Characterization of heat-wave propagation through laser-driven Ti-doped underdense plasma
22
LLNL-JRNL-411390 Characterization of Heat-Wave Propagation through Laser-Driven Ti-Doped Underdense Plasma M. Tanabe, H. Nishimura, N. Ohnishi, K. B. Fournier, S. Fujioka, A. Iwamae, S. B. Hansen, K. Nagai, F. Girard, M. Primout, B. Villette, D. Brebion, K. Mima March 19, 2009 High Energy Density Physics
-
Upload
independent -
Category
Documents
-
view
0 -
download
0
Transcript of Characterization of heat-wave propagation through laser-driven Ti-doped underdense plasma
LLNL-JRNL-411390
Characterization of Heat-WavePropagation through Laser-DrivenTi-Doped Underdense Plasma
M. Tanabe, H. Nishimura, N. Ohnishi, K. B. Fournier, S.Fujioka, A. Iwamae, S. B. Hansen, K. Nagai, F. Girard,M. Primout, B. Villette, D. Brebion, K. Mima
March 19, 2009
High Energy Density Physics
Disclaimer
This document was prepared as an account of work sponsored by an agency of the United States government. Neither the United States government nor Lawrence Livermore National Security, LLC, nor any of their employees makes any warranty, expressed or implied, or assumes any legal liability or responsibility for the accuracy, completeness, or usefulness of any information, apparatus, product, or process disclosed, or represents that its use would not infringe privately owned rights. Reference herein to any specific commercial product, process, or service by trade name, trademark, manufacturer, or otherwise does not necessarily constitute or imply its endorsement, recommendation, or favoring by the United States government or Lawrence Livermore National Security, LLC. The views and opinions of authors expressed herein do not necessarily state or reflect those of the United States government or Lawrence Livermore National Security, LLC, and shall not be used for advertising or product endorsement purposes.
Characterization of heat-wave propagation through
laser-driven Ti-doped underdense plasma
Minoru Tanabe∗,a, Hiroaki Nishimuraa, Naofumi Ohnishib, Kevin B.Fournierc, Shinsuke Fujiokaa, Atsushi Iwamaed,1, Stephanie B. Hansenc,2,Keiji Nagaia, Frederic Girarde, Michel Primoute, Bruno Villettee, Didier
Brebione, Kunioki Mimaa
aInstitute of Laser Engineering, Osaka University, 2-6 Yamada-Oka, Suita, Osaka
565-0871, JapanbDepartment of Aerospace Engineering, Tohoku University 6-6-01 Aramaki-Aza-Aoba,
Aoba-ku, Sendai 980-8579, JapancLawrence Livermore National Laboratory, P.O. Box 808, L-473, Livermore, California
94550, USAdDepartment of Mechanical Engineering and Science, Kyoto University, Kyoto 606-8501,
JapaneCommissariat a l ’Energie Atomique, DAM-Ile-de-France, Bruyeres-le-Chatel, 91297
Arpajon, Cedex, France
Abstract
The propagation of a laser-driven heat-wave into a Ti-doped aerogel target
was investigated. The temporal evolution of the electron temperature was
derived by means of Ti K-shell x-ray spectroscopy, and compared with two-
dimensional radiation hydrodynamic simulations. Reasonable agreement was
obtained in the early stage of the heat-wave propagation. In the later phase,
laser absorption, the propagation of the heat wave, and hydrodynamic motion
interact in a complex manner, and the plasma is mostly re-heated by collision
∗Corresponding author. Tel.: +81 6 6879 8777; fax: +81 6 6877 4799.Email address: [email protected] (Minoru Tanabe)
1Present address: Japan Atomic Energy Agency2Permanent address: Sandia National Laboratories
Preprint submitted to High Energy Density Physics February 13, 2009
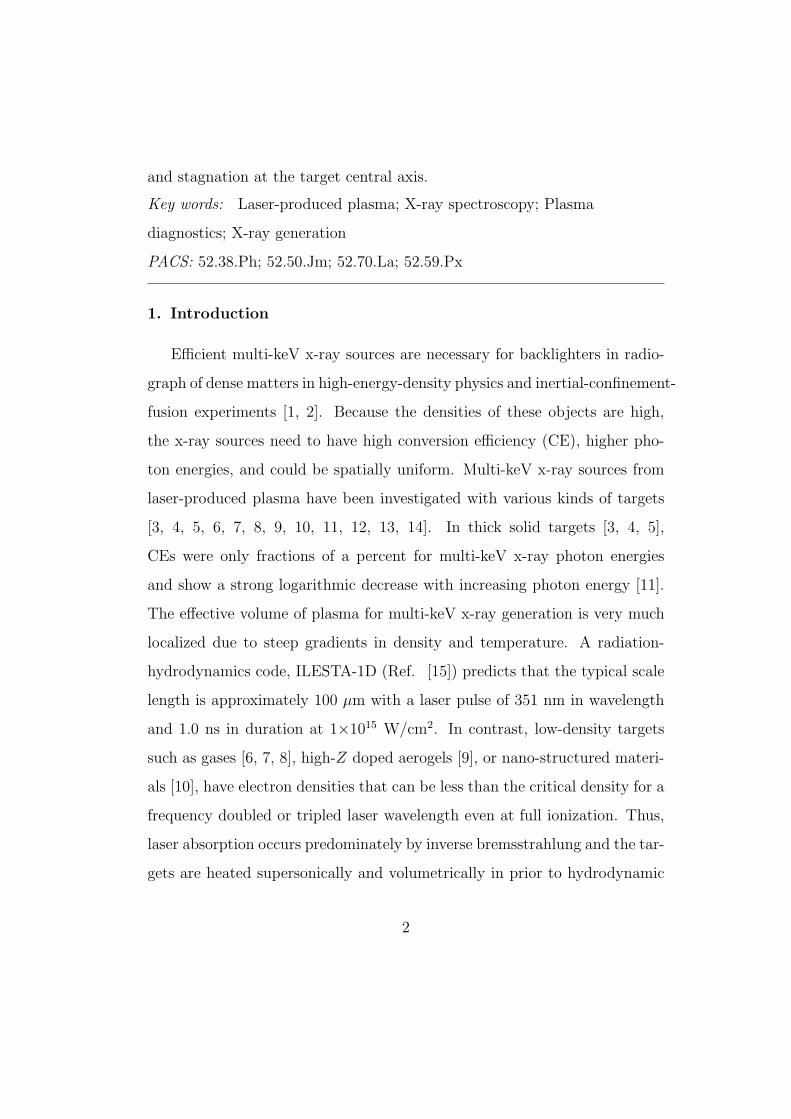
and stagnation at the target central axis.
Key words: Laser-produced plasma; X-ray spectroscopy; Plasma
diagnostics; X-ray generation
PACS: 52.38.Ph; 52.50.Jm; 52.70.La; 52.59.Px
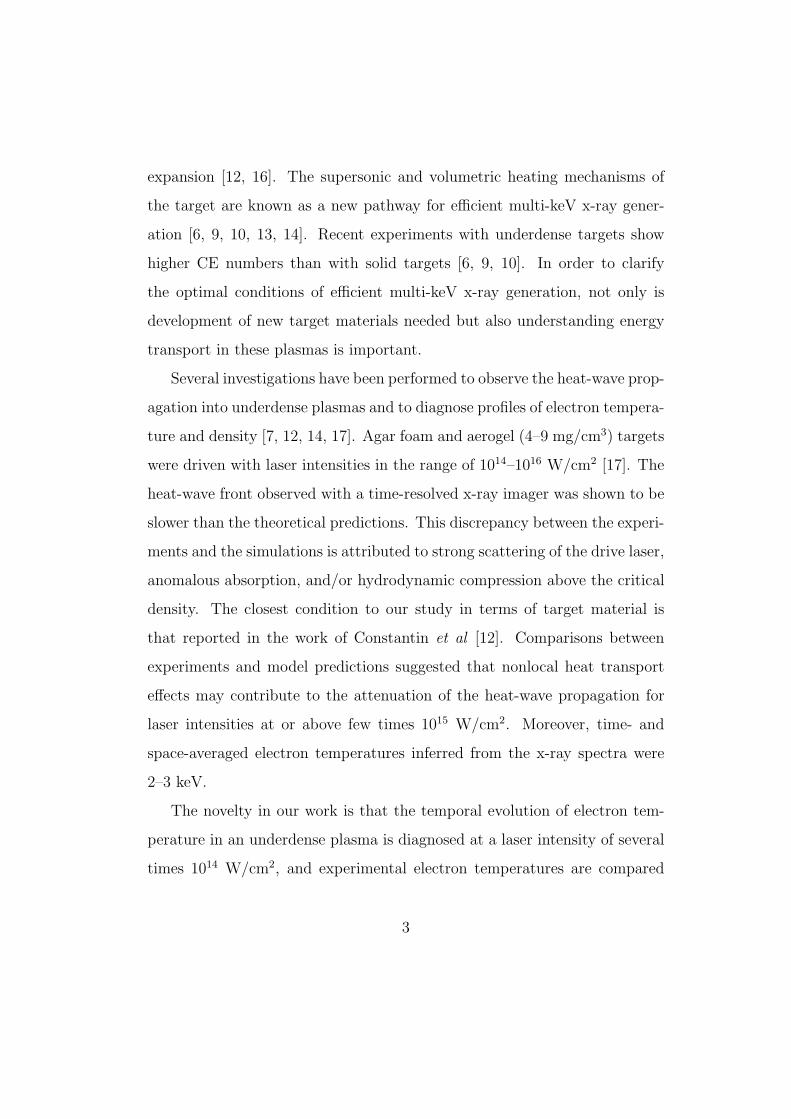
1. Introduction
Efficient multi-keV x-ray sources are necessary for backlighters in radio-
graph of dense matters in high-energy-density physics and inertial-confinement-
fusion experiments [1, 2]. Because the densities of these objects are high,
the x-ray sources need to have high conversion efficiency (CE), higher pho-
ton energies, and could be spatially uniform. Multi-keV x-ray sources from
laser-produced plasma have been investigated with various kinds of targets
[3, 4, 5, 6, 7, 8, 9, 10, 11, 12, 13, 14]. In thick solid targets [3, 4, 5],
CEs were only fractions of a percent for multi-keV x-ray photon energies
and show a strong logarithmic decrease with increasing photon energy [11].
The effective volume of plasma for multi-keV x-ray generation is very much
localized due to steep gradients in density and temperature. A radiation-
hydrodynamics code, ILESTA-1D (Ref. [15]) predicts that the typical scale
length is approximately 100 µm with a laser pulse of 351 nm in wavelength
and 1.0 ns in duration at 1×10¹⁵ W/cm2. In contrast, low-density targets
such as gases [6, 7, 8], high-Z doped aerogels [9], or nano-structured materi-
als [10], have electron densities that can be less than the critical density for a
frequency doubled or tripled laser wavelength even at full ionization. Thus,
laser absorption occurs predominately by inverse bremsstrahlung and the tar-
gets are heated supersonically and volumetrically in prior to hydrodynamic
2
expansion [12, 16]. The supersonic and volumetric heating mechanisms of
the target are known as a new pathway for efficient multi-keV x-ray gener-
ation [6, 9, 10, 13, 14]. Recent experiments with underdense targets show
higher CE numbers than with solid targets [6, 9, 10]. In order to clarify
the optimal conditions of efficient multi-keV x-ray generation, not only is
development of new target materials needed but also understanding energy
transport in these plasmas is important.
Several investigations have been performed to observe the heat-wave prop-
agation into underdense plasmas and to diagnose profiles of electron tempera-
ture and density [7, 12, 14, 17]. Agar foam and aerogel (4–9 mg/cm3) targets
were driven with laser intensities in the range of 1014–1016 W/cm2 [17]. The
heat-wave front observed with a time-resolved x-ray imager was shown to be
slower than the theoretical predictions. This discrepancy between the experi-
ments and the simulations is attributed to strong scattering of the drive laser,
anomalous absorption, and/or hydrodynamic compression above the critical
density. The closest condition to our study in terms of target material is
that reported in the work of Constantin et al [12]. Comparisons between
experiments and model predictions suggested that nonlocal heat transport
effects may contribute to the attenuation of the heat-wave propagation for
laser intensities at or above few times 1015 W/cm2. Moreover, time- and
space-averaged electron temperatures inferred from the x-ray spectra were
2–3 keV.
The novelty in our work is that the temporal evolution of electron tem-
perature in an underdense plasma is diagnosed at a laser intensity of several
times 1014 W/cm2, and experimental electron temperatures are compared
3
in detail with those simulated with the two-dimensional (2D) radiation-
hydrodynamic simulation, RAICHO (see Ref. [18]).
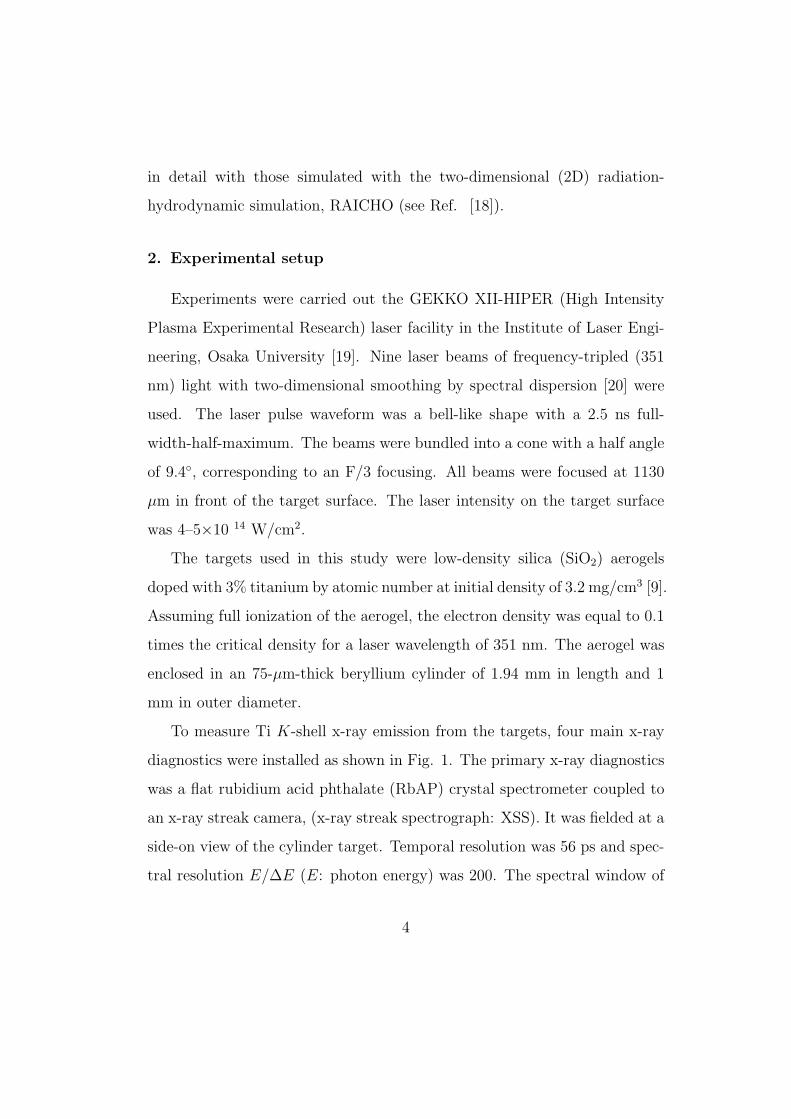
2. Experimental setup
Experiments were carried out the GEKKO XII-HIPER (High Intensity
Plasma Experimental Research) laser facility in the Institute of Laser Engi-
neering, Osaka University [19]. Nine laser beams of frequency-tripled (351
nm) light with two-dimensional smoothing by spectral dispersion [20] were
used. The laser pulse waveform was a bell-like shape with a 2.5 ns full-
width-half-maximum. The beams were bundled into a cone with a half angle
of 9.4◦, corresponding to an F/3 focusing. All beams were focused at 1130
µm in front of the target surface. The laser intensity on the target surface
was 4–5×10 14 W/cm2.
The targets used in this study were low-density silica (SiO2) aerogels
doped with 3% titanium by atomic number at initial density of 3.2 mg/cm3 [9].
Assuming full ionization of the aerogel, the electron density was equal to 0.1
times the critical density for a laser wavelength of 351 nm. The aerogel was
enclosed in an 75-µm-thick beryllium cylinder of 1.94 mm in length and 1
mm in outer diameter.
To measure Ti K-shell x-ray emission from the targets, four main x-ray
diagnostics were installed as shown in Fig. 1. The primary x-ray diagnostics
was a flat rubidium acid phthalate (RbAP) crystal spectrometer coupled to
an x-ray streak camera, (x-ray streak spectrograph: XSS). It was fielded at a
side-on view of the cylinder target. Temporal resolution was 56 ps and spec-
tral resolution E/∆E (E: photon energy) was 200. The spectral window of
4
observation was from 4.6 to 5.8 keV, which includes the following Ti K-shell
resonance lines: Heα(1s2− 1s2p), Lyα(1s − 2p), and Heβ(1s
2− 1s3p). To
restrict the observable region and also to attain high spectral resolution, a
100-µm-width slit was set at 1.5 mm away from the target in the line of sight
of the XSS. The substrate of the slit was a 50-µm-thick tantalum foil. The
observable regions were chosen to be 70-170 µm and 420-520 µm behind the
irradiated target surface by changing the position of the slit along the target
cylinder axis. An x-ray streak camera (XSC) was installed perpendicular to
the cylinder axis in order to observe heat-wave front propagation into the
target. A 20 µm diameter pinhole imager was used and the image magnifi-
cation was 8.7. A 100-µm-thick beryllium debris shield was set in front of
the imager and a K-edge absorption filter of 5-µm-thick titanium foil was
used to detect only the photon energy from 4.7 to 4.9 keV. A 700-µm-width
copper iodide slit was aligned in parallel to the cylinder axis to observe only
the region close to the target cylinder axis. Spatial resolution was 23 µm
and temporal resolution was about 100 ps. Photometrically calibrated x-ray
diodes were installed on the laser-illumination side to measure conversion
efficiency into x rays in the range of 4–6 keV.
3. Experimental results
Figure 2 shows time-resolved x-ray spectra for the region of 70-170 µm
behind the target surface. Corresponding intensity lineouts at 0.98 ns, 2.27
ns, and 3.35 ns are shown in Fig. 3. The Ti-Heα, Heβ resonance, and
lithiumlike satellite lines are identified. The Lyα emission is weak because the
target was not heated to a high enough temperature. The intercombination
5
transition and dielectronic satellite transitions (Li-like satellites) are partly
overlapped with the Ti-Heα line due to the limited spectral resolution of
the XSS. Similar spectra were obtained for the region 420-520 µm behind
the target surface. To derive temporal evolution of electron temperature
from the observed spectra, an atomic kinetics code, FLYCHK [21] was used.
Line intensity ratios of the Ti-Heα to the Li-like satellites, as well as the
ratio of the Heα line to Heβ line, were adopted as diagnostics. The electron
density was assumed to be 9.0×1020 cm−3. Spectra calculated with FLYCHK
were convolved with the instrumental spectral resolution. The synthetic
spectra for best-fit electron temperatures are also presented in Fig. 3. In
the FLYCHK code, the dielectronic satellite transitions seen in the red wing
of the Heβ are not included. Given that, the synthesized spectra agree quite
well with the observed spectra for the electron temperatures shown in the
figure. Electron temperatures at other times for the two observable regions
varied in the range from 600 to 1100 eV. Temporal evolution of electron
temperature and comparison with the simulation results are discussed in
detail in Sec. 5.
Figure 4 shows a typical streaked x-ray image. Since x-ray emission arises
from high temperature region dominated by the Ti-Heα emission, the image
indicates that heat wave propagates from the target surface toward the other
side of the target. The target was illuminated from the left-hand side. The
time origin was adjusted to coincide with the RAICHO simulation results.
Trajectory of the heat-wave front position at a particular time was defined as
the 1/e rising edge in x-ray intensity moving along the axial direction. The
velocity of the heat-wave propagation into the target was measured to be 4.8
6
× 107 cm/s.
4. Hydrodynamics simulations
To simulate the experimental results, we used RAICHO [18], a 2D, Eule-
rian radiation-hydrodynamics code with cylindrical axis-symmetric geometry
(radial direction and axial direction). The simulation included experimental
laser energy, laser spot, and pulse shape. Two-dimensional ray-tracing tech-
niques were used to track the laser propagation into the target. Laser energy
was deposited by inverse bremsstrahlung. The thermal electron conduction
was treated with the classical Spitzer-Harm formula [22] with a flux limiter
f = 0.1.
The main results of the RAICHO simulations are temporal and spatial
dependence of the electron density, electron temperature, laser energy de-
position, and laser ray-racing. Figure 5 shows the time- and space-resolved
electron density and temperature mappings calculated with RAICHO at 2.00,
2.25, 2.50, 2.75, and 3.00 ns. Also, figure 6 shows time- and space-resolved
laser rate-tracing and laser heating rate calculated with RAICHO at the
same times. For all images, the target is irradiated from the left-hand side.
To compare with the experimental x-ray streaked image shown in Fig. 4,
temporal evolution of spatial electron temperature profile along the center
of the cylinder axis calculated with RAICHO is shown in Fig. 7. The RAI-
CHO simulation replicates well the experiment until the heat-wave reaches
the cylinder end opposite the laser irradiation side. As shown in Fig. 8,
the trajectory of the measured heat-wave front is in particularly good agree-
ment with the position of the 900 eV contour in the simulation. However,
7
in the later phase, heating of the target is substantially affected by compli-
cated interplay among laser light penetration, heat-wave propagation, and
hydrodynamic motion shown in Figs. 5-7.
In the early phase of the target irradiation, the aerogel is partially ionized
by the laser, and the rest of the laser energy is predominantly absorbed by
inverse bremsstrahlung. Then, an ionization wave is created at the absorbed
region [16]. It further propagates into the aerogel (see Figs. 5 (a) and (b)).
After the heat wave reaches the other side of the target at around 2.0 ns,
the high temperature region moves backward toward the laser-incident side
as time advances. This result suggests that a part of the laser light reflected
by the plasma expanded from the cylinder wall is focused at the cylinder
center that this point moves backward to the laser incident side (see Figs. 6
(a), (b), (c), and (d)). Finally, the plasma expanding from the cylinder wall
stagnates at the center of the cylinder near the laser-irradiated front side.
As a consequence, the electron temperature and density at the front side of
the target increase as shown in Figs. 5 (c), (d), (e), and Fig. 7.
5. Analysis of electron temperature history
As noted above, the interactions between the laser and underdense plasma
are complicated and generally are not amenable to simple analysis. How-
ever, the experimental results and the RAICHO simulations provide some
indications of the interaction of physical processes. Electron temperature is
a particularly important quantity because it can be directly compared with
the simulation results to help us to understand heating processes in an un-
derdense plasma. We focused on the phenomena occurring near the front
8
side of the target.
In order to compare the experimental electron temperature with the sim-
ulation results, the electron temperature calculated with RAICHO was post-
processed by integration along the line of sight over all plasma elements and
weighted by emissivity of each plasma element. Therefore, volume-averaged
temperature must be calculated using the electron temperature based on the
RAICHO results. Moreover, emissivity of each plasma element must be taken
into consideration as a weighting factor. Figure 9 shows a flow diagram of
the post-processing process. First, the time-dependent x-ray emissivities for
each plasma element were calculated by inputting electron temperatures and
densities calculated from RAICHO into the FLYCHK code. Here, the char-
acter i represents an element number counted along to the radial direction of
the cylinder. In the RAICHO simulation, the element size along the radial
direction was chosen to be 10 µm. Then, the sum of emissivity of the time-
dependent spectra in the range from 4 to 6 keV was calculated. Finally, the
time-dependent, volume-averaged electron temperatures including emissivity
weighting factors were calculated with the equation given in Fig. 9. Figure
10 shows the comparison between the diagnosed time-evolution of electron
temperature (dots) and the post-processed electron temperature (lines) for
the two different observable regions. As discussed in Sec. 4, the temperature
increases rapidly as the underdense target is heated by the laser. Then, the
electron temperature decreases slightly as the high temperature region moves
back the other side of the cylinder, and finally the underdense plasma is re-
heated by the plasma stagnation at the cylinder axis. This scenario agrees
reasonably well with the measured data in terms of the absolute values of
9
the temperatures and their time history.
The x-ray conversion efficiency, defined as the ratio of the total x-ray out-
put in the 4–6 keV band into 4π solid angle to the incident laser energy, was
0.34±0.4%. In comparison with the identical target reported in Ref. [12],
this CE is quite low. The reason is due to the higher laser intensity (1.7×10¹⁵
and 3.4×10¹⁵ W/cm2 for the case in Ref. [12]) and different laser focusing
conditions. The FLYCHK code predicts that plasma with an electron tem-
perature of 2.0–2.5 keV optimally generates Ti K-shell x-ray radiation (4–6
keV). The inferred electron temperatures in the present study are lower than
the optimal temperatures. For a given laser focusing condition, higher elec-
tron temperatures can be obtained by utilizable plasma confinement in an
enclosure and energy recovery by hydrodynamic collision.
6. Conclusion
The temporal evolution of electron temperatures in low-density laser-
heated aerogel plasmas have been studied. Under the experimental condi-
tions, electron temperatures range from 600 to 1100 eV at the front side of
the target. Analysis of electron temperatures from the RAICHO simulation
post-processed with FLYCHK has shown that plasma re-heating occurs due
to the plasma stagnation on the cylindrical axis of the target following ra-
dial compression. We conclude that laser absorption, heat transport, and
hydrodynamics in underdense plasma are all of relevance for benchmarking
radiation-hydrodynamics codes and for development of efficient x-ray sources.
10
Acknowledgments
This work was performed under the auspices of the U.S. Department of
Energy by Lawrence Livermore National Laboratory under Contract DE-
AC52-07NA27344, the Ministry of Education, Cultures, Sports, Science and
Technology of Japan project “Advanced Diagnostics for Burning Plasma
(code 442) ”Temperature and density mapping of imploded burning plasma
with monochromatic x-ray imaging (code 20026005), and JSPS-CAS Core-
University Program in the field of “Plasma and Nuclear Fusion”.
References
[1] J. Nuckolls, L. Wood, A. Thiessen, et al., Nature (London) 239, 139
(1972).
[2] R. Kodama, H. Shiraga, K. Shigemori, et al., Nature 418, 934 (2002).
[3] D. W. Phillion and C. J. Hailey, Phys. Rev. A 34, 4886 (1996).
[4] J. Workman and G. A. Kyrala, Rev. Sci. Instrum. 72, 678 (2001).
[5] B. Yaakobi, P. Bourke, Y. Conturie, et al., Opt. Commun. 38, 196
(1981).
[6] C. A. Back, J. Grun, C. Decker, et al., Phys. Rev. Lett. 87, 275003
(2001).
[7] C. A. Back, J. Davis, J. Grun, et al. Phys. Plasmas 10, 2047 (2002).
[8] K. B. Fournier, C. Constantin, C. A. Back, et al., J. Quant. Spectrosc.
Radiat. Transf. 99, 168 (2006).
11
[9] K. B. Fournier, C. Constantin, J. Poco, et al. Phys. Rev. Lett. 92,
165005 (2004).
[10] M. Tanabe, H. Nishimura, S. Fujioka, et al., Appl. Phys. Lett. 93, 051505
(2008).
[11] R. Kauffman, Handbook of Plasma Physics (Elsevier Science, 1991),
chap. 3, p. 111.
[12] C. Constantin, C. A. Back, K. B. Fournier, et al. Phys. Plasmas 12,
063104 (2005).
[13] F. Girard, J. P. Jadaud, M. Naudy, et al. Phys. Plasmas 12 12, 092705
(2005).
[14] D. Babonneau, M. Primout, F. Girard, et al., Phys. Plasmas 15, 092702
(2008).
[15] H. Takabe, M. Yamanaka, K. Mima, et al. Phys. Fluids 31, 2884 (1988).
[16] J. Denavit and D. W. Phillion, Phys. Plasmas 1, 1971 (1994).
[17] J. A. Koch, K. G. Estabrook, J. D. Bauer, et al., Phys. Plasmas 2, 3820
(1995).
[18] N. Ohnishi, M. Nishikino, and A. Sasaki, J. Phys. IV 133, 1193 (2006).
[19] N. Miyanaga, M. Nakatsuka, H. Azechi, et al., in The proceedings of the
18th International Conference on Fusion Energy (IAEA, Sorrento, Italy,
2001), IAEA-CN-77.
12
[20] S. Skupsky, R. W. Short, T. Kessler, et al. J. Appl. Phys. 66, 3456
(1989).
[21] H. K. Chung, M. H. Chen, W. L. Morgan, et al. High Energy Density
Phys. 1, 3 (2005).
[22] L. Spitzer and R. Harm, Phys. Rev. 89, 977 (1953).
List of figure captions
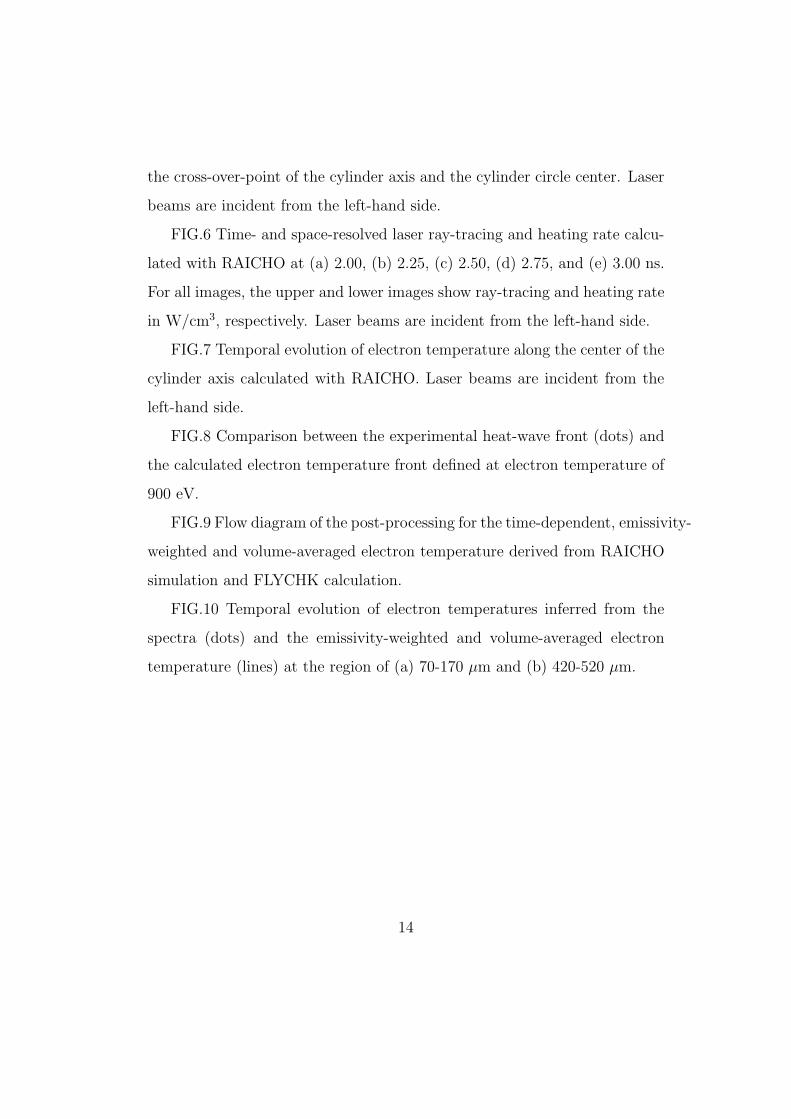
FIG.1 Experimental setup showing layout of laser beams and x-ray di-
agnostic instruments. A slit was set at 1.5 mm in distance from the target
surface to restrict the observable region.
FIG.2 Time-resolved Ti K-shell spectra measured with the x-ray streak
spectrograph for the region of 70-170 µm behind the irradiated target’s sur-
face. The Ti-Heα and Heβ resonance lines and lithiumlike satellite lines are
identified. The Lyα emission is hardly seen.
FIG.3 Temporal variations of the observed spectra (solid lines) derived
from the data shown in Fig. 2 at (a) 0.98, (b) 2.27, and (c) 3.35 ns. Spectra
calculated with the FLYCHK code (dashed lines) are shown for comparison
assuming the electron density of 9.0× 1020 cm−3.
FIG.4 Experimental x-ray streaked image. Laser beams are incident on
the target from the left-hand side.
FIG.5 Time- and space-resolved electron densities and electron tempera-
tures calculated with RAICHO at (a) 2.00, (b) 2.25, (c) 2.50, (d) 2.75, and
(e) 3.00 ns. For all images, the upper and lower images show electron den-
sity in cm−3 and electron temperature in eV, respectively. Spatial origin is
13
the cross-over-point of the cylinder axis and the cylinder circle center. Laser
beams are incident from the left-hand side.
FIG.6 Time- and space-resolved laser ray-tracing and heating rate calcu-
lated with RAICHO at (a) 2.00, (b) 2.25, (c) 2.50, (d) 2.75, and (e) 3.00 ns.
For all images, the upper and lower images show ray-tracing and heating rate
in W/cm3, respectively. Laser beams are incident from the left-hand side.
FIG.7 Temporal evolution of electron temperature along the center of the
cylinder axis calculated with RAICHO. Laser beams are incident from the
left-hand side.
FIG.8 Comparison between the experimental heat-wave front (dots) and
the calculated electron temperature front defined at electron temperature of
900 eV.
FIG.9 Flow diagram of the post-processing for the time-dependent, emissivity-
weighted and volume-averaged electron temperature derived from RAICHO
simulation and FLYCHK calculation.
FIG.10 Temporal evolution of electron temperatures inferred from the
spectra (dots) and the emissivity-weighted and volume-averaged electron
temperature (lines) at the region of (a) 70-170 µm and (b) 420-520 µm.
14
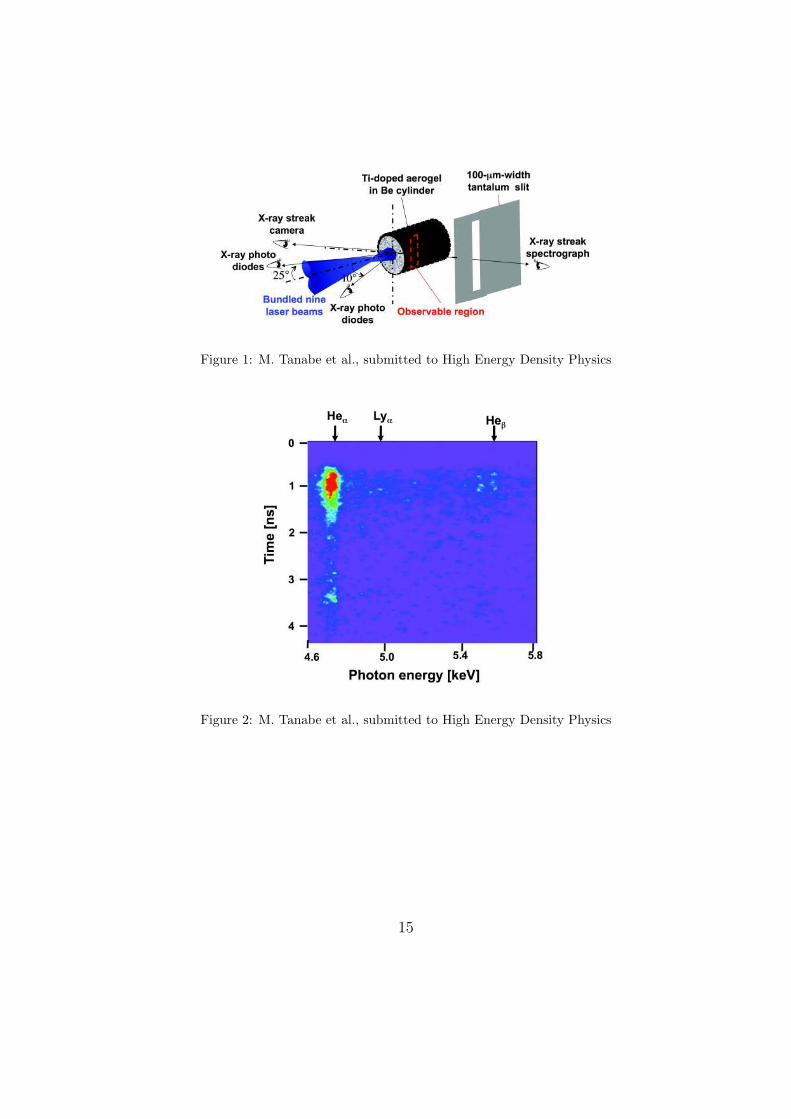
Figure 1: M. Tanabe et al., submitted to High Energy Density Physics
Figure 2: M. Tanabe et al., submitted to High Energy Density Physics
15
Figure 3: M. Tanabe et al., submitted to High Energy Density Physics
16
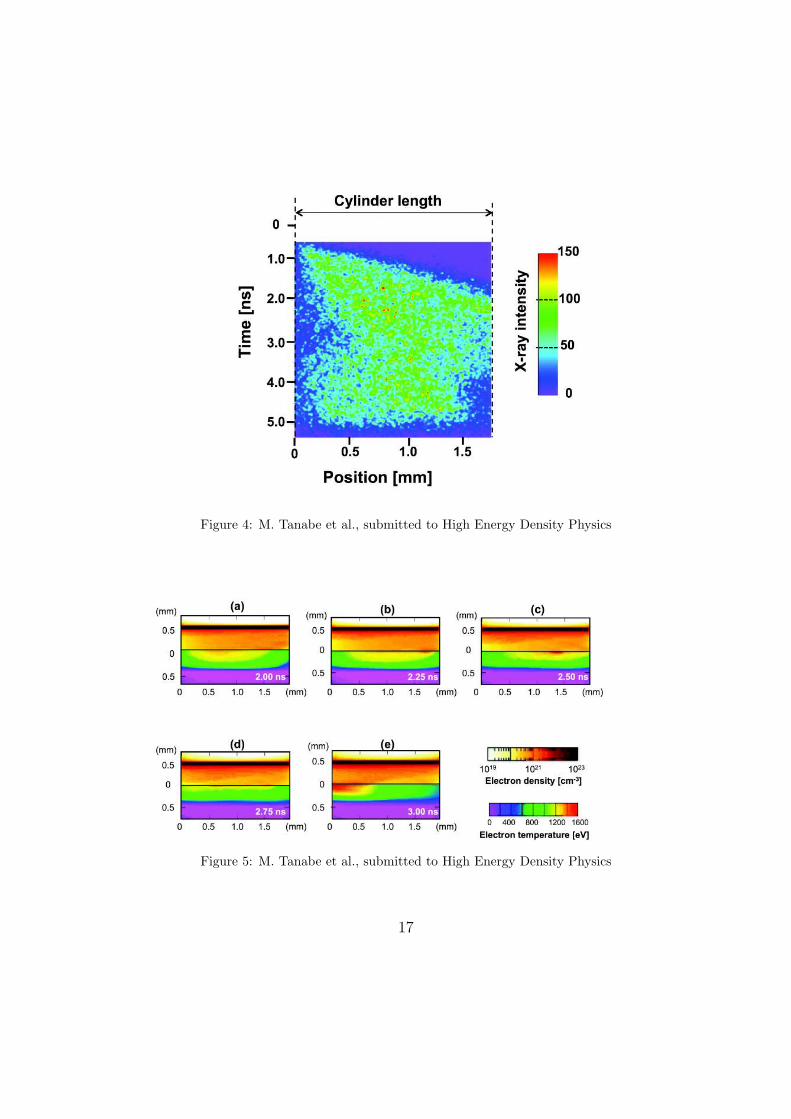
Figure 4: M. Tanabe et al., submitted to High Energy Density Physics
Figure 5: M. Tanabe et al., submitted to High Energy Density Physics
17
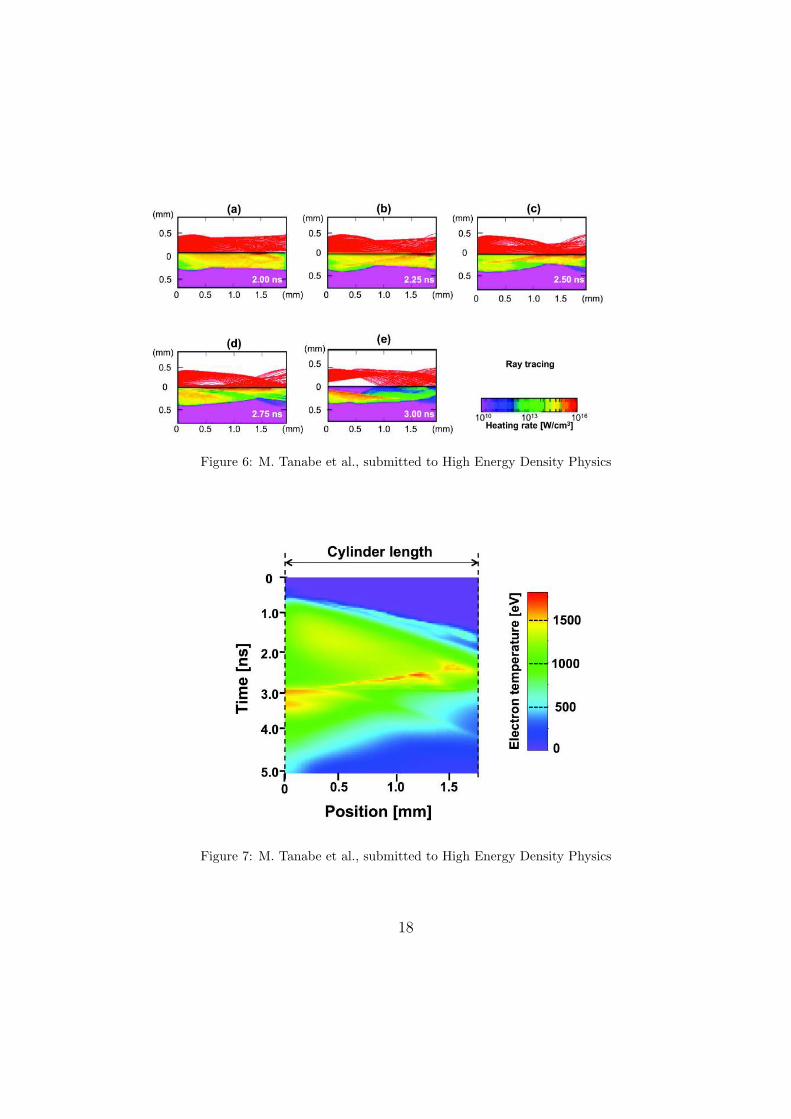
Figure 6: M. Tanabe et al., submitted to High Energy Density Physics
Figure 7: M. Tanabe et al., submitted to High Energy Density Physics
18

Experiments RAICHO(Te = 900 eV)
Figure 8: M. Tanabe et al., submitted to High Energy Density Physics
Figure 9: M. Tanabe et al., submitted to High Energy Density Physics
19
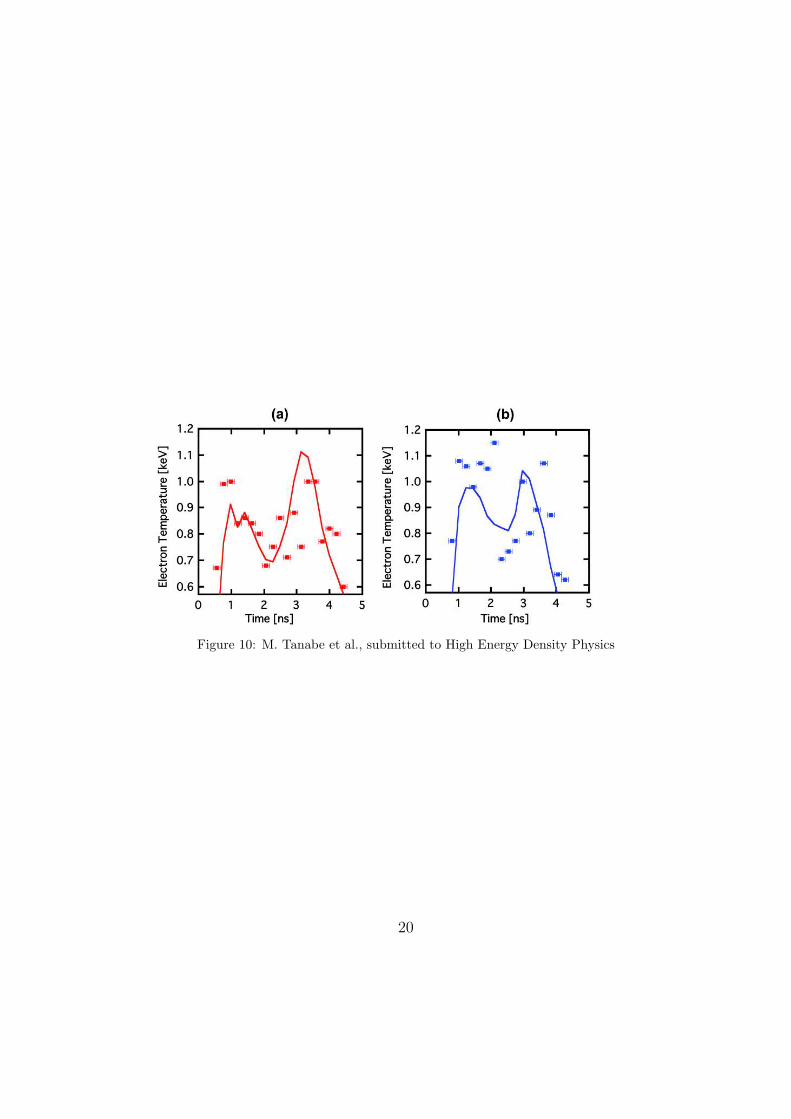
Figure 10: M. Tanabe et al., submitted to High Energy Density Physics
20