Investigation of the role of plasma channels as waveguides for laser-wakefield accelerators
15
Investigation of the role of plasma channels as waveguides for laser-wakefield accelerators This content has been downloaded from IOPscience. Please scroll down to see the full text. Download details: IP Address: 67.55.2.15 This content was downloaded on 03/10/2013 at 16:10 Please note that terms and conditions apply. 2010 New J. Phys. 12 045008 (http://iopscience.iop.org/1367-2630/12/4/045008) View the table of contents for this issue, or go to the journal homepage for more Home Search Collections Journals About Contact us My IOPscience
Transcript of Investigation of the role of plasma channels as waveguides for laser-wakefield accelerators
Investigation of the role of plasma channels as waveguides for laser-wakefield accelerators
This content has been downloaded from IOPscience. Please scroll down to see the full text.
Download details:
IP Address: 67.55.2.15
This content was downloaded on 03/10/2013 at 16:10
Please note that terms and conditions apply.
2010 New J. Phys. 12 045008
(http://iopscience.iop.org/1367-2630/12/4/045008)
View the table of contents for this issue, or go to the journal homepage for more
Home Search Collections Journals About Contact us My IOPscience
T h e o p e n – a c c e s s j o u r n a l f o r p h y s i c s
New Journal of Physics
Investigation of the role of plasma channels aswaveguides for laser-wakefield accelerators
T P A Ibbotson1, N Bourgeois1, T P Rowlands-Rees1,L S Caballero1, S I Bajlekov1, P A Walker1, S Kneip2,S P D Mangles2, S R Nagel2, C A J Palmer2, N Delerue3,G Doucas3, D Urner3, O Chekhlov4, R J Clarke4, E Divall4,K Ertel4, P Foster4, S J Hawkes4, C J Hooker4, B Parry4,P P Rajeev4, M J V Streeter4 and S M Hooker1,5
1 Clarendon Laboratory, Parks Road, Oxford OX1 3PU, UK2 The Blackett Laboratory, Imperial College London SW7 2BZ, UK3 John Adams Institute for accelerator science, University of Oxford,Oxford, UK4 Central Laser Facility, Rutherford Appleton Laboratory, Oxon OX11 0QX, UKE-mail: [email protected]
New Journal of Physics 12 (2010) 045008 (14pp)Received 16 October 2009Published 30 April 2010Online at http://www.njp.org/doi:10.1088/1367-2630/12/4/045008
Abstract. The role of plasma channels as waveguides for laser-wakefieldaccelerators is discussed in terms of the results of experiments performed withthe Astra-Gemini laser, numerical simulations using the code WAKE, and thetheory of self-focusing and self-guiding of intense laser beams. It is foundthat at a given electron density, electron beams can be accelerated using lowerlaser powers in a waveguide structure than in a gas-jet or cell. The transitionbetween relativistically self-guided and channel-assisted guiding is seen in thesimulations and in the behaviour of the production of electron beams. We alsoshow that by improving the quality of the driving laser beam the threshold laserenergy required to produce electron beams can be reduced by a factor of almost2. The use of an aperture allows the production of a quasi-monoenergetic electronbeam of energy 520 MeV with an input laser power of only 30 TW.
5 Author to whom any correspondence should be addressed.
New Journal of Physics 12 (2010) 0450081367-2630/10/045008+14$30.00 © IOP Publishing Ltd and Deutsche Physikalische Gesellschaft
2
Contents
1. Introduction 22. Self-focusing and self-guiding 23. Experimental set-up 34. Guiding of intense laser pulses 75. Electron beam production 86. Effect of the transverse profile of the input laser spot 117. Conclusions and future work 13Acknowledgments 14References 14
1. Introduction
As first proposed by Tajima and Dawson in 1979 [1], the relativistic plasma wave driven by theinteraction of an intense laser pulse with a plasma can be used to accelerate charged particles.These longitudinal electric fields within the wake can be as high as 100 GV m−1, a factor of 1000higher than in conventional accelerators, making plasma accelerators a very compact source ofhigh-energy particle beams.
The first quasi-monoenergetic beams of electrons from plasma accelerators were reportedin 2004 by several groups, employing either plasma channels [2] or gas-jets [3,4]. Since thenthe energy of the beams has been increased up to the GeV level, by channelling the driving laserpulse with a plasma channel [5,6] or by relativistic self-guiding [7].
In this paper, we discuss the role of plasma channels as waveguides for laser-wakefieldaccelerators in terms of the results of experiments performed with the Astra-Gemini laser atthe Rutherford Appleton Laboratory, numerical simulations, and the theory of self-focusingand self-guiding of intense laser beams. We show that at a given electron density, electronbeams can be generated in a waveguide structure at lower laser powers than in a gas-jet or cell.The transition between relativistically self-guided and channel-assisted guiding is seen in thesimulations and in the experimentally observed behaviour of the production of electron beams.We demonstrate the importance of the quality of the driving laser beam by showing that thethreshold laser energy required to produce electron beams can be reduced by a factor of almost2 by improving the quality of the focal spot.
The paper is arranged as follows. In section 2, the theory of relativistic self-guiding isreviewed, and in section 3, the experimental arrangement employed is described. In sections 4and 5, we describe the results of these experiments, and we present in detail the properties ofthe electron beams generated and the behaviour of the laser radiation transmitted through theplasma channel. The effect of improving the quality of the focal spot of the driving laser isdescribed and explained by numerical simulations in section 6.
2. Self-focusing and self-guiding
The quiver motion of the electrons in the electric field of a laser pulse becomes relativistic whenthe normalized vector potential a0 = eA/mec is greater than 1. The refractive index of a plasma
New Journal of Physics 12 (2010) 045008 (http://www.njp.org/)
3
is given by η = (1 − (ω2p/γω2
0))1/2, where ωp is the plasma frequency and ω0 is the driving laser
frequency. For a laser beam which is peaked on its axis, variations in the relativistic factor γ
cause the refractive index to be peaked on axis—which has the effect of focusing the laserpulse. The critical laser power Pc for this focusing to balance diffraction is usually taken tobe P0 > Pc = 17.4(ω0/ωp)
2 GW [8]. This condition is necessary but not sufficient for the laserpulse to be self-guided since transverse density gradients formed at the front of the pulse by theponderomotive force almost perfectly cancel out self-focusing, so that in the absence of externalguiding the front of the pulse diffracts essentially freely.
Lu et al [9] have shown that a laser pulse will self-focus to a spot size wsf ≡ 2k−1p
√a0,
where kp = ωp/c. A laser pulse of power P focused to a spot size wsf has a value of a0 givenby [9]
a0 = 2 (P/Pc)1/3 . (1)
If the rate of erosion of the leading edge of the pulse by diffraction is slower than that caused bytransfer of laser energy to the plasma wave, the pulse can be said to be self-guided. This leads toa condition on a0 for self-guiding of a0 > (ω0/ωp)
2/5, which can be combined with equation (1)to give a condition on the peak power for self-guiding of
P0 & Pdiffc = (1/8)(ω0/ωp)
6/5 Pc. (2)
For the pulse to propagate through the plasma ω0 > ωp, and hence Pdiffc > Pc. A waveguide with
a matched spot size wm = wsf relaxes this condition to P0 & Pc since diffraction of the leadingedge is eliminated. In the case of a waveguide with a matched spot size wm > wsf diffraction ofthe leading edge is still reduced, and as we show below, laser pulses with P0 < Pdiff
c can still beguided with a spot size close to wsf.
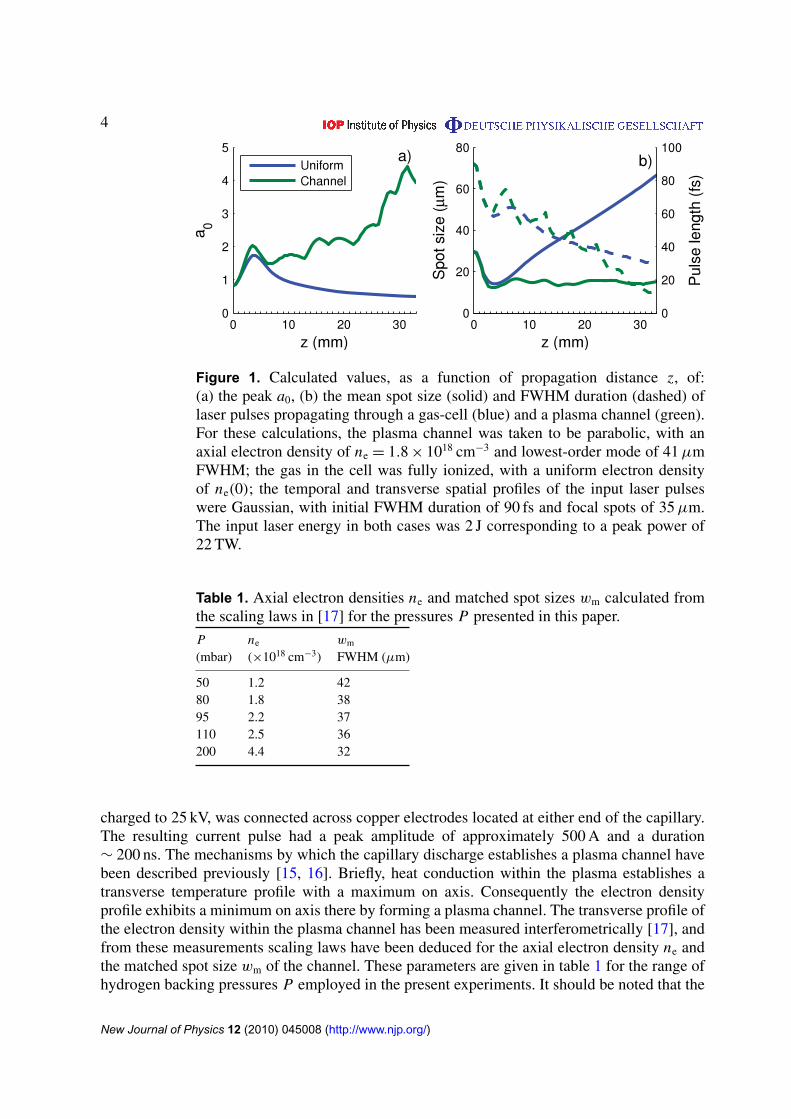
Figure 1 shows the results of simulations performed using the three-dimensional (3D) axi-symmetric particle-in-cell (PIC) code WAKE [10]. Here the propagation of the laser pulse iscompared in two cases: (i) a uniform, fully ionized plasma and (ii) a fully ionized plasmachannel with a lowest-order mode of 41 µm full-width at half-maximum (FWHM). In both casesP0 = 22 TW, Pc = 17 TW and Pdiff
c = 131 TW. The simulations show that without an externalguiding structure the laser pulse initially self-focuses to a spot size of approximately wsf, butthen diffracts freely as predicted. However, in a plasma channel, the pulse spot size evolves toapproximately wsf and maintains this value over many Rayleigh ranges. For the plasma channela0 increases beyond that achieved when the pulse is first self-focused owing to compressionof the pulse duration. For the simulations of figure 1, this allows a0 to evolve sufficiently toreach the threshold for injection of electrons into the wake, which is estimated to occur ata0 ≈ 3–4 [9, 11, 12]. For a given electron density, and hence output electron beam energy, thisallows injection to occur at lower laser powers than without a guiding mechanism in addition toself-focusing.
3. Experimental set-up
In the work described in this paper, the plasma-channel was created using the hydrogen-filledcapillary discharge waveguide [13, 14]. For this experiment, the capillary was 33 mm long and200 µm in diameter. It was connected via gas-slots of diameter 650 µm, located 4 mm fromeither end of the capillary, to a reservoir filled with hydrogen gas. The gas was allowed toflow for 2.5 s so that a steady state within the capillary was reached before a 1.7 nF capacitor,
New Journal of Physics 12 (2010) 045008 (http://www.njp.org/)
4
Figure 1. Calculated values, as a function of propagation distance z, of:(a) the peak a0, (b) the mean spot size (solid) and FWHM duration (dashed) oflaser pulses propagating through a gas-cell (blue) and a plasma channel (green).For these calculations, the plasma channel was taken to be parabolic, with anaxial electron density of ne = 1.8 × 1018 cm−3 and lowest-order mode of 41 µmFWHM; the gas in the cell was fully ionized, with a uniform electron densityof ne(0); the temporal and transverse spatial profiles of the input laser pulseswere Gaussian, with initial FWHM duration of 90 fs and focal spots of 35 µm.The input laser energy in both cases was 2 J corresponding to a peak power of22 TW.
Table 1. Axial electron densities ne and matched spot sizes wm calculated fromthe scaling laws in [17] for the pressures P presented in this paper.
P ne wm
(mbar) (×1018 cm−3) FWHM (µm)
50 1.2 4280 1.8 3895 2.2 37110 2.5 36200 4.4 32
charged to 25 kV, was connected across copper electrodes located at either end of the capillary.The resulting current pulse had a peak amplitude of approximately 500 A and a duration∼ 200 ns. The mechanisms by which the capillary discharge establishes a plasma channel havebeen described previously [15, 16]. Briefly, heat conduction within the plasma establishes atransverse temperature profile with a maximum on axis. Consequently the electron densityprofile exhibits a minimum on axis there by forming a plasma channel. The transverse profile ofthe electron density within the plasma channel has been measured interferometrically [17], andfrom these measurements scaling laws have been deduced for the axial electron density ne andthe matched spot size wm of the channel. These parameters are given in table 1 for the range ofhydrogen backing pressures P employed in the present experiments. It should be noted that the
New Journal of Physics 12 (2010) 045008 (http://www.njp.org/)
5
Capillarydischarge
f/20paraboloid
3 m
SM1 (f = 2.5 m)
output energy diode
12-bit CCD
Optical spectrometer
Vacuumchamber
e--spectrometer
L2
L1
W1
Cam1Cam2
SM2
W2
W3
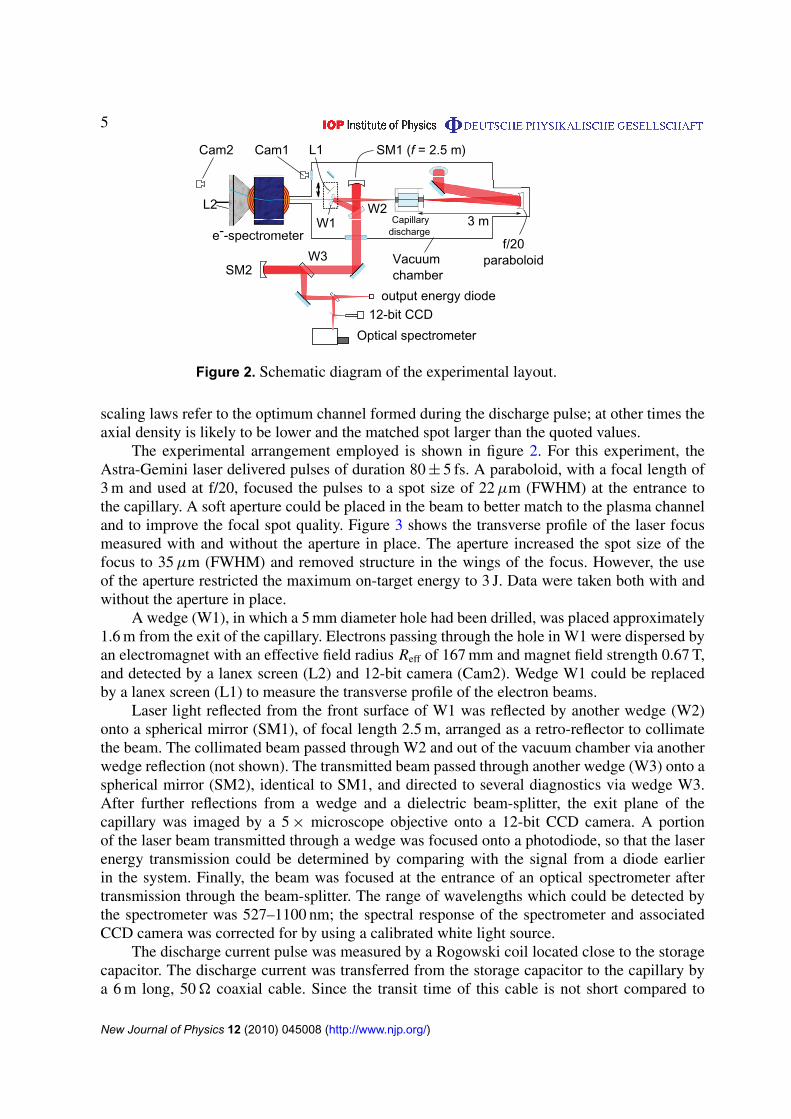
Figure 2. Schematic diagram of the experimental layout.
scaling laws refer to the optimum channel formed during the discharge pulse; at other times theaxial density is likely to be lower and the matched spot larger than the quoted values.
The experimental arrangement employed is shown in figure 2. For this experiment, theAstra-Gemini laser delivered pulses of duration 80 ± 5 fs. A paraboloid, with a focal length of3 m and used at f/20, focused the pulses to a spot size of 22 µm (FWHM) at the entrance tothe capillary. A soft aperture could be placed in the beam to better match to the plasma channeland to improve the focal spot quality. Figure 3 shows the transverse profile of the laser focusmeasured with and without the aperture in place. The aperture increased the spot size of thefocus to 35 µm (FWHM) and removed structure in the wings of the focus. However, the useof the aperture restricted the maximum on-target energy to 3 J. Data were taken both with andwithout the aperture in place.
A wedge (W1), in which a 5 mm diameter hole had been drilled, was placed approximately1.6 m from the exit of the capillary. Electrons passing through the hole in W1 were dispersed byan electromagnet with an effective field radius Reff of 167 mm and magnet field strength 0.67 T,and detected by a lanex screen (L2) and 12-bit camera (Cam2). Wedge W1 could be replacedby a lanex screen (L1) to measure the transverse profile of the electron beams.
Laser light reflected from the front surface of W1 was reflected by another wedge (W2)onto a spherical mirror (SM1), of focal length 2.5 m, arranged as a retro-reflector to collimatethe beam. The collimated beam passed through W2 and out of the vacuum chamber via anotherwedge reflection (not shown). The transmitted beam passed through another wedge (W3) onto aspherical mirror (SM2), identical to SM1, and directed to several diagnostics via wedge W3.After further reflections from a wedge and a dielectric beam-splitter, the exit plane of thecapillary was imaged by a 5 × microscope objective onto a 12-bit CCD camera. A portionof the laser beam transmitted through a wedge was focused onto a photodiode, so that the laserenergy transmission could be determined by comparing with the signal from a diode earlierin the system. Finally, the beam was focused at the entrance of an optical spectrometer aftertransmission through the beam-splitter. The range of wavelengths which could be detected bythe spectrometer was 527–1100 nm; the spectral response of the spectrometer and associatedCCD camera was corrected for by using a calibrated white light source.
The discharge current pulse was measured by a Rogowski coil located close to the storagecapacitor. The discharge current was transferred from the storage capacitor to the capillary bya 6 m long, 50 � coaxial cable. Since the transit time of this cable is not short compared to
New Journal of Physics 12 (2010) 045008 (http://www.njp.org/)
6
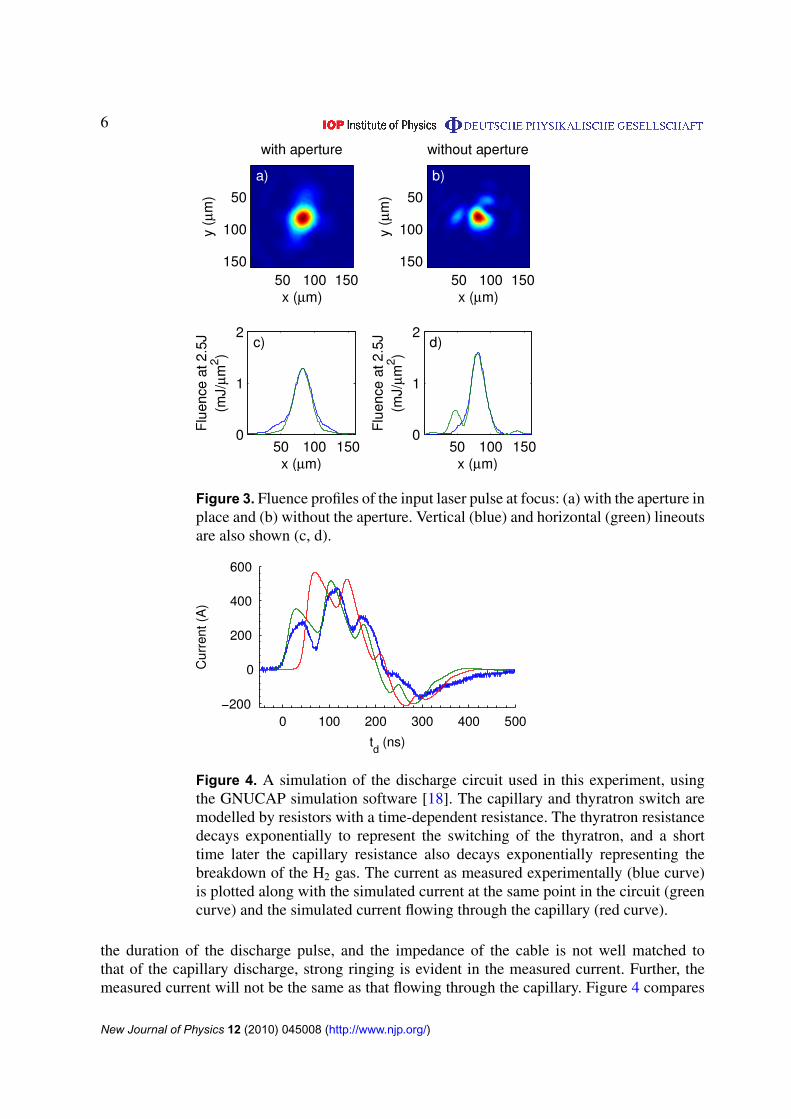
Figure 3. Fluence profiles of the input laser pulse at focus: (a) with the aperture inplace and (b) without the aperture. Vertical (blue) and horizontal (green) lineoutsare also shown (c, d).
Figure 4. A simulation of the discharge circuit used in this experiment, usingthe GNUCAP simulation software [18]. The capillary and thyratron switch aremodelled by resistors with a time-dependent resistance. The thyratron resistancedecays exponentially to represent the switching of the thyratron, and a shorttime later the capillary resistance also decays exponentially representing thebreakdown of the H2 gas. The current as measured experimentally (blue curve)is plotted along with the simulated current at the same point in the circuit (greencurve) and the simulated current flowing through the capillary (red curve).
the duration of the discharge pulse, and the impedance of the cable is not well matched tothat of the capillary discharge, strong ringing is evident in the measured current. Further, themeasured current will not be the same as that flowing through the capillary. Figure 4 compares
New Journal of Physics 12 (2010) 045008 (http://www.njp.org/)
7
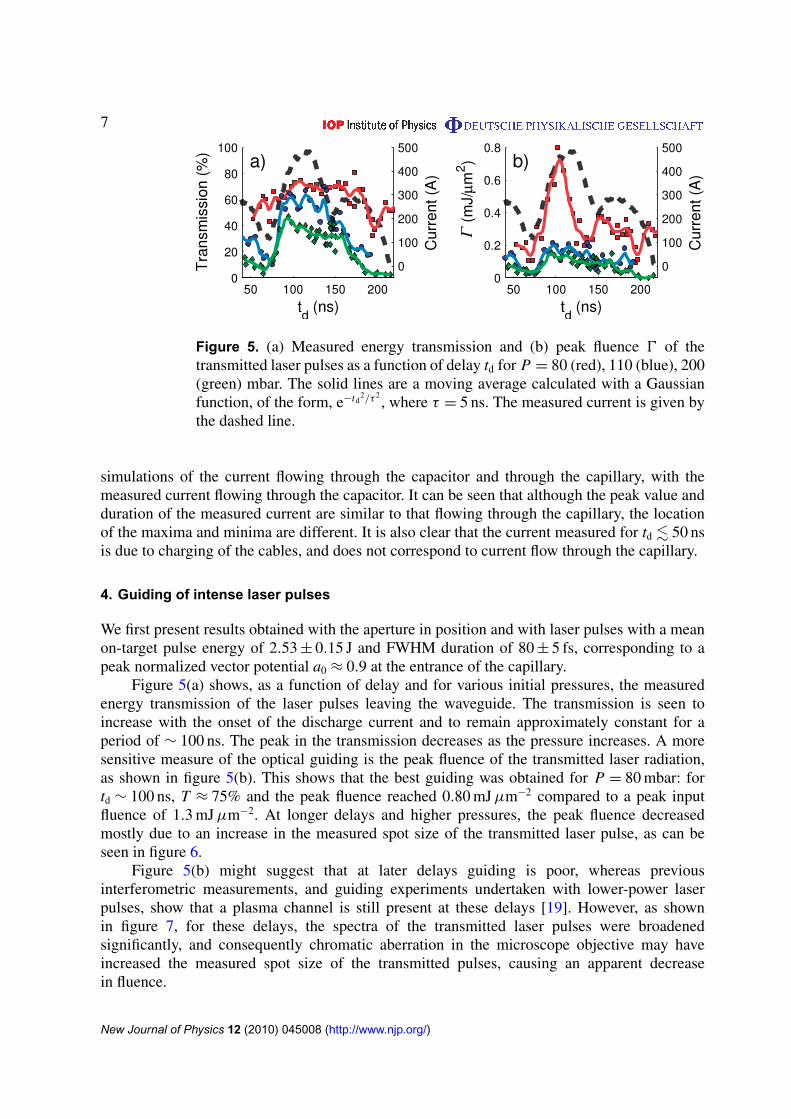
Figure 5. (a) Measured energy transmission and (b) peak fluence 0 of thetransmitted laser pulses as a function of delay td for P = 80 (red), 110 (blue), 200(green) mbar. The solid lines are a moving average calculated with a Gaussianfunction, of the form, e−td
2/τ 2, where τ = 5 ns. The measured current is given by
the dashed line.
simulations of the current flowing through the capacitor and through the capillary, with themeasured current flowing through the capacitor. It can be seen that although the peak value andduration of the measured current are similar to that flowing through the capillary, the locationof the maxima and minima are different. It is also clear that the current measured for td . 50 nsis due to charging of the cables, and does not correspond to current flow through the capillary.
4. Guiding of intense laser pulses
We first present results obtained with the aperture in position and with laser pulses with a meanon-target pulse energy of 2.53 ± 0.15 J and FWHM duration of 80 ± 5 fs, corresponding to apeak normalized vector potential a0 ≈ 0.9 at the entrance of the capillary.
Figure 5(a) shows, as a function of delay and for various initial pressures, the measuredenergy transmission of the laser pulses leaving the waveguide. The transmission is seen toincrease with the onset of the discharge current and to remain approximately constant for aperiod of ∼ 100 ns. The peak in the transmission decreases as the pressure increases. A moresensitive measure of the optical guiding is the peak fluence of the transmitted laser radiation,as shown in figure 5(b). This shows that the best guiding was obtained for P = 80 mbar: fortd ∼ 100 ns, T ≈ 75% and the peak fluence reached 0.80 mJ µm−2 compared to a peak inputfluence of 1.3 mJ µm−2. At longer delays and higher pressures, the peak fluence decreasedmostly due to an increase in the measured spot size of the transmitted laser pulse, as can beseen in figure 6.
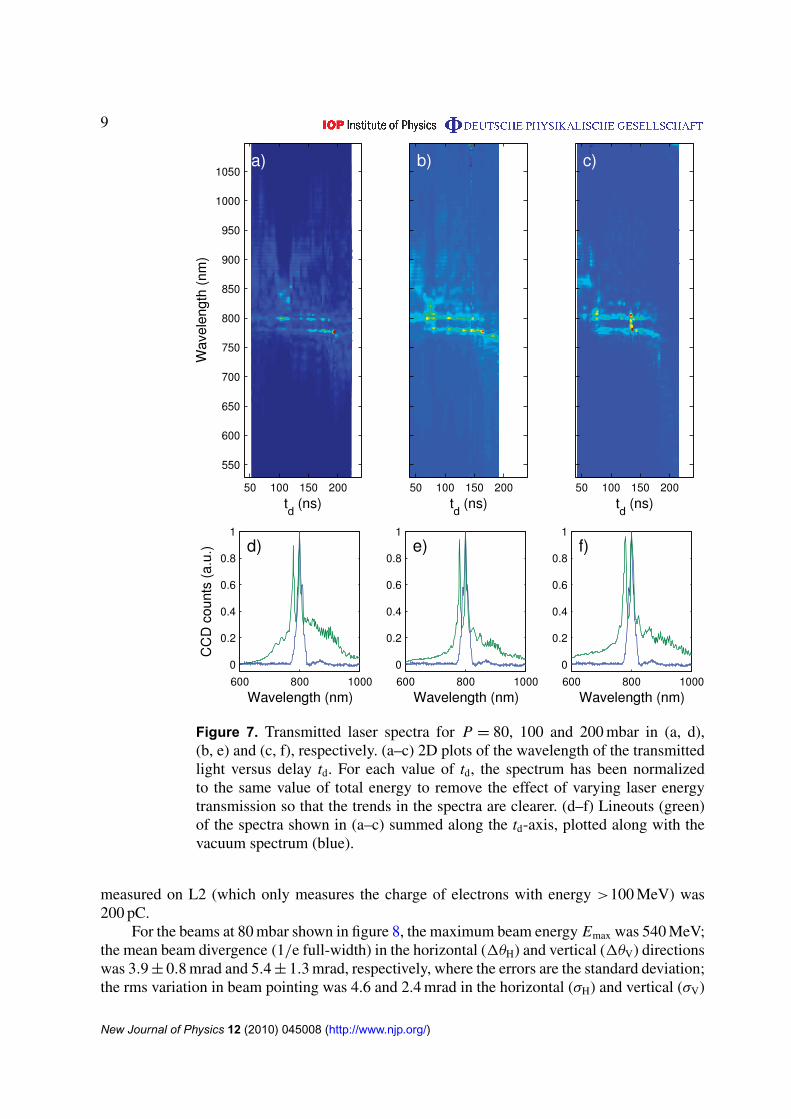
Figure 5(b) might suggest that at later delays guiding is poor, whereas previousinterferometric measurements, and guiding experiments undertaken with lower-power laserpulses, show that a plasma channel is still present at these delays [19]. However, as shownin figure 7, for these delays, the spectra of the transmitted laser pulses were broadenedsignificantly, and consequently chromatic aberration in the microscope objective may haveincreased the measured spot size of the transmitted pulses, causing an apparent decreasein fluence.
New Journal of Physics 12 (2010) 045008 (http://www.njp.org/)
8
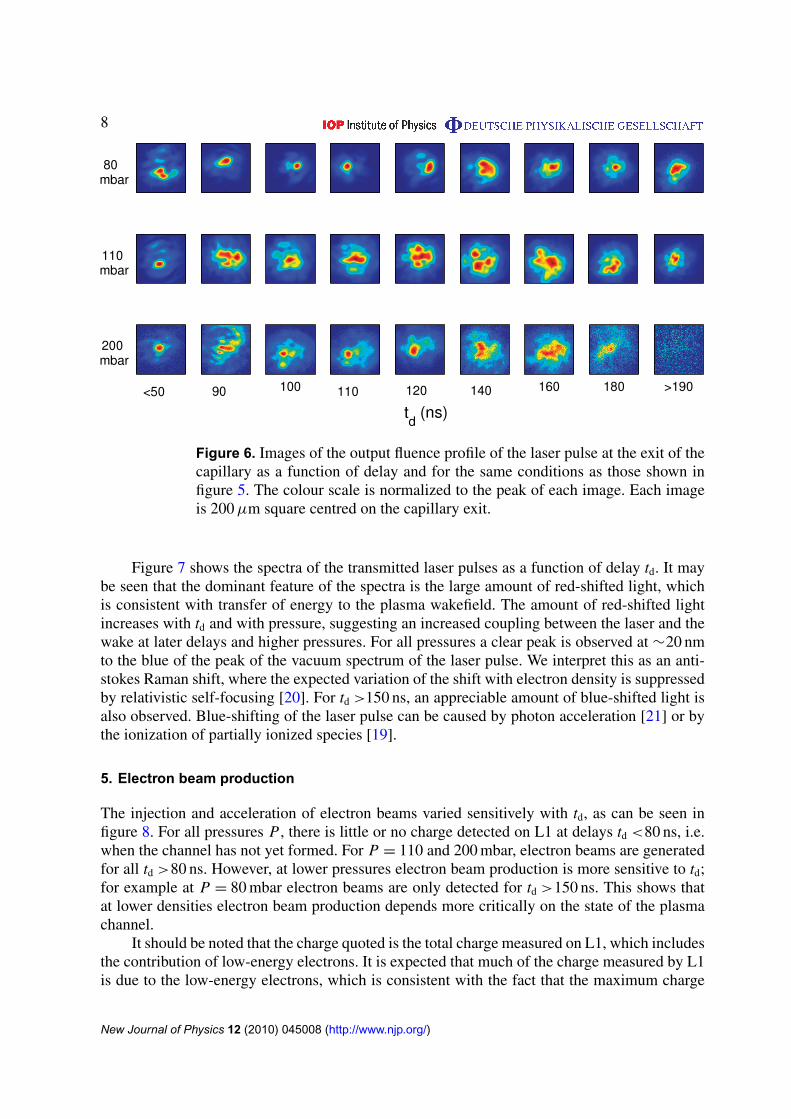
Figure 6. Images of the output fluence profile of the laser pulse at the exit of thecapillary as a function of delay and for the same conditions as those shown infigure 5. The colour scale is normalized to the peak of each image. Each imageis 200 µm square centred on the capillary exit.
Figure 7 shows the spectra of the transmitted laser pulses as a function of delay td. It maybe seen that the dominant feature of the spectra is the large amount of red-shifted light, whichis consistent with transfer of energy to the plasma wakefield. The amount of red-shifted lightincreases with td and with pressure, suggesting an increased coupling between the laser and thewake at later delays and higher pressures. For all pressures a clear peak is observed at ∼20 nmto the blue of the peak of the vacuum spectrum of the laser pulse. We interpret this as an anti-stokes Raman shift, where the expected variation of the shift with electron density is suppressedby relativistic self-focusing [20]. For td >150 ns, an appreciable amount of blue-shifted light isalso observed. Blue-shifting of the laser pulse can be caused by photon acceleration [21] or bythe ionization of partially ionized species [19].
5. Electron beam production
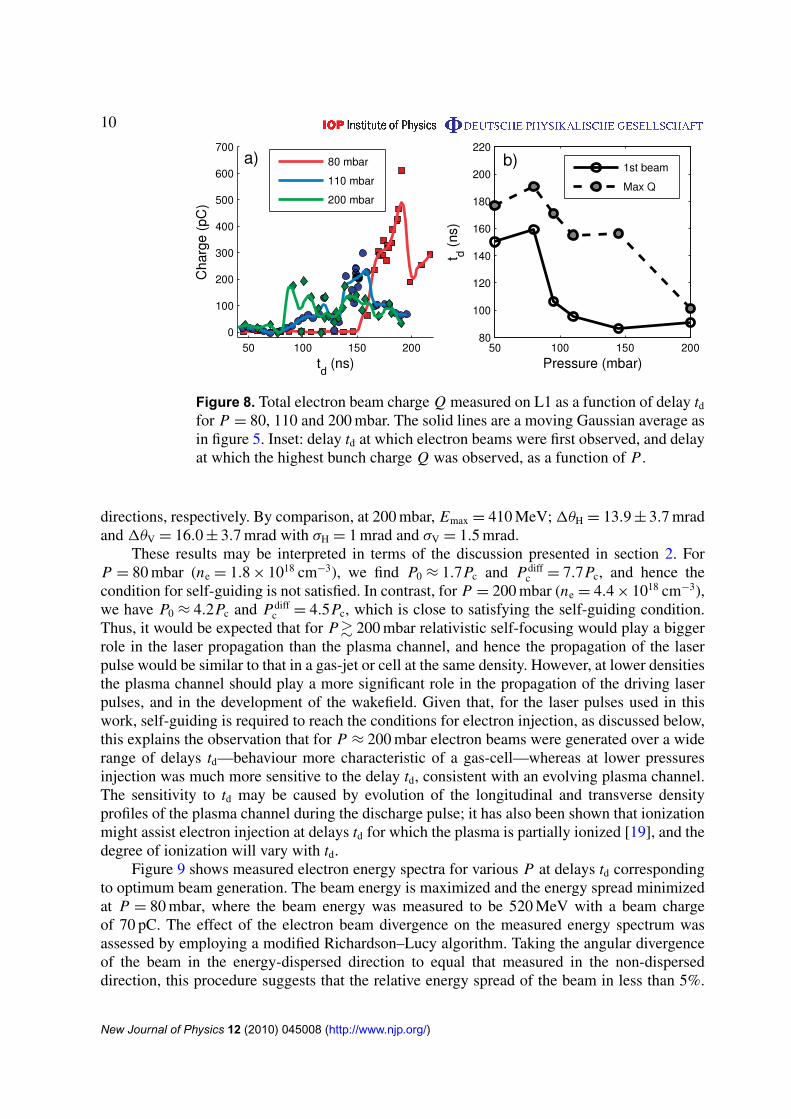
The injection and acceleration of electron beams varied sensitively with td, as can be seen infigure 8. For all pressures P , there is little or no charge detected on L1 at delays td <80 ns, i.e.when the channel has not yet formed. For P = 110 and 200 mbar, electron beams are generatedfor all td >80 ns. However, at lower pressures electron beam production is more sensitive to td;for example at P = 80 mbar electron beams are only detected for td >150 ns. This shows thatat lower densities electron beam production depends more critically on the state of the plasmachannel.
It should be noted that the charge quoted is the total charge measured on L1, which includesthe contribution of low-energy electrons. It is expected that much of the charge measured by L1is due to the low-energy electrons, which is consistent with the fact that the maximum charge
New Journal of Physics 12 (2010) 045008 (http://www.njp.org/)
9
Figure 7. Transmitted laser spectra for P = 80, 100 and 200 mbar in (a, d),(b, e) and (c, f), respectively. (a–c) 2D plots of the wavelength of the transmittedlight versus delay td. For each value of td, the spectrum has been normalizedto the same value of total energy to remove the effect of varying laser energytransmission so that the trends in the spectra are clearer. (d–f) Lineouts (green)of the spectra shown in (a–c) summed along the td-axis, plotted along with thevacuum spectrum (blue).
measured on L2 (which only measures the charge of electrons with energy >100 MeV) was200 pC.
For the beams at 80 mbar shown in figure 8, the maximum beam energy Emax was 540 MeV;the mean beam divergence (1/e full-width) in the horizontal (1θH) and vertical (1θV) directionswas 3.9 ± 0.8 mrad and 5.4 ± 1.3 mrad, respectively, where the errors are the standard deviation;the rms variation in beam pointing was 4.6 and 2.4 mrad in the horizontal (σH) and vertical (σV)
New Journal of Physics 12 (2010) 045008 (http://www.njp.org/)
10
Figure 8. Total electron beam charge Q measured on L1 as a function of delay td
for P = 80, 110 and 200 mbar. The solid lines are a moving Gaussian average asin figure 5. Inset: delay td at which electron beams were first observed, and delayat which the highest bunch charge Q was observed, as a function of P .
directions, respectively. By comparison, at 200 mbar, Emax = 410 MeV; 1θH = 13.9 ± 3.7 mradand 1θV = 16.0 ± 3.7 mrad with σH = 1 mrad and σV = 1.5 mrad.
These results may be interpreted in terms of the discussion presented in section 2. ForP = 80 mbar (ne = 1.8 × 1018 cm−3), we find P0 ≈ 1.7Pc and Pdiff
c = 7.7Pc, and hence thecondition for self-guiding is not satisfied. In contrast, for P = 200 mbar (ne = 4.4 × 1018 cm−3),we have P0 ≈ 4.2Pc and Pdiff
c = 4.5Pc, which is close to satisfying the self-guiding condition.Thus, it would be expected that for P& 200 mbar relativistic self-focusing would play a biggerrole in the laser propagation than the plasma channel, and hence the propagation of the laserpulse would be similar to that in a gas-jet or cell at the same density. However, at lower densitiesthe plasma channel should play a more significant role in the propagation of the driving laserpulses, and in the development of the wakefield. Given that, for the laser pulses used in thiswork, self-guiding is required to reach the conditions for electron injection, as discussed below,this explains the observation that for P ≈ 200 mbar electron beams were generated over a widerange of delays td—behaviour more characteristic of a gas-cell—whereas at lower pressuresinjection was much more sensitive to the delay td, consistent with an evolving plasma channel.The sensitivity to td may be caused by evolution of the longitudinal and transverse densityprofiles of the plasma channel during the discharge pulse; it has also been shown that ionizationmight assist electron injection at delays td for which the plasma is partially ionized [19], and thedegree of ionization will vary with td.
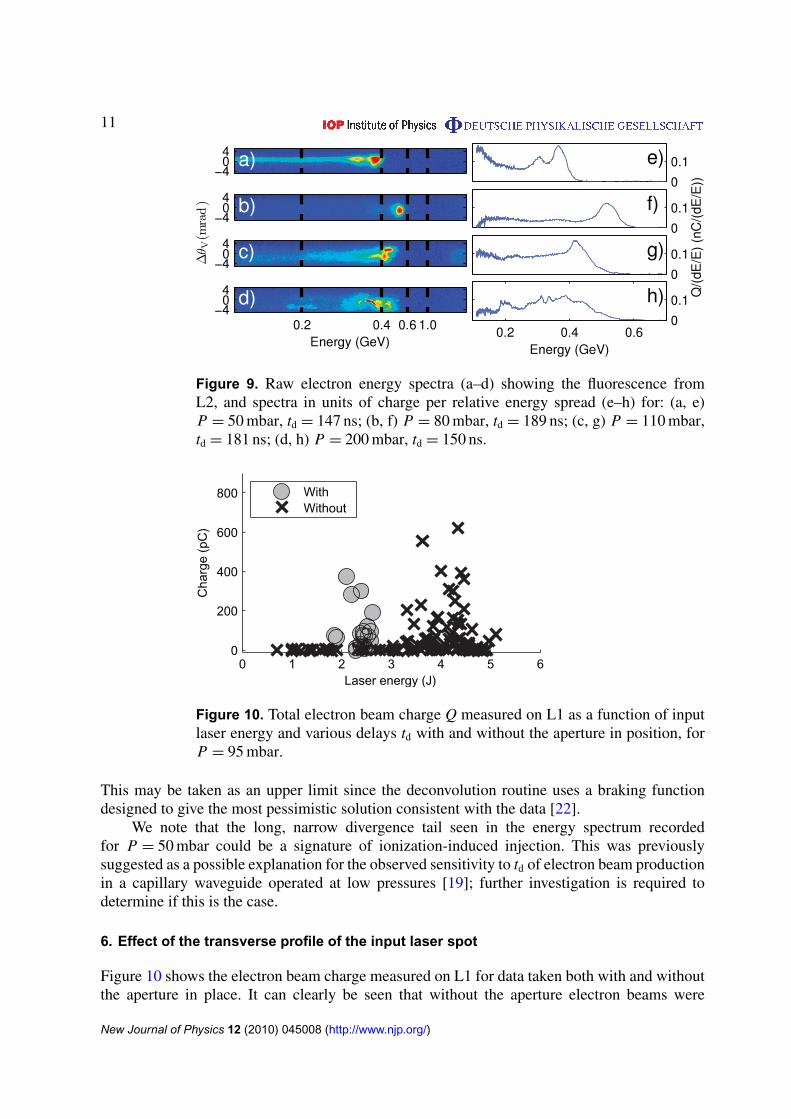
Figure 9 shows measured electron energy spectra for various P at delays td correspondingto optimum beam generation. The beam energy is maximized and the energy spread minimizedat P = 80 mbar, where the beam energy was measured to be 520 MeV with a beam chargeof 70 pC. The effect of the electron beam divergence on the measured energy spectrum wasassessed by employing a modified Richardson–Lucy algorithm. Taking the angular divergenceof the beam in the energy-dispersed direction to equal that measured in the non-disperseddirection, this procedure suggests that the relative energy spread of the beam in less than 5%.
New Journal of Physics 12 (2010) 045008 (http://www.njp.org/)
11
Figure 9. Raw electron energy spectra (a–d) showing the fluorescence fromL2, and spectra in units of charge per relative energy spread (e–h) for: (a, e)P = 50 mbar, td = 147 ns; (b, f) P = 80 mbar, td = 189 ns; (c, g) P = 110 mbar,td = 181 ns; (d, h) P = 200 mbar, td = 150 ns.
0 1 2 3 4 5 60
200
400
600
800
Laser energy (J)
Cha
rge
(pC
)
WithWithout
Figure 10. Total electron beam charge Q measured on L1 as a function of inputlaser energy and various delays td with and without the aperture in position, forP = 95 mbar.
This may be taken as an upper limit since the deconvolution routine uses a braking functiondesigned to give the most pessimistic solution consistent with the data [22].
We note that the long, narrow divergence tail seen in the energy spectrum recordedfor P = 50 mbar could be a signature of ionization-induced injection. This was previouslysuggested as a possible explanation for the observed sensitivity to td of electron beam productionin a capillary waveguide operated at low pressures [19]; further investigation is required todetermine if this is the case.
6. Effect of the transverse profile of the input laser spot
Figure 10 shows the electron beam charge measured on L1 for data taken both with and withoutthe aperture in place. It can clearly be seen that without the aperture electron beams were
New Journal of Physics 12 (2010) 045008 (http://www.njp.org/)
12
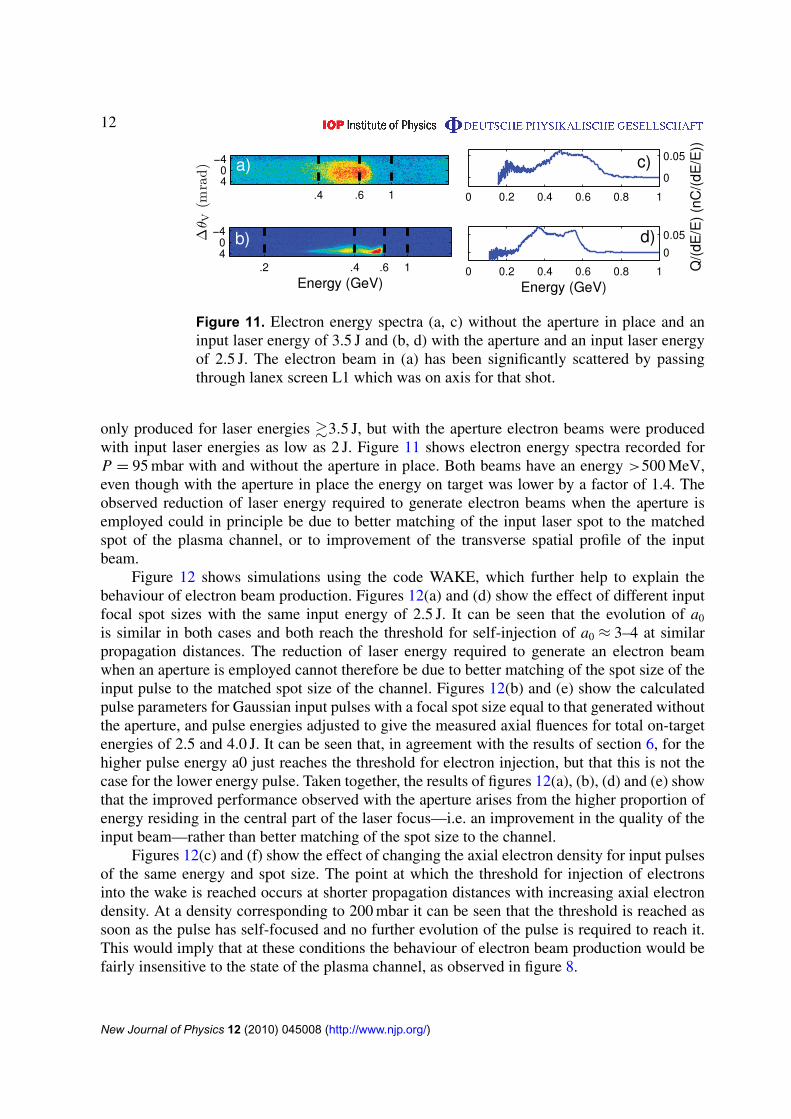
Figure 11. Electron energy spectra (a, c) without the aperture in place and aninput laser energy of 3.5 J and (b, d) with the aperture and an input laser energyof 2.5 J. The electron beam in (a) has been significantly scattered by passingthrough lanex screen L1 which was on axis for that shot.
only produced for laser energies &3.5 J, but with the aperture electron beams were producedwith input laser energies as low as 2 J. Figure 11 shows electron energy spectra recorded forP = 95 mbar with and without the aperture in place. Both beams have an energy >500 MeV,even though with the aperture in place the energy on target was lower by a factor of 1.4. Theobserved reduction of laser energy required to generate electron beams when the aperture isemployed could in principle be due to better matching of the input laser spot to the matchedspot of the plasma channel, or to improvement of the transverse spatial profile of the inputbeam.
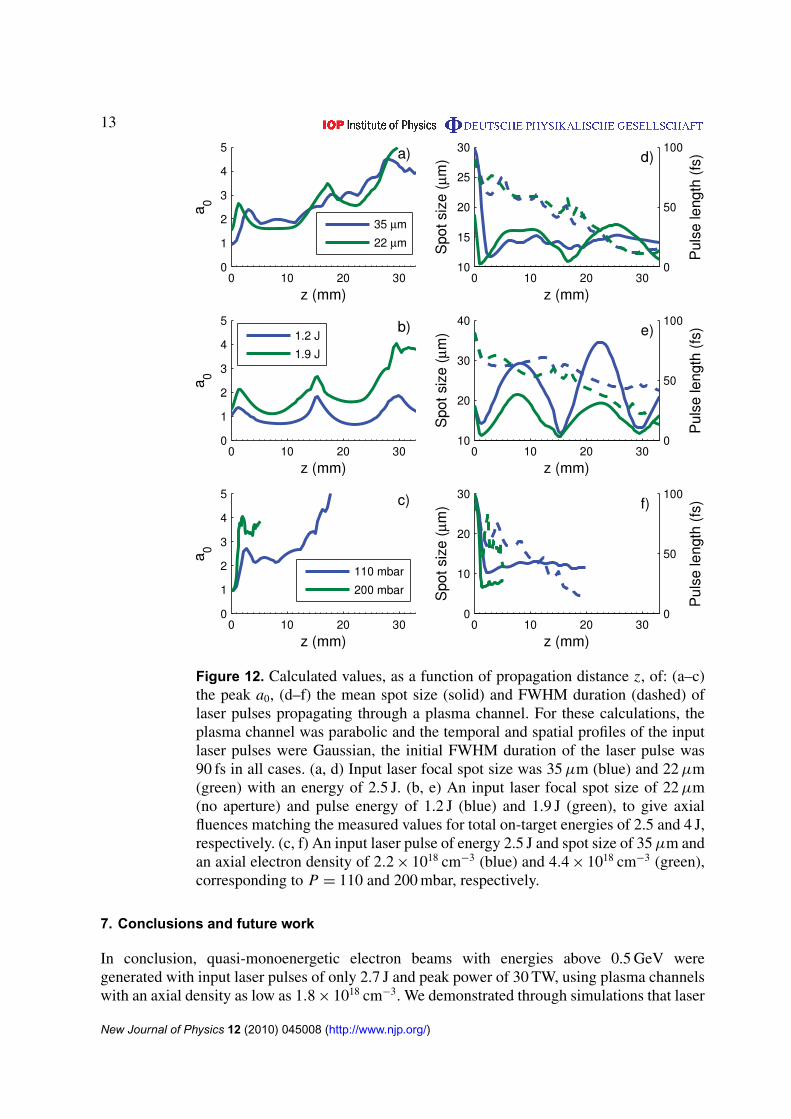
Figure 12 shows simulations using the code WAKE, which further help to explain thebehaviour of electron beam production. Figures 12(a) and (d) show the effect of different inputfocal spot sizes with the same input energy of 2.5 J. It can be seen that the evolution of a0
is similar in both cases and both reach the threshold for self-injection of a0 ≈ 3–4 at similarpropagation distances. The reduction of laser energy required to generate an electron beamwhen an aperture is employed cannot therefore be due to better matching of the spot size of theinput pulse to the matched spot size of the channel. Figures 12(b) and (e) show the calculatedpulse parameters for Gaussian input pulses with a focal spot size equal to that generated withoutthe aperture, and pulse energies adjusted to give the measured axial fluences for total on-targetenergies of 2.5 and 4.0 J. It can be seen that, in agreement with the results of section 6, for thehigher pulse energy a0 just reaches the threshold for electron injection, but that this is not thecase for the lower energy pulse. Taken together, the results of figures 12(a), (b), (d) and (e) showthat the improved performance observed with the aperture arises from the higher proportion ofenergy residing in the central part of the laser focus—i.e. an improvement in the quality of theinput beam—rather than better matching of the spot size to the channel.
Figures 12(c) and (f) show the effect of changing the axial electron density for input pulsesof the same energy and spot size. The point at which the threshold for injection of electronsinto the wake is reached occurs at shorter propagation distances with increasing axial electrondensity. At a density corresponding to 200 mbar it can be seen that the threshold is reached assoon as the pulse has self-focused and no further evolution of the pulse is required to reach it.This would imply that at these conditions the behaviour of electron beam production would befairly insensitive to the state of the plasma channel, as observed in figure 8.
New Journal of Physics 12 (2010) 045008 (http://www.njp.org/)
13
Figure 12. Calculated values, as a function of propagation distance z, of: (a–c)the peak a0, (d–f) the mean spot size (solid) and FWHM duration (dashed) oflaser pulses propagating through a plasma channel. For these calculations, theplasma channel was parabolic and the temporal and spatial profiles of the inputlaser pulses were Gaussian, the initial FWHM duration of the laser pulse was90 fs in all cases. (a, d) Input laser focal spot size was 35 µm (blue) and 22 µm(green) with an energy of 2.5 J. (b, e) An input laser focal spot size of 22 µm(no aperture) and pulse energy of 1.2 J (blue) and 1.9 J (green), to give axialfluences matching the measured values for total on-target energies of 2.5 and 4 J,respectively. (c, f) An input laser pulse of energy 2.5 J and spot size of 35 µm andan axial electron density of 2.2 × 1018 cm−3 (blue) and 4.4 × 1018 cm−3 (green),corresponding to P = 110 and 200 mbar, respectively.
7. Conclusions and future work
In conclusion, quasi-monoenergetic electron beams with energies above 0.5 GeV weregenerated with input laser pulses of only 2.7 J and peak power of 30 TW, using plasma channelswith an axial density as low as 1.8 × 1018 cm−3. We demonstrated through simulations that laser
New Journal of Physics 12 (2010) 045008 (http://www.njp.org/)
14
pulses with Pc <P . Pdiffc will, in a plasma channel with wm > wsf, self-focus and propagate
stably with a near-constant spot size approximately equal to wsf. In contrast, in a gas-cell or jetlaser pulses with P< Pdiff
c focus to a spot of order wsf, but thereafter diffract, reducing a0. Thesedifferences mean that a plasma channel allows a0 to increase through temporal compression tothe point that self-injection occurs for laser powers and plasma densities too low to achieveelectron injection in a gas-jet or cell. The transition between relativistically self-guided andchannel-assisted guiding was observed in the behaviour of the production of electron beams.We have also shown experimentally that the generation of electron beams depends stronglyon the properties of the input laser spot. Improving the focal spot quality with a soft aperturereduced by a factor of almost 2 the input laser energy required to produce electron beams. Takentogether, these results suggest that guiding high-quality driving laser pulses in plasma channelswill enable high-energy quasi-monoenergetic electron beams to be generated from relativelysmall-scale laser systems.
Acknowledgments
We acknowledge the support of the UK Engineering and Physical Sciences Research Council(grant EP/C005449) and the European Community-New and Emerging Science and TechnologyActivity under the FP6 ‘Structuring the European Research Area’ programme (projectEuroLEAP, contract number 028514).
References
[1] Tajima T and Dawson J M 1979 Phys. Rev. Lett. 43 267[2] Geddes C G R et al 2004 Nature 431 538[3] Mangles S P D et al 2004 Nature 431 535[4] Faure J et al 2004 Nature 431 541[5] Leemans W P et al 2006 Nat. Phys. 2 696[6] Nakamura K et al 2007 Phys. Plasmas 14 056708[7] Kneip S et al 2009 Phys. Rev. Lett. 103 035002[8] Esarey E et al 2002 IEEE J. Quantum Electron. 33 1879[9] Lu W et al 2007 Phys. Rev. Acc. ST Beams 10 061301
[10] Mora P and Antonsen Jr T M 1997 Phys. Plasmas 4 217[11] Mangles S P D et al 2007 Phys. Plasmas 14 056702[12] Mangles S P D et al 2008 IEEE Trans. Plasma Sci. 36 1715[13] Spence D J and Hooker S M 2000 Phys. Rev. E 63 015401[14] Butler A, Spence D J and Hooker S M 2002 Phys. Rev. Lett. 89 185003[15] Bobrova N A et al 2001 Phys. Rev. E 65 016407[16] Broks B H P, Garloff K and van der Mullen J J A M 2005 Phys. Rev. E 71 016401[17] Gonsalves A J et al 2007 Phys. Rev. Lett. 98 025002[18] Davis A Gnucap: An Analog and Mixed Signal Circuit Simulator http://wiki.gnucap.org/dokuwiki/doku.
php?id=gnucap:start/[19] Rowlands-Rees T P et al 2008 Phys. Rev. Lett. 100 105005[20] Hooker S M Ibbotson T P A Bourgeois N Experimental observation of relativistically damped Raman shifts
in preparation[21] Mori W B 1997 IEEE J. Quantum Electron. 33 1942[22] Rowlands-Rees T P 2009 Laser wakefield acceleration in the hydrogen-filled capillary discharge waveguide
PhD Thesis University of Oxford
New Journal of Physics 12 (2010) 045008 (http://www.njp.org/)