Direct laser writing of a new type of optical waveguides and ...
268
HAL Id: tel-02275792 https://tel.archives-ouvertes.fr/tel-02275792 Submitted on 2 Sep 2019 HAL is a multi-disciplinary open access archive for the deposit and dissemination of sci- entific research documents, whether they are pub- lished or not. The documents may come from teaching and research institutions in France or abroad, or from public or private research centers. L’archive ouverte pluridisciplinaire HAL, est destinée au dépôt et à la diffusion de documents scientifiques de niveau recherche, publiés ou non, émanant des établissements d’enseignement et de recherche français ou étrangers, des laboratoires publics ou privés. Direct laser writing of a new type of optical waveguides and components in silver containing glasses Alain Abou Khalil To cite this version: Alain Abou Khalil. Direct laser writing of a new type of optical waveguides and components in silver containing glasses. Biotechnology. Université de Bordeaux; Université Laval (Québec, Canada), 2018. English. NNT : 2018BORD0290. tel-02275792
-
Upload
khangminh22 -
Category
Documents
-
view
1 -
download
0
Transcript of Direct laser writing of a new type of optical waveguides and ...

HAL Id: tel-02275792https://tel.archives-ouvertes.fr/tel-02275792
Submitted on 2 Sep 2019
HAL is a multi-disciplinary open accessarchive for the deposit and dissemination of sci-entific research documents, whether they are pub-lished or not. The documents may come fromteaching and research institutions in France orabroad, or from public or private research centers.
L’archive ouverte pluridisciplinaire HAL, estdestinée au dépôt et à la diffusion de documentsscientifiques de niveau recherche, publiés ou non,émanant des établissements d’enseignement et derecherche français ou étrangers, des laboratoirespublics ou privés.
Direct laser writing of a new type of optical waveguidesand components in silver containing glasses
Alain Abou Khalil
To cite this version:Alain Abou Khalil. Direct laser writing of a new type of optical waveguides and components in silvercontaining glasses. Biotechnology. Université de Bordeaux; Université Laval (Québec, Canada), 2018.English. �NNT : 2018BORD0290�. �tel-02275792�

THÈSE EN COTUTELLE PRÉSENTÉE
POUR OBTENIR LE GRADE DE
DOCTEUR DE
L’UNIVERSITÉ DE BORDEAUX
ET DE L’UNIVERSITÉ LAVAL
ÉCOLE DOCTORALE DES SCIENCES PHYSIQUES ET DE L’INGÉNIEUR
SPÉCIALITÉ : LASERS, MATIÈRE ET NANOSCIENCES
Par Alain ABOU KHALIL
Direct Laser Writing of a new type of optical waveguides
and components in silver containing glasses
Sous la direction de Réal VALLÉE et de Lionel CANIONI
Soutenue le 28 Novembre 2018
Membres de Jury :
M. POUMELLEC, Bertrand, Directeur de recherche CNRS, Université Paris-Sud Président
Rapporteur
M. EATON, Shane, Chercheur Permanent à istituto di Fotonica e Nanotecnologie
Rapporteur
M. MESSADDEQ, Younès, Professeur à l’Université Laval Examinateur
M. BELLEC, Mathieu, Chargé de recherche à l’Université Nice-Sophia Antipolis Examinateur
M. VALLÉE, Réal, Professeur à l’Université Laval Examinateur
M. CANIONI, Lionel, Professeur à l’Université de Bordeaux Examinateur
M. PETIT, Yannick, Maître de conférence à l’Université de Bordeaux Invité

i
ii
Résumé
L'interaction laser-matière a intéressé la communauté scientifique depuis la
découverte du laser dans les années 1960. La recherche et le développement au
cours des dernières années ont conduit à un nombre quasiment illimité
d'applications industrielles et médicales basées sur le laser. Nettoyage laser,
découpe, marquage, chirurgie des yeux au laser, ablation de tumeurs cancéreuses,
imagerie médicale, le laser offre un outil polyvalent et non remplaçable dans les
domaines industriels et médicaux. Plus spécifiquement, l'interaction laser-verre a
été largement étudiée au cours des deux dernières décennies. Le processus de
focalisation des lasers femtosecondes à l'intérieur des verres, afin de modifier leurs
propriétés physico-chimiques, est appelé inscription laser directe. La technique
d’inscription laser directe permet une structuration tri-dimensionnelle (3D) directe
et rapide du verre, rendant possible la création de composants optiques 3D intégrés
dans des matériaux transparents. Cette nouvelle technique présente de nombreux
avantages par rapport à la lithographie, technique traditionnellement utilisée pour
la création des composants optiques. La lithographie se limite à la structuration bi-
dimensionnelle (2D) des matériaux et nécessite de nombreuses étapes, ce qui rend
l’inscription laser directe hautement compatible pour le transfert de procédés de
fabrication industrielle. De nombreuses applications pourraient être basées sur la
technique d’inscription laser directe, telles que la création de capteurs miniaturisés
et/ou de composants photoniques dans des puces de verre. En effet, par exemple,
la technique d’inscription laser directe dans les verres a conduit à la création de
Modular Photonics, une entreprise basée en Australie qui vend des micro-puces à
base de verre manufacturées par la technique d’inscription laser directe pour des
applications de sélection de mode, plus spécifiquement pour des besoins
astronomiques. Toutefois, il reste pertinent de mener une recherche permettant de
développer la compréhension et la maitrise de nouveaux processus lors de
l’interaction laser-matière, ce qui constitue le fondement de cette thèse.
Cette thèse a ainsi été réalisée grâce à une collaboration entre l'Université de
Bordeaux (France) et l'Université Laval à Québec (Canada), dans le cadre du
Laboratoire International Appliqué (LIA) LUMAQ (Lumière Matière Aquitaine
Québec). Plus précisément, elle a été réalisée entre trois laboratoires, le Centre des
lasers intenses et ses applications (CELIA) et l’Institut de chimie de la matière
condensée de Bordeaux (ICMCB) de l’Université de Bordeaux et le Centre
d’Optique, Photonique et Laser (COPL) à l'Université Laval, Québec, Canada. Elle
consistait à consacrer près de la moitié du temps de la thèse dans chaque

iii
université tout en travaillant sur le même projet, qui est la continuité des
recherches menées dans le groupe « Short Pulse Lasers : Applications et Matériaux
» (SLAM) de Lionel Canioni et le groupe « Chimie et Photonique des Matériaux
Oxyde de Fluorescence », sous la direction de Thierry Cardinal à l'ICMCB. Les
recherches précédentes étaient basées sur l'optimisation et la maîtrise de la
synthèse des verres oxydes à base de phosphate de zinc contenant de l'argent,
ainsi que sur la recherche et la compréhension des différents processus exotiques
de l’interaction laser-verre après l’inscription laser directe. Ces recherches ont
abouti à la création de l’entreprise « Argolight », une spin-off spécialisée dans la
vente de lames de verre structurées au laser permettant l’étalonnage de
fluorescence des microscopes. En outre, la NASA a utilisé un des produits
d’Argolight pour équiper le microscope de fluorescence de la Station spatiale
internationale pour le SpaceX SPX CRS 11 - Falcon 9.
Les travaux antérieurs du groupe sur les verres de phosphate de zinc contenant de
l'argent ont permis d’une part de formuler et développer des verres innovants de
qualité optique, et d’autre part d’induire par laser un riche éventail de propriétés
induites par irradiation laser femtoseconde. En effet, de tels verres phosphate à
l'argent sont des verres spéciaux et exotiques, en comparaison aux verres
standards généralement utilisés par la communauté scientifique ou l’industrie
manufacturière laser, pour réaliser l’inscription laser directe. L'incorporation d'ions
d’argent à l'intérieur de la matrice de verre permet des réponses exotiques du verre
après l’inscription laser directe, telles que : la création de très forts contrastes de
fluorescence à partir de la synthèse de nouvelles espèces moléculaires de type
agrégats ; l’exaltation localisée en 3D des propriétés optiques non linéaires de
génération de troisième harmonique et aussi la création directe et pionnière de
génération de second harmonique effective ; la fabrication localisée d’un milieu
effectif verre/métal suite à la précipitation de nanoparticules métalliques d’argent à
réponse plasmonique de surface. Dans ce contexte, ce projet de thèse ambitionne
d’aller au-delà des avancées obtenues sur la création locale de propriétés optiques,
en visant la création de nouvelles propriétés, et surtout le développement de
fonctionnalités optiques. Ainsi, ce projet de thèse porte sur la création et la
fonctionnalisation de nouveaux types de guides et composants optiques basés sur
la photochimie de l’argent activée par irradiation laser. En particulier, le projet
prévoit de créer de nouveaux types de guides d’ondes ainsi que des composants
optiques intégrés, dont les propriétés ne sont pas accessibles à partir des verres
standards.
iv
Ce manuscrit de thèse est divisé en quatre chapitres. Le premier chapitre parle du
fond du verre, du laser et de l’interaction laser-verre en général tandis que le
deuxième chapitre concerne plus spécifiquement l'écriture laser directe dans les
verres à l'argent qui présente une réponse originale.
Elle induit la création des agrégats d'argent fluorescents Agmx+ autour du voxel
d'interaction. Leur distribution spatiale est dictée par la géométrie du faisceau laser
gaussien au foyer de l’interaction. Ces espèces Agmx+ sont responsables d'un
nouveau type de changement d'indice de réfraction (∆n) compatible avec les
applications de guidage optique. Ce nouveau type de ∆n diffère totalement du type
I bien connu. En effet, il prend son origine dans la création d’agrégats d'argent
photo-induits autour du voxel d'interaction. Ce type de ∆n, basé sur de nouvelles
espèces chimiques, implique de nouvelles liaisons chimiques avec des nuages
d'électrons plus polarisables que ceux des ions argent, Ag+, initiallement présents
dans le verre, ce qui donne accès à un changement d’indice de réfraction local
permanent, indépendamment de toute modification de la matrice de verre elle-
même, c'est-à-dire une modification extrinsèque à la matrice vitreuse. Le ∆n photo-
induit augmente en fonction des paramètres d’irradiation et atteint une valeur
maximale d’environ 8x10⁻³. Des guides d'ondes multimodes et monomodes ont été
créés à l'intérieur des verres à l'argent. Les guides multimode (MM) et monomodes
(SM) ont été réalisés à partir de la photochimie induite de l’argent : un guide
d'onde multimode (MM) dans les longueurs d'onde visible et infrarouge présentait
des dimensions transverses typiques de ~415 µm2 avec un ∆n = 4.510-3 ; un
guide d'onde monomode (SM) à la longueur d’onde 𝜆 = 630 nm présentait des
dimensions de 36 µm2, ∆n = 2.5x10⁻³ et des pertes de propagation dont la borne
supérieure a été estimée à plus 1.2 dB/cm. Le profil de mode de guide d'onde SM
est un mode guidé par chacun des deux plans des agrégats d'argent agissant
comme un supermode. La simulation des profils de mode, conjointement à des
études de microscopie corrélative, nous a permis de montrer une correspondance
significative avec les modes expérimentaux d’une part, et d’autre part de confirmer
que le ∆n est vraiment basé sur la création des agrégats d’argent dans les verres
d’argent. Après cela, un séparateur 50%-50% de faisceau de géométrie Y et un
coupleur 50%-50% ont été écrits pour une longueur d’onde 𝜆= 630nm, ouvrant la
porte à la réalisation de composants optiques 3D intégrés et de circuits photoniques
intégrés. Finalement, le processus de guidage d'onde a été démontré dans des
fibres en forme de ruban contenant de l'argent en inscrivant un guide d'onde de 1,4
cm de long. Ces résultats offrent des opportunités uniques pour des applications
telles que la détection fibrée, le filtrage, et/ou la photonique totalement intégrée.

v
Le troisième chapitre concerne une étude comparative entre le type I et le nouveau
type A dans les verres contenant de l’argent.
En effet, l'inscription laser directe d’un changement d’indice de type I a été
également réalisée, à la fois dans un verre au phosphate de zinc à l'argent et sans
argent. Un ∆n négatif de type I peut être observé pour le verre contenant de
l'argent, par rapport à un ∆n également de type I toujours positif dans un verre ne
contenant pas d'argent, ce qui est probablement lié à la différence du rapport O/P
dans la formulation de ces deux verres, ce qui a été déjà signalé par d'autres
groupes de recherche. En revanche, dans les verres contenant de l’argent, en
modifiant les paramètres et le régime du laser, il est possible de déclencher de
façon sélective deux types de modifications différents, soit le type A, soit le type I.
La modification d’indice de type I se produit dans le régime thermique avec une
fluence laser élevée en utilisant un laser à taux de répétition de 250 kHz comparé à
un régime athermique pour une modification de type A utilisant une faible fluence
laser avec un laser à haut taux de répétition (9.8 MHz). Une comparaison de
morphologie entre deux guides d'onde monomodes associé à chaque type montre
la présence d’une grande zone affectée thermiquement pour une modification de
type I et l’absence d’une telle zone pour le type A. Les dimensions globales des
guides d'onde sont respectivement de 24 µm 38 µm et 3 µm 6 µm. Cependant,
les dimensions des profils de mode guidés sont similaires pour les deux types. En
effet, dans le cas du type I, la zone de guidage est d'environ 4 µm x 5 µm et
présente un profil de mode circulaire (dû à l’utilisation des lentilles cylindriques
dans but d’avoir un profil circulaire du faisceau laser) comparé à un modèle
elliptique pour le type A (3 µm 5.5µm). De plus, le ∆n de type I peut passer de
positif à négatif en fonction des paramètres d’irradiation, tandis que la modification
du type A est toujours positive. Ainsi, nous introduisons un nouveau type de
modification/changement d’indice de réfraction que nous appelons type A (inspiré
du nom latin de l’argent, Argentum). Ce nouveau type est basé sur la création des
agrégats d’argent qui prend lieu dans le régime de faible énergie d’impulsion, bien
avant le régime de modification de type I. Ce nouveau type présente de nombreux
avantages par rapport au type I qui sont rapportés dans ce travail : un ∆n toujours
positif pour différents paramètres laser, de plus petites dimensions, ainsi que la
capacité unique d’écrire directement des guides d’onde rasants à la surface du
verre, ceci en prenant avantage du régime énergétique à faible impulsion pour le
type A. De tels guides de surface en type A sont donc prometteurs pour de futures
applications de détection et la réalisation de capteurs.
vi
Le quatrième chapitre présente un des avantages des guides de type A qui est
l’inscription des guides d’ondes proche de la surface ainsi que la création d’un
capteur d’indice de réfraction pionnière.
En prenant avantage du régime énergétique à faible impulsion pour créer le type A
par rapport au type I, des guides d'ondes rasants à proximité de la surface ont été
écrits dans un verre de phosphate de zinc à l’argent sans processus
supplémentaires, ce qui constitue une première. Aucune attaque chimique, ni
utilisation d’un verre renforcé, ni méthode de compensation ne sont nécessaires
pour obtenir des guides d'ondes de type A proches de la surface en vue
d’applications de détection. Non seulement des guides d'onde proches de la surface
sont réalisables avec les guides d'ondes de type A, mais une écriture directe sur la
surface du verre est également possible. Sur la base des guides d'ondes très
proches de la surface (typiquement à 1 µm), un capteur d’indice de réfraction a été
créé dans un bloc de verre de 1 cm. Ceci a permis de montrer pour la première
fois, avec un guide intégré dans un échantillon monolithique, l’existence de deux
résonances en terme d’énergie transportée dans le guide, donnant ainsi accès à
une double zone de détection d’indice de réfraction du milieu environnant le verre,
l’une pour des indices inférieurs à l’indice effectif du guide d'ondes et l’autre pour
des indices égaux ou supérieurs. Une augmentation de 50% de la transmission et
une diminution de 66% ont été observées, pour une gouttelette d'huile de 4 mm
ayant un indice de 1.602 et 1.604 respectivement autour de l’indice du guide. Pour
les guides d'ondes plus loin de la surface, une seule résonance est observée,
correspondant à la chute de transmission lorsque l’indice de l'huile est égal ou
légèrement supérieur à l’indice du guide d'ondes. Pour expliquer cette nouvelle
phénoménologie de capteurs d’indice, un nouveau modèle théorique est proposé
prenant en compte la forme du mode guidé, sa distance à la surface et le couplage
évanescent entre le verre et le milieu extérieur, ainsi que le coefficient de réflexion
de Fresnel. Ainsi, le nouveau modèle développé est le premier modèle à simuler
l’augmentation de la transmission avant l’indice du guide d’onde. Enfin, un capteur
d’indice de réfraction très sensible dans la gamme de 1→1.632 présentant une
chute de transmission de 80% (7dB) pour une longueur d'interaction de 5 mm est
fabriqué dans un bloc de verre de 1 cm contenant de l'argent. Ces résultats sont
prometteurs pour toute application de détection de surface à partir de verres à
l'argent dont l’indice de réfraction peut dès lors être ajusté en amont, en vue de la
gamme réfractive visée.

vii
viii
Abstract
Direct Laser Writing (DLW) has been an exponentially growing research field during
the last two decades, by providing an efficient and robust way to directly fabricate
three dimensional (3D) structures in transparent materials such as glasses using
femtosecond laser pulses. It exhibits many advantages over the lithography
technique, which is mostly limited to two dimensional (2D) structuring and involves
many fabrication steps. This competitive aspect makes the DLW technique suitable
for future technological transfer to advanced industrial manufacturing. Generally,
DLW in glasses induces physical changes such as permanent local refractive index
modifications that have been classified under three distinct types: (Type I, Type II
& Type III). In silver containing glasses with embedded silver ions Ag+, DLW
induces the creation of fluorescent silver clusters Agmx+ at the vicinity of the
interaction voxel. In this work, we present a new type of refractive index change,
called type A occurring in the low pulse energy regime that is based on the creation
of the photo-induced silver clusters allowing the creation of new linear and
nonlinear optical waveguides in silver containing glasses. Various waveguides, a 50-
50 Y beam splitter, as well as optical couplers, were written based on type A
modification inside bulk glasses and further characterized. In addition, a
comparitive study between type A and type I waveguides is presented, showing
that finely tuning the laser parameters allows the creation of either type A or type I
modifications inside silver containing glasses. Finally, based on type A near-surface
waveguides, a highly sensitive refractive index sensor is created in a 1 cm glass
chip, which could exhibit a pioneer demonstration of double sensing refractive
ranges. The waveguiding properties observed and reported in the bulk of such
silver containing glasses were transposed to ribbon shaped fibers of the same
material. Those results pave the way towards the fabrication of 3D integrated
circuits and fiber sensors with original fluorescent, nonlinear and plasmonic
properties that are not accessible using the standard type I modification.

ix

x
Table of contents
Résumé ............................................................................................. ii
Abstract .......................................................................................... viii
Table of contents ........................................................................................ x
List of tables ........................................................................................... xii
List of figures .......................................................................................... xiv
List of Abbreviations ............................................................................... xliv
Acknowledgment .................................................................................... xlvi
General Introduction .................................................................................. 1
Chapter I General background on glass and laser-matter interaction ... 7 I.1. Introduction ...................................................................................... 7 I.2. Glass ................................................................................................. 8
I.2.1. Glass history .................................................................................. 8 I.2.2. Definition of glass ........................................................................... 8 I.2.3. Glass formation .............................................................................12 I.2.4. Glass making ................................................................................15 I.2.5. Introduction to fiber optics ..............................................................16
I.3. The laser ......................................................................................... 17 I.3.1. Definition of laser ..........................................................................18 I.3.2. Gaussian beam ..............................................................................21 I.3.3. Laser-material interaction ...............................................................24 I.3.4. Effects of laser parameters .............................................................29
I.4. Conclusion ...................................................................................... 36
Chapter II Direct laser writing of a new type of waveguide in silver
containing glasses .................................................................................... 39 II.1. Introduction .................................................................................. 39 II.2. Principle of DLW and ∆n classification ........................................... 40
II.2.1. Type I modification origins .............................................................42 II.3. State of the art: ............................................................................. 43
II.3.1. Waveguides .................................................................................43 II.3.2. Depressed cladding waveguides .....................................................49 II.3.3. Couplers: ....................................................................................51 II.3.4. Beam splitters ..............................................................................56 II.3.5. Waveguide Bragg grating (WBG) ....................................................57 II.3.6. Waveguide lasers .........................................................................59 II.3.7. Photonic lantern ...........................................................................60 II.3.8. Study of phosphate glasses ...........................................................61
II.4. Silver containing zinc phosphate glasses ....................................... 63 II.4.1. Optical properties .........................................................................64 II.4.2. Laser-silver containing glasses interaction .......................................66 II.4.3. Writing window in silver containing glasses ......................................71 II.4.4. Review of previous works on silver containing glasses .......................72
II.5. Experimental setup: Glass and laser used ..................................... 74 II.5.1. Glass synthesis and fiber drawing ...................................................74 II.5.2. Silver containing zinc phosphate glass fibers ....................................75 II.5.3. Laser setup: ................................................................................79 II.5.4. Mode profile setup: .......................................................................80 II.5.5. Confocal Microscope: ....................................................................81 II.5.6. Measuring ∆n: SID4Bio Phasics ......................................................81
xi
II.6. Results .......................................................................................... 84 II.6.1. Structures’ morphology .................................................................84 II.6.2. ∆n vs laser parameters .................................................................86 II.6.3. Waveguiding ................................................................................95 II.6.4. Optical components .................................................................... 110 II.6.5. Waveguides in Ribbon Fibers ........................................................ 115
II.7. Conclusion ................................................................................... 118
Chapter III Comparative study between the type A and the type I
refractive index changes ........................................................................ 122 III.1. Introduction ............................................................................... 122 III.2. Type I modification in phosphate – zinc phosphate glasses ....... 124 III.3. Experimental methods ............................................................... 124
III.3.1. Glasses .................................................................................... 124 III.3.2. Laser setup ............................................................................... 125
III.4. Results ....................................................................................... 126 III.4.1. Type I modification in silver containing and non-containing zinc
phosphate glasses ................................................................................ 126 III.4.2. Structure morphology ................................................................ 133 III.4.3. Refractive index and mode profiles .............................................. 135 III.4.4. Flipping ∆n ............................................................................... 138 III.4.5. Advantages of type A ................................................................. 144
III.5. Conclusion ................................................................................. 146
Chapter IV Direct laser writing of rising near-surface waveguides in
silver containing glasses with no additional processing ......................... 150 IV.1. Introduction ................................................................................ 150 IV.2. Evanescent wave theory ............................................................. 152 IV.3. Evanescent wave based sensors ................................................. 154
IV.3.1. Refractive index sensors ............................................................. 155 IV.4. Experimental methods ................................................................ 166
IV.4.1. Glass ........................................................................................ 166 IV.4.2. Laser setup ............................................................................... 166
IV.5. Results ........................................................................................ 167 IV.5.1. Writing near surface waveguides ................................................. 167 IV.5.2. RI sensor .................................................................................. 176
IV.6. Conclusion .................................................................................. 182
General Conclusion ................................................................................. 184
Perspectives ......................................................................................... 186
Appendix ......................................................................................... 192
References ......................................................................................... 202

xii
List of tables
Table II-1: Table summarizing the theoretical molar composition and the properties
of the different zinc phosphate glasses used in this work. Taken from [135]. ----- 63
Table II-2: Different silver (Ag) species identified following DLW in silver containing
glasses as reported in [139]. --------------------------------------------------------- 67
Table III-1: Table summarizing the different laser parameters for both lasers used
in this chapter. ----------------------------------------------------------------------- 126
Table III-2: Table summarizing the comparison between type I and type A
modification -------------------------------------------------------------------------- 145

xiii

xiv
List of figures
Figure I.1: The atomic arrangement of a A2O3 lattice of a (a) crystal (b) glass. The
crystal exhibits atomic order compared to the disorder exhibited by the glass
compound [5]. .............................................................................................. 9
Figure I.2: Volume variation as a function of the temperature while cooling a liquid
to form a crystal or a glass. Adapted from [1]. .................................................10
Figure I.3 The configurational entropy as a function of the temperature of the
cooling process of an equilibrium liquid. The glass transition freezes the entropy
and avoids a thermodynamic catastrophe. This is known as the Kauzmann paradox.
Taken from [1] .............................................................................................11
Figure I.4 Possible Differential Scanning Calorimetry (DSC) curve of a cooled liquid.
Tg is the glass transition temperature, Tx the temperature of formation of the first
crystal, and Tc the crystallisation temperature. The DSC curve taken from [11]. ..12

xv
Figure I.5 : Schematic presentation of an incident light on a glass sample. Io is the
incident light, IR the reflected light, IA the light absorbed, IT the transmitted light
and IS the scattered light. ..............................................................................14
Figure I.6:Absorption spectrum of a Silica glass in the visible and near infrared
region. A high transmission is shown in the visible range. ..................................15
Figure I.7: Schematic representation of the melting-quenching process...............16
Figure I.8: Schematic presentation of a cylindrical optic fiber with inner core and
outer cladding ..............................................................................................17
Figure I.9: Schematic presentation of a pulsed laser oscillator. ...........................19

xvi
Figure I.10: Schematic presentation of a laser beam (input beam) amplified using
an external amplifier. Taken from [29]. ...........................................................20
Figure I.11: Intensity profile distribution of a Gaussian beam as function of r. ......22
Figure I.12: Schematic presentation of a propagating Gaussian beam. ................23
Figure I.13: Schematic presentation of the multi-photon absorption process. In this
case, an electron in the valence band absorbs 3 photons to pass to the conduction
band. ..........................................................................................................24
Figure I.14: Schematic presentation of the photo-ionization processes during laser-
glass interaction. (a) Multi-photon ionization (MPI): An electron absorbs two or
more photons to be promoted in the conduction band (b) Tunneling ionization
where the electron passes through a barrier to be promoted the conduction band
(c) Avalanche ionization where an electron in the conduction band absorbs two or
more photons, then collides and promotes an electron from valence band to the
conduction band. Inspired from [34, 35]. ........................................................25

xvii
Figure I.15: (a) Scanning electron microscopy image of a track damage obtained by
focusing femtosecond pulses inside fused silica (b) Numerical simulation electron
density (c) Computed intensity counterplots. The comparison between experiment
and simulations shows a good match of the morphology. Figure taken from [43]. .27
Figure I.16: Timeline of physical phenomena involved during laser-matter
interaction. Inspired from [33]. ......................................................................28
Figure I.17: Schematic presentation of the temporal evolution of the power of a (a)
continuous laser (b) pulsed laser. ...................................................................30
Figure I.18: Numerical simulations of the heat accumulation process inside glass
following laser irradiation for different repetition rates, 100kHz, 500kHz and 1MHz.
A heat accumulation process starts taking place at the 500kHz repetition rate [48].
..................................................................................................................32

xviii
Figure I.19: Comparison between athermal and thermal regimes. For the athermal
regime, low repetition rate laser, the pulses are well spaced in time so that the
temperature does not have time to build up in the material. However for the
thermal regime, high repetition rate laser, the pulses are close in time and the
temperature builds ups. ................................................................................33
Figure I.20: Modification threshold dependence as a function of the numerical
aperture of the microscope objective used in borosilicate glass [54]. ..................35
Figure II.1: Schematic presentation of the Direct Laser Writing (DLW) process. ....40
Figure II.2: Map of the modification thresholds in fused silica for the four
regions/three types of modification as a function of the pulse energy and the
numerical aperture. Adapted from [64]. ..........................................................41

xix
Figure II.3: The refractive index changes/modification classified as function of the
irradiance. Pictures for every type of modification, waveguides, nanogratings and
voids. ..........................................................................................................42
Figure II.4: Schematic of guided and unguided rays in a planar dielectric
waveguide. The rays exhibiting a propagation angle 𝜃 lower than 𝑐 = 𝑐𝑜𝑠 − 1(𝑛2𝑛1) are only guided. Taken from [99]. ..................................................................45
Figure II.5: Graphical solution of (II-2) to determine propagation angles 𝜃 of the
mode of a planar dielectric waveguide. (a)The right side (RHS) and left side (LHS)
of the equation are plotted as a function of sin𝜃. The intersection points marked by
filled circles determines the propagation angles 𝜃. On the other hand, each
intersection of the tan function (LHS) corresponds to a mode. In this example, the
waveguide can support up to 9 modes. Taken from [99]. (b) RHS (orange dashed
line) and LHS (black full line) of (II-2) is plotted for a planar waveguide exhibiting a
single mode aspect with ∆n=2x10⁻³, dimensions of 5µm at a wavelength of 630nm.
..................................................................................................................47
Figure II.6: Schematic presentation of the way light rays propagate inside a
multimode step-index optical fiber. Taken from [99]. ........................................48

xx
Figure II.7: The acceptance angle 𝜃a of an optical fiber. The rays within the
acceptance cone are guided inside the fiber by total internal reflection. The
numerical aperture is given by: NA=sin𝜃𝑎. Taken from [99]. ..............................49
Figure II.8: (a) Top View phase contrast image of a type I waveguide written in
silver containing zinc phosphate glass under white light illumination (b) Optical Path
Difference (OPD) profile associated to the waveguide. A negative OPD is observed.
..................................................................................................................50
Figure II.9: Tranverse view of a depressed cladding waveguide (DCW) (a)
composed of 54 DCW distributed over 2 rings (b) composed of 212 DCW distributed
over 4 rings. Taken from [101] ......................................................................51
Figure II.10: Schematic presentation of two close waveguides interacting along a
distance “L” and separated by a distance “d”. The power is coupled between them.
..................................................................................................................52
Figure II.11: Horizontal (squares) and Vertical (triangles) polarization transmission
of laser written directional couplers as a function of the interaction length. First, the
effect of the polarization is so slight, however when increasing the interaction
distance, a bigger shift occurs indicating that the coupling effect could be altered
based on the injected light polarization. Taken from [108]. ................................54

xxi
Figure II.12: Schematic presentation of the first demonstration of a directional
coupler presented by Strelstov et al [109]. ......................................................55
Figure II.13: Schematic presentation of a 50-50 directional coupler. The light is
injected in one branch and 50% of the power is coupled into the other branch.
Taken from [110]. ........................................................................................55
Figure II.14: (a) Schematic presentation of the 3D coupler (b) Mode profiles of the
output indicating that the light is coupled in the three branches with a ratio of
43%:28%:29%. Taken from [111]. ................................................................56
Figure II.15: (a) Schematic design of the 1 to 8 beam splitter with 7-Y junctions (b)
Side view output of the far-field modes [113] ..................................................57
Figure II.16: (a) Schematic presentation of the laser writing of the 1x3 beam
splitter (b) Side view output visualization of the divided modes [114]. ................57

xxii
Figure II.17: Schematic presentation of the PointbyPoint (PbP) process of writing a
Waveguide Bragg Grating (WBG) as well as a bright field image of the top view of
the WBG. Taken from [101] ...........................................................................58
Figure II.18: (a) Top view of the Waveguide Bragg Grating (WBG). The waveguide
is indicated by the black lines (b) Reflection spectrum of the written WBG (upper
curve) compared to the transmission of a normal waveguide (lower curve). Taken
from [115]...................................................................................................59
Figure II.19: Sketch of a photonic lantern (PL) starting by a multimode rectangular
waveguide separating into several single mode waveguides. Taken from [125]. ...60
Figure II.20: Side view bright field photos of the (a) 4x4 single mode waveguides
(b) rectangular multimode waveguide. Output mode images of (c) the 4x4 single
mode waveguides following the injection in the rectangular multimode waveguide
(d) rectangular waveguide mode following the injection of light in the 4x4 single
mode array waveguides. Taken from [125]. .....................................................61 Figure II.21: Absorption coefficient as a function of the wavelength for zinc
phosphate glass and silver containing zinc phosphate glasses with different silver
concentrations. The silver containing glasses exhibit a higher absorption band and
are shifted to higher wavelengths compared to non-containing zinc phosphate
glass. Adapted from [11]. ..............................................................................65

xxiii
Figure II.22: Absorption as a function of the wavelength for the PZnAg2 sample
from UV to IR. A good transparency window is observed between 380 nm and
2700 nm. ....................................................................................................65
Figure II.23: Schematic presentation of the formation of silver clusters in silver
containing glasses following laser irradiation. ...................................................66
Figure II.24: Absorption (black) of the photo-induced silver clusters following laser
irradiation exhibiting two main absorption bands around 290 and 345 nm.
Fluorescence emission (orange) under blue light excitation at 405 nm. ...............67
Figure II.25: (a) Sketch of the morphology of the structures following static direct
laser writing (DLW) (b) confocal fluorescence images under UV excitation
(exc=405nm) of top view (xy) plane, ring shape (c) side view (xz) plane, two
fluorescent lines in a pipe shape [136]. Schematic presentation of the writing
process for (d) top view (xy) plane, photodissociation of the clusters in the middle
(e) side view (xz) plane. ................................................................................68
Figure II.26: Scheme of the formation of silver clusters during laser-glass
interaction in silver containing glasses. Taken from [140]. .................................70
xxiv
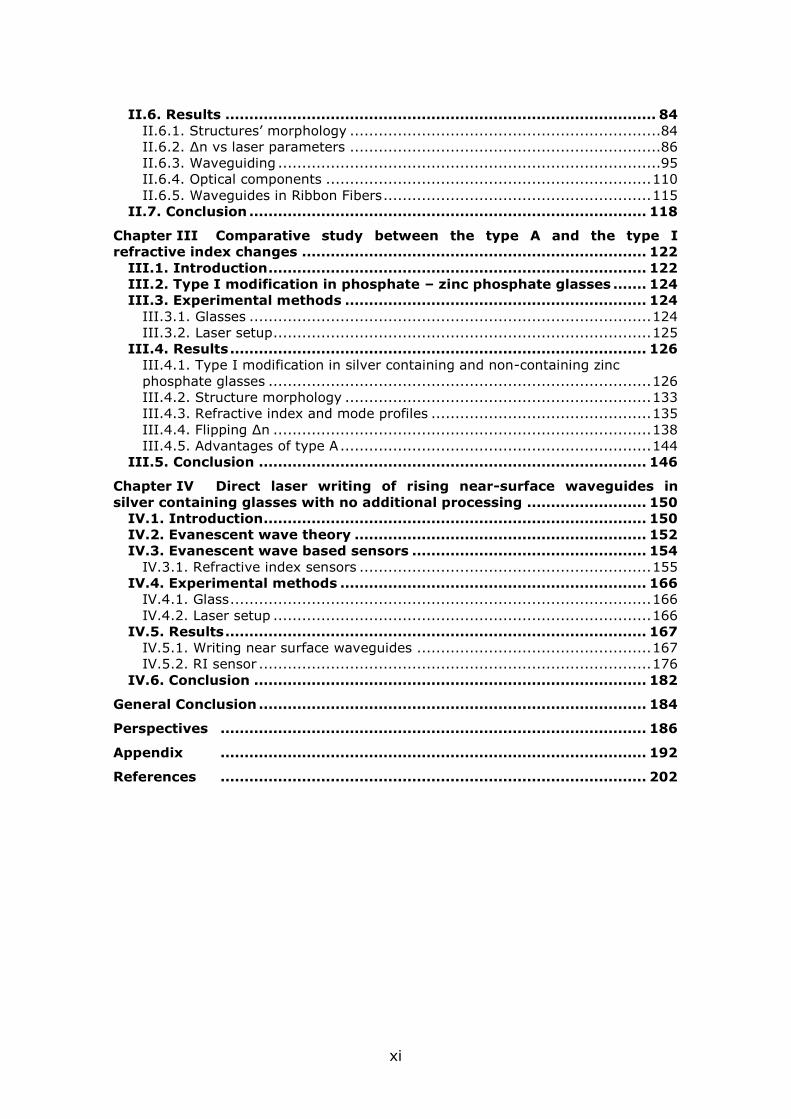
Figure II.27: (a) Fluorescence pattern of a written line under 405 nm excitation; (b)
four-line of electric field induced second harmonic generation (EFISHG) under 1030
nm femtosecond laser excitation (c) superposition of the fluorescence and EFISHG
correlated patterns under 405 nm and 1030 nm excitation. Taken from [143]......71
Figure II.28: Fluorescence intensity as a function of the laser irradiance and
number of pulses for different laser repetition rates (a) 10MHz (b) 1MHz (c) 100kHz
(d) 10kHz. Taken from [11]. ..........................................................................72
Figure II.29: Top view under white light illumination for different lines written using
a 250 kHz laser emitting at 1030 nm with a fixed pulse energy of 0.26 µJ for three
different speeds from the left to the right: 10 mm/s-5 mm/s-1 mm/s. To be
compared with figure 4 in [148]. ....................................................................74
Figure II.30: Zinc phosphate glass under UV excitation (a) non-containing (PZG-
4N) and silver containing (PZG-2N2A) preforms. PZG-2N2A only exhibiting
fluorescence emission; (b) fibers and a leftover of a preform. Taken from [149]. .76

xxv
Figure II.31: Comparison between bulk glass and fiber fluorescence emission
properties (exc=245nm). A good match is found indicating that the drawing process
preserved the glass properties. Taken from [149]. ............................................77
Figure II.32: (a) Thermal drawing of ribbon fibers. Preform, bottom-neck preform
and drawn fibers under UV excitation (exc=245nm). (b) Sketch, longitudinal and
side view of the drawn ribbon fiber. A flat surface with a rectangular side view is
obtained. Taken from [149]. ..........................................................................78
Figure II.33: Top view of the ribbon fiber (a) under white illumination before DLW
(b) under UV excitation (exc=405 nm) following DLW. The fluorescence of the
written structures could be observed. (b) Fluorescence intensity broad band
emission of the structures under UV excitation (exc=405 nm). (c) Fluorescence of
the written cartography and the corresponding differential transmission spectra. A
higher absorption band is observed for a higher laser irradiance. Taken from [149].
..................................................................................................................79
Figure II.34: Schematic of the laser setup used for direct laser writing. ...............80

xxvi
Figure II.35: Sketch of the SID4Bio wavefront sensor working principle. The
incident beam is diffracted by the modified Hartmann Mask into four replicas
making an interferogram on the sensor (CCD Camera) [155]. ............................82
Figure II.36: Sketch of the light delayed by a refractive index object (n2) with a
specific thickness “e” different than the surrounding medium (n1) leading to the
construction of the phase image. The optical thickness i.e. optical path difference
could be obtained [155]. ...............................................................................82
Figure II.37: The SID4Bio installed on a transmission microscope. The light is
diffracted by the grating creating the interferogram on the CCD camera giving an
output of an intensity and phase image [155]. .................................................83
Figure II.38: (a) Schematic of the morphology of the structures following
perpendicular translation to the laser beam propagation inside silver containing zinc
phosphate glasses. Fluorescence confocal images of the (b.i) top view (xy) plane,
and (c.i) side view (xz) plane. Schematic presentation of the writing process with
(b.ii) top view and (c.ii) side view. ..................................................................85

xxvii
Figure II.39: (a) Fluorescence image (ex=480nm, em=550nm) of the written
cartography. Writing irradiances are presented along the vertical axis while the
number of pulses appears along the horizontal axis (b) Blowup of the phase image
under white light illumination of the B2 structure (c) positive refractive index
change (∆n) determined from the phase image of B2. .......................................87
Figure II.40: (a) Phase image under white light illumination showing one line of
phase shift; (b) Line profile obtained from the phase image revealing only one
positive peak of optical path different in that case for the structures instead of two
peaks; (c) left column: experimental silver cluster spatial distribution for a
progressive scale of irradiances; right column: simulated distribution of the silver
clusters. For (i) and (v) low laser irradiance is used and a full disk of fluorescence is
observed, which is not the case for higher irradiances. Taken from [140] ............88
Figure II.41: Refractive index change variation (∆n) as a function of the number of
pulses and laser irradiance. ∆n increases as a function of the laser parameters.
Laser repetition rate 9.8 MHz. ........................................................................89
Figure II.42: Variation of the length of the structure along z as a function of the
laser parameters, laser irradiance and writing speed. The dimensions increase as a
function of the laser irradiance. Laser repetition rate 9.8 MHz. The shades
correspond to the standard deviation of the values. ..........................................90

xxviii
Figure II.43: Top view phase image of different lines separated by 1 µm in the z
plane. The seventh line becomes blurry indicating that the optical system is limited
to around 6 µm in depth. ...............................................................................91
Figure II.44: Refractive index change (∆n) as a function of the number of pulses for
two methods: (orange) using the compensation method (black) fixed method
where the depth of the structure higher than 6 µm is considered as 6 µm. Both
methods converge more or less to the same values. The black shades correspond to
the standard deviation of the values. ..............................................................92
Figure II.45: (a) High Resolution Scanning Electron Microscopy (HRSEM) image of
the top view of a ring shape structure formed by silver clusters; (b) Line profile
extracted from the HRSEM photo indicating a bump on the edges; (c) Atomic Force
Microscopy (AFM) profile indicating no bumps on the sides. The bumps observed in
the HRSEM are due to a change in the chemical composition and not to topological
changes. Taken from [136]. ...........................................................................93
Figure II.46: (a) fluorescence; (b) HRSEM, top view of the photo-induced
structures. The fluorescence spatial distribution is correlated to the HRSEM
indicating that the silver clusters are responsible for the change in the chemical
composition. The scale bar is 1 µm. Taken from [136]. .....................................94

xxix
Figure II.47:(a) Silver clusters differential absorption spectrum as a function of the
wavelength showing two main absorption bands near 290 nm and 350 nm; (b)
Refractive index change (∆n) determined from the spectrum shown in (a) based on
a Kramers-Kronig analysis, considering the filling factor of the silver clusters’ spatial
distribution. DLW parameters: 7TW/cm2 – 40 µm/s. .........................................95
Figure II.48: (a) Schematic of the direct laser writing process and the laser
injection; (b) Picture of the bulk sample under UV excitation (ex=405nm)
highlighting the fluorescence of the waveguide (indicated by the white arrow); (c)
fluorescence image of the side view of the waveguide under UV excitation
(ex=405nm); (d) near-field guided mode profile following laser injection [149]. ..96
Figure II.49: Cross section view of fluorescence under UV side-excitation
(exc=405nm) of (a) WG1, (e) WG2. Superimposed near field mode profile and
fluorescence features for (b) WG1, (f) WG2. Near field mode profile for a high order
propagating mode of (c) WG1, (g) WG2. Simulated mode profile using LUMERICAL
for (d) WG1, (h) WG2. DLW parameters for WG1: 8 TW/cm2 – 10µm/s. For WG2:
8TW/cm2 – 20µm/s. ......................................................................................98
Figure II.50: Near field mode profile following laser injection at 1.55 µm (a)
fundamental mode, (b) higher order mode. The waveguide presented a multimode
aspect. DLW parameters: 8TW/cm2 – 10 µm/s. ................................................99

xxx
Figure II.51: (a) Fluorescence confocal image of the side view of the waveguide.
(b) Normalized horizontal fluorescence profile averaged along the y axis. (c)
Normalized vertical fluorescence profile averaged along the z axis. ................... 100
Figure II.52: (a) Phase image of the top view of the waveguide under white
illumination (b) Refractive index change (∆n) profile obtained from the phase
image. DLW paramters: 9TW/cm2 – 60 µm/s. ................................................ 101
Figure II.53: Refractive index change (∆n) profile for different laser passages for an
irradiance of 7 TW/cm2 and a speed of writing of (a) 50 µm/s, (b) 30 µm/s, (c)
20 µm/s. A negative ∆n dip appears for lower writing speeds and for many laser
passages. .................................................................................................. 102
Figure II.54: Superposition of the silver cluster fluorescence spatial distribution
(black), normalized topology after chemical etching (red) and silver ions
concentration distribution (blue). Taken from [141]. ....................................... 103

xxxi
Figure II.55: The variation of the refractive index of the non-containing and silver
containing zinc phosphate glasses as function of the silver concentration
incorporated in the glass matrix. The higher the concentration of silver the higher
the refractive index of the glass is (from bottom to top). Data from [135]. ........ 104
Figure II.56: (a) Experimental: (a.i) Near field mode profile after injecting a 630
nm laser, (a.ii) normalized horizontal mode profile intensity averaged along the z
axis, and (a.iii) normalized vertical mode profile intensity averaged along the y
axis. (b) Simulations: (b.i) simulated mode profile (to compare with Figure
II.56.a.i), (b.ii) normalized horizontal intensity mode profile averaged along the z
axis (to compare with Figure II.56.a.ii), and (b.iii) normalized vertical mode profile
intensity averaged along the y axis. .............................................................. 105
Figure II.57: Schematic model of the simulated waveguides using Lumerical Mode
solutions software. The waveguides are simulated as two parallel ellipsoids with
thickness “e”, with a length “z” and separated by a distance “d”. The color scale
corresponds to the refractive index change. In this case, the glass refractive index
change is 1.6 while the waveguide is 1.608 corresponding to a refractive index
change (∆n) of 8x10⁻³. ................................................................................ 106
xxxii
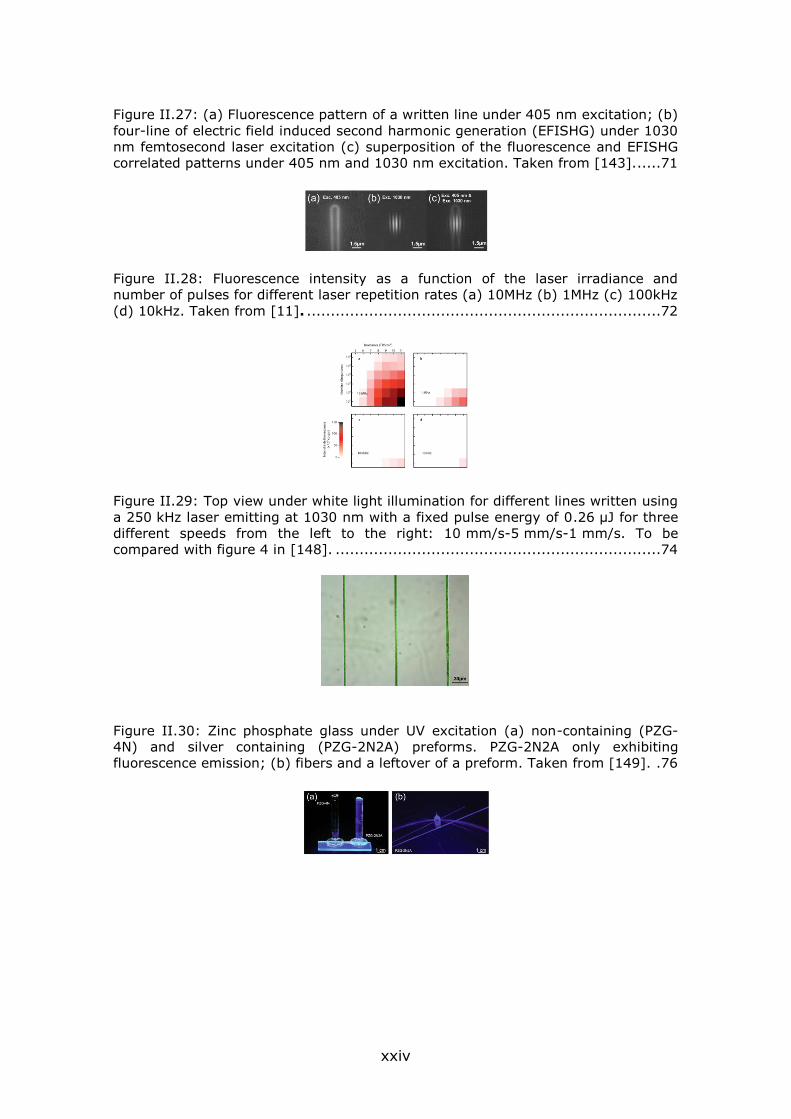
Figure II.58: Spatial superposition of the measured refractive index profile (∆n)
(black), simulated near-field mode profile (blue) and experimental near-field mode
profile (red). A good match is observed between the simulated and experimental
modes and the ∆n distribution...................................................................... 107
Figure II.59: Variation of the minimum ∆n required to trigger the multimode aspect
as a function of the thickness of the structures. Blue vertical line indicates the
thickness measured by confocal microscope and used during simulations (~500nm)
while the red line indicates the HRSEM measurement (~100nm) performed earlier
in our group [139]. ..................................................................................... 108
Figure II.60: Fundamental near-field mode profile of a (a) multimode (MM)
waveguide, (b) single mode (SM) waveguide. (c) Near-field mode profiles of the MM
and SM waveguides. DLW parameters for SM: 9TW/cm2 – 60µm/s, for MM:
10.5TW/cm2 – 20µm/s. ............................................................................... 110
Figure II.61: (a) Sketch of the Y-beam splitter dividing the input light into two
equal outputs (top view), (b) top view fluorescence image of the Y-junction
(ex=480nm, em=550nm), (c) output modes of the beam splitter (d) normalized
intensity profile of the output modes indicating an almost equal splitting of light
between both outputs. DLW parameters: 9TW/cm2 – 60µm/s. ......................... 111

xxxiii
Figure II.62: Sketch of the S-bend ............................................................... 112
Figure II.63: Normalized transmission of the S-bend waveguides as a function of
the radius curvature Rc and the separation distance ∆h. Reversed injection data
corresponds to backward injection in the S-bend waveguides. DLW parameters:
9.3TW/cm2 – 40µm/s. ................................................................................. 113
Figure II.64: Sketch of the coupler consisting of straight and S-bend waveguides.
................................................................................................................ 113
Figure II.65: Simulated and experimental normalized coupled power as a function
of the separation distance between the two waveguides. DLW parameters:
9.3TW/cm2 – 40µm/s .................................................................................. 114
Figure II.66: (a) Near-field mode profiles of the output of the coupler; (b)
normalized intensity of the mode profiles indicating the creation of a 50-50 coupler.
DLW parameters: 10.8 TW/cm2 – 40µm/s. .................................................... 115
xxxiv
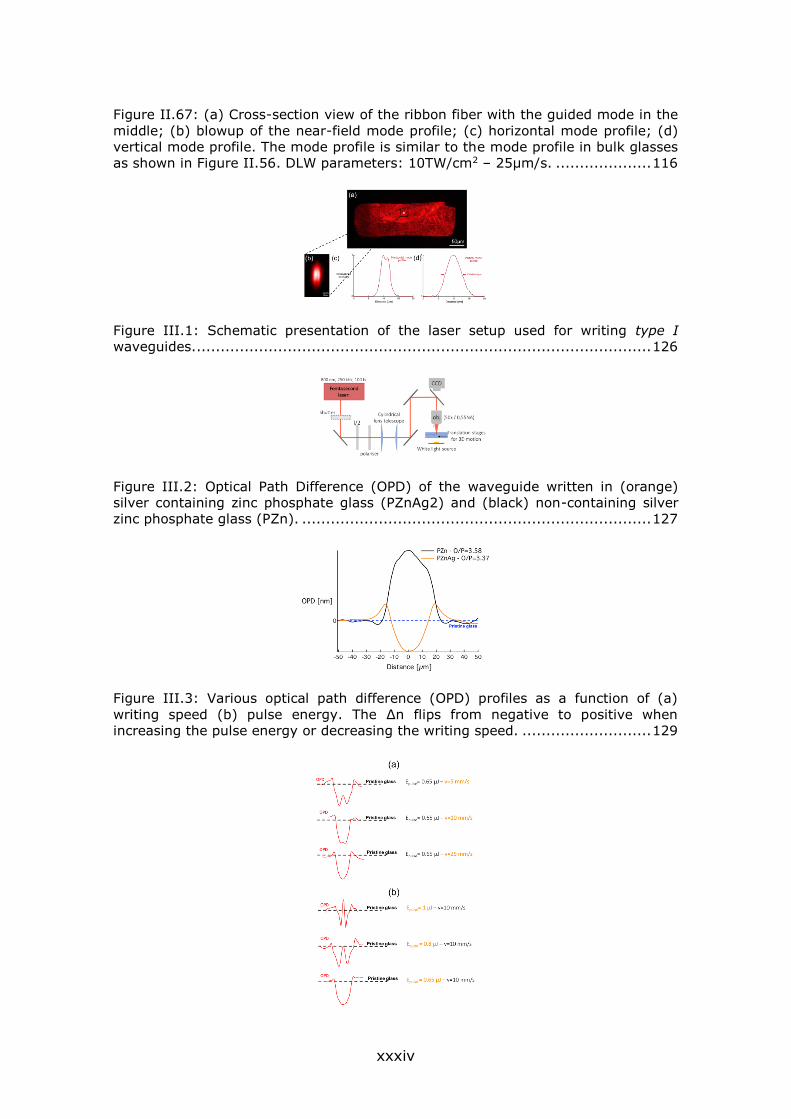
Figure II.67: (a) Cross-section view of the ribbon fiber with the guided mode in the
middle; (b) blowup of the near-field mode profile; (c) horizontal mode profile; (d)
vertical mode profile. The mode profile is similar to the mode profile in bulk glasses
as shown in Figure II.56. DLW parameters: 10TW/cm2 – 25µm/s. .................... 116
Figure III.1: Schematic presentation of the laser setup used for writing type I
waveguides. ............................................................................................... 126
Figure III.2: Optical Path Difference (OPD) of the waveguide written in (orange)
silver containing zinc phosphate glass (PZnAg2) and (black) non-containing silver
zinc phosphate glass (PZn). ......................................................................... 127
Figure III.3: Various optical path difference (OPD) profiles as a function of (a)
writing speed (b) pulse energy. The ∆n flips from negative to positive when
increasing the pulse energy or decreasing the writing speed. ........................... 129

xxxv
Figure III.4:Optical path difference (OPD) profiles of type I modification in non-
containing silver zinc phosphate glass as a function of the laser parameters. The ∆n
is always positive. ...................................................................................... 131
Figure III.5: Optical Path Difference (OPD) of the waveguide written in the same
conditions (Ep=1µJ - v=1mm/s) in (orange) silver containing zinc phosphate glass
(PZnAg2) and (black) non-containing silver zinc phosphate glass (PZn). ............ 133
Figure III.6: Top view white light illumination (a.i) for type I waveguide, (b.i) for
typical type A waveguide. Top view fluorescence (a.ii) for type I waveguide, (b.ii)
for typical type A waveguide. Side view white light illumination (a.iii) for type I
waveguide, (b.iii) for typical type A waveguide. Side view fluorescence image of
(a.iv) for type I waveguide, (b.iv) for typical type A waveguide. ....................... 135

xxxvi
Figure III.7 Top view phase image of (a.i) type I waveguide, (b.i) type A
waveguide. Refractive index profile of (a.ii) type I waveguide exhibiting one single
positive ∆n peak. Inset: side view of the type I waveguide under white light
illumination. (b.ii) Type A waveguide exhibiting two positive ∆n peaks. DLW
conditions for type I: (Ep=0.65µJ - v=5mm/s – 𝜏𝑟𝑒𝑝=250 kHz - NA=0.55 – 160µm
below the surface), type A (Ep=43nJ- v=60µm/s – 𝜏𝑟𝑒𝑝=9.8MHz - NA=0.75 -
160µm below the surface). .......................................................................... 136
Figure III.8: Near-field mode profile following the injection of a 630nm laser for
(a.i) Type I waveguide (b.i) Type A waveguide. Normalized horizontal intensity of
(a.ii) type I waveguide (b.ii) type A waveguide. Normalized vertical intensity of
(a.iii) type I waveguide (b.iii) type A waveguide. DLW conditions for type I:
(Ep=0.65µJ - v=5mm/s – 𝜏𝑟𝑒𝑝=250 kHz - NA=0.55 – 160µm below the surface),
Type A (Ep=43nJ- v=60µm/s – 𝜏𝑟𝑒𝑝=9.8MHz - NA=0.75 - 160µm below the
surface). ................................................................................................... 138
Figure III.9: Optical path difference (OPD) profiles as a function of (a) laser
irradiance (b) writing speed. The type A ∆n is always positive no matter what the
laser conditions are. Pulse energies: 30 nJ → 50 nJ. ....................................... 139
xxxvii
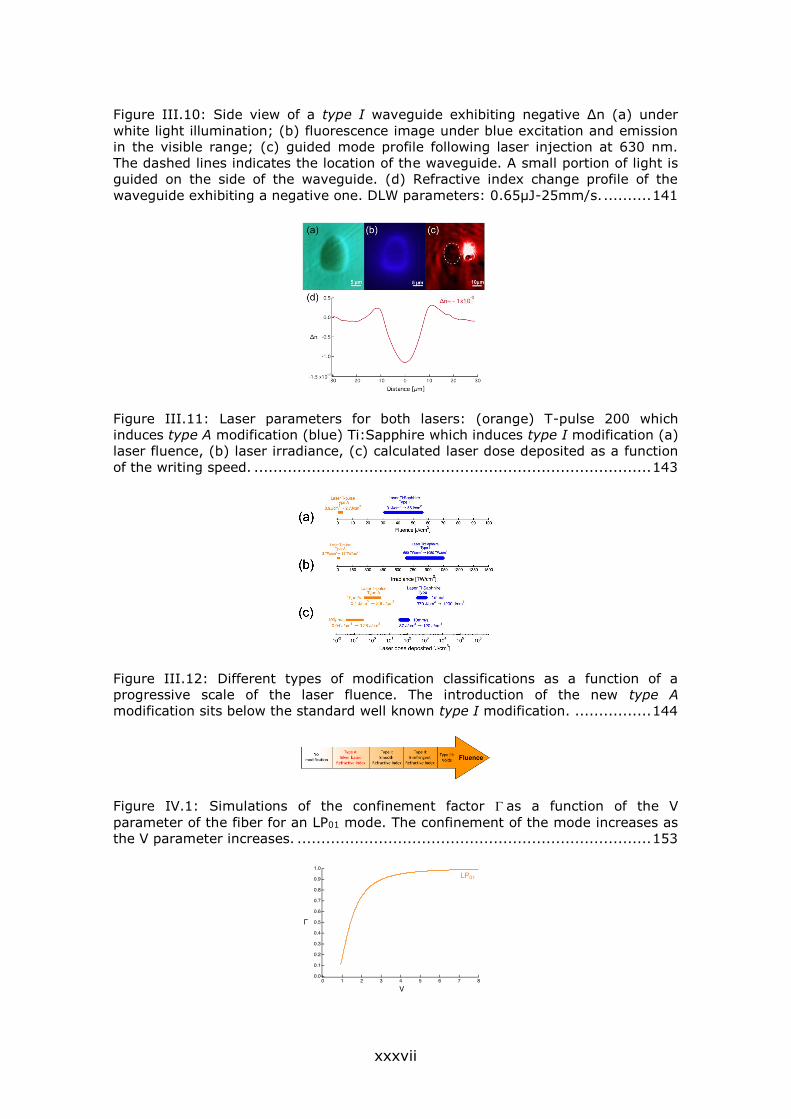
Figure III.10: Side view of a type I waveguide exhibiting negative ∆n (a) under
white light illumination; (b) fluorescence image under blue excitation and emission
in the visible range; (c) guided mode profile following laser injection at 630 nm.
The dashed lines indicates the location of the waveguide. A small portion of light is
guided on the side of the waveguide. (d) Refractive index change profile of the
waveguide exhibiting a negative one. DLW parameters: 0.65µJ-25mm/s. .......... 141
Figure III.11: Laser parameters for both lasers: (orange) T-pulse 200 which
induces type A modification (blue) Ti:Sapphire which induces type I modification (a)
laser fluence, (b) laser irradiance, (c) calculated laser dose deposited as a function
of the writing speed. ................................................................................... 143
Figure III.12: Different types of modification classifications as a function of a
progressive scale of the laser fluence. The introduction of the new type A
modification sits below the standard well known type I modification. ................ 144
Figure IV.1: Simulations of the confinement factor as a function of the V
parameter of the fiber for an LP01 mode. The confinement of the mode increases as
the V parameter increases. .......................................................................... 153

xxxviii
Figure IV.2: Schematic presentation of an evanescent wave based sensor. ........ 154
Figure IV.3: Schematic presentation of the sensor. Taken from [182]. .............. 155
Figure IV.4: Variation of the optical transmission for different refractive index
liquids for taper thickness of (1) ~1.6 µm (2) ~700 nm. Taken from [182]. ....... 156
Figure IV.5: (a) Transverse cut of the plastic fiber. (b) Top view of the polished
section. (c) Side view of the polished section. Due to the mismatch between the
refractive index liquids and the fiber core, part of the beam is lost (2) by refraction
in the sensing zone (3) guided by internal reflection. Taken from [183]. ........... 156
Figure IV.6: Experimental and theoretical normalized transmission output as a
function of the refractive index liquids. Taken from [183]. ............................... 159
xxxix
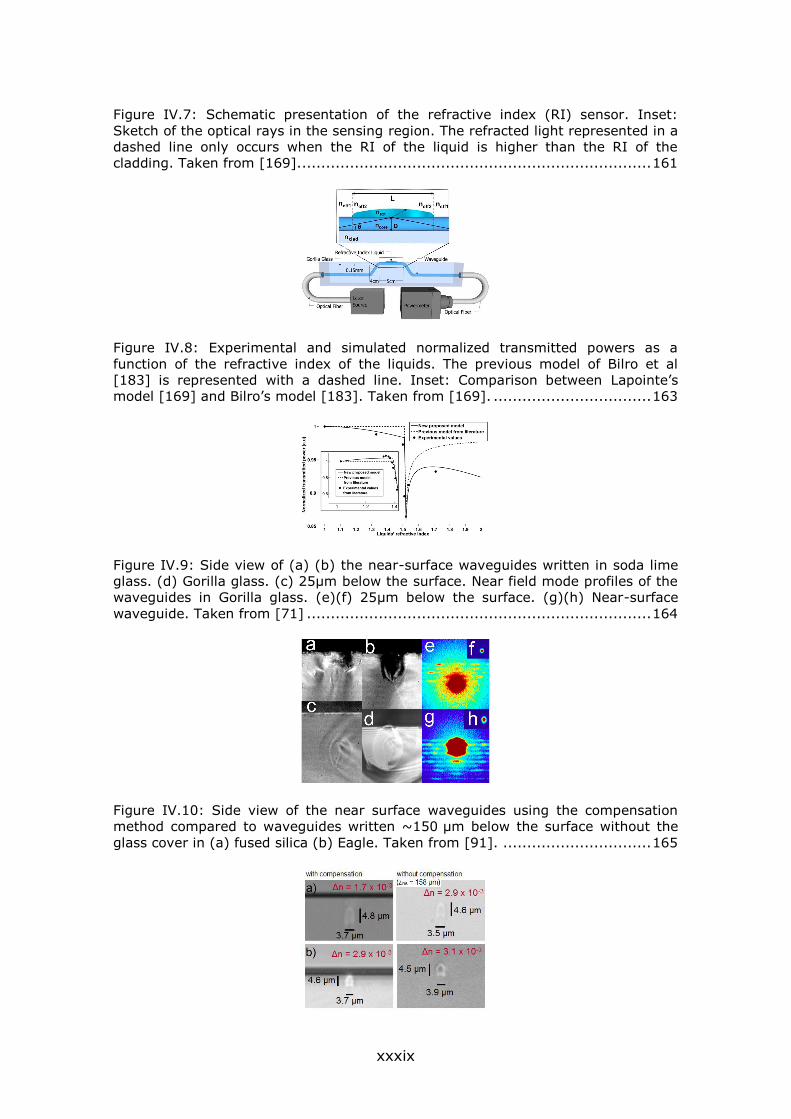
Figure IV.7: Schematic presentation of the refractive index (RI) sensor. Inset:
Sketch of the optical rays in the sensing region. The refracted light represented in a
dashed line only occurs when the RI of the liquid is higher than the RI of the
cladding. Taken from [169]. ......................................................................... 161
Figure IV.8: Experimental and simulated normalized transmitted powers as a
function of the refractive index of the liquids. The previous model of Bilro et al
[183] is represented with a dashed line. Inset: Comparison between Lapointe’s
model [169] and Bilro’s model [183]. Taken from [169]. ................................. 163
Figure IV.9: Side view of (a) (b) the near-surface waveguides written in soda lime
glass. (d) Gorilla glass. (c) 25µm below the surface. Near field mode profiles of the
waveguides in Gorilla glass. (e)(f) 25µm below the surface. (g)(h) Near-surface
waveguide. Taken from [71] ........................................................................ 164
Figure IV.10: Side view of the near surface waveguides using the compensation
method compared to waveguides written ~150 µm below the surface without the
glass cover in (a) fused silica (b) Eagle. Taken from [91]. ............................... 165
xl
Figure IV.11: (a) Side view of near-surface waveguide using the compensation
method and the guided mode profile following laser injection at =488 nm. (b)
Fluorescence emission of an aqueous fluorescein solution excited by the evanescent
wave of the light guided (=488 nm) in the near-near-surface waveguide observed
through a band pass filter 528/38 (top view) (c) Dark field image of a linear
periodic assembly of AG@SiO2@FITC nanowires (top view) (d) Fluorescence
emission of AG@SiO2@FITC nanowires (top view). Taken from [197]. ............... 166
Figure IV.12: Sketch of the rising near-surface waveguide. .............................. 168
Figure IV.13: Side view under white light illumination of (a) 32 µm straight
waveguide (b)(c)(d) rising near-surface waveguides. (e) Top view under white light
illumination of a portion of a near-surface waveguide. Smooth modifications where
no ablations or mini explosions were observed. DLW parameters: 28 nJ – 50 µm/s.
................................................................................................................ 169
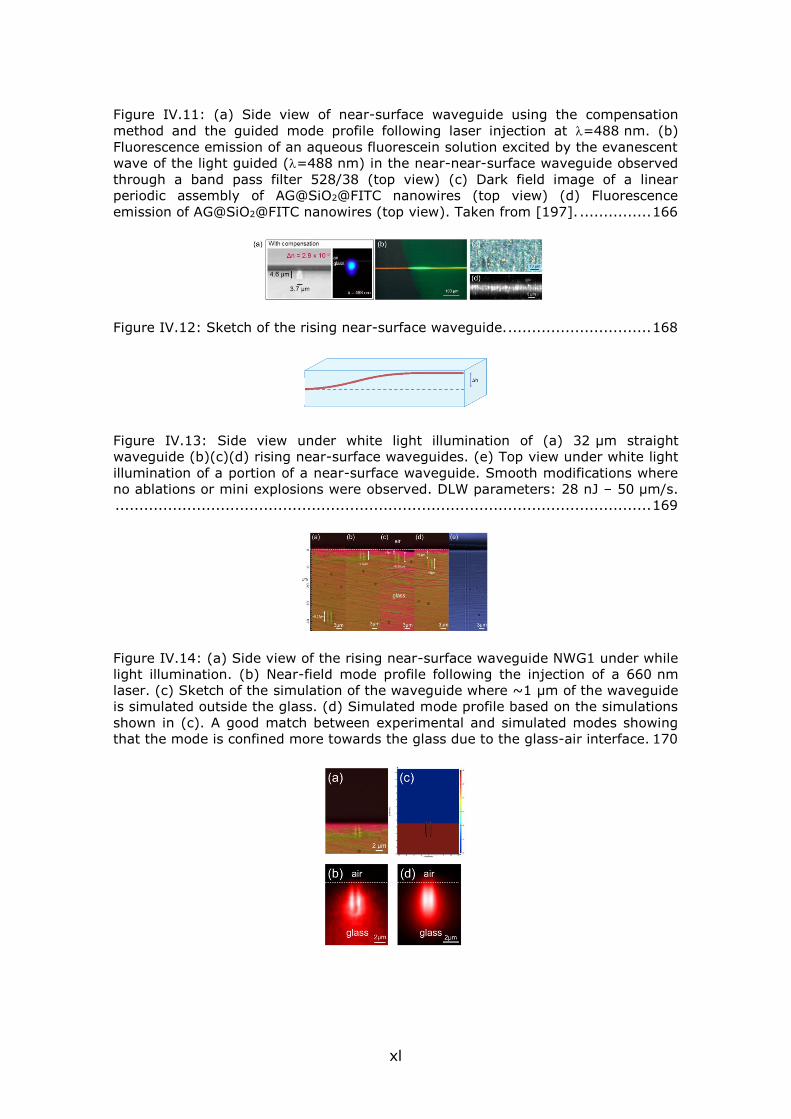
Figure IV.14: (a) Side view of the rising near-surface waveguide NWG1 under while
light illumination. (b) Near-field mode profile following the injection of a 660 nm
laser. (c) Sketch of the simulation of the waveguide where ~1 µm of the waveguide
is simulated outside the glass. (d) Simulated mode profile based on the simulations
shown in (c). A good match between experimental and simulated modes showing
that the mode is confined more towards the glass due to the glass-air interface. 170

xli
Figure IV.15: (a) Side view of a rising near-surface waveguide under white light
illumination. (b) Near-field mode profile following the injection of a 660 nm laser.
(c) Sketch of the simulation of the waveguide 2 µm away from the surface. (d)
Simulated mode profile based on the simulations shown in (c). A good match
between experimental and simulated modes showing that the mode is not affected.
................................................................................................................ 172
Figure IV.16: (a) Top view phase image of a portion of a waveguide neighboring
the surface waveguides exhibiting smooth type A modification. (b) ∆n profile
extracted from the phase image showing two positive peaks of ~2.4 x 10⁻³. DLW
parameters: 28 nJ – 50 µm/s. ...................................................................... 173
Figure IV.17: Normalized transmission for all written waveguides following the
deposition of a ~4 mm droplet of 1.604 Cargile oil. No interaction was observed
after 7 µm spacing between the waveguide and the surface. Inset: Near-field mode
profile of the most sensitive waveguide at ~2 µm below the surface. DLW
parameters: 28 nJ – 50 µm/s. ...................................................................... 175

xlii
Figure IV.18: Normalized transmission as a function of the size of the droplet of a
1.604 Cargille oil for two waveguides with different distances from the glass
surface. The larger the droplet the higher the losses in transmission. ................ 176
Figure IV.19: Normalized transmission as a function of different refractive index
(RI) Cargille oils deposited on the glass surface for four different waveguides at
different depths from the surface. DLW parameters: 28 nJ – 50 µm/s. .............. 178
Figure IV.20: Experimental (full line) and simulations (dashed lines) for two
different near surface waveguides at different distances from the surface. A good
match between the experiment and the simulations. ....................................... 180
Figure IV.21: Sketch of the evanescent wave/mode profile inside a near-surface
waveguide for a refractive index (RI). (a) Lower than the cladding/glass; (b) higher
than the cladding/glass; (c) equal to the cladding/glass. Inspired from [200].
Simulated mode profile for a (a.i) glass-air interface; (c.ii) glass-oil interface with a
refractive index of oil matching the glass 𝑛𝑒𝑥𝑡~𝑛𝑔𝑙𝑎𝑠𝑠. ..................................... 181

xliii
xliv
List of Abbreviations
DLW Direct Laser Writing CELIA CEntre des Lasers Intenses et ses Applications
ICMCB Institut de chimie de la matière condensée à Bordeaux
COPL Centre d’optique, photonique et laser
SLAM Short Laser Pulses: Applications & Materials
NPs Nanoparticles DSC Differential Scanning Calorimetry IR InfraRed
TIR Total Internal Reflection VIs Visible UV Ultra-Violet
NIR Near InfraRed MPI Multi Photon Ionization NA Numerical Aperture
3D Three Dimensions 2D Two Dimensions ∆n Refractive Index Change
SLM Spatial Light Modulator DWC Depressed Waveguide Cladding WG Waveguide
WBG Waveguide Bragg Grating
PbP Point by Point
WGL Waveguide Laser
DFB Distributed Feedback
PL Photonic Lantern
MM Multimode
SM Single Mode AOM Acousto-Optic Modulator OPD Optical Path Difference
QWLSI Quadri-Wave Lateral Shearing Interferometry DHM Digital Holographic Microscopy TIE Transport Of Intensity
HRSEM High Resolution Scanning Electron Microscopy AFM Atomic Force Microscopy FWHM Full Width Half Maximum
EFISHG Electric Field Induced Second Harmonic Generation LPG Long Period Grating FBG Fiber Bragg Grating
RI Refractive Index
WL White Light

xlv

xlvi
Fall Down 7 times … Get up 8

xlvii
xlviii
Acknowledgment
This PhD has been completed between two labs in two different countries, France
and Canada. These labs collaborating together under the umbrella of the
Laboratoire International Associé (LIA) LUMAQ (Lumière Matiere Aquitaine Quebec).
I would like to thank the directors of LUMAQ Thierry Cardinal and Younès
Messaddeq as well as of the Centre des Lasers Intenses et ses Applications (CELIA),
Philippe Balcou and Eric Mevel and the director of the Centre d’Optique, Photonique
et Laser, Réal Vallée for accepting me as a member of their great labs.
I would like to thank also, Dr. Bertrand Poumellec, Dr. Shane Eaton, Prof Younès
Messaddeq and Dr. Mathieu Bellec for accepting to take part in my PhD jury. It was
an honor for me.
To my PhD supervisors, Prof. Lionel Canioni, Prof. Réal Vallée and Dr. Yannick Petit,
special thanks for choosing me for this PhD. Thank you for your support,
understanding and help during the most difficult time of the PhD. Prof. Lionel
Canioni, you were a real mentor during my PhD and also my personal life. I really
appreciated all the discussions we had, related or not related to the PhD project.
Thank you for the huge amount of trust you put in me. I also enjoyed travelling to
several conferences with you. I am grateful for your contribution in teaching me
new things and introducing me to the scientific community. Prof. Réal Vallée, I have
always admired your way of engaging me in lab meetings so I could give more,
work more and get better results. Yes, you are a picky person in science but I love
that because I think it is a good quality for a scientist and it made me a better
scientist. It was a pleasure to work for you, in your lab. Dr. Yannick Petit thank you
for your friendly reception and the friendly environment you created during the
course of the PhD. Thank you for following all of my work and for your constructive,
critical remarks and observations. I learned a lot from you.
I also wish to thank all my colleagues in the SLAM group and COPL. Thank you all
for your help and the good times we spent together. Being a part of the SLAM
group is like being a part of a family and I really liked this atmosphere. Thank you
to the SLAM (ex) colleagues/friends, EungJang Lee, Marie Vangheluwe, Brice
Mutelet, Allu Amarnath Reddy, Arthur Le Camus, Sophie Rouzet, Délphine Syvilay,
Wendwesen Gebremichael (Wendey), Laura Loi, Inka Mannek-Honninger and Bruno
Bousquet. Thank you all for the great atmosphere we had in the lab and outside the
xlix
lab. Also thank you to Arnaud Royon for the interesting discussions about the PhD
project. Thank you to my colleagues at ICMCB: Jean-Charles Desmoulin, Alexander
Fargues, Sylvain Danto, Téa Skopak and Thierry Cardinal. Thank you to Jean-
Charles Desmoulin and Sylvain Danto for providing glass samples, otherwise my
project would not have been possible. Thank you for enduring my special demands!
Téa Skopak, thank you for the discussions we had and for the time we spent
talking. Special thanks and appreciation to Thierry Cardinal for all the financial
support for my travels to Canada. Thanks also to my (ex) colleagues in COPL for
the warm welcome and friendly environment: Mathieu Boivin, Cheikou Ba,
Souleymane Toubou Bah, Fréderic Jobin, Frédéric Maes, JC Gauthier, Laurent
Dusablon, Simon Duval, Yigit Ozan Aydin, Clément Frayssinous and Feng Liang.
Thank you to Denis Boudreau, Alex Grégoire, Victor Azzi for the help and letting me
use their equipment. Thank you also to Yannick Ledemi and Sandra Messadeq for
the help. I would like to thank also Tigran Galstian for accepting me to assist him in
his lab course. It gave me a great experience. Special thanks to Marc D’Auteuil,
Stéphane Gagnon, David Hélie, Martin Blouin, Vincent Fortin and Diane Déziel.
Marc, thank you for all you help in mounting my setups and finding the tools. I
really appreciated the volleyball discussions we used to have. Stéphane,
Stéphane... I asked you a lot of difficult and tricky tasks to do with my glasses
during my PhD so thank you a lot for your help. Without your help and skills, it
would have been nearly impossible for me to do it by my own. David and Diane,
thank you a lot for the help provided for me before my arrival and to facilitate my
arrival. Moreover, your friendly welcome is amazing and really appreciated. David
thank you for the Québecois cultural introduction during the sugar shack. Martin
Bernier, thank you for the warm welcome and the reputation you gave me at COPL
(don’t ask about it). It was really a pleasure to get to know you in Rochester and
dance, to interact with you in and outside the lab (on my farewell party). Thank
you! Julien, it was a pleasure playing volleyball with you, I really enjoyed it. Now
the two brothers I had at COPL, JP Bérubé and Jérôme Lapointe. Guys!!! It was
really a pleasure to work with you and go out together for beer and pool. Jay
(Jérôme), I will miss having a beer with you buddy, working late together at night
and our paths crossing late in the lab. JP, thank you for answering all my emails
almost every day for almost 2 years, following my daily work, giving advice and
helping me with my work. Thank you for enduring my persisting character and
correcting my papers/abstracts. I hope you are not bored now that I am not around
anymore.
l
Also thank you to Céline, Sophie, Sonia, Cinthia, Michelle, Caroline and Carole from
both universities for all the administrative help that you provided.
Of course, I would like to thank my funding sponsors, the French National Research
Agency (ANR), “Investments for the Future” Idex program for the mobility grant,
LAPHIA for funding the contract extension. From the Canadian side, I would like to
thank the Natural Sciences and Engineering Research Council of Canada (NSERC)
(CG101779), Canada Foundation for Innovation (CFI) (GF072345), and Fonds de
Recherche du Québec-Nature et Technologies (FQRNT) (FT097991, CO201310) for
their funding and for the equipment bought and used during this project.
On a personal note, I would like to dedicate this PhD to my parents. I would like to
thank my friends from France and Canada who supported and helped me during
this PhD: Christelle, Georges, Jean-Baptiste, Clément, Linh, Diaa. To the close
friends, Vittorio, Jack and Georges thank you. Vittorio, I will miss our trips together
man. Arthur Bagramyan: Thank you for having me as your friend and being like
family in Québec. We had awesome memories together. And Joyce, it was a
pleasure meeting you from the first day I arrived to the lab and I am lucky to have
you as a friend. That’s enough for you. A person who stood by me, he calls himself
“the sun”, thank you very much. You helped a lot. I appreciate it.

li

1
General Introduction
Laser-matter interaction has challenged the scientific communities since the
discovery of the laser in the 1960s. Research and development through the past
years led to almost a limitless number of industrial and medical laser-based
applications. Ranging from laser cleaning, cutting, welding, marking to laser-eye
surgery, ablating cancer tumours, medical imaging, the laser provides a versatile
and non-replaceable tool in both the industrial and medical fields. More specifically,
laser-glass interaction has been extensively studied during the last two decades.
The process of focusing femtosecond lasers inside glasses in order to change the
physical-chemical properties of the glass is called Direct Laser Writing (DLW). DLW
technique provides fast direct three-dimensional (3D) structuration of the glass
allowing the creation of 3D optical components embedded inside transparent
materials. It exhibits many advantages compared to the lithography technique
which is limited to the two-dimensional (2D) structuring of materials and involve
many steps, making DLW highly compatible with industrial manufacturing. Many
applications could be based on the DLW technique such as the creation of
miniaturized sensors and/or photonic components on glass chips. Indeed, for
example, the DLW technique in glasses has led to the creation of Modular Photonics
a company based in Australia selling glass based micro-chips processed by the DLW
technique used for mode-selective applications, more specifically for astronomical
needs.
This PhD was performed in a joint collaboration between University of Bordeaux,
France and Université Laval in Québec, Canada in the framework of the Laboratoire
International Associé (LIA) LUMAQ (Lumière Matière Aquitaine Québec). More
specifically, it was carried out between three labs: Centre des Lasers Intenses et
ses Applications (CELIA) and Institute of Chemistry of the Condensed Matter of
Bordeaux (ICMCB) at University of Bordeaux, France and Centre d’Optique,
Photonique et Laser (COPL) at Université Laval, Québec, Canada. It consisted in
spending almost half the time of the PhD at each university while working on the
same project which is a continuity of research activities conducted in the
“Shortpulse Lasers: Applications and Materials” (SLAM) research group of my
supervisor Lionel Canioni and the group “Chimie et photonique des matériaux oxide
de fluores”, supervised by Thierry Cardinal at ICMCB. Previous work was based on
optimizing and mastering the silver containing zinc phosphate glasses synthesis,
investigating and understanding the exotic laser-glass process following DLW.
Those activities led to the creation of “Argolight”, a spin-off company selling laser

2
structured glass slides allowing the fluorescence calibration of microscopes.
Furthermore, NASA used one of Argolight’s products to equip the International
Space Station microscope for the SpaceX SPX CRS 11 – Falcon 9.
While the previous works of the group on silver containing zinc phosphate glasses
were mostly based on the investigation of the laser-glass response, this PhD project
aims at creating and functionalizing of new type of optical components based on
the creation of fluorescent silver clusters. In fact, silver containing zinc phosphate
glasses are special and exotic glasses compared to the standard glasses used for
DLW by the scientific community. The incorporation of silver ions inside the glass
matrix allows exotic responses from the glass following DLW i.e. creation of silver
clusters exhibiting properties such as fluorescence, nonlinearity and plasmon
resonance. In particular, the project intends to create new types of optical
components with properties that were not accessible in previous standard glasses.
The first part of the project explains the standard laser-glass interaction that is
mainly known by the scientific community as well as the state of the art of some
optical components manufactured in glasses. Next, the exotic response of silver
containing glasses following DLW is presented in detail with a theoretical model.
The creation of a new type of waveguides and optical components in silver
containing glasses are presented in detail. The second part consists in
functionalizing the new type of waveguides and the creation of a refractive index
sensor inside silver containing glasses.
More specifically, the first chapter of the project consists in introducing the glass
and laser and presenting their history. The main laser-glass interaction processes
are also explained in this chapter.
The second chapter is the main part of this manuscript. It takes into account the
different types of modifications induced in glasses following DLW as well as a
review of some previous works. Then, silver containing zinc phosphate glasses are
introduced as well as the exotic laser-glass interaction they produce. Finally, the
design, fabrication and characterization of optical components are presented in this
chapter.
The third chapter consists of a comparison between the standard type I
modification and the new type A modification reported in this manuscript. The

3
comparison takes into consideration the morphology, the refractive index changes
and the near-field guided mode profile.
The fourth and last chapter consists in introducing the writing of near-surface
waveguides that do not require any additional process as well as a presentation of a
pioneer refractive index sensor exhibiting the advantages of type A modification.

4

5
Table of contents:
I. General background on glass and laser-matter interaction .......... 7
I.1 Introduction ............................................................................ 7
I.2 Glass ....................................................................................... 8
I.2.1 Glass history ............................................................................ 8
I.2.2 Definition of glass ..................................................................... 8
I.2.2.a Glass transition .......................................................................... 9
I.2.2.b Thermodynamic aspect ..............................................................10
I.2.3 Glass formation ....................................................................... 12
I.2.3.a Optical properties: Transparency window .....................................13
I.2.4 Glass making ........................................................................... 15
I.2.4.a Lab technique ...........................................................................15
I.2.5 Introduction to fiber optics ........................................................ 16
I.3 The laser ............................................................................... 17
I.3.1 Definition of laser ..................................................................... 18
I.3.2 Gaussian beam ........................................................................ 21
I.3.3 Laser-material interaction.......................................................... 24
I.3.3.a Non-linear absorption mechanisms in glasses ...............................24
I.3.3.b Time scale ...............................................................................28
I.3.4 Effects of laser parameters ........................................................ 29
I.4 Conclusion ............................................................................. 36

6

7
Chapter I
General background on glass and laser-
matter interaction
I.1. Introduction
Laser-matter interaction is a broad research area with loosely defined boundaries.
The laser is used to interact with different types of matter going from biological
tissues, up to metals, dielectrics, plastics. It has become an essential tool in
medical and industrial fields. In order to develop such effective and robust
industrial tools, the study of the laser-matter process is prerequisite. The
understanding of the effect of the laser on the matter and the physical-chemical
phenomena that occur during this interaction is mandatory. Every material interacts
with the laser irradiation in a specific way from the other. In this chapter, we will
start by presenting glass material used in this work by walking through its history,
the definition, the fabrication process and some other properties while the second
part will introduce the history of the laser and its functionality.
Finally, the last part highlights the interaction between femtosecond lasers and
glasses. This interaction highly depends on the type of laser used as well as on the
glass properties. The different physical phenomena that occur following the
interaction of femtosecond lasers with glasses will be presented in detail in order to
understand the core of the laser-glass interaction.
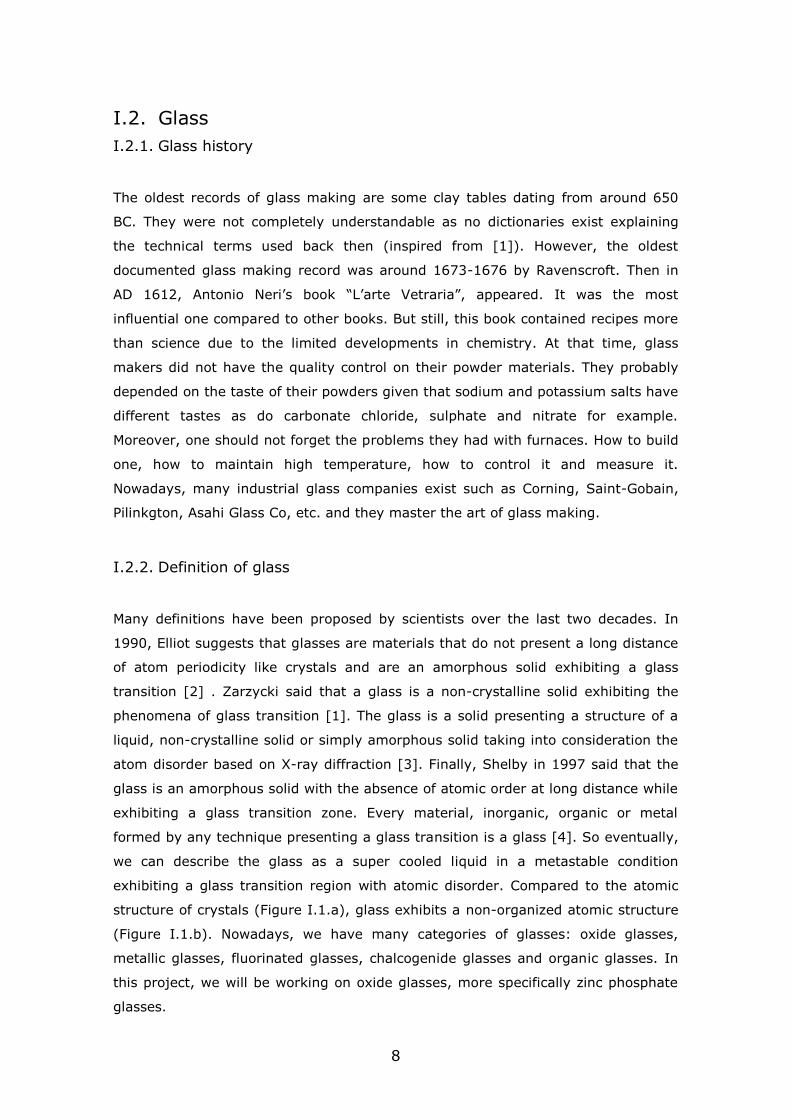
8
I.2. Glass
I.2.1. Glass history
The oldest records of glass making are some clay tables dating from around 650
BC. They were not completely understandable as no dictionaries exist explaining
the technical terms used back then (inspired from [1]). However, the oldest
documented glass making record was around 1673-1676 by Ravenscroft. Then in
AD 1612, Antonio Neri’s book “L’arte Vetraria”, appeared. It was the most
influential one compared to other books. But still, this book contained recipes more
than science due to the limited developments in chemistry. At that time, glass
makers did not have the quality control on their powder materials. They probably
depended on the taste of their powders given that sodium and potassium salts have
different tastes as do carbonate chloride, sulphate and nitrate for example.
Moreover, one should not forget the problems they had with furnaces. How to build
one, how to maintain high temperature, how to control it and measure it.
Nowadays, many industrial glass companies exist such as Corning, Saint-Gobain,
Pilinkgton, Asahi Glass Co, etc. and they master the art of glass making.
I.2.2. Definition of glass
Many definitions have been proposed by scientists over the last two decades. In
1990, Elliot suggests that glasses are materials that do not present a long distance
of atom periodicity like crystals and are an amorphous solid exhibiting a glass
transition [2] . Zarzycki said that a glass is a non-crystalline solid exhibiting the
phenomena of glass transition [1]. The glass is a solid presenting a structure of a
liquid, non-crystalline solid or simply amorphous solid taking into consideration the
atom disorder based on X-ray diffraction [3]. Finally, Shelby in 1997 said that the
glass is an amorphous solid with the absence of atomic order at long distance while
exhibiting a glass transition zone. Every material, inorganic, organic or metal
formed by any technique presenting a glass transition is a glass [4]. So eventually,
we can describe the glass as a super cooled liquid in a metastable condition
exhibiting a glass transition region with atomic disorder. Compared to the atomic
structure of crystals (Figure I.1.a), glass exhibits a non-organized atomic structure
(Figure I.1.b). Nowadays, we have many categories of glasses: oxide glasses,
metallic glasses, fluorinated glasses, chalcogenide glasses and organic glasses. In
this project, we will be working on oxide glasses, more specifically zinc phosphate
glasses.
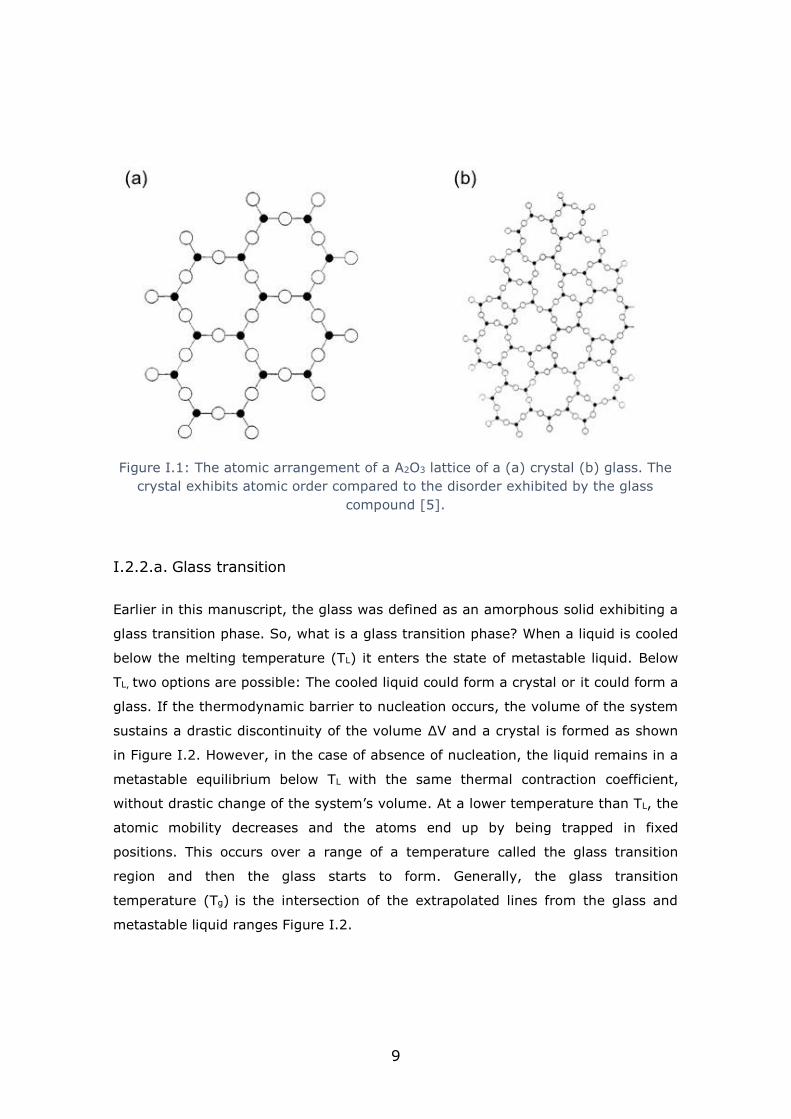
9
Figure I.1: The atomic arrangement of a A2O3 lattice of a (a) crystal (b) glass. The
crystal exhibits atomic order compared to the disorder exhibited by the glass
compound [5].
I.2.2.a. Glass transition
Earlier in this manuscript, the glass was defined as an amorphous solid exhibiting a
glass transition phase. So, what is a glass transition phase? When a liquid is cooled
below the melting temperature (TL) it enters the state of metastable liquid. Below
TL, two options are possible: The cooled liquid could form a crystal or it could form a
glass. If the thermodynamic barrier to nucleation occurs, the volume of the system
sustains a drastic discontinuity of the volume ∆V and a crystal is formed as shown
in Figure I.2. However, in the case of absence of nucleation, the liquid remains in a
metastable equilibrium below TL with the same thermal contraction coefficient,
without drastic change of the system’s volume. At a lower temperature than TL, the
atomic mobility decreases and the atoms end up by being trapped in fixed
positions. This occurs over a range of a temperature called the glass transition
region and then the glass starts to form. Generally, the glass transition
temperature (Tg) is the intersection of the extrapolated lines from the glass and
metastable liquid ranges Figure I.2.

10
Figure I.2: Volume variation as a function of the temperature while cooling a liquid
to form a crystal or a glass. Adapted from [1].
I.2.2.b. Thermodynamic aspect
Is the glass transition a phase transition? In order to answer this question, we will
look into the thermodynamic aspects of the glass formation and the Kauzmann
paradox [1]. But first let us introduce the entropy notion. The entropy (S) defines
the disorder in the system. For instance, as mentioned before in section I.2.2, the
crystal exhibits an organized atomic structure on a large scale, therefore the
disorder is minimum implying a low entropy. However, for the glass, the atomic
disorder is much greater, therefore we have a higher entropy than the crystal.
Let’s consider again a hot liquid being cooled down to form a glass or a crystal.
Kauzmann in 1948, noted that the configuration entropy of an equilibrium liquid
decreases as a function of the temperature that if extrapolated below the
temperature TK, it would fall below the crystal entropy (Figure I.3). That was not
acceptable given that it does not fit with the third law of thermodynamics which
states that the entropy of a crystal must be null at a temperature of 0K (S=0 →

11
T=0K). This disturbing phenomenon is stopped by a coincidental intervention of the
kinetic phenomenon, the glass transition. The entropy freezes at a characteristic
value of the equilibrium liquid at Tg as shown in Figure I.3. Moreover, the interval
between Tk and Tg is generally quite small. The glass exhibits an entropy at 0K
which is not the case for the crystal (Figure I.3). This is the Kauzmann paradox.
Grest and Cohen in 1981 tried to explain the glass transition as a first order phase
transition [6], Gibbs and Dimarzio in 1958 suggested a second order phase
transition [7] when Stillinger in 1988 proposed that no phase transition was
happening [8]. Eventually, Stillinger was right. The glass transition is not a phase
transition at all. It does not fulfil the Ehrenfest criteria for first or second order
phase transition [9], contrary to the crystal where the cooling process of a liquid to
form a crystal is considered as a phase transition from liquid to solid state.
Figure I.3 The configurational entropy as a function of the temperature of the
cooling process of an equilibrium liquid. The glass transition freezes the entropy
and avoids a thermodynamic catastrophe. This is known as the Kauzmann
paradox. Taken from [1]
Given that the glass transition is characterized by a change in the heat capacity
∆Cp, it could be experimentally detected using the Differential Scanning Calorimetry
(DSC). Comparing to another reference sample, the DSC output curve allows us to
see the glass transition i.e. the differential heat capacity therefore detecting the
glass transition temperature Tg. A DSC curve is shown in Figure I.4. The Tg can be

12
detected when the step change in heat capacity attains half the value of the total
step change [10] (Figure I.4). Moreover, the DSC curve allows the detection of the
temperature where the crystallisation effect starts at Tx and the peak of
crystallisation at Tc. One should note that the Tg highly depends on the glass
composition and its viscosity in the liquid state. Finally, in order to correctly
measure Tg we should start by cooling the equilibrium state i.e. cooling the liquid
[10].
Figure I.4 Possible Differential Scanning Calorimetry (DSC) curve of a cooled
liquid. Tg is the glass transition temperature, Tx the temperature of formation of
the first crystal, and Tc the crystallisation temperature. The DSC curve taken
from [11].
I.2.3. Glass formation
After chemistry and physical chemistry were developed over the years, scientists
started proposing criteria and formulas about glass formation instead of recipes
based on tasting their powders to form glass. More specifically, in 1926 scientists
proposed criteria for glass formation that may be applicable in some cases. This
subject will not be discussed in detail in this manuscript. If readers are interested in
this part, they may refer to the following readings [5, 12-15].
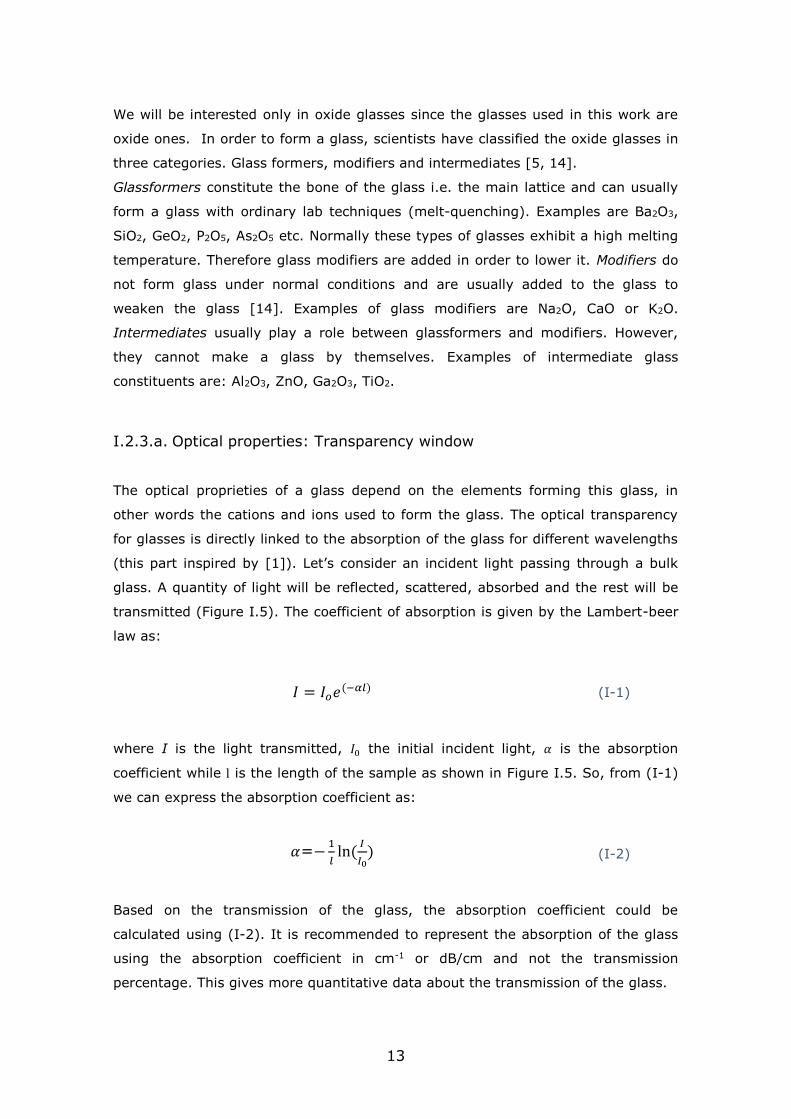
13
We will be interested only in oxide glasses since the glasses used in this work are
oxide ones. In order to form a glass, scientists have classified the oxide glasses in
three categories. Glass formers, modifiers and intermediates [5, 14].
Glassformers constitute the bone of the glass i.e. the main lattice and can usually
form a glass with ordinary lab techniques (melt-quenching). Examples are Ba2O3,
SiO2, GeO2, P2O5, As2O5 etc. Normally these types of glasses exhibit a high melting
temperature. Therefore glass modifiers are added in order to lower it. Modifiers do
not form glass under normal conditions and are usually added to the glass to
weaken the glass [14]. Examples of glass modifiers are Na2O, CaO or K2O.
Intermediates usually play a role between glassformers and modifiers. However,
they cannot make a glass by themselves. Examples of intermediate glass
constituents are: Al2O3, ZnO, Ga2O3, TiO2.
I.2.3.a. Optical properties: Transparency window
The optical proprieties of a glass depend on the elements forming this glass, in
other words the cations and ions used to form the glass. The optical transparency
for glasses is directly linked to the absorption of the glass for different wavelengths
(this part inspired by [1]). Let’s consider an incident light passing through a bulk
glass. A quantity of light will be reflected, scattered, absorbed and the rest will be
transmitted (Figure I.5). The coefficient of absorption is given by the Lambert-beer
law as:
𝐼 = 𝐼𝑜𝑒(−𝛼𝑙) (I-1)
where I is the light transmitted, 𝐼0 the initial incident light, 𝛼 is the absorption
coefficient while l is the length of the sample as shown in Figure I.5. So, from (I-1)
we can express the absorption coefficient as:
𝛼=−1
𝑙ln (
𝐼
𝐼0) (I-2)
Based on the transmission of the glass, the absorption coefficient could be
calculated using (I-2). It is recommended to represent the absorption of the glass
using the absorption coefficient in cm-1 or dB/cm and not the transmission
percentage. This gives more quantitative data about the transmission of the glass.
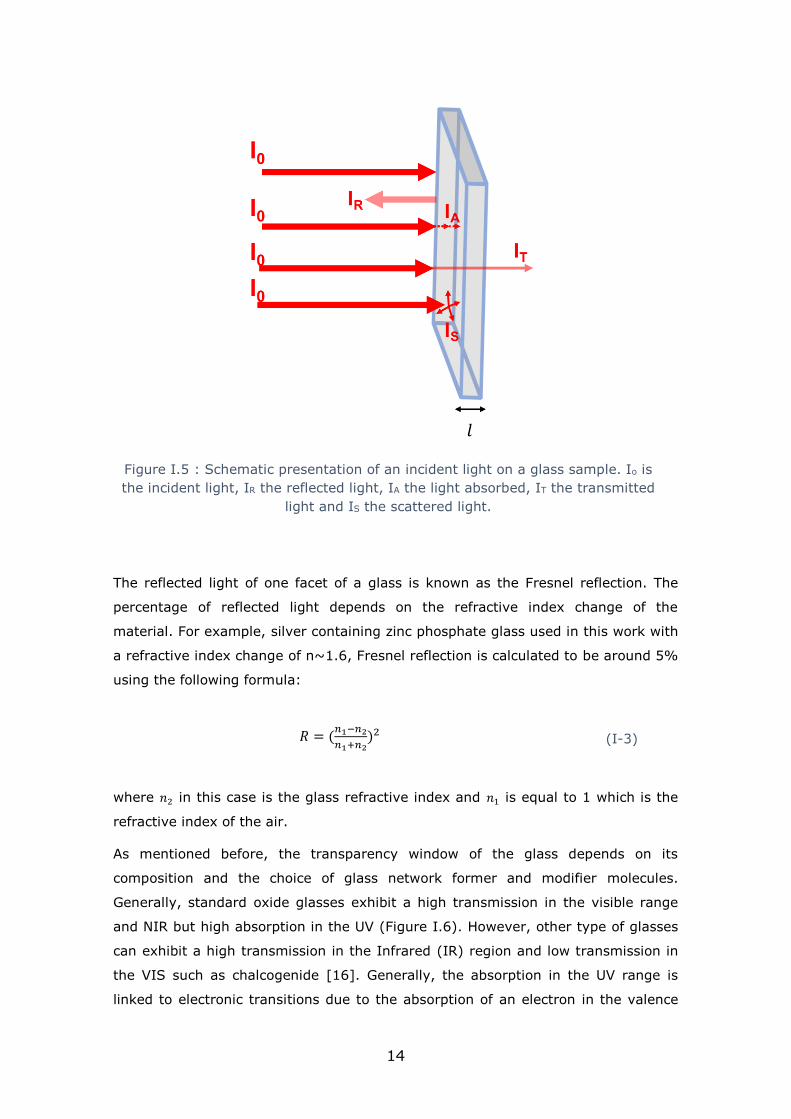
14
Figure I.5 : Schematic presentation of an incident light on a glass sample. Io is
the incident light, IR the reflected light, IA the light absorbed, IT the transmitted
light and IS the scattered light.
The reflected light of one facet of a glass is known as the Fresnel reflection. The
percentage of reflected light depends on the refractive index change of the
material. For example, silver containing zinc phosphate glass used in this work with
a refractive index change of n~1.6, Fresnel reflection is calculated to be around 5%
using the following formula:
𝑅 = (𝑛1−𝑛2
𝑛1+𝑛2)2 (I-3)
where 𝑛2 in this case is the glass refractive index and 𝑛1 is equal to 1 which is the
refractive index of the air.
As mentioned before, the transparency window of the glass depends on its
composition and the choice of glass network former and modifier molecules.
Generally, standard oxide glasses exhibit a high transmission in the visible range
and NIR but high absorption in the UV (Figure I.6). However, other type of glasses
can exhibit a high transmission in the Infrared (IR) region and low transmission in
the VIS such as chalcogenide [16]. Generally, the absorption in the UV range is
linked to electronic transitions due to the absorption of an electron in the valence

15
band to be promoted in the conduction band. However, the absorption in the IR is
linked to the molecular vibrations at this wavelength and the phonon energy [9].
Figure I.6:Absorption spectrum of a Silica glass in the visible and near infrared region.
A high transmission is shown in the visible range.
I.2.4. Glass making
Making glasses could be performed by many techniques. It could be formed from
plasma (evaporation), from liquid (quenching technique, sol-gel) or from solids
(decomposition) [9]. In this framework, we will be interested in the melt-quenching
technique which is used to form the glass. Two methods of melt-quenching
techniques exist. The first one is the float glass which is an industrial technique
used for the creation of large quantities of glass (which is not going to be presented
herein) and the lab technique which is more of a “homemade” technique.
I.2.4.a. Lab technique
The lab technique used at ICMCB to make silver containing glasses is the melt-
quenching technique shown in Figure I.7. It starts by choosing and weighing the
corresponding mix of powders to form the glass. Then the powders are placed in a
platinum crucible where they will be heated up to the melting temperature TL
(1200°C) in a furnace during 12h. At that temperature, the mixed powders will be

16
transformed into melted liquid (Figure I.7). Then the crucible is removed from the
furnace and quenched rapidly to form glass and to avoid any crystallisation process.
When rapidly quenching the liquid, the atoms do not have time to get into order
and crystalize. One should note that the quenching method is performed manually;
therefore the cooling process of the glass is not the same. It differs from one batch
to another, from person to person. Eventually, one should note that the glass
properties may differ from one glass batch to another. Afterwards, the glass is
annealed at 40 °C below the glass transition Tg for at least 4h to relax the
accumulated mechanical constraints. Finally, after the annealing process the glass
is removed from the furnace and allowed to rest at room temperature waiting to be
cut and polished.
Figure I.7: Schematic representation of the melting-quenching process.
I.2.5. Introduction to fiber optics
The previous part consisted in talking about the fabrication of bulk glasses. In this
part, we will introduce fiberoptics. Bulk glasses can be shaped into fibers forming a
thin glass wire that we call an optical fiber where light can propagate inside based
on Total Internal Reflection (TIR). Optical fiber is generally formed in a cylindrical
shape and made with low loss material such as fused silica glass. It has a centre
core in which light is guided because of TIR, and is embedded in an outer cladding
of slightly lower refractive index as shown in Figure I.8. Fiberoptics is responsible
for most of our communication systems and internet. Thousands of kilometers of

17
optical fiber exist underwater in the world in order to connect the world together
using the internet. Optical fiber exhibits many advantages for light/information
transportation. It exhibits lower signal attenuation and higher band pass compared
to electric wires. This waveguiding process in fiber optics will be discussed
furthermore in Chapter II at section II.3.1.a as well as the DLW process in ribbon
shaped silver containing fibers in section II.6.5.
Figure I.8: Schematic presentation of a cylindrical optic fiber with inner core and
outer cladding
I.3. The laser
In the 1960s, the laser was invented and characterized as a solution in search of a
problem [17]. Scientists did not imagine the range of applications they could have
access to using a laser. Nowadays lasers are everywhere. In our daily life, we use
products that are related to the laser. The internet connection, networking, data
storage and many other applications are accessible thanks to lasers. Laser presents
a versatile number of applications for spectroscopy, interferometry,
communications, and in the medical and industrial fields. Some examples of the use
of lasers in the medical sector are in odontology, dermatology, gynaecology and
ophthalmology. In industrial applications, lasers are used for processing materials,
cleaning, welding, cutting and drilling. The wings of airplanes are drilled by lasers,
bottles of perfume are marked by laser and even fruit is now being marked by
laser. Recently in 2016, a laser interferometry system was used to detect
gravitational waves and the first observation ever of a binary black hole merger
[18]. In short, laser applications in the medical and industrial fields are somewhat
unlimited. Research is extending the boundaries of potential applications.

18
Specifically for this project, the laser is used for writing photonic components inside
glasses.
We can clearly see that the invention of the laser was a great achievement during
the twentieth century (inspired by [17]). It all started with the discovery of the
process of stimulated emission in which a beam of radiation passing through a gain
medium can generate identical photons to those of the incident beam as reported
by Albert Einstein in 1917. The first amplification based on the simulated emission
was not achieved till 1954 by the research team of Charles Townes at Columbia
University [19]. They managed to build a microwave amplifier based on stimulated
emission radiation that they called “maser”. That was the beginning of the laser.
The “maser” was developed into an “optical maser” operating in the visible (Vis)
and infra-red (IR) regions in 1958 [20] by the same research group. Then, the race
was on to demonstrate a working laser and Theodor Maiman of Hughes
Laboratories won it in May 1960 [21]. He managed to get a pulsed laser emitting in
the red wavelength out of a ruby crystal pumped by a flash-tube. Later on, in 1961
a continuous gas laser was demonstrated by Bell Labs by Javan, Bennet and
Herriott. That laser operated in the near infra-red (NIR) wavelength at 1.15µm
[22]. Following these two discoveries, the number of lasers increased significantly.
Many types of lasers were created operating at different wavelengths, different
powers, different mode regimes. Currently, a huge number of lasers exist, going
from solid state [21], dye [23], semi-conductor [24], gas [25], fibre [26] , free-
electron [27] to X-ray lasers [28] that can operate in continuous and pulsed modes.
I.3.1. Definition of laser
LASER stands for “Light Amplification by Stimulated Emission of Radiation”. It is
based on the stimulated emission process introduced by Einstein in 1917. Basically,
a laser is composed of a pump source, active/gain medium and a cavity as shown
in Figure I.9. The amplification process of light takes place inside the laser cavity,
more specifically in the gain medium. It is achieved by a stimulated emission
process from an atomic or molecular system with transitions in an inverted
population (i.e. the upper energy level is more populated than the lower).

19
Figure I.9: Schematic presentation of a pulsed laser oscillator.
Generally, the laser is characterized by its wavelength emission, average power,
operating mode (continuous or pulsed), repetition rate and pulse duration (in case
of pulsed laser). A continuous laser could be transformed into a pulsed one using
two techniques: Q-Switching (using saturable absorbers, electric-optic shutters,…)
allowing pulses in the nanosecond range or Mode locking (using SESAMs, acousto-
optic switches, …) allowing shorter laser pulses in the pico to femtosecond range
[29]. As shown in Figure I.9, in order to have a femtosecond laser, the insertion of
a Mode locking device is a must as well as compensating for the cavity dispersion
due to the presence of a large band active medium. For more information and
details the reader is referred to the following reference [29]. Then, to have higher
laser energies that are sufficient for applications demanding it such as direct laser
writing, the laser presented in Figure I.9 for example could be amplified using an
external amplifier as shown in Figure I.10.

20
Figure I.10: Schematic presentation of a laser beam (input beam) amplified using
an external amplifier. Taken from [29].
During this project, the lasers used for direct laser writing are mode locked lasers.
The wavelength emission is determined by the gain medium i.e. the
atomic/molecular transitions between the atomic levels. Lasers could operate in
wavelengths going from X-ray [28] to the IR regions [30].
Maxwell’s wave equations, predicting the propagation of transversely oscillating
electromagnetic waves, were the first indication of the true nature of light.
Therefore, laser light propagation is defined by the Maxwell Equations published in
1864 (inspired from [31] ). Considering the use of lasers in this project, the
equations herein represent the propagation of light in a dielectric medium, in this
case glasses.
∇. E = −1
ϵ0∇. P (I-4)
∇. H = 0 (I-5)
∇ × H = 𝜀0
𝑑𝐸
𝑑𝑡+
𝑑𝑃
𝑑𝑡+ 𝐽 (I-6)
∇ × E = −𝜇0
𝑑𝐻
𝑑𝑡 (I-7)
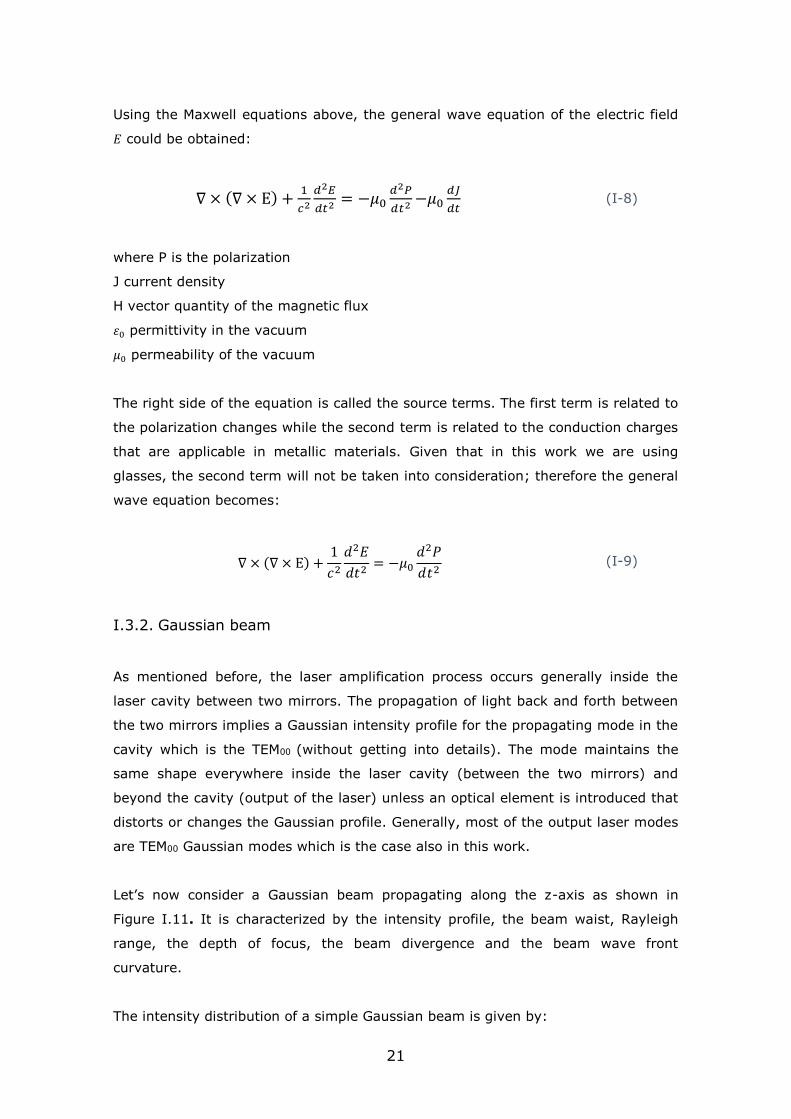
21
Using the Maxwell equations above, the general wave equation of the electric field
𝐸 could be obtained:
∇ × (∇ × E) +1
𝑐2
𝑑2𝐸
𝑑𝑡2 = −𝜇0𝑑2𝑃
𝑑𝑡2 −𝜇0𝑑𝐽
𝑑𝑡 (I-8)
where P is the polarization
J current density
H vector quantity of the magnetic flux
𝜀0 permittivity in the vacuum
𝜇0 permeability of the vacuum
The right side of the equation is called the source terms. The first term is related to
the polarization changes while the second term is related to the conduction charges
that are applicable in metallic materials. Given that in this work we are using
glasses, the second term will not be taken into consideration; therefore the general
wave equation becomes:
∇ × (∇ × E) +1
𝑐2
𝑑2𝐸
𝑑𝑡2= −𝜇0
𝑑2𝑃
𝑑𝑡2 (I-9)
I.3.2. Gaussian beam
As mentioned before, the laser amplification process occurs generally inside the
laser cavity between two mirrors. The propagation of light back and forth between
the two mirrors implies a Gaussian intensity profile for the propagating mode in the
cavity which is the TEM00 (without getting into details). The mode maintains the
same shape everywhere inside the laser cavity (between the two mirrors) and
beyond the cavity (output of the laser) unless an optical element is introduced that
distorts or changes the Gaussian profile. Generally, most of the output laser modes
are TEM00 Gaussian modes which is the case also in this work.
Let’s now consider a Gaussian beam propagating along the z-axis as shown in
Figure I.11. It is characterized by the intensity profile, the beam waist, Rayleigh
range, the depth of focus, the beam divergence and the beam wave front
curvature.
The intensity distribution of a simple Gaussian beam is given by:
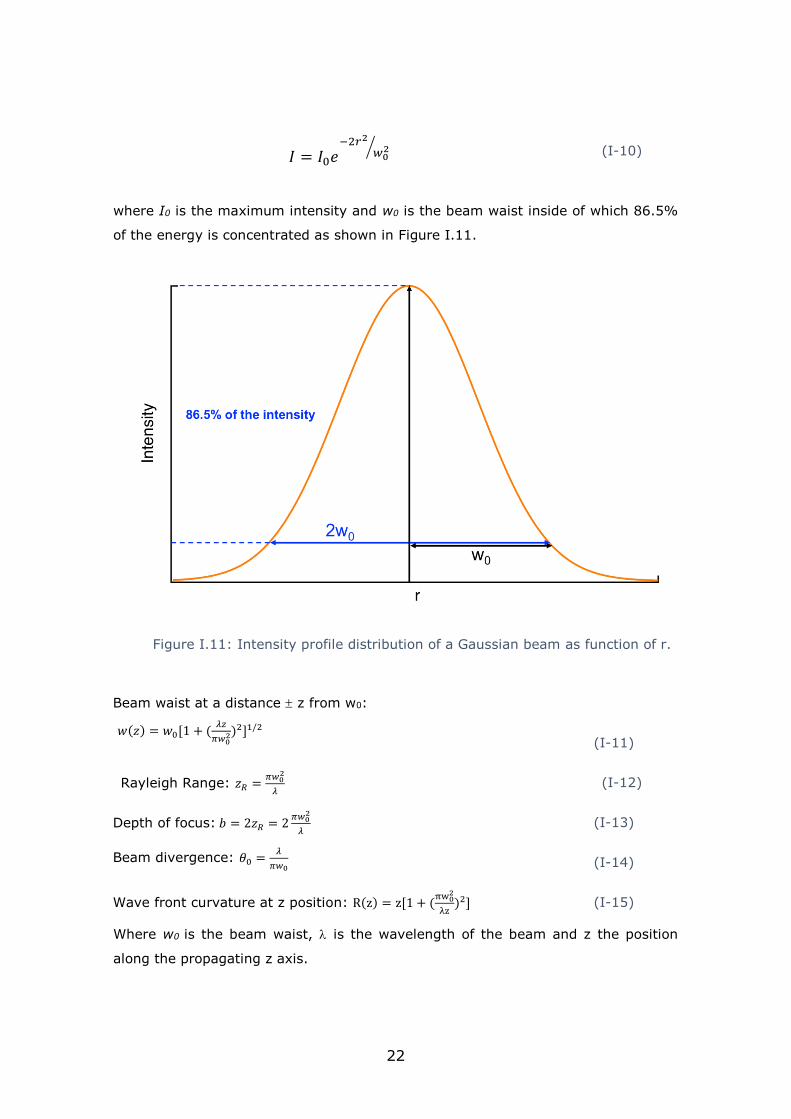
22
𝐼 = 𝐼0𝑒−2𝑟2
𝑤02⁄ (I-10)
where I0 is the maximum intensity and w0 is the beam waist inside of which 86.5%
of the energy is concentrated as shown in Figure I.11.
Figure I.11: Intensity profile distribution of a Gaussian beam as function of r.
Beam waist at a distance z from w0:
𝑤(𝑧) = 𝑤0[1 + (𝜆𝑧
𝜋𝑤02)
2]1/2
(I-11)
Rayleigh Range: 𝑧𝑅 =𝜋𝑤0
2
𝜆 (I-12)
Depth of focus: 𝑏 = 2𝑧𝑅 = 2𝜋𝑤0
2
𝜆 (I-13)
Beam divergence: 𝜃0 =𝜆
𝜋𝑤0 (I-14)
Wave front curvature at z position: R(z) = z[1 + (πw0
2
λz)2] (I-15)
Where w0 is the beam waist, is the wavelength of the beam and z the position
along the propagating z axis.

23
Following propagation, the width of the Gaussian beam decreases (R<0) until it
reaches its minimum waist size w0 (z=0) at the wave front curvature R= (Figure
I.12). Afterwards, the beam expands and diverges (R>0) as a cone of half-angle θ0.
The beam is considered to be parallel to the propagation axis on a length of 2zr that
is called depth of focus or the confocal parameter (Figure I.12) corresponding to
the double of the Rayleigh length. One should note that the tighter we focus the
beam the faster it diverges. We can conclude that the major beam intensity is
restrained in a voxel corresponding more or less to the depth of focus of the beam.
Therefore, the morphology of the interaction zone is dictated by the laser’s
Gaussian shape. Generally, the laser beam quality is defined by the factor M2≥1. In
this work, the laser beams exhibit a quality factor M2~1.1. The beam quality factor
M2 defines the beam illumination pattern as well as the laser propagation and
transformation properties. It also indicates how the laser output beam is close to
the fundamental Gaussian beam mode. The larger the value of M2 the lower the
beam quality is. For more information about the M2 the reader is referred to the
following references [29, 32]. However, in some experiments cylindrical lenses
were installed in order to change the beam shape at the focus plane i.e. change the
morphology of the modified region. This part will be more detailed in section
III.3.2.b. Also, beam shaping is possible using a Spatial Light Modulator (SLM)
which is not used during this work for beam shaping.
Figure I.12: Schematic presentation of a propagating Gaussian beam.

24
I.3.3. Laser-material interaction
Laser-matter interaction could be realized using a CW or a pulsed laser. In this
framework, it is realized using pulsed femtosecond lasers. In dielectric materials
such as glasses, a non-linear absorption process is present when the light intensity
is sufficient to generate one. Femtosecond lasers provide a high intensity of light in
a short time which triggers the non-linear effects. The photons are absorbed by the
atoms forming the glass matrix and then, if the energy is sufficient, the electrons
are able to pass from the valence band to the conduction band. Therefore we have
photoionization. More specifically, the electrons gain enough kinetic energy to move
freely in the glass matrix. The process is shown in Figure I.13 for dielectric
materials. The energy absorbed by the electrons should be higher than the band
gap Eg between the valence and the conduction band. In dielectric materials, the Eg
is generally higher than the energy of one photon; therefore, in order for the
electrons to pass to the conduction band, the non-linear absorption process is a
must. Moreover, the non-linear absorption process confines the deposited energy in
a 3D interaction voxel allowing the creation of sub-micrometre structures [33].
Figure I.13: Schematic presentation of the multi-photon absorption process. In
this case, an electron in the valence band absorbs 3 photons to pass to the
conduction band.
I.3.3.a. Non-linear absorption mechanisms in glasses
Generally, the laser average intensity used exceeds the ionization threshold of the
glass and the matter is photo-ionized. Three dominating non-linear excitation

25
processes in dielectric materials mainly occur: Multi-photon ionization (MPI),
tunnelling ionization and avalanche ionization. The first two processes are
considered as direct photo-ionization of the medium. Avalanche ionization is an
indirect process given that the electrons are promoted to the conduction band due
to the collision between free electrons accelerated by the electric field. The three
processes are presented in Figure I.14.
Figure I.14: Schematic presentation of the photo-ionization processes during laser-
glass interaction. (a) Multi-photon ionization (MPI): An electron absorbs two or more
photons to be promoted in the conduction band (b) Tunneling ionization where the
electron passes through a barrier to be promoted the conduction band (c) Avalanche
ionization where an electron in the conduction band absorbs two or more photons,
then collides and promotes an electron from valence band to the conduction band.
Inspired from [34, 35].
Multi-Photon Ionization (MPI) refers to the absorption process of the energy of two
or more photons by an electron in the valence band to pass to the conduction band.
This photoionization rate highly depends on laser intensity. The multiphoton
ionization rate is given by [34, 36, 37]:
𝑃(𝐼) = 𝜎𝑘𝐼𝑘 (I-16)
where 𝜎𝑘 is the multiphoton absorption coefficient for absorption of k photons and I
is the laser intensity. In order to have photoionization, a minimum number k of
photons is required to satisfy the relation 𝑘ℎ̅𝑤𝐸𝑔. Therefore, the total energy
absorbed is related to the number of photons. In the case of silver containing zinc
phosphate glasses that are used in this work, the band gap is between 4.5 eV and
4.8 eV depending on the concentration of silver ions inside the glass [11]. When
using a 1030 nm laser which exhibits a photon energy of 1.2 eV, a four-photon
absorption process is required in order to achieve ionization.
26
Tunneling ionization refers to an electron passing through a short barrier and
becoming free. The electric field generated by the laser intensity eliminates the
Coulomb potential wells that bind a valence electron to its atom. When the field is
very strong, the Coulomb potential well is eliminated and the electron passes
through the short barrier and becomes free [36] as shown in Figure I.14.a This
type of nonlinear process prevails for strong laser fields and low laser frequency
(high ). However, it could simultaneously occur with the Multi-Photon Ionization
process in other cases. Keldysh proposed a parameter to express the transition
between the two processes known as the Keldysh parameter [38]:
𝛾 =𝑤
𝑒[𝑚𝑐𝑛𝜀0𝐸𝑔
𝐼]1/2 (I-17)
where w is the laser frequency, c velocity of light, n refractive index change of the
medium, 𝜀0 permittivity in the vacuum, Eg band gap, m and e reduced mass and
charge of the electron and I the laser intensity. When the Keldysh parameter is
higher than 1 (>1), the MPI dominates the process while when it is lower (<1),
the tunneling ionization dominates. However, when it is around 1 (~1), the
intermediate regime [39], we have a mix of both MPI and tunneling ionizations. In
our framework, is estimated to be higher than 1 (~1.3) which puts us in the MPI
process regime.
Avalanche ionization refers to a two-step process. A free electron in the conduction
band absorbs photons until its energy exceeds the Eg of the material. An electron
with higher energy than the band gap E>Eg can collide and excite another electron
in the valence band to the conduction band as shown in Figure I.14.b. This process
will continue as long as the pulse is increasing the number of free electrons in the
focal volume [36].
▪ Plasma generation
The three previously mentioned non-linear effects contribute to ionize the material
resulting in the creation of high density electronic plasma in the vicinity of the focal
volume. This is due to the high density of electrons generated. The electron density
distribution could be described by the following equation [35]:

27
𝑑𝑛𝑒
𝑑𝑡= 𝑊𝑃𝐼 + 𝛼𝐶𝐼𝑛𝑒(1 + ∑ 𝛽𝑗𝐼𝑗
𝑘−1𝑗=1 ) (I-18)
where 𝛼𝐶 is the avalanche ionization coefficient, 𝑛𝑒 electron density and 𝛽𝑗 the cold
avalanche which was not introduced in this manuscript. If readers are interested in
further details, they are referred to [40-42] . The first term of the left part of the
equation indicates the contribution of the photo-ionization process while the second
term is linked to the avalanche ionization effect. The creation of plasma could be
linked to both processes or only to photo-ionization [43]. The morphology and the
type of modifications in the material following laser-matter interaction are directly
linked to the electron density distribution in the plasma. In fact, the threshold of
modification is associated to a certain value of the electron density and the
deposited energy is proportional to the electron density. In other words, the
electron density distribution in the material i.e. the shape of the plasma dictates
the morphology of the modified region. This was proved by Couairon et al. They
compared the morphology of a modified region in fused silica glass with the
numerical simulation of electron density distribution and they found a significant
match [43] as shown in Figure I.15.
Figure I.15: (a) Scanning electron microscopy image of a track damage obtained by
focusing femtosecond pulses inside fused silica (b) Numerical simulation electron
density (c) Computed intensity counterplots. The comparison between experiment
and simulations shows a good match of the morphology. Figure taken from [43].

28
I.3.3.b. Time scale
Laser-matter interaction has been widely used and studied during the last two
decades. The comprehension of the ongoing physical processes and their timeline
characteristics is important. Although it depends on the properties of the materials
and the irradiation regime, the community agrees that during the interaction of a
single femtosecond laser pulse with matter some of the following events occur as
shown in Figure I.16. Firstly, the laser energy is absorbed by the material and
creates photoelectrons. These photoelectrons then transfer their kinetic energy to
the lattice. Finally, heat diffusion occurs by melting, fusion or exploding the
material depending on the threshold modification of the material. The latter process
induces a local modification of the glass and will be discussed in detail in Chapter II
section II.2. For photochemical reactions, an great number of pulses needs to be
accumulated in order to drive the diffusion of chemical species inside the
temperature gradient [44]. That is what is required in silver containing glasses as
we are going to see during this work. In summary, the laser is absorbed then
modification of the structural network occurs and finally a permanent change in the
physical proprieties of the material/glass takes place.
Figure I.16: Timeline of physical phenomena involved during laser-matter
interaction. Inspired from [33].

29
I.3.4. Effects of laser parameters
Laser-matter interaction is a two-way process. The interaction response depends on
the matter used i.e. glass, metals, soft tissues, etc. as well as the laser parameters.
In this framework, we are working on glasses, changing one laser parameter could
sometimes make a lot of difference as we are going to see in this part.
▪ Wavelength:
The laser wavelength is an important parameter in laser-glass interaction. If the
glass exhibits a band gap in the UV, in order to have a non-linear process, a green
laser for instance or Infra-Red (IR) laser must be used. However, a laser operating
in the UV could be used but the interaction with the glass will be a linear one.
Therefore, the non-linear processes are not present. Moreover, the wavelength
used can define the number of photons absorbed to defy the glass band gap. For
the same glass, using different wavelengths can generate two-photon absorption or
four-photon absorption for example. If a glass exhibiting a band gap of 4.6 eV
when irradiated using a 1030 nm laser, a four-photon absorption process occurs;
however using a 515 nm implies a two-photon absorption process. For instance,
Hernandez-Rueda et al. investigated the influence of the laser wavelength on the
written waveguides in fused silica [45] by using lasers from the UV to the IR range.
It was concluded that using shorter wavelengths leads to smaller written features,
lower thresholds and narrower energy range for waveguide fabrication [45].
▪ Repetition rate, heat accumulation and laser writing regimes
As mentioned before, a laser can operate in continuous mode (CW) or in pulsed
mode. When the laser is operating in continuous mode, it has no repetition rate
because it is emitting light all the time, non-stop as shown in Figure I.17.a
However, a pulsed laser emits pulses spaced by a certain time depending on its
repetition rate (Figure I.17.b). The pulses exhibit a pulse duration 𝑇0 and are
separated by a period of T which is determined by the laser repetition rate 𝜏 = 1 𝑇⁄ .
The number of pulses per second is determined by the laser repetition rate. For
example if a laser is operating at 𝜏=250 kHz, it delivers 250 000 pulses per second.
During this work, femtosecond lasers are used exhibiting short pulses of hundreds
of femtoseconds which is equivalent to 10-15 s as we are going to see in the
following chapters.

30
Figure I.17: Schematic presentation of the temporal evolution of the power of a
(a) continuous laser (b) pulsed laser.
When using a CW laser, the material does not have time to cool down. However,
when using a pulsed laser, depending on the repetition rate as well as the thermal
properties of the material, thermal relaxation is possible and the material could
have time to cool down. The heating process following the interaction of
femtosecond lasers with glasses has been studied by many research groups. First it
was proposed by Schaffer et al. in 2003 in zinc doped borosilicate glass (Corning
0211) where the radius of the structures was observed to increase as the number
of the pulses increases [46]. Over many number of pulses the glass heats and
melts a larger volume than the focal volume. After the pulse train is switched off,
the glass is cooled and resolidifies in a way different from the initial one. These
observations were explained and modeled by the authors as a thermal melting
mechanism [46]. The latter work was confirmed and enhanced by Eaton et al. in
2005 and Zhang et al. in 2007. Both Eaton and Zhang studied the heat
accumulation effects with variable repetition rates. They also found that the radius
of the structures produced increased as a function of the repetition rate i.e. number
of pulses in borosilicate glass [47]. What is more interesting in this work was the
numerical model of cumulative heating that was proposed. A finite differential
method was applied to laser conditions to investigate the physical processes [48].
The laser pulses were modeled as periodic heat sources appearing as delta
functions in time since the electron heating and the electron-phonon coupling time
(<1ps) is much shorter than the thermal diffusion time of the glass in this case
(>0.1µs). The laser energy distribution was modeled as a spherical Gaussian mode:
𝐸(𝑟) = 𝐸0𝑒(−𝑟2 𝑤0
2)⁄ (I-19)

31
where r is the radial distance and w0 is the 1/e radius at the focused laser beam
waist. And the model was based on the radial component of the 3-D heat diffusion
equation that was solved numerically:
𝜕
𝜕𝑟(𝑟2
𝜕𝑇
𝜕𝑟) =
𝑟2
𝐷
𝜕𝑇
𝜕𝑡 (I-20)
where T(r,t) is the temperature and D is the thermal diffusivity of the glass.
The results of the numerical model for different repetition rates are shown in Figure
I.18. The horizontal black dashed line presents the annealing temperature of the
glass used. This is the temperature where the glass melts and starts sustaining
modifications. Three repetition rates were taken into consideration, 100kHz,
500kHz and 1MHz [48]. For the 100kHz repetition rate, we can observe that the
glass temperature is increasing roughly above the annealing temperature after
receiving the first pulse. However, afterwards the temperature decreases well
below the annealing temperature before the next pulse arrives. The glass has
sufficient time to cool down before the next pulse. The time between two pulses is
lower than the thermal diffusion of the glass 𝑇 < 𝐷. So on the one hand, we do not
have a cumulative thermal effect or more specifically we have minimum heat
accumulation.
On the other hand, for the 500kHz and 1MHz repetition rates, we clearly see that
we have a cumulative effect of pulses i.e. cumulative thermal effect (heat
accumulation). After the first pulse, the glass temperature increases above the
annealing temperature and the second pulse arrives quickly so the glass does not
have time to cool down and the temperature continues to build up. For the 1MHz,
the thermal cumulative effect is more significant due to the fast repetition rate i.e.
shorter time intervals between two consecutive pulses, the glass has no time to
cool down before the following pulse. The time between two pulses is higher than
the thermal diffusion of the glass 𝑇 > 𝐷 which leads to thermal modification
volumes much larger than the laser focus plane [47, 48].
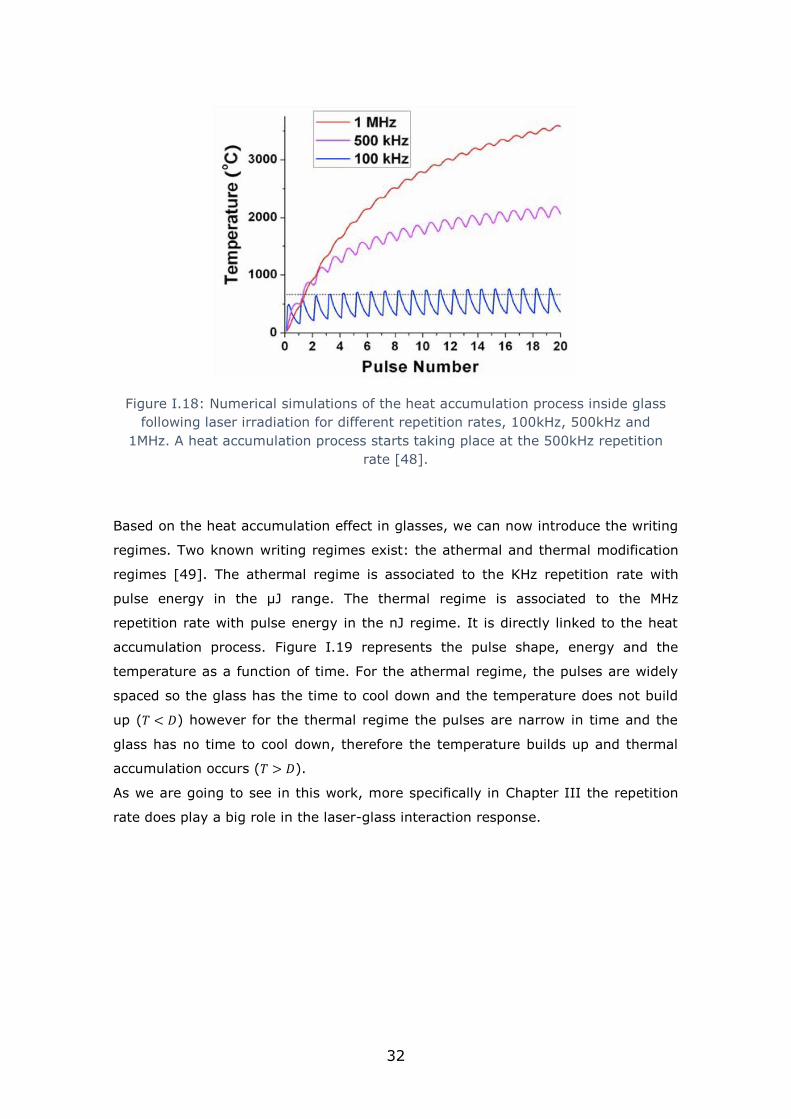
32
Figure I.18: Numerical simulations of the heat accumulation process inside glass
following laser irradiation for different repetition rates, 100kHz, 500kHz and
1MHz. A heat accumulation process starts taking place at the 500kHz repetition
rate [48].
Based on the heat accumulation effect in glasses, we can now introduce the writing
regimes. Two known writing regimes exist: the athermal and thermal modification
regimes [49]. The athermal regime is associated to the KHz repetition rate with
pulse energy in the µJ range. The thermal regime is associated to the MHz
repetition rate with pulse energy in the nJ regime. It is directly linked to the heat
accumulation process. Figure I.19 represents the pulse shape, energy and the
temperature as a function of time. For the athermal regime, the pulses are widely
spaced so the glass has the time to cool down and the temperature does not build
up (𝑇 < 𝐷) however for the thermal regime the pulses are narrow in time and the
glass has no time to cool down, therefore the temperature builds up and thermal
accumulation occurs (𝑇 > 𝐷).
As we are going to see in this work, more specifically in Chapter III the repetition
rate does play a big role in the laser-glass interaction response.

33
Figure I.19: Comparison between athermal and thermal regimes. For the athermal
regime, low repetition rate laser, the pulses are well spaced in time so that the
temperature does not have time to build up in the material. However for the
thermal regime, high repetition rate laser, the pulses are close in time and the
temperature builds ups.
▪ Polarisation:
Laser polarisation during laser-glass interaction could sometimes affect the results.
It has been reported by Stalmashonak et al. that reshaping metallic nanoparticles
(NPs) into non-spherical ones depends on laser polarisation [50]. The MPI was
found to be significantly higher for a linear polarization compared to a circular one
in fused silica and sapphire as reported by Temnov et al [51]. Moreover, the
polarization was found to strongly affect the creation of nanogratings in glasses, in
which the nanogratings are only formed with linear polarization [52]. In the
waveguides field, it has been reported by an Australian research team that using a
circular polarisation increases the transmission i.e. deceases the propagation losses
of photo-written waveguides [53].
▪ Numerical Aperture
The numerical aperture (NA) of the focusing objective determines the size of the
beam at the focus plane, therefore determining the area of the irradiated zone. The
beam waist at the focus plane for a NA<0.7 is given by:
𝑤0 = 0.518𝜆0
𝑁𝐴 (I-21)
When for a high NA i.e. NA>0.7, it is given by:

34
𝑤0 = 0.61𝜆0
𝑁𝐴 (I-22)
where 𝜆0 is the wavelength in the free space and NA the numerical aperture of the
focusing objective. So, one can conclude, that using a higher NA objective i.e.
focusing the beam tighter, leads to the creation of smaller structures and vice
versa.
It was reported that increasing the NA of the focusing objective used drastically
decreases the modification threshold in glasses [54, 55] as shown in Figure I.20.
Therefore, when using a high NA, objective pulse energy of nJ can produce
modifications in glasses. This is expected since it increases the laser irradiance
interacting with the glass. The laser irradiance is defined by the quantity of power
per surface area of the beam spot size. Having the same amount of power in a
tighter surface area (smaller beam spot size) increases the irradiance/laser dose
deposited in the glass. Taking into account (I-23), we can see that decreasing the
beam waist increases the laser irradiance in the glass. In this work, we consider the
laser irradiance to be:
𝐼 =𝑃𝑎𝑣𝑔. 𝑇. 𝑘
(𝑇0. (𝜋𝑤0
2
2))
(I-23)
where 𝑃𝑎𝑣𝑔 is the laser average power after the objective, 𝑇 the time between two
pulses, 𝑘 the Gaussian constant estimated to be 0.93 assuming that the pulse
profile is a Gaussian one and not square, 𝑇0 the pulse duration and 𝑤0 the beam
waist.
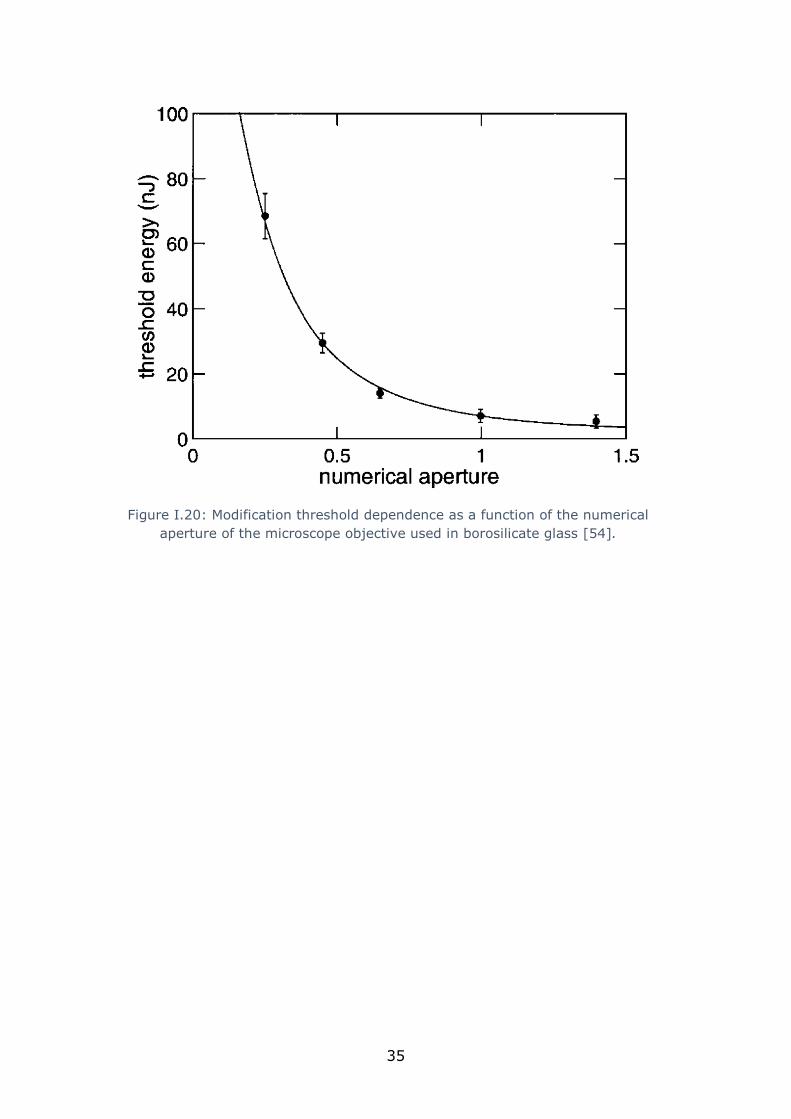
35
Figure I.20: Modification threshold dependence as a function of the numerical
aperture of the microscope objective used in borosilicate glass [54].

36
I.4. Conclusion
This chapter covers the theoretical approach of laser-glass interaction in general. It
starts by introducing the glass and its characterizations, the laser and eventually
the process of femtosecond laser-glass phenomena.
We first start by introducing the history of glass that dates back to 650 BC, then by
defining the glass itself as well as the glass transition phase. Even though in the
beginning of time, forming glasses was based on some recipes, nowadays the glass
industry is a vast one and glass is considered as an easy product to make. The ease
of making it, the optical window transparency in different wavelengths and the fact
that it could be shaped into fibers makes the glass a very attractive platform for
photonic and sensing applications.
Secondly, the laser is introduced and more specifically the laser-glass interaction
process. It is based on a non-linear process that allows the interaction of a laser
with a transparent substrate glass. The different timeline of physical processes was
presented following laser-glass interaction as well as the plasma generation around
the interaction voxel. We saw different glass responses for different laser
parameters, which highlights the effect of laser parameters in the interaction
process. Finally, we defined two inscription regimes based on the heat accumulation
process that were classified as athermal and thermal regimes.
The broad points regarding glass, lasers and basic laser-glass interactions were
covered allowing to tackle the main theme of this work where we will be introducing
in Chapter II: Direct laser writing of a new type of waveguide in silver containing
glasses. Chapter III will present a comparitive study between the type I and type A
photo-induced refractive index change by femtosecond laser writing. Finally,
Chapter IV the last chapter will address the direct laser writing of near-surface
waveguides as well as the creation of a refractive index sensor.

37
Table of contents:
II. Direct laser writing of a new type of waveguide in silver
containing glasses ......................................................................... 39
II.1 Introduction ......................................................................... 39
II.2 Principle of DLW and ∆n classification ................................. 40
II.2.1 Type I modification origins ....................................................... 42
II.3 State of the art ..................................................................... 43
II.3.1 Waveguides ........................................................................... 43
II.3.1.a Theory of waveguiding .............................................................44
II.3.2 Depressed cladding waveguides ................................................ 49
II.3.3 Couplers ................................................................................ 51
II.3.4 Beam splitters ........................................................................ 56
II.3.5 Waveguide Bragg grating ......................................................... 57
II.3.6 Waveguide lasers .................................................................... 59
II.3.7 Photonic lantern ...................................................................... 60
II.3.8 Study of phosphate glasses ...................................................... 61
II.4 Silver containing zinc phosphate glasses ............................. 63
II.4.1 Optical properties.................................................................... 64
II.4.2 Laser-silver containing glasses interaction .................................. 66
II.4.2.a Physical processes associated to the formation of silver clusters ....69
II.4.3 Writing window in silver containing glasses ................................. 71
II.4.4 Review on previous works on silver containing glasses ................. 72
II.5 Experimental setup: Glass and laser used ............................ 74
II.5.1 Glass synthesis and fiber drawing .............................................. 74
II.5.2 Silver containing zinc phosphate glass fibers ............................... 75
II.5.3 Laser setup ............................................................................ 79
II.5.4 Mode profile setup................................................................... 80
II.5.5 Confocal Microscope ................................................................ 81
II.5.6 Measuring ∆n:SID4Bio Phasics .................................................. 81
II.6 Results ................................................................................. 84
II.6.1 Structure morphology .............................................................. 84
II.6.2 ∆n vs laser parameters ............................................................ 86
II.6.3 Waveguiding .......................................................................... 95
II.6.3 Multimode waveguiding ...............................................................95
II.6.3.b Single mode waveguide ............................................................99

38
II.6.3.c Multimode – Single mode aspects ............................................ 109
II.6.4 Optical components ............................................................... 110
II.6.4.a Y-Beam splitters .................................................................... 110
II.6.4.b Directional couplers ................................................................ 111
II.6.5 Waveguides in Ribbon fibers ................................................... 115
II.7 Conclusion ......................................................................... 118
39
Chapter II
Direct laser writing of a new type of
waveguide in silver containing glasses
II.1. Introduction
In the past decades, laser-matter interaction has occupied the scientific community
due to its wide range of applications. More specifically, direct laser writing (DLW) in
transparent glasses has attracted the interest of many research groups. This simple
technique allows to directly address 3D micro-structures inside transparent
materials. It exhibits many advantages over lithography techniques which are
limited to 2D structuring and involve multiple steps, making DLW highly compatible
for faster material processing and for future technological transfer to advanced
industrial manufacturing. DLW in glasses induces a local permanent refractive index
change that could be used for the creation of waveguides as reported by Davis et al
[56]. Generally, the creation of waveguides is based on the type I refractive index
change as has been reported by many research groups [57-63].
In this chapter, we present the special response of the silver containing glasses
with femtosecond laser pulses. Following laser irradiation, fluorescent silver clusters
are created in the vicinity of the interaction voxel. Those silver clusters are
responsible for a novel type of refractive index change (∆n) that is compatible with
waveguiding applications. The morphology of the photo-induced structures, the ∆n
and the dimensions of the structures as a function of the laser irradiance were
investigated. Multimode and single mode waveguides were written and
characterized. A 50-50 Y-shaped beam splitter and a 50-50 directional coupler were
written also paving the way toward 3D integrated circuits. Finally, the waveguiding
process was demonstrated in silver containing ribbon fibers.

40
II.2. Principle of DLW and ∆n classification
Direct laser writing (DLW) in glasses consists in focusing femtosecond laser pulses
inside a transparent glass substrate using a microscope objective while moving the
sample which is placed on a 3D translation stage as shown in Figure II.1. Following
laser irradiation, the glass structure is changed resulting in a local permanent
change (modification) of the refractive index. The latter change in the refractive
index allows the fabrication of optical components and circuits embedded inside the
glass.
Figure II.1: Schematic presentation of the Direct Laser Writing (DLW) process.
This was first reported by Davis et al. in 1996, when focusing a femtosecond Ti-
Sapphire laser operating at 810 nm in silica glass induced a local modification of
the glass [56]. Normally, the refractive index change (∆n) results from the non-
linear absorption of the femtosecond laser pulses as previously explained in section
I.3.3.a. The ∆n induced by laser-glass interaction are classified generally as three
distinct types following an increasing pulse energy scale [64, 65]: Type I, Type II
and Type III as shown in Figure II.2. Poumellec et al. mapped the modification
process in pure silica glass for different pulse energies in four different regions.
Region I: no modification, Region II: Type I modification with isotropic ∆n, Region
III: Type II modification with anisotropic ∆n. Region IV: type III modification is
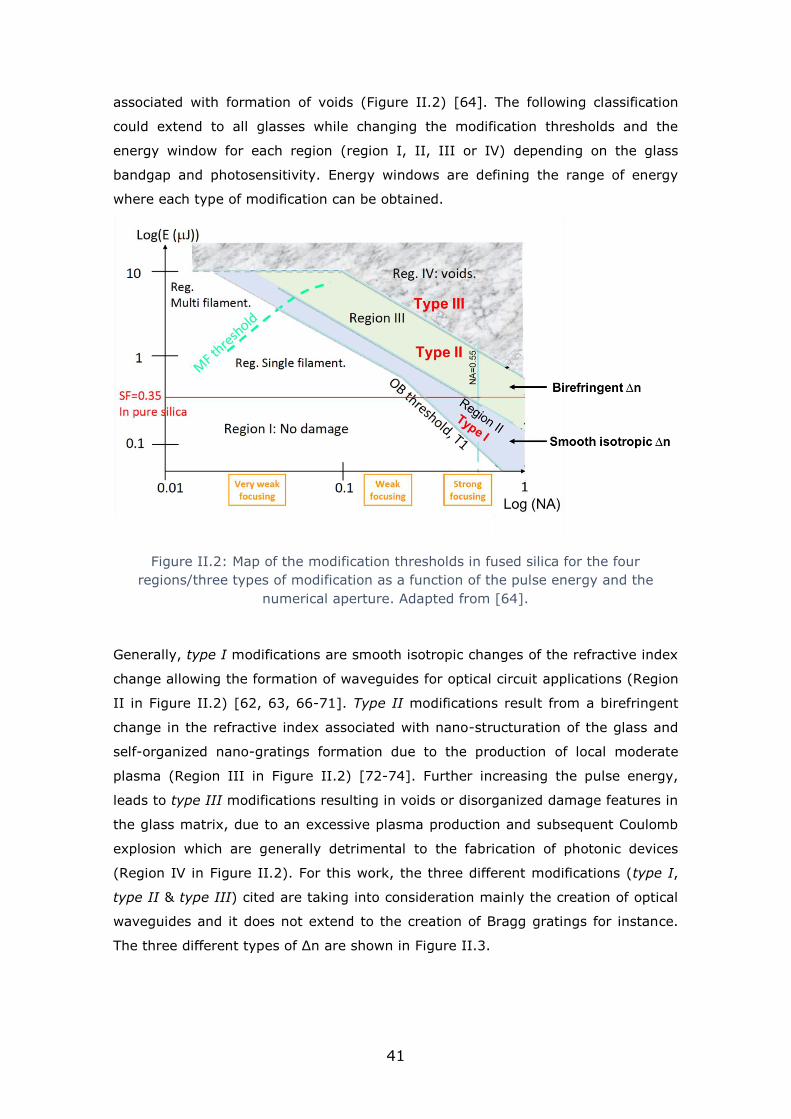
41
associated with formation of voids (Figure II.2) [64]. The following classification
could extend to all glasses while changing the modification thresholds and the
energy window for each region (region I, II, III or IV) depending on the glass
bandgap and photosensitivity. Energy windows are defining the range of energy
where each type of modification can be obtained.
Figure II.2: Map of the modification thresholds in fused silica for the four
regions/three types of modification as a function of the pulse energy and the
numerical aperture. Adapted from [64].
Generally, type I modifications are smooth isotropic changes of the refractive index
change allowing the formation of waveguides for optical circuit applications (Region
II in Figure II.2) [62, 63, 66-71]. Type II modifications result from a birefringent
change in the refractive index associated with nano-structuration of the glass and
self-organized nano-gratings formation due to the production of local moderate
plasma (Region III in Figure II.2) [72-74]. Further increasing the pulse energy,
leads to type III modifications resulting in voids or disorganized damage features in
the glass matrix, due to an excessive plasma production and subsequent Coulomb
explosion which are generally detrimental to the fabrication of photonic devices
(Region IV in Figure II.2). For this work, the three different modifications (type I,
type II & type III) cited are taking into consideration mainly the creation of optical
waveguides and it does not extend to the creation of Bragg gratings for instance.
The three different types of ∆n are shown in Figure II.3.

42
Figure II.3: The refractive index changes/modification classified as function of the
irradiance. Pictures for every type of modification, waveguides, nanogratings and
voids.
II.2.1. Type I modification origins
For the direct laser writing of photonic components such as waveguides, one is
usually interested in type I modification due to the smooth nature of the index
change associated with this type. Therefore, in this manuscript we will be interested
generally in type I modification. Over all, type I refractive index change (∆n) is
associated to the formation of color centers [60, 75, 76] and/or the change in the
glass density [46, 77-79]. Color centers result from a defect in the glass lattice
implying the absence of an atom from the place it would normally occupy in the
glass lattice. The electrons are trapped in such defects, which lends a certain
absorption band and color to the material. Thus, laser irradiation could create
enough color centers that the ∆n could be correlated to the Kramers-Kronig
mechanism [60]. The formation of color centers has been observed in many glasses
such as phosphate [76] and borosilicate [80]. Some groups have suggested that
the presence of color centers produces a metastable change in the polarizability
associated with a change in the molar refraction of the material [81]. The change in
polarizability is caused by a variation in the concentration of ionic bonds that results
from the capture of free electrons by defects in the network structure that occur
during irradiation [82]. This change in polarizability may induce a decrease [76, 83]
or increase [43] of the ∆n mainly on the material in which it is induced. Generally,
color centers are not stable and they disappear after thermal annealing.

43
However, the change in the glass density is due to the local heating of the glass
and restructuration during the cooling process following laser passage. In the laser
focal spot, due to the absorption of the laser energy, the glass is heated to a
temperature higher than Tg, therefore it melts [77] and following the laser
passage, it cools down at a different speed and process from the initial non-
irradiated glass resulting in a change in the density of the material creating a
change of ∆n of the material. The ∆n created could be positive or negative based
on the material irradiated [62]. Several groups have noticed that the magnitude of
the index variation is related to the cooling rates of the material, which confirms
the link between the index change and the thermal processes that occur during
laser irradiation [60]. Moreover, the change in the glass density i.e. the photo-
induced ∆n could also be related to the ion exchange following laser irradiation as
observed by Kanehira et al. [84] and others [85]. Obviously, several parameters
play an important role in the determination of the sign and the magnitude of the
refractive index variation in the glass going from the laser parameters to the glass
composition. This part will be more detailed in Chapter III
II.3. State of the art:
II.3.1. Waveguides
Over the past two decades, many research groups created waveguides inside
glasses using the direct laser technique since the first demonstration by Davis et al.
in 1996 [56]. The inscription of waveguides in glasses is the basic application that
builds up for the creation of integrated optical circuits. Two different writing
configurations are possible, longitudinal and transverse in which the sample is
translated respectively along and perpendicularly to the beam propagation axis.
The longitudinal writing configuration [62] results in intrinsically symmetric, round
waveguides and their size is determined by the focal spot of the laser beam.
However, their length is limited by the focal length of the focusing objective.
Furthermore, the transverse writing provides much more versatility and flexibility in
creating complex 3D geometries. The disadvantage could be producing a strong
asymmetry in the waveguide cross section resulting sometimes in elliptical
waveguides. Certain methods were introduced to overcome this problem. Some
research groups use a slit placed before the microscope objective [63]. Others use
cylindrical telescope lenses [86, 87] and some use a spatial light modulator (SLM)
[69] to reduce the asymmetry and create circular waveguides.

44
Waveguides were written in fused silica glasses [45, 57, 68], phosphate glasses
[61, 62, 76], Borosilicate glasses [48, 88], fluoride glasses [89], chalcogenide
glasses [90, 91] and other glasses as well. Depending on the glass transmission
widows, waveguides operating from the visible [61, 62, 89] to the IR [87, 92-94]
(up to 3.85 µm) region were written using direct laser writing. Moreover, low loss
waveguides in the order of 0.1 dB/cm (Borosilicate glasses, Fused silica glasses and
chalcogenide glasses) [48, 66, 95] and even lower to 0.027dB/cm in Gorilla glass
[71] were reported, paving the way for a bigger scale of material processing and
optical/photonic circuits in needed cases as well as for industrial transfer. However,
the lowest propagation losses of 0.027dB/cm [71] has not been
reported/reproduced by any research team to date. One can say that the DLW
losses could be comparable to silicon based ultra-low loss waveguides processed
with lithography technique exhibiting losses of 0.0008dB/cm [96] and 0.026dB/cm
[97] for example.
Finally, based on the creation of waveguides using DLW, many optical components
were created like couplers, splitters, waveguide lasers etc. The following part will
briefly discuss some of the significant work done over the past years based on
waveguides written in glasses. But before, a small overview of the waveguiding
theory is presented.
II.3.1.a. Theory of waveguiding
This part is inspired from [98, 99]. Let’s consider a planar dielectric waveguide
surrounded by a lower refractive index medium as shown in Figure II.4. The light
propagates inside the waveguide by the Total Internal Reflection (TIR) principle.
The inner part of the waveguide is called the core while the outer part is called the
cladding. Light propagates inside the waveguide’s core while making angles 𝜃 with
the z axis (Figure II.4) following many multiple internal reflections (Figure II.4).

45
Figure II.4: Schematic of guided and unguided rays in a planar dielectric
waveguide. The rays exhibiting a propagation angle 𝜃 lower than �̅� = 𝑐𝑜𝑠−1(𝑛2 𝑛1)⁄
are only guided. Taken from [99].
The rays exhibiting a propagation angle 𝜃 smaller than the critical angle given �̅� by,
�̅� = 𝑐𝑜𝑠−1(𝑛2 𝑛1)⁄ could be guided inside the waveguide. The light propagates inside
the waveguide as a form of a mode that could be determined using the self-
consistency condition. Modes are fields that maintain the same transverse spatial
distribution and polarization all along the waveguide along the propagation axis.
Assuming that a monochromatic light is propagating inside a planar waveguide with
an angle 𝜃 smaller than the critical angle �̅�, we impose the self-consistency
condition that a wave reproduces while propagating to determine the propagating
modes. In one round trip, the different optical path distance that occurs is given
by: 𝐴𝐶̅̅ ̅̅ − 𝐴𝐵̅̅ ̅̅ = 2𝑑𝑠𝑖𝑛𝜃 while 𝑑 is the waveguide width (Figure II.4). Every time the
light bounces on the interface core-cladding a phase shift occurs presented by ∅𝑟.
For self-consistency, the phase shift between two waves should be zero or a
multiple of 2, therefore:
2𝜋
𝜆2𝑑𝑠𝑖𝑛𝜃 − 2∅𝑟 = 2𝜋𝑚 (II-1)
The reflection phase ∅𝑟 is as a function of the propagation angle 𝜃. It depends also
on the polarization of the incident wave, TE (Transvers Electric) or TM (Transvers
Magnetic). Let’s consider a TE wave propagating inside the waveguide (the electric
field is in the x direction) the self-consistency condition is given by:
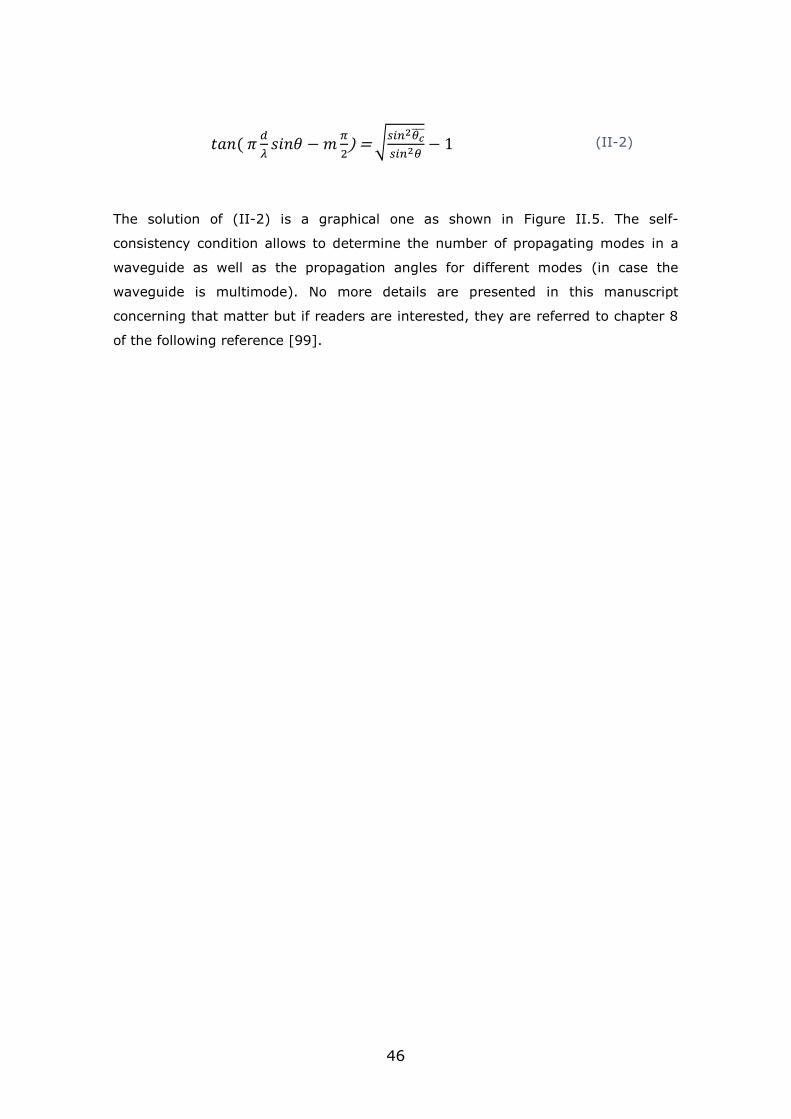
46
𝑡𝑎𝑛 ( 𝜋𝑑
𝜆𝑠𝑖𝑛𝜃 − 𝑚
𝜋
2) = √
𝑠𝑖𝑛2𝜃𝑐̅̅ ̅
𝑠𝑖𝑛2𝜃− 1 (II-2)
The solution of (II-2) is a graphical one as shown in Figure II.5. The self-
consistency condition allows to determine the number of propagating modes in a
waveguide as well as the propagation angles for different modes (in case the
waveguide is multimode). No more details are presented in this manuscript
concerning that matter but if readers are interested, they are referred to chapter 8
of the following reference [99].
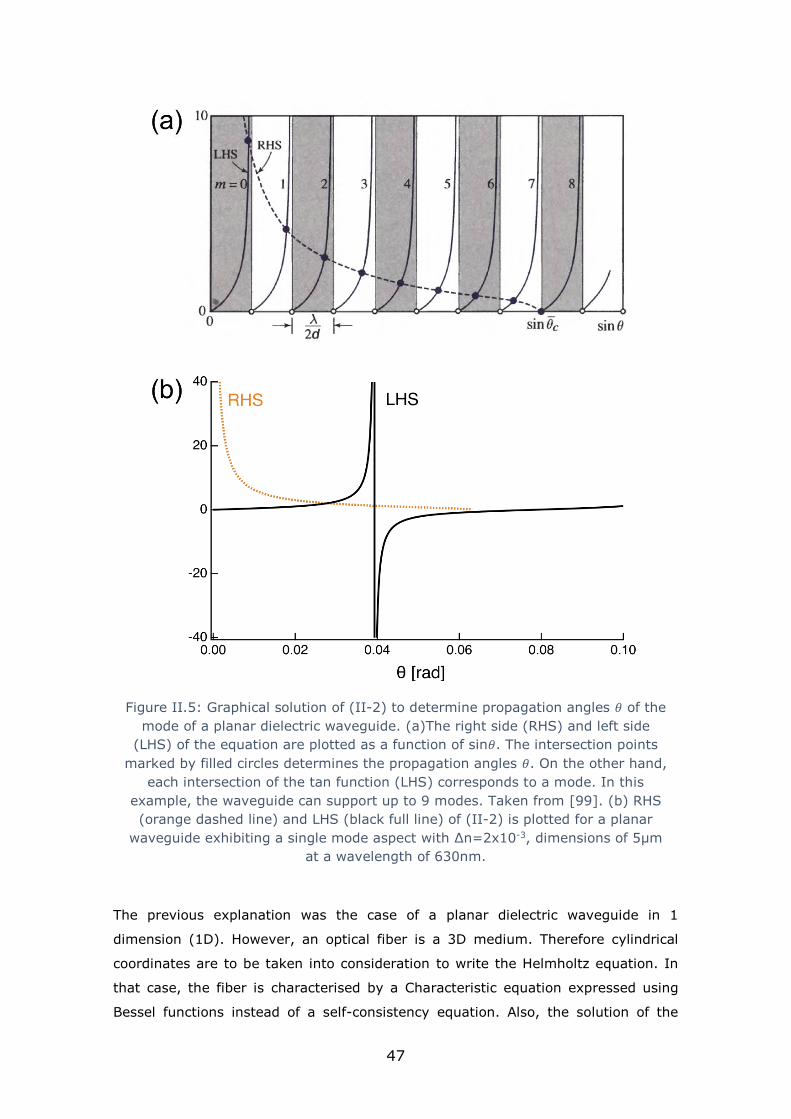
47
Figure II.5: Graphical solution of (II-2) to determine propagation angles 𝜃 of the
mode of a planar dielectric waveguide. (a)The right side (RHS) and left side
(LHS) of the equation are plotted as a function of sin𝜃. The intersection points
marked by filled circles determines the propagation angles 𝜃. On the other hand,
each intersection of the tan function (LHS) corresponds to a mode. In this
example, the waveguide can support up to 9 modes. Taken from [99]. (b) RHS
(orange dashed line) and LHS (black full line) of (II-2) is plotted for a planar
waveguide exhibiting a single mode aspect with ∆n=2x10⁻³, dimensions of 5µm
at a wavelength of 630nm.
The previous explanation was the case of a planar dielectric waveguide in 1
dimension (1D). However, an optical fiber is a 3D medium. Therefore cylindrical
coordinates are to be taken into consideration to write the Helmholtz equation. In
that case, the fiber is characterised by a Characteristic equation expressed using
Bessel functions instead of a self-consistency equation. Also, the solution of the

48
characteristic equation could be a graphical one (similar to the self-consistency
condition) allowing to determine the fiber parameters. This part will be briefly
presented later in the manuscript (section II.3.3). For more details, the reader is
invited to read chapter 9 of the following reference [99].
In a more general and simple way, the waveguiding process in fibers that are
dielectric waveguides is based on total internal reflection (TIR) as shown in Figure
II.6. The ∆n between the core and the cladding is enough to confine light inside the
core. The ∆n could be a step-index or a gradient one. In this case, we are only
considering the step-index case given that the photo-written waveguides almost
exhibit a step index ∆n between the pristine glass and the irradiated zone.
Figure II.6: Schematic presentation of the way light rays propagate inside a
multimode step-index optical fiber. Taken from [99].
The photo-written waveguides could be considered as an optical fiber with an
infinite cladding which is the glass. The ∆n is given by:
∆𝑛 =𝑛1 − 𝑛2
𝑛1 (II-3)
An incident light beam into the fiber/waveguide could be guided if it makes an
angle with the fiber axis that is smaller than �̅� with �̅� = 𝑐𝑜𝑠−1(𝑛2 𝑛1)⁄ . An
acceptance angle 𝑎 is required so the light is guided with: 𝑎 = 𝑠𝑖𝑛−1𝑁𝐴 where 𝑁𝐴 is
the numerical aperture of the fiber/waveguide as given by:
𝑁𝐴 = √𝑛12 − 𝑛2
2 (II-4)
The acceptance angle/the numerical aperture determines the cone of acceptance of
the fiber/waveguide as shown in Figure II.7. The guided rays inside the fiber exit
while diverging according to the acceptance angle i.e. numerical aperture.

49
Figure II.7: The acceptance angle 𝜃a of an optical fiber. The rays within the
acceptance cone are guided inside the fiber by total internal reflection. The
numerical aperture is given by: NA=sin𝜃𝑎. Taken from [99].
For an optical fiber or perfectly circular waveguides, the parameter V allows to
identify the number of modes propagating in the waveguide i.e. if the
waveguide/fiber exhibit a single mode or a multimode aspect for a specific
wavelength, it is given by:
𝑉 = 2𝜋𝑎
𝜆𝑁𝐴 (II-5)
The parameter V depends mainly on the NA i.e. ∆n and the dimension of the
waveguide a, once the propagating wavelength is fixed. Single mode
waveguides/fibers exist in the region where V<2.405. Beyond that region, the
waveguides/fibers represent a multimode aspect [98]. Many modes other than the
fundamental mode could propagate. So, in order to control the V parameter in
waveguides, one could change the photo-induced ∆n and/or the dimensions of the
waveguides. However, one should mention, that the photo-written waveguides are
not always circular ones, especially in this project. They are elliptical. Still, one can
approximate the V parameter using (II-5).
II.3.2. Depressed cladding waveguides
Actually, waveguides could be written in two ways: standard waveguides as
mentioned in the previous section and depressed cladding waveguides (DCWs).
Following laser-glass interaction a smooth ∆n is produced (with the right
parameters). However, the photo-induced ∆n is not always a positive one.
Sometimes it is a negative one [100] which complicates the creation of
waveguides. Therefore, researchers have found a way to live with negative ∆n and
started creating depressed cladding waveguides.

50
For instance, in silver containing zinc phosphate glasses used in this project, using
a 250 kHz repetition rate laser could induce a negative ∆n as shown in Figure II.8.
This part will be discussed more in detail in Chapter III
Figure II.8: (a) Top View phase contrast image of a type I waveguide written in
silver containing zinc phosphate glass under white light illumination (b) Optical Path
Difference (OPD) profile associated to the waveguide. A negative OPD is observed.
Another example of negative ∆n is in ZBLAN glasses as reported by Bérubé [101].
A depressed waveguide cladding was made by writing a series of waveguides
exhibiting a negative ∆n in a ring shape as shown in Figure II.9. In that case, the
guiding process takes place inside the non-irradiated zone where the refractive
index is higher compared to the modified region. This process eventually requires
more time and more processing to the glass in order to make a waveguide. This
technique was also used by other researchers to make waveguides in phosphate
glasses [102] and ZBLAN glasses also [103].

51
Figure II.9: Tranverse view of a depressed cladding waveguide (DCW) (a)
composed of 54 DCW distributed over 2 rings (b) composed of 212 DCW distributed
over 4 rings. Taken from [101]
II.3.3. Couplers:
If two waveguides/fibers are close enough such as their evanescent fields overlap,
light can be coupled from one to the other based on the evanescent field
interaction. Light could be transferred between waveguides allowing to make optical
couplers and switches. Based on coupled-mode theory [104] we can consider the
coupling between two waveguides/optical fibers as one waveguide/fiber creating a
perturbation for the second one [105]. The light injected in one waveguide/fiber is
coupled to the other one. Generally, in order to have the best coupling effect, the
two waveguides/fibers should be identical (same dimensions, same ∆n) exhibiting
the same propagation constant. Let’s consider two identical parallel waveguides
separated by a distance (center to center) “d” and with an interaction distance “L”
as shown in Figure II.10.
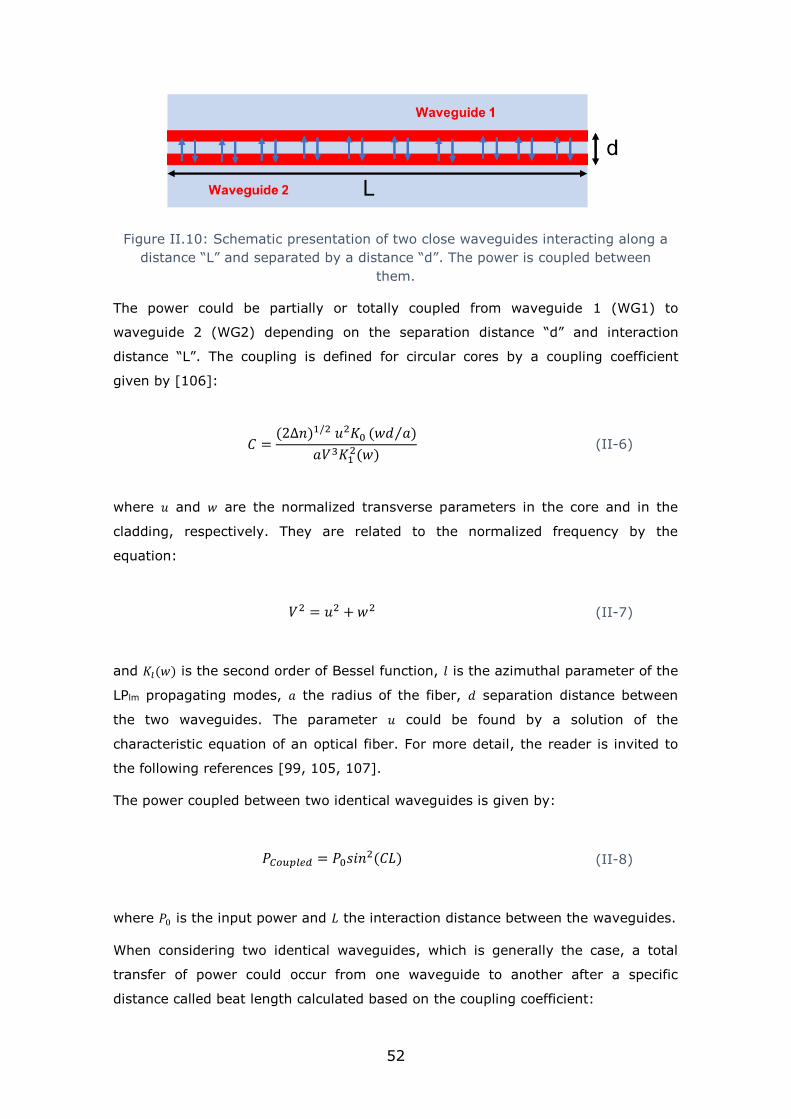
52
Figure II.10: Schematic presentation of two close waveguides interacting along a
distance “L” and separated by a distance “d”. The power is coupled between
them.
The power could be partially or totally coupled from waveguide 1 (WG1) to
waveguide 2 (WG2) depending on the separation distance “d” and interaction
distance “L”. The coupling is defined for circular cores by a coupling coefficient
given by [106]:
𝐶 =(2∆𝑛)1/2 𝑢2𝐾0 (𝑤𝑑 𝑎)⁄
𝑎𝑉3𝐾12(𝑤)
(II-6)
where 𝑢 and 𝑤 are the normalized transverse parameters in the core and in the
cladding, respectively. They are related to the normalized frequency by the
equation:
𝑉2 = 𝑢2 + 𝑤2 (II-7)
and 𝐾𝑙(𝑤) is the second order of Bessel function, 𝑙 is the azimuthal parameter of the
LPlm propagating modes, 𝑎 the radius of the fiber, 𝑑 separation distance between
the two waveguides. The parameter 𝑢 could be found by a solution of the
characteristic equation of an optical fiber. For more detail, the reader is invited to
the following references [99, 105, 107].
The power coupled between two identical waveguides is given by:
𝑃𝐶𝑜𝑢𝑝𝑙𝑒𝑑 = 𝑃0𝑠𝑖𝑛2(𝐶𝐿) (II-8)
where 𝑃0 is the input power and 𝐿 the interaction distance between the waveguides.
When considering two identical waveguides, which is generally the case, a total
transfer of power could occur from one waveguide to another after a specific
distance called beat length calculated based on the coupling coefficient:

53
𝑧𝐵 =𝜋𝐹
𝐶 (II-9)
Where 𝐹 is given by:
𝐹 =1
√1 + (∆𝛽2𝐶
)2
(II-10)
with 𝛽 as the propagation constant and 𝐶, the coupling coefficient given by (II-6).
In this case, where the waveguides are identical, F=1 given that they exhibit the
same propagation distance; therefore ∆𝛽 = 0.
Generally, the coupling coefficient and the power exchange are dictated by the
waveguides parameters only. However it was found that the polarization of the
guided beam could affect the coupling coefficient over a long distance of interaction
in directional couplers written using DLW technique, as reported by Crespi et al.
[108] and shown in Figure II.11.
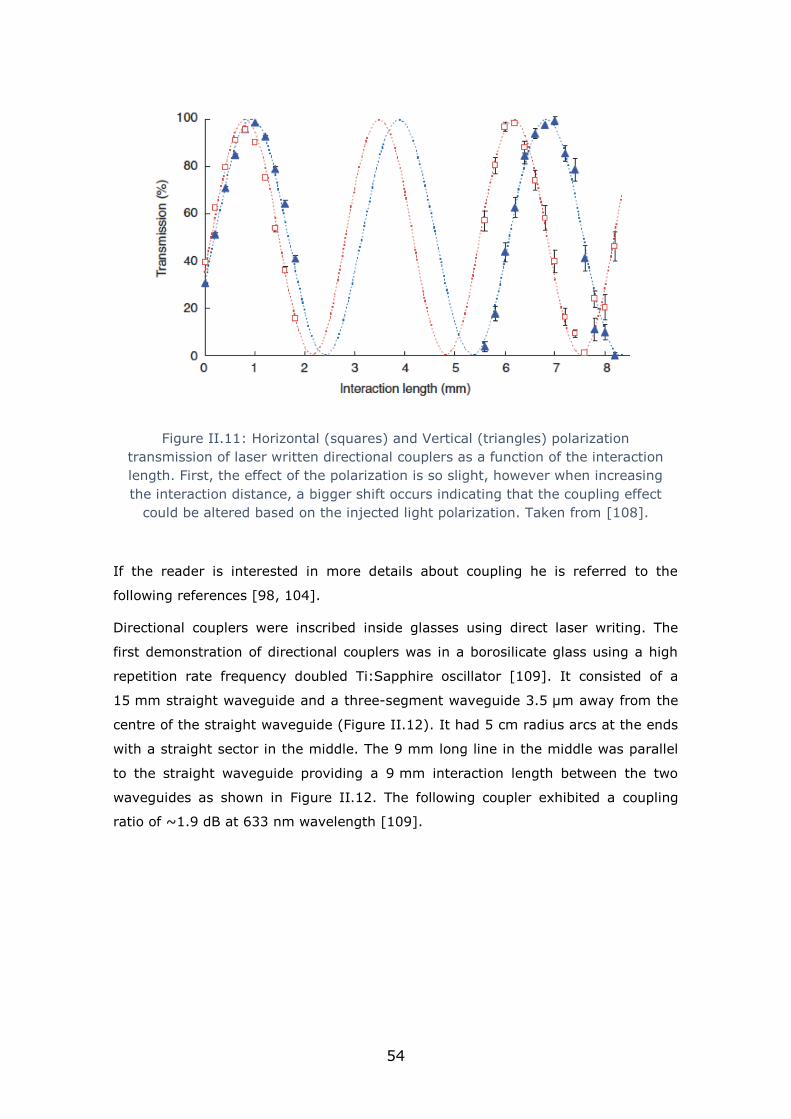
54
Figure II.11: Horizontal (squares) and Vertical (triangles) polarization
transmission of laser written directional couplers as a function of the interaction
length. First, the effect of the polarization is so slight, however when increasing
the interaction distance, a bigger shift occurs indicating that the coupling effect
could be altered based on the injected light polarization. Taken from [108].
If the reader is interested in more details about coupling he is referred to the
following references [98, 104].
Directional couplers were inscribed inside glasses using direct laser writing. The
first demonstration of directional couplers was in a borosilicate glass using a high
repetition rate frequency doubled Ti:Sapphire oscillator [109]. It consisted of a
15 mm straight waveguide and a three-segment waveguide 3.5 µm away from the
centre of the straight waveguide (Figure II.12). It had 5 cm radius arcs at the ends
with a straight sector in the middle. The 9 mm long line in the middle was parallel
to the straight waveguide providing a 9 mm interaction length between the two
waveguides as shown in Figure II.12. The following coupler exhibited a coupling
ratio of ~1.9 dB at 633 nm wavelength [109].

55
Figure II.12: Schematic presentation of the first demonstration of a directional
coupler presented by Strelstov et al [109].
Eaton et al. demonstrated low-loss and efficient directional couplers operating in
the telecom wavelengths using a 1 MHz repetition rate fiber laser [110]. A coupling
ratio of ~99% as well as the creation of a 50-50 coupler were reported for telecom
wavelengths between 1310 nm and 1550 nm. The couplers consisted of two
symmetric double S-bend waveguides as shown in Figure II.13. For the 50/50
coupler the waveguides were separated by 17.5µm while the interaction distance
was 20.6 mm (Figure II.13).
Figure II.13: Schematic presentation of a 50-50 directional coupler. The light is
injected in one branch and 50% of the power is coupled into the other branch.
Taken from [110].
The following reported couplers were written in the 2D planes, however, an
interesting work reported by Kowalevicz et al, exhibited a 3D, 3x3 directional
coupler [111]. The design was three waveguides fabricated on the edges of an
equilateral triangle as depicted Figure II.14.a. A 43%:28%:29% coupling ratio was
reported at the output following 800 nm laser injection (Figure II.14.b). The coupler

56
was manufactured in soda-lime glass using a 5.85 MHZ repetition rate Ti:sapphire
oscillator [111].
Figure II.14: (a) Schematic presentation of the 3D
coupler (b) Mode profiles of the output indicating that
the light is coupled in the three branches with a ratio of
43%:28%:29%. Taken from [111].
II.3.4. Beam splitters
A beam splitter consists of an optical component splitting light in an adiabatic
process into two or more branches while conserving the spatial mode distribution.
One of the first beam/power splitters was reported in 1999 in fused silica using a
low repetition rate 1kHz Ti:sapphire oscillator and longitudinal writing geometry. It
was a Y-shaped beam splitter dividing the input light into two different outputs at a
514.5 nm wavelength [112].
An impressive demonstration of high quality low loss beam splitters has been
reported in 2005 by Liu et al. [113]. A 1 to 8 optical waveguide beam splitter
operating at 1.55µm was fabricated in fused silica using a 150kHz Ti:Saphhire
laser. The total length of the component was 18 mm. It was composed out of 7Y
junctions as shown in Figure II.15.a. The curvature radius was from 200.005 µm to
225.010 µm to minimize any bending losses. The input light was successfully split
into eight output branches as shown in Figure II.15.b.

57
Figure II.15: (a) Schematic design of the 1 to 8 beam splitter with 7-Y junctions (b)
Side view output of the far-field modes [113]
Another approach for 3D beam splitters by the group of S.Nolte where a 1x3
splitter (Figure II.16) was written inside fused silica operating at 1.05 µm
wavelength using a 1 khZ Ti:sapphire laser [114].
Figure II.16: (a) Schematic presentation of the laser writing of the 1x3 beam
splitter (b) Side view output visualization of the divided modes [114].
II.3.5. Waveguide Bragg grating (WBG)
A waveguide Bragg grating (WBG) consists of a periodic perturbation of the
effective refractive index of the light guided inside the bulk material. This
perturbation is based on a modulation of ∆n that reflects particular wavelengths of
light, centered mainly at the Bragg wavelength while transmitting all the other

58
wavelengths. It acts as a filter or reflector of light. Two methods of fabricating WBG
exist, the point by point (PbP) method and the modulated burst method.
The first demonstration of a WBG was in 2006 by Marshall et al [115] using the PbP
method. It consists in modulating the ∆n point by point by modulating the laser
repetition rate and speed allowing to control the spatial separation between each
pulse as schematically presented in Figure II.17.
Figure II.17: Schematic presentation of the PointbyPoint (PbP) process of writing
a Waveguide Bragg Grating (WBG) as well as a bright field image of the top view
of the WBG. Taken from [101]
The waveguide was written before the grating structure and the WBG extended all
over the waveguide length (Figure II.18.a). A Bragg reflection was observed at a
1550.63 nm wavelength, as shown in Figure II.18.b [115]. Zhang et al.
demonstrated later on that WBGs could be fabricated using the PbP method with
only one scan of laser writing [116].

59
Figure II.18: (a) Top view of the Waveguide Bragg Grating (WBG). The waveguide
is indicated by the black lines (b) Reflection spectrum of the written WBG (upper
curve) compared to the transmission of a normal waveguide (lower curve). Taken
from [115].
The second method is the modulated burst method where the laser source was
modulated to generate a burst of laser pulses. The WBG is written with a one step
process while modulating the ∆n based on the modulation of the pulse energy.
Many WBGs were created using this technique [117, 118]. Given that this project
will not be taking into consideration WBG manufacturing, this part will be limited
and if the reader is interested in more details, the following reference [118] is of
interest.
II.3.6. Waveguide lasers
Waveguide lasers (WGL) are lasers based on the creation of waveguides in doped
glasses by the direct laser writing process as reported by many research groups
[119, 120]. The glasses were doped with rare earth elements like erbium Er or
Ytterbium Yb while the waveguides were used as a gain medium and mainly
external Bragg gratings to create the laser cavity. The first femtosecond laser
written waveguide laser was manufactured in a Er:Yb doped phosphate glass (Kigre
QX) in 2004 [119]. It consisted of a 20 mm active waveguide, optically pumped at
975 nm by two laser diodes and two external fiber Bragg gratings to create the
laser cavity. A maximum output power of 1.7 mW was obtained at 1.533 µm
wavelength. Furthermore, to improve the power stability, a preliminary result was
obtained on the feasibility of a Distributed feedback (DFB) laser configuration by
writing the Bragg gratings inside the glass substrate, in 2008 [120]. The glass was
an Er:Yb doped phosphate glass (Kigre QX). A 20 mm long waveguide and a
superposed Bragg grating were fabricated in a single step writing process. The laser
device demonstrated operated at a 1537.627 nm wavelength and delivered a 0.36
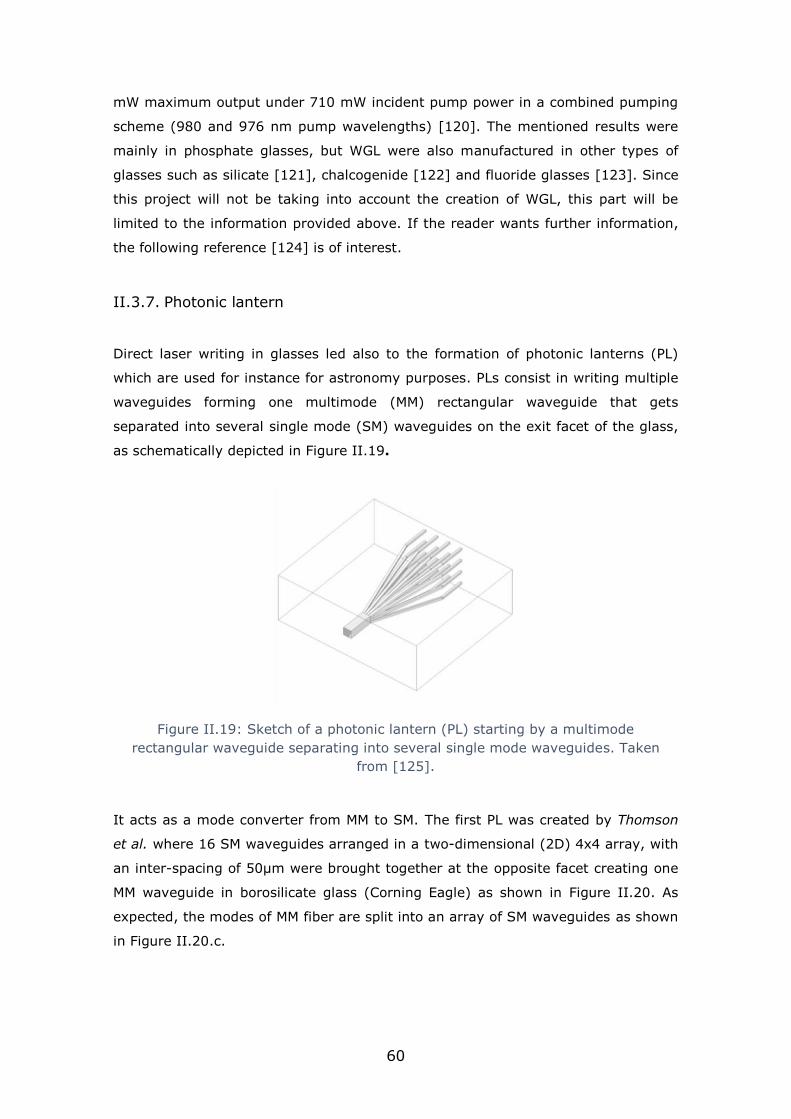
60
mW maximum output under 710 mW incident pump power in a combined pumping
scheme (980 and 976 nm pump wavelengths) [120]. The mentioned results were
mainly in phosphate glasses, but WGL were also manufactured in other types of
glasses such as silicate [121], chalcogenide [122] and fluoride glasses [123]. Since
this project will not be taking into account the creation of WGL, this part will be
limited to the information provided above. If the reader wants further information,
the following reference [124] is of interest.
II.3.7. Photonic lantern
Direct laser writing in glasses led also to the formation of photonic lanterns (PL)
which are used for instance for astronomy purposes. PLs consist in writing multiple
waveguides forming one multimode (MM) rectangular waveguide that gets
separated into several single mode (SM) waveguides on the exit facet of the glass,
as schematically depicted in Figure II.19.
Figure II.19: Sketch of a photonic lantern (PL) starting by a multimode
rectangular waveguide separating into several single mode waveguides. Taken
from [125].
It acts as a mode converter from MM to SM. The first PL was created by Thomson
et al. where 16 SM waveguides arranged in a two-dimensional (2D) 4x4 array, with
an inter-spacing of 50µm were brought together at the opposite facet creating one
MM waveguide in borosilicate glass (Corning Eagle) as shown in Figure II.20. As
expected, the modes of MM fiber are split into an array of SM waveguides as shown
in Figure II.20.c.

61
Figure II.20: Side view bright field photos of the (a) 4x4 single mode
waveguides (b) rectangular multimode waveguide. Output mode images of (c)
the 4x4 single mode waveguides following the injection in the rectangular
multimode waveguide (d) rectangular waveguide mode following the injection of
light in the 4x4 single mode array waveguides. Taken from [125].
Later on, the creation of PLs in Corning Eagle 2000 glass was demonstrated for
astronomical uses operating at 1.55 µm wavelength [126]. Eventually, this work
led to the creation of Modular Photonics a company selling glass based micro-chips
(processed by direct laser writing) used for mode-selective applications [127].
This section has presented a general review of the optical components written in
different types of glasses using the DLW technique. The following section will
emphasize the DLW process in phosphate based glasses.
II.3.8. Study of phosphate glasses
Since the 1990s, a considerable amount of research has focussed on phosphate
glasses. Phosphate glasses exhibit many advantages compared to silica glasses.
Those advantages are represented by the capacity of the host matrix to accept a
high quantity of rare earth and metals, in particular silver [128]. However,
phosphate glasses have a low resistance to water corrosion, due to the
pentavalence of the phosphorus atom. The introduction of an oxide modifier was
necessary in order to reduce the corrosion of these glasses to water. In particular,
the introduction of zinc oxide (ZnO) into phosphate glasses has been reported to
greatly improve chemical stability [129], thus the reason for using zinc phosphate
glasses. In the mid 1990s, a patent was registered by Corning for the first
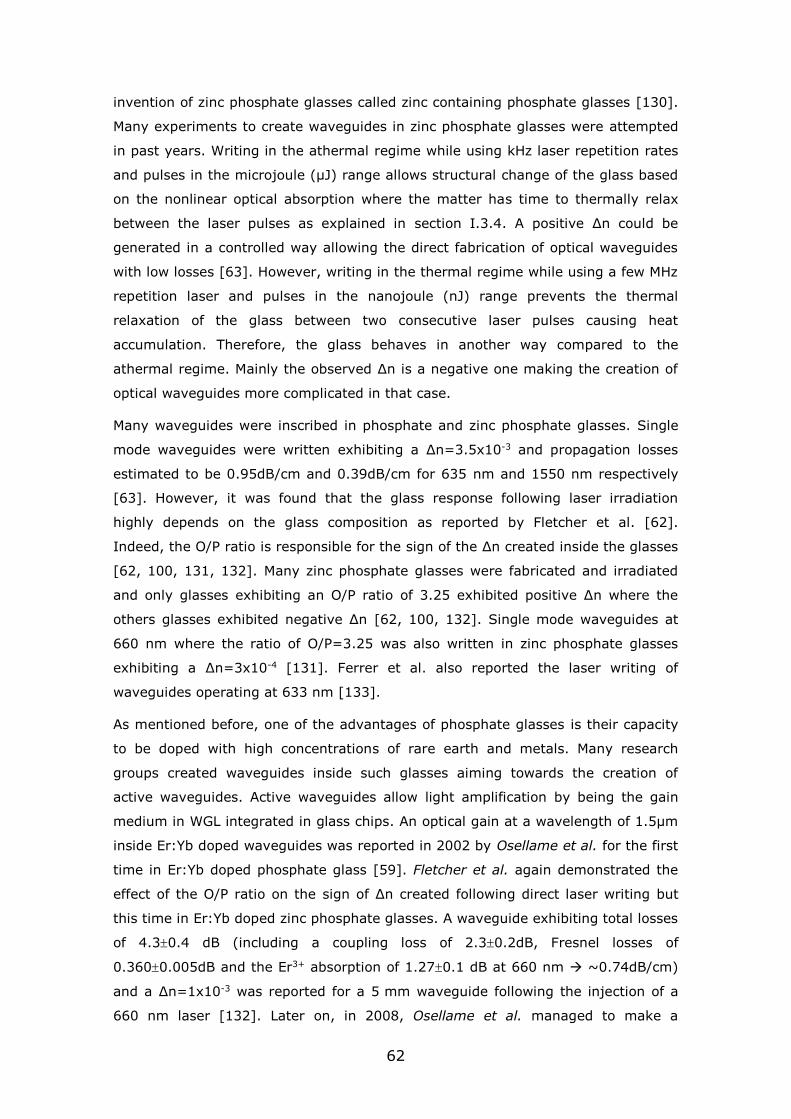
62
invention of zinc phosphate glasses called zinc containing phosphate glasses [130].
Many experiments to create waveguides in zinc phosphate glasses were attempted
in past years. Writing in the athermal regime while using kHz laser repetition rates
and pulses in the microjoule (µJ) range allows structural change of the glass based
on the nonlinear optical absorption where the matter has time to thermally relax
between the laser pulses as explained in section I.3.4. A positive ∆n could be
generated in a controlled way allowing the direct fabrication of optical waveguides
with low losses [63]. However, writing in the thermal regime while using a few MHz
repetition laser and pulses in the nanojoule (nJ) range prevents the thermal
relaxation of the glass between two consecutive laser pulses causing heat
accumulation. Therefore, the glass behaves in another way compared to the
athermal regime. Mainly the observed ∆n is a negative one making the creation of
optical waveguides more complicated in that case.
Many waveguides were inscribed in phosphate and zinc phosphate glasses. Single
mode waveguides were written exhibiting a ∆n=3.5x10⁻³ and propagation losses
estimated to be 0.95dB/cm and 0.39dB/cm for 635 nm and 1550 nm respectively
[63]. However, it was found that the glass response following laser irradiation
highly depends on the glass composition as reported by Fletcher et al. [62].
Indeed, the O/P ratio is responsible for the sign of the ∆n created inside the glasses
[62, 100, 131, 132]. Many zinc phosphate glasses were fabricated and irradiated
and only glasses exhibiting an O/P ratio of 3.25 exhibited positive ∆n where the
others glasses exhibited negative ∆n [62, 100, 132]. Single mode waveguides at
660 nm where the ratio of O/P=3.25 was also written in zinc phosphate glasses
exhibiting a ∆n=3x10⁻⁴ [131]. Ferrer et al. also reported the laser writing of
waveguides operating at 633 nm [133].
As mentioned before, one of the advantages of phosphate glasses is their capacity
to be doped with high concentrations of rare earth and metals. Many research
groups created waveguides inside such glasses aiming towards the creation of
active waveguides. Active waveguides allow light amplification by being the gain
medium in WGL integrated in glass chips. An optical gain at a wavelength of 1.5µm
inside Er:Yb doped waveguides was reported in 2002 by Osellame et al. for the first
time in Er:Yb doped phosphate glass [59]. Fletcher et al. again demonstrated the
effect of the O/P ratio on the sign of ∆n created following direct laser writing but
this time in Er:Yb doped zinc phosphate glasses. A waveguide exhibiting total losses
of 4.30.4 dB (including a coupling loss of 2.30.2dB, Fresnel losses of
0.3600.005dB and the Er3+ absorption of 1.270.1 dB at 660 nm → ~0.74dB/cm)
and a ∆n=1x10⁻³ was reported for a 5 mm waveguide following the injection of a
660 nm laser [132]. Later on, in 2008, Osellame et al. managed to make a

63
waveguide laser (WGL) inside Er:Yb phosphate glass (QX, Kigre Inc) exhibiting a
∆n=8x10⁻³, 7 dB of gain, 0.4 dB/cm propagation losses in the C-band telecom
wavelengths (1530-1565 nm) [134]. In 2012, Fletcher also reported 1dB/cm gain
at 1534 nm in a waveguide written inside Er-Yb co-doped zinc phosphate glass with
a ∆n=3x10⁻³.
II.4. Silver containing zinc phosphate glasses
The glasses used in this project are silver containing zinc phosphate glasses
exhibiting different silver concentrations. These glasses were developed and
optimized during many years of research at ICMCB and the laser writing process
took place in the SLAM group at CELIA. The detailed composition of the glasses is
shown in Table II-1.
However, some experiments were conducted using Argolight glasses AG01
Argolight is a start-up company that was created by Arnaud Royon and Gauthier
Papon who were working on the development and irradiation of silver containing
zinc phosphate glasses at ICMCB and in the SLAM group. Currently, they sell
microscope slides irradiated by femtosecond laser allowing the calibration of
fluorescent microscopes in terms of resolution, fluorescence collection and spectral
response.
Table II-1: Table summarizing the theoretical molar composition and the properties
of the different zinc phosphate glasses used in this work. Taken from [135].
Sample Name [P]
(%mol.)
[Zn]
(%mol.)
[Ga]
(%mol.)
[Ag]
(%mol.)
Tg
(5°C)
O/P
PZnGa5.5 PZn 56 38.5 5.5 0 435
3.58
PZnGa5.5:Ag5.5 PZnAg1 52.7 36.3 5.5 5.5 396 3.275
PZnGa5.4:Ag8 PZnAg2 51.3 35.3 5.4 8 381
3.37

64
Based on the previous results on the zinc phosphate glasses as mentioned in the
previous section II.3.8, the first silver containing zinc phosphate glass was a
40P2O5-55ZnO-5Ag2O exhibiting an O/P ratio of 3.25. However, it was found that
this composition was not stable for long terms and exhibited crystallization after
around 65 months [11]. So, it was necessary to add an additional compound to
stabilize the glass matrix. Therefore the choice fell on gallium oxide Ga2O3, a glass
former used in order to stabilize the glass matrix. Furthermore, one should mention
that the introduction of ZnO and Ga2O3 did not interfere or modify the absorption
bands of the glass. Both ZnO and Ga2O3 absorption bands neither overlap with the
silver nor tend to promote the reduction of the silver ions inside the glass [11]. So,
silver containing zinc phosphate glasses are zinc phosphate glasses where silver
was introduced into the glass network in the form of silver ions Ag+.
II.4.1. Optical properties
To study the optical properties, the absorption spectrum in the UV range was
monitored in non-containing silver glasses and silver containing glasses with
different silver concentrations. The O/P ratio was roughly the same while the silver
concentration was changed. The non-containing silver glass starts exhibiting an
absorption around 230 nm, which is attributed to the presence of defects and
impurities in small quantities in the glass [11]. However, for the silver containing
glasses, the absorption band is remarkably higher and shifted towards the higher
wavelengths i.e. lower energy levels. The higher the concentration of silver the
more the absorption band is shifted as shown in Figure II.21. The following results
imply that the incorporation of silver in the glass influences the absorption band of
the glass by shifting it to higher wavelengths. This is a typical property of the silver
ions integrated into the glass matrix. So, the bandgap of the glass is shifted to
lower energy levels (higher wavelengths as shown in Figure II.21) implying that the
silver ions enhance the photosensitivity of the glass.

65
Figure II.21: Absorption coefficient as a function of the wavelength for zinc
phosphate glass and silver containing zinc phosphate glasses with different silver
concentrations. The silver containing glasses exhibit a higher absorption band
and are shifted to higher wavelengths compared to non-containing zinc
phosphate glass. Adapted from [11].
Overall, silver containing zinc phosphate glasses exhibit a good transparency
window from the visible range to the mid IR as shown in Figure II.22 allowing
applications in a good range of wavelengths.
Figure II.22: Absorption as a function of the wavelength for the PZnAg2 sample
from UV to IR. A good transparency window is observed between 380 nm and
2700 nm.

66
II.4.2. Laser-silver containing glasses interaction
The interaction between a laser and silver containing glasses exhibits an exotic
response that totally differs from the standard laser-glass interaction in the
literature. Following laser irradiation, photo-induced silver clusters Agmx+ are
generated in the vicinity of the interaction voxel. This is based on a non-linear
absorption mechanism, a pulse-to-pulse process by heat accumulation which
results in the aggregation of silver atomic and ionic species. The formation of the
photo-induced clusters could be explained by the following: after laser-glass
interaction a reservoir of free-electrons is generated from the multiphoton process
enabling the reduction of Ag+ silver ions pre-existing in the glass into Ag0 atomic
states, which then aggregate with silver ions in order to form Ag2+. Based on a
chain reaction, larger silver clusters Agmx+ are formed from Ag+, Ag0 and Ag2+ inside
the glass matrix [44, 136], as schematically presented in Figure II.23. The
transverse Gaussian beam profile induces the photo dissociation of the silver
clusters in the centre region where the irradiance is higher [136].
Figure II.23: Schematic presentation of the formation of silver clusters in silver
containing glasses following laser irradiation.
The photo-induced silver clusters Agmx+ generally exhibit two main absorption
bands around 290 nm and 345 nm [136-139] affiliated to the creation of 𝐴𝑔𝛼(1) and
𝐴𝑔𝛼(2) clusters respectively [139] resulting in a broad brand fluorescence response
under UV-Blue excitation as shown in Figure II.24. 𝐴𝑔𝛼(1) and 𝐴𝑔𝛼(2) could be the
dominating clusters exhibiting the two dominating absorption bands. Also other
types of clusters are generated following DLW that were identified in a previous
report from our group [139] and presented in Table II-2.

67
Figure II.24: Absorption (black) of the photo-induced silver clusters following laser
irradiation exhibiting two main absorption bands around 290 and 345 nm.
Fluorescence emission (orange) under blue light excitation at 405 nm.
Table II-2: Different silver (Ag) species identified following DLW in silver containing
glasses as reported in [139].
Ag specie Peak absorption [nm]
Agα(1) 287±2
Ag2+ 302±3
Agα(2) 340±2
Ag0 387±4
Agn 442±1
Normally, the laser used for writing in such glasses is a high repetition laser,
around 10 MHz emitting femtosecond pulses at 1030 nm wavelength. However, the
glass is transparent at a wavelength of 1030 nm, as is shown in Figure II.22. Using
a femtosecond laser induces non-linear effects i.e. four-photon absorption process
in this case. This process was already explained in detail in section I.3.3.a. In
addition to that, thanks to the non-linear process, structures below the diffraction

68
limit could be created inside silver containing glasses, as it has been reported
earlier by our group [136].
Static direct laser writing of silver containing glasses, i.e. laser fixed and sample
fixed, results in the creation of 3D fluorescent (due to the silver cluster formation)
structures exhibiting dimensions below the diffraction limit [136]. In order to have
a better idea of the morphology of such structures, they were visualized using a
fluorescence confocal microscope to resolve the structures as shown in Figure II.25.
The confocal fluorescence images of the top view of the structures reveal a ring
shape of fluorescence [136]. The fluorescence is attributed to the distribution of
silver clusters; therefore, the clusters are distributed around the interaction voxel.
The ring shape is due to the photo dissociation of the silver clusters created in the
middle thanks to the transversal Gaussian profile of the laser beam (Figure II.25.b-
d). The side view photo exhibits two fluorescent lines arranged into a pipe shape
corresponding more or less to the Rayleigh range (Figure II.25.c-e) [44].
Eventually, one can say that the structures’ morphology is dictated by the laser
beam profile.
Figure II.25: (a) Sketch of the morphology of the structures following static direct
laser writing (DLW) (b) confocal fluorescence images under UV excitation
(exc=405nm) of top view (xy) plane, ring shape (c) side view (xz) plane, two
fluorescent lines in a pipe shape [136]. Schematic presentation of the writing
process for (d) top view (xy) plane, photodissociation of the clusters in the middle
(e) side view (xz) plane.

69
II.4.2.a. Physical processes associated to the formation of silver clusters
To better understand the laser-glass interaction and the spatial distribution
morphology of the silver clusters, a theoretical model [140] was presented by our
group (with the collaboration of other colleagues in CELIA and IMS) explaining the
different physical mechanisms involved in the formation of silver clusters. The
model takes into account the different non-linear photoionization processes, laser
energy deposition followed by laser heating of the sample, diffusion ions, kinetic
reactions and photo dissociation of metallic species [140]. The different physical
mechanisms responsible for the formation of silver clusters (taken from[140]) are
presented briefly herein. However for more details, the reader is referred to
reference [140]. One should note that all the physical parameters for the modelling
have been previously measured by our group and some data were taken from
handbooks. All parameters could be found in reference [140]. First, a reservoir of
free electrons is generated during the laser pulse: yellow circle that corresponds to
the radial distribution of the free electrons as shown in Figure II.26. In the green
region in Figure II.26.a, the formation of silver atoms Ag0 starts to take place
(Ag++e-→ Ag0) where the concentration of free electrons is at its peak. During the
formation of Ag0, holes are trapped by silver ions Ag+: h++Ag+ →Ag2+ and the
product is assumed not to be mobile. In fact, Ag2+ should be considered as a hole
trapped in proximity of a silver ion Ag+ instead of a doubly ionized silver ion. Thus,
the mobility of such pair is negligible compared to the mobility of silver ions Ag+,
due to its delocalization around the phosphate chains that form the glass network.
The reaction e-+Ag++→ Ag0 ends when the concentration of electrons vanishes. At
that moment, the spatial distribution of Ag0 corresponds to the slightly diffused
distribution of pre-existing free electrons (green circle, Figure II.26.b). The
absorption of the laser pulse induces and increases the temperature in the region
resulting in thermal diffusion (Blue arrows, Figure II.26.b). The diffusion of Ag0
(green arrows, Figure II.26.b) is highly activated by the temperature which allows
these species to meet with Ag+ ions and take a part in the following kinetic
reaction: Ag0 + Ag+ → Ag2+. The red circle (Figure II.26.b) reproduces the
beginning of the reaction in the area of maximal concentration of Ag0. The reaction
of the first stage of silver cluster formation Ag0 + Ag+→ Ag2
+ ends when the
concentration of silver atoms Ag0 wears off. So, the spatial distribution of Ag2+
corresponds slightly to the spatial distribution of pre-existing Ag0 (red circle, Figure
II.26.c). The trapping process and reactions are so fast that the concentration of
free electrons, holes and Ag0 wears off before the next laser pulse. The following
laser pulse destroys the silver clusters in the center by photo-dissociations where
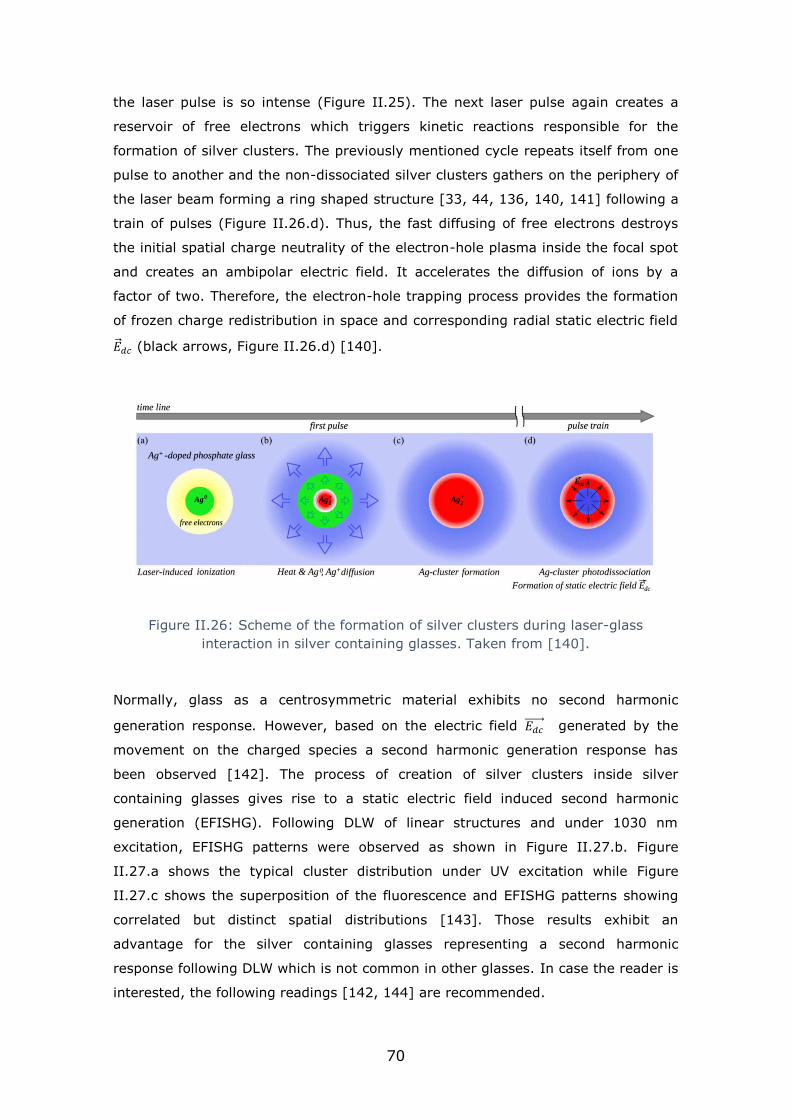
70
the laser pulse is so intense (Figure II.25). The next laser pulse again creates a
reservoir of free electrons which triggers kinetic reactions responsible for the
formation of silver clusters. The previously mentioned cycle repeats itself from one
pulse to another and the non-dissociated silver clusters gathers on the periphery of
the laser beam forming a ring shaped structure [33, 44, 136, 140, 141] following a
train of pulses (Figure II.26.d). Thus, the fast diffusing of free electrons destroys
the initial spatial charge neutrality of the electron-hole plasma inside the focal spot
and creates an ambipolar electric field. It accelerates the diffusion of ions by a
factor of two. Therefore, the electron-hole trapping process provides the formation
of frozen charge redistribution in space and corresponding radial static electric field
�⃗� 𝑑𝑐 (black arrows, Figure II.26.d) [140].
Figure II.26: Scheme of the formation of silver clusters during laser-glass
interaction in silver containing glasses. Taken from [140].
Normally, glass as a centrosymmetric material exhibits no second harmonic
generation response. However, based on the electric field 𝐸𝑑𝑐⃗⃗ ⃗⃗ ⃗⃗ generated by the
movement on the charged species a second harmonic generation response has
been observed [142]. The process of creation of silver clusters inside silver
containing glasses gives rise to a static electric field induced second harmonic
generation (EFISHG). Following DLW of linear structures and under 1030 nm
excitation, EFISHG patterns were observed as shown in Figure II.27.b. Figure
II.27.a shows the typical cluster distribution under UV excitation while Figure
II.27.c shows the superposition of the fluorescence and EFISHG patterns showing
correlated but distinct spatial distributions [143]. Those results exhibit an
advantage for the silver containing glasses representing a second harmonic
response following DLW which is not common in other glasses. In case the reader is
interested, the following readings [142, 144] are recommended.

71
Figure II.27: (a) Fluorescence pattern of a written line under 405 nm excitation;
(b) four-line of electric field induced second harmonic generation (EFISHG) under
1030 nm femtosecond laser excitation (c) superposition of the fluorescence and
EFISHG correlated patterns under 405 nm and 1030 nm excitation. Taken from
[143].
II.4.3. Writing window in silver containing glasses
Earlier, it was mentioned that the laser irradiation process in silver containing
glasses occurs with a femtosecond laser, high repetition rate and at a wavelength
of 1030 nm. A study was performed during the past years by previous colleagues
about the evolution of the fluorescence intensity i.e. the creation of silver clusters
as a function of the laser irradiance, number of deposited pulses and the repetition
rate [11]. The laser irradiance is given by (I-23) in Chapter I and is related to the
pulse energy. The study consisted in irradiating the glass with different laser
irradiances for different laser repetition rates and monitoring the fluorescence
intensity emitted by the structures under 405 nm excitation while collecting emitted
fluorescence in a spectral range between 450 and 750 nm [11]. The results are
presented in Figure II.28 in color scale: the lowest fluorescence intensity is
represented in white, the highest in black and the intermediate intensities are
exhibited in gradient red. The highest fluorescence intensity was observed at the
highest irradiance possible at 11TW.cm-2 below the explosion threshold and for a
number of pulses of 107.
Two conclusions could be derived from this study. In order to create silver clusters,
a huge number of pulses is required as well as the right laser irradiance. The
fluorescence intensity depends linearly on the irradiance while depending
logarithmically on the number of pulses [44]. The second conclusion implies that a
high repetition rate laser is required in order to activate and create the silver
clusters. When using a low repetition rate laser, the creation of silver clusters is

72
possible but requires a longer time of exposure which limits the writing process. A
minimum number of pulses is required in order to trigger the thermal process for
silver cluster creation.
Figure II.28: Fluorescence intensity as a function of the laser irradiance and
number of pulses for different laser repetition rates (a) 10MHz (b) 1MHz (c)
100kHz (d) 10kHz. Taken from [11].
II.4.4. Review of previous works on silver containing glasses
Few works were reported on direct laser writing inside silver containing zinc
phosphate glasses. This is because the glass has been developed by the Institute of
Chemistry of Condensed Matter of Bordeaux (ICMCB) since 2009, even though
some research groups have reported some works on similar glasses. One should
mention that silver doped glass is different from silver containing glasses. When
talking about doping a material, the highest quantity is 2% mol of the main
composition, once this limit is exceeded one can start talking about “silver
containing” glasses.
In 2013 a Chinese group reported the creation of silver nanoparticles (NPs)
following DLW using a 250 kHz repetition rate laser emitting at a wavelength of
800 nm using a writing speed of 150 µm/s. The glass was silver doped phosphate

73
with the following composition: 12Al2O3 -10Na2O-70P2O5-0.5Ag2O [145]. In 2015, a
Russian research group reported the creation of color centres and luminescent
silver NPs inside 0.55Ag2O-0.45P2O5 and 0.5Ag2O-0.1Nb2O5-0.4P2O5 using a
250 kHz repetition laser emitting at 800 nm using a writing speed of 2.5 µm/s
[146]. In 2016, P. Kazansky in collaboration with a Russian research group using a
glass (40P2O5-55ZnO-4Ag2O-1Ga2O3) similar to the one used in this project
reported the creation of luminescent silver NPs and birefringent micro-regions
paving the way towards 6D information encoding following DLW [147]. The laser
used was a 100kHz repetition rate emitting at a wavelength of 1030 nm [147]. In
2017, the same Russian research group reported the creation of ring shaped
fluorescent silver clusters and silver NPs simultaneously in silver containing glasses
in a single process for the first time [148]. The glass used was a 55ZnO-41P2O5-
4Ag2O while the laser was the same as in the previous reported work [147]. Herein,
we report that silver clusters and NPs were created inside silver containing zinc
phosphate glasses with one process during this project as shown in Figure II.29.
However, those results were not interesting for this framework given that the aim is
towards the creation of optical components. Therefore no results or investigations
were conducted concerning this matter.

74
Figure II.29: Top view under white light illumination for different lines written using
a 250 kHz laser emitting at 1030 nm with a fixed pulse energy of 0.26 µJ for three
different speeds from the left to the right: 10 mm/s-5 mm/s-1 mm/s. To be
compared with figure 4 in [148].
II.5. Experimental setup: Glass and laser used
II.5.1. Glass synthesis and fiber drawing
As mentioned before, three different silver containing glasses were used during this
project. The silver concentration change for the glasses were provided by ICMCB
while Argolight provided a slightly different glass composition. During the up-
coming work two silver containing zinc phosphate bulk glasses PZnAg1 and PZnAg2
provided by ICMCB were used (Table II-1). The glasses were elaborated from a mix
of powders Zn(PO3)2, ZnO, Ga2O3 and Ag(NO3). Both of the previously mentioned
glasses were made by the same technique. A glass sample was made using a melt-
quenching technique, as mentioned in section I.2.4.a. A platinum crucible
containing the powders was heated at 1200°C during 12h. The sample was
quenched, ground and melted twice with the intention of improving the chemical
homogeneity of the glass and limiting the local refraction index variations in order

75
to get the best optical quality. Afterwards the samples were annealed at 40°C
below the glass transition (~Tg=380°C) for 4h to relax the accumulated mechanical
constraints. Then the sample was cut in a parallel-piped shape and polished to
allow DLW. Furthermore, following DLW, the side facets were cut and polished
again in order to reveal the waveguides at the surface, to allow the laser injection
and the visualization of the guided mode profile. A non-silver containing zinc
phosphate glass (PZn) was also synthetized by the same method where the silver
was replaced by Ga2O3.
As mentioned before, silver containing zinc phosphate glasses exhibit a good
transparency window from the visible up to around 2.7 µm (Figure II.22). The
change in silver concentrations does not highly affect the transparency window for
this glass in the visible and NIR ranges. So, one could consider that the three
glasses exhibit more or less the same optical properties.
II.5.2. Silver containing zinc phosphate glass fibers
In addition to that, silver containing zinc phosphate glasses were shaped into fibers
by our colleague S.Danto at ICMCB [149]. It is a joint project with Professor
Smektala at ICB in Dijon, France. Aiming towards sensing applications and
integrated optical components, shaping glasses into fibers is an important point.
several sensors nowadays are fiber-optic based. In order to shape the glass into
fibers, it all starts by making a preform that will be shaped into fibers. The glass
preform in this case is a few centimetres thick and around 10 cm long, which is
enough to create roughly 10 meters of optical fiber. The critical point while shaping
glasses into fibers is to preserve the same characteristics of the bulk glass, trying
to avoid any aggregation and crystallization of the glass during the fiber drawing
process. In order to draw fibers, the preform composition used was 40P2O5-55ZnO-
1Ga2O3-2Na2O-2Ag2O. The introduction of sodium (Na) in the glass composition
was for poling purposes that are not addressed in this manuscript. The glass was
synthetized the same way as the previously mentioned bulk glass. However, to
shape the preform, the glass was casted in a specifically designed brass mold, pre-
heated at ~Tg-10 °C and annealed at Tg-40 °C for 12 hours. As first demonstrated,
two glasses were drawn where one of them did not exhibit any silver integration.
The idea aims to highlight the luminescence properties of the silver containing
glass. Both preforms are shown in Figure II.30.a. The preform with no silver shows
no luminescence under UV excitation at 𝜆=260nm [149]. The silver containing zinc
phosphate glasses exhibit an absorption band at 𝜆=245nm due to the presence of

76
silver ions Ag+ resulting in fluorescence mainly around 𝜆=368nm. This fluorescence
emission has been attributed to the d10↔d9s1 transition of Ag+ ions homogenously
dispersed throughout the glass matrix [150]. Thermal drawing was performed
using a dedicated 3-meter-high optical fiber draw tower composed of an annular
electrical furnace with a sharp temperature profile, a diameter monitor, a tension
dancer and a collecting drum. The preform was slowly fed into the furnace and the
temperature was gradually increased up to ~700°C under continuous oxygen gas
flow (3l.min-1). The preform holder motion and capstan rotation velocity were
controlled in real-time to produce the targeted fiber diameter.
Figure II.30: Zinc phosphate glass under UV excitation (a) non-containing (PZG-
4N) and silver containing (PZG-2N2A) preforms. PZG-2N2A only exhibiting
fluorescence emission; (b) fibers and a leftover of a preform. Taken from [149].
Figure II.30.b shows the rest of the drawn preform, capillaries and fiber under UV
excitation. At first impression, the homogenous macroscopic luminescence under
UV excitation is correlated to the homogeneous distribution of silver ions Ag+ in the
preform, capillaries and fiber. The comparison of the fluorescence properties of the
fiber and the bulk glass implies that the fluorescence emission is fully preserved at
the microscopic level also as shown in Figure II.31. This refers to the successful
drawing process where neither clustering nor reduction of the Ag+ occurred.

77
Figure II.31: Comparison between bulk glass and fiber fluorescence emission
properties (exc=245nm). A good match is found indicating that the drawing
process preserved the glass properties. Taken from [149].
Focusing a laser beam on the cylindrical geometry of the fiber generates strong
astigmatism and spherical aberrations, which complicates the process of
femtosecond laser writing. To avoid such problems, usually an oil immersion
objective is used as previously reported [151]. In order to bypass such
complications, the new fibers were shaped into flat fibers or alternatively called
“ribbon” fibers. Having a flat surface facilitates the manipulation and eases the
direct laser writing process.
In this case, the preform is a rectangular one instead of a cylindrical one. To
accomplish this, a glass slab is grinded and optically polished to proper dimensions
then drawn into rectangular fibers as shown in Figure II.32 [149]. If the reader is
interested in further details, the work of Danto et al [149] is recommended.
Ribbon/flat fibers were drawn with diameters ranging from 250 µm down to 75 µm
with a rectangular cross section as shown in Figure II.32.b. One can imagine the
flat fiber as a cladding, and using DLW, many cores or optical components could be
written in such fibers.
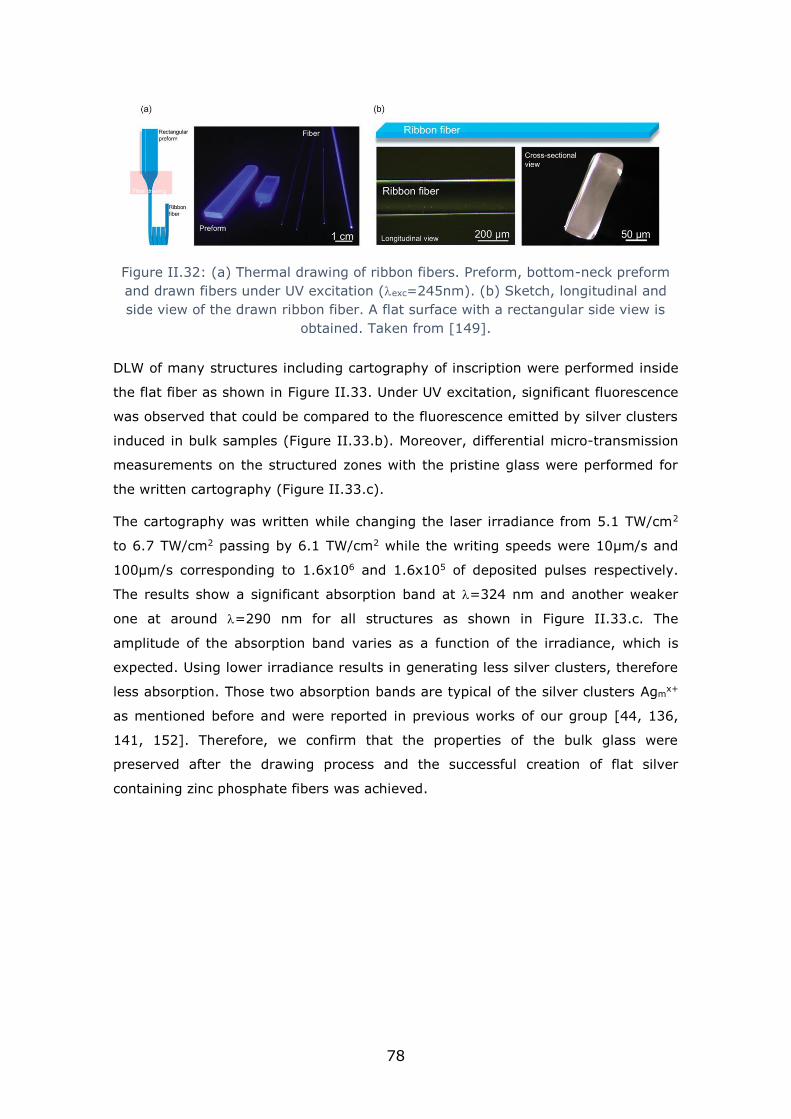
78
Figure II.32: (a) Thermal drawing of ribbon fibers. Preform, bottom-neck preform
and drawn fibers under UV excitation (exc=245nm). (b) Sketch, longitudinal and
side view of the drawn ribbon fiber. A flat surface with a rectangular side view is
obtained. Taken from [149].
DLW of many structures including cartography of inscription were performed inside
the flat fiber as shown in Figure II.33. Under UV excitation, significant fluorescence
was observed that could be compared to the fluorescence emitted by silver clusters
induced in bulk samples (Figure II.33.b). Moreover, differential micro-transmission
measurements on the structured zones with the pristine glass were performed for
the written cartography (Figure II.33.c).
The cartography was written while changing the laser irradiance from 5.1 TW/cm2
to 6.7 TW/cm2 passing by 6.1 TW/cm2 while the writing speeds were 10µm/s and
100µm/s corresponding to 1.6x10⁶ and 1.6x10⁵ of deposited pulses respectively.
The results show a significant absorption band at =324 nm and another weaker
one at around =290 nm for all structures as shown in Figure II.33.c. The
amplitude of the absorption band varies as a function of the irradiance, which is
expected. Using lower irradiance results in generating less silver clusters, therefore
less absorption. Those two absorption bands are typical of the silver clusters Agmx+
as mentioned before and were reported in previous works of our group [44, 136,
141, 152]. Therefore, we confirm that the properties of the bulk glass were
preserved after the drawing process and the successful creation of flat silver
containing zinc phosphate fibers was achieved.

79
Figure II.33: Top view of the ribbon fiber (a) under white illumination before DLW
(b) under UV excitation (exc=405 nm) following DLW. The fluorescence of the
written structures could be observed. (b) Fluorescence intensity broad band
emission of the structures under UV excitation (exc=405 nm). (c) Fluorescence of
the written cartography and the corresponding differential transmission spectra.
A higher absorption band is observed for a higher laser irradiance. Taken from
[149].
II.5.3. Laser setup:
The laser used for performing DLW in this chapter is a Yb:KGW femtosecond
oscillator (T-pulse 200 by Amplitude systems). A schematic of the setup is
presented in Figure II.34. It operates at a wavelength of 1030 nm, pulse duration
of 390 fs, a repetition rate of 9.8 MHz and an average power of 2.6 W. The laser
irradiance deposited in the glass sample was controlled using an acousto-optic
modulator enabling the accumulation of N=105-106 pulses with energies between
20 nJ and 120 nJ. A reflection type SLM is placed after the AOM in order to spatially
shape the beam if needed before irradiating the glass sample. In this project, the
SLM is used only as a convergence lens in order to compensate for the different
focal planes and to compensate the spherical aberrations that occur when using
high NA objectives [153] (the most dominant aberrations in this case given that
they are proportional to NA4) that occur when focusing the laser beam using a
microscope objective. Generally, the microscope objective used in this case is
adapted for laser focalisation under a microscope cover slide of ~170 µm with a

80
refractive index (RI) of ~1.5. Given that our glass exhibits an RI~1.6, aberrations
occur due to the refractive index mismatch. In the following work, two microscope
objectives were used: 20x-0.4NA Mitutoyo, APO PLAN NIR and 20x-0.75NA Carl
Zeiss. At the top, a CCD camera is placed in order to visualize the glass surface and
the writing process. Bottom white and blue illuminations at 405 nm are applied.
White light is used to visualize and find the surface of the glass while the blue
illumination serves to monitor and visualize the fluorescence of the silver cluster
created during DLW. A 405 nm high pass filter is placed before the CCD in order to
cut the blue diode at 405 nm allowing the observation of the fluorescence of silver
clusters.
Figure II.34: Schematic of the laser setup used for direct laser writing.
II.5.4. Mode profile setup:
After performing DLW of waveguides, the sample was placed on the mode profile
setup in order to characterize the waveguides. The mode profile setup consisted of
a red diode operating at 630 nm that could be injected inside the waveguides using
optical fibers. In this case a single mode HP460 fiber (core diameter 2.5 µm-

81
NA=0.13) at 630 nm was used to inject light inside the guiding structures
(waveguides, beam splitter). Then, a 100x-0,55NA Mitutoyo objective was used on
the output facet to visualize the guide mode profile and conjugate it on a CCD
camera. Moreover, when needed, the CCD camera was replaced by a power meter
to measure the transmission losses of our waveguides. The injection fiber, the
sample as well as the collecting objective were placed on separated 3 axis stages.
II.5.5. Confocal Microscope:
The photo-induced structures in silver containing glasses are sub-diffraction limited
structures, therefore, imaging them using a conventional microscope is not
convenient. Because they exhibit significant fluorescence intensity under UV-Blue
range excitation, they are visualized using a fluorescence confocal microscope to be
able to resolve them. Confocal microscopes exhibit many advantages compared to
standard ones, higher resolution (up to 300 nm), imaging planes separately and
the possibility of reconstructing a 3D image/video of the structures. If the reader is
interested, further details can be found in reference [154].
The fluorescent images were obtained using an Olympus FLUOVIEW FV1200
confocal microscope. An oil immersion objective of 60x – 1.3 NA was used to
resolve the structures. Excitation wavelength was at 480 nm while the emission
wavelength ranged between 500 nm and 600 nm.
II.5.6. Measuring ∆n: SID4Bio Phasics
To better characterize the written waveguides and optical components in glasses,
the ∆n is a crucial parameter to especially know with respect to its sign and
amplitude. During this project, the SID4Bio wave front sensor by PHASICS was
used to measure and characterize the ∆n of the written structures. It provides
quantitative phase imaging of the waveguides. The sensor could be placed on any
microscope operating in transmission mode. The sample where the structures are
written inside is placed on the microscope and is imaged using incoherent light i.e.
white light. The sensor is based on a CCD camera with a modified Hartmann Mask
placed in front. The incident incoherent light beam is diffracted by the mask into
four replicas to create an interferogram on the CCD as shown in Figure II.35.

82
Figure II.35: Sketch of the SID4Bio wavefront sensor working principle. The
incident beam is diffracted by the modified Hartmann Mask into four replicas
making an interferogram on the sensor (CCD Camera) [155].
The phase is encoded in the interference fringe deformation. Following that, Fourier
transforms allow the extraction of the intensity and phase image [156, 157]. In an
easier way, the light passing through an object with different refractive index
change is delayed and creates a difference in the optical path as shown in Figure
II.36.
Figure II.36: Sketch of the light delayed by a refractive index object (n2) with a
specific thickness “e” different than the surrounding medium (n1) leading to the
construction of the phase image. The optical thickness i.e. optical path difference
could be obtained [155].
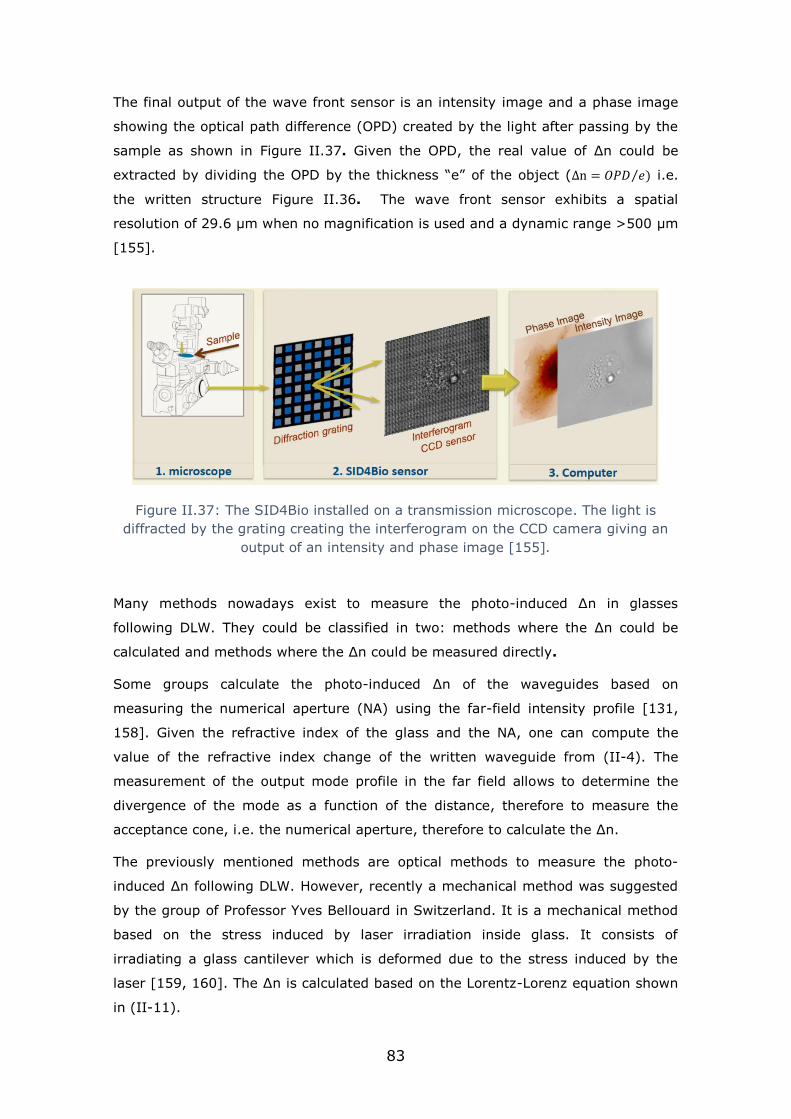
83
The final output of the wave front sensor is an intensity image and a phase image
showing the optical path difference (OPD) created by the light after passing by the
sample as shown in Figure II.37. Given the OPD, the real value of ∆n could be
extracted by dividing the OPD by the thickness “e” of the object (∆n = 𝑂𝑃𝐷 𝑒⁄ ) i.e.
the written structure Figure II.36. The wave front sensor exhibits a spatial
resolution of 29.6 µm when no magnification is used and a dynamic range >500 µm
[155].
Figure II.37: The SID4Bio installed on a transmission microscope. The light is
diffracted by the grating creating the interferogram on the CCD camera giving an
output of an intensity and phase image [155].
Many methods nowadays exist to measure the photo-induced ∆n in glasses
following DLW. They could be classified in two: methods where the ∆n could be
calculated and methods where the ∆n could be measured directly.
Some groups calculate the photo-induced ∆n of the waveguides based on
measuring the numerical aperture (NA) using the far-field intensity profile [131,
158]. Given the refractive index of the glass and the NA, one can compute the
value of the refractive index change of the written waveguide from (II-4). The
measurement of the output mode profile in the far field allows to determine the
divergence of the mode as a function of the distance, therefore to measure the
acceptance cone, i.e. the numerical aperture, therefore to calculate the ∆n.
The previously mentioned methods are optical methods to measure the photo-
induced ∆n following DLW. However, recently a mechanical method was suggested
by the group of Professor Yves Bellouard in Switzerland. It is a mechanical method
based on the stress induced by laser irradiation inside glass. It consists of
irradiating a glass cantilever which is deformed due to the stress induced by the
laser [159, 160]. The ∆n is calculated based on the Lorentz-Lorenz equation shown
in (II-11).
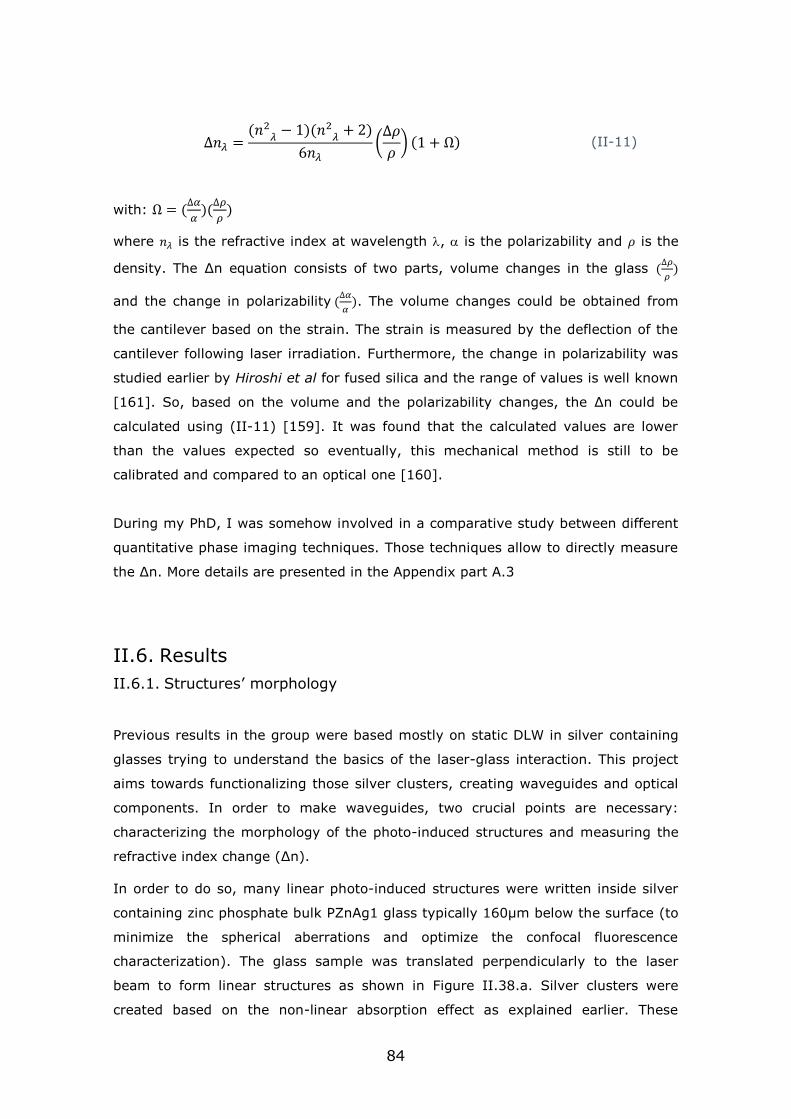
84
∆𝑛𝜆 =(𝑛2
𝜆− 1)(𝑛2
𝜆+ 2)
6𝑛𝜆(∆𝜌
𝜌) (1 + Ω) (II-11)
with: Ω = (∆𝛼
𝛼)(
∆𝜌
𝜌)
where 𝑛𝜆 is the refractive index at wavelength , is the polarizability and 𝜌 is the
density. The ∆n equation consists of two parts, volume changes in the glass (∆𝜌
𝜌)
and the change in polarizability (∆𝛼
𝛼). The volume changes could be obtained from
the cantilever based on the strain. The strain is measured by the deflection of the
cantilever following laser irradiation. Furthermore, the change in polarizability was
studied earlier by Hiroshi et al for fused silica and the range of values is well known
[161]. So, based on the volume and the polarizability changes, the ∆n could be
calculated using (II-11) [159]. It was found that the calculated values are lower
than the values expected so eventually, this mechanical method is still to be
calibrated and compared to an optical one [160].
During my PhD, I was somehow involved in a comparative study between different
quantitative phase imaging techniques. Those techniques allow to directly measure
the ∆n. More details are presented in the Appendix part A.3
II.6. Results
II.6.1. Structures’ morphology
Previous results in the group were based mostly on static DLW in silver containing
glasses trying to understand the basics of the laser-glass interaction. This project
aims towards functionalizing those silver clusters, creating waveguides and optical
components. In order to make waveguides, two crucial points are necessary:
characterizing the morphology of the photo-induced structures and measuring the
refractive index change (∆n).
In order to do so, many linear photo-induced structures were written inside silver
containing zinc phosphate bulk PZnAg1 glass typically 160µm below the surface (to
minimize the spherical aberrations and optimize the confocal fluorescence
characterization). The glass sample was translated perpendicularly to the laser
beam to form linear structures as shown in Figure II.38.a. Silver clusters were
created based on the non-linear absorption effect as explained earlier. These
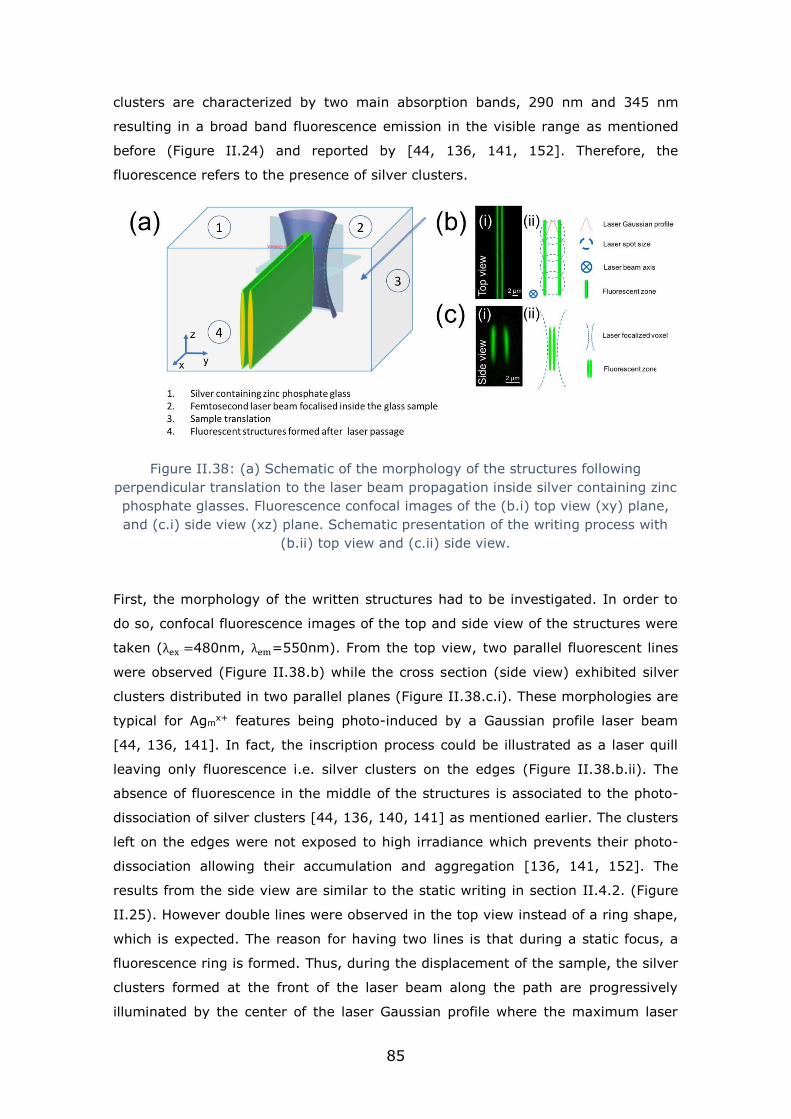
85
clusters are characterized by two main absorption bands, 290 nm and 345 nm
resulting in a broad band fluorescence emission in the visible range as mentioned
before (Figure II.24) and reported by [44, 136, 141, 152]. Therefore, the
fluorescence refers to the presence of silver clusters.
Figure II.38: (a) Schematic of the morphology of the structures following
perpendicular translation to the laser beam propagation inside silver containing zinc
phosphate glasses. Fluorescence confocal images of the (b.i) top view (xy) plane,
and (c.i) side view (xz) plane. Schematic presentation of the writing process with
(b.ii) top view and (c.ii) side view.
First, the morphology of the written structures had to be investigated. In order to
do so, confocal fluorescence images of the top and side view of the structures were
taken (λex =480nm, λem=550nm). From the top view, two parallel fluorescent lines
were observed (Figure II.38.b) while the cross section (side view) exhibited silver
clusters distributed in two parallel planes (Figure II.38.c.i). These morphologies are
typical for Agmx+ features being photo-induced by a Gaussian profile laser beam
[44, 136, 141]. In fact, the inscription process could be illustrated as a laser quill
leaving only fluorescence i.e. silver clusters on the edges (Figure II.38.b.ii). The
absence of fluorescence in the middle of the structures is associated to the photo-
dissociation of silver clusters [44, 136, 140, 141] as mentioned earlier. The clusters
left on the edges were not exposed to high irradiance which prevents their photo-
dissociation allowing their accumulation and aggregation [136, 141, 152]. The
results from the side view are similar to the static writing in section II.4.2. (Figure
II.25). However double lines were observed in the top view instead of a ring shape,
which is expected. The reason for having two lines is that during a static focus, a
fluorescence ring is formed. Thus, during the displacement of the sample, the silver
clusters formed at the front of the laser beam along the path are progressively
illuminated by the center of the laser Gaussian profile where the maximum laser

86
energy is located which dissociates the silver clusters already formed as shown in
Figure II.38.b.ii. Furthermore, the side view (zy plane, as shown in Figure
II.38.1.c) of the fluorescent structures reveals that the depth in the z plane is
typically proportional to the nonlinear Rayleigh range associated to the multi-
photon absorption [44], as shown in Figure II.38.c.ii. This indicates that the depth
of the structures can be controlled based on the microscope objective used for
DLW, i.e. controlling the dimensions of the written waveguides. Such depth can
also be ideally controlled by preparing the laser pulse profile to pre-compensate its
phase profile in a way to further minimize the resulting spherical aberrations at the
voxel, due to the refractive index mismatch between the zinc phosphate glass
(n~1.6) used here and the glass slides from which microscope objectives are
designed.
II.6.2. ∆n vs laser parameters
To investigate the ∆n created inside the glass following laser-glass interaction, a
cartography of square linear structures of 100 µm x 100 µm with an interline
spacing of 10 µm were written inside the glass typically 160µm below the surface
(to minimize the spherical aberrations and optimize the confocal fluorescence
characterization) as shown in Figure II.39.a. The irradiance as well as the wiring
speed were changed during the writing, from 6TW/cm2 to 10TW/cm2 (from 280 mW
to 470 mW average power measured after the microscope objective) while the
writing speed was varied between 10 µm/s and 50 µm/s corresponding to 1.7 x 10⁶
deposited pulses and 3.3 x 10⁵ deposited pulses respectively as shown in Figure
II.39.a. Top view fluorescent images under 480 nm excitation reveals the written
structures as shown in Figure II.39.a. The fluorescence intensity of the written
structures exhibits a variation as a function of the laser parameters which was also
previously reported by our group [44]: the higher the laser irradiance and/or the
number of pulses, the greater the resulting fluorescence intensity.
Furthermore, top view phase images were conducted using the wave front sensor
SID4bio. A pop-up of the written structure B2 of Figure II.39.a reveals a positive
optical path difference (OPD) i.e. positive ∆n correlated to the spatial distribution of
the silver cluster as shown in Figure II.39.b (to be compared with Figure II.39.a).
Based on the phase contrast images and given the depth of the structures, the
qualitative value of ∆n of the written structures could be ascertained. Figure II.39.c
shows the ∆n profile determined from the phase image in Figure II.39.b. One can
observe that every laser passage results in two positive ∆n peaks correlated to the
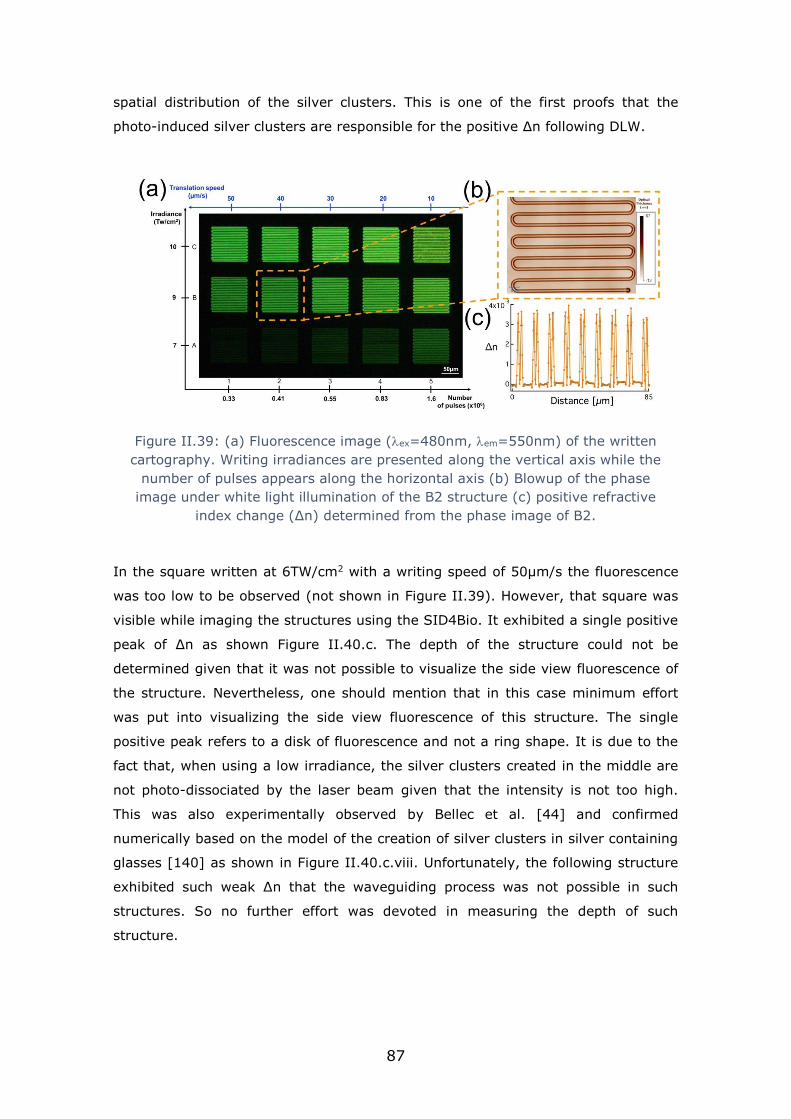
87
spatial distribution of the silver clusters. This is one of the first proofs that the
photo-induced silver clusters are responsible for the positive ∆n following DLW.
Figure II.39: (a) Fluorescence image (ex=480nm, em=550nm) of the written
cartography. Writing irradiances are presented along the vertical axis while the
number of pulses appears along the horizontal axis (b) Blowup of the phase
image under white light illumination of the B2 structure (c) positive refractive
index change (∆n) determined from the phase image of B2.
In the square written at 6TW/cm2 with a writing speed of 50µm/s the fluorescence
was too low to be observed (not shown in Figure II.39). However, that square was
visible while imaging the structures using the SID4Bio. It exhibited a single positive
peak of ∆n as shown Figure II.40.c. The depth of the structure could not be
determined given that it was not possible to visualize the side view fluorescence of
the structure. Nevertheless, one should mention that in this case minimum effort
was put into visualizing the side view fluorescence of this structure. The single
positive peak refers to a disk of fluorescence and not a ring shape. It is due to the
fact that, when using a low irradiance, the silver clusters created in the middle are
not photo-dissociated by the laser beam given that the intensity is not too high.
This was also experimentally observed by Bellec et al. [44] and confirmed
numerically based on the model of the creation of silver clusters in silver containing
glasses [140] as shown in Figure II.40.c.viii. Unfortunately, the following structure
exhibited such weak ∆n that the waveguiding process was not possible in such
structures. So no further effort was devoted in measuring the depth of such
structure.
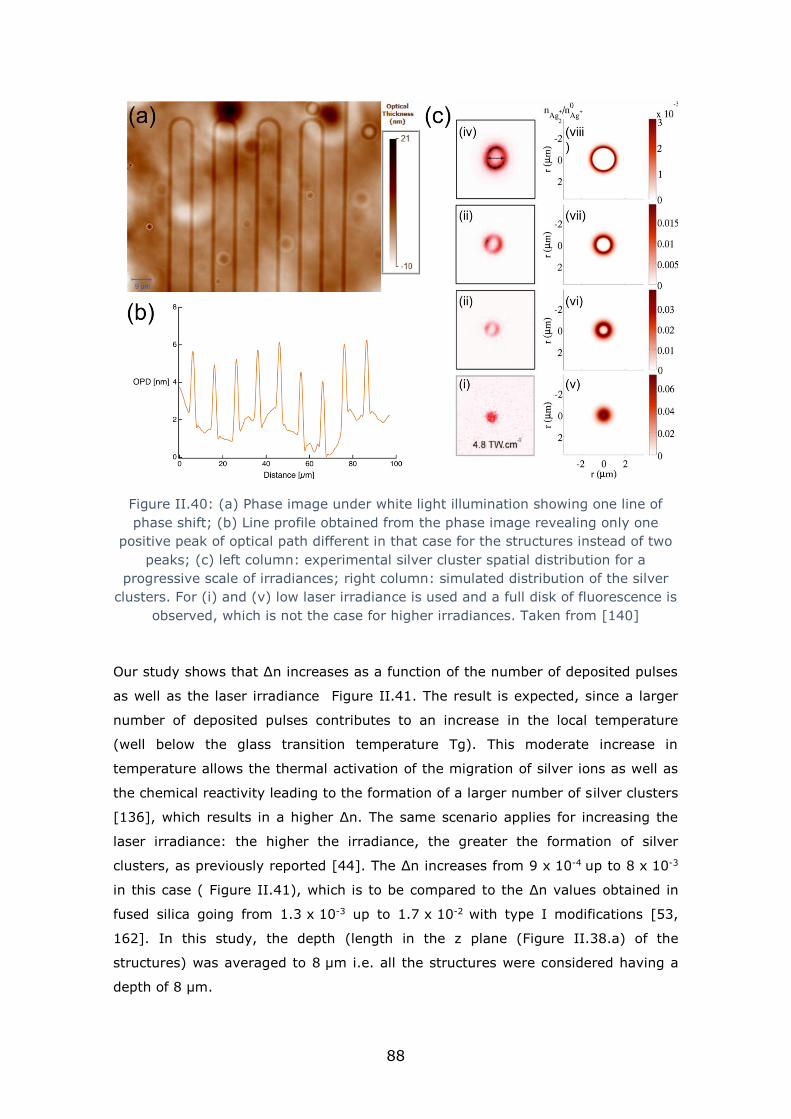
88
Figure II.40: (a) Phase image under white light illumination showing one line of
phase shift; (b) Line profile obtained from the phase image revealing only one
positive peak of optical path different in that case for the structures instead of two
peaks; (c) left column: experimental silver cluster spatial distribution for a
progressive scale of irradiances; right column: simulated distribution of the silver
clusters. For (i) and (v) low laser irradiance is used and a full disk of fluorescence is
observed, which is not the case for higher irradiances. Taken from [140]
Our study shows that ∆n increases as a function of the number of deposited pulses
as well as the laser irradiance Figure II.41. The result is expected, since a larger
number of deposited pulses contributes to an increase in the local temperature
(well below the glass transition temperature Tg). This moderate increase in
temperature allows the thermal activation of the migration of silver ions as well as
the chemical reactivity leading to the formation of a larger number of silver clusters
[136], which results in a higher ∆n. The same scenario applies for increasing the
laser irradiance: the higher the irradiance, the greater the formation of silver
clusters, as previously reported [44]. The ∆n increases from 9 x 10⁻⁴ up to 8 x 10⁻³
in this case ( Figure II.41), which is to be compared to the ∆n values obtained in
fused silica going from 1.3 x 10⁻³ up to 1.7 x 10⁻² with type I modifications [53,
162]. In this study, the depth (length in the z plane (Figure II.38.a) of the
structures) was averaged to 8 µm i.e. all the structures were considered having a
depth of 8 µm.

89
Figure II.41: Refractive index change variation (∆n) as a function of the number
of pulses and laser irradiance. ∆n increases as a function of the laser parameters.
Laser repetition rate 9.8 MHz.
However, another study was performed to investigate the depth (length in z plane)
of the structures as a function of the laser parameters. This study will lead probably
to a more accurate measurement of ∆n for all the written structures as a function
of their depth given that ∆n is determined based on the measured ODP and the
length of the structures in z plane (Figure II.38.a). The study consisted also in
cartographies of square structures of 100 µm x 100 µm with an interline spacing of
10 µm. The laser irradiance varied between 7 TW/cm2 to 11.8 TW/cm2 while the
writing speed was changed from 10 µm/s up to 100 µm/s corresponding to
1.7 x 10⁶ deposited pulses and 1.7 x 10⁵ respectively using a 20x-0.75NA
objective. The results reveal that the writing speed i.e. the number of deposited
pulses seems to not have a big effect on the length of the structure. However the
laser irradiance plays a major role in that case, as shown in Figure II.42. The
structure’s depth in z varied from 5 µm to ~13 µm.
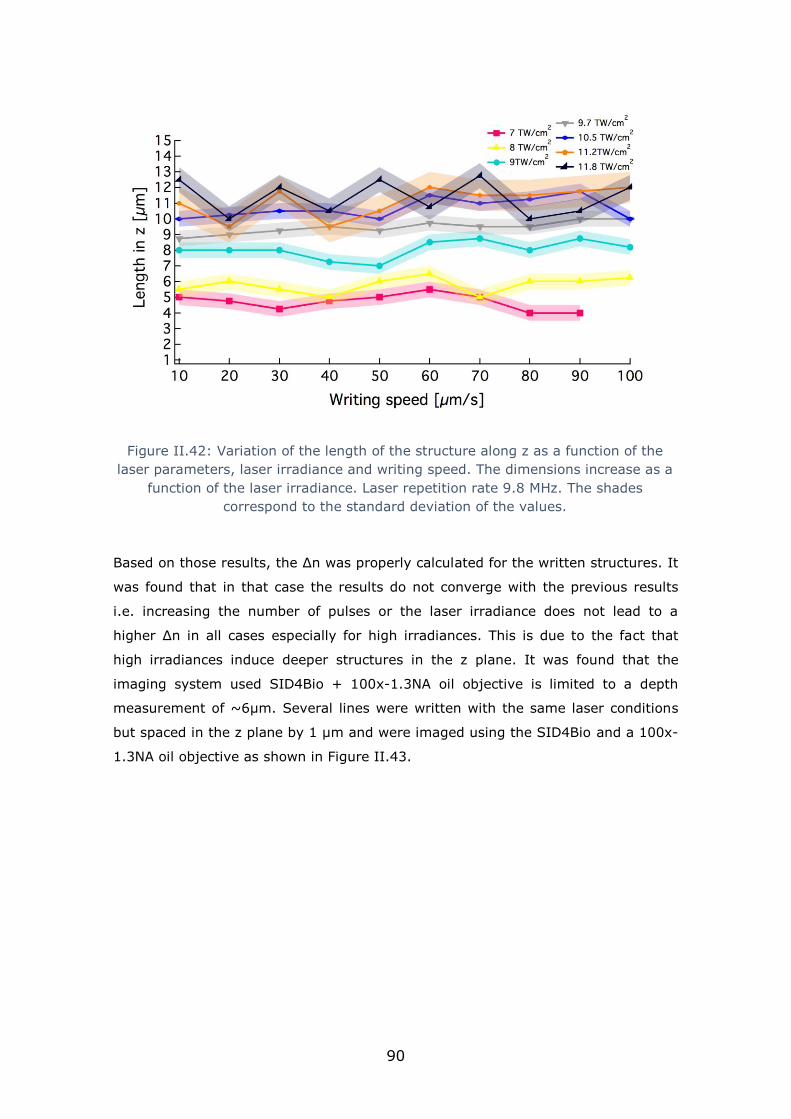
90
Figure II.42: Variation of the length of the structure along z as a function of the
laser parameters, laser irradiance and writing speed. The dimensions increase as a
function of the laser irradiance. Laser repetition rate 9.8 MHz. The shades
correspond to the standard deviation of the values.
Based on those results, the ∆n was properly calculated for the written structures. It
was found that in that case the results do not converge with the previous results
i.e. increasing the number of pulses or the laser irradiance does not lead to a
higher ∆n in all cases especially for high irradiances. This is due to the fact that
high irradiances induce deeper structures in the z plane. It was found that the
imaging system used SID4Bio + 100x-1.3NA oil objective is limited to a depth
measurement of ~6µm. Several lines were written with the same laser conditions
but spaced in the z plane by 1 µm and were imaged using the SID4Bio and a 100x-
1.3NA oil objective as shown in Figure II.43.

91
Figure II.43: Top view phase image of different lines separated by 1 µm in the z
plane. The seventh line becomes blurry indicating that the optical system is
limited to around 6 µm in depth.
The use of a 100x-1.3NA objective with the SID4Bio is necessary in order to
spatially resolve our structures. Taking into account the length of coherence, the
shape of our structure in the z plane, it was found that the depth of view is around
~6 µm and after that the structures are blurry and the OPD is underestimated.
Therefore, the measurement of our imaging system in this case is limited to around
6 µm. If the structure is deeper, the OPD is underestimated i.e. underestimating
the ∆n, which explains the divergence of the value of ∆n when taking into
consideration the real depth of the structure. Considering that and compensating
for it (∆𝑛 = 𝑂𝑃𝐷 𝑒𝑟𝑒𝑎𝑙⁄ ∗ 𝐶𝑐𝑜𝑚𝑝𝑒𝑛𝑠𝑎𝑡𝑖𝑜𝑛), the ∆n values where plotted again in Figure
II.44, where 𝑒𝑟𝑒𝑎𝑙 is the real thickness of the structures and 𝐶𝑐𝑜𝑚𝑝𝑒𝑛𝑠𝑎𝑡𝑖𝑜𝑛 the
calculated compensation coefficient. The compensation method took into
consideration the Fresnel number in that case. One can see that the results make
more sense i.e. increasing the number of pulses and/or laser irradiance increases
the ∆n.
In the first study of the ∆n as a function of the laser parameters (Figure II.41), all
the structures’ lengths were fixed to 8 µm. For this study, all the structures

92
exhibiting lengths more than 6 µm where considered as having a length of 6 µm
(fixed method with (∆𝑛 = 𝑂𝑃𝐷 6000)⁄ given that our system is limited to around
6 µm of depth of field (z plane Figure II.43). The results are plotted in Figure II.44
and compared to the compensation method. We used the compensation method
and took into account that all the structures exhibiting 6 µm in length (in the z
plane) converge and have more or less the same values. However, not
compensating for the OPD value leads to an underestimating to the ∆n value of our
structures, which is not plotted in Figure II.44.
Figure II.44: Refractive index change (∆n) as a function of the number of pulses
for two methods: (orange) using the compensation method (black) fixed method
where the depth of the structure higher than 6 µm is considered as 6 µm. Both
methods converge more or less to the same values. The black shades correspond
to the standard deviation of the values.
To further support our hypothesis that the photo-induced ∆n is related to the
creation of silver clusters, a non-silver containing zinc phosphate (PZn) glass was
irradiated using the same laser conditions and even higher irradiance. Neither
fluorescence nor refractive index change were observed in this case, which
indicated that the formation of silver clusters is the main and direct cause for the
∆n in silver containing glasses, in the low pulse energy regime. Moreover, the
photo-induced ring shape structure was investigated using High Resolution
Scanning Electron Microscopy (HRSEM) photos and Atomic Force Microscopy (AFM)
[136]. The glass sample was polished and etched using acid to reveal the
structures to the surface. The HRSEM profile line exhibited a rise on the edges of

93
the photo-induced structures with 80 nm width indicating a change in the chemical
composition or a topological bump (Figure II.45.b) [136].
In order to investigate these hypotheses, an AFM image proves that the topology
on the edges of the photo-induced structure does not increase (Figure II.45.c).
Therefore, we can attribute the enhanced contrast in the edge of the HRSEM image
to a change in chemical composition i.e. the presence of silver clusters. However, in
the middle of the structure a topological modification is observed that is due to the
selective acid-etching performed [136].
Figure II.45: (a) High Resolution Scanning Electron Microscopy (HRSEM) image of
the top view of a ring shape structure formed by silver clusters; (b) Line profile
extracted from the HRSEM photo indicating a bump on the edges; (c) Atomic
Force Microscopy (AFM) profile indicating no bumps on the sides. The bumps
observed in the HRSEM are due to a change in the chemical composition and not
to topological changes. Taken from [136].
In addition to that, the typical spatial fluorescence distribution was correlated to the
HRSEM image confirming once more that the silver clusters are responsible for the
fluorescence (Figure II.46), for the change in chemical composition [136] and
therefore the new type of refractive index change.
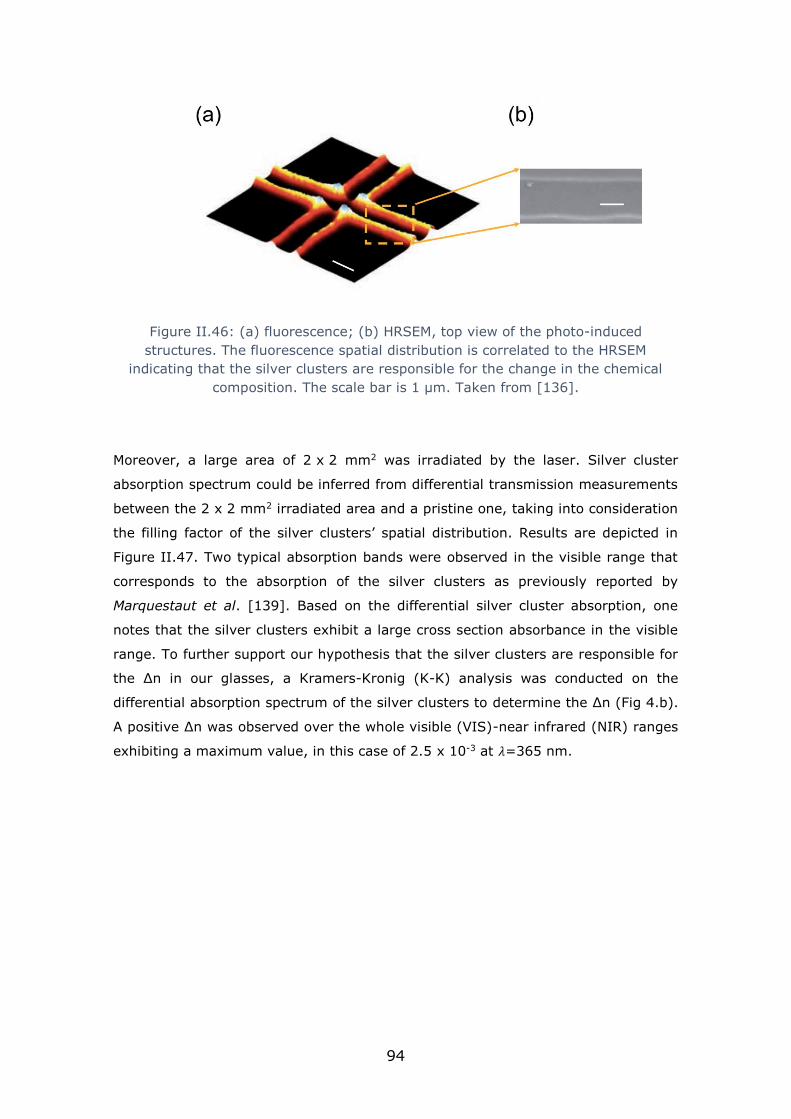
94
Figure II.46: (a) fluorescence; (b) HRSEM, top view of the photo-induced
structures. The fluorescence spatial distribution is correlated to the HRSEM
indicating that the silver clusters are responsible for the change in the chemical
composition. The scale bar is 1 µm. Taken from [136].
Moreover, a large area of 2 x 2 mm2 was irradiated by the laser. Silver cluster
absorption spectrum could be inferred from differential transmission measurements
between the 2 x 2 mm2 irradiated area and a pristine one, taking into consideration
the filling factor of the silver clusters’ spatial distribution. Results are depicted in
Figure II.47. Two typical absorption bands were observed in the visible range that
corresponds to the absorption of the silver clusters as previously reported by
Marquestaut et al. [139]. Based on the differential silver cluster absorption, one
notes that the silver clusters exhibit a large cross section absorbance in the visible
range. To further support our hypothesis that the silver clusters are responsible for
the ∆n in our glasses, a Kramers-Kronig (K-K) analysis was conducted on the
differential absorption spectrum of the silver clusters to determine the ∆n (Fig 4.b).
A positive ∆n was observed over the whole visible (VIS)-near infrared (NIR) ranges
exhibiting a maximum value, in this case of 2.5 x 10⁻³ at 𝜆=365 nm.

95
Figure II.47:(a) Silver clusters differential absorption spectrum as a function of the
wavelength showing two main absorption bands near 290 nm and 350 nm; (b)
Refractive index change (∆n) determined from the spectrum shown in (a) based on
a Kramers-Kronig analysis, considering the filling factor of the silver clusters’
spatial distribution. DLW parameters: 7TW/cm2 – 40 µm/s.
Indeed, we claim that our ∆n is not based on a standard index modification of the
glass matrix itself due to the laser-induced modifications of the local density as it is
the case for type I modification. Here, we report that the ∆n produced is based on
the localized laser-induced creation of a new chemical silver species with enlarged
molecular electric polarizability, locally leading to an increase in the electric
susceptibility and associated refraction index change.
II.6.3. Waveguiding
II.6.3.a. Multimode waveguiding
In order to illustrate the potential of this new DLW process for practical
applications, a first approach took place by writing two 7 mm long waveguides
typically 160 µm below the surface in a PZnAg2 glass provided by ICMCB. The DLW
process of two waveguides took place using the 1030 nm laser setup as mentioned
in the experimental part (section II.5.3) while using a 20x-0.4 NA Mitutoyu
microscope objective. The laser irradiance used was 8 TW/cm2 while two writing
speeds were used, 10 µm/s (WG1) and 20 µm/s (WG2). Then the sample was
rotated 90° for top laser injection and bottom collection of the guided light as
shown in Figure II.48.a. A micrograph of the bulk sample and the fluorescence of
one of the written waveguides under broad field UV illumination at 405 nm are
depicted in Figure II.48.b. A blue diode operating at 405 nm illuminated the top
surface while imaging the induced fluorescence from the bottom as shown in Figure
II.48.c. Based on that photo, the first waveguide dimensions were estimated to be
~15 µm by 4 µm exhibiting the double-line shape features which were shown

96
earlier in the manuscript. The depth of the waveguide in z plane is higher than what
was measured earlier and this is because in this case another microscope objective
is used for the DLW. The objective exhibited lower NA, 0.4 compared to 0.75 NA.
Therefore the photo-induced structures are larger given that the Rayleigh range is
larger. Following that, the blue diode was turned off, and a CW low power 1030 nm
laser (to avoid any fluorescence excitation or glass structuration) was injected
inside the waveguide. Upon laser injection, a transmitted light was observed
localized on the double-line shape structures (Figure II.48.d), which was the first
observation of the waveguiding properties of the photo-induced silver clusters in
silver containing glasses [149].
Figure II.48: (a) Schematic of the direct laser writing process and the laser
injection; (b) Picture of the bulk sample under UV excitation (ex=405nm)
highlighting the fluorescence of the waveguide (indicated by the white arrow); (c)
fluorescence image of the side view of the waveguide under UV excitation
(ex=405nm); (d) near-field guided mode profile following laser injection [149].
Further investigations were required to better characterize the written waveguide.
One of the advantages of writing type A waveguides is that injection of light could
be possible without the need to cut and polish the side facets if they are already
polished. During the writing process and while exiting the glass facet, no ablation
nor damage were noticed to the glass for type A waveguides, which makes the
injection of light possible. It is not the case when writing type I waveguides where
when reaching the glass facet, the glass explodes and is damaged. Therefore, the
polishing process is a must in order to inject light inside such waveguides. Still, to
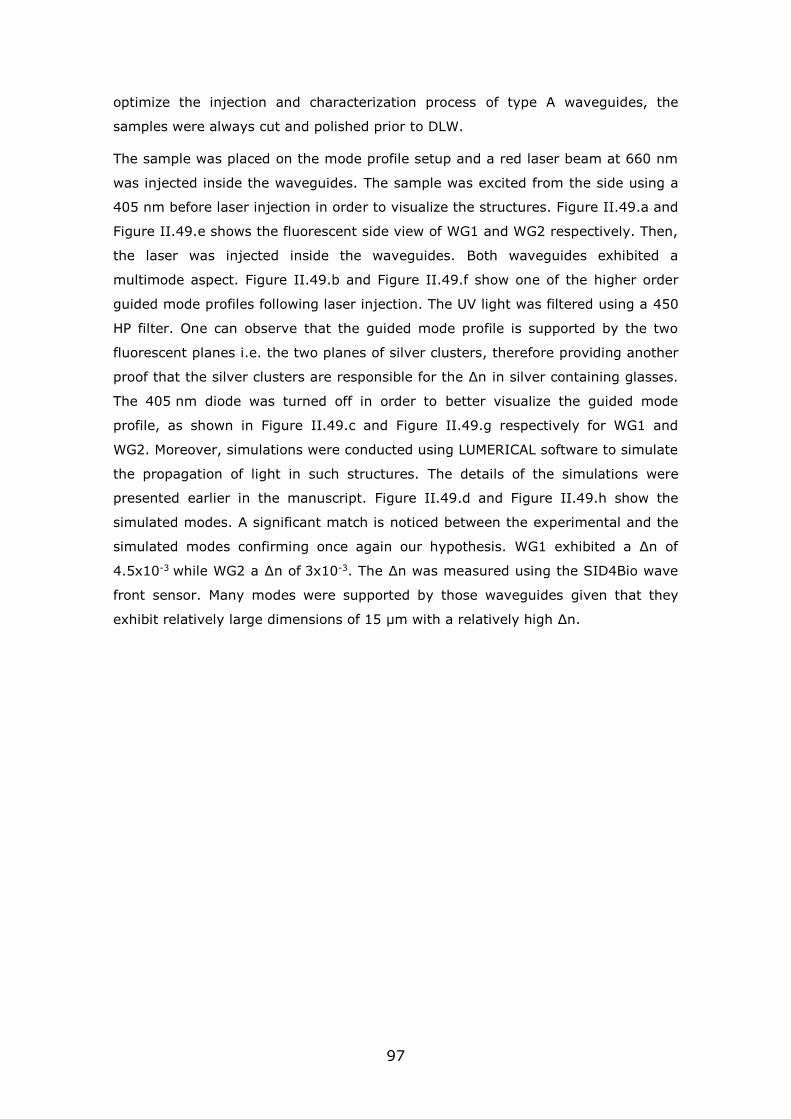
97
optimize the injection and characterization process of type A waveguides, the
samples were always cut and polished prior to DLW.
The sample was placed on the mode profile setup and a red laser beam at 660 nm
was injected inside the waveguides. The sample was excited from the side using a
405 nm before laser injection in order to visualize the structures. Figure II.49.a and
Figure II.49.e shows the fluorescent side view of WG1 and WG2 respectively. Then,
the laser was injected inside the waveguides. Both waveguides exhibited a
multimode aspect. Figure II.49.b and Figure II.49.f show one of the higher order
guided mode profiles following laser injection. The UV light was filtered using a 450
HP filter. One can observe that the guided mode profile is supported by the two
fluorescent planes i.e. the two planes of silver clusters, therefore providing another
proof that the silver clusters are responsible for the ∆n in silver containing glasses.
The 405 nm diode was turned off in order to better visualize the guided mode
profile, as shown in Figure II.49.c and Figure II.49.g respectively for WG1 and
WG2. Moreover, simulations were conducted using LUMERICAL software to simulate
the propagation of light in such structures. The details of the simulations were
presented earlier in the manuscript. Figure II.49.d and Figure II.49.h show the
simulated modes. A significant match is noticed between the experimental and the
simulated modes confirming once again our hypothesis. WG1 exhibited a ∆n of
4.5x10⁻³ while WG2 a ∆n of 3x10⁻³. The ∆n was measured using the SID4Bio wave
front sensor. Many modes were supported by those waveguides given that they
exhibit relatively large dimensions of 15 µm with a relatively high ∆n.
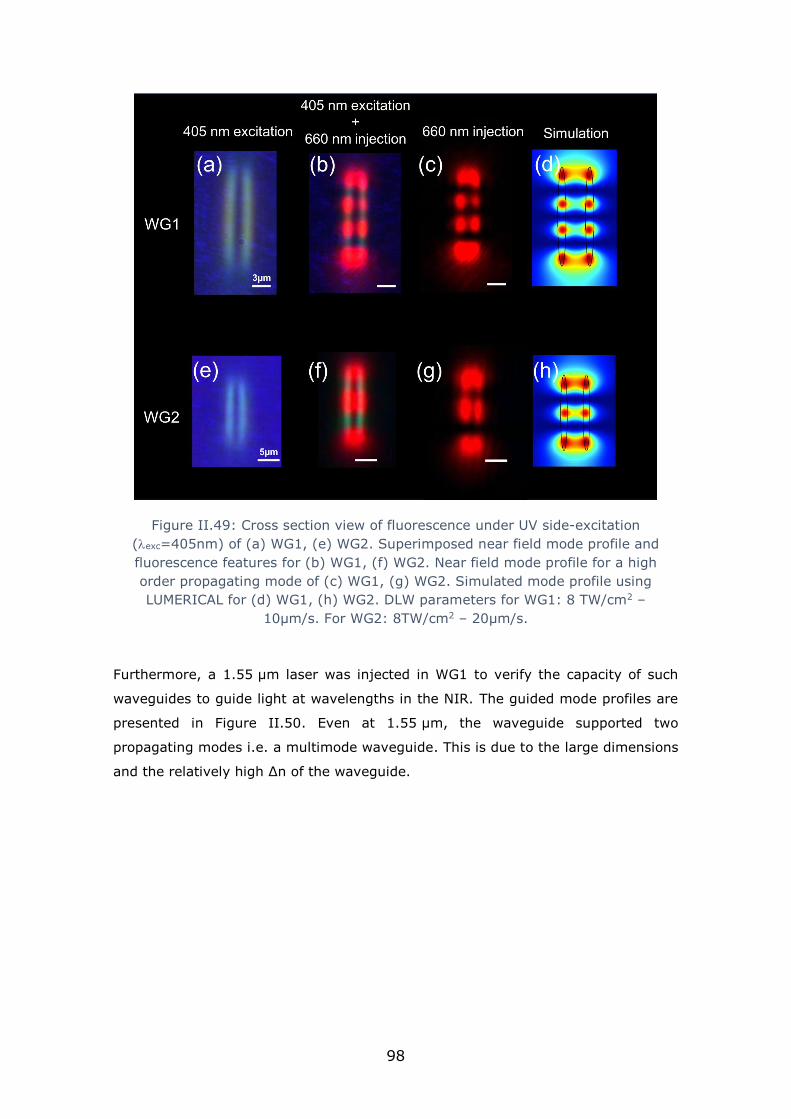
98
Figure II.49: Cross section view of fluorescence under UV side-excitation
(exc=405nm) of (a) WG1, (e) WG2. Superimposed near field mode profile and
fluorescence features for (b) WG1, (f) WG2. Near field mode profile for a high
order propagating mode of (c) WG1, (g) WG2. Simulated mode profile using
LUMERICAL for (d) WG1, (h) WG2. DLW parameters for WG1: 8 TW/cm2 –
10µm/s. For WG2: 8TW/cm2 – 20µm/s.
Furthermore, a 1.55 µm laser was injected in WG1 to verify the capacity of such
waveguides to guide light at wavelengths in the NIR. The guided mode profiles are
presented in Figure II.50. Even at 1.55 µm, the waveguide supported two
propagating modes i.e. a multimode waveguide. This is due to the large dimensions
and the relatively high ∆n of the waveguide.

99
Figure II.50: Near field mode profile following laser injection at 1.55 µm (a)
fundamental mode, (b) higher order mode. The waveguide presented a
multimode aspect. DLW parameters: 8TW/cm2 – 10 µm/s.
II.6.3.b. Single mode waveguide
The first approach to write waveguides resulted in multimode waveguides in the
visible and NIR range. For optical circuits and optical components, multimode
waveguides are a disadvantage due to the various numbers of modes supported by
the waveguide and the complexity of characterizing such waveguides. Therefore,
single mode (SM) waveguides needed to be written. In order to do so, a series of
waveguides were written in PZnAg1 silver containing zinc phosphate glass. The
waveguides were written typically 160 µm below the surface. The DLW was
performed using a 20x-0.75NA objective aiming to produce smaller waveguides.
The target was to reduce the dimensions of the waveguides as well as the ∆n.
Eventually the number of modes supported by a waveguide is linked to the
dimensions and ∆n of the waveguide (II-5). To get a single mode waveguide, the
laser irradiance as well as the number of pulses were optimized to get the
appropriate size and ∆n. Many waveguides were written, some were multimode,
some single mode. For the sake of simplicity and given that the multimode aspect
was presented earlier, only one single mode will be presented.
Following DLW, the sample was cut and polished. The structures were imaged using
a confocal fluorescence microscope (Figure II.51.a), which provides a better
resolution of silver cluster spatial distribution. As expected, the photo-induced
structures consisted of two parallel planes exhibiting a full width half maximum
(FWHM) of 0.55 µm (limited by confocal microscope resolution) and spaced by
1.85 µm along the y direction (Figure II.51.b). The corresponding length of the twin
structure along z was measured to be around 6 µm (Figure II.51.c). However, the
spacing between the two parallel fluorescent planes as well as their extent along z
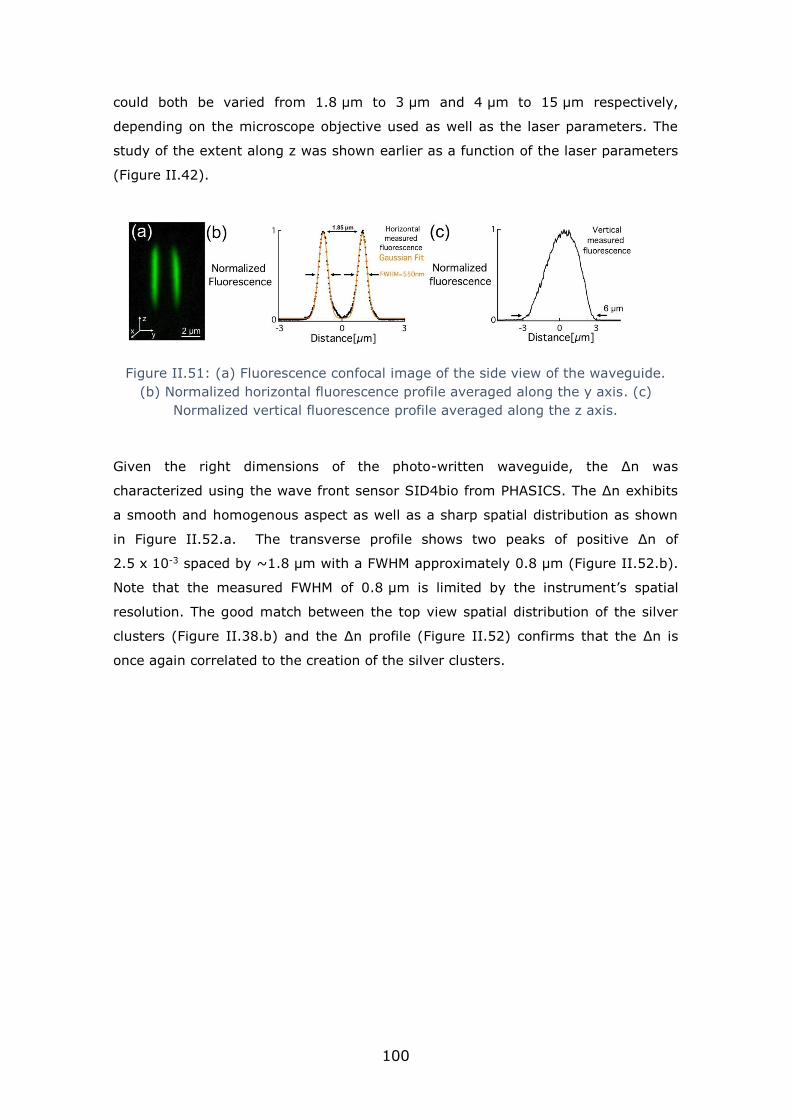
100
could both be varied from 1.8 µm to 3 µm and 4 µm to 15 µm respectively,
depending on the microscope objective used as well as the laser parameters. The
study of the extent along z was shown earlier as a function of the laser parameters
(Figure II.42).
Figure II.51: (a) Fluorescence confocal image of the side view of the waveguide.
(b) Normalized horizontal fluorescence profile averaged along the y axis. (c)
Normalized vertical fluorescence profile averaged along the z axis.
Given the right dimensions of the photo-written waveguide, the ∆n was
characterized using the wave front sensor SID4bio from PHASICS. The ∆n exhibits
a smooth and homogenous aspect as well as a sharp spatial distribution as shown
in Figure II.52.a. The transverse profile shows two peaks of positive ∆n of
2.5 x 10⁻³ spaced by ~1.8 µm with a FWHM approximately 0.8 µm (Figure II.52.b).
Note that the measured FWHM of 0.8 µm is limited by the instrument’s spatial
resolution. The good match between the top view spatial distribution of the silver
clusters (Figure II.38.b) and the ∆n profile (Figure II.52) confirms that the ∆n is
once again correlated to the creation of the silver clusters.

101
Figure II.52: (a) Phase image of the top view of the waveguide under white
illumination (b) Refractive index change (∆n) profile obtained from the phase
image. DLW paramters: 9TW/cm2 – 60 µm/s.
A small negative ∆n dip was observed between the two sharp positive peaks
(Figure II.52.b). It is the case when using relatively high irradiance and/or low
writing speed (high number of pulses) or following many laser passages as shown
in Figure II.53. For instance, for the same laser irradiance, the negative dip starts
to appear for lower writing speeds (Figure II.53). Furthermore, for a moderate laser
irradiance and writing speed, no negative dip was observed. However, the negative
∆n dip starts to appear and grows as a function of the number of laser passages as
shown in Figure II.53.a. For a relatively low speed of writing, the dip is present, yet
it grows as the number of laser passages grows (Figure II.53.b-c).
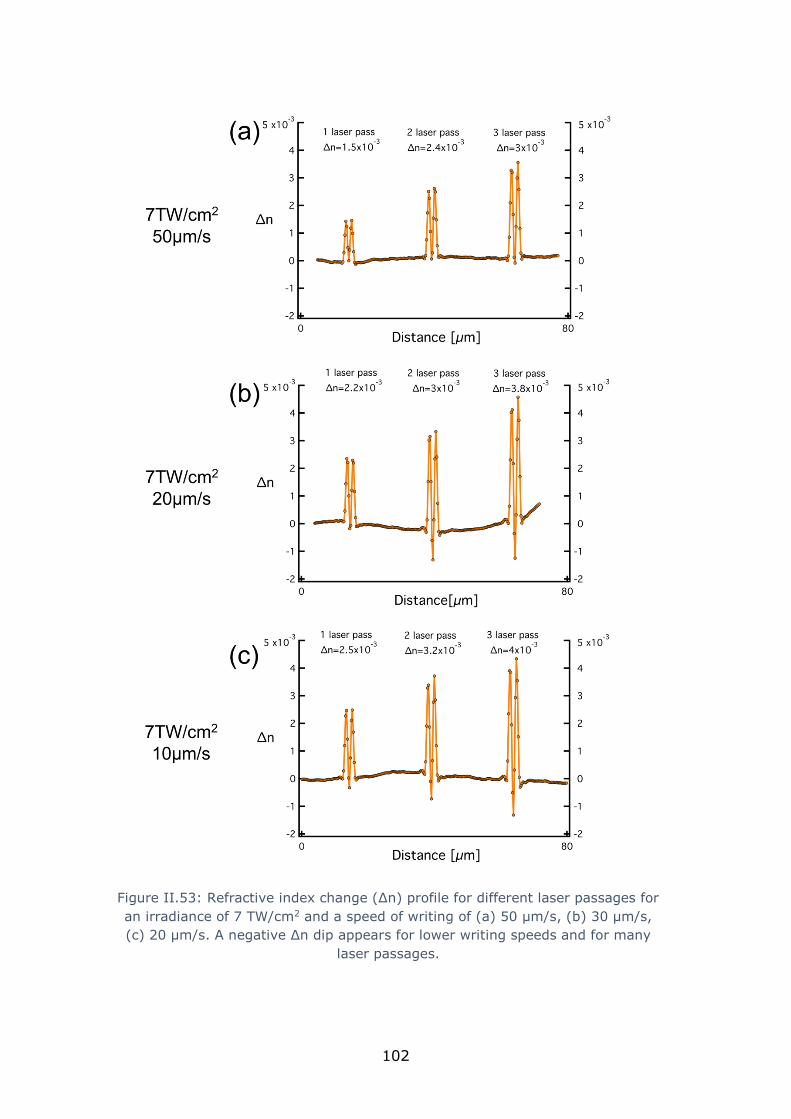
102
Figure II.53: Refractive index change (∆n) profile for different laser passages for
an irradiance of 7 TW/cm2 and a speed of writing of (a) 50 µm/s, (b) 30 µm/s,
(c) 20 µm/s. A negative ∆n dip appears for lower writing speeds and for many
laser passages.

103
This negative ∆n dip could be correlated to the diffusion of silver ions to the edges.
In 2015, a topological and silver concentration distribution study was performed by
Desmoulin et al [141]. The fluorescence distribution, the topology following
chemical etching and the silver concentration distribution were plotted together for
the same spatial distribution of silver clusters (Figure II.54). One can observe that
the concentration of silver ions exhibits a dip in the middle referring to fewer
quantities of silver ions. It could be due to the diffusion of such ions but no increase
was observed on the edges. However, this increase on the edges could be very
small and probably could not be detected by the microprobe used. The dip in the
middle refers to the lack of silver ions. Therefore it could be also correlated to the
small negative ∆n dip observed in phase image.
Figure II.54: Superposition of the silver cluster fluorescence spatial distribution
(black), normalized topology after chemical etching (red) and silver ions
concentration distribution (blue). Taken from [141].
During the development of silver containing glasses, it was observed that
incorporating silver ions in the glass matrix tended to increase the refractive index
of the glass, as shown in Figure II.55 [135]. Therefore, the absence of silver ions in
the middle could be responsible for the negative ∆n dip observed in the middle.
Furthermore, many laser passages imply more consumption of the silver ions
reservoir i.e. the silver ions are no longer present in the middle, probably diffused
leaving a small negative ∆n dip.

104
Figure II.55: The variation of the refractive index of the non-containing and silver
containing zinc phosphate glasses as function of the silver concentration
incorporated in the glass matrix. The higher the concentration of silver the higher
the refractive index of the glass is (from bottom to top). Data from [135].
After characterizing the morphology of the waveguide as well as the ∆n value, we
moved to testing the waveguiding properties. A 630 nm light was injected inside
the structure while the near field intensity profile was imaged using a CCD camera
and a microscope objective as mentioned in the experimental part section II.5.4.
The horizontal intensity mode profile depicted in Figure II.56.a.ii is a non-standard
single mode profile that can be fitted by the superposition of two Gaussian
distributions (total FWHM~3 µm) while the vertical intensity mode profile shows a
good match with a Gaussian fit as expected (FWHM~5.2µm) (Figure II.56.a.iii).
Based on numerical simulations, each single laser-induced trace of silver cluster
Agmx+ is expected to support waveguiding by itself. In the case of experimental
structures, the Agmx+ traces are separated by a relatively small separation distance
(~1.5 µm) and a relatively low ∆n (~2.5x10⁻³). The horizontal mode profile (Figure
II.56.a.i) was observed to remain the same whatever the injection condition.
Indeed, the spatial overlap of the injecting fiber with the guiding structure only
influence the transmitted intensity of the guided mode, without affecting the guided
mode profile. Therefore, this allows us to conclude that the following waveguide is a
single mode waveguide operating at 630 nm and supporting one single mode
despite its original profile. This was not the case for the previously mentioned

105
waveguides where the spatial overlap of the injecting fiber with the waveguide
affected the guided mode profile and resulted in exciting higher order modes, as
shown in Figure II.49. Such original double trace structure supported by the laser-
induced silver clusters thus seems to behave similarly to two close and highly
interacting waveguides [163, 164], globally corresponding to a structure that
sustains a single super mode. Although for single-mode, one can still note that such
a waveguide is elliptical (𝜀=1.7).
Figure II.56: (a) Experimental: (a.i) Near field mode profile after injecting a 630
nm laser, (a.ii) normalized horizontal mode profile intensity averaged along the z
axis, and (a.iii) normalized vertical mode profile intensity averaged along the y
axis. (b) Simulations: (b.i) simulated mode profile (to compare with Figure
II.56.a.i), (b.ii) normalized horizontal intensity mode profile averaged along the z
axis (to compare with Figure II.56.a.ii), and (b.iii) normalized vertical mode profile
intensity averaged along the y axis.
Furthermore, simulations were conducted to correlate the experimental and
simulated near-filed mode profiles. All the waveguides were simulated as two
parallel ellipsoids with a specific thickness “e”, spaced by the measured distance “d”
with the measured depth “z” in the z axis and a step index ∆n corresponding to the
values measured for each waveguide, as shown in Figure II.57.
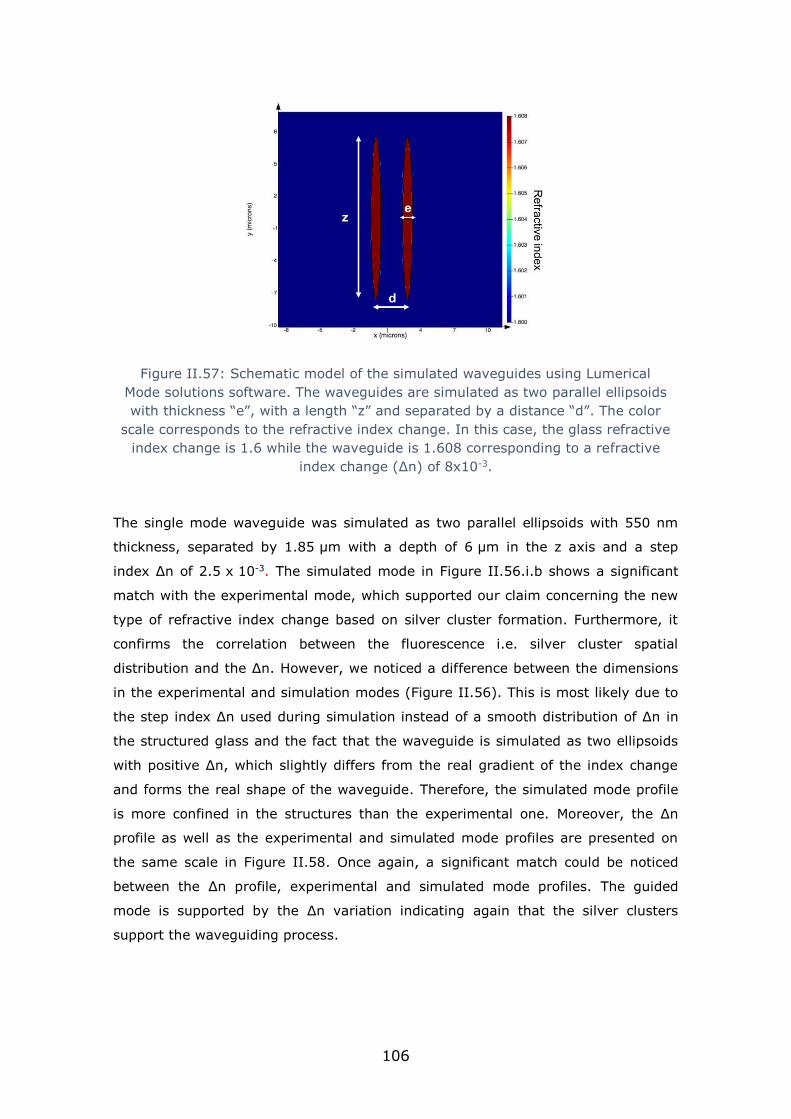
106
Figure II.57: Schematic model of the simulated waveguides using Lumerical
Mode solutions software. The waveguides are simulated as two parallel ellipsoids
with thickness “e”, with a length “z” and separated by a distance “d”. The color
scale corresponds to the refractive index change. In this case, the glass refractive
index change is 1.6 while the waveguide is 1.608 corresponding to a refractive
index change (∆n) of 8x10⁻³.
The single mode waveguide was simulated as two parallel ellipsoids with 550 nm
thickness, separated by 1.85 µm with a depth of 6 µm in the z axis and a step
index ∆n of 2.5 x 10⁻³. The simulated mode in Figure II.56.i.b shows a significant
match with the experimental mode, which supported our claim concerning the new
type of refractive index change based on silver cluster formation. Furthermore, it
confirms the correlation between the fluorescence i.e. silver cluster spatial
distribution and the ∆n. However, we noticed a difference between the dimensions
in the experimental and simulation modes (Figure II.56). This is most likely due to
the step index ∆n used during simulation instead of a smooth distribution of ∆n in
the structured glass and the fact that the waveguide is simulated as two ellipsoids
with positive ∆n, which slightly differs from the real gradient of the index change
and forms the real shape of the waveguide. Therefore, the simulated mode profile
is more confined in the structures than the experimental one. Moreover, the ∆n
profile as well as the experimental and simulated mode profiles are presented on
the same scale in Figure II.58. Once again, a significant match could be noticed
between the ∆n profile, experimental and simulated mode profiles. The guided
mode is supported by the ∆n variation indicating again that the silver clusters
support the waveguiding process.

107
Figure II.58: Spatial superposition of the measured refractive index profile (∆n)
(black), simulated near-field mode profile (blue) and experimental near-field mode
profile (red). A good match is observed between the simulated and experimental
modes and the ∆n distribution.
The waveguide was simulated as two ellipsoids with a thickness of 550 nm and a
∆n of 2.5 x 10⁻³. The fluorescence confocal microscope images reveal that the width
of the structure is around ~550 nm and this is probably limited by the resolution of
the confocal microscope. Earlier work in the group performed by Marquestaut et al.,
revealed that the structure’s thickness is ~100nm using HRSEM images [139] using
another microscope objective but still the results are interesting. Therefore, we
assume that in this case we are probably over estimating the thickness of our
structures. Unfortunately, no HRSEM measurements were performed on those
structures to confirm our hypothesis. But, on the other hand, using simulations,
when decreasing the thickness of structures, a higher ∆n is required to support
waveguiding and a higher ∆n is required to trigger the multimode aspect, as shown
in Figure II.59. This is expected, since decreasing the dimensions of a waveguide
decreases the 𝑉 parameter i.e. the number of guided modes. Therefore, if we are
underestimating the thickness of our structures, it implies that we are
underestimating the value of the photo-induced ∆n. For instance, if we estimate
the structure’s thickness to be 500 nm, the ∆n required to trigger the multimode
aspect is 4x10⁻³, while if the thickness is 200 nm a ∆n of 2x10⁻² is required to
trigger the multimode aspect.

108
Figure II.59: Variation of the minimum ∆n required to trigger the multimode
aspect as a function of the thickness of the structures. Blue vertical line indicates
the thickness measured by confocal microscope and used during simulations
(~500nm) while the red line indicates the HRSEM measurement (~100nm)
performed earlier in our group [139].
Finally, a large mismatch between the injected mode profile and the geometry of
the waveguide results in injection losses estimated to be at its best at 5.22 dB as
estimated by numerical simulations. The losses could be higher depending on the
glass surface condition during injection (for example dust, not well polished). That
is also related to the fact the waveguide is not a circular one but can be illustrated
as two ellipsoids with positive ∆n spaced by ~1.85 µm. The upper bound of the
overall losses is 1.2 dB/cm, estimated considering the simulated mismatch
(5.22 dB), Fresnel losses of (0.43 dB) (n=1.59) and the measured insertion losses
of the 7-mm waveguide. One should mention that the traditional methods for
characterizing propagation losses is not highly efficient due the large mismatch
between the fiber and the waveguide geometry, and the short length of the
waveguide. One of the best methods to identify the propagation losses is the cut-
back method. It is normally used to characterize the losses in fibers. Light is
injected inside a fiber roll of many meters or centimetres. The transmission is
monitored while a specific length of the fiber is cut while the light injection is fixed.
The transmission increases every time a part of the fiber is cut which leads to the
propagation losses per unit of length (dB/Km, dB/m, dB/cm). Unfortunately, during

109
the project, it was not possible to have long samples up to 10 cm in order to
perform the study. Therefore we limited the estimation of losses to the previously
mentioned method. Further efforts are required in the future to get a more
accurate evaluation of the propagation losses of such waveguides. Compared to the
type I waveguides in phosphate glasses, the lowest losses were ~0.54 dB/cm at a
wavelength of 660 nm [132]. While at 1530 nm-1565 nm, wavelengths losses were
lower than 0.4 dB/cm [134]. Both were reported in Er:Yb doped zinc phosphate
glasses. However, one should mention that the coupling losses in both cases were
not as high as in our case given that the waveguides exhibited a more circular
shape. The most critical point in estimating the losses of silver-based waveguides is
the power coupling/overlap between the injected mode and the elliptical waveguide
shape. Numerical simulations estimate the losses to be 5.22 dB but those losses
could be underestimated which makes the estimation of the propagation losses
harder.
II.6.3.c. Multimode - Single mode aspect
Multimode waveguides and single mode waveguides were presented during this
work. As mentioned before, a single mode (SM) waveguide is defined by the fact
that the spatial movement of the injecting fiber does not excite a higher order
mode. Therefore only one mode can propagate in the waveguide no matter how the
injection occurs. However, for the multimode (MM) waveguides, it is not the case.
Changing the injection affects the guided mode and excites higher order modes.
The number of higher modes that could be excited in a multimode waveguide could
be defined by the dimensions and the ∆n of the waveguide (V parameter in (II-5)).
Some multimode waveguides exhibit two guided modes only and others exhibit four
to five guided modes for instance. However, even for a multimode waveguide, the
fundamental mode could be excited. Figure II.60.a shows the fundamental mode of
a multimode waveguide while Figure II.60.b shows the fundamental mode of a
single mode waveguide. The MM waveguide is 13 µm long while the SM waveguide
is 6 µm. The transverse profiles of both modes are presented in Figure II.60.c. One
can see that for the MM waveguide, the global mode is more confined. The two
silver planes better confine light compared to the SM waveguide. The light intensity
drops in the middle to 0.3 compared to 0.65 for the SM waveguide. This is probably
due to the higher ∆n for the MM waveguide that results in more confining of the
light inside each silver cluster plane compared to SM, where the ∆n is relatively
lower and the light is less confined. This was observed for all MM and SM
waveguides. As mentioned before, the waveguides behave as two highly interacting

110
waveguides coupling light between each other, exhibiting a super mode profile as
an output. In the case of a higher ∆n, the light is more confined in one plane and
the interaction between them is lower. Nevertheless, all waveguides studied during
this project guided light supported by both silver planes acting as one waveguide.
Figure II.60: Fundamental near-field mode profile of a (a) multimode (MM)
waveguide, (b) single mode (SM) waveguide. (c) Near-field mode profiles of the
MM and SM waveguides. DLW parameters for SM: 9TW/cm2 – 60µm/s, for MM:
10.5TW/cm2 – 20µm/s.
Moreover, for the multimode modes presented in Figure II.49.c-g one can see that
the interaction between the modes in the middle of the waveguide is less
signigicant compared to the modes on the top and bottom. The modes on the top
and bottom are observed as one mode combined instead of two modes interacting
with each other, as it is the case for middle ones. This is probably because on the
top and bottom, the waveguides have thinner planes and probably lower ∆n than
the middle. So, the light is less confined in those areas and the coupling effect is
more significant on the top and bottom of the waveguides, as also observed in
simulation Figure II.49.d-h.
II.6.4. Optical components
II.6.4.a. Y-beam splitter
Once the waveguiding properties were investigated, confirmed and characterized,
the control of ∆n and multimode and single mode aspects is mastered, we moved
to the creation of optical components taking a step forward towards applications
such as 3D integrated circuits. The first approach was the inscription a 50-50 Y-
beam splitter typically 160 µm below the surface of PZnAg1 glass. It consisted of
two partially overlapping S-bended waveguides as shown in Figure II.61.a. The S-
bend waveguides were written using an irradiance of 9TW/cm2 with a writing speed
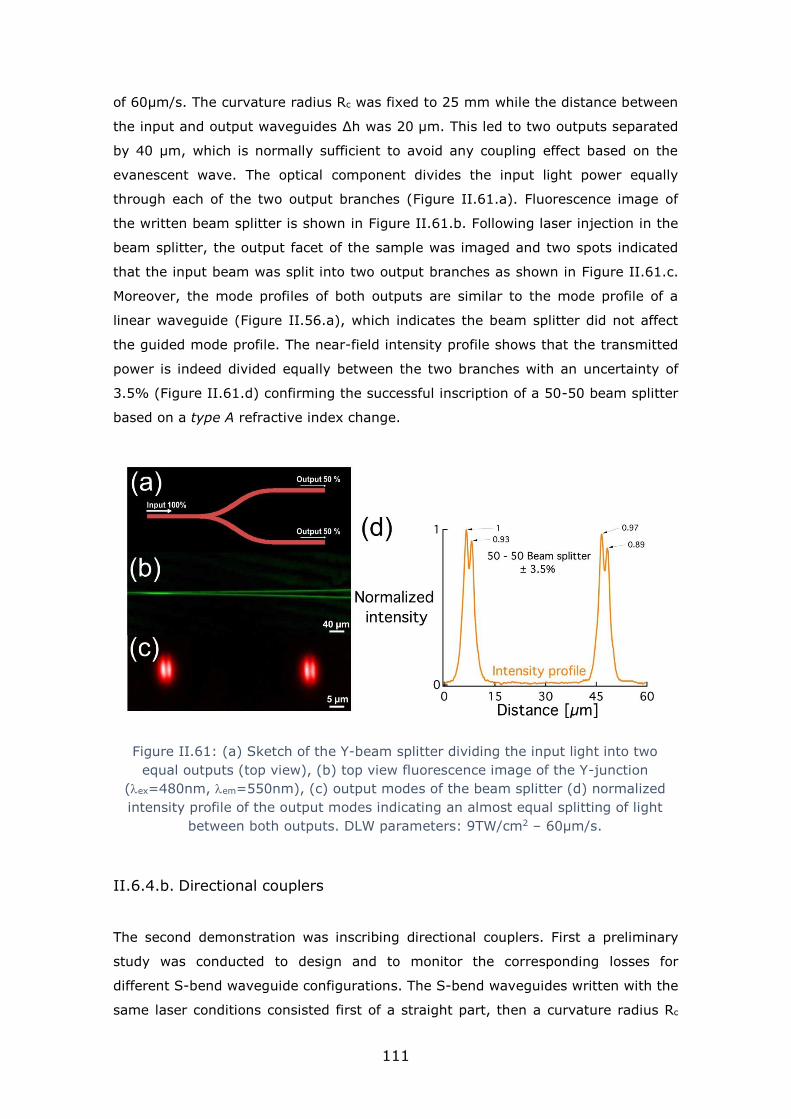
111
of 60µm/s. The curvature radius Rc was fixed to 25 mm while the distance between
the input and output waveguides ∆h was 20 µm. This led to two outputs separated
by 40 µm, which is normally sufficient to avoid any coupling effect based on the
evanescent wave. The optical component divides the input light power equally
through each of the two output branches (Figure II.61.a). Fluorescence image of
the written beam splitter is shown in Figure II.61.b. Following laser injection in the
beam splitter, the output facet of the sample was imaged and two spots indicated
that the input beam was split into two output branches as shown in Figure II.61.c.
Moreover, the mode profiles of both outputs are similar to the mode profile of a
linear waveguide (Figure II.56.a), which indicates the beam splitter did not affect
the guided mode profile. The near-field intensity profile shows that the transmitted
power is indeed divided equally between the two branches with an uncertainty of
3.5% (Figure II.61.d) confirming the successful inscription of a 50-50 beam splitter
based on a type A refractive index change.
Figure II.61: (a) Sketch of the Y-beam splitter dividing the input light into two
equal outputs (top view), (b) top view fluorescence image of the Y-junction
(ex=480nm, em=550nm), (c) output modes of the beam splitter (d) normalized
intensity profile of the output modes indicating an almost equal splitting of light
between both outputs. DLW parameters: 9TW/cm2 – 60µm/s.
II.6.4.b. Directional couplers
The second demonstration was inscribing directional couplers. First a preliminary
study was conducted to design and to monitor the corresponding losses for
different S-bend waveguide configurations. The S-bend waveguides written with the
same laser conditions consisted first of a straight part, then a curvature radius Rc

112
based on a radius circle then another identical one but with a reversed curvature,
then a straight part, as shown in Figure II.62. The input and the output of the S-
bend waveguide were separated by ∆h (Figure II.62).
Figure II.62: Sketch of the S-bend
A series of S-bend single mode waveguides were written using a laser irradiance of
9.3TW/cm2 and a writing speed of 40 µm/s using a 20 x -0.75NA obj. The chosen
Rc were 25 mm, 50 mm and 100 mm while the ∆h values were 10 µm, 25 µm,
50 µm, 100 µm and 150 µm. The results are shown in Figure II.63. The
transmission of the S-bend was normalized compared to a straight waveguide
written in the same laser conditions. The lowest losses were observed for an
Rc=100 mm and a ∆h between 10 µm and 25 µm. For an Rc of 25 mm even for a
small ∆h of 10 µm, the losses were high. Acceptable losses of around 20%
(0.96 dB) were observed for Rc=50 mm and ∆h=10 µm. However, for a ∆h of
25 µm losses were significant and equivalent to losses at a ∆h of 50 µm. We
believe that in that case the waveguide exhibited some defects implying higher
losses.

113
Figure II.63: Normalized transmission of the S-bend waveguides as a function of
the radius curvature Rc and the separation distance ∆h. Reversed injection data
corresponds to backward injection in the S-bend waveguides. DLW parameters:
9.3TW/cm2 – 40µm/s.
A series of couplers were written in order to optimize the coupling parameters i.e.
the interaction length “L” and the separation distance. The couplers consisted of
8 mm straight waveguides written typically 160 µm below the surface. Then 2 mm
away from the input facet, a S-bend waveguide is written spaced by a distance “d”
with an interaction length “L” providing the coupling zone as shown in Figure II.64.
Figure II.64: Sketch of the coupler consisting of straight and S-bend waveguides.
Given that the glass samples were limited in dimension to ~8 mm, the choice of Rc
and ∆h were 50 mm and 40 µm respectively in order to spatially fit the component
inside the 8 mm glass sample. The following parameters exhibited losses of course,
but these were acceptable losses in order to demonstrate the coupling effect
between type A waveguides. Following primary tests, it was found that for L=1 mm

114
the coupling is not high enough while the 2 mm length was sufficient to observe
coupling effects from one waveguide to another. Therefore, the interaction length
was fixed to 2 mm and the separation distance d between two waveguides was
varied from 5 to 20 µm by steps of 2.5 µm. The power transmitted by the straight
waveguide Ps was normalized by dividing it by the overall sum of the guided power
Ps+ Pc. Consequently, one can have a better idea of the coupling ratio. The
experimental and the simulated power coupling ratios are shown in Figure II.65.
The simulations were based on plotting the coupled power from (II-8). One can see
the oscillation of the coupling ratio between 5 µm and 7.5 µm, which is typical of
the coupler’s behaviour. However, that was not observed in the experimental data
owing to the fact that the distance step was 2.5 µm, which is too large compared to
a step of 0.1 µm in simulations. Moreover, an acceptable match between the
simulated and the experimental data was found. The small differences could be
related to the fact that the waveguide is elliptical (𝜖=1.3) and not a circular one
given that the simulations are based on LP01 circular modes interacting together.
Figure II.65: Simulated and experimental normalized coupled power as a function
of the separation distance between the two waveguides. DLW parameters:
9.3TW/cm2 – 40µm/s
A 50-50 coupler at a wavelength of 630 nm was written later using a laser
irradiance of 10.8 TW/cm2 and a writing speed of 40µm/s in an 8 mm bulk glass
sample. The straight waveguide and the S-bend were separated by d=7µm, the
interaction length set at L=2mm, Rc=50mm and ∆h=40µm. The near-field mode
intensity profiles of the two outputs show equivalent power for each output as

115
indicated in Figure II.66.b. The double line features of the silver clusters are not
visible in this image. This could be due to the beam profiler used for imaging the
guided near-field mode profile and not a high definition CCD camera like the
previous cases.
Figure II.66: (a) Near-field mode profiles of the output of the coupler; (b)
normalized intensity of the mode profiles indicating the creation of a 50-50 coupler.
DLW parameters: 10.8 TW/cm2 – 40µm/s.
II.6.5. Waveguides in Ribbon Fibers
Finally, DLW of waveguides was conducted in silver containing ribbon fibers. As
mentioned before in section II.5.2, DLW of small schemes like a Mach-Zenhder and
resonator was successfully performed on ribbon fibers but the waveguiding process
was never tested [149]. Therefore, a 1.4 cm waveguide was written inside a
500 µm x 200 µm ribbon fiber typically 50 µm below the surface. A laser irradiance
of 10TW/cm2 was used while the writing speed was 25 µm/s. After the writing
process, the end facets of the fiber were polished manually to optical quality to
reveal the structures to the surface, to allow laser injection and profile imaging. The
fluorescent structures exhibited the same morphology as the one in the bulk which
also demonstrated the equivalence of the index modification profiles in bulk and
fiber-shaped samples. A 630 nm laser was injected inside the 1.4 cm waveguide
and the near field image was taken. Light was guided all over the full length of the
waveguide, as shown in Figure II.67.a. The near field mode profile (Figure II.67.b)
was similar to that of a single mode waveguide in bulk glasses, as shown previously
in Figure II.56.

116
Figure II.67: (a) Cross-section view of the ribbon fiber with the guided mode in
the middle; (b) blowup of the near-field mode profile; (c) horizontal mode
profile; (d) vertical mode profile. The mode profile is similar to the mode profile
in bulk glasses as shown in Figure II.56. DLW parameters: 10TW/cm2 – 25µm/s.
Therefore, we demonstrate the capability of creating waveguides in ribbon fibers,
thus paving the way for fiber applications in spectroscopy sensing, filtering and/or
fully integrated photonics. DLW in silver-containing zinc phosphate bulk glasses and
ribbon fibers allows the formation of a perennial new type of waveguides which
take advantage of the thermal stability and bleaching-free fluorescence of the
photo-induced silver clusters up to the glass transition temperature (typically 380–
400 °C here) [152, 165]. Furthermore, as mentioned before such laser-induced
modifications had already led to original second-order effective nonlinearities by
means of direct laser poling (EFISHG), allowing for a localized second-harmonic
generation that showed a significant efficiency with an effective coefficient close to
the pm/V level [142, 143]. In addition, a post laser irradiation thermal treatment
(Tg + 20 °C) in silver-containing zinc phosphate glass had allowed the growth of
silver metallic nanoparticles exhibiting an effective dielectric/metal medium bearing
a plasmonic resonance response in the structured glass matrix [139]. To the best of
our knowledge, combining optical and plasmonic waveguiding in the same glass
sample is not achievable otherwise, which highlights the novelty and tremendous
potential of these new type waveguides. Finally, one must emphasize that the
creation of silver clusters is not only limited to the silver-containing zinc phosphate
glasses but can also be generated in other silver containing glass matrices such as
sodocalcic and borosilicate glasses, as previously reported by our group [140]. This
proves the universality in terms of processes when considering tailored materials as

117
silver-containing photosensitive glasses [33], and the novelty of this technique in
making hybrid integrated circuits

118
II.7. Conclusion
Direct laser writing (DLW) in silver containing glasses induces the creation of
fluorescent silver clusters Agmx+ around the interaction voxel. Their spatial
distribution is dictated by the laser Gaussian beam. Those Agmx+ are responsible for
a new type of refractive index change (∆n) that is compatible for waveguiding
applications. This new type of ∆n totally differs from the well-known type I as it
originates from the creation of the photo-induced silver clusters around the
interaction voxel involving such new chemical bonds with more polarizable electron
clouds than those of initial silver ions Ag+ leading to a local refractive index change
independent of any modification of the glass matrix itself. The photo-induced ∆n
increases as a function of the laser parameters reaching a maximum value of
around 8 x 10⁻³. Multimode (MM) and single mode (SM) waveguides were created
inside silver containing glasses. MM waveguides in the visible and IR wavelengths
exhibited dimensions of 4 x 15µm2 with a ∆n=4.5 x 10⁻³ while a SM waveguide
operating at =630 nm exhibited dimensions of ~3 x 6 µm2, ∆n=2.5x10⁻³ and
propagation losses estimated to be 1.2 dB/cm. The SM waveguide mode profile
consists of one mode supported by each of the two silver cluster planes acting as
one supermode. The simulation of mode profiles exhibited a significant match with
the experimental modes confirming that the ∆n is based on the creation of silver
clusters. Following that, a 50-50 Y-beam splitter and a 50-50 coupler were written
paving the way for 3D integrated optical components. Finally, the waveguiding
process was demonstrated in silver containing ribbon shaped fibers by writing a
1.4 cm waveguide. These results provide unique opportunities for applications such
as spectroscopy fiber sensing, filtering and/or fully integrated photonics.

119
120
Table of contents:
III. Comparative study between type A and the type I refractive
index changes .............................................................................. 122
III.1 Introduction ..................................................................... 122
III.3 Type I modification in phosphate – zinc phosphate glasses
................................................................................................. 124
III.3 Experimental methods ...................................................... 124
III.3.1Glasses ............................................................................... 124
III.3.2 Laser setup ......................................................................... 125
III.3.2.a Introduction ......................................................................... 125
III.3.2.b Ti:Sapphire REGA-Coherent ................................................... 125
III.4 Results ............................................................................. 126
III.4.1 Type I modification in silver containing and non-containing zinc
phosphate glasses ......................................................................... 126
III.4.2 Structure morphology ........................................................... 133
III.4.3 Refractive index and mode profiles ......................................... 135
III.4.4 Flipping ∆n ......................................................................... 138
III.4.5 Advantages of type A ........................................................... 144
III.5 Conclusion ........................................................................ 146

121

122
Chapter III
Comparative study between the type A and
the type I refractive index changes
III.1. Introduction
Direct Laser Writing (DLW) in glasses generally induced three types of refractive
index changes classified as a progressive scale of the laser irradiance/fluence: type
I, type II and type III [64, 65] as previously mentioned in Chapter II. Type I is a
smooth refractive index change caused by a variation of the glass density induced
at low fluence [61, 75, 166] which is due to the local heating and melting followed
by a cooling process after laser passage [46], and/or the formation of color centers
[60, 75, 76] (see section II.2.1). It consists of an intrinsic modification of the glass
matrix itself leading to a refractive index change. Increasing the fluence of the
laser, induces the creation of a type II refractive index modification which is
birefringent and associated with formation of nanogratings [72-74]. Further
increase of the fluence leads to the creation of type III modifications resulting in
formation of voids or chaotic damage formation in the glass matrix.
Type I refractive index change is the most communally used for the creation of
optical components such as waveguides [62, 63, 66-71], integrated optical
components [114, 167-169] and recently quantum photonic circuits in glasses
[170, 171]. However, a type I modification has been reported to exhibit a decrease
in the refractive index change in some glasses such as BK7 borosilicate, ZBLAN and
phosphate glasses [49, 76, 89, 100, 172, 173], which complicates the creation of
optical waveguides. It depends on the glass composition as well as the inscription
parameters.
In silver containing glasses, silver ions embedded inside the glass matrix act as a
photosensitive support for DLW. In such silver containing glasses, DLW allows the
formation of fluorescent silver clusters Agmx+ in the vicinity of the laser-glass
interaction voxel [44, 136, 141]. Those silver clusters are at the origin of a novel
type of refractive index modification that we call type A (based on the Latin name
of silver, Argentum), acting as an extrinsic modification from the glass matrix in

123
silver containing glasses. It allows the creation of optical waveguides as well as
photonic components as was demonstrated previously in Chapter II [149, 174].
In this chapter, a comparative study between the novel type A and the type I
refractive index change is presented. We demonstrate that in the same glass
substrate, which is a silver containing zinc phosphate glass, type A and type I
refractive index changes can be induced by wisely adjusting the laser writing
parameters. First, we start by investigating the type I modification in a silver
containing and a non-containing silver glass. Then, in silver containing glass, we
perform direct laser writing of single mode waveguides of both type A and type I. A
morphology comparison between both waveguides then the refractive index mode
profile, near field mode profile and losses are exploited. Finally, the advantages of
the type A modifications are highlighted.

124
III.2. Type I modification in phosphate – zinc phosphate
glasses
More specifically, phosphate glasses exhibit some challenges in the understanding
of the laser-glass interaction and its control. This is due to the presence of several
components in the glass composition that could affect the laser-glass interaction.
As mentioned before in section II.3.8, network modifiers are added to the glass
composition to stabilize the glass matrix and/or to dope the glass with high
concentrations of rare earth metals. Two writing regimes exist, athermal and
thermal (section I.3.4). While writing in the athermal regime i.e. generally low
repetition rate and pulse energy in the microjoule (µJ) scale, it was reported that
several laser passages switch the ∆n from positive to negative in a phosphate Kigre
QX glass [175]. In the thermal regime, positive and negative ∆n were observed for
the same photo-induced structures where in the latter case no waveguiding could
occur [49]. Generally for the thermal regime, most of the ∆n observed were
negative ones making the writing of optical waveguides complicated [49].
Moreover, a self-organizing feature and ripple structures were observed by many
research groups [49, 176] in phosphate glasses following DLW, which makes the
writing of low loss waveguides nearly impossible. This indicates that the writing
window of type I smooth waveguides in the thermal regime is really narrow in
phosphate glasses. Moreover, it has been reported that the photo-induced ∆n in
phosphate and zinc phosphate glasses highly depends on the glass composition as
well as the laser parameters [49, 62, 132, 173]. Fletcher et al. investigated the
effect of the ratio O/P in zinc phosphate glasses and found that a ratio O/P=3.25 is
the ideal one for having positive ∆n and writing smooth waveguides [62, 132]. To
sum up, creating smooth type I modifications exhibiting positive ∆n in phosphate –
zinc phosphate glasses is complicated due to the multicomponent nature of the
glass and requires a fine optimisation of the laser parameters and/or the glass
composition.
III.3. Experimental methods
III.3.1. Glasses
The glasses used in this work are PZnAg2 with an O/P~3.37 and PZn with an
O/P~3.58 (see Table II-1). In fact, PZn glass is the same glass as PZnAg2 in which
the silver is replaced by Gallium. Therefore it is a non-containing-silver zinc

125
phosphate glass. For more information about the glass synthesis process, please
refer to section II.5.1.
III.3.2. Laser setup
For this work, two lasers were used: the T-pulse 200 with a high repetition rate
(9.8 MHz) for the DLW of type A waveguides; and a second laser, a Ti:Sapphire
amplified laser with low repetition rate (250 kHz, compared to T-pulse) for the DLW
of type I waveguides. The different laser parameters are summarized in Table III-1.
III.3.2.a. T-pulse 200
Direct laser writing of type A waveguides was performed using the T-pulse 200
laser which is a 9.8MHz repetition laser emitting at a 1030 nm wavelength with
pulse duration ~400 fs and energies in the range of 20 nJ to 120 nJ. For more
detail, the setup was already presented in section II.5.3
III.3.2.b. Ti:Saphhire REGA-Coherent
Direct laser writing of type I waveguides was performed using a chirped pulse
amplification system (Coherent RegA) operating at a low repetition rate of 250 kHz
(compared to the 9.8 MHz laser) emitting at a wavelength of 800 nm with 100 fs
pulse duration using a 50x-0.55NA Nikon microscope objective. Pulse energies from
0.5 to 2.5 µJ could be obtained using this setup. A quarter-wave plate was inserted
in the beam path and adjusted to obtain circularly polarized light. The glass sample
was mounted on a mechanical stage (Newport XML210 and GTS30V). In order to
have a circular waveguide, a cylindrical lens telescope was used (ellipticity of
a/b=1/8).

126
Figure III.1: Schematic presentation of the laser setup used for writing type I
waveguides.
Table III-1: Table summarizing the different laser parameters for both lasers used
in this chapter.
T-pulse 200 REGA
Repetition rate 9.8 MHz 250 kHz
Wavelength 1030 nm 800 nm
Pulse duration 400 fs 100 fs
Pulse energy 0.2 nJ→120 nJ 0.5 µJ→2.5 µJ
Fluence 0.8 J/cm2→4.75 J/cm2 33 J/cm2
→140 J/cm2
III.4. Results
III.4.1. Type I modification in silver containing and non-containing zinc phosphate glasses
Type I refractive index changes were created in both silver containing zinc
phosphate glass (PZnAg2) and non-containing-silver zinc phosphate glass (PZn),
each glass exhibiting a different O/P ratio of 3.37 and 3.58 respectively. The laser
used to perform the DLW is the Ti:Sapphire laser operating at 250 kHz while ∆n
was measured using the SID4Bio wave front sensor using a 50x-0.55NA objective
(for more detail, see section II.5.6). For certain parameters, a negative ∆n could be
observed for the PZnAg2 glass exhibiting an O/P ratio of 3.37 while a positive ∆n is
always observed for the PZn glass where the O/P ratio is 3.58 as shown in Figure
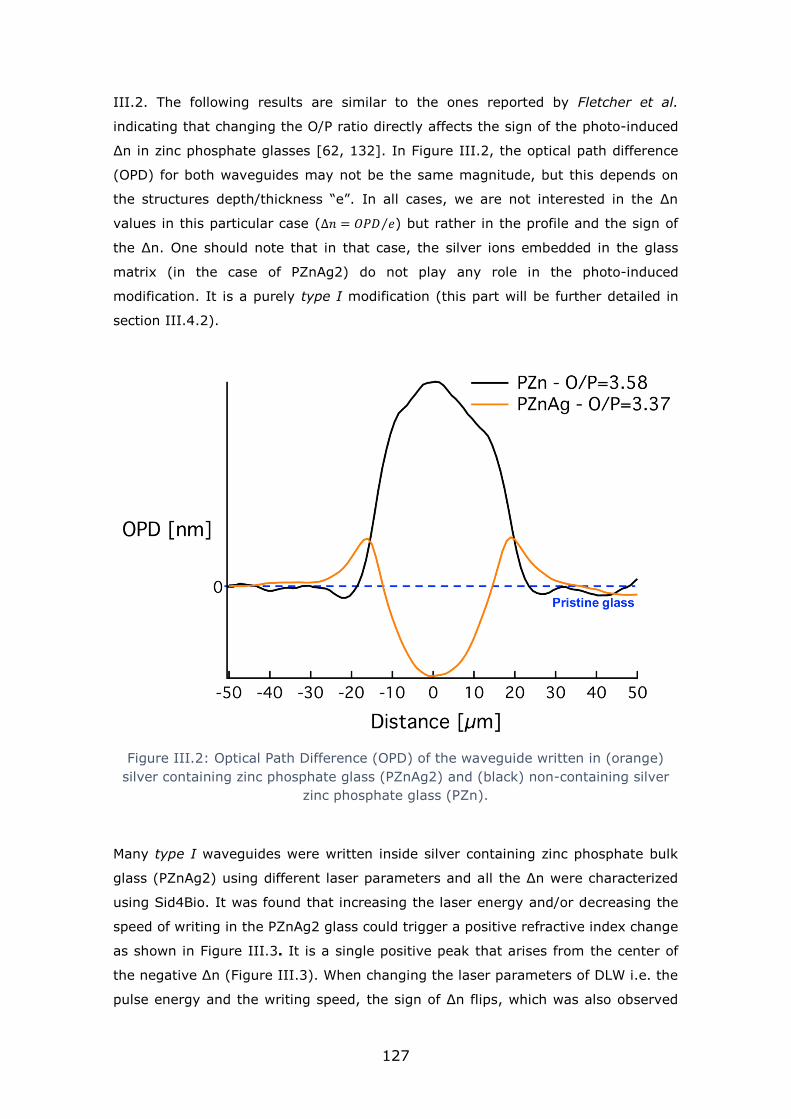
127
III.2. The following results are similar to the ones reported by Fletcher et al.
indicating that changing the O/P ratio directly affects the sign of the photo-induced
∆n in zinc phosphate glasses [62, 132]. In Figure III.2, the optical path difference
(OPD) for both waveguides may not be the same magnitude, but this depends on
the structures depth/thickness “e”. In all cases, we are not interested in the ∆n
values in this particular case (∆𝑛 = 𝑂𝑃𝐷 𝑒⁄ ) but rather in the profile and the sign of
the ∆n. One should note that in that case, the silver ions embedded in the glass
matrix (in the case of PZnAg2) do not play any role in the photo-induced
modification. It is a purely type I modification (this part will be further detailed in
section III.4.2).
Figure III.2: Optical Path Difference (OPD) of the waveguide written in (orange)
silver containing zinc phosphate glass (PZnAg2) and (black) non-containing silver
zinc phosphate glass (PZn).
Many type I waveguides were written inside silver containing zinc phosphate bulk
glass (PZnAg2) using different laser parameters and all the ∆n were characterized
using Sid4Bio. It was found that increasing the laser energy and/or decreasing the
speed of writing in the PZnAg2 glass could trigger a positive refractive index change
as shown in Figure III.3. It is a single positive peak that arises from the center of
the negative ∆n (Figure III.3). When changing the laser parameters of DLW i.e. the
pulse energy and the writing speed, the sign of ∆n flips, which was also observed

128
before by many research groups [49, 76, 89, 100, 172, 173]. Using a higher speed
of writing, i.e. lower number of pulses, tends to switch the ∆n from positive to
negative and vice versa. The ∆n flipping sign was also observed in borosilicate
glasses [172], fluoride glasses [89] and phosphate glasses [175] as a function of
the laser conditions used for DLW.

129
Figure III.3: Various optical path difference (OPD) profiles as a function of (a)
writing speed (b) pulse energy. The ∆n flips from negative to positive when
increasing the pulse energy or decreasing the writing speed.

130
However, that was not the case for the non-containing silver zinc phosphate glass
(PZn). For laser doses, i.e. pulse energy and writing speed, that are higher than the
type I modification threshold, all the observed ∆n were positive. However, the ∆n
profiles were not similar for all writing conditions. Figure III.4 shows the different
∆n profiles measured for different laser conditions. The profiles shown are the only
three possible profiles observed for different conditions. When writing with
relatively high pulse energy and low writing speed, the ∆n profile consists of three
positive peaks where the side peaks are related to the heat affected zone and the
middle peak dominates (Figure III.4.a). Writing using relatively medium pulse
energy and/or writing speed results in a single positive peak of ∆n (Figure III.4.b).
When using low pulse energy even with low speed, very weak single positive ∆n
peak is observed (Figure III.4.c). After that, no more modifications were observed
indicating that the laser conditions are lower than the type I modification threshold.

131
Figure III.4:Optical path difference (OPD) profiles of type I modification in non-
containing silver zinc phosphate glass as a function of the laser parameters. The
∆n is always positive.
To better understand the different ∆n behaviours for the non-containing silver
glass, a comparison between ∆n profiles for both glasses using the same laser
conditions (Ep=1µJ - v=1mm/s) is shown in Figure III.5. For the PZnAg2 glass, the
∆n is a single positive peak that is surrounded by two negative ∆n peaks that are
below the pristine glass. However, for PZn glass, the ∆n profile exhibits one
dominating single positive ∆n peak surrounded by two small positive ∆n peaks that
are above the pristine glass level. So over all, for PZn the ∆n is always positive,
which is not the case for PZnAg2. The two negative peaks in PZnAg2 glass are
more or less in the same spatial position of the two small positive peaks for PZn.
Comparing the behaviour of ∆n for both glasses, we see they both exhibit one main
single peak that decays as the applied laser dose decreases. But, for the PZnAg2,
the positive peak was surrounded by two negative ones. So when the positive peak
disappears, only the negative ∆n remains. However for PZn glass, when the single

132
positive peak disappears no more modification is observed. It could be related to
the Gallium effect given that more gallium is incorporated in the PZn glass matrix
or simply the difference in the O/P ratio.
Moreover, same DLW conditions were applied in an Argoglass (AG01) exhibiting an
O/P ratio of 2.95 different from the glasses PZnAg2 & PZn provided by ICMCB. No
positive ∆n was observed in Argoglass using the same conditions used for other
glasses. The following results match with what was reported earlier, that ∆n is
highly dependent of the glass composition as well as the laser irradiations in zinc
phosphate glasses.
As it turns out, zinc phosphate glasses are already multicomponent glasses before
the incorporation of silver ions and the ∆n highly depends on the glass composition
as well as the laser parameters, which makes it complicated to confirm the
response. This project does not aim at understanding and perfecting the creation of
type I waveguides. Therefore our investigation stopped at this point.

133
Figure III.5: Optical Path Difference (OPD) of the waveguide written in the same
conditions (Ep=1µJ - v=1mm/s) in (orange) silver containing zinc phosphate
glass (PZnAg2) and (black) non-containing silver zinc phosphate glass (PZn).
A more interesting study occurred, where the type I and type A waveguides were
written in the same silver containing zinc phosphate glass (PZnAg2) by using two
different lasers i.e. two different writing regimes. The comparison was based on the
morphology structures, ∆n and mode profiles for single mode waveguides operating
at 660 nm wavelength.
III.4.2. Structure morphology
A series of Type I waveguides were written typically ~160 µm below the surface of
a silver containing (PZnAg2) glass (for details see section II.4) while changing the
laser parameters. The pulse energy was changed from ~0.65 µJ to ~1 µJ while the
writing speeds varied between 1 mm/s, 5 mm/s, 10 mm/s and 25 mm/s. Some
waveguides were multimode and few were single mode but all exhibited more or
less the same morphology. In the following work, only the single mode (SM)
waveguide is fully characterized and compared to the type A single mode
waveguide. Under white light illumination, the top view reveals a single smooth line
modification that is typical of type I modification (Figure III.6.a.i). From the side
view, a white colored roughly triangular shape waveguide was observed that is

134
surrounded by a dark circle as shown in Figure III.6.a.iii. The white color
corresponds to a positive ∆n while the dark one corresponds to a negative ∆n
acting as a cladding. The same shape of structures i.e. waveguide with a
surrounding cladding was also observed by many research groups in the thermal
regime in Eagle 2000 glasses [85, 177, 178]. More details are be presented in
section III.4.3. Under UV-blue excitation, a very weak fluorescence (compared to
type A structures) was observed to be surrounding the waveguide as shown in
Figure III.6.a.iv. The weak fluorescence indicates the formation of very few silver
clusters following DLW. Given that the DLW is performed using a low repetition
laser (compared to 9.8MHz) and high speeds, the conditions for the creation and
aggregation of silver clusters were not met. The presence of few silver clusters on
the edges indicates that the high temperature in the middle as well as the high
laser intensity did not allow the formation of the silver clusters i.e. photo-
dissociation. Therefore few were only formed on the edges. And so, we can assume
that the overall modification is purely based on type I modification.
Figure III.6, shows a comparison between the morphology and fluorescence
aspects between type A and type I waveguides. One can observe that the type A
waveguide exhibits smaller structures compared to the type I. A noticeable heat
affected zone is present in the case of type I waveguides when compared to the
non-existing one in type A modification. This indicates that the writing regime in
that case is a thermal one given that the modified zone is larger than the laser focal
spot size. The type I waveguide exhibited structures of ~24 µmx38 µm compared
to 3 µm x 6 µm for the type A waveguide. However, the type I waveguide exhibited
a more circular waveguide (which is due to the cylindrical lens telescope used)
compared to an elliptical type A waveguide.

135
Figure III.6: Top view white light illumination (a.i) for type I waveguide, (b.i) for
typical type A waveguide. Top view fluorescence (a.ii) for type I waveguide, (b.ii)
for typical type A waveguide. Side view white light illumination (a.iii) for type I
waveguide, (b.iii) for typical type A waveguide. Side view fluorescence image of
(a.iv) for type I waveguide, (b.iv) for typical type A waveguide.
III.4.3. Refractive index and mode profiles
The refractive index change (∆n) was measured using SID4bio (see section II.5.6
for more details) for the SM type I waveguide, as shown in Figure III.7.a. A smooth
single line was observed from the top view, which is typical of type I modification
(Figure III.7a.i). The ∆n profile extracted from the phase image showed a single
positive ∆n peak of ~2x10⁻³. This value was measured from the highest peak to the
lowest level of the positive ∆n peak located inside the ∆n negative region, as shown
in Figure III.7.a.ii. The surrounding negative ∆n region acts as a waveguide
cladding. Going back to the bright field side view photo of the waveguide that is
shown in the inset of Figure III.7.b.ii. and based on the measured ∆n profile, the
dark region corresponds to a negative ∆n while the white one corresponds to a
positive one. Compared to the glass pristine refractive index, the positive peak
exists below it. The DLW process induces a strong negative ∆n on the borders of
the interaction voxel but a positive peak in the center (Figure III.7b.ii). Moreover,
Figure III.7 shows the top view phase image as well as the ∆n profile for a type A
waveguide to be compared with Figure III.7.b. For type A modification, one laser
passage induces the creation of double lines exhibiting two positive ∆n peaks
compared to one single positive ∆n peak for the type I.
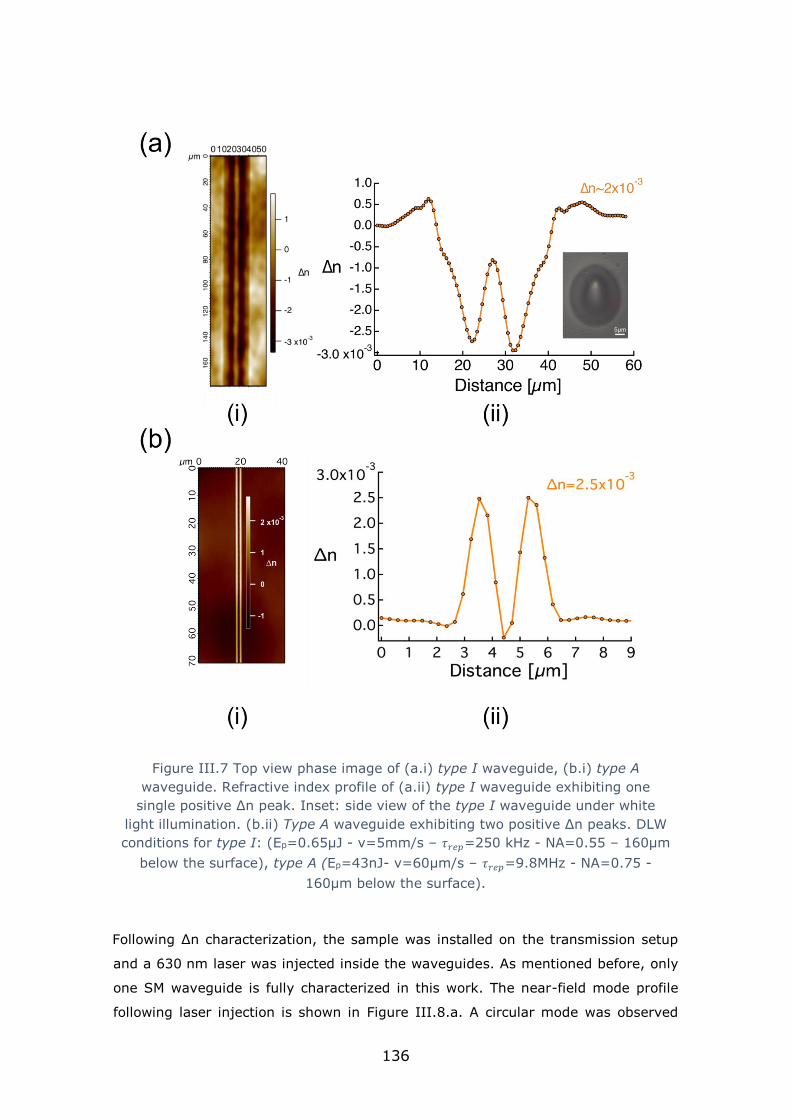
136
Figure III.7 Top view phase image of (a.i) type I waveguide, (b.i) type A
waveguide. Refractive index profile of (a.ii) type I waveguide exhibiting one
single positive ∆n peak. Inset: side view of the type I waveguide under white
light illumination. (b.ii) Type A waveguide exhibiting two positive ∆n peaks. DLW
conditions for type I: (Ep=0.65µJ - v=5mm/s – 𝜏𝑟𝑒𝑝=250 kHz - NA=0.55 – 160µm
below the surface), type A (Ep=43nJ- v=60µm/s – 𝜏𝑟𝑒𝑝=9.8MHz - NA=0.75 -
160µm below the surface).
Following ∆n characterization, the sample was installed on the transmission setup
and a 630 nm laser was injected inside the waveguides. As mentioned before, only
one SM waveguide is fully characterized in this work. The near-field mode profile
following laser injection is shown in Figure III.8.a. A circular mode was observed

137
that is the fundamental mode LP01. Horizontal and vertical line profiles indicate that
the mode is a Gaussian one ~4.5µmx5.2µm, almost a round mode. Even though
the waveguide exhibited large dimensions of ~24 µm x 38 µm, yet the guiding
region is only around ~5 µm x 5 µm. The guiding region is where the ∆n is positive
and is the white region in the side view bright field image (Figure III.6.b.iii). The
large dimensions of the waveguide are due to the heat affected zone that is
generated following DLW and does not support waveguiding.
Compared to the type A fundamental mode (Figure III.8.b), one can see the
difference. The type A near-field mode is an elliptical supermode that tends to be
an LP01 supported by two highly interacting waveguide modes. However the type I
near-field mode is a circular LP01 mode. One should not forget that the in the case
of writing type I waveguides, the beam was shaped using a cylindrical lens
telescope in order to obtain circular waveguides, which was not the case for type A
waveguides. In terms of dimensions, they are comparable. The type A guided mode
is ~3 µm x 5.5 µm compared to ~4.5 µm x 5.2 µm for the type I waveguide. For
the guiding losses, type I losses were estimated to be ~4.5 dB/cm (same method
used for estimating the propagation losses for type A, sectionII.6.3) which is quite
high, especially compared to type A waveguides exhibiting upper losses of
1.2 dB/cm. The high losses in type I waveguides could be explained by the
inhomogeneity of the glass sample as well as the defects during DLW. In addition to
that, self-periodic ripples were sometimes observed for the waveguides, which is
also one of the reasons for the high losses. Anyway, no further efforts were put into
creating low loss type I waveguides given that this was not the aim of this project.
Yet, waveguides exhibiting low losses, lower than 0.4 dB/cm were reported by
many research groups in phosphate/zinc phosphate glasses [63, 134].

138
Figure III.8: Near-field mode profile following the injection of a 630nm laser for
(a.i) Type I waveguide (b.i) Type A waveguide. Normalized horizontal intensity of
(a.ii) type I waveguide (b.ii) type A waveguide. Normalized vertical intensity of
(a.iii) type I waveguide (b.iii) type A waveguide. DLW conditions for type I:
(Ep=0.65µJ - v=5mm/s – 𝜏𝑟𝑒𝑝=250 kHz - NA=0.55 – 160µm below the surface),
Type A (Ep=43nJ- v=60µm/s – 𝜏𝑟𝑒𝑝=9.8MHz - NA=0.75 - 160µm below the
surface).
Finally, type I waveguides exhibited a heat affected zone referring to a thermal
regime while the type A waveguides exhibited no heat affected zone referring to an
athermal regime. Generally, thermal regimes are related to higher repetition rates
compared to athermal regimes but not in this case. In fact, it depends not only on
the repetition rate but also on the pulse energy. In the case of type I, the pulse
energy is in the order of µJ compared to nJ in the type A. The type A modification is
based on the photo-chemistry in the glass matrix whereas the type I modification is
based on the melting and reconstruction of the glass matrix itself. The type A
modification occurs in an extrinsic way to the glass matrix acting only on the silver
ions and forming silver clusters compared to type I which is an intrinsic
modification, heating the glass above the Tg, melting, reconstructing and changing
the initial properties of the glass itself.
III.4.4. Flipping ∆n
As reported in section III.4.1, the type I ∆n flips as a function of the laser
parameter (Figure III.3), which makes the DLW of waveguides more complicated in
this case. However, type A modifications are always positive, exhibiting two positive
peaks as long as the laser irradiance used is higher than the type A modification
threshold. Figure III.9 shows that the type A OPD is constantly positive for all the
laser parameters which is not the case for type I modification reducing the

139
complication of writing waveguides. In Figure III.9, all the OPD’s presented may
exhibit the same amplitude for different laser parameters but one should not forget
that the ∆n is calculated from the OPD using the following equation ∆n = OPD e⁄ .
Moreover, as mentioned before, the thickness of the structures changes as a
function of the laser parameters (see Figure II.42). Therefore the ∆n is surely not
the same for the different laser parameters. The purpose of Figure III.9 is to show
that for all laser parameters, the photo-induced type A ∆n is a positive one.
Figure III.9: Optical path difference (OPD) profiles as a function of (a) laser
irradiance (b) writing speed. The type A ∆n is always positive no matter what the
laser conditions are. Pulse energies: 30 nJ → 50 nJ.
Some type I waveguides exhibited negative ∆n with different morphology compared
to the type I waveguide with positive ∆n. The bright field images under white light
illumination reveals a single circular waveguide shape Figure III.10.a and the
fluorescence surrounded the whole waveguide as shown in Figure III.10.b, which
was not the case in positive ∆n waveguides (Figure III.6). The circular shape is
dark under WL illumination referring to a negative ∆n. Furthermore, the intensity
fluorescence was more intense compared to positive ∆n waveguides, which refers
to the creation of more silver clusters in this case. Writing in higher speed or lower
pulse energies result in depositing lower laser doses in the glass. The latter
conditions were more conducive to the creation of silver clusters in the periphery of
the waveguide. The waveguides exhibiting negative ∆n did not support waveguiding

140
of course, however, on the periphery, where the silver clusters are present, a weak
guiding was observed as shown in Figure III.10.c. As mentioned in Chapter II the
photo-induced silver clusters are responsible for a positive ∆n in silver containing
glasses. Therefore, the presence of these clusters around the waveguide even in
small quantities (compared to the ideal conditions as shown in Chapter II) exhibited
weak guiding properties. To have a better idea, the top view phase image using
SID4Bio wave front were achieved on the waveguides exhibiting negative ∆n. A
smooth single negative peak was observed with two small positive ∆n bumps on
the periphery of the waveguide as shown in Figure III.10.d. The two small positive
∆n bumps on the periphery are directly correlated to the presence of silver clusters
around the waveguide as shown in Figure III.10.b. Therefore, once again, the silver
clusters even in small quantities are responsible for a positive ∆n in silver
containing glasses. In the following conditions, negative type I modification was
created in the glass as well as a weak positive type A on the periphery on the
interaction voxel. However, the writing conditions were conducive to the creation of
type I instead of type A given that we are working in the low repetition rate regime.
One should mention that the smaller amount of silver clusters formed in the case of
positive ∆n waveguides were not enough to support guiding.

141
Figure III.10: Side view of a type I waveguide exhibiting negative ∆n (a) under
white light illumination; (b) fluorescence image under blue excitation and
emission in the visible range; (c) guided mode profile following laser injection at
630 nm. The dashed lines indicates the location of the waveguide. A small portion
of light is guided on the side of the waveguide. (d) Refractive index change
profile of the waveguide exhibiting a negative one. DLW parameters: 0.65µJ-
25mm/s.
Overall, the two lasers used in this work provided two totally different regimes each
one responsible for the creation of a type of modification. Summarizing both laser
parameters, one can see and understand the difference in the presence of two
different regimes/modifications. Figure III.11 shows the ranges of the laser fluence,
laser irradiance and the energy density deposited by voxel for both lasers. The T-
pulse laser parameters used allowing the creation of type A modification presented
very low laser fluence, laser irradiance as well as energy deposited by voxel
compared to the Ti:Saphire laser which presented much higher values, more than 3
orders of magnitude larger for instance in the case of the energy density deposited
by voxel. The details of calculations of the values of the laser fluence, laser

142
irradiance as well as the energy density deposited by voxel are presented in the
Appendix part A.4. As mentioned before, even though the T-pulse laser exhibits a
high repetition rate of 9.8 MHz the writing regime is an athermal one in this case
compared to a thermal regime for the Ti:Sapphire laser exhibiting a low repetition
rate of 250 kHz. Generally, thermal regimes are linked to high repetition rate lasers
compared to the athermal regimes where low repetition rate lasers are used, which
is not the case in this experiment. Given that pulse energies used in the case of the
T-pulse are in the few nanoJoule (nJ) range compared to microJoule (µJ) pulses for
the Ti:Sapphire and comparing the density of energy deposited by voxel between
both lasers, one can easily understand why. Furthermore, calculating ∆𝑇, which is
the highest temperature difference that occurs in one point induced by one laser
pulse for both cases, confirms our claim. For the parameters used with the T-pulse
200, a maximum ∆𝑇=10K was calculated compared to a very high value of ∆𝑇 in the
case of the parameters used with the Ti:Sapphire laser. The calculation used for
the T-pulse are not completely compatible for calculating high energies provided by
the Ti:Spahhire laser. Therefore we limited our calculation to the maximum pulse
energy used, which is 1 µJ (see Appendix part A.4). Obviously, no heat affected
zone was noticed for type A modification ,which is well expected with a low ∆𝑇 while
for type I, the glass heats and melts resulting in the creation of a heat affected
zone i.e. the modification zone is larger than the laser spot.

143
Figure III.11: Laser parameters for both lasers: (orange) T-pulse 200 which
induces type A modification (blue) Ti:Sapphire which induces type I modification
(a) laser fluence, (b) laser irradiance, (c) calculated laser dose deposited as a
function of the writing speed.
In closing this discussion, one can say that wisely choosing the laser parameters
and the laser regime, either type A or type I modification could be triggered in
silver containing glasses. The type A modification is an extrinsic modification where
the laser energy acts on the photo-chemistry inside the glass matrix by photo-
exciting the pre-existing silver ions Ag+ and developing the silver clusters Agmx+
responsible for the positive ∆n in this case. Type I modification is an intrinsic
modification acting on the glass matrix itself, where the laser energy heats (above
Tg) and melts the glass and reconstructs it as a new glass exhibiting a ∆n that could
be positive or negative depending on the glass composition as well as the laser
parameters. Type A modification clearly occurs in the low pulse energy regime
compared to the type I modification. Therefore we can introduce to the community
a new type of modification/refractive index called type A that exists well below the
type I modification in the pulse energy regime and can be added to the ∆n
classifications as shown in Figure III.12.
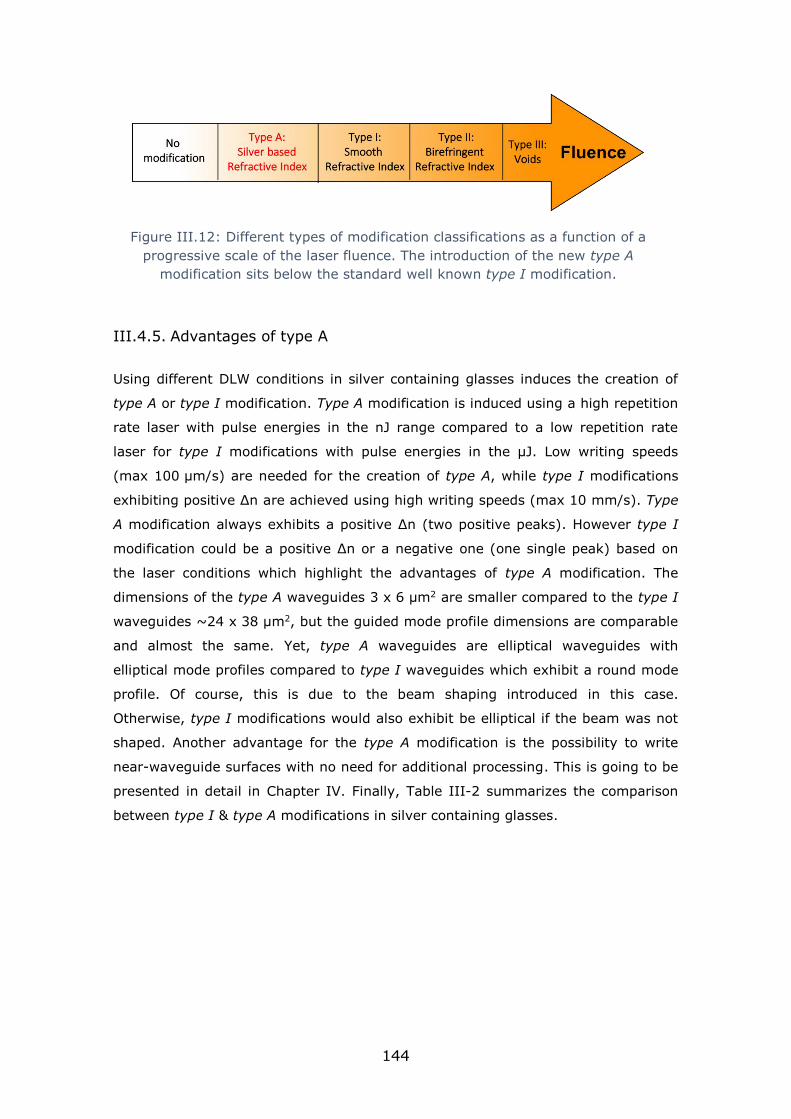
144
Figure III.12: Different types of modification classifications as a function of a
progressive scale of the laser fluence. The introduction of the new type A
modification sits below the standard well known type I modification.
III.4.5. Advantages of type A
Using different DLW conditions in silver containing glasses induces the creation of
type A or type I modification. Type A modification is induced using a high repetition
rate laser with pulse energies in the nJ range compared to a low repetition rate
laser for type I modifications with pulse energies in the µJ. Low writing speeds
(max 100 µm/s) are needed for the creation of type A, while type I modifications
exhibiting positive ∆n are achieved using high writing speeds (max 10 mm/s). Type
A modification always exhibits a positive ∆n (two positive peaks). However type I
modification could be a positive ∆n or a negative one (one single peak) based on
the laser conditions which highlight the advantages of type A modification. The
dimensions of the type A waveguides 3 x 6 µm2 are smaller compared to the type I
waveguides ~24 x 38 µm2, but the guided mode profile dimensions are comparable
and almost the same. Yet, type A waveguides are elliptical waveguides with
elliptical mode profiles compared to type I waveguides which exhibit a round mode
profile. Of course, this is due to the beam shaping introduced in this case.
Otherwise, type I modifications would also exhibit be elliptical if the beam was not
shaped. Another advantage for the type A modification is the possibility to write
near-waveguide surfaces with no need for additional processing. This is going to be
presented in detail in Chapter IV. Finally, Table III-2 summarizes the comparison
between type I & type A modifications in silver containing glasses.

145
Table III-2: Table summarizing the comparison between type I and type A
modification
Type I Type A
Low repetition rate 250 kHz, µJ pulses High repetition rate 9.8 MHz, nJ pulses
High writing speed(mm/s) Low writing speed (µm/s)
Round waveguide due to beam
shaping Elliptical waveguide shape
Large heat affected zone
(Thermal regime)
No heat affected zone
(Athermal regime)
One positive ∆n peak Two positive ∆n peaks
Circular mode profile Elliptical mode profile
Flipping ∆n as a function of DLW
parameters ∆n always positive
Additional processing for near surface
waveguides
Near surface waveguides with no
additional processing

146
III.5. Conclusion
Direct laser writing of type I modification/refractive index change was performed in
both silver-containing and non-silver-containing zinc phosphate glass exhibiting
different O/P ratio. Negative ∆n could be observed for the silver-containing glass
compared to an always positive ∆n in non-silver-containing glass which is probably
related to the difference in the O/P ratio which was also reported by other research
groups.
On the other hand, in silver containing glasses, wisely choosing the laser
parameters and regime, either type A or type I modifications could be triggered.
The type I modification occurs in the thermal regime with high laser fluence using a
low repetition laser (250 kHz) compared to an athermal regime for type A
modification using with a low laser fluence using a high repetition rate laser
(9.8 MHz). A morphology comparison between two single mode waveguides of each
type shows a large heat affected zone for type I modification compared to a non-
existing one for type A. The overall waveguide dimensions are ~24 µm x 38 µm
and 3 µm x 6 µm respectively for type I and type A waveguides. However, the
guided mode profile dimensions are comparable given that the guiding region in the
case of type I is around ~5 µm2 exhibiting a circular mode profile compared to an
elliptical one for type A (3 µm x 5.5 µm). Moreover, type I modification flips from
positive to negative as a function of the laser parameters whereas the type A
modification is always a positive one. Finally, we reported a new type of
modification/refractive index change called type A (from the Latin name of silver,
Argentum), based on the creation of the silver clusters that occur in the low pulse
energy regime sitting well below the type I modification regime. This new type
exhibits many advantages compared to type I: always positive ∆n for different laser
parameters, smaller dimensions and occurring in the low pulse energy regime that
could be used for writing near surface waveguides, paving the way for sensing
applications, as will be presented in Chapter IV.

147
148
Table of contents:
IV. Direct laser writing of rising near-surface waveguides in silver
containing glasses with no additional processing ........................ 150
IV.I Introduction ...................................................................... 150
IV.2 Evanescent wave theory .................................................... 152
IV.3 Evanescent wave based sensors ........................................ 154
IV.3.1 Refractive index sensors ........................................................ 155
IV.3.1.a RI sensors using DLW ............................................................ 159
IV.4 Experimental methods....................................................... 166
IV.4.1 Glass .................................................................................. 166
IV.4.2 Laser setup ......................................................................... 166
IV.5 Results .............................................................................. 167
IV.5.1 Writing near surface waveguides ............................................ 167
IV.5.2 RI sensor ............................................................................ 176
IV.6 Conclusion ......................................................................... 182

149

150
Chapter IV
Direct laser writing of rising near-surface
waveguides in silver containing glasses with
no additional processing
IV.1. Introduction
In the past years, the use of fiber optics for sensing applications (gases, liquids)
has attracted strong interest. Optical sensing provides in-situ, fast, selective,
remote, real time and non-destructive sensing. It is generally based on the
interaction of light with the outer medium. When light propagates in an optical
fiber, a portion propagates in the cladding. It is called evanescent wave. Fiber
sensors are based on the evanescent wave interaction with the outer medium.
Many evanescent wave based fiber sensors were created in the past years for gas
[179], chemical detection [180, 181] and refractive index sensing [182-184].
However, to manufacture those sensors, the fiber should be tapered or a part of
the cladding should be removed to reveal the sensing medium. Generally gas and
chemical sensors are rather based on the absorption of the evanescent wave by the
outer medium (complex part of the refractive index). However this phenomenon
plays a minor role in refractive index sensors. These rather rely on the mode
confinement (positive part of the refractive index) between the inner and outer
medium (glass-liquid).
The Direct Laser Writing (DLW) technique is a well-established technique allowing
to directly address 3D structures inside materials. More specifically, waveguides
[62, 71, 86, 89, 123, 162, 185] and optical components [124] were written
embedded inside glasses using DLW. Yet just a few works were reported on written
waveguides near the glass surface [91, 169]. This is due to the ablation that occurs
when writing near the surface given that the modification threshold decreases when
approaching the glass surface [186]. The need to write near-surface optical
components is to make the light interact with the outer medium in order to create

151
miniaturized sensors in glasses. However, few works report the creation of sensors
based on the DLW technique [187, 188].
In the first part of this chapter, DLW of rising near-surface waveguides in silver
containing glasses are reported with no need for additional processing. For the
second part, the waveguides written are used to create a refractive index sensor in
a ~1 cm glass chip with no need for etching or any additional process.
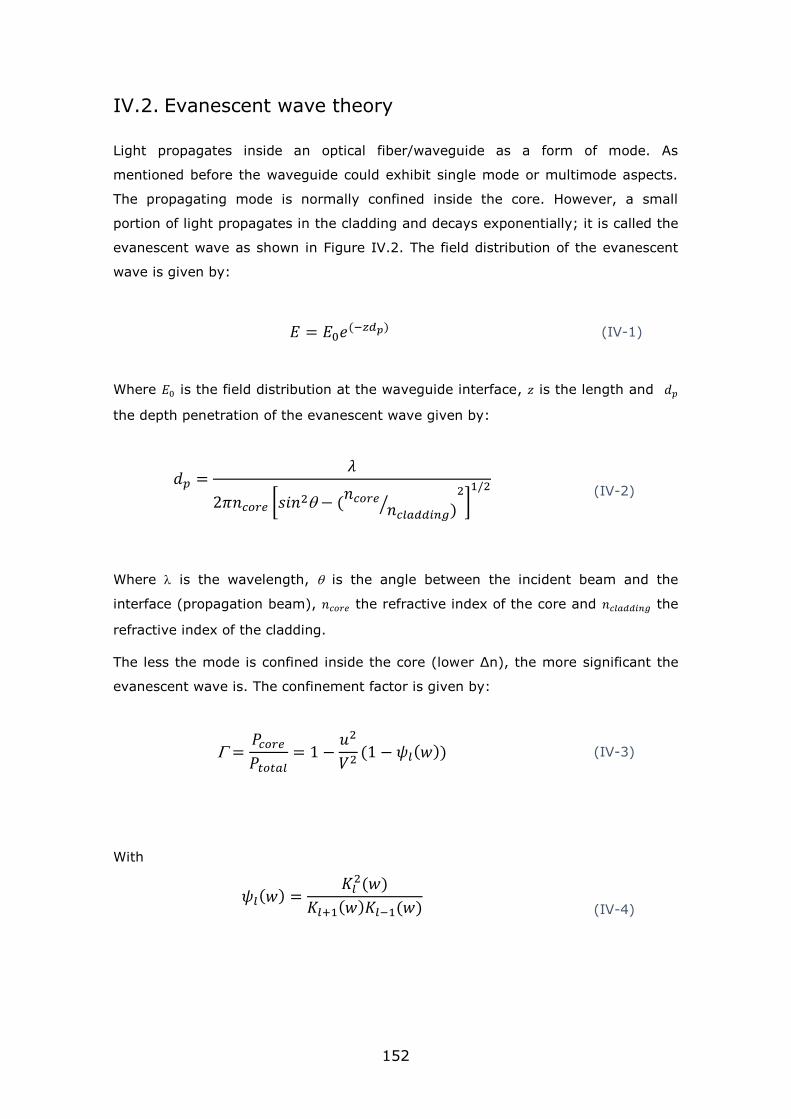
152
IV.2. Evanescent wave theory
Light propagates inside an optical fiber/waveguide as a form of mode. As
mentioned before the waveguide could exhibit single mode or multimode aspects.
The propagating mode is normally confined inside the core. However, a small
portion of light propagates in the cladding and decays exponentially; it is called the
evanescent wave as shown in Figure IV.2. The field distribution of the evanescent
wave is given by:
𝐸 = 𝐸0𝑒(−𝑧𝑑𝑝) (IV-1)
Where 𝐸0 is the field distribution at the waveguide interface, 𝑧 is the length and 𝑑𝑝
the depth penetration of the evanescent wave given by:
𝑑𝑝 =𝜆
2𝜋𝑛𝑐𝑜𝑟𝑒 [𝑠𝑖𝑛2− (𝑛𝑐𝑜𝑟𝑒
𝑛𝑐𝑙𝑎𝑑𝑑𝑖𝑛𝑔)⁄
2]1/2
(IV-2)
Where is the wavelength, is the angle between the incident beam and the
interface (propagation beam), 𝑛𝑐𝑜𝑟𝑒 the refractive index of the core and 𝑛𝑐𝑙𝑎𝑑𝑑𝑖𝑛𝑔 the
refractive index of the cladding.
The less the mode is confined inside the core (lower ∆n), the more significant the
evanescent wave is. The confinement factor is given by:
=𝑃𝑐𝑜𝑟𝑒
𝑃𝑡𝑜𝑡𝑎𝑙= 1 −
𝑢2
𝑉2(1 − 𝜓𝑙(𝑤)) (IV-3)
With
𝜓𝑙(𝑤) =𝐾𝑙
2(𝑤)
𝐾𝑙+1(𝑤)𝐾𝑙−1(𝑤)
(IV-4)

153
Where 𝑃𝑐𝑜𝑟𝑒 is the power inside the core, 𝑃𝑡𝑜𝑡𝑎𝑙 the total power injected in the fiber, 𝑢
and 𝑤 the normalized transverse parameters in the core and in the cladding
respectively, 𝑉 fiber parameter given by (II-7) and 𝐾𝑙(𝑤) is the second order of
Bessel function where 𝑙 is the azimuthal parameter of the LPlm propagating modes.
The confinement factor for the fundamental mode LP01 propagating in an optical
fiber has been simulated as a function of 𝑉, the fiber parameter as depicted in
Figure IV.1: the higher the V parameter the higher the confinement of the mode.
Thus, 𝑉 is proportional to the fiber radius a and to the numerical aperture NA of the
waveguide, V = 2πa
λNA (II-5). So, in order to further extend the evanescent wave
i.e. minimize the confinement of the propagating mode to increase the interaction
with the outer medium, one can either reduce the fiber radius and/or the ∆n
between the core and the cladding (to reduce 𝑉). Given that the ∆n in fiber optics
are generally fixed values, researchers tend more to reduce the fiber dimensions by
tapering it to enhance the sensitivity, as will be presented in section IV.3.
Figure IV.1: Simulations of the confinement factor as a function of the V
parameter of the fiber for an LP01 mode. The confinement of the mode increases as
the V parameter increases.
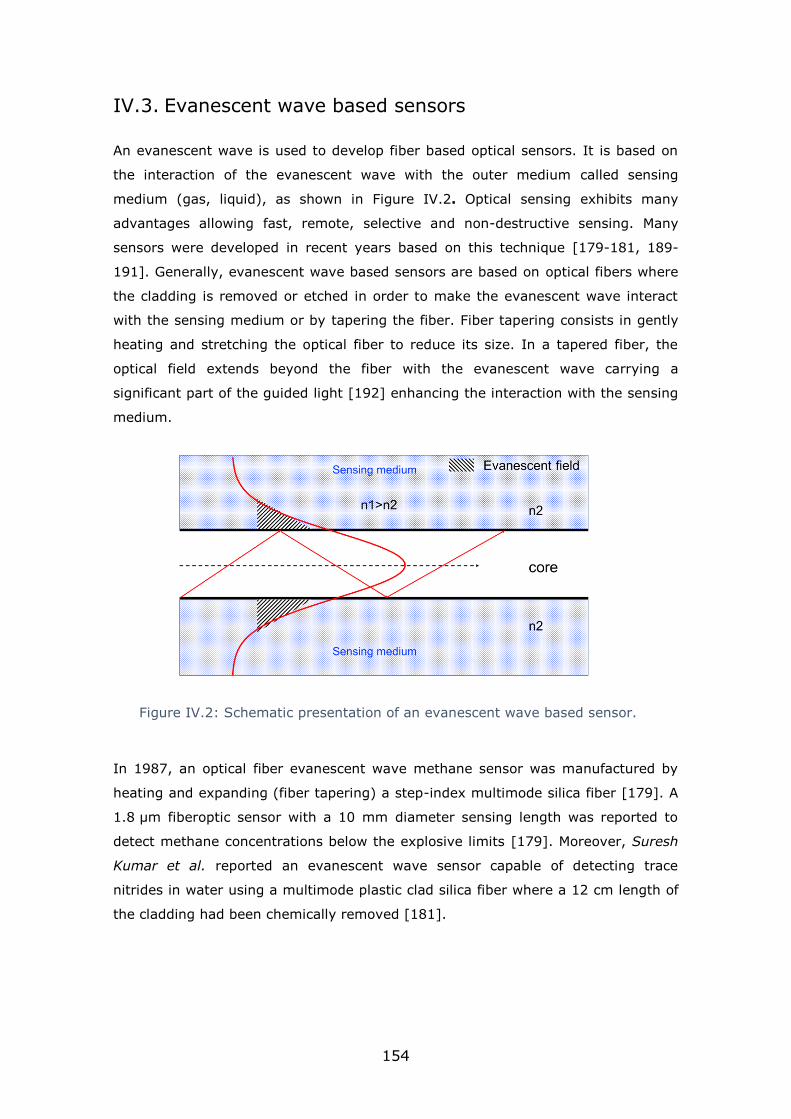
154
IV.3. Evanescent wave based sensors
An evanescent wave is used to develop fiber based optical sensors. It is based on
the interaction of the evanescent wave with the outer medium called sensing
medium (gas, liquid), as shown in Figure IV.2. Optical sensing exhibits many
advantages allowing fast, remote, selective and non-destructive sensing. Many
sensors were developed in recent years based on this technique [179-181, 189-
191]. Generally, evanescent wave based sensors are based on optical fibers where
the cladding is removed or etched in order to make the evanescent wave interact
with the sensing medium or by tapering the fiber. Fiber tapering consists in gently
heating and stretching the optical fiber to reduce its size. In a tapered fiber, the
optical field extends beyond the fiber with the evanescent wave carrying a
significant part of the guided light [192] enhancing the interaction with the sensing
medium.
Figure IV.2: Schematic presentation of an evanescent wave based sensor.
In 1987, an optical fiber evanescent wave methane sensor was manufactured by
heating and expanding (fiber tapering) a step-index multimode silica fiber [179]. A
1.8 µm fiberoptic sensor with a 10 mm diameter sensing length was reported to
detect methane concentrations below the explosive limits [179]. Moreover, Suresh
Kumar et al. reported an evanescent wave sensor capable of detecting trace
nitrides in water using a multimode plastic clad silica fiber where a 12 cm length of
the cladding had been chemically removed [181].

155
IV.3.1. Refractive index sensors
More specifically, refractive index (RI) sensors were manufactured by many
research groups in fiberoptics [182-184, 191, 193, 194]. Given that Bragg gratings
are so sensitive to the variation of the refractive index change, many RI sensors
were based on the creation of Bragg gratings. Chong et al. developed a long period
grating (LPG) in a B-Ge co-doped fiber where the resonant wavelengths shift as the
refractive index changes [193]. Chryssis et al. developed an RI sensor based on
Fiber Bragg Gratings (FBG) [191] where the cladding of a commercial fiber grating
was etched to enhance the sensitivity of the sensors. The change in the refractive
index in the sensing medium is detected by the shift of the Bragg wavelength.
However, RI sensors were also developed without relying on Bragg Gratings.
Indeed, in 2005, Polynkin et al. reported a RI sensor based on a tapered SMF 28.
The tapered fiber was placed in a polymer and a wide channel, 1 cm long by 3 mm
wide (sensing medium), was manufactured as shown in Figure IV.3 [182].
Figure IV.3: Schematic presentation of the sensor. Taken from [182].
Two tapered fibers were tested, one exhibiting a taper thickness at the waist of
~1.6 µm and another of ~700 nm. Several RI liquids were applied inside the
channel to test the response of such sensors. The results are shown in Figure IV.4.
It was found that for both fibres, the transmission is maximum when the liquid
matches the RI of the surrounding polymer while the thinner taper exhibited a
higher sensitivity to RI modifications.
They described the sensing mechanism as the following: the shape of the guided
mode is affected by the surrounding medium i.e. the RI liquid used. If the RI of the
liquid is higher than the cladding’s RI (polymer in this case), the mode is ejected
outside the polymer where it will be scattered by the channel and absorbed by the
liquid. However, if the RI is lower, the mode propagates with no significant changes
[182].

156
Figure IV.4: Variation of the optical transmission for different refractive index
liquids for taper thickness of (1) ~1.6 µm (2) ~700 nm. Taken from [182].
Another similar work was reported in 2010 by Bilro et al [183] in a multimode
plastic optical fiber. A part of the cladding was removed in order to create and
reveal the sensing medium. It was an oval shape with a length of 19.35 mm and a
diameter of 0.65 mm, as shown in Figure IV.5.
Figure IV.5: (a) Transverse cut of the plastic fiber. (b) Top view of the polished
section. (c) Side view of the polished section. Due to the mismatch between the
refractive index liquids and the fiber core, part of the beam is lost (2) by refraction
in the sensing zone (3) guided by internal reflection. Taken from [183].
A theoretical model was suggested to be fitted with experimental results. The
model is based on Fresnel’s equation [98] of light bouncing inside a multimode
optical fiber.
In the case of a dielectric medium, the equations could be reformulated in terms of
the incident/propagation angle 𝜃, the refractive index of the core 𝑛𝑐𝑜𝑟𝑒 and the
refractive index of the surrounding medium 𝑛𝑒𝑥𝑡.

157
The amplitude reflection coefficients of perpendicular 𝑟⊥ and parallel 𝑟∥ polarization
to the plane of incidence are given by:
𝑟⊥ =
𝑠𝑖𝑛𝜃 − √(𝑛𝑒𝑥𝑡
𝑛𝑐𝑜𝑟𝑒)2 − 𝑐𝑜𝑠2𝜃
𝑠𝑖𝑛𝜃 + √(𝑛𝑒𝑥𝑡
𝑛𝑐𝑜𝑟𝑒)2 − 𝑐𝑜𝑠2𝜃
(IV-5)
𝑟∥ =
(𝑛𝑒𝑥𝑡
𝑛𝑐𝑜𝑟𝑒)2𝑠𝑖𝑛𝜃 − √(
𝑛𝑒𝑥𝑡
𝑛𝑐𝑜𝑟𝑒)2 − 𝑐𝑜𝑠2𝜃
(𝑛𝑒𝑥𝑡
𝑛𝑐𝑜𝑟𝑒)2𝑠𝑖𝑛𝜃 + √(
𝑛𝑒𝑥𝑡
𝑛𝑐𝑜𝑟𝑒)2 − 𝑐𝑜𝑠2𝜃
(IV-6)
The intensity reflection coefficient of the unpolarised light can be calculated by:
𝑅 =|𝑟⊥|2 + |𝑟∥|
2
2 (IV-7)
As mentioned in section II.3.1.a, the waveguiding process occurs if the incident
beam is lower or equal to the critical angle 𝜃𝑐. The injected light was approximated
to a Lambertian source of light [195]; the input power of each ray is dependent of
the angle 𝜃 of propagation inside the fiber and assumed proportional to cos 𝜃.
Another consideration is that the beam guided in the fiber undergoes multiple
internal reflections (the case of a multimode fiber), which is related to the
propagation angle 𝜃, the dimension of the sensing medium i.e. the length 𝐿 and the
section 𝐷. Therefore, the number of reflections is given by:
𝑁 =𝐿𝑡𝑎𝑛𝜃
2𝐷 (IV-8)
After immersing the fiber in the liquids, the power remaining in the fiber after the
sensing medium is:
𝑃𝑜𝑢𝑡 ∝ ∫ 𝑅𝑛𝑒𝑥𝑡
𝑁(𝜃)𝑐𝑜𝑠𝜃 𝑠𝑖𝑛𝜃 𝑑𝜃
𝜃𝑐
0
(IV-9)
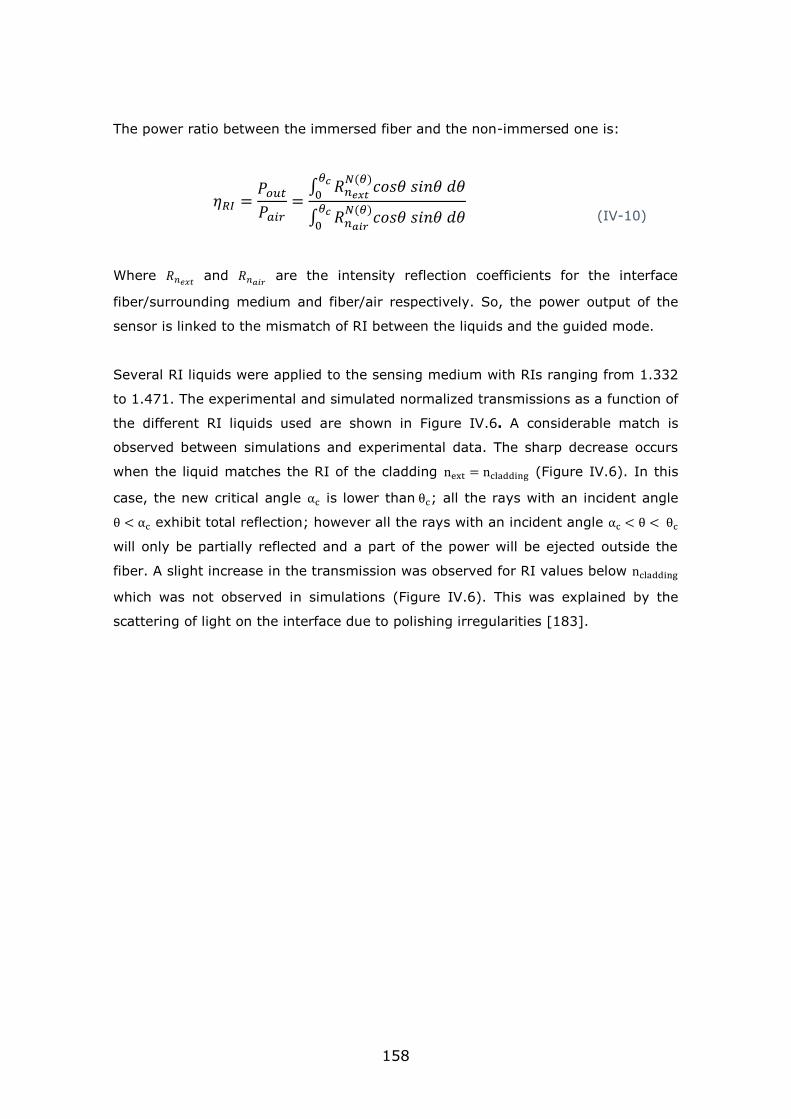
158
The power ratio between the immersed fiber and the non-immersed one is:
𝜂𝑅𝐼 =𝑃𝑜𝑢𝑡
𝑃𝑎𝑖𝑟=
∫ 𝑅𝑛𝑒𝑥𝑡
𝑁(𝜃)𝑐𝑜𝑠𝜃 𝑠𝑖𝑛𝜃 𝑑𝜃
𝜃𝑐
0
∫ 𝑅𝑛𝑎𝑖𝑟
𝑁(𝜃)𝑐𝑜𝑠𝜃 𝑠𝑖𝑛𝜃 𝑑𝜃
𝜃𝑐
0
(IV-10)
Where 𝑅𝑛𝑒𝑥𝑡 and 𝑅𝑛𝑎𝑖𝑟
are the intensity reflection coefficients for the interface
fiber/surrounding medium and fiber/air respectively. So, the power output of the
sensor is linked to the mismatch of RI between the liquids and the guided mode.
Several RI liquids were applied to the sensing medium with RIs ranging from 1.332
to 1.471. The experimental and simulated normalized transmissions as a function of
the different RI liquids used are shown in Figure IV.6. A considerable match is
observed between simulations and experimental data. The sharp decrease occurs
when the liquid matches the RI of the cladding next = ncladding (Figure IV.6). In this
case, the new critical angle αc is lower than θc; all the rays with an incident angle
θ < αc exhibit total reflection; however all the rays with an incident angle αc < θ < θc
will only be partially reflected and a part of the power will be ejected outside the
fiber. A slight increase in the transmission was observed for RI values below ncladding
which was not observed in simulations (Figure IV.6). This was explained by the
scattering of light on the interface due to polishing irregularities [183].

159
Figure IV.6: Experimental and theoretical normalized transmission output as a
function of the refractive index liquids. Taken from [183].
IV.3.1.a. RI sensors using DLW
With the Direct Laser Writing (DLW) technique, RI sensors were also developed in
fibers and glasses. Most of them are based on creating Bragg gratings and
monitoring the Bragg wavelength shift. In 2006, Grobnic et al. manufactured an RI
sensor in a tapered fiber where a fiber Bragg grating (FBG) was written using a
Ti:Sapphire laser operating at 800 nm [196]. Then the fiber was inserted in RI
liquids and the Bragg grating shift was monitored [196]. In 2007, Zhou et al.
created an RI sensor also based on FBG [188]. A micro-slot was engraved inside
the optical fiber and then FBGs were written using both the Direct Laser Writing
technique followed by an etching process. The fiber tip immersed in the RI liquids
and the Bragg wavelength shift were monitored as a function of the different RI
liquids [188].
In 2009, the creation of an RI sensor in the range from 1 to 1.452 based on the
creation of Waveguide Bragg Gratings (WBG), etching and microfluidics inside bulk
fused silica glass was reported by Maselli et al. [187]. The reflected Bragg
wavelength is highly affected by any change in the RI. The WBG and the micro-
fluidic channels were written using the DLW technique. Then the micro-fluidic
channels were etched (to reveal the channels) in order to fill them with different RI
liquids. The sensor was based on filling the micro-channels with liquids and

160
monitoring the Bragg wavelength shift as the evanescent wave of the mode
propagating in the WBG interacts with the nearby liquids in the channels [187]. The
highest sensitivity and Bragg shift were obtained when the liquid matched the RI of
the cladding i.e. the fused silica glass (n=1.458) [187].
Eventually, all the afore-mentioned Bragg grating based sensors developed by DLW
monitor the shift of the Bragg wavelength as a function of the external RI liquid and
are embedded inside the bulk glass or fiber. The etching process is a must in order
to reveal the sensing medium or fiber tapering. However, Lapointe et al. in 2015
managed to create an RI sensor using the DLW technique with no need for etching
or additional processing [169]. Their work was similar to the work reported by
Polynkin et al. in 2005 [182] and Bilro et al. in 2010 [183] where both of them
used the interaction of the evanescent wave in an optical fiber with the outer
medium and the total internal reflection principle to create an RI sensor. Their
sensor was based on a near-surface waveguide written using the DLW technique in
a toughened Corning Gorilla bulk glass. The schematic representation of the sensor
is depicted in Figure IV.7. A double S-bend waveguide is written at 5 cm near the
surface and acts as the sensing medium. A 1550 nm light is injected using a single
mode (SM) butt-coupled optical fiber. The light is guided and interacts with the
outer medium and then collected using an optical fiber linked to a power meter.

161
Figure IV.7: Schematic presentation of the refractive index (RI) sensor. Inset:
Sketch of the optical rays in the sensing region. The refracted light represented
in a dashed line only occurs when the RI of the liquid is higher than the RI of the
cladding. Taken from [169].
An improvement in the theoretical model proposed by Bilro et al. [183] was
introduced in Lapointe’s work [169]. In fact, it is a hybrid approach where the
model was adapted to single mode propagation (instead of multimode as
introduced by Bilro et al.) and the variation of the effective RI (𝑛𝑒𝑓𝑓) as a function of
the outer medium was taken into consideration. Given that the photo-written
waveguides were circular, the propagating mode is assumed to be a Gaussian
function i.e. proportional to e−θ2 b⁄ where 𝑏 is related to the Gaussian distribution
and characterized the mode field diameter. Therefore, (IV-9) and (IV-10) will now
be given by:
𝑃𝑜𝑢𝑡 ∝ ∫ 𝑅𝑛𝑒𝑥𝑡
𝑁(𝜃)𝑠𝑖𝑛𝜃 𝑒−𝜃2 𝑏⁄ 𝑑𝜃
𝜃𝑐
0
(IV-11)
𝑃𝑛𝑜𝑟𝑚 =𝑃𝑜𝑢𝑡
𝑃𝑎𝑖𝑟=
∫ 𝑅𝑛𝑒𝑥𝑡
𝑁(𝜃)𝑠𝑖𝑛𝜃 𝑒−𝜃2 𝑏⁄ 𝑑𝜃
𝜃𝑐
0
∫ 𝑅𝑛𝑎𝑖𝑟
𝑁(𝜃)𝑠𝑖𝑛𝜃 𝑒−𝜃2 𝑏⁄ 𝑑𝜃
𝜃𝑐
0
(IV-12)
The old model proposed by Bilro et al. [183] did not take into account the change in
the effective RI (neff) of the guided mode as a function of the outer medium i.e. the
RI liquids. The new model proposed by Lapointe took this into consideration (Figure

162
IV.7). Because calculating the effective RI is complicated, it was estimated using
the following equations:
𝑛𝑒𝑓𝑓1 = (1 − 𝑥)𝑛𝑐𝑜𝑟𝑒 + 𝑥𝑛𝑎𝑖𝑟 (IV-13)
𝑛𝑒𝑓𝑓2 = (1 − 𝑥)𝑛𝑐𝑜𝑟𝑒 + 𝑥𝑛𝑒𝑥𝑡 (IV-14)
where x characterizes the overlap of the mode with the different RI liquids applied
on the glass and can take values between 0 and 1. It could be evaluated using the
V parameter in (II-5). However V is unkown, so x was adjusted to fit the simulation
and experimental data. Assuming that the Fresnel reflection coefficient is
independent from θ (single mode waveguide, so θ very small), it is given by:
𝑅𝐹𝑟 = (𝑛𝑒𝑓𝑓1 − 𝑛𝑒𝑓𝑓2
𝑛𝑒𝑓𝑓1 + 𝑛𝑒𝑓𝑓2
)2 (IV-15)
So, in that case (IV-11) and (IV-12) could be written as:
𝑃𝑜𝑢𝑡 ∝ (1 − 𝑅𝐹𝑟)2 ∫ 𝑅𝑛𝑒𝑥𝑡
𝑁(𝜃)𝑠𝑖𝑛𝜃 𝑒−𝜃2 𝑏⁄ 𝑑𝜃
𝜃𝑐
0
(IV-16)
𝑃𝑛𝑜𝑟𝑚 = 𝜂𝑅𝐼 =𝑃𝑜𝑢𝑡
𝑃𝑎𝑖𝑟=
(1 − 𝑅𝐹𝑟)2 ∫ 𝑅𝑛𝑒𝑥𝑡
𝑁(𝜃)𝑠𝑖𝑛𝜃 𝑒−𝜃2 𝑏⁄ 𝑑𝜃
𝜃𝑐
0
∫ 𝑅𝑛𝑎𝑖𝑟
𝑁(𝜃)𝑠𝑖𝑛𝜃 𝑒−𝜃2 𝑏⁄ 𝑑𝜃
𝜃𝑐
0
(IV-17)
Different RI oil drops were placed on the near surface portion of the waveguide and
the output transmission was monitored for every RI oil. The transmission of the
waveguide following the deposit of an oil drop is normalized with respect to the
transmission of the waveguide where no oils were deposited. The experimental and
the new model exhibit a significant match as shown in Figure IV.8. According to
Lapointe et al, three different regimes were observed. The first one is when the RI
is lower than the 𝑛𝑐𝑙𝑎𝑑𝑑𝑖𝑛𝑔 i.e. RI=1→1.5114. Light is guided based on the total
internal reflection (TIR) exhibiting some losses due to the mismatch of the effective
RI with the deposited liquids. The second region is from 1.5514 to 𝑛𝑐𝑜𝑟𝑒 (~1.5117)
where the critical angle 𝜃𝑐 decreases drastically and all beams with a higher incident
angle are ejected outside the waveguide, as also suggested by Bilro et al [183].

163
The third region is where the RI of the liquids is higher than the 𝑛𝑐𝑜𝑟𝑒 where the
light is guided by many internal Fresnel reflections and not TIR [169].
Figure IV.8: Experimental and simulated normalized transmitted powers as a
function of the refractive index of the liquids. The previous model of Bilro et al
[183] is represented with a dashed line. Inset: Comparison between Lapointe’s
model [169] and Bilro’s model [183]. Taken from [169].
The difficulty in writing Bragg grating-based waveguides near the surface is one of
the reasons why the majority of RI sensors are manufactured by DLW are and not
on the work reported by Lapointe et al [169]. Generally, DLW on the surface of the
glass induces ablation which makes the writing process of waveguides on/near the
surface almost impossible. Very few works have reported on this over the last few
years.
Lapointe managed to write near-surface waveguides in reinforced Corning Gorilla
glass with a relatively low ∆n ~5 x 10⁻⁴ [71]. Figure IV.9 shows written waveguides
at 25 µm below the surface and a waveguide near the surface as well as the guided
mode profiles for each waveguide. The mode profile is shown to touch the glass-air
interface, as illustrated in Figure IV.9.g-h. Those waveguides were used to create
the RI sensor mentioned above. Attempts at writing near-surface waveguides inside
standard soda-lime glass proved unsuccessful (Figure IV.9 a-b) as opposed to the
case of Gorilla glass which protects the glass surface from ablation during the
writing process [71].
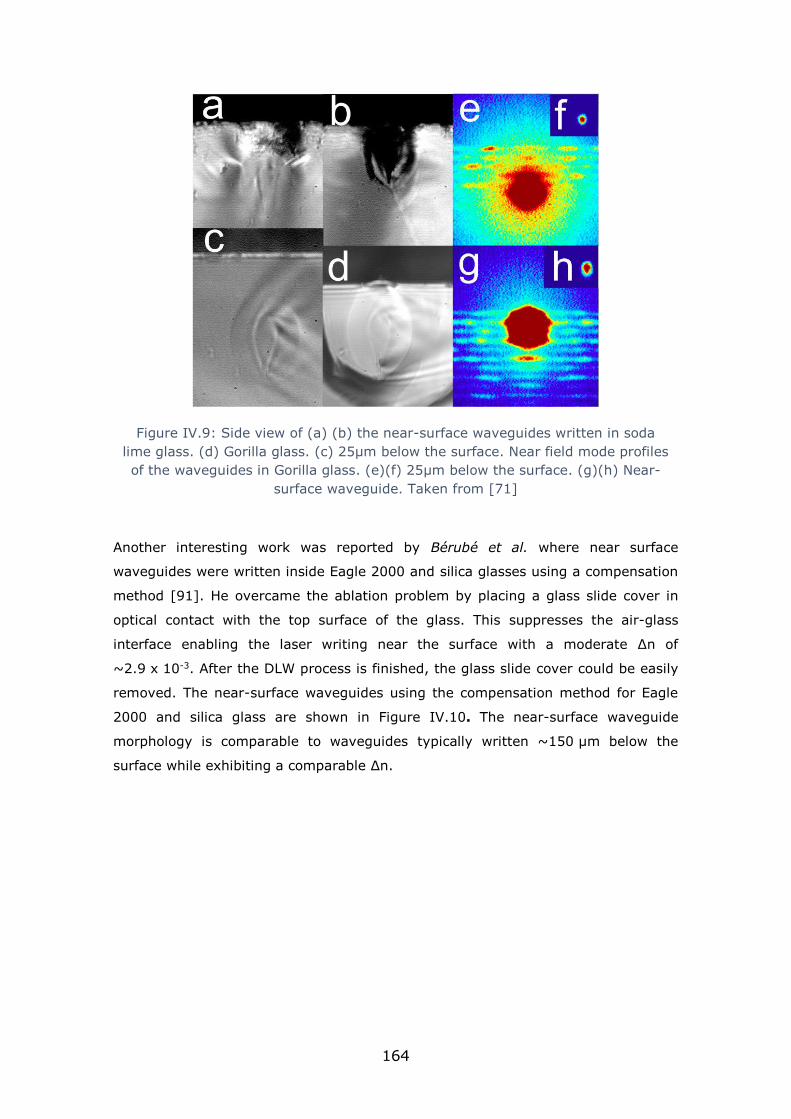
164
Figure IV.9: Side view of (a) (b) the near-surface waveguides written in soda
lime glass. (d) Gorilla glass. (c) 25µm below the surface. Near field mode profiles
of the waveguides in Gorilla glass. (e)(f) 25µm below the surface. (g)(h) Near-
surface waveguide. Taken from [71]
Another interesting work was reported by Bérubé et al. where near surface
waveguides were written inside Eagle 2000 and silica glasses using a compensation
method [91]. He overcame the ablation problem by placing a glass slide cover in
optical contact with the top surface of the glass. This suppresses the air-glass
interface enabling the laser writing near the surface with a moderate ∆n of
~2.9 x 10⁻³. After the DLW process is finished, the glass slide cover could be easily
removed. The near-surface waveguides using the compensation method for Eagle
2000 and silica glass are shown in Figure IV.10. The near-surface waveguide
morphology is comparable to waveguides typically written ~150 µm below the
surface while exhibiting a comparable ∆n.
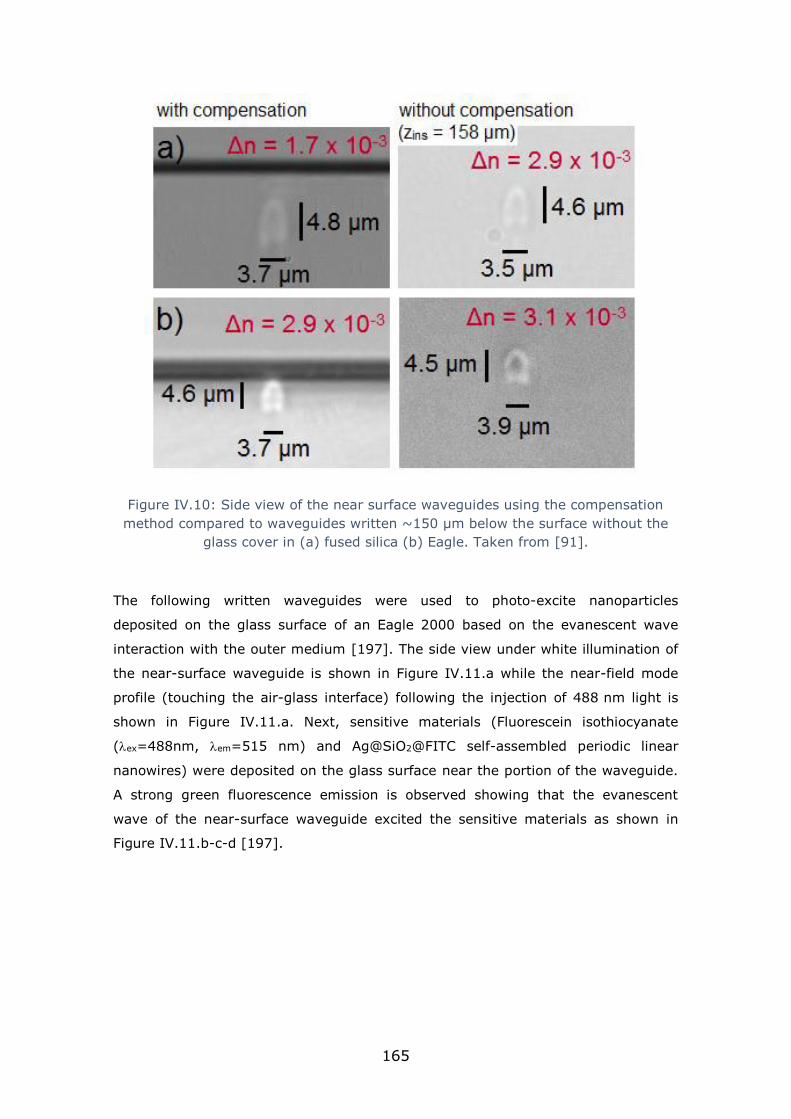
165
Figure IV.10: Side view of the near surface waveguides using the compensation
method compared to waveguides written ~150 µm below the surface without the
glass cover in (a) fused silica (b) Eagle. Taken from [91].
The following written waveguides were used to photo-excite nanoparticles
deposited on the glass surface of an Eagle 2000 based on the evanescent wave
interaction with the outer medium [197]. The side view under white illumination of
the near-surface waveguide is shown in Figure IV.11.a while the near-field mode
profile (touching the air-glass interface) following the injection of 488 nm light is
shown in Figure IV.11.a. Next, sensitive materials (Fluorescein isothiocyanate
(ex=488nm, em=515 nm) and Ag@SiO2@FITC self-assembled periodic linear
nanowires) were deposited on the glass surface near the portion of the waveguide.
A strong green fluorescence emission is observed showing that the evanescent
wave of the near-surface waveguide excited the sensitive materials as shown in
Figure IV.11.b-c-d [197].
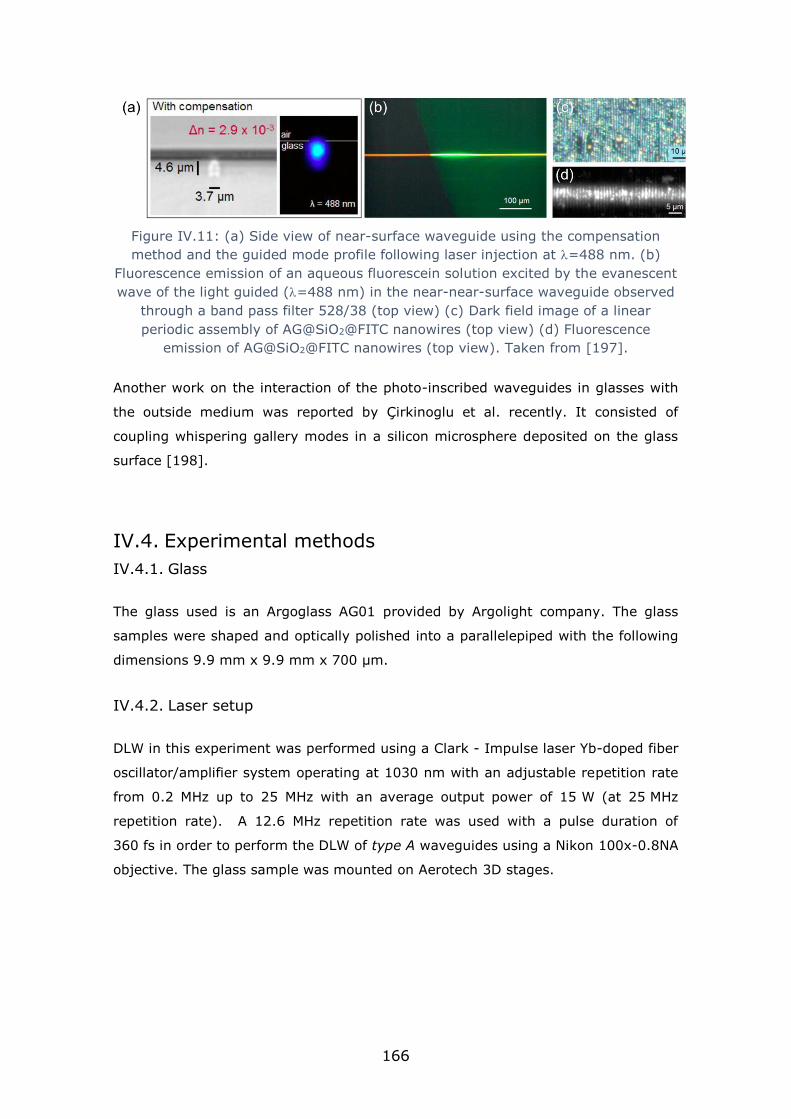
166
Figure IV.11: (a) Side view of near-surface waveguide using the compensation
method and the guided mode profile following laser injection at =488 nm. (b)
Fluorescence emission of an aqueous fluorescein solution excited by the evanescent
wave of the light guided (=488 nm) in the near-near-surface waveguide observed
through a band pass filter 528/38 (top view) (c) Dark field image of a linear
periodic assembly of AG@SiO2@FITC nanowires (top view) (d) Fluorescence
emission of AG@SiO2@FITC nanowires (top view). Taken from [197].
Another work on the interaction of the photo-inscribed waveguides in glasses with
the outside medium was reported by Çirkinoglu et al. recently. It consisted of
coupling whispering gallery modes in a silicon microsphere deposited on the glass
surface [198].
IV.4. Experimental methods
IV.4.1. Glass
The glass used is an Argoglass AG01 provided by Argolight company. The glass
samples were shaped and optically polished into a parallelepiped with the following
dimensions 9.9 mm x 9.9 mm x 700 µm.
IV.4.2. Laser setup
DLW in this experiment was performed using a Clark - Impulse laser Yb-doped fiber
oscillator/amplifier system operating at 1030 nm with an adjustable repetition rate
from 0.2 MHz up to 25 MHz with an average output power of 15 W (at 25 MHz
repetition rate). A 12.6 MHz repetition rate was used with a pulse duration of
360 fs in order to perform the DLW of type A waveguides using a Nikon 100x-0.8NA
objective. The glass sample was mounted on Aerotech 3D stages.

167
IV.5. Results
IV.5.1. Writing near surface waveguides
Direct laser writing (DLW) in silver containing glasses as mentioned in Chapter II
and Chapter III induces the creation of fluorescent silver clusters. Those silver
clusters are responsible for a new type of refractive index change called type A that
allows the fabrication of optical waveguides and components [174]. A series of
1 cm S-bend rising near surface waveguides (~5 mm from the surface) were
written in silver containing glass based on type A refractive index change with no
additional process. The conditions of DLW were optimized in order to avoid
ablations of the glass when reaching the surface. First, the laser beam is focused on
the surface or typically ~1 µm below the surface. The writing speed was fixed to
50 µm/s while the laser pulse energy was changed. In this chapter, we are relying
on the pulse energy as our power reference given that the window for writing is so
narrow. Therefore if we express the writing conditions using laser irradiance, the
slight difference would be exaggerated. The DLW writing process starts while
reducing the pulse energy until we reach just below ablation conditions. This pulse
energy is chosen to make waveguides as it sits just below the ablation threshold
allowing the creation of type A waveguides hopefully with a moderate refractive
index change (∆n). One should mention that the energy window is quite narrow
while writing near the glass surface. A variation of 2 to 3 nJ in the pulse energy
could cause ablations. A series of 1 cm near surface waveguides were written
~5 mm from the surface in a step process where the laser is focused deeper inside
the glass with each pass starting at 1µm to ~12µm. The waveguides were written
using a 12.6 MHz repetition rate Impulse laser by Clark-Mxr.Inc operating at 1030
nm with a pulse duration of 370 fs. The pulse energy was fixed to 28 nJ
corresponding to 7.2TW/cm2 and the writing speed to 50 µm/s. A 100 x -0.8NA
Nikon microscope objective was used. The S-bend near surface waveguides
exhibited an Rc=80mm and a ∆h=32µm (Figure IV.12). Ideally, the waveguide is
preferred to be a double S-bend waveguide with a portion rising to the surface and
the input and the output on the same level. However, due to the small dimensions
of the sample and to minimize the curve losses of our waveguides, it was based
only on a single S-bend as shown in Figure IV.12.
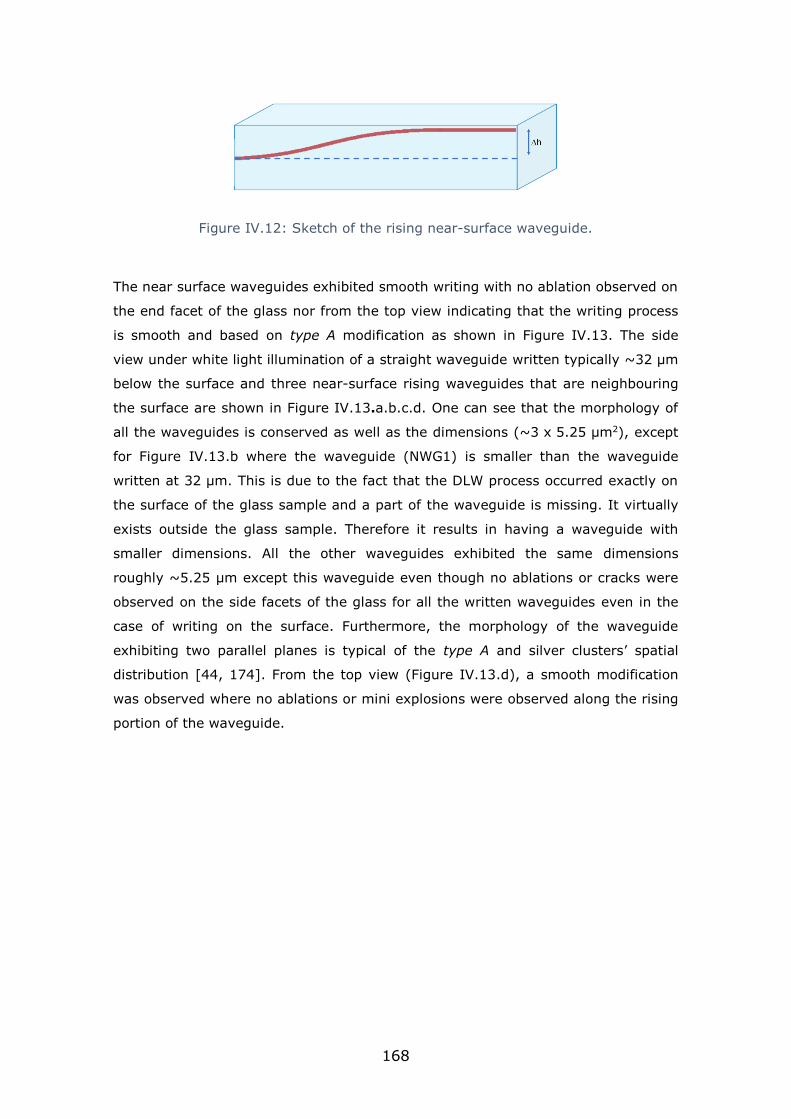
168
Figure IV.12: Sketch of the rising near-surface waveguide.
The near surface waveguides exhibited smooth writing with no ablation observed on
the end facet of the glass nor from the top view indicating that the writing process
is smooth and based on type A modification as shown in Figure IV.13. The side
view under white light illumination of a straight waveguide written typically ~32 µm
below the surface and three near-surface rising waveguides that are neighbouring
the surface are shown in Figure IV.13.a.b.c.d. One can see that the morphology of
all the waveguides is conserved as well as the dimensions (~3 x 5.25 µm2), except
for Figure IV.13.b where the waveguide (NWG1) is smaller than the waveguide
written at 32 µm. This is due to the fact that the DLW process occurred exactly on
the surface of the glass sample and a part of the waveguide is missing. It virtually
exists outside the glass sample. Therefore it results in having a waveguide with
smaller dimensions. All the other waveguides exhibited the same dimensions
roughly ~5.25 µm except this waveguide even though no ablations or cracks were
observed on the side facets of the glass for all the written waveguides even in the
case of writing on the surface. Furthermore, the morphology of the waveguide
exhibiting two parallel planes is typical of the type A and silver clusters’ spatial
distribution [44, 174]. From the top view (Figure IV.13.d), a smooth modification
was observed where no ablations or mini explosions were observed along the rising
portion of the waveguide.
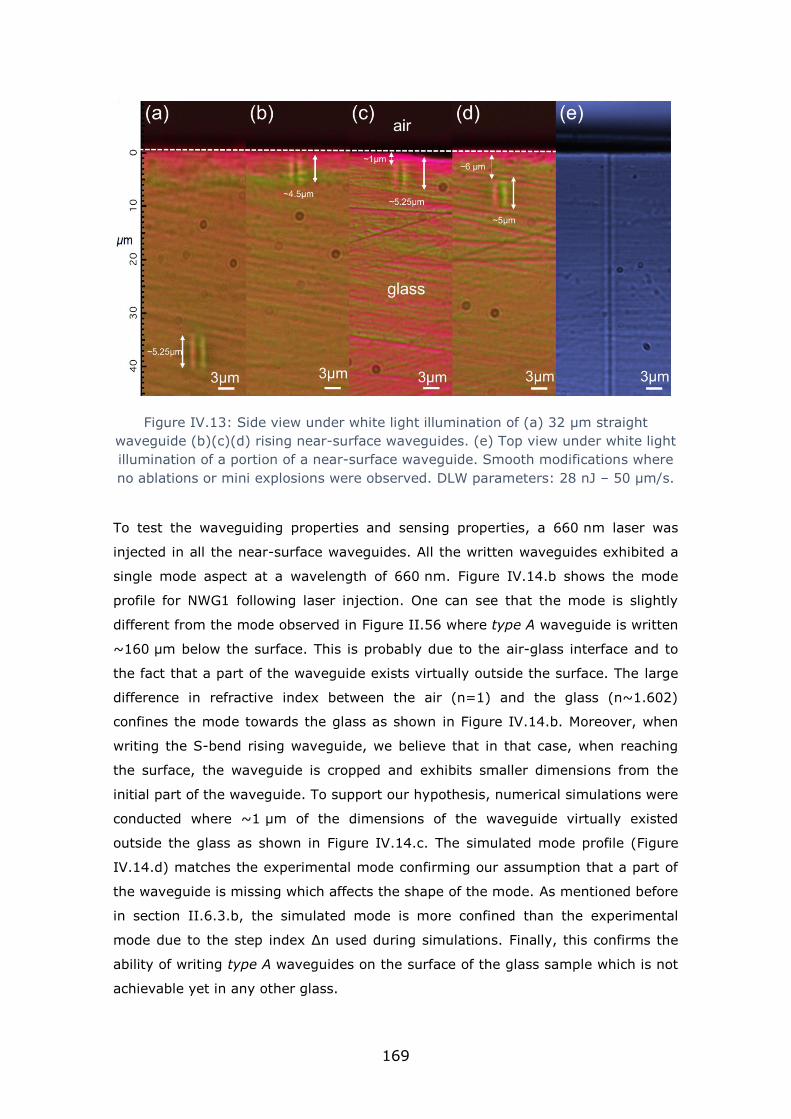
169
Figure IV.13: Side view under white light illumination of (a) 32 µm straight
waveguide (b)(c)(d) rising near-surface waveguides. (e) Top view under white light
illumination of a portion of a near-surface waveguide. Smooth modifications where
no ablations or mini explosions were observed. DLW parameters: 28 nJ – 50 µm/s.
To test the waveguiding properties and sensing properties, a 660 nm laser was
injected in all the near-surface waveguides. All the written waveguides exhibited a
single mode aspect at a wavelength of 660 nm. Figure IV.14.b shows the mode
profile for NWG1 following laser injection. One can see that the mode is slightly
different from the mode observed in Figure II.56 where type A waveguide is written
~160 µm below the surface. This is probably due to the air-glass interface and to
the fact that a part of the waveguide exists virtually outside the surface. The large
difference in refractive index between the air (n=1) and the glass (n~1.602)
confines the mode towards the glass as shown in Figure IV.14.b. Moreover, when
writing the S-bend rising waveguide, we believe that in that case, when reaching
the surface, the waveguide is cropped and exhibits smaller dimensions from the
initial part of the waveguide. To support our hypothesis, numerical simulations were
conducted where ~1 µm of the dimensions of the waveguide virtually existed
outside the glass as shown in Figure IV.14.c. The simulated mode profile (Figure
IV.14.d) matches the experimental mode confirming our assumption that a part of
the waveguide is missing which affects the shape of the mode. As mentioned before
in section II.6.3.b, the simulated mode is more confined than the experimental
mode due to the step index ∆n used during simulations. Finally, this confirms the
ability of writing type A waveguides on the surface of the glass sample which is not
achievable yet in any other glass.

170
Figure IV.14: (a) Side view of the rising near-surface waveguide NWG1 under
while light illumination. (b) Near-field mode profile following the injection of a
660 nm laser. (c) Sketch of the simulation of the waveguide where ~1 µm of the
waveguide is simulated outside the glass. (d) Simulated mode profile based on
the simulations shown in (c). A good match between experimental and simulated
modes showing that the mode is confined more towards the glass due to the
glass-air interface.
Moreover, Figure IV.15 shows the side view, experimental near-field mode profile,
simulation sketch and simulated near-field mode profile of a waveguide
neighbouring the surface 2 µm away. The experimental near-field mode profile
(Figure IV.15.b) exhibited the same shape of the mode reported in Figure II.56 for
a waveguide written typically ~160 µm below the surface. The simulated mode

171
profile (Figure IV.15.d) fits very well with the experimental one implying that, for
this waveguide, the mode is generally well confined inside the glass and the glass-
air interface does not significantly affect the shape of the propagating mode. This
confirms our previous assumption that NWG1 exhibited a part of the mode outside
the glass which highly affected the near-field mode profile.

172
Figure IV.15: (a) Side view of a rising near-surface waveguide under white light
illumination. (b) Near-field mode profile following the injection of a 660 nm laser.
(c) Sketch of the simulation of the waveguide 2 µm away from the surface. (d)
Simulated mode profile based on the simulations shown in (c). A good match
between experimental and simulated modes showing that the mode is not affected.
The refractive index change (∆n) of the surface-rising waveguides was measured
using SID4bio wave front sensor, as previously explained in section II.5.6. As
expected, two sharp positive ∆n peaks were observed correlated to the silver

173
clusters’ spatial distribution which is typical for type A waveguides (Figure IV.16). A
∆n of ~2.4 x 10⁻³ was measured (Figure IV.16.b) for all the near-surface
waveguides measured on the portion neighbouring the surface that could be
compared to the SM waveguide written at ~160 µm below the surface (∆n~2.5x10-
3 in Figure II.40). Generally, it is a challenge to make near-surface waveguides.
Moreover, it is a challenge to have a moderate ∆n. The pulse energy threshold for
glass modifications decreases as the beam approaches the glass surface [186],
which makes it more complicated to make near-surface waveguides with a good
value of ∆n. Previous works on near-surface waveguides reported a relatively low
∆n ~5 x 10⁻⁴ in the case of reinforced Gorilla glass [169] and a moderate
∆n~2.9 x 10⁻³ in Eagle glass , but using the compensation method [91]. For type A
waveguides, there is no need for reinforced glass or compensation method to write
near-surface waveguides while exhibiting a moderate ∆n of ~2.4 x 10⁻³ (Figure
IV.16). On one hand, one tends to reduce the ∆n to extend the evanescent wave
and enhance the sensitivity of the waveguides but on the other hand, one is
interested in a moderate ∆n in order to reduce the propagation losses due to the
curvature of the rising near-surface waveguides (curvature losses).
Figure IV.16: (a) Top view phase image of a portion of a waveguide neighboring
the surface waveguides exhibiting smooth type A modification. (b) ∆n profile
extracted from the phase image showing two positive peaks of ~2.4 x 10⁻³. DLW
parameters: 28 nJ – 50 µm/s.
All the written near-surface waveguides were tested by injecting a 660 nm laser
and dropping a ~4 mm droplet of Cargille oil with an RI of 1.604 on the rising
portion of the waveguide. The choice of an RI of 1.604 came after testing several
oils. Further details will be presented in section IV.5.2. The following study aims to
monitor the sensitivity of the waveguides i.e. the transmission drop following the

174
deposition of the oil droplet on the glass surface as a function of their distance from
the surface. The results are depicted in Figure IV.17. The transmission of each
waveguide is normalized with respect to the transmission of the waveguide where
no oil was deposited on the sample. The distance from the surface is from the
glass-air interface to the upper part of the waveguide as shown in Figure IV.13.
Even though the NGW1 is written on the surface, it does not exhibit the highest
sensitivity between the written waveguides. This is because the mode is cropped at
the interface, weakly guided and weakly confined. And it is hard to monitor the
transmission decrease following the deposition of the oil droplet. The farther the
waveguides are from the surface, the lesser the interaction is with the outer
medium, which is expected. The interaction between the waveguides and the outer
medium stops at a distance of ~9 µm from the surface (Figure IV.17). The most
sensitive waveguides are the ones which are ~1 µm to ~1.75 µm away from the
surface exhibiting a transmission loss of ~65% (~4.8 dB) for a 4 mm oil droplet.
The mode profile of one of the most sensitive waveguides is shown in the inset of
Figure IV.17. The mode profile exhibits no distortion and is totally located inside the
glass. Furthermore, even the last written waveguide interacting with the outside
medium ~6.5 µm away from the surface exhibits significant transmission losses of
~33% (1.73dB) showing the high sensitivity of type A waveguides. Compared to
the work of Lapointe et al where the maximum transmission drop is less than 15%
(0.7 dB) for an oil droplet of ~1 cm [169], our waveguides seem to be much more
sensitive, up to four times more sensitive. However, one should take into
consideration the distance of the waveguides to the surface in the case of Lapointe
et al. In a previous work [71], a side view picture of the near-surface waveguides
was shown, and it seems that the waveguides are farther than ours to the surface,
which could explain the lower sensitivity. Thus, we believe that it is impossible to
write type I waveguides on the surface of the glass like it is the case for type A.
This is explained by the fact that the type A occurs before the type I in the pulse
energy scale. The DLW in silver containing glasses targets the chemicals inside the
glass i.e. silver ions and produce silver clusters. The pulse energy needed to
activate the chemical reactions is significantly lower than the pulse energy needed
to create type I modification (melting the glass and/or creating color centers).
Finally, type A waveguides are based on two sub-wavelength waveguides highly
interacting together guiding one single supermode. It is well known that sub-
wavelength waveguides exhibit a greater evanescent wave and sensitivity [182,
199] compared to normal waveguides. This could also be one of the reasons that
type A waveguides exhibit a high sensitivity compared to type I waveguides.

175
Eventually, given that few works have been reported on this subject, one can only
assume the hypothesis.
Figure IV.17: Normalized transmission for all written waveguides following the
deposition of a ~4 mm droplet of 1.604 Cargile oil. No interaction was observed
after 7 µm spacing between the waveguide and the surface. Inset: Near-field mode
profile of the most sensitive waveguide at ~2 µm below the surface. DLW
parameters: 28 nJ – 50 µm/s.
Finally, a test of the transmission decrease as a function of the dimensions of the
oil droplet was performed. As expected, the larger the droplet of oil, the higher the
transmission drop for an RI oil of 1.604, as shown in Figure IV.18. The larger the
dimension of the droplet is, the higher the interaction length. Therefore more light
rays are ejected outside the waveguide. After covering almost all the near-surface
portion of the waveguide, the drop of transmission stops as expected. The highest
transmission drop was observed to be around 80% (~7 dB) when covering the
entire interaction length of ~5 mm for the most sensitive waveguide (Figure IV.18).

176
Figure IV.18: Normalized transmission as a function of the size of the droplet of a
1.604 Cargille oil for two waveguides with different distances from the glass
surface. The larger the droplet the higher the losses in transmission.
Therefore, we demonstrated the writing of near-surface waveguides with high
sensitivity, a moderate ∆n value with no need for additional processing based on
type A modification, highlighting the advantages of the new type A modification.
IV.5.2. RI sensor
A refractive index (RI) sensor was created based on the written near-surface
waveguides. Four waveguides were taken into consideration for this experiment
exhibiting different distances from the surface. First, the NWG1 waveguide
mentioned before where ~1µm of this waveguide exists virtually outside the glass
and NWG2, NWG3, NWG4 which are ~1 µm, 3.75 µm and 6 µm away from the
glass surface respectively. Different RI Cargille oils were dropped on the glass
surface using a micropipette in a way that the oil droplet exhibits the same
dimensions (~4 mm) for every measurement. The oil droplets dimensions were
visualized using a top view CCD camera. Then, the transmission was monitored for
each waveguide, for different RI oils. The transmission was normalized with respect
to the transmission where no oil was dropped on the glass surface. Following every
droplet of oil, the sample was cleaned using Ethanol until the transmission power

177
returned to the initial value measured before dropping oil. This confirms the
exactitude of the measurements. The results are shown in Figure IV.19 for the four
different waveguides. NWG1 and NWG2 exhibited a non-standard behaviour
exhibiting two resonances, one where the transmission is increased up to ~50% for
an oil RI of 1.602 and the other one where the transmission is decreased for an oil
RI of 1.604. The second resonance is an expected one and comparable to the one
observed in the literature for similar works [169, 182, 183], as shown in Figure
IV.4, Figure IV.6 and Figure IV.8. However, the first resonance was observed for
the first time in such sensors created by the DLW technique. It was observed by
Polynkin et al. when injecting a 1.5 µm light in a tapered fiber of ~700 nm thick
and applying RI liquids with lower RI than the cladding. However, it was not
explained and interpreted [182]. The taper exhibited around 40% more losses
compared to the taper with a thickness of 1.6µm. When applying the RI liquids
below the cladding’s RI, the transmission increased and almost all the losses were
compensated with RIs matching the cladding’s (Figure IV.4) before decreasing
when exceeding the cladding’s RI [182], which is similar to our results. Also
observed by Bilro et al [183] in Figure IV.6 but explained as scattering of the light
on the surface due to irregularities and the polishing process.
In our case, this could be explained by the fact that these two waveguides are so
close to the surface, even one of them has a part cropped by the glass interface.
Compared to deeper waveguides, those waveguides exhibited losses up to 50%
(3 dB), which is probably due to the mode evading the waveguide when reaching
the surface (glass-air interface). Once we match the RI of the glass which is ~1.602
in this case, the glass-air interface disappears and the mode is re-confined and re-
guided inside the waveguide as a normal waveguide embedded totally inside the
glass (RTI reflections), thus the increase in the transmission and almost full
compensation of the initial losses. Furthermore, this double resonance was not
observed for the waveguides that are deeper in particular NWG3 & NWG4 which are
~3.75 µm and 6 µm from the surface respectively. Only one resonance is observed
as reported by all the previous works [169, 182, 183]. The sensing process could
be described as three different regions (Figure IV.4, Figure IV.6 and Figure IV.8);
the first region where the RI of the liquid is lower than the glass, 𝑛𝑒𝑥𝑡 ≤ 𝑛𝑔𝑙𝑎𝑠𝑠,: the
second region where the RI of the liquid is equal to the waveguide, 𝑛𝑒𝑥𝑡~𝑛𝑤𝑎𝑣𝑒𝑔𝑢𝑖𝑑𝑒;
and the third where the RI is higher than glass, 𝑛𝑒𝑥𝑡 > 𝑛𝑔𝑙𝑎𝑠𝑠. The first region is
where the light is guided by total internal reflection (TIR) inside the waveguide with
a slight augmentation of the transmission (~2-4%) observed that could be
correlated to the fact that the oil drops are lowering the Fresnel reflection
coefficient between the propagating mode and the outer medium. This leads to the

178
fact that for deeper waveguides, the whole mode is confined/located inside the
glass and no part of the mode is evading it. The second region is where
𝑛𝑒𝑥𝑡~𝑛𝑤𝑎𝑣𝑒𝑔𝑢𝑖𝑑𝑒, a large portion of light is ejected outside the waveguide given that
the critical angle 𝜃𝑐 is now much lower. The third is for 𝑛𝑒𝑥𝑡 > 𝑛𝑔𝑙𝑎𝑠𝑠, where light is
no longer guided by TIR but by many internal Fresnel reflections.
Figure IV.19: Normalized transmission as a function of different refractive index
(RI) Cargille oils deposited on the glass surface for four different waveguides at
different depths from the surface. DLW parameters: 28 nJ – 50 µm/s.
A theoretical model was suggested in this case in order to fit the experimental
results. It consisted of three parts. The first part covering the first region where
𝑛𝑒𝑥𝑡 ≤ 𝑛𝑔𝑙𝑎𝑠𝑠 , the second part for 𝑛𝑒𝑥𝑡~𝑛𝑔𝑙𝑎𝑠𝑠 and the third part for 𝑛𝑒𝑥𝑡 > 𝑛𝑔𝑙𝑎𝑠𝑠. For the
first region 𝑛𝑒𝑥𝑡 ≤ 𝑛𝑔𝑙𝑎𝑠𝑠, the guided mode in the waveguide is affected by the glass-
outer medium interface when the waveguide is close enough to the surface. Based
on this hypothesis, the overlap coefficients between the normal mode embedded
totally inside the glass and the mode near the surface were calculated as a function
of the different exterior RIs (see Appendix part A.5). Using Lumerical Mode
Solutions, we ran the simulations for our exotic waveguide and obtained the exotic
mode profile for a normal waveguide well embedded inside the glass. Following
that, the simulations of a near-surface waveguide took place for different exterior
RIs, and the overlap coefficients between the two modes (the mode embedded in
the glass and the near-surface mode) were calculated. The simulations were
conducted for two waveguides, one which is ~1 µm below the surface and another

179
one ~3.75 µm. Simulations and experimental results are shown in Figure IV.20.
One can see that the simulations fit the experimental results. The first resonance
i.e. the increase of the transmission for 𝑛𝑒𝑥𝑡 ≤ 𝑛𝑔𝑙𝑎𝑠𝑠 was also seen in simulations as
well as the experiment, which was not observed by the previous suggested models.
For the second region where 𝑛𝑒𝑥𝑡~𝑛𝑤𝑎𝑣𝑒𝑔𝑢𝑖𝑑𝑒, when the RI of the oil matches the
core’s (𝑛𝑒𝑥𝑡~𝑛𝑤𝑎𝑣𝑒𝑔𝑢𝑖𝑑𝑒), the mode should be completely ejected outside the
waveguide and the transmission should drop to 0% theoretically. Experimentally, it
is not the case for our sensor. This could be explained by the following hypothesis.
When the mode is propagating in the waveguide, it is well confined due to the ∆n,
and a small portion of the light travels outside as an evanescent wave. However,
when immersing the waveguide totally in a liquid exhibiting the same RI as the
core, the refractive index difference is almost null and the mode starts to get
ejected outside the waveguide from both sides. But, in this case, the waveguide is
immersed only from the top side, which means that only the upper part of the
mode interacting with the oil will be ejected while a small part of light (lower part of
the waveguide) will still be guided inside the written waveguide. A certain distance
is required in order to eject the totally mode from the waveguide, which we did not
achieve in our case. This was supported by the fact that increasing the oil droplet’s
size caused the transmission to drop also (see Figure IV.18). In this case the total
interaction distance was ~5 mm which was not enough to eject the entire mode
outside the waveguide. Therefore, the transmission does not drop to zero in our
case when the RI of the oil matches the RI of the waveguide (more specifically, the
effective refractive index of the propagating mode). A rough calculation where we
assumed that half of the mode is ejected outside the waveguide and that the
interaction zone with the mode exhibits a square intensity distribution resulted in
transmission dropping to 93.5% (compared to 70% for the experiment) for a 4 mm
droplet of oil. In order to increase the exactitude of such calculations, one should
consider the real shape of the mode and the real intensity distribution interaction
with the liquid, which will not be taken into consideration in this case. For the third
region where 𝑛𝑒𝑥𝑡 > 𝑛𝑔𝑙𝑎𝑠𝑠 and based on Lumerical simulations, no waveguiding
should occur. In fact, as mentioned before, the mode is no longer guided due to
TIR but is guided due to several Fresnel reflections. Every time the light beam hits
the upper part interacting with the oil (𝑛𝑜𝑖𝑙 > 𝑛𝑔𝑙𝑎𝑠𝑠), a part of light is ejected outside
the waveguide and another part is reflected and guided. The third part was
simulated and fitted to experimental results based on the Fresnel Reflection
Coefficient and the RI of the oil (which is similar to the previous suggested models)
as shown in Figure IV.20.

180
Figure IV.20: Experimental (full line) and simulations (dashed lines) for two
different near surface waveguides at different distances from the surface. A good
match between the experiment and the simulations.
In order to have a better idea, a sketch of the behaviour of the evanescent
wave/mode profile as well as simulated mode profiles as a function of different RI
liquids is depicted in Figure IV.21. For 𝑛𝑒𝑥𝑡 < 𝑛𝑔𝑙𝑎𝑠𝑠 (Region I), one can see that the
mode is confined towards the glass as shown in Figure IV.21.a. The simulated
mode profile for a glass-air interface clearly shows it (Figure IV.21.a.i). It is due to
the huge difference in RI between the glass and air. For 𝑛𝑒𝑥𝑡 > 𝑛𝑔𝑙𝑎𝑠𝑠 (Region III),
the mode tends to be guided in the higher RI medium which is the oil in this case
(mode ejected). However a portion of light is still guided in the waveguide Figure
IV.21.b. No guided mode could be simulated in this case given that the mode is no
longer propagating based on TIR. Therefore no real solution was found by the
software.
When matching the RI of the cladding i.e. glass 𝑛𝑒𝑥𝑡~𝑛𝑔𝑙𝑎𝑠𝑠, the mode is guided
normally with no aberrations as if the waveguide was embedded deep inside the
glass Figure IV.21.c. This also confirms the significant increase in the transmission
for NWG1 and NWG2 when the oil matches the RI of the glass (see Figure IV.19).

181
Figure IV.21: Sketch of the evanescent wave/mode profile inside a near-surface
waveguide for a refractive index (RI). (a) Lower than the cladding/glass; (b)
higher than the cladding/glass; (c) equal to the cladding/glass. Inspired from
[200]. Simulated mode profile for a (a.i) glass-air interface; (c.ii) glass-oil
interface with a refractive index of oil matching the glass 𝑛𝑒𝑥𝑡~𝑛𝑔𝑙𝑎𝑠𝑠.
So, an RI sensor was created in a 1 cm glass chip based on type A waveguides that
allow to show a double resonance enabling double sensing regions for lower and
higher RIs of the waveguide. The sensor operates in a region between 1 and 1.632,
which has not been reported before. The significance of this work exists in the fact
that the RI sensor was created in a 1 cm glass chip with higher sensitivity and
much more compact design compared to all previous models [169, 182, 183]. With
an interaction length of ~5 mm, the transmission drops up to ~80% (7 dB) which is
not achievable yet with the DLW technique. Finally, one should not forget that silver
containing zinc phosphate glasses are shaped into ribbon fibers while preserving all
the characteristics of bulk samples [149]. Therefore, the RI sensor could be
transported and manufactured inside a ribbon fiber paving the way towards fiber
based RI sensors.
182
IV.6. Conclusion
Taking advantage of the low pulse regime of type A compared to type I, rising
near-surface waveguides were written in silver containing zinc phosphate glasses
with no need for additional processing which is a first. No etching, nor reinforced
glass, nor compensation method were required to achieve near-surface type A
waveguides compatible with sensing applications. Not only are near-surface
waveguides achievable with type A waveguides, but also direct writing on the glass
surface. Based on the rising near-surface waveguides, an RI sensor was created in
a 1 cm glass chip that makes it possible to show double resonances (when the
waveguide is very close to the surface, ~1µm) allowing a double sensing region
before and after the RI of the waveguide. An increase of ~50% in the transmission
(noil=1.602) and a decrease of ~66% was observed for a 4 mm oil droplet
(noil=1.604). For waveguides that are deeper inside the bulk, only one weaker
resonance is observed, which is the transmission drop when the RI of the oil is
equal to the RI of the waveguide. A new theoretical model is proposed taking into
account the mode shape between the glass and the outer medium as well as the
Fresnel reflection coefficient. The resulting new model is the first one to simulate
the increase in the transmission before the RI of the waveguide. Finally, a very high
sensitive RI sensor in the range of 1→1.632 refractive index, exhibiting a
transmission drop up to 80% (7dB) for an interaction length of 5 mm was
fabricated in a 1 cm silver containing glass chip,. This was a first using the DLW
technique, paving the way towards more sensing applications in silver containing
glasses.

183

184
General Conclusion
This project aimed at creating a new type of optical waveguides and components
inside silver containing glasses introducing new advantages compared to the
standard glasses.
Direct Laser Writing (DLW) in silver containing glasses induces the creation of
fluorescent silver clusters Agmx+ in the vicinity of the interaction voxel due to the
non-linear absorption (multi-photon) allowing the creation of sub-wavelength 3D
structures. It was found that those Agmx+ are responsible for a new type of photo-
induced modification/refractive index change (∆n), following DLW in silver
containing glasses that we called type A. This new type of ∆n, allows the creation of
optical waveguides as well as optical components. Several single and multi-mode
waveguides were created based on type A ∆n in silver containing glasses in the
visible and NIR ranges. More specifically, a 3 x 6 µm2 single mode 7 mm waveguide
at a wavelength of 660 nm was written inside silver containing glasses exhibiting a
∆n of 2.5 x 10⁻³, while showing upper bound propagation losses of 1.2 dB/cm at
660 nm. The photo-induced type A ∆n could reach a maximum value of around
8 x 10⁻³, which is fairly comparable to what is achieved with the type I modification.
Based on type A modification, several optical components were written inside silver
containing zinc phosphate glasses (exhibiting dimensions not longer than 1 cm): a
50-50 Y beam splitter dividing light equally into two output branches, optical
couplers showing typical coupling behaviour, as well as a perfect 50-50 coupler
operating at a wavelength of 660 nm.
In addition, it was found that wisely tuning the laser writing regime could trigger
either type A or type I modifications in silver containing glasses. Writing using a
250 kHz laser with µJ pulses (thermal regime in this case) induces a thermal effect
and a change in the glass matrix itself corresponding to an intrinsic type of
modification compared to an athermal regime using a 9.8 MHz laser and nJ pulses
where the type of modification is purely based on the aggregation of the silver ions
Ag+ pre-existing in the glass matrix. A comparison between the two types shows
that the type I exhibits a noticeable thermal affected zone, exhibiting a positive
region that is surrounded by a negative one acting as a cladding while the guiding
process occurs in the positive region (circular mode profile 4.5 x 5.2 µm2 due to the
circular beam shaping). Type A modification showed smaller waveguides with no
presence of an affected thermal zone with an elliptical mode profile of 3 x 5.5 µm2.
The photo-induced type A modification is always a positive one, which was not the

185
case for type I modification that flips its sign as a function of the laser parameters
and the glass composition. This makes DLW of optical waveguides in zinc
phosphate glasses more complicated. Furthermore, it was found that the type A
modification occurs well before the type I modification on the pulse energy scale
putting the type A modification in the region of the low pulse energy regime.
Taking advantage of the low pulse energy regime, near-surface and on surface
waveguides were written in silver containing zinc phosphate glass for the first time
with no special needs such as reinforced glass or any compensation methods.
Based on near-surface waveguides, an RI sensor was created that could exhibit a
double resonance presenting the opportunity to create two sensing regions when
the waveguide is around 1 µm from the surface. A new improved theoretical
method was also introduced that fits the experimental results and was able to
simulate the behaviour of the double resonances for the first time. It is based on
the mode shape confinement when it reaches the glass-outer medium interface as
a function of the RI of the different oils, as well as the Fresnel reflection
coefficients. Finally, a 1 cm highly sensitive RI sensor (80% - 7 dB transmission
drop for a 5 mm oil droplet) operating in the region of 1→ 1.632 refractive index
was created based on type A. It exhibited the highest reported sensitivity for a DLW
RI sensor and possible double sensing regions, which paves the way towards more
integrated sensors in silver containing glasses.
Finally, this project fulfilled expectations by producing the first waveguides that are
based on the creation of silver clusters in silver containing glasses, paving the way
towards a new type of optical circuits in bulks and fibers while exhibiting exotic
properties not accessible using the standard type I modification, such as
fluorescence, non-linearity, development of nanoparticles with plasmonic responses
as well as writing near-surface waveguides with no need for any additional
processing.

186
Perspectives
Many perspectives arise from such interesting work and a lot of work is required
such as transposing the RI sensor into a ribbon shaped silver containing fiber. The
only difficulty that one could face for this work is having a really flat top surface of
the fiber (±500 nm) in order to write a near-surface waveguide without problems.
For instance, aviation companies demand a technology to detect the level of fuel in
airplane fuel tanks. Writing such near-surface waveguides in silver containing
ribbon shaped fibers could be one solution to be able to detect in real time the level
of fuel in airplane fuel tanks.
Moreover, given that the type A modification exhibits a smooth quality and sub-
wavelength spatial resolution, this could be used for the creation of WBGs in the
visible range. It could be performed either by modulating the laser beam to create
a modulation of the ∆n, or by writing a waveguide and then overlapping gratings on
top of it. This part was performed during the PhD project but not yet characterized.
One perspective that could be a very important and interesting one is studying the
opto-optical effect.
▪ Opto-Optical effect
The photo-induced silver clusters exhibit two main absorption bands in the UV-
visible range, as shown in Figure II.24 while emitting fluorescence in the visible
range. An approach tested during the project was to monitor the behaviour of the
refractive index change when exciting the silver clusters under UV light. A change
in the refractive index could occur due to the populated excited states of the
clusters. The term opto-optical is based on the principle of changing the behaviour
of light using light like, for example, the electro-optical effect where light is
modulated using electrical signals. Herein, we tried to modulate light using light
itself, therefore the term opto-optical effect.
A 405 nm diode laser was added to the SID4Bio wave front sensor setup to excite
the silver clusters from the bottom as shown in Figure A.b. In addition, a 405 nm
notch filter was introduced in the microscope to eliminate the light coming from the
blue diode into the CCD camera.

187
Figure A: The SiD4bio wavefront sensor mounted on a microscope operating (a) in
white light illumination and providing top view phase image; (b) under blue
(405 nm) illumination and providing top view local excited fluorescence image.
The experiment was conducted as follows. A normal phase image is acquired for the
photo-induced structures ,as shown in Figure B.a using white light illumination.
Then the blue diode is turned on to excite a specific part of the structures
simultaneously with the white light illumination, as shown in Figure B.b. Following
that, the white light illumination is turned off and a picture of the fluorescence is
acquired to precisely localize the excited zone Figure B.c. One notes that in that
case, the CCD acquisition time was highly increased (10 times more) in order to
acquire the fluorescence image.
Figure B: Top view phase image under (a) white light illumination; (b) white light
and blue light illumination simultaneously; (c) top view fluorescence image
indicating the local excited zone by blue light illumination. (d) Subtraction phase
image of “a” and “b” revealing a local change in the refractive index change
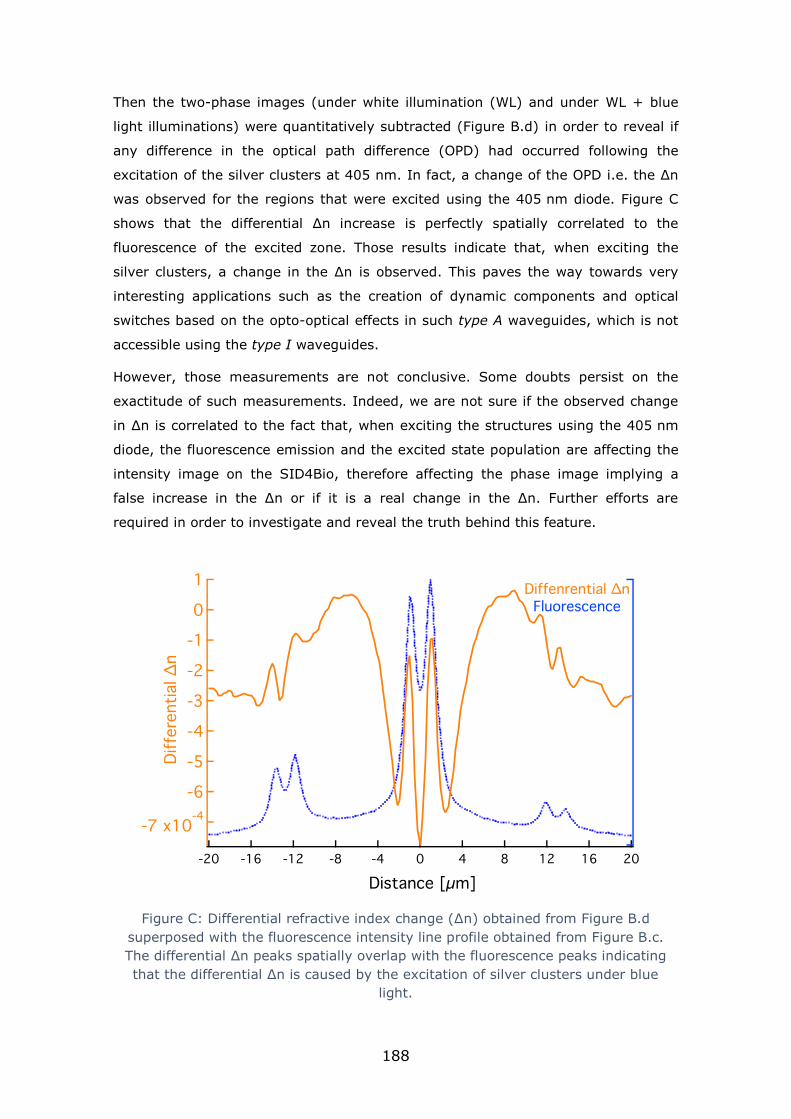
188
Then the two-phase images (under white illumination (WL) and under WL + blue
light illuminations) were quantitatively subtracted (Figure B.d) in order to reveal if
any difference in the optical path difference (OPD) had occurred following the
excitation of the silver clusters at 405 nm. In fact, a change of the OPD i.e. the ∆n
was observed for the regions that were excited using the 405 nm diode. Figure C
shows that the differential ∆n increase is perfectly spatially correlated to the
fluorescence of the excited zone. Those results indicate that, when exciting the
silver clusters, a change in the ∆n is observed. This paves the way towards very
interesting applications such as the creation of dynamic components and optical
switches based on the opto-optical effects in such type A waveguides, which is not
accessible using the type I waveguides.
However, those measurements are not conclusive. Some doubts persist on the
exactitude of such measurements. Indeed, we are not sure if the observed change
in ∆n is correlated to the fact that, when exciting the structures using the 405 nm
diode, the fluorescence emission and the excited state population are affecting the
intensity image on the SID4Bio, therefore affecting the phase image implying a
false increase in the ∆n or if it is a real change in the ∆n. Further efforts are
required in order to investigate and reveal the truth behind this feature.
Figure C: Differential refractive index change (∆n) obtained from Figure B.d
superposed with the fluorescence intensity line profile obtained from Figure B.c.
The differential ∆n peaks spatially overlap with the fluorescence peaks indicating
that the differential ∆n is caused by the excitation of silver clusters under blue
light.

189
Nevertheless, one brilliant idea came to us about creating active Bragg Gratings. It
consists in performing the DLW of a type A waveguide in silver containing glasses,
then, from the top and using a periodic grating, diffracting a 405 nm laser diode
with a very specific period and overlapping it with the waveguide to create Bragg
gratings, as shown in figure D. When turning on the diode, the Bragg grating is
active i.e. the ∆n is modulated all along the waveguide based on the opto-optical
effect and the waveguide reflects the Bragg wavelength (Figure D.b). However,
when the blue diode is turned off, the Bragg gratings disappear (no more
modulation of the ∆n) and the waveguide acts as a standard waveguide with no
specific reflection observed (Figure D.c). The opto-optical effect paves the way for
the creation of dynamic optical components and light switches in silver containing
glasses but further efforts are required to fully confirm this phenomenon.
Figure D: (a) Top view of a standard type A waveguide exhibiting two lines; (b)
using a blue diode and overlapping the grating with the type A waveguide to
modulate the ∆n based on the opto-optical effect and creating a waveguide Bragg
grating; (c) turning off the diode induces the disappearance of the grating;
therefore, a standard type A waveguide.

190
▪ Waveguide laser Given that under UV-Blue excitation a significant fluorescence intensity in the
visible range is emitted by the silver clusters, we tried to create a waveguide laser
(WGL) based on the fluorescent emission. A type A waveguide was written using
DLW in silver containing glasses and was mounted on the transmission setup. A
532 nm laser was injected inside the waveguide simultaneously with a 394 nm
laser diode inside the waveguide using a microscope objective (instead of an optical
fiber). Given that the fluorescence emission peak is mainly centred in the green
region (~532 nm), one would expect an amplification of the green laser following
excitation of the silver clusters. However, unfortunately this was not the case.
Following the injection of a 394 nm laser diode and exciting the silver clusters, a
sudden 33% decrease of transmission was observed, as shown in Figure E.a.
Moreover, shutting down the blue diode resulted in a slow increase of 33% of the
power, going back to the initial transmission (Figure E.b). The fast drop and the
slow increase in transmission could be explained by the creation of the triplet
excited state of the silver clusters. Once excited to a higher level, they probably
exhibit an absorption band at ~532 nm which explains the sudden decrease and
the slow increase of the waveguide transmission at 532 nm after turning off the
diode. As a first approach, the following results may kill the idea of making a WGL
in silver containing zinc phosphate glasses.

191
Figure E: (a) Sudden decrease of 33% in the waveguide transmission following the
simultaneous injection of 394 nm with the 532 nm laser. The dashed line indicates
the moment the blue diode was turned on. (b) Slow increase of the waveguide
transmission when the 394 nm laser is turned off once it reaches its initial value.
The dashed line indicates the moment the blue diode was turned off.

192
Appendix
A. List of communications
A.1. Scientific papers
• Photowritable Silver-Containing Phosphate Glass Ribbon Fibers
S.Danto, F. Désévédavy, Y. Petit, J.-C.Desmoulin, A. Abou Khalil, C.
Strutynski, M. Dussauze, F. Smektala, T. Cardinal, L. Canioni
Advanced Optical Materials, 2016. 4(1): p. 162-168
• Direct Laser writing of new type of waveguides in silver containing glasses
A .Abou Khalil, J.P Bérubé, J.C Desmoulin, S.Danto, T. Cardinal, Y. Petit, R.
Valleé and Lionel Canioni.
Scientific Reports, 2017. 7(1): p. 11124
• [Review] On the femtosecond laser-induced photochemistry in silver-
containing oxide glasses: mechanisms, related optical and physico-chemical
properties, and technological applications
Y. Petit, S. Danto, T. Guérineau, A. Abou Khalil, A. Le Camus, E. Fargin,1
G. Duchateau, J.-P. Bérubé, R. Vallée, Y. Messaddeq, T. Cardinal and L.
Canioni
Advanced Optical technologies
• Comparative study between the Type A and the type I photo-induced
modification in silver containing glasses
Ongoing process
• Direct laser writing of near surface waveguides with no additional processing
Ongoing process
A.2. National and international conferences
• Direct laser writing of waveguides in photosensitive zinc phosphate glass
A. Abou Khalil, L. Canioni, Y. Petit and R. Vallée
IONS QUEBEC 2016
Québec city, Quebec, Canada, 20 - 22 May 2016 – Oral
• Inscription d’un guide d’onde dans des verres de phosphate de zinc à
l’argent
A. Abou Khalil, J.-C. Desmoulin, S. Danto, T. Cardinal, Y. Petit, T. Cardinal,
R.Vallée, L. Canioni
Journée du COPL
Québec city, Québec, Canada – May 2016 - Poster

193
• Inscription de guides d’onde par irradiation laser femtoseconde dans des
verres de phosphate de zinc à l’argent
A. Abou Khalil, J.-P. Bérubé, J.-C. Desmoulin, T. Cardinal, Y. Petit, R.
Vallée, L. Canioni
Optique Bordeaux – HORIZON 2016
Bordeaux, France, 04-07 July 2016 - Poster
• Fibres ruban de zinc-phosphate-argent photo-inscriptibles
S. Danto, F. Désévédavy, Y. Petit, J.-C.Desmoulin, A. Abou Khalil, C.
Strutynski, M. Dussauze, F. Smektala, T. Cardinal, L. Canioni
Optique Bordeaux – Journées Nationales de l’Optique Guidée (JNOG 2016)
Bordeaux, France, 04-07 July 2016 – Oral
• [Invited] Direct Laser Writing and microstructuring of silver-doped
phosphate glasses for optical functionalities
T. Cardinal, J.C. Desmoulin, S. Danto, A. Abou-khalil, Y. Petit, Y. Ledemi,
L. Canioni, Y. Messaddeq, M. Dussauze, V. Rodriguez, R. Vallée
BMIC Inorganic Chemistry and XVII Brazilian Meeting on Rare Earths) Sao
Pedro, Brazil, 25-30 September 2016 - Oral
• Photo-writable Silver-containing Phosphate Glass Ribbon Fibers
S. Danto, F. Désévédavy, Y. Petit, J-C. Desmoulin, A. Abou Khalil, C.
Strutynski, M. Dussauze, F. Smektala, T. Cardinal, L. Canioni
PHAROS Event, (Best Paper Award)
Bordeaux, France, 24-26 October 2016 – Oral
• Photo-writable Silver-containing Phosphate Glass Ribbon Fibers
S. Danto, F. Désévédavy, Y. Petit, J-C. Desmoulin, A. Abou Khalil, C.
Strutynski, M. Dussauze, F. Smektala, T. Cardinal, L. Canioni
GDR Journées Verres
Bordeaux, France, 17-18 November 2016 – Poster
• New type of waveguides in silver containing zinc phosphate glasses by
femtosecond laser writing
A. Abou Khalil, J.-P. Bérubé, S. Danto, J.-C. Desmoulin, T. Cardinal, Y.
Petit, L. Canioni, and R. Vallée
SPIE – Photonics West
San Francisco, California, USA, 28 January – 02th February 2017-Oral

194
• Femtosecond laser writing of new type of waveguides in silver containing
glasses
A. Abou Khalil, J.-P. Bérubé, S. Danto, J.-C. Desmoulin, T. Cardinal, Y.
Petit, L. Canioni, and R. Vallée
Symposium LIA-LUMAQ
Bordeaux, France, 29-31 March 2017- Oral
• Intermediate-Tg-glasses for hybrid/composite fiber devices: recent advances
and new prospects
S. Danto, C. Strutynski, F. Désévédavy, Y. Petit, J-C. Desmoulin, A. Abou
Khalil, M. Dussauze, J-C. Jules, G. Gadret, F. Smektala, L. Canioni, T.
Cardinal
Material Research Society - MRS2017 (Spring meeting)
Phoenix, Arizona, USA, 17-21 April 2017 – Oral
• Intermediate-Tg Phosphate and Tellurite Glasses For Multi-materials Fiber
Devices
S. Danto, C. Strutynski, F. Désévédavy, Y. Petit, J-C. Desmoulin, A. Abou
Khalil, M. Dussauze, J-C. Jules, G. Gadret, F. Smektala, L. Canioni, T.
Cardinal
Fibers Society
Aachen, Germany, 17-19 May 2017 - Oral
• Direct laser writing of novel type of waveguides in silver containing zinc
phosphate glasses
A. Abou Khalil, J.-P. Bérubé, S. Danto, J.-C. Desmoulin, T. Cardinal, Y.
Petit, R. Vallée and L. Canioni
International Conference for Professionals & Young Scientists - Low
Temperature Physics (ICPYS-LTP2017)
Kharkiv, Ukraine, 29 May – 2 June 2017 - Oral
• Nouveau type de variation d’indice de réfraction par inscription laser femto
dans les verres à l’argent
A. Abou Khalil, J.-P. Bérubé, S. Danto, J.-C. Desmoulin, T. Cardinal, Y.
Petit, R. Vallée et Lionel Canioni
Journées Nationales d’Optique Guidée (JNOG2017)
Limoges, France, 4-6 July 2017 - Poster
• Comparative study between the novel type A and the standard type I photo-
induced refractive index change in silver containing zinc phosphate glasses
A. Abou Khalil, J.-P. Bérubé, S. Danto, T. Cardinal, Y. Petit, L. Canioni, and
R. Vallée
SPIE – Photonics West
San Francisco, California, USA- 27 January – 1 February 2018 - Oral
• Intermediate-Tg glasses for multimaterial fibers

195
Sylvain Danto, C. Strutynski, F. Désévédavy, Y. Petit, J-C. Desmoulin, A.
Abou Khalil, M. Dussauze, J-C. Jules, G. Gadret, F. Smektala, L. Canioni, T.
Cardinal
SPIE Photonics Europe
Strasbourg, France, 22-26 April 2018 – Oral
• Progress in femtosecond laser structuring of silver containing glasses: a
review
L. Canioni, Y. Petit, A. Abou Khalil, A. Le Camus, S. Danto and T. Cardinal,
R. Vallée
Progress in Ultrafast Laser Modifications of Materials (PULMM – 3rd edition)
Telluride, Colorado, USA, June 13th – 16th, 2018- Oral
• [Invited] Multi-scaled architectured materials: from vortex-induced to dual
color laser structuring in silver-containing (non-)oxide glasses
Y. Petit, A Abou Khalil, A. Le Camus, S. Danto, T. Skopak, J.-C. Desmoulin,
E.-J. Lee, K. Mischik, T. Cardinal, L. Canioni,
J.-P. Bérubé, S.H. Messaddeq, Y. Messaddeq, R. Vallée
ISNOG
Québec city, Canada, 17-21 June 2018
• Intermediate-Tg glasses for multi-materials fibers
S. Danto, C. Strutynski, F. Désévédavy, Y. Petit, A. Abou Khalil, M.
Dussauze, J-C. Jules, G. Gadret, F. Smektala, L. Canioni, T. Cardinal
ISNOG
Québec city, Canada, 17-21 June 2018
• DLW of silver containing phosphate glass and fiber
Thierry Cardinal, Theo Guerineau, Alain Abou Khalil, Sylvain Danto; Jean
Philippe Bérubé, Yannick Petit, Clement Strutynski, Marc Dussauze, Lionel
Canioni, Real Vallee
Advanced Photonics 2018 Congress
ETH Zurich Swiss, 2-5 July 2018 – Oral
• Development of silver and rare-earth doped phosphate glasses for fiber
Laser applications
C. Strutynski, S. Danto, A. Abou Khalil, Y. Petit, L. Canioni, T. Cardinal
PNCS-ESG
Saint-Malo, France, 9-13 July 2018 - Oral
• The impact of the silver-containing phosphate glass composition on
femtosecond laser induced optical properties
T. Guérineau, C. Strutynski , S. Danto, M. Dussauze, L. Canioni, R. Vallée, A.
Abou Khalil, Y. Petit, T. Cardinal
PNCS-ESG

196
Saint-Malo, France, 9-13 July 2018 - Oral
• Intermediate-Tg glasses for multi-materials fibers
S. Danto, C. Strutynski, F. Désévédavy, Y. Petit, A. Abou Khalil, M.
Dussauze, J-C. Jules, G. Gadret, F. Smektala, L. Canioni, T. Cardinal
PNCS-ESG
Saint-Malo, France, 9-13 July 2018 – Oral
• Highly luminescent microstructures tailored by direct laser writing (DLW)
technique in silver containing fluorophosphate glass: application in 3D
waveguide and second harmonic generation (SHG)
T. de Castro, A. Abou Khalil, H. Fares, J.-C. Desmoulin, S. Rouzet, C.
Strutinski, Y. Petit, S. Danto, V. Jubera, L. Canioni, M. Nalin, S. J. L. Ribeiro,
& T. Cardinal
8th International Conference on Optical, Optoelectronic and Photonic
Materials and Applications (ICOOPMA 2018)
Maresias-SP, Brazil, 26-28 August 2018 – Oral
• Direct Laser writing of near-surface waveguides in silver containing glasses
with no additional processing
A.Abou Khalil, J.P Bérubé, S. Danto, T. Cardinal, Y. Petit, R. Vallée and
Lionel Canioni
SPIE – Photonics West
San Francisco, California, USA- 2 January – 7 February 2019 – Oral
(Upcoming)
• Photonic functionalities with a new type of waveguides sustained by
femtosecond laser inscribed fluorescent silver clusters in prepared glasses:
From directional couplers to waveguide Bragg gratings
Y. Petit, A. Abou Khalil, J.P Bérubé, S. Danto, T. Cardinal, R. Vallée and
Lionel Canoni
SPIE – Photonics West
San Francisco, California, USA- 2 January – 7 February 2019 – Oral
(Upcoming)
A.3. Comparitive study of different commercial techniques for ∆n
measurement. This study compares three different commercially available techniques that could be
used to measure the ∆n photo-induced in glasses following DLW. The work
compared the Quadri-wave lateral shearing interferometry (QWLSI), which refers to
the SID4bio wavefront sensor used during my PhD, the digital holographic
microscopy (DHM), and the last technique, which is the transport intensity equation
(TIE). The DHM technique is based on a Mach-Zenhder interferometer. It is a fully
integrated system in a microscope where a built-in 666 nm laser beam is divided
197
into two paths, one forming the object wave and the other forming the reference
wave. The object wave diffracted from the sample interferes with the reference
wave forming a hologram recorded by a digital camera [156]. After signal
processing and reconstruction, the output of the system is somehow similar to the
SID4bio: an intensity image and a phase image. More detail about the system can
be found in the following reference [156]. The TIE method consisted in capturing
the phase image based on several bright-field intensity images taken on both sides
of the focus plane of the object [201]. Then, the phase image is obtained based on
a Taylor series expansion from the bright-field intensity images [58]. The QWLSI
and DHM methods are fast methods consisting in placing the sample on the
microscope and imaging it in order to get the phase image. However, the TIE
method consisted in taking many intensity images while defocusing in both positive
and negative directions from the focus plane then feeding the images to the
software in order to determine the OPD which consumes a huge amount of time
compared to the first two techniques.
The comparison of those three methods was based on measuring a well-known
optical fiber, which is an SMF28 fiber with a 125 µm cladding, 8.2 µm germanium
doped core exhibiting a ∆n=5.2 x 10⁻³ [202]. The three methods managed more or
less to converge to the same ∆n value and profile, as shown in figure F. It was
surprising to notice a small dip ~600 nm of ∆n in the core that was not observed
before. The following study proves that the three existing techniques are accurate,
and reliable for measuring ∆n modification in a fast non-destructive way [202]. For
further details, the reader is referred to the following reference [202].

198
Figure F: The measured ∆n profile using the four methods, (blue) TIE, (red)
QWLSI/SID4Bio, (green) DHM and dashed lined RNF. All methods converge to
the same ∆n profile and value. Taken from [202].
A.4. Calculating the laser fluence, irradiance and energy
deposited per voxel (Chapter III) The average power, after the microscope objective was used, was measured for all
parameters used for DLW for both lasers, the T-pulse and the Ti:Sapphire laser.
Then, the pulse energy was extracted using the following equation:
𝐸𝑝 =𝑃𝑎𝑣𝑔
𝑇 (A-1)
where 𝑃𝑎𝑣𝑔 is the averaged power measured after the microscope objective and 𝑇 is
the repetition rate of the laser used.
Then the laser fluence (J/cm2) is calculated using the following equation:
𝐹 =𝐸𝑝
𝜋𝑤02 (A-2)

199
Where 𝐸𝑝 is the pulse energy and 𝑤0 is the waist calculated using (I-21) or (I-22)
depending on the NA of the objective.
The laser irradiance in this case or laser intensity (TW/cm2) is calculated as a
function of the spot size, the laser repetition rate and the pulse duration using
(I-23).
The deposited energy was calculated using equations extracted from the PhD
manuscript of Gautier Papon [203] where the deposited energy is given by:
𝐸𝐷 = 𝛼(4)9𝑇𝜋(𝑤𝑁𝐿
3)2𝐼4
3
4𝑧𝑁𝐿 (A-3)
Where 𝛼(4) =14.6 ± 1 × 10⁻³ 𝑐𝑚5/𝑇𝑊3 is the coefficient absorption corresponding to
the four photon process; 𝑇 is the laser repetition rate with 𝑤𝑁𝐿 =𝑤0
√𝑁 and 𝑧𝑁𝐿 =
𝑧𝑟
√𝑁 the
non-linear waist and Rayleigh length with N=4 corresponding to a four photon
absorption effect, and 𝐼 the laser irradiance.
The deposited energy calculated for parameters used for type I modification
exceeded the energy of the pulse which is not normal. The formula used in that
case is not fully compatible when using high pulse energies. Therefore the energy
deposited was limited to 1 µJ. Finally, those calculations are only approximate to
show the large difference between the two laser parameters used.
And the energy deposited by voxel/laser dose is obtained by dividing the last term
(the deposited energy) by the volume of the voxel:
𝑄0 =𝐸𝐷
𝜋3/2𝑤𝑁𝐿2 𝑧𝑁𝐿
(A-4)
From the laser energy deposited by voxel, one can calculate the highest
temperature difference that occurs in one point induced by one laser pulse as given
by:
∆𝑇 =𝑄0
𝜌𝐶𝑝 (A-5)
Where 𝜌 is the molar density of the glass and 𝐶𝑝 the heat capacity.
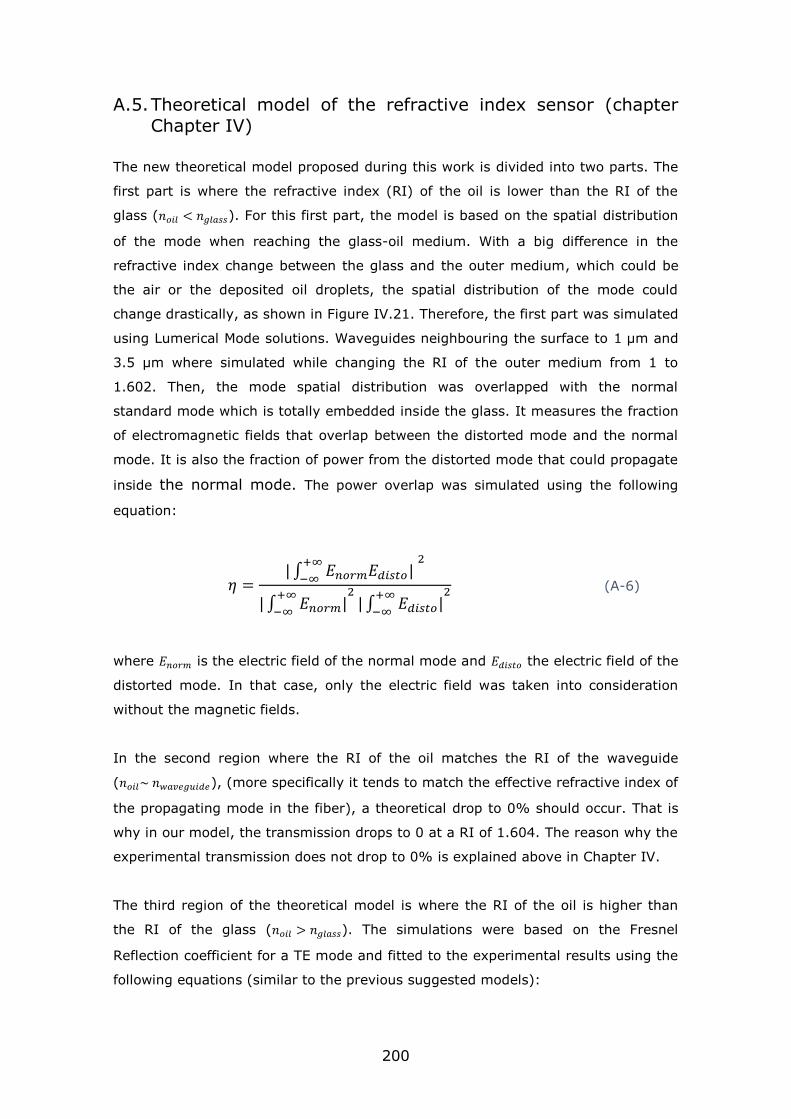
200
A.5. Theoretical model of the refractive index sensor (chapter
Chapter IV)
The new theoretical model proposed during this work is divided into two parts. The
first part is where the refractive index (RI) of the oil is lower than the RI of the
glass (𝑛𝑜𝑖𝑙 < 𝑛𝑔𝑙𝑎𝑠𝑠). For this first part, the model is based on the spatial distribution
of the mode when reaching the glass-oil medium. With a big difference in the
refractive index change between the glass and the outer medium, which could be
the air or the deposited oil droplets, the spatial distribution of the mode could
change drastically, as shown in Figure IV.21. Therefore, the first part was simulated
using Lumerical Mode solutions. Waveguides neighbouring the surface to 1 µm and
3.5 µm where simulated while changing the RI of the outer medium from 1 to
1.602. Then, the mode spatial distribution was overlapped with the normal
standard mode which is totally embedded inside the glass. It measures the fraction
of electromagnetic fields that overlap between the distorted mode and the normal
mode. It is also the fraction of power from the distorted mode that could propagate
inside the normal mode. The power overlap was simulated using the following
equation:
𝜂 =| ∫ 𝐸𝑛𝑜𝑟𝑚𝐸𝑑𝑖𝑠𝑡𝑜|
+∞
−∞
2
| ∫ 𝐸𝑛𝑜𝑟𝑚|+∞
−∞
2| ∫ 𝐸𝑑𝑖𝑠𝑡𝑜|
+∞
−∞
2 (A-6)
where 𝐸𝑛𝑜𝑟𝑚 is the electric field of the normal mode and 𝐸𝑑𝑖𝑠𝑡𝑜 the electric field of the
distorted mode. In that case, only the electric field was taken into consideration
without the magnetic fields.
In the second region where the RI of the oil matches the RI of the waveguide
(𝑛𝑜𝑖𝑙~ 𝑛𝑤𝑎𝑣𝑒𝑔𝑢𝑖𝑑𝑒), (more specifically it tends to match the effective refractive index of
the propagating mode in the fiber), a theoretical drop to 0% should occur. That is
why in our model, the transmission drops to 0 at a RI of 1.604. The reason why the
experimental transmission does not drop to 0% is explained above in Chapter IV.
The third region of the theoretical model is where the RI of the oil is higher than
the RI of the glass (𝑛𝑜𝑖𝑙 > 𝑛𝑔𝑙𝑎𝑠𝑠). The simulations were based on the Fresnel
Reflection coefficient for a TE mode and fitted to the experimental results using the
following equations (similar to the previous suggested models):

201
𝑅 =
𝑛𝑔𝑙𝑎𝑠𝑠𝑐𝑜𝑠𝜃1 − 𝑛2√1 − (𝑛𝑔𝑙𝑎𝑠𝑠𝑠𝑖𝑛𝜃1
𝑛𝑜𝑖𝑙)2
𝑛𝑔𝑙𝑎𝑠𝑠𝑐𝑜𝑠𝜃1 + 𝑛2√1 − (𝑛𝑔𝑙𝑎𝑠𝑠𝑠𝑖𝑛𝜃1
𝑛𝑜𝑖𝑙)2
(A-7)
𝑇 = (1 − 𝑅2)𝑛 (A-8)
202
References:
1. Zarzycki, J., Glasses and Amorphous Materials. Vol. 9. 1991.
2. Elliot, S.R., Physics of amorphous materials. 1990: Harlow, Essex, England : Longman Scientific & Technical ; New York : J. Wiley, ©1990.
3. Varshneya, A., Fundamentals of Inorganic Glasses. 1994.
4. Schubert, U., Introduction to glass science and technology. Von J. E. Shelby. Royal Society of Chemistry, Cambridge, 1997. 244 S., Broschur, 18.95 £.—ISBN 0-85404-533-3. Angewandte Chemie, 1997. 109(22): p. 2637-2637.
5. Zachariasen, W.H., THE ATOMIC ARRANGEMENT IN GLASS. Journal of the American Chemical Society, 1932. 54(10): p. 3841-3851.
6. Grest, G.S. and M.H. Cohen, Liquids, Glasses, and the Glass Transition: A Free-Volume Approach, in Advances in Chemical Physics. 2007, John Wiley & Sons, Inc. p. 455-525.
7. Gibbs, J.H. and E.A. DiMarzio, Nature of the Glass Transition and the Glassy State. The Journal of Chemical Physics, 1958. 28(3): p. 373-383.
8. Stillinger, F.H., Supercooled liquids, glass transitions, and the Kauzmann paradox. The Journal of Chemical Physics, 1988. 88(12): p. 7818-7825.
9. Messaddeq, Y., Le verre : principes théoriques et applications, U. Laval, Editor.
10. Badrinarayanan, P., et al., The glass transition temperature versus the fictive temperature. Journal of Non-Crystalline Solids, 2007. 353(26): p. 2603-2612.
11. Bourhis, K., Photostructuration par laser infrarouge femtoseconde de verres photosensible de phosphate de zinc, d'argent et de gallium. 2011, Université de Bordeaux.
12. Goldschmidt, V.M., Die Gesetze der Krystallochemie. Naturwissenschaften, 1926. 14(21): p. 477-485.
13. Smekal, A. and W. Klemm, Mechanische Messung chemischer Bindefestigkeiten. Monatshefte für Chemie und verwandte Teile anderer Wissenschaften, 1951. 82(3): p. 411-421.
14. Sun, K.H., FUNDAMENTAL CONDITION OF GLASS FORMATION*. Journal of the American Ceramic Society, 1947. 30(9): p. 277-281.
15. Shelby, J.E., Introduction to Glass Science and Technology. 2005: Royal Society of Chemistry.
16. Savage, J.A. and S. Nielsen, Chalcogenide glasses transmitting in the infrared between 1 and 20 μ — a state of the art review. Infrared Physics, 1965. 5(4): p. 195-204.
17. Hooker, S. and C. Webb, Laser Physics. 2010
.

203
18. Abbott, B.P., et al., Observation of Gravitational Waves from a Binary Black Hole Merger. Phys Rev Lett, 2016. 116(6): p. 061102.
19. Gordon, J.P., H.J. Zeiger, and C.H. Townes, Molecular Microwave Oscillator and New Hyperfine Structure in the Microwave Spectrum of N${\mathrm{H}}_{3}$. Physical Review, 1954. 95(1): p. 282-284.
20. Schawlow, A.L. and C.H. Townes, Infrared and Optical Masers. Physical Review, 1958. 112(6): p. 1940-1949.
21. Maiman, T.H., Stimulated Optical Emission in Fluorescent Solids. I. Theoretical Considerations. Physical Review, 1961. 123(4): p. 1145-1150.
22. Javan, A., W.R. Bennett, and D.R. Herriott, Population Inversion and Continuous Optical Maser Oscillation in a Gas Discharge Containing a He-Ne Mixture. Physical Review Letters, 1961. 6(3): p. 106-110.
23. Littman, M.G. and H.J. Metcalf, Spectrally narrow pulsed dye laser without beam expander. Applied Optics, 1978. 17(14): p. 2224-2227.
24. Hall, R.N., et al., Coherent Light Emission From GaAs Junctions. Physical Review Letters, 1962. 9(9): p. 366-368.
25. Heard, H.G., Ultra-violet Gas Laser at Room Temperature. Nature, 1963. 200: p. 667.
26. Fortin, V., et al., Fluoride glass Raman fiber laser at 2185 nm. Optics Letters, 2011. 36(21): p. 4152-4154.
27. Emma, P., et al., First lasing and operation of an ångstrom-wavelength free-electron laser. Nature Photonics, 2010. 4: p. 641.
28. Rocca, J.J., et al., Demonstration of a Discharge Pumped Table-Top Soft-X-Ray Laser. Physical Review Letters, 1994. 73(16): p. 2192-2195.
29. Svelto, O., Principles of Lasers. fifth edition ed.: Springer, Boston, MA.
30. Bernier, M., et al., 3.77 mum fiber laser based on cascaded Raman gain in a chalcogenide glass fiber. Opt Lett, 2014. 39(7): p. 2052-5.
31. SIlfvast, W.T., Laser Fundamentals. Second ed. 2008.
32. Bhowmik, A. and A.E. Siegman, <title>Defining, measuring, and optimizing laser beam quality</title>. 1993. 1868: p. 2-12.
33. Royon, A., et al., Femtosecond laser induced photochemistry in materials tailored with photosensitive agents [Invited]. Optical Materials Express, 2011. 1(5): p. 866-882.
34. Chris, B.S., B. André, and M. Eric, Laser-induced breakdown and damage in bulk transparent materials induced by tightly focused femtosecond laser pulses. Measurement Science and Technology, 2001. 12(11): p. 1784.
35. Bérubé, J.-P., Étude des changement structuraux photo-induits dans le verre à l'aide des imulstions femtosecondes et application à l'inscription de composants photoniques. 2014, Université Laval.

204
36. Stuart, B.C., et al., Laser-induced damage in dielectrics with nanosecond to subpicosecond pulses. Phys Rev Lett, 1995. 74(12): p. 2248-2251.
37. Lenzner, M., et al., Femtosecond Optical Breakdown in Dielectrics. Physical Review Letters, 1998. 80(18): p. 4076-4079.
38. V, K.L., Concerning the theory impact ionization in semiconductors Zh. Eksp. Teor. Fiz. 47 1945 (Engl. transl.Sov. Phys.–JETP 20 1307 (1965)), 1964.
39. Stuart, B.C., et al., Nanosecond-to-femtosecond laser-induced breakdown in dielectrics. Physical Review B, 1996. 53(4): p. 1749-1761.
40. Gaier *, L.N., et al., Hole-assisted energy deposition in dielectrics and clusters in the multiphoton regime. Journal of Modern Optics, 2005. 52(7): p. 1019-1030.
41. gamaly, E., Femtosecond laser-matter interactions. 2011.
42. Chichkov, B.N., et al., Femtosecond, picosecond and nanosecond laser ablation of solids. Applied Physics A, 1996. 63(2): p. 109-115.
43. Couairon, A., et al., Filamentation and damage in fused silica induced by tightly focused femtosecond laser pulses. Physical Review B, 2005. 71(12).
44. Bellec, M., et al., 3D Patterning at the Nanoscale of Fluorescent Emitters in Glass. The Journal of Physical Chemistry C, 2010. 114(37): p. 15584-15588.
45. Hernandez-Rueda, J., et al., The influence of femtosecond laser wavelength on waveguide fabrication inside fused silica. Applied Physics Letters, 2017. 110(16): p. 161109.
46. Schaffer, C.B., J.F. García, and E. Mazur, Bulk heating of transparent materials using a high-repetition-rate femtosecond laser. Applied Physics A, 2003. 76(3): p. 351-354.
47. Eaton, S.M., et al., Heat accumulation effects in femtosecond laser-written waveguides with variable repetition rate. Optics Express, 2005. 13(12): p. 4708-4716.
48. Zhang, H., et al., Heat accumulation during high repetition rate ultrafast laser interaction: Waveguide writing in borosilicate glass. Journal of Physics: Conference Series, 2007. 59: p. 682-686.
49. Gross, S., et al., Ultrafast Laser Inscription in Soft Glasses: A Comparative Study of Athermal and Thermal Processing Regimes for Guided Wave Optics. International Journal of Applied Glass Science, 2012. 3(4): p. 332-348.
50. Stalmashonak, A., H. Graener, and G. Seifert, Transformation of silver nanospheres embedded in glass to nanodisks using circularly polarized femtosecond pulses. Applied Physics Letters, 2009. 94(19): p. 193111.
51. Temnov, V.V., et al., Multiphoton ionization in dielectrics: comparison of circular and linear polarization. Phys Rev Lett, 2006. 97(23): p. 237403.
52. Bhardwaj, V.R., et al., Optically produced arrays of planar nanostructures inside fused silica. Phys Rev Lett, 2006. 96(5): p. 057404.

205
53. Ams, M., G.D. Marshall, and M.J. Withford, Study of the influence of femtosecondlaser polarisation on direct writing ofwaveguides. Optics Express, 2006. 14(26): p. 13158-13163.
54. Schaffer, C.B., et al., Micromachining bulk glass by use of femtosecond laser pulses with nanojoule energy. Optics Letters, 2001. 26(2): p. 93-95.
55. Ashcom, J.B., et al., Numerical aperture dependence of damage and supercontinuum generation from femtosecond laser pulses in bulk fused silica. Journal of the Optical Society of America B, 2006. 23(11): p. 2317-2322.
56. Davis, K.M., et al., Writing waveguides in glass with a femtosecond laser. Optics Letters, 1996. 21(21): p. 1729-1731.
57. Hirao, K. and K. Miura, Writing waveguides and gratings in silica and related materials by a femtosecond laser. Journal of Non-Crystalline Solids, 1998. 239(1): p. 91-95.
58. Barone‐Nugent, E.D., A. Barty, and K.A. Nugent, Quantitative phase‐amplitude microscopy I: optical microscopy. Journal of Microscopy, 2002. 206(3): p. 194-203.
59. Osellame, R., et al., Optical gain in Er-Yb doped waveguides fabricated by femtosecond laser pulses. Electronics letters, 2002. 38(17): p. 1.
60. Streltsov, A.M. and N.F. Borrelli, Study of femtosecond-laser-written waveguides in glasses. Journal of the Optical Society of America B, 2002. 19(10): p. 2496-2504.
61. Chan, J.W., et al., Waveguide fabrication in phosphate glasses using femtosecond laser pulses. Applied Physics Letters, 2003. 82(15): p. 2371.
62. Fletcher, L.B., et al., Direct femtosecond laser waveguide writing inside zinc phosphate glass. Optics Express, 2011. 19(9): p. 7929-7936.
63. Ams, M., et al., Slit beam shaping method for femtosecond laser direct-write fabrication of symmetric waveguides in bulk glasses. Optics Express, 2005. 13(15): p. 5676-5681.
64. Poumellec, B., et al., Modification thresholds in femtosecond laser processing of pure silica: review of dependencies on laser parameters [Invited]. Optical Materials Express, 2011. 1(4): p. 766-782.
65. Hnatovsky, C., et al., Pulse duration dependence of femtosecond-laser-fabricated nanogratings in fused silica. Applied Physics Letters, 2005. 87(1): p. 014104.
66. Will, M., et al., Optical properties of waveguides fabricated in fused silica by femtosecond laser pulses. Applied Optics, 2002. 41(21): p. 4360-4364.
67. Osellame, R., et al., Femtosecond writing of active optical waveguides with astigmatically shaped beams. Journal of the Optical Society of America B, 2003. 20(7): p. 1559-1567.
68. Shah, L., et al., Waveguide writing in fused silica with a femtosecond fiber laser at 522 nm and 1 MHz repetition rate. Optics Express, 2005. 13(6): p. 1999-2006.

206
69. Salter, P.S., et al., Adaptive slit beam shaping for direct laser written waveguides. Optics Letters, 2012. 37(4): p. 470-472.
70. Berube, J.P., et al., Tailoring the refractive index of Ge-S based glass for 3D embedded waveguides operating in the mid-IR region. Opt Express, 2014. 22(21): p. 26103-16.
71. Lapointe, J., et al., Making smart phones smarter with photonics. Opt Express, 2014. 22(13): p. 15473-83.
72. Shimotsuma, Y., et al., Self-Organized Nanogratings in Glass Irradiated by Ultrashort Light Pulses. Physical Review Letters, 2003. 91(24): p. 247405.
73. Richter, S., et al., Formation of femtosecond laser-induced nanogratings at high repetition rates. Applied Physics A, 2011. 104(2): p. 503-507.
74. Liang, F., R. Vallée, and S.L. Chin, Mechanism of nanograting formation on the surface of fused silica. Optics Express, 2012. 20(4): p. 4389-4396.
75. Chan, J.W., et al., Modification of the fused silica glass network associated with waveguide fabrication using femtosecond laser pulses. Applied Physics A: Materials Science & Processing, 2003. 76(3): p. 367-372.
76. Little, D.J., et al., Mechanism of femtosecond-laser induced refractive index change in phosphate glass under a low repetition-rate regime. Journal of Applied Physics, 2010. 108(3): p. 033110.
77. Chan, J.W., et al., Structural changes in fused silica after exposure to focused femtosecond laser pulses. Optics Letters, 2001. 26(21): p. 1726-1728.
78. Dekker, P., et al., Annealing dynamics of waveguide Bragg gratings: evidence of femtosecond laser induced colour centres. Optics Express, 2010. 18(4): p. 3274-3283.
79. Zhao, Q.-Z., et al., Temperature dependence of femtosecond laser induced refractive index change in Nd3+-doped phosphate glass. Optical Materials, 2005. 27(6): p. 1159-1162.
80. Little, D.J., et al., Structural changes in BK7 glass upon exposure to femtosecond laser pulses. Journal of Raman Spectroscopy, 2011. 42(4): p. 715-718.
81. Abdel-Baki, M., et al., Factors affecting optical dispersion in borate glass systems. Journal of Physics and Chemistry of Solids, 2007. 68(8): p. 1457-1470.
82. Messaddeq, S., et al., Light-induced relief gratings and a mechanism of metastable light-induced expansion in chalcogenide glasses. Physical Review B, 2001. 63(22): p. 224203.
83. Messaddeq, S.H., et al., Study of the photosensitivity of GeS binary glasses to 800nm femtosecond pulses. Optics Express, 2012. 20(3): p. 2824-2831.
84. Kanehira, S., K. Miura, and K. Hirao, Ion exchange in glass using femtosecond laser irradiation. Applied Physics Letters, 2008. 93(2): p. 023112.
85. Arriola, A., et al., Low bend loss waveguides enable compact, efficient 3D photonic chips. Optics Express, 2013. 21(3): p. 2978-2986.
207
86. Cerullo, G., et al., Femtosecond micromachining of symmetric waveguides at 1.5 µm by astigmatic beam focusing. Optics Letters, 2002. 27(21): p. 1938-1940.
87. Bérubé, J.-P., et al., Femtosecond laser direct inscription of mid-IR transmitting waveguides in BGG glasses. Optical Materials Express, 2017. 7(9): p. 3124-3135.
88. Mauclair, C., et al., Ultrafast laser writing of homogeneous longitudinal waveguides in glasses using dynamic wavefront correction. Optics Express, 2008. 16(8): p. 5481-5492.
89. Bérubé, J.-P., M. Bernier, and R. Vallée, Femtosecond laser-induced refractive index modifications in fluoride glass. Optical Materials Express, 2013. 3(5): p. 598-611.
90. McMillen, B., et al., Ultrafast laser fabrication of low-loss waveguides in chalcogenide glass with 0.65  dB/cm loss. Optics Letters, 2012. 37(9): p. 1418-1420.
91. Bérubé, J.-P. and R. Vallée, Femtosecond laser direct inscription of surface skimming waveguides in bulk glass. Optics Letters, 2016. 41(13): p. 3074-3077.
92. Nandi, P., et al., Femtosecond laser written channel waveguides in tellurite glass. Optics Express, 2006. 14(25): p. 12145-12150.
93. Osellame, R., et al., Waveguide lasers in the C-band fabricated by laser inscription with a compact femtosecond oscillator. IEEE Journal of Selected Topics in Quantum Electronics, 2006. 12(2): p. 277-285.
94. Ródenas, A., et al., Three-dimensional mid-infrared photonic circuits in chalcogenide glass. Optics Letters, 2012. 37(3): p. 392-394.
95. Tong, L., et al., Optical loss measurements in femtosecond laser written waveguides in glass. Optics Communications, 2006. 259(2): p. 626-630.
96. Lee, H., et al., Ultra-low-loss optical delay line on a silicon chip. Nature Communications, 2012. 3: p. 867.
97. Li, G., et al., Ultralow-loss, high-density SOI optical waveguide routing for macrochip interconnects. Optics Express, 2012. 20(11): p. 12035-12039.
98. Saleh, B.E.A. and M.C. Teich, Fundamentals of photonics. 1991: Wiley.
99. Saleh, B.E.A. and M.C. Teich, Fundamentals of Photonics. 2007: Wiley.
100. Fletcher, L.B., et al., Femtosecond laser writing of waveguides in zinc phosphate glasses [Invited]. Optical Materials Express, 2011. 1(5): p. 845-855.
101. Bérubé, J.-P., Étude des changements structuraux photo-induits dans le verre à l’aide des impulsions femtosecondes et application à l’inscription de composants photoniques, in COPL. 2014, Université Laval.
102. Palmer, G., et al., High slope efficiency and high refractive index change in direct-written Yb-doped waveguide lasers with depressed claddings. Opt Express, 2013. 21(14): p. 17413-20.

208
103. Lancaster, D.G., et al., Versatile large-mode-area femtosecond laser-written Tm:ZBLAN glass chip lasers. Optics Express, 2012. 20(25): p. 27503-27509.
104. Yariv, A., Optical Electronics. 1990: Oxford University Press.
105. Vallée, R., La fibre Optique, U. Laval, Editor.
106. Snyder, A.W. and A. Ankiewicz, Optical fiber couplers-optimum solution for unequal cores. Journal of Lightwave Technology, 1988. 6(3): p. 463-474.
107. Buck, J.A., Fundamental of Optical fibers. 2nd ed. 2004.
108. Crespi, A., et al., Integrated photonic quantum gates for polarization qubits. Nat Commun, 2011. 2: p. 566.
109. Streltsov, A.M. and N.F. Borrelli, Fabrication and analysis of a directional coupler written in glass by nanojoule femtosecond laser pulses. Optics Letters, 2001. 26(1): p. 42-43.
110. Eaton, S.M., et al., Telecom-Band Directional Coupler Written With Femtosecond Fiber Laser. IEEE Photonics Technology Letters, 2006. 18(20): p. 2174-2176.
111. Kowalevicz, A.M., et al., Three-dimensional photonic devices fabricated in glass by use of a femtosecond laser oscillator. Optics Letters, 2005. 30(9): p. 1060-1062.
112. Homoelle, D., et al., Infrared photosensitivity in silica glasses exposed to femtosecond laser pulses. Optics Letters, 1999. 24(18): p. 1311-1313.
113. Liu, J., et al., Directly writing of 1-to-N optical waveguide power splitters in fused silica glass using a femtosecond laser. Optics Communications, 2005. 253(4): p. 315-319.
114. Nolte, S., et al., Femtosecond waveguide writing: a new avenue to three-dimensional integrated optics. Applied Physics A: Materials Science & Processing, 2003. 77(1): p. 109-111.
115. Marshall, G.D., M. Ams, and M.J. Withford, Direct laser written waveguide-Bragg gratings in bulk fused silica. Optics Letters, 2006. 31(18): p. 2690-2691.
116. Zhang, H., et al., Type II femtosecond laser writing of Bragg grating waveguides in bulk glass. Electronics Letters, 2006. 42(21): p. 1223.
117. Marshall, G.D., et al., Three-dimensional imaging of direct-written photonic structures. Optics Letters, 2011. 36(5): p. 695-697.
118. Ams, M., et al., Fabricating waveguide Bragg gratings (WBGs) in bulk materials using ultrashort laser pulses. Nanophotonics, 2017. 6(5): p. 743-763.
119. Taccheo, S., et al., Er:Yb-doped waveguide laser fabricated by femtosecond laser pulses. Optics Letters, 2004. 29(22): p. 2626-2628.
120. Marshall, G.D., et al., Directly written monolithic waveguide laser incorporating a distributed feedback waveguide-Bragg grating. Optics Letters, 2008. 33(9): p. 956-958.

209
121. Psaila, N.D., et al., Er : Yb-Doped Oxyfluoride Silicate Glass Waveguide Laser Fabricated Using Ultrafast Laser Inscription. IEEE Photonics Technology Letters, 2008. 20(2): p. 126-128.
122. Sabapathy, T., et al., Direct ultrafast laser written C-band waveguide amplifier in Er-doped chalcogenide glass. Optical Materials Express, 2012. 2(11): p. 1556-1561.
123. Lancaster, D.G., et al., Fifty percent internal slope efficiency femtosecond direct-written Tm3+:ZBLAN waveguide laser. Optics Letters, 2011. 36(9): p. 1587-1589.
124. Della Valle, G., R. Osellame, and P. Laporta, Micromachining of photonic devices by femtosecond laser pulses. Journal of Optics A: Pure and Applied Optics, 2009. 11(1): p. 013001.
125. Thomson, R.R., et al., Ultrafast laser inscription of an integrated photonic lantern. Optics Express, 2011. 19(6): p. 5698-5705.
126. Spaleniak, I., et al., Integrated photonic building blocks for next-generation astronomical instrumentation II: the multimode to single mode transition. Opt Express, 2013. 21(22): p. 27197-208.
127. Photonics, M.; Available from: http://www.modularphotonics.com/.
128. MESNAOUI, M., et al., Spectroscopic properties of Ag+ ions in phosphate glasses of NaPO3− AgPO3 system. European journal of solid state and inorganic chemistry, 1992. 29(6): p. 1001-1013.
129. Montagne, L., G. Palavit, and R. Delaval, Effect of ZnO on the properties of (100-x)(NaPO 3)-xZnO glasses. Journal of non-crystalline solids, 1998. 223(1): p. 43-47.
130. Inc, C., Zinc containing phosphate glasses. 1990: US.
131. Heisterkamp, A., et al., All-optical characterization of fs-laser induced refractive index changes in bulk and at the surface of zinc phosphate glasses. 2015. 9355: p. 935518.
132. Fletcher, L.B., et al., Effects of rare-earth doping on femtosecond laser waveguide writing in zinc polyphosphate glass. Journal of Applied Physics, 2012. 112(2): p. 023109.
133. Ferrer, A., et al., Deep subsurface optical waveguides produced by direct writing with femtosecond laser pulses in fused silica and phosphate glass. Applied Surface Science, 2007. 254(4): p. 1121-1125.
134. Osellame, R., et al., Lasing in femtosecond laser written optical waveguides. Applied Physics A, 2008. 93(1): p. 17-26.
135. Desmoulin, J.-C., Synthèse et caractérisation de verres d’oxyde d’argent : évolution sous rayonnements ionisants et structuration multi-échelle par laser femtoseconde. 2016, Université de Bordeaux.
136. Bellec, M., et al., Beat the diffraction limit in 3D direct laser writing in photosensitive glass. Optics Express, 2009. 17(12): p. 10304-10318.
210
137. Peyser, L.A., et al., Photoactivated fluorescence from individual silver nanoclusters. Science, 2001. 291(5501): p. 103-106.
138. Maurel, C., et al., Luminescence properties of silver zinc phosphate glasses following different irradiations. Journal of Luminescence, 2009. 129(12): p. 1514-1518.
139. Marquestaut, N., et al., Three-Dimensional Silver Nanoparticle Formation Using Femtosecond Laser Irradiation in Phosphate Glasses: Analogy with Photography. Advanced Functional Materials, 2014. 24(37): p. 5824-5832.
140. Smetanina, E., et al., Modeling of cluster organization in metal-doped oxide glasses irradiated by a train of femtosecond laser pulses. Physical Review A, 2016. 93(1).
141. Desmoulin, J.-C., et al., Femtosecond laser structuring of silver-containing glass: Silver redistribution, selective etching, and surface topology engineering. Journal of Applied Physics, 2015. 118(21): p. 213104.
142. Choi, J., et al., Three-dimensional direct femtosecond laser writing of second-order nonlinearities in glass. Optics Letters, 2012. 37(6): p. 1029-1031.
143. Papon, G., et al., Fluorescence and second-harmonic generation correlative microscopy to probe space charge separation and silver cluster stabilization during direct laser writing in a tailored silver-containing glass. Optical Materials Express, 2013. 3(11): p. 1855.
144. Papon, G., et al., Femtosecond single-beam direct laser poling of stable and efficient second-order nonlinear optical properties in glass. Journal of Applied Physics, 2014. 115(11): p. 113103.
145. Tu, Z., et al., Micro-modification of luminescence property in Ag+-doped phosphate glass using femtosecond laser irradiation. Journal of Non-Crystalline Solids, 2014. 383: p. 161-164.
146. Vasileva, A.A., et al., Structural features of silver-doped phosphate glasses in zone of femtosecond laser-induced modification. Journal of Solid State Chemistry, 2015. 230: p. 56-60.
147. Lipat’ev, A.S., et al., Formation of Luminescent and Birefringent Microregions in Phosphate Glass Containing Silver. Glass and Ceramics, 2016. 73(7-8): p. 277-282.
148. Shakhgildyan, G.Y., et al., One-step micro-modification of optical properties in silver-doped zinc phosphate glasses by femtosecond direct laser writing. Journal of Non-Crystalline Solids, 2018. 481: p. 634-642.
149. Danto, S., et al., Photowritable Silver-Containing Phosphate Glass Ribbon Fibers. Advanced Optical Materials, 2016. 4(1): p. 162-168.
150. Bourhis, K., et al., Femtosecond laser structuring and optical properties of a silver and zinc phosphate glass. Journal of Non-Crystalline Solids, 2010. 356(44-49): p. 2658-2665.
211
151. Grenier, J.R., et al. Optical Circuits in Fiber Cladding: Femtosecond laser-written Bragg Grating Waveguides. in CLEO:2011 - Laser Applications to Photonic Applications. 2011. Baltimore, Maryland: Optical Society of America.
152. Royon, A., et al., Silver clusters embedded in glass as a perennial high capacity optical recording medium. Adv Mater, 2010. 22(46): p. 5282-6.
153. Escobar, I., et al., Reduction of the spherical aberration effect in high-numerical-aperture optical scanning instruments. Journal of the Optical Society of America A, 2006. 23(12): p. 3150-3155.
154. Robinson, J.P., Chapter 4 Principles of confocal microscopy, in Methods in Cell Biology. 2001, Academic Press. p. 89-106.
155. http://phasicscorp.com/. Available from: http://phasicscorp.com/.
156. Bon, P., et al., Quadriwave lateral shearing interferometry for quantitative phase microscopy of living cells. Optics Express, 2009. 17(15): p. 13080-13094.
157. Rivet, S., Caractérisation complète d'un faisceau laser impulsionnel femtoseconde : mise en évidence et analyse du couplage spatio-temporel dans la propagation linéaire et non linéaire. 2001, Université Bordeaux 1.
158. !!! INVALID CITATION !!! {Homoelle, 1999 #314;Heisterkamp, 2015 #12;Heisterkamp, 2015 #12}.
159. Bellouard, Y., et al., Stress-state manipulation in fused silica via femtosecond laser irradiation. Optica, 2016. 3(12): p. 1285.
160. Block, E.K., et al. Non-ablative femtosecond laser exposure of fused silica in the sub-50 fs regime (Conference Presentation). in SPIE LASE. 2017. SPIE.
161. Hiroshi, K., S. Kazuya, and J.I. Akira, Refractive Index, Density and Polarizability of Silica Glass with Various Fictive Temperatures. Japanese Journal of Applied Physics, 2004. 43(6A): p. L743.
162. Eaton, S.M., et al., High refractive index contrast in fused silica waveguides by tightly focused, high-repetition rate femtosecond laser. Journal of Non-Crystalline Solids, 2011. 357(11-13): p. 2387-2391.
163. Marom, E., O. Ramer, and S. Ruschin, Relation between normal-mode and coupled-mode analyses of parallel waveguides. IEEE journal of quantum electronics, 1984. 20(12): p. 1311-1319.
164. Lacroix, S., F. Gonthier, and J. Bures, Modeling of symmetric 2× 2 fused-fiber couplers. Applied optics, 1994. 33(36): p. 8361-8369.
165. Royon, A., et al., Durability study of a fluorescent optical memory in glass studied by luminescence spectroscopy. Microelectronics Reliability, 2013. 53(9–11): p. 1514-1518.
166. Fletcher, L.B., et al., Changes to the network structure of Er–Yb doped phosphate glass induced by femtosecond laser pulses. Journal of Applied Physics, 2009. 106(8): p. 083107.

212
167. Chen, W.-J., et al., Broadband directional couplers fabricated in bulk glass with high repetition rate femtosecond laser pulses. Optics Express, 2008. 16(15): p. 11470.
168. Minoshima, K., et al., Fabrication of coupled mode photonic devices in glass by nonlinear femtosecond laser materials processing. Optics Express, 2002. 10(15): p. 645-652.
169. Lapointe, J., et al., Toward the integration of optical sensors in smartphone screens using femtosecond laser writing. Opt Lett, 2015. 40(23): p. 5654-7.
170. Marshall, G.D., et al., Laser written waveguide photonic quantum circuits. Optics Express, 2009. 17(15): p. 12546-12554.
171. Flamini, F., et al., Thermally reconfigurable quantum photonic circuits at telecom wavelength by femtosecond laser micromachining. Light: Science & Applications, 2015. 4(11): p. e354.
172. Mermillod-Blondin, A., et al., Flipping the sign of refractive index changes in ultrafast and temporally shaped laser-irradiated borosilicate crown optical glass at high repetition rates. Physical Review B, 2008. 77(10).
173. Ehrt, D., et al., Femtosecond-laser-writing in various glasses. Journal of Non-Crystalline Solids, 2004. 345-346: p. 332-337.
174. Abou Khalil, A., et al., Direct laser writing of a new type of waveguides in silver containing glasses. Scientific Reports, 2017. 7(1): p. 11124.
175. Ams, M., et al., Investigation of Ultrafast Laser--Photonic Material Interactions: Challenges for Directly Written Glass Photonics. IEEE Journal of Selected Topics in Quantum Electronics, 2008. 14(5): p. 1370-1381.
176. Osellame, R., et al., Optical properties of waveguides written by a 26 MHz stretched cavity Ti:sapphire femtosecond oscillator. Optics Express, 2005. 13(2): p. 612-620.
177. Eaton, S.M., et al., Transition from thermal diffusion to heat accumulation in high repetition rate femtosecond laser writing of buried optical waveguides. Optics Express, 2008. 16(13): p. 9443-9458.
178. Jovanovic, N., et al. Direct Laser Written Multimode Waveguides for Astronomical Applications. in Advanced Photonics & Renewable Energy. 2010. Karlsruhe: Optical Society of America.
179. Tai, H., H. Tanaka, and T. Yoshino, Fiber-optic evanescent-wave methane-gas sensor using optical absorption for the 3.392-μm line of a He–Ne laser. Optics Letters, 1987. 12(6): p. 437-439.
180. Heo, J., et al., Remote fiber-optic chemical sensing using evanescent-wave interactions in chalcogenide glass fibers. Applied Optics, 1991. 30(27): p. 3944-3951.
181. Kumar, P.S., et al., A fibre optic evanescent wave sensor used for the detection of trace nitrites in water. Journal of Optics A: Pure and Applied Optics, 2002. 4(3): p. 247.
213
182. Polynkin, P., et al., Evanescent field-based optical fiber sensing device for measuring the refractive index of liquids in microfluidic channels. Optics Letters, 2005. 30(11): p. 1273-1275.
183. Bilro, L., et al., A simple and low-cost cure monitoring system based on a side-polished plastic optical fibre. Measurement Science and Technology, 2010. 21(11): p. 117001.
184. Ribeiro, R.M., et al., An evanescent-coupling plastic optical fibre refractometer and absorptionmeter based on surface light scattering. Sensors and Actuators A: Physical, 2002. 101(1): p. 69-76.
185. Vazquez, R.M., et al., Integration of femtosecond laser written optical waveguides in a lab-on-chip. Lab Chip, 2009. 9(1): p. 91-6.
186. Liu, D., et al., Influence of focusing depth on the microfabrication of waveguides inside silica glass by femtosecond laser direct writing. Applied Physics A, 2006. 84(3): p. 257-260.
187. Maselli, V., et al., Femtosecond laser written optofluidic sensor: Bragg grating waveguide evanescent probing of microfluidic channel. Optics Express, 2009. 17(14): p. 11719-11729.
188. Zhou, K., et al., A refractometer based on a micro-slot in a fiber Bragg grating formed by chemically assisted femtosecond laser processing. Optics Express, 2007. 15(24): p. 15848-15853.
189. Liu, X. and W. Tan, A Fiber-Optic Evanescent Wave DNA Biosensor Based on Novel Molecular Beacons. Analytical Chemistry, 1999. 71(22): p. 5054-5059.
190. Stewart, G., F.A. Muhammad, and B. Culshaw, Sensitivity improvement for evanescent-wave gas sensors. Sensors and Actuators B: Chemical, 1993. 11(1): p. 521-524.
191. Chryssis, A.N., et al., High sensitivity evanescent field fiber Bragg grating sensor. IEEE Photonics Technology Letters, 2005. 17(6): p. 1253-1255.
192. Bures, J. and R. Ghosh, Power density of the evanescent field in the vicinity of a tapered fiber. Journal of the Optical Society of America A, 1999. 16(8): p. 1992-1996.
193. Chong, J.H., et al., Measurements of refractive index sensitivity using long-period grating refractometer. Optics Communications, 2004. 229(1-6): p. 65-69.
194. Banerjee, A., et al., Fiber optic sensing of liquid refractive index. Sensors and Actuators B: Chemical, 2007. 123(1): p. 594-605.
195. Bass, M., et al., Handbook of Optics, Third Edition Volume I: Geometrical and Physical Optics, Polarized Light, Components and Instruments(set). 2010: McGraw-Hill, Inc. 1248.
196. Grobnic, D., et al., Bragg grating evanescent field sensor made in biconical tapered fiber with femtosecond IR radiation. IEEE Photonics Technology Letters, 2006. 18(1): p. 160-162.

214
197. Bérubé, J.P., et al. Direct inscription of waveguides in bulk glass for the photoexcitation of on-surface nanoparticles. in 2017 Conference on Lasers and Electro-Optics (CLEO). 2017.
198. Çirkinoğlu, H.O., et al., Silicon microsphere whispering gallery modes excited by femtosecond-laser-inscribed glass waveguides. Applied Optics, 2018. 57(14): p. 3687-3692.
199. Tong, L. and M. Sumetsky, Subwavelength and Nanometer Diameter Optical Fibers, in Subwavelength and Nanometer Diameter Optical Fibers. 2010, Springer Berlin Heidelberg: Berlin, Heidelberg. p. 1-14.
200. Agnarsson, B., et al., Evanescent-wave fluorescence microscopy using symmetric planar waveguides. Optics Express, 2009. 17(7): p. 5075-5082.
201. Barty, A., et al., Quantitative optical phase microscopy. Optics Letters, 1998. 23(11): p. 817-819.
202. Cheben, P., et al., Comparative study of quantitative phase imaging techniques for refractometry of optical fibers. 2018: p. 39.
203. Papon, G., NANOSTRUCTURATION DES PROPRIÉTÉS OPTIQUES LINÉAIRES ET NON-LINÉAIRES D’UN VERRE PHOTOSENSIBLE PAR LASER FEMTOSECONDE. 2012, Université de Bordeaux.
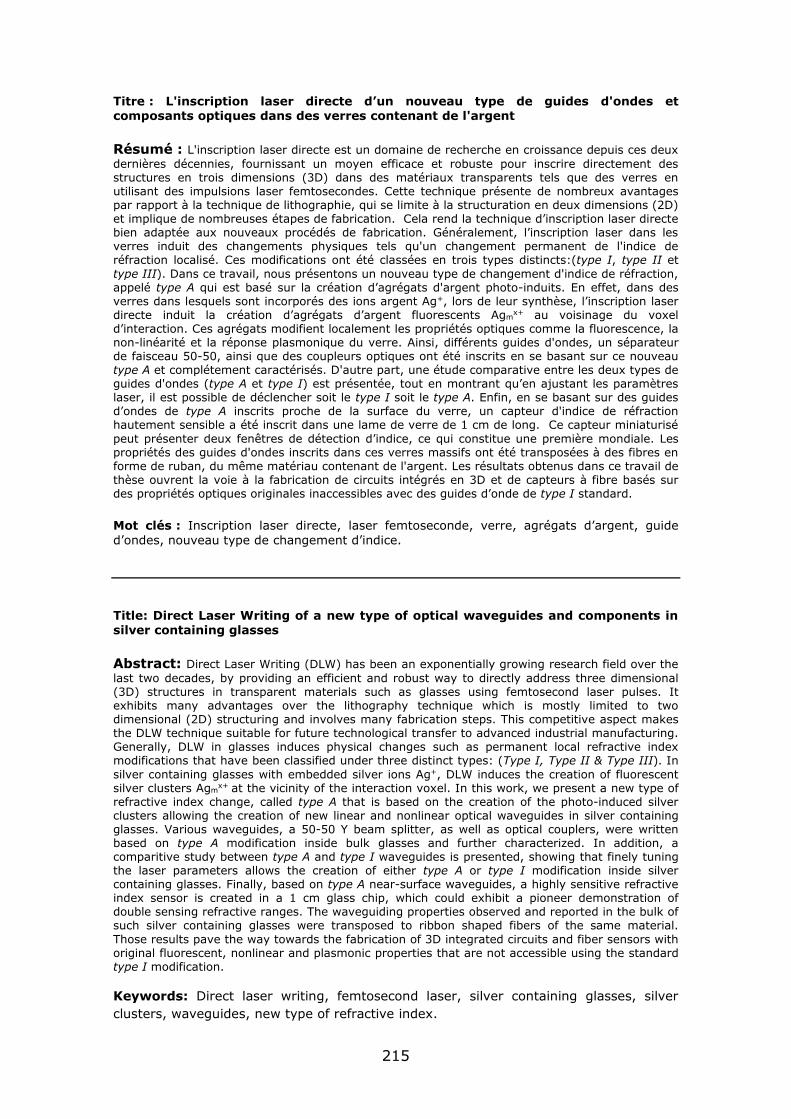
215
Titre : L'inscription laser directe d’un nouveau type de guides d'ondes et composants optiques dans des verres contenant de l'argent Résumé : L'inscription laser directe est un domaine de recherche en croissance depuis ces deux
dernières décennies, fournissant un moyen efficace et robuste pour inscrire directement des structures en trois dimensions (3D) dans des matériaux transparents tels que des verres en utilisant des impulsions laser femtosecondes. Cette technique présente de nombreux avantages par rapport à la technique de lithographie, qui se limite à la structuration en deux dimensions (2D) et implique de nombreuses étapes de fabrication. Cela rend la technique d’inscription laser directe bien adaptée aux nouveaux procédés de fabrication. Généralement, l’inscription laser dans les verres induit des changements physiques tels qu'un changement permanent de l'indice de réfraction localisé. Ces modifications ont été classées en trois types distincts:(type I, type II et
type III). Dans ce travail, nous présentons un nouveau type de changement d'indice de réfraction, appelé type A qui est basé sur la création d’agrégats d'argent photo-induits. En effet, dans des verres dans lesquels sont incorporés des ions argent Ag+, lors de leur synthèse, l’inscription laser directe induit la création d’agrégats d’argent fluorescents Agm
x+ au voisinage du voxel d’interaction. Ces agrégats modifient localement les propriétés optiques comme la fluorescence, la non-linéarité et la réponse plasmonique du verre. Ainsi, différents guides d'ondes, un séparateur de faisceau 50-50, ainsi que des coupleurs optiques ont été inscrits en se basant sur ce nouveau type A et complétement caractérisés. D'autre part, une étude comparative entre les deux types de guides d'ondes (type A et type I) est présentée, tout en montrant qu’en ajustant les paramètres laser, il est possible de déclencher soit le type I soit le type A. Enfin, en se basant sur des guides d’ondes de type A inscrits proche de la surface du verre, un capteur d'indice de réfraction hautement sensible a été inscrit dans une lame de verre de 1 cm de long. Ce capteur miniaturisé
peut présenter deux fenêtres de détection d’indice, ce qui constitue une première mondiale. Les propriétés des guides d'ondes inscrits dans ces verres massifs ont été transposées à des fibres en forme de ruban, du même matériau contenant de l'argent. Les résultats obtenus dans ce travail de thèse ouvrent la voie à la fabrication de circuits intégrés en 3D et de capteurs à fibre basés sur des propriétés optiques originales inaccessibles avec des guides d’onde de type I standard. Mot clés : Inscription laser directe, laser femtoseconde, verre, agrégats d’argent, guide
d’ondes, nouveau type de changement d’indice.
Title: Direct Laser Writing of a new type of optical waveguides and components in silver containing glasses
Abstract: Direct Laser Writing (DLW) has been an exponentially growing research field over the
last two decades, by providing an efficient and robust way to directly address three dimensional (3D) structures in transparent materials such as glasses using femtosecond laser pulses. It exhibits many advantages over the lithography technique which is mostly limited to two dimensional (2D) structuring and involves many fabrication steps. This competitive aspect makes the DLW technique suitable for future technological transfer to advanced industrial manufacturing. Generally, DLW in glasses induces physical changes such as permanent local refractive index modifications that have been classified under three distinct types: (Type I, Type II & Type III). In
silver containing glasses with embedded silver ions Ag+, DLW induces the creation of fluorescent silver clusters Agm
x+ at the vicinity of the interaction voxel. In this work, we present a new type of refractive index change, called type A that is based on the creation of the photo-induced silver clusters allowing the creation of new linear and nonlinear optical waveguides in silver containing glasses. Various waveguides, a 50-50 Y beam splitter, as well as optical couplers, were written based on type A modification inside bulk glasses and further characterized. In addition, a comparitive study between type A and type I waveguides is presented, showing that finely tuning the laser parameters allows the creation of either type A or type I modification inside silver containing glasses. Finally, based on type A near-surface waveguides, a highly sensitive refractive index sensor is created in a 1 cm glass chip, which could exhibit a pioneer demonstration of double sensing refractive ranges. The waveguiding properties observed and reported in the bulk of such silver containing glasses were transposed to ribbon shaped fibers of the same material.
Those results pave the way towards the fabrication of 3D integrated circuits and fiber sensors with original fluorescent, nonlinear and plasmonic properties that are not accessible using the standard type I modification.
Keywords: Direct laser writing, femtosecond laser, silver containing glasses, silver
clusters, waveguides, new type of refractive index.