Only Slight Impact of Predicted Replicative Capacity for Therapy Response Prediction
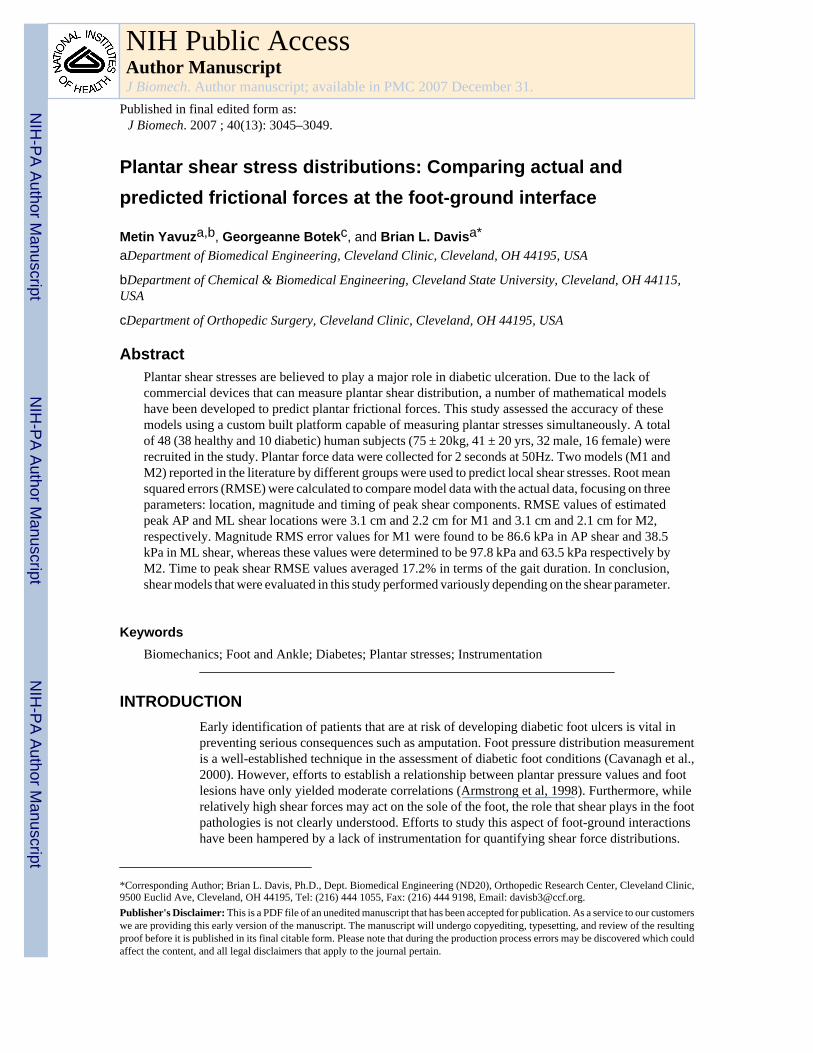
Plantar shear stress distributions: Comparing actual andpredicted frictional forces at the foot-ground interface
Metin Yavuza,b, Georgeanne Botekc, and Brian L. Davisa*
aDepartment of Biomedical Engineering, Cleveland Clinic, Cleveland, OH 44195, USA
bDepartment of Chemical & Biomedical Engineering, Cleveland State University, Cleveland, OH 44115,USA
cDepartment of Orthopedic Surgery, Cleveland Clinic, Cleveland, OH 44195, USA
AbstractPlantar shear stresses are believed to play a major role in diabetic ulceration. Due to the lack ofcommercial devices that can measure plantar shear distribution, a number of mathematical modelshave been developed to predict plantar frictional forces. This study assessed the accuracy of thesemodels using a custom built platform capable of measuring plantar stresses simultaneously. A totalof 48 (38 healthy and 10 diabetic) human subjects (75 ± 20kg, 41 ± 20 yrs, 32 male, 16 female) wererecruited in the study. Plantar force data were collected for 2 seconds at 50Hz. Two models (M1 andM2) reported in the literature by different groups were used to predict local shear stresses. Root meansquared errors (RMSE) were calculated to compare model data with the actual data, focusing on threeparameters: location, magnitude and timing of peak shear components. RMSE values of estimatedpeak AP and ML shear locations were 3.1 cm and 2.2 cm for M1 and 3.1 cm and 2.1 cm for M2,respectively. Magnitude RMS error values for M1 were found to be 86.6 kPa in AP shear and 38.5kPa in ML shear, whereas these values were determined to be 97.8 kPa and 63.5 kPa respectively byM2. Time to peak shear RMSE values averaged 17.2% in terms of the gait duration. In conclusion,shear models that were evaluated in this study performed variously depending on the shear parameter.
KeywordsBiomechanics; Foot and Ankle; Diabetes; Plantar stresses; Instrumentation
INTRODUCTIONEarly identification of patients that are at risk of developing diabetic foot ulcers is vital inpreventing serious consequences such as amputation. Foot pressure distribution measurementis a well-established technique in the assessment of diabetic foot conditions (Cavanagh et al.,2000). However, efforts to establish a relationship between plantar pressure values and footlesions have only yielded moderate correlations (Armstrong et al, 1998). Furthermore, whilerelatively high shear forces may act on the sole of the foot, the role that shear plays in the footpathologies is not clearly understood. Efforts to study this aspect of foot-ground interactionshave been hampered by a lack of instrumentation for quantifying shear force distributions.
*Corresponding Author; Brian L. Davis, Ph.D., Dept. Biomedical Engineering (ND20), Orthopedic Research Center, Cleveland Clinic,9500 Euclid Ave, Cleveland, OH 44195, Tel: (216) 444 1055, Fax: (216) 444 9198, Email: [email protected]'s Disclaimer: This is a PDF file of an unedited manuscript that has been accepted for publication. As a service to our customerswe are providing this early version of the manuscript. The manuscript will undergo copyediting, typesetting, and review of the resultingproof before it is published in its final citable form. Please note that during the production process errors may be discovered which couldaffect the content, and all legal disclaimers that apply to the journal pertain.
NIH Public AccessAuthor ManuscriptJ Biomech. Author manuscript; available in PMC 2007 December 31.
Published in final edited form as:J Biomech. 2007 ; 40(13): 3045–3049.
NIH
-PA Author Manuscript
NIH
-PA Author Manuscript
NIH
-PA Author Manuscript
Frictional shear forces have been observed to reduce both the amount of pressure and the timerequired to develop a decubitus ulcer in test animals (Dinsdale, 1974). Among researchers whohave investigated plantar shear distribution under the foot, Pollard and Le Quesne (1983)observed neuropathic ulceration at the sites of maximal shear. Unfortunately theinstrumentation developed to measure plantar shear were limited in terms of (i) being capableof recording only uniaxial shear (i.e. antero-posterior), (ii) suffering low spatial resolution(Davis et al., 1998) or (iii) not being practical (Tappin et al, 1980; Akhlaghi and Pepper,1996; Lord and Hosein, 2000) due to calibration difficulties and cross-talk between shear andpressure channels.
A number of investigators have established 2D models to predict shear under the foot. A decadeago Abuzzahab et al. (1997) attempted to estimate shear distribution, based on local pressuredata and global ground reaction forces. Their aim was to create a kinetic model of the foot andthe ankle where they distributed shear loads to each segment of the foot based on the arithmeticcontribution of the local vertical forces to the global normal force (Model 1). Giacomozzi andMacellari (1997) took a similar approach but also incorporated the free moment (Model 2) intotheir calculations (Giacomozzi and Macellari, 1997).
None of these models, however, have been validated. Our aim in this study was to compareplantar shear stress data collected with a custom-built device (Davis et al., 1998), with thepredicted results of Models 1 and 2.
METHODSA total of 48 volunteers were recruited for the study among which 10 were diagnosed withdiabetic neuropathy. Exclusion criteria included, (i) gross foot deformities (minor clawing ofthe toes was permissible), (ii) prior foot surgeries and (iii) foot pain. Table 1 displays thecharacteristics of the subjects. The study was explained to the volunteers before theirparticipation and they signed an informed consent form.
The custom built system consists of 80 transducers arranged in an 8×10 array, each with asurface area measuring 1.27×1.27 cm. The device was set flush with the ground to create aplatform measuring 11.4×14.2 cm with 1.5 mm space in between each sensor. Although theoverall size of the device was not large enough to permit force measurements under the entireplantar surface, it was large enough to examine the forefoot area. This region is of primaryinterest since diabetic ulcers mostly occur in the forefoot area (Oyibo et al., 2000; Caselli etal., 2002). The platform enabled data collection at 50Hz, for periods up to 3 seconds. Themeasuring device utilized strain gauge technology (Davis et al., 1998). The data recorded bythe platform had an average error percentage of 1.0%, 4.6% and 5.0% respectively for pressure,antero-posterior and medio-lateral shear channels.
The 2-step method was preferred in data acquisition (McPoil et al., 1999). The tests were carriedout for only one foot (left or right), 3 trials for each subject.
A normal force value of 5 N was used as a threshold to determine the “active” sensors. Globalnormal (FN), antero-posterior (FAP) and medio-lateral (FML) shear forces were calculated bysumming up the normal (N), antero-posterior (AP) and medio-lateral (ML) forces measuredby each active transducer. A proportionality ratio (k) was found for active sensors by dividingthe measured local N force to FN. To calculate local shear forces according to the Model 1(Abuzzahab et al., 1997) the following equations were used;
Model 1:f AP i = kiFAP i = 1, 2 ‥ ‥ 80 (1)
Yavuz et al. Page 2
J Biomech. Author manuscript; available in PMC 2007 December 31.
NIH
-PA Author Manuscript
NIH
-PA Author Manuscript
NIH
-PA Author Manuscript
fML i = kiFML i = 1, 2 ‥ ‥ 80 (2)
Model 2 including the free moment (Giacomozzi and Macellari, 1997):f APi = kiFAP − ∣ fMi ∣ sinαix i = 1, 2 ‥ ‥ 80 (3)
fMLi = kiFML + ∣ fMi ∣ cosαiy i = 1, 2 ‥ ‥ 80 (4)
fMi is the local shear force on a unit area generated by the free moment that acts about thecenter of pressure (COP) of the forefoot, x and y are unit vectors of the x and y axes,respectively. α denotes the angle between the vector that connects the COP and the particularsensor and x axis.
Three characteristic parameters were extracted from the experimental, Model 1 (M1) andModel 2 (M2) datasets: peak shear magnitudes, location and time to peak shear forces. Peakforce magnitudes, regardless of direction, were picked throughout the whole gait data. Forceto stress conversion was performed by dividing the measured force by sensor surface area.Positive (+) values of antero-posterior shear stresses refer to stresses on the skin pointingtowards anterior direction whereas negative (−) values posterior direction. Similarly stressestowards lateral and medial directions were denoted by (+) and (−) signs respectively.
The x and y coordinates for the locations of the peak shear stresses were determined for eachdataset. For each trial actual gait duration was identified. The time when the peak shear stressoccurred according to the three datasets were recorded as a percentage of the actual gait time.Statistical analysis included root mean squared error (RMSE) values. Location errors werepresented by calculating the Euclidian distances between the actual peak shear sites and theestimated ones.
ResultsRMSE values of the estimated shear stress parameters are given in Table 2. Both models wereable to predict the locations of peak ML shear component to within 2.2 cm. However the errorvalues increased up to 3.1 cm in AP shear case. Actual and estimated peak AP and ML stressprofiles of a representative subject are given in Figure 1 and Figure 2. In the given specificcase peak actual AP shear occurred under the second toe; however estimated sites by bothmodels were distant from the actual location (Figure 1). On the other hand both modelsdetermined the location of peak ML stress correctly (Figure 2). In general, actual peak AP andML shear stresses took place 2.7 cm apart whereas the distance between peak AP and ML shearsites was 0.5 cm and 0.9 cm, respectively for M1 and M2.
Actual peak AP and ML shear stresses yielded mean absolute magnitudes of 76.1 kPa and 50.9kPa, respectively. Predicted peak AP shear stress magnitudes had RMSE values as high as 97.8kPa. RMSE values decreased quantitively in the ML shear case however error to actual ratiowas still high in M2 prediction. The most accurate magnitude estimation was in the M1 MLshear case with a 76% RMSE to actual ratio.
RMSE results by both models ranged between 14.9% and 18.6% for the time to peak shearparameter.
DiscussionThe models developed to predict plantar shear distribution have not been validated before. Thisstudy has revealed that the performance of both models varied according to the shear parameter.Time to peak shear was predicted by an average of 17%, considering all four situations.Location errors might not be considered significant if one assumes the average length of the
Yavuz et al. Page 3
J Biomech. Author manuscript; available in PMC 2007 December 31.
NIH
-PA Author Manuscript
NIH
-PA Author Manuscript
NIH
-PA Author Manuscript
human foot is 25 cm (≈10 inches). However in clinical applications that require sensitive peakshear coordinates both M1 and M2 might be questioned. With about 100% error levels peakshear magnitude determination was the field where the models were the least successful.
M1 was observed to perform better than M2 in magnitude estimation. Their results were almostidentical in finding peak shear locations. Time to peak shear was the only category where M2won against M1.
The authors believe the reason that the models could not achieve their mission with shearmagnitudes is mainly due to the lack of the linear relationship between pressure and shearstresses that was assumed. Plantar shear magnitudes probably are influenced by localdifferences in frictional properties and/or intrinsic muscle activities.
The kinetic coefficient of friction (COF) is given by the ratio of shear to normal force at a giventime. The product of the kinetic COF and local normal forces in fact reveals the sliding frictionforce. Having the local shear forces calculated by this approach, M1 practically assumes thatthe whole plantar surface is sliding against the supporting media during the gait cycle. Howeverour experience and results did not confirm this sliding foot assumption.
This study had limitations related to the spatial resolution and overall size of the device. Thethreshold value used to determine active sensors eliminated some of the partial sensor contactcases. Data processing proceeded assuming full contact in the remaining situations. Onlywalking was assessed, and this was restricted to barefoot locomotion. Considering the relativelysmall size of the device and the elderly subjects, visually aiming for the platform was allowed.The decision was based on the report by Grabiner et al. (1995), which has shown that targetingof a force plate did not produce different ground reaction force data.
In summary, to our knowledge this is the first study that has attempted to validate previouslydeveloped plantar shear distribution models. Our results indicate that distribution of plantarshear should be measured, particularly if one is interested in the magnitudes of shearcomponents.
Acknowledgements
This research was possible due to support from National Institutes of Health (Grant # 2R44DK061164). The authorswould like to thank Gordon Hirschman and Lynn Bardsley of Infoscitex, Inc for their kind input during the course ofthis study.
ReferencesAbuzzahab FS, Harris GF, Kidder SM. A kinetic model of the foot and ankle. Gait and Posture 1997;5
(2):148.Akhlaghi F, Pepper MG. In-shoe biaxial shear force measurement: the Kent shear system. Medical and
Biological Engineering and Computing 1996;34(4):315–317. [PubMed: 8935501]Armstrong DG, Peters EJ, Athanasiou KA, Lavery LA. Is there a critical level of plantar foot pressure
to identify patients at risk for neuropathic foot ulceration? Journal of Foot and Ankle Surgery 1998;37(4):303–307. [PubMed: 9710782]
Brand, PW. Symposium on the Neurological Aspects of Plastic Surgery. Vol 17. St Louis: 1978.Pathomechanics of pressure ulceration.
Caselli A, Pham H, Giurini JM, Armstrong DG, Veves A. The forefoot-to-rearfoot plantar pressure ratiois increased in severe diabetic neuropathy and can predict foot ulceration. Diabetes Care 2002;25(6):1066–1071. [PubMed: 12032116]
Cavanagh PR, Ulbrecht JS, Caputo GM. New developments in the biomechanics of the diabetic foot.Diabetes/Metabolism Research and Reviews 2000;16:S6–S10. [PubMed: 11054880]
Yavuz et al. Page 4
J Biomech. Author manuscript; available in PMC 2007 December 31.
NIH
-PA Author Manuscript
NIH
-PA Author Manuscript
NIH
-PA Author Manuscript
Davis BL, Perry JE, Neth DC, Waters KC. A device for the simultaneous measurement of pressure andshear forces on the plantar surface of the foot. Journal of Applied Biomechanics 1998;14:93–104.
Dinsdale SM. Decubitus ulcers: role of pressure and friction in causation. Archives of Physical Medicineand Rehabilitation 1974;55(4):147–152. [PubMed: 4595834]
Giacomozzi C, Macellari V. Piezo-dynamometric platform for a more complete analysis of foot-to-floorinteraction. IEEE Transactions on Rehabilitation Engineering 1997;5(4):322–330. [PubMed:9422457]
Grabiner MD, Feuerbach JW, Lundin TM, Davis BL. Visual guidance to force plates does not influenceground reaction force variability. Journal of Biomechanics 1995;28(9):1115–1117. [PubMed:7559681]
Lord M, Hosein R. A study of in-shoe plantar shear in patients with diabetic neuropathy. ClinicalBiomechanics (Bristol, Avon) 2000;15(4):278–283.
McPoil TG, Cornwall MW, Dupuis L, Cornwell M. Variability of plantar pressure data. A comparisonof the two-step and midgait methods. Journal of the American Podiatric Medicine Association1999;89(10):495–501.
Oyibo SO, Jude EB, Tarawneh I, Nguyen HC, Armstrong DG, Harkless LB, Boulton AJ. The effects ofulcer size and site, patient's age, sex and type and duration of diabetes on the outcome of diabeticfoot ulcers. Diabetic Medicine 2001;18(2):133–138. [PubMed: 11251677]
Pollard JP, Le Quesne LP. Method of healing diabetic forefoot ulcers. British Medical Journal (ClinicalResearch Ed.) 1983;286(6363):436–437. [PubMed: 6401552]
Tappin JW, Pollard JP, Beckett EA. Method of measuring shearing forces on the sole of the foot. ClinicalPhysics and Physiological Measurement 1980;1:83–85.
Yavuz et al. Page 5
J Biomech. Author manuscript; available in PMC 2007 December 31.
NIH
-PA Author Manuscript
NIH
-PA Author Manuscript
NIH
-PA Author Manuscript
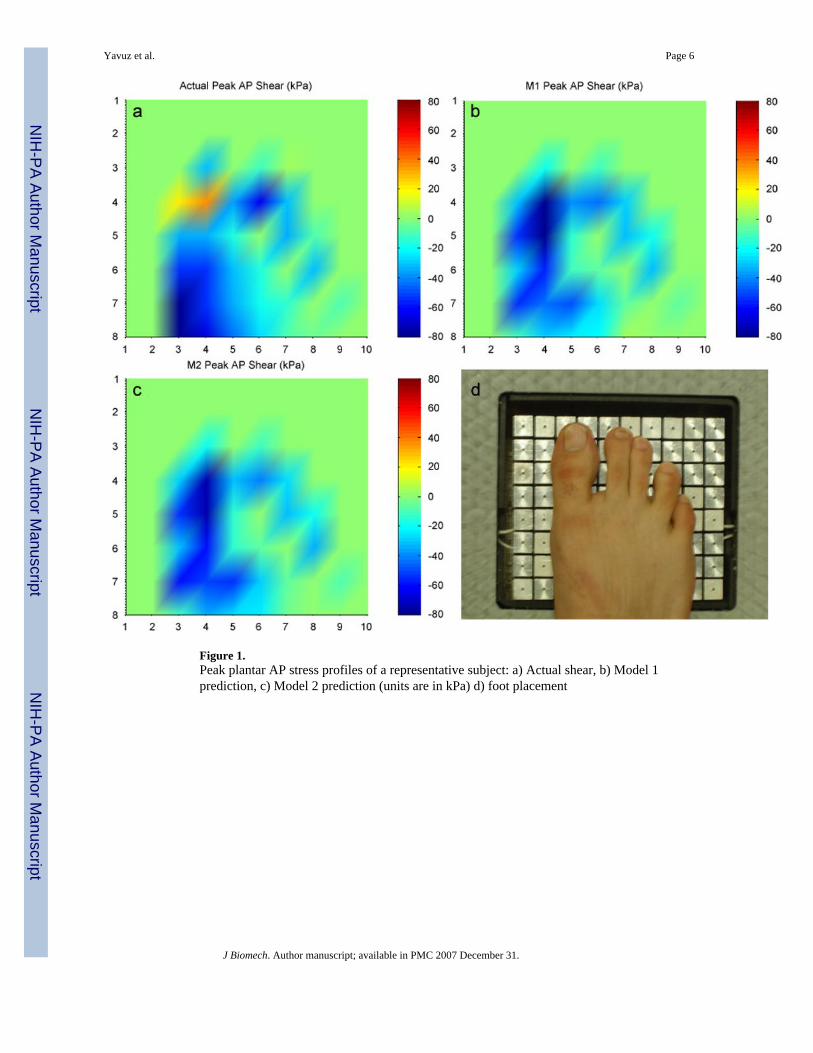
Figure 1.Peak plantar AP stress profiles of a representative subject: a) Actual shear, b) Model 1prediction, c) Model 2 prediction (units are in kPa) d) foot placement
Yavuz et al. Page 6
J Biomech. Author manuscript; available in PMC 2007 December 31.
NIH
-PA Author Manuscript
NIH
-PA Author Manuscript
NIH
-PA Author Manuscript
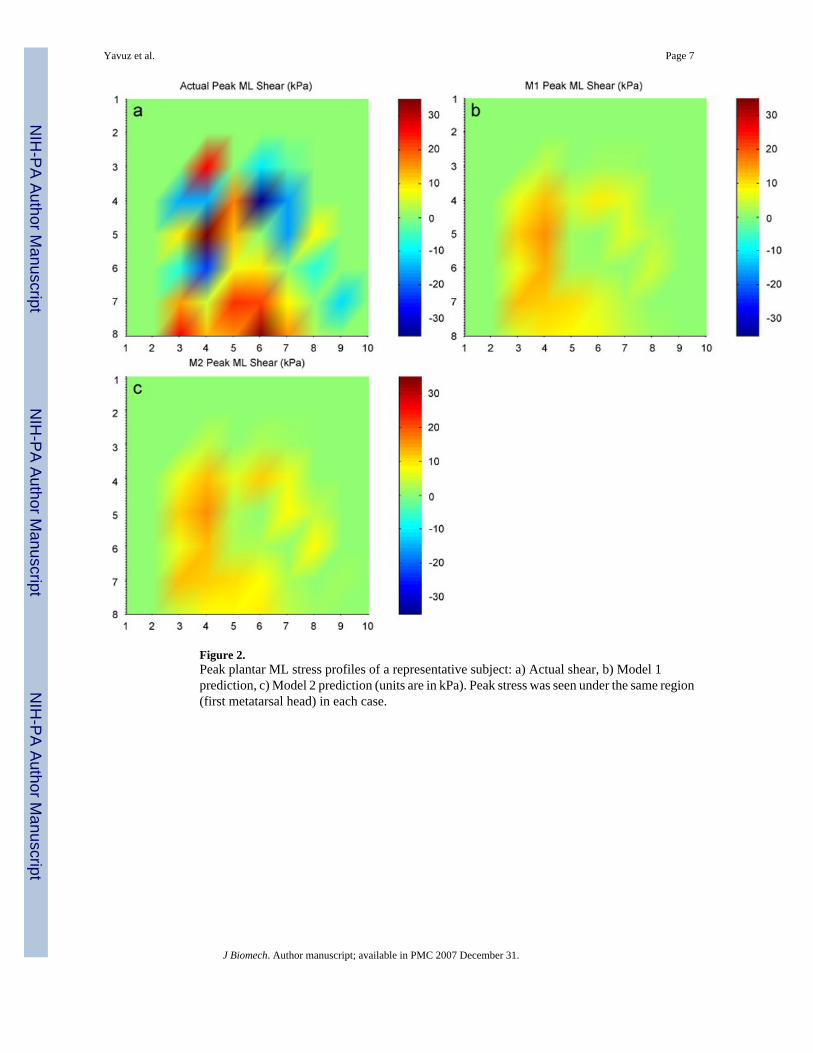
Figure 2.Peak plantar ML stress profiles of a representative subject: a) Actual shear, b) Model 1prediction, c) Model 2 prediction (units are in kPa). Peak stress was seen under the same region(first metatarsal head) in each case.
Yavuz et al. Page 7
J Biomech. Author manuscript; available in PMC 2007 December 31.
NIH
-PA Author Manuscript
NIH
-PA Author Manuscript
NIH
-PA Author Manuscript

NIH
-PA Author Manuscript
NIH
-PA Author Manuscript
NIH
-PA Author Manuscript
Yavuz et al. Page 8
Table 1Characteristics of the subjects
No of subjects 48 (16 female, 32 male, 10 diabetic neuropathic, 38 healthy)Age (years) 41 ± 20 (13–83)Weight (kg) 75 ± 20 (41–140)Values are presented as the mean ± standard deviation, with the range in parentheses.
J Biomech. Author manuscript; available in PMC 2007 December 31.

NIH
-PA Author Manuscript
NIH
-PA Author Manuscript
NIH
-PA Author Manuscript
Yavuz et al. Page 9
Table 2Comparison of peak actual and predicted shear stress parameters
M1 AP M2 AP M1 ML M2 MLMagnitude RMSE (kPa) 86.6 97.8 38.5 63.5Peak stress location RMSE (cm) 3.1 3.1 2.1 2.2Time to peak shear RMSE (% gait) 18.0 17.4 18.6 14.9
J Biomech. Author manuscript; available in PMC 2007 December 31.
Copyright © 2022 FDOKUMEN