Plant and animal endemism in the eastern Andean slope: Challenges to conservation
19
Plant and animal endemism in the eastern Andean slope: challenges to conservation Swenson et al. Swenson et al. BMC Ecology 2012, 12:1 http://www.biomedcentral.com/1472-6785/12/1 (27 January 2012)
-
Upload
independent -
Category
Documents
-
view
0 -
download
0
Transcript of Plant and animal endemism in the eastern Andean slope: Challenges to conservation

Plant and animal endemism in the easternAndean slope: challenges to conservationSwenson et al.
Swenson et al. BMC Ecology 2012, 12:1http://www.biomedcentral.com/1472-6785/12/1 (27 January 2012)

RESEARCH ARTICLE Open Access
Plant and animal endemism in the easternAndean slope: challenges to conservationJennifer J Swenson10,1*, Bruce E Young1, Stephan Beck2, Pat Comer1, Jesús H Córdova3, Jessica Dyson1,11,Dirk Embert4, Filomeno Encarnación5, Wanderley Ferreira6, Irma Franke3, Dennis Grossman1,12, Pilar Hernandez1,13,Sebastian K Herzog7, Carmen Josse1, Gonzalo Navarro6, Víctor Pacheco3, Bruce A Stein1,14, Martín Timaná1,15,Antonio Tovar8, Carolina Tovar8, Julieta Vargas9 and Carlos M Zambrana-Torrelio2,16
Abstract
Background: The Andes-Amazon basin of Peru and Bolivia is one of the most data-poor, biologically rich, andrapidly changing areas of the world. Conservation scientists agree that this area hosts extremely high endemism,perhaps the highest in the world, yet we know little about the geographic distributions of these species andecosystems within country boundaries. To address this need, we have developed conservation data on endemicbiodiversity (~800 species of birds, mammals, amphibians, and plants) and terrestrial ecological systems (~90;groups of vegetation communities resulting from the action of ecological processes, substrates, and/orenvironmental gradients) with which we conduct a fine scale conservation prioritization across the Amazonwatershed of Peru and Bolivia. We modelled the geographic distributions of 435 endemic plants and all 347endemic vertebrate species, from existing museum and herbaria specimens at a regional conservation practitioner’sscale (1:250,000-1:1,000,000), based on the best available tools and geographic data. We mapped ecologicalsystems, endemic species concentrations, and irreplaceable areas with respect to national level protected areas.
Results: We found that sizes of endemic species distributions ranged widely (< 20 km2 to > 200,000 km2) acrossthe study area. Bird and mammal endemic species richness was greatest within a narrow 2500-3000 m elevationband along the length of the Andes Mountains. Endemic amphibian richness was highest at 1000-1500 melevation and concentrated in the southern half of the study area. Geographical distribution of plant endemismwas highly taxon-dependent. Irreplaceable areas, defined as locations with the highest number of species withnarrow ranges, overlapped slightly with areas of high endemism, yet generally exhibited unique patterns across thestudy area by species group. We found that many endemic species and ecological systems are lacking national-level protection; a third of endemic species have distributions completely outside of national protected areas.Protected areas cover only 20% of areas of high endemism and 20% of irreplaceable areas. Almost 40% of the 91ecological systems are in serious need of protection (= < 2% of their ranges protected).
Conclusions: We identify for the first time, areas of high endemic species concentrations and high irreplaceabilitythat have only been roughly indicated in the past at the continental scale. We conclude that new complementaryprotected areas are needed to safeguard these endemics and ecosystems. An expansion in protected areas will bechallenged by geographically isolated micro-endemics, varied endemic patterns among taxa, increasingdeforestation, resource extraction, and changes in climate. Relying on pre-existing collections, publically accessibledatasets and tools, this working framework is exportable to other regions plagued by incomplete conservationdata.
Keywords: Andes-Amazon, conservation planning, ecological systems, endemic species richness, irreplaceability,Latin America
* Correspondence: [email protected] School of the Environment, Duke University, Box 90328, Durham,NC 27708, USAFull list of author information is available at the end of the article
Swenson et al. BMC Ecology 2012, 12:1http://www.biomedcentral.com/1472-6785/12/1
© 2012 Swenson et al; licensee BioMed Central Ltd. This is an Open Access article distributed under the terms of the CreativeCommons Attribution License (http://creativecommons.org/licenses/by/2.0), which permits unrestricted use, distribution, andreproduction in any medium, provided the original work is properly cited.

BackgroundNumerous global conservation prioritization schemeshave been developed that are centered on biodiversity,endemism and vulnerability (e.g. [1-5]). Characterizingglobal areas of high biodiversity under threat as “hot-spots” [1] or “priority ecoregions” [6], for example, hasidentified priorities using a variety of weighting schemes(e.g. [3,4]). However, the information that underliesthese prioritizations in the best cases can consist ofcoarse scale species range maps, typically hand-drawnby knowledgeable researchers from available localitydata [7-10]. In less than ideal cases, lists of known spe-cies by large areal units such as ecoregions are used[11]. Although the range maps are convenient accompa-niments for species accounts in field guides, they aretoo coarse for landscape-level conservation planning(Figure 1). There are often errors in the locality infor-mation that is used to generalize range maps, and theytypically overestimate areas of occupancy because of thecoarse scale at which they are drawn [12,13]Global prioritization areas themselves are typically too
large to protect in their entirety (e.g. the Andean ‘hot-spot’ sensu [1], covers an area over four times the sizeof Germany and crosses over seven Andean countries),and are not practical nor intended for use in national ordepartmental planning. For many data-poor countrieshowever, global datasets such as these are the only con-sistent estimates of biodiversity that are available. Effec-tive on-the-ground conservation efforts and decisionsrequire planning and biodiversity information at a muchfiner scale [14].Endemic species are restricted to a particular geo-
graphic area-occurring nowhere else-and are important
components in most global conservation prioritizations.A focus on endemic species richness can provide uniqueinformation about biodiversity patterns [3,15] comparedto all-encompassing species richness that is dominatedby generalist (non-endemic) species [4], which are typi-cally the lowest priority for conservation. Areas high inendemism are especially valuable because they mayrepresent areas of high past speciation in evolutionaryhotspots [16]. The forces that create areas of high spe-cies endemism and richness are still not well under-stood, which is one argument for their preservation forfurther study [17]. Another reason for preservation isthat these areas may function as species refugia duringfuture climate changes, as they may have in the past.Globally, areas of high endemism are currently underre-presented by the protected area network [2].The Andes region of South America harbours one of
the largest assemblages of endemic plant and animalspecies and is one of the most biodiverse and threatenedareas of the world [1-5]. Explanations for such a con-centration of endemics include past climate shifts, geo-tectonic events, modern ecological interactions, andlimited dispersal. This area was historically isolated fromthe lowlands by the Andean uplift, which created a com-plex mosaic of high mountains and deep inter-Andeanvalleys. Researchers generally agree that this ancientuplift and isolation were important drivers in speciation,resulting in high concentrations of endemic birds[18-22], mammals [23], and plants [24-27]. Analyses ofAndean amphibians are limited but indicate similar dri-vers of environmental divergence [28-30] and coloniza-tion from different regions [31]. Recent climatic stabilityinfluenced by topography has created ideal conditions
Figure 1 Comparison of hand drawn vs. modelled species distribution map. Hand-drawn range map (a) used in many continental studieswith (b), a modeled species distribution for Cycanolyca viridicyanus in southwestern Peru (Vilcabamba). National protected areas (white), anddepartment boundaries (black lines) and elevation as backdrop.
Swenson et al. BMC Ecology 2012, 12:1http://www.biomedcentral.com/1472-6785/12/1
Page 2 of 18

for high biodiversity (very humid areas) and endemism(dissected topography creating isolated dry valleys) [32].Despite the agreement among scientists about the ori-
gins and existence of the extremely high endemic diver-sity of this region, it remains scientifically understudied[33]. We have very limited knowledge of current patternsof Andean species distributions and diversity within thisglobally prioritized area [14]. National-level efforts toprioritize conservation in Peru and Bolivia have pre-viously explored gaps in protected area coverage, buthave been hindered by the limited information availableon species status and distribution [34,35]. The informa-tion available is primarily of bird diversity patterns ratherthan other taxon groups [36-40]. Yet even the mostrecent endemism studies of birds were delimited by a 1/4° grid (~28 × 28 km) as the unit of analysis [36,37]. Stu-dies of the spatial pattern of Andean endemic mammalrichness are lacking, possibly due to unstable taxonomyand incomplete knowledge about distributions [41]. Aworldwide distributional analysis at a coarse scale with a1° grid (~111 × 111-km) showed a relative concentrationof endemic mammal species along the east side of theAndes in Peru and northern Bolivia [5]. As well, a regio-nal study in Peru corroborated this pattern [42]. We areunaware of spatially explicit analyses of amphibian ende-mic patterns, although several authors have suggestedthat higher concentrations of endemics should be foundin montane regions [43-45]. Knowledge of endemicplants in this region varies widely by taxonomic group.Analyses of a few better-known groups suggest peaks ofdiversity and endemism in the eastern Andes [17,46-49].Vegetation and land cover maps of this region have vari-able coarse spatial and classification detail; differentregions employ distinct classification schemes and meth-ods that make joining maps along borders difficult.The development of computer-aided models to predict
species distributions presents an opportunity to developdistribution information at the scale necessary for in-coun-try conservation planning [50,51]. With the goal of produ-cing relatively fine resolution species and ecosystem datawithin a repeatable framework of methods, we createdgeographic distributions of endemic birds, mammals,amphibians, plants, and mapped their ecosystems on theeastern slope of the Andes in Peru and Bolivia at a scaleapplicable to conservation planning (1 km2 grid, less than< 1/60°, 1:250,000 - 1:1,000,000). This multiple taxonapproach enables a broader characterization of diversity,given that one taxonomic group or species is not alwaysrepresentative of other taxa [15,52,53]. By geographicallyintegrating this data, we identify areas of high endemicconcentrations and irreplaceable areas (greatest number ofnarrowly distributed endemics) across the study area [54].We characterize the ecological systems where endemicspecies reside and perform a gap analysis to identify
species ranges, endemic concentrations and ecological sys-tems currently located outside of established national-levelprotected areas. In addition to pinpointing candidate areasfor future protection efforts, the results highlight severalchallenges to conservation in the region.
MethodsIn addition to the following descriptions of endemic dis-tribution modelling, mapping of ecological systems andgeographical analysis of all the overlapping datasets, theSupporting Information Additional Files 1, 2, 3, 4, 5, 6,contain further method details.
Study AreaOur study focused on the Amazon basin of Peru andBolivia, from treeline in the eastern Andes (~3500 m),downslope to the Amazon lowlands and extending to theBrazilian border (Figure 2). The southern limit extends tothe edge of the southern subtropical uplands where thebiogeographic province of the chiquitanía begins. Thearea hosts a wide range of ecosystems from the wetlandsof the Beni savanna and the Iquitos várzea, to xeric habi-tats of inter-Andean valleys and humid montane forestsalong much of the eastern Andean slope. Many areas aredifficult to access because of lack of transportation infra-structure, entrance restrictions into indigenous lands andpatrolling of illegal crops [36]. The study area extendsfrom 5°23’ to 18° 15’ S latitude and from 60° 23’ to 79°26’ W longitude and covers 1,249,282 km2.
Endemic Species and Locality DataMore than a century of collecting in South America hasyielded large numbers of plant and animal specimensthat provide locality data for species geographic distribu-tion predictions. To represent a diverse suite of species,we modelled the geographic distributions of all bird,mammal, and amphibian species that are endemic toour study area [7-9] (Table 1). We identified which spe-cies were endemic based on pre-existing hand drawnrange maps [8,9,55] and consultation with regionalexperts. We also modelled distributions of endemicplants but limited our analysis to 15 representative focalgroups (families or genera) generally well known, andrelatively well sampled in both countries (details on cri-teria for inclusion can be found in Additional File 1):Acanthaceae, Anacardiaceae, Aquifoliaceae, Brunellia-ceae, Campanulaceae, Chrysobalanaceae, Cyatheaceae,Ericaceae, Inga (Fabaceae), Mimosa (Fabaceae), Loasa-ceae, Malpighiaceae, Marcgraviaceae, Fuchsia (Onagra-ceae), and Passiflora (Passifloraceae). As with thevertebrates, we modelled distributions for all species inthese groups that are endemic to the study area.For each of the 782 species of endemic plants and ani-
mals, we compiled locality records from an exhaustive
Swenson et al. BMC Ecology 2012, 12:1http://www.biomedcentral.com/1472-6785/12/1
Page 3 of 18

search of specimen records in 81 local and internationalnatural history collections and herbaria, publishedrecords, and for birds and mammals only, observationaldata. Specimen searches were carried out 2004-2006with Peruvian, Bolivian and international institutions,individuals, and from published sources (see AdditionalFile 5). The majority of specimens were collected in the1990’s and 2000’s, yet dates ranged wider for publishedsources that we validated with national gazetteers of col-lecting locations [56]. The oldest localities for example,were collected for mammal species in the early part ofthis century [57]. Because many specimen labels did notinclude global positioning system-based coordinates forthe collecting locations, we identified the most reliable
localities based on their described location and geo-referenced them using standardized methods [58], andadditional resources such as consultation with the col-lector, and geographic gazetteers (e.g.[56]). To furtherassure the creation of an accurate locality database, wethen asked taxonomic specialists familiar with the spe-cies and geography to review mapped localities toensure the creation of an accurate locality database. Webuffered the study area by 100 km for the endemic spe-cies data gathering and modelling to avoid edge effects.
Predictive Distribution ModellingWe used spatial environmental layers describing climate,topography, and vegetation within our study area at 1-
Figure 2 Study area. The Amazon basin of Peru and Bolivia with current protected areas. Protected areas information from INRENA-Peru, andFAN-Bolivia, elevation from Shuttle Radar Topography Mission.
Table 1 Summary of endemic species groups and modeled ranges
Speciesgroup
Numberspecies
Numbergenera
Totalnumberlocalities
Median numberrecords per species
No. data sourcescollaboratingInstitutions
Number Maxentmodels formed
Mediandistributional area,(km2)
Amphibians 177 30 1060 2 9 85 399
Birds 115 69 2437 15 15 99 21,075
Mammals 55 29 618 7 12 47 24,156
Plants 435 66 3040 3 50+ 264 3543
Swenson et al. BMC Ecology 2012, 12:1http://www.biomedcentral.com/1472-6785/12/1
Page 4 of 18

km2 resolution together with the field locality data todevelop species distribution models (Table 2). TheWorldClim climate data [59] is currently the best avail-able for this region yet it has its own inaccuracies aswill any future downscaled version, because meteorolo-gical information is scarce in many areas of the studyarea. To maintain consistent spatial resolutions, weresampled the most accurate elevation data for theregion (NASA’s Shuttle Radar Topography Mission,SRTM [60]) to match the 1-km2 resolution of the cli-mate data. Vegetation characterizations were made witha 3-year seasonal time series of satellite-derived MODISvegetation indices and per cent tree cover [61] at thesame resolution. Mapping of detailed ecological systems,discussed below, was conducted separately as an inde-pendent characterization at a higher spatial resolutionbased on NASA’s Landsat Thematic Mapper satellitesensors.There are drawbacks to predictive distribution model-
ling-for example, models may overestimate species’ geo-graphic ranges [62,63]-as well as advantages, such asreducing the effect of uneven collecting efforts [64].Nonetheless, distribution modelling is arguably the bestapproach at present when reliable locality and environ-ment data are available [65]. We chose MaximumEntropy ("Maxent”) [66], a statistical mechanicsapproach, as our modelling algorithm because of itsdocumented success at modelling species with limitedlocality data, a common problem when working withendemic species [65,67-69]. To ensure that Maxent wasbest suited to modeling distributions of Andean species,we compared the success of Maxent and two new pro-mising methods: Mahalanobis Typicalities (a methodadopted from remote sensing analyses), and RandomForests (a model averaging approach to classificationand regression trees). We found that Maxent produced
more consistent predictions across varying climatic con-ditions for 16 species [67]. Two to seven taxonomic spe-cialists reviewed each model output to determinethresholds to convert continuous predictions into pre-sence-absence maps based on known areas of absence,and to remove areas of known over-prediction (i.e.,where the species was known not to occur). Specialistreview is especially necessary when modelling with smallsets of locality data [52,67,70]. For species known from asingle or very few localities, we ran “rule-based” models(instead of Maxent) consisting of the geographic inter-section of known ranges in elevation and other environ-mental variables such as temperature and precipitation.
Areas of Endemism and IrreplaceabilityTraditionally, ecologists have overlain distribution mapsof species to identify areas of high endemism or speciesrichness [39]. We followed this approach to identifyareas of high endemism for each vertebrate and plantgroup. To identify discrete areas of high endemism wechose an arbitrary threshold value of two-thirds themaximum number of overlapping species for each groupand compared these patterns with previous studies,where they exist. This simple threshold could be chan-ged depending on the desire to be more or less inclusivein identifying areas of high endemism.To highlight areas harbouring species with very
restricted ranges, and therefore of potentially greaterconservation significance, we created maps of summedirreplaceability for each group using the C-Plan Software[71]. Summed irreplaceability is the likelihood that agiven analysis unit should be protected to achieve a spe-cified conservation target for the study area [54]. Weused 10-km2 analysis pixels and defined 25 of these pix-els for each species as a conservation “target”. If a givenspecies was found present in < 25 of the 10-km2 pixels,
Table 2 Environmental predictors and data sources for species distribution modelling
Variable Data Source
Mean annual temperature, mean temperature diurnal range,isothermality, precipitation of wettest and driest month, precipitationseasonality
Worldclim, (Hijmans et al. 2005. www.worldclim.org), 1-km resolution
Topography: Elevation Shuttle Radar Topography Mission digital elevation data provided byCGIAR (http://srtm.csi.cgiar.org/) resampled to 1-km resolution
Slope Degree of slope (maximum rate of change in elevation from each pixel toits 8 neighbors) derived from the SRTM digital elevation data
Topographic exposure Expresses the relative position of each pixel on a hillslope (e.g. ridge,valley, toe slope). Using methods of Zimmermann (2000) on the SRTMdigital elevation data with three neighborhood windows of 3x3, 6x6 and9x9
Percent tree cover MODIS global vegetation continuous fields sourced from http://glcf.umiacs.umd.edu/data/modis/vcf/data.shtml (Hansen et al. 2003) 1-km resolution,and summarized within 3- and 5- km moving windows
Enhanced Vegetation Index (EVI)Principal component 1Principal component 2
MODIS vegetation indices 16-Day data product sourced from the NASAEOS data gateway; Principal component analysis of 3 years of 16-daycomposites. MODIS EVI data summarized within 5 km moving window
Swenson et al. BMC Ecology 2012, 12:1http://www.biomedcentral.com/1472-6785/12/1
Page 5 of 18

we set the target as the number of pixels in which thespecies occurs. For each species, irreplaceability for eachpixel ranges from 0 to 1. Low values of irreplaceabilityindicate that for a species there are many other (replace-able) sites that may be conserved (in other words that aspecies occurs in many pixels), whereas high values indi-cate there are very few sites available (irreplaceable)because the species have very narrow ranges. The finalirreplaceability number is the result of summing irrepla-ceability values for all species occurring at each location,thereby emphasizing the locations with the higher num-ber of narrow-range endemics.
Ecological SystemsTo complement the endemic species information, weproduced a detailed map of natural vegetation types at ascale of 1:250,000 (25 ha minimum mapping unit). Weapplied a hemisphere-wide vegetation classification sys-tem [72] that is the terrestrial classification employed asa standard in North America in U.S. federal mappingprojects [73,74] and an emerging standard in LatinAmerica [75]. The classification relies on the concept ofterrestrial ecological systems [73], which are groups ofvegetation communities that tend to co-occur in land-scapes as a result of the action of common ecologicalprocesses, substrates, and/or environmental gradients.The ecological system classification allows for effectiveintegrated vegetation mapping, at desired levels of the-matic detail, permitting planners to prioritize acrossborders and across large regions. The species distribu-tion models did not use this map as a predictor variable,thus the map provides an independent characterizationof areas where endemics reside. In addition to analysingprotection gaps and representativeness of the systems,we examined the overlap between ecological systemsand areas of high endemism. Our goal was to identify ifany systems were disproportionally represented in ende-mic areas compared to their distributions across thestudy area.To create the ecological systems map, we incorporated
existing vegetation maps where possible, and with in-country mapping teams of local field and botanicalexperts; we applied one cohesive classification systemacross the two countries. The mapping relied on fieldwork, visual interpretation of Landsat TM and ETM+satellite images in the Peruvian lowlands and areas ofBolivia, and spatial modelling and image classificationfor upland areas in Peru. Though more advanced map-ping methods exist (e.g., [76]), we found our methods tobe appropriate for these landscapes and the limited dataavailability, as well as more accessible to the in-countrymapping teams. For ecological system characterizationas well as accuracy assessment, we developed a rapidfield survey protocol for more than 2000 points across
the study area using spatial optimization to identify can-didate clusters of points. Field observations and aerialtransects of high-resolution digital photos of remote andinaccessible areas provided the basis for map validationand accuracy assessment. Details of the mapping meth-ods, classification system and accuracy assessment canbe found in Additional File 1.
Gap AnalysisWe conducted a gap analysis (sensu [77]) by examiningthe representation of terrestrial ecological systems, spe-cies distributions, and areas of high endemism and irre-placeability with respect to existing national-levelprotected areas. We included all designated nationallyadministered areas corresponding to World Conserva-tion Union (IUCN) categories I-VI (IUCN 1994), as wellas those that have not yet been scored against the IUCNcriteria. This covered national parks, communalreserves, protected forests, integrated managementareas, and other national sanctuaries. Rather than limit-ing our analysis to those areas with IUCN categoriesreflecting the strictest levels of protection, we took aninclusive approach, recognizing that in this region effec-tive protection can vary in any category. We used digitalmaps of protected area boundaries from 2007 providedby our in-country collaborators as they were more cur-rent than the World Database of Protected AreasWDPA [78] at the time. National level protected areaboundaries have not changed in the region at the timeof publication of this article; however improvementshave been made to the WDPA information. Regionalprotected areas have experienced shifts in jurisdiction,area, and level of protection. While including regionalprotected areas in this analysis would be advantageous,information on protection levels and boundaries ofregional areas is incomplete in some areas and inconsis-tent across country borders.
ResultsThe datasets and individual species maps for most ofthe analyses described here are publically accessible (inboth graphic and geospatial format) on the project web-site (http://www.natureserve.org/andesamazon). Thesupporting Additional Files 1, 2, 3, 4, 5, 6, contain sup-plementary results in detail.
Endemic SpeciesWe compiled 7154 unique records of existing specimenlocalities to create distribution models for all 115 birds,55 mammals, 177 amphibians, and 435 plants included inour endemic species analysis (Table 1; see Additional File1). Sample sizes of unique localities for modelling distri-butions of individual species were highest for birds, fol-lowed by mammals, plants, and amphibians. There were
Swenson et al. BMC Ecology 2012, 12:1http://www.biomedcentral.com/1472-6785/12/1
Page 6 of 18

3 mammal and 3 bird species having just one reliablelocality, whereas 123 plant and 65 amphibian specieswere limited to one location, none of which were pre-dicted with distribution modelling. Modelled distributionsizes varied from just 2 km2 for the plant Centropogonbangii, to 690,992 km2, or 55% of the study area, for thefrog Colostethus trilineatus. On average, endemic mam-mals tended to have the largest geographic distributions,followed by birds, plants and amphibians (Figure 3).Maxent models produced satisfactory distribution maps,according to expert reviewers and model evaluation tech-niques, for 67% of the species. We produced distributionsfor the remaining species, which had too few knownlocalities for Maxent models, using rule-based models.Expert review was essential for eliminating areas fromthe distribution where the species was known not tooccur for reasons of competition or geographic isolation.
Areas of Endemism and IrreplaceabilityAreas with the highest numbers of endemic species liealong mid to upper elevations on the eastern slope ofthe Andes, yet patterns vary by taxonomic group. Bothbirds (25-38 species per 1-km2 grid cell) and mammals(17 - 20 species per cell) followed this trend (Figures 4a,b) with peaks of endemic richness encompassing eleva-tions between 2500 and 3000 m and extending almostthe entire length of the study area. Amphibians, by con-trast, displayed peaks of endemism (21 - 29 species per1-km2 cell) on lower slopes, between 1000 and 1500 melevation. These areas were concentrated in southernPeru, northern Bolivia, and in an isolated endemic areain the northern Peruvian department of San Martin(Figure 4c). Combining all vertebrate species revealshigh concentrations between 2000 and 3000 m elevation(Figure 5) with highest concentrations (75 to 78 overlap-ping species) in Bolivia’s Cochabamba and Tiraque
Cordilleras (mountain ranges) and extensive areas ofhigh value along Peru’s Vilcabamba Cordillera. Wefound that the different plant groups varied widely inendemic patterns among themselves and with respect tovertebrates. Areas of high Fuchsia endemism, for exam-ple, were at similar elevations as birds and mammals,but with local concentrations in the departments ofCusco (Peru), and Cochabamba (Bolivia) (Figure 4d).Endemic species of Aquifoliaceae, Chrysobalanaceae,Inga, Loasaceae, and Malpighiaceae were concentratedin the northern portion of the study area, whereas ende-mic Brunelliaceae, Campanulaceae, Ericaceae, Marcgra-viaceae, Mimosa, and Passifloraceae were concentratedin the south. We found concentrations of endemicAcanthaceae in both the north and south. Endemic spe-cies of Anacardiaceae, Chrysobalanaceae, Inga, and Mal-pighiaceae were concentrated in the lowlands, whereasAcanthaceae and Cyatheaceae occurred largely at midelevations (around 1000 m); endemic species in theremaining nine groups occur mostly above 2000 m(maps of all plant species can be found here: http://www.natureserve.org/aboutUs/latinamerica/maps_plant-s_intro.jsp).Summed irreplaceability analysis which highlights
areas with the greatest numbers of narrow-ranging spe-cies, shows different key areas than the endemic areasanalysis. Similar to the endemic areas, many of thepeaks of summed irreplaceability occurred in the higherelevation slopes along the Andean cordillera (Figure 6a-d, areas over threshold value shown). Endemic richnessof birds and mammals overlapped more than othergroups yet summed irreplaceability showed differencesbetween these two taxonomic groups, as well as foramphibians. The northern portion of the study area inthe Peruvian department of Amazonas (Cordillera deColán and Alto Mayo) is highly irreplaceable for plants,amphibians, and birds but was not identified as an ende-mic area by the simple overlay of species ranges (Figures4a, c, d); this emphasizes the large number of veryrestricted range species that occur there. Summed irre-placeability also highlighted some lowland areas for spe-cies groups in which most other species occurred athigher elevations. For instance, birds have high irrepla-ceability in north-eastern Peru, where a number of spe-cies are restricted to the lowland white-sand forests nearIquitos. Similarly, there are two restricted range primatespecies in the Beni savanna of Bolivia, emphasizing theirreplaceability of that region for mammals. Detaileddescriptions of locations of the areas of high endemismand irreplaceability for all species groups can be foundin Young et al. (2007).Discrete centres of endemism (Figure 7), covered
23,844 km2 for birds, 11,655 km2 for mammals, 2781km2 for amphibians, and 67,676 km2 for plants. (We
Figure 3 Distribution of predicted range sizes by speciesgroups
Swenson et al. BMC Ecology 2012, 12:1http://www.biomedcentral.com/1472-6785/12/1
Page 7 of 18
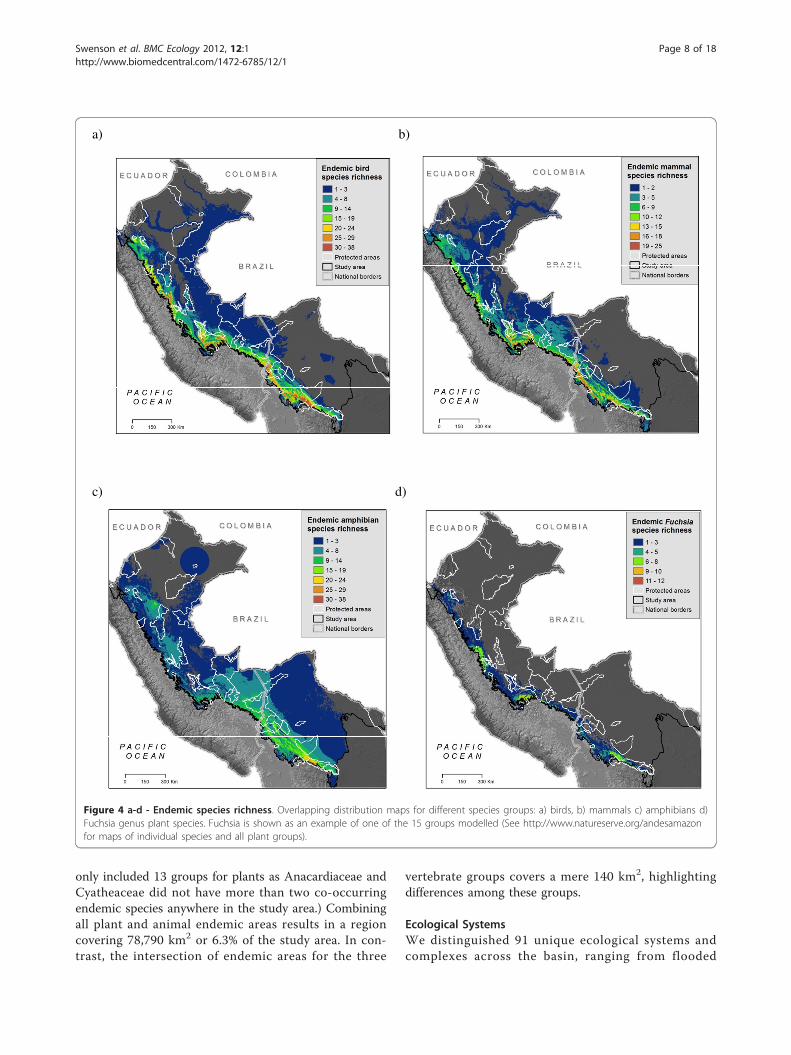
only included 13 groups for plants as Anacardiaceae andCyatheaceae did not have more than two co-occurringendemic species anywhere in the study area.) Combiningall plant and animal endemic areas results in a regioncovering 78,790 km2 or 6.3% of the study area. In con-trast, the intersection of endemic areas for the three
vertebrate groups covers a mere 140 km2, highlightingdifferences among these groups.
Ecological SystemsWe distinguished 91 unique ecological systems andcomplexes across the basin, ranging from flooded
b) a)
c) d)
Figure 4 a-d - Endemic species richness. Overlapping distribution maps for different species groups: a) birds, b) mammals c) amphibians d)Fuchsia genus plant species. Fuchsia is shown as an example of one of the 15 groups modelled (See http://www.natureserve.org/andesamazonfor maps of individual species and all plant groups).
Swenson et al. BMC Ecology 2012, 12:1http://www.biomedcentral.com/1472-6785/12/1
Page 8 of 18

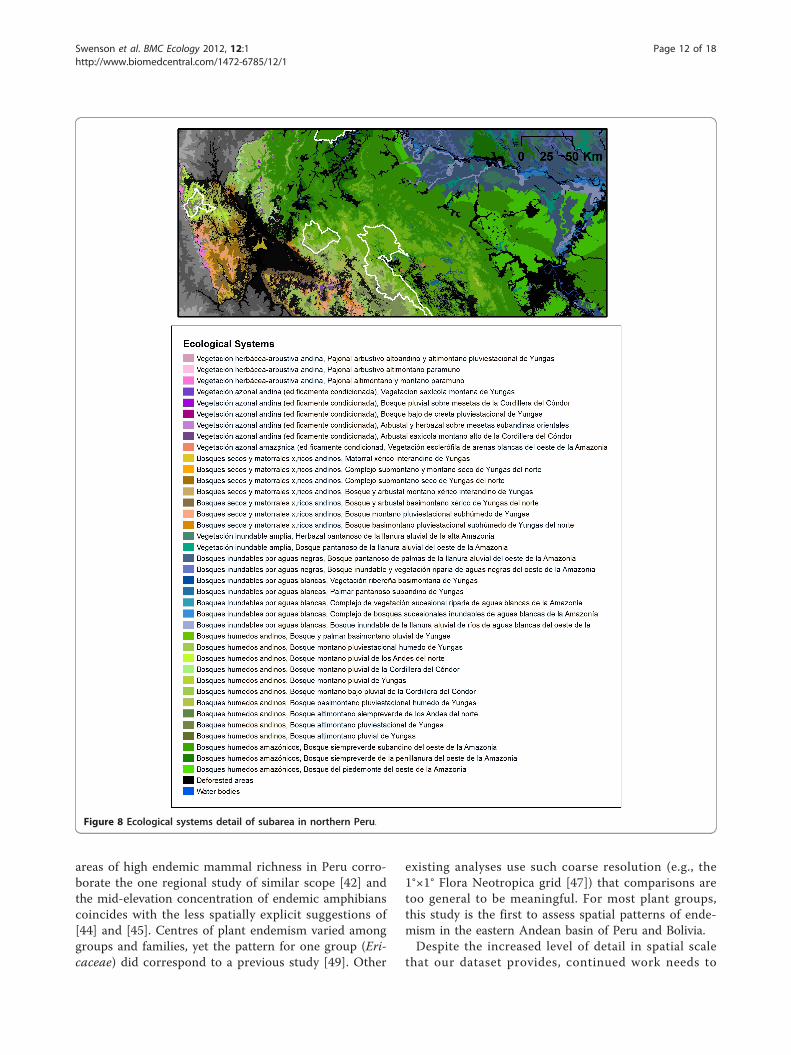
savanna systems to xeric shrub types (Figure 8 shows anarea in detail for northern Peru; see [79] for a descrip-tion of each ecological system). The systems representunique vegetation communities, further distinguished bybioclimate, geomorphology, substrate, flooding regime,river type (black, white, mixed water) and regional com-positional differences. Half of the ecological systemsconsist of different forms of wetlands and cover 30% ofthe study area and systems with bamboo-dominated for-ests cover over 71,500 km2. Forty-two of the ecologicalsystems are unique to the Amazon basin of Peru andBolivia. The Andean uplands region of Peru, typified bysteep elevation gradients and subsequent vegetationzonation [80], represents only 12% of the study area yetharbours 37% of the different ecological systems. Accu-racy of the ecological system map varied by region andthe type of validation data. For detailed classes of ecolo-gical systems (not including areas converted to humanuses), accuracy ranged from 62 to 91% by mappingregion, while a map legend of 20 coarser groupings ofsystems defined by ecological similarity had accuraciesranging from 81 - 90% (See Additional File 1 and 4).Combining the areas of endemism of the three verte-
brate groups creates a region covered by 16 ecologicalsystems (Table 3). The montane pluvial forest of theYungas (montane and cloud forests of the Andean-Ama-zon slope in Peru and Bolivia) covers ~36% of the verte-brate endemic area, yet only makes up 1.7% of the studyarea. This ecosystem together with the three other Yun-gas forest types, (lower mountain pluvial forest, montanehumid pluviseasonal, upper montane pluvial forests)cover an overwhelming proportion, (77%) of the verte-brate endemic areas but themselves cover just 7% of thestudy area. Ecological systems that occurred in highlyirreplaceable areas, were more evenly distributed interms of system type (Table 3 second column); westernAmazon sub-Andean evergreen forest covered the high-est percentage (12.6%) of highly irreplaceably areas
followed by the Yungas lower mountain pluvial forest(9.3%).
Gap AnalysisNational protected areas cover approximately 12% of thestudy area, resulting in variable levels of protection forendemic species and their ecosystems. Of the endemicspecies examined, 327 (42%) have less than 10% of theirdistributions within protected areas (Table 4 see Addi-tional File 3). About a third of all endemic species (226)occur completely outside of protected areas. As for dis-crete areas of endemism, amphibian areas receive thegreatest protection: 67% of the area occurs within exist-ing protected areas. Protection for the other endemicareas was lower (birds, 7%; mammals, 29%; plants, 24%).Only 20% of the combined endemic centres occurredwithin national-level protected areas (Figure 7). Fewerthan 20% of all combined irreplaceable areas are undernational protection, with protection varying by speciesgroups (birds, 17%; mammals, 18%; amphibians, 17%;plants, 15%) (Figures 6a-d). Five of the seventeen ecologi-cal systems that cover the areas of endemism (Table 3)have less than 5% of their extents protected across thestudy area. About half of the 91 ecological systems have10% or less of their extents covered by protected areas,with 26 of these systems having less than 2% under legalprotection (Table 5; Figure 9; see Additional File 3).Several areas of endemism and irreplaceability without
current national-level protected status are worth highlight-ing (Figure 7). In northern Peru, areas near the cities ofIquitos and Tarapoto host unique concentrations of ende-mic plants. The Tarapoto region also has a large irreplace-able area for amphibians. The Carpish Hills in theDepartment of Huanuco host many endemic plants(Acanthaceae, Aquifoliaceae and Fuchsia) and are highlyirreplaceable for endemic birds (up to 32 ranges overlap)but are completely unprotected. The Cordillera de Vilca-bamba is a major area of endemism for birds, mammalsand plants (Fuchsia). It also constitutes the largest cohe-sive irreplaceable area for birds and mammals in the studyarea, and is highly irreplaceable for some plants. Currentlythe Cordillera of Vilcabamba has only one protected area,the Machu Picchu Historical Sanctuary, which covers just326 km2, and is highly impacted by tourism. The north-eastern corner of the Department of Puno has numerousendemic birds and mammals and is also unprotected.However, many of the ranges of these species extend intoBolivia where they are protected in Madidi National Park.In Bolivia, the cordilleras near La Paz have high levels
of bird, mammal and plant endemism (8 of the 13 plantgroups analysed), and scored as highly irreplaceable forendemic mammals and plants. Most of these cordillerasare not protected, although a small area that is irre-placeable for amphibians coincides with the 608-km2
Endemic Vertebrate Richness78 overlapping species
> 3 overlapping species
0 150 Km
Figure 5 Endemic vertebrate species richness . Combinedendemic mammal, bird, and amphibian richness over a three-dimensional oblique perspective. Viewpoint is from northeasternPeru looking south across the Amazon basin towards the southernPeruvian and northern Bolivian Andes.
Swenson et al. BMC Ecology 2012, 12:1http://www.biomedcentral.com/1472-6785/12/1
Page 9 of 18

Cotapata National Park (Figure 5). In central Bolivia,unprotected endemic areas for birds, mammals, andamphibians occur in the Cordillera de Cocapata-Tiraqueand Cochabamba Department, between protected areas.
DiscussionOur results, at a conservation practitioner’s scale, iden-tify geographic areas in the eastern slopes of the Peru-vian and Bolivian Andes with high concentrations of
a) b)
d) c)
Figures 6 a-d - Summed irreplaceability analysis for different species groups; a) birds, b) mammals c) amphibians d) plants from all 13groups.
Swenson et al. BMC Ecology 2012, 12:1http://www.biomedcentral.com/1472-6785/12/1
Page 10 of 18
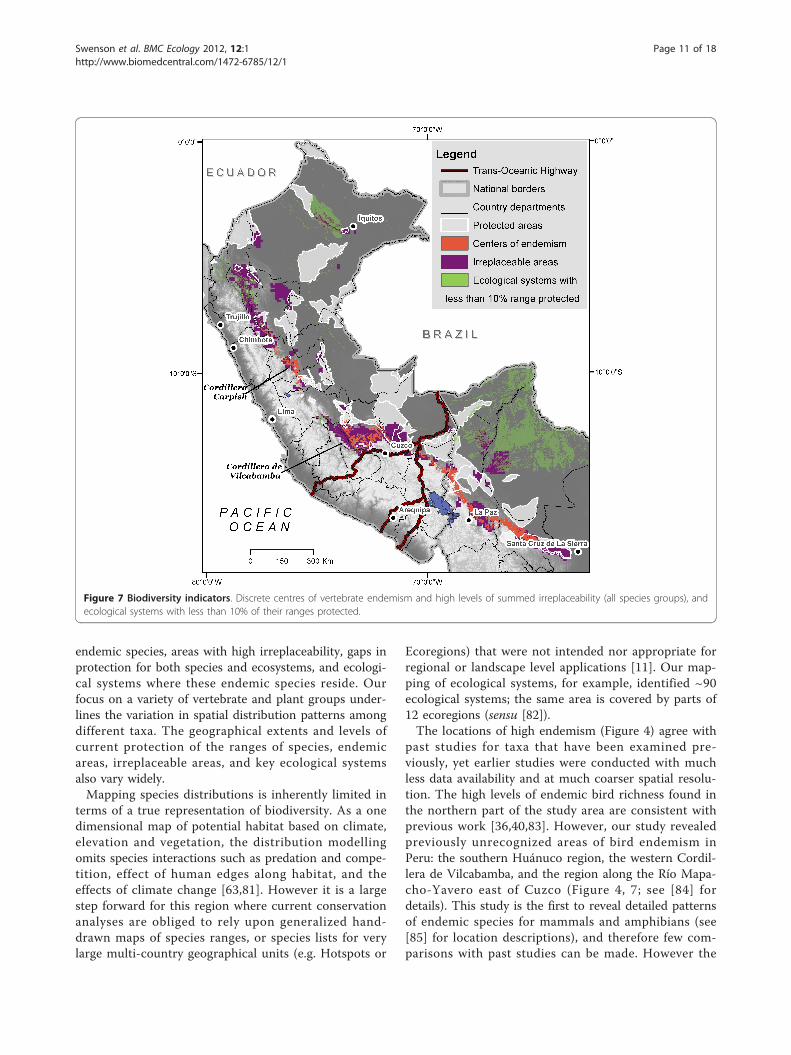
endemic species, areas with high irreplaceability, gaps inprotection for both species and ecosystems, and ecologi-cal systems where these endemic species reside. Ourfocus on a variety of vertebrate and plant groups under-lines the variation in spatial distribution patterns amongdifferent taxa. The geographical extents and levels ofcurrent protection of the ranges of species, endemicareas, irreplaceable areas, and key ecological systemsalso vary widely.Mapping species distributions is inherently limited in
terms of a true representation of biodiversity. As a onedimensional map of potential habitat based on climate,elevation and vegetation, the distribution modellingomits species interactions such as predation and compe-tition, effect of human edges along habitat, and theeffects of climate change [63,81]. However it is a largestep forward for this region where current conservationanalyses are obliged to rely upon generalized hand-drawn maps of species ranges, or species lists for verylarge multi-country geographical units (e.g. Hotspots or
Ecoregions) that were not intended nor appropriate forregional or landscape level applications [11]. Our map-ping of ecological systems, for example, identified ~90ecological systems; the same area is covered by parts of12 ecoregions (sensu [82]).The locations of high endemism (Figure 4) agree with
past studies for taxa that have been examined pre-viously, yet earlier studies were conducted with muchless data availability and at much coarser spatial resolu-tion. The high levels of endemic bird richness found inthe northern part of the study area are consistent withprevious work [36,40,83]. However, our study revealedpreviously unrecognized areas of bird endemism inPeru: the southern Huánuco region, the western Cordil-lera de Vilcabamba, and the region along the Río Mapa-cho-Yavero east of Cuzco (Figure 4, 7; see [84] fordetails). This study is the first to reveal detailed patternsof endemic species for mammals and amphibians (see[85] for location descriptions), and therefore few com-parisons with past studies can be made. However the
Figure 7 Biodiversity indicators. Discrete centres of vertebrate endemism and high levels of summed irreplaceability (all species groups), andecological systems with less than 10% of their ranges protected.
Swenson et al. BMC Ecology 2012, 12:1http://www.biomedcentral.com/1472-6785/12/1
Page 11 of 18
areas of high endemic mammal richness in Peru corro-borate the one regional study of similar scope [42] andthe mid-elevation concentration of endemic amphibianscoincides with the less spatially explicit suggestions of[44] and [45]. Centres of plant endemism varied amonggroups and families, yet the pattern for one group (Eri-caceae) did correspond to a previous study [49]. Other
existing analyses use such coarse resolution (e.g., the1°×1° Flora Neotropica grid [47]) that comparisons aretoo general to be meaningful. For most plant groups,this study is the first to assess spatial patterns of ende-mism in the eastern Andean basin of Peru and Bolivia.Despite the increased level of detail in spatial scale
that our dataset provides, continued work needs to
Figure 8 Ecological systems detail of subarea in northern Peru.
Swenson et al. BMC Ecology 2012, 12:1http://www.biomedcentral.com/1472-6785/12/1
Page 12 of 18

focus on refining these biodiversity data to even finerspatial scales (e.g. 1:100,000) and higher levels of accu-racy. The dataset and analyses we have produced aretied to the time of specimen collections and to the qual-ity of available data. As more specimen locations arecollected in the future with increasingly accurate loca-tional and elevational information (using a precise globalpositioning system), distribution models could be re-runand models validated. Geographical collection bias, a
problem for presence-only distribution models could beaddressed in future modelling efforts by the selection ofpseudo-absence data having similar bias as the presencedata [86]. More precise geographical climate data couldrefine the spatial resolution of model predictions; therewill be an increasing prevalence of ‘downscaled’ geogra-phical climate data thanks to higher spatial resolutiondigital elevation models (SRTM and ASTER). Howeverthe overall limitation is the lack of adequate meteorolo-gical stations in the region. Other layers that would beuseful to incorporate upon their refinement would be acharacterization of soils or geology. We successfullymodelled all endemic vertebrates yet, additional modelsof plant species distributions should be realized. Consid-ering there are over 5000 endemic plant species in thecountry of Peru (of which approximately 3200 fallwithin the altitudinal range of our study area) [87], our435 species represents a small fraction of endemics toPeru and/or Bolivia in the Amazon watershed.Our country wide analysis could be refined to depart-
ment scale using land tenure information and local toregional protected areas and resource concessions.
Table 3 Ecological systems that overlap vertebrate endemic areas and irreplaceable areas.
Ecological system Percent of endemicarea covered by
system
Percent of irreplaceableareas covered by system
Percent of study areacovered by system
Percent of systemrange that isprotected
Montane pluvial forest of the Yungas 35.7 1.3 1.7 34
Lower montane pluvial forest and palmgrove of the Yungas
16.1 9.3 3.5 41
Montane humid pluviseasonal forest ofthe Yungas
14.9 6.3 1.1 13
Upper montane pluvial forest of theYungas
10.4 1.4 0.6 22
Upper montane pluviseasonal forest ofthe Yungas
5.2 2.6 0.6 9
Converted lands 4.6 14.7 6.0 4
Low montane subhumid pluviseasonalforest of the southern Yungas
3.3 0.8 0.6 16
Lower montane humid pluviseasonalforest of the Yungas
3.3 2.3 0.8 18
Southwestern Amazon subandeanevergreen forest
2.8 5.2 5.9 42
High-Andean and upper montane pluvialgrassland and shrubland of the Yungas
2.3 3.4 0.4 30
Western Amazon subandean evergreenforest
0.0 12.6 5.0 38
Southwestern Amazon piedmont forest 0.0 7.4 2.6 39
Southwestern Amazon subandeanevergreen seasonal forest
0.0 5.6 1.7 48
Western Amazon semideciduous azonalforest
0.0 5.4 1.0 1
Lower montane humid pluviseasonalforest of the Yungas
0.0 2.3 0.8 18
Lower montane pluvial forest of theCondor Mountain Range
0.0 2.0 0.2 42
Systems shown cover at least 2% of vertebrate endemic (2,7676 km2) or irreplaceable areas (150,500 km2); ordered by coverage of endemic areas.
Table 4 Coverage of endemic species ranges by national-level protected areas; IUCN l - VI (IUCN, 1994)
Percent range in IUCN I-VIprotected area
Birds Mammals Amphibians Plants
> 75 3 3 21 15
51 to 75 5 2 11 23
26 to 50 40 23 33 97
10 to 25 44 13 29 92
< 10 23 14 83 207
No protection 5 5 72 144
Total number of species 115 55 177 435
Swenson et al. BMC Ecology 2012, 12:1http://www.biomedcentral.com/1472-6785/12/1
Page 13 of 18

Current maps of forest deforestation and degradationwould aid in calculating the remnant ranges for eachspecies as well as ecological systems. Further analysiscould be made in terms of the complementarity of spe-cies assemblages and their relationship to ecological sys-tems and levels of protection, whose results couldfurther guide priorities. However, the greater battle forbiodiversity conservation lies in managing elementsbeyond our datasets and analyses, as described below.The geographical patterns of endemism, irreplaceabil-
ity, and ecosystems revealed here pose several challengesfor conservation planning in the region (Figure 7). Themost obvious challenge is the geographic configurationof the locations of endemic or irreplaceable areas.Although we mapped only a small subset of the biodi-versity that occurs in the region, we found striking geo-graphic differences in endemic species concentrationsacross taxonomic groups. The difficulty of using surro-gates of one species group for another has been recog-nized [15,52,53], and our findings underscore the needfor a large portfolio of protected areas and other protec-tion mechanisms to conserve diverse elements ofbiodiversity.
Second, the gap analysis demonstrates that many areaswhere concentrations of endemic species occur remainunprotected today. Considering ongoing threats in theregion from infrastructure development [88], oil extrac-tion [89], gold mining [90,91], illicit crops [36], and thecontinually advancing agricultural fronts, more carefullysituated protected areas and novel land use regulationstrategies will be necessary to safeguard substantialamounts of biodiversity.Third, although we use protected area coverage to
evaluate conservation coverage, we acknowledge thatprotection status does not necessary translate into actualprotection on the ground. Indeed, resource extractionand degradation is continuing in many legally protectedlands in the study area [92]. Nevertheless, these reserveshave the potential to protect important segments ofendemic and irreplaceable areas, suggesting thatstrengthening the capacity of relevant authorities toimprove protection is an important and continuingchallenge.Fourth, large reserves will probably be insufficient to
maintain all biodiversity. Although large reserves oftenprovide the best means for maintaining well-functioning
Table 5 Terrestrial ecological systems having less than 2% protection in the study area
Ecological system Area(ha)
Percent of studyArea
Area protected(ha)
Percentprotected
Complex of non-alkaline savannas of the Beni transitional to theCerrado
2,221,743 1.8 459 0
Cerrado complex of the northern Beni 1,766,905 1.4 0 0
Western Amazon semideciduous azonal forest 1,276,552 1.0 14,533 1
Complex of non-alkaline savannas of the Beni 585,143 0.5 0 0
Central-south Amazon Palm dominated forest 578,331 0.5 0 0
Chiquitania and Beni seasonally flooded herbaceous oligotrophicsavanna
506,966 0.4 0 0
Beni seasonally flooded palm grove and savanna of the alkalineflatlands
226,672 0.2 6 0
Chiquitania and Beni “Cerradão” 214,452 0.2 0 < 1
Beni seasonally flooded herbaceous mesotrophic savanna 208,539 0.2 217 < 1
Montane interandean xeric forest and shrubland of the Yungas 205,749 0.2 40 < 1
Interandean xeric scrub of the Yungas 152,396 0.1 0 0
Beni and Chiquitania open hydrophytic savanna 145,912 0.1 0 0
Lower montane xeric forest and shrubland of the northern Yungas 137,919 0.1 101 < 1
Beni mixed-water riparian vegetation and forests complex 120,637 0.1 0 0
Northern Yungas dry submontane complex 95,189 0.1 0 0
Cerrado hydrophytic savannah with termite mounds 63,280 0.1 0 0
Chiquitania and Beni semideciduous subhumid forest 48,789 < 0.1 0 0
Beni clear and dark-water riparian forests and vegetation complex 35,684 < 0.1 0 0
Central-south Amazon ridges lithomorphic scrub 21,028 < 0.1 0 0
Northern Yungas dry montane and submontane complex 19,602 < 0.1 0 0
Yungas ridge pluviseasonal forest 16,994 < 0.1 325 1
Montane lithomorphic vegetation of the Yungas 10,296 < 0.1 0 0
Western Beni seasonally flooded thorn forest of the alkaline flatlands 10,009 < 0.1 0 0
Upper montane pluvial Polylepis forest of the Yungas 8423 < 0.1 73 1
Swenson et al. BMC Ecology 2012, 12:1http://www.biomedcentral.com/1472-6785/12/1
Page 14 of 18

ecosystems [93], the pattern of endemism we document,in which microendemic species are scattered across thelandscape and not always concentrated geographically,will require multi-pronged conservation efforts.Restricted-range species that occur far from the majorareas of endemism or irreplaceability, such as the twoprimates in the Bolivian Beni, would benefit from awider network of smaller reserves, perhaps establishedby departmental, provincial, or municipal governmentsor private entities. Current trends toward the decentrali-zation of responsibility for natural resource managementto provincial governments may provide a useful institu-tional context for the establishment of some of thesesmaller, but nonetheless critical reserves [94].Our finding that highly endemic areas disproportion-
ally occupy a handful ecological systems presents yet afifth challenge. Ecological systems characterize broad,integrated units of biodiversity and can be used as acoarse filter for conservation. While maintaining repre-sentation of all systems in landscape-level protectionplans [95], planners may need to balance the need toprotect endemic species with the need for a representa-tive sample of ecosystem type and function as well asother targets such as endangered species or carbonsequestration. On the other hand, these particular
ecological systems could be considered surrogates forareas of high endemism. The systems are advantageouslyclose together in the Yungas region, are relatively lim-ited in extent (totalling 7% of the study area), and haveindividual ranges that are < 35% protected.A final challenge is continued climate change. We
know that because of climate change, the ranges ofmany species will shift across the landscape and possiblyout of protected areas [96,97]. Evidence is accumulatingthat along the Andean slope, species shifts are alreadyoccurring [98,99]. Yet the variation in projections offuture South American climate makes assessment of theeffects on species’ distributions difficult [100]. The steepelevation (and therefore climate) gradients in the Andes,where most endemic species are located, suggest thatsuch displacements may take place over relatively smalldistances. Extinctions are most likely in species inhabit-ing the highest-elevation habitats, which occur aboveour study area [100]. Nevertheless, planners should con-sider adding upslope buffers to conservation areas desig-nated using current distributions of endemic species,and future research could model these species distribu-tions under future climate scenarios.To complement the further creation and effective
management of protected areas, other alternative
Figure 9 Ecological systems protection. Percentage of each system’s range protected in study area.
Swenson et al. BMC Ecology 2012, 12:1http://www.biomedcentral.com/1472-6785/12/1
Page 15 of 18

approaches, which will result in the maintenance of keyecosystems, should expand and continue. Theseapproaches include, strategic conservation on privatelands and brokering conservation agreements with pri-vate companies, effective land use planning and possiblycarbon accounting at the regional government level forboth public and private lands, and payments for ecosys-tem services (e.g. water provision, ecotourism recreation,carbon storage through forests: Reducing Emissionsfrom Deforestation and forest Degradation, REDD).However priority areas for ecosystem services conces-sions may not necessarily overlap with priorities for bio-diversity conservation (e.g.[101]).
ConclusionsWe believe these spatial datasets provide a substantivebase upon which to make decisions and move forwardfor further protection. The approach to developingthese datasets described here, relying on existing envir-onmental data sources, data in natural history collec-tions, and in-country expertise to identify endemicspecies distributions, concentrations and gaps in pro-tection across national borders is applicable to manyregions of the world where survey efforts are incom-plete. Our results demonstrate that even under theseconditions, conservationists can develop spatial data-sets for multiple taxonomic groups at a scale useful toguide planning.
AcknowledgementsWe are deeply indebted to the Gordon and Betty MooreFoundation for financial support and technical guidanceduring the project. The project would not be possiblewithout the generous data sharing, opinions, advice andparticipation of our long list of collaborators, found athttp://www.natureserve.org/aboutUs/latinamerica/col_in-stitutions.jsp. Funds from NatureServe, Duke Univer-sity’s Nicholas School of Environment, and USAID’sEmerging Pandemic Threats PREDICT Program sup-ported the publication of this manuscript. The datasetsfor most of the maps and analyses described here areaccessible in both graphic and GIS format at http://www.natureserve.org/andesamazon.We greatly appreciate the critiques of the anonymous
reviewers and Nigel Pitman that helped shape andimprove this manuscript.
Additional material
Additional file 1: Species distribution modeling, Ecological Systemmapping, endemism and irreplaceability, gap analysis.
Additional file 2: Endemic species model results.
Additional file 3: Gap analysis results.
Additional file 4: Ecological system accuracy assessment.
Additional file 5: Sources of species locality data and expertreviewer list.
Additional file 6: Enlarged map of SE Peru; Vertebrate Endemism &Ecological Systems.
Author details1NatureServe, 4600 North Fairfax Drive, Floor 7, Arlington, VA 22203, USA.2Herbario Nacional de Bolivia, Universidad Mayor de San Andrés, La Paz,Bolivia. 3Museo de Historia Natural, Universidad Nacional Mayor de SanMarcos, Apartado 140434, Lima-14, Perú. 4Fundación Amigos de laNaturaleza, km 7,5 Doble Vía la Guardia, Santa Cruz de la Sierra, Bolivia,Casilla 2241. 5Instituto de Investigaciones de la Amazonía Peruana, Iquitos,Perú. 6Rumbol, S.R.L. Av. Dorbigni 1608, Cochabamba, Bolivia. 7AsociaciónArmonía, BirdLife Internacional, Avenida Lomas de Arena 400, Casilla 3566,Santa Cruz de la Sierra, Bolivia. 8Centro de Datos para la Conservación,Departamento de Manejo Forestal, Facultad de Ciencias Forestales,Universidad Nacional Agraria La Molina, Apartado 456, Lima 100, Perú.9Museo Nacional de Historial Natural, Colección Boliviana de Fauna, Casilla8706, La Paz, Bolivia. 10Nicholas School of the Environment, Duke University,Box 90328, Durham, NC 27708, USA. 11The Nature Conservancy, 99 BedfordSt., 5th Floor, Boston MA 02111 USA. 12The Nature Conservancy, 4245 FairfaxDrive, Arlington, VA 22203 USA. 13Ontario Ministry of Natural Resources, 50Bloomington Road W, Aurora, ON L4G 3G8. 14National Wildlife Federation,901 E Street, NW Suite 400, Washington DC, 20004 USA. 15Departamento deCiencias, Pontificia Universidad Católica del Perú, Av. Universitaria 1801, Lima32, Peru. 16EcoHealth Alliance - 460 W 34th Street, 17th Floor, New York, NY10001, USA.
Authors’ contributionsAuthor contributions: All co-authors contributed to data collection and/oranalysis of project results. JJS and BEY wrote the majority of the paper withcontributions from the co-authors. All authors have read and approved thefinal manuscript.
Received: 19 September 2011 Accepted: 27 January 2012Published: 27 January 2012
References1. Myers N, Mittermeier RA, Mittermeie CG, da Fonseca GAB, Kent J:
Biodiversity hotspots for conservation priorities. Nature 2000, 403:853-858.2. Rodrigues ASL, Akcakaya HR, Andelman SJ, et al: Global gap analysis:
Priority regions for expanding the global protected-area network.BioScience 2004, 54:1092-1100.
3. Orme CDL, Davies RG, Burgess M, et al: Global hotspots of speciesrichness are not congruent with endemism or threat. Nature 2005,436:1016-1019.
4. Brooks TM, Mittermeier RA, da Fonseca GAB, Gerlach J, Hoffmann M,Lamoreux JF, Mittermeier CG, Pilgrim JD, Rodrigues ASL: Globalbiodiversity conservation priorities. Science 2006, 31:58-61.
5. Ceballos G, Ehrlich PR: Global mammal distributions, biodiversityhotspots, and conservation. Proceedings of the National Academy ofSciences 2006, 103:19374-19379.
6. Olson DM, Dinerstein E: The global 200: priority ecoregions for globalconservation. Annals of the Missouri Botanical Garden 2002, 89:199-224.
7. IUCN: Guidelines for protected areas management categories. Cambridge,UK and Gland, Switzerland: International Union for Conservation of Nature1994.
8. Patterson BD, Ceballos G, Sechrest W, Tognelli MF, Brooks T, Luna L,Ortega P, Salazar I, Young BE: Digital distribution maps of the mammalsof the Western Hemisphere.Edited by: NatureServe. Arlington, V.A.:NatureServe; , 2.0 2007:.
9. Ridgely RS, Allnutt TF, Brooks T, McNicol DK, Mehlman DW, Young BE,Zook JR: Digital distribution maps of the birds of the WesternHemisphere.Edited by: NatureServe. Arlington, VA; , 2.1 2007:.
10. Schipper J, Chanson JS, False Chiozza: The status of the world’s land andmarine mammals: diversity, threat, and knowledge. Science 2008,322:225-230.
Swenson et al. BMC Ecology 2012, 12:1http://www.biomedcentral.com/1472-6785/12/1
Page 16 of 18

11. Londoño-Murcia MC, Tellez-Valdés O, Sánchez-Cordero V: Environmentalheterogeneity of World Wildlife Fund for Nature ecoregions andimplications for conservation in Neotropical biodiversity hotspots.Environmental Conservation 2010, 37(2):116-127.
12. Freitag S, Nicholls AO, Van Jaarsveld AS: Nature reserve selection in theTransvaal, South Africa: what data should we be using? Biodiversity andConservation 1996, 5:685-698.
13. Hurlbert AH, White EP: Disparity between range map- and survey-basedanalyses of species richness: patterns, processes and implications.Ecology Letters 2005, 8:319-327.
14. Ferrier S: Mapping spatial pattern in biodiversity for regionalconservation planning: where to from here? Systematic Biology 2002,51:331-363.
15. Leroux SJ, Schmiegelow FKA: Biodiversity concordance and theimportance of endemism. Conservation Biology 2007, 21:266-268.
16. Balmford A, Mace GM, Ginsberg JR: The challenges to conservation in achanging world: putting processes on the map. In Conservation in achanging world. Edited by: G.M Mace AB, and J.R. Ginsberg. Cambridge:Cambridge Univ Press; 1998:1-28.
17. van der Werff H, Consiglio T: Distribution and conservation significance ofendemic species of flowering plants in Peru. Biodiversity and Conservation2004, 13:1699-1713.
18. Roy MS, Silva JMCD, Arctander P, Garcia-Moreno J, Fjeldså J: The speciationof South American and African birds in montane regions. In AvianMolecular Evolution and Systematics. Edited by: Mindell DP. New York:Academic Press; 1997:325-343.
19. Fjeldså J: Geographical patterns for relict and young species of birds inAfrica and South America and implications for conservation priorities.Biodiversity and Conservation 1994, 3:207-226.
20. Roy MS, Torres-Mura JC, Hertel F: Molecular phylogeny and evolutionaryhistory of the tit-tyrants (Aves: Tyrannidae). Molecular PhylogeneticEvolution 1999, 11:67-76.
21. García-Moreno J, Fjeldså J: Chronology and mode of speciation in theAndean avifauna. Bonner Zoological Monographs 2000, 46:25-46.
22. Dingle C, Lovette IJ, Canaday C, Smith T: Elevational zonation and thephylogenetic relationships of the Henicorhina wood-wrens. Auk 2006,123:119-134.
23. Patton JL, Smith MF: MtDNA phylogeny of Andean mice: a test ofdiversification across ecological gradients. Evolution 1992, 46:174-183.
24. Young KR: Biogeographical paradigms useful for the study of tropicalmontane forests and their biota. In Biodiversity and conservation ofneotropical montane forests. Edited by: Churchill; SP, Balslev; H, Forero; E,Luteyn JL. New York. The New York Botanical Garden; 1995:.
25. Young KR, Ulloa C, Luteyn JL, Knapp S: Plant evolution and endemism inAndean South America: an introduction. Botanical Review 2002, 68:4-21.
26. Hughes C, Eastwood R: Island radiation on a continental scale:Exceptional rates of plant diversification after uplift of the Andes.Proceedings of the National Academy of Sciences 2006, 103:10334-10339.
27. Donoghue MJ: A phylogenetic perspective on the distribution of plantdiversity. Proceedings of the National Academy of Sciences 2008,105:11549-11555.
28. Lynch JD, Duellman WE: The Eleutherodactylus of the Amazonian slopesof the Ecuadorian Andes (Anura: Leptdactylidae). MiscellaneousPublication of the University of Kansas Natural History Museum 1980, 69:1-86.
29. Graham CH, Ron SR, Santos JC, Schneider CJ, Moritz C: Integratingphylogenetics and environmental niche models to explore speciationmechanisms in Dendrobatid frogs. Evolution 2004, 58:1781-1793.
30. Lynch JD: Origins of the high Andean herpetological fauna. Págs. In HighAltitude Tropical Biogeography. Edited by: Vuilleumier F, Monasterio M.Oxford: Oxford University Press; 1986:478-499.
31. Santos JC, Coloma LA, Summers K, Caldwell JP, Ree R, Cannatella DC:Amazonian amphibian diversity is primarily derived from late MioceneAndean lineages. PLOS Biol 2009, 7:0448-0461.
32. Killeen TJ, Douglas M, Consiglio T, Jørgensen PM, Mejia J: Dry spots andwet spots in the Andean hotspot. Journal of Biogeography 2007,34(8):1357-1373.
33. Hoorn C, Wesselingh FP, ter Steege H, Bermudez MA, Mora A, et al:Amazonia through time: Andean uplift, climate change, landscapeevolution, and biodiversity. Science 2010, 330:927-931.
34. Bush M, Lovejoy T: Amazonian conservation: pushing the limits ofbiogeographical knowledge. Journal of Biogeography 2007, 34:1291-1293.
35. Rodriguez LO, Young KR: Biological diversity of Peru: determining priorityareas for conservation. Ambio 2000, 29:329-337.
36. Fjeldså J, Alvarez MD, Lazcano JM, Leon B: Illicit crops and armed conflictas constraints on biodiversity conservation in the Andes region. Ambio2005, 34:205-211.
37. Fjeldså J, Lambin E, Mertens B: Correlation between endemism and localecoclimatic stability documented by comparing Andean birddistributions and remotely sensed land surface data. Ecography 1999,22:63-78.
38. Hellmayr CE: Ueber neue und selteneVögel aus Südperu. Verh OrnitholGes Bayern 1912, 11:159-163.
39. Müller P: The dispersal centers of terrestrial vertebrates in theNeotropical realm. Biogeographica 1973, 2:1-244.
40. Stattersfield AJ, Crosby MJ, Long AJ, Wege DC: Endemic bird areas of theworld. Cambridge, UK.: BirdLife International; 1998.
41. Pacheco V, Quintana HL, Hernandez PA, Paniagua L, Vargas J, Young BE:Mammals. In Endemic species distributions on the east slope of the Andes inPeru and Bolivia Edited by: Young BE. Arlington, Virginia: NatureServe 2007,40-45.
42. Pacheco V: Mamíferos del Perú. In Diversidad y conservación de losmamíferos neotropicales. Edited by: Ceballos; G, Simonetti J. Mexico City,Mexico. CONABIO-UNAM; 2002:586.
43. Doan TM, Arizábal W: Microgeographical variation in species compositionof the herpetofaunal communities of Tambopata region, Peru. Biotropica2002, 34:101-117.
44. Duellman WE: Distribution patterns of amphibians in South America. InPatterns of distribution of amphibians. Edited by: Duellman WE. Baltimore,MD. Johns Hopkins Univ Press; 1999:255-328.
45. Reichle S: Distribution and conservation status of Bolivian Amphibians.Germany: Rheinische Friedrich Wilhelms Universitaet; 2007.
46. Kessler M: The elevational gradient of Andean plant endemism: varyinginfluences of taxon-specific traits and topography at different taxonomiclevels. Journal Biogeography 2002, 29:1159-1166.
47. Knapp S: Assessing patterns of plant endemism in Neotropical uplands.Botanical Review 2002, 68:22-37.
48. León B, Young KR: Distribution of pteridophyte diversity and endemismin Peru. In Pteridology in perspective. Edited by: Camus; JM, Gibby; M, JohnsRJ. Kew, U.K.. Royal Botanic Garden; 1996:77-91.
49. Luteyn JL: Diversity, adaptation, and endemism in Neotropical Ericaceae:biogeographical patterns in the Vaccinieae. Botanical Review 2002,68:55-87.
50. Guisan A, Thuiller W: Predicting species distribution: offering more thansimple habitat models. Ecology Letters 2005, 8:993-1009.
51. Guisan A, Zimmermann NE: Predictive habitat distribution models inecology. Ecological Modelling 2000, 135:147-186.
52. Kremen C, Cameron A, Moilanen A, Phillips S, Beentje H, Dransfeld J,Fisher BL, Glaw F, Hijmans R, Lees D, et al: Aligning conservation prioritiesacross taxa in Madagascar with high-resolution planning tools. Science2008, 320:222-226.
53. Prendergast JR, Quinn RM, Lawton JH, Eversham BC, Gibbons DW: Rarespecies, the coincidence of diversity hotspots and conservationstrategies. Nature 1993, 365:335-337.
54. Ferrier S, Pressey RL, Barrett TW: A new predictor of the irreplaceability ofareas for achieving a conservation goal, its application to real-worldplanning, and a research agenda for further refinement. BiologicalConservation 2000, 93:303-325.
55. IUCN, Conservation International, NatureServe: Global amphibianassessment. IUCN (International Union for Conservation of Nature,Conservation International, NatureServe;, Version 1.1 2006.
56. Stephens L, Traylor ML: Ornithological gazetteer of Peru. In Museum ofComparative Zoology Edited by: University H. Boston, MA 1983.
57. Thomas O: New mammals from Peru and Bolivia, with a list of thoserecorded from the Inambari River, upper Madre de Dios. Ann Mag NatHist 1901, 7(5):148-153.
58. MaNIS/HerpNet/ORNIS: Mammal Networked Information System:Georeferencing Guidelines. 2001.
59. Hijmans RJ, Cameron SE, Parra JL, Jones PG, Jarvis A: Very high resolutioninterpolated climate surfaces for global land areas. International Journalof Climatology 2005, 25:1965-1978.
60. Farr TG, et al: The Shuttle Radar Topography Mission. Rev Geophys 2007,45(RG2004).
Swenson et al. BMC Ecology 2012, 12:1http://www.biomedcentral.com/1472-6785/12/1
Page 17 of 18

61. Hansen M, DeFries R, Townshend JR, Carroll M, Dimiceli C, Sohlberg R:Vegetation Continuous Fields, MOD44B, 2001 Percent Tree Cover,Collection 3.Edited by: Univ Maryland CP. College Park, MD 2003 .
62. Graham CH, Ferrier S, Huettman F, Moritz C, Peterson AT: Newdevelopments in museum-based informatics and applications inbiodiversity analysis. Trends in Ecology and Evolution 2004, 19:497-503.
63. Loiselle BA, Howell CA, Graham CH, Goerck JM, Brooks T, Smith KG,Williams PH: Avoiding pitfalls of using species distribution models inconservation planning. Conservation Biology 2003, 17:1591-1600.
64. Nelson BW, Ferreira C, da Silva M, Kawasaki ML: Endemism centres, refugiaand botanical collection density in Brazilian Amazonia. Nature 1990,345:714-716.
65. Elith J, Graham CH, Anderson RP, et al: Novel methods improve predictionof species’ distributions from occurrence data. Ecography 2006,29:129-151.
66. Phillips SJ, Anderson RP, Schapire RE: Maximum entropy modeling ofspecies geographic distributions. Ecological Modelling 2006, 190:231-259.
67. Hernandez PA, Franke I, Herzog SK, Pacheco V, Paniagua L, Quintana HL,Soto HA, Swensen JJ, Tovar C, Valqui TH, et al: Predicting speciesdistributions in poorly-studied landscapes. Biodiversity and Conservation2008, 17:1353-1366.
68. Hernandez PA, Graham CH, Master LL, Albert DL: The effect of sample sizeand species characteristics on performance of different speciesdistribution modeling methods. Ecography 2006, 29:773-785.
69. Wisz MS, Hijmans RJ, Li J, Peterson AT, Graham CH, Guisan A: PredictingSpecies Distributions Working Group N: Effects of sample size on theperformance of species distribution models. Diversity and Distributions2008, 14:763-773.
70. Loiselle BA, Jørgensen PM, Consiglio T, Jiménez I, Blake JG, Lohmann LG,Montiel OM: Predicting species distributions from herbarium collections:does climate bias in collection sampling influence model outcomes?Journal of Biogeography 2008, 35:105-116.
71. Pressey RL, Watts M, Ridges M, Barrett T: C-Plan conservation planningsoftware. User Manual New South Wales, Australia: New South WalesDepartment of Environment and Conservation; 2005.
72. Josse C, Navarro G, Comer P, Evans R, Faber-Langendoen D, Fellows M,Kittel G, Menard S, Pyne M, Reid M, et al: Ecological systems of LatinAmerica and the Caribbean: a working classification of terrestrialsystems. Arlington, VA: NatureServe; 2003.
73. Comer P, Faber-Langendoen D, Evans R, et al: Ecological systems of theUnited States: a working classification of U.S. terrestrial systems.Arlington, VA: NatureServe; 2003.
74. Comer P, Schulz K: Standardized ecological classification for meso-scalemapping in southwest United States. Rangeland Ecology Management2007, 60:324-335.
75. Sayre R, Bow J, Josse C, Sotomayor L, Touval J: Terrestrial ecosystems ofSouth America. In North America land cover summit: a special issue of theAssociation of American Geographers. Edited by: Campbell JC, Jones KB,Smith JH. Washington, DC; 2008:131-152.
76. Lowry J, Ramsey RD, Thomas K, et al: Mapping moderate-scale land-coverover very large geographic areas within a collaborative framework: acase study of the Southwest Regional Gap Analysis Project (SWReGAP).Remote Sensing of Environment 2007, 108(108):59-73.
77. Scott MJ, Davis F, Cusuti B, Noss R, Butterfield B, Groves C, Anderson H,Caicco S, D’Erchia F, Edwards TC, et al: GAP analysis: a geographicapproach to protection of biological diversity. Wildlife Monographs 1993,123:1-41.
78. IUCN, UNEP-WCMC: The World Database on Protected Areas (WDPA).Cambridge, UK: UNEP-WCMC; 2010.
79. Calle LJosse: Ecological Systems of the Amazon Basin of Peru and Bolivia:Classification and Mapping. Arlington, Virginia: NatureServe; 2007.
80. Ellenberg H: Vegetationsstufen in perhumiden bis perariden Bereichender tropischen Anden. Phytocoenologia 1975, , 2: 368-387.
81. Sieck M, Ibisch P, Moloney K, Jeltsch F: Current models broadly neglectspecific needs of biodiversity conservation in protected areas underclimate change. BMC Ecology 2011, 11(1):12.
82. Olson DM, Dinerstein E, Wikramanayake ED, Burgess ND, Powell GVN,Underwood EC, D’Amico JA, Itoua I, Strand HE, Morrison JC, et al: TerrestrialEcoregions of the World: A New Map of Life on Earth. Bioscience 2001,51(11):933-938.
83. Graves GR: Linearity of geographic range and its possible effect on thepopulation structure of Andean birds. Auk 1988, 105:47-52.
84. Young BE, Franke I, Hernandez PA, Herzog SK, Paniagua L, Soto A, Tovar C,Valqui T: Using spatial models to predict areas of endemism and gaps inthe protection of Andean slope birds. Auk 2009, 126:554-565.
85. Endemic species distributions on the east slope of the Andes in Peruand Bolivia. Edited by: Young BE. Arlington, VA: NatureServe; 2007:.
86. Phillips SJ, Dudík M, Elith J, Graham CH, Lehmann A, Leathwick J, Ferrier S:Sample selection bias and presence-only distribution models:implications for background and pseudo-absence data. EcologicalApplications 2009, 19(1):181-197.
87. Leon B, Pitman N, Roque J: Introducción a las plantas endémicas delPerú. Rev Peru Biol 2006, 13(2):9-25.
88. Delgado C: Is the Interoceanic Highway exporting deforestation? Master’sthesis Durham: Duke University; 2008.
89. Finer M, Jenkins CN, Pimm SL, Keane B, Ross C: Oil and Gas Projects in theWestern Amazon: Threats to Wilderness, Biodiversity, and IndigenousPeoples. PLoS ONE 2008, 3(8):e2932.
90. Fraser B: Peruvian gold rush threatens health and the environment.Environmental Science and Technology 2009, 43:7162-7164.
91. Swenson JJ, Carter CE, Delgado CI, Domec JC: Gold mining in thePeruvian Amazon: global prices, deforestation, and mercury imports.PLoS One 2010, 6(4):e18875.
92. Killeen TJ, Calderon V, Soriana L, Quezeda B, Steininger MK, Harper G,Solorzano LA, Tucker TJ: Thirty years of land-cover change in Bolivia:exponential growth and no end in sight. Ambio 2007, 36:600-606.
93. Margules CR, Pressey RL: Systematic conservation planning. Nature 2000,405:243-253.
94. Ferroukhi L: Municipal forest management in Latin America. Bogor,Indonesia.: CIFOR and IDRC; 2003.
95. Groves CR, Jensen DB, Valutis LL, Redford KH, Shaffer ML, Scott JM,Baumgartner JV, Higgins JV, Beck MW, Anderson MG: Planning forbiodiversity conservation: putting conservation science into practice.Bioscience 2002, 52:499-512.
96. Parmesan C: Ecological and evolutionary responses to recent climatechange. Annual Review Ecology Systematics 2006, 37:637-669.
97. Williams P, Hannah L, Andelman S, Midgley G, Araújo M, Hughes G,Manne L, Martinez-Meyer E, Pearson R: Planning for climate change:identifying minimum dispersal corridors for the Cape Proteaceae.Conservation Biology 2005, 19:1063-1074.
98. Feeley KJ, Silman MR, Bush MB, Farfan W, Cabrera KG, Malhi Y, Meir P,Revilla NS, Quisiyupanqui MNR, Saatchi S: Upslope migration of Andeantrees. Journal of Biogeography 2011, 38(4):783-791.
99. Forero-Medina G, Terborgh J, Socolar SJ, Pimm SL: Elevational Ranges ofBirds on a Tropical Montane Gradient Lag Behind WarmingTemperatures. PLoSOne 2011, 6(12):e28535.
100. Magrin G, Gay García C, Cruz Choque D, Giménez JC, Moreno AR, Nagy GJ,Nobre C, Villamizar A: Latin America. Climate change 2007: impacts,adaptation and vulnerability. In Climate change 2007: impacts, adaptationand vulnerability. Edited by: Parry; ML, Canziani; OF, Palutikof; JP, Linden;PJvd, Hanson CE. Cambridge, U.K. Cambridge Univ Press; 2007:581-615.
101. Chan KMA, Shaw MR, Cameron DR, Underwood EC, Daily GC: ConservationPlanning for Ecosystem Services. PLOS Biol 2006, 4(11):e379..
doi:10.1186/1472-6785-12-1Cite this article as: Swenson et al.: Plant and animal endemism in theeastern Andean slope: challenges to conservation. BMC Ecology 201212:1.
Swenson et al. BMC Ecology 2012, 12:1http://www.biomedcentral.com/1472-6785/12/1
Page 18 of 18