Dry spots and wet spots in the Andean hotspot
17
SPECIAL ISSUE Dry spots and wet spots in the Andean hotspot Timothy J. Killeen 1 *, Michael Douglas 2 , Trisha Consiglio 3 , Peter M. Jørgensen 3 and John Mejia 4 1 Centre for Applied Biodiversity Science at Conservation International, 1919 M Street NW, Washington, DC 20036, USA, 2 National Severe Storms Laboratory/NOAA, National Weather Center, 120 David L. Boren Blvd, OK 73072, USA, 3 Missouri Botanical Garden, PO Box 299, St Louis, MO 63166-0299, USA and 4 CIMMS/NOAA-Univ. of Oklahoma, National Weather Center, 120 David L. Boren Blvd, OK 73072, USA *Correspondence: Timothy J. Killeen, Centre for Applied Biodiversity Science at Conservation International, 1919 M Street NW, Washington, DC 20036, USA. E-mail: [email protected] ABSTRACT Aim To explain the relationship between topography, prevailing winds and precipitation in order to identify regions with contrasting precipitation regimes and then compare floristic similarity among regions in the context of climate change. Location Eastern slope of the tropical Andes, South America. Methods We used information sources in the public domain to identify the relationship between geology, topography, prevailing wind patterns and precipitation. Areas with contrasting precipitation regimes were identified and compared for their floristic similarity. Results We identify spatially separate super-humid, humid and relatively dry regions on the eastern slope of the Andes and show how they are formed by the interaction of prevailing winds, diurnally varying atmospheric circulations and the local topography of the Andes. One key aspect related to the formation of these climatically distinct regions is the South American low-level jet (SALLJ), a relatively steady wind gyre that flows pole-ward along the eastern slopes of the Andes and is part of the gyre associated with the Atlantic trade winds that cross the Amazon Basin. The strongest winds of the SALLJ occur near the ‘elbow of the Andes’ at 18° S. Super-humid regions with mean annual precipitation greater than 3500 mm, are associated with a ‘favourable’ combination of topography, wind-flow orientation and local air circulation that favours ascent at certain hours of the day. Much drier regions, with mean annual precipitation less than 1500 mm, are associated with ‘unfavourable’ topographic orientation with respect to the mean winds and areas of reduced cloudiness produced by local breezes that moderate the cloudiness. We show the distribution of satellite- estimated frequency of cloudiness and offer hypotheses to explain the occurrence of these patterns and to explain regions of anomalously low precipitation in Bolivia and northern Peru. Floristic analysis shows that overall similarity among all circumscribed regions of this study is low; however, similarity among super- humid and humid regions is greater when compared with similarity among dry regions. Spatially separate areas with humid and super-humid precipitation regimes show similarity gradients that are correlated with latitude (proximity) and precipitation. Main conclusions The distribution of precipitation on the eastern slope of the Andes is not simply correlated with latitude, as is often assumed, but is the result of the interplay between wind and topography. Understanding the phenomena responsible for producing the observed precipitation patterns is important for mapping and modelling biodiversity, as well as for interpreting both past and future climate scenarios and the impact of climate change on biodiversity. Super- humid and dry regions have topographic characteristics that contribute to local Journal of Biogeography (J. Biogeogr.) (2007) 34, 1357–1373 ª 2007 The Authors www.blackwellpublishing.com/jbi 1357 Journal compilation ª 2007 Blackwell Publishing Ltd doi:10.1111/j.1365-2699.2006.01682.x
-
Upload
independent -
Category
Documents
-
view
0 -
download
0
Transcript of Dry spots and wet spots in the Andean hotspot
SPECIALISSUE
Dry spots and wet spots in the Andeanhotspot
Timothy J. Killeen1*, Michael Douglas2, Trisha Consiglio3, Peter M.
Jørgensen3 and John Mejia4
1Centre for Applied Biodiversity Science at
Conservation International, 1919 M Street
NW, Washington, DC 20036, USA, 2National
Severe Storms Laboratory/NOAA, National
Weather Center, 120 David L. Boren Blvd, OK
73072, USA, 3Missouri Botanical Garden, PO
Box 299, St Louis, MO 63166-0299, USA and4CIMMS/NOAA-Univ. of Oklahoma,
National Weather Center, 120 David L. Boren
Blvd, OK 73072, USA
*Correspondence: Timothy J. Killeen, Centre for
Applied Biodiversity Science at Conservation
International, 1919 M Street NW, Washington,
DC 20036, USA.
E-mail: [email protected]
ABSTRACT
Aim To explain the relationship between topography, prevailing winds and
precipitation in order to identify regions with contrasting precipitation regimes
and then compare floristic similarity among regions in the context of climate
change.
Location Eastern slope of the tropical Andes, South America.
Methods We used information sources in the public domain to identify the
relationship between geology, topography, prevailing wind patterns and
precipitation. Areas with contrasting precipitation regimes were identified and
compared for their floristic similarity.
Results We identify spatially separate super-humid, humid and relatively dry
regions on the eastern slope of the Andes and show how they are formed by the
interaction of prevailing winds, diurnally varying atmospheric circulations and
the local topography of the Andes. One key aspect related to the formation of
these climatically distinct regions is the South American low-level jet (SALLJ), a
relatively steady wind gyre that flows pole-ward along the eastern slopes of the
Andes and is part of the gyre associated with the Atlantic trade winds that cross
the Amazon Basin. The strongest winds of the SALLJ occur near the ‘elbow of the
Andes’ at 18� S. Super-humid regions with mean annual precipitation greater
than 3500 mm, are associated with a ‘favourable’ combination of topography,
wind-flow orientation and local air circulation that favours ascent at certain
hours of the day. Much drier regions, with mean annual precipitation less than
1500 mm, are associated with ‘unfavourable’ topographic orientation with
respect to the mean winds and areas of reduced cloudiness produced by local
breezes that moderate the cloudiness. We show the distribution of satellite-
estimated frequency of cloudiness and offer hypotheses to explain the occurrence
of these patterns and to explain regions of anomalously low precipitation in
Bolivia and northern Peru. Floristic analysis shows that overall similarity among
all circumscribed regions of this study is low; however, similarity among super-
humid and humid regions is greater when compared with similarity among dry
regions. Spatially separate areas with humid and super-humid precipitation
regimes show similarity gradients that are correlated with latitude (proximity)
and precipitation.
Main conclusions The distribution of precipitation on the eastern slope of the
Andes is not simply correlated with latitude, as is often assumed, but is the result
of the interplay between wind and topography. Understanding the phenomena
responsible for producing the observed precipitation patterns is important for
mapping and modelling biodiversity, as well as for interpreting both past and
future climate scenarios and the impact of climate change on biodiversity. Super-
humid and dry regions have topographic characteristics that contribute to local
Journal of Biogeography (J. Biogeogr.) (2007) 34, 1357–1373
ª 2007 The Authors www.blackwellpublishing.com/jbi 1357Journal compilation ª 2007 Blackwell Publishing Ltd doi:10.1111/j.1365-2699.2006.01682.x

INTRODUCTION
The tropical Andes hotspot is the most biologically rich region
of the planet (Myers et al., 2000) and the most biologically
diverse areas within this hotspot are the eastern slopes where
humid air masses from the Amazon impinge the topographic
barrier of the Andean Cordillera. The traditional view of the
eastern slope is of rain and cloud forests that stretch from
Colombia to Argentina, with precipitation decreasing and
seasonality increasing with distance from the equator. Species
diversity in the Amazon and Andes is assumed to decrease with
increasing latitude and most systematic and biogeographical
research supports that hypothesis (Cardillo et al., 2005; ter
Steege et al., 2006). However, latitude per se is not a
mechanism for predicting species diversity, and different
abiotic and biotic mechanisms have been proposed to explain
the observed phenomenon (Hutchinson, 1959; Rhode, 1992;
Gaston, 2000; Whittaker et al., 2001).
Numerous hypotheses have been presented to explain this
globally consistent trend. One group of hypotheses is based on
the large spatial extent of the tropics and the relationship
between species diversity and geographical area (Colwell &
Lees, 2000; Rosenzweig, 2003). Another group of hypotheses
focus on climate and its impact on organisms and ecosystems
(Francis & Currie, 2003). Maximum levels of solar energy and
unrestricted availability of water allow tropical ecosystems to
attain optimum levels of photosynthesis; higher net primary
productivity leads to greater biomass and more individuals per
area, which allows for more species to be supported within a
landscape or region (Brown, 1984; Currie, 1991; O’Brien, 1998,
2006). The processes of speciation, particularly mutagenesis
and selection, are enhanced in the high-energy environments of
the tropics, accelerating the creation of new species (Rhode,
1992; Cardillo et al., 2005; Wright et al., 2006). Tropical
climates have enjoyed relatively constant conditions over
millennia when compared with higher latitudes; climatic
stability leads to lower extinction rates, allowing tropical
biomes to retain a greater number of species (Gaston &
Blackburn, 2000). Nonetheless, the historical importance of
Pleistocene and Tertiary climate oscillations on the Andean and
Amazonian biota is just beginning to be appreciated (Ricklefs &
Schluter, 1993; Rasanen et al., 1995; Bush et al., 2004; Mayle
et al., 2004). It is now generally accepted that patterns of
biodiversity are explained by multiple phenomena that interact
at global, regional and local scales (Gaston, 2000; Whittaker
et al., 2001). The topographic and climatic characteristics of the
eastern Andes and adjacent piedmont in Ecuador, Peru and
Bolivia provide an opportunity to study the interaction of some
of these phenomena on the distribution of biodiversity.
Precipitation and seasonality vary considerably in western
Amazonia and the adjacent foothills, and several areas of high
rainfall exist at a considerable distance from the Equator.
Several isolated dry regions exist along the eastern flank due to
a variety of topographic phenomena generally assumed to
reflect local rain shadows (Humboldt, 1807). This regional
variability in climate can be used to evaluate whether observed
patterns of biodiversity are a simple function of latitude or the
result of a more complex interaction of precipitation, season-
ality and topography. This information has practical applica-
tions for conservation planning as it can be used to stratify the
region in terms of habitat heterogeneity in the context of
climate change.
The existence of areas of both high and low rainfall along the
eastern Andean slopes has been well known to researchers
working with national climate maps (INRENA, 1975; Unzeta,
1975; Montes de Oca, 1997; Brack-Egg & Mendiola, 2000). The
advent of geographical information systems (GIS) and the
availability of large data sets have facilitated the study of
climatic phenomena at the continental scale (Lindsey, 2002),
including efforts to document the wind patterns associated
with the South American monsoon (Nogues-Paegle et al.,
2002; Marengo et al., 2004).
Understanding regional patterns of precipitation is important
for conservation science and biogeography for several reasons.
After more than 200 years of biological inventory, including a
fairly intensive effort over the last 30 years, biodiversity maps of
the tropical Andes hotspot remain incomplete. Much of the
challenge resides in the very nature of the hotspot, where
diversity and endemism are so high that it will require many
more decades of intensive collecting to map species distributions
reliably. Current information is laden with artefact and many
efforts to map and model species diversity and endemism do
little more than show collecting density (Nelson et al., 1993). In
the few cases where the results are fairly convincing, researchers
focused on a restricted area that had been subject to intensive
collecting by several collaborating institutions (Jørgensen &
Leon-Yanez, 1999; Valencia et al., 2000; Pittman et al., 2002).
The lack of reliable species data for the tropical Andes and
the adjacent, equally poorly sampled region of the western
Amazon has led conservation scientists to rely on surrogate
data, either in the form of a few well-studied taxa, such as birds
(Stotz et al., 1996; Patterson et al., 1998), butterflies (Lamas,
climatic stability and may represent ancestral refugia for biodiversity; these
regions are a conservation priority due to their unique climatic characteristics and
the biodiversity associated with those characteristics.
Keywords
Biodiversity, conservation biogeography, dry forest, latitudinal diversity gradi-
ents, Pleistocene refugia, precipitation patterns, rain forest, tropical Andes,
water-energy dynamics.
T. J. Killeen et al.
1358 Journal of Biogeography 34, 1357–1373ª 2007 The Authors. Journal compilation ª 2007 Blackwell Publishing Ltd

1994), mosses (Churchill et al., 1995) and aroids (Vargas et al.,
2004) or more commonly on general descriptions of vegetation
types (Hueck & Siebert, 1972; Navarro & Maldonado, 2002;
Josse et al., 2003). One of the most widely used systems is
based on a subjective classification of geomorphology, veget-
ation cover, precipitation levels and ‘expert knowledge’ (Olson
& Dinerstein, 1998). While improving biological inventory
data is a top priority, conservation planners must continue to
rely on surrogate data to develop conservation strategies. Data
about environmental phenomena are especially important
because they can be used not only to characterize regions but
also to improve and refine models that propose to depict
species ranges based on existing observational data and the
environmental parameters associated with these data
(Stockwell & Peters, 1999).
One incentive for refining species distribution models is to
predict the impact of climate change on species ranges; the
goal is to identify species that face the greatest risk over the
short or medium term. However, interpreting how climate
change might impact upon a species requires an understand-
ing of regional weather patterns, particularly where topogra-
phy or edaphic phenomena constrain ecosystem function and
species distributions. Global change will be manifest not just
by shifts in temperatures but also by changes to wind and
ocean currents, precipitation patterns and cloud formation
(Cox et al., 2000; Houghton et al., 2001). Such basic changes
will probably be amplified by altered land use, simplification
of habitat structure (Shukla et al., 1990) and forest degrada-
tion (Laurance et al., 2001; Werth & Avissar, 2002; Nepstad
et al., 2004). Regional climate change models nested within
global climate models are being developed, but these will
require further interpretation to identify the potential impact
of climate change at the regional level.
The weather over the Amazon and along the Andes is a
good example of how wind patterns and topography are
responsible for creating the precipitation patterns that define
the natural ecosystems of the region. Understanding the
relationships between topography, wind and precipitation is
essential to decipher the nature of past climates and
ecosystems, to understand and map the current distribution
of species and to model how future change will impact upon
conservation strategies. In this study, we describe the
relationship between topography, wind and precipitation
and use climate data derived from multiple sources to
validate that descriptive model. We postulate that the
distribution of plant species on the eastern slope of the
Andes and adjacent regions of the western Amazon is
constrained by precipitation gradients that are independent
of a latitudinal gradient and test that hypothesis using
floristic data based on plant collections.
INFORMATION SOURCES
We use information derived from three public-domain data
sets that have been made available over the past several years.
Topographic data consisted of digital terrain elevation data
(DTED) collected by the NASA Shuttle Radar Topography
Mission (SRTM); the continental mosaic was compiled at the
Centre for Applied Biodiversity Science at Conservation
International using data downloaded from the EROS Data
Centre (Fig. 1a). The precipitation data are from the WorldC-
lim grid (Hijmans et al., 2004), which is a 1-km interpolation
from 50 years of ground station data (Fig. 1b,c). We compared
the WorldClim data set with GOES-8 satellite imagery
available from public websites (http://goes.gsfc.nasa.gov/) and
which have been collated into summary data sets spanning
2 years (Figs 2 & 3).
The remote sensing data measure the temperature of the
Earth’s surface; the coldest temperatures are those associated
with cloud-tops; the colder the temperature, the higher the
altitude of the cloud-top. In the tropics, cold clouds are
associated with active deep convection (thunderstorms), thus
a high frequency of cold clouds is an indication of heavy
rainfall. Data are summarized by showing the frequency of
pixels colder than a certain threshold value. Figure 3 shows
the frequency of days over the Neotropics where the
threshold value temperature was exceeded for a given value
[)12�C c. 7000 m above sea level (a.s.l.); )38�C c. 10,000 m
a.s.l.; )65�C c. 14,000 m a.s.l.]; high values indicate increased
cloud frequency at that altitude. The )12�C threshold
registers cold surface temperatures over the altiplano and
Andean peaks during winter, so it is not as good an
indication of cloudiness as the other two threshold values.
The )38�C (235 K) threshold agrees with the widely used
GOES precipitation index (GPI); Arkin (1979) showed this
value had the highest correlation between tropical rainfall and
cloud frequency. The )65�C threshold shows where very high
cloud tops are associated with deep convective storms and
high rainfall rates.
The high frequency of high/cold clouds in the extra-
equatorial super-humid regions (Fig. 2) corresponds to the
high rainfall documented by the WorldClim data set. However,
the cloud data reveal an artefact in the WorldClim data set,
which tends to show the super-humid regions as having an
ovoid shape that extends well into the adjacent Amazonian
lowlands. The cloud-density data show that these super-humid
regions are actually ellipsoidal and are spatially associated with
the montane slopes and piedmont of the Andes. In most cases
the high-precipitation zones extend laterally on the piedmont
and upslope into the mountains further than shown in the
WorldClim data set. These discrepancies are caused by
the extrapolation of data from too few ground-based sites in
the tropical montane and lowland regions of South America
(Fig. 1c). This artefact is a potential source of spatial error for
models that rely on the WorldClim data set, particularly those
that attempt to predict species distributions based on elevation
and precipitation.
The WorldClim and satellite data sets are not in good
agreement for the high-rainfall region in eastern Ecuador.
WorldClim shows this area to have annual precipitation in
excess of 5000 mm year)1, but lacks the typical high/cold
cloud frequency characteristics of other high-precipitation
Dry spots and wet spots in the Andean hotspot
Journal of Biogeography 34, 1357–1373 1359ª 2007 The Authors. Journal compilation ª 2007 Blackwell Publishing Ltd

regions (Fig. 2). The explanation for the lack of correspon-
dence of the two independent sources of information must be
a result of the type of precipitation in Amazonian Ecuador.
The absence of a distinct maximum in the frequency of high/
cold cloudiness suggests that a significant fraction of the
precipitation in eastern Ecuador originates from clouds having
a shallower vertical extent.
The wind data come from two sources. The most widely
available source is the NCEP/NCAR ‘reanalyses’ (Kalnay et al.,
1996) that have been generated at 6-h intervals using a global
prediction model and a data stream from the global meteoro-
logical observation data base (http://www.cdc.noaa.gov/in-
dex.html). The NCEP/NCAR reanalyses are used for studies of
climate variability and are considered to be of acceptable
accuracy for studies of larger-scale atmospheric circulation
(Fig. 4).
The second source of wind information comes from special
observations made during the South American low-level jet
experiment (SALLJEX) and associated data collected by the
Pan American Climate Studies programme sounding network
(PACS-SONET) (http://www.nssl.noaa.gov/projects/pacs/).
The SALLJEX observations were made in late 2002 and early
2003, and show finer-scale aspects of air flow over the region.
Additional information on the relationship between the South
American low level jet and the South American monsoon was
obtained from published summaries (Douglas et al., 1999;
Nogues-Paegle et al., 2002; Marengo et al., 2004).
The floristic data come from the TROPICOS data base at the
Missouri Botanical Garden, the world’s largest data base of plant
information that contains web-searchable records for over
980,000 plant names and nearly 2.8 million specimens (http://
mobot.mobot.org/W3T/Search/vast.html). TROPICOS is the
most comprehensive information resource for the flora of the
Andean region (Brako & Zarucchi, 1993; Jørgensen & Leon-
Yanez, 1999). TROPICOS was queried using a GIS interface to
return all georeferenced specimens that were collected in four
super-humid regions (Amazonian Ecuador, Selva Central and
Manu–Tambopata in Peru, and Chapare in Bolivia), four
intermontane dry valleys (Maranon and Apurimac–Urubamba
in Peru; La Paz and Rio Grande in Bolivia) and three
intermediate humid regions situated between the super-humid
regions (the Condor region in the Amazonas Department in
northern Peru, the Purus region in central Peru and the Madidi
region in northern Bolivia). Only specimens identified to the
species level were used in the analysis and infraspecific taxa were
treated as the same species in the floristic analysis; the list was
reviewed to exclude cultivated species and orthographic vari-
ants, as well as obvious errors in the georeferenced data.
Figure 1 (A) The topography of South America; from the SRTM
digital terrain model (NASA/JPL), the arrow indicates the elbow of
the Andes. (B) Mean annual precipitation of northern South
America, the grey scale shows precipitation from 9000 to
<200 mm year)1. The high precipitation zones are: (a) Amazonian
Ecuador (maximum precipitation > 5000–5500 mm), (b) Selva
Central in Peru (maximum precipitation > 5000–5500 mm), (c)
Manu–Tambopta in Peru (maximum precipitation > 7000 mm)
and (d) Chapare in Bolivia (maximum precipitation > 5000 mm).
(C) The climate station localities upon which the WorldClim data
set is based (Hijmans et al., 2004).
T. J. Killeen et al.
1360 Journal of Biogeography 34, 1357–1373ª 2007 The Authors. Journal compilation ª 2007 Blackwell Publishing Ltd

The floristic analysis was conducted among regions using
three separate statistical procedures. Sørensen’s similarity
index [SI ¼ 2c/(a + b)] makes pair-wise comparison, where
c is the number of shared taxa and a and b are the total number
of taxa at two separate localities. The similarity among
localities was also measured using both a detrended corres-
pondence analysis (DCA) and a canonical correspondence
analysis (CCA). The DCA partitions the variation among
ordinate axes based entirely on floristic similarity, while the
CCA is a direct gradient analysis where the ordinate axes are
weighted by taxa whose distribution are correlated with the
defined environmental parameters (ter Braak & Smilauer,
1997). In the analysis, we used three environmental para-
meters: the latitudinal centroid of each geographical region,
the mean elevation associated with the specimens from each
region and the mean annual precipitation of the geographical
region according to the WorldClim data set (Table 1).
TOPOGRAPHY, WIND AND RAIN
Starting in the late 1990s, meteorologists began to document
the wind flow patterns at Santa Cruz, Bolivia and described
what has long been known to the residents of the region;
relatively steady and strong winds blow from the north-west to
the south-east (Douglas et al., 1999). These local winds are
now known to be a manifestation of a much larger atmo-
spheric phenomenon that impacts upon many of the contin-
ent’s ecosystems east of the Andes. The winds are associated
with a major gyre that originates with the Atlantic trade winds
that pass over the Amazon Basin and recurve southward as
they near the Andes to form the South American low level jet
(SALLJ; Nogues-Paegle et al., 2002; Marengo et al., 2004). This
wind system can be viewed as a river of humid air that parallels
the Andean Cordillera, which eventually turns south-eastward
and flows towards southern Brazil, north-western Argentina
and the Atlantic Ocean.
The tropical rain forest ecosystem of the Amazon basin is
dependent on the humid trade winds that flow from the
Atlantic, transporting water from the ocean to the continent.
Rainfall associated with this moisture influx migrates season-
ally from the north-west to the south-east across the Amazon
Basin (Hastenrath, 1997), and the period with the greatest
precipitation and frequency of cold cloudiness in the south
occurs during the austral summer (Fig. 2). Water is recycled
Figure 2 Cold cloud frequency from imagery for years 2002–03 showing the seasonal shift of cloudiness over the Neotropics. Warmer
colours (orange to red) correspond to areas with the highest frequency of clouds with temperatures colder than )38�C threshold, black is
zero. Seasons are: JJA (June, July, August), SON (September, October, November), MAM (March, April, May) and DJF (December, January,
February). Cold cloud tops are associated with rainstorms and a map of cold cloud frequency is a surrogate for rainfall intensity.
Dry spots and wet spots in the Andean hotspot
Journal of Biogeography 34, 1357–1373 1361ª 2007 The Authors. Journal compilation ª 2007 Blackwell Publishing Ltd

within the Amazon Basin in the form of precipitation and
evapotranspiration and the westward-flowing trade winds
remain humid until reaching the Andean Cordillera. Until
the documentation of the SALLJ, the general assumption was
that winds continued to flow westward and precipitation
occurred as part of the orographic uplift of the trade winds
against the eastern slopes of the Andean cordillera. The aridity
of the high Andes and the Pacific Coast reinforces this view
since a rain shadow is a natural consequence of orographic rain
(Humboldt, 1807). Some of these winds at relatively high
altitudes pass through the Huancabamba Gap on the border
between Ecuador and Peru, but others are recurved towards
the south to form the SALLJ.
The impact of the SALLJ is most noticeable over eastern
Bolivia during the austral summer, when the region of
maximum rainfall is displaced southward over South America
in association with the beginning of the wet season of the
South American summer monsoon (Nogues-Paegle et al.,
2002). The SALLJ is responsible for much of the transport of
moisture from the Amazon Basin into the seasonally dry
regions of subtropical South America (Fig. 4) and is respon-
sible, together with convective processes, for much of the
annual precipitation in south central and southern Brazil, as
well as in northern Argentina and Paraguay (Nogues-Paegle
et al., 2002; Marengo et al., 2004).
The traditional view of many geographers has been of a rain
forest situated at the base of the eastern slope of the Andes
(Montgomery et al., 2001) supplied with moisture by the
Intertropical Convergence Zone (ITCZ). Mean annual preci-
pitation was assumed to decease with increasing latitude due to
the seasonal shift of the rain belt associated with the ITCZ and
the impact of increasingly pronounced dry seasons (Maslin &
Burns, 2000). Even today, routine reports from meteorological
services in Peru and Bolivia refer to the movement of the ITCZ
over the region, a concept that is not generally accepted by
research meteorologists. The compilation of better data sets
and the increased awareness of the South American summer
monsoon and the SALLJ revealed an important interaction
between topography and wind. Figure 1b shows the precipi-
tation patterns as revealed by the WorldClim data set that
show considerable variation in rainfall along the eastern slope
and piedmont of the Andes. This variation can be partially
understood when viewed in the context of the SALLJ and the
orientation of the Andes.
The Andes are generally visualized to have a north–south
orientation, but the central Andes actually form a curving arc,
the Bolivian orocline (Hinsch et al., 2002; McQuarrie, 2002).
At 18� S the Andes abruptly change orientation, forming the
‘elbow of the Andes’ (Fig. 1a). The topographic setting
associated with the Bolivian orocline is largely responsible
for channelling the SALLJ back to the east, while local
variations in topography are associated with the variations in
precipitation observed on the piedmont south of the equator
(Figs 1b & 2).
Super-humid regions in the Andean foothills and
piedmont
The impact of the low-level winds east of the Andes is best
understood when viewed in the context of the regional
Figure 3 Frequency of clouds for different temperature thresh-
olds over the Neotropics averaged over the austral summer
months of 2002 and 2003; the temperature threshold is inversely
correlated with the altitude of the cloud tops, and higher clouds
are correlated with greater precipitation. The colours orange to red
correspond to highest frequency of clouds with temperatures that
are colder than the three temperature thresholds. The areas with
the highest frequency of coldest clouds correspond to the regions
with highest rainfall. Data derived from the GOES-8 satellite.
T. J. Killeen et al.
1362 Journal of Biogeography 34, 1357–1373ª 2007 The Authors. Journal compilation ª 2007 Blackwell Publishing Ltd

geological and topographic setting. Due to its equatorial
location, the piedmont and foothills in Ecuador receive cross-
Amazonian trade wind flow all year round and, consequently,
are one of the wettest regions within the Amazon Basin.
However, there are three additional well-defined and separate
high-rainfall areas situated well to the south of the equator that
have values of mean annual precipitation in excess of 3500 mm
and up to 6000 mm in places. These sites include the foothills
north-east of central Peru (Selva Central), the Manu–Tam-
bopata region in southern Peru and the Chapare region of
Bolivia (Fig. 1b). Between each of these four high-precipitation
regions there are extensive zones on the piedmont and in the
adjacent foothills where mean annual precipitation rarely
exceeds 2500 mm.
The SALLJ is a dominant climatic feature along the eastern
slopes of the central Andes and over the south-west Amazon
Basin (Marengo et al., 2004). The mean wind velocity and the
frequency of windy days increase between 12 and 18� S; this
wind pattern is associated with the two southern very-high
rainfall zones in Manu–Tambopata and Chapare. Both super-
humid regions are associated with mountain ranges with a
more east–west orientation with regard to mean wind flow,
and present relatively abrupt vertical profiles rising between
4000 and 5000 m over a horizontal distance that is only
50–80 km wide. Consequently, winds have a considerable
upslope component that results in high annual precipitation.
In adjacent regions, where the topographic contours are more
nearly parallel to mean wind flow, there is less rainfall (Fig. 4).
At 18� S, the orientation of the Andes radically changes, but
the SALLJ winds continue to flow to the south-east away from
the Andes. The south-eastward flow descends in the lee of the
high terrain, the subsiding air suppresses cloud development,
and this leads to dramatic decrease in precipitation to the
south of Santa Cruz (Figs 1 & 2).
The high rainfall in the regions noted above is not fully
explained by the mean wind flows and topographic orientation
during the warm season months; cold cloud tops are registered
in the early morning in high-precipitation regions (Figs 5 & 6).
This observation suggests that much of the rainfall in these wet
spots is due to early morning precipitation on the piedmont
adjacent to the mountain slopes, whereas the precipitation at
higher terrain appears to maximize during the afternoon
hours.
The regions of highest rainfall and cloudiness (Chapare, near
Manu–Tambopata, central Peru) are all regions where the
maximum precipitation occurs in the early morning hours.
The diurnal cycle composites (Fig. 5) suggest that nocturnal
drainage flows from surrounding higher terrain are associated
with the initiation of convective storms, a mechanism that has
been described for other tropical regions. Descent along the
sloping terrain in the early morning requires compensatory
rising motions over the adjacent piedmont; with enough
lifting, saturation of the unstable air leads to the development
of convective storms that persist until a few hours after sunrise.
Thus an additional reason for the enhancement of precipita-
tion in wet spots may be due to favourable configurations of
Figure 4 Moisture flux patterns over the
western Amazon and central Andes. The
length of the moisture flux vectors is pro-
portional to magnitude of the moisture,
while the direction of the vectors gives the
direction of the prevailing wind. The South
American low-level jet (SALLJ) flows from
the north-west over eastern Bolivia all year,
but is strongest during the austral winter. The
seasonal mean wind speeds (contours, in
m s)1) show the strong trade winds entering
from the Atlantic with significant recurvature
to the south throughout the year (vectors).
However, wind flow occurs over the Andes at
the Huancabamba Gap throughout the year.
Data are from the NCEP/NCAR reanalyses
and represent the period 1950–2003. The
850 mbar level is approximately 1500 m
above sea level and is near the level of
maximum winds of the SALLJ.
Dry spots and wet spots in the Andean hotspot
Journal of Biogeography 34, 1357–1373 1363ª 2007 The Authors. Journal compilation ª 2007 Blackwell Publishing Ltd

cold-air drainage. The central Peruvian cloudiness maximum
is found over the upper parts of the Rio Pachitea, just south of
Pucallpa (8� S), a low broad valley that is surrounded by
elevated terrain except to the north. Air with a high relative
humidity must be present, so that a small ascent will produce
condensation and cloud growth. It should be noted that
although the discussion above suggests plausible mechanisms
of rainfall production that have been documented in many
tropical regions, there are no specific studies of the cited
regions. Many of the hypotheses could be directly addressed
through the application of mesoscale numerical weather
prediction models that can simulate the topographically
induced flows and associated development of convective
storms.
In summary, the interaction of the low-level winds, the
diurnal cycle of solar radiation and the particular geography of
the Andes leads to the formation of geographically separate
high-rainfall areas in southern Peru and central Bolivia.
Seasonality is also an important component when evaluating
the impact of precipitation regimes on the Andean piedmont.
The southern region of the Amazon Basin, especially the
south-western part, has a pronounced seasonality and the
zones of very high precipitation within that region are more
seasonal when compared with the equatorial Amazon. How-
ever, they remain ‘humid’ throughout the year and the
estimated evapotranspiration does not exceed precipitation
during any month (Hijmans et al., 2004).
Dry valleys, canyons and plateaus
Botanists have long been aware of the presence of dry forest
and other xeric plant communities on the eastern slope of the
Andes (Troll, 1968; Hueck & Siebert, 1972). Almost all of these
communities exist as isolated patches populated by species
with an apparent shared biogeographical history (Prado &
Gibbs, 1993; Prado, 2000; Pennington et al., 2004). However,
relating these habitats to climate maps extrapolated from
terrestrial stations has not been feasible due to the thinness of
ground-station data. Satellite-derived data have likewise not
shown precipitation patterns at sufficient resolution to enable
the identification of xeric habitats, although the interpretation
of Landsat images has had limited success in identifying some
of these regions based on land cover (Killeen et al., 2006).
Fortunately, traditional botanical field studies have been more
successful in mapping dry forest habitats within the eastern
Andes (Kessler & Helme, 2000; Pennington et al., 2000; Ibisch
et al., 2003; Cayola et al., 2005).
Dry habitats typically exist in valleys situated behind large or
high mountain barriers that create an orographic rain shadow.
Rain shadow has been commonly invoked (often erroneously)
to explain the distribution of precipitation in the Andes and
the presence of arid ecosystems in western Peru, the Bolivian
altiplano and northern Chile. However, rain shadow effects
alone do not explain the existence of all dry habitats,
particularly the extreme aridity that can be found in juxtapo-
sition with some of the world’s most humid forests on the
same side of the continental divide. The most extreme xeric
vegetation types are found within very deep canyons, and it is
not uncommon to find vegetation dominated by arboreal cacti
in canyon bottoms that are bordered upslope on both sides of
the canyon by cloud forests.
The aridity in the deep canyons along the eastern flank of
the Andean cordillera can be explained partly as a consequence
of the diurnal cycle of solar heating. During the mid-morning
to mid-afternoon hours the canyon or mountain slopes are
heated by short-wave solar radiation. The resulting difference
in density between the air in contact with the heated slopes and
the cooler air over the middle of the valley produces a pressure
difference that causes the air to move towards the heated slopes
and, by continuity, rise upwards along the slopes (Defant,
Table 1 Botanical collections and total number of identified taxa (species and subspecies) from the different climatic regions.
Latitudinal
midpoint
Mean
elevation
(m)
Mean annual
precipitation
(mm)
Number of
specimens
Number of
determined
specimens
Total number
of identified
species
Dry valleys
Maranon 6.00 1561 945 7855 3064 1632
Apurimac 13.00 1698 1431 1246 745 621
La Paz 16.10 1895 914 1681 1062 845
Rio Grande 18.50 1823 753 1825 1162 764
Humid regions
Condor Amazonas 4.40 335 2704 5295 1972 1403
Purus 11.20 212 2329 2060 1203 891
Madidi 14.50 401 2009 6360 3632 1569
Super-humid regions
Amazonian Ecuador 1.08 590 3858 30,437 21,953 4458
Selva Central 8.69 372 4269 36 29 28
Manu–Tambopata 13.00 581 4304 4552 1956 1419
Chapare 16.60 250 3916 815 555 429
Total 62,162 37,333 8320
T. J. Killeen et al.
1364 Journal of Biogeography 34, 1357–1373ª 2007 The Authors. Journal compilation ª 2007 Blackwell Publishing Ltd
1951; Atkinson, 1981). If enough moisture is initially present
in the air and the air rises far enough, it will eventually
condense as cloud (Fig. 6). The air rising up the slopes of the
canyon must be replaced by air descending over the centre of
the valley (Rampanelli et al., 2004). This descending air,
although it may start saturated, quickly becomes warmer as it
descends and the relative humidity decreases. As a conse-
quence, valley centres are generally cloud-free during the
daytime, while the surrounding ridges have a maximum in
cloudiness and rainfall during the daytime hours. Comparison
of Fig. 6(b) and (c) shows this evolution, which is similar to
that discussed by Hindman (1973). The situation is not
symmetrical, and there is no corresponding maximum in
rainfall over the centre of most valleys late at night. Instead, air
descending the mountain slopes forms a relatively cool layer
across the canyon floor and continues to descend down the
valley. As discussed in the previous section, where the valley
floor is broad and flat, and where enough low-level moisture is
present near the surface, the lifting induced by the converging
winds flowing down both sides of the valley may produce
condensation and rain. A similar process appears to be
responsible for the nocturnal maxima in rainfall and frequen-
cies of cold cloudiness along the Andean piedmont (Fig. 5a).
However, most east Andean dry canyons, especially those
linking the altiplano to the piedmont, are relatively narrow and
steep, and do not support the development of nocturnal
storms. Thus, as these canyons lack both night-time and
daytime rainfall they are usually the driest areas along the
eastern side of the Andes (Fig. 6).
The minimum of daytime clouds over deep canyons has
another effect; more sunlight reaches the surface, increasing
the potential evapotranspiration. This higher daily-averaged
solar radiation results in higher surface temperatures, lower
relative humidities and a more xeric environment in general,
compared with other areas with similar annual rainfall, but
more daytime cloudiness. This difference in mean daytime
cloudiness can be very large between the cloud-free centres of
the major Andean valleys that drain eastward and the ridge
tops, which are generally cloudy most afternoons.
Implicit in the discussion above is the assumption that the
regularity of the diurnal cycle of cloudiness and rainfall over
the region is largely responsible for the observed spatial
patterns of mean rainfall. Studies like those of Garreaud (2000)
and Garreaud & Aceituno (2001) have described intra-seasonal
to inter-annual variability of rainfall over the altiplano and
have shown that some large-scale conditions (easterly flow for
example) are more favourable than others for inducing
widespread rainfall. However, the satellite composites shown
in Fig. 6(a)–(d), together with the topography (Fig. 1c)
suggest that the detailed spatial variability of the mean
precipitation field is also strongly influenced by the interaction
of topography and the diurnally forced circulations.
It should be noted that most studies of rainfall or cloudiness
over the altiplano and surrounding regions (e.g. Garreaud,
2000; Vuille & Keimig, 2004) have used satellite imagery data
sets with a pixel size of 30 km or larger from the International
Satellite Cloud Climatology Project (ISCCO; Rossow &
Schiffer, 1991). The study of diurnal variation of cloudiness
over South America by Garreaud & Wallace (1997) modified
the original 30 km ISCCP data to a 55 km set; such coarse
resolution imagery cannot resolve even the larger canyons that
drain the eastern Andean slopes and the role of such canyons
in modulating local rainfall cannot be inferred from studies
using such data. The higher-resolution imagery used in this
study to produce Fig. 6 is needed to depict the cloudiness
gradients more accurately.
Recently, accurate and well-validated vegetation maps of the
Bolivia Andes have shown the distribution of the dry forest and
scrub vegetation in the country (Navarro & Maldonado, 2002;
Ibisch et al., 2003). Similar detailed information for Peru has
yet to be produced, but a preliminary review of Landsat images
and fieldwork shows that xeric vegetation is present in the
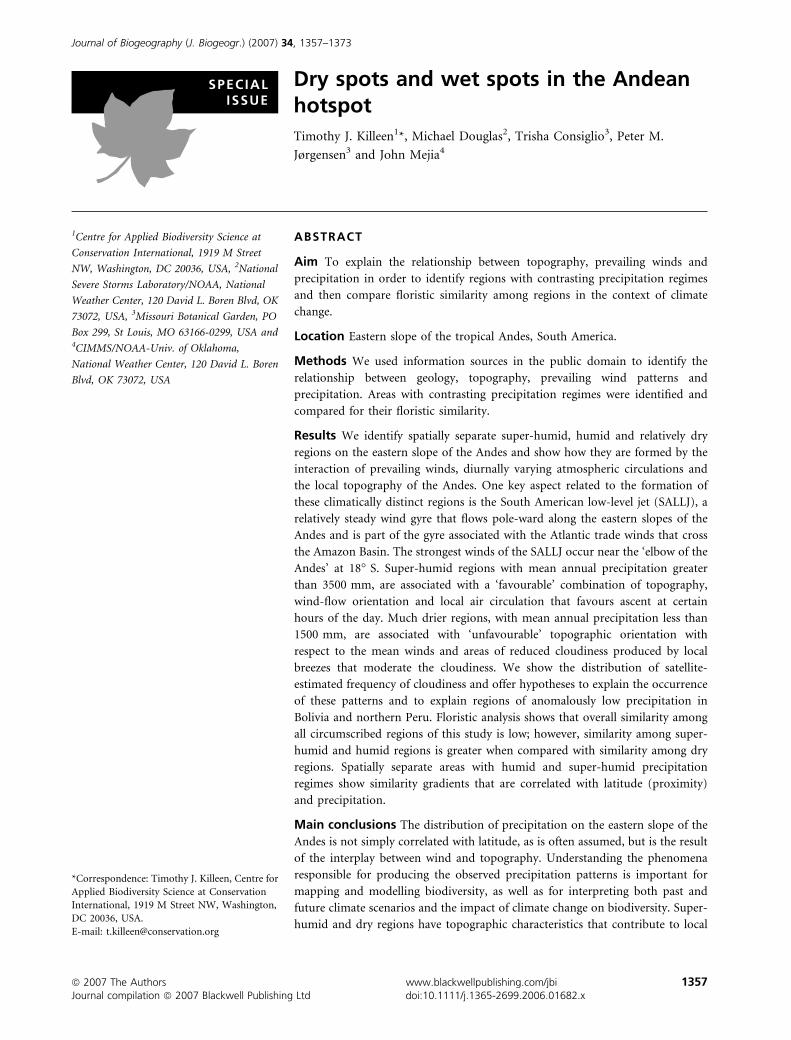
Figure 5 Frequency of clouds colder than )38�C, obtained from
averaging hourly imagery from (a) 04:00–13:00 Coordinated
Universal Time (UTC) (c. midnight to 09:00) and (b) 17:00–02:00
UTC (c. 13:00 to 22:00) for two summers (December–March
2002–03). Yellow to reddish (max.) are higher frequencies, blue to
black are lowest (black represents zero per cent of time with cold
clouds). Note am maxima are close to the mean precipitation
maxima shown in Fig. 1b, indicating that most of the rainfall in
these areas occurs in the early morning.
Dry spots and wet spots in the Andean hotspot
Journal of Biogeography 34, 1357–1373 1365ª 2007 The Authors. Journal compilation ª 2007 Blackwell Publishing Ltd

canyons of the Apurimac and Maranon rivers (Fig. 7). The two
complimentary topographic phenomena of rain shadow (pre-
vailing winds interacting with topography) and deep canyons
(topography interacting with the diurnal cycle of solar heating)
provide an effective explanation for the presence for almost all
of the dry forest habitat patches on the eastern slope of the
Andes in Peru and Bolivia. However, there is one locality, near
the Peruvian and Bolivian border, which cannot easily be
attributed to either rain shadow or deep canyon effects. A
small plateau situated adjacent to Madidi National Park is
covered by deciduous forest and grassland within a broader
region that is otherwise characterized by evergreen forest
(Killeen et al., 2006). Originally, ecologists ascribed the
formation of these dry habitats to degradation of the ecosystem
caused by past human societies, but more recent surveys have
shown it to be a naturally occurring ecosystem characterized by
several endemic bird species (Herzog & Kessler, 2002) and an
adjacent valley is covered by more than 40,000 ha of undis-
turbed dry forest habitat (Kessler & Helme, 2000). Rain
shadow has been invoked as an explanation for the develop-
ment of the forest and savanna, but an examination of the
region using a geographical information system indicates that
the ridges situated upwind are not particularly high and do not
provide a convincing explanation for the formation of such a
large dry forest formation (Killeen et al., 2006).
From a meteorological perspective, it is likely that a
satisfactory explanation of this dry forest and savanna region,
as well as other important variations in mean precipitation
seen along the eastern side of the Andes, will only come from a
systematic application of high-resolution atmospheric simula-
tion models that can reproduce the topography of the region at
high (�1 km or less) spatial resolution. By simulating the
atmospheric evolution under conditions that represent the
commonly observed large-scale flow regimes it should be
possible to reproduce the observed patterns of rainfall and
cloudiness.
Dry habitats have played an important role in the evolution
of biodiversity in the Andes. By providing a functionally
distinct vegetation type with a unique biota, and acting as an
obstacle to the dispersion of species restricted to humid
(a)
(c)
(b)
(d)
Figure 6 Mean cloudiness from 4 months (December–March 2003–04) of GOES-8 visible light imagery (brighter is more clouds) at four
times during the diurnal cycle. (a) 11:45 UTC (07:45 local), (b) 14:45 UTC (10:45 local), (c) 17:45 UTC (13:45 local) and (d) 20:45 UTC
(14:45 local). Note that the deep valleys of the central Andes become increasingly cloud free as the day progresses.
T. J. Killeen et al.
1366 Journal of Biogeography 34, 1357–1373ª 2007 The Authors. Journal compilation ª 2007 Blackwell Publishing Ltd

habitats, dry forests promote potential allopatry. In particular,
cloud forests are often surrounded by, or interposed with, dry
habitats, thus contributing to the isolation and evolution of the
numerous endemic species characteristic of these ecosystems.
Dry valleys and canyons situated on the eastern slope of the
Andes offer a particularly hospitable environment for human
settlement, being climatically benign with respect to the
abundant parasites and diseases characteristic of the humid
tropics, but enjoying ample water resources for agriculture and
domestic use. Dry valleys show extensive evidence of early
human habitation, as well as later advanced civilizations in the
pre-Hispanic era (Mesa et al., 1998).
ENVIRONMENTAL GRADIENTS
The relative importance of latitudinal and precipitation
gradients in influencing species distributions was evaluated
by comparing the floristic similarity among nine spatially
distinct regions.
The TROPICOS data base reveals that the Andes and
adjacent regions of the Amazon have not been subject to an
adequate biological survey. The super-humid region in central
Peru (Selva Central) is potentially one of the most diverse
places on the planet, yet a mere 36 collections have been
registered for this region; the super-humid Chapare region in
Bolivia is not far behind with only 865 specimens (Table 1).
Amazonian Ecuador has the highest collection density, yet this
reflects an incomplete inventory. The Manu–Tambopata
region has been the subject of intensive research for more
than 30 years, but only a moderate number of specimens were
registered in TROPICOS.
Regardless of the limitations of the data set, the 8449 species
registered for the 10 different subregions represent a sample of
the flora of the different regions, and the floristic data show
several trends. Dry valleys have floras that differ radically from
those of both humid and super-humid regions (Tables 2 & 3);
this information is already known to botanists and validates
the utility of the data set (Pennington et al., 2004). The floristic
analysis also reveals some novel features about the dry valleys
and their floras. First, dry valley floras show levels of within-
group similarity that are only marginally greater than these
regions share with adjacent humid regions. Second, northern
(Amazonian) dry valleys are more similar to one another than
they are to the southern (Chacoan) Rio Grande Valley. The
level of similarity measured for the humid and super-humid
regions reveals a geographical gradient, and that humid and
super-humid regions, although broadly similar, also have
regional differences (Table 3).
Sørensen’s index offers a simple numerical value that
measures floristic similarity, but it is a one-dimensional
measurement based on a simple comparison between two
samples. Ordination procedures permit a multi-dimensional
and multi-sample comparison and can be used to identify and
characterize gradients among samples. The ordination proce-
dures were applied to a pooled data set that included all of the
species for all 10 subregions (Fig. 8), as well as a series of
separate analyses performed for each of 37 plant families and
pteridophytes that are considered to be either diverse or
characteristic of tropical forest ecosystems, include a variety of
life forms, and which have benefited from the study of
specialist taxonomists over the past two decades (see Figs S1–
S5 in Supplementary Materials). The DCA analysis of the
pooled data set shows that dry valleys are not only different
from humid and super-humid regions, but are also relatively
dissimilar among themselves (Fig. 8). The differentiation of
dry valleys was accentuated when the data were analysed by the
CCA, in part because these areas also had mean elevations
greater than both the super-humid and humid regions. Of all
the dry valleys, the most similar to humid regions was the
Maranon Valley (Table 3), which also had the greatest number
of collections (Table 1), highlighting the limitations of the data
set and the possibility that at least some of the differences or
Figure 7 The 10 subregions included in the floristic analysis;
light grey are dry valleys, dark grey are humid regions, black are
super-humid regions; the humid and subhumid polygons were
derived from the WorldClim data set (Hijmans et al., 2004), while
the dry region polygons were derived from the SRTM digital
elevation model and identify the dry valleys of the eastern Andes
(see Fig. 1).
Table 2 Number of taxa shared among the three different cli-
matic regions studied; values in the lower left half of the matrix are
Sørensen’s similarity index.
Regions
Dry
valleys
Humid
regions
Super-humid
regions
Dry valleys 1351 856
Humid regions 0.43 1761
Super-humid regions 0.21 0.43
Total number of taxa 3242 3012 5209
Dry spots and wet spots in the Andean hotspot
Journal of Biogeography 34, 1357–1373 1367ª 2007 The Authors. Journal compilation ª 2007 Blackwell Publishing Ltd

similarities observed among regions are the result of collecting
artefacts.
Humid and super-humid areas were not discriminated as
being floristically distinct by the DCA and these six regions
were consistently grouped together with varying degrees of
similarity, thus demonstrating the broad similarity of the
humid forest flora along the Andean piedmont and the eastern
flank of the Andes. However, the CCA did discriminate among
the humid and super-humid regions for pooled data (Fig. 8),
as well as for 29 of 39 families when analysed individually (see
in Supplementary Figs S1–S5). For the pooled data, precipi-
tation was negatively correlated with the first ordinate, while
the second ordinate corresponds to a latitudinal gradient that
is evident among the humid and subhumid areas jointly, as
well as for the dry valleys separately (Fig. 8). In addition, there
is a separate trend associated with the third CCA axis that
Table 3 Taxa shared by the different regions. Boxes surround sample comparisons with similar precipitation regimes (dry, humid, super-
humid); the lower-left half of the table shows the Sørensen’s similarity index; values >0.20 are in bold face.
Maranon Apurimac La Paz
Rio
Grande
Condor/
Amazonas Purus Madidi
Amazonian
Ecuador Manu Chapare
Maranon 161 190 101 230 130 254 521 214 52
Apurimac 0.14 101 33 92 97 155 205 110 35
La Paz 0.15 0.14 145 76 56 155 184 105 38
Rio Grande 0.08 0.05 0.18 15 16 73 62 16 15
Condor Amazonas 0.15 0.09 0.07 0.01 281 356 934 397 128
Selva Central 0.10 0.13 0.06 0.02 0.24 376 518 310 140
Madidi–Tambopata 0.16 0.14 0.13 0.06 0.24 0.31 757 416 259
Amazonian Ecuador 0.17 0.08 0.07 0.02 0.32 0.19 0.25 806 256
Manu 0.14 0.11 0.09 0.01 0.28 0.27 0.28 0.27 169
Chapare 0.05 0.07 0.06 0.03 0.14 0.21 0.26 0.10 0.18
Total 1632 621 845 764 1403 891 1569 4458 1419 429
Figure 8 Depiction of the floristic similarities using detrended correspondence analysis (DCA) and canonical correspondence analysis
(CCA); the analyses were based on the presence or absence of 8318 species in 10 geographical regions defined by precipitation regimes (see
Fig. 7 & Table 1); symbols are geographical regions and radiating lines in the CCA plot depict the direction and strength of environmental
variables. Monte Carlo test results for the CCA eigenvalues were P ¼ 0.03 (axis 1), 0.03 (axis 2) and 0.07 (axis 3) and for species–
environment correlations were P ¼ 0.04 (axis 1), 0.04 (axis 2) and 0.08.
T. J. Killeen et al.
1368 Journal of Biogeography 34, 1357–1373ª 2007 The Authors. Journal compilation ª 2007 Blackwell Publishing Ltd
demonstrates that super-humid regions are different in their
floristic composition when compared with adjacent humid
regions and that this difference is at least partially explained by
precipitation.
In summary, the CCA showed that there are measurable
differences in the floristic composition of dry, humid and
super-humid regions and that these differences can be
attributed to latitude and precipitation, as well as elevation.
Dry valleys were discriminated using both the DCA and CCA;
humid and super-humid regions showed greater floristic
similarity, but were discriminated by the CCA when latitude
and precipitation were incorporated into the analysis. We
identified two separate – but related – biodiversity gradients,
one is correlated with geographical proximity, as measured by
latitude, and the other is correlated with precipitation, which
is only partially related to latitude. Floristically inter-
mediate regions reflected their geographical position and
precipitation.
PAST AND FUTURE SCENARIOS
Knowledge that precipitation in the western Amazon Basin
and over the Andean foothills is modulated by the interaction
of prevailing winds and topography should be used to provide
a spatial component for models that attempt to explain the
consequences of different climate regimes. The SALLJ is tightly
linked to the easterly trade winds and the seasonal evolution of
the rainfall over South America; both are a natural conse-
quence of the rotation of the planet and solar radiation, neither
of which will disappear under any climate scenario. Likewise,
since the orientation of the Andes has been constant over the
past several million years, the areas of super-high rainfall and
dry valleys are also regions with a high probability of
experiencing climate stability, at least when compared with
adjacent regions.
Understanding regional patterns of precipitation is import-
ant for understanding how past climate regimes have impacted
upon the evolution and distribution of biodiversity in the
eastern Andes and western Amazon (Bush & Silman, 2004;
Mayle et al., 2004). Species diversity decreases with latitude,
and one of the assumptions underlying that hypothesis is that
high precipitation and reduced seasonality at the equator are
important drivers of increased biodiversity (Gentry, 1988;
Currie, 1991; Gaston, 2000). If so, extra-equatorial regions of
high precipitation in the tropics should likewise have higher
levels of biodiversity when compared with adjacent areas with
lower levels of precipitation. Unfortunately, the currently
available data set is not sufficiently robust to test that
hypothesis and underlies the need for both additional biolo-
gical inventory as well as the integration of data bases, so as to
make better use of existing information. Nonetheless, our
study does show that the distribution of biodiversity as
measured by similarity can also be explained by a precipitation
gradient that is independent of latitude.
The once popular refugia hypothesis posited that the humid
forests of the Amazon Basin became fragmented during the
Pleistocene and that this fragmentation was responsible for the
diversification of the Amazonian biota (Haffer & Prance,
2001). The mechanism for explaining the nature of that
fragmentation and the subsequent diversification of the
Amazonian flora was the presence of a drier and cooler
climate, which led to the expansion of savanna ecosystems and
a reduction and fragmentation of forest ecosystems. There is
little palaeoecological evidence to support the refugia hypoth-
esis (Colinvaux & de Oliveira, 2001) and the prevailing view is
that although the spatial extent of humid forest ecosystems was
much reduced during the Pleistocene, the Amazon was not
fragmented by savanna; more probably, mosaics of evergreen
to semi-deciduous tropical forest, according to local hydrology
and soils, occupied much of eastern Amazonia, with western
Amazonia retaining an evergreen forest (Bush et al., 2002,
2004; Mayle et al., 2004). Similarly, there are explanations
other than allopatric speciation that can account for the
extremely high levels of biodiversity in the Amazon (Knapp &
Mallet, 2003). Chief among these alternative viewpoints are the
very great age of the Amazon flora (Wilf et al., 2003) and the
existence of marine incursions in the Tertiary that fragmented
the South American continent (Rasanen et al., 1995; Webb,
1995; Nores, 1999).
Nonetheless, the lack of evidence to support the refugia
hypothesis as the mechanism for the evolution of Amazonian
diversity does not rule out the existence of spatial climate
variation in the Amazon during the Pleistocene. Quite to the
contrary, there is overwhelming evidence of past climate
change and of alterations in the distribution of biodiversity
(Mayle et al., 2004). The identification of climatically stable
zones of high and low precipitation provides the basis to refine
further the hypotheses regarding past climates and the
distribution of biodiversity in the Amazon and Andes. Regions
that are likely to harbour greater diversity (super-humid areas)
or increased endemism (isolated dry valleys) should be made a
priority for biological inventory. Even more importantly, the
knowledge that some areas appear to be inherently climatically
stable should be a central theme in conservation planning,
particularly in a strategically important region such as the
western Amazon and the eastern Andes. Climatic stability is an
extremely important asset and the identification of such
regions should be incorporated into the very core of conser-
vation planning.
ACKNOWLEDGEMENTS
Images were provided by the NOAA-CIRES Climate Diagnos-
tics Centre, Boulder, Colorado, from their website at http://
www.cdc.noaa.gov/. Support for this research was provided
by the Critical Ecosystem Partnership Fund (CEPF) to the
Noel Kempff Mercado Natural History Museum, and the
Moore Family Foundation (to T.J.K.), by the National Science
Foundation (grant no. 0101775) and the Taylor Fund for
Ecological Research (to P.M.J.). The NOAA’s Office of
Global Programs supported the research activities of M.D.
and J.M.
Dry spots and wet spots in the Andean hotspot
Journal of Biogeography 34, 1357–1373 1369ª 2007 The Authors. Journal compilation ª 2007 Blackwell Publishing Ltd

REFERENCES
Arkin, P.A. (1979) The relationship between fractional coverage
of high cloud and rainfall accumulations during GATE over
the B-scale array. Monthly Weather Review, 107, 1382–1387.
Atkinson, B.W. (1981) Meso-scale atmospheric circulations.
Academic Press, London.
ter Braak, C.J.F. & Smilauer, P. (1997) CANOCO for Windows
v. 4.02. Centre for Biometry Wageningen CPRO-DLO,
Wageningen.
Brack-Egg, A. & Mendiola, V.C. (2000) Ecologıa del Peru.
PNUD, Editorial Bruno, Lima.
Brako, L. & Zarucchi, J.L. (1993) Catalogue of the flowering
plants and gymnosperms of Peru, Monographs in Systematic
Botany, Vol. 45. Missouri Botanical Garden, St Louis, MO.
Brown, J.H. (1984) On the relationship between abundance
and distribution of species. The American Naturalist, 124,
255–279.
Bush, M.B. & Silman, M.R. (2004) Observations on Late
Pleistocene cooling and precipitation in the lowland Neo-
tropics. Journal of Quaternary Science, 19, 677–684.
Bush, M.B., Miller, M.C., de Oliveira, P.E. & Colinvaux, P.A.
(2002) Orbital forcing signal in sediments of two Amazo-
nian lakes. Journal of Paleolimnology, 27, 341–352.
Bush, M.B., de Oliveira, P.E., Colinvaux, P.A., Miller, M.C. &
Moreno, J.E. (2004) Amazonian paleoecological histories:
one hill three watersheds. Palaeogeography, Palaeoclimatol-
ogy, Palaeoecology, 11, 3619–3621.
Cardillo, M., Orme, C.D.L. & Owens, I.P.F. (2005) Testing for
latitudinal bias in diversification rates: an example using
New World birds. Ecology, 86, 2278–2287.
Cayola, L., Fuentes, A. & Jørgensen, P.M. (2005) Estructura y
composicion florıstica de un bosque seco subandino yun-
gueno en el Valle del Tuichi, Area Natural de Manejo In-
tegrado Madidi (La Paz, Bolivia). Ecologıa en Bolivia, 40,
396–417.
Churchill, S.P., Griffin, D., III & Lewis, M. (1995) Moss
diversity of the tropical Andes. Biodiversity and conservation
of Neotropical montane forests (ed. by S.P. Churchill, H.
Balslev, E. Forero and J.L. Luteyn), pp. 335–346. New York
Botanical Garden, New York.
Colinvaux, P.A. & de Oliveira, P.E. (2001) Amazon plant
diversity and climate through the Cenozoic. Palaeogeo-
graphy, Palaeoclimatology, Palaeoecology, 166, 51–63.
Colwell, R.K. & Lees, D.C. (2000) The mid-domain effect:
geometric constraints on the geography of species richness.
Trends in Ecology & Evolution, 15, 70–76.
Cox, P.M., Betts, R.A., Jones, C.D., Spall, S.A. & Totterdell, I.J.
(2000) Acceleration of global warming due to carbon-cycle
feedbacks in a coupled model. Nature, 408, 184–187.
Currie, D.J. (1991) Energy and large-scale patterns of animal and
plant species richness. The American Naturalist, 137, 27–49.
Defant, F. (1951) Local winds. Compendium of meteorology (ed.
by T. Malone), pp. 655–672. American Meteorological
Society, Boston, MA.
Douglas, M.W., Nicolini, M. & Celeste, S.A. (1999) Observa-
tional evidences of a Low-level jet east of the Andes during
January–March 1998. Meteorologica, 23, 63–72.
Francis, A.P. & Currie, D.J. (2003) A globally-consistent
richness-climate relationship for angiosperms. The American
Naturalist, 161, 523–536.
Garreaud, R.D. (2000) Intraseasonal variability of moisture
and rainfall over the South American altiplano. Monthly
Weather Review, 128, 3337–3346.
Garreaud, R.D. & Aceituno, P. (2001) Interannual rainfall
variability over the South American altiplano. Journal of
Climate, 14, 2779–2789.
Garreaud, R.D. & Wallace, J.M. (1997) The diurnal march of
convective cloudiness over the Americas. Monthly Weather
Review, 125, 3157–3171.
Gaston, K.J. (2000) Global patterns in biodiversity. Nature,
405, 220–227.
Gaston, K.J. & Blackburn, T.M. (2000) Pattern and processes in
macroecology. Blackwell Scientific, Oxford.
Gentry, A.H. (1988) Changes in plant community diversity
and floristic composition on environmental and geo-
graphical gradients. Annals of the Missouri Botanical Garden,
75, 1–34.
Haffer, J. & Prance, G. (2001) Climate forcing of evolution in
Amazonia during the Cenozoic: on the refuge theory of
biotic differentiation. Amazonia, 16, 579–607.
Hastenrath, S. (1997) Annual cycle of upper air circulation and
convective activity over the tropical Americas. Journal of
Geophysical Research, 102, 4267–4274.
Herzog, S.K. & Kessler, M. (2002) Biogeography and compo-
sition of dry forest bird communities in Bolivia. Journal fur
Ornithologie, 143, 171–204.
Hijmans, R.J., Cameron, S. & Parra, J. (2004) WorldClim
(v1.2.), a square kilometer resolution database of global
terrestrial surface climate. http://biogeo.berkeley.edu/.
Hindman, E.E., II (1973) Air currents in a mountain valley
deduced from the breakup of a stratus deck. Monthly
Weather Review, 101, 195–200.
Hinsch, R., Krawczyk, C.M., Gaedicke, C., Giraudo, R. &
Demuro, D. (2002) Basement control on oblique thrust sheet
evolution; seismic imaging of the active deformation front of
the Central Andes in Bolivia. Deep seismic probing of the
continents and their margins. Tectonophysics, 355, 23–39.
Houghton, J.T., Ding, Y., Griggs, D.J., Noguer, M., van der
Linden, P.J., Dai, X., Maskell, K. & Johnson, C.A. (2001)
Climate change – the scientific basis. Intergovernmental Panel
on Climate Change. Cambridge University Press, New York.
Hueck, K. & Siebert, P. (1972) Vegetationskarte von Suda-
merika. 1: 8, 000, 000. Vegetationsmonographien der ein-
zefnen Grossraume, 2a. Gustav Fischer Verlag, Stuttgart.
Humboldt, A. (1807) Essai sur la geographie des plantes.
Levrault Schoell, Paris.
Hutchinson, G.E. (1959) Homage to Santa Rosalia, or why are
there so many kinds of animals? The American Naturalist,
93, 145–159.
T. J. Killeen et al.
1370 Journal of Biogeography 34, 1357–1373ª 2007 The Authors. Journal compilation ª 2007 Blackwell Publishing Ltd

Ibisch, P.L., Beck, S., Gerkmann, B. & Carretero, A. (2003)
Ecoregiones y ecosistemas. Biodiversidad: la riqueza de
Bolivia, estado de conocimiento y conservacion (ed. by P.L.
Ibisch and G. Merida), pp. 47–88. Editorial FAN, Santa Cruz
de la Sierra.
INRENA (Instituto Nacional de Recursos Naturales) (1975)
Mapa ecologico del Peru escala 1:1 000 000 con guia explica-
tiva. INRENA, Ministerio de Agricultura, Lima.
Jørgensen, P.M. & Leon-Yanez, S. (1999) Catalogue of the
vascular plants of Ecuador, Monographs in Systematic Bot-
any, Vol. 78. Missouri Botanical Garden, St Louis.
Josse, C., Navarro, G., Comer, P., Evans, R., Faber-Langen-
doen, D., Fellows, M., Kittel, G., Menard, S., Pyne, M.,
Reid, M., Schulz, K., Snow, K. & Teague, J. (2003) Eco-
logical systems of Latin America and the Caribbean: a
working classification of terrestrial systems. NatureServe,
Arlington.
Kalnay, E., Kanamitsu, M., Kistler, R., Collins, W., Deaven, D.,
Gandin, L., Iredell, M., Saha, S., White, G., Woollen, J., Zhu,
Y., Chelliah, M., Ebisuzaki, W., Higgins, W., Janowiak, J.,
Mo, K.C., Ropelewski, C., Wang, J., Leetmaa, A., Reynolds,
R., Jenne, R. & Joseph, D. (1996) The NCEP/NCAR 40-year
reanalysis project. Bulletin of the American Meteorological
Society, 77, 437–471.
Kessler, M. & Helme, N. (2000) Floristic diversity and phy-
togeography of the central Tuichi Valley, an isolated dry
forest locality in the Bolivian Andes. Candollea, 54, 341–366.
Killeen, T.J., Siles, T.M, Soria, L. & Correa, L. (2006) Estra-
tificacion de vegetacion y cambio de uso de suelo en los
Yungas y Alto Beni de La Paz. Estudios botanicos de la region
de Madidi (ed. by P.M. Jørgensen, M.J. Macia, T.J. Killeen,
S. Churchill and S. Beck). Ecologıa en Bolivia, 40(special
edn), 32–69.
Knapp, S. & Mallet, J. (2003) Refuting refugia. Science, 300,
71–72.
Lamas, G. (1994) Megadiversidad biologica. ?‘Porque hay
tantas especies de mariposas en el Peru? Actas. Academia
National de Ciencia y Technologia, 23, 32–37.
Laurance, W.F., Cochrane, M.A., Bergen, S., Fearnside, P.M.,
Delamonica, P., Barber, C., D’Angelo, S. & Fernandes, T.
(2001) The future of the Amazon. Science, 291, 105–119.
Lindsey, R. (2002) Introduction to the large scale biosphere–
atmosphere experiment in Amazonia. Earth Observatory
Features (http://earthobservatory.nasa.gov/Study/LBA).
Marengo, J., Soares, W., Saulo, C. & Nicolini, M. (2004) Cli-
matology of the LLJ east of the Andes as derived from the
NCEP reanalyses, characteristics and temporal variability.
Journal of Climate, 17, 2261–2279.
Maslin, M.A. & Burns, S.J. (2000) Reconstruction of the
Amazon Basin effective moisture availability over the past
14,000 Years. Science, 29, 2285–2287.
Mayle, F.E., Beerling, D.J., Gosling, W.D. & Bush, M.B. (2004)
Responses of Amazonian ecosystems to climatic and atmo-
spheric CO2 changes since the last glacial maximum. Phi-
losophical Transactions of the Royal Society of London Series
B, Biological Sciences, 359, 499–514.
McQuarrie, N. (2002) Initial plate geometry, shortening vari-
ations, and evolution of the Bolivian orocline. Geology, 30,
867–870.
Mesa, J., Gisbert, T. & Mesa, C. (1998) Historia de Bolivia, 5th
edn. Gisbert y Cia. S.A., La Paz.
Montes de Oca, I. (1997) Geografıa y recursos naturales de
Bolivia, 3rd edn. EDOBOL, La Paz.
Montgomery, D.R., Balco, G. & Willet, S.D. (2001) Climate,
tectonics, and the morphology of the Andes. Geology, 29,
579–582.
Myers, N., Mittermeier, R.A., Mittermeier, C.G., da Fonseca,
G.A.B. & Kent, J. (2000) Biodiversity hotspots for con-
servation priorities. Nature, 403, 853–858.
Navarro, G. & Maldonado, M. (2002) Geografıa ecologica de
Bolivia, vegetacion y ambientes acuaticos. Centro de Ecologıa,
Simon I. Patino, Cochabamba.
Nelson, B.W., Ferreira, C.A.C., da Silva, M.F. & Kawasaki, M.L.
(1993) Endemism centres, refugia and botanical collection
density in the Brazilian Amazonia. Nature, 345, 714–716.
Nepstad, D., Lefebrve, P., Lopez da Silva, U., Tomasella, J.,
Schlesinger, P., Solorzano, L., Moutinho, P., Ray, D. & Be-
nito, J.G. (2004) Amazon drought and tree growth: a basin
wide analysis. Global Change Biology, 10, 704–717.
Nogues-Paegle, J., Mechoso, C.R., Fu, R., Berbery, E.H., Chao,
W.C., Chen, T.C., Cook, K., Diaz, A.F., Enfield, D., Ferreira,
R., Grimm, A.M., Kousky, V., Liebmann, B., Marengo, J., Mo,
K., Neelin, J.D., Paegle, J., Robertson, A.W., Seth, A., Vera,
C.S. & Zhou, J. (2002) Understanding the South American
monsoon. Progress in Pan American Climate, 27, 1–30.
Nores, M. (1999) An alternative hypothesis for the origin of
Amazonian bird diversity. Journal of Biogeography, 26, 475–
485.
O’Brien, E.M. (1998) Water-energy dynamics, climate, and
prediction of woody plant species richness: an interim
general model. Journal of Biogeography, 25, 379–398.
O’Brien, E.M. (2006) Biological relativity to water–energy
dynamics. Journal of Biogeography, 33, 1868–1888.
Olson, D.M. & Dinerstein, E. (1998) The Global 200: a
representation approach to conserving the Earth’s most
biologically valuable eco-regions. Conservation Biology, 12,
502–515.
Patterson, B.D., Stotz, D.F., Solari, S., Fitzpatrick, J.W. &
Pacheco, V. (1998) Contrasting patterns of elevation zona-
tion for birds and mammals in the Andes of south-eastern
Peru. Journal of Biogeography, 25, 593–607.
Pennington, R.T., Prado, D.A. & Pendry, C. (2000) Neo-
tropical seasonally dry forests and Pleistocene vegetation
changes. Journal of Biogeography, 27, 261–273.
Pennington, R.T., Lavin, M., Prado, D.E., Pendry, C.A., Pell, S.
& Butterworth, C.A. (2004) Neotropical seasonally dry for-
est plants show patterns of both Tertiary and Quaternary
diversification. Philosophical Transactions of the Royal Society
of London Series B, Biological Sciences, 359, 515–538.
Pittman, N.C.A., Jørgensen, P.M., Williams, R.S.R., Leon-
Yanez, S. & Valencia, R. (2002) Extinction-rate estimates for
Dry spots and wet spots in the Andean hotspot
Journal of Biogeography 34, 1357–1373 1371ª 2007 The Authors. Journal compilation ª 2007 Blackwell Publishing Ltd
a modern Neotropical flora. Conservation Biology, 16, 1427–
1431.
Prado, D.E. (2000) Seasonally dry forests of tropical South
America: from forgotten ecosystems to a new phytogeo-
graphic unit. Edinburgh Journal of Botany, 57, 437–461.
Prado, D.E. & Gibbs, P.E. (1993) Patterns of species dis-
tributions in the dry seasonal forests of South America.
Annals of the Missouri Botanical Garden, 80, 902–927.
Rampanelli, G., Zardi, D. & Rotunno, R. (2004) Mechanisms
of up-valley winds. Journal of Atmospheric Science, 61, 3097–
3111.
Rasanen, M.E., Linna, A.M., Santos, J.C.R. & Negri, F.R (1995)
Late Miocene tidal deposits in the Amazonian foreland
basin. Science, 296, 386–390.
Rhode, K. (1992) Latitudinal gradients in species diversity: the
search for the primary cause. Oikos, 65, 514–527.
Ricklefs, R.E. & Schluter, D. (1993) Species diversity: regional
and historical influences. Species diversity in ecological com-
munities: historical and geographical perspectives (ed. by R.E.
Ricklefs and D. Schluter), pp. 350–363. University of Chi-
cago Press, Chicago.
Rosenzweig, M.L. (2003) How to reject the area hypothesis of
latitudinal gradients. Macroecology: concepts and conse-
quences (ed. by T.M. Blackburn and K.J. Gaston), pp. 87–
106, Blackwell Publishing, Oxford.
Rossow, W.B. & Schiffer, R.A. (1991) ISCCP cloud data pro-
ducts. Bulletin of the American Meteorological Society, 72, 2–
20.
Shukla, J., Nobre, C. & Sellers, P. (1990) Amazon deforestation
and climate change. Science, 247, 1322–1326.
ter Steege, H., Pitman, N.C.A., Phillips, O.L., Chave, J., Saba-
tier, D., Duque, A., Molino, J.F., Pravost, M.F., Spichiger, R.,
Castellanos, H., von Hildebrand, P. & Vasquez, R. (2006)
Continental-scale patterns of canopy tree composition and
function across Amazonia. Nature, 443, 444–447.
Stockwell, D.R.B. & Peters, D. (1999) The GARP modelling
system: problems and solutions to automated spatial pre-
diction. International Journal of Geographical Information
Science, 13, 143–158.
Stotz, D.F., Fitzpatrick, J.W., Parker, T.E., III & Moskowitz,
D.K. (1996) Neotropical Birds:, ecology and conservation.
University of Chicago Press, Chicago.
Troll, C. (1968) The cordilleras of the tropical Americas. As-
pects of climatic, phytogeographical and agrarian ecology.
Colloquium geographicum. Volume 9. Geoecology of the
mountainous regions of the tropical Americas (ed. by C.
Troll), pp. 15–56. Proceedings of the UNESCO Mexico
Symposium 1966, Bonn.
Unzeta, Q. (1975) Mapa ecologica de Bolivia, memoria expli-
cativa. Ministerio de Asuntos Campesinos y Agropecuarios
(MACA), La Paz.
Valencia, R., Pitman, N., Leon-Yanez, S. & Jørgensen, P.M.
(2000) Libro rojo de las plantas endemicas del Ecuador 2000.
Herbario QCA, Pontificia Universidad Catolica del Ecuador,
Quito.
Vargas, J.H., Consiglio, T., Jørgensen, P.M. & Croat, T.B.
(2004) Modelling distribution patterns in a species-rich
plant genus Anthurium (Araceae), in Ecuador. Diversity and
Distributions, 10, 211–216.
Vuille, M. & Keimig, F. (2004) Interannual variability of
summertime convective cloudiness and precipitation in the
central Andes derived from ISCCP-B3 data. Journal of Cli-
mate, 17, 3334–3348.
Webb, D.S. (1995) Biological implications of the Middle
Miocene Amazon seaway. Science, 269, 361–362.
Werth, D. & Avissar, R. (2002) The local and global effects of
Amazonian deforestation. Journal of Geophysical Research
Atmospheres, 107, 8087.
Whittaker, R.J., Willis, K.J. & Field, R. (2001) Scale and species
richness: towards a general, hierarchical theory of species
diversity. Journal of Biogeography, 28, 453–470.
Wilf, P., Cuneo, N.R., Johnson, K.R., Hicks, J.F., Wing, S.L. &
Obradovich, J.D. (2003) High plant diversity in Eocene South
America: evidence from Patagonia. Science, 300, 122–125.
Wright, S., Keeling, J. & Gillman, L. (2006) The road from
Santa Rosalia: a faster tempo of evolution in tropical cli-
mates. Proceedings of the National Academy of Sciences of the
United States of America, 103, 7718–7722.
SUPPLEMENTARY MATERIALS
The following supplementary material is available for this
article:
Figure S1. Results of the canonical correspondence analyses
(CCA) for eight selected plant families (Acanthaceae to
Bromeliaceae).
Figures S2. Results of the canonical correspondence analyses
(CCA) for eight selected plant families (Capparidaceae to
Heliconiaceae).
Figures S3. Results of the canonical correspondence analyses
(CCA) for eight selected plant families (Lauraceae to Myrist-
aceae).
Figures S4. Results of the canonical correspondence analyses
(CCA) for eight selected plant families (Myrsinaceae to
Pteridophytes).
Figures S5. Results of the canonical correspondence analyses
(CCA) for five selected plant families (Rubiaceae to Zingib-
eraceae).
This material is available as part of the online article from:
http://www.blackwell-synergy.com/doi/abs/10.1111/j.1365-2699.
2006.01682.x
Please note: Blackwell Publishing are not responsible for the
content or functionality of any supplementary materials sup-
plied by the authors. Any queries (other than missing material)
should be directed to the corresponding author for the article.
T. J. Killeen et al.
1372 Journal of Biogeography 34, 1357–1373ª 2007 The Authors. Journal compilation ª 2007 Blackwell Publishing Ltd

BIOSKETCHES
Timothy J. Killeen is a conservation biologist who has resided in Bolivia since the early 1980s. His research interests have evolved
over the course of his career, starting with the taxonomy and ecology of grasses, later focusing on floristics, plant community ecology
and biodiversity patterns at local and regional scales; efforts to map biodiversity led to an interest in remote sensing and geographical
information systems.
Mike Douglas is a research meteorologist with a background in tropical and mesoscale meteorology. His principal focus during the
past 15 years has been on Latin American meteorology and climate, with an emphasis on observational studies. Current work is
focused towards explaining the characteristics of the observed climate of the region at small spatial scales through application of
meso-meteorological concepts.
Trisha Consiglio is a geographical information systems analyst and biodiversity scientist with the Missouri Botanical Garden. She
uses a broad array of tools including GIS, remote sensing and species distribution modelling to identify areas of plant biodiversity
and endemism. Her current work is focused on integrating these tools with plant systematics to explain patterns of plant
distributions and test ideas of niche conservatism on a regional scale.
Peter Møller Jørgensen, Danish botanist, received his PhD from the University of Aarhus in Denmark, and is currently an
Associate Curator at the Missouri Botanical Garden. He has coordinated and co-edited the Catalogue of the Vascular Plants of
Ecuador. During the past 22 years his research has focused on the flora of the tropical Andes and he is the author of many papers and
several books on this topic.
John Mejia hails from Medellin, Colombia, where he received an education in hydrology and worked on projects related to water
balance and climate forecasting. He is currerntly a PhD candidate in the meteorology department at the University of Oklahoma. His
dissertation research into aspects of the American monsoon system has involved extensive field work, analysis of satellite imagery and
other meteorological observations, and mesoscale modelling.
Editor: Mark Bush
The inspiration for this special issue on Amazonian biogeography was a meeting of the Association of Tropical Biology held in
Uberlandia, Brazil, 24–28 July 2005. The papers comprise several commissioned as an outcome of this meeting, alongside other
unsolicited submissions to the journal.
Dry spots and wet spots in the Andean hotspot
Journal of Biogeography 34, 1357–1373 1373ª 2007 The Authors. Journal compilation ª 2007 Blackwell Publishing Ltd