Planimetric Quality Assurance of the LANDMAP mosaic: methods and results
10
LANDMAP Special Session, RSS 2000, Leicester University, 12-14 September 2000 1 Planimetric Quality Assurance of the LANDMAP mosaic: methods and results Ian Dowman † , Kumar Chugani § , Kamie Kitmitto*, Jan-Peter Muller † , Alec Walker † † Department of Geomatic Engineering University College London London WC1E 6BT [email protected], [email protected], [email protected], [email protected] § Selektra Limited *Manchester Computing, University of Manchester Manchester M13 9PL [email protected] Abstract The LANDMAP project has produced orthoimages which have been geocoded with a DEM derived from Interferometric SAR. When the project is finished a mosaic of the whole of the UK will be available. In addition the DEM will be used to create orthoimage mosaics from SPOT and Landsat images. These data sets will all be validated to assess their planimetric quality. Because of the large amounts of data involved and the problems in identifying ground control points, automatic methods are desirable. This paper discusses the reference data available and methods used for the validation. At the time of writing only preliminary results are available. 1. Introduction The validation of Digital Elevation Models (DEMs) at any scale is of great importance if the data is to be used with confidence by itself or for the production of orthoimages. To carry out this task efficiently, accurate reference data is required and some automation is desirable to ensure that checks can be carried out on significant areas of the data set and that this can be done accurately. The manual selection of check points is both time consuming and prone to error. The LANDMAP project has generated a DEM of the whole of the United Kingdom and Ireland from ERS Tandem data. The DEM is being used to geocode the SAR data and to create a mosaic of the whole area. This paper is concerned with the validation of the mosaic using a number of sets of reference data. The LANDMAP products should be able to be well validated because good reference data is available, or can be acquired conveniently without expensive field campaigns. The principle methods available are the use of existing cartographic datasets and the use of GPS data captured specifically for the purpose of control and validation of the data. The initial validation is being done on geocoded SAR data by registering the image data to existing reference data. The SPOT and Landsat data will be validated also by reference to the SAR data. Hence image to map registration and image to image registration is necessary. This paper starts by discussing the reference data available, the methods used and the results. There is then some discussion on improving these methods by the introduction of automatic processes. 2. Data A number of data sets are available and are listed and described in table 1. In selecting the most suitable reference data and method of validation a number of key factors must be considered:
-
Upload
manchester -
Category
Documents
-
view
0 -
download
0
Transcript of Planimetric Quality Assurance of the LANDMAP mosaic: methods and results

LANDMAP Special Session, RSS 2000, Leicester University, 12-14 September 2000
1
Planimetric Quality Assurance of the LANDMAP mosaic:methods and results
Ian Dowman†, Kumar Chugani§, Kamie Kitmitto*, Jan-Peter Muller†, Alec Walker†
†Department of Geomatic EngineeringUniversity College London
London WC1E [email protected], [email protected], [email protected], [email protected]
§ Selektra Limited *Manchester Computing, University of ManchesterManchester M13 [email protected]
Abstract
The LANDMAP project has produced orthoimages which have been geocoded with a DEMderived from Interferometric SAR. When the project is finished a mosaic of the whole of the UKwill be available. In addition the DEM will be used to create orthoimage mosaics from SPOT andLandsat images. These data sets will all be validated to assess their planimetric quality. Becauseof the large amounts of data involved and the problems in identifying ground control points,automatic methods are desirable. This paper discusses the reference data available and methodsused for the validation. At the time of writing only preliminary results are available.
1. Introduction
The validation of Digital Elevation Models (DEMs) at any scale is of great importance if the datais to be used with confidence by itself or for the production of orthoimages. To carry out this taskefficiently, accurate reference data is required and some automation is desirable to ensure thatchecks can be carried out on significant areas of the data set and that this can be done accurately.The manual selection of check points is both time consuming and prone to error.
The LANDMAP project has generated a DEM of the whole of the United Kingdom and Irelandfrom ERS Tandem data. The DEM is being used to geocode the SAR data and to create a mosaicof the whole area. This paper is concerned with the validation of the mosaic using a number of setsof reference data.
The LANDMAP products should be able to be well validated because good reference data isavailable, or can be acquired conveniently without expensive field campaigns. The principlemethods available are the use of existing cartographic datasets and the use of GPS data capturedspecifically for the purpose of control and validation of the data. The initial validation is beingdone on geocoded SAR data by registering the image data to existing reference data. The SPOTand Landsat data will be validated also by reference to the SAR data. Hence image to mapregistration and image to image registration is necessary.
This paper starts by discussing the reference data available, the methods used and the results.There is then some discussion on improving these methods by the introduction of automaticprocesses.
2. Data
A number of data sets are available and are listed and described in table 1. In selecting the mostsuitable reference data and method of validation a number of key factors must be considered:

LANDMAP Special Session, RSS 2000, Leicester University, 12-14 September 2000
2
• the data set is very large and includes different types of terrain and different land cover;
• validation of a significant sample of the dataset can only be done if automatic tools areavailable;
• different users expect different accuracy.
Accordingly a tiered approach was adopted in which visual assessment was done on the whole areabut quantitative assessment based on selected check points was done with limited number ofpoints.
Dataset Characteristics Comments
OSCAR® Vector data set of UK roads basedon 1:50 000 digitised maps.
Useful when overlain on SAR data asfull pattern can be seen. Co-ordinates ofpoints can be extracted.
Bartholomew's Map coverage of UK derived from1:250 000 maps.
All features available but scale toosmall, and too much generalisation tobe useful for validation.
PROMAP® Ordnance Survey large scale vectordata which can generate co-ordinates of selected points with anaccuracy of between 1m and 3mdepending on area.
Accurate point data but output can onlybe manual. No definitive specificationof accuracy for each point.
Kinematic GPStraverses (Crosset al., 2000)
Traverses along roads withaccuracy of about 2.5m in X, Y,and Z with 20 spacing.
Accurate data which follows roads andalso gives elevation
Table 1. Characteristics of the data sets available.
3. Methods available
A number of traditional and new methods of validation are available, these are described and theirsuitability for LANDMAP discussed in this section.
3.1 Check points
This is the traditional way of checking map data. A number of well distributed points are chosenover the area. These should be of higher accuracy than the data. Stuttard et al (1998) suggest afactor of 1:2 as being a suitable ratio of the accuracy between control points or check points andexpected accuracy of the product.
Check point co-ordinates can be derived from existing maps, but great care must be taken in usingthis method as error will accrue from distortion of the map, generalisation at scales smaller that1:10 000 and measurement. PROMAP® is a useful tool for selecting co-ordinates because itallows the co-ordinates to be derived directly from the digital data base. No numerical output ispossible using PROMAP® and the co-ordinates would have to be entered into any analysis toolused. Stuttard et al (1998) have reported on the analysis of ERS-1 and SPOT data in this way.Co-ordinates of road intersections can also be derived from OSCAR®, using a package such asARC/Info.
The error associated with checkpoints (which can be termed a discrepancy to distinguish it from aresidual derived from a check point) can be measured at any time on the geometrically correctedimage. A residual or discrepancy is defined as:

LANDMAP Special Session, RSS 2000, Leicester University, 12-14 September 2000
3
vx = xr - xi and vy = yr - yi (1)
where xi, y i are the source co-ordinates, and xr, yr are either the re transformed co-ordinates (forresiduals) or the check point co-ordinates (for discrepancies). The vector error is given by:
2y
2xxy ν+ν=ν (2)
The total rms errors in x and y are given by:
∑=
−=n
1i
2irx )xx(
n1
rmse ∑=
−=n
1i
2iry )yy(
n1
rmse (3)
Hence, the total rmse is given by:
2y
2xxy rmsermsermse += (4)
Whilst this method gives an excellent assessment of the accuracy of the product, the task ofselecting sufficient point points with an ideal distribution is very time consuming. With SAR datathis problem is exacerbated because of the nature of the image. Linear features in SAR do notshow as continuous heavy lines and when viewed with the pixels visible it is often impossible todetermine the centre of a road intersection. Figure 1. illustrates this problem.
Figure 1. A road intersection shown at small scale with a road intersection clearly visible, andzoomed with the pixels visible. The cross has been overlain to indicate the probableposition of the intersection.
There are several methods of overcoming this problem which are discussed below.
3.2 Visual validation
A way of overcoming the time required to validate using check points and to compare the positionof linear features is to overlay the image data with features such as roads, railways, water or land

LANDMAP Special Session, RSS 2000, Leicester University, 12-14 September 2000
4
cover such as woodland. This allows a direct comparison to be made between lines, rather thanpoints. Using a data set such as OSCAR®, it also gives a rapid validation of the whole areacovered by the OSCAR® data. The same could be done with the GPS traverses and with data setssuch as the Bartholomew's data, but the latter is not accurate enough in this case. Overlaying theBartholomew's data does however aid the identification of features and allows the removal ofambiguity between roads and railways for example.
The disadvantage of overlays is that it gives no quantitative analysis. The following sectionsuggests methods of overcoming this.
3.3 Quantitative analysis of overlays
Using the overlay as a guide it should be easier to identify features such as road junctions but toassist in this a deformable cursor could be used. If the relevant section of the overlay was cut fromthe overlay layer and moved to the best fit position of the image, a position could be estimatedquickly and points which were easiest to identify could be selected and measured. An alternativemethod could be to automatically match the image with a template derived from the overlay.Klang (1997, 1998) has developed a method of automatic extraction of road junctions from SPOTdata and the matching of these with a window from the corresponding map.
3.4 Automatic registration
The ARCHANGEL European Commission 4th Framework project has developed a number oftools for matching images with maps. The basic techniques which are used are the extraction ofline and area features from image and map and then the matching of these features. The polygonis the main feature used. These are extracted from vector data by selecting features with anappropriate attribute, for example lakes, forests or field boundaries. The polygons are extractedfrom the images by segmentation which is refined by applying a registrability index to eliminatepolygons which are unlikely to give a match (Ruskoné and Dowman, 1997).
The basic techniques of matching polygons is adapted from Abbasi-Dezfouli and Freeman, (1994).Polygons are characterised by a number of parameters such as shape and area. Shape is defined bya bounding rectangle, parallel to defined axes, and also by the chain code method described byAbbasi-Dezfouli and Freeman. When this technique is used for validation no initial translation isneeded as image and reference data are in the same co-ordinate system.
Once established the corresponding polygons must then be exactly matched in order to extractconjugate points. A method of dynamic programming developed at UCL is one method of doingthis, (Newton et al, 1994). The perimeter of the feature is followed and a best fit obtained. Costsare determined by a number of measures relating the predicted edge pixel position projected intothe map and the edge pixel under consideration. The difference in gradient direction between themap boundary pixel and the edge pixel under consideration are also used as costs. The method alsoallows the detection of changes between the two polygons which may represent true change or anerror in detection, in either case such points will not be selected as conjugate. The technique makesallowance for the fact that the image may be distorted due to terrain effects or geometric effectsfrom the camera or sensor.
This method is ideal for validating orthoimages because the image and the reference data arealready registered and the use of overlays allows suitable features to be quickly selected.
3.5 Image to image registration
Once the quality of the SAR data has been established the SPOT and Landsat data can be validatedby reference to this using image to image registration. Dowman and Dare (1999) have described amethod of automatic registration of images of different types and of images with vector data. Thebasic techniques which are used are the extraction of line and area features from an image and/or amap and then the matching of these features. The polygon or patch is the main feature used as
LANDMAP Special Session, RSS 2000, Leicester University, 12-14 September 2000
5
described in section 3.4. The polygons can be extracted from the images by thresholding,homogeneous patch detection or segmentation. The technique has been used to match SAR andSPOT data and results show that registration of complete satellite images can be achieved.
4. Expected Results
The planimetric accuracy of a geocoded SAR image is dependent on many factors. These include:
• The rigor of the geocoding algorithm and available control - ERS data can be transformedwithout control, or with only 2 GCPs but RADARSAT may need more;
• Terrain - much better results are expected in flat areas;
• DEM - obviously the better the DEM the better the geocoded image;
• The landcover - this does not effect the accuracy as much as the evaluation of the accuracyas few features can be found for checking purposes.
Treibnig and Raggam (1989) have determined the standard deviation of an ideal DEM with nomeasurement error for different terrain types and different grid spacing; their results are shown intable 2.
Terrain type Grid size
10m 20m 30m 50m
Mountainous 0.64 1.16 1.65 2.57
Granite bedrock 0.33 0.52 0.68 0.97
Flat farmland 0.20 0.30 0.39 0.54
Table 2. Errors in a DEM due to variations in grid size with no measurement error.
These figures will be reflected in the accuracy of the orthoimage where the terrain has a greatsignificance and the effect of an error in the DEM will be much greater in areas of high terrain thanin flat areas.
Published results show varying accuracies. OEEPE (European Organisation for ExperimentalPhotogrammetric Research) conducted a test of the accuracy of geocoding (Dowman, 1996), inwhich a number of European organisations tested geocoded ERS SAR image against a set ofcontrol points. The results are summarised in table 3.
Organisation Rmse (m) on check points
No E N
DLR, Germany 9 9.2 4.8
Telespazio, Italy 30 17..9 18.5
ISTAR, France 27 11.4 8.0
ICC, Spain 23 17.4 18.9
Table 3. Accuracy of geocoding ERS-1 SAR from the OEEPE test.
LANDMAP Special Session, RSS 2000, Leicester University, 12-14 September 2000
6
Palà and Corbera (1994) from ICC produced a geocoded mosaic of Catalan, using a DEM with15m spacing and rmse in height of 2.5m and achieved a rmse of 24.75m in x and 26.12m in y fom24 check points.
Studdard et al (1998) reported on correction of ERS-1 data to Ordnance Survey grid co-ordinatesin a flat area in Staffordshire using polynomial correction, and found rmse errors of 58m in E,38m in N and 39m in elevation
For the LANDMAP project the pixel size in the SAR orthoimage is 1 arc second and in areas offlat to medium terrain, accuracies of less than 1 pixel would be expected. In hilly areas becauseof reduction of accuracy of the DEM and in the accuracy of the reference data, much higherfigures are expected.
5. Results
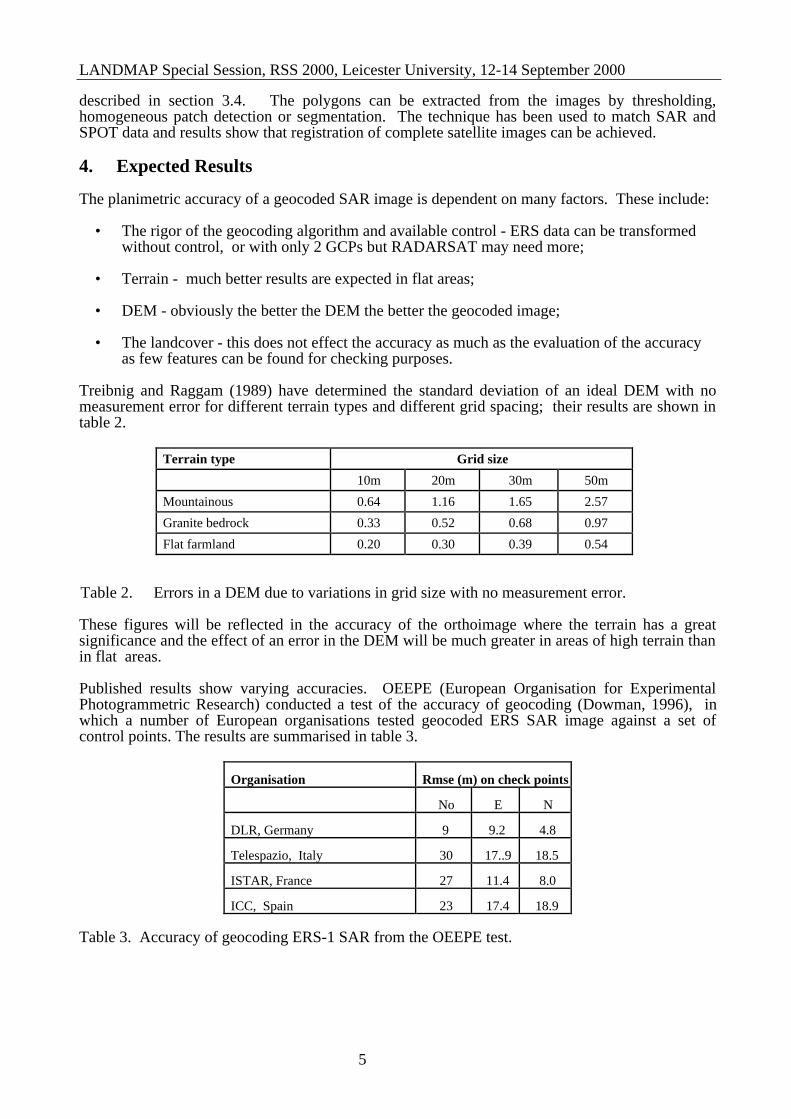
At the time of writing the validation is in progress. The use of overlays has confirmed that thesegive an excellent overall impression of the quality of the data. The OSCAR® data and the GPSdata fit very well to the orthoimages as shown in figure 2.
Figure 2. Part of the image of strip 2 showing the OSCAR data (blue) and the Bartholomew data(purple) overlain. The red cross within the box is a selected check point.

LANDMAP Special Session, RSS 2000, Leicester University, 12-14 September 2000
7
The GPS data is clearly better and shows dual carriageways and overpasses. The Bartholomewrailway data does not fit well and clearly shows the effect of generalisation.
The strips were evaluated by selecting suitable control points and comparing the co-ordinatesderived from the image and from the OSCAR® data . To date three strips have been checked.these cover the South East part of England. Figure 3 shows strip 1 which stretches from the Isle ofWight to the Humber estuary.
Figure 3. Points selected for validation on strip 1, together with their planimetric (x,y) deviation.
The discrepancies from all points are shown in table 4. which shows the discrepancies in latitudeand longitude, pixel and Easting and Northing.

LANDMAP Special Session, RSS 2000, Leicester University, 12-14 September 2000
8
Point no Strip Diff lat"
Diff long"
Diff Npixel
Diff Epixel
Diff Em
Diff Nm
a 1 0 -4 0 -4 0 -120
2 0 -5 0 -5 0 -150
b 1 1 -1 1 -1 30 -30
2 1 -2 1 -2 30 -60
c 1 1 -2 1 -2 30 -60
2 1 -2 1 -2 30 -60
d 2 1 -1 1 -1 30 -30
e 1 0 1 0 1 0 30
2 1 0 1 0 30 0
f 1 0 -1 0 -1 0 -30
2 0 -1 0 -1 0 -30
g 1 1 0 1 0 30 0
2 0 -3 0 -3 0 -90
h 1 1 3 1 3 30 90
i 1 1 1 1 1 30 30
j 1 1 -3 1 -3 30 -90
k 2 1 0 1 0 30 0
l 2 1 -1 1 -1 30 -30
m 2 0 -1 0 -1 0 -30
3a 3 2 0 2 0 60 0
3b 3 1 2 1 2 30 60
3c 3 1 -2 1 -2 30 -60
3d 3 1 3 1 3 30 90
3e 3 2 -2 2 -2 40 -40
Mean 0.79 -0.88 0.79 -0.88 22.92 -25.42
rmse 0.59 1.98 0.59 1.98 16.28 59.20
Table 4. Discrepancies on check points from 3 strips.
A number of observations can be made about the process of validation.
• It is very difficult to select point features from the SAR data with 1 arc second pixel size.Once the pixel structure becomes visible then the structure of features is lost. It tookseveral days work to identify 8 suitable control points.
• In hilly areas, features such as roads are completely lost on the image.
• Water features show up clearly but no accurate data base of the coastline is available.
The results show that the discrepancies in the Northing direction, which is approximately alongtrack, are within the expected accuracy discussed above, furthermore these errors are all positive

LANDMAP Special Session, RSS 2000, Leicester University, 12-14 September 2000
9
which suggests a systematic shift which is not inconsistent with other work on SAR without theuse of control points. The Easting, or across track discrepancies are larger and show a generaltrend to be negative, again indicating a systematic shift. Where points have been measured in twooverlapping strips the discrepancies agree well, with the exception of point g. This suggests eithera constant range error, or an error in identification which is similar in both strips. Given that thewhole process has been carried out without the use of control points, the result is remarkablygood.
A full quantitative analysis is being prepared and will be the subject of a future publication.
6. Conclusions
The work done so far indicates that good accuracy has been achieved in the mosaic derived fromERS SAR geocoded from the interferometric DEM and that once some problems with shifts havebeen resolved the road network from the OSCAR ® data will register to within one or two pixels onthe flat areas. This is the expected level of accuracy. Further checking with control pointsselected from OSCAR® data is hampered by the difficulty of selecting points from the SAR image.Further work must concentrate on the use of automatic techniques to extract points and features forregistration and checking.
7. References
Abbasi-Dezfouli M. and Freeman T, 1994. Patch matching in stereo-images based on shape.International Archives of Photogrammetry and Remote Sensing, 30(3):1-8.
Cross, P.A., R. Keenan, R., Barnes, J., Anthis, N., Chugani, K., Walker, A.H., J-P. Muller, J.-P.,Kitmitto, K. (2000) GPS Validation of IfSAR Digital Elevation Models from LANDMAP.paper in LANDMAP Special Session, RSS 2000, Leicester University.
Dowman I, 1996. The OEEPE test of geocoding ERS-1 SAR data. OEEPE Official PublicationNo 32. Frankfurt am Main. 126 pages.
Dowman I and Dare P, 1999. Automated procedures for multi sensor registration andorthorectification of satellite images. International Archives of Photogrammetry andRemote Sensing, 32(7-4-3 W6):37-44.
Klang. D., 1997. Automatic Ground Control Point Extraction for Satellite Scene Orientation. ISPRSWorkshop "From Producer to User", Boulder, USA, 7th-9th October 1997. 6 pages.
Klang D., 1998. Automatic detection of changes in road data bases using satellite imagery. GIS -between visions and applications, ISPRS Commission VI Symposium, Stuttgart, September 7-10, 1998.
Muller, J.-P., Morley, J.G. , Walker, A.H. , Barnes, J., Cross, P.A., Dowman, I.J. Mitchell, K.Smith, A., Chugani, K., Kitmitto, K. (1999), ‘The LANDMAP project for the creation ofmulti-sensor geocoded and topographic map products for the British Isles based on ERS-tandem interferometry’. Proc. Second International Workshop on ERS SAR Interferometryon "'Advancing ERS SAR Interferometry from Applications towards Operations'".10 – 12November 1999, Palais des Congrès, Liège, Belgium. http://www.esa.int/fringe99/
Muller, J.-P., Morley, J.G. , Walker, A.H. , Mitchell, K., Kim, J.-R., Barnes, J., Keenan, R., Cross,P.A., Dowman, I.J. Mitchell, K. Smith, A., Chugani, K., Kitmitto, K. ,Quarmby, N. (2000),‘The LANDMAP project for the Automated Creation and Validation of multi-resolutionorthorectified satellite image products and a 1” DEM of the British Isles from ERS tandem SARinterferometry’, paper in LANDMAP Special Session, RSS 2000, Leicester University.

LANDMAP Special Session, RSS 2000, Leicester University, 12-14 September 2000
10
Newton W, Gurney C, Sloggett D, Dowman I, 1994, An approach to automated identification offorests and forest change in remotely sensed images. International Archives ofPhotogrammetry and Remote Sensing, 30(3/2):607-614.
Palà V and Corbera J, 1994. ERS-1 rectification based on orbital and elevation data.Proceedings of Fourth International Workshop on Image Rectification of SpaceborneSynthetic Aperture SAR. Loipersdorf, Austria, 26-28 May 1993. Pp 19-25.
Ruskoné R. and Dowman I. J., 1997. Segmentation Design For An Automatic MultisourceRegistration. SPIE 11th Annual International Symposium on Aerospace/Defense Sensing,Simulation and Controls, Aerosense '97, Orlando, 20-25 April 1997. 11 pages.
Studdard M, Dare P, Batts A, Dowman I, and Seaman E, 1998. Development of methods for thequality checking of geometrically corrected remotely-sensed imagery. Report for EuropeanCommission DGVI Contract Ref JD/gc(RSAC-CON.DOC)
Triebnig, G., Raggam, J., 1989. Errors in digital elevation models. Presented at 2nd InternationalWorkshop on Image rectification techniques for spacebourne SAR. Loipersdorf, Austria.