Performance Assurance Report Performance ... - HSE
53
NOVEMBER 2014 NATIONAL PERFORMANCE ASSURANCE REPORT 1 2014 Performance Assurance Report Performance Assurance Report Performance Assurance Report Performance Assurance Report DECEMBER 2013 Health Service NOVEMBER NOVEMBER NOVEMBER NOVEMBER 2014 2014 2014 2014
-
Upload
khangminh22 -
Category
Documents
-
view
2 -
download
0
Transcript of Performance Assurance Report Performance ... - HSE

NOVEMBER 2014 NATIONAL PERFORMANCE ASSURANCE REPORT
1
2014 Performance Assurance ReportPerformance Assurance ReportPerformance Assurance ReportPerformance Assurance Report
DE
CE
MB
ER
20
13
Health Service
NOVEMBER
NOVEMBER
NOVEMBER
NOVEMBER 2
014
2014
2014
2014

NOVEMBER 2014 NATIONAL PERFORMANCE ASSURANCE REPORT
2

NOVEMBER 2014 NATIONAL PERFORMANCE ASSURANCE REPORT
3
Contents
Performance Overview ........................................................................................................ 5
Updates by Division
Quality and Patient Safety ........................................................................................................ 14
Acute Division ........................................................................................................................... 16
Palliative Care Services ............................................................................................................ 22
National Ambulance Service .................................................................................................... 25
Primary Care Division ...................................................................................................................
Primary Care .................................................................................................................. 30
Social Inclusion ............................................................................................................... 32
Primary Care Reimbursement Scheme ........................................................................... 32
Health & Wellbeing Division ..................................................................................................... 34
Social Care Division .....................................................................................................................
Disability Services ........................................................................................................... 38
Services for Older People ................................................................................................ 40
Mental Health Division .............................................................................................................. 44
Human Resources .................................................................................................................... 48
Finance Overview…………………………………………………………………………………….….51

NOVEMBER 2014 NATIONAL PERFORMANCE ASSURANCE REPORT
4

NOVEMBER 2014 NATIONAL PERFORMANCE ASSURANCE REPORT
5
Performance Overview November 2014 Overview
During the month of November hospitals continued to experience significant increases in demand for both emergency and scheduled care services. Between January and November there has been 363,016 emergency admissions, an overall increase of 6,475 (1.8%) compared to 2013.
A number of factors are impacting on patient flow within hospitals, including:
• An increase in the number of emergency admissions
• An increased number of elderly patients attending emergency departments with complex medical needs
• A high volume of delayed discharges which stood at 835 at the end of November
• An increase in the number of patients on trolleys in emergency departments who require admission to an inpatient bed.
While an additional €25m has been secured to address these pressures during 2015, €3m of this funding was allocated during November to immediately put in place additional long term care beds and a range of community supports including transitional, community and home care services. These measures will improve patient flow within hospitals by reducing the number of delayed discharges and the volume of patients waiting on trolleys in emergency departments for admission to an inpatient bed.
Community services such as Home Care Packages and Community Intervention Teams are important alternative care pathways for those who can be cared for in their own homes. Demand for these services is high. Between January and November the number of Home Care Packages provided was 13,139, 20.8% more than expected levels of activity. Similarly, demand for services provided by Community Intervention Teams is higher than expected. There have been 5,976 ED/ Hospital avoidance episodes provided between January and November, 39% ahead of the full year target.
The 4 week target for urgent colonoscopy was breached on 15 occasions during November. However, all patients had been seen by 23rd December.
The number of patients waiting greater than 13 weeks for a routine colonoscopy has grown from 583 in January to 4,879 in November. The increase within the month was 135 or 3%. A targeted initiative to address this will commence shortly.
At the end of November the outpatient waiting list was 382,008 of which 14.6% (55,733) were waiting over 52 weeks.
In October 79% of inter hospital transfers were carried out by an Intermediate Care Vehicle. This has a very positive impact on freeing up emergency ambulances and crews for emergency calls.
There has been significant improvement in the percentage of children receiving a child health developmental health check at 10 months. Performance was 91.9% at the end of November compared to 87.9% for the same period last year.
In November 98% of people requiring specialist palliative care inpatient beds received it within 7 days of referral.
The proportion of people offered an appointment and seen by the psychiatry of old age within 3 months of referral was 97% at the end of November.
There has been a 16% reduction in the number of patients waiting loner than 12 weeks for a physiotherapy assessment.
NOVEMBER 2014 NATIONAL PERFORMANCE ASSURANCE REPORT
6
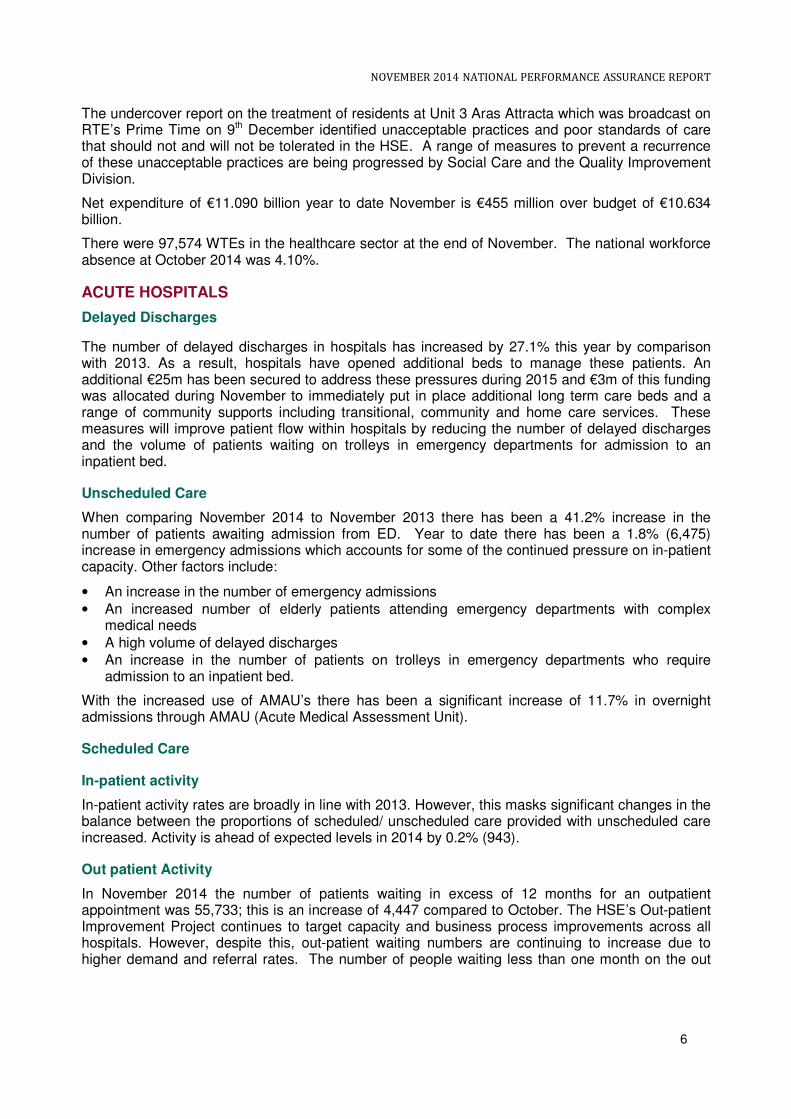
The undercover report on the treatment of residents at Unit 3 Aras Attracta which was broadcast on RTE’s Prime Time on 9th December identified unacceptable practices and poor standards of care that should not and will not be tolerated in the HSE. A range of measures to prevent a recurrence of these unacceptable practices are being progressed by Social Care and the Quality Improvement Division.
Net expenditure of €11.090 billion year to date November is €455 million over budget of €10.634 billion.
There were 97,574 WTEs in the healthcare sector at the end of November. The national workforce absence at October 2014 was 4.10%.
ACUTE HOSPITALS
Delayed Discharges
The number of delayed discharges in hospitals has increased by 27.1% this year by comparison with 2013. As a result, hospitals have opened additional beds to manage these patients. An additional €25m has been secured to address these pressures during 2015 and €3m of this funding was allocated during November to immediately put in place additional long term care beds and a range of community supports including transitional, community and home care services. These measures will improve patient flow within hospitals by reducing the number of delayed discharges and the volume of patients waiting on trolleys in emergency departments for admission to an inpatient bed.
Unscheduled Care
When comparing November 2014 to November 2013 there has been a 41.2% increase in the number of patients awaiting admission from ED. Year to date there has been a 1.8% (6,475) increase in emergency admissions which accounts for some of the continued pressure on in-patient capacity. Other factors include:
• An increase in the number of emergency admissions
• An increased number of elderly patients attending emergency departments with complex medical needs
• A high volume of delayed discharges
• An increase in the number of patients on trolleys in emergency departments who require admission to an inpatient bed.
With the increased use of AMAU’s there has been a significant increase of 11.7% in overnight admissions through AMAU (Acute Medical Assessment Unit).
Scheduled Care
In-patient activity
In-patient activity rates are broadly in line with 2013. However, this masks significant changes in the balance between the proportions of scheduled/ unscheduled care provided with unscheduled care increased. Activity is ahead of expected levels in 2014 by 0.2% (943).
Out patient Activity
In November 2014 the number of patients waiting in excess of 12 months for an outpatient appointment was 55,733; this is an increase of 4,447 compared to October. The HSE’s Out-patient Improvement Project continues to target capacity and business process improvements across all hospitals. However, despite this, out-patient waiting numbers are continuing to increase due to higher demand and referral rates. The number of people waiting less than one month on the out

NOVEMBER 2014 NATIONAL PERFORMANCE ASSURANCE REPORT
7
patient waiting list at the end of November is 60,698 which equates to 15.9% of total patients waiting.
The Out-patient Improvement Project continues to target capacity and business process improvements across all hospitals but as yet has not impacted on the increasing numbers.
Waiting Times
Adult
Adult waiting lists demonstrate that 77% (43,031) of adults were waiting less than eight months for a planned procedure in November 2014. The numbers waiting over 8 months are now 12,540 an 8% (n=904) increase on October and an increase of 10,776 patients waiting over 8 months from the end of January 2014 position. This trend is expected to continue to year end.
Paediatric
59% (3,279) of all children waiting on the elective waiting list were waiting less than twenty weeks. The numbers waiting over 20 weeks are now 2,234, a 9% (n=176) increase on October and an increase of 1,761 patients waiting over 20 weeks from the numbers reported at the end of January 2014.
The HSE is currently undertaking an analysis of growth rates in waiting list breaches to assess the additional elective service capacity required. The HSE will review options in the context of its financial cost containment plans.
GI Endoscopies
62% of patients on the GI Endoscopy Waiting List were waiting less than thirteen weeks in November 2014. The number waiting over 13 weeks at the end of November is 4,879 which is a 3% (n=135) increase on last month. The numbers waiting over 13 weeks has increased from 583 at the end of January, an increase of 4,296 patients. The HSE in partnership with NTPF is currently commencing a targeted initiative to address patients waiting over 13 weeks in Galway University Hospital, Limerick University Hospital, Tallaght Hospital, Naas Hospital, Beaumont Hospital, Connolly Hospital and Mercy University Hospital.
European Working Time Directive
Data available for November has identified 94% compliance with requirement for NCHD’s not to be rostered / work >24 hour shifts and a 56% compliance with an average 48 hour working week 12 hospitals are showing compliance with requirement for NCHD’s not to be rostered / work > 24 hour shifts and 4 hospitals are compliant with an average 48 hour working week
PALLIATIVE CARE
Access Inpatient Unit
In November 98% of specialist palliative care inpatient beds were provided within 7 days of referral (national target 94%).
Access Community Home Care
In November 88% of patients received specialist palliative care services in their place of residence (home, nursing home, non acute hospital) within 7 days of referral (national target 82%).

NOVEMBER 2014 NATIONAL PERFORMANCE ASSURANCE REPORT
8
NATIONAL AMBULANCE SERVICE
Ambulance Activity1
At the end of October, the total number of AS1 and AS2 calls received by the National Ambulance Service was 241,926, a 4% (8,744) increase over the same period in 2013. This amounts to an increase of approximately 1,000 calls per month or an average daily rate of 799 calls. Nationally there is a 5% (117) increase in the volume of ECHO calls (life-threatening cardiac or respiratory arrest) compared to the same period last year and a 10% (6,978) increase in the volume of DELTA calls.
ECHO incidents responded to within the target timeframe of 18 minutes and 59 seconds now stands at 76% while DELTA incidents are 67%. The installation of new technology upgrades enables more accurate data reporting. The NAS is in the process of replacing its entire information system with the move to a single Computer Aided Dispatch (CAD) system.
Intermediate Care Services
The Intermediate Care Service (ICS) was set up to provide a safe and timely transfer for non emergency patients when transferring between hospitals within the healthcare system or moving to step down facilities in the community. In October, 79% or approximately 3,396 of the inter hospital transfers, previously carried out by ambulances were handled by Intermediate Care Vehicles, reflecting a very positive development for the Intermediate Care Project. This initiative has a positive impact on the availability of emergency ambulances for pre hospital care and facilitates emergency ambulance personnel to focus on the core function of the delivery of pre hospital care.
Ambulance Turnaround Times
The NAS continuously monitor the turnaround times at hospitals on a national and local basis. In November, 67% of emergency ambulances were released and had their crews and vehicles available to respond to further calls within 30 minutes or less. 94% of calls had crews and vehicles clear and available within 60 minutes.
PRIMARY CARE
Community Intervention Teams
At the end of November 2014, 1,273 patients received support from the 8 CIT teams in place, bringing the number of patients provided with a service year to date to 13,375.
At the end of November, CITs exceeded the full year target of ED/ Hospital avoidance cases by 2,346 or 39%. The total number of ED/ hospital avoidance episodes is now 8,322 compared to the full year target of 5,976.
GP Out of Hours Service
• In November, 75,065 patients availed of the GP out of hours services including triage, treatment, home visits, bringing the total to 843,331year to date.
Therapy Services
• Referrals for Physiotherapy services have increased by 4.1% in 2014.
• In November the number of people waiting more than 12 weeks for a physiotherapy assessment was 6,029, down from 7,181 at the end of December 2013. This is a 16% reduction on the December 2013 number.
1 Response time data one month in arrears

NOVEMBER 2014 NATIONAL PERFORMANCE ASSURANCE REPORT
9
• Referrals for Occupational Therapy services have increased by 13.7% in 2014.
• In November the number of people waiting more than 16 weeks for an occupational therapy assessment was 7,910, down from 8,511 at the end of December 2013. This is a 7% reduction on the December 2013 number.
• The number of referrals to Speech and Language Therapy services was 44,748 up to the end of November, with 38,052 assessments carried out in the same period.
• Improved access and reductions in waiting times for Primary Care therapy services have been prioritised as additional staff are deployed under the Primary Care Development Programme and through the utilisation of HRA productivity targets.
Primary Care Reimbursement Scheme
At the end of November 2014:
• 1,771,368 people held medical cards (39% of the population). Included in these cards were 74,674 medical cards granted on discretionary grounds. The number of entirely new medical cards issued / upgraded is 117,763 year to date.
• 157,913 people hold GP visit cards. Included in these cards were 33,672 GP visit cards granted on discretionary grounds.
HEALTH AND WELLBEING
Ebola
The overall risk of a case of Ebola being imported into in Ireland is low; there have been no cases of Ebola in Ireland to date. However, the Irish health services are in a good state of preparedness in the unlikely event of a case of Ebola occurring in Ireland irrespective of other pressures on services at the time.
Planning actions and procedures to manage suspected or actual cases of Ebola in Ireland are under constant review in the light of international developments and understanding. Specific training for front line health care workers around these procedures, including the use of personal protective equipment is ongoing and is a priority for the HSE.
Delegates from all 29 receiving hospitals in Ireland attended a conference on Ebola in November, hosted and organised by the Mater Hospital in Dublin. Receiving hospitals are those identified to receive any Ebola cases in the first incidence. The all day event dealt with key aspects relating to Ebola was jointly co-ordinated by course directors, Dr Jack Lambert from the Mater Hospital and Dr Darina O’Flanagan, Director of the HSE’s Health Protection Surveillance Centre.
Child Health
• Child Health developmental screening has been provided to 5,181 children in the reporting period and 57,415 children year to date. This is 91.9% of the target group. This compares favourably with the national position for the same reporting period in 2013 (87.9%).
• Health and Wellbeing meets monthly with Area Managers to review the data and maintain focus on the targets.
Breast Cancer Screening
• 11,532 women attended for breast screening in November, bringing the YTD total to 129,972.
SOCIAL CARE
DISABILITY SERVICES
The Social Care Division held a ‘Learning Summit’ on 17th November 2014, which was attended by the vast majority of HSE and voluntary providers of residential care services. The Summit had a particular focus of the learning to date in relation to Governance from a Quality and Patient Safety

NOVEMBER 2014 NATIONAL PERFORMANCE ASSURANCE REPORT
10
perspective, and was well received by all attendees. It is intended to repeat similar exercises during 2015.
SERVICES FOR OLDER PEOPLE
• 9,423,875 hours have been provided YTD nationally, a 6% increase on the same period last year. Activity is 0.2% (17,793 hours) below the expected YTD service delivery level.
• 13,139 persons were in receipt of a home care package at end of November 2014.
• 22,618 clients are supported by the Nursing Home Support Scheme (NHSS).
• At the end of November there were 1,898 people on the national placement list for funding approval under the scheme, with an average wait time of 14 weeks. The scheme is taking on new clients within the limits of the resources available, in accordance with the legislation. The overall position remains challenging and both the Social Care and Acute Hospital division are collaborating closely in monitoring the situation.
MENTAL HEALTH
Adult Mental Health Services
In November, 76% of people offered an appointment by General Adult Community Mental Health teams nationally were seen within three months (target 75%).
97% of people offered an appointment by Psychiatry of Old Age Community Mental Health teams were seen within three months, nationally (target >95%).
CAMHs Teams
70% of accepted referrals/re-referrals to CAMHs teams nationally were offered a first appointment and seen within 3 months (target >75%).
The Child and Adolescent Mental Health Service waiting list has increased to 2,709 cases, a 7% increase on the same period last year (2,541) despite a 6% increase in referrals accepted by the service compared to the same time last. There are 376 individuals or 14% of the waiting list waiting more than 12 months. Of the 63 CAMHS teams, 59% (37) has no-one waiting more than 12 months.
Children and adolescents admitted to approved adult HSE mental health inpatient units
By the end of November, there had been 263 children and adolescents admissions, of which 179 (68%) were to age appropriate Acute Child and Adolescent Inpatient Units and 84 (32%) to approved adult mental health inpatient units, the majority as voluntary admissions with parental consent with a very small number under Section 25 of the Mental Health Act 2001. Approximately 85% of these were 16/17 years old and a third are discharged within 2 days and two thirds within a week.
HUMAN RESOURCES
Absence Rates Latest National absence rate data shows that the absence rate for October 2014 is at 4.10%.
This compares with previously published October rates of 5.59% (2008) 5.51% (2009) 4.80% (2010) 4.97% (2011) 4.74% (2012) and 4.84% (2013).
Workforce Numbers
The Health Sector is 2,679 WTEs above the current employment ceiling of 94,895 WTEs. There were 97,574 WTEs at the end of November.
Since November 2007, a reduction of 15,197 WTEs has been recorded in employment levels (-13.48%).

NOVEMBER 2014 NATIONAL PERFORMANCE ASSURANCE REPORT
11
The Nurse Graduate Programme recorded 327 placements with a 319 WTE value in November, down 26 WTEs from last month. The Support Staff Intern Scheme continues to grow with a total of 1,210 people on placement, with 1,155 WTE value.
FINANCE
Net expenditure year to date November 2014 is €11.090 billion against the available budget reported at €10.626 billion leading to a reported deficit of €464m.
The health service has experienced budget cuts / savings targets of over €3.5bn over the last 6 years which is at odds with the experience in the vast majority of OECD countries where “cuts” to health generally refer in reality to a slow-down in the rate of their cost growth rather than an actual year on year reduction.
The revenue deficit (on an income and expenditure basis) to year end for the health service is currently estimated at €510m. The supplementary estimate for 2014 will need to encompass this deficit as well as an expected over run on costs incurred by the State Claims Agency in respect of health service claims and any other technical cash/vote accounting items. This forecast takes account of our best estimate of likely cost increases to year end mitigated by our ongoing cost containment plans. It is important to stress that, as with any forecast, there is a certain degree of uncertainty particularly given the scale of the overall HSE cost base, the complexity of our services and the lack of a national financial system. For example a “margin for error” of one tenth of one per cent (0.1%) equates to close to €12m.
The arrival at this 2014 level of deficit indicates that our net costs will have risen 1.8% between 2013 and 2014 or by 0.7% if we look at the 2 year period from 2012 to 2014. However, a longer term view indicates that from 2009 to 2014 our costs will have fallen by 6.5% despite for example the growth in population of circa 3.5% and a much higher increase in the very elderly (85+ years of age) population at over 20%.
It is important to stress that in excess of €250m or around 50% of this 2014 deficit relates to budget reductions assigned to the HSE which were outside of its control and therefore not deliverable (includes €108m unspecified pay savings, €30m pensions excess etc.).
AGENCY SERVICES
HSE year to date agency costs were €311m versus €224m for the corresponding period in 2013, an increase of €87m (39%) year on year. Agency costs incurred in acute hospital services were €208m and this compares to €148m for the same period last year. The 2014 agency costs for hospitals include €90m in respect of the medical/dental pay category. Hospital agency costs overall have increased by €60m (up 41%) compared to the same period last year. This primarily reflects the diminishing capacity to recruit doctors and price increases for agency provision rather than volume growth in medical staff inputs.
However, 80% of the increase in hospital agency expenditure is in the medical and support services pay categories. These staff were already at the HRA maximum hours and therefore the hospitals did not benefit from additional hours. Cost growth and under performance in cost containment plans are also currently evident.

NOVEMBER 2014 NATIONAL PERFORMANCE ASSURANCE REPORT
12

NOVEMBER 2014 NATIONAL PERFORMANCE ASSURANCE REPORT
13
2014 Updates by DivisionUpdates by DivisionUpdates by DivisionUpdates by Division
NOVEMBER 2014 NATIONAL PERFORMANCE ASSURANCE REPORT
14
Quality and Patient Safety
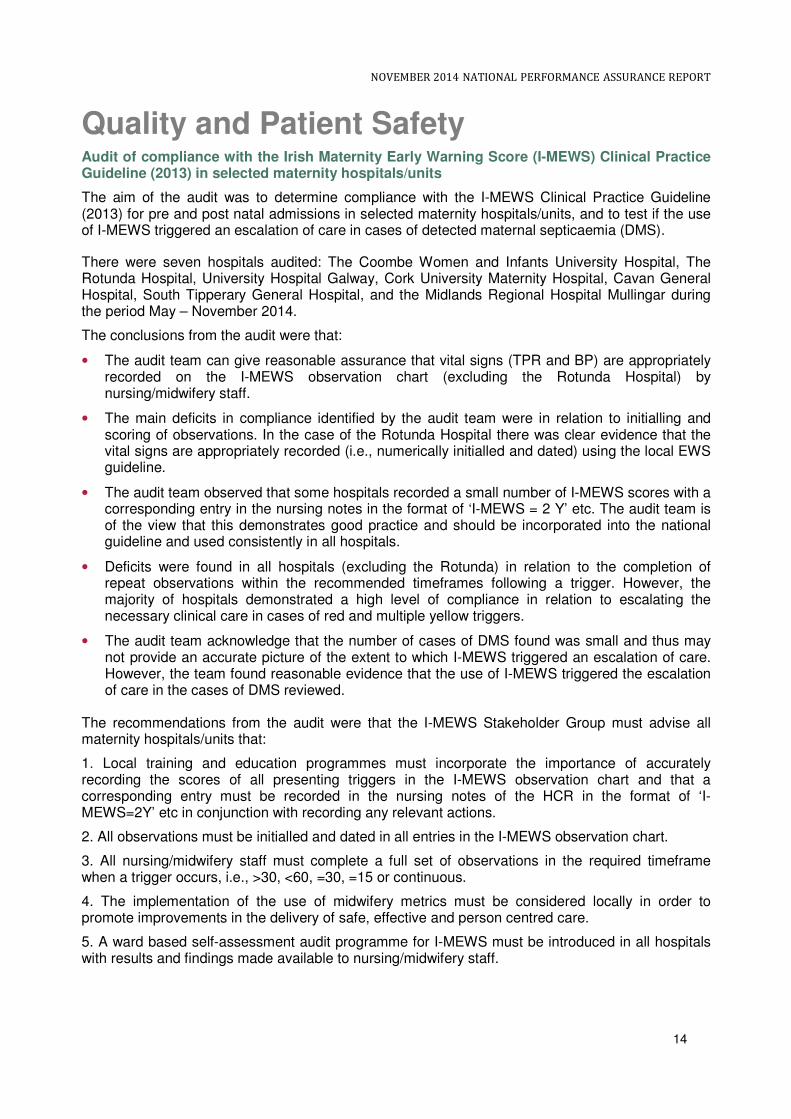
Audit of compliance with the Irish Maternity Early Warning Score (I-MEWS) Clinical Practice Guideline (2013) in selected maternity hospitals/units
The aim of the audit was to determine compliance with the I-MEWS Clinical Practice Guideline (2013) for pre and post natal admissions in selected maternity hospitals/units, and to test if the use of I-MEWS triggered an escalation of care in cases of detected maternal septicaemia (DMS).
There were seven hospitals audited: The Coombe Women and Infants University Hospital, The Rotunda Hospital, University Hospital Galway, Cork University Maternity Hospital, Cavan General Hospital, South Tipperary General Hospital, and the Midlands Regional Hospital Mullingar during the period May – November 2014.
The conclusions from the audit were that:
• The audit team can give reasonable assurance that vital signs (TPR and BP) are appropriately recorded on the I-MEWS observation chart (excluding the Rotunda Hospital) by nursing/midwifery staff.
• The main deficits in compliance identified by the audit team were in relation to initialling and scoring of observations. In the case of the Rotunda Hospital there was clear evidence that the vital signs are appropriately recorded (i.e., numerically initialled and dated) using the local EWS guideline.
• The audit team observed that some hospitals recorded a small number of I-MEWS scores with a corresponding entry in the nursing notes in the format of ‘I-MEWS = 2 Y’ etc. The audit team is of the view that this demonstrates good practice and should be incorporated into the national guideline and used consistently in all hospitals.
• Deficits were found in all hospitals (excluding the Rotunda) in relation to the completion of repeat observations within the recommended timeframes following a trigger. However, the majority of hospitals demonstrated a high level of compliance in relation to escalating the necessary clinical care in cases of red and multiple yellow triggers.
• The audit team acknowledge that the number of cases of DMS found was small and thus may not provide an accurate picture of the extent to which I-MEWS triggered an escalation of care. However, the team found reasonable evidence that the use of I-MEWS triggered the escalation of care in the cases of DMS reviewed.
The recommendations from the audit were that the I-MEWS Stakeholder Group must advise all maternity hospitals/units that:
1. Local training and education programmes must incorporate the importance of accurately recording the scores of all presenting triggers in the I-MEWS observation chart and that a corresponding entry must be recorded in the nursing notes of the HCR in the format of ‘I-MEWS=2Y’ etc in conjunction with recording any relevant actions.
2. All observations must be initialled and dated in all entries in the I-MEWS observation chart.
3. All nursing/midwifery staff must complete a full set of observations in the required timeframe when a trigger occurs, i.e., >30, <60, =30, =15 or continuous.
4. The implementation of the use of midwifery metrics must be considered locally in order to promote improvements in the delivery of safe, effective and person centred care.
5. A ward based self-assessment audit programme for I-MEWS must be introduced in all hospitals with results and findings made available to nursing/midwifery staff.

NOVEMBER 2014 NATIONAL PERFORMANCE ASSURANCE REPORT
15
Antibiotic Awareness
The new website launched in November - “Under the Weather” www.undertheweather.ie -has proven to be a major success with over 40,000 visits to date. The site provides practical advice to the public (including information for parents of young children) on how to deal with colds, flu, etc with the aim of reducing the demand for antibiotics and supporting people to manage these conditions themselves.
Disability Services: Aras Attracta
The television revelations about treatment of people in our disability services identified attitudes and practices that are totally unacceptable in any service. The Quality Improvement Division is working with the Disability Services to underlying cultural and practice issues that can lead to such care for vulnerable people. The division will provide support to management and staff to:
• Determine the evidence in the evaluation of standards of care
• Engage with service users advocates and staff in a collaborative process
• Develop sustainable plans to empower staff to address deficits in practice
• Provide support for the implementation of quality improvement
• Draw on national and local resources as required to implement required changes
• Develop and deliver a monitoring process
This work will involve significant on site evaluation and support that must lead to a fundamental change in culture and attitude of services providers to the care of all users of our services.

NOVEMBER 2014 NATIONAL PERFORMANCE ASSURANCE REPORT
16
Acute Hospitals
QUALITY AND PATIENT SAFETY
• The % of emergency Hip Fracture Surgeries carried out within 48 hours in November 2014 was 82%, down from 85% in October.
• The % of surgical inpatients who have principal procedure conducted on day of admission November 2014 was 65%, same as reported in the previous two months.
• The trend for emergency re-admission rates is downward, decreasing from 11% at the start of the year to 10% in the current month. The surgical re-admission rate remained at 2.0% again in November.
• The average length of stay across hospitals has increased from 5.1 days in October to 5.2 days in November and this is below the 2014 target of 5.6.
• Many hospitals are continuing to implement the productive theatre improvement programme to target further reductions in surgical length of stay.
HOSPITAL ACTIVITY PERFORMANCE
Unscheduled Admissions Jan – November Actual 2013
Jan – November Actual 2014
Val Var % Var
ED Admissions 257,224 259,182 1,958 0.8%
Emergency (Other)1 70,784 71,967 1,183 1.7%
MAU Admissions2 28,533 31,867 3,334 11.7%
Total Unscheduled Admissions 356,541 363,016 6,475 1.8%
Scheduled Admissions Jan – Nov Actual 2013
Jan – Nov Actual 2014
Val Var % Var
Elective Admissions3 98,834 94,017 -4,817 -4.9%
Total Scheduled Admissions 98,834 94,017 -4,817 -4.9%
Total Unscheduled and Scheduled Admissions Jan – November Actual 2013
Jan – November Actual 2014
Val Var % Var
Total Unscheduled and Scheduled Admissions 455,375 457,033 1,658 0.4%
• There has been an increase in unscheduled admissions (+1.8%) (n=6,475) this year to date. Some hospitals are experiencing a significant rise in Emergency admissions compared to same period last year, such as Midland Regional Hospital Mullingar (+26.0%), St. Vincent’s University Hospital (+19.2%), Waterford University Hospital (+12.7%) and Our Lady’s Children’s Hospital Crumlin (+14.6%)
• The most significant rise in emergency admissions has been in MAU related admissions. The HSE has continued to develop the medical assessment facilities across emergency departments to ensure appropriate streaming of patients. The increase in MAU admissions is a result of both increased referral by GPs to hospital based MAUs and an increase in the number of MAUs opened.
• Note
1 Emergency Other includes LIU, Paediatric Assessment, Surgical Assessment, Transfer, OPD admission sources
• Note2
MAU - Medical Assessment Unit
• Note3
Elective Admissions do not include Obstetric Elective admissions

NOVEMBER 2014 NATIONAL PERFORMANCE ASSURANCE REPORT
17
• In-patient activity rates have marginally increased by 0.02% (n=127) compared to 2013. However, this variance masks significant changes in the provision and demand for unscheduled and scheduled care.
Elective Admissions
3000400050006000700080009000
10000
2012 8493 8659 8913 8376 9694 8580 8967 8344 8924 9366 9547 6645
2013 8552 8430 8272 9159 9450 8888 9699 8268 9315 9254 9547 7144
2014 8399 7655 8186 8262 9048 8826 8945 7708 9009 9098 8881
Jan Feb Mar Apr May Jun Jul Aug Sep Oct Nov Dec
• There has been a 4.9% decrease in elective admissions (n= 4,817) compared to 2013. Part of this decrease can be accounted for increased emergency admission demand over the same period and a 33.5% increase in delayed discharges since the start of the year, further constraining available capacity.
• Although national elective activity has decreased, elective activity has increased amongst a number of hospitals including Mater University Hospital (+20.8%), Midland Hospital Portlaoise (+18.8%), South Infirmary (+31.1%), South Tipperary (+30.2%), Drogheda (+14.0%) and Kerry General Hospital (+13%)
• While nationally, day care attendances have decreased by 3.8% and remain 2% ahead of target, a coding reclassification in St. James’s Hospital has led to less day care activity being reported in 2014 which skews the national data. Excluding St. James’s from the National profile day case attendances are up 1.9% on same period last year and 7.2% ahead of expected levels.
EMERGENCY DEPARTMENT NEW ATTENDANCES
• There has been a 3.5% increase in new ED attendances in 2014 compared to 2013. This is a significant rise in new ED attendances given the fact that the number of EDs in operation decreased over 2013 (Mallow, Bantry and St. Columcilles have become urgent care centres over 2013)
• Some hospitals are experiencing significant increases in attendance numbers. For example, since the development of an Urgent Care Centre at St. Columcilles, St. Vincent’s University Hospital has seen a 21.7% rise in new attendances and St. Michaels has increased by 6.2%.

NOVEMBER 2014 NATIONAL PERFORMANCE ASSURANCE REPORT
18
ED New Attendances
40,00050,00060,00070,00080,00090,000
100,000
2012 87,596 87,907 94,103 88,302 95,729 89,044 89,589 88,985 88,097 91,041 87,306 90,141
2013 88,161 81,793 89,183 91,956 94,448 87,695 93,022 87,116 89,214 89,431 84,189 88,641
2014 91,895 83,982 94,843 92,868 96,503 92,409 93,704 88,686 93,821 91,706 90,204
Jan Feb Mar Apr May Jun Jul Aug Sep Oct Nov Dec
• January – November 2013 / 2014 3.4% increase (n=34,413)
EMERGENCY DEPARTMENT - TROLLEYGAR and PATIENT EXPERIENCE TIME (PET)4
There has been a 41.2% increase in the number of ED patients waiting on trolleys for ward bed accommodation comparing November 2014 with November 2013.
The HSE and SDU will continue to work locally with all hospitals on patient flow issues and the HSE will continue to monitor closely the pattern of trolley waits in preparation for the period September 2014 to April 2015.
Jan Feb Mar Apr May Jun Jul Aug Sep Oct Nov Dec
2011 397 386 401 349 352 341 287 301 349 366 341 259
2012 315 342 307 308 281 257 224 200 220 241 244 234
2013 285 276 303 318 252 203 187 151 189 182 204 191
2014 280 265 237 255 224 204 205 177 245 247 288
050
100150200250300350400450
Average Number of Patients waiting on Trolleys for Ward Bed Accommodation 2011 / 2012 / 2013 / 2014
• While the number of patients on trolleys has deteriorated, the Patient Experience Time(PET) in November showed that 68.4% of all patients were discharged or admitted from ED within 6 hours and 81.6% within 9 hours (both a disimprovement on October).
DELAYED DISCHARGES
• Since January there has been an upward trend in the number of delayed discharges. This trend plateaued during June due to lower emergency admissions in this month. The number of delayed discharges reported at the end of November was 835. This upward trend in delayed discharges may continue to year end reducing hospital capacity for higher ED admissions over the winter period.
Note
4 TrolleyGar performance based on INMO data trolley count / PET coverage is 22 ED hospitals

NOVEMBER 2014 NATIONAL PERFORMANCE ASSURANCE REPORT
19
Delayed Discharges
28 Jan
25 Feb
25 Mar
29 Apr
27 May
24 June
29 July
26 Aug
30 Sept
28
Oct 25
Nov
National Total 620 604 612 642 665 658 692 730 746 782 835
It is important to note that while the clinician in charge has ultimate responsibility for the decision to discharge; this decision is made as part of a multi-disciplinary process and focuses on the needs of the individual patient. The Acute Division is currently in discussions with the Social Care Division on the requirement for targeted responses to address the current pattern of delayed discharges. This response will be developed within the current resource base.
Delayed Discharges by Destination 25/11/2014 Over 65 Under 65
Total
No. %
Home 96 19 115 13.8%
Long Term Nursing Care 586 58 644 77.1%
Other (inc. National Rehab Hospital, complex bespoke care package,
palliative care, complex ward of court cases) 43 33 76 9.1%
Total 725 110 835 100.0%
For those patients who are moving to long term nursing care, the main reasons for delayed discharges are NHSS application not yet submitted to local NHSS office (202 clients / 24.2%) and Financial Determination in Progress - State Support only, no loan (136 clients, 16.3%).
WAITING TIMES
INPATIENT
Adult waiting lists demonstrate that 77% (43,031) of adults were waiting less than eight months for a planned procedure in November 2014. The numbers waiting over 8 months now number 12,540 an 8% (n=904) increase on October.
PAEDIATRIC
59% of all children waiting on the elective waiting list were waiting less than twenty weeks (3,279). The numbers waiting over 20 weeks now number 2,234 a 9% (n=176) increase on October.
GI ENDOSCOPY
62% of patients on the GI Endoscopy Waiting List were waiting less than thirteen weeks in November 2014. The numbers waiting over 13 weeks now number 4,879 a 3% (n=135) increase on October.
Almost 80% of those waiting more than 13 weeks are concentrated in 4 hospitals, (Beaumont Hospital, Tallaght/Naas, Galway University Hospital and Mercy University Hospital. There are specific capacity issues in some areas of the country (e.g. Tallaght/Naas). There continues to be reports of increased referrals notable from primary care for endoscopes. In March a target endoscope initiative was undertaken by the HSE and despite commissioning over 1,100 long waiter additional scopes across 13 hospitals, the GI endoscope waiting list continues to increase. The HSE is currently working with these hospitals to ensure appropriate schedules. . The HSE in partnership with NTPF is currently commencing a targeted initiative to address patients waiting over 13 weeks in Galway University Hospital, Limerick University Hospital, Tallaght Hospital, Naas Hospital, Beaumont Hospital, Connolly Hospital and Mercy University Hospital.

NOVEMBER 2014 NATIONAL PERFORMANCE ASSURANCE REPORT
20
COLONOSCOPY
There is a target to complete urgent colonoscopies within 4 weeks of referral; at the end of November 15 patients were reported as having breached this target. There was follow up with the hospitals concerned and all 15 patients had their procedure by 23rd December.
OUTPATIENT
In November 2014 the number of patients waiting in excess of 12 months for an outpatient appointment has increased from 51,286 to 55,733.
The Out-patient Improvement Programme continues to make progress in streamlining referral processing and targeting capacity gains for increased new appointments.
Overall January – November 2014 saw an increase of 3% (98,237) in OPD Attendances in comparison to 2013.
In November 2014, 85% of patients waiting on the Outpatient waiting list were waiting less than twelve months. In November 2013, 84% of patients were waiting less than twelve months.
The HSE is currently developing a number of options to address and respond to the significant increase in need for scheduled care capacity. It should be noted that increased focus by the HSE in the area of out-patients will have a concomitant impact on in-patient and daycase treatment requirements (and waiting lists). Similarly, the rise in the requirement for emergency admissions has reduced scheduled care capacity which has in turn, impacted on the total number of patients awaiting treatment. All of these factors contribute to the current trend in waiting lists
AMBULANCE TURNAROUND TIMES AT ACUTE HOSPITALS
In November, 67% of emergency ambulances were released and had their crews and vehicles available to respond to further calls within 30 minutes or less. 94% of calls had crews and vehicles clear and available within 60 minutes.
INTERMEDIATE CARE SERVICE
The Intermediate Care Service (ICS) was set up to provide a safe and timely transfer for non emergency patients when transferring between hospitals within the healthcare system or moving to step down facilities in the community. In October, 79% of all patient transfer calls (AS3) were handled by Intermediate Care Vehicles reflecting a positive development from the Intermediate Care Project. This service ensures that emergency ambulance personnel are available to focus on the core function of the delivery of pre-hospital emergency care.
HUMAN RESOURCES
Acute Services Division WTE Ceiling WTE YTD Variance % WTE Variance
Children's Hospitals 2,615 2,787 +173 +6.60%
Dublin Midlands Hospitals 8,508 9,158 +651 +7.65%
Ireland East Hospitals 9,184 9,823 +639 +6.96%
National Services Hospitals 22 25 +3 +15.25%
Palliative Care Hospitals 578 615 +37 +6.38%
RCSI Hospitals 6,791 7,392 +601 +8.85%
Saolta Healthcare University Hospitals 7,274 7,801 +527 +7.25%
South/ South West Hospitals 8,199 8,823 +624 +7.61%
University of Limerick Hospitals 2,865 3,054 +189 +6.60%
service development posts 116 0 -116 - 46,151 49,478 +3,328 +7.21%
Note: Children's HG now includes data for Tallaght CH

NOVEMBER 2014 NATIONAL PERFORMANCE ASSURANCE REPORT
21
FINANCE Acute Services Division
Approved Allocation
YTD % Var Act v Tar Actual Plan Variance
€'000 €'000 €'000 €'000 €'000
RCSI Dublin North East 588,506 569,294 538,123 31,171 6%
Dublin Midlands 731,395 695,615 668,239 27,375 4%
Dublin East 747,318 729,069 686,244 42,825 6%
South / South West 642,821 629,327 585,712 43,615 7%
Saolta University Health Care 601,119 599,504 549,002 50,502 9%
UL Hospitals 236,669 242,073 216,151 25,922 12%
Children's Hospital Group 209,233 203,759 190,441 13,318 7%
Regional & National Services 15,999 19,272 16,498 2,774 17% Total 3,773,059 3,687,914 3,450,411 237,503 6.88%
NOVEMBER 2014 NATIONAL PERFORMANCE ASSURANCE REPORT
22
Palliative Care Services
KEY AREAS OF FOCUS
• Community Home Care • Access - Inpatient Unit
• Day Care • Access - Community Home Care
• Paediatric Services • Budget / Expenditure
COMMUNITY HOME CARE
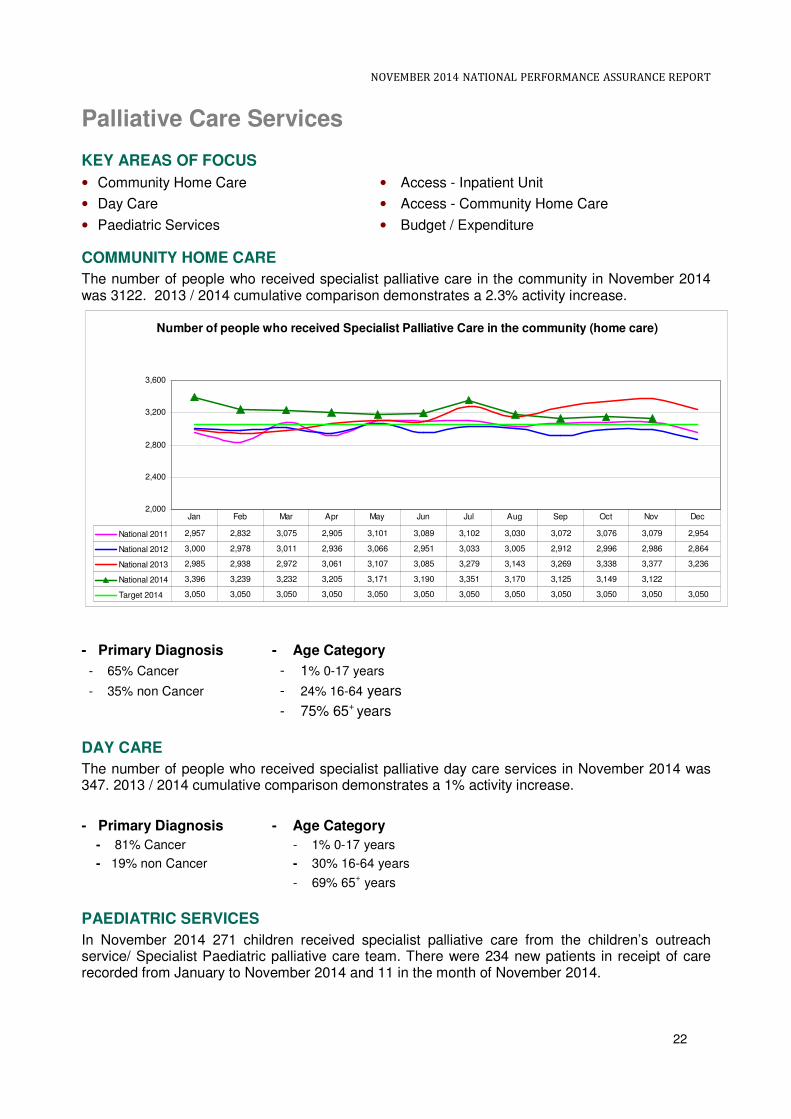
The number of people who received specialist palliative care in the community in November 2014 was 3122. 2013 / 2014 cumulative comparison demonstrates a 2.3% activity increase.
Number of people who received Specialist Palliative Care in the community (home care)
2,000
2,400
2,800
3,200
3,600
National 2011 2,957 2,832 3,075 2,905 3,101 3,089 3,102 3,030 3,072 3,076 3,079 2,954
National 2012 3,000 2,978 3,011 2,936 3,066 2,951 3,033 3,005 2,912 2,996 2,986 2,864
National 2013 2,985 2,938 2,972 3,061 3,107 3,085 3,279 3,143 3,269 3,338 3,377 3,236
National 2014 3,396 3,239 3,232 3,205 3,171 3,190 3,351 3,170 3,125 3,149 3,122
Target 2014 3,050 3,050 3,050 3,050 3,050 3,050 3,050 3,050 3,050 3,050 3,050 3,050
Jan Feb Mar Apr May Jun Jul Aug Sep Oct Nov Dec
- Primary Diagnosis - Age Category
- 65% Cancer - 1% 0-17 years
- 35% non Cancer - 24% 16-64 years
- 75% 65+ years
DAY CARE
The number of people who received specialist palliative day care services in November 2014 was 347. 2013 / 2014 cumulative comparison demonstrates a 1% activity increase.
- Primary Diagnosis - Age Category
- 81% Cancer - 1% 0-17 years
- 19% non Cancer - 30% 16-64 years
- 69% 65+ years
PAEDIATRIC SERVICES
In November 2014 271 children received specialist palliative care from the children’s outreach service/ Specialist Paediatric palliative care team. There were 234 new patients in receipt of care recorded from January to November 2014 and 11 in the month of November 2014.

NOVEMBER 2014 NATIONAL PERFORMANCE ASSURANCE REPORT
23
INPATIENT UNIT
In November 2014, 279 patients were admitted to Specialist Palliative Care inpatient beds. 2013 / 2014 cumulative comparison demonstrates a 4.7% activity increase.
Number of patients admitted to Specialist palliative care inpatient beds
150
200
250
300
2011 224 211 253 245 234 226 250 247 246 238 249 234
2012 238 233 242 231 259 212 207 233 222 239 247 245
2013 249 241 233 241 232 226 257 239 254 254 241 231
2014 254 237 223 250 253 232 287 254 270 279 254
Jan Feb Mar Apr May Jun Jul Aug Sep Oct Nov Dec
- Source of referral - Primary Diagnosis - Age Category
- 46% home - 74% Cancer - <1% 0-17 years
- 53% Acute Hospital - 26% non Cancer - 20% 18-64 years
- 1% community bed / hospice - 79% 65+ years
ACCESS - INPATIENT UNIT
In November 98% of specialist palliative care inpatient beds were provided within 7 days of referral (national target 94%).
Specialist Palliative Care wait times within 7 days vs target
70%
80%
90%
100%
National 2013 95% 91% 95% 95% 95% 94% 90% 92% 97% 98% 96% 97%
National 2014 94% 96% 96% 98% 98% 97% 95% 94% 96% 99% 98%
Target 2014 94% 94% 94% 94% 94% 94% 94% 94% 94% 94% 94% 94%
Jan Feb Mar Apr May Jun Jul Aug Sep Oct Nov Dec

NOVEMBER 2014 NATIONAL PERFORMANCE ASSURANCE REPORT
24
COMMUNITY HOME CARE - ACCESS
In November 88% of patients received specialist palliative care services in their place of residence (home, nursing home, non acute hospital) within 7 days of referral (national target 82%). Previous performance deterioration trend demonstrated (February - May) reversed.
HUMAN RESOURCES Palliative Care Services WTE Ceiling WTE YTD Variance % WTE Variance
DML 452 486 +34 +7.53%
DNE 42 46 +4 +9.00%
South 11 12 +1 +10.44%
West 72 70 -2 -2.96%
Total 577.91 614.76 36.85 6.4%
FINANCE
Palliative Care Services
Approved Allocation
YTD % Var Act v
Tar
Actual Plan Variance
€'000 €'000 €'000 €'000 €'000
DML 26,035 24,090 23,856 234 1.0%
DNE 12,165 10,464 10,895 -430 -4.0%
South 9,340 8,619 8,560 58 0.7%
West 21,022 19,963 19,234 729 3.8% Total 68,561 63,137 62,545 591 0.9%

NOVEMBER 2014 NATIONAL PERFORMANCE ASSURANCE REPORT
25
National Ambulance Service
KEY AREAS OF FOCUS
• Quality and Patient Safety • Ambulance Turnaround
• Activity Levels • Human Resources
• Emergency Call Volume and Response Times
• Intermediate Care Services
• Finance
QUALITY AND PATIENT SAFETY
• Migration to a modern single National Control Centre continues and this key project will deliver a modern National Emergency Control Centre across two sites, Rivers Building Tallaght (hub site) and Ballyshannon (resilience site) on a single computer based platform. This process has progressed to a point where at this point in time four of the original nine sites remain in operation – Townsend Street, Wexford, Tullamore and Ballyshannon. The fit out of the single National Control Centre in Tallaght is complete and migration to the Rivers Building will be completed by Quarter 1 2015.
• National Leads within the NAS continue to engage both nationally and locally with our public health colleagues and all staff in relation to the Ebola Virus Disease.
• The National Out-Of-Hospital Cardiac Arrest Register (OHCAR) is hosted by the Department of Public Health Medicine in the HSE West with the NAS as the major funder. It is administered and supported by the Discipline of General Practice, NUI Galway. The National OHCAR project was established in June 2007, in response to a recommendation in the Report of the Task Force on Sudden Cardiac Death. The need for OHCAR was reinforced in the policy document ‘Changing Cardiovascular Health’ and the ‘Emergency Medicine Programme Strategy’. Since 2012, OHCAR became one of only three national OHCA registries in Europe. OHCAR data is increasingly used in national reports and documents. Most recently OHCAR data from 2012 and 2013 was included in Health Technology Assessment of Public Access Defibrillation by HIQA. The ONE LIFE Project is an unprecedented initiative undertaken by NAS to increase out of hospital cardiac arrest (OHCA) survival rates in Ireland. The primary focus is on improving how OHCA is recognised, treated and measured.
• Ongoing evaluation of an Emergency Medicine Programme initiative aimed at improving the effectiveness of handover at emergency departments continues.
• The ‘Treat and Discharge Pilot Scheme’ is monitored and reviewed on an ongoing basis.
• The NAS will continue to play an active role in supporting community engagement on the development of community first responder schemes. Volunteers operate the community first responder schemes within the community they live or work and are trained to respond to incidents within a pre-defined geographical area such as a village or small town, and are linked to the NAS. Community First Responders (CFRs) are trained as a minimum in basic life support and the use of a defibrillator and can attend an actual or potentially life-threatening emergency. CFRs can play a vital role in helping the NAS to save lives. A new National Forum for Community First Responder Schemes is now in place. The NAS supports the continued development of first response schemes and agrees that the most rural and sparsely areas should be targeted. Nationally there are 105 Community First Responder Groups. In November, there were 105 CFR engagements, nationally.

NOVEMBER 2014 NATIONAL PERFORMANCE ASSURANCE REPORT
26
ACTIVITY LEVELS
• 24,782 emergency and urgent calls were responded to
• 291 Emergency Aero Medical Services calls completed YTD
• 102 Air ambulance calls completed YTD
• 462 Neonatal Retrieval Transfers YTD
• 4,317 Intermediate Care transfers, 3,396 (79%) by ICV vehicles, 921 emergency ambulances;
In October 2014 the National Ambulance Service responded to 24,782 AS12 and AS23 calls with a daily average call rate of 799. 241,926 calls were received YTD, a 4% (8,744) increase in calls over the same period in 2013.
National Daily Average Volume of AS1 and AS2 Calls
Jan Feb Mar Apr May Jun Jul Aug Sep Oct Nov Dec
National 2009 747 740 727 720 744 731 681 666 700 710 719 810
National 2010 756 718 717 708 755 746 714 730 751 706 662 752
National 2011 643 673 686 724 675 713 683 697 711 699 691 783
National 2012 708 783 726 719 718 726 705 715 723 717 723 819
National 2013 765 768 771 759 770 779 766 730 788 775 751 816
National 2014 778 841 793 782 800 803 788 778 801 799
600
650
700
750
800
850
900
National daily average AS1 and AS2 (Emergency Ambulance) calls - including ECHO and DELTA
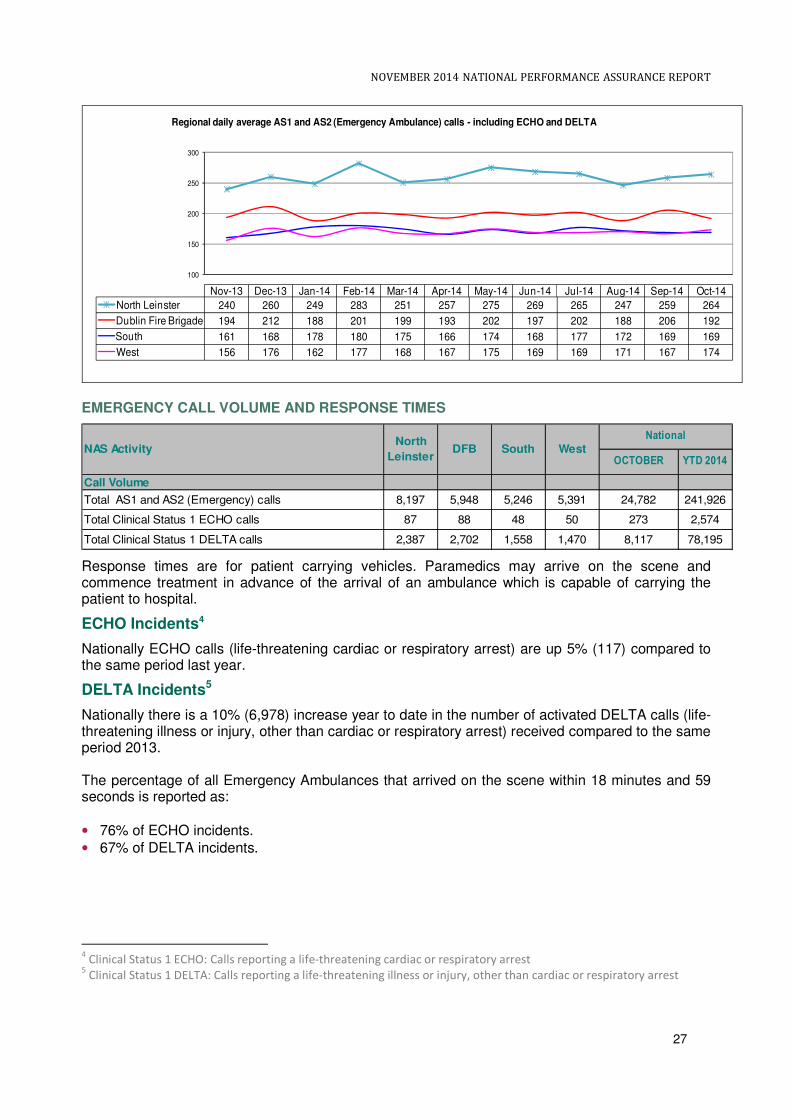
Regional Daily Average of AS1 and AS2 calls
2 AS1 – 112/ 999 emergency and urgent calls
3 AS2 – Urgent calls received from a general practitioner or other medical sources
NOVEMBER 2014 NATIONAL PERFORMANCE ASSURANCE REPORT
27
100
150
200
250
300
Nov-13 Dec-13 Jan-14 Feb-14 Mar-14 Apr-14 May-14 Jun-14 Jul-14 Aug-14 Sep-14 Oct-14
North Leinster 240 260 249 283 251 257 275 269 265 247 259 264
Dublin Fire Brigade 194 212 188 201 199 193 202 197 202 188 206 192
South 161 168 178 180 175 166 174 168 177 172 169 169
West 156 176 162 177 168 167 175 169 169 171 167 174
Regional daily average AS1 and AS2 (Emergency Ambulance) calls - including ECHO and DELTA
EMERGENCY CALL VOLUME AND RESPONSE TIMES
OCTOBER YTD 2014
Call Volume
Total AS1 and AS2 (Emergency) calls 8,197 5,948 5,246 5,391 24,782 241,926
Total Clinical Status 1 ECHO calls 87 88 48 50 273 2,574
Total Clinical Status 1 DELTA calls 2,387 2,702 1,558 1,470 8,117 78,195
National
WestNAS ActivityNorth
LeinsterDFB South
Response times are for patient carrying vehicles. Paramedics may arrive on the scene and commence treatment in advance of the arrival of an ambulance which is capable of carrying the patient to hospital.
ECHO Incidents4
Nationally ECHO calls (life-threatening cardiac or respiratory arrest) are up 5% (117) compared to the same period last year.
DELTA Incidents5
Nationally there is a 10% (6,978) increase year to date in the number of activated DELTA calls (life-threatening illness or injury, other than cardiac or respiratory arrest) received compared to the same period 2013. The percentage of all Emergency Ambulances that arrived on the scene within 18 minutes and 59 seconds is reported as:
• 76% of ECHO incidents.
• 67% of DELTA incidents.
4 Clinical Status 1 ECHO: Calls reporting a life-threatening cardiac or respiratory arrest
5 Clinical Status 1 DELTA: Calls reporting a life-threatening illness or injury, other than cardiac or respiratory arrest

NOVEMBER 2014 NATIONAL PERFORMANCE ASSURANCE REPORT
28
The detail by region is:
% of Clinical Status 1 ECHO incidents responded to by a
patient-carrying vehicle in 18 minutes and 59 seconds or
less
78% 77% 76% 70%
% of Clinical Status 1 DELTA incidents responded to by a
patient-carrying vehicle in 18 minutes and 59 seconds or
less
70% 66% 67% 62.5%
Activity Response Times Arrived at Scene
76%
67%
OCTOBER
North
LeinsterDFB South West
National
AMBULANCE TURNAROUND FROM ACUTE HOSPITALS
The NAS continuously monitor the turnaround times at hospitals on a national and local basis. In November, 67% of vehicles were released and had their crews and vehicles available to respond to further calls within 30 minutes or less. 94% of calls had crews and vehicles clear and available within 60 minutes. Going forward, the NAS will measure the number of escalations that occurred in line with the flow path in the ambulance turnaround framework document.
At times of pressure in the emergency care system, there is the potential for delay in the transfer of care of patients from ambulance resources to acute hospital Emergency Departments. A national framework document was developed to clarify the process of clinical handover to establish clear lines of responsibilities and the standards expected. This document sets out the escalation process to be used by NAS to alert the required levels of management both within NAS and the wider healthcare system and delays in the release of ambulance resources.
Ambulance turnaround times provide the time interval from ambulance arrival time (through clinical handover in the Emergency Department or Specialist Unit) to when the ambulance crew declares the readiness of the ambulance to accept another call (clear and available). This data is collected through the Computer Aided Dispatch (CAD) systems for every Emergency Call (AS1) and Urgent Call (AS2) transported to hospitals within Emergency Department / Specialist Units.
Ambulance turnaround data is currently manually aggregated across multiple CAD systems. The analogue system, where used, may not accurately record / reflect the data because it is an ageing technology and is one of the reasons NAS is migrating to Digital Platforms. NAS is developing a more robust solution to data requirement in the new national CAD being implemented as part of the NAS Control Centre Reconfiguration Programme.
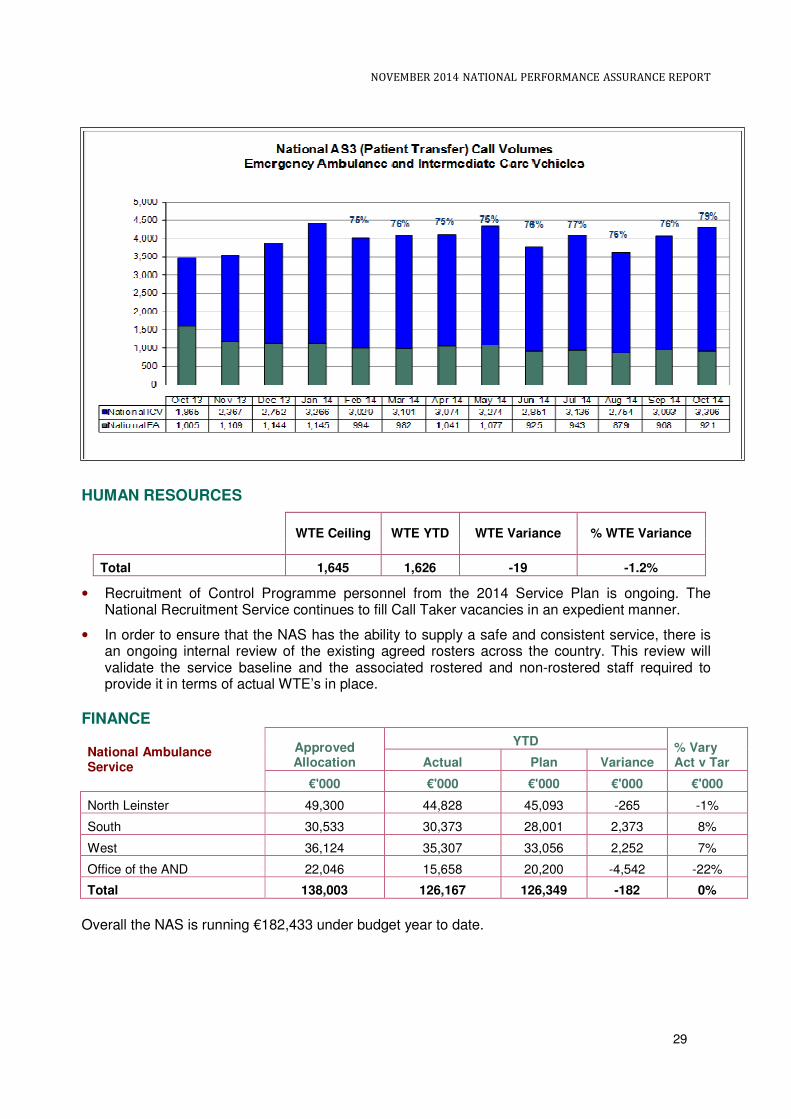
INTERMEDIATE CARE SERVICES
The Intermediate Care Service (ICS) was set up to provide a safe and timely transfer for non emergency patients when transferring between hospitals within the healthcare system or moving to step down facilities in the community. In October, 79% of the inter hospital transfers, previously carried out by ambulances were handled by Intermediate Care Vehicles, reflecting the best performance year to date for the Intermediate Care Project. This initiative has a positive impact on the availability of emergency ambulances for pre hospital care and facilitates emergency ambulance personnel to focus on the core function of the delivery of pre hospital care.
Total Number of Patient Transfer Calls Each Month
Nov Dec Jan Feb Mar April May June July Aug Sep Oct
3,536 3,896 4,411 4,023 4,083 4,115 4,351 3,776 4,079 3,633 4,061 4,317
NOVEMBER 2014 NATIONAL PERFORMANCE ASSURANCE REPORT
29
HUMAN RESOURCES
WTE Ceiling WTE YTD WTE Variance % WTE Variance
Total 1,645 1,626 -19 -1.2%
• Recruitment of Control Programme personnel from the 2014 Service Plan is ongoing. The National Recruitment Service continues to fill Call Taker vacancies in an expedient manner.
• In order to ensure that the NAS has the ability to supply a safe and consistent service, there is an ongoing internal review of the existing agreed rosters across the country. This review will validate the service baseline and the associated rostered and non-rostered staff required to provide it in terms of actual WTE’s in place.
FINANCE
National Ambulance Service
Approved Allocation
YTD % Vary Act v Tar Actual Plan Variance
€'000 €'000 €'000 €'000 €'000
North Leinster 49,300 44,828 45,093 -265 -1%
South 30,533 30,373 28,001 2,373 8%
West 36,124 35,307 33,056 2,252 7%
Office of the AND 22,046 15,658 20,200 -4,542 -22%
Total 138,003 126,167 126,349 -182 0%
Overall the NAS is running €182,433 under budget year to date.

NOVEMBER 2014 NATIONAL PERFORMANCE ASSURANCE REPORT
30
Primary Care Division
KEY AREAS OF FOCUS
• Quality and Patient Safety • Physiotherapy Services
• Community Intervention Teams (CITs) • Occupational Therapy Services
• GP Out of Hours Service • Finance
QUALITY AND PATIENT SAFETY PRIMARY CARE
Incident Management
National Standards for Safer Better Health Care
A Quality Assessment and Improvement Tool (QA&I) for the National Standards has been developed in the form of eight workbooks and are now available on line at http://hsenet.hse.ie/HSE_Central/PrimaryCare/QAIResources/
Nominated representatives from each of the ISA areas have also been registered onto the QA+I web enabled electronic tool, which is an electronic system designed for the collation of self assessments and quality improvement plans undertaken at Primary Care Management Team (PCMT) level, Primary Care Networks and/or Primary Care Teams (PCTs) within Primary Care .
Work is also ongoing with the HSE Change Management Resources Team in the development of a National Networking online Forum via HSELand.ie ‘Change Hub’ to enhance learning and sharing of information across the ISAs in their assessment against the National Standards for Safer Better Health Care.
COMMUNITY INTERVENTION TEAMS
During November 2014, 1,273 patients had been seen by the 8 CIT teams, bringing the number seen year to date to 13,375. As part of the National Service Plan 2014 a review of CIT services was undertaken and the provision and further development of services will be informed by the outcome of the Review.
In November:
• 809 people were provided with a community intervention service to assist with hospital avoidance or inpatient admission – a total of 8,322 year to date.
• 230 people availed of the service to assist early discharge – a total of 2,845 year to date.
• 148 GP referrals – a total of 1,365 year to date. This figure excludes GP referrals that are deemed hospital avoidance and which have been included under the category ED/Hospital Avoidance.
• 86 Community referrals - a total of 843 year to date. This figure excludes Community referrals that are deemed hospital avoidance and which have been included under the category ED/Hospital Avoidance.
GP OUT OF HOURS SERVICE
• 75,065 patients availed of GP out of hours services in November (i.e. triage, treatment, home visit etc.) to bring the total year to date to 843,331. This is a demand led service and reflects the actual demand for services in the reporting period.

NOVEMBER 2014 NATIONAL PERFORMANCE ASSURANCE REPORT
31
Jan Feb Mar Apr May Jun Jul Aug Sep Oct Nov Dec
National 2012 85,505 81,833 91,790 84,521 83,145 83,847 74,077 71,348 75,641 75,676 71,403 118,78
National 2013 87,441 76,679 98,373 82,957 82,196 83,173 77,094 76,014 71,877 75,112 71,155 96,000
National 2014 80,769 78,152 90,972 80,801 79,128 79,462 68,398 73,434 65,907 71,243 75,065
60,000
70,000
80,000
90,000
100,000
110,000
120,000
No of contacts with GP OOH's per month
PHYSIOTHERAPY SERVICES
Waiting List Management: At the end of 2013 there were 7,181 patients waiting more than 12 weeks for an assessment. The Service Plan 2014 target is to reduce that number by 10%. At the end of November there were 6,029 patients waiting more than 12 weeks, which is an improvement and represents a reduction of 16%.
Physiotherapy Services: variance from expected activity in the month
Regions DML DNE South West National
Referrals +14.3% +9.3% -2.3% +7.2% +6.4%
Patients seen first assessment +15.4% +15.5% +7.5% +5.9% +10.4%
Patients Treated +15.8% +19.5% -3.3% +17.0% +10.8%
Treatment contacts +21.8% +10.5% -6.8% +5.7% +6.3%
Physiotherapy patients waiting more than 12 weeks for assessment
Regions DML DNE South West National
Number of patients waiting more than 12 weeks for assessment
755 862 1,094 3,318 6,029
OCCUPATIONAL THERAPY SERVICES
At the end of 2013 there were 8,511 patients waiting more than 16 weeks for an assessment. The Service Plan 2014 target is to reduce that number by 10%. At the end of November there were 7,910 patients waiting more than 16 weeks, which is an improvement and represents a reduction of 7%.
Occupational Therapy Services: variance from expected activity in the month
Regions DML DNE South West National
Referrals +30.8% +29.5% +14.1% +11.8% +21.4%
Patients seen first assessment +24.1% +19.8% +16.7% +2.7% +16.2%
Patients Treated +26.9% +46.5% +18.1% +89.% +23.9%

NOVEMBER 2014 NATIONAL PERFORMANCE ASSURANCE REPORT
32
Occupational Therapy patients waiting more than 16 weeks for assessment
Regions DML DNE South West National
Number of patients waiting more than 16 weeks for assessment
2,113 1,001 3,257 1,539 7,910
Improved access and reductions in waiting times for Primary Care therapy services have been prioritised as additional staff are deployed under the Primary Care Development Programme and through the utilisation of HRA productivity targets.
Social Inclusion QUALITY AND PATIENT SAFETY
Progress is being made in relation to the completion of clinical guidelines for Opioid Substitution Treatment and finalising arrangements for the recruitment of a Clinical Lead for Addiction Services.
Addiction services
• 9,312 patients received Opioid Substitute Treatment (excluding prisons) at the end of the reporting period which includes 3,936 patients being treated by 339 GPs in the community.
• Opioid Substitute Treatment was dispensed by 624 pharmacies catering for 6,355 patients at the end of the reporting period.
• At the end of the reporting period there were 71 HSE clinics providing Opioid Substitute Treatment and an additional 10 clinics were provided in the prison service. 83 new patients commenced Opioid Substitute Treatment during the reporting period (7 in General Practice, 55 in HSE clinics and 21 in the prison clinics).
Primary Care Reimbursement Service QUALITY AND PATIENT SAFETY
A new dedicated GP Support line has been introduced to enhance the collaboration between GPs and the HSE to look after patients in relation to their medical card applications and renewals. GPs commenced accessing the new dedicated support line in September 2014.
MEDICAL CARDS
The number of people covered by medical cards as of 1st December 2014 was 1,771,368 (39% of the population). Included in these cards were 74,674 medical cards granted on discretionary grounds.
The total number of GP visit cards as of 1st December 2014 was 157,913. Included in these cards were 33,672 GP visit cards granted on discretionary grounds.
The change in relation to medical cards overall as of November 2014 is a net reduction of 78,012 since the beginning of the year. The number of medical cards granted on discretionary grounds is 74,674.

NOVEMBER 2014 NATIONAL PERFORMANCE ASSURANCE REPORT
33
Performance Activity Medical Cards and GP Visit Cards *
DML DNE South West National
Total
Number of People with Medical Cards 448,791 377,026 475,818 469,733 1,771,368
Number of people with GP Visit Cards 41,198 33,292 44,798 38,625 157,913
Total 489,989 410,318 520,616 508,358 1,929,281
*Includes 74,674 medical cards granted on discretionary grounds and 33,672 GP visit cards granted on discretionary grounds.
As of the 15th December 2014, 97.23% of completed medical card applications were processed and issued within 15 days. Of the 2.77% which were not processed within target, the majority relate to applications where the income was in excess of the qualifying limits and a medical assessment was required” Source: PCRS Management Report – November 2014 (Draft)
Long Term Illness / General Medical Scheme National
Number Processed % Variance to profiled target November 2014 Jan – Nov YTD
LTI claims 135,420 1,162,025 +34.4%
LTI items 475,253 3,986,584 +42.3%
GMS prescriptions 1,629,750 17,614,318 -11.1%
GMS items 4,959,250 54,187,549 -10.9%
GMS Special items 134,040 873,881 +13.4%
GMS Special type consultations 85,169 1,007,110 -11.8%
*increase primarily attributable to flu season commencing
HUMAN RESOURCES
Primary Care WTE Ceiling WTE YTD Variance % WTE Variance
Total 9,456.64 9,452.08 -4.56 -0.05%
The numbers employed are in line with the ceiling targets.
FINANCE
Primary Care Division (Overall Total)
Approved Allocation
YTD % Var Act v Tar
Actual Plan Variance
€'000 €'000 €'000 €'000 €'000
Total 3,246,870 3,079,789 2,967,374 112,415 3.8%
NOVEMBER 2014 NATIONAL PERFORMANCE ASSURANCE REPORT
34
Health and Wellbeing Division
KEY AREAS OF FOCUS
• Quality and Patient Safety • Child Health Development Screening
• Screening Programmes • Healthy Ireland
• Tobacco Control • Developments in November
QUALITY AND PATIENT SAFETY
Work continued on the updating of Divisional and sub-Divisional risk registers during the month which were considered at the monthly Health and Wellbeing Senior Management Team.
The second Colposcopy Forum was held in National Screening Services central office on Friday 21st November with clinical and nursing colleagues from all 15 services invited. The sharing of data across units to aid service improvement and quality has commenced.
The first meeting of the new membership of the CervicalCheck Quality Assurance committee was held on 27th November in NSS central office. The previous members had come to their end of term.
PERFORMANCE INDICATORS
There are a number of performance indicators and measures against which the Division will report progress in 2014. These include, inter alia, measures of health protection and immunisation, developmental screening for children, attendances at national screening programmes, tobacco, food safety and Public Health Nurse visits to newborn babies. The majority of this data is reported on a quarterly basis.
SCREENING PROGRAMMES
11,532 women attended for breast screening in November, bringing the YTD total to 129,972. BreastCheck Executive Management Team reviewed the screening targets and noted that it is likely that the numbers screened by the end of 2014 will be in the region of 138,000. However as the programme is delivered on an area-by-area basis over a two year screening round, and the parameters for screening recall are within 21-27 months of previous mammogram, screening activity is not necessarily evenly divided by calendar year. Taking the screening activity for 2013 and (projected) 2014 together (144,656 + 138,000 = 282,656) activity will be well in excess of the combined 2-year 2013 and 2014 targets (280,000).
CervicalCheck saw 21,896 women screened in November bringing the year to date total to 249,655. The number of women to be screened in primary care was revised in 2014 (275,000). Activity to year end is anticipated to be +/-5% of target.
17,425 clients in the eligible age range were invited to participate in the BowelScreen programme in November. Year to date 198,406 clients have been invited, consistent with targets for 2014.
10,874 clients were invited to participate in the Diabetic RetinaScreen programme in November. Year to date 114,899 clients have been invited, consistent with targets for 2014.
TOBACCO CONTROL
As reported last month, the new HSE QUIT service went live with phone support for smokers on 1st October 2014. The objective of the new service is to support smokers wanting to quit by providing information, advice and direct access to an intensive cessation support programme (QUIT programme) via a range of media, including phone, online, social media, SMS and email. The
NOVEMBER 2014 NATIONAL PERFORMANCE ASSURANCE REPORT
35
initial results show a greatly more effective conversion rate from callers to QUIT programme signups than the previous QUITline service. During November, work continued on the online elements of the QUIT service, including development of the newly designed QUIT.ie website, SMS and Live Chat integration. These digital services are due to go live at the end of December 2014 when the QUIT service will be officially launched.
8,622 smokers received face-to-face intensive cessation support from a cessation counsellor to end of November 2014 compared to an expected activity target of 8,548 (+0.9%). 1,576 smokers reported/validated ‘quit at one’ month to end August 2014 versus an expected target of 1,845
(-14.6%). These figures are reported 3 months in arrears.
Performance against expected activity for the training of front line workers in brief intervention in smoking cessation to the end of November is 7.5% behind its planned target. The total number trained is 1,203 (2014) versus 1,301 (2013). In November 2014, 142 front line staff received training. There are ongoing challenges in getting staff released and engagement continues with the Acute Division and Hospital Groups where there have been low levels of staff released for training.
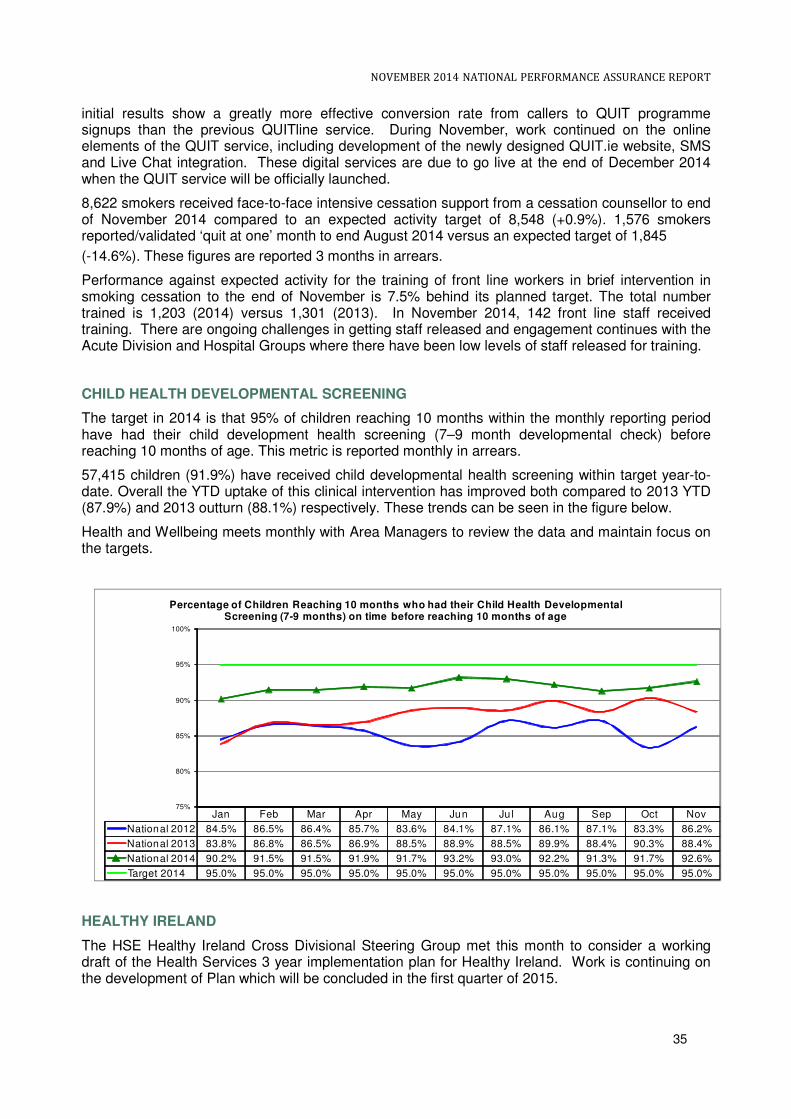
CHILD HEALTH DEVELOPMENTAL SCREENING
The target in 2014 is that 95% of children reaching 10 months within the monthly reporting period have had their child development health screening (7–9 month developmental check) before reaching 10 months of age. This metric is reported monthly in arrears.
57,415 children (91.9%) have received child developmental health screening within target year-to- date. Overall the YTD uptake of this clinical intervention has improved both compared to 2013 YTD (87.9%) and 2013 outturn (88.1%) respectively. These trends can be seen in the figure below.
Health and Wellbeing meets monthly with Area Managers to review the data and maintain focus on the targets.
Jan Feb Mar Apr May Jun Jul Aug Sep Oct Nov
National 2012 84.5% 86.5% 86.4% 85.7% 83.6% 84.1% 87.1% 86.1% 87.1% 83.3% 86.2%
National 2013 83.8% 86.8% 86.5% 86.9% 88.5% 88.9% 88.5% 89.9% 88.4% 90.3% 88.4%
National 2014 90.2% 91.5% 91.5% 91.9% 91.7% 93.2% 93.0% 92.2% 91.3% 91.7% 92.6%
Target 2014 95.0% 95.0% 95.0% 95.0% 95.0% 95.0% 95.0% 95.0% 95.0% 95.0% 95.0%
75%
80%
85%
90%
95%
100%
Percentage of Children Reaching 10 months who had their Child Health Developmental Screening (7-9 months) on time before reaching 10 months of age
HEALTHY IRELAND
The HSE Healthy Ireland Cross Divisional Steering Group met this month to consider a working draft of the Health Services 3 year implementation plan for Healthy Ireland. Work is continuing on the development of Plan which will be concluded in the first quarter of 2015.

NOVEMBER 2014 NATIONAL PERFORMANCE ASSURANCE REPORT
36
On the 13th November the Irish Heart Foundation-Happy Heart Healthy Eating and Active@Work Awards 2014 took place commending the efforts of 85 businesses and organisations around the country that supported 55,000 employees to make healthier choices.
The Irish Heart Foundation’s workplace programme, supported by the HSE, has worked with companies nationwide for more than 20 years promoting the importance of a supportive workplace environment and providing heart health programmes, to make the healthy choice the easy choice for employees, especially regarding diet and physical activity. These behaviours help employees reduce their risk of cardiovascular disease, the leading cause of death in Ireland. The awards event was hosted by Bank of Ireland, who achieved a Gold Active@work Award as 10,000 of their employees took part in a company-wide, 4-week Step Challenge as well as other activities and along with Eurest Catering, they were also winners of 10 awards for their catering provision for staff. Seventy companies were certified this year by the Irish Heart Foundation under their Healthy Eating Awards to provide and promote healthy meal options in their restaurants and canteens and to date about 400 companies have been certified benefiting 400,000 employees nationwide. Only in its second year, the Active@Work Award was presented to 20 companies in recognition of efforts to boost employee physical activity levels at work. Promoting an active workforce has the potential to reduce sick by days by as much as 27% and drive down absenteeism by up to 20%. HSE services were well represented including Wexford General Hospital who received an award. On 19th November 2014, Sligo County Council and the HSE convened a workshop to explore the possibility of making Sligo a Healthy City, under World Health Organisation (WHO) structures. The WHO Healthy Cities movement has been in existence for 25 years. It is a model for tackling the underlying social determinants of health in an integrated and co-ordinated way. The workshop was by invitation and was attended by representatives from a broad range of key organisations. OTHER DEVELOPMENTS
Ebola preparedness
The HSE has been advised of the confirmed case of Ebola in Scotland. The Health Protection Surveillance Centre is monitoring the situation closely.
The HSE has procedures in place to manage suspected or actual cases of Ebola in Ireland. These procedures are constantly being reviewed in light of international developments and understanding, of which the Scottish is an example. Specific training for front line health care workers around these procedures, including the use of personal protective equipment is ongoing and remains a priority for the HSE.
Preparedness is ongoing with arrangements at the ports being kept under close review.
Food safety
A report published in November by the Conference Board of Canada’s Centre for Food in Canada in collaboration with the University of Guelph’s Food Institute ranked Ireland and Canada in joint top place for Food Safety among 16 OECD Countries. The report measures and ranks Ireland’s food safety performance against that of 16 peer OECD countries including Australia, France, Germany, the UK and the USA.
The role of the HSEs Environmental Health Service along with partner organisations involved in Food Control was acknowledged by Minister Varadkar.

NOVEMBER 2014 NATIONAL PERFORMANCE ASSURANCE REPORT
37
Staff Event
The first of 3 planned Winter events for staff in Health and Wellbeing took place in Dublin this month. The event, which was attended by almost 200 staff, was an opportunity to update colleagues on significant developments since the Summer events and discuss 2015 planning priorities. Further events are planned for December and January.
HUMAN RESOURCES
Health & Wellbeing WTE Ceiling WTE YTD Variance
% WTE Variance
Health & Wellbeing 1,228 1,237 +9 +1.00%
FINANCE
Health & Wellbeing Approved Allocation
YTD % Var Act v Tar Actual Plan Variance
€’000 €’000 €’000 €’000 €’000
National 207,373 166,550 186,636 -20,086 -10.8%

NOVEMBER 2014 NATIONAL PERFORMANCE ASSURANCE REPORT
38
Social Care Division
Disability Services
KEY AREAS OF FOCUS
• Quality and Patient Safety • Human Resources
• School Leavers Rehabilitative Training (RT) Exits • Finance
• Services for Children & Young People (0-18s)
QUALITY AND PATIENT SAFETY
The Social Care Division held a ‘Learning Summit’ on 17th November 2014, which was attended by the vast majority of HSE and voluntary providers of residential care services. The Summit had a particular focus of the learning to date in relation to Governance from a Quality and Patient Safety perspective, and was well received by all attendees. It is intended to repeat similar exercises during 2015.
HIQA has published 419 inspection reports at the end of November 2014. A number of situations have arisen where poor performance/service failures have been identified and these are being managed to ensure safety of residents and the required improvement in service. A monitoring and analysis process in respect of HIQA inspection reports across the Division has commenced and is currently being tested. This will form the basis of a safety intelligence system which will provide an ability to monitor key safety parameters and provide information to inform service improvement initiatives.
SCHOOL LEAVERS AND REHABILITATIVE TRAINING (RT) EXITS
In November, 2,583 rehabilitative training places were provided for persons with disabilities. As weekly places are utilised by more than one person, 2,935 people availed of these places nationally.
SERVICES FOR CHILDREN AND YOUNG PEOPLE (0-18s) PROGRAMME
There are 55 children’s disability network teams now reconfigured under Progressing Disability Services for Children and Young People who have signed off and submitted their Principles, Policies and Procedures, Governance Structures and the Implementation Plan. The target for the remainder of children’s services to reconfigure across the HSE and Voluntary Organisations is an additional 63 teams (total target of 118 teams by Q1 2016).
Allocation of the 80 posts associated with the 2014 €4m has been finalised and Area Managers advised on immediate recruitment in conjunction with voluntary sector providers. Primary Notification issued in August for 79 posts allocated to twelve areas. The recruitment process has commenced in all Areas One post will be assigned nationally to take on a dedicated project management role. A job/person specification for the filling of this post is being finalised, and the 80th development post will be utilised to ‘backfill’ the post vacated by the successful applicant for this project manager role. Training and other supports will be provided in Mid-West, Meath, West Cork, Cavan/Monaghan and Midlands. Funding is being allocated on the basis that monies will be spent before year end. Specific initiatives are also being put in place to address significant waiting lists, e.g. use of Temporary staff, contracting ‘private’ capacity to address waiting lists, etc.

NOVEMBER 2014 NATIONAL PERFORMANCE ASSURANCE REPORT
39
HUMAN RESOURCES Social Care Division WTE Ceiling WTE YTD Variance % WTE Variance
Total 24,242.75 24,231.93 -10.82 -0.04%
FINANCE Social Care Disability Services
Approved Allocation
YTD % Var Act v Tar Actual Plan Variance
€’000 €’000 €’000 €’000 €’000
DML 433,007 409,486 397,528 11,958 3.0%
DNE 332,026 310,729 304,012 6,717 2.2%
South 307,030 284,697 281,329 3,368 1.2%
West 339,641 314,098 310,681 3,417 1.1%
National 2,525 0 2,315 -2,315 -100.0%
Corporate 5,767 3,739 5,294 -1,555 -29.4%
National 1,419,997 1,322,750 1,301,160 21,590 1.7%
Social Care Division (Total)
Approved Allocation
YTD % Var Act v Tar Actual Plan Variance
€'000 €'000 €'000 €'000 €'000
National 2,891,587 2,695,510 2,645,782 49,728 1.9%
NOVEMBER 2014 NATIONAL PERFORMANCE ASSURANCE REPORT
40
Services for Older People
KEY AREAS OF FOCUS
• Quality and Patient Safety • Nursing Home Support Scheme
• Service Activity • Elder Abuse
• Home Help Hours • Human Resources
• Home Care Packages • Finance
• Residential Services
QUALITY AND PATIENT SAFETY
The Social Care Division is focused on improving the quality of services and supports provided for older persons. To this end a service improvement programme is being implemented to ensure the delivery of cost effective models of care with safety as a fundamental priority. A monitoring and analysis process in respect of HIQA inspection reports across the Division has commenced and is currently being tested. This will form the basis of a safety intelligence system which will provide an ability to monitor key safety parameters and provide information to inform service improvement initiatives.
Central to the service improvement programme is the continued emphasis on the residential care standards for older persons as regulated and inspected by HIQA. The Social Care Division is also participating in a working group with HIQA for a further revision of these standards for 2015.
Liaison with DOH, HIQA, Estates and Area Management on the requirements for re-registration of public residential care units in 2014/2015 is ongoing.
INTEGRATED MODEL OF CARE
The HSE are committed to developing a single Integrated Model of Care for Older People across hospital and community services. This important cross divisional programme is co chaired by the Social Care and National Clinical Strategy and Programmes Divisions, supported by the System Reform Group. The model is defining appropriate care pathways both from a clinical and social perspective to support older people to live in their own homes and communities.
A working group involving members of the National Clinical Strategy Programme and Services for Older People is now being established to progress the development of the Integrated Care Programme for Older People. A Benefits realisation workshop, facilitated by the System Reform Group (SRG), was held on 14th August and was attended by key stakeholders e.g. people working across Services for Older People and representatives from the DoH and voluntary sector. A Project Manager is to be assigned to this project to support the working group and progress stakeholder consultation and the development of guidance documentation.
SERVICE ACTIVITY
As of November 2014:
• 47,137 clients were in receipt of home help service receiving 9.4m home help hours YTD
• 13,139 clients are in receipt of a home care package
• 22,016 clients are supported by the Nursing Home Support Scheme (NHSS)
• At the end of November there were 1,898 people on the national placement list for funding approval under the scheme, with an average wait time of 14 weeks. The scheme is taking on new clients within the limits of the resources available, in accordance with the legislation. The overall position remains challenging and both the Social Care and Acute Hospital division are collaborating closely in monitoring the situation.

NOVEMBER 2014 NATIONAL PERFORMANCE ASSURANCE REPORT
41
• 47,137 clients were in receipt of home help services at the end of November a 1.5% increase (+714) on the same period last year.
• 9,423,875 hours have been provided YTD nationally, a 6% increase on the same period last year. Activity is 0.2% (17,793 hours) below the expected YTD service delivery level.
HOME HELP HOURS
The 2014 National Target for Home Help Hours is 10.3m hours. The maximum target in November is 9.44m hours of service delivery. The maximum sustainable rate for each region has been applied to the performance reports for November 2014.
*It is important to note that variances on this indicator are related to the demand for low or high value home care packages and are not a good indicator of overall performance.
HOME CARE
Intensive Home Care Packages
The HSE is working with the voluntary group Genio to develop outcome measures and to assess the effectiveness of intensive homecare packages, both from a quality perspective as well as the potential for the development of alternative care in the home for people with significant complex care needs. €3m has been assigned to the roll out in 2014 and will be fully utilised by year end. The focus is on ensuring that the intensive home care packages come on stream to support services and respond to the discharge requirements of acute hospitals in Q4 during the winter period.
The home care tender process is taking longer than anticipated due to legal action. While this is being finalised the remaining funding allocation is being used to support discharge from the acute hospital system as public nursing units throughout the country are providing transition care.
Services for Older People are committed to delivering 30 Intensive Home Care Packages (iHCP) by year end. The 30 packages will be delivered and funded on a Money Follows the Patient basis. Each Integrated Service Area (ISA) has been requested to submit applications for approval and are being monitored on a weekly basis to ensure delivery of the target by year end.
Region Expected Activity 2014 Activity
YTD % var YTD v EA YTD Full Year YTD
National Total 10,300,001 9,441,668 9,423,875 -0.2%
HSE DML 1,910,001 1,750,834 1,503,286 -14.1%
HSE DNE 1,660,000 1,521,667 1,857,192 22.0%
HSE South 3,620,000 3,318,333 3,198,158 -3.6%
HSE West 3,110,000 2,850,833 2,865,239 0.5%
HOME CARE PACKAGES
The expected level of service in 2014 is that 10,870 persons would be in receipt of a home care package at any time.
13,139 persons were in receipt of a home care package at end of November 2014.
• Activity year-to-date was 20.9% above the expected level of service*.
• South Region was below the expected level of service with a variance of 8.1%.
• DML, DNE and West Regions were above the expected level of service at 32.7%, 38.1% and 10.8%.
% of the total no. of persons in receipt of a Home Care
Package by region in November 2014
DML
26.9%
DNE
37.3%
South
17.0%
West
18.9%

NOVEMBER 2014 NATIONAL PERFORMANCE ASSURANCE REPORT
42
RESIDENTIAL SERVICES
Service Improvement Teams
The Service Improvement Team work is focused on maximising efficiency, ensuring the delivery of cost effective models of care with safety as a fundamental priority in each unit.
Since Feb 2014, services for older people have undertaken a comprehensive piece of work using a range of measures to ensure that public residential services are provided in a cost efficient manner and through a model of care that is standards based and compliant with HIQA requirements, as well as flexible to the residents needs. Services for Older People reviewed 49 public residential units and used the HRA enablers to support the progress and delivery on a number of key developments across services for older people. Implementation of targets and recommendations is discussed with Area Managers at the monthly Performance Meetings and a seminar was held in September with Senior SOP Managers, Finance Managers, Directors of Nursing and the Service Improvement Team where the rationale and recommendations were outlined. Following intensive engagement with unions using 12 learning sites, the matter has been referred to the Joint Oversight Committee for consideration. Public Beds
The expected level of service in 2014 for Nursing Home Support Scheme (NHSS) beds in Public Long Stay Units is 5,400 beds at any one time.
• In November 2014 there were 5,290 HSE public beds designated to the NHSS Scheme; 2% below target nationally due to HIQA compliance issues.
• Regionally DML, DNE and the West were below target at -1.5%, -7.6% and -1.2% respectively. The South was just above the target at 0.1%.
• Short stay beds are 0.6% above target in November.
NURSING HOME SUPPORT SCHEME (NHSS)
In November 2014 the scheme funded 22,016 long term public and private residential places and when adjusted for approved clients not in payment (602), there were 22,618 supported under the scheme. The numbers in payment are in line with the target of 22,062.
Number of patients in Long Term Residential Care funded beds
HSE Region NHSS Public Beds
No. of patients in NHSS Private
No. of patients on Subvention
No. of patients in Contract
Beds
No. of ‘savers’ in Section 39
Units
Total in Payment during Month
Total – Dec 2013 5,052 16,269 565 1,016 105 23,007 DML 1,321 4,240 107 436 - 6,104 DNE 842 3,228 96 188 11 4,365 South 1,496 4,122 82 92 71 5,863 West 1,210 4,278 126 70 - 5,684
Total – Nov 2014 4,869 15,868 411 786 82 22,016
Note: An additional 602 clients have been approved under the scheme but had not taken up a place or had not come into payment of financial support under the scheme during the month. The reasons for a client not taking up a place can be due to a combination of events such as people requiring other services e.g. acute care, people deciding not to go into long term care, etc.

NOVEMBER 2014 NATIONAL PERFORMANCE ASSURANCE REPORT
43
HUMAN RESOURCES
Social Care Division WTE Ceiling WTE YTD Variance % WTE Variance
Total 24,211.44 24,199.50 -11.94 -0.05%
FINANCE
Social Care Older Persons Services
Approved Allocation
YTD % Var Act v Tar Actual Plan Variance
€'000 €'000 €'000 €'000 €'000
DML 168,758 162,978 153,166 9,811 6.4%
DNE 123,234 118,369 112,092 6,277 5.6%
South 176,145 167,134 161,369 5,765 3.6%
West 172,245 165,072 157,564 7,508 4.8%
Fair Deal (ex Contract & Subvention) 804,543 749,373 739,173 10,200 1.4%
National 8,371 0 7,673 -7,673 -100.0%
Corporate 12,196 9,721 7,994 1,728 21.6%
National Director Office 6,098 113 5,590 -5,477 -98.0%
Total 1,471,590 1,372,760 1,344,622 28,138 2.1%
Social Care Division (Total)
Approved Allocation
YTD % Var Act v Tar Actual Plan Variance
€'000 €'000 €'000 €'000 €'000
National 2,891,587 2,695,510 2,645,782 49,728 1.9%
HUMAN RESOURCES
Social Care Division WTE Ceiling WTE YTD Variance % WTE Variance
Total 24,211.44 24,199.50 -11.94 -0.05%

NOVEMBER 2014 NATIONAL PERFORMANCE ASSURANCE REPORT
44
Mental Health Division
KEY AREAS OF FOCUS
• Quality and Patient Safety • National Office for Suicide Prevention
• Adult Mental Health Services • Mental Health Development Posts
• Acute Adult Inpatient Services • Finance
• Child & Adolescent Community Mental Health Services
QUALITY AND PATIENT SAFETY
The National Service Plan 2014 places a particular emphasis on quality and patient safety. The mental health division continues to implement the HSE incident management policy and guidance with particular emphasis on management of serious incidents including Serious Reportable Events (SREs). A divisional Incident Support and Learning Team is now established and continues to provide support and oversight of Serious Incident management across the Division. The first of three programmes of System Analysis Investigation training planned for 2014 took place in November, two further programmes are planned for December.
As part of the overall risk management assurance process and to ensure management of risk issues identified at Mental Health Area Level is visible to the Division, each Mental Health Area has submitted a copy of their risk register to the National Division and a quarterly reporting process will be established in 2015.
ADULT MENTAL HEALTH SERVICES
In November, 76% of accepted referrals/re-referrals to General Adult Community Mental Health teams nationally were offered a first appointment and seen within three months (target 75%). The performance in November remained the same as the October figures although the YTD figure is 74%. The national figure can mask variances in performance against the target by individual Teams and the Regional performance for the South and West continues to exceed the national target.
The Did not Attend (DNA) rate for New (including re-referred) Cases for the General Adult Community Mental Health Teams is 21% and this figure is embedded within the reporting on this KPI impacting negatively on reported performance. The Division is working with the Area Mental Health Management Teams to ensure that a standardised approach is taken to managing DNAs across all community mental health teams with the aim of optimising attendance.
97% of accepted referrals/re-referrals to Psychiatry of Old Age Community Mental Health teams were offered first appointment and seen within three months, nationally (target >95%). Performance in November decreased slightly since the October figures but has been consistently on and/or over target in the year to date.
The DNA rate for New (including re-referred) Cases for the Psychiatry of Old Age Community Mental Health Teams is 2%.
ACUTE ADULT INPATIENT SERVICES
In Q2 2014 the number of admissions to adult acute units was 3,240, which is a 4% decrease on the Q2 position in 2013.
In Q2 2014 the number of involuntary admissions to adult acute units was 460, which is a 1% decrease on the Q2 position in 2013.

NOVEMBER 2014 NATIONAL PERFORMANCE ASSURANCE REPORT
45
CHILD AND ADOLESCENT MENTAL HEALTH SERVICE (CAMHS)
A service improvement plan for the CAMHs service has been established which will address the access and use of the CAMHs inpatient and community services. This will consider in more detail the trends in performance and underlying contributing factors, consultant capacity and availability, correlation with availability of other related services e.g. early intervention teams, nature or complexity of any “long waiters” etc. This work is supported by the coming on stream of the development posts allocated to CAMHs from 2012 and 2013. Of the 150.5 WTEs allocated from the 2012 investment to CAMHs, 93.69% or 141 are in post as at end November 2014. Of the 82.5 WTEs allocated from the 2013 investment, 60.6% or 50 are in post. The remaining 32.5 are at varying stages within the recruitment process.
In November, 70% of accepted referrals/re-referrals to Child and Adolescent Community Mental Health Teams were offered a first appointment and seen within 3 months, nationally (target >75%).
The Did not Attend (DNA) rate for New (including re-referred) Cases for the Child and Adolescent Community Mental Health Teams is 13% and this figure is embedded within the reporting on this KPI impacting negatively on reported performance.
The Child and Adolescent Mental Health Service waiting list has increased to 2,709 cases, a 7% increase on the same period last year (2,541) despite a 6% increase in referrals accepted by the service compared to the same time last year and is 8% (168 cases) above the year end target of 2,518 cases. There are 376 individuals or 14% of the waiting list waiting more than 12 months. Of the 63 CAMHS teams, 59% (37) has no-one waiting more than 12 months.
8 (i.e. two teams in DML, one team in DNE, three teams in the South and two teams in the West) of the 24 teams where individuals are waiting over a year make up 63% (238) of the 376 waiting longer than 12 months.
Children and adolescents admitted to approved adult HSE mental health inpatient units
By the end of November, there had been 263 children and adolescent admissions, of which 179 (68%) were to age appropriate Acute Child and Adolescent Inpatient Units and 84 (32%) to approved adult mental health inpatient units. The majority of admissions to approved adult mental health inpatient units are voluntary with parental consent with a very small number under Section 25 of the Mental Health Act 2001. Approximately 85% of admissions to approved adult mental health inpatient units are 16/17 years old and a third are discharged within 2 days and two thirds within a week. The reasons for some of these admissions is mostly related to a crisis admission where no adolescent bed is immediately available. Distance to the nearest CAMHs in-patient unit can also be a factor when immediate assessment and treatment may be the requirement and/or the presenting needs of the young person, who may be nearly 18 years old and more appropriately assessed and treated in an adult unit.
In 2012, the operational capacity of the Child and Adolescent Acute Inpatient Units was 44 (73%) out of a total bed complement of 60. This has increased to 48 beds and the plans to achieve full operational capacity in each unit during 2014 are outlined in the table below. Timeframes have disimproved since earlier reports this year due to issues mentioned in table below.
There are a series of developments underway to improve capacity and response in CAMHs services including the opening of a new day hospital in Galway in Qtr 4 2014 to complement the existing In-Patient and Community CAMH’s services and others which will develop capacity further during 2015 and beyond. A CAMHs service improvement project has been underway since mid 2014 focused on improving and developing all CAMH’s services and specifically in increasing the in-patient capacity. The Service Improvement Project will also concentrate on the most effective use of the existing Units through Standard Operating Procedures and weekly monitoring of the use and throughput of the four Child and Adolescent Units. Staff development and training are also a crucial element of delivering effective and safe services to young people, particularly those that present with challenging behaviour.

NOVEMBER 2014 NATIONAL PERFORMANCE ASSURANCE REPORT
46
HSE CAMHS inpatient bed capacity
Child & Adolescent Inpatient Units
November 2014 Update
Beds Open
Merlin Park Unit, Galway 20 20 Fully Operational
Existing Linn Dara Unit St. Loman’s Hospital
6 6 2 beds opened on 17th November and the remaining 6 to open on Dec 8
th.
New Linn Dara Unit 8 2
St. Joseph’s Unit, Fairview 12 8 Consultant cover has recently been put in place to enable service to increase to 12 beds before the end of 2014.
Eist Linn Unit, Cork 20 12 Capacity has been impacted by the recent resignation of a Consultant in the Unit. Replacement Consultant being actively sought
Total No. of Beds 66 48
NATIONAL OFFICE FOR SUICIDE PREVENTION
The HSE’s National Office for Suicide Prevention (NOSP) leads the national implementation of “Reach Out”, the Government strategy for suicide prevention. The National Office for Suicide Prevention is advancing a National Strategic Framework for Suicide Prevention.
In November,
• The roll out of the national social marketing campaign (#littlethings), launched in October, continued with 30 partner agencies.
• Work continued in Donegal on the national template for the local implementation of the new framework.
• A series of meetings were held with key Government Departments in relation to commitments for the new National Strategic Framework
• A communications working group is planning a strategy for the launch of the new framework, and the key communication inputs that will be included in the framework – e.g. media monitoring and web based platforms.
• A recruitment campaign for 7 new Regional Resource Officers for Suicide Prevention continued.
• Meetings were held with the Northern Ireland Public Health Agency in relation to cross border cooperation.
• Comhairle na nOg National Showcase was supported
MENTAL HEALTH WORKFORCE
The Table below provides detail of the Mental Health staffing by Staff Group
Mental Health Staffing by Category
Staffing Medical/ Dental
Nursing Health & Social Care
Mgt / Admin
General Support Staff
Other Patient & Client Care
Total
*WTEs @ end 2012 715 4,628 740 766 1,038 1,021 8,909
WTEs @ end Dec 2013
715 4,428 1,026 757 986 995 8,906
WTEs @ Nov 2014 709 4,455 1,152 755 925 958 8,953
* WTE = Whole Time Equivalent
The €20m allocated to mental health for 2014 will allow the Mental Health Division commit to approximately 270 posts. As outlined in the National Mental Health Division Operational Plan
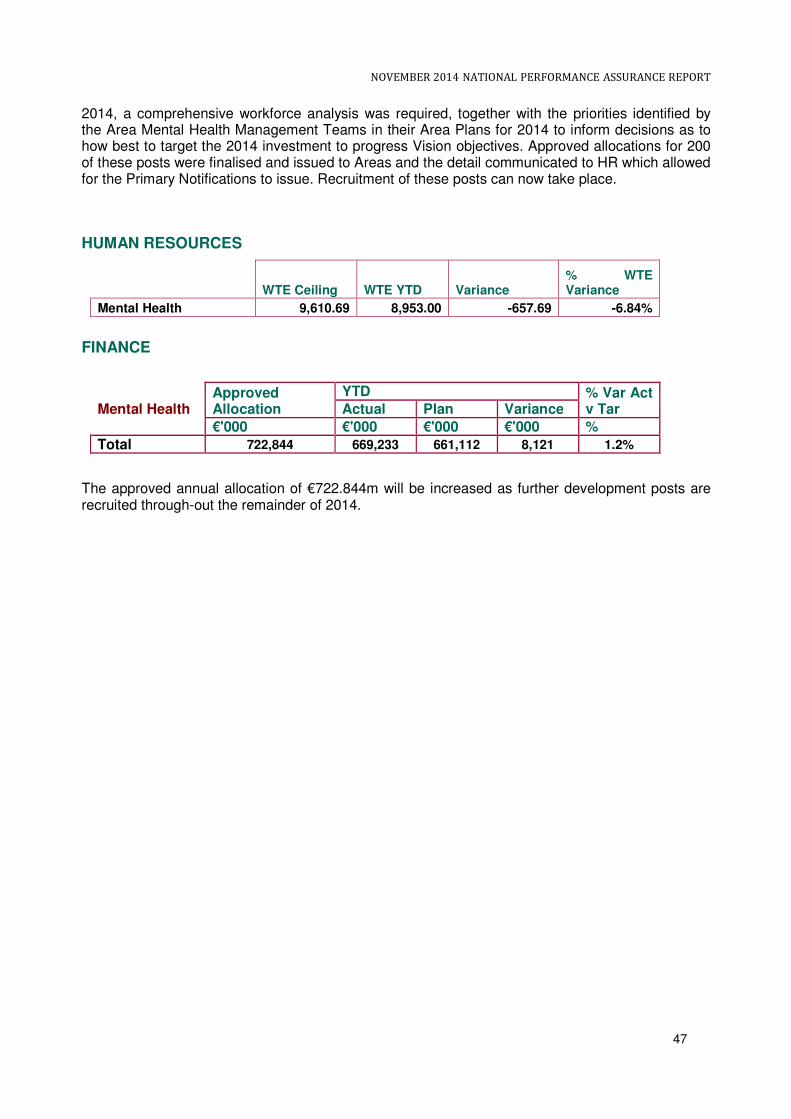
NOVEMBER 2014 NATIONAL PERFORMANCE ASSURANCE REPORT
47
2014, a comprehensive workforce analysis was required, together with the priorities identified by the Area Mental Health Management Teams in their Area Plans for 2014 to inform decisions as to how best to target the 2014 investment to progress Vision objectives. Approved allocations for 200 of these posts were finalised and issued to Areas and the detail communicated to HR which allowed for the Primary Notifications to issue. Recruitment of these posts can now take place.
HUMAN RESOURCES
WTE Ceiling WTE YTD Variance
% WTE Variance
Mental Health 9,610.69 8,953.00 -657.69 -6.84%
FINANCE
The approved annual allocation of €722.844m will be increased as further development posts are recruited through-out the remainder of 2014.
Mental Health Approved Allocation
YTD % Var Act v Tar Actual Plan Variance
€'000 €'000 €'000 €'000 %
Total 722,844 669,233 661,112 8,121 1.2%

NOVEMBER 2014 NATIONAL PERFORMANCE ASSURANCE REPORT
48
Human Resources WORKFORCE POSITION
WTE Overview Year-end ceiling
Ceiling Nov 2014
WTE Nov 2014
WTE Variance Nov 2014
WTE Variance against
Year-end ceiling
% WTE Variance Nov 2014
% WTE Variance against
Year-end ceiling
Total Health Service 94,209 94,895 97,574 +2,679 +3,365 +2.8% +3.6%
WTE Overview by Division
WTE Oct 2014
Ceiling Nov 2014
WTE Nov 2014
WTE Change
since Oct 2014
WTE Change
from Dec 2013 to
Nov 2014
WTE Variance Nov 2014
% WTE Variance Nov 2014
Acute Services 49,300 46,151 49,478 +178 +1,209 +3,328 +7.2%
Mental Health 8,978 9,611 8,953 -24 +37 -658 -6.8%
Primary Care 9,465 9,457 9,452 -13 +35 -5 -0.1%
Social Care 24,200 24,243 24,232 +32 -159 -11 -0.0%
Health & Wellbeing 1,249 1,228 1,237 -12 -29 +9 +0.8%
Ambulance Services 1,614 1,645 1,626 +11 +10 -19 -1.2%
Corporate & HBS 2,590 2,561 2,596 +6 -23 +34 +1.3%
Total Health Service 97,395 94,895 97,574 +178 +1,080 +2,679 +2.8%
� 97,574 WTEs at end of November with employment levels 1,080 WTEs above end 2013, excluding the Nurse Graduate Programme and Support Staff Intern Scheme.
� Upward employment growth pressures continue to be seen year-to-date with an increase of 1,080 WTEs compared to a decrease of 1,572 WTEs for same period in 2013, with Acute Services being the primary driver, up 1,209 WTEs (reduction of 696 WTEs in same period 2013).
� All staff categories except General Support Staff recorded increases this month. Some of the main messages are as follows. Consultant WTEs increased by 8 WTE. They are 74 WTEs above end 2013 levels. Consultant WTEs now constituting some 2.6% of overall health sector employment up from just over 2% in 2008. NCHDs WTEs increased this month by a further 24 WTEs and are now 371 WTEs above end 2013 levels.
� Since November 2007, a reduction of 15,197 WTEs has been recorded in employment levels (-13.48%).
� This is slightly distorted by the transfer of Children and Families staff to the new Agency (3,204 WTEs - estimated), the transfer of Community Welfare Services to the Department of Social Protection (1,000 WTEs), set against the filling of new service developments, subsumed agencies and other staff not previously returned in census (combined 4,149 WTEs), which would indicate that the true change from the peak in recorded employment is overstated by 56 WTEs. Accordingly adjusted employment in the health services has reduced by 15,142 WTEs approximately from the peak (-13.2%).

NOVEMBER 2014 NATIONAL PERFORMANCE ASSURANCE REPORT
49
EMPLOYMENT CEILING COMPLIANCE
� The Health Sector is 2,679 WTEs above the current employment ceiling of 94,895 WTEs (excludes CFA initial ceiling of 3,443 WTEs and includes half-yearly downward adjustment for 2014) and is 3,365 WTEs above notified end-2014 target of 94,209 WTEs excluding CFA.
� Primary Care, Social Care, Mental Health and Health & Wellbeing are currently under ceiling and Acute Services is 3,328 WTEs above ceiling with an increase there of 1,209 WTEs in employment levels over end of 2013 levels. The level of real growth is higher at 1,661 WTEs in this Division when growth in the Nurse Graduate Programme and Support Staff Scheme are factored in.
� The other Divisions are marginally above their current allocated ceilings.
GRADUATE NURSE & SUPPORT STAFF SCHEMES
The Nurse Graduate Programme recorded 327 placements with a 319 WTE value in November, down 26 WTEs from last month. The Support Staff Intern Scheme continues to grow with a total of 1,210 people on placement, with 1,155 WTE value. Both these schemes are excluded from reported WTEs for ECF purposes, but reflect a combined increase from end of 2013 of +973 WTEs.
NEW SERVICE DEVELOPMENTS
782 WTEs of 2013 new service development posts filled, up 22 WTEs from October (130.7 WTEs - National Ambulance Service, 241.5 WTEs - Primary Care, 343 WTEs - Mental Health Services, 45 WTEs - Acute Services and 21 - Finance). 38.8 WTEs of 2014 new service development posts filled to date, up 9 WTEs from October (29 WTEs National Ambulance Service, 9.8 WTEs Acute Services).
ABSENCE RATES
Target Outturn
2013
Outturn October
2014
Actual RTM
YTD
% Medically Certified (October
2014)
% Medically Certified
(YTD)
Absence Rates 3.50% 4.73% 4.10% 4.08% 4.29% 89.41% 90.69%
Absence Rate is the term generally used to refer to unscheduled employee absences from the workplace. Absence rate is defined as an absence from work other than annual leave, public holidays, maternity leave and jury duty. The HSE’s National Service Plan 2014 sets absence rates as a key result area (KRA) with the objective of reducing the impact and cost of absence and commits to a national target level of 3.5% for all hospitals and agencies. The HSE continues to review its current sick leave policies and procedures as well as having a range of current supports and interventions to address challenges being encountered in the whole area of attendance management and absence rates through ill health. The objective of all these actions is to enhance the health sector’s capacity to address and manage more effectively absence rates, support people managers in better managing the issue, while also supporting staff regain fitness to work and resume work in a positive and supportive environment as well as of course the key objective of reducing the impact and cost of absence.

NOVEMBER 2014 NATIONAL PERFORMANCE ASSURANCE REPORT
50
Latest monthly figures (October 2014)
• Latest National absence rate data shows that the absence rate for October 2014 is at 4.10%.
• This compares with previously published October rates of 5.59% (2008) 5.51% (2009) 4.80% (2010) 4.97% (2011) 4.74% (2012) and 4.84% (2013).
• In October 90.69% of absence was medically certified which is a marginal increase on September (90.41 % YTD).
YTD 2014 Trend Analysis – 2008 onwards
• Absence rates have been collected centrally since 2008 and in overall terms, there has been a general downward trend seen over that time.
6.89%
5.85%5.77%
4.94%
4.53%
4.78%
5.22%
4.62% 4.43%
4.83%
4.71%4.84%
3.98% 4.05% 4.07% 4.07% 4.10%
3.5%
3.2%
3.7%
4.2%
4.7%
5.2%
5.7%
6.2%
6.7%
7.2%
Jan Feb Mar Apr May Jun Jul Aug Sept Oct Nov Dec
2008 2012 2013 2014 Target

NOVEMBER 2014 NATIONAL PERFORMANCE ASSURANCE REPORT
51
Finance
OVERVIEW
The HSE’s 2014 National Service Plan made clear that the HSE was facing the most severe financial challenge in 2014 resulting from the continued reduction in its funding base and the significant additional savings required. Between 2008 and 2013 the Health Service costs/budgets have reduced by €3.3bn (22%) and this rises to €4bn (27%) when the 2014 requirement is included. This is in the context of an increased demand for services, more services being provided with significantly less resources and the loss of more than 10% of our staff. Net expenditure year to date November 2014 is €11.090 billion against the available budget reported at €10.626 billion leading to a reported deficit of €464m.
Actual Plan Variance
€'000s €'000s €'000s €'000s
Total Acute Division* 3,841,619 3,751,051 3,512,956 238,095 6.78%
Total Primary Care Division 3,246,870 3,079,789 2,967,374 112,415 3.79%
Total Health & Wellbeing Division 207,373 166,550 186,636 - 20,086 -10.76%
Total Social Care Division 2,891,587 2,695,510 2,645,782 49,728 1.88%
Total Mental Health Care Division 722,844 669,233 661,112 8,121 1.23%
Pensions 393,647 396,754 362,636 34,118 9.41%
Other including National Services, Regional Services,
Corporate and Held Funds**, etc 287,002 331,182 289,409 41,773 14.43%
Total 11,590,942 11,090,069 10,625,905 464,164 4.37%
Expenditure by Category and Division
Approved
Allocation
YTD November 2014
% Var Act v
Tar
The acute hospital sector (including Palliative Care) is reporting a deficit of €238m at the end of November which represents 53% of the overall deficit.
AGENCY SERVICES
HSE year to date agency costs were €311m versus €224m for the corresponding period in 2013, an increase of €87m (39%) year on year. Agency costs incurred in acute hospital services were €208m and this compares to €148m for the same period last year. The 2014 agency costs for hospitals include €90m in respect of the medical/dental pay category. Hospital agency costs overall have increased by €60m (up 41%) compared to the same period last year. This primarily reflects the diminishing capacity to recruit doctors and price increases for agency provision rather than volume growth in medical staff inputs.
However, 80% of the increase in hospital agency expenditure is in the medical and support services pay categories. These staff were already at the HRA maximum hours and therefore the hospitals did not benefit from additional hours. Cost growth and under performance in cost containment plans are also currently evident.

NOVEMBER 2014 NATIONAL PERFORMANCE ASSURANCE REPORT
52
FINANCIAL RISKS
Based on the first eleven months figures the HSE is not flagging any new financial risks beyond those set out in the service plan, however it should be noted that the financial risks include a number of items which are not fully within the control of the HSE: This includes a range of items including:
• €108m - unspecified pay savings which are subject to engagement with the relevant departments.
• €63m - temporary assignment of pension funding to earlier probity target which adjusted the impact of same subject to engagement with relevant department.
• €45m - Various other items not within or fully within the control of the HSE
o €12m - Targeted savings related to the proposed introduction of a nurse bank. The
proposal assumed external approval and legacy capacity around creating the necessary
employment subsidiary and this is currently the subject of engagement with the relevant
departments.
o €10m - Graduate Nurses savings target within the 2013 NSP related to PSA I –
overtaken by PSA II Graduate Nurses and Support Interns schemes which are the
subject of separate budget reductions.
o €7m - Excess target re full year effect of adjusting the asset based contribution in the
Fair Deal scheme.
o €5m - Target related to proposed licensing of tobacco retailers. Dependant on the
introduction of new legislation.
o €11m PCRS - dependant on legislation, DoH looking at alternative options.
• €5m - Local “demand led” schemes savings targets (community aids and appliances, hardship medicines, etc) – deficit in the first eleven months of 2014 €44m, despite ongoing work programme in place to standardise nationally and seek to safely reduce costs.
• The scale of the PCRS savings target for 2014 of €249m is a very significant challenge given that it follows the €353m targeted for 2013. This includes original medical card probity targets.
HADDINGTON ROAD AGREEMENT (HRA)
The HSE is committed to maximising delivery on the €276m6 HRA savings target given that the agreement represents an essential tool for the HSE to safely reduce pay costs without impacting services. Current analysis and implementation plans indicate a stretched gross delivery of €210m7 or over 75% is achievable utilising the levers made available through the HRA. A full HRA implementation plan has been submitted to DPER/DoH in this respect. The valuation of the maximum delivery was completed in August and it is estimated that the HRA has delivered approximately €192m (gross) to the end of November 2014.
CONCLUSION
The health service has experienced budget cuts / savings targets of over €3.5bn over the last 6 years which is at odds with the experience in the vast majority of OECD countries where “cuts” to health generally refer in reality to a slow-down in the rate of their cost growth rather than an actual year on year reduction.
The revenue deficit (on an income and expenditure basis) to year end for the health service is currently estimated at €510m. The supplementary estimate for 2014 will need to encompass this deficit as well as an expected over run on costs incurred by the State Claims Agency in respect of
6 €276m is exclusive of the €14m assigned to TUSLA / CFA.
7 Draft figure as validation exercise currently being finalised.
NOVEMBER 2014 NATIONAL PERFORMANCE ASSURANCE REPORT
53
health service claims and any other technical cash/vote accounting items. This forecast takes account of our best estimate of likely cost increases to year end mitigated by our ongoing cost containment plans. It is important to stress that, as with any forecast, there is a certain degree of uncertainty particularly given the scale of the overall HSE cost base, the complexity of our services and the lack of a national financial system. For example a “margin for error” of one tenth of one per cent (0.1%) equates to close to €12m.
The arrival at this 2014 level of deficit indicates that our net costs will have risen 1.8% between 2013 and 2014 or by 0.7% if we look at the 2 year period from 2012 to 2014. However, a longer term view indicates that from 2009 to 2014 our costs will have fallen by 6.5% despite for example the growth in population of circa 3.5% and a much higher increase in the very elderly (85+ years of age) population at over 20%.
It is important to stress that in excess of €250m or around 50% of this 2014 deficit relates to budget reductions assigned to the HSE which were outside of its control and therefore not deliverable (includes €108m unspecified pay savings, €30m pensions excess etc.).
Despite the demographic and other service pressures which drive costs to increase, the C&AG 2012 report shows that of the 6 government departments / agencies that generally required a supplementary estimate between 2008 and 2012 the Health Service had the lowest average annual supplementary at 1.3% compared to a range of 1.7% to 7.1% for the other 5, none of which operate in as complex an area as health.
Similarly, despite much adverse media comment, over the period 2008 to 2013:
• The HSE received just 0.19% / €137m in supplementary estimates related to its core services i.e. was 99.8% compliant with the available budget over the period.
• It received 0.63% / €452m in supplementary estimates related to Medical Cards / GMS Drugs / Demand Led Schemes etc. This indicates it was 99.4% compliant with the available budget over the period despite these PCRS areas not being within the sole control of the HSE.
• 71% of the total supplementary estimates were related to Exchequer / Technical items that do not reflect its financial performance.