re thinking th e mosaic - rethinking - IRC
315
Themes from Collaborative Research n Institute of Development Studies, Jaipur n Institute for Social and Environmental Transition, Boulder n Madras Institute of Development Studies, Chennai n Nepal Water Conservation Foundation, Kathmandu n Vikram Sarabhai Centre for Development Interaction, Ahmedabad Investigations into Local Water Management Contributing Authors Paul Appasamy, Sashikant Chopde, Ajaya Dixit, Dipak Gyawali, S. Janakarajan, M. Dinesh Kumar, R. M. Mathur, Marcus Moench, Anjal Prakash, M. S. Rathore, Velayutham Saravanan and Srinivas Mudrakartha Edited by Marcus Moench, Elisabeth Caspari and Ajaya Dixit RETHINKING THE MOSAIC RETHINKING THE MOSAIC
-
Upload
khangminh22 -
Category
Documents
-
view
1 -
download
0
Transcript of re thinking th e mosaic - rethinking - IRC

Themes from Collaborative Research� Institute of Development Studies, Jaipur
� Institute for Social and Environmental Transition, Boulder� Madras Institute of Development Studies, Chennai� Nepal Water Conservation Foundation, Kathmandu
� Vikram Sarabhai Centre for Development Interaction, Ahmedabad
Investigations into Local Water Management
Contributing AuthorsPaul Appasamy, Sashikant Chopde, Ajaya Dixit, Dipak Gyawali, S. Janakarajan, M. Dinesh Kumar,
R. M. Mathur, Marcus Moench, Anjal Prakash, M. S. Rathore, Velayutham Saravanan and Srinivas Mudrakartha
Edited byMarcus Moench, Elisabeth Caspari and Ajaya Dixit
RE
THIN
KIN
GTH
EM
OS
AIC
RETHINKINGTHE MOSAICRETHINKINGTHE MOSAIC
�
1999
Investigations into Local Water Management
RETHINKINGTHE MOSAIC
Themes from Collaborative Research� Institute of Development Studies, Jaipur
� Institute for Social and Environmental Transition, Boulder� Madras Institute of Development Studies, Chennai� Nepal Water Conservation Foundation, Kathmandu
� Vikram Sarabhai Centre for Development Interaction, Ahmedabad
Edited byMarcus Moench, Elisabeth Caspari and Ajaya Dixit

�
© Copyright, 1999
Institute of Development Studies (IDS)
Institute for Social and Environmental Transition (ISET)Madras Institute of Development Studies (MIDS)Nepal Water Conservation Foundation (NWCF)
Vikram Sarabhai Centre for Development Interaction (VIKSAT)
No part of this publication may be reproduced nor copied in anyform without written permission.
Supported by International Development Research Centre (IDRC)Ottawa, Canada and The Ford Foundation, New Delhi, India
First Edition: 1000
December, 1999.
Price
Nepal and India Rs 1000Foreign US$ 30Other SAARC countries US$ 25.
(Postage charges additional)
Published by: Nepal Water Conservation Foundation, Kathmandu,and the Institute for Social and Environmental Transition, Boulder,Colorado, U.S.A.
DESIGN AND TYPESETTING
GraphicFORMAT, PO Box 38, Naxal, Nepal.
PRINTED AT
Jagadamba Press PO Box 42, Patan Dhoka, Nepal.

�
The research programme was undertaken through grants from theInternational Development Research Centre (IDRC) and The Ford Foundation,New Delhi. Their support and patience is gratefully acknowledged. The PacificInstitute for Studies in Development, Environment, and Security provided muchneeded support. Special mention is also essential for the careful and detailedwork on document layout and map design done by Anil Raj Shrestha andSunil Shrestha of GraphicFORMAT. Ajaya Dixit supervised production of thispublication. Opinions expressed in the papers are those of the authors, not theeditors or the organizations supporting the research. Kanchan Dixit alsoprovided much needed support. Thanks are also due to everyone who hascontributed views and insights at different stages of the research programme.Photographs were contributed by Marcus Moench, Ajaya Dixit, Dipak Gyawali,Salil Subedi, S. Janakarajan and VIKSAT.
Acknowledgments

About the Study This is the report of the first phase of the collaborative program on Local Supply andConservation Responses to Water Scarcity supported by the International DevelopmentResearch Centre (IDRC) and The Ford Foundation. The study investigated watermanagement issues of four river basins: the Palar, the Sabarmati, and the Shekhawatiin Tamil Nadu, Gujarat, and Rajasthan respectively as well as the Tinau in Nepalthat joins the West Rapti in Uttar Pradesh. Water management challenges in theNoyyal and the Bhavani basins of Tamil Nadu were also investigated.
In the first three basins, water scarcity is an increasingly grim reality. Theorganizations and their principal investigators have extensive experience in analysingwater management issues in scarcity situations. The fourth river basin was selectedto capture the physical diversity of a Himalayan river and to analyse the watermanagement concerns in an area of Nepal and India that is ostensibly rich in waterresources but is beginning to confront a situation of stress.
Though collaborative, the study implementation did not provide scope for thekind of process envisaged in the design. As such, methodological differences areevident. While studies in India followed the social science research model, the studyon the Tinau used an ethno-ecological approach. The collaborative exercise, however,did include series of meetings and sharing of research tools as well as ideas. Threemajor events were the April 1998 Writing Workshop in Kathmandu, the January 1999Chennai Meeting and the May 1999 Ahmedabad Workshop where the findings of thestudy were reviewed, analysed and critiqued. There were regular interactions via emailas well as joint field visits.
The participating institutions, their principal investigators and supporting staffs were:��������������� ��������������� �������
M. S. Rathore and R. M. Mathur
���������� ������ � ��������������� �������������� ����
Marcus Moench and Elisabeth Caspari
������� ��������������� �����������������������
S. Janakarajan, Paul Appasamy, Velayutham Saravanan, supported by S. Jothi and
K. Sivasubramaniyan
���� ������������������ ���������!���������
Dipak Gyawali, Ajaya Dixit, supported by Sudhindra Sharma and Ngamindra Dahal
"�#��������$����������� ������ ������ ������������ %�����$���
M. Dinesh Kumar, Shashikant Chopde, Srinivas Mudrakartha and Anjal Prakash

PALAR, BHAVANI AND NOYYAL
TINAUSHEKHAWATI
SABARMATI
INDIA
NEPAL
BAY OF BENGAL
ARABIAN SEA
LOCATION OF RIVER BASINS
��

Preface ix
CHAPTER 1 Addressing Constraints in Complex Systems 1Meeting the Water Management Needs ofSouth Asia in the 21st CenturyMarcus Moench
CHAPTER 2 Fractured Institutions and Physical Interdependence 57Challenges to Local Water Management in theTinau River Basin, NepalDipak Gyawali and Ajaya Dixit
CHAPTER 3 Conflicts over the Invisible Resource in Tamil Nadu 123Is there a way out?S. Janakarajan
CHAPTER 4 Historical Perspectives on Conflicts over Domestic andIndustrial Supply in the Bhavani and Noyyal Basins,Tamil Nadu 161Velayutham Saravanan and Paul Appasamy
CHAPTER 5 Addressing Water Scarcity 191Local Strategies for Water Supply and ConservationManagement in the Sabarmati Basin, GujaratM. Dinesh Kumar, Shashikant Chopde, Srinivas Mudrakarthaand Anjal Prakash
CHAPTER 6 Dug Well Recharging in Saurashtra, Gujarat 247A Local Response to Water ScarcityM. Dinesh Kumar, Shashikant Chopde and Anjal Prakash
CHAPTER 7 Local Strategies for Water Management and Conservation 261A Study of Shekhawati Basin, RajasthanM. S. Rathore and R. M. Mathur
CHAPTER 8 Ways Forward 301
Contents

P R E F A C E
ix
From the Ganga in the north to the Cauvery in the south, rivers of South Asia havecarried the political, economic and social history of the region with them. As theyflow from the highland ranges of the Himalaya, Western Ghats or the Aravallis towardsthe Bay of Bengal or Arabian Sea, these rivers have become intertwined with thehopes and aspirations of the people who live in their basins. Today, water systems inthe region are under stress. Growing demands from agriculture, industry and urbangrowth stretch available supplies while pollution undermines the quality of the resourcebase. Addressing these problems will require a level of understanding andmanagement far beyond that needed during the entire previous history of waterdevelopment. Building the institutions and scientific understanding essential to enablemanagement represents one of the most important challenges facing the region. Inmany ways, this challenge is one of understanding social change and its dynamics.Approaches to it stem from concepts – either implicit or explicit – regarding the roleof different groups within society and of the state and also why individuals andgroups behave the way they do. These underlying concepts, and the differing sets ofassumptions social actors make based upon them, are rarely explicit in debates overwater management. The set of papers in this volume represent an initial effort toclarify key elements in debates over the role of decentralized, “local” institutions andthe participatory processes necessary to initiate effective water management.
“Local,” “participatory” approaches to water management are often proposed asalternatives to large scale centralized initiatives managed by the State. Whilecentralized State initiatives draw on a long history of water resources development,relatively few data exist on the nature and limitations of more localized approaches.In addition, the terms “local” and “participatory” are vague. What “local” and“participatory” mean is unclear both in terms of physical scale and the social processesinvolved. In many cases, local management seems to be approached as simply asmall-scale version of larger levels of organization. Local management organizationsare expected to take on a similar array of functions (though scaled down and requiringless technical expertise) as their larger State cousins and are even characterized asoperating through a similar analytical decision-making process. Where scale isconcerned, they are intended to take responsibility for a hydrologic unit or waterdelivery system (aquifer, river basin, irrigation system or municipal supply facility).This “local” hydrologic unit or system is seen as a single element among an arrayof other similar local elements that are governed at some ultimate level by the State.
More often than not, the existence of such an “overall system” is itself anassumption, as is the belief at the central levels that local management units are
PREFACE
In many cases,local management
seems to beapproached as asmall-scale version
of larger levels oforganization.

x
P R E F A C E
similar or guided by similar sets of managementconcerns. This hierarchic “rationalist” model israrely explicitly spelled out but implicitly underliesmany recent attempts to develop “local”,“participatory” water management organizations.The development of water user associations insurface irrigation systems is, for example, amajor case in point. In contrast to the model,local systems (as the cases in this volume show)are richly heterogeneous in their managementstyles and objectives. Attempting to force theminto a unitary framework based on how they“should” work is unrealistic. Similarly, the“overall system” itself is a policy terrain that iscontested at various levels.
The rationalist model of policy reform andmanagement is implicitly based on concepts ofsocial behaviour and the role of organizations thatare far removed from local dynamics. In theassumed model, arguments for policy reform aredeveloped from careful multi-disciplinary analysisand directed to high-level decision makers. Thesedecision makers are assumed to be patriarchalrationalists who synthesize available informationand make informed, objective decisions within theconstraints imposed by an external unruly world.In practice, policy decisions are widely recognizedas occurring within a complex environment inwhich numerous social actors cognize andstrategize with varying degrees of certainty orobjectivity. The lack of progress in developingeffective water management approaches is oftenviewed as related to these inherent imperfectionsin decision-making. This is, however, often notseen as a fundamental flaw in the model. Instead,failures are generally attributed to “external”factors such as “lack of political will,” “vestedinterests” or “imperfect information.”
Initiating local management within thishierarchic framework is generally portrayed as aprocess of policy reform. Organizational modelsare developed and tested through policy researchand pilot projects. Analysts evaluate pilot projectresults and recommend appropriate policy changesto higher-level decision-makers. Once decisionsare made, policy reforms are assumed to take placeenabling widespread formation of “improved”(that is more local and participatory) managementorganizations. These organizations are thenassumed to be capable of “managing” local waterresources through a relatively standard array ofplanning, regulatory, monitoring, technical andother techniques.
While the papers in this volume do not analysepolicy reform models directly, taken together theysuggest a fundamentally new approach to theevolution of effective management responses. Allthe case studies highlight the dynamic interlinkagebetween physical water resource systems and thelarger social, economic and institutional contextwithin which they are managed. The studies alsohighlight the wide variety of actors whoseindividual or collective decisions influence wateruse patterns and, ultimately, water managementneeds and options. Together they imply that, ratherthan the hierarchic and prescriptive top downreform model underlying most conventional policyanalysis, reform must involve a much more open,non-linear and on-going process of social dialogueand debate. This flexible “bottom-up” approachis essential if complex water management systemsare to be nudged toward less stressful and conflictridden paths in the future.
The effectiveness of this process is dependenton recognizing three strands in an overall
To force localwater
managementsystems into aunitary
frameworkbased on howthey “should”
work isunrealistic.

P R E F A C E
xi
management triad that need to be in dynamic andcreative engagement. The difference between themodel of policy reform suggested here and thelinear model assumed in most water managementdebates is outlined below. At the centre of thisperspective lie water users in all their diversity. Asthe first strand in the triad, they are not mute,atomized and passive actors that will do as theyare told. On the contrary, they actively cognize,strategize and make decisions – individually andcollectively – to further what they perceive to betheir advantage. These interests more often thannot differ from those that water managers (thesecond strand in the triad) may prescribe. Thisdiscrepancy between what the users want and whatthe managers think they “should” want cannotbe resolved within the hierarchic “rationalist”
model, which essentially upholds the principle ofinstitutional monism.
The third strand consists of what we call “socialauditors”. They are the “watch dog” social activistsas well as various organs of the state that areresponsible for assuring appropriate justice. Theyare not users or managers, and their concernsoften stem from different callings – those of equity,sustainability and fair play. Linear policy modelsthat account for the users at the bottom and themanagers at the top are often at a loss when theseactors enter the fray – often in the event thatcontradictions emerge between the avowedobjectives of management and its practice. Exceptfor extreme cases of bureaucratic rigidity, socialauditors from the activist mould and from within
Reform mustinvolve a much
more open, non-linear and on-
going process of
social dialogue.
Figure 1:Stakeholders’ framework.
�������� ����� ���� �������
������� ��� ��������������� ��!�
����
��������
��������
�"����#����
$�##����������# %����
����"������� �������
$�&#�� '��(��� �������
��)� '�������������
��!������ �������
���*�
�����
���������
����# ��!�#� ������ �������
��*�
xii
P R E F A C E
the government do often work together to assureproper functioning by the concerned waterbureaucracy. They also often act as catalysts forchange. Furthermore, even as the managers of adepartment may advocate hierarchicaladministrative approaches to water management,significant sections of the state machinery,including the judiciary and units of localgovernance, often assert themselves in upholdingpoints of equity, democratic process and socialjustice. These catalyzing changes can thus comefrom any section.
The above approach to understanding andapproaching water management is a dynamic onebased on social process. In it, as with anydemocratic constitution or pluralistic scheme, the
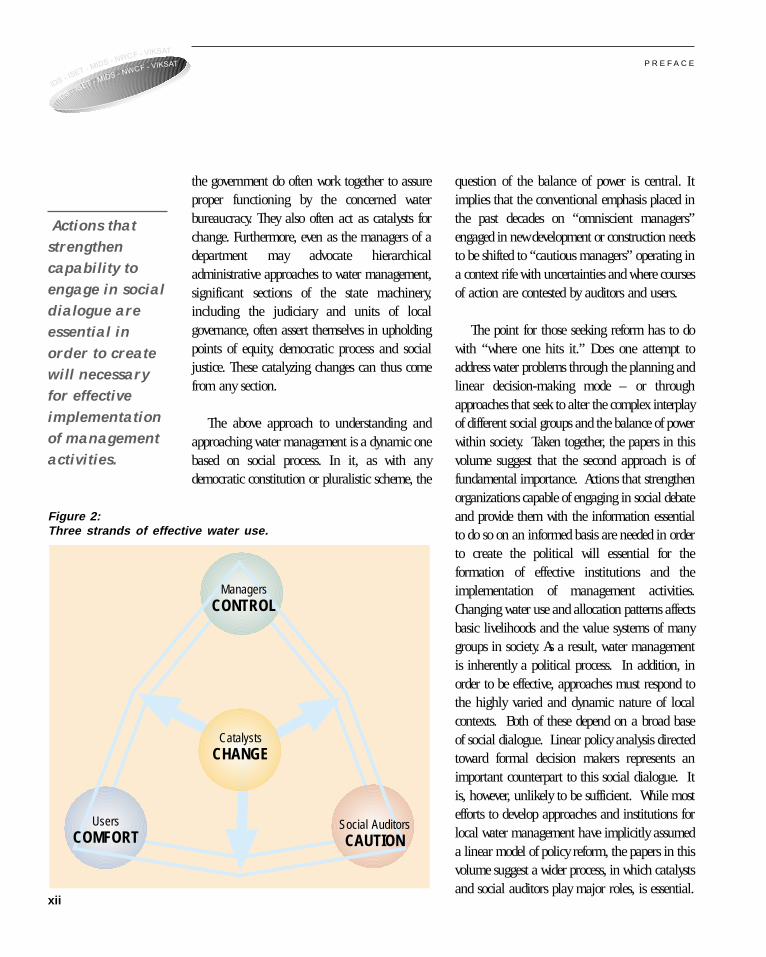
Figure 2:Three strands of effective water use.
question of the balance of power is central. Itimplies that the conventional emphasis placed inthe past decades on “omniscient managers”engaged in new development or construction needsto be shifted to “cautious managers” operating ina context rife with uncertainties and where coursesof action are contested by auditors and users.
The point for those seeking reform has to dowith “where one hits it.” Does one attempt toaddress water problems through the planning andlinear decision-making mode – or throughapproaches that seek to alter the complex interplayof different social groups and the balance of powerwithin society. Taken together, the papers in thisvolume suggest that the second approach is offundamental importance. Actions that strengthenorganizations capable of engaging in social debateand provide them with the information essentialto do so on an informed basis are needed in orderto create the political will essential for theformation of effective institutions and theimplementation of management activities.Changing water use and allocation patterns affectsbasic livelihoods and the value systems of manygroups in society. As a result, water managementis inherently a political process. In addition, inorder to be effective, approaches must respond tothe highly varied and dynamic nature of localcontexts. Both of these depend on a broad baseof social dialogue. Linear policy analysis directedtoward formal decision makers represents animportant counterpart to this social dialogue. Itis, however, unlikely to be sufficient. While mostefforts to develop approaches and institutions forlocal water management have implicitly assumeda linear model of policy reform, the papers in thisvolume suggest a wider process, in which catalystsand social auditors play major roles, is essential.
ManagersCONTROL
UsersCOMFORT
Social AuditorsCAUTION
CatalystsCHANGE
Actions thatstrengthencapability to
engage in socialdialogue areessential in
order to createwill necessaryfor effective
implementationof managementactivities.

Meeting the Water Management Needsof South Asia in the 21st Century
Addressing Constraints inComplex Systems
Marcus Moench
C H A P T E R 1

2
A D D R E S S I N G C O N S T R A I N T S I N C O M P L E X S Y S T E M S
Objectives
Water management is inherently a question of governance. Water related issues ripple
throughout society and affect basic livelihoods and deeply embedded social values. As a
result they must be addressed at a societal level through the complex array of political,
economic, institutional and social processes by which society governs itself. That is, perhaps,
the single most important theme running throughout research by the collaborative group
and, as a result, this paper.
Water management represents one of the mostfundamental challenges facing South Asia in
the 21st century. Over the last century, increasesin irrigation provided the foundation on whichagricultural growth, poverty alleviation andultimately the growth of national economieshave rested. Progress has been substantial, butmuch of it may prove unsustainable. In manyareas, pollution, groundwater overdraft, waterscarcity and the unanticipated impacts ofhuman actions on complex water systemsthreaten both the environment and the economicfoundations of society. The problem is not justone of water scarcity or resource degradation.Land use changes and rapid increases in thepopulation living within flood zones underliemajor increases in both flooding and itsimpacts. Maintaining the environment whilemeeting the basic food, domestic and qualityof life needs of growing populations in SouthAsia will require fundamental changes in the waywater resources are used and managed.Furthermore, much of the physical andinstitutional infrastructure for water managementcreated over recent decades is poorly designed anddecaying. The costs of system reform and
rehabilitation strain national accounts. Forinvestments to be effective, fundamentalchanges in physical and institutional infrastructureare needed.
Fundamental change is easy to recommend buthard to implement. Conditions and managementneeds evolve over time and the physical natureof water resource problems varies betweenlocations and scales of management or analysis.Cultural, economic and political contexts also varyand with them the social viability of differentmanagement interventions. Furthermore,institutions – although often vibrant when new –rapidly become rigid and entrenched, unable torespond to changing conditions. In combination,the above factors necessitate water managementstrategies capable of producing effective actionwithin socially complex and continuously evolvingcontexts. Strategies dominating current debatesover water resource issues provide, at best, a partialbasis for this.
The purpose of this report is to presentpreliminary results from a series of case studiesundertaken by the collaborative project on
Conditions andConditions andConditions andConditions andConditions and
managementmanagementmanagementmanagementmanagement
needs evolveneeds evolveneeds evolveneeds evolveneeds evolve
over time.over time.over time.over time.over time.

3
A D D R E S S I N G C O N S T R A I N T S I N C O M P L E X S Y S T E M S
Preliminary Implications for Policy and Implementation
The tremendous diversity of problems, contextsand opportunities for water management that
exist in local areas is the primary initial resultof the collaborative research project on LocalSupply and Conservation Responses to WaterScarcity. This result is, in one sense, trivial –saying that conditions vary greatly between areasisn’t a particularly profound insight. In anothersense, however, the result is far from trivial. Thehistory of water management is, in many ways,a history of searches for universally applicablesolutions. The “development era” focused onconstruction of large-scale infrastructure projects– dams, municipal supply systems, irrigationsystems and embankments – as the single mostimportant set of interventions to meet watermanagement needs. In a similar manner, manynow advocate economic pricing, basin approaches,integrated planning, the development ofparticipatory water management institutions anddemand side management as “the” solution tomanagement needs. The case studies presented
here, in contrast, highlight the potential rolemultiple sets of management actions at differentlevels of intervention might play in meetingmanagement needs within different areas. We donot see any particular set of water managementinterventions per se as having universalapplicability – too much depends on the localcontext.1 Furthermore, socioeconomic and politicalconsiderations in all localities often dominate otherconsiderations in determining the types ofinterventions that could, practically, beimplemented.
The diversity of local contexts and thedominant role of social and political considerationsleads to what we see as a broadly applicable andan important result for the study. Society’s abilityto respond to local water management needsdepends on information and understanding ofemerging problems. Beyond this, it is primarilyan issue of governance, process and the structureof civil society.
Society’s abilitySociety’s abilitySociety’s abilitySociety’s abilitySociety’s ability
to respond toto respond toto respond toto respond toto respond to
local waterlocal waterlocal waterlocal waterlocal water
managementmanagementmanagementmanagementmanagement
needs isneeds isneeds isneeds isneeds is
primarily anprimarily anprimarily anprimarily anprimarily an
issue ofissue ofissue ofissue ofissue of
information,information,information,information,information,
governancegovernancegovernancegovernancegovernance
processes andprocesses andprocesses andprocesses andprocesses and
the structure ofthe structure ofthe structure ofthe structure ofthe structure of
civil societycivil societycivil societycivil societycivil society.....
Local Supply and Conservation Responses to WaterScarcity and to propose a research and actionprogramme through which results can beconfirmed, new insights gained andimplementation catalysed. In addition, thereport identifies conceptual insights that arepractically and strategically central to addressingSouth Asia’s water management challenges inthe 21st century. These insights have beenidentified on the basis of case studies and awider analysis of water management issues.They address key gaps in currently dominantapproaches to water management and suggestnew strategies for action and research.
This chapter is organized in the followingmanner: Key initial results are presented brieflyfirst. The focus then shifts to conceptual insightsgenerated by the collaborative research. Theseconceptual insights are of equal importance as themore immediate policy results because they helpto clarify key elements in the underlyingframeworks that ultimately shape approaches towater management. Emerging physical and socialissues are discussed next with particular referenceto the conceptual elements. The final sectionidentifies ways forward both for approaches towater management in general and for thecollaborative project itself.

4
A D D R E S S I N G C O N S T R A I N T S I N C O M P L E X S Y S T E M S
Unless broad groups of stakeholdersunderstand emerging problems and have aneffective voice in the formulation ofmanagement approaches, solutions willnot evolve, will be stymied by lack ofsupport or will benefit only narrow elites. Asthe diagram on this page illustrates,perceptions of water resources often vary.Interventions that strengthen the ability ofdifferent groups to engage in informeddialogue within civil society are probablythe single most important avenue foraddressing water management needs atall levels.
The above results have majorimplications for water policy andimplementation activities in India andNepal. Instead of implementation policyreforms of the type often advocated,however, the results suggest that keypoints of leverage for addressing watermanagement needs lie in:
1. systems that enable public access to keywater resources information;
2. the location of administrative frameworksand processes for water management thatenable wide-spread public involvement andgive water users a clear role in decision-making processes; and
3. the development of analytical andadvocacy organizations with publicinformation mandates that are capable ofaddressing the socioeconomic dimensions ofwater management as well as the technical.
Aquifer conditions and human perceptions:One reality, many visions
Underground stream
Underground lake
Complex geology

5
A D D R E S S I N G C O N S T R A I N T S I N C O M P L E X S Y S T E M S
Conceptual frameworks are important. They form the basis for management initiatives
implemented by NGOs, state and nationalgovernments and international donor agencies.They are also used as a basis for advocating policyand legal or legislative reforms. The conceptualframeworks that guide most current watermanagement initiatives are, at best, partial. Theycapture or reflect important factors affectingsociety’s ability to manage water resource but alsooften obscure key issues or contain limitations. TheWorld Bank’s Policy Paper on Water ResourcesManagement (quoted above) reflects some of theconceptual themes that run through watermanagement dialogues worldwide including:
Economics: The need to recognize the economicvalue of water and treat it as an economic good;
Integration: The need for integrated approachesto water management and the development ofcomprehensive policy frameworks that address theneeds of multiple users including the environment;
Participation and Decentralization: The need toinvolve stakeholders in water managementinitiatives and decentralize delivery of waterservices for effective management;
Institution Building: The need to createorganizations, rights structures and legislative
frameworks at local, regional, national andinternational levels that can provide a frameworkfor implementing water management actions;
Basin Management: The need to manage waterresources within natural units – generallyriver basins;
Sustainability: The need to manage the waterresource base so that it is passed on undiminishedin quantity and quality to other users and futuregenerations.
Each of the above concepts reflects a history ofresearch and practical experience. The conceptscapture key insights important to effective waterresource management. Yet each concept containsinherent limitations. These limitations – and thesometimes perverse results they generate in thecontext of management initiatives – are importantto recognize. Of more importance, however, is theidentification and development of new or underemphasized concepts that help address theselimitations.
Field case studies and broader analysis byparticipants in the collaborative researchprogramme have resulted in the identification offive broad conceptual elements that are, to greateror lesser degrees, under-represented in currentwater management debates and yet appear central
The conceptualThe conceptualThe conceptualThe conceptualThe conceptual
frameworks thatframeworks thatframeworks thatframeworks thatframeworks that
guide mostguide mostguide mostguide mostguide most
current watercurrent watercurrent watercurrent watercurrent water
managementmanagementmanagementmanagementmanagement
initiatives are,initiatives are,initiatives are,initiatives are,initiatives are,
at best, partial.at best, partial.at best, partial.at best, partial.at best, partial.
New conceptsNew conceptsNew conceptsNew conceptsNew concepts
are essential.are essential.are essential.are essential.are essential.
Conceptual Insights
“The proposed new approach to managing water resources builds on the lessons of experience.At its core is the adoption of a comprehensive policy framework and the treatment of water asan economic good, combined with decentralized management and delivery structures, greaterreliance on pricing, and fuller participation by stakeholders.” (World Bank, 1993)

6
A D D R E S S I N G C O N S T R A I N T S I N C O M P L E X S Y S T E M S
to society’s ability to address critical challenges.These are:
� the importance of an enabling civilenvironment;
� the process nature of management;� integrated response sets;� water service focus; and� trend reflective management.
In many ways, the above concepts representa fundamental divergence in world view betweena static perspective in which water resourcesystems can be understood and optimized tomeet society’s needs and a dynamic perspectivethat emphasizes the dynamic interlinked natureof water resource and other systems and thelimitations of human understanding. The firstworld view tends to lead to technicallydominated planning approaches that attemptto comprehensively describe and manage systemsthrough manipulation of stocks and flows.The second, which we articulate, emphasizesprocesses and frameworks for responding touncertainty as needs arise. Water managementissues are seen essentially as issues of governancewithin a larger civil society context. They cannotbe addressed without both understanding andsocial dialogue.
Enabling Civil Environment
The concept of an enabling civil environment,while often implicit, has received little explicitattention in debates over water management. Thecore idea is that management can only occur ifthe institutions that define civil society arefunctioning in ways that enable managementsystem evolution and implementation.
Water management plans developed byspecialists and targeted at audiences of “keydecision makers” often come to naught. In manycases, technical experts and policy analysts identify“lack of political will” as a key cause. Absence of“political will,” however, generally does not reflectthe characteristics of individual politicians but thelarger balance of power within society. When largesections of society are disenfranchised or lackinformation and understanding, they are not in aposition to identify, advocate or protect theirinterests. As a result, special interests (which areoften better informed or represent elite groups ofwater users) are in a far better position to influencegovernment actions in ways that benefitthemselves. Furthermore, in many cases, lack ofinformation and understanding leads the verygroups most affected by problems to oppose actionsintended to address those problems. This type ofdynamic is implicitly recognized by mostprofessionals and underlies public IEC(information-educat ion-communicat ion)components in water management projects orprogrammes.
The enabling civil environment concept,however, extends beyond the simple IEC approachcommon in water management. IEC elements aregenerally included in management programmeson the premise that, if the public understands whatwe (the specialists) are trying to do, then they willsupport our management recommendations.Society rarely works that way. Well-informedgroups – groups with access to information andthe capacity to analyse it – develop their ownperspectives. These perspectives often differ fromthose of technical managers. In contrast to thestandard IEC approach, the concept of an enablingcivil environment focuses on the process of
PPPPPolitical willolitical willolitical willolitical willolitical will
reflects thereflects thereflects thereflects thereflects the
balance ofbalance ofbalance ofbalance ofbalance of
power in societypower in societypower in societypower in societypower in society.....
WWWWWell informedell informedell informedell informedell informed
groups developgroups developgroups developgroups developgroups develop
their owntheir owntheir owntheir owntheir own
perspectives.perspectives.perspectives.perspectives.perspectives.

7
A D D R E S S I N G C O N S T R A I N T S I N C O M P L E X S Y S T E M S
negotiation within society. It emphasizes givingstakeholders the sets of analytical, legal,institutional and organizational tools essential todevelop and advocate their perspectives ratherthan viewing the stakeholders as obstacles to “beconvinced” through information, education andcommunication.
The concept of an enabling civil environmentlocates the foundations of management actionin negotiations between groups and perspectiveswithin civil society. When the balance of powerwithin society is weighted against those mostaffected by water problems, effective approachesto management are unlikely to evolve. This isparticularly true when essential managementactions directly affect groups with substantialpolitical, economic or social capital. In order tonegotiate effectively, those affected by waterproblems must have information. Organizationsmust also exist that adequately represent affectedgroups, have the capacity to analyse informationand develop management proposals, and are ina position to advocate the perspectives theydevelop within larger governmental frameworks.Appropriate legal and legislative frameworks area further essential component. Unless legalframeworks give groups the basis and standingto catalyse action, the perspectives of those groupsand the values they seek to protect will be ata comparative disadvantage to those of othergroups. If no law against groundwater pollutionexists, for example, or if the pollution law onlyempowers governmental action, groups affectedby pollution will be excluded from legal coursesof action. Similarly, where recognized legalframeworks limit organizational options, theevolution of advocacy and managementorganizations is constrained. The evolution of
pollution legislation in India provides someinsights into the legal frameworks that can enableactions within civil society, (Box 1).
The significance of an enabling civilenvironment for the evolution of watermanagement has immediate practical implicationsfor those seeking to address emerging problems.It suggests that indirect actions to increaseinformation availability, the capacity of non-government and grass roots advocacyorganizations, and legal rights frameworks are atleast as important as more direct managementinitiatives. In the absence of initiatives to createenabling civil environments, many technicallyviable management approaches will fail becausethe balance of power in society reduces theirpolitical or social viability. In addition, theenabling civil environment concept addresses gapsin two principles – participation and institutionalcapacity building – which are core componentsof many current water management initiatives.
The need to “involve” local users in initiativesis now central to most prescriptions for naturalresource management. In many cases, however,there is little real “participation.” Information,problem identification, management approachdevelopment and decision-making functionsremain within the government departments. Thesegovernment departments operate within constraintsimposed by the larger political-economic structuresthat define power relations in society. Becauseparticipatory approaches rarely involve actions orstructural changes intended to influence thosepower relations, the scope for “real” participationby affected communities in the identification,development and implementation of managementinitiatives is limited. In the absence of an enabling
Indirect actionsIndirect actionsIndirect actionsIndirect actionsIndirect actions
to increaseto increaseto increaseto increaseto increase
informationinformationinformationinformationinformation
availabilityavailabilityavailabilityavailabilityavailability, the, the, the, the, the
capacity ofcapacity ofcapacity ofcapacity ofcapacity of
NGOs andNGOs andNGOs andNGOs andNGOs and
reform legalreform legalreform legalreform legalreform legal
rightsrightsrightsrightsrights
frameworks areframeworks areframeworks areframeworks areframeworks are
as important asas important asas important asas important asas important as
directdirectdirectdirectdirect
managementmanagementmanagementmanagementmanagement
initiatives.initiatives.initiatives.initiatives.initiatives.

8
A D D R E S S I N G C O N S T R A I N T S I N C O M P L E X S Y S T E M S
civil environment, participatory initiatives oftenbecome little more than window dressing.
Institutional capacity building is another keycomponent of most water managementprogrammes. In general it focuses on buildingthe array of technical and analytical skills withingovernment departments and the infrastructurethey have available for their functions. The impactof institutional capacity building efforts is, however,
often limited. Improvements in the technicalquality of a management plan or the databaseon which water resource analyses are madehave little impact in themselves unless the socialcontext enables utilization of the improvedinformation. When information is not widelydisseminated, when non-governmental andadvocacy organizations lack analytical capacitiesand when legal frameworks limit avenues foraction by social organizations, building the
Until the early 1970s, few legal avenues existed toaddress pollution problems in India except those
implicit in certain constitutional provisions. Article 21 of theConstitution of India, for example, guarantees protectionof life and personal liberty; Article 47 of the Constitutionstates that it is the primary duty of the State to raise thelevel of nutrition and of the standard of living and to improvepublic health; Article 48A indicates that the State shallendeavour to protect and improve the environment and tosafeguard the forests and wildlife of the country; and Article51(A)g explicitly requires the State to protect and improvethe natural environment including forests, lakes, rivers andwildlife and to have compassion for living creatures. Theabove articles provided a potential basis for action toaddress pollution problems but, in the absence of actionat the Supreme Court level, gave little basis for practicalinitiatives at local levels in the context of specific pollutionproblems.
After the United Nations conference on the HumanEnvironment held in Stockholm in 1972, where Indiaexpressed strong environmental concerns, the 42ndamendment to the Constitution was passed. This enabledenactment of a series of environmental protection laws suchas The Water (the prevention and control of pollution) Act,1974, the Air (the prevention and control of pollution) Act1981 and the Environment Protection Act, 1986. The Water
Act, 1974 enabled the formation of the Central PollutionControl Board and the formation of various State PollutionControl Boards. While the former functions directly underthe control of the Government of India, the latter functionunder the control of the various state governments. TheWater Act prohibits the use of streams and wells fordisposal of polluting matters, puts restrictions on outletsand discharge of effluents without obtaining consent fromthe various pollution control boards. The EnvironmentProtection Act of 1986 also contains very useful provisions.It enables the creation of an authority or authorities underSection3(3) of the act with adequate powers to controlpollution and protect environment. Some states have acted
Tannery wastes: Tamil Nadu
BOX 1:Enabling Civil Society, the Case of Pollution in India
Access toAccess toAccess toAccess toAccess to
improvedimprovedimprovedimprovedimproved
informationinformationinformationinformationinformation
builds socialbuilds socialbuilds socialbuilds socialbuilds social
capacitycapacitycapacitycapacitycapacity.....

9
A D D R E S S I N G C O N S T R A I N T S I N C O M P L E X S Y S T E M S
institutional capacity of governmental or scientificorganizations has little impact on the social orpolitical context. As a result, the impact ofinstitutional capacity building on society’s abilityto identify and implement effective managementactions remains rather limited.
The enabling civil environment conceptpresumes non-linear approaches to management.Management becomes a continuous process in
which natural resource problems emerge and areaddressed – not through the implementation ofcomprehensive and integrated management plans– but through negotiation between sections ofsociety affected by a given water resource problemand by the types of actions they proposed to addressit. In many ways the approach is a pragmaticresponse to the fact that governmental capacity isextremely constrained. Particularly in the highlypopulated regions of South Asia, governments lack
on this. For example, the Tamil Nadu government issuedOrder (Ms) No 213 dated March 30, 1989, which prohibitedsetting up of polluting industries (including tanneries, anddyeing and bleaching units) within one kilometre of theembankments of rivers, streams or dams.
None of the constitutional provisions and acts, however,have had significant impact on the direct ability of thegovernment to control pollution problems in Tamil Nadu.The government order issued in 1989 has not beenenforced strictly and the Tamil Nadu Pollution Control Boardwhich is supposed to monitor and control pollution remainsmore of a passive spectator than a powerful pollutioncontrolling agency.
Despite the limitations of the above acts, it is primarilydue to environmental laws that many NGOs have becomeactive in affected regions. The laws gave NGOs a basis tocreate awareness among the people and represent theircases to the authorities and in courts of law. The presenceof a legal structure also provided a strong reason for NGOsand communities to assess damage caused to theenvironment, to individuals and to communities by polluters.In some cases, public interest litigation enabled by the legalstructure has resulted in significant actions. Public interestlitigation filed by the Vellore Citizens’ Forum in 1991, forexample, sparked off a major judiciary intervention in TamilNadu. This has led to the closure of many tanneries and
dyeing and bleaching units as well as having put enormouspressure on them to install treatment plants. In addition,legal action led to a major judgement by the Supreme Courtin 1996. Under this judgement the central government hasbeen urged to constitute an authority headed by a retiredjudge of the High Court to deal with the situation createdby the tanneries and other polluting industries in the state.The authority is intended to implement the “polluter pays”principle. It will also assess and help pay compensationto the families affected by tannery pollution. After theSupreme Court judgement, an NGO in the Kodaganar Riverbasin identified 27 villages where land, houses, cattle, cropsand the health of villagers have been severely affected andthere have been major losses of employment due topollution. For all these losses the total amount of damageclaimed is about Rs. 104 million and the NGO is supportingthe community in its pleas for compensation.
Despite the progress pollution legislation has enabled,political parties in the region are not willing to mobilizeresidents against the polluters. This would antagonize theindustrial interests that represent an important source offinancial support for political activities. In addition, workersin the industries and the labour unions representing themare a major support base for all political parties. Theseinterests are more concerned with wage issues thanorganizing to address environmental problems.
S. Janakarajan
WWWWWateraterateraterater
management ismanagement ismanagement ismanagement ismanagement is
a continuousa continuousa continuousa continuousa continuous
processprocessprocessprocessprocess
governed bygoverned bygoverned bygoverned bygoverned by
non-linearnon-linearnon-linearnon-linearnon-linear
relationships.relationships.relationships.relationships.relationships.
10
A D D R E S S I N G C O N S T R A I N T S I N C O M P L E X S Y S T E M S
the ability to impose management solutions onmillions of individual water users. In other ways,however, the enabling civil environment conceptreflects deeper beliefs about the importance ofdemocratic institutions and processes. Thesebeliefs are articulated in the constitutions of manystates in the region. Emphasis here on theimportance of an enabling civil environment forwater management flows from this largerdemocratic framework.
The Process Nature ofManagement
The enabling civil environment concept reflectsthe process nature of management. From ourperspective, management is a process by whichinstitutions (and society as a whole) identify andrespond to diverse complex challenges as theyemerge within continuously evolving contexts.Although planning may be part of management,the process extends far beyond the preparation andimplementation of discrete “plans.” The enablingcivil environment is, in many ways, an underlying“framework” defining the boundaries within whichmanagement processes run. It also generatesmanagement goals and objectives. These goalsand objectives will shift as specific needs emergeand the perspectives of different groups withinsociety evolve.
Recognizing the process nature of managementcomplicates definition of the underlying principlesneeded to give it structure. Without such principles,however, management could easily become “seatof the pants” responses to immediate concerns.
Discussions held between research collaboratorson the Local Supply and Conservation Responses
to Water Scarcity project resulted in theidentification of three basic principles for guidingmanagement processes: (1) Systemic perspectives;(2) Constraint analysis; and (3) Context (scale,institution and trend) reflective responses. Thesebasic principles are discussed briefly below. Inaddition, integrated resource planning processesare discussed briefly in Box 15 at the end of thischapter. This provides a practical example of theapplication of process considerations to energy andwater planning in other countries.
Systemic Perspectives
Water management problems need to beapproached from a systemic perspective butgenerally cannot be addressed throughcomprehensive systems analysis. A core distinctionis being made here. A systemic perspectiverecognizes both the importance of interactionsbetween systems and the limitations of knowledgeregarding those interactions. It also emphasizesscale issues. Aquifers or watersheds are not discreteunits but operate rather as systems within systems.The scale at which management needs to occurdepends on the scale of system processes andinteractions. Watershed approaches, when appliedto the Gangetic basin at one extreme or a localizedpollution problem at the other becomemeaningless. Instead of focusing on “localmanagement” or “basin management” the keyis to identify the system scale at which differentproblems need to be addressed. Furthermore,comprehensive systems analysis presumes anability to identify and quantify the nature ofinteractions and to clearly define the boundariesof systems – or at least those of the greatestimportance in relation to management needs. Thisis, however, often unachievable.
ConstraintConstraintConstraintConstraintConstraint
analysis can beanalysis can beanalysis can beanalysis can beanalysis can be
used to identifyused to identifyused to identifyused to identifyused to identify
managementmanagementmanagementmanagementmanagement
needs andneeds andneeds andneeds andneeds and
potential pointspotential pointspotential pointspotential pointspotential points
of leverage forof leverage forof leverage forof leverage forof leverage for
addressingaddressingaddressingaddressingaddressing
them.them.them.them.them.

11
A D D R E S S I N G C O N S T R A I N T S I N C O M P L E X S Y S T E M S
The fact that water management problemsmust be addressed as part of the larger hydrologicsystem in which they occur is widely recognized.The “systemic” nature of management issues,however, extends far beyond the hydrologic system.Many management issues are rooted ininteractions between complex interdependent waterresource, economic, environmental, cultural,institutional and social systems. The nature ofthese interactions, while often important, isextremely difficult to analyse in a systematic andcomprehensive manner. In most parts of theworld, key data required for comprehensiveanalysis are unavailable. Furthermore, in manycases the systems themselves are poorly understood.As a result, while the location of water problemswithin larger sets of interacting systems is widelyrecognized, the ability to analyse those systems isrelatively weak.
The “comprehensive” policy frameworkrecommended by the World Bank and thewidespread emphasis given to integratedmanagement approaches in the global watermanagement literature have led to many massivedata collection and planning exercises. Theseoften run into fundamental problems due tothe scale of the exercise, long lead and analysistimes and lack of data. Furthermore, the exercisesare difficult to focus and, while useful asmechanisms for compiling information, rarelyresult in the integrated vision or depth ofinformation needed for a centralized approach toplanning and management.
Approaching water management problems froma systemic perspective, rather than attemptingcomprehensive integrated analysis fits well with theprocess nature of management. The systemic
perspective encourages recognition of interlinkedsystems at different levels – within the hydrologicsystem, and between the hydrologic system andother environmental, economic or social systems.At the same time, by explicitly recognizing thelimitations of knowledge concerning systeminteractions, the concept should encourage thedevelopment of mechanisms for responding touncertainty – that is, the social frameworks neededto guide an ongoing management process forward.
Constraint Analysis
Constraint analysis represents a second keyprinciple for guiding management processes. Thecore idea here is that within a broader systemicperspective, analysis of management problems atany given time should emphasize key constraintsrather than systems as a whole. In many ways,this is already what people do. Society tends tofocus on points where problems are perceived asoccurring or imminent. As problems are addressed,attention shifts to new areas. Constraint analysisrecognizes and formalizes the incremental“tinkering” nature of social responses tomanagement needs.
The contrast between constraint analysis andintegrated planning is fundamental. Approachesbased on constraint analysis are problem focused.The principle is to identify problem areas (orpotential problem areas) and then trace out thekey factors causing those constraints to emergewithin interlinked sets of systems. Integratedplanning, on the other hand, presumes an abilityto describe and understand the systems as awhole first and then to “manage” them in a waythat optimizes water resource systems tominimize constraints.
ManagementManagementManagementManagementManagement
issues areissues areissues areissues areissues are
rooted inrooted inrooted inrooted inrooted in
interactionsinteractionsinteractionsinteractionsinteractions
betweenbetweenbetweenbetweenbetween
complex andcomplex andcomplex andcomplex andcomplex and
interdependentinterdependentinterdependentinterdependentinterdependent
water resource,water resource,water resource,water resource,water resource,
economic,economic,economic,economic,economic,
environmental,environmental,environmental,environmental,environmental,
cultural,cultural,cultural,cultural,cultural,
institutionalinstitutionalinstitutionalinstitutionalinstitutional
and socialand socialand socialand socialand social
systems.systems.systems.systems.systems.

12
A D D R E S S I N G C O N S T R A I N T S I N C O M P L E X S Y S T E M S
Context Reflective or AdaptiveResponses
Natural variability is a key theme runningthroughout the water management literature.Hydrologic characteristics vary greatly betweenlocations and at different scales of analysis. Thisis also the case with social, cultural and economicsystems. Management approaches, in contrast,have tended to cluster around individual themesor models. Participatory, “decentralized”approaches are, for example, now competing withcentralized planning approaches. Similarly,sectoral “use-based” management structures(focused, for example, on individual irrigation ordrinking water systems) are now competing withintegrated structures (water resource departmentsor basin commissions) that focus on multiple useswithin hydrologic units such as basins.
There is a disjuncture between the inherentvariability of natural and social systems and thetendency for approaches to cluster around a fewmanagement models. New managementparadigms emerge in response to limitations inearlier ones. When these new paradigms becomedominant, their inherent limitations emerge andthey are gradually discarded in favor of new“better” paradigms. In many cases, watermanagement paradigms become “solutions” insearch of problems.
The principle of context reflective responses isintended to address the above disjuncture. Thebasic idea is that management approaches needto reflect the characteristics of specific situations(problems, objectives and opportunities) ratherthan follow narrowly pre-defined models or
philosophies. Constraint analysis can be used toidentify management needs and potential pointsof leverage for addressing them. Once leveragepoints have been identified an array of potentialmanagement responses will emerge throughdialogue between civil society actors.2 Thecharacteristics of these responses will thendetermine the approaches appropriate forimplementing them.
In many ways, the above principle turnscurrent debates over management on their head.Instead of debating whether or not participatory,decentralized approaches are “better” thancentralized approaches for water management ingeneral, the principle suggests working from thespecifics of a given problem outwards toward thebest solution for addressing it. Some problemsmay be best addressed through decentralized“participatory” approaches; others may requiremuch more centralized forms of intervention.3
Within the overall principle of context reflectiveresponses proposed, three elements appearparticularly important to consider: scale,institutions and trends.
� Scale: The scale at which management needsto occur varies greatly in specific situations.Current management philosophy emphasizes theimportance of natural hydrologic units –watersheds and aquifers – as management units.While this does reflect essential characteristics ofthe natural system, many basins (such as theGanga) are too large to be effectively managed asa single unit. Furthermore, basins rarely coincidewith natural units of human organization. As aresult, while basins and aquifers are convenient
ManagementManagementManagementManagementManagement
initiatives needinitiatives needinitiatives needinitiatives needinitiatives need
to reflect localto reflect localto reflect localto reflect localto reflect local
contexts andcontexts andcontexts andcontexts andcontexts and
adapt asadapt asadapt asadapt asadapt as
conditionsconditionsconditionsconditionsconditions
change.change.change.change.change.

13
A D D R E S S I N G C O N S T R A I N T S I N C O M P L E X S Y S T E M S
units from a resource perspective, they are oftencomplicated from a social managementperspective.
Many management needs – such as localizedoverdraft or pollution problems – can be addressedeffectively through actions at local or regionalscales. Other needs – such as water allocationbetween upstream and downstream users orthe impacts of upstream land use patterns ondownstream flooding – have inherent implicationsat the basin scale. As a result, while thecontext of any given management need or setof responses within the larger basin system mustbe recognized, there is no inherent reasonfor management at a basin scale and theremay be good reasons not to do so. Overall,rather than focusing on basins per se, the goalshould be to ensure that management actionsoccur within hydrologically viable units. Thisargument suggests that the scale at whichresponses to management needs are targetedshould depend on the specific context ratherthan a pre-defined basin or local managementstrategy. In many cases, nested sets ofmanagement approaches will probably benecessary. Some of these would addressinherently local issues, others regional and othersbasin level.
� Institutions: In addition to scale, the nature ofexisting institutions is a key factor defining thecontext of any given management need. Culturalgroupings, economic institutions (such asmarkets), private and public sector organizations,and administrative units are critical factorsdetermining the array of social managementoptions. As a result, as in the case of approaches
defined on a watershed versus other basis, theexisting institutional landscape should be a criticalconsideration in developing managementapproaches. In general, approaches that build offexisting institutions and cultural patterns ofbehaviour wherever possible rather thanattempting to develop new ones are likely to bemore successful. The guiding principle might betermed “institutional evolution” as opposed toinstitutional superimposition.
This concept has particularly large implicationsfor debates over local versus governmental andmarket versus regulatory institutions formanagement. Rather than start off with aningrained philosophical perspective regarding oneor the other approach, it suggests that theinstitutional mix appropriate in a given contextshould emerge based on analysis of options,existing institutions and the larger process ofdialogue within civil society.
� Trends: Finally, larger trends within society needto be recognized as part of the managementcontext. In many cases, management approachesare developed with little sensitivity for larger trendswithin society. The local, village based,management approaches that are often advocatedmay, for example, conflict with increasing trendstoward urbanization in many parts of the world.Similarly, management approaches that advocate,for example, crop shifting or specific types ofirrigation technologies may run counter to globalmarket trends. In general, managementapproaches that build off or are consistent withlarger social trends are more likely to be successfulthan approaches that attempt to run counter tothese trends.
The elements ofThe elements ofThe elements ofThe elements ofThe elements of
contextcontextcontextcontextcontext
reflectivereflectivereflectivereflectivereflective
response areresponse areresponse areresponse areresponse are
� ScaleScaleScaleScaleScale
� InstitutionsInstitutionsInstitutionsInstitutionsInstitutions
� TTTTTrends.rends.rends.rends.rends.

14
A D D R E S S I N G C O N S T R A I N T S I N C O M P L E X S Y S T E M S
Water Service Focus
Water management debates are often cloudedby a strong focus on the water resource systemitself rather than on the core environmental andhuman services it provides. The conceptualdistinction being made is of basic importance.Society and the natural environment depend onwater resource systems to provide basic servicessuch as access to clean water for basic needs, waterfor economic uses and instream flows and waterquality conditions necessary to maintainbiodiversity and ecosystem characteristics. Mostpeople “care” about the maintenance of thesebasic services rather than about water resourcecharacteristics per se.
In most parts of the world, efforts to monitorand analyse the functioning of water resourcesystems are, at best, loosely tied to the serviceswe actually care about or depend on.Furthermore, the manner in which data (forexample on groundwater extraction, surfacewater diversions, pollution and water quality)are analysed rarely conveys the threats to basichuman or environmental services that may beimplicit in them.
The case of groundwater in India is illustrative.In India, water levels in monitoring wells are theonly groundwater data collected on a regular basis.These data are combined with estimates of otherparameters such as pumping to estimateextraction/recharge ratios. These ratios areintended to reflect the sustainability of groundwateruse patterns. If extraction increases to the pointwhere it approaches or exceeds recharge, uses arepresumed to be unsustainable, and managementactions are triggered.
The above approach has a number offundamental flaws. Data to accurately calculatethe extraction/recharge ratio are unavailable andthere is substantial uncertainty regarding the realmeaning (if any) of published ratios (Moench,1991). More importantly, however, the waterbalance estimates, even if accurate, are bythemselves a very poor indicator of potentialimpacts on water services. Water level declines,for example, can affect base flows in streams,surface vegetation communities, pumping costsand access to groundwater by individuals owningshallow wells. They can, as a result, have majorimplications for environmental values, accessequity and agricultural production costs. Waterlevel changes are not linearly related to theextraction/recharge ratio. In many cases, rechargeinitially increases as water levels decline.Furthermore, the rate of water level decline withpumping depends far more on the characteristicsof aquifers than it does on the balance ofextraction and recharge. Beyond this it isimportant to recognize that, in some cases, thesustainability of extraction (as indicated by theextraction-recharge ratio) may not be anappropriate management objective. Groundwatermining may, for example, be appropriate duringprolonged droughts or where substantial fossilwater resources are available.
The core point in the above discussion is thatthe relationship between hydrological data and thewater services society may care about is neitherlinear nor transparent. By focusing primarily onthe ratio of extraction to recharge, attention isdrawn to the water resource base itself and focusedon relatively abstract sustainability issues. Whilethe overall sustainability of use patterns isimportant, it is only one among many potential
ManagementManagementManagementManagementManagement
approachesapproachesapproachesapproachesapproaches
need to beneed to beneed to beneed to beneed to be
developed withdeveloped withdeveloped withdeveloped withdeveloped with
more sensitivitymore sensitivitymore sensitivitymore sensitivitymore sensitivity
to the largerto the largerto the largerto the largerto the larger
trends withintrends withintrends withintrends withintrends within
societysocietysocietysocietysociety.....
15
A D D R E S S I N G C O N S T R A I N T S I N C O M P L E X S Y S T E M S
management objectives. Furthermore, many keywater services can be affected long before there isany real threat to sustainability of the resourcebase. The above situation is common in most partsof the world. Water resource monitoring systemshave generally been deviced by engineers andscientists concerned with resource dynamics butlittle appreciation for the water services that maybe of wider importance.
If management is viewed as a process governedby prevailing perspectives within society, theninformation on hydrologic systems needs to relateto water services in a manner that is accurate andtransparent. This “water service” focus should bea basic principle or starting point in the analysisof water resource systems and management needs.Emphasizing water services does not imply anyreduction in the need for the basic hydrologicaldata essential to understand water resourcedynamics but may often imply a reorientation inthe types of data collected, the way they areanalysed and how they are presented.
Integrated Response Sets
The principle of integrated response sets stemsfrom recognition that in virtually all cases meetingwater management objectives requires multipleforms of intervention. Both the case studiesundertaken through this project and the widerliterature on water resources emphasize the broadarray of environmental, economic and socialfactors influencing individual water use decisions.In many countries, however, managementapproaches rely on a very limited set of tools.Furthermore, even where multiple avenues arebeing tried, they are often applied in a piecemeal,fragmentary manner. India, for example, is
The relationshipThe relationshipThe relationshipThe relationshipThe relationship
betweenbetweenbetweenbetweenbetween
hydrologicalhydrologicalhydrologicalhydrologicalhydrological
data and thedata and thedata and thedata and thedata and the
water serviceswater serviceswater serviceswater serviceswater services
society may caresociety may caresociety may caresociety may caresociety may care
about is neitherabout is neitherabout is neitherabout is neitherabout is neither
linear norlinear norlinear norlinear norlinear nor
transparent.transparent.transparent.transparent.transparent.
attempting to develop groundwater managementapproaches based primarily on regulation(Moench, 1994). This neglects the fact that wateruse decisions, particularly those in the agriculturalsector, are dominated by economic, technical,access and system operation considerations.Similarly, in other areas, market based approachesare advocated as “the solution” to most watermanagement and allocation needs. As withregulatory approaches, giving market mechanismsa pre-eminent position neglects the fact that manykey water management services (povertyalleviation, environmental maintenance, cultural,and religious) are not reflected in markettransactions. In general, integrated response setsshould incorporate the following potential spheresof action:
� Technical and Infrastructure: Water usetechnologies and infrastructure have a tremendousimpact on management options and needs. As a
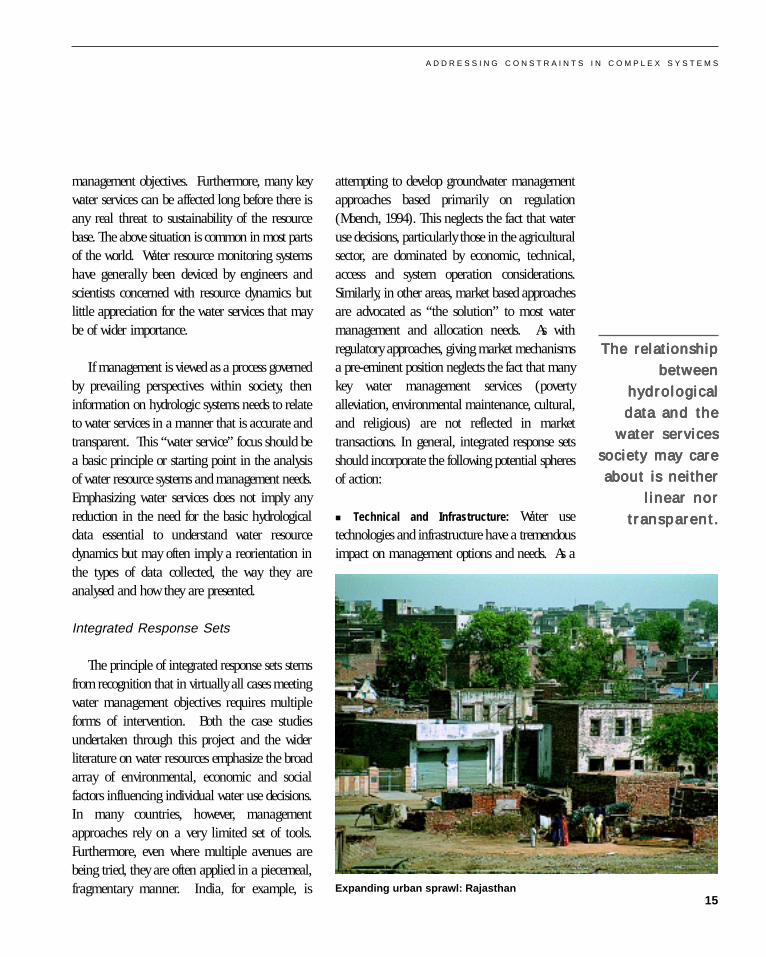
Expanding urban sprawl: Rajasthan

16
A D D R E S S I N G C O N S T R A I N T S I N C O M P L E X S Y S T E M S
result, the technological availability and optionsfor creating or altering infrastructure are centralpieces in any integrated set of responses tomanagement needs.
� Regulation: Possibilities for regulation andissues regarding who and how regulation mightbe accomplished are a key part of integratedresponse sets.
� Economic and Market: As previously noted,economic factors are among the most majorinfluencing water use patterns. As a result,avenues for influencing the economics of wateruse, in particular the price users pay for water,need to be a key component in any integrated setof responses to water management needs. Waterprices can be influenced either indirectly (throughenergy prices, for example) or directly through thecreation and functioning of water markets. It isimportant to recognize, however, that water pricesestablished in either manner are unlikely to reflectthe full value of the resource since many uses –such as the role water plays in maintaining
ecological systems – are not reflected in markettransactions or easily incorporated in indirectapproaches to pricing.
� Education: The social nature of the managementprocess necessitates a broad-based understandingof issues and options. In addition, since manywater management decisions are made at the levelof individuals (how long to irrigate, whether ornot to take a long shower, etc…) the degree towhich individuals understand water related issueswill greatly influence the viability of manymanagement initiatives. Education should thusbe a core piece in any integrated strategy.
� Organization: The nature and orientation ofpublic and private sector organizations has a largeimpact on the types of management issues thatemerge and how they are addressed. If waterresource organizations, such as groundwaterdepartments are organized primarily on technicallines, then the perspectives they will tend topromote will be dominated by technicalconsiderations. Similarly, the structure of localmanagement groups and the resources (technicaland otherwise) they can draw on will influencetheir perspectives and spheres of action. As aresult, organizational considerations need to be acentral part of any integrated set of responses towater management needs.
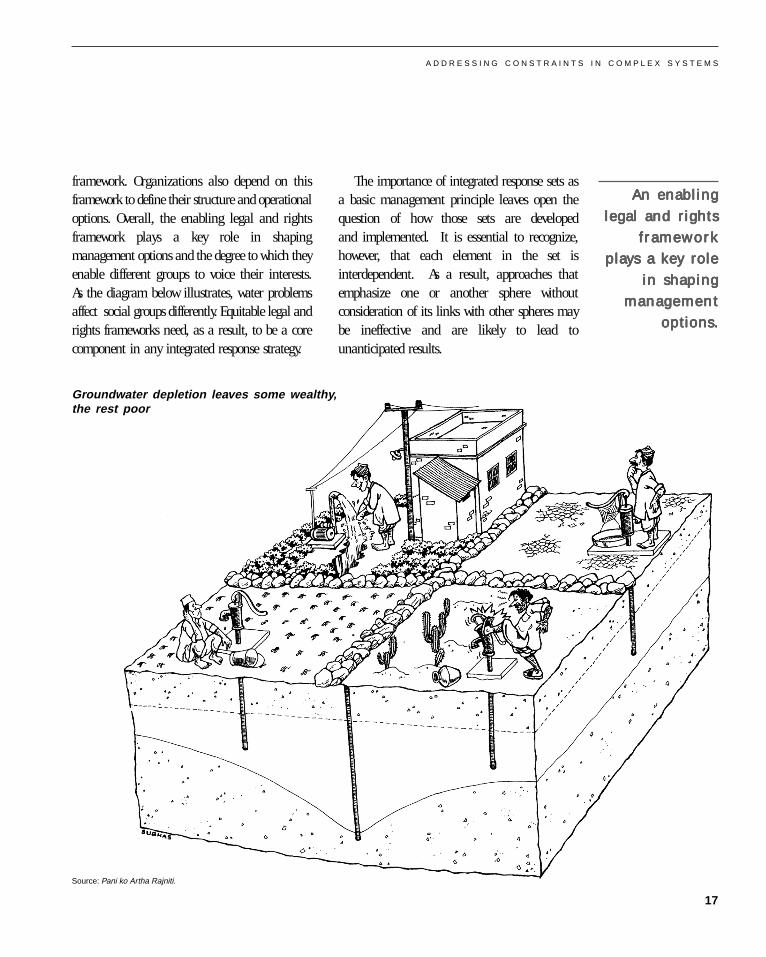
� Enabling Legal and Rights Framework: Legaland rights structures represent a final major sphereof action within integrated response sets. In manyways this arena is particularly important as thepoint where integration occurs. Regulatory andmarket arenas of management are, for example,directly dependent on the legal and rights
If water resourceIf water resourceIf water resourceIf water resourceIf water resource
organizationsorganizationsorganizationsorganizationsorganizations
are establishedare establishedare establishedare establishedare established
primarily onprimarily onprimarily onprimarily onprimarily on
technical lines,technical lines,technical lines,technical lines,technical lines,
then thethen thethen thethen thethen the
perspectives theyperspectives theyperspectives theyperspectives theyperspectives they
will tend towill tend towill tend towill tend towill tend to
promote will bepromote will bepromote will bepromote will bepromote will be
dominated bydominated bydominated bydominated bydominated by
technicaltechnicaltechnicaltechnicaltechnical
considerations.considerations.considerations.considerations.considerations.
Groundwater recharge message: Gujarat
17
A D D R E S S I N G C O N S T R A I N T S I N C O M P L E X S Y S T E M S
framework. Organizations also depend on thisframework to define their structure and operationaloptions. Overall, the enabling legal and rightsframework plays a key role in shapingmanagement options and the degree to which theyenable different groups to voice their interests.As the diagram below illustrates, water problemsaffect social groups differently. Equitable legal andrights frameworks need, as a result, to be a corecomponent in any integrated response strategy.
The importance of integrated response sets asa basic management principle leaves open thequestion of how those sets are developedand implemented. It is essential to recognize,however, that each element in the set isinterdependent. As a result, approaches thatemphasize one or another sphere withoutconsideration of its links with other spheres maybe ineffective and are likely to lead tounanticipated results.
An enablingAn enablingAn enablingAn enablingAn enabling
legal and rightslegal and rightslegal and rightslegal and rightslegal and rights
frameworkframeworkframeworkframeworkframework
plays a key roleplays a key roleplays a key roleplays a key roleplays a key role
in shapingin shapingin shapingin shapingin shaping
managementmanagementmanagementmanagementmanagement
options.options.options.options.options.
Groundwater depletion leaves some wealthy,the rest poor
Source: Pani ko Artha Rajniti.

18
A D D R E S S I N G C O N S T R A I N T S I N C O M P L E X S Y S T E M S
The focus of this paper now shifts from thebroad conceptual insights generated in debates
between participants to integration of the moredirect results from field research within each casestudy location.
The preliminary results of this study highlightsome issues that are common in many situationsglobally. Water scarcity linked with groundwateroverdraft and pollution are critical problems inall case sites except perhaps those in Nepal.Flooding is also an issue even in “water scarce”regions such as Gujarat. Beyond the resource itself,in many cases management systems that havefunctioned well for centuries have increasinglycome under stress and are being destroyed. Wherethe social dimensions are concerned, competitionis growing both within and between rural andurban areas. As a result, equity concerns areincreasing. The poor and disenfranchised are thefirst to lose access to water when scarcity occurs.They also are the first to face the consequences ofpoor management or infrastructure developmentdecisions. Legal frameworks and the capacity ofinstitutions at all levels to develop effectiveresponses to the above concerns are weak ornonexistent.
Beyond the above common issues, the casestudies highlight a number of issues that havereceived less attention in the global literature. Atthe heart of management problems in all thecase study areas lies the interdependent natureof water resource and water use systems. Thesequential nature of flows and water usesimplies that problems and the results ofmanagement interventions ripple through both the
Key Emerging Issues
hydrologic system and the water use and economicsystems based upon them. Furthermore, thetarget of management is constantly shifting.Responding to natural variability (both floodsand droughts) is a major issue – particularly inarid areas where inter and intra-annualfluctuations in precipitation are common. Theissue of variability is, however, not dominatedprimarily by hydrologic or climatic dynamics.Rapid social, economic, land use and (in somecases) technical changes are occurring withineach case study area. Some changes are due tolong term demographic or other trends, othersare driven by much shorter term economic orsocial fluctuations. These changes, rather thanmicro-level decisions based on water considerationsper se, have a dominant impact on water usepatterns. Perhaps the greatest challenges facingwater management are not the physical problemsthemselves but devising systems capable offunctioning and remaining relevant in the face ofrapid patterns of social and economic change.
Water ResourceInterdependent Systems
The story of system interdependency starts insituations, such as that along the Tinau River inNepal and India, where local water use patternsevolve in directions that ignore both upstreamdependencies and downstream effects. It is not anew story – but the story is of increasingimportance as the scale of human actionsignificantly alters hydrologic dynamics. The caseof the Tinau is outlined in detail in box number2 in order to illustrate key issues in theinterdependency story.
The poor andThe poor andThe poor andThe poor andThe poor and
disenfranchiseddisenfranchiseddisenfranchiseddisenfranchiseddisenfranchised
are the first toare the first toare the first toare the first toare the first to
lose access tolose access tolose access tolose access tolose access to
water whenwater whenwater whenwater whenwater when
scarcity occurs.scarcity occurs.scarcity occurs.scarcity occurs.scarcity occurs.

19
A D D R E S S I N G C O N S T R A I N T S I N C O M P L E X S Y S T E M S
The situation found in the Tinau case iscommon. In most areas studied as part of thisresearch, resource development or managementactivities have been initiated with little conceptionof the larger system into which they fit. As a result,major problems regularly emerge due tounanticipated interactions. Collection of the datarequired to fully characterize systems would be amajor time consuming and expensive process –one unlikely to be undertaken rapidly in mostmedium watersheds of South Asia. It should beemphasized, however, that extremely valuableinsights can be achieved through the partial datathat is often available if it is analysed from asystemic perspective. The use of the WEAPmodelling system to evaluate the potential impactsof groundwater recharge and demand sidemanagement activities in Gujarat (Box 3) isillustrative. The WEAP system enables evaluationof water demand and supply balances at a basinor regional level on the basis of relatively limiteddata. Using it, VIKSAT was able to determine thatrecharge – the primary focus of government andNGO water management activities in their studyarea – could address only a minor fraction ofgroundwater overdraft problems, while demandside management activities could have a fargreater impact. Focusing on key constraints withina larger semi-quantitative or qualitativeconceptualization of water resource systems allowsdevelopment of more integrated managementresponses and the progressive refinement ofsystemic understanding.
Overall, a water resources systems approach towater management planning helps incorporate theinter-relationships between physical components ofthe water resource system (surface storage, streamflows and groundwater storage), and also between
supply and demand. It also helps prioritizedifferent demands within basins, such as drinkingwater supplies, irrigation, urban and industrialuses, on the basis of consensus among the usergroups. Finally, it can help identify the types ofwater management interventions that can havemaximum impact in terms of reducing the overallgap between the goals of management and thelimitations inherent in each intervention. A systemsapproach can also help stakeholders to understandthe impact of various interventions.
Overdraft and Aquifer Disruption
In many parts of India, groundwater overdraftis emerging as a major point of concern (WorldBank, 1998). Since the 1950s, government policieshave emphasized groundwater development as animportant mechanism for ensuring food securityand as a catalyst for rural development. As a result,the number of wells and operational pumpsets hasincreased exponentially from a few thousand inthe early 1950s to estimated numbers exceeding
WWWWWater resourceater resourceater resourceater resourceater resource
developmentdevelopmentdevelopmentdevelopmentdevelopment
has often beenhas often beenhas often beenhas often beenhas often been
initiated withinitiated withinitiated withinitiated withinitiated with
littlelittlelittlelittlelittle
considerationconsiderationconsiderationconsiderationconsideration
for largefor largefor largefor largefor large
systems.systems.systems.systems.systems.
UnanticipatedUnanticipatedUnanticipatedUnanticipatedUnanticipated
interactions areinteractions areinteractions areinteractions areinteractions are
a direct result.a direct result.a direct result.a direct result.a direct result.
Supply line abandoned due to groundwater overdraft in Rajasthan

20
A D D R E S S I N G C O N S T R A I N T S I N C O M P L E X S Y S T E M S
The Tinau starts in the Mahabharat middle hills of Palpain Nepal. Throughout the hill region, traditional hill
irrigation systems dominate water use patterns. Numerousindividual small to medium scale diversions take water outof the river and channel it along hillside and valley bottomterraces. Most of these diversions are seasonal and thediversion structures are temporary – designed to be re-built following each monsoon.
Before it exits into the plains of the Nepal Tarai, theTinau runs through a narrow gorge. There, below thelowest of the hill irrigation diversions, a small 1 MW run ofthe river hydropower plant has been constructed. This plantis currently not operational. A gauging station was,however, established at the plant. This station representsvirtually the only fixed data point regarding flows in whatis, at that point, a medium sized river. Just below thehydropower station, the river exits the hills at the small butfast growing town of Butwal. It is a typical Tarai townwith a market and many consumer goods shops. It isalso an engineering centre and ideally located to grow asa site for small to medium scale industries. The town nowdiverts more and more water for municipal uses and returnsit untreated to the stream as an increasingly large anddegraded waste flow.
Below Butwal, the Tinau is a braided stream whoseshifting course wends its way across the coarse sedimentsat the base of the Himalayas and finally into the deeper,fine basin sediments of the main Gangetic basin along theIndia-Nepal border. The hydrology of this zone is poorlyunderstood. Flow in the Tinau almost disappears as itcrosses the Bhabar Zone (a deep band of coarse graveldeposits at the base of the Himalayan uplift). The channelclearly shifts on a regular basis. One barrage constructedby the Indians in Nepal now crosses a dry riverbed. Theriver itself has shifted and flows in a new channel. Nolong term flow measurements are available at any point inthis zone. Observations suggest, however, that flowincreases substantially in the lower portions of the basinin India after the river has passed over the coarse grainedsands of the Bhabar Zone.
Use patterns along the Tinau below Butwal in India andNepal are also complex and poorly understood. Some of
the best documented traditional irrigation systems divertwater just below Butwal and provide water to as much as5,000 ha. Below these, “modern” pumped systems andmedium irrigation schemes built by the Indian Governmentdivert water from the river. Furthermore, within Indianumerous diversions for towns and industry occur. Eachdiversion is accompanied by a return flow and the qualityof water in the Tinau probably declines steadilydownstream. Flash floods are a major concern at the pointwhere the river leaves the mountains. In lower regions,large-scale flooding during the monsoon replaces the flashflood issue and becomes a dominant shaping factor inpeople’s lives.
In the areas surrounding the Tinau, groundwaterdevelopment has grown rapidly over recent decades. Someareas are served by deep wells drilled with assistance frominternational donors. In other areas, including most of thosein the command of large surface irrigation systems, shallowtubewells are common. The number of shallow wells andthe extent of their use is virtually unknown. In some areasvisited by the study team, wells are capped and coveredwith soil when not in use to avoid tampering. Farmersmove pumps between wells at their convenience. In theseareas a survey of operational wells may underestimatethe actual number in use substantially. In one area,only one in 4 to 5 wells was actually operational at thetime of our visit. The rest were capped and buried for usein other seasons.
BOX 2:Interdependent Systems: The Case of the Tinau in Nepal
20Irrigated land in Madi phaant: Tinau, Palpa

21
A D D R E S S I N G C O N S T R A I N T S I N C O M P L E X S Y S T E M S
In many ways, the core issue in the Tinau basin isfragmentation of a complex system leading tocounterproductive management interventions that should,with the benefit of hindsight, have been avoidable.Throughout the Tinau basin, water management is treatedas a dominantly local issue. In the lower basin,embankments are constructed to protect specific areasfrom flooding. Little thought is given to how flooding mightbe reduced by upstream interventions or to theconsequences of embankments for other areas not similarlyprotected. Similarly, in upstream areas diversions arecreated and waste returned to the stream with little thoughtto downstream users. As industrial developmentaccelerates in the Nepal Tarai, the consequences of thisfor water quality may be particularly significant.
Water resource characteristics and use patterns alongdifferent sections of the Tinau are interlinked. Extensivewater diversions and the development of complex hillirrigation systems have influenced flow dynamicsthroughout the lower basin. The dynamic, mobile characterof the channel where the stream exits the hills constrainspossibilities for development of diversions and irrigationsystems. Return flows from municipal and other usesinfluence downstream water quality. Widespreaddevelopment of groundwater through shallow wells byprivate farmers influences the need for larger scale surfaceand groundwater development initiatives by the government.Flooding problems in one area are exacerbated by
embankments created in other areas. These sweepingtypes of interactions are relatively easy to conceptualize.There are, however, no data for quantifying them. Thisdoes not, however, imply that the interactions should beignored or discounted nor does it imply that nothing canbe done without detailed information on resource dynamicsthroughout the basin. The starting point is to outline, atleast on a conceptual basis, the interlinked nature of waterresource dynamics and use in the basin and then focuson key constraints – in this case flooding and water quality.Limited sets of data can then be collected to addressconstraints while a more detailed understanding of thebasin is gradually developed over the decades requiredfor water resource monitoring to produce reliable results.
D. Gyawali, A. Dixit and M. Moench
25 million at present. The consequences ofunregulated development are now beginning toemerge. In Rajasthan, for example, water levelsacross a wide swath in the central portion of thestate have been dropping at rates averaging onemetre a year over the last decade.4 As the boxesbelow document, similar problems are clearlyevident in many arid and hard rock sections ofthe country.
Overall, it is now broadly recognized thatmanagement of India’s aquifers, rather thangroundwater development, is among the mostmajor challenges facing the water resourcesector in the country. This said, it is equallyimportant to recognize that groundwater overdraftis not an isolated problem. Instead, reflectingthe core message of the previous section, overdraftneeds to be viewed as a key constraint within a
Embanked Kuda River: Uttar Pradesh
GroundwaterGroundwaterGroundwaterGroundwaterGroundwater
overdraft is aoverdraft is aoverdraft is aoverdraft is aoverdraft is a
constraintconstraintconstraintconstraintconstraint
within anwithin anwithin anwithin anwithin an
interdependentinterdependentinterdependentinterdependentinterdependent
system.system.system.system.system.

22
A D D R E S S I N G C O N S T R A I N T S I N C O M P L E X S Y S T E M S
Community based local water management initiativesare increasingly recognized by NGOs, researchers
and academics as a major strategy to address growingwater scarcity problems. Almost all NGO and communitybased responses to water scarcity and pollution problemsin Gujarat (and other parts of India as well) focus onaugmenting the available supplies of surface andgroundwater in the locality. Efforts to address water demandor non-point sources of pollution are almost absent.Furthermore, most initiatives are highly localized with verylittle potential impact on regional water dynamics. Waterscarcity problems are, however, often regional in natureand emerge from a range of physical (hydrology, geology,climate, etc.), social, economic and institutional factors.
Experience with comprehensive basin level approachesto water management is lacking in India. As a result, thereis little basis to evaluate the extent to which local watermanagement interventions — supply and demand sidemanagement — could address emerging problems of waterscarcity or pollution at a regional or basin scale.Understanding water management needs requiresestimation of current and future demand and supply ofwater in the basin. This is critical for evolving basin orregional water management perspectives. It is also useful
in identifying the right kind of institutional arrangementsfor implementing management solutions and the rolevarious stakeholders might play. The case of the Sabarmatibasin in Gujarat, studied by VIKSAT, illustrates this well.
Most water management initiatives by the governmentand NGOs in the Sabarmati basin have focused ongroundwater recharge. Modelling activities by VIKSAT usingthe WEAP (Water Evaluation and Planning) systemdeveloped by Stockholm Environment Institute, however,clearly indicate the limited role recharge can play from asystemic perspective. By developing an integrated modelof water supply and demand in the Sabarmati, VIKSATwas able to contrast the impact of an integrated set ofdemand side management interventions with a similar arrayof recharge activities. Based on their model, rechargecould only reduce the gap between demand and supplyby 8 MCM per year as compared to a reduction of morethan 259 MCM/year achievable through efficiencyinterventions. While the preliminary nature of modellingresults and limited data availability are acknowledged, themagnitude of the difference suggests that the potential fordemand management interventions clearly outweighsanything achievable through recharge.
D. Kumar, S. Chopde and A. Prakash
BOX 3:A Systems Approach to Basin Level Water Management, the Gujarat Case
set of interdependent systems. Overpumping,the proximate cause of groundwater overdraft, isitself a product of technical and economic change.Solutions may, as a result, lie both in actionsthat directly affect extraction or recharge levelsand in interventions designed to alter the largecontext from which groundwater use emerges.
Pollution
Water pollution is a well-known but extremelypoorly documented problem throughout SouthAsia. Over the last decade, India’s urbanpopulation has increased by 36% and, of the total
urban population, official figures indicate thatonly 64% have access to sewage facilities (Laxmi,1997). Most towns and villages lack sewagefacilities. Furthermore, even where sewagefacilities are present, treatment is at best partial.Beyond this there are numerous point andnon-point sources of pollution which govirtually untreated. Agriculture, for example,now reportedly uses substantially morefertilizer and pesticide per unit area than isused in the United States (Repetto, 1994).Boxes 1 and 6 provide good examples ofthe pollution problems now emerging and theirlikely impacts.
Numerous pointNumerous pointNumerous pointNumerous pointNumerous point
and non-pointand non-pointand non-pointand non-pointand non-point
sources ofsources ofsources ofsources ofsources of
pollution gopollution gopollution gopollution gopollution go
untreated.untreated.untreated.untreated.untreated.

23
A D D R E S S I N G C O N S T R A I N T S I N C O M P L E X S Y S T E M S
Mehsana district in North Gujarat is one of the richestaquifers in India. The deep alluvial aquifers extend
to depths exceeding 600 metres in central parts of thedistrict and contain substantial supplies of fresh water. Aslarge surface irrigation systems are absent in the district,groundwater is the major source of irrigation accountingfor nearly 97% of the net irrigated area in the district.Irrigation grew rapidly in the early 1970s with theintroduction of Green Revolution technologies. At that pointfarmers began investing heavily in tubewells for groundwaterpumping. Now the region’s agrarian economy is heavilydependent on groundwater, most of which is suppliedthrough private wells.
Uncontrolled extraction of groundwater for irrigation hasled to large drops in water levels in the shallow aquifersand the drying up of many thousands of open wells inMehsana district. Extensive rural electrification, the readyavailability of high capacity pump sets and deep drillingtechnologies initially enabled extensive development of deepaquifers. In addition, governmental subsidies for financingwell development and highly subsidized electricity in thefarming sector have also played a major role. The rapiddevelopment catalysed by these subsidies led to furtherlowering of water levels in the deep tubewells with aresultant increase in pumping depths.Although groundwater development in thedistrict was initially through shallow dug wells,the current depth of most tubewells inMehsana ranges from 200 to 300 metres andpump capacities ranging from 50 to 100 HPare common.
According to 1992 official estimates, theaverage annual extraction of groundwater inMehsana district is 901 MCM against anaverage annual recharge of 410 MCM (GOG,1992). The average annual decline inpiezometric levels in some parts of Mehsanahas increased from 1 m/year in the year 1971to 2 m/year in 1991 with some parts recordingdeclines of 5-8 m/year (GOG, 1992). Decliningwater levels have led to widespread well
failures. In addition, in some areas, pumping from deepconfined aquifers has resulted in groundwater qualitydeterioration. Salinity and fluoride levels in the waterpumped through tubewells are now often far above thosepermissible for safe drinking water. Of the 1,106 villagesin Mehsana, a total of 608 villages are affected byexcessive levels of fluoride in groundwater. Salinity is alsoemerging as a major problem for both agricultural andindustrial water users.
Regulatory measures to control groundwaterdevelopment in Mehsana have been attempted. These haveincluded restrictions on institutional financing for new wellsand pumps imposed by National Bank for Agriculture andRural Development (NABARD) and enforcement of wellspacing regulations by the Gujarat Electricity Board (GEB)through the denial of electricity connections. Restrictionson institutional financing have not been effective due tothe large amount of private investment in well drilling byfarmers’ groups as well as individuals in Mehsana. Wherespacing regulations are concerned, it is often possible tobypass restrictions on electricity connections. Overall,those attempts to regulate groundwater extraction in thedistrict appear to have had little impact.
D. Kumar, S. Chopde and A. Prakash
BOX 4:Mining of Aquifers in Mehsana
Deep aquifer mining: Gujarat
23

24
A D D R E S S I N G C O N S T R A I N T S I N C O M P L E X S Y S T E M S
Groundwater depletion is a well-known problem inCoimbatore district. During the last 30 years, the
number of wells has doubled but the net area irrigated bythem has increased only marginally from about 141,655ha to 142,096 ha. As a result, the average net irrigatedarea per well has shown a 50% decline from 1.56 ha in1960-61 to about 0.747 ha in 1989-90. Along with this, thenumber of abandoned wells in the district increased from4,033 in 1960 to 16,700 in 1990 (Palanasami andBalasubramanian, 1993). This indicates that thegroundwater resources of the region are fully developedand new wells are in competition with existing ones for thelimited available supplies of groundwater. Similar issuesare also found across large areas in parts of Karnataka(Rao, 1995) and are likely to emerge in many other hardrock areas.
As water levels fall, the risks for farmers associatedwith well construction have also grown. Drilling depthshave increased and many wells fail to strike significantamounts of water. Newcomers have to construct wellsdeeper than their predecessors who constructed wells, say,
BOX 5:Overdraft and Aquifer Disruption in Tamil Nadu
The social dynamics documented in Box 6highlight some of the fundamental challengesfacing attempts to address pollution. In manycases, particularly those involving industrialpollution, those most affected by problemshave far less political or economic power thanthe polluters. The social response documented inBox 6 is also common. When problems acutelyaffect larger populations, unified social protestmay result. The impact of protests is, however,often short lived. In the absence of ongoingenforcement measures, initial mitigationmeasures gradually decline. Local governmentsmay take up part of the slack, but the affectedpopulations generally remain in a much worsesituation than initially.
10 years ago. Deepening of each well affects other wellsand stiff competition among the well owners in exploitinggroundwater ensues. Individuals whose wells are affectedby a neighbours effort to deepen his own well cannot seekjustice through legal mechanisms because property rightsin groundwater are ambiguous and indeterminate. Thisdelicate situation poses heavy negative externalities onfuture users and adds to the costs for current users.
S. Janakarajan
These dynamics suggest the importance of anenabling civil environment. At present, the civilenvironment provides little support when localgroups protest. Their protests may be heard, butthey can be ignored after a short while. Thishighlights the importance of establishingpermanent organizations at local and higher levelsas well as legal frameworks for regulation andenforcement. NGO’s capable of sustained andinformed public advocacy are also important.Permanent local organizations are needed in orderto provide ongoing supervision of pollutingactivities – rather than relying on the temporarynature of social outrage. Given the social/politicalpower distribution, however, these will have littleimpact without higher level legal and other
Attempts toAttempts toAttempts toAttempts toAttempts to
addressaddressaddressaddressaddress
pollution facepollution facepollution facepollution facepollution face
fundamentalfundamentalfundamentalfundamentalfundamental
challenges.challenges.challenges.challenges.challenges.
Poisoned well lies abandoned: Tamil Nadu

25
A D D R E S S I N G C O N S T R A I N T S I N C O M P L E X S Y S T E M S
frameworks for enforcement that can balance thesocial and economic power of large polluters.
Variability
Variability represents a major watermanagement challenge. A typical example of thiscomes from Gujarat. Throughout northernportions of the state, rainfall is highly erratic.Storms tend to be brief and intense. Drought yearsare common. As Dr. Pisharote notes for Kutch,half the annual rainfall typically occurs over aperiod of 2-3 hours during the monsoon season.There are generally only 8-10 rainy days in theyear and rain actually falls for an annual averageof 12-15 hours (Pisharote, 1992). Under theseconditions, run-off is intense and only lasts forbrief periods. The area near Mandvi, for example,received 654 mm over a four-day period in July1992 after receiving only 185 mm total in 1991(Raju, 1992). Under these conditions, run-off isintense and only lasts for brief periods. Even inhigh rainfall sections of the state, precipitation ishighly seasonal. Out of an annual average of 51rainy days in south Gujarat, 48.5 (accounting for94% of the total rainfall) occur between June andSeptember (Phadtare, 1988).
Natural variability limits the array of responsesto water scarcity that are technically viable. Inthe Kutch case, many local residents – and a largenumber of engineers as well – argued that itwould be technically feasible to meet all regionalwater needs through structures capable ofharvesting 25% of the annual average rainfall.Because the rainfall is highly variable both withinand between years, however, this estimate isunrealistic. The four days of intense rainfall inJuly 1992 represent over 80% of the total rainfall
received in some locations over a two year period.Despite the construction of numerous waterharvesting structures, it was impossible to capturemost of the high flows.
Modelling efforts by VIKSAT undertaken as partof the current study (see the VIKSAT case study inthis document), suggest the inherent limitationsof local water harvesting in high variabilityenvironments. Their study for central Gujaratindicates that local water harvesting could addressan insignificant fraction of overdraft problems inthe region despite the fact that long term averagelevels of precipitation would be volumetricallysufficient for a much larger proportion.
A similar issue of variability is present in theNepal Tarai. There, farmers in traditionalirrigation systems often face major water scarcityproblems during low flow periods each year.Frequent flash floods, however, often damage thepermanent structures. Chaar Tapaha, one of thesystems along the Tinau, for example, experiencedflash floods in 1970, 1981 and 1995. Thesedamaged intake structures and in the 1981 casedeposited so much debris that the system took twoyears to repair.
Management challenges imposed by thenatural variability of precipitation patterns arecompounded by a similar high degree of variabilityin geologic and other factors affecting waterresource systems. It is beyond the scope of thispaper to go into these in detail. It is, however,important to recognize that temporal and regionalvariability represents one of the most importantchallenges for local water management.Recognizing the constraints this imposes onmanagement approaches and adapting responses
ManagementManagementManagementManagementManagement
options areoptions areoptions areoptions areoptions are
constrained byconstrained byconstrained byconstrained byconstrained by
naturalnaturalnaturalnaturalnatural
variabilityvariabilityvariabilityvariabilityvariability.....

26
A D D R E S S I N G C O N S T R A I N T S I N C O M P L E X S Y S T E M S
Groundwater pollution has become a major issue inseveral parts of Tamil Nadu. Important industries, such
as tanneries, textile dyeing units, viscose, paper pulp,sugar, sago, oil refineries, fertilizer units and chemicalmanufacturers often discharge effluents onto the landsurface or into rivers, thereby polluting groundwater as wellas surface water bodies. Groundwater contamination hasbeen particularly widely reported in parts of the state wheretanneries and dyeing and bleaching units are concentratedin large numbers. As most of these industries are highlywater intensive in nature, they are concentrated along the
river courses. This gives them good access to water (bothsurface and groundwater), and also enables use of therivers for effluent discharge. Important rivers in the statewhich have become badly polluted include: (i) the Bhavaniin Coimbatore district, (ii) the Kalingarayan Canal in Erodedistrict, (iii) the Noyyal in Tiruppur (Coimbatore district),and (iv) the Amaravathi in Karur district (v) the Kodaganarin Dindigul district and (vi) the Palar in Vellore district. Ofthese, the first five fall within the large Cauvery basin.
Pollution of groundwater in the Palar River basinrepresents a typical example of the problems now emergingin the above basins. Groundwater quality sample testsconducted at various points in this region by the Tamil NaduWater Supply and Drainage Board show very high levelsof total dissolved solids. Contamination has been observedup to a distance of 8 km from tannery effluent outfalls. Adetailed study undertaken by the Soil Survey and LandUse Organization, Government of Tamil Nadu, found thattanneries store their effluent in the earthen lagoons forsolar evaporation. The number and the capacity of theselagoons is not, however, proportionate to the quantity ofeffluent generated by the tanneries. Many of the lagoonsoverflow and the waste drains into nearby fields. Large-scale breaches in the lagoons are also common. As result,effluents seep and flow into fields where they stagnate. Alarge number of tanneries directly dispose of effluents intolakes and tanks. This, in turn, contaminates the lakes andsurrounding wells. The Soil Survey and Land UseOrganization identified about 16,000 hectares of affectedland due to the tannery effluent in the Vellore district asearly as 1982. The same study was repeated in 1990 onlyto find further damage to soils, surface and groundwater.A study conducted by the Central Pollution Control Boardto assess the groundwater quality collected samples from12 irrigation wells from 12 regions in 1994. The data showthat the groundwater in all the sample wells has excesssalinity. The study team has confirmed that, since thenatural aquifer was of a good quality, the excess salinitywas primarily due to contamination caused by the tanneryeffluent. In addition, heavy metals such as chromium,
BOX 6:Groundwater Pollution Due to Effluent Discharge in Tamil Nadu
Tannery effluent: Tamil Nadu
26

27
A D D R E S S I N G C O N S T R A I N T S I N C O M P L E X S Y S T E M S
copper, zinc, iron and manganese are now found both inthe tannery effluent and in the groundwater.
Another example of the impact of pollution comes fromthe Noyyal River basin. The social impacts in this regionare particularly evident and well documented. Large-scaleimpacts of pollution were catalysed when the Governmentof Tamil Nadu constructed the Orathapalayam Dam acrossthe Noyyal in 1992 about 10 km below Tiruppur. Thisdam was intended to provide irrigation for about 8,000hectares. It has a catchment area of 2,245 km2 whichincludes most of the area in which the dyeing andbleaching units are located. Water that is stored in thedam is much more than the actual flow in the river. Thisis because a large quantity of untreated effluent (about92 mld/day) produced by the Tiruppur dyeing and bleachingunits is released into the Noyyal River and contributes tothe ‘additional storage level’ of the dam. Thus, the dameffectively performs the role of a storage reservoir for thecontaminated water, contributing quite significantly topollution of the environment, in particular, groundwater.
In February 1997 water from the Orathapalayam Damwas released. The dam was opened without any priorpublic notice and the polluted water caused substantialdamage to crops, animals, soil and groundwater. Accordingto local villagers, hundreds of cattle died and enormousdamage was caused to groundwater along the river.Petitions were filed in the High Court protesting thedecision of the government to release the pollutedwater and claimed compensation for the damages. Whatfollows next is the case study of a village that representsa typical case where high levels of groundwatercontamination are reported:
The village of Veerapandi is located 12 km fromTiruppur, on the Tiruppur-Palladam road. This is a bigrevenue village with a population of 25,000 (Census ofIndia, 1991). One large knitwear factory, along with its owndyeing and bleaching units and two other small units, arelocated in this village. These industries were started about20 years ago. They utilize local groundwater resources and
discharge effluent on the open space and roads. Thiseffluent forms a stream that eventually joins the NoyyalRiver. Wells in this village have adequate water, but theyare completely polluted. Agriculture is a dead occupation.The industries have not only made use of the groundwaterquite successfully, they have also caused extensivegroundwater pollution by the discharge of untreated tradeeffluent. At present, the water is so polluted thatindustries have to transport water for their own use from anearby village.
Pollution of well water has also created an acutedrinking water scarcity problem. This became so bad thatin August 1997, about 3,000 people organized a processionand picketed the government offices protesting against thedyeing and bleaching units. They held the units to besolely responsible for groundwater pollution and theresultant scarcity of drinking and irrigation water in thearea. The sub-collector, one of the higher level governmentofficials in the region, had to intervene to placate the angrymob and helped to arrive at some agreement. Under theagreement, the industries were to supply two tanker-loadsdaily of potable water (15,000 litres per load) to the village.The agreement was complied with for about a month.Thereafter the supply was ceased on the pretext that theindustries were facing great pressure to erect their owntreatment plants. Later on, the panchayat union startedtransporting drinking water in rotation to various segmentsof the village. Through this each household received waterfor two and a quarter hours, equivalent to about 100 litresonce in 8 days. Soon it was realized that the water suppliedby the Panchayat Union was inadequate. In the currentscarcity situation, a local water market has developed. Afew farmers store lorry loads of water which they sell tothose who are in need at the rate of 75 paise per pot: Therate goes up to Rs 2 per pot in times of acute scarcity.Most people in this village use water for bathing only onceor at the most twice a week. This is the price that thevillage population is paying for drinking water after havingallowed the polluters entry into the village.
S. Janakarajan27

28
A D D R E S S I N G C O N S T R A I N T S I N C O M P L E X S Y S T E M S
to those constraints is central to the developmentof effective solutions to management needs.
Technical Change
A final major management challenge stemsfrom technological change. The development andspread of high dams, major embankment systemsand energized pumping technologies representeda fundamental shift in the ability of people to alterhydrologic systems. Take the case of pumpingtechnologies. Prior to the spread of energizedpumping technologies, the ability of society to altergroundwater regimes was, to a large extent,“capped” by the limitations of manual or animalpowered pumping techniques. The flows that werepossible to generate using these techniques werevery small in comparison to natural flows withingroundwater systems. Energized pumpingtechnologies changed that limitationfundamentally.
Throughout India, groundwater developmenthas been growing at an exponential rate overrecent decades. Figure 1 (compiled from a varietyof official sources (CBIP, 1989); (CGWB, 1991);(CGWB, 1995); and (CGWB, 1996)) suggests therapid rate of growth in groundwater extractionpotential caused by the spread of energizedpumps.5 Technological change on this scalefundamentally alters the context in which watermanagement must occur.
While there may be no immediately evidenttechnical changes on the horizon that woulddirectly affect water system dynamics in themanner that pumping technologies have done,other technological changes may have equal
impacts. Lateral thinking may be essential in orderto recognize the potential impacts of technicalchanges before they occur. Agricultural changes,for example, that are related to the spread ofmechanized farm machinery and the fieldcharacteristics necessary for it to operate couldfundamentally alter run-off and infiltrationpatterns. This is also the case with urban growth,road networks and other factors that result inthe creation of large impervious surfaces. Evenless directly connected to water use patterns arethe spread of global communications andremote monitoring technologies. These, forexample, may soon make it possible to monitorcropping at the level of individual fields and tomonitor water flows in systems on a real time basiseven under conditions in the Third World. This typeof information change could enable institutions– such as water rights – to evolve in ways that
TTTTTechnologicalechnologicalechnologicalechnologicalechnological
changes alterchanges alterchanges alterchanges alterchanges alter
the waterthe waterthe waterthe waterthe water
managementmanagementmanagementmanagementmanagement
context.context.context.context.context.
Modern and traditional technology: Rajasthan

29
A D D R E S S I N G C O N S T R A I N T S I N C O M P L E X S Y S T E M S
were previously impractical. This could eventuallyhave a major impact on water use patterns andsystem dynamics.
From a management perspective, the rapidpace of technological, social, economic and otherchanges has important implications. Flexibilityis essential. Rigid approaches that presumemanagement needs, issues and techniques whichcan be projected well into the future and addressedwith limited sets of specific interventions are likelyto fail as the technological context changes. Onthe other hand, approaches that are designed torespond adaptively and flexibly as technologicalconditions change and new opportunities arisemay have a much better chance of success. Therapid pace of technological change is afundamental reason why process types ofapproaches, rather than more rigid planningapproaches, are essential.
Social
Social issues associated with emerging watermanagement needs take a variety of forms. Onone level lie social consequences such ascompetition, differentiation, inequity anddestruction of traditional systems that can be
directly traced to specific water managementproblems. On a deeper level, however, lie issuesassociated with social structures and theimplications these structures have for the causesof specific water resource problems and potentialresponses to them. This arena is characterized byissues such as the role social and economic changeplay in shaping water use patterns, institutionalcapacity and scale and issues related to legalframeworks or water rights.
This section discusses a number of the keypoints that have emerged in the course of the jointresearch programme related to the above issues.The section is not intended to be comprehensive.Instead, the intention is to highlight details wesee as particularly important and relate these backto the larger conceptual framework.
Competition, Differentiation and Equity
Competition, differentiation and equity issuesrelated to water management problems have beena central focus for substantial research in SouthAsia. Competition over scarce water supplies isgrowing both between and within urban and rural
RigidRigidRigidRigidRigid
approaches thatapproaches thatapproaches thatapproaches thatapproaches that
proceed withproceed withproceed withproceed withproceed with
limited sets oflimited sets oflimited sets oflimited sets oflimited sets of
specificspecificspecificspecificspecific
interventionsinterventionsinterventionsinterventionsinterventions
are likely to failare likely to failare likely to failare likely to failare likely to fail
as theas theas theas theas the
technologicaltechnologicaltechnologicaltechnologicaltechnological
and socialand socialand socialand socialand social
context changes.context changes.context changes.context changes.context changes.
Vegetable irrigation using sprinkler: Tinau
Figure 1:Growth of energized pumpsets
30000
25000
20000
15000
10000
5000
0
1951 19
6119
7119
8119
9120
01
Thou
sand
s
���������������� ���� �������� ���� ���������������� ����

30
A D D R E S S I N G C O N S T R A I N T S I N C O M P L E X S Y S T E M S
areas. This leads to questions over equity in accessto water for regions and individuals. The case ofAhmedabad is typical of many cities in arid areas(Box 7). As Box 8 on Tamil Nadu discusses,competition within rural areas is also importantand can lead to processes of differentiation inwhich the poor lose out. Competition and theequity issues associated with it have receivedsignificant attention in debates over waterresources in South Asia (Shah, 1993; VIKSAT, 1993;Moench, 1994a). There is little point in revisitingthe nuances of those debates here. The
implications of competition and equity issues forwater management approaches are, however,important and have received somewhat lessattention than the issues themselves.
Perhaps the most important implication ofemerging competition and equity issues has to dowith the question of state legitimacy. In South Asia,state legitimacy is an exercise in the political artof managing the needs of large populations. Muchof this art is exercised through the state’s role inassuring (and often providing) basic services such
Provision of municipal water supply to Ahmedabad wasfirst planned by the municipality in 1890 and the initial
water supply system itself was developed in 1891 with apopulation of 155,405 being served. Since then, municipalwater supplies have been augmented numerous times inresponse to growing demands from large-scale expansionof the city area and the increasing population density withinit. Between 1951/52 and 1971/72 groundwater extractionfrom city wells for domestic and industrial use increasedfrom 6.4 MCM to 69.45 MCM and increased further to128.7 MCM by 1980 (CSE, 1995).
Unable to meet growing demands, the AhmedabadMunicipal Corporation started drawing water from theDharoi Reservoir. This water was initially developed tosupply irrigation in the downstream command area.Currently, water supplied from Dharoi to Ahmedabad is 189million litres per day (excluding transmission lossesbetween Dharoi and the Dhudheshar waterworks whichsupplies water to the city). This accounts for 45% ofAhmedabad’s municipal supplies. As a result, the reservoirhas seldom been able to provide the amount of waterpromised to farmers for irrigation. Over the past 21 years,the reservoir was only able to supply the planned allocationof water for irrigation for three years on the right bankand two years on the left bank. The amount of water
released for Ahmedabad and Gandhinagar from the DharoiReservoir has, however, steadily increased from 148.145MCM in 1971/72 to 225.56 MCM in 1996/97 (Puri andVermani, 1997).
The water table in and around Ahmedabad is decliningfast resulting in reduced yields for municipal tubewells. Inaddition, groundwater quality is deteriorating with increasingincidence of high fluoride levels and TDS in pumpedgroundwater. These levels are now often beyondpermissible limits. In sum, the scope for augmentingmunicipal supplies through groundwater to maintain currentservice levels is limited. Ahmedabad’s urban population isgrowing rapidly — historical trends show an annualpopulation growth rate of 2.59%. Assuming demand fordomestic water supply grows proportionately, maintainingthe minimum level of service in the urban area will be atthe cost of rural areas. In some cases, these are likely tocompletely loose access to surface water supplies forirrigation. Existing competition problems are compoundedby declines in the capacity of many of the surfacereservoirs. Sedimentation studies done on the Dharoireservoir indicate a total reduction in the capacity of 13.97MCM over a 3-year period.
D. Kumar, S. Chopde and A. PrakashSource: Projects Division, Dharoi Reservoir, Kheralu, Mehsana district.
BOX 7:Increasing Urban-Rural Competition in Gujarat
Equity is relatedEquity is relatedEquity is relatedEquity is relatedEquity is related
to the issue ofto the issue ofto the issue ofto the issue ofto the issue of
state legitimacystate legitimacystate legitimacystate legitimacystate legitimacy.....

31
A D D R E S S I N G C O N S T R A I N T S I N C O M P L E X S Y S T E M S
as food, water, power and roads. Historically, waterresource development was one of the most directmechanisms through which states in Asia coulddirectly improve conditions for their citizens andbuild their political legitimacy (Wittfogel, 1957).The role of water resource development gainedfurther prominence in the 1960s and 70s withintroduction of the Green Revolution package ofagricultural technologies in which irrigation wasthe lead input. By providing access to irrigationeither directly through surface systems or indirectlythrough energy and pump subsidies forgroundwater development, states enabled ruralpopulations to greatly increase agricultural outputand their overall wealth along with it.Furthermore, increases in agricultural outputprovided a foundation on which urban populationsand the urban-industrial economy could grow.This basic pattern remains unchanged in today’srapidly urbanizing world. Competition andequitable access were not an issue so long as thepie was growing. Now, however, competition overaccess is emerging as a major issue. If the stateis unable to meet the fundamental needs of itscitizens, its own legitimacy may be subject tochallenge. In some areas this has already evolvedinto a major source of internal political instability.7
It could translate into regional instability ifextended droughts or floods (such as the recentcyclone in Orissa) occur.
Competition essentially involves issues of accessto and allocation of scarce resources. These issuesare inherently complicated from a socialperspective. Regardless of official policy positions(or for that matter local norms), access andallocation issues tend to have major political andeconomic ramifications. Furthermore, themechanisms used for allocation touch deep
cultural, ethical and often religious sensitivities(Moench, 1995). As the boxes on Tamil Nadu andAhmedabad demonstrate, they also directly affectpeople’s livelihoods. As a result, the politicaland economic dimensions cannot be ignoredor eliminated.
Given the inherent political dimension, thenature of dialogue within civil society is offundamental importance to the resolution of watermanagement problems. This is a key reason whythe conceptual framework presented at thebeginning of this document emphasizes theimportance of an enabling civil environment andrecognizing the process nature of management.Water management challenges now emerging inSouth Asia represent a fundamental shift fromparadigms of water development that havecharacterized human history since prehistorictimes. The change from expansion into an“infinite” resource base to allocation of finitesupplies between competing uses draws social faultlines to the surface. How those fault lines arebridged, who benefits and who loses, and what
CompetitionCompetitionCompetitionCompetitionCompetition
involves issuesinvolves issuesinvolves issuesinvolves issuesinvolves issues
of access to andof access to andof access to andof access to andof access to and
allocation ofallocation ofallocation ofallocation ofallocation of
scarcescarcescarcescarcescarce
resources.resources.resources.resources.resources.
������ ������ ����� �
�����
���� �� ���� ������ ����� ���
�����
���������
����������
Source: Pani ko Artha Rajniti.

32
A D D R E S S I N G C O N S T R A I N T S I N C O M P L E X S Y S T E M S
In Tamil Nadu, competition over scarce groundwatersupplies is growing between farmers in many rural areas.
This is leading to a process of differentiation in which thosefarmers with better access to capital and other resourcesprogressively benefit at the expense of those farmers withfewer resources. Competition raises important issuesparticularly in cases where users have unequal financialendowments. Many dug wells are, for example, jointlyowned. Dug wells, which may measure 10x10m squareand up to 100 m deep, are often partitioned in theinheritance process. These partitions are then often furtherdivided as land is sold or divided among distantly relatedfamily members. As a result, individuals often own differentsized shares in wells. Because of land transfer traditionsin Tamil Nadu, these shares often relate to a physicalportion of a well – not to pumping hours or water volumes.Individual dug wells may have many pumps – eachbelonging to an individual shareholder.
In the above situation, competition aggravates theprecariousness of crop production. Even if farmers havea large share in a well, they have little assurance waterwill remain in it, since other shareholders can continue topump. This can inflame competition over declining water
tables. Competitive extraction increases as eachshareholder in the joint well seeks to protect “their share”of available water supplies. In some cases competitivedeepening occurs even within individual dug wells asshareholders seek to ensure that their section of the wellis deepest. The most important implication, however, is theprocess of differentiation that is occurring. Shareholdersin joint wells often have unequal access to it. This resultsin deprivation and exclusion of the resource-poor farmersfrom the use of such jointly owned wells. Competitionbetween well owners and the social and economicconsequences of progressive lowering of the water tableare matters of great concern.
Beyond the differentiation occurring between joint wellowners, ever-increasing costs are the most importantimplication of competitive well deepening. Hugeinvestments are lost as wells are abandoned and thepercentage of unsuccessful attempts to dig or drill newones increases. Eventually, losses represent a heavyburden on communities as well as on individual farmers.Major questions exist concerning the extent to whicheconomic activities in the context of competitive welldeepening are sustainable, particularly in hard-rock regions.
Well irrigation has become a gamble and notall those who invest in wells are successful.Many fail and lose in the race of competitivedeepening. They either sell their land orbecome locked in debt. A new dimension ofinequality is emerging between those whohave successfully maintained access togroundwater through competitive deepeningand those who have not. The former areemerging as a class of water sellers whilethe latter are reduced to the status of waterpurchasers. There is a sharp polarizationbetween water sellers and water purchasersboth economically and socially. Commercialdeals between water sellers and purchasersclearly expose the weaker bargaining capacityand the vulnerability of the latter.
S. Janakarajan
BOX 8:Competition and Differentiation Among Farmers in Tamil Nadu
Five pumps on a single well: Tamil Nadu
32

33
A D D R E S S I N G C O N S T R A I N T S I N C O M P L E X S Y S T E M S
Destruction of Functioning Systems
The wealth of history on the decline anddestruction of South Asia’s traditional waterharvesting systems has been extensivelydocumented (Agarwal and Narain, 1997). Thesesystems are widely recognized as a major resourcefor meeting local water management needs –where they can be maintained or revived. Thecore questions relate to that last caveat, themaintenance and reviving of traditional systems.
As the boxes 9 and 10 on Tamil Nadu and theNepal Tarai demonstrate, traditional systems wereembedded in specific social and technologicalcontexts. As contexts change, the incentives andlogic for users to maintain traditional systemschange as well. In the Tamil Nadu case,maintenance of tank systems was heavilydependent on the concentration of land in thehands of a relatively small group of upper castelandholders. When lands were re-distributed, thisgroup lost much of its social power and ability toorganize maintenance on a large-scale. Inaddition, the spread of pumping technologiesgreatly reduced the dependence of farmers on tankirrigation water. In the Nepal Tarai, traditionalsystems continue to operate in some areas. Inothers, however, projects for “modern” irrigationdevelopment have been implemented with littleknowledge of or consideration for existing systems.In some cases, such as Marchawar in Nepals’
Tarai, canals cut for modern systems have resultedin the direct physical destruction of traditionalirrigation works.
Beyond the specific causes illustrated in theTamil Nadu and Nepal cases, the larger contextin which traditional irrigation systems exist ischanging rapidly. At the global level, less than15% of the world’s population lived in cities andtowns in 1920, by the turn of the century nearly50% will (Morris, Lawrence et al, 1994, p. 1, citingUNCHS, 1987). Urbanization is also proceedingapace in South Asia although the proportion ofrural inhabitants remains higher than globalaverages (Chaterjee, 1998). Along withurbanization, the globalization of markets,communications and labour representfundamental context changes for traditional watermanagement systems. Many systems depended onthe existence of relatively stable, locally focused
Markets,Markets,Markets,Markets,Markets,
communicationscommunicationscommunicationscommunicationscommunications
and changingand changingand changingand changingand changing
labourlabourlabourlabourlabour
relationshipsrelationshipsrelationshipsrelationshipsrelationships
representrepresentrepresentrepresentrepresent
context changescontext changescontext changescontext changescontext changes
for traditionalfor traditionalfor traditionalfor traditionalfor traditional
waterwaterwaterwaterwater
managementmanagementmanagementmanagementmanagement
institutions.institutions.institutions.institutions.institutions.
interests are represented depends on the structuresthat govern social dialogue. Access to information,legal frameworks and the nature of organizationsin civil society are among the key elements thatcan counterbalance the exercise of raw politicalor economic power.
Main canal from Butwal barrage crossing Gurbania canal: Tinau

34
A D D R E S S I N G C O N S T R A I N T S I N C O M P L E X S Y S T E M S
communities to provide a basis for ongoingmaintenance and operational activities. Wherecommunities have become more mobile (havingnumerous individuals working outside on apermanent or temporary basis, for example) thesocial basis for maintenance of traditional systemoften declines. A similar situation can also occurwhere governmental assistance for theimprovement of traditional systems gradually
Traditional water resources institutions once commonthroughout India, primarily served irrigation and drinking
water needs. Their characteristics depended heavily uponlocal customs and conventions. In Tamil Nadu, as well asother parts of South India, there were innumerabletraditional systems of water harvesting. Tanks (smallreservoirs and ponds) were, however, one of the mostcommon forms of traditional water harvesting structures.Most were built for irrigation but others were intended tomeet the drinking water requirements of local people andlivestock. Temple tanks were also common. In addition totheir direct role in water supply, these water bodiesperformed an important function of groundwater recharge.In addition to tanks, thousands of temporary diversionchannels (kasam or spring channels) took off from riversand supplied irrigation water for at least one irrigated cropeach year. In many villages these spring channels werethe only important source of irrigation.
At present, many of the drinking water tanks, cattletanks (kuttai) and temple tanks are in poor or non-operational condition. Many others have disappeared orbeen encroached upon by other land uses. The well orderedtemporary diversion channel system has also disappearedin most of the villages. According to the original tankmemoir (notes from initial engineering surveys), 39,000irrigation tanks once existed in Tamil Nadu. The numberremaining in use is unknown as is the number that havebeen abandoned or have disappeared. Studies on tanksin Tamil Nadu indicate that large numbers are in decay,
particularly in northern parts of the state. The decline oftanks is directly related to declines in the institutionsresponsible for their maintenance. A recent study oftraditional irrigation institutions found, for example, thatinstitutions responsible for maintenance were defunct insix out of the fifteen tanks of the Palar Anicut System innorthern Tamil Nadu. In southern parts of Tamil Nadu,tanks still play an important role in irrigation.
One of the main reasons for the disintegration oftraditional irrigation systems in Tamil Nadu has been alarge-scale transfer of land from the upper caste landlordsto tenants and agricultural labourers. Prior to land reform,landlords not only controlled the land itself but also thewater resources. In this context, they performed the roleof an effective rule enforcing authority and mobilizedfree labour from their tenants for tank maintenance. Afterland reform, cultivation by small individual land ownersreplaced larger farms run by absentee and large landlordsas the primary mode of production. At the same timethe introduction of green revolution technologies startingin the mid-1960s increased the demand for reliablesources of irrigation water. This, along with the diffusionof pumping technologies, has catalysed large-scaleinvestment in well irrigation by many farmers. While thishas had many advantages for individual users it has alsoundermined traditional tank irrigation institutions. Thedecline of tank irrigation institutions is closely associatedwith growth in the number of irrigation wells constructed intank command areas.
S. Janakarajan
BOX 9:Destruction of Traditional Water Harvesting Systems in Tamil Nadu
undermines their operational and institutionalcapabilities. This is illustrated in Box 10 on thefarmer managed Khadwa-Motipur irrigationsystem in Nepal.
The above arguments should not be taken toimply that traditional systems are inherentlysubject to decline or that revitalization isimpossible. Instead, the core point is that major
Major trends inMajor trends inMajor trends inMajor trends inMajor trends in
society shapesociety shapesociety shapesociety shapesociety shape
the context ofthe context ofthe context ofthe context ofthe context of
waterwaterwaterwaterwater
management.management.management.management.management.

35
A D D R E S S I N G C O N S T R A I N T S I N C O M P L E X S Y S T E M S
The Khadwa-Motipur irrigation system in western Nepalis discussed in detail in the Nepal case study chapter
later in this volume. The system is farmer-managed, hasa command area of 2,000 ha, and has recently receivedgovernment support. Until the late 1970s a traditionalsystem to divert water from the Khadwa stream servedapproximately 18 villages. In the late 1970s, the local waterusers committee was headed by Bhushan Tiwari from atail end village who was also a member of the Rastriya(national) Panchayat. With his support, the villagersmanaged to get a “permanent” dam constructed for thesystem and a partially lined canal constructed up to thevillage of Bhuwari, the home of Bushan Tiwari. These
improvements lasted for one season before major damageoccurred. The system was then repaired a few years lateronly to suffer substantial damage during the followingmonsoons. The dam was completely reconstructed in 1985but again collapsed shortly thereafter. Now the system isbeing rehabilitated again under the irrigation line of creditfrom the World Bank.
Prior to 1992, water user groups in Khadwa-Motipurand other traditional irrigation systems were informal innature. They are now being formally registered under theWater Resources Act of 1992. As formal institutions, theyare susceptible to becoming a political forum for contestingpolitical power. In some ways, the processes offormalization and system “improvement” are underminingthe traditional system that existed prior to the 1970s.Headworks, which were once constructed with inexpensivelocally available materials, are now built from expensivematerials that are not locally available. When they fail,repair is difficult and local communities have learned towait for the next governmental rehabilitation project.Furthermore, the scheme no longer brings much benefit.Due, in part, to unreliability of the surface system overrecent decades, there are now 67 shallow tubewells and150 pumpsets in the command. Many farmers no longerdepend on the system for water. The net result is a historyof “improvements” that have gradually undermined systemoperation and led farmers to seek alternatives. Thetraditional system is, in many ways, no longer present.
D. Gyawali and A. Dixit
BOX 10:The Khadwa-Motipur Irrigation System in Nepal
The Prominent Role of Economic,Institutional and Cultural Factors
The previous section highlights the role ofsocial change in the decline of traditional watermanagement systems. In many ways, social,cultural, institutional and economic factors outsidethe physical resource system, and availabletechnology, are the most prominent elements
Private pump in Tinau command
trends in society are reshaping the context inwhich water management occurs. Approaches thatignore or do not evaluate the logic of specificmanagement approaches in the context of thesetrends are likely to fail. Management approachesmust, as a result, reflect and, wherever possible,build off major social trends. Maintaining andrevitalizing traditional systems may face particularquestions on this count.
Societal trendsSocietal trendsSocietal trendsSocietal trendsSocietal trends
shape watershape watershape watershape watershape water
managementmanagementmanagementmanagementmanagement
responses.responses.responses.responses.responses.

36
A D D R E S S I N G C O N S T R A I N T S I N C O M P L E X S Y S T E M S
influencing water use patterns at local levels.The case of the Shekhawati basin in Rajasthan(Box 11) illustrates the role economic andinstitutional factors play in rural areas. Asdiscussed further in Box 12, urbanizationand larger changes in the structure of societyare also major factors. The primary focus hereis, however, on factors within rural areas.
In most agricultural areas, crop choice isone of the largest factors affecting water demandat the field level. The decisions individual farmersmake regarding crop selection are based onan array of considerations including prices,risks, input availability, marketing facilities and,at least in some situations, cultural factors. Thesefactors are often interrelated. The crop pricesfarmers see are often, for example, influenced byglobal market conditions, governmental supportprogrammes and the presence or absence ofmarketing facilities. In the Shekhawati Basincase, high prices for oilseeds (a product of bothincreasing demand and governmental supportprogrammes), the development of organizationsfor oilseed processing and marketing, andreductions in risk through subsidized creditplus groundwater development resulted indramatic shifts in cropping patterns. Over a periodof approximately 15 years, oilseed productiongrew from negligible to over 40% of theirrigated area in the basin. This increase wasbrought about primarily through expansion inirrigated area, although crop shifting from moretraditional crops such as wheat may also haveoccurred. It is important to note, however, thatdespite the substantially better returns associatedwith oilseeds, wheat production remains verysignificant – accounting for approximately 30%of the irrigated area.
Many economic,Many economic,Many economic,Many economic,Many economic,
technical andtechnical andtechnical andtechnical andtechnical and
cultural factorscultural factorscultural factorscultural factorscultural factors
affect cropaffect cropaffect cropaffect cropaffect crop
choice andchoice andchoice andchoice andchoice and
consequentlyconsequentlyconsequentlyconsequentlyconsequently
waterwaterwaterwaterwater
managementmanagementmanagementmanagementmanagement
options.options.options.options.options.
Cultural factors may be playing a majorrole in limiting the shift away from wheat andinto oilseeds. In Gujarat and Rajasthan, societyplaces a high social value on food self-sufficiency.During fieldwork in both locations, farmers oftenemphasized that it is a point of pride never topurchase grain from the market. Growingsufficient wheat for home use is widely viewed asthe basic measure of a successful farmer. In somecases visited in Mehsana district of Gujarat, farmersare irrigating wheat using groundwater withpumping lifts of greater than 200 m. In interviewsthey regularly acknowledge that they could earnmuch better returns by growingoilseeds and, in some cases, point out that thewheat would actually cost less (despite highsubsidies for electricity for pumping) if purchasedon the market.8 Furthermore, farmers indicateda strong awareness of water scarcity alongwith the need to conserve or use it as efficientlyas possible – but that awareness did notoverweigh the social marker value of growing atleast some wheat.
The above dynamics within rural areas arefurther complicated by major patterns of socialchange occurring throughout South Asia. Aspreviously noted, urban populations in SouthAsia are growing rapidly, as are the urbanpopulations Worldwide. In 1920, less than 15%of the world’s population lived in cities andtowns. By the turn of the century nearly 50% will(Morris, Lawrence et al., 1994, p. 1, citing UNCHS,1987). The same pattern is occurring in Indiaand, to a lesser extent, in Nepal (Chaterjee,1998). The consequences of this are illustratedin the case of Tamil Nadu (Box 12). Industry isgrowing and water use patterns are shifting. Moreimportantly, the structure of society is changing

37
A D D R E S S I N G C O N S T R A I N T S I N C O M P L E X S Y S T E M S
In the Shekhawati basin a wide variety of factors (includingagricultural pricing policies set by the government, the
development and adoption of new seeds along with inputsubsidies, and state intervention in creating appropriatemarketing facilities), have caused significant changes inland use and cropping patterns. Over the past two decades,credit support programmes run by the National Bank forAgriculture and Rural Development (NABARD) were a majorfactor supporting the digging of new wells and the adoptionof sprinkler technology. Changes in the relative price ofcrops and the development of processing and marketingfacilities also made oilseeds more profitable. This led tomajor reductions in the area under traditional irrigated cropswhile the area under oilseeds (mustard and rape, whichare commercially valuable, low water intensity crops) hasgrown greatly, and water saving technologies such assprinklers have been widely adopted. Water demand perunit output may have dropped as a result. This shift has,however, been accompanied by increases in the numberof energized wells and irrigated area. As a result, netextraction has probably not declined.
The land use pattern in the Shekhawati basin hasundergone significant change since 1980. The basin hasrecorded an increase from 566 thousand hectares to 585thousand hectares (that is, an increase of roughly 19thousand hectares) in area sown more than once. As aresult the total cropped area has shown an impressiveincrease of 16 per cent. This increase has resulted in areduction in fallow and grazing lands. In addition, the areaclassified as uncultivable wasteland has declined from over60 thousand hectares to less than 30 thousand hectaresbetween 1980 and 1997.
The changes in cropped area are reflected in thecropping pattern of the basin. Between 1980 and 1990 theirrigated area increased almost 100%, and it increased afurther 30% between 1990 and 1997. In addition, a strikingchange occurred in the cropping pattern. The area underoilseeds increased dramatically from negligible levels in1980 to 87.6 thousand hectares in 1997. Oilseed cropsnow account for more than 40 per cent of the total irrigatedarea. The next most important crop is wheat, whichaccounts for about one third of the irrigated area. All these
crops are rabi season crops.The khari f crops are mostlyrainfed and irrigation then ismostly protective.
Although the region has shiftedfrom relatively lower valueand higher water intensitycrops to higher value andlower water intensity crops andmany farmers have adoptedsprinkler irrigation technologies,increases in irrigated area suggestthat groundwater extraction hasnot declined. In any case,groundwater tables throughout thebasin have declined sharply overthe last decade, possibly causingirreversible damage to the aquifer.
M.S. Rathore
BOX 11:Social and Economic Change in the Shekhawati Basin, Rajasthan
Sprinklers in Rajasthan
37

38
A D D R E S S I N G C O N S T R A I N T S I N C O M P L E X S Y S T E M S
With an urban population of 33%, Tamil Nadu has thesecond largest percentage of its population in urban
areas of all states in India. Composite indices reflectingurbanization characteristics, such as town density inaddition to urban population, place it first. Most of thisurbanization has occurred over recent decades and therapid process coupled with speedy industrialization hasresulted in a situation where it is increasingly difficult tomeet the basic water and other needs of urban populations.
In the last decade, many industrial and commercialestablishments in the urban areas have been drawing ahuge amount of groundwater through their own deepborewells or by purchasing water. Noteable among the citiesand towns in the state which depend upon the pumping ofwater from their rural neighbourhood are Chennai and theCoimbatore-Tiruppur-Erode corridor (in the previouslyundivided Coimbatore district), Karur (Karur district) andDindigul (in Dindigul district). The sale of groundwater hasbeen quite extensive in these areas. Perhaps the largestconsuming town is Tiruppur in Coimbatore district. Thistown has earned a place on the industrial map of thesubcontinent as one of the largeforeign exchange earners due to theheavy concentration of knitwearindustries in the town.
The case of Tiruppur illustratesthe impact rapid urbanization ishaving on water demand and usepatterns. There are about 752 dyeingand bleaching units functioning in thistown whose operations dependheavily on high quality water. In theabsence of any other source, theseunits have been transportinggroundwater from the rural areas bytruck-tankers. Out of 93 million litresof water used per day (mld) in thistown, private water supply alonecontributes to about 60 mld, or 64%.The water is transported by the truck-
tankers from several villages within a 30 km radius ofTiruppur. A rough estimate puts their number at 900 to1000, of which about 90% are reported to be owned bythe industrialists. Although much more water is used forirrigation purposes than for the urban industrial and drinkingwater needs, the Tiruppur industries concentrate theirpumping in the selected villages in the area where thequality of water is relatively better. This puts an especiallyheavy burden on these villages. As a result of this exportof good quality water from the villages, there has been atrend in the last 10 to 15 years of agricultural wells goingdry and people finding it hard even to meet their drinkingwater needs. There are now about 30 heavily affectedvillages around Tiruppur. The people living in these villages,especially farmers, have become increasingly sensitive tothe depleting groundwater conditions. Wet crop or gardencrop cultivation (in particular coconut, banana and turmericcultivation) is no longer practiced in these villages. Mostdeep borewells belong to industrialists.
S. Janakarajan
BOX 12:Urbanization and Rural-Urban Water Trade in Tamil Nadu
Water in tankers for sale: Tamil Nadu
38

39
A D D R E S S I N G C O N S T R A I N T S I N C O M P L E X S Y S T E M S
The prominent role of social, cultural,economic and institutional factors represents oneof the largest challenges for water management.Water management discussions often focus onwater management topics per se rather than onthe larger context shaping water use decisions.Where institutions are concerned, discussions oftenfocus on specific water management organizationsrather than on the wide array of institutions,such as agricultural cooperatives or marketingfacilities, for example, that shape marketstructures. Similarly, where economics areconcerned, discussions emphasize water andenergy prices rather than the economics of cropchoice. Water and energy prices can be a minorfactor in the larger economics of crop productionand may, thus, have little actual impact on thetotal amount of water used (Moench and Kumar,1994). In addition, cultural factors such as thesocial value of food self-sufficiency as a key markof success can dominate economic factors in wateruse decisions even where water scarcity is a widelyacknowledged concern.
The above points underlie many of the keyconceptual elements we see as essential foreffective water management. Economic and socialfactors often change rapidly. Management systemscannot, as a result, remain fixed. Instead,management needs to be structured as a processcapable of responding to changing contexts.Systemic perspectives and integrated response setsare equally important, because water managementinterventions per se may have far less impact onactual water use patterns than the wider array ofeconomic, institutional and cultural factorsaffecting individual water use decisions.
Organization Capacity and Scale
Although larger patterns of social andeconomic change probably have a greater impacton water use per se, water related organizationsare extremely important as the focal pointsthrough which intervention and managementinitiatives occur. Among many factors central todebates over water management organizations,discussions among the organizations collaboratingin this project highlighted four as particularlyimportant:
1. The gap between the village and the state:
Throughout South Asia, most organizationsdealing with water management fall into one oftwo large classifications – governmental andvillage. Most government organizations arecentrally controlled either at the national level orthe state level. They are part of largegovernmental bureaucracies and have relativelyweak links with the local realities of watermanagement needs. Village level organizations,in contrast, are generally very small and localized.They deal with water management needs at a locallevel and often operate informally. While theseorganizations are closely linked with localproblems and realities, they function with little
South Asia lacksSouth Asia lacksSouth Asia lacksSouth Asia lacksSouth Asia lacks
intermediateintermediateintermediateintermediateintermediate
levellevellevellevellevel
organizationsorganizationsorganizationsorganizationsorganizations
for waterfor waterfor waterfor waterfor water
management.management.management.management.management.
The village-stateThe village-stateThe village-stateThe village-stateThe village-state
gap must begap must begap must begap must begap must be
bridged.bridged.bridged.bridged.bridged.
Stakeholders’ Forum: Gujarat
rapidly making it difficult to identify a sustainablesocial basis for management.

40
A D D R E S S I N G C O N S T R A I N T S I N C O M P L E X S Y S T E M S
technical expertise or other backup. Feworganizations function at levels between these twoextremes. This polarization represents a significantchallenge for effective water management becausemany needs require regional scale (aquifer orbasin) interventions. Traditional irrigationsystems in Nepal, which may cover as many as5,000 ha and involve thousands of farmers, arethe only example of intermediate level watermanagement organizations we have encountered.
2. The orientation of water management
organizations: Most water organizations in SouthAsia were initially structured to implement waterdevelopment activities. This orientation remainsstrong. The tendency for organizations to focuson development is enhanced by the fact thatdevelopment requires large amounts of fundingfor construction while management interventionsmay require substantially less.
3. Organization capacity for management is
limited: In concert with the focus on development,
most governmental water organizations aredominated by technical specialists. Effectivemanagement, however, requires organizations tohave an effective capacity to take part in dialogueswithin civil society. Management processes requireinstitutional evolution and capacity development.
4. Organization responsibilities are often
disjointed and overlapping: The case of the TinauRiver provides the best illustration of this.Numerous traditional and governmentalorganizations are engaged in activities affectingthe water resource system along the Tinau.Because few of these are aware of each other,activities often conflict. Deep irrigation wellsfunded by international donors, for example, arebeing installed in locations where shallow wellsalready meet most irrigation needs. Projects suchas the Marchawar Lift Irrigation Scheme aredesigned and constructed with little knowledge ofthe traditional systems they bisect. On the Indianside of the border, embankments are constructedto protect areas from flooding. In the process they
The processThe processThe processThe processThe process
approachapproachapproachapproachapproach
emphasizes theemphasizes theemphasizes theemphasizes theemphasizes the
evolution ofevolution ofevolution ofevolution ofevolution of
organizationalorganizationalorganizationalorganizationalorganizational
capacities.capacities.capacities.capacities.capacities.
The confluence of water, religion and officialdom. State managed canal: Rajasthan

41
A D D R E S S I N G C O N S T R A I N T S I N C O M P L E X S Y S T E M S
create larger flood problems in other areas andundermine agricultural systems dependent on siltand rapid drainage. There is no mechanism forcoordination at a regional or basin level.
From our perspective, the above organizationalissues are a major reason behind the necessity ofa process approach to management.Organizations often cannot be created, reformedor strengthened rapidly – particularly when thearray of activities needed is complex and variesgreatly between locations. Process approachesemphasize the gradual evolution of organizationalcapacities in response to needs and opportunities.While it is clear that core gaps – such as theabsence of intermediate level organizations capableof addressing regional problems – must be filledeventually, the specific characteristics of theseorganizations is difficult to determine in advance.A process approach enables the essential evolutionto proceed.
Legal Frameworks and Water Rights
Existing legal frameworks for watermanagement in South Asia are partial at best. InIndia, there are four sets of legal frameworksaffecting water use and management: traditional,common law, legislative and constitutional. Whileit is beyond the scope of this paper to review thesein detail, it is important to recognize that existingframeworks are in a state of flux. This isparticularly true in the case of groundwater. As arecent report by the World Bank and Governmentof India states: “Systematic approaches tomanagement require a solid legal frameworkif they are to be implemented. Groundwaterlegislation will ultimately be essential formanagement. There is, however, little unanimity
regarding the form such legislation should takein order to be effective.”(WB, 1998, p. iv).
The case of India is illustrative. In many partsof India, traditional rules of allocation and formsof water rights still govern the day to day use ofwater at local levels. This is clearly evident in thehill irrigation systems of the Indian Himalayas(and Nepal), many of which operate on the basisof complex local customary rights systems. Inaddition to traditional practices, Common law(derived from the British, and ultimately Roman,systems) governs most aspects of water in the civilcourts. Under common law, groundwater is chattelto land. Extraction of percolating waters with nolimit on quantity is the right of every landowner(Sinha and Sharma, 1987; Jacob, 1989). Thisright is, in theory, limited by the Easement Actand irrigation acts which “proclaim the absoluterights of government in all natural water” (Singh,1990, p. 50). In addition, a number of othersubsequent acts such as the Maharashtra Water
Existing legalExisting legalExisting legalExisting legalExisting legal
frameworks areframeworks areframeworks areframeworks areframeworks are
in a state ofin a state ofin a state ofin a state ofin a state of
flux.flux.flux.flux.flux.
Traditional sancho for water allocation: Palpa

42
A D D R E S S I N G C O N S T R A I N T S I N C O M P L E X S Y S T E M S
Act, Madras mini-act, Gujarat amendment to theIrrigation Act, and the Model Bill circulated by theCentral Ground Water Board all start with theperspective that water rights are all held by thegovernment. These acts relate, albeit indirectly,to constitutional provisions. Under Entry 17 of ListII of the Constitution of India, the states have fullauthority overall water within their borders exceptin the case of interstate rivers and basins (WorldBank, 1998). Other constitutional provisions,specifically those relating to the environment andthe right to life, limit the way in which water rightsheld by either the state or individuals can be used.
The above mix of rights, many of which arecontradictory, has been coming under increasingpressure due to a variety of recent events. On onehand, increasing attention is being givenworldwide to water markets and their potential useas efficient mechanisms for water allocation.Development of formal water markets (as opposedto water trades between adjacent users) requires alegal rights foundation. On the other hand, recentdecisions by India’s Supreme Court mandategovernmental action in the form of a groundwaterauthority for regulating extraction to addressoverdraft. These developments lay the foundationfor increased conflict between use patternsestablished on the basis of traditional or customaryrights and new forms of rights. At present, it isfar from clear what types of rights systems will beboth viable and capable of meeting emergingmanagement needs. The types of privately heldtransferable rights essential for large-scale watermarkets to evolve may be socially or politicallyunacceptable. The physical difficulty inestablishing such a rights system should also notbe underestimated. There are, for example, over
25 million private pumpsets in India (World Bank,1998) and, as previously noted, many wells arecapped and buried when not in use in the NepalTarai. In this situation, the practical difficultiesin monitoring groundwater extraction may exceedany benefits that would be achieved through arights system.
Overall, the fact that clear pathways forreforming water rights do not exist and thatsubstantial experimentation will probably berequired before effective rights systems can bedeveloped are key reasons why an evolutionaryprocess approach to water management is needed.Rights systems do represent part of a largerenabling civil environment. They cannot, however,be deviced or imposed without substantialexperimentation and learning. Furthermore, inmany cases traditional or civil rights systems mayprovide key building blocks for future approaches.While much has been done to document thesesystems, how the advantages they contain mightbe integrated into more formalized governmentalsystems remains relatively unexplored.
Social Responses
The major social responses to emerging watermanagement problems have taken a variety offorms. Throughout much of India, water scarcityhas led to the spontaneous emergence of informalmarkets for drinking, irrigation and, in some cases,industrial supplies. Interviews with field NGOs andfarmers also indicate that water scarcity isbecoming a major factor driving rural populationsto migrate to urban areas. Where organized actionis concerned, protests at the grass roots level arecommon and many rural NGOs have decided
DevelopingDevelopingDevelopingDevelopingDeveloping
effective watereffective watereffective watereffective watereffective water
rights systemsrights systemsrights systemsrights systemsrights systems
requiresrequiresrequiresrequiresrequires
experimentation.experimentation.experimentation.experimentation.experimentation.

43
A D D R E S S I N G C O N S T R A I N T S I N C O M P L E X S Y S T E M S
either to focus on water problems or include themin their village level work programmes. A similarevolution has also occurred at the national levelwith higher-level research organizations andactivist NGOs incorporating water problems asmajor components in their agendas. Thesenational level NGOs and research organizationsprovide much of the analytical and activistpressure behind recent national level attention towater issues. A recent tangible result of this is theSupreme Court decision mandating action by theCentral Ground Water Board to address overdraftproblems (World Bank, 1998). Beyond this type offormalized action, water issues are becomingmajor focal points for political attention.
The cases of Kathmandu and Gujarat (Boxes13 and 14 ) are a good illustration of the gradualevolution of social responses to water scarcity.Historically, water supply depended on the initiativeof individuals and local communities to dig wellsor divert streams to meet their water needs. Withpopulation growth, agricultural intensification andurbanization, needs grew beyond the scale atwhich individuals or communities could easilyrespond. At this point governments began thedevelopment of supply systems. Often these startedas what we now term “traditional” systems andthen evolved in a piecemeal manner into irrigationor drinking water supply systems containing a mixof modern and “traditional” technologies. In theKathmandu case, growing demand andoperational issues have outstripped the capacity ofthe government to manage the system, and scarcityfor users emerges as a result. Rather thanaddressing these internal management issues, thegovernmental response focuses on the developmentof new supplies. At the same time, scarcity (either
in an absolute or quality sense) creates theconditions in which markets emerge. This formof social response is generally paralleled by theemergence of social protest. Although initiallydisorganized, social protest over water scarcityproblems often leads to the emergence ofinstitutions or forums outside the government thatadvocate for change. Where educational, financialand organizational resources are available, as inKathmandu and Gujarat, these institutions canprovide an increasingly informed and sophisticatedbasis for social debate over potential responses.Where these resources are less available locally,as the case of pollution in Tamil Nadu suggests(Box 6), external organizations may enter. Often,however, a long term process of protest, minorgovernmental responses and local adaptation toscarcity emerges as the dominant response.
Beyond the broad patterns noted above,summarizing the full array of social responses isbeyond the scope of this paper. A few commonelements are, however, important to note. We viewthese elements as a central component of thecontext in which management must occur.
First, social agitation is frequently emerging inmoments of crisis and water issues are becomingcentrepoints for political attention. As the box ongroundwater pollution in Tamil Nadu documents(Box 6), agitation is often intensive but short-lived.Groups organize to protest a specific issue – waterscarcity, pollution problems, electricity prices orshortages, etc. – and the crisis is temporarilyaverted only to emerge again as attention wanes.Despite its temporary nature, the extent of socialagitation around water issues is increasing. Thedegree to which water issues have become a focal
Social responsesSocial responsesSocial responsesSocial responsesSocial responses
to waterto waterto waterto waterto water
managementmanagementmanagementmanagementmanagement
problems take aproblems take aproblems take aproblems take aproblems take a
variety of forms.variety of forms.variety of forms.variety of forms.variety of forms.

44
A D D R E S S I N G C O N S T R A I N T S I N C O M P L E X S Y S T E M S
Kathmandu, the capital of Nepal, sits on a plateau in abroad valley surrounded by the Mahabharat Mountains.
The Bagmati River and its tributaries are the valley’sprincipal river system and its springs are the main sourceof drinking water for the residents, particularly for greaterKathmandu — the urban core of the valley. Whereas thesnow-fed rivers of the country bypass the valley in theeast and west, the Bagmati, is rainfed. Residents of thecapital served by the city drinking water system facerecurrent water scarcity even during high rainfall portionsof the year. Responses to scarcity have been ongoing fortwenty five years and provide an interesting case study ofhow different social groups within the capital have perceivedand responded to the problem.
For the sake of analysis, responses to scarcity can becategorized as occurring within four social and institutionalgroupings: (1) individual and community initiative; (2) thegovernment; (3) the market; and (4) civil society institutions.
The first grouping consists of individuals and localcommunities (or user groups) who took the initiative todevelop local water supplies to meet their own needs. This
“traditional” form of water development prevailed throughoutmost of the valley until recent decades.
The second institutional grouping, and the currentlydominant one, is that of the government and thegovernmental water utility that now has the formalresponsibility of supplying water to greater Kathmandu.Historically, drinking water supply to the town of Kathmanduwas met through stone waterspouts. These flowing spoutsare located within rectilinear pits built in the ground. Thespouts were supplied through Raj Kulos (state canals),which served irrigation water needs. These stone spoutsused local water sources and, though they received statesanctions, were highly decentralized.
Modern intervention for improving drinking water inKathmandu started more than 100 years ago during thereign of Rana Prime Minister Bir Sumsher. It was duringhis rule that Kathmandu’s first drinking water system, theBir Dhara, was built. The supply system also had theostensible function of supplying water to the fountain infront of his palace, which was called “Fountain Palace” (inNepali Fohora Durbar). Subsequently there have been
BOX 13:Social Responses to Deficient Drinking Water Supply, Kathmandu
Private water tanker: Kathmandu Rower pump: Kathmandu

45
A D D R E S S I N G C O N S T R A I N T S I N C O M P L E X S Y S T E M S
Traditional drinking water source: Kathmandu
several interventions to tap water in the surrounding hillsas the population increased and the character of the capitalchanged from agricultural to a commercialized metropolis.In the early 1970s Nepal secured the first loan from theWorld Bank to upgrade the drinking water supply systemfor Kathmandu. A few years later, the Bank funded theinitiative to tap into the valley’s groundwater. Subsequently,more water has been tapped to fulfill water needs of thecity’s population.
The network that currently supplies water in theKathmandu Metropolitan Municipality and LalitpurMunicipality covers an area of 50 km2 and serves 935,000consumers via 96,058 connections.9 Daily drinking waterproduction is 107,000 m3/day with an estimated system lossrate of 40%. Water supply is intermittent and severallocalities on the network are not supplied. The systemreceives water from seven different production arrangementsinvolving surface and groundwater sources which supplywater to seven sectors of the city.
By the 1980s, the water supplied via sources within thevalley was considered to be inadequate and sources outsidethe valley were investigated. The source identified as mostfeasible was the Melamchi River, which could be tappedvia a 27 km tunnel though the mountains north of the valley.The Melamchi Project is currently being pursued, with theAsian Development Bank taking the lead role. Whencompleted, the Melamchi project is expected to augmentthe drinking water supply of Kathmandu substantially. Theefforts of the state agencies has been guided by theincentives for continued augmentation of supply as theirdominant response to water scarcity.
The third institutional response has been the emergenceof water markets and related commercial organizations.Scarcity of drinking water supplies from the governmentsystem has forced individuals to develop or return to otheroptions. Many residents in the city have directly connected
centrifugal pumps to the mains, while land owninghouseholds have installed hand pumps, rower pumps, oropen wells. Others have resorted to collecting rainwaterat least during the monsoon months. More affluent groups,such as Kathmandu’s hotels, industries and commercialestablishments have installed deep tubewells. Since many

46
A D D R E S S I N G C O N S T R A I N T S I N C O M P L E X S Y S T E M S
of the sources are of uncertain quality, commercialestablishments have sprung up that offer water treatmentand water quality testing services. Many entrepreneurssupply drinking water. Water sellers using private tankersare also active, and bottled water use is now common.In doing so they provide a key service and also makessignificant profits. One 8,000 litre tanker of water costs Rs1,000, one litre of bottled water costs Rs 20. The situationof scarcity has been used by some to make a profit byproviding the services.
The final institutional response to the water supplysituation in Kathmandu has been by activists, consumers’forums, journalists and academics. These critique thesystemic flaws in the management of the valley watersupply utility and question the need to develop new suppliesby demonstrating that existing supplies could meet needsif management were improved. Questions are raised innewspapers, TV and public programmes. These critiquesare, however, infrequent, disorganized, and too feeble to
receive major attention by government agencies anddonors who continue business as usual. Critiques have,however, had limited impact. The inefficiency of theparastatal utility has been noted by the World Bank and ithas proposed that management of Kathmandu’s watersupply system should be leased out to the private sector.The question of why the supply points in the distributionnetwork do not receive the quantity of water that musttheoretically be available remains unanswered.
The Kathmandu case indicates the varied nature ofresponses to drinking water supply scarcity. Every sociallyorganized group prefers solutions that reflect their ownstrategy, fear of risks and perception of nature. Mostindividuals, whatever group they fall within, strategizeto secure access to drinking water either bymanipulating the governmental supply system, or bycreating access to the market, by protest or by thedevelopment of private sources.
A. Dixit and D. Gyawali
Pumping water from a supply main: Kathmandu Bottled water is becoming popular in Kathmandu

47
A D D R E S S I N G C O N S T R A I N T S I N C O M P L E X S Y S T E M S
Mehsana district in northern Gujarat has been a focusof attention for hydrologists, agricultural economists
and government policy makers working on water resourcesfor several decades. This is due to the extensive alluvialaquifers underlying the district, exponential growth in thenumber of wells, the intensity of groundwater irrigation andits contribution to the agrarian economy of the region.Groundwater over-exploitation problems first emerged in theearly ’70s in the intensively cultivated areas of northernGujarat when expansion of tubewell irrigation caused waterlevel declines in the shallow alluvial aquifers and the dryingup of open wells.
In order to understand the nature of the causes of waterlevel declines a study sponsored by the UNDP was doneof the Mehsana aquifers in the early 1970s. This wasfollowed by several publications, which focused on emergingphysical problems and potential technical solutions suchas artificial recharge and water harvesting. In 1976,artificial recharge experiments were successfully carriedout in Mehsana with assistance from the UNDP. Thisconfirmed the technical viability of recharge options.However, recharge activities did not take off on a large-scale due to lack of funds. The availability of sufficientwater for recharge to have much impact on groundwateroverdraft problems is also uncertain.
By the late 1980s water problems in Mehsana and otherareas were becoming more widespread and groundwatermanagement became one of the core issues in the overalldebate on water among academicians, government policymakers and NGOs. The response from NGOs such asthe Shri Vivekananda Research and Training Institute(SVRTI) in Mandvi, Kutch and the Aga Khan Rural SupportProgramme (I) (AKRSP (I)) came in the form of local watermanagement initiatives in their project areas. These andother academic and research institutions took up severalresearch studies looking at the social and economicimpacts of resource depletion.
In the early ’90s, farmers from villages near Upletta in
Rajkot district of Gujarat started diverting rainwater intotheir farm wells in an effort to replenish their drying wells.Later, this was picked up on by many religious and spiritualinstitutions, NGOs and grass root organizations in otherareas of Saurashtra as a worthwhile method of addressingthe scarcity issues.
A conference organized by VIKSAT in 1993 first lookedat the technical, social, economic, legal and institutionalissues in groundwater management in India. It was followedby several publications discussing the range of issues andthe physical, social and economic options for managinggroundwater (Moench, et al, 1994). The mid-1990s sawmany NGOs and grass root organizations in the statereplicating the experiments by Swadhyaya, Sri VivekanandResearch and Training Institute (SVRTI) and Aga KhanRural Support Programme, India (AKRSP) in local watermanagement, while many others also advocated a supplybased approach as a solution to groundwater depletionproblems and water scarcity.
In the late 1990s, a prestigious rural institution, theMehsana Dudh Sagar Dairy, began to be actively involvedin local water management activities in Mehsana. This isoccurring with funds mobilized from the village dairycooperatives that are affiliated with the larger dairycooperative. The larger cooperative has set up afoundation, the Motibhai Foundation, to work on addressingwater management issues in the district. The involvementof the diary represents a significant change in the degreeof local attention being devoted to groundwatermanagement. Most NGO efforts have been externallyfinanced and involve, at most, only nominal contributionsfrom local populations. Activities by the dairy representthe first large-scale, locally financed initiative by a largelocal organization in Gujarat. Along with activities by thedairy, greater recognition of the widespread problems iscoming from the national government, and major projectson groundwater management are proposed.
D. Kumar, S. Chopde and A. Prakash
BOX 14:Responses to Groundwater Depletion in Gujarat

48
A D D R E S S I N G C O N S T R A I N T S I N C O M P L E X S Y S T E M S
point for social attention is illustrated by thecomments of Indrajit Gupta, the former InteriorMinister of India, following the recent nuclear tests.He stated then that: “The nuclear tests are a greatachievement for India, no doubt, but we can’t evensupply ordinary drinking water and electricalpower to the people of this country”.10 On a morelocal level, in some areas political parties arebeginning to focus on water management as acore part of activities to build their support base.11
From large-scale issues – such as the Narmadaor Pancheswar dams12 – to more diffuse problemsassociated with groundwater overdraft, water issuesare now central points for political attention.
Second, in addition to short-term agitation andthe increasing political debate over water issues,longer term movements are beginning to emergein some areas. Many small-scale initiatives thatwere catalysed by NGOs exist in rural regions.Most of these are confined to a few villages andtheir focus and sustainability vary greatly. Box14 on the Gujarat case illustrates the gradualevolution of NGO activities into nascent, potentiallylarge-scale, rural movements. The case study ofthe Swadhyaya movement, also in Gujarat,represents a different type of initiative. There,religious leaders encouraged farmers to rechargegroundwater by diverting storm flows into existingdug wells have catalysed a relatively large-scalemovement. Supplementing water supplies – ratherthan managing available ones – has been a keyfeature of most NGO and other rural movementsto address water resource problems. These supplyside interventions are beginning to besupplemented by demand side managementactivities. For example, sprinkler systems, whichare widely viewed as saving water, are being
adopted on a large-scale in many areas. Most ofthis is occurring on the basis of actions byindividual farmers rather than through initiativesby rural water management organizations. It has,however, been supported through subsidized creditprogrammes run by the government through theNational Bank for Agriculture and RuralDevelopment. Rural NGOs are also beginning topromote demand side management activities,though little progress has been made in mostcases. Overall, there appears to be a very gradualevolution away from initial supply focusedactivities and toward a recognition that demandside management will be essential to addressscarcity in many situations. This evolution isclearly evident in the Gujarat case documented inBox 14. The above said, most activities throughlocal NGOs remain supply focused.
The core point in the above discussion is thatwater issues are becoming a central part of debateswithin civil society at both local and nationallevels. The emergence of these debates coincideswith nascent and often limited initiatives for actualwater management at local levels. One of thelargest challenges facing water management in thefuture will involve the evolution of both the largercivil society debates and the more specific watermanagement initiatives. In the past, many watermanagement debates became polarized between,for example, dam proponents and anti-damactivists or between those in favor of centralizedversus decentralized approaches. Polarization oftenresults in deadlock with little social space foreffective action. If water management needs areto be addressed, enabling environments that avoidpolarization and encourage local initiatives toevolve are essential.
In order toIn order toIn order toIn order toIn order to
address wateraddress wateraddress wateraddress wateraddress water
managementmanagementmanagementmanagementmanagement
needs, enablingneeds, enablingneeds, enablingneeds, enablingneeds, enabling
environmentsenvironmentsenvironmentsenvironmentsenvironments
that reducethat reducethat reducethat reducethat reduce
polarizationpolarizationpolarizationpolarizationpolarization
and encourageand encourageand encourageand encourageand encourage
local initiativeslocal initiativeslocal initiativeslocal initiativeslocal initiatives
are essential.are essential.are essential.are essential.are essential.

49
A D D R E S S I N G C O N S T R A I N T S I N C O M P L E X S Y S T E M S
Ways Forward – What does all this mean forlocal management?
What does this all mean for local watermanagement? This report represents the first
phase of a study, that will systematically examinewater problems in a series of case study regionsand then identify the types of local watermanagement options that could be implementedin order to address them. As planned, the firstphase has involved a broad scoping processintended to collect background information,develop concepts and create the basis for morequantitative and targeted investigations insubsequent phases. The above caveats aside, theresearch has major implications for watermanagement initiatives.
First, local water management is a misnomer.Even if strategies and implementation projects arecarried out by local communities and areessentially “local,” they are most likely to evolveif the higher level structure of civil society issupportive. “Enabling environments” are regionalor national and require support at that level.Similarly, on a physical level, managementapproaches should not be polarized between“local” and centralized strategies. Instead, issuesand appropriate responses should vary in scaleaccording to context and needs. Some of this willinvolve national level action and some local.
Second, the key questions surrounding watermanagement have to do with governance processeswithin civil society and not technical or site specificdetails. Physical problems and potential technicalresponses to them are, in most cases, relativelyclear. How society can implement them effectively
is far less so. Details vary greatly between sitesand regions. Few models are easily generalized atthis level. The larger questions of civil societyprocesses may, however, be more easilygeneralized.
To project collaborators, the way forwards,toward sustainable water management, requiresaction in three areas:
1. Implementation and documentation ofmanagement initiatives, particularly onesinvolving participation by local populations andorganizations as well as the government, to addressspecific water resource constraints;
2. Strengthening the basis for informed debatewithin civil society regarding water managementneeds and options; and
3. Beginning the process of reforming waterrelated institutions and organizations away fromdevelopment and into the types of structuresneeded to support the larger social process ofmanagement.
As emphasized at the beginning of this report,water management issues are governance issuesthat ripple throughout society and must beaddressed at a societal level. That is, perhaps,the single most important theme runningthroughout research by the collaborative groupand, as a result, this report. Each of the arenaslisted above are central to addressing thegovernance nature of water management issues.
Local waterLocal waterLocal waterLocal waterLocal water
management ismanagement ismanagement ismanagement ismanagement is
a misnomera misnomera misnomera misnomera misnomer.....
ManagementManagementManagementManagementManagement
needs vary inneeds vary inneeds vary inneeds vary inneeds vary in
scale andscale andscale andscale andscale and
responsesresponsesresponsesresponsesresponses
should as well.should as well.should as well.should as well.should as well.

50
A D D R E S S I N G C O N S T R A I N T S I N C O M P L E X S Y S T E M S
Implementation andDocumentation
On a practical level, water managementproblems cannot be addressed unlessimplementation activities occur. At present,implementation initiatives are widely scattered andpoorly documented. While many focus on specificwater resource constraints, few are based on anylarger perspective regarding the larger systems intowhich they fit. Furthermore, most emphasizenarrow technical solutions rather than recognizingthat the most important points of leverage maylie within in the surrounding socioeconomiccontext. Strengthening and expandingimplementation activities based on the conceptualelements outlined at the beginning of this reportis essential in order to develop a broad base ofexperience. Without documentation, however, thisexperience cannot be used to inform futureexperiments and the long term process of evolvingeffective management systems. Documentation is,as a result, essential.
Building the Basis forInformed Dialogue
The importance of documentation relates to thenecessity for informed dialogue within civil societybased governance processes. From our perspective,a relatively high degree of social consensusregarding the nature of emerging problems andmanagement options is essential for progress.Water problems touch too many people’s lives intoo many ways for them to be addressed purelythrough technically focused governmental action.Furthermore, too many groups within society havethe capacity to block management initiatives
unless a larger social consensus can be built.Informed dialogue is, as result, essential. The keyword is informed. This requires:
1. Information: In the absence of a broad base ofaccurate information (on the nature of emergingproblems, related social issues, managementoptions, etc.) debates over water problems will bebased on the entrenched position of narrowperspectives. Actions that improve both theinformation quality and information access are,as a result, important points of leverage. Giventhe extremely broad array of water managementproblems and needs, information needs to betargeted on key issues in order to be useful.Furthermore, information is only likely to be usedif it relates to water management needs that arecurrent focal points for public and policy attention.As a result, tightly focused research activities thataddress key issues and are capable of addingdetailed insights will prove more effective thanbroad regional studies.
2. Conceptual Understanding: Information is of littleuse unless it can be interpreted. Conceptualframeworks are essential for this. Furthermore,conceptual frameworks are central for theidentification of gaps in the understanding ofcomplex interlinked social and hydrological systems.Most importantly, however, conceptual frameworksare the underlying structure guiding debates overoptions and needs. Shaping conceptual frameworksshapes the nature and direction of debates withincivil society. This is perhaps the most importantpoint of leverage for organizations seeking to supportthe evolution of effective water managementapproaches. Research to test, strengthen and developconceptual frameworks is, as a result, a key point of
InformedInformedInformedInformedInformed
dialogue isdialogue isdialogue isdialogue isdialogue is
crucial forcrucial forcrucial forcrucial forcrucial for
reaching areaching areaching areaching areaching a
social consensussocial consensussocial consensussocial consensussocial consensus
regardingregardingregardingregardingregarding
emergingemergingemergingemergingemerging
problems andproblems andproblems andproblems andproblems and
appropriateappropriateappropriateappropriateappropriate
responses.responses.responses.responses.responses.

51
A D D R E S S I N G C O N S T R A I N T S I N C O M P L E X S Y S T E M S
Integrated resource planning (IRP) is standardpractice in the electricity industry in the United States
and is beginning to be applied to water resources byorganizations such as the Metropolitan Water District ofSouthern California. A key difference between IRP andearlier, supply-focused, approaches to planning is thatdemand side management is given equal weight to thegeneration of new supplies. An additional key differencebetween IRP and earlier planning approaches is that IRPis intended as an open participatory process leading to areview of final plans by the public or a public agency.
Process differences between IRP and earlierapproaches have been outlined well in a recent paper byJan Beecher of the National Regulatory Research Institute.According to her, traditional processes are characterizedby unilateral decision-making, procedural formality andrigidity, adversarial processes, an emphasis on dueprocess, a fact-finding orientation, narrowly defined
issues, limited participation, short and closed-endedtime frames, high resource requirements, and a highdegree of institutionalization. By contrast, alternativeprocesses are characterized by collective decision-making,less formal and rigid procedures, consensual processes,variable treatment of due process considerations, aproblem-solving orientation, broadly defined issues, wideparticipation, longer time frames, variable resourcerequirements, and a low degree of institutionalization(Beecher and Stanford, 1993).
These alternative processes encourage the formationof plans that can be implemented more easily than manyof those produced through traditional methods. Theygenerate a much broader consensus regarding the issues,the types of actions appropriate to address them, and thereal costs (social as well as economic) associated withdifferent options. Finally, it is important to note that IRP isdesigned as an ongoing, iterative process.
M. Moench
leverage. As with information, conceptualstrengthening is likely to prove most effective if itfocuses on key issues that are central to currentpublic and policy debates.
3. Communication: Information and concepts arefine but will have little impact unless they areaccessible to the broad array of groups central toany broad based dialogue within civil society.Broad-based communication strategies that reachkey audiences, particularly water users, and thestrengthening of organizational structures forinformation dissemination are essential.
4. Forums for debate: Debates within civil societygenerally occur through the media and in political
Broad-basedBroad-basedBroad-basedBroad-basedBroad-based
communicationcommunicationcommunicationcommunicationcommunication
through multiplethrough multiplethrough multiplethrough multiplethrough multiple
forums isforums isforums isforums isforums is
central tocentral tocentral tocentral tocentral to
informedinformedinformedinformedinformed
dialogue.dialogue.dialogue.dialogue.dialogue.
BOX 15:Integrated Resource Planning in the United States – A process example
forums. These forums are often not suitable forfocused debates or conceptual evolution. As aresult, development of more focused forums, suchas a South Asian Water Resource Network, inwhich those with particular interests in water issuescan engage is key to the evolution of knowledgeand dialogue.
5. Processes: Identifying systematic processeswhich, while retaining an adaptive and flexiblenature, also lead relatively rapidly towardmanagement action. We know of no processexamples of this type in South Asia. IntegratedResource Planning processes being developedin the U.S. may, however, provide some guidance.This processes is outlined in Box 15.

52
A D D R E S S I N G C O N S T R A I N T S I N C O M P L E X S Y S T E M S
Institutional Reform
Supporting institutional reform processes,wherever possible, is the final key element we viewas essential. Institutional reforms are likely to bea product of the informed debates within civilsociety discussed above. That said, however,focused attention on this aspect is particularlyimportant. The formal institutional structuresrecognized in both India and Nepal often limitinformation availability and the types ofmanagement approaches considered in debates.Government organizations, for example, oftenhave a high degree of control over waterresource data and limit access to other groups.Similarly, existing water laws limit the array ofmanagement approaches that can be tested inimplementation initiatives.
Overall, particular attention needs to be givento identifying and promoting potential institutionalreforms that could reduce constraints to bothinnovative implementation initiatives and theevolution of informed dialogue within civil society.Three sets of activities could contribute toinstitutional reform processes. These are:
1. Synthesis and evaluation of information ontraditional and other institutions for watermanagement in South Asia. Extensive research
has been undertaken on traditional rightsstructures, water related organizations, formal legalstructures, etc. in South Asia. Little of this has,however, been synthesized in a way that enablesevaluation of the basis it may provide for eitheractual management initiatives or largergovernance processes. Synthesis and evaluationis essential if this base of knowledge is to be acentral feature of institutional reform debates.
2. Harvesting lessons from other regions. Manyparts of the world are going through a similartransition from water resources development tomanagement as that occurring in South Asia. Aspart of this process a wide variety of insights andexperiences have been generated. Harvesting thelessons from this could provide valuable insightsfor organizations in South Asia.
3. Development of concrete reform proposals.In most cases, institutional and water rightsreforms advocated by researchers are very general.The devil is, however, in the details. Activities suchas the development of model water rights laws ormanagement legislation, along with specificproposals regarding how they might beimplemented, could have a much more majorimpact than general discussions by presentingpolicy makers and the public with specificproposals to react to.
Synthesis andSynthesis andSynthesis andSynthesis andSynthesis and
evaluation ofevaluation ofevaluation ofevaluation ofevaluation of
informationinformationinformationinformationinformation
and harvestingand harvestingand harvestingand harvestingand harvesting
lessons fromlessons fromlessons fromlessons fromlessons from
other regionsother regionsother regionsother regionsother regions
would helpwould helpwould helpwould helpwould help
developdevelopdevelopdevelopdevelop
concrete reformconcrete reformconcrete reformconcrete reformconcrete reform
proposals.proposals.proposals.proposals.proposals.

53
A D D R E S S I N G C O N S T R A I N T S I N C O M P L E X S Y S T E M S
1 This is not to say that certain approaches do not have broad applicability within broad categories of problems. Demandside management, for example, is widely needed in response to water scarcity problems in most arid areas. The characteristicsof most demand side management packages will, however, vary greatly depending on local conditions.
2 The wider the array of actors having the capacity and standing to engage in this dialogue, the more representative andbroader it will be.
3 A prime example of this comes from the Ta’iz area of Yemen. There, a limited number of operators owning deep drillingrigs are beginning to open deeper aquifers critical for drinking water supply and irrigation uses. Protection of drinkingwater supplies can be relatively easily achieved through centralized regulation of these drillers. In contrast, increasing theefficiency of irrigation uses in the same area depends heavily on the actions of many thousands of small farmers and wellowners. In this later case, participatory approaches are essential.
4 Maps prepared by the Rajasthan Groundwater Department.
5 Statistics after 1993 are estimates and those after 1997 represent proposals for development prepared by the CGWB (CGWB,1996).
6 The next generation of Indian satellites will have a resolution of 1x1 metres and an ability to collect multispectral data at5x5 metres. Discussions are already ongoing regarding monitoring of crops and water use at the level of individual fieldsusing this technology.
7 Water and agricultural power pricing policies and availability are, for example, one of the most politically sensitive issuesin India. In many states they are the core issue on which governments stand or fall. (Moench, discussions held withgovernment officials as team leader for part of the World Bank-GOI Water Sector Review)
8 Interviews with farmers, Fall 1997.
9 ADB (1997).
10 Quoted in the New York Times, page A3, May 28, 1998.
11 Discussions with local BJP leaders in Rajasthan, February 1998.
12 The Pancheswar Dam is a 315 metre high multi-purpose project proposed to be built in the Mahakali - a border riverbetween Nepal and India. The Mahakali Treaty signed between the two countries on December 1996 sets the stage forimplementation of the project. For discussions on the political nature of the controversy surrounding the treaty, seeGyawali and Dixit (1999).
Notes

54
A D D R E S S I N G C O N S T R A I N T S I N C O M P L E X S Y S T E M S
Bibliography
ADB (1997). Second Water Utilities Data Book, Asian and Pacific Region, (ed) McIntosh C. A. and Y. E. Ceaser AsianDevelopment Bank, Manila.
Agarwal, A. and S. Narain, eds. (1997). Dying Wisdom: Rise, Fall and Potential of India’s Traditional Water HarvestingSystems. New Delhi, Centre for Science and Environment.
Beecher, J. and J. Stanford (1993). Consensus Building for Integrated Resource Planning. Columbus, Ohio, NationalRegulatory Research Institute.
CBIP (1989). Statistics of Minor Irrigation Development. New Delhi, Central Board of Irrigation and Power, Government ofIndia.
CGWB (1991). Special Issue on Ground Water Statistics, Bhu-Jal News. Vol. 6, No. 1, pp. 1-162.
CGWB (1995). Groundwater Resources of India. Faridabad, Central Ground Water Board, Ministry of Water Resources,Government of India.
CGWB (1996). Back Ground Note Prepared by Central Ground Water Board. Colloquium on Strategy for Ground WaterDevelopment, New Delhi, Government of India, Ministry of Water Resources.
Chaterjee, P. (1998). The Largest Mass Migration in South Asian History, Himal. Vol, 11, pp. 12-19.
CSE (1995). The State of India’s Environment: A Citizen’s Report. New Delhi, Centre for Science and Environment,Ambassador Press.
Gyawali, D. and A. Dixit (1999). Mahakali Impasse and Indo-Nepal Water Conflict Economic and Political Weekly, Vol34, No. 9, pp. 553-564.
Jacob, A. (1989). The Existing Legal Regime of Ground Water: Some Observations. Workshop on Efficiency and Equity inGroundwater Use and Management, Anand, Gujarat, Institute of Rural Management.
Laxmi, V. (1997). Environment: Can Neglect No Longer, in K. Parikh.(ed.): India Development Report, 1997. Delhi, OxfordUniversity Press: pp. 95-106.
Moench, M. (1991). Sustainability, Efficiency, and Equity in Ground Water Development: Issues in the Western U.S. andIndia. Oakland, Pacific Institute for Studies in Environment, Development and Security.
Moench M., Turnquist S. and D. Kumar (1994). Proceedings of the Workshop on Water Management: India’s GroundwaterChallenge, VIKSAT/Pacific Institute Collaborative Groundwater Project, Ahmedabad, VIKSAT.
Moench, M. (1994). Approaches to Groundwater Management: To Control or Enable. Economic and Political Weekly(September 24): pp. A135-A146.
Moench, M., ed. (1994a). Selling Water: Conceptual and Policy Debates Over Groundwater Markets in India. Ahmedabad,VIKSAT, Pacific Institute and Natural Heritage Institute.
Moench, M. (1995). Allocating the Common Heritage: Debates over Groundwater Rights in India and the Western U.S.Paper presented at the first Open Meeting of the Human Dimensions of Global Environmental Change Community,Durham, North Carolina, Duke University.
Moench, M. and D. Kumar (1994). Distinctions Between “Efficiency” and “Sustainability: The Role of Energy Prices inGroundwater Management. The Workshop on Economics and Environment, New Delhi, Centre for Science andEnvironment.

55
A D D R E S S I N G C O N S T R A I N T S I N C O M P L E X S Y S T E M S
Morris, B., and A. Lawrence, et al., (1994). The Impact of Urbanisation on Groundwater Quality (Project SummaryReport). Keyworth, British Geological Survey.
Palanasami, K. and R. Balasubramanian (1993). Overexploitation of Groundwater Resources: Experiences from TamilNadu. Workshop on Water Management: India’s Groundwater Challenge, Ahmedabad, VIKSAT.
Phadtare, P. N. (1988). Geohydrology of Gujarat State. Ahmedabad, Central Ground Water Board, West Central Region,Government of India.
Pisharote, P. R. (1992). Rainfall Regime of Kutch District, Gujarat State, India. Workshop on Drought Management,Mandvi, Kutch, Sri Vivekanand Research and Training Institute.
Puri, V. and A. Vermani (1997). Changing Priorities: Increasing Conflicts Between Rural and Urban Water User. ThaltejTekra, Ahmedabad, Unpublished report of the Management Training Segment of Institute of Rural Management submittedto VIKSAT.
Raju, K. C. B. (1992). Ground Water Resources of Kutch District and Necessity for its Proper Management. Mandvi,Gujarat, Sri Vivekanand Research and Training Institute.
Rao, D. S. K. (1995). Groundwater Overexploitation in the Low Rainfall Hard-Rock Areas of Karnataka State. inM.Moench (ed.) Groundwater Availability and Pollution Ahmedabad, VIKSAT and Natural Heritage Institute: pp. 99-122.
Repetto, R. (1994). The “Second India” Revisited: Population, Poverty, and Environmental Stress Over Two Decades.Washington, D.C., World Resources Institute.
Shah, T. (1993). Groundwater Markets and Irrigation Development: Political Economy and Practical Policy. Bombay,Oxford University Press.
Singh, C. (1990). Water Rights in India. New Delhi, Indian Law Institute.
Sinha, B. P. C. and S. K. Sharma (1987). Need for Legal Control of Ground Water Development - Analysis of ExistingLegal Provisions. Bhu-Jal News (April-June): pp. 10-13.
VIKSAT (1993). Proceedings of the Workshop on Water Management: India’s Groundwater Challenge. Workshop on WaterManagement: India’s Groundwater Challenge, Ahmedabad, Gujarat, VIKSAT.
World Bank (1993). Water Resources Management, Washington, D.C., International Bank for Reconstruction andDevelopment.
World Bank and Ministry of Water Resources (1998). India - Water Resources Management Sector Review, GroundwaterRegulation and Management Report. Washington D.C., New Delhi, World Bank, Government of India.
Wittfogel, K. (1957). Oriental Despotism. New Haven, Connecticut, Yale University Press.

C H A P T E R 2
Fractured Institutions andPhysical Interdependence
Challenges to Local Water Managementin the Tinau River Basin, Nepal
Dipak Gyawali and Ajaya Dixit

58
F R A C T U R E D I N S T I T U T I O N S A N D P H Y S I C A L I N T E R D E P E N D E N C E
The Tinau River originates in the Himalayaof central Nepal and debouches onto the Tarai
plains before flowing into India, where it joins theWest Rapti River near Gorakhpur. This river is oneamong the many interactive highland-lowlandregional complexities of the South Asian riversystem called the Himalaya-Ganga.
The major tributaries of the Ganga,Brahamputra and Indus of the Himalaya-Gangaare both a boon and a bane to the people livingin the region who depend on them. TheHimalaya-Ganga is an integrated system facing thestress of change. Within it, the developmentalneeds of the people have to be defined andmanaged in ways that reflect the complex,interlinked and interacting nature of the physical,social and ecological sub-systems that togethercharacterize the region.1
Nepal rests in this interacting highland-lowlandregional complexity. The country is a smallerrepresentation of the larger regional context, whichconsists of the highest mountain chain on thisplanet and diverse ecological zones, together withthe flora and fauna they support. The regionencompasses a rich plurality of social systems,incorporating within them hundreds of ethnicgroups, scores of languages and almost all thereligions of the world. Social and agriculturesystems are also intrinsic parts of this varied hydro-ecological regime.
This wide variability lies at the core of thechallenges in water management facing Nepal. Asthe population grows and its demand for food,
Introducing the Tinau River System
health and other services increases, developmentneeds will confront environmental values andequity concerns related to poverty alleviation.
Even though the region falls under the generalinfluence of the monsoon, the river systemsflowing through the country show distinctcharacteristics depending upon their place oforigin. The Himalayan rivers have sustained dryseason flow from snowmelt, whereas the flow inrivers originating in the Mahabharat ranges aresupplemented by springs and base flow but containlow dry season flow. The Tinau River studied inthis paper falls in the latter category (Figure 1).Rivers that originate in the Churia ranges of thesouth are ephemeral.
Through relatively small, the Tinau basinencompasses distinct geographical regions and thediverse social and cultural systems that theysupport. Both the surface and the groundwaterresources of the basin have been extensivelyexploited, and the contiguous region is beginningto show early signs of stress exacerbated by thein-migration, rapid urbanization andindustrialization, which followed the completionof the Mahendra and Siddhartha highways.
Successful water management strategies arethose that can cope with surprises, whether sprungby nature or by society. They have to be matchedappropriately with the behaviour of the physicalresource as well as with the stress of changebearing on the social milieu and its incentivestructures. The style of management will have tochange when the scale of intervention varies.2 The
Successful watermanagement
strategies arethose that cancope with
surpriseswhether relatedto nature or
society.

59
F R A C T U R E D I N S T I T U T I O N S A N D P H Y S I C A L I N T E R D E P E N D E N C E
������
�����
���������
���������
��������
��� ����
�� ����
���������
������ ������
�����������
������
�����
�����
������
�����
���
�
�
�
�
�
�
�
������
�����
�����
�����������
��� ���
������������������������������������������ �����
����� ���
�������������������
���� ���������
�����������������
����
���� �����
��� ���!�"�#�
��$$"%��� �� �&�'
� (&��
������
��&���)��*�%'�+��"��*,
��� ��-(*'��*.
�'($#���.�*
������
������
���� �
������������� �����
����������
�
�
�
�
�/
0
1
2�3
����������� ������������� ������ � ����� � ��� / ����� ������ 0 �������� ��� 1 �����
2 ����� �����3 �����
���������������
������
��.'4�%.'���� 5�#��$$ �&' ����� 5�#
�*'%&*�'�-*�"��-&$%&
�N
Figure 1 (a):River systems of Nepal and Location of Tinau Basin in the Himalaya-Ganga
Figure 1 (b):Tinau basin and adjoining region

60
F R A C T U R E D I N S T I T U T I O N S A N D P H Y S I C A L I N T E R D E P E N D E N C E
Defining theTinau “basin”
(once it exits thehills) is difficultbecause the
hydrologicboundariesbetween it and
adjacent riversare poorlydefined.
Tinau has seen several responses to watermanagement along its course. Theyinclude particular projects and developmentinitiatives in specific hydro-ecological niches thatrange from community-led irrigation efforts tomunicipal or state ventures supported by foreignaid agencies. As the scale of interventionincreases, the varied management styles that haveevolved independently of each other willperforce have to interact. When they do, aviable management strategy will have to be readyin place so that the system is not overwhelmedby surprises.
This paper examines the Tinau River basin asa physical system and analyses the functionalwater uses within the basin through casestudies. Each case study discusses the physicalsystem itself as well as the institutions at workwithin it; it also summarizes the situation in thebasin in the form of key issues. The paper’sobjectives include the following:
� To explain the physical complexity andvariability of the Tinau River basin.
� To map the extent and nature of functionalwater uses in that basin.
� To analyse along horizontal and verticaltransects the roles and adaptive responsesof water management institutions.
� To identify issues requiring detailedanalysis and further research.
The study uses an ethno-ecological methodof analysis. In a nested case study approach,attempts were made to capture the nature ofvariability and management responses. Fieldworkin the case study region included visits andinteractions with key informants. The aim was to
understand the systemic interrelationship betweenwater use and related institutions, and the pointsthat are facing stress.
In Nepal, the Tinau flows through two districts,Palpa and Rupandehi. The headwaters of the riverlie on the southern slopes of the Mahabharat rangesurrounding the Madi phaant (parcels of irrigatedland on the valley floor) of Palpa districtTributaries contribute to the Tinau from much ofwestern Palpa and include streams such as theKusum, Dobhan, Sisne and Jhumsa kholas. TheTinau then flows through a gorge section of theChuria hills before debouching onto the plains atthe town of Butwal, Rupandehi district.Immediately downstream of Butwal, the river splitsinto two branches, the eastern is called the Tinauand the western is called the Dano.The two branches rejoin at Bangain in Marchawar,from which point the river is called the Danab.After flowing a further five kilometres inNepali territory, the Danab then flows into India,where its name changes to Kuda, acquires ameandering character and joins the West RaptiRiver near Gorakhpur in Uttar Pradesh. TheTinau and the Dano also form the eastern andwestern limits of the river’s inland delta in theNepal Tarai.
An analysis of the available maps shows thatthe total drainage area of the Tinau/Kuda up tothe point where it meets the West Rapti is about3,200 km2, of which about 850 km2 is in India.This area includes the neighbouring streams ofthe Tinau such as the Kothi nadi and the Betinadi, which originate in the Churia hills inNepal east of the Banganga River but meetthe Tinau River in India. The Tinau proper inNepal has a total drainage area of about

61
F R A C T U R E D I N S T I T U T I O N S A N D P H Y S I C A L I N T E R D E P E N D E N C E
INDIA
�� ����������������
����������
�����������������
��������������
����������������
������
������������������� �
�������6� ����� ������������ ���������� �����6
�� ��������������� �������
����
������������ ���
���
���
�-*%��-(*$�&#
�*'%&*�'�-*�"��-(*$�&#
���
������
����4�� �""-5��(�%5%"".
NEPAL
1,194 km2. In the hills, the river drains an area of554 km2, and its drainage in the Tarai of Nepal isabout 640 km2.
The drainage area of the river in the Tarai plainsof both Nepal and India cannot be precisely definedmainly because it overlaps with areas of the RohiniRiver in the east and the Banganga River in the west.All three rivers continuously change their courses andsplit into distributaries that capture one or anotherchannel of neighbouring streams as they move fromthe north to the south. As a result, the available mapsdo not represent the actual alignment of the riversin the Tarai accurately. Additional difficulties indefining basin boundaries are introduced by the factthat the Tarai part of the basin is underlain by acontinuous east-west alluvial formation that alsoreceives flow from ephemeral rivers originating inthe Churia hills.
Unlike larger snow-fed rivers like the Karnali,Gandaki and Kosi emerging from the High Himalayaof Nepal or the smaller flash flood-prone streams thatoriginate in the Churia (Siwalik) hills, rivers such
as the Tinau drain a catchment thatincludes both the Mahabharat (the middle hills)and the Churia ranges. Because their dischargedepends not only on rainfall but also onsustained groundwater and subsurface inflow,these rivers have a more stable flow during thedry season than do the rivers that originate inthe southern Churia ranges. The Tinauresembles West Rapti, Babai, Bagmati, Kamalaand Kankai rivers that drain the middleMahabharat ranges. The Tinau and itstributaries are extensively used for irrigation,hydropower generation and drinking purposesin the two districts. Location of the watermanagement systems studied in this chapter areshown in Figure 2.
Floods are common during the monsoonmonths, when rivers like the Tinau havesharply peaked hydrographs. Dry seasonflow, wherever present, derives fromgroundwater and base flow contribution.Groundwater from the riparian landmass,especially the Churia hills, enters the river
Figure 2:Major water management institutions on the Tinau River in Palpa and Rupandehi districts.
In the Tarai,surface river
channels shiftcontinuously
and are
underlain by theinterconnectedaquifers of the
larger Gangasystem.
�N

62
F R A C T U R E D I N S T I T U T I O N S A N D P H Y S I C A L I N T E R D E P E N D E N C E
Jan Feb Mar Apr May Jun Jul Aug Sep Oct Nov Dec Annual
Tansen 17 32 13 29 74 228 487 256 262 41 3 26 1,470
Mujung 30 14 20 28 84 311 431 277 301 46 7 34 1,583
Taltung 24 23 33 36 99 332 649 426 410 55 11 33 2,132
Butwal 13 15 15 20 93 375 722 489 455 142 5 18 2,326
Bhairahawa 16 9 15 17 56 282 554 334 281 69 9 12 1,651Sources: Department of Hydrology and Meteorology, Department of Soil Conservation and Watershed Management.
channel at sections where the piezometric surfaceintersects the ground profile. After Dobhan, theTinau flows over a geological formation knownas the bhabar. The bhabar zone is a stretch ofdeposits composed of poorly sorted outwash,boulders, cobbles, gravel and sand. It is about 5to 10 kilometres wide and soil conditions alongits entire east-west stretch of the Himalayanpiedmont are poor. This zone forms the transitionbetween the northern end of the Indo-Gangeticplain and the Churia hills. Originally a malarialjungle, the bhabar has emerged as a region ofrapid population and urban-industrial growthsince the 1960s, when Nepal’s East-West Highwaywas constructed along the Churia foothills .
Because of the weak geology and the unstablenature of the Churia hills, landslides in the uppercatchment of Tinau are frequent. During theheavy rains, the river transports high sediment load,which is deposited in its inland delta once the river’sincline, and thus its carrying capacity, decreasesupon reaching the plains. The channels here arein dynamic flux and the rivers change their coursesperiodically. The channels of the river between itsmain branches shift regularly, depending on thenature and intensity of the monsoon as well as thestate of riverbed aggradation. The slope of the Tinaufrom the hills up to the Nepal-India border is shownin Figure 3.
The Tinau basinexperiences
high rainfallvariability,intense
cloudbursts,both low andhigh flow
extremes and(during highflows) large
amounts ofsedimenttransport.
TABLE 1:Average Annual Rainfall at Tansen, Mujung, Taltung, Butwal and Bhairahawa (mm)
Figure 3:Elevation transect of the Tinau River.
The climate of the Tinau basin ranges fromhot tropical in the southern Tarai to warmtemperate in the hills of Tansen. In the Tarai,summer temperatures reach 400 C while in theupper hills it remains cool. The main source ofprecipitation in the basin is the summer monsoon.Bulk of the annual rainfall occurs in the fourmonths between June and September. Theremaining rainfall is received from the westerliesduring the winter months of December/Januaryand pre-monsoon months. The monsoon,although generally regular, occasionally fails ordelivers only scattered cloudbursts. Annual rainfallin the five stations at Tansen, Mujung, Taltung,Butwal and Bhairahawa, from the northern hillsto the southern plains respectively, is shown inTable 1. The average annual rainfall in the hillysection of the basin is about 1,500 mm and in
PATALE19431900
1700
1500
1300
1100
900
700
500
300
100900
0 10 20 30 40 50 60 70 80 90 100 110 120 130 140
DISTANCE
ELE
VA
TIO
N
DO
VA
NB
UT
WA
L
MLI
P
NE
PA
L-IN
DIA
BO
RD
ER
150 160

63
F R A C T U R E D I N S T I T U T I O N S A N D P H Y S I C A L I N T E R D E P E N D E N C E
Station Jan Feb Mar Apr May Jun Jul Aug Sep Oct Nov Dec Mean
Dobhan 4.39 3.03 2.45 2.16 2.35 15.1 58.3 107.86 46.7 24.7 7.61 4.94 23.5
Bangain 7 6 4 3 7 45 192 108 188 101 13 9 56.9Source: (Delft, 1988)
Cloudbursts arecommon in the
Churia rangeand often cause
bishyari,
massive floodsfrom landslides
that temporarily
dam rivers andthen break.
the southern parts, it is about 1600 mm. In theChuria range the annual average rainfall is about2,000 mm and occurs in high intensity bursts,often with three to four hundred mm in 24 hours.In the Tinau basin, the maximum recorded 24hour rainfall was 320 mm in 1981 at Taltung inthe hills.
Surface Water
The Tinau is gauged at Dobhan before the riverflows into Butwal. Although records arediscontinuous, available data indicate a meanannual flow of 24 m3/s. Minimum flow in April isclose to 1 m3/s. Judging from the records between1964-1969, the average monsoon flow of the Tinauin August can be as high as 108 m3/s and theinstantaneous flood peak is close to 2,200 m3/s.Run-off from the Tinau is influenced by rainfallpatterns in the upper catchment and unassesseddiversion for irrigation by upstream users. Suchuse is widespread and intense, but the volume isdifficult to determine because almost all theupstream irrigation practices are informaland unregistered.
Downstream along the river between Dobhanand Bangain, where the Tinau and the Dano joinnear Marchawar, groundwater appears tocontribute to stream flows. Rivers originating inthe Churia range that flow into the Dano also addto the discharge. This is indicated by the differencein flows measured at these two locations (Table
2).3 The highly seasonal nature of precipitationand absence of snowmelt sources mean that riverhydrology in the dry season is mainly a functionof its base flow contributions.
In contrast to the dry season calm, the highintensity monsoon rainfall in the upper reaches,particularly in the Churia range, often triggerslandslides, and the resulting floods lead to bankcutting.3 Landslides frequently dam river and,when these temporary dams are overtopped, theybreach and cause devastating floods. Thisphenomenon, which is preceded by fish kill inthe dried out downstream reaches, is known inNepali as bishyari, and is regular enough for itto find a place in the language. In the past, theTinau has experienced several such bishyariswhich, along with other flash floods, have causedlarge-scale loss of human and animal lives as wellas massive destruction of property. The Dauretoleneighbourhood of Butwal, for example, wascompletely and suddenly washed away by abishyari in the 1970s. During bishyaris, theamount of boulders and mud gouged out andswept from the river banks in the hills to thelowlands is phenomenal.
Aside from bishyaris, normal sedimenttransport in the Tinau is limited to the monsoonwhen brief intense rainfall results in rapid rise ofthe water level at gorge. These events also lead tohigh sediment transport, which has seriousimplications for irrigation technology, since flash
TABLE 2:Mean Monthly Flow of Tinau at Dobhan and Bangain (m3/s)

64
F R A C T U R E D I N S T I T U T I O N S A N D P H Y S I C A L I N T E R D E P E N D E N C E
High sedimentlevels lower
performance of:� irrigation
intakes,
� pump blades,� flushing tanks,
and
� canals.
floods wash away supposedly “permanent” (thatis, cement concrete) diversion weirs and bed loadschoke intakes and canals. As the river enters theTarai, the bed load and large sediment particlesare deposited on the debris fan of the inland delta,while the suspended load flows downstream. Dataon sediment load out of Dobhan in the Tinau isnot available. However, at Bangain, differentestimates of sediment load carried by the riverexist. Hedeselskabet (1987) estimates sediment loadconsisting of sand to be only 30,000 tons/year,though the same report mentions annual load of400,000 to 500,000 tons.4 Finer sediment load isestimated to be 20 to 40 times higher than sandload. Analyses of samples show that the suspendedsediment consists mainly of silt and clay, 80 percent of which have a particle size less than 0.06mm. Delft (1988) has estimated the bed materialload to be 3,550,000 tons/year. It is not clear howthese quantities were computed.
In any case, the sediment quantity and contentin the river has affected the performance of theintake, sediment flushing system and the pumpsof the Marchawar Lift Irrigation System. Thetraditional farmer-managed irrigation systems, onthe other hand, seem to have adapted to thisnatural regimen and are less affected by it becausethey rely on temporary brushwood weirs.
Groundwater
Unconsolidated sediments forming highlypermeable aquifers, some of which are artesian,underlie the Tarai in Rupandehi district. Rechargeresults from a combination of rainfall and inflowfrom rivers as they leave the Churia hills. Otherrivers that flow from the mountains similarly
contribute to the recharge of the aquifers of theTarai that can be simple or artesian. Thepreviously noted bhabar formation lies south ofthe Churia foothills and north of the alluvium ofthe Indo-Gangetic plain. Rupandehi district hasan area of 1,140 km2, of which the bhabar zoneunderlies at least 100 km2 (Tillson, 1985),although hydro-geologists from the Bhairahawa-Lumbini Groundwater Development Project(BLGWP) estimate the area of bhabar to be twiceas much.5 Groundwater aquifers generally beginat the end of the bhabar region. For the purposeof studying groundwater systems, Uprety (1989)used the 150 metre contour line as the physicalend of the Tarai’s quaternary sediments. If oneconsiders only the Tinau basin, the bhabarportion is not very large. In the bhabar region,the depth of the water table is low, andpermeabilities are reported as 50 to 200 metresper day. In the remaining areas of the Tarai, thereare wide variations in soil characteristics as wellas in the extent of irrigation, both of which affectrecharge. The groundwater aquifers of the districtas well as the northern Ganga plains are probablyrecharged from the bhabar though the actualamount of recharge remains unassessed.
What is the groundwater potential of the Taraiin the Tinau basin? It is not possible to definethis separately because the basin is underlain bymultiple aquifers covering the three Tarai districtsof the Lumbini zone: Nawalparasi in the east,Rupandehi in the middle and Kapilvastu in thewest. The entire Tarai region between the Daunnehills near the Gandaki River to the Deokhuri hillseast of the West Rapti is made up of interlinkedgroundwater aquifers. Though many studies havebeen undertaken on groundwater, the estimates are

65
F R A C T U R E D I N S T I T U T I O N S A N D P H Y S I C A L I N T E R D E P E N D E N C E
Estimates ofgroundwater
availability andrecharge vary
greatly and are
highlydependent on
the assumptions
made.
preliminary and vary depending upon theunderlying assumptions, which also vary.
Tillson (1985) estimates percolation rateswithin a range from 156 to 504 mm/yeardepending on the type of soil. The averagepercolation rate is 330 mm/year, which isequivalent to about 17% of the rainfall. Applyingthis rate to the whole of Rupandehi district – area1,140 km2 – yields a recharge to the shallowaquifer of about 375 MCM (million cubic metres).If, conservatively, only 10% of the annual rainfallof 1,900 mm (the average of the northernand southern parts) is assumed to recharge theshallow aquifer, the volume over the same areawould be about 216 MCM/year. Anotherpreliminary estimate of the potential recharge wasmade by assuming the effective porosity of sandand gravel aquifers as 15% and considering thatthe average rise of the water table during themonsoon period is 2.3 metres over the area of1,140 km2. If one third of this formation werecomposed of permeable deposits, the net rechargewould be about 130 MCM,6 not includingthe amount rejected due to the saturationof the soil in the rainy season and the evaporationloss due to the high water table duringthe summer period. If pumping lowers the watertable, there will be more recharge than thisestimate suggests.
The estimated figure of 130 MCM is, therefore,a conservative estimate – a minimum undernatural conditions – and should include allrecharge from the bhabar zone. A final estimatecan be made based on the percentage of directrainfall recharge in the bhabar region. With anannual rainfall of about 2,200 mm along the
foothills, and about 100 km2 of bhabar formation,this estimate suggests a recharge volume of closeto 96 MCM. In sum, different estimates suggestrecharge amounts between 96 MCM and 375 MCMas the lower and upper limits.
In the Tarai region of Rupandehi district,groundwater dynamics are affected not just byrainfall but also by percolation to deep aquifersfrom shallow groundwater and by southward flowinto aquifers in Uttar Pradesh in India. In theupper, mountainous regions of the Tinau,groundwater availability is generally low, althoughit has been contemplated as an option forsupplying drinking water to Tansen Municipality.7
Groundwater contributions to the base flow of theTinau River in the hills are unknown. By the timethe Tinau and the Dano reach the Indian border,however, groundwater contributions to base floware clearly substantial. If this were not the case,large diversions for irrigation in the Tarai betweenButwal and Marchawar and then within Indiashould deplete all surface flow. The relatively highflow – much higher at Uska Bazaar nearGorakhpur in India than at Marchawar in Nepal,even with the influx of other tributaries – canresult only from subsurface inflow from thebhabar and the Tarai zones.
More details on ground and surface waterinteraction are available in the BLGWP area.Tubewells constructed for this project draw waterfrom aquifers 50 to 300 m below ground surface.In about two-thirds of the BLGWP area, wellsconstructed in Stage 1 are artesian. Theseconditions are not expected to persist; a long-termdecline of up to 15 metres is foreseen. This impliesthat water will percolate from the unconfined to

66
F R A C T U R E D I N S T I T U T I O N S A N D P H Y S I C A L I N T E R D E P E N D E N C E
Ground andsurface water
interaction issignificant, butscientific
documentationabout therelationship is
lacking.
the confined aquifer, thereby affecting the rivers’discharges. Hedeselskabet (1982) estimates thatdischarge in the rivers will be reduced by 20-30%as BLGWP’s first phase pumping reaches fullcapacity. The study estimates demand at 56 MCM/year, suggesting a reduction of 0.3 to 0.5 m3/s instream flows. UNCDF (1987), mentions the totalannual water demand to be 90 MCM/yearsuggesting reductions of 0.55 to 0.85 m3/s withthe rule proposed by Hedeselskabet.8 This analysis,however, only refers to Stage 1 of the project. Asstage 3 of the BLGWP is coming to an end, usingsimilar assumption reduction in stream flowshould be higher. The possibility of reduction instream flow is also supported by Delft (1988), whomention the interlinkages between surface flow,shallow and deep aquifers.
Downward leakage from a shallow aquifer intoa deep aquifer is both possible and probable sincemaps indicate that shallow aquifer heads are abovethose of deep aquifers in most of the district,particularly the northern part above the BLGWParea (Uprety, 1989). The interlinkages imply thatground and surface water interaction is significantwithin the Tarai region. Scientific documentation,however, is lacking. A proper foundation for theHedeselskabet reduction rule, for example, is notmentioned in the available reports. Similarly,observations of groundwater contribution tostreams are based on general flow observationsrather than on detailed monitoring ormeasurement. Also the actual amount of waterused for irrigation is a function of crop type,efficiency, operating hours of pump, area underirrigation and cost of pumping. These are variableand unassessed. As a result, the relative balancebetween groundwater contribution to surface flowand vice versa are far from clear.
In addition to interaction with surface streams,flow within and between aquifers is significant. Ingeneral, the geologic structure of aquifers and highlevels of recharge along the base of the Churiaresult in groundwater flow towards the south. Forgeneral purposes, the international boundary canbe used to estimate the outflow of shallowgroundwater across the border into the northernUttar Pradesh Tarai.9 The length of outflow sectionin the district is about 40 km. The transmissivityin Vishnupura, which is located in the uppersection, is 160 m2/day. This figure decreases to 100m2/day in the middle of the district and againincreases to 200 m2/day towards the west. Thegradient in the eastern half of the outflow sectionis about 0.0016 and in the western half about0.0008. Thus, the volume of water outflowing intothe aquifer in Uttar Pradesh may be estimated tobe about 7.8 MCM/year. The outflow volume is asmall portion of the annual recharge potentialestimated earlier. The difference between rechargeand the subsurface outflow into Uttar Pradesh isdissipated primarily through evaporation andpartially through inflow into the Tinau, the Danoand other rivers along with withdrawals from dugand shallow wells (a minor component at present).Theoretically this may be salvaged by carefullyplanned exploitation, provided that the lithologyof shallow aquifers (thickness and transmissivity)permits large-scale groundwater development.
Institutions and Development
The Tinau basin includes the municipal areasof Tansen in the hills, Bhairahawa in the Taraiplains and Butwal at the Churia piedmont.Bhairahawa is the international gateway toLumbini, the birthplace of Buddha, which is about23 km to the west. There are also villages along

67
F R A C T U R E D I N S T I T U T I O N S A N D P H Y S I C A L I N T E R D E P E N D E N C E
The ideology ofthe welfare state
has givenpoliticians a
source of
popularlegitimacy in the
form of
irrigationdevelopment.
the north-south highway such as Manigrambetween Bhairahawa and Butwal in the Tarai, aswell as villages in the upstream reaches that areevolving into small townships with dynamiccommercial or small-scale industrial activities.These townships and villages have activelytaken advantage of possibilities offered bydevelopment of new infrastructure (roads,telecommunications, and education) to furthertheir economic activities. In addition, access to newinfrastructure has strengthened some of thetraditional institutions, particularly those relatedto irrigation and agriculture marketing, in theregion (INFRAS and IDA, 1993). There is, forexample, a major bi-weekly haat bazaar at Butwal,where farmers from the hills and the plains meetto buy and sell their farm produce and other wares.This bazaar is the largest and most dynamic inNepal, and since the completion of the east-west(Mechi-Mahakali) and north-south (Sunauli/India-Pokhara) highways, it has linked with otherhaat bazaars in Bhairahawa and elsewhere.
The Tinau region has a long history ofsettlement based on the use of water resources foragriculture. In the Tarai reaches of the basin,settlements date back to the time of GautamBuddha and the reign of the Sakyas who inhabitedthis region. Indeed, in the life of Buddha, a storyis told of how Lord Buddha mediated a waterdispute between two warring clans over the usesof the Rohini, which flows east of is birthplace atLumbini. During the last century, the region wascovered by dense, sparsely populated, jungle. Thelandscape started to change with the constructionof Chhattis and Sorha Mauja farmer-managedirrigation systems, which were, for example, builtabout 150 years ago. They function as some ofthe largest farmer- managed surface irrigation
systems in Nepal. Similarly, on the west bank ofthe Tinau, opposite the Chhattis and Sorha mauja,lies the Chaar Tapaha irrigation system, which isalso managed by the beneficiary farmers.
Although major irrigation systems wereconstructed over a century ago, rapid changesbegan in the post-1950 period after the overthrowof the century-long feudal Rana dynasty in 1951.At this time the government began a programmeof tapping new surface and groundwater sourcesfor irrigation to meet the national objective ofincreasing food production. Before this, except fora few initiatives towards the end of Rana rulebetween the two World Wars, the Nepali State hadnot considered providing irrigation as one of itsprime functions. Instead, the state had focused onclassifying agricultural land into four categoriesdepending upon its productivity and levying taxaccordingly.10 With democracy came the ideologyof the welfare state and Nepal’s new rulers neededa source of popular legitimacy. As a result, asuccession of governments has pushed forirrigation development initiatives in this region.
One of the first state-led irrigation initiativesoccurred in the early 1960s. An irrigation barragewith a network of canals was built on the Tinau,close to Butwal, and downstream of the intake ofthe existing Chhattis and Sorha Mauja irrigationsystems. Built under the minor irrigationdevelopment programme assisted by theGovernment of India in the aftermath of the KosiAgreement of 1954, the objective of the project wasto irrigate a command area in Marchawar locatedabout 30 kilometres to the southwest.11 The barrageand earthen main canal of the project were sitedin the unstable inland deltaic portion of the TinauRiver (Figure 4a). As a result, a large section of

68
F R A C T U R E D I N S T I T U T I O N S A N D P H Y S I C A L I N T E R D E P E N D E N C E
��������
��������
���������
�����
��������
������������ �
���� �����
�����
���������������
������������� ������
����4�����������6
�����
������ ����������6
��*�"�*'%&*�'�-*�"��-(*$�&#��������� 5�#
�-�(!��*�
�"$���*�"��%'5-&7
���� �
�� ���������
�� ������
���
�����6�
�������
������
�����
�����
���
�-�(!��*�
�-�� ��&� �5�����
Temporarydams for
irrigation havetraditionallybeen erected
through massivecommunitymobilization.
the canal was washed away by floods in the yearafter commissioning of the barrage and the rivershifted course, bypassing the structure. The newirrigation scheme never functioned and the canalsystem in the lower region remains all butabandoned except for its use for drainagecollection and as ponds. In addition, a section ofthis canal system was repaired and used for theUNCDF-funded Marchawar Lift Irrigation Scheme,described in Case Study VIII.
Aside from design oversights, the new irrigationsystem completely ignored a pre-existing,functioning farmer-managed irrigation system inthe Marchawar region. This traditional system wassimilar to the Sorha-Chhattis Mauja irrigationsystems, but was possibly older. Local lore describesthe tharu chaudhary (headman) who initiatedthis system. It consisted of fairly large temporaryweirs at Gurbania and Harewa on the Tinau afew kilometres south of Bhairahawa-LumbiniHighway and an extensive network of distributioncanals extending almost all the way to the Indianborder (Figure 4b). This dam was washed away
every monsoon (as it was meant to be when waterwas not required) and was rebuilt at the start ofthe dry season with massive communitymobilization. Every year after the monsoon floods,the entire labour force of the villages of the regionwould be mobilized to construct a bamboo/brushwood and mud weir that raised the waterlevel in the river to the intake of the main canal.The weir fed the distribution system, which wascleaned and maintained every year by this systemof community labour.12 The alignment of thecanals matched long-established property rights tothe riparian lands and natural drainage patterns.
The Butwal barrage superimposed an externallyconceived and geometrically designed network ofcanals on a functioning system. The newalignment of the canal from Butwal physicallydisrupted the traditional Gurbania canal network.It also disrupted the functioning watermanagement institution and its interrelationshipwith landholding and drainage patterns. Farmingplots and their ownership patterns in Nepal, bothin the hills and in the Tarai, form a crazy-quilt,
�N
Figure 4a:Indian Schemelayout from 1960sthat carved up theGurbania network.
Figure 4b:Layout of traditional Gurbania canalnetwork.

69
F R A C T U R E D I N S T I T U T I O N S A N D P H Y S I C A L I N T E R D E P E N D E N C E
�*'%&*�'�-*�"��-(*$�&#������*�"��%'5-&7������
�����
��������������
�������
and are not geometrically neat. They aredetermined not only by the land contour but alsoby history and the prevalent social dynamics aswell as by the ensuing water rights andrequirements. Imposing a geometric framework onsuch a living system is tantamount to carving upthe existing social order. In any case, the newsystem became non-functional when the riverchanged course and bypassed the barrage. TheIndian and Nepali governments made no effort torestore the system for the next two decades. Thechange that would have been wrought by theimposed geometric framework could not besustained, and the farmers went back to healinga wounded system with their traditional watermanagement means and the temporary weirs.13
In the late 1970s the Tinau River system sawfour major government-led water initiatives thatwere characterized by both institutional amnesiaregarding previous formal efforts at watermanagement and continued obliviousness toregarding informal farmer-managed systems. Onewas the Bhairahawa Lumbini Ground WaterProject (BLGWP) with credit assistance from theWorld Bank. A second was the Marchawar LiftIrrigation Project (MLIP), which was implementedwith help from the UNCDF to irrigate the lowerpart of the area that would have been served bythe abortive Butwal barrage scheme. Like thisearlier intervention, the conceptualization of the
Variegated Dynamics
As described above, even though the Tinaucovers a relatively small area, the basin
contains great physical and social variability. Theregion encompasses diverse ecological regions ofthe Mahabharat, the Churia and the Tarai (Figure5) as well as a range of ethnicities and
languages.14 Water in the basin is available asspring sources, river and stream flow as well asgroundwater in artesian and non-artesianconditions, and is managed by different institutionsthat reflect the variegated social systems. Thespatial distribution of rainfall is also not uniform;
Figure 4c:Network of Marchawar Lift Irrigation System(developed on top of Indian scheme and traditional network)
MLIP also ignored the existing irrigationarrangement and imposed a geometric design overa traditional arrangement (Figure 4c). A thirdinitiative, though not related to irrigationdevelopment per se, was the 15-year TinauWatershed Management Project implemented withSwiss and German assistance in the aftermath ofa devastating bishyari on the Tinau. This wasanother isolated initiative that, although intendedas integrated rural development in Palpa (the hillyportion of the Tinau River basin), did not take abroad perspective of the basin. Another initiativewas the World Bank funded development ofButwal’s drinking water supply. These projectcentric and engineering-led interventions occurredin a fragmented manner both conceptuallyand practically.
Developmentinterventions in
the Tinau basinhave occurred
in a
conceptuallyand practically
fragmented
manner.
�N
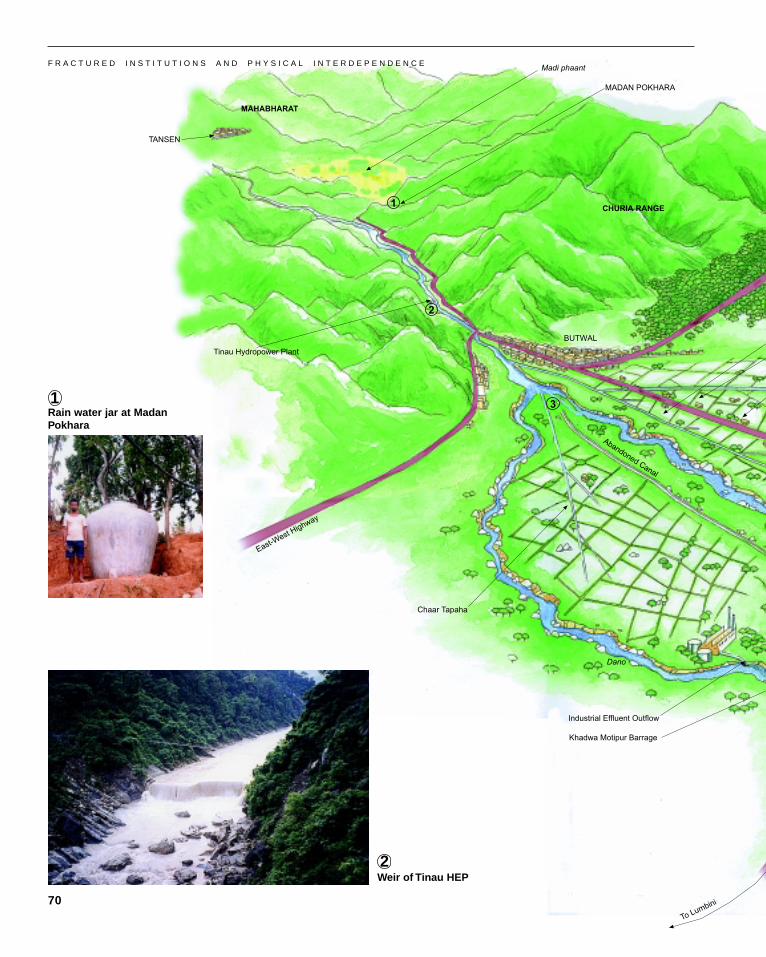
�-�(!�
�*�
���� ����!
����������
������
��*�(��#$&-8-5%&��"�*'
���������� �
�����
�$5���-'�8(&���&&��%
� ��&���8� �
"�#������� �
���*$-*%$ ��*�"
$
%
&
���"
��.'4�
%.'���
5�#
�*$(.'&��"��::"(%*'��(':"-5
F R A C T U R E D I N S T I T U T I O N S A N D P H Y S I C A L I N T E R D E P E N D E N C E
70
Rain water jar at MadanPokhara
Weir of Tinau HEP
1
2

�����
�-��-&�7 8(&
������
�����
���.
�-��
�&�'8(
&
�����
�����(!8��-(.%
���� �����
����!
� �''�.���(9�
�-& ����(9�
��*��&�!
���.���.
���.
���.
'
�� �����
�������;-&%.'
���.
���.
��$$ �&' ����� 5�#
����
����
����
���.
Figure 5:Schematic view of the Tinau River and water uses dependent on it.
F R A C T U R E D I N S T I T U T I O N S A N D P H Y S I C A L I N T E R D E P E N D E N C E
71
MLIS canal
Abandoned Butwal barrage3
4

72
F R A C T U R E D I N S T I T U T I O N S A N D P H Y S I C A L I N T E R D E P E N D E N C E
the southern part of the Tinau basin close to theIndian border as well as its northern part on theMahabharat range receives less rainfall than areassuch as Butwal in the Churia foothills in themiddle. Residents of the Marchawar region, forexample, mention that rainfall there is less thannormal every four to five years, resulting indrought-like conditions.
Given the limited nature of water-related datathat has been collected, this diversity of institutionsand management styles places a severe limitationon making precise estimates of resourceavailability. The first problem is the variability ofphysical conditions that have not been analysedin adequate detail or in a broad enoughperspective to permit confident generalization.Another limitation is the assessment of the surfaceflow itself. Because water applications by differentusers are not monitored simultaneously, it isdifficult to make a composite assessment of howmuch water is withdrawn from surface and
groundwater sources and how much is available.The third difficulty lies in the varied social systemsand, consequently, water management styles withinthe basin. Ignoring them has led to the promotionand implementation of narrowly focused projectsthat have not looked at interlinkages betweenvarious upstream and downstream systems.
The present preliminary analysis attempts tounderstand the dynamism of water resourcemanagement within the Tinau, the socialdimensions affecting its use, and the interlinkagesat work. The following sections describe variouscases of water use starting from the headwaters ofthe river in Palpa and moving downstream alongthe plains into India. Many of the water usesystems discussed below are located along roadsor planned roads that have been built as part ofpast projects. In this sense, the study has arestricted scope which excludes from field-levelanalysis many roadless portions of the Taraigenerally and the Tinau particularly.
CASE STUDIES:
The small regionof the Tinau
basinencompassesdiverse social,
ecological,physical andcultural systems
which result ina complexmosaic of water
managementsystems.
Case Study I:Tansen Municipality
Background
Tansen Municipality is located on theuppermost hills of the Tinau catchment on thesouthern slopes of the Sri Nagar hills between1,200 m and 1,500 m above sea level. It is thedistrict capital of Palpa and is 30 km north ofButwal. Its growth, like that of other settlements,along the north-south Gandaki growth axis, wasspurred by the completion of the SiddharthaHighway.15 Palpa Valley, where Tansen is situated,
was a principality before the unification of Nepal.Although the Gorkhalis captured Kathmandu in1769, Palpa was captured later, in 1806. Duringthe years of Rana rule that started in 1846, andended in 1951, Palpa maintained a somewhatindependent status by virtue of the fact that it wasgoverned by “rebel” Ranas who were exiled to itsgovernorship. The result of this status was thatPalpa undertook many independent developmentinitiatives such as Tansen’s piped drinking watersystem, built in the late 1930, which survives tothis day.16 In addition, Tansen has traditionaldhungey dharas (stone water spouts), locatedgenerally in the lower sections of the town, which

73
F R A C T U R E D I N S T I T U T I O N S A N D P H Y S I C A L I N T E R D E P E N D E N C E
tap into hillside springs. Due to poor maintenance,they too have fallen into disrepair and some haveceased to function. Some households have usedhigh density polyethylene (HDP) pipes to connectsome of the functioning ones to taps.
Following the completion of the SiddharthaHighway, which linked Sunauli at the Indo-Nepalborder with Pokhara in the middle hills, thepopulation of Tansen began to increase. In theearly 1970s, Tansen had a population of about6,000; it had doubled by 1979.17 By 1998, thepopulation had reached close to 15,000. Theexpansion of administrative services aroundTansen also contributed to the growth. Drinkingwater systems were expanded as the town’spopulation grew. The oldest is a gravity systemfrom Banja, a spring water source, which wascompleted in the 1930s. In 1972, the Holangdisource within Palpa Valley was tapped and pumpedto the reservoir at Basantapur. With assistance fromthe Japanese government, the construction of theBhulke system was started in 1976 and completeda year later. After this, the Japanese governmentprepared an elaborate Water Supply and SewerageSystem Master Plan for the town, which envisionedpumping water from the Kali Gandaki River atRanighat. The proposal, however, was not takenup owing, among other factors, to the excessivepumping head of more than 1,000 metres.18
System Description
At present, Tansen gets its water supply fromthree sources. The first is the old gravity system,which stores water in a 170 m3 capacity reservoirat Muldhara, and then supplies it to a section ofthe town via private connections and public stand-posts. This system was rehabilitated in 1995. In
addition to this there are two pump systems. Oneis the Holangdi system within the Palpa valley,which pumps from a sump well of 75 m3 locatedat Holangdi spring and which supplies a 130 m3
reservoir. The other system pumps water from theBhulke spring on the Kali Gandaki watershed tothe northwest of Tansen. It also taps the Krungakhola, where water is first brought by gravity tothe second pumping stage and lifted further. Wateris pumped in four stages to a reservoir at Batasedanda (hill) and then distributed by gravity. Inthe dry season, a total of 1,500 m3 per day arepumped from the two sources; 1,000 m3 fromBhulke and another 500 m3 from Krunga khola.
The transmission line is about 8 km long andthe water is lifted 550 metres. The four pumps witha capacity of 21 m3/hour need a total powercapacity of 300 kW. A 33 kV transmission line hasbeen extended to Bhulke. There are presently 1,200private connections, few of which are metered, andabout 100 public stand posts that supply drinkingwater to the town’s population. Because the systemsoperate at lower than the design capacity – Bhulke(65%) and Holangdi (80%) – only 800 to 1000m3 water is supplied in a day giving a daily percapita supply that ranges from about 53 to 67 litres(lpcd). With 42% leakage in the system, the percapita availability is reduced. Since the watersupply system also caters to floating population,this figure could be even lower.
Institutions at Work
In Tansen Municipality, the Department ofWater Supply and Sewerage (DWSS) of HMG’sMinistry of Housing and Physical Planning(MHPP) employes pump operators andadministrative staff to operate and maintain the
As early as 1930Tansen had a
piped drinkingwater system.

74
F R A C T U R E D I N S T I T U T I O N S A N D P H Y S I C A L I N T E R D E P E N D E N C E
� Increased water needs in Tansen could lead toincreased disputes among current users as newclaims on the existing sources will stress thearrangement of water allocation beyond capacity.
� The generation of solid and liquid waste islikely to increase. Because a completed sewersystem does not exist and waste treatment receivesvery little focus, water quality may decline in thehead region of the Tinau. Although pollution hasnot yet reached a critical threshold to affect waterquality, the possibility is high because the Tinauwith a low flow in the dry season does not havesufficient flushing capacity to assimilate the waste.This is likely to lower quality of river water forexisting downstream users and impinge upon theirwater rights.
� Water conservation, proper pricing, and use ofrainwater harvesting are important optionsto explore. The rainwater harvesting option, forexample, could reduce the volume of water to bepumped and thereby minimize the cost incurred.
Case Study II:Madi Phaant
Background
Madi phaant is the main valley of Palpadistrict and forms the upper catchmentof the Tinau River. The watershed area of theTinau in Palpa covers much of the western halfof the district south of Tansen, and the Madiphaant valley occupies about a sixth of thiscatchment. It lies at an approximate elevation of1,000 m and is surrounded by the Mahabharathills to the north and the Churia (Siwalik) hillsto the south.
system. Although water is pumped continuously,it is supplied to different sectors of the town on arotational basis. Each sector receives a supply foronly about two and a half hours. While the annualoperating cost of the system is 7-8 million rupees,only 6-7 hundred thousands rupees is raised asrevenue.19 Due to the high cost of operation andlow revenue, the supply system is deteriorating.Pump efficiency has gone down considerably andsections of the supply line have been damaged andleak profusely. In addition, the electricity supplyis erratic and often subject to load-shedding. As aresult, only half of the total daily water productioncapacity is available for use in the dry season. Thisis causing hardship to the people of Tansen, whocite water supply shortage as the main constraintto the growth and development of their town.Clearly, the operation of Tansen’s drinking watersupply system is not sustainable economicallywithout government subsidy.
Key Issues
� In 1991 almost a third of the total electricityconsumed in Tansen Municipality was utilized inpumping water. Dependent as it is on a supply ofcheap and reliable electricity, Tansen needs torevise its tariff and redesign its power and waterdistribution systems.
� A higher tariff can serve as a disincentive forincreased consumption. In Tansen appropriatemechanisms have to be evolved to recoup fromthe users the cost of supplying water.
� The supply level is low due to the inefficiencyof the pumps. Arrangements need to bemade to maintain and repair them on aregular basis.
In Tansen, thedrinking water
supply system isinefficientlyoperated and
economicallyunsustainable.

75
F R A C T U R E D I N S T I T U T I O N S A N D P H Y S I C A L I N T E R D E P E N D E N C E
The Madi phaant has a warm temperateclimate with an annual average temperature of160C (maximum 31.60C and minimum 3.40C). Thesurrounding hills, depending on the altitude, canhave a cool temperate climate. The valley receivesan average of about 1,800 mm of rainfallannually, which is the primary water source.Water availability in Palpa, as elsewhere in thehills of Nepal, is a function of the terrain. Valleybottoms have irrigated agricultural land and oftengroundwater fed stream flows. Hill settlements relyon springs for drinking water and agriculture inthe upper slopes is rain-fed.
The Madi Valley has an approximate area of97 km2 and falls within the administrativejurisdiction of 71 wards of twelve VillageDevelopment Committees (VDCs, which used to becalled Village Panchayats prior to 1990) and onemunicipality.20 The valley bottom consists ofirrigated agricultural land called khet, and thesurrounding hillslopes host forests (now mostlycommunity managed), non-irrigated land calledbaris, as well as hamlet settlements and TansenMunicipality. There are 31 community-managedforests with a total area of 1,011 ha in the hillsaround the valley catering to the partial needs of3,145 households for fuelwood and fodder.
Land ownership in the Madi phaant is mixed.While slightly over half the land is reported to beraikar (private), significant portions are ownedby guthis (religious trusts) of important templesand monasteries as well as by absentee shopownersto whom the land has accrued as defaultedcollateral. The paddy fields of Madi phaant havetraditionally been bequeathed to the guthis thatmanage the temples of Palpa. These systemsexisted even before the Shah dynasty began 1769.21
Old people indicate that this is system has existedas long as they can remember and was spokenabout by their grandfathers as well. The more well-known of these trusts are Ridi guthi, Majhadeviguthi, Kalankidevi guthi, Mandabya guthi,Ranighat guthi, Narayan guthi andRanaujjeshwari Bhagwati guthi. Guthi landconstitutes most of the land in the Khauruwaphaant of the Tinau, while in Saranja phaantthere is a preponderance of raikar (private) land.Both these phaants are situated within the largerMadi plain. The example of RanaujjeshwariBhagwati guthi is instructive. The temple in itspresent form was established in 1834 by GeneralUjir Singh Thapa, nephew of Nepal’s first primeminister Bhim Sen Thapa, who became thegovernor of Palpa in 1815. Ujir Singh establisheda guthi for the temple with the royal seal of KingRajendra Bikram Shah.
Because the management of guthi lands iscentrally controlled in Nepal by HMG’s GuthiSansthan and since there are limitations onbuying, selling or changing land use as well asrent payments, the tenants of guthi land areeffectively its owners, but with a built-in degree ofuncertainty. The terms of payment to religiousguthis are traditional and can be as low asproviding one he-goat a year for sacrifice or smallquantities of flour during festivals. Despite the lowrent, tenants have not found it easy to change fromcultivating the traditional rice to more lucrativevegetables. Even within the Madi phaant, somevillages, such as Madan Pokhara (Case Study III),have managed to take advantage of the marketbetter than others.
A major development intervention in the upperTinau area was the Swiss-German project initially
Guthis (religioustrusts) legally
own much of theland in the
Madi phaant
but it is farmedby long termtenants who
are, in someways, the
defacto owners.

76
F R A C T U R E D I N S T I T U T I O N S A N D P H Y S I C A L I N T E R D E P E N D E N C E
Irrigation parcels in Madi phaant use brushwood dam diversion
called the Tinau Watershed Project (TWP) andlater renamed the Palpa Development Program(PDP). The TWP was initiated after the massiveflood in the Tinau in 1978 that washed awayDauretole, a section of Butwal. At that time, it wasassumed that deforestation in the upper catchmentwas the culprit, and watershed management(afforestation through tree planting, gullystabilization etc.) was perceived as the solution.In fact, the cause of the 1978 flood was notdeforestation, but a massive cloudburst thatdeposited 125 mm of rain in a few hours,triggering a landslide in the black shale sectionof the gorge, which blocked the Tinau. When theovertopping of this natural “dam” took place, thesurge washed away Dauretole and causedunprecedented damage.22
By 1988, it was clear that the issue of watershedmanagement was not merely about planting treesand building check dams on gullies. The earlierunderstanding that deforestation and flooding werepart of a vicious circle gradually proved untrue asnew evidence showed the more complex nature oflinkages and associated uncertainties. (Thompson
et al., 1986). It became clearer that propermanagement was tied to fundamental issues ofdevelopment, such as building local infrastructure,enhancing social capital, as well as promotinglocal governance through decentralization andempowerment. Thus TWP became PDP and placedspecial emphasis on building “green roads”,23
community forestry and rural poverty alleviationthrough community mobilization. Other aspectsof PDP’s programme that ran through governmentagencies, such as livestock development andwatershed management, were deemedunsatisfactory and dropped. The PDP wasphased out in 1995 because the issue ofdecentralization and local governance couldnot be adequately resolved. Donor supportis now confined to promoting local initiatives ingrassroots development efforts and income-generating activities.
System Description
The main stem of the Tinau River originatesfrom Kaphaldanda in ward numbers 2 and 8 ofDevinagar VDC at the eastern end of the valley. Itis joined by several smaller streams such as Pasti,Loreng, Dangsing, Gophadi, Pugdi, Muntung,Chidipani, Sapangdi, Boksadi, Rakse, Majhor,Chuhar and Khawa. While tributaries originatingfrom the Mahabharat range to the north are morestable, those from the southern Churia ranges areephemeral and bring a lot of sediment flow withthe monsoon. These streams carry water onlyduring the rainy season and in the monthsimmediately after it. All these streams, includingthe ephemeral ones, have take-off points forirrigation in the form of temporary brushwoodweirs. These are washed away every monsoon andhave to be rebuilt. They are managed individually
Watershedmanagement
has to do withafforestationand check dams
as much as withlivelihood issuesconcerned with
irrigatedagriculture.

77
F R A C T U R E D I N S T I T U T I O N S A N D P H Y S I C A L I N T E R D E P E N D E N C E
or collectively with varying sets of rules andregulations. The various irrigation systems in theMadi phaant valley can be grouped into severalsub-systems. Representative irrigation systems aredescribed below:
a. Upper Tinau: From the spring at Kaphaldandato Chhedua kulo (channel), individual farmerson both sides of the stream tap water. Because ofthe temporary nature of the diversions and theirinherent heavy seepage downstream, disputesbetween users are not severe. If more efficientextractive technologies or more water intensivecrops are introduced, the potential for conflicts inthe future exists.
b. Middle Tinau: This sub-system consists ofseveral irrigation take-off points such asChheduwa, Tal, Bokhap, Bagnase and Khauruwa(also called Pachase) kulo. A representativeexample is Chhedua kulo, which is located inRupse VDC, ward number 3. This ancienttraditional system has a canal length of 4 km,which irrigates about 42 ha of khet cultivatedmainly for rice and secondarily for wheat, cornand some vegetables. The Chhedua kuloupabhokta samitee (Users’ Committee) managesit. This samitee has representation from 135households. A nine-member elected executivecommittee governs it on a daily basis. The generalbody meets twice a year and its decisions areminuted. Failure to live up to the decisions madecan result in a fine of Rs 50 and failure to paythis results in not having access to water forirrigating rice seedlings. The current difficultiesrelate to shortage of water during the dryseason and the ill feelings that arise amongdifferent users as a result. There is a feelingthat more frequent meetings need to be held to
handle this problem and also to develop a separatefund for the samitee.
c. Boksadi-Khahare system of Rupse: This systemconsists of takeoff points for smaller irrigationsystems such as Bandhuwa, Gaurawari, Chimli,Rajiya, Khasaha and Bhangtar kulo. Arepresentative example is Bandhuwa kulo.
Bandhuwa (Mohane) kulo is also located inRupse VDC, ward number 3. This takeoffirrigates approximately 22 ha. It does not haveeven an informal users’ group although it serves54 households. Problems in this system relateto sharing watering turns, but have been resolvedby village interaction (sarsallaha) with themediation of a VDC representative. Users agree onthe need for a formal user’ group and aseparate maintenance fund. However, the difficultyis in finding non-controversial people to elect tothe executive.
d. Majhare system: The Sinchase khola and theDamahar khola join to form this tributary of theTinau. It contains many small irrigation systemsof which the Majhare kulo is an example.
The source of the Majhare kulo is Teen Kanyamul (source) located below Aryabhanjyang inPokharathok VDC. Even though the kulocommands an area of 75 ha with 35 to 45households benefiting from it, there is noorganized committee with rules of use. At the timeof irrigation for rice or wheat, whoever comes firstuses the stream flow. If someone else has come atthe same time, then there is an agreement on thespot about how to share the water. When rainfallis low much of the land remains fallow, whichoccurred in 1959 and later in 1998.
Between the late1980s and the
mid 1990s,watershed
management
concepts in theTinau evolvedfrom a simple
focus onreforestation to
larger questions
of communitydevelopment
and
governance.
78
F R A C T U R E D I N S T I T U T I O N S A N D P H Y S I C A L I N T E R D E P E N D E N C E
e. Middle Tinau Saranja phaant: This is a largestretch of land in the middle of the valley, whichuses water from spring sources and seepage flowthat arises from water use in upstream reaches.Examples are the Sodhan Katuwa mul (source)and Garniya kulo.
Sodhan Katuwa mul is a spring source at thesouthwest end of the Madi valley which provides acontinuous flow of about two inches. There areadditional sources of smaller magnitude, whichare used to irrigate about 16 ha of Saranja phaantin the middle of the Madi valley. (This couldpossibly be seepage from the Old Tinau channel.)The main use of this water is for growing riceseedlings in the dry season immediately precedingthe monsoon. People informally contribute labour,wooden and bamboo stakes as well as brushwoodfor canal construction. Those who do notcontribute do not get water to cultivate theseedlings for transplantation. While there isenough water for growing seedlings, there is notenough for the main rice crop or wheat. In casethe monsoon fails, there are informal discussionsabout how to share this water on an hourly basis.Old established practices play a major part inthis. Most of the land belongs to the Shree Narayantemple guthi in Tansen Municipality, and thefarmers are all tenants who belong to VDCssuch as Madan Pokhara, Kaseni, Pokharathok andChirtungdhara. They have filed a petition in thecourt to have the land declared raikar (private)in their names, but the court has not decided theissue yet. They do not feel that a formal users’committee can be set up without these issuesbeing resolved.
Garniya kulo is an old irrigation system, whichincludes 160 households and irrigates about 20
ha of land in Chidipani VDC. The Palpa DistrictDevelopment Committee (DDC) has given a grantof Rs 25,000, which is used for weir construction.There is no users’ group formed yet, but there isa thirteen member construction committee. Themanagement system is traditional consultations(sarsallah), which occur at the end of Jestha, andthose who do not contribute labour are excludedfrom access to water for irrigation.
f. Tansen Khola sub-system: This system uses thewaters of the Tansen and Gawang kholas, whichare tributaries of the Tinau, to provide irrigationto the Chalise, Nayare, Simbutari, Churkek, Belarias well as the Hadaha canals.
Hadaha Khauruwa kulo is a traditional systemirrigating 9 ha of land. It was modernized in1977 by adding a cement weir and canals toexpand irrigation to 25 ha. This system is locatedin Madan Pokhara VDC and has a formal structurewith a user group executive committee of nine,which meets every month. The general users’group meets at least once, often twice a year inJanuary and May. The decisions of meetings,which relate to such issues as fines and thedistribution of hours of water use, are minuted.Labour contributions for canal maintenance areobligatory and enforced through fines of Rs 50per day, which are deposited in the users’ groupaccount. Those who do not pay their finesare barred from using the water.
At present, the users’ group has a fund of Rs28,000, which has come from the Rs 50 per usercollected and from a Rs 21,000 grant from thePalpa DDC . Floods damaged the cement intakebuilt recently and the expansion of the system toirrigate 25 ha requires 3.2 million rupees. These
Many effectivewater
managementinstitutions inthe Tinau are
mainly informalin nature.

79
F R A C T U R E D I N S T I T U T I O N S A N D P H Y S I C A L I N T E R D E P E N D E N C E
funds are not yet available from any source. As aresult, some of those who participated in thecommittee to obtain access to water are restless.
Miyaltar kulo, an old system that irrigates 132ropanis of khet land, created a formal water users’association in 1997. This association has 32participating households with an eleven memberexecutive committee. The primary crops aremonsoon and spring rice with wheat as asecondary crop. The users’ committee has a fundof Rs 6,600 from users and Rs 15,000 from thePalpa District Development Committee . A majorachievement mentioned by users is theimprovement of the intake weir. The meetings ofthe group are held as necessary and the minutesare maintained in written form. The fine systemis Rs 50 per day for labour not provided, and auser who does not pay his fine is precluded fromuse of water from the kulo. For the winter crop,the meeting sets the rotation regime. A problemthat has cropped up is encroachment on canals,which has led to conflicts.
Institutions at Work
Irrigation in Madi phaant is managedprimarily by informal traditional systems withvarying degrees of organization. At one extreme,there is individual “right of prior capture” suchas for the small spring sources of the Tinau nearits headwaters at Kaphaldanda in the east. At theother extreme are organized systems like Chheduakulo and Hadaha Khauruwa kulo. Theseorganized systems have elected executivecommittees, regular minuted meetings, requiredlabour contributions and enforcement of fines aspart of their regular operation. In between theseextremes are other systems that have informal
arrangements, are not registered or are onlybeginning to consider formal registration.
Two factors are playing major but contradictoryroles in regional water use: traditional land tenurewherein much of the land is owned by absenteelandlords, and modern transportation, especiallythe Siddhartha Highway connecting Pokhara inthe hills with Bhairahawa near the Indian borderin the plains. The former has dampenedagricultural innovation while the latter haspromoted it. Farmers are responding to thesepressures by changing crops from grain tovegetables and litigating or agitating to have bettertenancy rights.
Key Issues� The new land tenancy act, passed by Parliamentbut contested in the Supreme Court, allows 50%of the land of a landowner to revert to the tenant.In the context of guthi land and the litigation thatis underway, the new act is likely to expand landtenure conflicts in the Madi phaant.
� Vegetable production is more lucrative thanconventional rice farming. However, such a shiftmay require a more intensive use of water. Thismay lead to change in existing arrangements ofallocating water and to increased disputes,especially among the less organized groups.
� Some farmer groups are more skillful in usingthe state machinery to get access to funds for weirand canal construction, which means theestablishment of permanent intakes and linedcanals as opposed to brushwood weirs and unlinedcanals. Such technical innovations lead to betterwater efficiency for upstream users at the expenseof downstream ones.
Decisions onwater shares
are often madeon the basis of
informal
discussions.

80
F R A C T U R E D I N S T I T U T I O N S A N D P H Y S I C A L I N T E R D E P E N D E N C E
Education givesa sense of self
confidence andegalitarianismthat foster
creativity, whichallows farmersto take
advantage ofthe market.
� Because there is little coordination betweendifferent users’ groups and because theadministrative structure of Madi phaant isfractured, the conventional approach of setting upvalley-wide authority for regulation and mediationmay not be feasible. An egalitarian forum orstructure that allows different groups to interactwith each other may function more effectively.
Case Study III:Madan Pokhara Sprinklers andWater Harvesters
Background
Madan Pokhara is one of the six VDCssurrounding Madi phaant. It has a population of6,858 in 1,082 households. This village has madea name for itself as a major supplier of vegetablesto the haat bazaar of Butwal. Land in MadanPokhara is mostly raikar or privately owned, andthe farmers here have the distinction of being thefirst in Nepal to experiment with sprinklers forirrigation. They began to experiment withvegetables in the late 1970s with the introductionof PVC pipes allowing them to tap the varioussprings and streams (which flow into the Tinau)for vegetable production. Completion of theSunauli-Pokhara Highway, which passes by thevillage in 1969, was an important infrastructuralasset, as it allowed the villagers to take advantageof the market in Butwal.
While infrastructure is important, it can remaina passive resource. Unusually for a village inNepal, Madan Pokhara has two high schools, theearlier one having been established in the 1950s.The level of education is very high, giving thepeople an enhanced sense of self-confidence and
egalitarianism. The village has an average literacyrate of 72%. During the People’s Movement of1990, which restored multiparty democracy toNepal, of the 36 people arrested in Palpa at thestart of the agitation, 21 were from MadanPokhara. This confidence, as well as the broadoutlook that education and consciousness-raisingprovide, has encouraged experimentation with newtechnologies (such as sprinklers and improvedvarieties of vegetables) and enabled them to takeadvantage of the market. In addition to vegetables,another important export of Madan Pokhara isschoolmasters to the various schools of the westernregion of Nepal.
System Description
Starting in 1979, progressive farmers beganto use PVC pipes to tap streams like Juke dhara,Gamdi, Rip mul, and Andheri. Becauseof their ability to take advantage of state supportstructures, the farmers were able to mobilizeresources from the Agriculture Development Bankand other sources to tap water throughout the VDCfor vegetable and fruit cultivation. They alsobegan to use sprinklers of which there arecurrently 95 in Madan Pokhara. Because of thegood returns from vegetable farming, many whohad government jobs in the past have left theservice to take up full-time farming. The shift incropping pattern from grain to fruits andvegetables is now almost complete.
Between 1962 and 1972 there was widespreaddeforestation in the VDC area. Many smallspring sources dried up. Since 1974 villagepeople have made special efforts to conserveforests, and the condition of springs has improved.Restoration has allowed 78% of the village to have

81
F R A C T U R E D I N S T I T U T I O N S A N D P H Y S I C A L I N T E R D E P E N D E N C E
drinking water piped to their homes. For peopleliving in altitudes above 3,800 feet, there are nospring sources from which water can be broughtby gravity flow. In searching for ways to meet thischallenge, they learned that rainwater harvestingwas practiced in the Philippines and that asimilar system had been installed in the village ofBaungha in Gulmi district north of Palpa. Pressurewas put on the Palpa DDC, which in turnmobilized Finnish aid for developing drinkingwater supply. A rainwater harvesting pilotproject for 20 households was completed by theVDC in 1994. Its success has prompted the currentconstruction of 311 rainwater harvesting systemsfor households as well as 3 larger systems forprimary schools. An experiment is also underwayto collect and store rainwater in plastic-lined pondsfor vegetable irrigation. Electric pumps were alsotried for irrigation, but given the high tariff ofelectricity in Nepal, they were found to beuneconomical: currently only one farmer useselectricity to lift water from one of the Tinau’stributaries for vegetable production.
Institutions at Work
While individual farmers have tapped thespring sources for sprinkler irrigation to makeprofit in the market, high levels of education andawareness have also enabled farmers of thevillage to participate fully in the activities of theVDC and its decisions. Local government istherefore used a social capital resource to obtainaccess to state-supported credit, foreign aid andother resources. The dominant institution thatguides prosperity in Madan Pokhara is, however,the market and awareness building education hasplayed a key role in the farmers’ ability to takeadvantage of it.
Key Issues
As production processes become integrated with(or dependent on) the market, one may seeegalitarianism erode in the face of individualinterests. During times of low rainfall, individualinterests may override common concerns,requiring more formal arrangements through theVDC for water diversion and use.
Case Study IV:Drinking Water in ButwalMunicipality
Background
Butwal used to serve as a trading outpostbetween the Palpa hills and the plains. It issituated on the outwash fan at the foothills of theChuria range. After the eradication of malaria andthe completion of the Siddhartha Highway thatconnects Bhairahawa at the Indo-Nepal borderwith Pokhara, the town began to see migrationfrom different parts of the kingdom. This trendhas continued with the completion of the East-West Highway through Butwal making it animportant national junction. The town is alsoemerging as an important industrial developmentcentre. A 1993 study outlines the dramatic growthof Butwal caused by the following factors (INFRASand IDA, 1993):
� With the construction of the road toPokhara and the extension of the East-WestHighway to the west, Butwal became acentrally located town, which was traditionallyan interface between the Tarai and the hills.Road completion provided new opportunitiesfor the wholesale trade of manufactured
Eradication ofmalaria and
opening ofhighways has
led to rapid
growth ofButwal.

82
F R A C T U R E D I N S T I T U T I O N S A N D P H Y S I C A L I N T E R D E P E N D E N C E
Butwalmunicipality
uses bothsurface andgroundwater
sources fordrinking watersupply.
Indian goods, ghee, ginger, herbs and otherhill products.
� Early metal workshops established by UnitedMission to Nepal (UMN)24 initiated the growth ofa metal manufacturing sector catering totransportation demands. Butwal’s growth is alsobased on industrial development; some industrialparks have been established recently.
� Many migrants from Palpa were businessmen.Entrepreneurial and innovative families with linksin Tansen manage a considerable part of thebusiness in Butwal.
� Proximity to India has also stimulated Butwal’sdevelopment as well. Nearby Bhairahawa is animportant customs entry point.
The census of 1991 estimated the municipality’spopulation to be about 44,000 living in nine wards.In that year the municipality’s jurisdiction wasexpanded to six neighbouring village panchayatswith whose inclusion the population reached about50,000 in 1991. According to a 1996 study, thepopulation of the municipality was 60,000(Hyundai and Cemat, 1996)25 and is projected toreach 91,111 in 2000. Because it is a highwayjunction, there is a large floating population.
System Description
The town Batuali, the old part of Butwalwas supplied with drinking water from asystem that was built when Pratap Sumsher wasgovernor of Palpa. Subsequently, supplies wereaugmented by pumping water from the TinauRiver. This system was built with the assistancefrom the Indian Cooperation Mission (ICM)
in 1965 when the highway to Pokhara wasbeing constructed.
The 1973 drinking water sector study by Binnieand Partners briefly discussed existing water supplysystem, sewerage and drainage facilities of Butwal.Under the World Bank funded Second Water SupplyProject, the feasibility study for water supply,sewerage, and drainage was completed for thetown. The report identified both surface andgroundwater sources including expansion of thesystem built by the ICM to meet rising needs ofthe town. Subsequently Proctor and Redfern(1984) reviewed the feasibility report. Hyundai andCemat (1996) recommended rehabilitation of thedrinking water system of Butwal to provide 24uninterrupted service to about 68,333 people in2000, which is 75% of the population projected toreach by that year.
The municipality of Butwal has both formaland informal water supply facilities. The supplysystem uses three sources: groundwater, the TinauRiver and the Chidia khola. This is a smallsurface source located in the Churia hills about1.5 km north of Butwal. Water is supplied bygravity to a 900 m3 capacity reservoir situated atRamphedi in the norther part of the town. Fromthe Tinau River water is pumped into the samereservoir. Water of the Tinau is tapped using asump well 8 m deep with three radial collectors.The intake is located downstream of the tailraceof the Tinau Hydropower Plant. From the sumpwell water is pumped by four 17.5 HP capacitypumps. A fifth pump is provided as a standby unit.
To tap groundwater sources, two deep tubewellshave been installed at Milan Chowk on the leftbank of the Tinau. Water is pumped from the wells

83
F R A C T U R E D I N S T I T U T I O N S A N D P H Y S I C A L I N T E R D E P E N D E N C E
Safe disposal ofmunicipal
wastes is anemerging
challenge in
Butwal.
into a 500 m3 capacity reservoir. The deeptubewells were developed during the Third WaterSupply Project funded by the World Bank in 1981.
The two deep wells each of 75 and 85 HPdesigned capacity yield water at the rate of 47litres/second. The radial collectors were damagedin the 1993 floods, but have not been repaired.Water of the river is allowed to flow directly intothe sump well. Due to poor operation andmaintenance the capacity of both the deeptubewells has been lowered. Breakdown of thepumps on the bank of the Tinau River is frequent.
From the two reservoirs, water is distributed bygravity. The larger reservoir serves the northernsection of the town while the smaller one servesthe southern section. Those without access tomunicipality services use independent andinformal sources like springs and the Tinau. Thesupply system covers an area of about 3 km2 anddelivers water through a 45 kilometre ofdistribution network consisting of galvanized iron(GI) and high density polyethylene (HDP) pipes.Water is supplied on an intermittent basis to 41,000consumers via 3,546 private connections. Onehundred and thirty are public stand posts. Thesystem currently supplies water to thirteen wardsof the municipality, local industries, hotels andlodges, schools and other pubic offices.
The average per capita use in privateconnection is about 110 lpcd, while in the publicstand post, the figure goes down to 72 lpcd. Inmany localities of the municipality, supply of wateris poor and inadequate. Hyundai and Cemat(1996) estimates the leakage to be 45%, whileofficials of the Butwal Branch of the NWSCmention much lower percentage. Though the
quality of groundwater is within acceptable limits,quality of the Tinau water deteriorates during themonsoon months when the turbidity in the riverincreases due to sedimentation. A pressure filterof 3 MLD capacity was expected to improve quality,but does not function due to lack of fitting. Thequality of supplied water is poor as only bleachingpower is added as disinfectant.
In the wet season the three supply systemproduce 8 to 8.5 MLD water, while dry seasonproduction is substantially reduced. The flowof both the Tinau and the Chidia kholadrastically diminish in the months of April-May,which are the dry seasons. Also its installedcapacity has been substantially reduced due toageing of the transmission pipes. Theoretically,by continuously operating deep tubewell possiblegap between supply and demand can be narrowed.Declining specific yield of wells as well as highcost of pumping, however, emerge asmajor constraints.
The expansion and growth of Butwal from arural staging centre into an industrial townshiphas brought to fore new forms of environmentalchallenges. There is no sewer system in themunicipality. Use of septic tank and pit latrine iscommon. Instances of waterlogging and ponding,however, is low because the landscape slopessouthward and the geological formation hashigh permeability.
A number of outfalls that collect drainage waterfrom roadside and core section of the town flowinto the Tinau close to water supply and irrigationintakes. Solid wastes are dumped on the banks ofthe Tinau. The other sources of pollution in Butwalare wastes from industries. Though responsibilities

84
F R A C T U R E D I N S T I T U T I O N S A N D P H Y S I C A L I N T E R D E P E N D E N C E
of treatment and safe disposal of wastes remainwith the industrial estates, in many cases untreatedwastes are discharged into surface drains. Thelayout of the drinking water systems and localitiescritical from environment perspectives are shownin Figure 6.
Institutions at work
The operation and management of the watersupply system for Butwal is under the Nepal WaterSupply Corporation (NWSC) a parastatalorganization under the Ministry of Housing andPhysical Planning (MHPP), which is responsiblefor water supply in eleven urban centres of Nepal,including Greater Kathmandu. According to ADB(1997) the annual operation and maintenancecost of NWSC is Rs 232 million, and its annualbilling is Rs 269 million. Hyundai and Cemat(1996) estimate the average monthly billing atButwal to be Rs 418 thousand, giving an annualbilling of Rs 5.1 million. The MHPP exercisescontrol over operation and development of NWSC.Sixty one per cent of its investment come fromexternal sources. IDA’s credit to the NWSC amountsto 17%. Butwal Municipality cross subsidizesoperation and management of Kathmandu’s watersupply system. The Ministry of Finance, whichunderwrites the IDA loans to the Nepal WaterSupply Corporation, meets the charge of publicstand-posts. NWSC employs 2,078 staff.
Executives of the municipality seem to be awareof many of the challenges that the town faces. Themunicipality declared 1998 to be the “DrinkingWater Year”, and as part of this commemorationit provided a loan of Rs 5 million payable in 5years to the Butwal office of NWSC to be used forimproving the water supply in the municipality.
Key Issues
� Water quality is a significant concern. Becausepumping is done directly from the Tinau, andthere are no sedimentation tanks, the turbidity ofthe supplied water is high. The present watertreatment facility is insufficient.
� Dependence on electricity for the operation ofthe systems is another issue. Immediately after thepump system came into operation, the supply ofelectricity was inadequate. In March of 1998, therewas a major disruption in the supply because ofdamage to one of the plants of the system – TrisuliHydropower Plant – and led to power cuts in thenational power grid. This seriously affectedButwal’s water supply
� The rising population and growing industriesin Butwal have increased the demand for water.There are plans to augment the supply byrehabilitating, installing more wells and bydeveloping additional surface water sources. Thisexpansion may increase the demand on the Tinau,and could result in competition with existingirrigation users and give rise to new disputes.
� Waste disposal is a major issue, but has receivedlittle attention. Butwal has no sewerage system orwaste treatment facility. Its surface drainage systemis inadequate and discharges waste and storm flowsinto lower regions of the town. A proposal todischarge storm water into the Tinau led to adispute with farmers of the Sorha/Chhattis Majuairrigation systems. Subsequently an agreement wasreached to release the wastes downstream of theintake point of the irrigation canal. Thefundamental nature of the emerging dispute hasnot been resolved by this agreement.
Key issues inButwal
Municipalityinclude:� water quality,
� populationand industrialgrowth,
� waste disposaland
� potential for
groundwatercontamination.
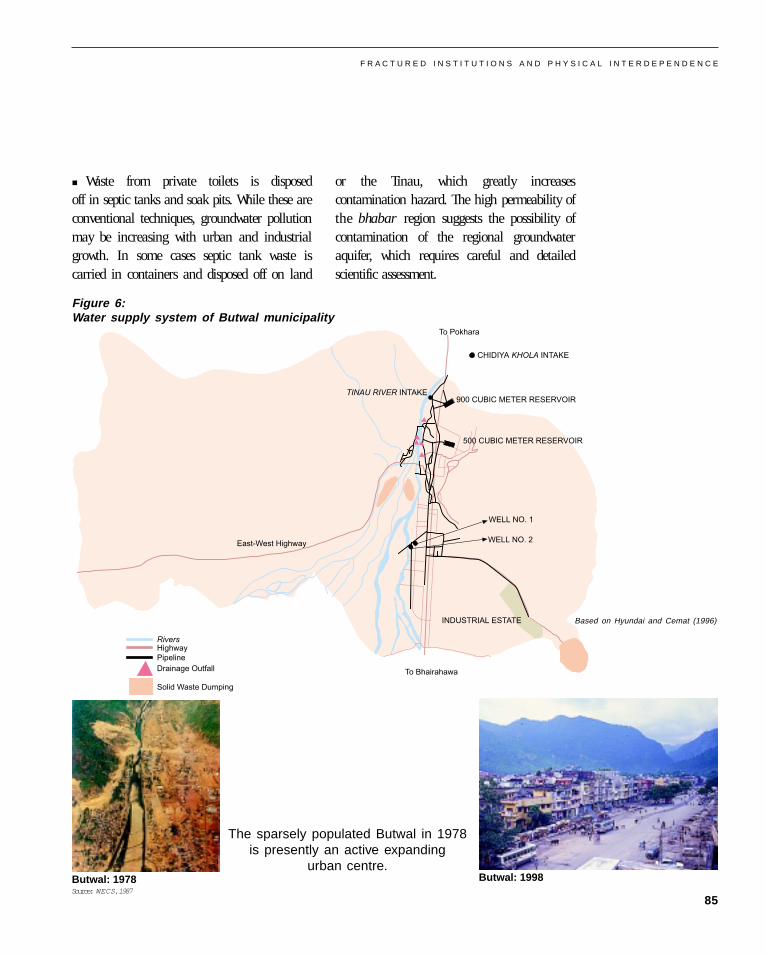
85
F R A C T U R E D I N S T I T U T I O N S A N D P H Y S I C A L I N T E R D E P E N D E N C E
�����6������������
���������������233����������� � ��� <��
�33����������� � ��� <��
�����=��
�����=��
������ ���������
�-��-7 �&�
��.'4�%.'���� 5�#
�-�� ��&� �5�
��������� 5�#��8%"�*%�&��*��%��(':�""
�-"�$���.'%��(!8�*�
Butwal: 1978 Butwal: 1998
The sparsely populated Butwal in 1978is presently an active expanding
urban centre.
Source: WECS, 1987
� Waste from private toilets is disposedoff in septic tanks and soak pits. While these areconventional techniques, groundwater pollutionmay be increasing with urban and industrialgrowth. In some cases septic tank waste iscarried in containers and disposed off on land
or the Tinau, which greatly increasescontamination hazard. The high permeability ofthe bhabar region suggests the possibility ofcontamination of the regional groundwateraquifer, which requires careful and detailedscientific assessment.
Based on Hyundai and Cemat (1996)
Figure 6:Water supply system of Butwal municipality

86
F R A C T U R E D I N S T I T U T I O N S A N D P H Y S I C A L I N T E R D E P E N D E N C E
Butwal PowerCompany (BPC)
presented analternativemodel of
hydropowerdevelopment forNepal.
Case Study V:Hydropower
Background
Water from the Tinau is diverted through a weirand a tunnel to a run-of-the-river, undergroundhydroelectric plant at the gorge section of the riverjust upstream of Butwal. Because the plant makesuse of the gradient of the riverbed to generatepower and does not store or consume water, it haslittle impact on users downstream in the bhabar(Butwal, Sorha Mauja, Chaar Tapaha) or Taraizones (Marchawar, Manigram). Although thisplant that was established in the mid-1960’s doesnot store or consume water, it is important forseveral reasons.
Electricity from the Tinau Hydroelectric Planthas played a significant role in theindustrialization of Butwal. While private powercompanies have been formed in Nepal in the pastand some of them did manage to generate andsell some electricity, their institutional presenceremained ephemeral: indeed, none of them existany longer. However, the institutional set-up ofButwal Power Company (BPC), which designedand built the Tinau Plant, did endure andpresented itself as an alternative model ofhydropower development in Nepal even though itfell under government control later.
After Tinau, the company went on to build the5 MW Andhikhola Hydroelectric Plant in Syangjadistrict just north of Palpa, and the 12 MWJhimruk Hydropower Project in Pyuthan district tothe west. Currently BPC is engaged in a partnershipwith Norwegian investors in building the 60 MWKhimti Hydroelectric Project in Ramechhap district
east of Kathmandu, which is the largest privateinvestment in Nepal. The company is negotiatingwith the government to build the Melamchi watersupply system for Kathmandu, which will entailthe construction of a 27 km tunnel with a 15 MWpower plant in the city’s outskirts. Factories andengineering works established by the BPC groupof companies are engaged in rehabilitating theelectromechanical parts of the Marchawar LiftIrrigation Scheme in the downstream reaches ofthe Tinau (Case study VIII).
System Description
The Tinau Hydroelectric Project diverts the riverthrough a tunnel and is capable of generating1,000 kW for supply to Butwal at 3 kV. A 65 metrelong dam across the river raises the waterlevel by 8 metres, allowing flow to be divertedthrough a trash rack to the desilting chamber,where manually operated radial valves have beeninstalled for intake control and sediment flushing.From there, water is taken to the powerhousethrough a 1,266 metre long brick and cementmortar lined horizontal tunnel of 2.1 m diameter.The tunnel has a centreline that is at least 25metres inside the outer surface of the hill. Theunderground powerhouse consists of threegenerating sets imported from Norway, whichhave their own governors, penstock valves, oilcircuit breakers and instrument panels. The threeunits consist of two turbines of 250 kW and oneof 500 kW.
Since the powerhouse floor is below the riverlevel, seepage water is an expected problem.To cope with heavy seepage during floods, severalpumping systems have been installed. The seepagewater is collected in a tank and drained out with

87
F R A C T U R E D I N S T I T U T I O N S A N D P H Y S I C A L I N T E R D E P E N D E N C E
the discharge from the turbines back tothe river through a 752 metre long and 3.85 mdiameter tailrace tunnel. The power generatedis transmitted to Butwal and connected to the33 kV/3 kV substation there, thus linking it to thenational grid.
Institutions at Work
In December 1965, Butwal Power CompanyLimited (BPC), was registered by the UMN26 withthe objective of producing, transmitting,distributing and selling electricity mainly withinthe Lumbini Zone in central Nepal. The ElectricityDepartment (ED)27 of His Majesty’s Governmentof Nepal first provided the company a temporarylicence to produce and distribute diesel power. InJune 1966, a proper licence valid for ten years wasissued and, in March 1968, a licence was given toproduce and sell diesel power to the Butwal public.The first consumer to receive BPC’s diesel-generated electricity was an industry in Butwal inDecember 1968. A year later, in October 1969,supply was given to three private consumers, andby April 1971, 323 electricity consumers were onthe company’s roster.
Construction of the Tinau Hydropower Plantwas begun in 1966 by BPC, a few months after itwas registered as a company. In December 1970,50 kW of the first stage of the project startedgeneration. The second stage of production, 250kW, was begun in July 1974. In April 1978, thethird and final stage of the power plant wascompleted, increasing its total capacity to 1,000kW. His Majesty the King formally inaugurated thisproject in February 1979, and it was nationalized(or handed over to HMG by BPC without receiptof any compensation) on July 16, 1980. HMG then
handed over the ownership of the project to NepalElectricity Corporation (NEC), which took up itsoperation and maintenance.
Approximately a year after the hand-over, inSeptember 1981, a severe flood on the Tinaudamaged the powerhouse and encased thegenerators in mud. After four months of cleanupwork, the plant started to generate electricity andwas restored to full capacity. Several years later,the plant’s capacity was reduced to approximately900 kW because one of the generators wasdamaged and the required rewinding had not beendone. Subsequently, poor maintenance has causedthe output to be reduced even further as the dataof Tinau’s contribution to meeting the peak loadof the month shows (Table 3).
Operation of the plant has been problematicunder the parastatal ownership of NEC/NEA. Suchold machinery requires systematic and meticulouspreventive maintenance, an issue that is a chronicproblem in all technical areas of Nepal, whetherpower, irrigation or water supply. In the Nepalgovernment’s technical culture, as expressed in itsbudget philosophy, operation and maintenanceactivities are not accorded the kind of seriousnessthat high level and expensive technical artifactsdemand for their proper functioning. A standardgrouse of the engineering staff in all government-owned or government-led utilities and departmentsis that the operation and maintenance budget,never more than symbolic in most cases, is thefirst item to be slashed when any austerity measurecomes in vogue.
The system also suffered from the fact that thegeneration and distribution voltage of 3 kV wasnot the standard in Nepal and hence the power
The initialnationalization
and currentreprivatization
of the BPC is
indicative of theongoing policy
swings that have
constrainedprivate sector
hydropower
development inNepal.

88
F R A C T U R E D I N S T I T U T I O N S A N D P H Y S I C A L I N T E R D E P E N D E N C E
plant had to supply an isolated segment of Butwaltown. A 3/33 kV link transformer was installed tothe Tinau plant with the national grid, but formany years the NEC/NEA did not permitsynchronization into its larger system. The powerplant, therefore, had to supply only an isolatedpart of the system, which was inefficient use of itspotential. The interconnection of the powerhousewith the national grid was completed only in 1995.
Key Issues
� The history of BPC and the Tinau power planthighlights the problems of private sectorinvolvement in power generation in Nepal. A fewyears before BPC’s Tinau plant was nationalized,smaller electric works such as Bageshwari Electricof Nepalganj and the Eastern ElectricityCorporation were taken over and merged into thegovernment parastatal Nepal ElectricityCorporation.28 At that time Nepal, and the majordonors that were supporting it, believed in state-led and state-consolidated development. Privatesector contributions were not supported.29
� For UMN to bring money for constructioninto Nepal, conditions were imposed: assets socreated were to be handed over to HMG six monthsafter the completion of the project.30 This wasapparently seen as a routine legal formality onInternational Non Governmental Organization
(INGO) operations and not as a foregoneconclusion, since no specific prior understandinghad been made or discussed between UMN, thedonor agency NORAD and HMG. HMG was aminority shareholder in the BPC and held thechairmanship position on its board, and thus hadsufficient insight into and influence on companyaffairs. Thus the UMN expected that the BPC wouldcontinue to own and operate the system in thefuture. It is within this framework that the TinauHydropower Plant was taken over by HMG andgiven over to the NEC.
� In subsequent projects built by the BPC, HMGtook over the shares, but they were retained bythe Ministry of Finance and not handed over tothe NEA. As a result, after the takeover of Andhikhola and Jhimruk power plants, the Ministry nowowns close to 97% of the shares of the BPC. Theremaining shares are divided between the UMN,NEA and the Nepal Industrial DevelopmentCorporation.31 Today, privatization andliberalization are in vogue. As a result, there is amove, both from within HMG and from externaldonors, including the Norwegians, towards theprivatization of the BPC by selling HMG’s sharesto the private parties. The necessary documentshave been prepared, a public notice issued, andthe process of privatization is on, althoughcontroversy has emerged between HMG and privateparties involved.
Operation andmaintenance
are low priorityitems, both interms budgets
and thegovernment’swork culture.
The month of Saun corresponds to July-AugustSource: (NEA, 1997).
Saun Bhadra Asoj Kartik Mangsir Poush Magh Fagun Chait Baisak Jeth Asar
16/7-16/8 17/8-16/9 17/9-16/10 17/10-15/11 16/11-15/12 16/12-13/1 14/1-10/2 11/2-13/3 14/3-12/4 13/4-13/5 14/5-14/6 15/6- 15/7
0.44 0.44 0.50 0.54 0.50 0 0.55 0.22 0.20 0.48 0.45 0.50
TABLE 3:Tinau HEP’s Contribution in MW to the Monthly Peak Load for FY 1996-97

89
F R A C T U R E D I N S T I T U T I O N S A N D P H Y S I C A L I N T E R D E P E N D E N C E
Case Study VI:Farmer-Managed IrrigationSystems
Background
Local farmers have been diverting the water ofthe Tinau to irrigate areas that lie on its east andwest banks since historical times. There are threesuch irrigation systems using temporary intakeson the Tinau: the Chhattis and Sorha mauja onthe east and the Chaar Tapaha Irrigation systemon the western side. Locally, Chhattis and Sorhamauja mean thirty-six and sixteen birta (revenuevillages) respectively, while “chaar tapaha”means “four canals.”
The Chhattis and Sorha mauja systems werebuilt by the local tharu community about 150years ago. They are some of the largest farmerbuilt and managed irrigation systems in Nepal.The main 10 kilometre long canal was originallybuilt to irrigate Sagarhawa, which today is at thesystem’s tail end. While tharu settlements arevery old, more recent ones were promoted bythe State and provided with support for expandingthe pre-existing system. The translation of thename Chhattis Mauja itself, “the thirty-six birtarevenue villages” suggests that they wereformed due to the state’s push, and not aspontaneous effort.
Such settlements were organized through thegrant of a land title: the landlord collected revenueand forwarded a fixed annual sum to the State.Landlords (zamindars) were not so much privateowners paying taxes, but functioned asrepresentatives of State entrusted with maintaininglaw and order, including assuring tax collection.
After the initial establishment of the systems,people from different parts of Nepal startedto migrate to the region resulting in a gradualdecline in the forest cover of the “chaar kosejhari”, the thick tropical forest of bhabar zone.These forests were cut and convertedinto agricultural land, a trend which increasedafter 1950. Migration increased for severalreasons, including the eradication of malariain the 1960s and the completion of theBhairahawa-Pokhara and East-West highwaysof Nepal. In addition, many people fromthe hills came to the Tarai after their settlementswere affected by floods and landslides.
The command areas of these irrigation systemslie in the bhabar zone. As previously noted,this zone is characterized by high infiltrationrates due to unconsolidated flood plain depositsbrought by rivers from the Churia. The landscapegently slopes southward and has a soil-basea couple of feet in depth. Unlike in the lowerTarai plain, use of groundwater is limited tothe lower end of the region, where deposits allowwells to be constructed easily. In the upperreaches of the canal systems, coarse soil depositsand high infiltration rates cause high levels ofseepage and necessitate more irrigation applicationthan at the lower sections of the commandarea. Seepage losses are particularly high inthe months of April and May, and result inwater scarcity in the surface irrigation systems.In those months, water availability in theTinau drastically reduces and becomes lessthan 1 m3/s. As a result, irrigation water cannotbe supplied to tail-reaches and cannotsupplement the third crop in the spring. Theoutcome is increasing evidence of water scarcityduring these months.
There is ahistory of
farmer-managedirrigation
systems even inareas where
settlement was
promoted by thestate.

90
F R A C T U R E D I N S T I T U T I O N S A N D P H Y S I C A L I N T E R D E P E N D E N C E
System Description
Chhattis and Sorha Mauja
The Chhattis and Sorha mauja have acombined command area of 5,000 ha. TheChhattis Mauja irrigation canal has thecapacity to irrigate about 3,500 ha of land inMakrahar, Ananda Ban, Jogikuti and Sagarhawavillages.32 The Sorha Mauja irrigates a smallerarea, 1,500 ha between Chhattis Maujaand the Tinau River. The two irrigation systemsare, therefore, contiguous. The Sorha MaujaSystem is about 95 years old and irrigates landin Madhuban, Anandavan, and Khopia. Theaverage households in the area have 8 membersand the irrigated landholding averages 1.0 hain the head reach of system and about 1.5 ha atthe tail end.
The Sorha and Chhattis mauja irrigationsystems divert water from the Tinau River at itsleft bank at Butwal at a place is calledKanyadhunga. Two kilometres downstream ofthe main diversion, at a point called Tara PrasadBhod, the water in the jointly operated canalis split into two separate channels. The SorhaMauja canal is allocated 40 per cent of thecombined canal flow, while the rest of the flow isassigned to the Chhattis Mauja systemwhose main canal is eleven kilometres long. Thisallocation was decided in a 1969 negotiationmediated by the government. The main canal isoperated jointly.
The irrigation systems incorporate a 33 branchcanal sub-system that draws on water from themain canal and is used by a total of 54 villageunits. This is accomplished by 44 temporary canaloutlet structures. The canals of both the irrigation
systems are unlined and the layout of this systemis shown in Figure 7.
Chaar Tapaha
Before the Chaar Tapaha irrigation system wasbuilt, farmers tapped small local stream-channels.There were no major canals. Following migrationfrom the hills, the population started to increase,which resulted in more land being brought undercultivation and increased the need for water.Smaller canals, which received water fromlocal sources, were mostly built through individualefforts. Some farmers built larger canals andsome were managed on a community basis. Laterrepresentatives of these different canal groupsdecided to form an umbrella organization, theChaar Tapaha Committee, which functions todayas the water users committee.
The Chaar Tapaha irrigation system uses waterfrom both the Tinau and the Dano rivers. Thereare four unlined canal systems altogether that takewater from the rivers: Panch, Eghara, Khadawaand Chaar Tapaha. This network irrigates thevillages of Motipur, Amuwa, Pharsa Tikar, Semlar,Bangai, as well as ward numbers fourteen andfifteen of Butwal Municipality. The total land areathat can be irrigated by the system is about 4,800ha, benefiting 43,000 people in 4,175 households.The canals divert water using temporarydiversions, which are made of stone, mud,brushwood, and bamboo. Some of the recentlyrehabilitated structures on the canals are made ofcement concrete.
Institutions at Work
The management of these irrigation systemsby farmers’ associations is stressed by challenges
Two majorcomponents of
irrigationmanagementare water
allocation andcanalmaintenance.

91
F R A C T U R E D I N S T I T U T I O N S A N D P H Y S I C A L I N T E R D E P E N D E N C E
�-��-7 �&�
���������
� �<� �������� ����
�� ������������������
�����������
�����
������
��
����4�
����������6
����� ����-�� ��&� �5�
���� ������������
��������� 5�#
���� ����
�� ���������������������
�-�� �&�'8(&
�����
Figure 7:Sorha and Chhattis Mauja systems.
related to the growing domestic and irrigationdemand for water. The irrigation organizationshave evolved over decades from informal systemto formal ones. Farmers now feel the threatof losing control over the water resources inthese systems.
The users’ committee of Chaar Tapaha, whichwas registered by the District Administration Officeof Rupandehi in 1983, manages its overall system.The constitution of the committee is the guidingdocument legitimizing decisions and activities. Itis based on traditional rules and norms that havebeen in practice for decades, with every farmerwithin the irrigation command area being anequal stakeholder responsible for the managementof the system. There are two major componentsof the management system - water allocation and
canal maintenance. Water allocation isproportional to land ownership. A farmer who hasa larger area of land gets more water, but mustpay more water tax. Tax rates vary from Rs 5,000,to Rs 11,000 depending upon the size of themauja. The tax is adjusted every year. Unlike theSorha-Chhattis system, the management of ChaarTapaha is less orderly.
Water allocation within these systems isrelated to the availability of water in the TinauRiver. Since the intake of the left bank Sorha-Chhattai Mauja is one hundred metres upstreamof the right bank Chaar Tapaha intake site,disputes exist between the systems regarding waterallocation. The two management committees ofthe systems have an understanding to share waterby turns.
The watershares of the
Sorha and
Chhattis Maujairrigation
systems were
negotiated byan external
adjudicator.
�N
Tara Prasad Bhod diversion structure
Main canal of Sorha-Chhattis system

92
F R A C T U R E D I N S T I T U T I O N S A N D P H Y S I C A L I N T E R D E P E N D E N C E
The management committee of the Sorha-Chhattis system is elected. Each member of themanagement committee has equal responsibilityregardless of the area of land he/she owns. Forparticipation in maintenance works, the commandarea of each canal is divided into different blocks,(known as mauja). Each mauja has sub-committees for the maintenance of canals withinthe area and for monitoring water allocation. It iscompulsory for specified members to attend tocanal and headwork maintenance. There is alsoa mandatory provision for 60 persons from eachmauja to participate in the reconstruction andrehabilitation of the headwork and canal systems.Anyone who fails to contribute to this collectivecommunity enterprise has to pay a fine.The constitution of the Water Users’ Committeehas specified the conditions under which theuser should pay regular charges and extracharges or fines.
Key Issues
� The inadequacy of water in the dry months andflooding impeded drainage in the tail reaches inthe monsoon are major problems in all threesystems. These conditions often cause loss ofagriculture production. The extent of water scarcityis highly seasonal and fluctuates from year to year.In the dry months, when irrigation demand ishigh, water in the canals is at its ebb. Irrigationand drinking water needs grow continuously fromDecember to June until the monsoon gains its fullstrength by the end of June.
� Scarcity often causes farmers to leave landfallow. Where possible, people cope with waterscarcity for domestic use by using open wells,boring deep tubewells or using hand pumps. Deep
boring is successful only at a few places towardthe southern section of the irrigation commands,south of the bhabar zone.
� Irrigation system performance is emerging asa significant issue. Canals are unlined in all threesystems and high seepage rates reduce wateravailability in the lower sections of the command.The high seepage does, however, contribute to therecharge of the regional aquifers, but the preciselinkage remains poorly understood.
� Farmers are advocating permanent intakes foreach of the canal systems due to the complexityof maintaining collective action for intakerehabilitation and canal cleaning. According tothem, temporary intakes are increasingly difficultto maintain because the bed level of the river isdeclining due to the extraction of sand and gravelfor construction. These changes in rivermorphology have not been studied scientifically.
� Chaar Tapaha experienced flash floods in 1970,1979, 1981, 1995 and 1998; the 1979 flood beingparticularly devastating. The cause of this floodwas a landslide a few kilometres upstream ofButwal, which blocked the flow of the Tinau forseveral hours before it burst through. It took placein the early monsoon when farmers were plantingrice. The flood swept away all intakes and most ofthe canals of Chaar Tapaha as well as parts ofButwal. Traditional informal farmer-managedirrigation systems are structured with resilience todeal with such natural phenomenon whileformalized users’ groups exhibit tendencies towardsdependence on government.
� The Tinau has a high rate of sedimentationand tends to change its course. Sedimentation is
Traditional FMIS
face many issuesincluding:� water scarcity
during drymonths,
� increasing
difficulty inmaintainingtemporary
diversions,� pollution,� changing
labouravailability formaintenance,
� debates oversystemperformance,
� destructionfrom flashfloods, and
� highsedimentation.

93
F R A C T U R E D I N S T I T U T I O N S A N D P H Y S I C A L I N T E R D E P E N D E N C E
a significant problem affecting the efficiency ofcanals and the productivity of farmlands, especiallywhen large amounts of sand are deposited. The1979 flood deposited boulders, sand andunproductive sediment over the canals and farmland. The damage was so serious that it took twoyears to restore the canals to normal.
� New forms of stress are emerging due tourbanization and rising pollution. Waste fromButwal Municipality is dumped on the banks ofthe Tinau and the Dano rivers close to irrigationintakes. During lean season scarcity, pollutionlevels are high due to low dilution capacity of theriver. Despite this, people are compelled to useriver water for domestic and livestock purposes,which has affected the health of local people.
� The changing nature of labour relationships,triggered by urbanization and increased mobilitydue to improved transportation, are exerting stresson the irrigation institutions. Defaulting on long-held norms farmers show an inclination to workelsewhere instead of contributing to activities likecleaning canals or erecting the diversion.Irrigation institutions face the challange ofsuccessfully reconciling new emerging socialpractices with old tradition.
Case Study VII:Khadwa-Motipur IrrigationSystem
Background
Khadwa-Motipur, another farmer-managedirrigation system (FMIS) in the Tinau basin, liesin the lower, southern portion of Rupandehidistrict. The headwork site is located beside the
Bhairahawa-Lumbini road, about 10 km west ofBhairahawa, upstream of the confluence of theDano and the Siyari rivers. This government-assisted scheme with a gross command area of2,000 ha and net command of 1,200 ha is expectedto benefit three Village Development Committees(VDCs) — Bashauli, Pakadi and Bhumari. A totalof around 10,000 families have their lands withinthe command area of the system.
Khadwa-Motipur is being rehabilitated throughthe Irrigation Line of Credit (ILC) pilot project, aWorld Bank loan to HMG/N, implemented by theDepartment of Irrigation. ILC was initiallylaunched to establish a framework for the future(National) Irrigation Sector Program (ISP)33 andwas later extended as a pilot project to testprocedures for a sectoral approach to participatoryirrigation. The ILC pilot project takes up thefollowing types of schemes:
(a) construction of new small and mediumirrigation systems to be managed by farmers;
(b) rehabilitation of farmer-managed small andmedium irrigation systems;
(c) rehabilitation of small and mediumgovernment managed irrigation systems and theirturnover to farmers; and
(d) construction of new groundwater schemes tobe managed by farmers.
Khadwa-Motipur is the second type of schemein this classification, a medium-scale, farmer-managed irrigation system needing rehabilitation.The ILC pilot project seeks to be demand driven,and the project cycle begins from information
The NISPpromotes
construction,rehabilitation
and the
turnover ofirrigation
schemes to
farmers.

94
F R A C T U R E D I N S T I T U T I O N S A N D P H Y S I C A L I N T E R D E P E N D E N C E
from seepage, spring and drain water.Its dry season flow in April is around 50 to 60litres/second and it carries a moderately lowsediment load. At the headwork location, the riverpasses through a narrow gully with a firm highbank. The command area lies on the southernside of the Bhairahawa-Lumbini Highway betweenthe Tinau and the Dano rivers (in contrastto the headwork, which lies just north ofthe highway).
The headwork consists of a barrage with sixgates. Other structures included in the scheme areone head regulator, one road culvert at theBhairahawa-Lumbini Highway, one cross drainagework, two village road bridges, one foot bridge anda 1,500 metres long bund along the river banksas well as river training works. The idle length ofthe canal is 2.5 km, while the main canal andbranch canals are 10 km and 1.7 km longrespectively. The earthen canal capacity is 1.8cumec. The scheme also includes four branchcanals and several tertiaries.
The villages of Parsawa and Motipur lie in theidle length portion of the canal. Towards the head-reach of the canal, in the eastern part lie thedifferent wards of Barsauli village while Budawalies in the western portion. Different wards ofPakadi VDC lie towards the middle reach of thecanal, while Bhuwari lies towards the tail-end ofthe canal.
Institutions at Work
Before the construction of the Bhairahawa-Lumbini Highway, farmers tapped water from theSiyari River, about one km upstream from thepresent confluence, using an earth and wood
collection, goes on to its dissemination and endswith farmers taking responsibility for the operationand maintenance of the scheme.
Under the ILC, requests for governmentalassistance should originate from the concernedfarmers once information about the project hasbeen widely disseminated. The requests are thenscreened at the District Irrigation Office (DIO)with screening including a walk through thescheme to identify needs. This is followed by afeasibility study assessing not only technical andeconomic parameters, but also social andinstitutional ones. Once the scheme has beenappraised and construction approved, the usersneed to establish a formal Water Users’Association (WUA).
An agreement is then signed between the DIOand the WUA. The WUA is expected to raise a cashcontribution to deposit in the bank for later usefor operation and maintenance. Duringconstruction, the WUA has the responsibility ofmobilizing labour and jointly supervising (with theDIO) construction works. When the scheme iscommissioned, farmers are formally responsible forthe operation and maintenance of the system. InKhadwa-Motipur this procedure has generally beenfollowed but, as discussed below, there have beenmany loopholes.34
System Description
Although now separated from the main stream,the river supplying Khadwa-Motipur is part of theTinau River system and could be one of itsabandoned channels which ultimately join theDano River about 5 to 6 km downstream fromthe headwork site of the project. It is fed mainly
Under the NISP,implementation
is supposed tobe demanddriven but there
are manyloopholes.

95
F R A C T U R E D I N S T I T U T I O N S A N D P H Y S I C A L I N T E R D E P E N D E N C E
diversion bund. Because the Bhairahawa-LumbiniHighway would cut across the existing canal, theDepartment of Roads constructed a culvert at thepoint of intersection.
Local villagers articulated their request forassistance from the government under the ILCin terms of the kachha/pakka distinction. Thereis a preference for a pakki bandh (a permanentconcrete dam) over a kachhi bandh (a temporaryearthen dam) because the kachhi bandh hasto be constructed anew every year (sometimeseven more than once a year) while apakki bandh ostensibly does not have to berehabilitated repeatedly.
Historically, until the late 1970s, eighteenvillages served by the system would jointly build atemporary weir to divert water from the Khadwastream. In 1979, a water users’ committee wasformed with Chandra Bhushan Tiwari fromBhuwari village (towards the tail-reach of thecanal) as chairman. Tiwari was a member of theRastriya Panchayat (national legislature of theparty-less Panchayat system) and thus aninfluential local person. During this period, thevillagers collected funds for building a permanentdam. When the dam was built in 1980, it wasformally inaugurated by the HM King, who hadcome to visit the region.
Baked bricks were used in constructing the damin 1980, which were also used to rehabilitateportions of the canal that had been breached. Thecanal was constructed up to Bhuwari, the homevillage of Tiwari, but after one season, the bankof the canal near the headwork was breached andthe dam collapsed. It was rehabilitated afterroughly two years only to be washed away and
again, with the sediments from the flood cloggingthe canals.
In 1985, Deepak Bohora, who was then amember of the Rastriya Panchayat (and also akey figure in the decision behind the MarchawarLift Irrigation System), made state funds availablefor the reconstruction of the dam. Because the damwas not properly designed (for instance, it had noreinforced concrete pillar), it collapsed once again.The farmers then began to request assistance fromthe government through the ILC pilot project.
The local users formally followed theprocedures for requesting funding for the schemeunder the ILC, including filling out the sub-projectrequest form and assisting in identifyingand establishing the feasibility of the scheme. Thefinal push for taking up the scheme forrehabilitation came from Sarvendra Nath Shukla,a local Member of Parliament who was thenthe State Minister for Water Resources and a scionof the influential Shukla zamindars ofMarchawar. He iniiated the scheme in 1996 andconstruction commenced in 1997. The scheme wasfirst designed as an overflow weir diversion, butan unprecedented flood in July 1996 caused theDIO to revise the design with support from aTechnical Assistance Team. Finally, through localpressure, the overflow weir was replaced with afull barrage.
The present users’ committee was formed in1996. The main persons in the WUA are all fromPakadi village located in the middle-reach portionof the canal. In contrast to the earlier committee,whose chairman was from the tail-end portion ofthe scheme, this time those from the middleportion of the canal dominate the committee.
Issues facing theKhadwa-Motipur
scheme include:� poor cost
recovery,
� formalizationof WUA,
� frequent
damage,� the growth of
tubewells in
the commandarea, and
� lower than
anticipatedincreases inyield.

96
F R A C T U R E D I N S T I T U T I O N S A N D P H Y S I C A L I N T E R D E P E N D E N C E
When the design and cost estimates of Khadwa-Motipur were first prepared, the estimated cost wasRs 11,166,173. This was subsequently revised toRs 18,481,775 in 1997. According to this figure,the cost per hectare comes to be around Rs 15,400while the internal rate of return figured at around47 per cent. By the end of the 1997/98 fiscal year,the construction costs had reached Rs 26,000,000.Consequently, the cost per hectare has escalatedwhile the IRR has come down considerably.
The farmers were expected to contribute Rs80,000 at the rate of Rs 100/bigha by the end ofthe 1999/2000 fiscal year. According to the DIO,only after the farmers have deposited this amount,will the gates be installed. To date, however,farmers have been able to contribute only aroundRs 27,000. The department officials complain thatthey spend days waiting for the WUA representativesto show for meetings, but without success, thatthe farmers are “not active in participation”.
Key Issues
� When the scheme was first proposed costestimates were much lower but the time it reachedcompletion, costs had almost doubled. Theescalation could be due to improper feasibility anddesign analysis at the very beginning. Initialestimates are deliberately deflated by construction-biased agencies and consultants to make thescheme feasible. This is usually done by increasingthe command area estimates, underestimatingexisting yield, over-estimating the expected yieldin the future and reducing design structures tothe bare essentials.
� Prior to 1996 the irrigation water users’ groupsthat existed were informal in nature. These now
have to be registered with the District WaterResource Committee and the formal nature ofthese bodies may result in them becoming forumsfor contesting local political power.
� In the past, the scheme was often damaged, butheadwork was built at a low cost and with locallyavailable materials. It meant that the farmerscould rehabilitate it. Because the headwork is builtfrom imported materials, local resilience has beenundermined. Given the nature of cloudbursts andhydro-ecology in the region, it is likely that thescheme will be damaged in the future, whileprovisions for repair does not exist.
� Within the command area, there are severalshallow tubewells pumpsets with the help ofwhich local farmers irrigate their fields.Where groundwater pumping is available itis unclear whether farmers will have anincentive to participate in WUA’s operation andmaintenance activities.
� Increases in agricultural output from thisscheme are likely to be small. Existing yields arehigher than cited in the feasibility report becauseof the tubewells and diesel operated pumps whichare used for irrigation in the area, but which arenot acknowledged by irrigation agencies.
� The participatory irrigation developmentapproach endorsed by the government and donorsfaces implementation difficulties. The ILCprogramme, which preceded the NISP, wasoriginally designed as a comprehensive packageof assistance comprising of social, physical,environmental, legal and organizational aspectsrather than a narrow set of design andconstruction activities. NISP shows little sign of
Powerful localactors could use
state irrigationsupport as apolitical tool.

97
F R A C T U R E D I N S T I T U T I O N S A N D P H Y S I C A L I N T E R D E P E N D E N C E
Like many otherschemes, the
Marchawarscheme has
evolved through
manyincarnations.
institutionalizing the new approach of investmentin irrigation because of entrenched reluctancewithin the department to move away from itsconstruction focus.
Case Study VIII:Marchawar Lift IrrigationSystem
Background
The region that includes Marchawar washistorically known as Shivaraj. It lies about 40kilometres southwest of Butwal and about 20kilometres east of Lumbini. Today’s Marchawarwas settled by people from the south about four tofive generations ago. Although the area wascultivated and the land was irrigated even duringthe time of the Buddha, the region resemblesmuch of the northern Ganga plains with a feudalsocio-political system governed by local elite. Mostfarmers are descendants of tenants brought bylandlords who were invited by the government ofNepal to resettle lands handed back to Nepal after1816 by the British Raj.35 The tenants were mainlyMuslim and Hindu farming or “peasant” castes.Lateral linkages of association for trade andmarriage are common with similar groups in UttarPradesh. Local populations marry, work, travel,and trade across without any border formalities.
Marchawar was relatively lightly populatedbetween 1930 and 1980. Even in the late 1960s,population density in Marchawar was lower thanthat in Uttar Pradesh, where administrativeattention to farming, communication, and tradeand revenue collection was better than inMarchawar. The area does not have migration andresettlement from the hills such as that
characterizing the areas to the immediate northin BLGWP and Butwal. This has a majorinfluence on the social make-up in the irrigationcommand area and thus on the success or failureof the irrigation scheme.36
System Description
The Marchawar Lift Irrigation System, whichwas funded by the United Nations’ CapitalDevelopment Fund (UNCDF), was started in thelate 1970s. It was designed to irrigate the areaoriginally planned to be served through thesurface water canal, constructed in 1960 withIndian assistance from the barrage near Butwal.As previously noted, a flood washed away the maincanal near the headwork of this system the yearafter it was constructed. After the headworkfailed, it was not rebuilt. Later the surface liftpump irrigation system was conceived to supplywater to the southern sections. The northeasternsections of Marchawar continue to be withoutadequate surface water irrigation since thefailure of the canal from the Butwal barrage.Farmers there feel that their right to Tinau’swater pre-dates the conceptualization of the liftirrigation system.37
Any understanding of the Marchawar LiftIrrigation System (MLIS) is incomplete withoutsome discussion of its history. The region wasserved by a traditional farmer-managed irrigationsystem (FMIS) at least as old, if not older, thanthe Chhattis Mauja System. The traditionalirrigation system at Marchawar consisted of atemporary dam at a place called Gurbania on theTinau River west of Makari village. The dam siteis located to the south of the Bhairahawa-LumbiniHighway bridge on the Tinau and the system

98
F R A C T U R E D I N S T I T U T I O N S A N D P H Y S I C A L I N T E R D E P E N D E N C E
consisted of an intricate canal network. One canalfrom Gurbania followed a southeast alignment toParsiya, where it bifurcated, with one branch goingto Kadmahawa and Mardhawa and the other toMaryadpur, Majhgawa, Hardi and Rohinihawa. Asecond temporary dam at Harewa was also erected,and a canal from it passed by Hardi to Asurainavillage. A drainage called Kathphor nala (orMatiyar nala) emerged from the Jignihawa tal.Tail-water from the two canal systems mentionedabove also drained into the nala. The drainagechannel was dammed near the villages ofNawabi and Thumhawa and used to irrigatelands in the villages of Mahadehi, Semaraand Thumhawa.
The local feudal order of Marchawar was ableto mobilize thousands of villagers for the tasks ofbuilding the temporary dams every irrigationseason and of maintaining the old canal system.38
Even though the system was kept operational, theprevailing social formation entailed substantialinequity and violation of human rights,perpetuated by the feudal formation. When theRana rule in Nepal ended after the British departedfrom India, the entrenched feudal system inMarchawar began to be challenged.
The aftermath of political changes in 1951 inNepal also saw a mini revolution against the localfeudal order in Marchawar. The late Dr. K. I.Singh, who during the post-Rana interregnumbecame Nepal’s Prime Minister, instigated the localrebellion. Challenging the feudal order led to adeep rupture in the local social formations.Following the “K. I. Singh revolt” it becamedifficult for the feudal lords of Marchawar to coercelarge numbers of people to contribute labour formaintenance without equitable apportioning of
costs and benefits. The interregnum in Marchawarlasted until 1957, when the first general electionsin Nepal brought forth a multiparty parliamentwith an absolute majority of the Nepali Congress.In December 1960, the multiparty system wasdone away with by a royal decree and thePanchayat System was instituted in 1962.
It is at this juncture of post-democracy and pre-panchayat rule that the Indian Aid Mission, withthe concurrence of the Nepal government,conceptualized a surface irrigation system tobenefit the command area of Marchawar.39 Thebarrage of this system is located just south ofButwal on the debris fan of the Tinau River. Thewater was to be delivered to Marchawar by a canalaligned with the western bank of the river. AtTunihawa near Maryadpur, the canal bifurcatesinto two branches. One branch was meant to servethe villages of Kadmahawa and Bogadi, the easternvillages, while the other branch was extended toSemara, a village close to the Indian border.Semara is also the tail end of one of the primarycanals of the MLIS. The Butwal barrage and itscanals were superimposed on the pre-existingcanal network built and managed by farmers. Aspreviously noted, the new irrigation system wasvery short-lived. It had, however, a majordestructive impact, because the alignment of thecanal and its placement literally carved up theexisting irrigation canals at Marchawar. In severalplaces the new canal either blocked the existingsystem or disturbed the drainage pattern.
As the new system was constructed in theaftermath of the mini-revolution, the changingsocial dynamics in Marchawar could not challengethe trampling of the existing irrigationarrangement by the Nepali and Indian states.
The earlierfeudal order
present inMarchawarwas able to
mobilizethousands offarmers for
buildingtemporary weirsand
maintainingcanals.

99
F R A C T U R E D I N S T I T U T I O N S A N D P H Y S I C A L I N T E R D E P E N D E N C E
���� ��� ��� 6�����
������������
���� ��� ��� 6�����
������6�������� 6
������ ������� 6
��� ������������� 6
�� ���� ��� 6����� ������ �� ��� 6�����
��������
���������
��������
��� ����������
���� ����������
�('"%'.�"-+7��-(*$�&#
Because of the destruction of the old social order,the system could not be sustained. At the farmers’level, there did seem to be some effort at restoringthe old Gurbania system. A functionary of theMLIS’s WUA remembers participating in erectingthe Gurbania weir for the last time a few yearsafter the Indian system collapsed.40 This led toan overall social and economic decline in theregion, which in turn gained notoriety as a dacoit-infested area due to frequent instances of robberyand looting.
The MLIP was intended to support the socialand economic development of Marchawar.41 Theproject was implemented in two phases: Phase Ifrom 1981 to 1989 and Phase II from 1992 toJune 1996.42 Both phases were constructiondominated. The first phase followed the victory ofthe then Panchayat system in the nationalreferendum of 1980 over the supporters ofmultiparty democracy. The second phase startedafter the Peoples’ Movement of 1990, whichsaw the restoration of multiparty democracy inthe country.
The initial assumption was that theTinau River had sufficient water to irrigatea command area of 7,200 ha gross, or 5,766net. The command area of the system hassince been revised several times. Irrigationapplication at MLIP varies greatly between the wetand dry seasons due to the low availability of waterfrom the Tinau. Summer paddy irrigationis restricted to a maximum of 3,600 and winterwheat to 2,200 ha. The system presently providessupplemental irrigation to about 2,815 ha ofland,43, which serves a population of some 22,400people. The layout of the irrigation system isshown in Figure 8.
The pumping system consists of ten pumpsmanufactured by GANZ-MAVAG of Hungary withmotors from Yugoslavia. Six pumps have a lowpumping head, referred to as low lift (LL) pumps,while four pumps have a higher head, referred toas high lift (HL) pumps. The pump station liftswater from the river into a sedimentation tank,from where water is supplied into the upper main,lower main and Hardi primary canals.
The upper lift pumps feed the upper maincanal, which uses part of the canal from thedefunct Butwal barrage. In this section water flows“uphill”. The low lift pumps serve the lower canaland Hardi primary systems. The upper and lowercanal systems can be operated independently, andwater can be diverted from the high level pumpsto supplement the low-level system if required.The actual installed capacity is nine pumps withone pump serving as a permanent standby. Of theten pumps, six have a discharge capacity of 575
Figure 8:Marchawar irrigation system layout.
Pumped systemsfor irrigation
require a
sophisticatedcapacity for
operation and
maintenanceamong farmers
and this is often
lacking inplaces such as
Marchawar.

100
F R A C T U R E D I N S T I T U T I O N S A N D P H Y S I C A L I N T E R D E P E N D E N C E
Management ofthe MLIS by a
combination ofactors (WUA, theDOI and the
NHE ) is stillcontested andtheir role need
to beharmonizedwithin a new
framework.
litres/second and the remaining four have acapacity of 765 litres/second. The electricity supplyis from the Integrated Nepal Power System (INPS)in Lumbini.
The length of the main canal of the Marchawaris 3.0 km, that of the primary canal 8.7 km andthat of the secondary canals 17.6 km. Theirrigation system has approximately 29.1 km oftertiary canals that serve the command area. Thereare nine sub-canal systems within the network thatincludes 148 hydraulic structures of various typesand sizes to regulate water distribution and tomeasure discharge. The distribution system isdesigned on the basis of proportional divisionusing broad-crested weirs to equitably spread watersupplies. Approximately 25.7 kilometres of allweather roads have been built.
The irrigation system is divided into 9 sub-systems according to the branch canals (7 lowermain, one independent and 1 upper main,but the latter is not yet registered with the maincommittee). Of the 8 lower main sub-systems, 127blocks have been developed in order to facilitatewater allocation and management at blocklevel as the foundation of the WUA. Each blockcommittee is formed of five representatives of blockfarmers. Each system is then constituted of fiveelected members representing block committees,and the main committee is comprised of twelverepresentatives — eight system committees’chairpersons as ex-office members and fourrepresentatives elected by block committeechairpersons. Thus there is a three-tier systemstructure with 127 assembly members in the WUA.Two general assemblies – Marchawar shabha –are designed to take place before starting the winterand summer crop cultivation each year.
Institutions at Work
The first phase of the project started as a majoractivity of the Department of Irrigation, whichimplemented it by employing a contractor to buildthe pump house, the sedimentation tank and partof the canal system. In the second phase, afterthe political changes of 1990, the Department ofIrrigation employed expatriate and Nepaliconsultants to construct the distributary andtertiary canal networks and their supportfacilities.44 The joint implementation andmanagement arrangement with the private sectorwas an interesting feature incorporated into theorganization of the project. It was during thisperiod that HMG introduced its new irrigationpolicy, under which the management of MLIS wasformally handed over to the Water Users’Association in early 1998.
The pump house and the sedimentation tankremain under the full ownership and managementof the Department of Irrigation. The rest ofthe system is managed and used, but not owned,by the water users’ group. Operation andmaintenance of the pump house is contractedout to a private workshop, Nepal Hydro andElectric (NHE) of Butwal, whose responsibilities arelimited to the pump house, machines andequipment. Cleaning the intake of silt depositsis the responsibility of the Water Users’ Association,while 90% of electricity costs are borne bythe department.45
Key Issues
� The management and operation of the pumpirrigation scheme is a highly skilled exercise, moresophisticated than is within the current capability

101
F R A C T U R E D I N S T I T U T I O N S A N D P H Y S I C A L I N T E R D E P E N D E N C E
Increasing the
water tariff isessential in
order to cover
costs but thisrepresents a
major challenge
for the WUA atMarchawar.
of Nepal’s farmers or the rules and managementstyles of its official agencies. As a result there aresubstantial technical and institutional problems inroutine maintenance and operation of theirrigation system.
� The farmers cannot maintain the machinerythemselves and have to depend on skilledpersonnel to do the job. In Marchawar theresponsibility for technical aspects has beencontracted out to an outside party, the NHE ofButwal, which has successfully experimented withcasting spare parts of pumps and replacing them.This arrangement seems to work successfully butits sustainability needs to be explored becausefarmers, currently need subsidies to meetoperational costs and the Department of Irrigationdoes not have strong capability in mechanicalengineering.
� The issue of cost opens up the question ofirrigation water tariff. The monthly electricitycharge for pumping can be as high as Rs 300,000/month, but the annual water charge of Rs 6/kattha/year only brings in Rs 119,000, equivalentto a monthly income of about Rs 9,000 if all ofthe water cess is raised. Given the difference,substantial increases will be required beforefarmers will be paying anything approaching thecost of pumping water.
� The irrigation system is dependent on theavailability of water in the Tinau at the pumpstation. Since this is insufficient, substantialportions of the command area cannot be supplied.Additional water from a different source wouldincrease the overall viability of the operation. Onepossibility is to establish deep wells near tailends of canals, as well as in the upper section of
Marchawar not served by MLIS that could use thestill existing Gurbania canal network.
� Like all surface irrigation schemes, Marchawaralso reveals differences in the availability of waterand services to the head-reaches compared to whatis available to tail-enders. Disputes regarding priorrights both within the Marchawar system andbetween MLIS and upstream users, such as Sorha-Chhattis and Khadwa-Motipur systems, maybecome major issues in the years ahead.
� Water Users’ Association needs institutionalstrengthening. At present, the WUA lacks many ofthe capacities necessary to manage a technicallyand economically complicated system such asMarchawar. The handover by the government anddonors was sudden and was not preceded byadequate preparation of the WUA.
Case Study IX:Groundwater
Background
The region’s groundwater aquifers generallybegin in the tail region of the Sorha, Chhattis andChaar Tapaha irrigation systems. There are fourcategories of groundwater users in the region: deeptubewells such as those constructed under theBLGWP and ILC at Marchawar, shallow tubewellsinstalled by farmers with support from thegovernment and development banks, private dieselpumps, and handpumps, rower pumps as well astreadle pumps. Following the widespread use ofshallow tubewells in the 1980s, the third and thefourth categories of uses have recently spread inshallow groundwater areas with the deepening ofmarket penetration.

102
F R A C T U R E D I N S T I T U T I O N S A N D P H Y S I C A L I N T E R D E P E N D E N C E
Bhairahawa Lumbini Ground WaterProject
The Bhairahawa Lumbini Ground WaterProject (BLGWP) operates under the Ground WaterDevelopment Board of HMG/N. The project wasexecuted in three phases; the first phase from1976-1983, the second from 1984-1991 and thethird from 1991 ending in 1999.
In the mid-1970s, the Department of Irrigationstarted to install pumps to tap deep aquifers andimprove the reliability of the water supply forirrigation. The World Bank funded the project. By1999, when the third phase is expected to end,the project will have installed a total of 181electrically powered deep tubewells with verticalturbine pumps. The command of a deep tubewellaverages around 120 ha and meets the needs of80 families. Units are independent and areexpected to discharge 300 m3/hour. In total, thepump systems installed under the project areexpected to provide irrigation to about 20,880 haof land46 and to benefit 17,690 farm families. Inaddition to installing the wells and pumps, theproject also provides basic infrastructure, includingcanal networks, gravel roads and 11 kVtransmission lines, as well as extension services,to farmers.
In the initial stages aid agencies covered almostall the construction and operating costs. Given thetechnology involved and the density of fieldcoverage, costs are high. There have beenimplementation problems with both the technologyand the institutional design. Beneficiaries are nowrequired to increase their contribution. They haveto provide land for the PVC pipes and free labouras well as to meet pumping costs. Wells are at
different stages of development and some are beingturned over to farmers’ group for operation.Overall the project is considered to be successful,even though the area actually irrigated – 14,809ha – is less than that expected to be irrigated.Availability of irrigation services has increasedcropping intensity from 118% in the first phase to196%. There has been crop diversification andproduction has increased three fold.47
Institutions at Work
The project is in transition from a supply to ademand driven mode. Also there is an increasingtendency for private rather than public investmentand expenditure. The objectives are to reduceoperation and maintenance costs and to transferthe tubewell systems to beneficiaries for operationand maintenance. Though some published studiesindicate annual operations and maintenance costsmay be as low as Rs 430, these are acknowledgedto be generally higher in practice .
Cost recovery has been set at a limit that ispolitically acceptable. Originally, in Phase I,beneficiaries were asked to pay either a flat chargeof Rs 200 to Rs 400 per ha or the cost of a pumpoperator’s salary and electricity. The flat ratesystem also resulted in excessive pumping andwasteful application of water, and hence highelectricity bills. After the political changes of 1990,many did not pay irrigation charges. Since 1993,a new arrangement has been adopted for operationand maintenance where the flat rate water chargehas been cancelled, but the electricity cost forpumping is borne by the Water Users’ Groups. Thissystem is based on the principle that cost recoveryshould, at least, include operation and routinemaintenance, while accepting that capital
BLGWP wasimplemented
using a“governmentprovides all”
approach.

103
F R A C T U R E D I N S T I T U T I O N S A N D P H Y S I C A L I N T E R D E P E N D E N C E
investment is the responsibility of the State. Underthe new arrangement, pumping hours are reportedto have declined without affecting agriculturalproductivity, which suggests that water use is moreefficient than before. To encourage users to acceptthe new system of payments, however, thegovernment, in some cases, has had to cut offelectricity or actually remove pumpsets. It has beensaid that only such “crisis” tactics have ledbeneficiaries to believe that the State would notsubsidize them indefinitely.
The final stage of transfer involves givingfarmers full responsibility for employing pumpoperators and for covering maintenance costs. Toprovide users an incentive to accept this, thesystems installed in Phase I are being upgradedwith brick-lined, open channel watercourses. PVCpipes are being installed in Phase II. Nonetheless,users are not eager to take over responsibility dueto high operation costs. So far, only 93 tubewellshave been handed over to users. Of the 64 pumpsinstalled in the first phase farmers did not agreeto take over 4 sets, which have, since been closed.Thirty-eight units were installed in the secondphase, twenty were handed over, ten are beinghanded over, and the rest are being rehabilitated.Twelve of the 79 tubewells installed in the thirdphase have been handed over. In practice, thecontinued presence of the BLGWP helps provide aguarantee and a subsidy.
In the first two phases of the BLGWP, siteselection was done on the basis of engineeringconsiderations alone. Phase I of the project wasinitiated without farmers’ participation of anysort. Farmers were simply advised that a deeptubewell would be installed in their field.Consequently, unlimited free water was available
to the farmers. In 1989, when the third phase wasbeing planned, the concept of participation wasintroduced. As a result, elements of farmers’participation were included in the final part of thesecond phase to the extent possible, in cases wherethe deep tubewells had not yet been installed.Phase III of the project is designed based onfarmers’ participation and development is expectedto be driven by their demand. In many parts ofthe command areas farmers express dissatisfactionwith the high cost of pumping caused by the hightariff as well as with difficulties in operationand maintenance. This makes it difficult to obtaintheir full participation.
In principle, the new demand-driven approachin the system, which comprises a denseunderground network of channels and finetargeting on demand by each user should makeoperational cost recovery easier than it was withthe MLIS. Increases in food production have takenplace in some of the BLGWP schemes. However,construction costs are high and indigenouscapacity for implementation and maintenance low.Moreover, various operational practices, such asturning tubewells on and off between delivery todifferent users, shorten pump life. Overall, it isnot clear how well the pumps will be sustainedafter the aid agency leaves the area.
Other Tubewells
Possibilities for irrigation using deep tubewellsexist in the area that may be served by the ILC.In Marchawar deep tubewell drilling started in1998. Four electrically operated pumps have beeninstalled and testing of one is ongoing. Theyare located in Amuwa, Kudsar, Rudalapur andKataiya villages.
Shallowtubewells are
common withinthe command
area of existing
surfaceirrigation
systems.

104
F R A C T U R E D I N S T I T U T I O N S A N D P H Y S I C A L I N T E R D E P E N D E N C E
Shallow tubewells in the Nepal Tarai are mostlyowned by individuals with 5 HP pumps andinstallation costs are subsidized by Nepal’sAgricultural Development Bank. According toGautam and Shrestha (1997), in Rupandehidistrict 3,777 pumps have been installed with thebank’s support. Many other private tubewells haveprobably also been installed in this section of theTarai adjacent to the Dano and the Tinau, butthe actual numbers are unknown.
A survey during the field study identified 1,345shallow tubewells. Of these, 460 tubewells arewithin the command area of the Marchawar LiftIrrigation System and 345 are in Uttar Pradesh,along the Kuda (Tinau) River between the Nepaliborder and Naugadh. The rest of the pumps arealong the region dependent on the Tinau. Clearlythese figures do not represent the actual numberof tubewells. Because they are capped, they aredifficult to count accurately. Incidentally, becausethe tail end command of the MLIS receivesinadequate water for irrigation, the number ofshallow tubewells there is widespread.
Key Issues
� In initiating the BLGWP, the institutionalculture was guided by construction andengineering, and it was solipsistic regarding thefact that the region was close to one of the longestfunctioning irrigation systems in Nepal managedby farmers themselves. Despite their increasedinteraction with farmers the level of participationby central departments is still quite remote fromgrossroots concerns.
� Management of deep tubewells requireshighly skilled manpower, availability of spare
parts, and cash expenditure. These are oftenunavailable and there is little use for unskilledlocal labour.
� Maintenance support is often unavailable andthere is competition from Indian pumpmanufacturers. Users in India get pumps undersubsidy and suppliers generally recommend pumpswith higher a HP than required. This leads tomarket distortion in Nepal.
� The farmers think that water from deeptubewells is very expensive compared to thatextracted from shallow, diesel-operated wells. Itmakes no difference to them that the deep tubewellgets water from a much deeper aquifer than do,the diesel pump operated tubewells. Farmers prefershallow tubewells because of their flexibility andlower cost. The erratic supply of electricity and thefrequent damage to parts are often mentioned asmajor problems while operating deep pumps.
� The efficiency of shallow tubewells is poor. Inthe lower Tinau region several shallow wellshave gone dry, probably due to well interference,poor siting or drilling of wells. All pumps arediesel-operated and, because diesel is often mixedwith kerosene, efficiency is lowered further. Mostwell drillers have received no training;consequently the wells are improperly drilled andpoorly maintained.
� Overall, the extent of groundwater irrigationusing shallow tubewells in the lower Tarai in Nepalis unknown, but clearly large. This could havesignificant implications for the willingness offarmers to participate in other, often morecomplex, schemes such as the MLIS or deeptubewell installations.
Issues facingBLGWP include:
� institutionalculture,
� deep tubewell
management,� erratic power
supply, and
� farmerpreferencesfor shallow
tubewells.
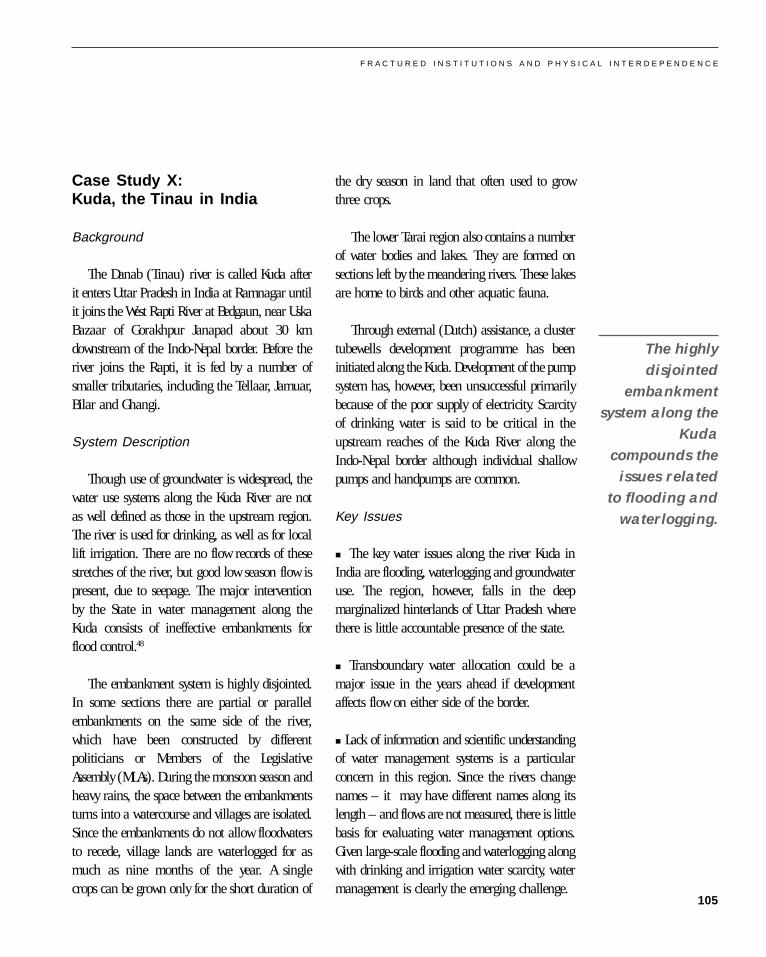
105
F R A C T U R E D I N S T I T U T I O N S A N D P H Y S I C A L I N T E R D E P E N D E N C E
Case Study X:Kuda, the Tinau in India
Background
The Danab (Tinau) river is called Kuda afterit enters Uttar Pradesh in India at Ramnagar untilit joins the West Rapti River at Bedgaun, near UskaBazaar of Gorakhpur Janapad about 30 kmdownstream of the Indo-Nepal border. Before theriver joins the Rapti, it is fed by a number ofsmaller tributaries, including the Tellaar, Jamuar,Bilar and Ghangi.
System Description
Though use of groundwater is widespread, thewater use systems along the Kuda River are notas well defined as those in the upstream region.The river is used for drinking, as well as for locallift irrigation. There are no flow records of thesestretches of the river, but good low season flow ispresent, due to seepage. The major interventionby the State in water management along theKuda consists of ineffective embankments forflood control.48
The embankment system is highly disjointed.In some sections there are partial or parallelembankments on the same side of the river,which have been constructed by differentpoliticians or Members of the LegislativeAssembly (MLAs). During the monsoon season andheavy rains, the space between the embankmentsturns into a watercourse and villages are isolated.Since the embankments do not allow floodwatersto recede, village lands are waterlogged for asmuch as nine months of the year. A singlecrops can be grown only for the short duration of
the dry season in land that often used to growthree crops.
The lower Tarai region also contains a numberof water bodies and lakes. They are formed onsections left by the meandering rivers. These lakesare home to birds and other aquatic fauna.
Through external (Dutch) assistance, a clustertubewells development programme has beeninitiated along the Kuda. Development of the pumpsystem has, however, been unsuccessful primarilybecause of the poor supply of electricity. Scarcityof drinking water is said to be critical in theupstream reaches of the Kuda River along theIndo-Nepal border although individual shallowpumps and handpumps are common.
Key Issues
� The key water issues along the river Kuda inIndia are flooding, waterlogging and groundwateruse. The region, however, falls in the deepmarginalized hinterlands of Uttar Pradesh wherethere is little accountable presence of the state.
� Transboundary water allocation could be amajor issue in the years ahead if developmentaffects flow on either side of the border.
� Lack of information and scientific understandingof water management systems is a particularconcern in this region. Since the rivers changenames – it may have different names along itslength – and flows are not measured, there is littlebasis for evaluating water management options.Given large-scale flooding and waterlogging alongwith drinking and irrigation water scarcity, watermanagement is clearly the emerging challenge.
The highlydisjointed
embankmentsystem along the
Kuda
compounds theissues related
to flooding and
waterlogging.

106
F R A C T U R E D I N S T I T U T I O N S A N D P H Y S I C A L I N T E R D E P E N D E N C E
Key Insights and Conclusions
The case of the Tinau River is that of aninterdependent physical system, in which water
management responses have evolved in afragmented and independent manner.Interdependence is caused by a combination ofhydro-geological, historical and social factors, andlinkages in terms of the actual relationships andtheir implications remain poorly understood. Theselinkages are becoming important as the scale ofwater use and economic development grows. Insome cases, specific constraints such as waterscarcity and pollution in the dry season andflooding during the monsoon are causing clearstresses. That the system is naturallyinterdependent implies institutional overlaps bothhorizontal and vertical. A schematic diagram andchart of the inter-relationship between physicalinterdependence, technological choice, and watermanagement systems is shown in Figure 9.
The story of system interdependency in theTinau starts in situations where local water usepatterns evolve in directions that ignore bothupstream dependencies and downstream effects. Itis not a new story, but it acquires increasingimportance as the scale of human actionsignificantly alters hydro-ecologic dynamics.
The core issue in the Tinau River is thatfragmented institutions which oversee a complex
and interdependent system lead tocounterproductive management interventions thatshould, with the benefit of hindsight, have beenavoidable. Throughout the Tinau, watermanagement is practiced as a dominantlyhousehold or very local activity. In the lowersections of the basin in India, embankments areconstructed to protect specific areas from floodingwith little thought given to the consequences ofembankments for other areas not similarlyprotected or to how flooding might be mitigatedby upstream management. Similarly, in upstreamareas, diversions are created and waste returnedto the stream with little thought of downstreamusers. As industrial development and urban livingaccelerates in the Nepal Tarai and in urban hillcentres such as Tansen or Madan Pokhara, theconsequences of waste disposal for water qualityand use may be particularly significant.
Conceptually, water resource and usecharacteristics along different sections of the Tinauare interlinked. Water diversions and thedevelopment of complex hill irrigation systemshave influenced flow dynamics throughout theupper basin, and may also have had an impacton the lower region. The dynamic, mobilecharacter of the river channel, where the streamexits the hills, constrains possibilities for thedevelopment of permanent diversions for irrigation
Water resourcesystems are
interdependentbutmanagement
responses aregenerallyfragmented.
� While flooding is a major concern inthe region, embankments may have brought littlebenefits to the people. During the monsoonmonths when river stages are high embankments
serve as a place of respite, but these structureshave led to large-scale land and agriculturaldegradation through waterlogging anddrainage congestion.

107
FR
AC
TU
RE
D
INS
TIT
UT
ION
S
AN
D
PH
YS
ICA
L
INT
ER
DE
PE
ND
EN
CE
Figure 9:Sources, water management systems, technology, institutions and interdependence along a schematic transect of theTinau River
�()��
���� ����! *����+
�#����
"�#��� ������ !����
������
����� �����
��+,�"��,+,!��
)���,������ ��*>��8&�*�>��'&%�!>� �?%& ��*@��'&%�!@� �?%&@��8.'&%�!�:"-5@��&-(*$5�'%&A�. �""-5>�$%%8A��&'%.��*>�*-*4�&'%.��*@� %+ �&�%@���.%�:"-5@� %'(&*�:"-5
������ �.�*��+-!8%'�'�-*@���� �+-.'@�-""('�-*@�;"--$.@��($."�$%@��!-*��*$�5�' �*�.#.'%!�&�� '.@���'%&. %$!�*��%!%*'
�%�.-*�"�.+�&+�'#@��-""('�-*@;"--$.@��*$."�$%.@��-("$%&�*$�.�*$�%B'&�+'�-*@ %+ �&�%@� �*��*��*�'(&%-:��""-+�'�-*
�%�.-*�"�.+�&+�'#@��-.'@��-""('�-*@���*7�+(''�*�@�!-*���*$�5�' �*�.#.'%!�&�� '.@��%""��*'%&:%&%*+%@-5%&%$�5�'%&�'��"%.@��&&���'�-*�!�*��%!%*'
�*(*$�'�-*@��&��*��%�+-*�%.'�-*@��'%&"-���*�@���*7�+(''�*�@��-""('�-*
��������#��
�&�*7�*��5�'%&@�(&��*>�&(&�"@��&&���'�-*@�#$&-8-5%&@���.'%�$�"('�-*
�&�*7�*��5�'%&A�(&��*>&(&�"@��&&���'�-*@���.'%$�"('�-*>��*$(.'&#
�&&���'�-*@��&�*7�*��5�'%&@�&(&�">�(&��*@�*$(.'&#@���.'%�$�"('�-*
�&&���'�-*@��&�*7�*��5�'%&A�&(&�">(&��*@��*$(.'&#@���.'%�$�"('�-*
�����������������-
����>�;;���>��;���>����><��>����>���&7%'>����>�;������
;;���>��;���>����>;������>���>���&7%'
����>�;������>����.>�����;>���>����>����>���>����� ���>����.>���
!��������� � �.#.'%!�&�?�'#�:"-5@��%.%"�8(!8@��%%8�'(�%5%""@�&(. 5--$�5%�&
��%.%"�8(!8@��"%+'&�+�8(!8@��"%+'&�+�.(&:�+%"�:'�.#.'%!@��&�?�'#�:"-5@��&%�$"%�8(!8@��%�&
��%.%"�8(!8@��"%+'&�+�8(!8@�&%�$"%�8(!8@��!��*7!%*'@��%�&
!���,�!�(�
�(��!�"����*�,�(�
�(!8@� ���@�8&�*7"%&@��&�?�'#@�&(. 5--$�5%�&
�����./������C��%8�&'!%*'�-:���'%&��(88"#��*$��%5%&��%@�����C��('5�"��-5%&��-!8�*#@�����C���.'&�+'��%?%"-8!%*'��-!!�''%%@�<���C�<�""��%��%?%"-8!%*'��-!!�''%%@�����C�� ��&� �5��(!��*���&-(*$���'%&��&-9%+'>��-��C��%8�&'!%*'�-:��&&���'�-*@�����C���'%&��.%&.D��..-+��'�-*@�����C���'�-*�"��#$&-��"%+'&�+@����;�C��*�'%$���'�-*���8�'�"��%?%"-8!%*'�;(*$@����C��&&���'�-*��%8�&'!%*'@����C��-&"$���*7@�����C��5�..��%?%"-8!%*'��-&8-&�'�-*@�����C�� �""-5�'(�%5%"";�������C�;�**�. ��*'%&*�'�-*�"��%?%"-8!%*'��..�.'�*+%>������C��%8�"���'%&��(88"#��-&8-&�'�-*>������C���'�-*�"��&&���'�-*��(88-&'��&-�&�!!%>� ����C� ��*���'%&��'-&��%���*7>;;����C�;-&!�"�;�&!%&4!�*��%$��&&���'�-*��#.'%!>��;����C��*:-&!�"�;�&!%&4!�*��%$��&&���'�-*��#.'%!
�%%8�'(�%5%"">� � �""-5�'(�%5%"">� �$5�4�-'�8(&>��������>������������!��*7!%*'.
��*.%*�5�'%&�.#.'%!> ���;�&!%&4!�*��%$�.#.'%!>���$������� � �8&�*7"%&>� ��� ��*5�'%&�'�*7.>���������#$&-8-5%&>�������('5�"�$&�*7�*��5�'%&>����������-& �4+ �''�.��*$�� ��&���8� �

108
F R A C T U R E D I N S T I T U T I O N S A N D P H Y S I C A L I N T E R D E P E N D E N C E
uses. Return flows from municipal and other usesinfluence downstream water quality. Widespreaddevelopment of groundwater through shallow wellsby private farmers influences the large-scalesurface and groundwater development initiativesby the government, necessitating seriousconsiderations of conjunctive use. Embankmentscreated in one area exacerbate flooding problemsin other areas. These sweeping types of interactionsare relatively easy to conceptualize. There is,however, no data for quantifying them and worse,no functioning institutional arrangements in place,which would provide proper overseeing of thesematters as the scale of interventions grows.Interdependency and how to address it is the singlemost important challenge facing watermanagement in the region.
From Interdependence toAction, Key ConceptsEmerging from Case Studies
Recognition of system interdependence isimportant, but the evolution of practicalmanagement responses requires conceptualapproaches that enable portions of the largerequation to be addressed as needed. From thisperspective, the management situation found inthe Tinau basin is highly fractured. In most areasstudied as part of this research, resourcedevelopment or management activities have beeninitiated with little conception of the larger systeminto which they fit. As a result, major problemsregularly emerge due to unanticipated interactions.Collection of the data required to fully characterizethe systems would be a major time-consuming andexpensive process – one unlikely to be undertakenrapidly even in the medium watersheds of SouthAsia. Focusing on key constraints within a larger
qualitative conceptualization of the system wouldallow the development of more appropriatemanagement responses and the progressiverefinement of systemic understanding. In theTinau, the insights on local water managementobtained from this exercise are as follows:
The Mosaic Nature of Sub-Systemsand Institutions
The Tinau river system can be viewed as amosaic of smaller systems and institutions – allof which interact with other systems and arepartially, but not fully, interdependent. Manymanagement issues are dominantly local (that is,bounded within a given sub-system); othersinvolve interactions at higher system levels oramong sub-systems. The distinction betweenmanagement “within” and “among” sub-systemsis critical. Cost recovery and maintenance of adrinking water or irrigation system is a “within”sub-system issue – although it may be affected byexternal factors such as the cost of alternativesupply sources. Groundwater pumping that affectssurface flows and pollution are “among” sub-system issues. The “within system” issues can beaddressed by institutions such as WUAs providedtheir capacity is strengthened throughappropriate training. The “among systems”issues require more elaborate data, disputeresolution mechanisms and levels of organizationthat extend beyond local groups of users.Institutions capable of addressing these “amongsystem” issues currently don’t exist. They will,however, be required as demand for waterincreases the scale of interventions and theimpact of uses within sub-systems extendsbeyond individual sub-system boundaries.This is, for example, likely to be a factor if
As the scale ofhuman
interventionsgrows, themanagement of
interdependentsystems willbecome the
single mostimportantchallenge facing
the region.

109
F R A C T U R E D I N S T I T U T I O N S A N D P H Y S I C A L I N T E R D E P E N D E N C E
The dynamicmosaic of
managementinstitutions
necessitates
recognition ofthe “among”and “within”
sub-systemissues.
groundwater extraction begins to affect regionalwater levels or as pollution grows.
The Dynamic Nature of Systems
The natural, institutional and use systems aredynamic, not static, and the changing nature ofdifferent components of these systems is notuniform. Surface systems, for example, have highseasonal and interannual variability. Groundwatersystems, in contrast, are much more resilientbecause the stock portion is much greater thanthe flow. The dynamic nature of institutional anduse systems is also important to emphasize – thisis where the impact of social change hasfundamental implications for traditionalinstitutions, use patterns, and so on.
Many water management approaches arepoorly adapted to the dynamic nature of systems.The extreme engineering example of this is thedefunct Butwal barrage, which was bypassed in1962 by the Tinau when it shifted course.Institutionally, the decline of traditional systemswhen democratization reduced the ability of therural elite in Marchawar to mobilize labourrepresents a similar example. Water managementapproaches are rarely designed with the dynamicnature of systems as a primary consideration.Efficiency is often a high priority but measures ofefficiency rarely reflect the opportunity costsassociated with flexibility. This may, for example,be the primary factor causing farmers to prefershallow tubewells over deep tubewells in parts ofthe BLGWP and surface irrigation commands.Individuals owning shallow wells have muchhigher flexibility and ability to meet their ownwater needs than members served by larger deepwells, even when the operation and other costs of
shallow wells are higher in relation to the volumeof water pumped.
Adaptation Versus Control
A third concept closely related to the dynamicnature of systems is that of adaptation. Manytraditional systems are adapted to variability (thatis, brushwood dams were designed for replacementafter the monsoon) while modern systems oftenreflect attempts to control variability.Embankments and the establishment of permanentirrigation structures are primary examples of this.In contrast, the development of elevated surfacesfor refuge from floods without attempting toconfine rivers to their course would represent amore adaptive approach to flood problems. Thiswould encourage drainage and the deposit ofnutrient-rich silts while still enabling a degree ofprotection for residents against flood. In a similarway, temporary dams (perhaps not brushwood, butones with an improved design) would allow riverchannels to change course without major damageto irrigation systems.
Adaptive approaches should not be viewed asbeing equivalent to “traditional” approaches.Groundwater development, for example, can beseen as an attempt to adapt by shifting dependenceto a source with low natural variability as opposedto attempting to control the variability of surfacesources such as rivers.
Key Challenges
In addition to the above concepts, the casestudies highlight a series of water managementchallenges emerging throughout theTinau basin. The insights may find equal

110
F R A C T U R E D I N S T I T U T I O N S A N D P H Y S I C A L I N T E R D E P E N D E N C E
Managementapproaches that
respond betterto variabilityare needed.
resonance on similar situations faced in themarginal regions along smaller rivers of theGanga system.
Social, Economic and TechnologicalTransition
The introduction of new technologies iscoinciding with major socioeconomic changesin the region. As a result, existing traditionalinstitutions and systems are under stress. The caseof Sorha-Chhattis Mauja is typical. The logsand tree branches needed for traditionaltemporary diversions are becoming difficultto obtain and river dynamics are changing due tocontinued extraction of boulders and sandfrom the river bed. The process is becomingcomplex because river boulders and sand are usedby private individuals as well as the localgovernment. Institutions like District DevelopmentCommittees (DDCs), for example, use incomefrom the sale of boulders as one of their sourcesof revenue.
As a result, the river water level at the intakeis becoming lower than before and, although thecommittee at Sorha-Chhattis Mauja is able tomobilize the support of all the water users’, re-erecting the intake is becoming an increasingconstraint. A permanent intake would be expensiveand, given river dynamics, faces a high risk ofbeing washed away. Equally important, traditionalsystems face difficulty mobilizing labour due tothe economic, political and social changescurrently occurring in the region. Traditionalinstitutions, as a result, need to innovate and todevelop the capacity to respond to the newchanges. Many (such as the new WUAs), however,lack the roots and social legitimacy to have an
immediate impact and are generally subject to thesame social stresses as traditional institution. Inaddition, most new institutions focus on “within”sub-system issues while some of the mostimportant issues are “among” sub-systems.
Intervention Magnitude andIntersectoral Impacts
The scale of modern interventions is muchlarger in relation to the stocks and flows withinthe natural hydrologic system than was the casewith traditional water management interventions.The spread of groundwater pumping, for example,has the potential to change basic relationshipsbetween surface and groundwater systems.Traditional lift methods didn’t. This is also thekey difference between a large cement dam and asmall brushwood one or the difference between theeffluent discharge of villages and that frommunicipalities and industries.
Because of the eradication of malaria,opening of highways, the migration fromthe hills and the expansion of industrialactivities, the population of the region hasseen a steady increase over the past thirtyyears. This in turn has increased the needfor water and has gradually created risingcompetition among the sectors. Industrial useis gradually rising and urban populations aregrowing. Irrigation is the dominant water use,with drinking water emerging as the next bigcompetitive demand. As a result, disposal ofuntreated return flow and increasing downstreampollution are emerging as major regional issues.The situation is serious in the dry months, whenthe water system is stressed to levels ofenvironmental insult.

111
F R A C T U R E D I N S T I T U T I O N S A N D P H Y S I C A L I N T E R D E P E N D E N C E
As the scale of interventions grows, there is anincreasing need for fostering the socialcapability to address “among systems” issues. Thisis compounded by the overlay of the large-scaleexternal interventions now occurring: waterprojects cutting across traditional systems,changed incentives for the members to invest inthe maintenance of traditional systems, andregional development (markets, urban growth,etc.) all change the nature of use patterns andregional populations. The ability to address“among sub-system” issues is one of the majorchallenges facing water management systems inthe region.
Uncertainty, Variability and ExtremeEvents
The natural system of the Tinau River basinexhibits uncertainty as a major characteristic.High intensity rainfall, landslides, mudslides, highsedimentation, fluctuations in river flow andbank cutting are all normal events in thebasin. These events exacerbate floods, whichlead to high loss of lives and property. Muchtraditional water management occurs inresponse to this uncertainty, and shows someability to cope with the disruptions that these eventsbring. In contrast, many of the more recentinterventions have increased the risks, and facegreater susceptibility to bank caving. It isimportant to recognize that while the surfacesystem is highly variable, the groundwater systemis far less so. A key challenge is to reduce therisks associated with the high variability of thesurface system (floods and droughts) withouteither reducing the benefits from that variability(groundwater recharge or sediment dispersal) orcreating new problems.
Poorly Understood Systems andSystem Linkages
The Tinau system as a whole is poorlyunderstood and no institutions exist that havean overall perspective or responsibility for it. As aresult, management has focused on subsystemswith little recognition of emerging “amongsystems” issues. Lack of information andunderstanding is likely to increasingly constrainthe evolution of management options as “amongsystems” impacts and tensions increase. Improvedunderstanding is central to identify the key pointswhere systemic stresses are being faced. Whiledata is important, it is, however, often unavailable.Thus something must be done even withoutdetailed information on the resource dynamicsthroughout the basin. The starting point is tooutline, at least conceptually, the inter-linkednature of water resource dynamics and use in thebasin and then focus on key constraints – in thiscase probably flooding and rising competition inthe dry season accompanied by water qualityconcerns. Limited sets of data can then be collectedto address constraints, while the more completeunderstanding of the basin required for waterresource monitoring to produce more reliableresult is gradually developed over the decades.
One question that needs to be explored furtheris: what constitutes a basin? Though an attempthas been made to analyse the Tinau as a basin,the variable character of the resource in the hillsand the Tarai, the role of return flows and theimpact on surface water and groundwater needto be appreciated to understand how responsesare made and how systems have becomestressed in recent times. In the case of the Tinau,it is logical to consider its hilly region as a unit.
New institutionslack roots and
legitimacy,while
traditional
institutions arestressed beyond
their capacity.

112
F R A C T U R E D I N S T I T U T I O N S A N D P H Y S I C A L I N T E R D E P E N D E N C E
The roles oflocal and
national levelorganizationsin water
managementneed to be re-focused.
However, because the southern lower portion ofthe basin constitutes part of different contiguousformations, (bhabar and the Tarai, for example)it may be more logical to treat this portion asoverlapping and thus with very different stresscharacteristics. These distinctions needs furtherconceptualization and research, especially wherethe concept of basin approach is considered centralfor the management of a river system as large asthe Ganga basin. The insight of this studyis that physical, social, and institutionalcomplexity grows more marked as the scalebecomes larger.
Potential Responses
Re-focus the Roles of State and LocalLevel Institutions
In Nepal, state institutions involved in watermanagement have a long history of intensepreoccupation with projects and the actualimplementation of irrigation or other water relatedactivities. This focus encourages state agencies toconcentrate on sub-systems rather than on largerissues of water management at the scale of a basinor a region. In many ways, this focus conflictswith the increasing need for institutions capableof addressing “among-systems” issues. Rather thanthe details of management at very local levels,more attention needs to be devoted to“governance” and the larger, long-term regionalvision. Local level problems need a locally rootedcapacity to solve them.
Such an approach is intrinsically tied tothe long running debate on decentralizationbeing conducted both in Nepal and India. If
local units of governance such as municipalitiesand district or village units (VDCs in Nepal andpanchayati raj institutions in India) were moreempowered to manage the resources within theirlocales, immediate concerns could be betteraddressed. In this situation, local units couldconcern themselves with the conceptualization ofmeaningful projects, while higher units suchas departments and ministries at the centrecould focus on issues of governance, regulationand adjudication of disputes. Currently thesituation is reversed: the central governmentfocuses on donor-funded projects, while the localpeople their representatives and local governmentare left to adjust to and ameliorate the unintendedaftermath of these projects, which tend todemonstrate top-down characteristics.
State and National Level Roles InWater Management
What might be the practical role of stateand national level institutions in a reformed watersector? Institutional arrangements are needed tounderstand and resolve potential disputes betweensub-systems as they emerge. They could include:
1. Information/understanding/auditing: A largersystemic perspective is required in order toidentify when major changes within sub-systemsare likely to have major impacts on othersub-systems. Institutions need to have theoverall conceptual understanding of the systemiclinkages among the various management optionsand the ability to guide the development of theinformation base essential for more detailedunderstanding. Enhanced local capacity shouldprovide independent auditing of watermanagement options.
113
F R A C T U R E D I N S T I T U T I O N S A N D P H Y S I C A L I N T E R D E P E N D E N C E
2. Arbitration/dispute resolution capabilities:
Institutions capable of arbitrating disputesamong sub-systems (effect of urban or industrialpollution on agricultural users) are needed.
3. Enforcement: Institutions that are capable ofenforcing management decision are needed as“among system” issues evolve into major disputes.
Decentralized Management for Sub-systems
Many management challenges are within sub-systems and can be logically resolved at thislevel. This is where “local” management initiativesare an increasingly important counterpart (ratherthan alternative) to the proposed role for state andnational level institutions. In some cases,decentralization is already occurring, but it needsto have greater formal recognition and authority.The primary move toward decentralizedmanagement by the state has been the array ofrecent initiatives to turn over completed schemesto farmers’ groups for management and allocationof water. The new Policy on Irrigation (1992)provides a framework for the turnover of surfaceas well as of groundwater irrigation schemes tousers’ groups for operation and arrangement.
Two issues are already emerging as lessonsfrom these initial turnover efforts. First, since theinitial choice of technology and designwere imposed by external agencies, they
rarely reflect local needs or operationalconsiderations. Second, to overcome limitations,intense support for institution buildingthrough collective action is necessary. Theinitiatives of system turnover have tobe sensitive to the new forms of stress that areintroduced, by such factors as urbanization,education and commoditized labour.
Focus on Adaptive Technologies
Water management option that usesurface water sources should respond to thevariability by resorting to flexible diversion designs.A good engineer could develop low cost,“temporary” diversions that require less labour andmaterial than the brushwood structures. Muchcould be learned from the sayal (flood irrigation)systems of the Middle East that “peel off” bits ofthe high flows for irrigation and recharge. Butthe extreme nature of the peak flood in theTinau calls for better adaptation to physicalvariability. Conjunctive water managementcould also be useful. One could, for example,develop gravel pits in the bhabar away fromthe stream and use a partial water diversionstructure to channel peak flows into them forrecharge during the monsoon. If done properly,the resulting deposition of sand could be minedduring the dry season. This could reduce normalflood peaks, reduce the mining of the river bed,and increase dry season base flows plusgroundwater availability.
Managementoption need to
better respondto variability.
Conclusion
Even though a small river, the physical andsocial intricacy of water use and management
systems in the Tinau is extraordinary. Several water
management initiatives, some by the state andothers by local units of governance or communitiesthemselves, had been taken along its length

114
F R A C T U R E D I N S T I T U T I O N S A N D P H Y S I C A L I N T E R D E P E N D E N C E
independently of each other. With theintensification of urbanization and marketagriculture, the level of water use has increasedand is forcing these systems to take interest in theactivities of others to ensure survival of their ownwater use patterns.
With the emergence of stress points within andamong systems, the key to meeting futurechallenges to management in the Tinau basin liesin effecting operational responses in three differentstyles – the hierarchic, the individualistic and theegalitarian along a scale that ranges from thecapital city to the rural hamlets. While thehierarchic style of management is found at thetop with the state agencies as well as at the bottomamong larger, and traditional farmer-managedirrigation systems, the issue facing them is that ofmore effective decentralization, monitoringprocedures including project financing andimplementation. The top scale state organs likethe Department of Irrigation will need to relinquishconstruction as well as operation and maintenanceactivities to bodies at the lower scale closer to thefarmers. Governments need to focus on developingbetter governance functions such as adjudicationamong systems and promotion of scientific studiesthat help this process.
The individualistic style of management isgrowing rapidly within the Tinau, from sprinkler-using vegetable farmers of Madan Pokhara tobullock cart-driven diesel pumps for tubewellsin the Tarai. This management style is conduciveto market measures and is capable of benefitingfrom its innovation and efficiency, but israther notorious for a short-term perspectivethat is oblivious of environmental or fairness
considerations. It is a style appropriate at thescale of the household or individual farmersthat cannot be banned to benefit hierarchicinterests but needs to be given space within aframework of adjudicatory regulations, especiallyif management options are to benefit fromits dynamism.
Besides the dualism of bureaucratic socialismand individualistic market liberalism is a thirdmanagement style of egalitarian voluntarismfound from villages to the national capital. In thetraditional systems, some of it is found in thesmaller farmer-managed irrigation schemes, whilein the urban context this is the style adopted bymany citizen groups and community-basedorganizations, including the activist-inclinedintelligentsia. Market expansion and stateinterventions are crowding this style out of thetraditional system, a style that owes its existenceto failure of the other two styles in consideringequity and long-term socio-environmental effectsof their actions. It is making a comeback throughnational and district organizations of villageheadmen as well as water users’ associations.
The systems of water management along theTinau have many surprises to cope with. Theyrange from natural events such as droughts,cloudbursts and floods to disruptive interventionsby state and municipality projects as well as themarket. Pollution, sedimentation and shifting ofrivers, local maintenance incapacity, land rightsand tenancy conflicts, high cost of electricity andfuel, and many other issues keep cropping up atinopportune times to stress these systems. Whiledecisions have to be made by system managersunder conditions of uncertainty and imperfect
Pluralisticapproaches
allowing forcesofentrepreneurial
innovations,egalitariancaution and
governmentalregulation theirdue
institutionalparticipationmay avoid
many of thepitfallsencountered in
the past.

115
F R A C T U R E D I N S T I T U T I O N S A N D P H Y S I C A L I N T E R D E P E N D E N C E
knowledge, the role of cautionary activists servingas social auditors is crucial to ensure thateconomic and environmental equity issues areplaced on the agenda. An egalitarian role needsto be played by research establishments anduniversities so that scientific analysis can ensureboth economic efficiency and social justice.
While a hierarchic response to theemerging stresses may be to declare a “basin-wideauthority” to manage water issues of the Tinau,an alternative pluralistic approach that gives space
to all three management styles with varyingobligations at varying scales may be a lessrigid and more stable arrangement. Allowing forcesof entrepreneurial innovation, egalitariancaution and governmental regulation theirdue institutional participation may avoidthe pitfalls of the past and provide more balancedinterventions in an increasingly uncertainand stressful future.49 The lessons are relevantnot just for the Tinau River and water usesystems depend on it, but for water managementin general.
Cautionary
activists shouldserve as social
auditors to
ensure thatenvironmental,
economic and
equity issuesare central on
the agenda.

116
F R A C T U R E D I N S T I T U T I O N S A N D P H Y S I C A L I N T E R D E P E N D E N C E
1 For discussions on the complexity of Himalaya-Ganga see Gyawali and Dixit (1994).
2 The concept of style and scale of management is based on Thompson (1997).
3 In 1998 August, after prolonged rainfall, a slope of the highly saturated Churia range came down as a mudslide thataffected more than 100 houses in Butwal municipality. Because the local residents saw the incipient slide, they did not stayindoors during the night of the slide. There were, as a result, few deaths. The 1998 monsoon also saw devastating floods inthe regions adjoining the Tinau. For details on the devastation see Special Issue of Seminar (1999).
4 The peak sediment concentration is also estimated to range between 6,000 and 12,000 ppm by Delft (1988).
5 Uprety (1989).
6 Ibid.
7 Nippon Koei (1978).
8 The calculation is based on the assumption that the demand for water is 12,000 m3/year/ha. The details, however, are notavailable. See Delft (1988)
9 The outflow calculation is only approximate, as it is based on estimates of gradients and transmissivities, while the overallauthenticity and accuracy needs to be revalidated. See Uprety (1989). For a discussion on recharge along the bhabar seeDuba (1982).
10 The four conventional land categories are (in descending order of quality of land): abbal, doyem, sim and chahar.
11 The project plaque on a building close to the abandoned barrage at Butwal states that the irrigation command area is64,000 acres.
12 Information from Tazmul Musalman, Chairman of the Marchawar Water User’s Association as well as other elders. Theauthors walked with the chairman along the remnants of the old canal starting from the “people-built” Gurbania weir.
13 According to local farmers, they repaired the old dam once, but the social disruption begun by the K. I. Singh revolt of1951 was supplemented by the physical disruption wrought by the canals from the Butwal barrage. Marchawar degeneratedinto a “dacoit infested area” for the next two decades. Oral history during the interregnum needs to be explored to documentthe nature of the social change.
14 Of the 60+ ethnicities and caste groups in Nepal, summarized by Gurung based on the 1991 population census (SeeGurung, 1998 and Salter and Gurung, 1996), at least a third of them are found in the Tinau basin. Of these, the traditionallydominant groups are the Bahun (hill brahmin), Chhetri, Magar, Gurung, Newar, and Damai-Kami in the hills, and Tharu,Yadav, Muslim, Kewat and Lodh ethnicities in the Tarai. The linguistic composition of Palpa is Nepali – 63%, Magar –32%, Newari – 3%, with Gurung, Tharu, Maithili, Rai, Sherpa, Bhojpuri, Awadi, Tamang etc. forming the rest. In Rupandehithe percentage distribution is as follows: Bhojpuri – 43%; Awadhi – 29%; Nepali – 18%; Tharu – 3%; and Newari – 1%(NRA, 1982).
15 Palpa is located on the trade route that links the Indian heartland with Mustang Bhot. The route generally follows theKali Gandaki River, which originates in Mustang, and is referred to as the Gandaki growth axis.
16 This was during the governership of General Pratap Sumsher. That Palpa was relatively independent even from Kathmanduis seen from the fact that during Nepal’s 1950 revolution, which ousted the Rana oligarchy, the Nepali Congress planned tofly late King Tribhuban to Palpa in a helicopter and then to India. See Koirala (1998).
Notes

117
F R A C T U R E D I N S T I T U T I O N S A N D P H Y S I C A L I N T E R D E P E N D E N C E
17 According to the census, in 1971, Tansen had a population of 6,434. By 1979 the population had increased to 13,500.According to municipality sources, in 1997 Tansen had a population of 14,289 (Tansen Municipality, 1997).
18 See Nippon Koei (1978).
19 In 1996/1997, operation and maintenance costs were Rs 8.5 million, while revenue was Rs 0.52 million (NESS, 1998).
20 This valley floor of the upper Tinau with a total area of 36.36 km2 includes the following wards of the VDCs mentioned:Devinagar # 3, 5; Jhadewa # 3, 4, 5; Humin # 2, 3, 4, 5, 6, 7; Chidipani # 3, 7, 6, 8, 9; Rupse # 1, 2, 3, 4, 5, 6, 7, 8, 9;Kaseni # 1, 2 Similarly, the Upper Majhar khola with a total area of 25.96 km2 includes: Pokharathok # 1, 2, 3, 4, 5, 6,7, 8, 9; Nayar # 1, 2, 3, 9; Chappani # 1; Chirtung Dhara # 1, 2, 3, 4, 5, 6, 7, 8; and Tansen Municipality #1, 2, 3, 8, 10,15. The Majhar khola occupies an area of 34.09 km2 of Madi phaant and includes the following: Kaseni # 3, 5, 6, 7, 9;Madan Pokhara # 1, 2, 3, 4, 6, 7, 8, 9, Tansen Municipality # 9, 14; Chirtung Dhara # 9.
21 Palpa became a part of the Gorkhali empire only in 1806 AD. Sen kings ruled Palpa from the 14th century until theGorkhali conquest.
22 This phenomenon, wherein a landslide temporarily dams a river and then bursts, is known as bishyari in Nepali. Theselandslips occur with depths much greater than the rootzones of trees, and occur even in very well forested slopes. For detailson bishyari on the Tinau see Sharma (1988).
23 This is a special innovation of the Palpa Development Program that is becoming increasingly popular in the hills of Nepal.It envisages building hill roads in a manner that is different from the conventional practice of using heavy equipment,earth-cutting and dumping down hillslopes. Green roads first begin by opening a narrow track and initiating bioengineeringmeasures, and widening the track over a four-year period allowing slope stabilization through incremental means.
24 United Mission Nepal (UMN) is an international federation of Christian missionary groups.
25 There are differences in the population figure. According to the publication by Butwal Municipality, the population of thetown was 52,201 in 1994 and 44,271 in 1992. (BM, 1997).
26 One of the organizations of the UMN was a Norwegian mission, which was able to arrange funding for the Tinau HydropowerProject partly through donations of second-hand electro-mechanical equipment and partly in cash from the NorwegianAgency for Development (NORAD). Some funding also came from His Majesty’s Government, Nepal (HMG/N) and as a loanfrom the Nepal Industrial Development Corporation (NIDC).
27 This HMG/N department was the previous form of today’s Electricity Development Centre (EDC). This government department,under the Ministry of Water Resources, was merged with the Nepal Electricity Corporation (NEC), a wholly government-owned parastatal, in 1985 to form the Nepal Electricity Authority (NEA). This merger was a precondition of the multilaterallending agencies for their approval of a loan to construct the 69 MW Marsyangdi Hydroelectric Project. Subsequently, in1995, the staff of the erstwhile Electricity Department, who had had themselves transferred to the Ministry of Water Resourcesas HMG officers rather than remain employees of a parastatal, were able to bring about a decision effectively resurrectingthe Electricity Department under a new name. For a discussion see (Gyawali, 1997).
28 In the industrial policy made by HMG between 1972 and 1980, there was a provision wherein the government couldnationalize electric power generation and supply. The NIDC management at that time decided to take over the BagheswariElectric Company (BEC) and eventually hand it over to the NEC. The management of the BEC, which was started by thelanded gentry of west Nepal after the land reforms of 1964 made land ownership a risky proposition, was not competentenough to manage the power generation and supply business. There were serious concerns about the technical capabilityand the managerial skills of the BEC, with respect to providing uninterrupted electricity supply. There were complaints

118
F R A C T U R E D I N S T I T U T I O N S A N D P H Y S I C A L I N T E R D E P E N D E N C E
against the BEC by significant sections of the business community of Nepalgunj, which viewed erratic power supply as abottleneck for industrialization efforts in and around Nepalgunj. However, the take-over action should not have been pursuedas the only appropriate solution: helping the company to acquire technical and managerial skill or, in the worst of cases,allowing other private parties to take it over, would have been better. Taking over a private company and handing it overto a government company was not the best of options, as the track record of the state utility suggests. As hindsight shows,this action did not solve the problem, but covered it up instead. (Personal communication from the then loan officer in theNIDC who dealt with the subject in the mid-1970s).
29 While the Tinau Hydroelectric Project was being constructed, indeed when the second phase had been completed and thethird was underway, the World Bank was engaged in putting together a loan for the Kulekhani Hydroelectric Project forHMG. Its “staff appraisal report” acknowledges the existence of BPC, but dismisses it, and the Eastern Electricity Corporation(EEC – subsequently merged by the government into NEC) in one short paragraph; “EEC, established in October 1974, hassince taken over two private entities, the Morang Hydro Electric Supply company and the Dharan Electricity Corporation. Itis owned up to 25% by NEC and the remainder by HMG. The Butwal Power Company is entirely a private company”. Thistacit approval by powerful donors of nationalization is believed to have spurred government officials to discourage privatesector involvement in electricity generation. (See World Bank, 1979). Even as late as 1987, when the Arun-3 HydroelectricProject’s planning and promotion were in full swing, the NEA and the Canadian donors helping it prepare the feasibilityreport were reluctant to admit the existence of the BPC or of projects such as the Tinau Hydropower Plant. In a crucialstudy that justified Arun-3, the Tinau Plant is not shown or acknowledged in the system diagram but dismissed as smallhydro. See (CIWEC and NEA, 1987).
30 In Nepal, one of the legal provisions for the registration of non-governmental organizations (Nepali or international) isthat their assets revert to HMG if they cease to function. The principle at work behind this provision is that such assets havebeen created as part of a public trust, which is not taxed. Hence, once the entity that is holding that public trust no longerfunctions, its assets ought to revert to another “public trustee” such as the government. However, in this case both the UMNand the BPC continue to function.
31 Mr. Odd Hoftun, the Norwegian electrical engineer of UMN who had the prime responsibility to establish the Tinau Plant,has worked in Nepal for over forty years and was honoured in 1996 by the Society of Electrical Engineers, Nepal, for hisachievements. He provided comments on the above text and described the nationalization in the following words overemail: “The only reason for handing over Tinau and the Butwal distribution system was the general feeling at that timethat power generation and distribution belonged to the public sector. In fact, HMG wanted to nationalize not only the plant,but also the company as such because a private party involved in power generation or distribution was seen as an irregularityand an irritation. It was only after a prolonged fight that we succeeded in keeping BPC afloat as an instrument for possiblefuture cooperation between UMN and HMG. In the case of Andhikhola it was laid down more or less clearly in the projectdocument between UMN and HMG that BPC should own and operate the company in the future. But HMG then demandedthat UMN hand over the corresponding shares in BPC. Jhimruk was a different case: BPC built this plant as a contractor forHMG. For practical reasons (tax etc.) NORAD funds were channelled through UMN as equity investment, and UMN maintaineda majority shares in BPC during the construction and trial operation period. The project agreement stated clearly that theproject on completion should be handed over to HMG by BPC without compensation. This was done, but HMG decided toturn the project back to BPC as equity investment in kind, resulting in HMG getting 97 per cent of the shares in BPC. Thiswas done against strong protests from UMN, who suggested that UMN’s shares should rather be sold to private investorsright away, with the proceeds reverting to HMG. In light of the complications involved in the ongoing privatization process,I guess many will now agree that HMG should have listened to this suggestion.”
32 For details also see Yoder (1994) and Stevens and Schiller (1993).
33 The name of the programme has been changed subsequently to National Irrigation Sector Programme (NISP).
34 See Reidinger and Gautam (1992) and Bhattarai (1994) for discussions on implementation issues related with the procedureand challenges of this method.
35 UNCDF (1995).

119
F R A C T U R E D I N S T I T U T I O N S A N D P H Y S I C A L I N T E R D E P E N D E N C E
36 Like most voluntary migrants, the hill people are more open to innovation and aware of modern opportunities beyond theirlocal, traditional, and social orbit than indigenous groups, who tend to be more locked into their culture and history(UNCDF, 1995).
37 The farmer-managed system from the Gurbania weir was long in operation when the Indian aided Butwal barrage systemwas built without acknowledging its existence. The old system enjoyed the same legitimacy as other farmer-managed schemes,such as Khadwa-Motipur and Sorha-Chhattis systems.
38 Such irrigation institutions may be referred to as hydraulically dispotic, a term used by Karl Wittfogel to describe centralizedand authoritarian arrangements that uphold a particular type of hydraulic intervention (Wittfogel, 1957).
39 There is no record of how this decision was taken, either with HMG’s Irrigation Department or with the Indian Embassy inKathmandu. Interviews by the authors with old timers, including the Shuklas, hint at the possible hypothesis that it wasinstigated by the powerful landlords, who saw the permanent dam at Butwal as a means of bypassing the need to mobilizeunruly post-democracy masses for the annual dam construction work at Gurbania.
40 Personal communication with the Chairman of the Marchawar Water Users’ Association.41 According to local history the project had its genesis in the visit to Marchawar by HM the King in 1977. The locals appraised
the monarch of the declining social and economic condition and requested an irrigation system. The conceptualization ofthe Lift Irrigation System followed. It is also argued by some that the MLIS grew out of the political pressure of the localmember of the Rastriya Panchayat.
42 Evaluation in 1987 of Phase I of the project recommended initiating a pilot extension in a smaller area. In 1989 the FAOProject Formulation Mission revised the command area to 5,600 ha for Phase II. Net command areas of 3,685 ha in thelower command area and 1,915 ha in the area to be served by the Upper Link Canal were proposed for development. Asubsequent reconfirmation of the decision was made to further constrain the command area to be developed under PhaseII of MLIP to 2,815 ha. The detailed historical sequence of events to the present according to UNCDF (1995) is as follows:1989 November - Project Agreement signed for Phase II1990 December - MoU on Phase II to HMGN MoF1991 April - Project Documents for Phase II to HMGN for DoI
- Pumps from Phase I begin operation1992 June - Contract for Phase II from UNOPS to Euroconsult
- First season’s irrigation of Hardi Primary Canal1993 - Construction begins Phase II: Total 616 ha1994 - Total 1,351 ha1995 July - Total 2,015 ha1996 - Est 2,815 ha
43 ibid. Also see Euro Consult (1995).44 The private sector was represented by a consortium of East Consult from Nepal, Euroconsult and Delft Hydraulics.45 The share borne by the DOI is slated to decrease to 80%, 70% and 60% in the coming years. However, the WUA says it is
unable to raise and collect the water fees needed to make this possible, more after the 25% electricity tariff increase ofNovember/December 1999.
46 The area expected to be irrigated was 7,680 ha (first phase), 4,600 (second phase), and 8,600 ha (third phase). The revisedtarget of the third phase is 9,249 ha, with which the total area expected to irrigated will be 21,529 ha. See Olin (1992) andTiwari (1997) for discussions on BLGWP.
47 See DOI (1998).
48 Activists campaigns describe how politicians promise that if they are elected, they will build embankments and there will beno need to pay land tax, water tax, or electricity charges. Ibid Seminar (1999).
49 See Gyawali and Dixit (1997).

120
F R A C T U R E D I N S T I T U T I O N S A N D P H Y S I C A L I N T E R D E P E N D E N C E
Bibliography
ADB (1997). Second Water Utilities Data Book, Asian and Pacific Region, (ed) McIntosh C. A. and Y. E. Ceaser, AsianDevelopment Bank, Manila.
Bhattarai, D. (1994). Issues of Irrigation management in Nepal, Water Nepal Vol 4 No 1, pp 132-137.
Butwal Municipality (1997). Butwal Smarika, Butwal Municipality, Butwal.
CIWEC and NEA (1987). Least Cost Generation Expansion Plan 1987, Report No. PD/SP/431124/3-3 of CanadianInternational Water and Energy Consultants (CIWEC) and NEA’s System Planning Department.
Delft Hydraulics (1988). Water Intake Design Review, Draft Final Review, United Nations Development Programme officefor Project Execution.
Department of Hydrology and Meteorology, Climatological Records of Nepal.
Department of Soil Conservation and Watershed Management, Meteorological Data of Palpa from 1979 to 1991.
DOI (1998). Official Diary, Department of Irrigation, Kathmandu.
Duba, D. (1982). Groundwater Resources in the Tarai of Nepal.
Euro Consult (1995). Marcharwar Lift Irrigation Project Present Status Report, Euro Consult, and East Consult/DelftHydraulics, UNDP/HMG.
Gautam S. and P. B. Shrestha, (1997). Technological Constraints to the Optimum Utilization and Expansion ofGroundwater Irrigation in Nepal Tarai, Research Report Series No 38, Winrock International, December, Kathmandu.
Gurung, H. (1998). Nepal – Social Demography and Expressions, New Era, Kathmandu.
Gurung, H. and J. Salter (1996). Faces of Nepal, Himal Books, Kathmandu.
Gyawali, D. (1997). Foreign Aid and the Erosion of Local Institutions: An Autopsy of Arun-3 from Inception to Abortion inGlobalization and the South (ed) Caroline T. and W., Peter, Globalization and the south Macmillan Ltd. London.
Gyawali, D. and A. Dixit (1994). The Himalaya Ganga - Contending with Interlinkages in a Complex System, Water NepalVol 1 4 No 1 pp 1-6.
Gyawali, D. and A. Dixit, (1997). How Distant is Nepali Science from Nepali Society? Lessons from the 1997 Tsho RolpaGLOF Panic, Water Nepal vol. 5 no. 2, Kathmandu.
Hedeselskabet (1987). Marchawar Irrigation Project, Report on Hydrological Investigations.
Hedeselskabet (1982). Marchawar Irrigation Project, Report on assistance in final design and inspection of construction.
Hyundai and Cemat (1996). Final Design Report Butwal, Urban Water Supply and Sanitation Rehabilitation Project ForOutside the Valley Towns, IDA and HMG.
INFRAS and Interdisciplinary Analysts (1993). Rural Urban Interlinkages: A Case Study Based on Nepalese-SwissDevelopment Experience, Interdisciplinary Consulting Group for national Resource and Infrastructure Management, INFRASZurich and Interdisciplinary Analysts (IDA), Kathmandu.
NEA (1997). Integrated Nepal Power System: Prospects and Retrospect’s Fiscal Year 2053/54 (July 16, 1996 – July 15,1997), Load Dispatching Centre, System Control Division, Nepal Electricity Authority, Kathmandu.

121
F R A C T U R E D I N S T I T U T I O N S A N D P H Y S I C A L I N T E R D E P E N D E N C E
Koirala, B.P. (1998). Atmabritanta, Jagadamba Press, Kathmandu.
NESS (1998): Final Report For Study of Rain Water Harvesting In Tansen Palpa, Nepal Environmental and ScientificServices (P) Ltd., Kathmandu.
Nippon Koei (1978). Master Plan for Tansen Water Supply and Sewerage, Department of Water Supply and Sewerage, HMG,Ministry of Water and Power, Tokyo, Japan.
NRA (1982). Nepal District Profile, National Research Associates, Kathmandu.
Olin, M. (1992). The Sustainability of Groundwater Farmer Managed Irrigation Systems, Paper No 47.
Proctor and Redfern (1986). Water and Sanitation Sector Study, Vol 1 Main Report, HMG Nepal, UNDP, Nep/79/032.
Reidinger, R. and U. Gautam (1992). Promoting Private Irrigation Development: The Irrigation sector ProgrammeExperience in Nepal, Proceeding Water Forum, 1992 Irrigation and Drainage Session, EE, HY, IR WRDW/ASCE.
Seminar (1999). Flood, Malavika Singh, New Delhi.
Sharma, C. K. (1988). Natural Hazards and Man Made Impacts in the Nepal Himalaya, Mrs. Pushpa Sharma, Bishalnagar,Kathmandu.
Stevens D. and E. Schiller (1993). The Performance of the Sorha Mauja Farmer-Managed Irrigation System in the Tarai ofNepal, Water Nepal, Vol. 3 No. 2-3, Kathmandu.
Tansen Municipality (1997). Tansen Water Supply Distribution Network and Sewerage System Rehabilitation, Final Report.
Thompson, M. (1997). Security and Solidarity, Anti Reductionist Framework for Thinking about the Relationship betweenus and the Rest of Nature, Report No 9720, Norwegian Research Centre in Organization and Management.
Thomson, M., M. Warburton and T. Hatley (1986). Uncertainty on Himalayan Scale, Ethnographica, London.
Tillson, D. (1985). Hydro-geological Technical Assistance to the Agriculture Development Bank Nepal, ADB-UNDP.
Tiwari, P. N. (1997). Management Transfer of Deep Tubewell Irrigation System to Water Users Groups, A case ofBhairahawa Lumbini Groundwater Project Rupandehi, Nepal.
UNCDF, (1987). Evaluation Report, Marchawar Lift Irrigation Nep (78/CO4)
UNCDF, (1995). Marchawar Lift Irrigation Project, Phase II (1989-1995) External Review Main Report, Nep/87/CO4,Development and Anthropology, Oxford.
Uprety S. R. (1989). Shallow Groundwater Investigations in the Tarai Rupandehi District, UNDP, Project NEP/86/025.
WECS (1987). Erosion and Sedimentation in the Nepal Himalaya: An Assessment of River Process HMG, MWR.
World Bank (1979). Appraisal of the Kulekhani Hydroelectric Project, Report No. 833a-NEP, Power Division, South AsiaProjects Department, World Bank, Washington D.C.
Wittfogel, K. (1957). Oriental Despotism, New Haven, Connecticut, Yale University Press.
Yoder R. (1994). Organization and Management by Farmers in the Chhattis Mauja Irrigation System, Nepal, IIMI,Colombo.

C H A P T E R 3
Conflicts over theInvisible Resource in Tamil Nadu
Is there a way out?
S. Janakarajan
Supported by K. Sivasubramaniyan, G. Jothi

124
C O N F L I C T S O V E R T H E I N V I S I B L E R E S O U R C E
���������
������
�����������
�������
��������
������
������������
����
������
��� ���
������������������
�����
�������������
���������
�������
��������
��������� ������
���
�����
��� ��
�����������
��������������
������
�����������
This study analyses groundwater conditions intwo river basins in Tamil Nadu and
constraints to conservation of the resource. Thestudy focuses on competition issues as one of thekey factors that local management must addressif communities are to develop mechanisms forconserving water and responding to scarcity. Thepurpose of this paper is to examine the natureand the sources of conflict in groundwater use inTamil Nadu and their implications for both the
Purpose and Objectives
Figure 1:Tamil Nadu basin location map.
resource base and different sections of the ruraland urban population. Constraints to waterconservation due to competition emerge both fromwithin village society and from external pressure.They are caused by the division of wells as landownership becomes fragmented, competitivedeepening of wells, unequal access to resources,and groundwater pollution due to the dischargeof industrial effluents.
The study is based primarily on officialpublications, information gathered in 1997 and1998 during a rapid field survey of villages in thePalar River basin and along four tributaries of theCauvery River (Map 1), and on previous studiesin the state. Structurally, the paper is divided intofour parts: The first two sections discuss the conflictthat occurs within rural areas and then theconflicts that arise out of the increasing industrial/urban needs for groundwater. The next sectionoutlines institutional and technological responsesarising out of the conflicts. Issues are summarizedand policy implications are presented in the lastsection.
Documentation and analysis of groundwaterconflicts has generated a number of insights. Inparticular it has highlighted the extent of scarcitycreated by competitive deepening of wells andpollution of groundwater via discharge ofindustrial effluent. While scarcity in the formercase is reversible, the damage caused togroundwater and the resulting scarcity conditionscaused by pollution are permanent. One of the keyissues for further research is to analyse anddocument both the causes of, and responses to,groundwater scarcity.
Groundwaterscarcity is amajor
constraint inTamil Nadu.
�N

C O N F L I C T S O V E R T H E I N V I S I B L E R E S O U R C E
125������������
��� � �
� ��!���������"
�����������!������ �����"
��� ������ ��
�������
� ������
�� ��
��� ���� �����������
��� ������ �
�������������
������������ �����������������#� �
���� ��
����� ����������
�������������
��������� �� ������
�������
������������
��������
����� � �
������
�������
�����������
���������
������
��������������
�����������Figure 2:Administrative map of Tamil Nadu.
Conflicts over the use of water have a longhistory. River courses are not constrained by
administrative, ethnic or national boundaries andthe impacts of upstream use fall upon downstreampopulations. As a result, disputes arise betweengroups and regions. Recently, groundwater haseven become a source of conflict. This issue hasattracted considerable attention from policy makersin India because surface water sources areapproaching full utilizations and groundwater iswidely perceived as the last major water resourcethat can be tapped to meet growing waterdemands. Tamil Nadu is among the mostvulnerable states to water scarcity. While the statehas 7 per cent of India’s total population and 4per cent of its land area, it possesses only 3 percent of its water resources. Of the 1,261 TMC(thousand million cubic feet) of surface wateravailable annually in Tamil Nadu, about 92% isutilized for irrigation, drinking and industrialpurposes. Agriculture is by far the largest user,consuming approximately 1,050 TMC forirrigation. The remaining 105 TMC are used fordrinking and industrial purposes. Groundwaterextraction is also high. Approximately 1.5 millionwells extract 425 TMC annually.
Water demand throughout Tamil Nadu hasbeen increasing steadily due to population growthand associated increases in demand for food grainscombined with economic expansion. Introductionof the “green revolution” package of agriculturaltechnologies (high yielding crop varieties,chemical fertilizers, pesticides and energizedpumping technologies) along with growing urbanwater demand for both industrial and domesticpurposes have had a particular impact on
groundwater. Much of Tamil Nadu is underlainby hard rock formations with little water storagecapacity (Figure 3). As in many other hard- rock,low rainfall regions (which constitute most of thearid and semi-arid zones of India), water tableshave been receding progressively as a result ofunregulated groundwater extraction. In manycases this has also caused the decline of traditionalwater sources such as tanks and baseflow diversionchannels (locally known as springs).
Groundwater Conflicts
Water demandhas increased
due to populationgrowth,
economic
expansion andintroduction of
green revolution
technology.
�N

126
C O N F L I C T S O V E R T H E I N V I S I B L E R E S O U R C E
�������
��������
������
�� �
��������
��� ��
��� ��
�$����%�����$�����%�$���&%��$���
�&&��������$����
�'��������$����
���($�)*����
��������������������
���������
������
�����������
��������
���
Figure 3:Geological map of Tamil Nadu.
As competing demands for groundwaterhave grown in rural and urban areas, conflictinginterests have emerged between these two majorsets of users. Competition and conflict are not,however, just an urban-rural phenomenon butare also emerging within rural areas betweengroups of farmers and the owners of adjacent wells.Competition is a root cause of environmentaldegradation. Water table and stream flow declines,the drying up of traditional surface water bodiessuch as tanks and springs, and pollution byindustrial effluents of surface water, groundwaterand agricultural lands are all related tocompetition. Beyond competition, these factorshave become both direct and indirect sourcesof conflict.
In India the right to construct a well and extractgroundwater is attached to land ownership. As
in the case of any other property, the owner ofland with a well has a bundle of rights such asthe freedom to enjoy, to sell, exclusivity andtransferability. These rights over land andgroundwater - the two most important productiveresources in agriculture - confer immense powerto individuals. The direct consequence is thatgroundwater is exploited only by landowners. Thelandless section of the population is excluded fromaccess to groundwater, except where it has beendeveloped for domestic uses through public wells.Even among landowners, access to groundwaterdepends on hydrologic characteristics(groundwater is not available in all locations). It
also depends on wealth. A landowner must havesufficient financial or other resources to be ableto drill or dig a well in order to benefit fromgroundwater. For this reason, many resource-poorfarmers are also excluded from access togroundwater. In addition, exclusion often occursprogressively as water levels decline through aprocess of competitive well deepening. Groups ofwell owners continuously deepen their wells inresponse to deepening by their neighbours, andassociated water level declines. Only those whoare able to afford the cost of continuous deepening(and the lucky few who strike high-yieldingfracture zones that are unaffected by general waterlevel declines) are able to maintain their accessto groundwater. Inequality in access to this critical
Competitionand conflicts
are emergingbetween groupsof farmers.
�N
Conflicts in the Use of Groundwater WithinRural Areas

C O N F L I C T S O V E R T H E I N V I S I B L E R E S O U R C E
127
productive resource, and the progressive exclusionof many farmers in the process of competitive welldeepening, is a major source of conflict.
In many ways, conflict over groundwater is thereflection of ambiguous property rights.Landowners have the right to construct a well andextract groundwater – but they don’t actually ownthe water and aren’t able to conserve it for futureuse. The right to groundwater is a right of captureenjoyed by the well owners. The ambiguous natureof property rights has resulted in a number offorms of competition including:
(a) fragmentation of wells into different sharesas land and wells are divided through inheritanceand the emerging conflicts between those holdingshares in the same well;
(b) competitive deepening of wells and theemerging conflict between well owners who sharea common aquifer;
(c) trading in groundwater and the emergingconflicts between water seller and water purchaser;and
(d) unregulated pumping contributing to thedrying up of the surface water bodies.
Each of these conflicting interests is discussedin detail below.
Fragmentation of wellOwnership
Property rights over groundwater and theoperation of the law of inheritance (under whichland and wells are shared equally between
brothers) have created a problem of sub-divisionand fragmentation of wells into many shares alongwith land. Before entering into a discussion onthe issues associated with fragmentation and theresultant joint ownership of wells, it is importantto understand the extent to which it is occurring.Virtually no data are available at a macro level toindicate the nature and extent of joint wellownership. However, studies conducted by theauthor and others in river basins and villages inTamil Nadu, indicate not only the magnitude, butthrow light on the dilemmas and uncertaintiesassociated with the management of jointownership of wells.
Surveys of well ownership in the Vaigai andPalar river (Figure 4) basins indicate that between20% and 47% of all wells are jointly owned (Figure1).1 A survey of eight villages in the Palar basinundertaken in collaboration with Dr. BarbaraHarriss in 1993-94 (unpublished) showed thehighest incidence of joint well ownership. In thatsurvey the number of shares (or sub-divisions) ineach well for different sections of farmers wasdetermined (Table 1). At least four points are clearfrom this table:
(1) Apart from a large number of landlessagricultural labourers who are excluded fromhaving any access to groundwater, approximatelyone-third of the land owners are alsoexcluded from direct access to this preciousresource.
(2) The average number of wells owned in eachsize class increases at an increasing rate as thelandholding size class increases. This indicates thatbetter access to land is associated with better accessto groundwater.
Property rightsover
groundwaterand inheritance
laws have
fragmented wellownership.

128
C O N F L I C T S O V E R T H E I N V I S I B L E R E S O U R C E
���������
���� ��������������
���� �����������������
�������������������
�����
� ��
���������� ��
������� ��
�����������������������������$������������'���++�$���� �%%�,�������� �%%�,��
������
������� ��
������� ��
��%%����������$-
(3) There is a negative association between thelandholding size classes and the number of sharesin individual wells. In the two largest landholdingsize classes, there are hardly any shared wells. Atthe same time, few wells are owned by a singleindividual in the smaller landholding classes. Thisreinforces the point made earlier that the largerlandowners consolidate their shares in a well,perhaps by purchasing shares from others.
(4) The frequency with which individuals ownsmaller shares in wells is relatively high in thelower landholding size classes. For instance, all 4farmers owning less than 10% of a well, 11 out of16 farmers whose share in a well is 10%, and 21out of 25 farmers whose share in a well is 17-20%fall in the first three landholding size classes (thatis, they own less than 2 acres). These groups oftenown unmanageably small fractions in wells. As a
result, they are particularly vulnerable to distressor pressure from richer landowners and often selltheir well shares along with the land.
Although the management of jointly ownedwells has not yet been studied in detail in thecourse of the current study, interviews conductedin these eight villages indicate that conflict betweenshareholders in wells is widespread. The practicaldifficulties involved in allocating water betweenshareholders are the most important source ofconflict. The most common practice of joint wellmanagement seems to be to install a single pumpset and run the motor in rotation for a fixednumber of hours. The cost is shared equallyamong the shareholders. Problems, however,frequently emerge due to lack of cooperation ornon-cooperation among the shareholders insharing the costs as well as the available water/
Those who don’town land have
no direct abilityto own wellsand therefore to
accessgroundwater.
�N
Figure 4:Palar basin map.

C O N F L I C T S O V E R T H E I N V I S I B L E R E S O U R C E
129
Size Classes No. of No. of Total(std.acres) Farmer Farmer No. of
Households Households Wellswith Wells Extent of Share Ownership of Wells in the
SizeClass
<.1 .10 .17 .20 .25 .33 .50 .67 .80 1.0 2.0 3.0 4.0 5.0 6.0
<0.50 230 70 160 0 4 10 6 14 6 10 1 0 21 0 0 0 0 0 35.6
0.51-1.00 211 109 102 3 5 5 10 15 26 21 1 0 24 0 0 0 0 0 51.2
1.01-2.00 270 214 56 1 2 6 5 24 39 57 2 0 91 0 1 0 0 0 145.0
2.01-4.00 276 247 29 0 4 2 1 18 32 77 3 0 144 9 0 0 0 0 218.5
4.01-6.00 134 128 6 0 1 0 2 8 23 42 2 0 67 13 1 0 0 0 128.5
6.01-10.00 88 85 3 0 0 0 1 5 3 12 1 0 46 27 1 0 0 0 112.1
10.01-15.00 17 16 1 0 0 2 0 2 1 5 1 0 2 7 3 0 0 0 29.3
15.01-25.00 15 15 0 0 0 0 0 0 0 0 0 1 1 6 2 4 1 1 46.8
25.00+ 4 4 0 0 0 0 0 0 0 0 0 0 0 1 2 0 0 1 14.0
Total 1245 888 357 4 16 25 25 86 130 224 11 1 396 63 10 4 1 2 780.8
TABLE 1:Extent and Share Ownership of Wells Across Size Classes of Farmers in 8 Villages of the Palar Basin
Source: Survey conducted by the present author and Barbara Harriss - White in Tiruvannamalai and Vellore Districts (previously North Arcot District) in 1993-94.
Booster pump in a well: Tamil Nadu
power supply. Unlike the case of the disintegrationof the traditional tank irrigation communities,which is primarily due to the lack of motivationamong the users for various reasons (Janakarajan,1993), the lack of cooperation in joint wellownership is by and large due to financialconstraints or a generally poor resource position.In such cases, those who have “not cooperated”are excluded from the use of a pump set. Inaddition, even if everyone agrees to share theinitial costs of pump set installation, many disputesoccur in the use and sharing of water due to theerratic power supply. These disputes are oftensettled by the village panchayats (informal villagecourts), but are not sustainable as they crop upagain in the next period of scarcity.
Aside from rotation of available pumping time,another common mechanism for sharing waterfrom a jointly owned well is for each shareholderto install his own pump set (either electric or diesel
operated). This often generates conflict as theavailable water is rapidly drained. The problem isinflamed when the shareholders install high-powered motors in a competitive manner with aview to extracting more water. The incidence ofsuch disputes appears to be very high whenfarmers of different castes share a well.
Problemsfrequently
emerge betweenjoint well
owners due to
water scarcity,power
unrealiability,
and differencesover costs.

130
C O N F L I C T S O V E R T H E I N V I S I B L E R E S O U R C E
Fragmentation
of wellsincreasessocioeconomic
differentials byexcludingresource poor
farmers.
In many of these cases, the more resource richshareholders purchase the shares of the lessadvantaged. This situation came to light ininterviews carried out in Vengodu, Mappathuraiand Sirungattur villages in 1993/94 of the formerNorth Arcot district. In one case a single farmerwho shared a well with 15 others bought up allthe shares along with the land (Vengodu village).A large farmer in Sirungattur village adopted asimilar strategy.
In many cases, when shareholders havedifferent land holding status, individuals feel thatbenefits from deepening will go to the others andflatly refuse to cooperate. Conflicts in thisenvironment are common and are referred to thevillage panchayats. One of the most commonsolutions extended by the village panchayats isto physically divide the disputed wells into asmany shares as needed. This leaves the individualsconcerned free to dig and deepen their delineatedshares as they see fit. Such physically fragmentedwells are common in all the villages surveyed.Although this is the widely adopted solution,it encourages competitive deepening even withinindividual wells. It also frequently results inindividuals drilling borewells within theirportions of the larger dug well. In such cases,shareholders whose resource position is weakrapidly find it difficult to survive. Eventually, thewell tends to be dominated by the shareholder whohas the best access to financial and otherresources. The position of the resource poorfarmers becomes especially vulnerable as they areexcluded from the use of a well. In some cases,however, wells are completely abandoned due tothe prevalence of too many shareholders. In thissituation there may be too many disputes for any
solution to be effective. A typical shared well isshown in Figure 5.
Partition of wells between shareholders hasimportant implications. It aggravates theprecariousness of crop production (as manyfarmers have to share wells, with limited watersupply). It inflames the problem of an alreadyretreating water table due to competitive extractionas well as competitive deepening within individualwells. The most important implication, however,is that it increases socioeconomic differentiationby excluding resource poor farmers from the useof jointly owned wells and access to groundwater.
Conflict between well owners
Rapid expansion of groundwater irrigation hasresulted in the steady decline of the water table inmany parts of India. Pumping rates exceedrecharge and have resulted in secular lowering ofwater tables and the mining of groundwater (see,for instance, Bhatia, 1992, Rao 1993, Moench1992, Vaidyanathan, 1996, Janakarajan 1997).Conflicting interests among well owners haveemerged in this context. To determine the extentconflicts are likely to occur, the level to which thegroundwater table has declined over a period oftime is evaluated below within selected river basins.
The most appropriate way to evaluate thedegree to which the secular lowering of the watertable is occurring would be to document thechange in the depth of wells, the change in thedepth to the water table and the change in thevolume of water extracted over a period of time.This information is not, however, available fromany published source, nor is it possible to capture

C O N F L I C T S O V E R T H E I N V I S I B L E R E S O U R C E
131
Figure 5:Shared well diagram
WEALTHYmultiple water uses,capacity to deepenwell, water for nine
months, land:20 acres, cash crops
MEDIUMWEALTHY
Old pumps, cannotafford deepening, buys
water, land: 2 acres,subsistence crops,works full time as
labourer
POORESTlow capacity pump, nowell deepening, water
for 2 months, buys water,land: 1 acre, works as
seasonal labourer
through any survey. Instead, in a study conductedby this author and Vaidyanathan in 1997, anattempt was made to estimate the extent of thedecline in the water table in the Vaigai River basinusing a different, simple methodology. Twoimportant pieces of information were sought fromeach sample well owner: (a) What was the depthof the well when it was originally dug? (that is,the “original depth”); and (b) What was the depthof the well at the time of the survey? (that is, the“current depth”). The difference between the“original depth” and the “current depth” for anygiven well illustrated the extent to which the watertable had declined over a period of time. This studyindicated that the decline of the water table wasespecially rapid in the sample wells located outsidethe canal and tank commands. In addition to this,a crucial finding was that the “original depths”of the sample wells dug at different points of timeincreased over time, implying that a newcomer hasto have a well deeper than his predecessor(Janakarajan and Vaidyanathan, 1997). Casestudies carried out in other river basins in TamilNadu, and secondary research, indicate that thispattern is widespread across the state.
Declining water levels have severalconsequences. First, deepening often affectsneighbouring wells. The resulting situation isunusual in that an aggrieved party is unlikely toseek justice through the legal system becausegroundwater rights are ambiguous andindeterminate. There is, as a result, little recoursefarmers can take except to deepen their own wells.Second, declining water levels affect the costs ofconstruction of new wells due to the greater depthto which they must be dug. Third, deeper waterlevels increase pumping costs. This poses a

132
C O N F L I C T S O V E R T H E I N V I S I B L E R E S O U R C E
Declining water
levels:� affect
neighbouring
wells,� increase the
cost of new
wells,construction
� increase
pumpingcosts.
particularly heavy burden on farmers who areunable to obtain electricity connections (sincepower is provided free of charge) and on societyas a whole since power supply subsidies aresupported by the state. Overall, falling water levelscreate a delicate situation and add tremendouslyto the costs of current users, while posing a heavynegative externality on future users (Janakarajanand Vaidyanathan, 1997).
The social and economic consequences ofprogressive lowering of the water table are a matterof great concern. Major questions exist regardingthe extent to which wells that are dug anddeepened in a competitive manner are sustainable,particularly in hard rock regions such as the Palar,Bhavani, Noyyal and Vaigai river basins. Thecost of procuring groundwater is an importantgauge of sustainability. A study of groundwaterirrigation in 27 villages in the Vaigai basinindicated that the amount spent per acre of(net) well irrigated area works out to be muchmore than what has been spent to create onehectare of surface irrigation potential throughmajor and medium irrigation projects nationally(Janakarajan and Vaidyanathan, 1997). Accordingto the Report of the Eighth Plan, Governmentof India (1989), the average amount spentto create a hectare of irrigation potential duringthe Seventh Plan (1985-1990) in India wasRs 32,400. In the Vaigai basin, however, ourstudy results indicate that farmers spentapproximately Rs 80,000 per hectare of irrigationpotential created from groundwater. This costestimate would be even higher if such expensesassociated with abandoned wells, trial bores andso on were also included in the calculations. Allthe investments in wells accumulate to pose aheavy burden on the community as a whole
as well as on individual farmers. This isparticularly true because many of the investmentsare in failed wells.
Well irrigation has become a gamble. Not allthose who invest in wells are successful. Many failand lose in the race of competitive deepening. Theyend up selling their land or become trapped indebt. The direct consequence is the emergence ofa new dimension of inequality between those whohave been successful in the competitive deepeningrace and those who have not. The former areemerging as a class of water sellers and the latterare being reduced to the status of water purchasers.This is the subject of the next section.
Conflict between water sellersand purchasers
Groundwater sale in rural areas has come tobe a common phenomenon throughout India.2
Like joint well ownership, water markets in ruralareas have emerged as a spontaneous institutionto facilitate sharing of this scarce resource. Watermarket characteristics and their extent varybetween locations depending upon the availabilityof groundwater, need, custom and conventions.
Exclusion of a majority of the agriculturalpopulation from direct access to groundwater forirrigation and the differential access to resourcesbetween water sellers and water purchasers are theprincipal sources of conflict between these twoagents. A survey in the Vaigai basin indicated thatmore than three-fourths of the water purchasersare poor farmers whose landholding size is lessthan one hectare (Janakarajan and Vaidyanathan,1997). In this author’s study of the Palar basin,the extent of inequality in the distribution of land

C O N F L I C T S O V E R T H E I N V I S I B L E R E S O U R C E
133
Groups involvedin water
markets aresharply
polarized
socially andeconomical with
unequal
bargainingcapacity.
across all the sections of farmers (excluding thelandless population) was found to beextraordinarily high. In one village, wherecalculations indicate a Gini coefficient ofconcentration of 0.88, Gini coefficients calculatedseparately for the water purchasers and the watersellers, were relatively small – at 0.34 and 0.40respectively. This indicates that the “between-group” component of inequality (that is, betweenwater sellers and water purchasers) is fargreater than the “within-group” component(Janakarajan, 1992). Moreover, most waterpurchasers belong to the socially deprivedcastes. Scheduled Castes, the most deprived groupin the social hierarchy, constitute 27.3% of thewater purchasers (Janakarajan and Vaidyanathan,1997). This suggests that groups involved inthe water deals are sharply polarizedsocioeconomically as well as and have unequalbargaining capacity.
There are two causes for the emergence ofconflict between sellers and purchasers. The firstis violation of an informal rule that waterpurchasers should purchase water only from thenearest well owner. If the concerned wellowner agrees, water can also be purchasedfrom the next nearest well owner. This rule isenforced to avoid conflicts that could otherwisearise as water is transported through the fieldchannels belonging to others. Conflicts betweenwater sellers and water purchasers due to theviolation of this rule have been documented(Janakarajan, 1992). Even if all those concernedagree, purchasers must generally invest in hosepipes to convey the water to their fields. Theyare, however, often reluctant to make thispurchase since there is no guarantee that a waterseller would sell water regularly and investments
in pipes can be expensive for resource poorfarmers (Janakarajan and Vaidyanathan, 1997).
Unequal trading relationships are a secondcause of conflict. This results in exploitation ofthe weaker agent through non-competitivepricing for water purchased and through non-pricemeasures. In some cases water sellers requirewater purchasers to provide free or under-paidlabour services. Water purchasers cannot refusethis because the seller could cease to supplywater in the middle of a season resulting inthe purchaser losing his crop and all theinvestments he has made in it (Janakarajan,1992). In the Vaigai basin survey, this authorfound that payments for water were oftenmade through labour compensation and in severalcases through output (grains). In this process,water markets become interlocked with labour,credit and product markets (Janakarajan, 1992and 1997).3 In some cases, water purchasersare forced to lease their land to water sellersat terms dictated by the latter. This is a caseof reverse tenancy in which a lessee is morepowerful than a lessor. Such cases have beenrecorded in the villages surveyed in theTiruvannamalai district in the Palar River basin(Janakarajan, 1992 and 1996).
Although instances of open conflict betweenwater purchasers and water sellers are sporadicand infrequent, by and large the former areresentful of the latter. This is exacerbated insome villages where water sellers collude in fixingthe price for water (Folke, 1996; Janakarajan,1992). In order to understand the intricaciesof conflicts in the water trade, a closerexamination through a carefully designed fieldsurvey is in progress.

134
C O N F L I C T S O V E R T H E I N V I S I B L E R E S O U R C E
The causes ofconflict between
water sellersand purchasersinclude:
� violation ofinformalrules,
� unequaltradingrelationships,
� cases ofreversetenancy.
Conflicts emerging in surfacesystems due to increasedgroundwater use
Interaction between surface and groundwateris another important dimension where conflict isemerging. Groundwater pumping in prohibitedareas, such as in river beds or their proximity,results in the drying up of surface water bodiesand/or reduced downstream flow. This hasoccurred in the Palar Anicut System, an ancientsurface irrigation system in which water from thePalar River is diverted via a weir through anetwork of unlined channels to 317 irrigationtanks. A survey of 27 of these tanks throughoutthe system showed that in 22 of them, springchannels (the local term for channels cut to divertsubflow from river gravels) had stoppedsupplying water (Janakarajan, 1993). Thissuggests that a high portion of all the tanks inthis basin are affected. Spring channels originatein the Palar River and are used to supply waterfor about 6 to 8 months each year. These werehistorically one of the most important sources ofsurface irrigation in the region. Now, most areunusable, being either heavily silted or encroachedupon by farmers.
Another dimension of the competition betweengroundwater and surface water use concernsgroundwater pumping in tank command areasthroughout the state. Large numbers of wellsare located in tank command areas. These wellsderive most of their water through seepage orgroundwater recharge from the tanks. As a result,the tanks are both losing their water and theirplace as an important source of irrigation(Vaidyanathan and Janakarajan, 1989). Somestudies indicate a positive correlation between the
rapid growth of well irrigation and the decay oftraditional tank irrigation systems. As the use ofwells has increased, tank maintenance hasdeclined. In a 1996 paper Lindberg shows howindividual rationality conflicts with collectiverationality. This eventually results in the erosionof common property resources. In the case oftanks, individuals rationalize disassociation fromthe collective maintenance of tanks and canals,because they can rely instead on groundwater.Indiscriminate pumping of groundwater, in turn,results in the progressive lowering of the watertable. The problem is not only related toincentives for individual versus collective action.Large-scale rural electrification and theintroduction of high yielding varieties havecontributed as well. High yielding varieties requiremore assured, controlled and timely applicationof water and since the available tank water wasinadequate to raise three short duration HYVcrops, the growth of well irrigation in the tankcommand areas became inevitable. Thegovernment’s policy of supplying free electricity toagriculture has aggravated this problem.
Environmental degradation is a majorconsequence of the above pattern. Water tableshave declined and recharge may be declining aswell due to the drying up of the surface waterbodies such as tanks. Traditional institutionsgoverning tanks were found to be defunct in 6out of the 17 tanks studied in the Palar AnicutSystem. These were also the tank command areasin which well density was quite high. In one ofthe tanks, the tank sluices were permanently closedto facilitate the recharge of wells located in thetank commands. In other tanks, in which thewell density in command areas was very low, thetraditional system of irrigation was reasonably

C O N F L I C T S O V E R T H E I N V I S I B L E R E S O U R C E
135
Individualrationality
conflicts withthe collective
rationality
needed forwater
management.Conflicts between rural and urban areas overwater in Tamil Nadu have surfaced for two
main reasons: (a) rapid urbanization and the everincreasing urban water needs for industrial anddomestic purposes; and (b) pollution by industries,such as tanneries, textile dyeing units, andchemical industries, when they discharge effluentonto the surrounding land, streams or rivers.These two issues are investigated further in thefollowing pages.
Conflicts due to increasingurban water needs
By most measures, Tamil Nadu is highlyurbanized compared to most states in India. Itranks second in overall urbanization and firstusing a wider composite index calculated byincluding other important features of urbanizationsuch as town density and degree of urbanization.In many districts, the degree of urbanization ishigher than the all India average of 23% (Census
of India, 1981). The process of urbanization hasbeen rapid and coupled with speedyindustrialization. Together these factors havecreated enormous pressure on the provision ofbasic services in towns and cities, the mostimportant of which is water.
In the last several decades, many industrial andcommercial establishments in urban areashave met their water needs by pumpinggroundwater through their own deep wells orby purchasing it from external suppliers bytanker. Notable among the cities and towns inthe state that depend upon the pumping ofwater from their rural neighbourhood areChennai, the Coimbatore, Tiruppur, ErodeCorridor, Karur and Dindigul (all these citiesexcept Chennai, are in the Cauvery basin, whichis shown in Figure 6). The sale of groundwaterhas become quite extensive in these areas.Although statistical data for these cities and townsis unavailable, it is common knowledge that a
unimpaired (Vaidyanathan and Janakarajan; 1989,Janakarajan, 1993). A similar result was obtainedin a large-scale study, undertaken by the TamilNadu Agricultural University (Palanisamy,Balasubramanian and Ali, 1996) and several othervillage studies carried out in Tamil Nadu (Harriss,1982; Janakarajan, 1986; Nanjamma, 1977;Janakarajan, 1996). The association betweenincreases in well numbers and the decline of tankirrigation systems is not, however, uniform. Astudy on tanks in the Periyar-Vaigai system shows
that the spread of well irrigation in the tankcommands does not lead to a total collapse of thetank institution although its degree of effectivenessdoes vary, according to well density (Vaidyanathanet.al. 1998). As tank irrigation systems decline,small farmers who do not have access to their ownwell irrigation are the most affected. This groupis often reduced to the status of dependents onbig farmers and water sellers for their irrigationneeds. The net result is further polarization in analready differentiated society.
Conflicts Arising Out Of Industrial And Urban WaterNeeds

136
C O N F L I C T S O V E R T H E I N V I S I B L E R E S O U R C E
���������
�����������������
���� �������� ��
�������#������
��������� ��
����� �����
� �������
���
������
����������
���������� ��
��� ������ ��
������
�����
���������
��� ��������
�� ��
����������
������
����� ����
�����
���������� ��
��� ���
���
�������������
�� �������������
������
���
�����
.
/
������� �������
��������������������
������������
��������������
.0������%/0��-�1���
large part of their water needs are met throughgroundwater pumping in adjacent rural areas.
The case of Coimbatore and Erode districts, andparticularly the town of Tiruppur in Coimbatoredistrict is illustrative of the situation in the region.Tiruppur has earned a place on the industrial mapof the subcontinent as one of the large foreignexchange earners due to a heavy concentration ofknitwear industries in the town. There are about752 dyeing and bleaching units functioning therewhose operations depend heavily on high qualitywater. In the absence of any other source, theseunits have been transporting groundwater fromrural areas by truck-tankers. Out of 93 millionlitres of water used per day (mld), private watersupply alone contributes about 60 mld, or 64%
Industries bringaffluence but
their wastespollute water.
(Appasamy, 1994). It is transported by truck-tankers from several villages in a radius up to 30km away. A rough estimate puts the number oftruck-tankers which transport water to the townat 900 to 1,000, of which, according to a unionleader in Tiruppur, about 90% are owned by theindustry owners. While it is not surprising that alarge number of farmers have resorted to sellingwater to the industries at Tiruppur, it is verysurprising that the Tamil Nadu Electricity Boardhas authorized 230 agricultural wells aroundTiruppur, Palladam and Avinashi to sell water byissuing them a separate service connection.
In the area around Tiruppur about 30 revenuevillages are heavily affected by over-extraction ofgroundwater.5 Farmers report that until the 1980’s
�N
Figure 6:Cauvery and its tributaries.

C O N F L I C T S O V E R T H E I N V I S I B L E R E S O U R C E
137
Water is pumpedfrom rural
areas and sold
in urban areas.
Rural water sale location: Tamil Nadu
water intensive, garden crop cultivation includingthe cultivation of coconut, banana, tobacco andturmeric was common but that it is no longerpracticed in these villages. In the last 10 to 15years agricultural wells have gone dry andinhabitants now face difficulties in meeting eventheir drinking water needs.6 They believe this isprimarily because of the transportation of waterfrom these villages to the town. Industrialists ownmany deep borewells in the villages. A few arealso owned by local farmers, but financed by theindustry owners.
When water scarcity problems became severein the early 1990’s, groups of local people startedagitating and presented the issue to the revenueauthorities. On several occasions in 1997 revenueofficials had to mediate between water sellers andfarmers. In June of that year an agreement was
signed in front of the Revenue Divisional Officerthat no new deep borewells could be sunk andthat groundwater could be transported to the townonly from a few selected wells. Industry owners,however, are reported to have violated this
Figure 7Groundwater use and responses.
������'����&�%%�����
���'��,����������
�2&�����,&�&�%�����
���'��,�++%���$�
#����%��'����'�%%
��)&�����1����&����,
���+�$��'������1������3,�����'����
�2���$����
4��-��1�%%�,�
���������%��5���,�%�����
��������&�3$�&�
�������+��
�� ����������������5�%���,�����
������
�&%����������$��$���
�������
����������������,����������6��,
4������%�
��*������
���������
���������
�
�����'����

138
C O N F L I C T S O V E R T H E I N V I S I B L E R E S O U R C E
Emerging waterscarcity
problems haveled towidespread
protests.
Tankers supplying water to industry: Tamil Nadu
agreement within a month. Similar agitations andwidespread demonstrations by farmers are alsoreported in many other areas within Coimbatoreand Erode districts, especially on the Dharapuram– Tiruppur road, one of the main water transportcorridors.7 Many women have participated in theseagitations – a symptom of the fact that they havehad to struggle hard even to get drinking waterfor their routine household needs.
Extreme scarcity in the town of Palladamresulted in the sale of water even for drinkingpurposes at Rs 2 to 3 per pot. Most of the wellsthere are either dried or utilized for the sale ofwater to Tiruppur. Farmers, individually andcollectively, have sent many memoranda to theconcerned District Collectors and to ministers,urging them to ban the sale of water fromagricultural wells to the towns. Since their petitionshaven’t yielded results, farmers and women havestarted detaining water trucks in several villagesaround this town.
Several farmers organizations have expressedthe fear that the widespread sale of groundwater
to urban consumers has caused distress inagriculture. This is seen as causing an increasein rural unemployment, reductions in agriculturalyield, large-scale migration from rural to urbanareas and a shift towards non-farm employment.Now there is a large-scale shift towards non-farmoccupations such as weaving, road constructionor small business that seems to be essentiallydistress induced. These issues need to be examinedmore closely in the next phase of research.
An important dimension of the competitionbetween rural and urban areas over water has todo with quality. Water transported for domesticand industrial purposes, although volumetricallyless than irrigation use, is of high quality. As aresult, transport tends to focus on the limited highquality supplies available in many rural areasleaving these rural areas with little or no highquality water for their own uses. Pumping isconcentrated in selected villages where waterquality is relatively better. As a result, the peopleliving in these villages, particularly farmers, havebecome more sensitive to the depletinggroundwater conditions.
Conflict due to environmentaldamage
Conflict as a result of the damage togroundwater by industrial pollution is a majorconcern to the policy makers as well as the generalpublic. A number of large-scale industries (suchas tanneries, textile dyeing units, viscose, paperpulp, sugar, sago, oil refineries, fertilizer units andchemical factories) discharge effluent directly ontothe surrounding land or into the rivers andstreams. Contamination of groundwater has been
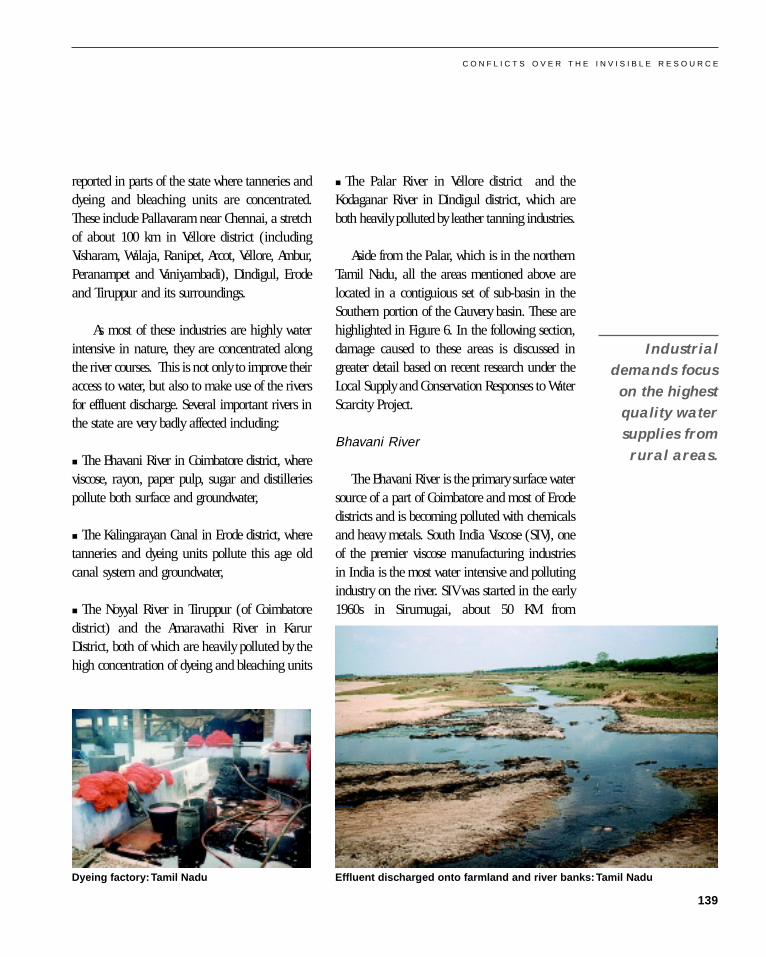
C O N F L I C T S O V E R T H E I N V I S I B L E R E S O U R C E
139
Industrialdemands focus
on the highestquality watersupplies from
rural areas.
Effluent discharged onto farmland and river banks: Tamil NaduDyeing factory: Tamil Nadu
reported in parts of the state where tanneries anddyeing and bleaching units are concentrated.These include Pallavaram near Chennai, a stretchof about 100 km in Vellore district (includingVisharam, Walaja, Ranipet, Arcot, Vellore, Ambur,Peranampet and Vaniyambadi), Dindigul, Erodeand Tiruppur and its surroundings.
As most of these industries are highly waterintensive in nature, they are concentrated alongthe river courses. This is not only to improve theiraccess to water, but also to make use of the riversfor effluent discharge. Several important rivers inthe state are very badly affected including:
� The Bhavani River in Coimbatore district, whereviscose, rayon, paper pulp, sugar and distilleriespollute both surface and groundwater,
� The Kalingarayan Canal in Erode district, wheretanneries and dyeing units pollute this age oldcanal system and groundwater,
� The Noyyal River in Tiruppur (of Coimbatoredistrict) and the Amaravathi River in KarurDistrict, both of which are heavily polluted by thehigh concentration of dyeing and bleaching units
� The Palar River in Vellore district and theKodaganar River in Dindigul district, which areboth heavily polluted by leather tanning industries.
Aside from the Palar, which is in the northernTamil Nadu, all the areas mentioned above arelocated in a contiguious set of sub-basin in theSouthern portion of the Cauvery basin. These arehighlighted in Figure 6. In the following section,damage caused to these areas is discussed ingreater detail based on recent research under theLocal Supply and Conservation Responses to WaterScarcity Project.
Bhavani River
The Bhavani River is the primary surface watersource of a part of Coimbatore and most of Erodedistricts and is becoming polluted with chemicalsand heavy metals. South India Viscose (SIV), oneof the premier viscose manufacturing industriesin India is the most water intensive and pollutingindustry on the river. SIV was started in the early1960s in Sirumugai, about 50 KM from

140
C O N F L I C T S O V E R T H E I N V I S I B L E R E S O U R C E
Pollution hasgreatly reduced
drinking wateravailability. Insome cases the
poor mustpurchage waterto meet basic
needs.
Coimbatore. This industry meets 70% and 40% ofSouth India’s staple fibre and filament yarnrequirements respectively and produces 180 tonsof wood pulp per day. The latest availableinformation indicates that the industry consumesan average of 40 million litres of water per dayand discharges a roughly equal quantity into theBhavani River, contributing significantly topollution of the river especially in the dry season(Appasamy, 1994). Local farmers associations andThe Bhavani River Environment Committeehave expressed concern that the water stored inthe Bhavani Sagar Dam, located 10 miles belowSIV, is polluted with chemicals and heavy metals.They also claim that the polluted water iscontributing to the salinity of groundwater in thearea and that the area irrigated by the dam wateris losing its fertility.
A study conducted by Stanley AssociatesEngineering Ltd. for the Tamil Nadu PollutionControl Board in 1994 revealed that SIV generatesa large quantity of effluents containing chemicalslike calcium, sulphite, nickel salts, soda ash andsodium hypochlorite. Despite treatment theeffluent is dark brown and has a very strongsulphurous odor. The study concludes: “The largedischarge volumes, the colour and odor form apotential threat for the water quality of the Bhavaniriver” (Asian Development Bank, 1994, Vol.III, p.163). In the mid-1990’s the Madras High Courtordered SIV to shut down its plants. Although theplant has been closed for brief periods, no majorchange has yet occurred. In addition to SIV, thereare a significant number of other industrial unitssuch as dyeing and bleaching units and sugarmills, which contribute to pollution of the BhavaniRiver. Notable among them are Tan India andUnited Bleachers.
Competing demands for surface water andsurface water pollution, are well documented inthis basin, but there are few studies to show thatthe effluent discharged from SIV or the otherindustries has contributed to the groundwaterpollution in the region. Likewise, little researchhas been conducted on the effect of water pollutionon agriculture and soils.
Kalingarayan Canal
Around 80 small and large tanneries arelocated along the 600 year old Kalingarayan Canalthat runs parallel to the Cauvery River near Erode.Together these tanneries generate about 5,000 m3
of effluent a day, which is discharged into thecanal. The Kalingarayan Canal Farmers’Association is concerned that these effluents havepolluted the surface and groundwater supplyresulting in yield reduction. This would seem tobe a reasonable assertion that deserves furtherattention in the next phase of this study. Aside fromthese tanneries, 250 to 300 small and mediumdyeing and bleaching units are located in vicinityof the canal, concentrated around Erode. Thesedyeing and bleaching units are reported to bedischarging their effluent on the road andsurrounding land. This probably has a significantimpact on the local waterways, and ultimately onthe nearby Cauvery River.
Although data are unavailable to show that thetanneries and dyeing and bleaching units in thisregion have contributed to groundwater pollution,the information provided by the Tamil NaduGroundwater Board do indicate that groundwaterpollution is significant in this region. A sample ofgroundwater has been tested biannually since 1985from an observation well in an area of Erode

C O N F L I C T S O V E R T H E I N V I S I B L E R E S O U R C E
141
Preciseknowledge of
pollution isfragmented due
to
unavailabilityof data.
Schematic view of river pollution by industrial effluent.
known as B. P. Agraharam where most of thetanneries are concentrated. The results arepresented in Table 2. Although the data presentedin this table do not show any steady decline inthe groundwater quality since 1985, the sampletests do indicate that the groundwater quality isfar from prescribed standards and that it isfluctuating from year to year. In addition, it isimportant to note that the tests focus on standardagricultural parameters and do not include manyof the heavy metals (such as chromium) or otherchemicals that would be expected as industrialpollutants.
Noyyal River
The largest town in the Noyyal River basin isTiruppur, where the growth of the hosiery industryhas been exceptional. The number of knitting millsin the town went from 22 in 1941 to 2,800 in1991. Similarly, while there were hardly any dyeing
and bleaching units in the 1940s the Tamil NaduPollution Control Board indicates that 752 unitswere in operation in 1996. In addition, manyunregistered units are reported to be operatingabout which no reliable information is available.The direct export value of hosiery products fromTiruppur has gone up tremendously from Rs 190million (US$ 5 million) in 1985 to aboutRs 20,000 million (US$ 530 million) in 1996.Tiruppur contributed 11.2% of the total value and21% of the quantity of knitwear exported fromIndia in 1984. By 1996, Tiruppur’s share had goneup to 42% and 49.3% respectively. As aconsequence, the population of the town has morethan doubled from 80,000 in 1961 to a little lessthan 200,000 in 1991.
Dyeing and bleaching are important processesin the production of knitwear. These activitiesrequire an enormous quantity of clean water.Almost the same quantity of water is discharged
141

142
C O N F L I C T S O V E R T H E I N V I S I B L E R E S O U R C E
Year Month EC Micro pH Ca Mg CI TDS Total SARCM at 25oc Hardness
1985 Jul 4,000 9.3 96 54 922 2,300 460 14.3
1986 Jan 2,000 9.2 76 49 808 1,795 390 12.7
1986 Jul 520 8.6 26 29 32 316 185 1.5
1987 Jan 3,790 9.2 16 68 808 2,195 320 16.8
1989 Jul 5,900 9.5 240 63 1,549 3,335 860 13.2
1990 Jan 4,170 8.7 80 331 1,078 2,213 1,560 2.5
1991 Jan 2,020 8.1 108 133 479 1,033 820 1.3
1992 Jan 3,510 8.8 24 83 688 2,028 400 13.1
1993 Jan 1,820 8.5 24 20 199 1,068 140 13.0
1993 Jul 720 20 15 57 393 110 4.8
1994 Jan 2,000 64 59 305 1,077 400 5.8
1995 Jan 1,450 44 59 206 830 350 3.8
1996 Jan 1,600 46 57 234 978 350 5.1
TABLE 2:Chemical Analysis of Groundwater from Agraharam Village, Erode
(Observation well No. 63247, range between two samples in the same year is presented as mg/l)Note: EC = Electrical Conductivity , Ca = Calcium, Mg= Magnesium, Cl= Chloride, TDS = TotalDissolved Solids, SAR = Sodium Absorption Ratio.Source: TNGB, 1996.
There has beena dramatic rise
in the number ofdyeing andbleaching units
over last fivedecades.
as effluent into the Noyyal River and other smallstreams such as the Nallar and Jamunai. Effluentdischarged by these units is hazardous, causingserious health problems. This is evident from thetype and extent of chemicals used in the bleachingand dyeing process. To process 100 kg of clothesthe following chemicals are required: 500 gramsof wetting oil, 4 kg of caustic soda, 750 grams ofhypern, 4 kg of sodium peroxide, 8 kg ofhydrochloric acid, 15 kg of soda ash, 3 kg of aceticacid, 10 kg of common salt and 2 kg of petroleumoil. The process also requires approximately 40,000litres of water per 100 kg of clothes. On average,a dyeing unit can process 20 tons of clothes permonth or about 700 kg per day and consumesabout 8 million litres of water per month or280,000 litres of water per day (Palanichamy andPalanisami, 1994). Discharge of these effluents hasa tremendous impact on the Noyyal, particularlybecause it is not a perennial stream. During low
flow or dry periods, virtually all flow is industrialand other effluents.
The estimated water requirement of thebleaching and dyeing units in Tiruppur is about94 million litres per day (mld) of which about60% is met by groundwater transported by tanker-trucks from rural neighbourhoods. A roughlyequivalent quantity of effluent is released into theNoyyal River and other streams. This has alreadycaused permanent damage to the river, topsoil and,most important of all, to the groundwater. Even30 years ago, the local textile operators confirmedthat groundwater was contaminated in the areaswhere dyeing and bleaching units discharged theireffluent. In the absence of any perennial sourceof surface water, the villages around Tiruppurdepend entirely upon groundwater for agriculture.Since groundwater is contaminated, agriculture asthe key occupation has been abandoned in manyvillages (Asian Development Bank, 1994, Vol.II).
A Government Order (G.O. No.213, I) datedMarch 30, 1989 prohibits the establishment ofpolluting industry with in one kilometre of rivers.The Noyyal is one of the rivers notified in thisorder. The Tiruppur Dyers’ Association wantedexemption from the order since, according to theirclaim, the Noyyal River is dry and any water thatflows in the river is not used for irrigation. Thisclaim may have had some merit at the time,but by 1992 the government of Tamil Nadu hadbuilt the Orathapalayam Dam. This wasintended for irrigating about 8,000 hectares andlocated some 10 kilometres below Tiruppur. Thisdam’s catchment is 2,245 km2 and includes mostof the area in which the bleaching and dyeingunits are located.

C O N F L I C T S O V E R T H E I N V I S I B L E R E S O U R C E
143
Reservoir wateris also
contaminatedby effluents
from industries.
Orathapalayam Dam: Tamil Nadu
The Orathapalayam Dam has never functionedwell as an irrigation reservoir. Instead, it hasbecome a storage reservoir for the pollution fromTiruppur and contributes significantly to pollutionof the environment, especially groundwater. Waterstored in this reservoir is substantially more thanthe natural flow in the river, because of the largequantity of effluent (about 92 mld/day) that isdischarged by the Tiruppur dyeing and bleachingunits into the Noyyal. This effluent contributes tothe “additional storage level” of the dam.
The problem of polluted waters behind thisdam was illustrated in an incident in February1997. At that time there was no appreciable flowin the Cauvery, which the Noyyal joins some 32kilometres downstream of the OrathapalayamDam. Effluent was, however, accumulating behindthe dam and threatening surrounding villages. Inresponse to this situation the authorities decidedto release the highly polluted water from the dam.As the river contained little unpolluted flow, andno public notice was given when effluent wasreleased, this action resulted in considerabledamage to crops, animals, soil and groundwater.The polluted waters continued downstream into theCauvery. According to local reports, severalhundred animals collapsed after drinking thiswater and petitions were filed in the High Courtprotesting release of the polluted water andclaiming compensation for the damages. Thesituation was serious enough that the Tamil Nadugovernment released 20,000 cusecs of water fromthe Mettur Dam upstream on the Cauvery to dilutethe pollution even though it was a scarcity period.
In all the villages all along the river coursefrom Tiruppur to the Orathapalayam Dam, a
distance of about of 10 km, and in villages up to20 km downstream of the dam, groundwater isreported to have been affected by the effluent.1
Before construction of the dam, agriculturalproduction was high and included major crops oftobacco, coconut, turmeric, maize, cotton andvegetables. At present, only dry crop cultivation iscarried out in these villages and wet cropcultivation is limited to a few farmers whose wellsare not yet polluted.
Field visits by Blomqvist in 1996 confirmed thatthe groundwater on both sides of the Noyyal Riverhas become brackish and considerably harder inthe last 10 to 15 years. The water quality is nowunfit even for irrigation to depths of 300 feet.According to Jacks: “Downstream of Tiruppur atOrathapalayam, there is a newly constructed dam,aimed at arresting flash floods and utilizing themfor irrigation. The water in the dam was brackish(7,000 mg/l TDS) and had a SAR (SodiumAbsorption Ratio) in between that found in theeffluent and that in the groundwater in Tiruppurtown indicating a mixing of effluent from the

144
C O N F L I C T S O V E R T H E I N V I S I B L E R E S O U R C E
Infiltration ofpolluted water
has poisonedgroundwaterwells.
textile industries discharged directly into Noyyaland groundwater from Tiruppur town” (Jacks, etal., 1994, p.5). He also commented that:“Downstream of Tiruppur, however, the salinitywas excessive definitively rendering the waterunsuitable for almost any purpose” (Jacks, et al.,1994, p.4). Preliminary field visits for this studyin the region confirm that the villages on bothsides of the Noyyal River below the OrathapalayamDam are quite badly affected by contaminatedgroundwater and people find it challenging evento meet drinking water needs.
What follows next is the case study of thevillage Veerapandi, a typical case where a highdegree of groundwater contamination is reported:
Veerapandi is located 12 km from Tiruppur,on the Tiruppur – Palladam road. This is a bigrevenue village with a population of 25,000(Census of India, 1991). One large knitwearindustry along with its own dyeing and bleachingunits and two other small units are located in thisvillage. These industries were started about 20years ago. All these units discharge their effluentonto the surrounding land and roads. Eventuallythe effluent ends up in the Noyyal River. Wells inthis village have adequate water but it iscompletely polluted. As a result, agriculture hasdisappeared. Industries use most of thegroundwater and have caused substantial pollutionthrough effluent discharge. Due to the pollution,many industries now transport water from anearby village. Inhabitants of that village nowface major difficulties obtaining drinking water.In August 1997, about 3,000 people organized aprocession and picketed the government offices toprotest against the dyeing and bleaching units,which they held solely responsible for the pollution
of groundwater. The sub-collector intervened andnegotiated an agreement between the villagers andindustries. According to this agreement, theindustries were to provide two tanker-loads ofpotable water (15,000 litres per load) daily to thisvillage at their own cost. The agreement wascomplied with for about a month. Thereafter theindustries stopped supplying water stating that theywere under great pressure to erect their owntreatment plants. Later on, the Panchayat Unionstarted transporting drinking water in rotation tovarious segments of the village. Each householdreceived water for two and a quarter hours,equivalent to about 100 litres once in 8 days. Soonit was realized that the water supplied by thePanchayat Union was inadequate. As a result, alocal water market has developed in which acouple of farmers store lorry loads of water andsell it at 75 paise per pot. This rate increases toRs 2 per pot at times of acute scarcity. Most peoplein this village use water for bathing only once ortwice a week. The village population is now payinga high price for having let the polluters in.
Jacob’s study in 1996 clearly demonstrated theimpact of industries on groundwater quality in theTiruppur area. He measured a number ofgroundwater quality parameters. The importantresults are presented in Table 3. The informationprovided in this table suggests that the effluentdischarged by the industries may have causedpermanent damage to the groundwater in theregion. Farmers from several villages along theNoyyal River complain about the hardness of thewater and indicate that crop yields have declined.8
Reports in local newspapers indicate that peoplewalk miles for drinking water in this region.According to dyers in the town pollution alsoaffects industry (Blomqvist, 1996).

C O N F L I C T S O V E R T H E I N V I S I B L E R E S O U R C E
145
TABLE 3:Effluent and Groundwater Quality, Tiruppur Area
TDS : Total Dissolved Solids, BOD : Biological Oxygen Demand, COD : Chemical Oxygen Demand, mg/l: milligram per litre, Ms :Microsiemens.Source: Derived from Jacob, (1996).
Characteristics For Effluent For GroundwaterTolerable Limit Actual Tolerable Limit Actual
EC <2,000 Ms 4,780 to 23,300 Ms <2,000 Ms 2,910 to 16,400 Ms
TDS 2,100 mg/l 4,500 to 19,920 mg/l 1,500 mg/l 2,541 to 14,010 mg/l
Chloride 1,000 mg/l 3,750 to 7,273 mg/l <1,000 mg/l 1,007 to 4,490 mg/l
Sulphate 1,000 mg/l 168 to 1,413 mg/l <1,000 mg/l 156 to 821 mg/l
Magnesium NA NA 50 mg/l 100 to 766 mg/l
Sodium NA NA 200 mg/l 352 to 2,800 mg/l
BOD 30 mg/l 37 to 365 mg/l Zero 1 to 128 mg/l
COD 250 mg/l 230 to 1,786 mg/l NA NA
Iron NA NA 0.3 mg/l 1.7 mg/l
Pollution hasgreatly reduced
drinking wateravailability and
in some cases
the poor mustnow pay for it.
On the whole, four important issues, all ofwhich require further investigation, emerge fromthe foregoing discussion:
(i) Groundwater scarcity is increasing and maybe caused by the indiscriminate deepening andpumping of water by those who sell water to theindustries;
(ii) Agricultural problems are increasing due todeclining or dried condition of the wells andgroundwater pollution;
(iii) Industrial effluents may have contributed todeclines in soil quality; and
(iv) Health hazards due to pollution may also beincreasing.
Amaravathi River
As with the Noyyal River, the Amaravathi Riverand its basin are polluted due to the growth of
textile dyeing and bleaching units. Karur, near theconfluence with the Cauvery, is particularlyaffected. Like Tiruppur, Karur is an importanttextile export centre that has grown rapidly overthe last 15 years. In 1985, 100 bleaching anddyeing units were in operation. This number hasnow increased to 600 licenced units and anunknown but large number of unlicenced ones.Most units are located in a 17 kilometre stretchalong both sides of the river and theThirumanilayur Branch Canal. This area hassubstantial quantities of potable groundwater.However, since the entire industrial effluent goesinto the surrounding environment and waterways,farmers in this region and the River CauveryProtection Council have expressed concern thatboth groundwater and surface water are becomingpolluted.
Dyers in this area claim that the large numberof units is only one cause of the pollution.According to them a second factor is change inthe demand pattern from foreign buyers requiring

146
C O N F L I C T S O V E R T H E I N V I S I B L E R E S O U R C E
Closure ofpolluting
industries isdifficult due tothe impact on
local economies.
different input chemicals and a different dyeingprocess. The previous process used naptha basedchemicals, whereas the new process is a “reactivetype” which requires 10 times more water and alsocontributes a greater pollution load to theAmaravathi River in the vicinity of Karur.
The switch from naptha to reactive dyes hasprobably also occurred in dyeing units located inTiruppur, but the damage caused in theAmaravathi basin appears to be less than in theNoyyal basin. This may be due to the fact thatthere is a reasonable flow of water in theAmaravathi River but very little flow in the Noyyal.Another point of difference between water use inthese two towns is that there is little or no needfor the sale of water in Karur. Unlike the Tiruppurdyers, most of those in Karur and its suburbsmanage their water requirement from wells locatedwithin their premises.
One of the more polluted villages near Karuris Tanthonimalai. Groundwater there can nolonger be used. In response to this, in 1995 theConsumer Protection Council filed a case againstthe dyers and bleachers in the High Court onbehalf of the village. As a result of the case, theHigh Court issued a notice to all the pollutersthrough the Tamil Nadu Pollution Control Boardto close down all the units with immediate effect.They could open their units only if they had accessto either their own treatment plant or to a jointone. As a result of this order 600 units havebeen closed since November 1997. Water treatmentplants are also under construction, but progresshas been slow and the High Court has constituteda committee comprised of lawyers representing thedyers, the Tamil Nadu Pollution Control Board andthe original petitioners to conduct an inquiry into
treatment plant construction. On January 21st,1998, textile industry workers picketed the DistrictCollector’s office protesting the dyeing andbleaching unit closures. Around the same time theinquiry committee constituted by the Courtsubmitted its findings and recommendations.According the committee, the dyeing units couldnot install their treatment plants due to lack offinancing, a problem aggravated by closure of theunits. Moreover, the committee found that theclosure of units in Karur had affected the towneconomy badly. Therefore it recommended that theunits should reopen under the condition that theyinstall either their own treatment plant or to getaccess to a common effluent treatment plant(CETP) within three to six months. Since, however,many of the dyeing and bleaching units are smalland have little capital, it is unlikely that they willinstall either their own treatment plants or getaccess to a CETP within the deadline prescribedby the Court. The process is ongoing and itremains to be seen what action will occur on thepart of the court, government and unit owners.The key point, however, is that environmental andlivelihood issues are coming into increasedconflict. In addition, many of those affected bythe environmental problems (farmers and townresidents) are often different from those whoselivelihoods are threatened (in this case, workersin the units).
Palar River
An Asian Development Bank study to assess theenvironmental condition in Tamil Nadu concludedthat the Palar River is one of the most polluted inthe state. It identified 3,226 small, medium andlarge industrial units, which primarily contributeto the pollution of the eight major river basins in

C O N F L I C T S O V E R T H E I N V I S I B L E R E S O U R C E
147
TABLE 4:Estimated Industrial Pollutant Loads inthe Palar River
Source: Derived from Tamil Nadu Environmental Monitoringand Pollution Control, Asian Development Bank, Final Report,Volume-II, P.4.4, 1994.
Parameter Pollutant loading (Kg / d)
Total suspended solids 29,938
Total dissolved solids 400,302
Chloride 101,434
Ammoniacal Nitrogen 3,034
Phenol 383
Oil and Grease 670
BOD 23,496
COD 70,990
Copper 4
Zinc 465
Total Chromium 474
Nickel 93
Cyanide 22
Livelihood andenvironmental
issues are inconflict. Those
affected by
environmentalproblems are
different from
those whoselivelihood isthreatened
when pollutingunits are closed.
the state. Of these, 639 (or 20%) are located inthe Palar basin. Table 4 gives estimated industrialpollutant loads discharged into the Palar River.
Probably the most polluted area in the Palarbasin is between the towns of Visharam andVaniyambadi (a stretch of about 100 KM on theChennai-Bangalore national highway in Velloredistrict – Figure 4), where about 300 tanneriesare concentrated along both sides of the river.These discharge effluent directly into the lakes,irrigation tanks, streams and the river. In addition,solid waste, such as lime, hair and leather areheaped near the tanneries and are washed intoadjacent surface water bodies. Leather tanning iswater and chemical intensive. Salt, wetting agents,lime, sodium sulphide, ammonium chloride andsulphate, enzymatic products, sulphuric acid,sodium carbonate, dyes and sulphonated vegetableoils are among the chemicals used. In addition,substantial amounts of chromium are used.
Although the amount discharged in the Palar isnot known, estimates indicate that as much as75,000 to 100,000 tons of chrome sludge may begenerated every year in the leather industry inIndia. This is particularly problematic because safedisposal mechanisms for chromium sludge haveyet to be identified anywhere in the world(Thyagarajan, 1992, p.145). About 45 litres ofwastewater is discharged per kilogram of semi-finished hide. The major pollutants in tanneryeffluent are alkaline effluent, lime, dissolved salts,sulphide, chromium and organic matter fromhides and treatment agents.
A detailed study undertaken by the Soil Surveyand Land Use Organization of Government ofTamil Nadu examined the impact of the tanneryeffluent on the region (Teekaraman, and Ahmad,1982 and 1990). This study showed that tanneryeffluent disposal patterns are far from thoseprescribed by the Pollution Control Board. The1982 study found that hardly any tanneries treatthe effluent. Instead, effluent is discharged toearthen lagoons for evaporation. In most cases thenumber and capacity of these lagoons is notsufficient for the quantity of effluent generated.To quote, “...it is a common sight to seeoverflowing lagoons and the waste getting drainedinto the nearby fields. There are also large-scalebreaches in the lagoons and the effluents seep andflow to stagnate later in the fields. Quite a largenumber of tanneries in Pernampet, Valathur,Vaniyambadi, Ranipet, Walajahpet, Arcot andGudiyattam zones dispose of their effluent directlyinto lakes and tanks which in turn contaminatethe water in the lakes and surrounding wells. Afew tanneries in Pernampet, Vaniyambadi andVellore let off their effluent directly into the Palar

148
C O N F L I C T S O V E R T H E I N V I S I B L E R E S O U R C E
Poor disposaland
management ofeffluentscontributes
heavily togroundwaterpollution.
River, contaminating the potable water also.”(Teekaraman, et al., 1982 p. 15). The 1982 studyidentified about 16,000 hectares of affected landdue to the tannery effluent in Vellore districtusing parameters such as soil quality and waterquality (both surface and groundwater) todemarcate the affected area. The same studywas repeated in 1990. It found no change ineffluent disposal patterns and further damage tosoils, surface and groundwater. Of 855 effluentstorage lagoons inspected in the 15 centres fromVisharam to Vaniyambadi, only 150 were concretelined, 519 had broken structures, 696 wereoverflowing into open fields and only 67 couldhold the quantity of effluent generated. Most ofthe channels carrying effluent from the tanneriesto the lagoons were unlined, broken andoverflowing. The above factors indicate that poormanagement of the effluents is likely to contributeheavily to groundwater pollution.
Studies by Narayana Murthy in 1987documented the negative impact of tanneryeffluent on the environment in the Palar basin.According to Murthy, the number of tanneries inVaniyambadi taluk alone increased from 108 inthe 1960s to 240 in 1975. During the same period,land rendered unfit for use increased from 240hectares to 6,400 hectares and the number ofpolluted wells increased from 48 to 520. Theimpact is continuing to grow. By 1984, the numberof polluted wells exceeded 10,000. As a resultof the pollution, agricultural yields have declined,drinking water scarcity has increased andcultivation has been abandoned in severalvillages (Narayana Murthy, 1987). Major healthproblems have also been caused by contaminatedgroundwater including cholera, skin ailmentsand gastroenteritis.
Groundwater quality sample tests conducted atvarious points in this region by the Tamil NaduWater Supply and Drainage Board (TWAD),Government of Tamil Nadu in 1983, and quotedin Narayana Murthy (1987) show high BOD(biological oxygen demand) and TDS (totaldissolved solid) levels. BOD levels in somecases exceed 20,000 mg per litre and as earlyas in 1983 TDS levels in the Ambur andVaniyambadi region ranged from 3,710 to5,350 mg per litre, whereas the safe limit fordrinking water is considered to be 3 mg/l ofBOD and 500 mg/l TDS. A more recent studycarried out by the Water Resources Organization,Government of Tamil Nadu, also shows thatdischarge of untreated effluent by tanneriesto the Palar River and adjacent lands over thepast three decades have affected the groundwaterquality (Rajarathinam and Santhanam, 1996).TDS levels in most sample locations rangedfrom 4,905 to 10,172 mg/l. The CentralPollution Control Board also conducted a studyof groundwater quality in 12 locations in Velloredistrict, during 1994 (Central Pollution ControlBoard, 1995). Samples were taken fromagricultural wells and all showed excesssalinity with TDS values ranging from 2,529 to10,674 mg/l. Since the natural aquifer wasof a good quality, the excess salinity wasattributed to contamination by tannery effluent.In addition, heavy metals including chromium,copper, zinc, iron and manganese were foundin all except two sample wells. The high presenceof chromium in 10 out of 12 sample wellsin particular, indicates that the contaminationof groundwater is primarily due to tanneryeffluent. Tables 5 and 6 present more detailedinformation pertaining to groundwater pollutionin the Palar basin.

C O N F L I C T S O V E R T H E I N V I S I B L E R E S O U R C E
149
TABLE 5:Mean Values for Heavy Metals in Groundwater, Palar Basin, 1994 (mg/l)
Source: Groundwater Quality in Problem areas: A Status Report, Part-II, Chapter-6, pp.90-93,Central Pollution Control Board, Government of India, Delhi, 1995.
Well No. Zinc Copper Chromium Iron Manganese
G1 0.078 O.026 0.143 0.150 0.132
G2 0.110 0.030 0.305 0.125 0.106
G3 0.081 0.031 1.120 0.100 0.114
G4 0.095 0.070 0.000 0.155 0.089
G5 0.071 0.027 0.290 0.200 0.490
G6 0.081 0.018 0.270 0.100 0.106
G7 0.103 0.023 0.120 0.150 0.152
G8 0.151 1.056 0.325 0.200 0.139
G9 0.098 0.025 0.620 0.133 0.472
G10 0.097 0.045 0.170 0.200 0.155
G11 0.085 0.016 0.640 0.100 0.407
G12 0.222 0.021 0.000 0.158 0.184
Groundwatersamples show
increasingcontamination
from heavy
metals.
Many of the parameters in Tables 5 and 6exceed normal limits for irrigation and drinking.In addition to the high chromium and TDS levels,the high coliform counts are characteristic ofpollution associated with tannery effluent. Theyindicate that the groundwater in this region hashigh bacterial contamination. This, along with theheavy metals and other contaminants, is probablya primary cause of health problems reported inthe region. Recently the Madras School ofEconomics has studied the impact of the tanneryeffluent on health in three sample villages locatedin the Walajapet taluk, downstream on the PalarRiver (Madras School of Economics, 1998). In oneof the villages (Gudimallur) the effluent hasentered the irrigation tank, heavily contaminatingboth surface and groundwater. Partly treated waterpasses through the two other sampled villagesbefore entering the Palar River, causing enormousdamage to the water bodies and resulting inserious health problems for both humans andanimals. The most commonly reported healthproblems are related to respiratory ailments, skinallergies and diarrhea.
Remedies to tannery effluent pollution appearcomplex. Even if all the tanneries were to installthe treatments or become a part of the CETP, thedisposal of sludge remains an unresolved issue.On the order of 70 to 80 tons of sludge aregenerated by existing CETPs and individualtreatment plants per day. This may increase to140 to 180 tons per day when all the treatmentplants become operational. The sludge, which istoxic and hazardous, contains chrome. At presentit is stored within tanneries but during the rainyseason it often washes into streams causingenormous damage to the environment and thehuman population (Sahasranaman, 1997).
Villages affected by tannery effluents (asreported in various studies) have been plotted onthe Palar basin map. Most of the villages are intwo clusters along the Palar River. One cluster isin the upper Palar (near Ambur, Vaniyambadi andPernampet) and the other is downstream nearRanipet and Walajahpet.
Kodaganar Basin
Like the Palar River basin, the Kodaganar basinis severely affected by tannery effluent.Approximately 80 units operate in this river basinnear Dindigul in the southern Cauvery basin.About 20,000 skins are processed daily,generating nearly 60 million litres of effluent. Theuntreated effluent stagnates in local pools andstreams before it eventually joins the KodaganarRiver. Many irrigation tanks in this region havebeen highly contaminated by effluent andtwo of them have been allotted as sitesfor the construction of Common EffluentTreatment Plants.

150
C O N F L I C T S O V E R T H E I N V I S I B L E R E S O U R C E
TABLE 6:Mean Values for Major Chemicals in Groundwater, Palar Basin, 1994
Source: Central Pollution Control Board, Government of India, Delhi, 1995.
Well PH EC Total Fluoride Chloride TDS Calcium TotalNo. Ms/cm Hardness Mg/I Mg/l Mg/l Mg/l Coliform
mpn/100ml
G1 8.2 10.32 2,295 0.53 3,089 5,834 938 31,522
G2 8.2 11.92 4,135 0.59 3,781 7,117 1,331 7,913
G3 8.1 14.39 2,542 0.49 4,296 8,049 865 5,426
G4 8.0 15.00 3,937 0.48 4,763 8,292 1,788 8,460
G5 8.0 17.47 4,812 0.47 5,443 9,782 2,363 9,942
G6 8.2 4.87 1,574 0.64 1,249 2,718 763 7,714
G7 8.1 12.34 3,670 0.38 3,978 6,796 2,087 24,409
G8 7.4 14.87 3,994 0.40 4,809 8,251 2,167 8,453
G9 8.1 10.62 2,880 0.51 3,186 5,918 1,639 8,563
G10 8.2 10.72 3,374 0.62 3,277 5,861 1,205 13,727
G11 8.2 11.48 3,518 0.62 3,276 6,480 1,590 2,077
G12 8.2 4.08 921 0.64 1,061 2,334 533 3,765
Disposal ofchromium
contaminatedsludge fromtanneries is a
majorunresolvedissue.
Sindalakundu village is one of the mostseverely affected villages in this region. Thisrevenue village has eight hamlets and a populationof about 25,000. The village has seven irrigationtanks with a combined command area of 2,500acres. There are about 500 wells in the commandarea of these tanks. In addition, this village has15,000 acres of agricultural land, some of whichis dry and some of which is irrigated by about1,000 wells. These originally supplied water forcrops such as paddy, groundnut and vegetables.Pollution by the tanneries first became evidentapproximately 15 years ago. Now the village facesacute drinking water scarcity and, even thoughmost wells outside tank commands, containsubstantial water, they cannot be used due to thepollution. As a result, farmers have given upcultivation outside of tank commands anddrinking water is fetched from distant wells locatedin the wet lands. These wells still have high qualitywater because they are located far on the otherside of the river from the tanneries. Agricultural
activity has been heavily affected in this village ashas livestock. Village respondents report that thecattle population has declined from 15,000 in 1981to the current level of approximately 1,000 head.As a result, many farmers have migrated to townsand cities. In one hamlet (T. Puthur) only 4 outof an original 60 households remain. Some ofthem have sold their land during the past 10 yearsand others have left the land barren. The economicimpact of the tanneries has not, however, beenuniform with regard to all communities in thevillage. Approximately 60% of the 500 ScheduledCaste households in this village are employed inthe tanneries. People of other castes, having losttheir agricultural employment, prefer to undertakecasual work in the town such as loading andunloading or construction work instead of seekingemployment in the tanneries. A CETP has beenconstructed in the region. However, according tovillagers it does not function satisfactorily,although its presence enables tannery operationsto continue.
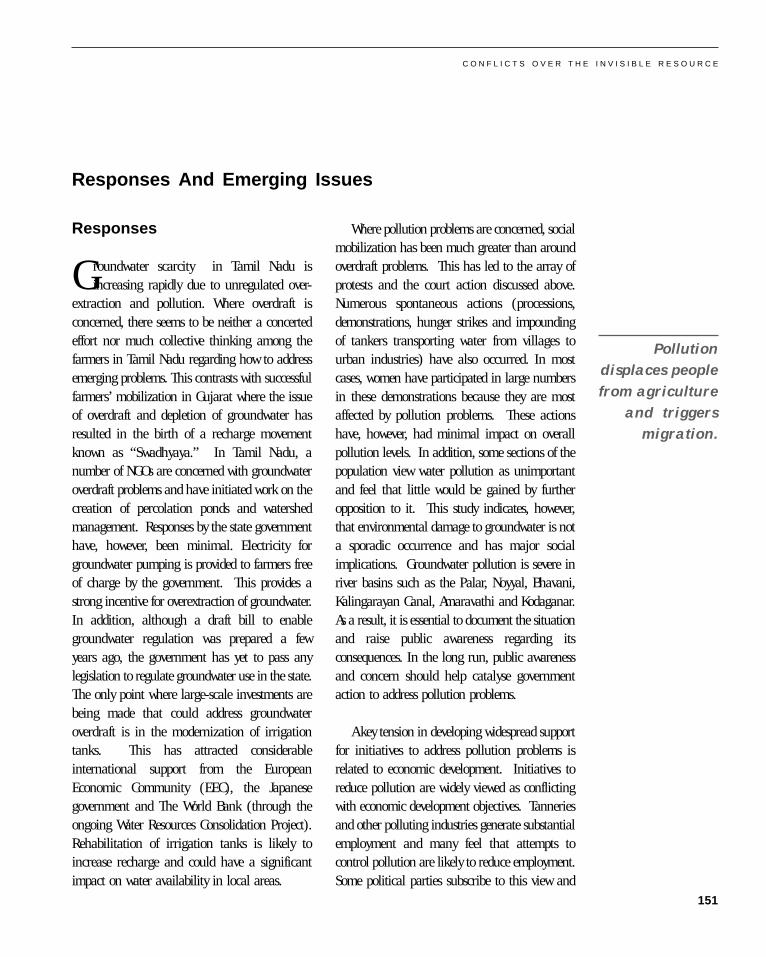
C O N F L I C T S O V E R T H E I N V I S I B L E R E S O U R C E
151
Pollutiondisplaces people
from agricultureand triggers
migration.
Responses And Emerging Issues
Responses
Groundwater scarcity in Tamil Nadu isincreasing rapidly due to unregulated over-
extraction and pollution. Where overdraft isconcerned, there seems to be neither a concertedeffort nor much collective thinking among thefarmers in Tamil Nadu regarding how to addressemerging problems. This contrasts with successfulfarmers’ mobilization in Gujarat where the issueof overdraft and depletion of groundwater hasresulted in the birth of a recharge movementknown as “Swadhyaya.” In Tamil Nadu, anumber of NGOs are concerned with groundwateroverdraft problems and have initiated work on thecreation of percolation ponds and watershedmanagement. Responses by the state governmenthave, however, been minimal. Electricity forgroundwater pumping is provided to farmers freeof charge by the government. This provides astrong incentive for overextraction of groundwater.In addition, although a draft bill to enablegroundwater regulation was prepared a fewyears ago, the government has yet to pass anylegislation to regulate groundwater use in the state.The only point where large-scale investments arebeing made that could address groundwateroverdraft is in the modernization of irrigationtanks. This has attracted considerableinternational support from the EuropeanEconomic Community (EEC), the Japanesegovernment and The World Bank (through theongoing Water Resources Consolidation Project).Rehabilitation of irrigation tanks is likely toincrease recharge and could have a significantimpact on water availability in local areas.
Where pollution problems are concerned, socialmobilization has been much greater than aroundoverdraft problems. This has led to the array ofprotests and the court action discussed above.Numerous spontaneous actions (processions,demonstrations, hunger strikes and impoundingof tankers transporting water from villages tourban industries) have also occurred. In mostcases, women have participated in large numbersin these demonstrations because they are mostaffected by pollution problems. These actionshave, however, had minimal impact on overallpollution levels. In addition, some sections of thepopulation view water pollution as unimportantand feel that little would be gained by furtheropposition to it. This study indicates, however,that environmental damage to groundwater is nota sporadic occurrence and has major socialimplications. Groundwater pollution is severe inriver basins such as the Palar, Noyyal, Bhavani,Kalingarayan Canal, Amaravathi and Kodaganar.As a result, it is essential to document the situationand raise public awareness regarding itsconsequences. In the long run, public awarenessand concern should help catalyse governmentaction to address pollution problems.
A key tension in developing widespread supportfor initiatives to address pollution problems isrelated to economic development. Initiatives toreduce pollution are widely viewed as conflictingwith economic development objectives. Tanneriesand other polluting industries generate substantialemployment and many feel that attempts tocontrol pollution are likely to reduce employment.Some political parties subscribe to this view and

152
C O N F L I C T S O V E R T H E I N V I S I B L E R E S O U R C E
one national party protested strongly when someof the polluting industries were closed followingthe Supreme Court’s directive. In addition,political parties in the region are often unwillingto oppose industrialists (who are an importantsource of support for political activities) or riskweakening their support bases among the workersemployed in these industries.
Pressure by industry and worker interests has,to some extent, been counterbalanced by NGOs.Many NGOs are active in regions affected bypollution. They create awareness among thepeople, represent their cases to governmentauthorities in court and assess environmental andeconomic damage due to pollution. The publicinterest litigation filed by the Vellore Citizens’Forum in 1991 is a case in point. This initiatedmajor judicial intervention in Tamil Nadu. Thecase lasted five years before a historic judgementwas passed by the Supreme Court in 1996. Underthis judgement the central government was urgedto create an authority, headed by a retired judgeof the High Court, to assess damage and forcepolluters to pay compensation to affected groups.After this judgement, one NGO in the KodaganarRiver basin identified 27 villages that had seriousdamage to land, houses, cattle and crops, as wellas loss of employment and health problems. Forall these losses, the total amount of compensationclaimed was about Rs 104 million. This case iscurrently being taken through the courts withsupport from the NGO.
Public litigation cases filed by the individualsand supported by the NGOs, have led to the closureof the polluting industries like the tanneries andthe dyeing and bleaching units in many parts ofthe state. On the whole, the pressure exerted on
the government by the people, NGOs and the courtshas been substantial. Whether the government willtake effective action, however, is yet to be seen.Currently most action is through the Tamil NaduPollution Control Board. Although it is supposedto control and monitor pollution, this board is farfrom effective and does little beyond issuingreminders or guidelines. Some of this may be dueto ambiguous government policies: On one hand,the government strongly supports textile andleather exports to earn foreign exchange. At thesame time, under the threat of court orderedclosure of the polluting industries, the governmenthas been trying to encourage and subsidize theinstallation of common effluent treatment plants.The government wants to avoid unpopular policydecisions such as closures that would lead tomassive retrenchment of workers and underminetheir support from industrialists. In sum, thegovernment does not seem to have any long termpolicy to handle the situation. They neither collectany systematic information nor do they encourageany public debates on these critical issues.
Emerging issues requiringexamination
The detailed analysis of the existing studies andthe official data supplemented by a rapid surveyin the basin areas, have helped to identify issuesfor research that are central to the question of localmanagement. Some of these issues are listed below:
(i) To what extent are economic development andenvironmental protection goals actually in conflictwith regard to both pollution and groundwateroverdraft? If effective and affordable pollutioncontrol mechanisms can be identified, for example,incomes and employment associated with the
Publicawareness and
concern cancatalysegovernment
action toaddresspollution
problems.

C O N F L I C T S O V E R T H E I N V I S I B L E R E S O U R C E
153
tannery and textile industries could remain highwhile the negative impacts of pollution areaddressed. This would reduce the tension betweenenvironmental protection and economicdevelopment goals. It could also be a key factorbreaking the deadlock between interest groups thathas, so far, limited effective local responses topollution. In addition, documentation of economiclosses due to pollution (such as yield declines andhealth costs) could provide some perspectiveregarding the economic value of pollutingindustries and their critical role in regionaldevelopment. Overall, economic and technicalresearch to identify ways pollution can beaddressed without reductions in income andemployment, and to document economic lossesdue to pollution, appear central to any localmanagement solution.
(ii) To what extent are emerging overdraftproblems related to agricultural versus urban/industrial uses of groundwater? Local farmers’associations often claim that agricultural wells areadversely affected by pumping for industrial andother uses. Quantification of different uses isessential to determine what types of action(improvements in agricultural use efficiency,limitations on industrial pumping and watertransport, etc.) could have a significant impact onoverdraft problems.
(iii) To what extent do local water marketsrepresent equitable and efficient mechanisms forallocating scarce water supplies? A detailedanalysis of water market characteristics and theirfunctioning for drinking, agricultural andindustrial uses is critical in evaluating the rolethey could play in water management at the locallevel. If they function in an inequitable manner
as part of interlocking agrarian markets the neteffect could be socially negative. If, on the otherhand, they enable access to water for low-incomegroups and the reallocation of water to sociallyhigh value uses, they could be key tools for watermanagement. A comprehensive evaluation of thepolitical economy of water markets in the studyareas is needed.
(iv) Can institutional or other mechanisms beidentified to address the problem of competitivewell deepening? The dynamics of competition arerelatively well understood as are the implicationsfor present and future generations. How the viciouscycle of competition might be addressed is one ofthe core challenges that must be addressed by anymanagement system.
(v) What institutional structures might enableeffective management of both overdraft andpollution problems? Insights into this may bepossible to gain through analysis of traditionalirrigation institutions and the ways thoseinstitutions have responded to technology changes(the introduction of energized wells) and economicchanges (the development of industries in areasthat were once dominantly agrarian).
(vi) To what extent must managementapproaches address both surface and groundwaterresources? Is there a positive association betweenthe large-scale emergence of wells and the dryingup of surface water bodies such as tanks, or havetanks declined due to reductions in maintenance,siltation and environmental changes throughoutthe basin?
(vii) A final key issue relates to monitoring. Giventhe high variability of groundwater conditions in
Addressingpollution in a
meaningfulmannerrequires
sustained policyreform and
public dialogue.

154
C O N F L I C T S O V E R T H E I N V I S I B L E R E S O U R C E
hard rock zones and difficulties in monitoringextraction rates, the bi-annual water levelmeasurements in drinking wells carried out byCentral and State Groundwater Boards provide littleindication of conditions in agricultural wells.Water levels often drop rapidly on a seasonal basisand extraction rates vary greatly even betweenadjacent locations. Farmers often experienceextreme water scarcity even when officialmonitoring data show no long term water leveldeclines. As a result, new data collection andmonitoring systems are needed that provideinformation on conditions as experienced by waterusers. A key research question, therefore, relatesto the types of information and data necessary tomonitor groundwater problems and communicatethem to local users and managers.
Summary And PolicySuggestions
This paper probes into the nature of conflictsover the use of groundwater and provides insightsinto the forces limiting the effectiveness of effortsto seek remedies.
Within rural areas, conflicts occur betweenusers due to the inherent restrictions wellownership patterns create on access to thisimportant productive resource. Conflicts also reflectthe ambiguous nature of property rights togroundwater. Some of the dimensions of conflictin rural areas include:
(a) As land becomes fragmented, well ownershipis also fragmented into shares creatingmanagerial problems. Eventually, disputes betweenshareholders arise and wells fall into disuse or arepurchased by a resourceful shareholder.
(b) Conflicts between well owners emerge as waterlevels drop. This leads to a process of competitivedeepening in which individuals with luck andsufficient resources who can afford the costs ofdigging can maintain access to water while othersare gradually excluded.
(c) Trading in groundwater commonly leads toconflict between water sellers and purchasers. Inmany situations, the unequal trading relationshipand relative poverty of water purchasers causesenormous friction.
(d) Unregulated pumping in tank commandareas and near the river beds is affecting surfacewater sources such as tanks and spring channels.Studies indicate that the rapid growth of wells intank command areas is a primary cause of thedecline of traditional institutions for tankmaintenance.
Conflict over groundwater between rural andurban areas occurs for at least two reasons: (a)The transport of groundwater from rural areas tomeet increasing municipal and industrial waterneeds, and (b) the environmental damage togroundwater by industrial pollution. Farmersbelieve groundwater transport to urban orindustrial areas is a major cause of depletion inrural areas and has caused a major decline inagricultural activities. In addition, untreatedeffluent from industrial uses is causing permanentdamage to soil and groundwater aquifers.
Legal measures are essential in order to protectand regulate groundwater. Perhaps the mostimportant factor would be to separate the right togroundwater use from land ownership. Attemptsto define and clarify groundwater property rights
Reconcilingenvironmental
anddevelopmentgoals will
requireaddressingoverdraft,
pollution andmanagingnegative impact
of imperfectmarkets.

C O N F L I C T S O V E R T H E I N V I S I B L E R E S O U R C E
155
and remove current ambiguities are essential. Inaddition, some legal mechanisms are necessary toregulate water markets in rural areas for bothagricultural and non-agricultural purposes. Overthe short term, direct regulation of well depths,for example, may be a practical mechanism foraddressing water level declines and reducingproblems associated with competitive deepening.Finally, the official policy of supplying freeelectricity for agricultural purposes needs reform.A uniform electricity tariff for agricultural purposesshould be evolved for all states to curb waste andmisappropriation of subsidies as well as to
discourage use of electricity subsidy policies aspolitical tools (MIDS, 1988 and Lindberg, 1996).
Where pollution is concerned, existingabatement laws are ineffective and need to bereformed to ensure that those who are responsiblefor pollution of the environment and groundwatercan be held accountable. Damage caused bytanneries, dyeing and bleaching industries ispermanent and imposes severe negativeexternalities on future generations. Thoseresponsible for the pollution should not beable to absolve their responsibility by erecting
Disputes overgroundwater are
related to:� land
fragmentation
� competitivewelldeepening
� groundwatertrading, and
� the impact of
pumping onsurfacesources.
Figure 8Dynamics of groundwater use and emerging conflicts.
������������
���������
���������
���������������
��� ����!��������"�,��$�%����
�����������#���"������'��������6�5��&���,�5�$���%�
�����$����!��������"������������������,3*%��$-��,������
�������"��������1�$��%�1�%���'�������&&%�
��)&�����1�����&����,*��'�%%��'����
���+%�$�����������1������+�7����%���'����'�%%����+%�$��*��'����'������%%��������&��$-��������+%�$��*��'�������+�$�
����,�����'����
��������
���������������
��� ����!��������"�������5������,�����*%��$-��,
����������
�������������������$�&�%���&&%������+��)�����%������
�������"��������1�$��%�1�%���'�������&&%�
%�&���'�
� ������'����������&%�����
� �,��$�%����%�������,������3���)&%��)���
� �$%����������%������� $��&&�������5��&�%%�����
� ���%�-�-�8���
� ��,-���$�����+�%�1��,
�!����'�
� �)&%��)���
� ��$������� ��,��$�%��������&��
!���!��

156
C O N F L I C T S O V E R T H E I N V I S I B L E R E S O U R C E
Accountability
lies at the coreof addressingproblem of over-
exploitationandenvironmental
degradation.
treatment plants that are often nonfunctional. InTiruppur for instance, many dyeing and bleachingunits started erecting the treatment plantsreluctantly after being ordered to do so by thecourt.9 In fact, many only started after theiroperations were affected by groundwaterpollution.10 For this reason, it is of paramountimportance to devise legal measures that
enforce the “Polluter Pays Principle.” This couldbe used both to internalize the cost of externalitiesand to recover the cost of permanent damagealready caused to groundwater and otherenvironmental values. Finally, public educationregarding the causes and consequences of over-exploitation and environmental degradation for thegroundwater resource is essential.
C O N F L I C T S O V E R T H E I N V I S I B L E R E S O U R C E
157
Notes
1 A survey of 1,100 sample wells in 27 villages of the Vaigai River basin (in southern Tamil Nadu) indicated that, on average,about one-third of the wells in that region are jointly owned (Janakarajan and Vaidyanathan, 1997). In a similar survey of1,064 sample wells in 26 villages of the Palar River basin, the incidence of joint well ownership was 20 per cent (Rajagopaland Vaidyanathan, 1997). A separate unpublished report of a survey of 8 villages in the Palar basin carried out by thisauthor and Barbara Harriss in 1993/94 indicated that a much higher percentage of wells (47%) were jointly owned.
2 See, for instance, Shah, 1993; Kolavalli and Chicoine, 1989; Shah and Vengamaraju, 1988 and Moench, 1994. For moredetails on water sale in Tamil Nadu, see Janakarajan, 1992; Narayanamoorthy, Vaidyanathan and Janakarajan, 1989 andJanakarajan and Vaidyanathan, 1997.
3 For evidence in the other parts of the state, see also: Folke, Steen, 1996. Ruth Meinzen-Dick in her study of Pakistanfound that the water purchasers in her study areas also enter into informal contracts with water sellers in the form of sharecropping for water. Water purchasers were expected to bring fuel wood or provide other similar services in return (Meinzen-Dick, 1996).
5 These include Thongutti palayam, Kandiyan koil, North Avinashipalayam and Perunthozhuvu revenue villages.
6 A detailed investigation in this area by Blomqvist (1996) confirmed the scarcity situation. She documented that the waterlevels had fallen due to the extensive pumping by industrialists and that shallow wells had dried up resulting in the scarcityof water supply.
7 Blomqvist (1996) observes that the occasional sight of water tankers filled with good quality water in a drought affected,water starved region triggered demonstrations and the blocking of roads: “In 1993, a wave of agitation against the waterlorries was organized along the road between Tiruppur and Dharapuram, one of the main water transport corridors” (pp70-71). Among the other areas where agitations are reported are Pongalur, Palladam, Sultanpet, Avinashi, Muthanampalayam,Nallur, Veerapandi, Mudalipalayam, Murugampalayam and villages around Dharapuram. Also, from another source:“Depletion of the groundwater level in villages near Tiruppur like Mandapam, Peruntholuvu, Orathapalayam has affectedagriculture, and farmers have registered their protest against groundwater extraction for selling/industrial purposes (TiruppurConsumers Council) (Appasamy, 1994, p 71).
8 Villages affected by groundwater pollution include Orathapalayam, Kodumanal, Pudur, Siviyarpalayam, Ramalingapuram,Thammareddipalayam, Namakkarampalayam, Semman Kuzhipalayam and Kamatchipuram.
9 Only after the intervention of the Madras High Court in March 1997 did the dyeing and bleaching units in Tiruppur takeup the issue of erecting treatment plants. The report submitted by the Pollution Control Board to the Madras High Court inJune 1997 stated that many units had not taken steps to erect the treatment plants and were operating without the consentof the Board. Only 31 had fully completed the work. On 23rd June, 1997 the Madras High Court ordered the immediateclosure of 44 units that had not begun to erect the plants. It granted four months time to complete the work to 708 othersthat had plants in various stages of construction (The Hindu, June 24th, 1997).
10 Detailed interviews carried out by Blomqvist (1996) with the owners of dyeing and bleaching units clearly reveal this point.Many owners expressed a deep concern about the polluted groundwater in Tiruppur and in the neighbourhood. One of thelarge dyers stated that, “All dyers are well aware that we are polluting. We know that we ourselves will get affected. ?Wehave invested in the industry here, and all those investments are going to be ours forever. If it is risky to live in Tiruppur,if it gives health effects, then what will be the use? Even now, people who can afford to send their children to school in Ootywill do so. My daughter goes to a school in Nilgiris. And when the children come back home for a vacation, they have togo the doctor week, which is not necessary when they are in school. If it is like that, everything will be in vain, all the hardwork. ....” (p. 156).

158
C O N F L I C T S O V E R T H E I N V I S I B L E R E S O U R C E
Bibliography
Appasamy, P. (1994). Sharing Common Water Resources: Urban Study A Review, background paper for Policy AdvisoryCommittee Meeting, Chennai, Madras Institute of Development Studies, unpublished mimeo.
Asian Development Bank (1994). Tamilnadu Environmental Monitoring and Pollution Control, Unpublished study carriedout by Stanley Associates Engineering Ltd., Canada, for Tamilnadu Pollution Control Board, Madras (three volumes).
Bhatia, B. (1992). Lush Fields and Parched Throats: Political Economy of Groundwater in Gujarat’, Economic andPolitical Weekly, Vol.27, Nos.51 and 52.
Blomqvist, Anna. (1996). Food and Fashion: Water Management and Collective Action Among Irrigation Farmers andTextile Industrialists in South India, Linkoping, Linkoping University.
Census of India (1991). General Population Tables (1961, 1971, 1981), New Delhi, Government of India.
Central Pollution Control Board, (1995). Groundwater Quality in Problem Areas: A Status Report, Part-II, New Delhi,Government of India.
Nanjamma, C. (1977). Adoption of the New Technology in North Arcot District, in Farmer B.H., (ed), Green Revolution?Technology and Change in Rice Growing Areas of Tamilnadu and Sri Lanka, New York, Macmillan.
Folke, S. (1996). Cauvery Delta: Canal and Well Irrigation and Conflicts over Land and Water, unpublished, mimeo.
Planning Commission (1989). Report of the Eighth Five Year Plan, New Delhi, Government of India.
Harriss, J. (1982). Capitalism and Peasant Farming: Agrarian Structure and Ideology in Northern Tamilnadu, Bombay,Oxford University Press.
Institute of Water Studies (1992). Water Resources Assessment and Management Strategies for Palar Basin, Madras, WaterResources Organization, Government of Tamilnadu.
Jacob, C.T. (1996). Impact of Industries on the Groundwater Quality of Tiruppur and Ethical Implications, Chennai,unpublished thesis submitted for the award of the Doctor of Philosophy, University of Madras.
Jack G., Kilhage, M., and C. Magnnssan (1994). The Environmental Costs of T-Shirts, paper presented at the PolicyAdvisory Committee meeting on Sharing of Common Water Resources, Chennai, Madras Institute of Development Studies.
Janakarajan, S. (1986). Aspects of Market Inter-relationships in a Changing Agrarian Economy: A Case Study fromTamilnadu, Thesis submitted for the award of the Doctor of Philosophy, Chennai, University of Madras.
Janakarajan, S. (1992). Interlinked Transactions and the Market for Water in the Agrarian Economy of a TamilnaduVillage, in S.Subramanian, (ed), Themes in Development Economics: Essays in Honour of Malcolm Adiseshiah, DelhiOxford University Press.
Janakarajan, S. (1993). In Search of Tanks: Some Hidden Facts, Economic and Political Weekly: Vol. 28, No. 26.
Janakarajan, S. (1996). Complexities of Agrarian Markets and Agrarian Relations: A Study of Villages in NorthernTamilnadu. Paper presented in a workshop on Adjustment and Development: Agrarian Change, Markets and Social Welfarein South India, 1973-1993, Chennai, Madras Institute of Development Studies.
Janakarajan, S. (1997). Consequences of Aquifer Over-exploitation: Prosperity and Deprivation, Review of Developmentand Change, Vol.II No.1.
Janakarajan, S. and A. Vaidyanathan. (1997). Conditions and Characteristics of Groundwater Irrigation: A Study of VaigaiBasin in Tamilnadu. Report of a research project sponsored by the Planning Commission, Government of India, Chennai,Madras Institute of Development Studies.
Kolavalli, S. and D.L. Chicoine (1989). Groundwater Markets in Gujarat, India, Water Resources Development, Vol.5.

C O N F L I C T S O V E R T H E I N V I S I B L E R E S O U R C E
159
Lindberg, S. (1996). While the Wells Went Dry: Tragedy of Collective Action Among Farmers in South India’, chapter forthe anthology: From “Wild Pigs to Foreign Trees,” draft.
Madras School of Economics (1998). Economic Analysis of Environmental Problems in Tanneries and Suggestions forTaking Action, unpublished document, Chennai, Madras School of Economics.
Meinzen-Dick, R. (1996). Groundwater Markets in Pakistan: Participation and Productivity, Research Report 105,Washington D.C. International Food Policy Research Institute.
MIDS (1988). Tamilnadu Economy: Performance and Issues, chapter-6, New Delhi, Oxford and IBH Publishing Co.
Moench, M. (1992). Chasing the Water Table: Equity and Sustainability in Groundwater Management, Economic andPolitical Weekly, Vol.27.
Moench, M. (1994). Selling Water: Conceptual and Policy Debates over Groundwater Markets in India, VIKSAT, PacificInstitute and Natural Heritage Institute Collaborative Groundwater Project, Ahmedabad, VIKSAT.
Naryanamurthy N. (1987). Murder by Poisoning - Death of the Palar, in Agarwal, A., D’Monte, D., and U. Samarth (eds),The Fight for Survival: People’s Action for Environment, New Delhi, Centre for Science and Environment.
Palanichamy, N.V. and K. Palanisamy (1994). Groundwater Pollution in Tiruppur Town, Background paper for PolicyAdvisory Committee Meeting, Chennai, Madras Institute of Development Studies.
Palanisamy, K., Balasubramanin, R., and A. Mohamed Ali (1996). Management of Tank Irrigation by Government andCommunity: An Economic Analysis of Tank Irrigation Performance in Tamilnadu, Coimbatore, Water Technology Centre.
Rajagopal, A. and A. Vaidyanathan, (1997). Conditions and Characteristics of Groundwater Irrigation in the Palar Basin,some preliminary results, Chennai, Madras Institute of Development Studies.
Rajarathinam, N. and K. Santhanam (1996). Industrial Pollution Affecting Upper Palar Environ, paper presented in aseminar on Ecology, Environment and Water Management, Tiruchi, Irrigation Management and Training Institute.
Rao, D.S.K. (1993). Groundwater Over-exploitation Through Bore-Holes Technology, Economic and Political Weekly,Vol.38.
Sahasranaman, A. (1997). Tanneries in Tamilnadu, Indian Leather, Feb. 1997.
Shah, T. (1993). Groundwater Markets and Irrigation Development: Political Economy and Practical Policy, Bombay,Oxford University Press.
Shah, T. and K. Vengamaraju (1988). Groundwater Markets and Small Farmer Development, Economic and PoliticalWeekly, Vol.23, No.13.
Tamilnadu Pollution Control Board (1996). Annual Report, Chennai, Government of Tamilnadu.
Teekaraman, G. et al., (1982). A Study on the Influence of Tannery Effluent on Soils, Water and Crops in North ArcotDistrict, Soil Survey and Land Use Organization, Chennai, Government of Tamilnadu.
Teekaraman, G and F. Ahmed (1990). A Study on the Influence of Tannery Effluent on Soils, Water and Crops in NorthArcot Ambedkar District, Soil Survey and Land Use Organization, Chennai, Government of Tamilnadu.
Vaidyanathan, A. (1996). Depletion of Groundwater: Some Issues, Indian Journal of Agricultural Economics, Vol.51,Nos.1 and 2.
Vaidyanathan, A and S. Janakarajan (1989). Management of Irrigation and Its Effect on Productivity Under DifferentEnvironmental and Technical Conditions: A Study of two Surface Irrigation Systems in Tamilnadu, Report submitted tothe Planning Commission, Government of India, Chennai, Madras Institute of Development Studies.
Vaidyanathan, A., K. Sivasubramaniyan, A. Rajagopal, and S. Mariasusai, (1998), Tanks of South India, draft, MadrasInstitute of Development Studies.

Historical Perspectives onConflicts over Domestic andIndustrial Supply in theBhavani and Noyyal Basins,Tamil Nadu
Velayutham Saravanan and Paul Appasamy
C H A P T E R 4

H I S T O R I C A L P E R S P E C T I V E S O N C O N F L I C T S O V E R D O M E S T I C A N D I N D U S T R I A L S U P P LY
162
Domestic Water Supply: 1890-1970
This chapter is an account of the history ofconflicts between farmers, municipalities,
urban residents, industry and the state over waterin the Bhavani and Noyyal river basins,particularly the areas surrounding Coimbatore andTiruppur, from the late nineteenth century (1890)to the 1970s. The information in this chapter ismostly synthesized from government orders anddocuments on board proceedings of the TamilNadu Water and Drainage Board (TWAD) foundat the Tamil Nadu State Archives in Chennai.1 Thework represents a counterpoint to the more field-based work, undertaken partly in the same area,that has been presented in the previous chapters.
The chapter examines the nature of conflictsthat emerged between different groups associatedwith diversion of water from the Bhavani andNoyyal Rivers for domestic and industrial watersupply. It does this by attempting to answer aseries of questions regarding conflicts and theirdynamics in the course of everyday life. Was thereany opposition to the municipality from urbanpeople over fixing water tax? Was there any clashof interests between the municipality, farmers, the
Introduction
public works department and the state? Did farmersprotest against diversions? If so, how did thegovernment address issues and what assuranceswere made to farmers in the basins regarding theirconcerns? What policy was adopted by thegovernment to resolve conflicts? Answers to thesequeries increases understanding of the nature ofwater conflicts both between different sectors andwith different governmental agencies inCoimbatore and Tiruppur.
In addition to the above queries the study alsoexamines whether the government considered theimportance of irrigation and the traditional rightsof the farmers in the Bhavani and Noyyalrivers and their tributaries and channelsbetween 1890 and 1970. This report consistsof four sections in addition to the introduction.The first section deals with the history ofdrinking water supply to Coimbatore and Tiruppur,the second narrates the chronology of waterdiversion from the Bhavani River basin to theNoyyal River basin for agricultural purposes, thethird analyses the conflicts, and the last containsconcluding observations.
Competitionand conflict
over water usebetween sectors,regions, and
stakeholdershas a longhistory in Tamil
Nadu.
The Problem
Diversion of water for purposes other thanagriculture has been a major source of
conflict. The concept of diverting water from theBhavani and Noyyal river basins to supplyCoimbatore and Tiruppur along with their
associated industries emerged at the end of thenineteenth century. It was implemented during thesecond quarter of the twentieth century.
Drinking water problems are often crucial forgrowing cities, towns and in some cases villages.In most areas, water needs are initially met

163
H I S T O R I C A L P E R S P E C T I V E S O N C O N F L I C T S O V E R D O M E S T I C A N D I N D U S T R I A L S U P P L Y
through local sources, such as wells and tanks,but growing urban demands often rapidly exceedsupply from these sources. In both Coimbatore andTiruppur problems of water supply wereparticularly intense.
Coimbatore faced water supply challengescompared to many other cities because drinkingwater was mainly extracted through the wells, andlocally available supplies were saline and scarce.Since the late nineteenth century, Coimbatore’spopulation has grown rapidly and the city emergedas a centre of industrial activity. As this occurred,the requirement for water assumed ever greaterimportance. The population of Coimbatore was53,000 in 1901, by 1971 it had increased to565,293 (figures for the 1981 city boundaries). Thefirst textile unit was established by the British in1888 and a local entrepreneur established a millin 1907. Since then, a number of other industrieshave been established. In 1995, there wereapproximately 150 large-scale textile units, 350small spinning mills, 20,000 powerless and 40,000handloom units, 2,000 knitting units, 500 steelcasting foundries, and 350 electric motor foundriesin the city. In addition, many other industrial unitswere established. Due to population and industrialgrowth demand for water increased greatly.Consumption in 1931 was 11.3 mld, supplying90,000 individuals at the rate of 126 litres per day.In 1971 this increased to 13 mld and by 1991 itwent up to 85 mld and was distributed at the rateof 103 litres for 820,000 people. To meet theincreasing demand, the municipality tried toextract water from tanks and streams adjoiningthe city. Due to the non-availability of good qualitywater in these sources, diversion of water from theBhavani, Noyyal and its tributaries was activelyconsidered at the end of nineteenth century.
The water supply situation in Tiruppur is alsoextreme. Tiruppur is known for its knittingindustries and is located on the banks of theNoyyal River. Water availability problems have,however, been severe since the 1930s due to bothpopulation and industrial growth. The totalpopulation of Tiruppur was 6,056 in 1901 and roseto 128,228 in 1971 (figures for 1991 boundaries).The numbers of industries also have increaseddramatically. By 1995 there were 8,437 units ofwhich 713 were water intensive units and therequirement of water for industrial use was 90million litres per day. Much of this was utilizedby the 526 dyeing units present in the town.
History of Coimbatore WaterSupply Schemes
Constituted as a municipality on November 20,1866, Coimbatore is spread over about 10 squaremiles in 10 revenue villages (Coimbatore, aportion of Telungupalayam, Ramanathapuram,Krishnarasapuram, Sanganur, Anupparpalayam,Puliakulam, Kumarapalayam, Savaripalayam andGanapathi). Though located near the NoyyalRiver, drinking water availability is limited.Rainfall levels are low (Table 1) and due to thelow storage in underlying hard rock formations,groundwater is also scarce. The quality of water isalso very poor. Groundwater in the regioncontains lime, probably also with magnesium andother salts. Because of its poor quality, availablegroundwater could not be used for industrialboilers, dyeing, cloth and other manufacturingpurposes and was also poorly suited for domesticconsumption. Tanks in and around the city areeither situated in elevated locations not suited fordrawing water from or are highly unreliable watersources. In addition to naturally occurring quality
Higher waterdemands in
urban areashave been
triggered by
population andindustrial
growth.
Year Rainfall(inches)
1893/94 22.43
1895/96 17.53
1897/98 13.44
1899/1900 24.89
1901/02 28.04
1903/04 31.83
1905/06 17.54
1907/08 19.87
1892/93 15.12
1894/95 16.24
1896/97 27.17
1898/99 25.11
1900/01 25.11
1902/03 32.01
1904/05 14.38
1906/07 33.32
1908/09 26.77Source: G.O.No.145 Mis WPWD[B and R], 15-11-1917,Tamil Nadu State Archives,Chennai (hereafter TNSA).
TABLE 1:Rainfall in Coimbatore:1892/93-1908/09

H I S T O R I C A L P E R S P E C T I V E S O N C O N F L I C T S O V E R D O M E S T I C A N D I N D U S T R I A L S U P P LY
164
District Jail Main Gate Jail GardenWell Well Well
Total solids (grams per litre) 1.610 1.730 1.580
Volatile solids do 0.320 0.390 0.320
Chlorine do 0.398 0.390 0.355
Total hardness Clarks scale 49.000 49.000 49.000
Permanent hardness 15.750 26.250 22.750
Free Ammonia Ml (grams per litre) 1.160 0.080 0.160
Albunminoid 0.120 0.040 0.080
Nitric acid 11.250 11.250 15.000
Apparent quality of the wateras inferred from the resultsobtained on examination Bad Bad Bad
of the towns and villages located along these riversas early as the late nineteenth century. Insufficientand bad quality of water caused the spread ofcholera and other diseases. For example, inCoimbatore 96 persons were affected by epidemicsin 1926-27 of whom 59 died. In 1927-28, 86 ofthe 127 affected lost their lives (G.O.No.9 Mis LSG[L and M], 4-1-1932). Finally, the governmentinitiated diversion of water from the Bhavani andNoyyal and their tributaries. A brief account ofthe different water supply schemes for Coimbatoreis presented before analysing the other issues. Thedifferent schemes are listed in Table 3 and thendiscussed in detail in the following subsections.
Muthikulam Scheme
The Siruvani Project is the oldest in the historyof Coimbatore Water Supply Schemes. The firstrecord of it is in an inspection note by ColonelMontgomery in 1879 (G.O.No. 1453 W, PWD [Band R-Civil Works], 15-11-1917). The governmentdid not, however, consider the proposal until the1880s when the Coimbatore Municipal Councilconsidered various possible schemes. In the late1880s, the government proposed construction of amulti-purpose dam across the Bhavani at itsjunction with the Siruvani River, that is, a tributaryof the Bhavani, for drinking water supply toCoimbatore and also to irrigate about 2,000 acresin the Noyyal basin. This was dropped in 1890 fortwo reasons. First, during low flow periods,diversion of water from Siruvani could affectthe large irrigation channels which take offfrom the river between the towns of Mettupalayamand Bhavani. Second, supply across the chainof hills between Mettupalayam and the NoyyalRiver would require a huge investment forexcavating or tunnelling. As a result, the
Source: G.O.No.53 Mis L and M (M), 16.1.1893, TNSA.
problems, by 1890 much of the groundwater inCoimbatore was contaminated (see Table 2).However, the municipality did not consider anyother sources of water supply for the town. Untilthe 1880s, the Coimbatore Municipal Councilmanaged these problems through repairing theexisting wells in the different parts of the city. Noattempt was made to bring water from the riversand other sources (G.O.No. 184 Mis, L and M [M],14-2-1889).
Part of the apparent reluctance to developalternative water sources was cost. Schemesproposed in the late 1800s were often prohibitivelyexpensive. Part of the reluctance may also havebeen the limited nature of supplies available withinthe region. Towns and villages neighbouring theBhavani and Noyyal rivers did not have sufficientgood quality drinking water and were dependentupon nearby wells and public tanks. Groundwaterin these regions, as in Coimbatore, was hard andits availability was very limited. Due to the growingpopulation, industries and the process ofurbanization, water problems were acute in most
As early as the1890s, scarcity
and poor waterquality inCoimbatore led
to interbasintransferproposals.
TABLE 2:Chemical and Bacteriological Examination in Different Wells ofCoimbatore: 1890.

165
H I S T O R I C A L P E R S P E C T I V E S O N C O N F L I C T S O V E R D O M E S T I C A N D I N D U S T R I A L S U P P L Y
Year Proposal Name of the Scheme Water Source(s) Dropped/Finalized RemarksMade1888 Muthikulam Scheme Bhavani River Dropped in 1890 Prohibitive cost1892 Noyyal River Scheme Noyyal River Dropped in 1893 Prohibitive cost1901 Chitrachavadi Channel Chitrachavadi Dropped in 1901 Bad quality of water
and Rajavaikkal of Channel andNoyyal River Rajavaikkal of
Noyyal River1907 Kistnambadi Tank Chitrachavadi Dropped in 1908 Protest from
Scheme Channel of farmers, agri,Noyyal River farm and other
downstream villages;and bad quality of water
1909 Sub-Artesian Springs, Sub-Artesian Dropped in 1912 Prohibitive cost andSinganallur Scheme Springs, poor financial
Singanurpallam conditions of theValley Singanallur municipalityTank
1912 Siruvani I Siruvani River Finalized in 1924 Best water at lowcost of the scheme
1928 Anayar and Periyar Anayar and Periyar Finalized in Temporary waterScheme Streams 1929 and 1930 supply
1956 Siruvani II Siruvani River Finalized in 1970 Supply of waterincreased
1980 Bhavani River Bhavani River Finalized in 1989 Supply of waterincreased
Difficulties incompensating
users led to therejection of
several schemes
for waterdiversion.
government decided that diversion of the westflowing streams into the Noyyal basin wasimpracticable (G.O.No. 556 I PWD, 7-10- 1890).
Noyyal River Scheme
In 1892, the government explored thepossibility of bringing water from the head sluiceof the Kurumymookoor channels some milesabove the Vellalore anicut (small dam/weir) ofthe Noyyal River. This proposal also did not takeoff because the proposed location of the filtrationgallery had valuable coconut topes and lackedapproach routes for delivering material forconstruction and fuel storage. Furthermore, a largeamount of funds were required to compensate theowners of coconut topes and to establish the roads.
In addition, water quality in the Noyyal River waspoor (see Table 4). Ultimately, the proposal wasdiscarded due to the prohibitive cost (G.O.No.53Mis. L and M [M], 16-1-1893).
Muthannankulam Tank Scheme
In 1901, Coimbatore Municipal Councilproposed storing water from Chitrachavadi andRajavaikkal canals (which drew water fromon the Noyyal River) in the Muthannankulamtank for water supply to Coimbatore. This tank islocated at the northern end of Coimbatoretown. It is higher than the town and spreadover about 9.75 acres. A proposal was made toenlarge the tank to store water for a period of 3 to5 years. This proposal was, however, dropped
TABLE 3:Details of Different Sources of Coimbatore Water Supply Proposals/Schemes

H I S T O R I C A L P E R S P E C T I V E S O N C O N F L I C T S O V E R D O M E S T I C A N D I N D U S T R I A L S U P P LY
166
Total solids 38.00
Total hardness parts per 1,00,000 28.00
Permanent hardness 8.500
Chlorine 4.970
Free Ammonia 0.009
Albunmnoid Ammonia 0.008
Nitric acid (N02) Nil
Oxygen absorbed (Tidy’s process) 0.068
Nitrates Present
Sulphates Present
Phosphates Nil
Iron, Poisonous metals Nil
Opinion of water Contaminated
Source: G.O.No.1337 Mis L and M (M), 27-6-1907, TNSA.
Contaminationwas a problem
even in the earlypart of thecentury.
because the tank received drainage from theoutskirts of the town. In addition, objections wereanticipated because the Noyyal River already hadtoo many demands on it. Also, the quality of waterat the tail end of Chitrachavadi channel wasbad and unfit for drinking (Table 5). Finally,the scheme failed to take off (G.O.No.1490 Mis Land M [M], 10-10-1901).
Kistnambadi Tank Scheme
In 1907, the government proposed constructionof a tank near the Kistnambadi tank, where theChitrachavadi channel from Noyyal discharges.This scheme was proposed in order to harnesssurplus water from the Kistnambadi tank thatwas being discharged into rivers, the Selvambaditank, and ultimately the Kumarasamy tank. Asurplus weir is present in the Kumarasamy tankand the whole amount of water flowing overthis weir would, in theory, be available for theproposed new water supply tank (G.O.NO.1664 MisL and M [M], 9-10-1908).
Total solids 0.540
Volatile solids 0.080
Chlorine 0.060
Total hardness-Clark’s scale 28.00
Permanent hardness Clark’s scale 0.700
Free Ammonia Ml 0.200
Albunmnoid 0.120
Nitric acid 0.450
Apparent quality of the water as Inferred from the results obtained on examination Bad
Source: G.O.No.53 Mis L and M (M), 16.1.1893, TNSA.
This proposal received stiff opposition from thegovernment agricultural farm and the farmers ofthe Chitrachavadi channel and other downstreamvillages (G.O.NO.1664 Mis L and M [M], 9-10-1908).The agricultural farm objected to it for thefollowing reasons:
(i) the proposed storage tank would utilizelands that would otherwise be used for the farm,the institute and the residential buildings forthe staff.
(ii) more than half of the wetlands acquiredfor experimental work by the government farmwould be taken away; and
(iii) water supply for the wetlands would beaffected in bad years (G.O.NO.1664 Mis L andM [M], 9-10-1908).
TABLE 4:Chemical and Bacteriological Quality ofNoyyal River Water: 1890. (grams perlitre except as noted)
TABLE 5:Chemical and Bacteriological Examinationof Chitrachavadi Channel Water: 1906.(parts per 100,000, except as noted)

167
H I S T O R I C A L P E R S P E C T I V E S O N C O N F L I C T S O V E R D O M E S T I C A N D I N D U S T R I A L S U P P L Y
Source: G.O.No.1337 Mis L and M (M), 27-6-1907, TNSA.
Total solids 39.00
Total hardness 20.00
Permanent hardness 0.50
Chlorine 5.325
Free Ammonia 0.010
Albunmnoid Ammonia 0.012
Nitric acid (N02) Nil
Oxygen absorbed (Tidy’s process) 0.108
Nitrates Present
Sulphates Present
Phosphates Nil
Iron, Poisonous metals Nil
Opinion of water Contaminated
Proposedschemes were
often rejecteddue to multiple
factors.
In addition to the objections of the governmentfarm, 86 landholders of the Chitrachavadi andother villages submitted a petition stating that theyhad been suffering on account of inadequaterainfall and uncertain supply of water from theChitrachavadi channel for their paddy crops andtopes. This had forced them to leave large areasof land fallow for several years. In addition, thefarmers requested a reduction in the landassessment rate or an exemption from any increaseof assessment for the next two settlement periods.As a result, they asked the government toreconsider the proposed storage tank for theCoimbatore water supply scheme (G.O.NO.1664Mis L and M [M], 9-10-1908). Finally there wasthe question of water quality. As with othersources, water in Kistnambadi tank water wascontaminated (Table 6). In addition to the abovecomplications, the project was expensive. Thestorage reservoir would have to be enlarged atconsiderable cost to hold twelve months supplies.
1. Siruvani River 15.95 47,530 5,000 0.52
Water supply
2. Sub-artesian 7.50 22,147 161,500 1.84
supply
3. Bhavani River 21.00 62,770 402,000 4.65
4. Singanallur 26.25 72,353 57,000 1.30
Source: G.O.No. 381 W PWD [B and R-Civil Works] 23-2-1915, TNSA.
Scheme Probable Probable Annual MaintenanceCost Initial Cost in Rs (lakhs)
Siruvani bund Maintenance, Total annual on ½ the pumping maintenance capital cost charges, etc. at 5.96% for 30 years
Even then there was no guarantee that supplywould be sufficient throughout the year(G.O.NO.1664 Mis L and M [M], 9-10-1908). Asa result of these factors, particularly the cost, thegovernment decided to abandon the scheme.
Sub-artesian springs and SinganallurScheme
In 1908, the government consideredundertaking a detailed study of the possibility ofsecuring sufficient water supply from newlydiscovered artesian springs near Coimbatore. Itinvited suggestions for other moderately pricedschemes with a supply source other than theNoyyal River. (G.O.No. 1664 Mis L and M [M],22-7- 1909). By 1909, the Sanitary Engineer hadfound possible sources as: (a) sub-artesian springs,(b) Sanganurpallam valley, and (c) Singanallurtank. This resulted in a request to the governmentto investigate schemes (a) and (c) (G.O.No. 1151Mis. L and M [M], 22-7-1909).
TABLE 6:Chemical and Bacteriological Examinationof Krishnambadi Tank Water: 1906. (partsper 100,000, except as noted)
TABLE 7:Cost and Maintenance of Schemes Investigated in 1912

H I S T O R I C A L P E R S P E C T I V E S O N C O N F L I C T S O V E R D O M E S T I C A N D I N D U S T R I A L S U P P LY
168
Bacteriological Examination
Total colonies per c.c. on agar at 37 IC 120
Lactose fermenters present in how many C.C 1 C.C and upwards
Result of Vibrios test No Vibrios in 100c.c
Nature of lactose fermenters isolated
and number of species Two of class II and 8
of class III.
3 species
Chemical Examination
Physical appearances:
Colour and transparency slightly yellowish but clear
Smell No
Quantitative: (in parts per 100,000)
Total solids 4 - 6
Temporary hardness Nil
Permanent hardness 1.0
Chlorine 0.3
Ammoniacal Nitrogen Trace
Albuminoid 0.0Source: G.O.No. 2158 Mis LSG (PH), 23-10-1925, TNSA.
In addition to
cost, commonproblems withproposed
schemesincluded waterquality, land
acquisitionissues, andquestionable
supplyreliability.
In 1910, the government deferred the study onthe sub-artesian sources of water supply until thefinancial conditions of the council had improved(G.O.No.1 Mis L and M [M], 3-1-1910), and in1912 the investigation of the Singanallur tankscheme was abandoned owing to its prohibitivecost and unrealiable prospects of water supply(G.O.No. 1435 M L and M, 5-8-1912). In the sameyear, the government ordered an investigation ofthe Siruvani and Bhavani rivers as sources of watersupply to Coimbatore.
Siruvani Scheme - I
In 1912, a preliminary investigation wasconducted for four possible schemes: the SiruvaniRiver, sub-artesian supply, the Bhavani River andSinganallur tank (G.0.No.381 W PWD [B and R-Civil works]).
The Siruvani River water was reported to be ofexcellent quality and the best among thoseexamined in connection with the investigation (seeTable 8). This water was uncontaminated exceptby wild animals in the hill areas (G.O.No.2158Mis LSG (PH), 23-10-1925). Considering the manyadvantages, the Sanitary Engineer recommendedthe Siruvani River scheme to the CoimbatoreMunicipal Council for consideration.
The Coimbatore Municipal Council reportedthat the high cost of the proposed Siruvani watersupply scheme could not be met with their ownresources. They recommended looking into thefeasibility of a combined hydroelectric schemewhich would be financially viable. In 1913, theSanitary Engineer submitted an alternativeapproximate estimate for a water supply schemefor Coimbatore, combined with a hydro-electricproject and some irrigation. The new scheme wasdesigned to provide water to 70,000 people inCoimbatore and to another 20,000 people in thePodanur railway shops and colony. Powergenerated would be for electricity supply toPodanur workshops, colony, Nilgiri Railways,Coimbatore colony and industrial concerns, andelectrification of at least Coiner, Wellington andOotacamand. The project would also increase thearea of wet cultivation in the Bodampatti valleyand indirectly benefit cultivation under the NoyyalRiver basin system (G.O.No. 1453 W PWD [B andR-Civil works], 15-11-1917). This combinedproject remained under consideration at least until1915, although the power component was droppedsubsequently (G.O.No.381 W PWD, 23 2-1915).
In 1919, the Sanitary Engineer submittedindependent plans and estimates for the Siruvaniwater supply scheme. This proposal envisioned
TABLE 8:Bacteriological and Chemical Examination of Siruvani Water: 1923

169
H I S T O R I C A L P E R S P E C T I V E S O N C O N F L I C T S O V E R D O M E S T I C A N D I N D U S T R I A L S U P P L Y
Year Amount(Rs in 100,000)
1924-25 0.50
1925-26 7.50
1926-27 14.75
1927-28 12.25
1928-29 6.00
41.00
Source: G.O.No. 1277 Mis, LSG(PH), 6-9-1924, TNSA.
irrigation of 2,000 acres in the Noyyal River basin,continuous water supply to 100,000 people at therate of 20 gallons per head per day and 375gallons per minute per day for industrial concerns.In 1924, the government sanctioned Rs 4,100,000on the basis of cost sharing at a 50:50 ratio withthe municipal council. The foundation stone forthe scheme was laid by Hon. Viscount Goschen ofHawkhucs, Governor of Madras on October 10,1924. Work on this scheme was started in 1925(G.O.No. 4452 Mis LSG [L and M], 14-11-1930).As a special case, the government was willing toallow its grants to be spent first and ordered thatthe expenditure would be incurred on the scheduleshown in Table 9.
Although the government was willing toallow its share to be spent first, it warned themunicipal government that any costs abovethe initially estimated amount should be metentirely from the municipal funds, otherwisethe scheme would be stopped (G.O.No.2246 MisLSG [PH], 5-11-1925). In 1926, the governmentindicated that the Coimbatore Municipalitydid not need to pay any charge for drawingwater from the Siruvani River for drinkingwater supply until irrigation could beinitiated under the scheme (G.O.No. 1814 I PWD,29-11-1926). In 1930, the government revised theestimate of the scheme’s cost to Rs 43,74,808and agreed that this was to be shared, with thegovernment paying Rs 2,357,024 andthe municipality paying Rs 2,017,784(G.O.No.2094 Mis L and M [PH], 28-8- 1930).In 1932, the government sanctioned revisedestimates amounting to Rs 4,641,650 for thecomplete scheme relating to Coimbatorewater works (G.O.No.2320 Mis W PWD, 7-11-1932).The Siruvani scheme was completed in 1931 and
drinking water supply has been available to thecity through it since then.
In addition to municipal water supply from theSiruvani, the farmers of Palladam and Coimbatoreat various times proposed diverting surplus waterfrom the Siruvani to the Noyyal River basin foragricultural use. In 1949, the governmentsanctioned Rs 67,660 for raising the height ofthe Siruvani dam by 4 ft under the ‘Grow MoreFood’ scheme. The storage level was increasedfacilitating discharge of more water into the tunnelfor irrigation purposes in the Noyyal basin. DuringSeptember 1950 and June 1951 25 to 40 cusecswere released (G.O.No. 790 Mis PWD, 2-3-1955).This was mainly used by the ayacuts (commandarea) under the Chitrachavadi channel. In July1951, following damage in the tunnel supply ofwater for the Noyyal basin, irrigation was stoppedby the municipality.
Anayar and Periyar Scheme
Before the Siruvani scheme, drinking waterscarcity was severe in Coimbatore. As a result, in1928 the government ordered water supplies to bearranged from government sources on the Anayarand Periyar rivers (G.O.No.2211 Mis Public Health19-10-1928). In 1929, the government sanctionedRs 36,240 for this scheme (G.O.No.2560 W PWD,9-9-1929), and it was further hiked to Rs 40,485in 1931 (G.O.No. 132 Mis PW and L W, 17-3-1931). Water was diverted from the Anayar Riverinto the gravitation main by means of a temporarydam which was supplemented by the Periyar River.This scheme was expected to supply 5 gallons ofwater per head per day for a population of 70,000(G.O.No.4452 Mis LSG (L and M), 14-11-1930).From March 2, 1929 water was drawn from the
As early as the1890s cost
sharing wasprevalent
between
government andmunicipality.
TABLE 9:Expenditure on SiruvaniWater Supply Scheme

H I S T O R I C A L P E R S P E C T I V E S O N C O N F L I C T S O V E R D O M E S T I C A N D I N D U S T R I A L S U P P LY
170
Water became apoint of
competitionbetween Keralaand Tamil Nadu
soon after theStates wereseparated
during statereorganizationin 1956.
Anayar and from April 18, 1927 from the PeriyarRiver. The total quantity of water drawn from boththe sources was about 300,000 gallons per day(G.O.No.1189 I PW and L, 11-4-1930).
Siruvani – II
After the reorganization of states in 1956, theTamil Nadu government approached the Keralagovernment to divert more water from the Siruvanifor drinking water purposes and also for extendingirrigation in the downstream villages. The Keralagovernment, however, refused permission(G.O.No.2393 Mis E and PH [H], 21-9- 1960). Thesubject was then included in the agenda for themeeting of the Southern Zonal Council held inApril 1960 where it was decided that the ChiefMinisters of both the states should settle the matterbetween themselves (G.O.No.2393 Mis E and PH[H], 21-9-1960).
In the meanwhile, in 1956, the Chief Engineer,PWD (Gl) in Tamil Nadu prepared a proposal toincrease storage capacity in the scheme from 2.4MCF to 425 MCF to meet the increasing demandfor more water for Coimbatore, irrigation ofdownstream villages and the Noyyal basin throughconstruction of a new dam across the Siruvani.The approximate cost was estimated to be Rs14,400,000 [11,400,000 for drinking water supplyand Rs 3,000,000 for irrigation] (G.O.No.2393 MisE and PH [H], 21-9-1960). In addition, anagreement was made between Tamil Nadu andKerala for Kerala to provide 1,300 million cubicfeet of water every year, that is 223 million gallonsdaily (TNSAR 1983-84, p.257). Based on thisnew supply agreement, a new scheme foraugmenting the Siruvani water supply (at a levelfive-fold over that of the then present rate of
supply) was inaugurated on September 15, 1970at a cost of Rs 6 crores (Tamilarasu,2 October1970, p.35). In 1977-78, the governmentsanctioned Rs 161,600,000 towards the initial costand Rs 3,500,000 for annual maintenance (TamilNadu State Administrative Report 1977- 78, p.334).Part of the works of this scheme costing Rs70,100,000 in Kerala were executed by Kerala PWDwith the Coimbatore Municipality bearing theentire amount. The remaining works in TamilNadu which cost Rs 91,500,000 were undertakenby the Tamil Nadu Water and Drainage (TWAD)Board. The “Siruvani Water Supply ImprovementScheme” of the TWAD Board was estimated to costRs 22 crores. This was taken up with loanassistance from the LIC and state government’sresources (Tamil Nadu Administrative Report1984-85, p.209).
Pillur Scheme
In 1989, the Pillur Reservoir Project wasconstructed across the Bhavani River to generateelectricity as well as to extend water supply toCoimbatore, 20 towns and 523 hamlets situatedin 99 village panchayats.
History of Tiruppur WaterSupply Schemes
The water problem in Tiruppur is an acute onedespite the fact that the Noyyal River runs throughthe town. There are two main reasons for this.First, there are about 31 irrigation anicuts acrossthe Noyyal above Tiruppur, which divert largeportions of the river’s flow. Second, the availablewater, what little there is of it, was contaminatedeven in the early twentieth century (G.O.No.660Ms L and M [M], 22-4-1918). Water problems were

171
H I S T O R I C A L P E R S P E C T I V E S O N C O N F L I C T S O V E R D O M E S T I C A N D I N D U S T R I A L S U P P L Y
Year Rainfall (inches)
1909 25.77
1910 31.45
1911 17.82
1912 26.74
1913 17.74
1914 17.08
1915 32.60
1916 23.72
1917 31.20
1918 25.16
1919 23.88
1920 22.75
1921 26.70
1922 36.08
1923 16.69
1924 24.24
1925 27.20
1926 16.70
1927 20.49
1928 27.78
1929 22.52Source: G.O.No.316 Mis LSG [PH], 10-2-1933.
Large-scaleriver water
diversion forirrigation
combined with
contaminationof available
sources added
to waterscarcity in
Tiruppur in the
early 20th
century.
particularly severe during the summer. Theaverage annual rainfall from 1909 to 1929 wasonly 25.72 inches (see Table 10), and most of thisoccurred during the monsoons.
Until the 1920s, the water for Tiruppur wassupplied mainly through seven public wells(G.O.No.4965 Mis LSG [L and M], 14-11- 1937).Every year, the Tiruppur municipality spent acertain amount on repairing the wells so that itcould provide the maximum water supply possiblethrough them. Attempts to provide adequate watersupply could not, however, meet the demand ofthe growing population of the Tiruppurmunicipality and until the 1920s the governmentdid not initiate any steps towards providingsufficient drinking water.
In 1919, Koilveli valley water was examinedand found to be hard and bacteriologically nothygenic (Table 11). Despite the low quality, thissource of water was recommended for the Tiruppurmunicipality water supply scheme because of theabsence of any other perennial supply(G.O.No.2353 Mis E and PH [PH], 15-8-1936).
In the 1920s, the government proposedsupplying water from the Koilveli infiltrationgallery about five miles from Tiruppur. Thisscheme would supply only 20,000 people at 5gallons of water per head per day (G.O.No.3089Mis Health, 16- 11-1954). It consisted of twostages: 1) construction of an open infiltrationgallery and collecting wells and a full power test;and 2). construction of a gravitation main, servicereservoir and distribution system, (G.O.No. 725 MisPW and L [W], 10-3-1928). In 1920, the SanitaryEngineer recommended that the first part of thescheme be taken up first and, depending on its
viability, decisions could be made regarding thelater part (G.O.No. 725 Mis PW and L [W], 10-3-1928). In 1923, the cost of first part was estimatedat Rs 105,000 and in 1927, the governmentapproved an approximate estimate of Rs 67,000(G.O.No. 725 Mis PW and L [W], 10-3-1928).Before sanctioning this scheme, the governmentissued an order to confirm the viability of the watersupply scheme by ‘full power test’ and in 1928,sanctioned Rs 51,000 for the purpose (G.O.No.725 Mis PW and L [W], 10-3-1928). In 1931, arevised estimate of Rs 64,300 was sanctioned fora full power test (G.O.No.809 Mis PW and L [W],23-3-1931). In 1937, the government finallysanctioned Rs 184,000 for the Koilveli watersupply scheme (G.O.No.4068 Mis LA, 30-10-1937)
TABLE 10:Rainfall at Tiruppur Station 1909-1929

H I S T O R I C A L P E R S P E C T I V E S O N C O N F L I C T S O V E R D O M E S T I C A N D I N D U S T R I A L S U P P LY
172
Source: G.O.1327 Mis LSG (PH), 8-8-1923.
Physical appearances colour and transparency -slightly yellowish but clear
Smell -none
Quantitative (parts per 100,000):
Total solids parts per 45.0
Temporary hardness 17.5
Permanent hardness 10.0
Chlorine 1.420
Free ammonia 0.003
Albuminoid ammonia 0.003
Nitric nitrogen
Qualitative: 0.225
Nitrates Nil
Sulphates Present
Phosphates Nil
Iron, poisonous metals Nil
Microscopic exams of suspendedMatter Practically no deposit
Numerous
potentialsources wereinvestigated for
Tiruppur watersupply.
but this scheme was kept under suspension untila drought season (G.O.No.4965 Mis LSG [L andM], 14-11-1934). Later, the scheme’s expenditurewas reduced to Rs 1,82,370, of which, Rs 9,1185was of share the government and the rest asmunicipal contribution (G.O.No.908 Mis E and PH[PH],3-3-1941).
The Koilveli water supply scheme provided only75,000 gallons of water per day distributed throughsome 20 public taps. This was inadequate and didnot serve even one-third of the water demand ofmunicipality (G.O.No.4203 Mis E and PH [PH],28-11-1949). Consequently, Tiruppur looked foradditional schemes to increase water supply.
In 1949, the government sanctionedinvestigation of a water supply scheme withthe Bhavani River as the source to serveTiruppur and seven nearby villages: Pogalur,
Kurukkalaiyampalayam, Annur, Karavalur,Nombiyampalayam, Avanasi and Tirumuganpundi(G.O.No.844 Mis HELA [H], 3-3-1956). Later,Karamadai, a nearby village also was includedunder this scheme (G.O.No.2012 Mis Health, 27-5-1953) and the Tiruppur municipality agreed toadopt it (G.O.No.4203 Mis E and PH [PH], 28-11-1949). In 1949, the Sanitary Engineer alsorecommended provision of supply from theCoonoor River as the most suitable andeconomical scheme. He estimated the cost at aboutRs 10,600,000 with an annual maintenancecharge of Rs 1,38,000 (G.O. No.1520 Mis HELA[H], 7-5-1956). As a result, although supply fromthe Bhavani appeared feasible, attention shifted tousing the Coonoor as a source.
In 1953, the Sanitary Engineer of Coimbatorereported that the minimum flow of the CoonoorRiver was 56 cusecs and that only 5 cusecs wererequired for the Tiruppur water supply. Hisanalysis indicated that diversion of the 5 cusecswould not affect riparian interests in the CoonoorRiver and the irrigation interests under the LowerBhavani Project (LBP) (G.O.No.844 Mis HELA [H],3.3.1956). He further reported that the estimatedcost of the scheme would be Rs 9,125,000. Basedon these recommendations the Tiruppur watersupply scheme was sanctioned in 1955 with theCoonoor River as the source (G.O.No.1520 MisHELA [H], 7-5-1956). This scheme wasinaugurated by the Chief Minister on 7-7-1955.
Progress on the scheme did not, however, lastlong. The Chief Engineer (Irrigation) indicatedthat, based on results of gauging conducted in theCoonoor River, it was not possible to tap waterfrom the river for the municipal water supplywithout it being detrimental to irrigation (G.O.No.
TABLE 11:Chemical Examination of Koilveli Springs

173
H I S T O R I C A L P E R S P E C T I V E S O N C O N F L I C T S O V E R D O M E S T I C A N D I N D U S T R I A L S U P P L Y
People protested
againstdelaying the
implementation
of waterprojects.
Industrial Water Supply: 1900-1970
The Problem
Until the early twentieth century, water from theBhavani River and its tributaries was used only
for irrigation and was never diverted either forsupply to towns and villages or for industrialconcerns. During the early twentieth century, onlysmall amounts of water were diverted toCoimbatore Municipality and to some extent to theRailways and other industries. However, in thesecond half of the twentieth century, diversions tosmall towns, villages and industry increasedsubstantially.
Whether diversion of water to the industriescreated any scarcity for agriculture is an importantquestion. It is also important to have acomprehensive understanding of the adverseimpact on the environment that discharge ofindustrial effluents created. These basic factors arean essential part of the context in which toevaluate the government’s policies and the role ofthe judiciary towards effective water managementin the Bhavani River basin. Reactions of localinhabitants are also a core part of that context.Information on the extent of farmers protests andthe measures taken by the government to protect
the farmers’ interests and water quality in theBhavani River basin is central to understandingwater management and environmental problems.
The main objective of this section is tounderstand government policy regarding industrialwater supply in a historical perspective between1900 and 1970. This section focuses on the historyof water diversion to the Railways, water supply toindustrial concerns and the attendantenvironmental issues in the light of thegovernment policies.
Water Supply to the Railways
When water from the Bhavani and itstributaries was diverted for the Railways at the endof the nineteenth century, the government did notvisualize any major implications for theagricultural sector. Initially, the governmentcollected water charges from the Railways at a flatrate without considering the quantity of watertaken. Starting in 1898, the South Indian RailwayCompany diverted water from the Kallar River atKallar in Coimbatore district through pipes (LetterNo.2979 Mis, PW and L, 28-11-1931). From 1902onwards, it also took 4,000 gallons of water per
844 Mis HELA [H], 3-3- 1956). Consequently thegovernment suspended this water supply scheme.As a result of the suspension, the people ofTiruppur municipality protested against deferringthe execution of the water supply scheme,particularly after work had been inaugurated. Themunicipality pressured the government to proceedwith the work with the Bhavani River atMettupalayam as a source. According to them, even
after the change over to the Bhavani River, theportion of the scheme beyond the Bhavani bridgewould remain the same as designed and approvedfor the scheme that originally had the Coonoor asthe source (G.O.NO.1520 Mis HELA [H], 7-5-1956). Finally, in 1956, the governmentrecommended the scheme be continued and a loanof Rs 2,500,000 was also sanctioned (G.O.NO.1520Mis HELA [H], 7-5-1956).

H I S T O R I C A L P E R S P E C T I V E S O N C O N F L I C T S O V E R D O M E S T I C A N D I N D U S T R I A L S U P P LY
174
day to the Mettupalayam railway station from theOdanthorai channel in Coimbatore district andpaid 6 rupees-10 annas-6 paisa per annum to theRevenue Department (G.O.No.3010 Mis PW and L(I), 23-10-1929). The Railway company wasinformed that supply of water would be stopped atany time if it affected irrigation of the ayacutunder the channel (BP. No.1880 Mis, 24-3-1902).In spite of this, there was no indication of anyresentment among the farmers against thediversion of water to the Railways.
The governmental authorities neglectedcollection of the minor water charges from theRailways until 1926. In 1927, the governmentchanged the mode of collection and fixed the tariffaccording to the actual quantity of water, therebyreplacing the earlier flate rate. Under the newsystem, the Railway Company was chargedRs 3 per 1,000 cubic yards for drawing waterfrom the government sources (G.O.No.2183 (I) PWand L, 28-9-1927). The rate was based on thatalready established by the South Indian RailwayCompany for drawing water from theOdanthurai channel (G.O.No.3010 Mis PW and L(I), 23-10-1929). It was estimated on the basisthat the 3 inch pipe would irrigate aboutone acre of land. It was further stated that thisrate would be continued for the Railway Companysubject to modification in every decade(G.O.No.1307, PWD Mis, 16-4-1948).
Beginning in October 1898, the South IndianRailway Company began diverting water from theKallar River through pipes. The governmentmeanwhile ordered that the water charges shouldbe collected from company starting at thebeginning of 1898. The railway company did not,however, oblige. Nothing much was done until a
government order was issued in 1928 indicatingthat, although the government had ordered theRailway Company to pay in 1909, it has nevercharged as no agreements had been entered withit (G.O.No.1784 PW and L (I), 19-7-1928). Thecompany, however, requested the government towaive the balance due. Consequently, in 1931,the government ordered that tariff on the SouthIndian Railway Company should be levied onlyfrom September 28, 1927 and waived the earlierdues (G.O.No.2903 Mis PW and L (I), 19-11-1931).This history shows that the governmentconsistently neglected the need to regulate watersupply to the Railway Company until the firstquarter of the twentieth century. At the sametime, it must be recognized that in those days, theBhavani River water was diverted only through oldchannels such as the Arakkankottai, Thadappalliand Kalingaroyan canals. As such, diversion ofwater to the railways may not have posed a seriousthreat to the agricultural sector.
Even though there was no representation fromthe farmers’ side regarding the water diversion tothe Railways, the government did hike the watercharges further in 1948. The government raisedthe rates for water drawn for the Railway Companyfrom irrigation sources and navigation channelsto Rs 6 per 1000 cubic yards, subject to aminimum of Rs 100 per annum (G.O.No.1307 Mis,PWD, 16-4-1948).
During the second half of the twentieth century,water supply to the Railway Company wasregulated by installing meters and other measuringdevices. In 1954, the government proposed to fixmeters or other suitable devices to measure thequantity of water and maintain them at thegovernment’s cost. The Railway was responsible
Railways werecompetitors for
water.

175
H I S T O R I C A L P E R S P E C T I V E S O N C O N F L I C T S O V E R D O M E S T I C A N D I N D U S T R I A L S U P P L Y
for the proper housing and safe custody of theinstalled devices. Rent for the meters and cost ofrepairs or replacement due to the negligence ofthe Railway would be adjusted in the accounts ofthe Railway. The Railway was also responsible formaintaining a log book containing daily entriesof the quantities of water drawn.
Water Supply to Industries
Traditional industries have utilized Bhavaniwaters in small quantities since historical times.Originally, the water diverted for industrial usesprobably did not create any issue inviting thegovernment’s policy attention. In Karnool districtof Andhra Pradesh, for example, factories drewwater from the Karnool-Cuddapah canal for up to40 years before 1927 without paying any charges.Since the Bhavani River basin was also part ofthe Madras Presidency similar practices may havebeen common in the study area as well.
Different kinds of water charges for industrieswere introduced in 1909. At that time, thegovernment fixed the rate for industrial watersupply at Rs 3 per 1,000 cubic yards if taken bymeans of sluices or pipes and Rs 80 for the sameamount taken by hand. Both types of diversionwere subject to a minimum charge of Rs 50 perannum unless the industries were speciallyexempted or concessional rates allowed by thegovernment (G.O.No.441 PWD (I), 19-10-1909 andG.O.No.1200 Mis, PW and L, 1-6-1927). Followingnon-compliance of the 1909 Government Orderdirecting the authorities to collect the outstandingtariff, in 1928 the government again advised themto charge the industries for taking water fromgovernment sources (G.O.No.1784 PW and L (I),19-7-1928). Available historical records to this
point suggest that diversion charges were imposedsolely to increase government revenue. They donot suggest that water supply to industries wasregulated due to objections raised by farmers orthat the water tariff was imposed to ensureconstant water supply to farmers or forenvironmental protection from industrial effluents.
During the second quarter of the twentiethcentury, water demand for the industries increasedsubstantially in the Bhavani River basin. Forinstance, in 1925, the Sanitary Engineer estimatedthat about 50,000 gallons of water per day wereutilized by factories in Coimbatore and couldgenerate revenue worth Rs 9,000 per annum at arate of eight annas per 1,000 gallons (G.O.No.888Mis, PWD (W), 26-6-1925). Rates were not,however, increased. In 1940, when the ChiefEngineer (Irrigation) proposed raising watercharges, the government deferred implementationdue to the Second World War (G.O.No.2093 MisPWD, 6-8-1945). Until 1945, the minimum ratewas only Rs 3 per 1,000 cubic yards. In 1945, thegovernment did accept the recommendations of theChief Engineer, though implementation wasfurther postponed until normal conditions wererestored after the Second World War (G.O.No.2093Mis, PWD, 6-8-1945).
Until 1946, water charges were collected atdifferent rates based on the method of lifting andthe quantity of water. Finally, in 1946, thegovernment modified the earlier rules forsupplying water to the industries from governmentsources. The entire quantity of water actually usedfor boiling purposes was to be charged at the rateof Rs 3 per 1,000 cubic yards. If used for coolingpurposes, without exceeding the permitted quantity,the rate was one-fourth of this full official rate.
The governmentregulated the
supply of waterto railways.

H I S T O R I C A L P E R S P E C T I V E S O N C O N F L I C T S O V E R D O M E S T I C A N D I N D U S T R I A L S U P P LY
176
To obtain this rate, the company was required toreturn the same quantity of water into thechannel or river. The government order furtherstated that all expenses connected with metersand other devices should be borne by the companyand that penalties of Rs 8 per 1,000 cubic yardswould be charged if companies drew morethan the prescribed quantity. Charges for theestimated quantity of water required by thecompany were to be paid in advance (G.O.No.2538Mis, Revenue, 19-11-1946).
In 1948 the water charges were increased toRs 6 for 1,000 cubic yards (G.O.No.1307 Mis, PWD,16-4-1948). This rate applied to water fromstreams, government irrigation systems andnavigation channels and to all types of industrialuses including rice mills. Users were also subjectto a minimum charge of Rs 100 per annum(G.O.No.1307 Mis, PWD, 16-4-1948). In the caseof water taken for cooling purposes and returnedundiminished and unpolluted to governmentsources, a concessional rate was fixed at the rateof one rupess and eight annas per 1,000 cubicyards. If the water was not returned to the channelthe water cess was to be at the basic Rs 6 per1,000 cubic yards rate applicable to all industrialpurposes. These requirements and those fordiversions for cooling represent the first indicationof environmental considerations.
Aside from the nascent emphasis on waterquality and protection from pollution, thegovernment imposed some restrictions onindustries, which reflected the importance ofirrigation for agriculture along the river and itschannels during the second half of the twentiethcentury. In 1950, for example, Solar Industries andTraders Ltd, Punjai Lakkapuram, Erode,
approached the Executive Engineer, PWD, Erode,seeking permission to take water from theKalingarayan canal. They were refused permissionon the grounds that the canal water was intendedonly for irrigation purposes. The government,however, granted permission to take water fromthe channel in the same year at the rate of Rs 6per 1,000 cubic yards under the followingconditions (G.O.No.4801 Mis, PWD, 26-11-1951).
1) Pumping was not to be done directly, but withthe help of a cistern to be built by the companyat its own cost.
2) Cisterns were to be supplied by a 6" diametersluice with a headwall tube built at the site to beselected by the PWD.
3) The sill level of the sluice would be kept aboutone foot above the bed level of the channel
4) The company was to agree to pay watercharges fixed by the government
5) During scarcity and closure periods, waterwould not be allowed to be used for industrialpurposes.
6) The company should not change or modifyany of the arrangements fixed initially.
7) In the event of infringement of any of theconditions the pipe sluice would be blockedpermanently and no diversions of water from thechannel would be permitted.
The above conditions show that the governmenthad initiated certain measures to regulateindustrial water supply in order to protect the
Different rateswere charged
for suppliedwater.

177
H I S T O R I C A L P E R S P E C T I V E S O N C O N F L I C T S O V E R D O M E S T I C A N D I N D U S T R I A L S U P P L Y
farmers. A similar situation also occurred in thecase of the United Bleachers Ltd. factory, whichwas located on the right bank of the Bhavani, closeto the railway bridge in Mettupalayam. Thisfactory required about one cusec of water. Thecompany accepted payment of the usual cess ofRs 6 per 1,000 cubic yards for the water consumedand the government permitted it to draw waterfor 10 years from March 1, 1954 by sinkingborewells in the riverbed with the followingconditions:
1) the company was not to use the water for anypurpose other than processing in the factory.
2) the company was to pay charges at the rate ofRs 6 per 1,000 cubic yards subject to a minimumof Rs 100 per annum or any other rate fixed bythe government from time to time.
3) After processing the effluent, water was to betreated properly before being let into the river.
4) the meters installed by the company at its costshould be open at all times for inspection by theofficers of PWD or the Revenue Department.
5) the company should bear the cost of drawingwater and also for letting it back.
6) the company was not to claim right to drawwater and the permission was liable to be cancelledat any time (G.O.No.1797 Mis, PWD, 17-5-1954).
Since Independence, successive governmentshave paid little attention to interest of thefarmers and water quality, while allowing waterdiversions for the industries. Until 1977, noseparate act was enacted to minimise orcontrol the discharge of effluents by industries.In 1977, under the Water (Prevention andControl of Pollution) Cess Act 1977 (Act No. 36of 1977), water charges were fixed forindustrial purposes at a rate of three-quarters of apaisa per cubic metre for cooling, spraying inmine pits or use in boilers; 2 paise per cubicmetre for processing in which the waterbecomes polluted but the pollutants areeasily bio-degradable. The rate was higher –two and half paise per cubic metre – forprocessing whereby water becomes pollutedand the pollutants are toxic and not easilybio-degradable.
The governmentinitiated
measures toregulate
industrial water
supply in orderto protectfarmers’
interests.
Conflicts over Water supply
Disputes and conflict over allocation of waterhave been seen in both Noyyal and Bhavani
river basins since the beginning of the century.The following section discusses the history andnature of the conflicts.
Debates over InterbasinDiversions
During the same period that demands for watersupply to the municipalities of Coimbatore and
Tiruppur were increasing, lack of water supply inthe Noyyal River basin forced the farmers ofPalladam and Coimbatore taluks to demand morewater for irrigation (G.O.No.496 PWD [I], 9-9-1890). As a result of these increasing demands,the idea of diverting Bhavani water into the Noyyalbasin emerged during the last quarter of thenineteenth century. The proposal did not, however,proceed within the government due to theprohibitive cost (G.O.NO.127 PWD [I], 1-3-1890).Farmers constantly made representations to

H I S T O R I C A L P E R S P E C T I V E S O N C O N F L I C T S O V E R D O M E S T I C A N D I N D U S T R I A L S U P P LY
178
reconsider the decision not to proceed with theproposal, but the government refused to do so(G.O.No.496 PWD [I], 9-9-1890).
Although the proposal was not being pursuedby the government, it remained under discussionby farmers and other institutions. In 1923, aproposal to utilize surplus water in the Bhavaniby diverting it through a tunnel into the Noyyalbasin for irrigation was developed. This proposalhas been under consideration ever since. Underthis proposal, it was expected that excess Bhavaniwater could be diverted through this tunnelbetween June 1, and December 15 and would besufficient for direct irrigation of 1,600 acres ofpaddy. This irrigated area could be doubled if astorage facility could be developed in the Noyyalbasin (G.O.No.2339 I Mis PW and L, 14-10-1927).Meanwhile, the Siruvani water supply scheme(discussed above for Coimbatore municipalsupply), was finally implemented in 1931. Aftermeeting the drinking water needs of Coimbatore,this scheme was believed to have substantial excesswater that could be diverted through its tunnelinto the Noyyal valley.
Aware of the importance of utilizing anysurplus water passing through the Siruvani tunnelfor irrigation, but uncertain as to the amountsactually available, the government issued amemorandum to the Coimbatore MunicipalCouncil. The memorandum stated: “theCoimbatore Municipal Council is informed that theChief Engineer for Irrigation has reported thatsufficient reliable information is not available asto the quantity of water which may be drawnthrough the tunnel and as to the surplus quantitywhich will be available for irrigation in the Noyyalvalley and that in order to divide the area for
which water would be available for directirrigation, the gaugings of the stream for two yearshave been ordered. He has also reported it is onlyafter the results of the two years’ gaugings of theSiruvani have been received and theSuperintending Engineer has submitted his reporton the investigation of a channel in the higherreaches of the Noyyal that it will be possible toformulate proposals for the most profitable use ofthe surplus water passing through the tunnel forpurposes of extension of irrigation” (G.O.No.2112Mis, LSG [P.H], 26-10-1927). The debate overwater availability continued, and diversion forirrigation did not take place until 1944. Until then,the government was considering various alternativeproposals and decided to postpone the diversionof Bhavani water into the Noyyal basin until adecision on the Lower Bhavani Project was reached(G.O.No.3936 Mis, PWD, 22-10-1949).
In September 1944, the PWD diverted Siruvaniwater into the Noyyal basin for irrigation purposes.This was done for 14 days without the previousconsent of the Coimbatore Municipal Council.Taking offence, the municipality claimed that thegovernment should compensate the city for thediversion (G.O.No. 2544 PWD, 1-10-1945). Thiswas turned down by the government on thegrounds that “there was no occasion to agree tothe request for payment of compensation to themunicipality for diversion of water from theSiruvani reservoir into the Noyyal basin forirrigation purposes.” The government’scommunication further said: “It is not, however,obligatory on the part of the government to consultthe Municipal Council in regard to the utilizationof the surplus water of the reservoir after meetingthe requirements of the town water supply”(G.O.No.2544 PWD, 1-10-1945).
Proposals forinterbasin
water transferto meetirrigation needs
in Palladamand Coimbatorewere made
during the1890s butrejected due to
cost.

179
H I S T O R I C A L P E R S P E C T I V E S O N C O N F L I C T S O V E R D O M E S T I C A N D I N D U S T R I A L S U P P L Y
The question of diversion again cropped upafter the Lower Bhavani Project was finalized in1946. In 1946, farmers who had been pressing thegovernment demanded that: 1) The usual flow ofwater in the Chitrachavadi channel shouldnot be restricted, and 2) sufficient water shouldbe allowed through the tunnel in the SiruvaniRiver for storage in irrigation tanks in andaround Coimbatore. In the same year, theExecutive Committee meeting of the MadrasChamber of Agriculture passed a resolutionurging implementation of the farmers’ demands(G.O.No.3936 Mis PWD, 22-10-1949). TheExecutive Engineer reported, however, thatthe free flow of water in the Chitrachavadichannel was not disturbed except from April 1 to21 in every year and that this disturbance wasessential in order to complete annual repairs. Inaddition, he indicated that it was not possibleto interfere with operation of the Siruvanidrinking water supply scheme. Finally, heindicated that there was a separate proposalfor diverting the Siruvani River itself into theNoyyal basin for irrigation purposes (G.O.No.3936Mis, PWD, 22-10-1949).
While this was all going on, members ofthe Madras Legislature and the Central LegislativeAssembly from Coimbatore district werediscussing development of an irrigation schemefor utilizing the Bhavani water in Avanashi,Palladam and Dharapuram taluks. Variousalternative proposals were examined and itwas finally decided to postpone the scheme untila decision was reached on the Lower BhavaniProject. In 1947, V. C. Palanisamy Gounder,MLA, wrote a letter to the PWD Ministerrequesting him to issue very urgent instructionsto the chief engineer for irrigation have the
proposed plans for raising the Siruvani damestimated expeditiously and sanctioned atan early date (G.O.No.3936 Mis, PWD, 22-10-1949). After finalizing the LBP, the governmentdecided to increase the height of the Siruvani damby 4 feet to divert the water through the tunnelfor the Noyyal basin. In 1949, the governmentissued the necessary order with a view toenhancing water supply to an existing ayacut of3,500 acres under the Noyyal River (G.O.No.3936Mis, PWD, 22- 10-1949).
In 1948, the Coimbatore Municipality passed aresolution allowing diversion of surplus waterthrough the Siruvani project tunnel between Juneand September for irrigation purposes subject tothe following conditions:
(i) The diversion were required to be withoutprejudice to the rights of the municipality for thesupply of 35 gallons per head per day;
(ii) The municipality reserved the right to stop thediversion if and when it was found that the supplyhad prejudicially been affected.
(iii) The government was required toinvestigate and ascertain the stability of the dam’sfoundations before the scheme was put hrough.
(iv) The government could pay a contributionto the municipality towards the maintenance ofthe water works out of irrigation funds; and
(v) Should there be change to any portion of thewater works including the tunnel consequent onthe release of the surplus water, the governmentwas required to reimburse the municipality allexpenses (G.O.No.3936 Mis, PWD, 22-10- 1949).
The state had amajor role in
makingdecisions over
water
allocation.

H I S T O R I C A L P E R S P E C T I V E S O N C O N F L I C T S O V E R D O M E S T I C A N D I N D U S T R I A L S U P P LY
180
The above conditions were substantiallyaccepted and the scheme was implemented. Onlyconditions four and five remained to be settled(G.O.No.3136 Mis, PWD, 4- 9-1954).
After the completion of the works to raise thedam’s height, the municipality permitted thediversion of between 20 and 40 cusecs of waterthrough the tunnel from September 1950 to June1951. This water was mainly utilized by theexisting ayacut under the Chitrachavadi channel.In July 1951 slight damage occurred in the tunnelleading to a temporary breakdown of watersupply for Coimbatore. Consequently, themunicipality refused to allow water through thetunnel for irrigation purposes stating that the watersupply for the town had been disturbed due toincreased draw through the tunnel (G.O.No.790Mis, PWD, 2-3-1955).
To achieve the objective of ensuring watersupply for irrigation and to reach an agreementwith the municipality, the two outstandingconditions were examined in consultation with theChief Engineer, Sanitary Engineer, and theMunicipal Council as well as the Health and LocalAdministration Departments. They suggested thatthe Siruvani dam, approach channel, tunnel, andassociated works could be taken over by the PWDand certain safety measures be carried out in thetunnel to prevent any possible collapse. They alsosuggested that the average annual expenditure ofRs 23,000 incurred on maintenance works shouldbe recovered from the municipality as itscontribution towards the cost of maintenance. Thegovernment realized that if the PWD took over themaintenance of the tunnel, difficulties in divertingwater for irrigation purposes could be solved(G.O.No.3136 Mis, PWD, 4-9-1954). In 1955, the
District Collector discussed the surplus waterdiversion at the district board meeting and theboard had approved the inclusion of the schemein the Second Five-Year Plan (G.O.No.4182 Mis,PWD, 7-11-1955).
The above history indicates that, while theconcept of inter-basin water diversion had emergedby the end of the nineteenth century, no diversionswere implemented until the water supply schemewas launched for Coimbatore City. Both thefarmers of Noyyal basin and the electedrepresentatives of the Coimbatore region haddiscussed the possibility of inter-basin transfers foralmost for half century. During that period, theconcept of transfers did not generate much debateeven in the source area. There were no majorobjections by farmers of the Bhavani River to thediversion of water into the Noyyal basin. It wasonly when Coimbatore municipality actuallydiverted Bhavani water for drinking water supplythat issues associated with inter-basin diversionbegan to be discussed extensively. Even then, theconflict that erupted was not generated by usersin the source area. Instead, it centred around thediversion facilities (tunnel capacity, etc.) andirrigation revenue. Debates over revenue occurredbetween the municipality and PWD over themunicipality’s demand for a certain amount ofthe irrigation revenue in return for allowing itsfacilities to be used to divert surplus water.
The inter-basin water diversion debatecontinued until the early 1950s. Nothing wasresolved due to the conflict between themunicipality and the state. By the time decisionwas arrived at on diversion, there was no surpluswater left due to the increasing population growthand industrial development in the town of
The cost ofmaintaining
water systemswas recoveredfrom
municipalities.

181
H I S T O R I C A L P E R S P E C T I V E S O N C O N F L I C T S O V E R D O M E S T I C A N D I N D U S T R I A L S U P P L Y
Coimbatore. After this, attention shifted tomunicipal water supply schemes.
Conflicts BetweenMunicipalities andthe State Government
As water diversions increased in the studyarea, conflicts emerged between municipalitiesand the state government. On the surface, theseconflicts were related primarily to the sharing ofproject costs and water charge income. On adeeper level, however, they reflect tensions over thegovernment’s claim of ultimate ownership andauthority over water resources. The history inCoimbatore illustrates these tensions.
Conflicts regarding contributions forirrigation benefits
As proposals for the Siruvani water scheme todivert water from the Siruvani to the Noyyalbasin for Coimbatore water supply progressed,tensions emerged between the municipality ofCoimbatore and the government. These conflictswere not directly over water but related tothe contribution of funds for the water supplyscheme. The Coimbatore Municipal Councildemanded that the government contribute acertain amount from the “irrigation funds” forthe Coimbatore water supply scheme on thebasis that the Siruvani water would be used forirrigation purposes. The government refused thisdemand and pointed out that there was nothingnew in Siruvani water being made available forirrigation as it was only a diversion from theSiruvani to Coimbatore. Furthermore, thegovernment pointed out that no storage would beprovided for irrigation. In this context, the
government categorically stated that nocontribution would be given from the irrigationfunds (G.O.No.1746 Mis PH, 27-11-1924). Later,in 1926, the Coimbatore Municipal Councilinsisted that the government pay reasonablecosts from “irrigation funds” for the diversionfrom the Siruvani to Noyyal. This too wasturned down (G.O.No.1787 Mis LSG [PH], 7-10-1926). In 1927 the municipal council againsought a reconsideration of the government’sdecision. The government responded that, “acontribution from irrigation funds can beconsidered only if and when it is found thatirrigation is benefited by the water supplyscheme” (G.O.No. 93 Mis LSG [PH], 19-1-1927).The dispute simmered on until 1945 when theCoimbatore municipality claimed compensationfor the diversion of water from the Siruvanireservoir into the Noyyal basin for irrigation.Again the government refused saying, “there isno occasion to agree to the request for paymentof compensation to the municipality fordiversion of water from the Siruvani reservoir intothe Noyyal basin for irrigation purposes”(G.O.No.2544 Mis PWD, 1-10-1945).
The conflict between the municipality and thestate government regarding funds stemmed fromthe government’s approach towards the localbodies. When a local body demanded a sharefrom the “irrigation funds”, the governmentrefused stating that the scheme was not meant forirrigation. But, when it found surplus water,the government appropriated it for irrigationpurposes without paying any amount to the localbodies. It thus treated the local bodies as“secondary citizens” as far as the sharing ofirrigation funds and compensation for the surpluswater diversion was concerned.
Conflicts overwater reflect
tension betweenthe state’s claim
of ultimate
ownership overwater resources
and the
perspectives ofmunicipalities.

H I S T O R I C A L P E R S P E C T I V E S O N C O N F L I C T S O V E R D O M E S T I C A N D I N D U S T R I A L S U P P LY
182
Conflicts Regarding Water Charges
Until the 1860s, the question of taxing watersupplied from government sources for drinkingwater supply had not arisen in the MadrasPresidency (G.O.No.1433 I PW and L, 14-5-1930).Furthermore, once the principal of taxing watersupplies had been established there was littleuniformity in the rates for water supplied to localbodies from government sources. A fewmunicipalities and the Madras MunicipalCorporation paid on the basis of quantity, otherspaid only a fixed amount irrespective of thequantity drawn and yet others paid nothing (seeAppendix - 1). In 1868, charges were fixed forthe very first time at Rs 1 for 1,000 cubic yardsfor the Madras Corporation. This rate was arrivedat by dividing the quantity of water required formaturing a crop on an acre of land (estimated at7,000 cubic yards) with the then current water-rate of Rs 7 per acre (G.O.No.1433 I PW and L,14-5-1939). The same rate was also adopted inthe case of Cocanada, Masulipatam, Ellore andChidambaram municipalities. In some othermunicipalities, such as Berhampur and Karnool,a fixed charge was made irrespective of thequantity of water taken (G.O.No.1433 I, PW andL, 14-5-1930). In 1930, the government passed anorder stating: “so far as existing water supplyschemes of local bodies are concerned, no chargefor water taken from government sources shall belevied where none has been levied hitherto. But,in fact any future time, in connection withimprovements to existing schemes or carrying outof new schemes, any considerable quantity of waterhas to be diverted from irrigation sources, it willbe open to the government to decide what, if any,charge shall be levied on that account”(G.O.No.1433 I PW and L, 14-5-1930).
Charging water rates for the urban supply toCoimbatore was not discussed while consideringvarious sources between the 1890s and the early1920s. In 1926, the government passed an orderstating that “the Coimbatore municipality will, forthe present, be permitted to take water from theSiruvani river for its water supply scheme, free ofcharge, but if and when irrigation is affected thequestion of charging for the water will beconsidered” (G.O.No.1814 I PW and L, 29-11-1926). The municipality refused to accept thegovernment order and pointed out that thequestion of charging for the water supply hadnever been indicated by the government right fromthe inception of the Siruvani scheme. Themunicipality contended that even while finalizingthe scheme the government had not mentioned it(G.O.No.168 I PW and L, 24-1-1927). When themunicipality requested reconsideration of thedecision, the government responded that whensuch a contingency arose the councilrepresentations would be considered (G.O.No.168I PW and L, 24-1-1927). In 1934, the governmentissued an order stating that “if a local body gettingits supply free of charge from a government sourceand sells water for non-domestic purposes, itshould pay to the government one-third of the totalamount realized by it every year from such sales”(G.O.No.1297 I PWD, 15-6-1934). The municipalcouncil did not, however, accept this. As a result,in 1935, the government indicated thatCoimbatore’s rate concession was given only forthe time being and there was no reason to exemptthe council from the payment of water charges(G.O.No.1297 I, 15- 6-34) (G.O.No.1698 Mis IPWD, 30-7-1935).
This led to a long running dispute over watercharges by the government to the municipality.
The stategovernment
treated localbodies, such asmunicipalities,
as “secondarycitizens” whenmaking water
allocationdecisions.

183
H I S T O R I C A L P E R S P E C T I V E S O N C O N F L I C T S O V E R D O M E S T I C A N D I N D U S T R I A L S U P P L Y
The municipality claimed that while sanctioningthe Siruvani scheme, the Chief Engineer hadaccepted that the cost of maintenance could bemet from income derived through the sale of waterfor non-domestic purposes so long as it did notaffect irrigation. Since irrigation had not beenaffected at present, the government, it said wasnot entitled to levy a charge on the water sold fornon-domestic or industrial concerns. Therefore, thecouncil considered filing a suit seeking adeclaration that the Government of Madras wasnot entitled to claim any share of the revenue fromthe sale of water for non-domestic consumption.This prompted the government to direct theCollector to take appropriate steps in case a suitwas filed (G.O.No.1784 Mis, PWD [I], 31-3-1937).Consequently, the municipality gave up thelitigation and paid the amount to the government(G.O.No.106 Mis, PWD I, 16-1-1946).
Conflicts between UrbanPeople and the MunicipalityRegarding Water Tax
In order to meet the cost of the Siruvani watersupply scheme, Coimbatore Municipalityproposed hiking the property tax from the7.5 per cent prevailing in 1924 to15.5 per cent. This would beimplementedas a consolidated rate based on the annual rentalvalue of all buildings and the land withinthe municipal limits and would start from October1, 1925. In addition, they proposed that theexisting property tax of two annas for every 80square yards would be increased to four annas.These increases were to be allocated as waterand drainage taxes respectively. Socialorganizations and the public at large protestedagainst the proposed increases. Meetings of tax
payers were held in 20 wards of city betweenFebruary and March 1925. Eighteen wardscompletely rejected the proposed hike for theSiruvani water supply scheme and two wardsaccepted it with certain conditions (G.O.No.821Mis LSG [PH], 28-4-1927). Six public meetingswere also held in different places of thecity. Petitions containing thousands of signatureswere sent to the chairman of the municipalcorporation from the wards protesting againstthe tax increases. Several suits were filed in theDistrict Munsif court challenging the hike, anda lower court as well as an appellate court heldthat the council levy was illegal (G.O.NO.1845 MisLSG [PH], 23- 9-1927).
Those protesting the tax increases for the watersupply scheme mainly demanded that: (1) eitherthe government should bear the entire centagecharges; (2) it should bear three-quarters of thecost of the scheme; (3) interest on the loan shouldbe reduced and the repayment period extended to50 years; (4) the agriculture and forest colleges,police recruitment school and central jail shouldbe included in the municipal limits and madesubject to any taxes; and (5) the water tax onannual income should be reduced to 5 per cent(G.O.No. 1792 Mis LSG (PH), 26-8- 1925). Thegovernment refused to concede to these demands,except for reducing the centage charges, andpointed out that water and drainage tax inCoimbatore were very low when compared to theprevailing rates in 14 other municipalities(Appendix -2). If these charges were reduced below8 per cent, the municipal council would not be ina position to finance its share of the cost of thescheme (G.O.No.1845 Mis LSG [PH], 23-9-1927).
In 1927, the government issued an order
In 1925proposals by the
government toraise watertaxes were
opposed bysocial
organizations
and the generalpublic through
public meetings
and legalactions in
Coimbatore.

H I S T O R I C A L P E R S P E C T I V E S O N C O N F L I C T S O V E R D O M E S T I C A N D I N D U S T R I A L S U P P LY
184
indicating that if the municipal council undertookthe proposed drainage works, the tax rate wouldbe increased with a final level determined afterfinance requirements for the scheme had beenconsidered (G.O.No.525 Mis PH, 25-3-1927). Thisled to public protests, and the municipal councilpassed resolutions clarifying that there would beno need for additional taxation. To substantiateits stand, the council noted that property valueswere steadily increasing leading to increased taxrevenues at the then current assessment rate.Overall income from the property tax, for example,had increased from Rs 46,662, in 1915/16 to Rs1,03,000 in 1926/27. Increases of this type, it wasargued, would be sufficient for completion of thewater supply scheme with no change in rates.Overall, tensions over rates represented acontinuing source of conflict between thegovernment and the municipality.
The above types of tensions were commonbetween the government and municipalities. Asituation similar to the one in Coimbatoredeveloped between the government and the Erodemunicipality. At the inception of a major watersupply scheme for this city the government didnot mention anything regarding the payment ofwater charges for taking water from theKalingarayan channel and the Cauvery River. Theonly condition on water diversions was that nodamage would be done to the channel. Startingin 1919-20, the municipality drew water from theCauvery River without paying and without thegovernment demanding any charges. In 1930,however, the government ordered the municipalityto pay water charges from 1920 to 1929 at a rateof Rs 1 per 1,000 cubic yards. The municipalityrequested the government to withdraw the chargesstating financial hardship. In the end, the
government agreed that no charge need be leviedfrom the Erode municipality for water drawn eitherfrom the Cauvery or the Kalingarayan channel(G.O.No.2269 I PW and L, 25-1-1930).
Water Conflicts betweenFarmers and StateGovernment
Water diversion for domestic water supplycreated conflicts between farmers and the state inthe Bhavani and Noyyal River basins. Thegovernment did not support farmers’ protestsagainst water diversion, but mostly favoureddrinking water supply schemes in the towns andvillages of these basins. The farmers ofChitrachavadi channel protested diversion of waterfrom the Anayar and Periyar rivers to supplyCoimbatore. Disregarding the farmers’ objections,the government passed an order in favour of theCoimbatore municipality. They also decided tosupply the water without any levy. Themunicipality was warned, however, that if therewas any adverse effect on irrigation, thegovernment might at any time cancel thepermission granted to tap the sub-soil water fromthe Anayar and Periyar rivers (G.O.No.1189 I PWand L, 11-4-1930).
In a similar situation in 1949, the governmentproposed diversion of water from the Coonoor Riverto provide drinking water to Tiruppur. Opposingthis, the farmers of Nellithurai, Thekkampatti andOdanthurai villages requested the government toabandon the scheme fearing that it would affectirrigation (G.O.No. 844 Mis HELA [H], 3-3-1956).According to their protest, about 2,000 acres ofpaddy and betel nut groves would be affected andabout 2,000 agricultural labourers would be
Tension overwater rates
represented acontinuingsource of
conflict betweenthe governmentand the
municipality.

185
H I S T O R I C A L P E R S P E C T I V E S O N C O N F L I C T S O V E R D O M E S T I C A N D I N D U S T R I A L S U P P L Y
deprived of their employment. In addition, thefarmers indicated that shortages of irrigation waterwere already causing suffering. Consequently, in1956 the government ordered that work on theCoonoor River water supply scheme should besuspended. The government also ordered the ChiefEngineer, PWD (GL) to report on the availabilityof water for the Tiruppur water supply schemefrom the Coonoor River (G.O.No. 844 Mis HELA[H], 3-3-1956).
In April 1956, representatives from themunicipality and the government participated ina conference held at the Assembly Chambers. Theconference proceedings stated that “therequirements of the municipality being only 3cusecs, about 100 acres of the tope can bepurchased by the municipality and the water tobe utilized by this, diverted for water supply”(G.O.No. 1520 Mis HELA (H),7-5-1956). As a result,the government decided to proceed with theTiruppur municipality water supply scheme statingthat the small quantity of water required wouldnot affect irrigation.
Conflicts over Industrial WaterSupply
No conflicts between farmers and industriesconcerning water diversion for industrial uses arepresent in the historical records examined. As inthe case of municipal supplies, most conflictoccurred over water charges. As previously noted,in 1924 the government specifically stated that themaintenance cost of the Coimbatore MunicipalWater Supply Scheme could be met from theproceeds of the sale water for industrial purposes(G.O.No.1267 Mis PWD I, 28-5-1936). In 1934, it
changed its position and stated that if the localbody received supply free of cost and sold it fornon-domestic purposes, the local body should payone-third the amount of the total received throughsales every year to the government (G.O.No.1297Mis, PWD (I), 15-6-1934). Although theCoimbatore municipality protested this, thegovernment emphasized that the municipalcouncil could not be allowed to enjoy the entireincome from the sale of water for industrialpurposes (G.O.No.1267 Mis, PWD (I), 28-5-1936).It also indicated that if the municipality drewwater partly from government sources it had topay proportionally (G.O.No. 3066 PWD, 7-1936).In 1937, the municipal council countered that‘the government was not entitled to levy anycharge whatsoever on the water sold by thecouncil to individuals, non-domestic or industrialconcerns’ (G.O.No.1784 Mis, PWD (I), 31-8-1937).Based on this, the council intended to challengethe government in the court. The governmenttoo directed the Collector to take steps to meetthe threat from the municipal council(G.O.No.1784 Mis, PWD (I), 31-8-1937). In 1940,the Coimbatore Municipal Council gave upthe litigation and paid the sum of Rs 6,263due to the government (G.O.No.106 Mis PWD(I), 16-1-1940).
Overall, until Independence and even after,the government considered water supplyto industries only from a monetary pointof view. Conflicts seldom arose in theagricultural sector against diversion ofwater to the industries. Only from the1970s onwards did issues concerning industrialpollution come into the picture in the BhavaniRiver basin.
Farmersprotested
againstdiversion ofwater from
irrigation formunicipal use
as early as
1930.

H I S T O R I C A L P E R S P E C T I V E S O N C O N F L I C T S O V E R D O M E S T I C A N D I N D U S T R I A L S U P P LY
186
Conclusion
In the Bhavani and Noyyal river basins, theconcept of inter-basin water diversion to
augment domestic water supply emerged at theend of the nineteenth century. Since then, waterhas been diverted from agriculture to non-agricultural sectors. These diversions, along withpollution, represent the fundamental continuingpoint of tension between agricultural and non-agricultural users.
Initial conflicts focused primarily on costsharing for water supply schemes and watercharges and their allocation between local bodiesand the state government. The situation inCoimbatore in the 1930s typified these tensions.When water was diverted for the Coimbatore watersupply scheme the people who demanded drinkingwater were not ready to pay the cost andcomplained that water charges were too high. Themunicipality was in a bind. It had to impose thetax on the water users to generate the resourcesessential for maintenance, for payment of its shareto the state and for recovery of investments in thewater supply scheme. Conflicts over the quantityof water diverted emerged gradually and were notas prominent initially as these financial tensionswere. Only in recent history have tensions overpollution as well as water availability dominatedconflicts over finances and project control. Waterdiversion for the Coimbatore water supply schemewas first envisioned in the 1890s when the waterdiversion for the Noyyal basin was also discussed.In the early twentieth century, a small quantity ofwater was diverted for the Railways and industries.At that time, neither the quantity of water nor thequality of water was an issue.
Lack of coordination among the governmentdepartments also led to unnecessary conflicts inwater distribution, management and projectsustainability. Although the municipality acceptedthe terms and conditions of the state governmentrelating to domestic water supply, it refused tosupply surplus water to the agriculture sector.When the government demanded diversion ofsurplus water for irrigation, the municipalityprotested and pointed out that the government hadnot paid a share of the expenses for the domesticwater supply scheme. This led to conflict betweenthe municipality, the PWD and the stategovernment. This shows the importance ofcoordination among the government departmentsand different stakeholders for enabling efficientwater management.
As time passed and diversions increased,conflicts over supply availability between urbanand agricultural interests gradually increased. Ingeneral, the municipalities won most of theseconflicts. In the Coimbatore case, for example,although the government placed conditions onmunicipal water supply schemes stating that watersupply for domestic purposes would be restrictedif agricultural operations were affected, whenactual shortages occurred municipal supplies weremaintained despite farmers’ protests against thediversion and scarcity. The government did notseriously consider those protests, indicating thatonly a small quantity of water was diverted fordomestic purposes. On the whole, the diversion ofwater supply did affect cultivation. This was nottaken into account either by the municipality orthe state. The problem is not, however, just
Pollutionrepresents a
continuing pointof tensionbetween
agriculturaland non-agricultural
water users.

187
H I S T O R I C A L P E R S P E C T I V E S O N C O N F L I C T S O V E R D O M E S T I C A N D I N D U S T R I A L S U P P L Y
associated with diversions for municipal uses. Inthe agriculture sector increasing demand for waterarose due to changing cropping patterns and themechanization of water lifting devices. This alsocontributed to water scarcity. In addition,discharges of industrial effluent affected the qualityof water. In this situation, how to accommodatenew demands in the dynamic processes ofeconomic transformation involving multiplestakeholders is an important question.
In the case of water use for industry and theRailways, initially they both used river waterwithout restrictions. Neither the farmers nor thegovernment considered industrial water use anissue until the second half of the twentieth century.In addition, during the second quarter of thetwentieth century the government’s main concernwas revenue and it completely neglectedenvironmental problems. Only after Independencedid the government attach some importance to theprotection of water quality in the Bhavani River.In short, until the 1970s, the government failedto give much attention to the diversion of waterfor industries and the discharge of effluents intothe river and its channels. This was not, however,just a lapse on the part of the government. Farmersalso were oblivious of the long term effects of
industrial water supply and effluent discharges inthe Bhavani River and its tributaries.
History suggests that an effective approach towater management would be to allocate equitableshares in the available water among thestakeholders and, within that proportion,increasing demand should be managed. This couldprevent the emergence of conflict due to increasingdemand on scarce water resources. In addition,the government should encourage and educatefarmers to cultivate less water consuming cropsin water scarce areas. This would help society tomeet the increasing demand both in the non-agricultural sectors and within the agriculturalsector. The government should also frame scientificnorms ensuring equitable distribution of wateramong the different sectors for efficient waterutilization. At the same time, it should considerconstructing tanks to harness remaining surfacesupplies and improve plans for effluent anddrainage treatment. Unless treatment isaccomplished, the constantly increasing demandfor water from the domestic and industrial sectorwith the attendant effluent and drainage dischargeswill not only reduce water supply available forirrigation, but will also pollute remaining freshwater resources.
History suggeststhat an effective
approach towater
management
may be toallocate
equitable shares
amongstakeholders.

H I S T O R I C A L P E R S P E C T I V E S O N C O N F L I C T S O V E R D O M E S T I C A N D I N D U S T R I A L S U P P LY
188
Source: G.O. No. 1845, MIS Local Self-Government (PH)23-9-1927.
Name of theMunicipality
Cuddapa
Rajamundry
Masulipatam
Nagapatanam
Coonoor
Tanjore
Tuticorin
Trichinopoly
Vellore
Otacamund
Conjeeveram
Ellore
Vizagapatam
Tirupathi
Bellari
Berhampur
Kumbakonam
Nellore
Dindigul
Cocanad
Chidambaram
Gudur
Coimbatore
PropertyTax
8 ¾
8 ½
9 ½
8 ½
10
8 ¾
8 ½
8 ½
7
9
8
8 ½
8 ½
8 ½
9 ¾
8 ½
9
9 ½
7 ½
7 ½
8
10
7 ½
Water andDrainage Tax
8 ¾
8
9
8 ½
8
8
5 ½
9 ¾
8
6 ½
8 ½
8
8
7
6 ½
8
5 ½
7
6
6
8
5
8
Total
17 ½
16 ½
18 ½
17
18
16 ¾
14
18 ¼
15
15 ½
16 ½
16 ½
1 ½
15 ½
16
16 ½
14 ½
16 ½
13 ½
13 ½
16
15
15 ½
Name of the Local Bodies
Berhampur Municipality
Cocanada
Masulipatam
Ellore
Madras Corporation
Karnool
Anantapur Municipality
Adoni
Bellari
Chengalput
Canjeeveram
Tanjore
Mannargudi
Nagapatam
Chidambaram
Sources of Supply
Ichapur canal
Samalkota canal
Bandar canal
Kistna-Ellore canal
Red hills tank
Karnool-Cuddapah canal
Wells excavated in the
Bed of Pandameru River
Gangalamanchi tank
Wells excavated in the
Bed of the Hagari River
Wells excavated in the bed
of Palar River
Wells excavated in the bed
of Vegavathi River
Vennar
Vadvar Municipal channel
Vettar
North Rajan Channel
Rate of ChargesRs 1,225/1000 c. yds
do
do
do
do
do
do
do not pay any charge
do
do
do
do
do
do
do
do
Source: G.O. No. 1845, MIS Local Self-Government (PH), 10-2-1927.
APPENDIX - 1List of Local Bodies, Sources of Water Supply and Rate of Chargesin Madras Presidency, 1927
APPENDIX - 2Property Tax and Water and Drainage Tax inDifferent Municipalities in MadrasPresidency: 1926 (in per cent)

189
H I S T O R I C A L P E R S P E C T I V E S O N C O N F L I C T S O V E R D O M E S T I C A N D I N D U S T R I A L S U P P L Y
Abbreviations
BP - Board ProceedingsE and PH - Education and Public HealthG.O. - Government OrderHELA - Health and Local AdministrationLA - Local AdministrationLBP - Lower Bhavani ProjectLIC - Life Insurance CorporationL and M - Local and MunicipalLSG (PH) - Local Self-Government (Public Health)LSG (LM) - Local Self-Government (Local and Municipal)MLA - Member of Legislative AssemblyPH - Public HealthPW and L - Public Works and LabourPWD - Public Works DepartmentPWD (B and R) - Public Works Department (Buildings and Roads)PWD - Public Works DepartmentPWD (I) - Public Works Department (Irrigation)PW and L - Public Works and LabourTNSA - Tamil Nadu State ArchivesTNSAR - Tamil Nadu State Administrative ReportTWAD - Tamil Nadu Water and Drainage Board

H I S T O R I C A L P E R S P E C T I V E S O N C O N F L I C T S O V E R D O M E S T I C A N D I N D U S T R I A L S U P P LY
190
Notes
1 Unless otherwise noted all government orders and TWAD board proceedings and letters referred to in the text are from theTamil Nadu State Archives, Chennai.
2 Tamilarasu is an official magazine published by the Government of Tamil Nadu.

Local Strategies for Water SupplyandConservation Management inthe Sabarmati Basin, Gujarat
Addressing Water Scarcity
M.Dinesh Kumar, Shashikant Chopde, Srinivas Mudrakartha and Anjal Prakash
C H A P T E R 5

192
A D D R E S S I N G W A T E R S C A R C I T Y
Summary and Findings
The Sabarmati River, which flows fromRajasthan into Gujarat, plays an important
role in the socioeconomic development of thestate in general and the basin area inparticular. The basin’s water resources serve theagricultural, industrial and household needs ofthe 9.94 million people living within it.Competition between water use sectors – rural andurban domestic uses, industry and agriculture –within the basin is great. Increasing population,urbanization and industrialization are puttingpressure on the limited water resources. This,coupled with depletion of groundwaterresources and increasing pollution of surfacewater bodies, is causing water scarcity to emergeas a major source of conflict. Water problemsare a threat to the sustainability of localcommunities, the environment and the region’seconomic development.
This paper presents preliminary results ofresearch being carried out by VIKSAT as part ofan ongoing networked project to evaluate localwater management options. The purpose is:
1. to investigate water scarcity and pollutionproblems in the Sabarmati basin in Gujarat, India;
2. to evaluate responses by local populations toemerging water management problems;
3. to analyse the potential role different supplyand demand based water management strategiescould have on water availability, water demandand water quality within the basin under currentconditions and in the future; and
4. to identify institutional arrangements throughwhich water management could be implemented.
The study involves extensive fieldworkthroughout the Sabarmati Basin. Preliminaryresults presented here relate primarily to bullets1,3 and 4 above. Chapter six documents the majorfarmer movement to recharge groundwater. Forthe research here, a first-cut analysis of watermanagement alternatives was undertaken usingthe Water Evaluation and Planning (WEAP)modelling system developed by the Tellus Institute,the Boston office of the Stockholm EnvironmentInstitute. WEAP is a mass balance “accounting”system that allows comparison of watermanagement scenarios involving broad arrays ofnew supply development and demand sidemanagement options. Institutions which couldpotentially play major roles in water managementwere also investigated. The major findings arepresented below.
Emerging Water RelatedProblems and Issues
� Groundwater overdraft is leading to increased
costs and a decline in quality and quantity
throughout the basin, but is especially strongly
felt in the rural areas: Groundwater is the majorsource of water in the rural areas of the basin.In alluvial areas, long term declines in waterlevels, resulting from excessive pumping ofgroundwater reduce well yields, increase inpumping costs, increase in fluoride and salinitylevels in groundwater and a reduce availability ofwater for irrigation. The middle and lower
Water scarcity isemerging as a
major source ofconflict inGujarat due to
groundwaterdepletion andpollution.

A D D R E S S I N G W A T E R S C A R C I T Y
193
portions of the basin, which includes all the majorurban centres, are in the alluvial zone. In thehard rock zone, that is the rural areas of the upperpart of the basin, excessive groundwater pumpingcauses rapid seasonal declines in water levels,which result in acute seasonal scarcity of water,in turn causing a major obstacle for agriculturalproduction.
� Declining water table and increased gross
supply, but decreasing per capita supply of water
to Ahmedabad and other centres of population:
In Ahmedabad, as the population and industryhave expanded, municipal supplies have beenexpanded greatly by an exponential increase ingroundwater extraction through tubewells and,somewhat more recently, by further augmentingmunicipal supplies with diversion of water fromthe Dharoi – a reservoir built to supply water forirrigation in Mehsana and Sabarkantha districts,drinking water for Ahmedabad and Gandhinagarcities and for Sabarmati and Gandhinagar thermalpower stations. In spite of this, the per capita watersupplied by the municipal corporation inAhmedabad declined from 197 litres per capita perday (lpcd) in 1971-72 to 125 lpcd in 1996-97. Ontop of this, there has also been an indiscriminategrowth in the number of privately owned tubewellsin the city, with their added impact on thedeclining water table.
� The quality of the resource is declining due to
its pollution and depletion, leading to a further
decrease in the effective supply: Industrieslocated in and around Ahmedabad dispose of theuntreated effluents in the river bed downstream ofAhmedabad and upstream of the Vasna Barrage.Untreated municipal sewage is also dischargeddirectly to the river. Both of these cause serious
problems of pollution of river water. The watercontaminated by effluents also pollutes theagricultural fields, which are irrigated by theFatehwadi canals that take off from the Vasnabarrage. With continued large investment in theindustrial sector expected in the future, the threatto surface and groundwater bodies from pollutionis great. Furthermore, effective groundwaterdepletion is increased with the contamination byfluorides and salts that make the resource eithera health hazard or unfit for many uses, or both.
� Overdraft of groundwater in Ahmedabad is
leading to increased urban/rural competition: Withlittle scope for the further augmentation of suppliesin Ahmedabad, the municipality is increasinglylooking for rural supplies to meet their demands.This has led to reductions in allocation forirrigation in the command of reservoirs such asDharoi in the upper Sabarmati basin and becomea source of conflict between urban and rural users.
� No single institution in Gujarat has the expertise
needed to plan and implement an updated water
resource management strategy: Generally, themore centralized institutions have the technicalskills that would be required, but lack the socialscience, or social engineering, skills. Members oflocal cooperatives, on the other hand, often havea very clear sense of local conditions and needs,but may lack the technical skills and politicalpower to implement a strategy. There are somegood research and training institutions in thebasin that can provide a link between theseinstitutions.
� The WEAP analysis shows the urgent need for
water management interventions: A first-cutanalysis of future water supplies and demand using
Municipaldemands are
encroachingupon irrigationwater supplies.

194
A D D R E S S I N G W A T E R S C A R C I T Y
WEAP shows that, in the absence of watermanagement interventions, the gap betweendemand and supply (the actual supplyrequirement) could increase to 1,017 MCM by2,020 and to 1,875 MCM by 2,050.
� Less equitable distribution of the resource: Inaddition to the above issues, the issue of equityalso needs to be addressed. From the availableinformation, resource access appears inequitable.This is reflected in the increasing competitionleading to increased frequency and intensity ofconflicts between different sectors of water usecaused differential allocation. Equity issues are offundamental importance and will form one of thefocus areas for research in the future.
The above issues in the Sabarmati basin willlead to an increasing gap between demand andsupply. This is confirmed by the WEAP analysisbase case scenario. In order to address this basecase scenario, four Water Management Optionshave been examined, again applying WEAP. Thefollowing section describes the Options and thefindings in brief.
Water Management Options
The alternative water management optionsanalysed through the study are: local rechargeusing excess run-off within the basin; adoption ofefficient water use practices and reducedconveyance losses; conjunctive management usingimported water supplies; and a combination ofefficient water use and local recharge activities.The results show that:
� Local recharge on its own would be quiteinsignificant in reducing the gap between demand
and supply anticipated by 2020 and 2050 A.D.WEAP modelling results indicate thatimplementation of this option would cause areduction of less than 1 per cent.
� The extent to which demand side options couldhelp address the water scarcity gross situation inthe future is quite large. This would requirelarge-scale adoption of efficient irrigation wateruse technologies such as drips, sprinklers andefficient conveyance systems in the fields, andefficient water use technologies in the domesticand industrial sector. WEAP modelling indicatesthat these interventions could reduce the gapbetween supply and demand by 324 MCM and1,005 MCM in 2020 and 2050 respectively. Inother words, this means that this option couldmake good roughly one-third of the gapprojected for 2020 and more than half theprojected gap for 2050.
� The modelling also indicates that conjunctivemanagement of groundwater could be anotheroption to consider. This option would entail therecharge of surplus monsoon flows diverted fromthe Sardar Sarovar reservoir. The available suppliesdue to this option would increase by 157 MCMand 156 MCM by 2020 and 2050 respectively.While this is less than what could be achievedthrough demand management, it still representsa significant contribution towards addressing waterscarcity problems.
� In the final analysis, the modelling suggeststhat a combination approach incorporatingdemand management, network improvementto reduce conveyance losses and conjunctivemanagement would have the maximumpotential to address water scarcity problems.
Watermanagementchallenges are
related toinstitutions,equity andincreasing
competition.

A D D R E S S I N G W A T E R S C A R C I T Y
195
This combination of improvements should beinvestigated further in detail.
It must be emphasized that none of the aboveoptions is adequate in isolation. The existinginstitutions are too inadequate in themselves toaddress the issues. It is essential therefore that theinstitutional arrangements involve all thestakeholders throughout planning, implementingand monitoring stages. The following sectiondetails some of these measures.
Institutional Arrangements forWater Management
There are a large number of rural and urbaninstitutions in and around the Sabarmati basin,which have major stakes in the way water ismanaged. They could play significant roles inbasin water management in the future. Institutionsthat could either oversee or direct the whole processare, however, lacking at present. There is also nosingle coordinating institution that could definelinks between existing institutions. Watermanagement institutions that might serve theabove purpose are proposed below:
� A Sabarmati Basin Water Management Society
(SBWMS) is proposed as a lead institution forcoordinating management. As envisioned here, awide array of technical, scientific and managementinstitutions, and the municipal corporations ofmajor urban centres would be members of thesociety. The society would have legal/statutorypowers to enact regulations to affect watermanagement decisions. Its mandate would be tolead the evolution of broader water managementperspectives for the basin, while ensuringsustainable and judicious resource allocation and
use among user groups. Linked to this institutionwould be the ones described below:
� A stakeholders forum is proposed, which wouldhave representation from various interest groupsin the basin. The forum’s mandate would be toorient the basin water management society onwater management issues concerning the multiplestakeholders, to suggest management priorities andtheir ways of implementation, and to ensureeffective participation by stakeholders in the designand implementation of water management plans.Identifying the stakeholders and representativeswould be accomplished in conjunction with theregional, village/watershed level and urban levelinstitutions described further below.
� Village and watershed level institutions areproposed at local levels and would have themandate to identify local resource managementissues, identify potential management initiatives,and implement the same with support fromregional institutions.
� Urban water management institutions areproposed in urban areas. They would have amandate to implement water management plansapplicable to their respective urban areas includingdirect and indirect management interventions.These institutions would be entrusted with legalpowers to enforce legislation, regulations and acts.
The regional institutions proposed above wouldhave a cross cutting mandate to identify areassuitable for local water management interventionsand to assist proposed local institutions inplanning and implementation. Regionalinstitutions would also be responsible for ensuringthat the area has access to financial and technical
New institutionsare needed to
involvestakeholders
and coordinate
watermanagement.

196
A D D R E S S I N G W A T E R S C A R C I T Y
I n Gujarat, as in several other semi-arid partsof India, groundwater overdraft, coupled with
increasing scarcity and pollution of surface watersupplies, threatens ecosystems as well as many ofthe advances in agriculture and domestic watersupply made over recent decades. Gujarat has alsobeen the focal point for major debates over inter-basin water transfer involving water from theSardar Sarovar (Narmada) project.
The Sabarmati River basin, which is one ofthe inter-state river basins in Gujarat, plays animportant role in the socioeconomic developmentof the State in general and the region in particular.The basin is one of the water scarce basins inGujarat and is characterized by a number ofcompeting uses – rural domestic and irrigation,urban domestic and industrial uses. Pressures areincreasing on limited water resources due to thelack of state laws and policies for watermanagement, demographic trends andindustrialization. In addition some state policies,including those promoting industrializationexacerbate pressure on available water supplies.This coupled with depleting groundwater resourcesand increasing pollution of surface water bodies,is leading to increasing conflict. The emergingscenario poses serious threat not only to thesustainability of the communities but also to theregion’s overall economic progress.
In Gujarat, as well as the rest of India,community based local water managementinitiatives are increasingly being recognized byNGOs, researchers and academics as a majorstrategy to address the growing water scarcityproblems (Moench and Kumar, 1993). These localmanagement initiatives are undertaken either bylocal communities or the NGOs.
Almost all NGO and community basedresponses to water scarcity and pollution problems– in Gujarat and other parts of India as well –focus on augmenting the available supplies ofsurface and groundwater in the locality (Moench,1995). Efforts to address the issues related todemand management are ineffective andinadequate in these efforts. Further, these initiativesare highly localized with little potential to havean impact on the regional water situation.However, water scarcity problems are often regionalin nature and emerge from a range of physical(such as hydrology, geology and climate), social,economic and institutional factors.
In general, experiences with comprehensiveapproaches to water management are scarce inIndia. As a result, there is a paucity of knowledgeand information on the extent to which localwater management interventions, which includesboth supply and demand side management,
Water scarcityproblems are
regional innature andemerge from
physical, social,economic andinstitutional
factors.
Introduction
resources to implement management plans.Technical support for this would be providedby the basin water management society. Inaddition, establishment of tradable water rightsand promotion of water markets are suggestedas institutional mechanisms to achieve the
larger goals of sustainability, equity andefficiency in water use. These institutionalmechanisms can take care of the water allocationand maintenance of the system in a way thatis compatible with the prevailing social andphysical context.

A D D R E S S I N G W A T E R S C A R C I T Y
197
could address emerging problems of waterscarcity and pollution in a region or basin. Withwater management issues posing a majorchallenge to food security and economic growthin the region, understanding the natural scienceand social science of basin level watermanagement will be critical to framing waterresource development and management policiesfor the next century.
Current water management debates in Indiaare polarized between big dams and localmanagement by communities. This polarizationleaves little space for experimenting withthe variety of other institutional arrangements,such as combinations of quasi-governmentalinstitutions, private institutions and ruralinstitutions. Such gaps in thinking mainlystem from a lack of clarity regarding the typeof institutions which could address waterscarcity and pollution problems at local, regionalor basin levels.
Developing comprehensive and effective watermanagement perspectives for a basin requires adetailed analysis of the impact of each of the
diverse interventions on the overall water supply,demand and water quality situation. It alsorequires analysing the extent to which eachintervention should be implemented in order tobalance the supply and demand, considering theeconomics of each intervention as also theprobable future changes in the demand and supplywithin the basin.
Institutional issues are central to all watermanagement debates. Being a social activity,water management decisions should reflect theneeds and priorities of direct users and otherstakeholders. These often conflict. Therefore,achieving larger water management goalsrequires compromise on the part of each oneof the stakeholders with decisions being arrivedat through consensus. Hence, stakeholders willfind their due place in the development ofmanagement institutions. However, the typesof capabilities are different for differentstakeholders. Their capabilities – technical,organizational, social, legal and financial – todeal with water management issues need to beexamined to suggest their potential future rolein water management.
Watermanagement
decision-makingis a social
activity
reflecting theneeds and
priorities of
users.
Research Structure
The research project being carried out by VIKSATin the Sabarmati basin represents a
preliminary attempt to:
� investigate the water scarcity and pollutionproblems in the basin and the emergingissues;
� analyse the impact the various supply anddemand based water management
interventions could have on wateravailability, demand and water qualitywithin the basin today and in the future;and
� identify the institutional arrangements forimplementing the water managementinterventions by reviewing existinginstitutions in the basin and proposingalternative arrangements.

198
A D D R E S S I N G W A T E R S C A R C I T Y
�����������������
������������
�� �� ��������
�� �� �������
���������
������
������
������
��������
�����
����������
���������� !�����"�������#$"
���������
% �$" ���& ����&"�$"
����$��&� ��"�
Components and Methods
The research presented here has two maincomponents: (1) evaluation of physical options forwater management in the Sabarmati basin usingthe Water Evaluation and Planning (WEAP)system; and (2) documentation of existinginstitutions in the basin of relevance forwater management.
The physical aspects of water managementhave been analysed by describing existingwater scarcity and pollution problems andcreating water balance scenarios for the years2020 and 2050. These scenarios were designed toinvestigate combinations of water managementinterventions and contrast these with a basecase developed by projecting current socioeconomicand demographic trends. Research to develop thewater balance scenarios included study definition(in terms of boundaries, time horizon andhydrology), development of current accounts forwater demand (agriculture, industry, and urban
All watermanagement
options haveembeddedassumptions.
domestic) and water supplies (surface andgroundwater). A wide range of assumptions(related to demographic and socioeconomic trends,policy changes, water allocation, water andenergy pricing and environmental policies; waterresource systems and water use technologies) alsowere used to develop scenarios.
The institutional aspects of water managementwere evaluated by documenting existinginstitutions (government, NGO, private andcommunity) within the Sabarmati basin andevaluating their ability to take effectivemanagement actions based on the professionalresource base. The study investigated a range ofrural institutions including village dairycooperatives, tree-growers cooperatives, and largeagricultural and dairy cooperatives. Governmentand research institutions were also studied.These include the Water and Land ManagementInstitute Anand, Institute of Rural ManagementAnand, Gujarat Water Resources DevelopmentCorporation (GWRDC), Gujarat Water Supply andSewerage Board (GWSSB), Gujarat Jal SevaTraining Institute (GJTI) and Gujarat EcologyCommission (GEC).
Assumptions and Hypotheses
Evaluating the viability of different options foraddressing water scarcity in the Sabarmati basinthrough generation of water managementscenarios required making assumptions regardingfuture conditions that will affect the demand andsupply of water. The study was designed to test alimited number of hypotheses regarding thepotential utility of specific management actions.Assumptions and hypotheses related to this aregiven in the next section.
Figure 1:Gujarat and the Sabarmati basin.
�N

A D D R E S S I N G W A T E R S C A R C I T Y
199�� �� �������
���������
'
()
*
+
,
-
.
'/0
'0
'-
'.
'' ',
(/()
(*
'(
')
(( (,('(+
'+
(-(0
(.'*
���������
11
���� ��&� ��"�����$��&� ��"�
The institutional portion of the study was notdesigned to test specific hypotheses at this stage.Many questions of institutional design can onlybe tested through long term experiments basedon actual management initiatives. As a result,the current study was designed to identify andevaluate existing institutions. This will thenprovide a basis for hypothesis testing in subsequentphases of research.
Water Management Hypotheses
� Local recharge and small scale waterharvesting practices can make a substantialdifference to water scarcity and in situpollution problems, such as fluorideconcentration and salinity, if carried outsystematically throughout the Sabarmatibasin;
� Demand side management can make asubstantial contribution to addressing waterscarcity, but not as large a contribution asimports of water through the SardarSarovar project do;
� Conjunctive management of surface andgroundwater coupled with use of waterimported through the Sardar Sarovarproject would make the largest singlecontribution to addressing water scarcity inthe basin.
Assumptions used in WaterManagement Scenarios
� Water demand will increase correspondingto the population increase. Absence of watermanagement interventions will lead tohigher demand leading to increasedintersectoral competition.
� Agriculture, industry and other economicactivities in the Sabarmati basin willcontinue to expand at historical rates;
� Cropping patterns will undergo changes asa function of water availability andeconomic returns; and
� Animal husbandry patterns will remain thesame as at present.
Types and Sources of Data
The data for carrying out the research wasgenerated from both primary and a variety ofsecondary sources. For WEAP modelling, the typesof data collected included hydrologic and climaticdata (such as rainfall, stream flows, evaporationand evapo-transpiration rates),1 data ongroundwater recharge and extraction by taluka,releases from reservoirs and irrigation andmunicipal water supplies; groundwater withdrawalfor municipal demand; data on crops and cropping
1. Danta 2. Kheralu3. Khedbrahma 4. Idar5. Himmatnagar 6. Vijaynagar7. Bhiloda 8. Modasa9. Meghraj 10. Malpur
11. Gandhinagar 12. Ahmedabad13. Sanand 14. Viramgam15. Dholka 16. Dehgam17. Prantij 18. Bayad19. Vijapur 20. Kapadwanj21. Mehmadabad 22. Nadiad23. Balashinor 24. Thasra25. Matar 26. Anand27. Borsad 28. Petlad29. Cambay
*Information not available
Figure 2:Schematic map of talukasin the Sabarmati basin.
Assumptions inmanagement
scenarios relateto demographic
trends,
socioeconomictrends, pricingpolicy, resource
systems, andtechnological
choices.
�N

200
A D D R E S S I N G W A T E R S C A R C I T Y
������������"&�����2����
�����������2����
3��"�4����2����
���������
�� �� �������
����
������
��
��
���
�� ����
�
�����
��������
�� ����
����
��
���
��
���
�
����������
��������
���%����
������
����
���� ��&� ��"������
Figure 3:Drainage of the Sabarmati andits tributaries.
Tributary Length (Km)889575
105248100
Tributary NameWakalSeiHarnavHathmatiWatrakBhogavo
Drainage Area (Km2)1,625
946972
1,5238,6385,178
Physical characteristics
Surface Water Hydrology
The Sabarmati is the main river of theSabarmati basin and is also the largest of the fourmain rivers traversing the alluvial plains ofGujarat. The river originates at an elevation of 762metres in the Aravalli Hills about 48 kilometresinside the state of Rajasthan. The six majortributaries of the Sabarmati are the Sei, Wakal,Harnav, Hathmati, Watrak and Bhogavo. Thedrainage areas and lengths of these sub-basinsare shown in Table 1. The sub-basins are shownin Figure 3.
It traverses a further 371 kilometres of Gujaratbefore discharging into the Gulf of Cambay in the
Water Scarcity and Pollution Problems in theSabarmati Basin
The Sabarmatiflows through
major urbansettlements.
pattern by taluka from the Directorate ofAgriculture; water requirements and water use ratesfor different crops from published reports; data onirrigation practices from field surveys; data onindustrial water use; socioeconomic data (humanand livestock); population (rural and urban); andpopulation growth rates from Census reports.
In addition, for the wider study, information oninvestment in industries and the number and typesof institutions in rural and urban areas, wascollected from socioeconomic studies. Theirorganizational and institutional profiles werecollected from primary institutional surveys andCensus reports.
�N
TABLE 1:Physical Characteristics of Sabarmati Tributaries

A D D R E S S I N G W A T E R S C A R C I T Y
201
District
Sabarkantha
Kheda
Ahmedabad
Mehsana
Gandhinagar
Banaskantha
GeographicalArea (Km2)
7,390
7,194
8,707
9,027
651
12,073
Area within the Basin(Km2)
7,250
5,439
2,378
975
648
860
% Area withinthe Basin
98.11
75.60
27.31
10.80
99.85
6.77
Arabian Sea. About three-quarters of the way downits course, the Sabarmati passes Gandhinagar andAhmedabad. Of the total catchment area of 21,674km2, 17,550 km2 is in Gujarat and the remaining4,124 km2 in Rajasthan. The drainage area withinGujarat covers parts of Sabarkantha, Mehsana,Banaskantha, Ahmedabad and Kheda districts(Table 2).
The Sei and Wakal originate in the AravalliHills, while the others originate in the alluvialplains below. While the Sei basin is the smallesttributary with a basin spread of 946 km2, theWatrak is the largest with 9,337 km2. Most of thesetributaries are essentially storm channels dryingup during low rainfall periods. The basin isdivided into three sub-basins on the basis ofwatershed sub-systems. The catchment of the mainriver up to the Dharoi Dam2 is the Dharoi sub-basin covering an area of 2,640 km2. TheHathmati sub-basin, named after the majortributary Hathmati, encompasses 5,573 km2.between Dharoi dam and the confluence of theKhari River. The third is the Watrak sub-basin.
There are also several major and mediumirrigation projects in the Sabarmati basin. Theseare shown in Figure 4.
The total surface water availability in the basinis estimated to be 1826 MCM of which 1,539 MCMis from the Gujarat part of the basin (GOG, 1996).An indication of the scarcity of surface water inthe basin can be had from the total surface wateravailability within the basin which works out to0.0855 MCM per km2, whereas the average surfacewater availability for all catchments in the state is0.13 MCM per km2 (GOG, 1991).
The Dharoi Dam has a total catchment of5,540 km2 with 2,639 km2 falling within Gujaratstate. The Dharoi Reservoir scheme suppliesdrinking water to the cities of Ahmedabad and
�N
Figure 4:Major and medium irrigation projects inthe Sabarmati basin
The Sabarmatiis a water
scarce basin.
TABLE 2:Proportion of Districts Falling within the Sabarmati Basin
���������
���"&�����2����
�����������2����
3��"�4����2����
���������
�� �� �������
��%����
3���5����
����%����
����62%
���3�����
��7��%����
��������
���%����
������
3���������
��%8���3�%�
6�����������
������3�%�
��%���������%����
����62%%
���� ��&� ��"�
�����
�����9�3$�"�

202
A D D R E S S I N G W A T E R S C A R C I T Y
�������� ���������
������������
�� �� ��������
�� �� �������
���������
������
������
������
��������
�����
����������
���������
�"�#������ �����&����$���&�4�
����#���
"� ��$:�������:��&�$"��$
�$��� ��"�;
% �$" ���& ����&"�$"����$��&� ��"�
Figure 5:Hydrogeology of the Sabarmati basin.
The Sabarmatibasin has both
confinedandunconfined
aquifers.
Gandhinagar, at a plan allocation of 150 and 11mgd respectively. It also supplies irrigation waterto Mehsana and Sabarkantha districts at a planallocation of 45,548 ha and 11,130 ha respectively.The Vasna Barrage, which has a total irrigatedcommand area of 25,101 ha, and is located 4 kmdownstream of Ahmedabad, allows diversion ofwater for irrigation to paddy fields in Ahmedabaddistrict through the Fatehwadi canal system. Thecanal turns productive when the discharge in theriver exceeds 50,000 cusec.
Geology and Hydrogeology of theSabarmati Basin
As previously mentioned, the Sabarmati Riveroriginates in southern Rajasthan and traverses ina southerly direction through most of Gujarat tojoin the Arabian Sea in the Gulf of Cambay. Theriver’s source is in the metamorphic rocks of the
Ajabgarh series of the Delhi system consistingmainly of calc schist, calc gneiss and limestones,which have a regional north east-south west strikedirection dipping towards north west as well assouth east. The Sabarmati River basin is underlainmainly by the rocks belonging to the Pre-Cambrian age in its northern and eastern partsand recent alluvial deposits in the western andsouthern parts. The alluvial deposits underlieapproximately two-thirds of the basin and arethemselves underlain by rocks of Pre-Cambrianage. The maximum thickness of the sediments inthe alluvial zone is 2,600 metres. The stratigraphyis given on the next page.
The confined aquifers occurring in the northeastern parts of the basin have good yieldcharacteristics. The transmissivity3 of theseconfined aquifers is as high as 2,500 m2/day. Theyield declines considerably toward the western partsof the basin where the transmissivity values arearound 200 m2/day.
Unconfined aquifers in the north eastern partsof the basin are comprised mainly of igneous andmetamorphic hard rocks with low yields indicatedby transmissivity values ranging from 20-100 m2/day. This is also the case with Deccan Traps(basalts) occurring in the eastern parts of the basinunder Sabarkantha district, and with igneous andmetamorphic rocks in the north-northwestern partof the basin under parts of Kheralu taluka ofMehsana district and Danta taluka of Banaskanthadistrict. Unconfined aquifers in the sedimentaryHimmatnagar Sandstone formations (mainlyoccurring around Himmatnagar town inSabarkantha district) have medium yieldcharacteristics with transmissivity values of around250 m2/day.
�N

A D D R E S S I N G W A T E R S C A R C I T Y
203
Percentage GrowthDistrict 1971-1981 1981-1991 1991-1997
Base 1971 Base 1971 Base 1981
Ahmedabad 33.17 31.83 23.90
Banaskantha 43.96 41.89 29.09
Gandhinagar 44.08 59.76 41.48
Kheda 22.99 17.37 14.12
Mehsana 18.69 16.14 13.60
Sabarkantha 26.49 21.79 17.23Source : Census, Government of India, 1991.
District
Ahmedabad
Banaskantha
Gandhinagar
Kheda
Mehsana
SabarkanthaSource : GOG, 1996.
Cultivable Area/GeographicalArea (%)
78.00
49.50
74.00
82.40
66.60
69.80
Net Sown Area/CultivableArea (%)
87.70
86.70
84.70
91.80
86.90
87.90
Irrigated Area/Net SownArea (%)
17.30
27.50
72.60
37.40
21.90
26.60
CroppingIntensity(%)
114
119
116
119
132
112
District Population Population Total DensityRural Urban Person/km2
Ahmedabad 547,896 3,405,384 3,953,280 1,660/320**
Banaskantha 120,803 10,673 131,476 150
Gandhinagar 240,661 166,450 407,111 630
Kheda 2,021,683 617,777 2,639,460 490
Mehsana 325,380 74,217 399,597 410
Sabarkantha 1,568,495 185,109 1,753,604 240
**320 excluding population and area of Ahmedabad citySource : Census, Government of India, 1991.
The rest of the basin, including parts of Kheda,Ahmedabad and Gandhinagar district, a part ofKheralu taluka in Mehsana district, parts ofHimmatnagar, Idar, Pantij and Dehgam inSabarkantha district is underlain by alluvialformations. These consist of alternating sand andclay zones, where thickness increases from thenortheast to the southwest. The alluvial formationshave good yield characteristics. Water in themoccurs under unconfined, semi-confined andconfined conditions. Figure 5 shows thehydrogeology of the Sabarmati River basin.
Socioeconomic FactorsAffecting Water Use
Demography of the Basin
According to the 1991 census, the totalpopulation of the basin was 9.28 million with anaverage density of 310 per km2. This populationdensity is higher than that in the Gangetic plain.The population density for the Yamuna basin inUttar Pradesh ranges from 165 people per km2 to265 per km2. The densely populated districts ofthe Sabarmati basin include Ahmedabad,Gandhinagar, Kheda and Mehsana where densityranges from 410 to 1,660 per km2. Forty-eight percent (4.46 million people) of the basin populationlives in major urban areas. This is much higherthan the 34.5% state average. Moreover, there isa great degree of unevenness in the geographicdistribution of this urban population as it isconcentrated in a few cities. Ahmedabad, situatedon the banks of the Sabarmati River has a totalpopulation of 3.31 million, comprising 74.2% ofthe total urban population and 35.7% of the totalpopulation in the basin. Table 3 shows the ruraland urban population of the basin by district.
As can be seen from the Tables 3 and 4 thedecadal growth rate for the basin was lower during1981-91 as compared to 1971-81.
TABLE 3 :Demography of the Sabarmati River Basin
TABLE 4 :Decadal Growth of Population in Districts within the SabarmatiBasin
TABLE 5 :Agricultural Land Use and Cropping Intensity

204
A D D R E S S I N G W A T E R S C A R C I T Y
The ruraleconomy is
based onrainfedagriculture but
industry alsohas a longhistory in the
basin.
*The non-food crops also include fibres apart from oilseeds and fodder.
District Name of % Area under % Area under % Area under % Area underTaluka Food Crops Oilseed Fodder Crops Non-Food
Crops*
Mehsana Kheralu 51.3 25.6 18.1 48.7
G’nagar Gandhinagar 55.7 23.7 16.3 44.3
Sabarkantha Bhiloda 86.3 8.5 4.1 13.7
Kheda Kapadvanj 69.4 17.2 4.3 30.7
Ahmedabad Dholka 76.2 2.2 16.4 23.8
Agricultural Development
Despite rapid industrial growth, the ruraleconomy of the basin is predominantly basedon rainfed agriculture, although greater accessto irrigation as a result of groundwaterdevelopment has led to development of waterintensive irrigated agriculture in many areas(Shunmugam and Ballabh, 1998). Cropproduction is concentrated in the kharif(monsoon) and rabi (winter) seasons.
The intensity of cropping varies widely acrossdistricts. The total cultivated area expressed as apercentage of the total geographical area in eachdistrict varies from 89.5% for Kheda district to49.5% in Banaskantha district (Table 5). The netsown area expressed as a percentage of the totalcultivable area ranges between 85% and 92%. Thecropping intensity, expressed in terms of thepercentage of gross cropped area to net sown area,varies from 112% in Sabarkantha district to 132%in the case of Gandhinagar district. The netirrigated area, expressed as a percentage of thenet sown area, varies from as low as 17.2% inAhmedabad district to as high as 72.6% inGandhinagar district.
Cropping patterns vary widely across the region.Table 6 below shows the cropping pattern in 1994-95 for five typical talukas in the basin (thesetalukas are representative of their parent districtsin terms of soils, climate and water availability).This table shows that the cropping pattern isroughly balanced between food crops and non-foodcrops in Kheralu taluka in the north eastern partof Mehsana and in Gandhinagar districts. In thecase of Bhiloda taluka of Sabarkantha district,Kapadvanj taluka of Kheda, and Dholka taluka ofAhmedabad district, on the other hand, food cropsoccupy the largest portion of the total cropped areain all seasons.
Industrial Development in theSabarmati Basin
The types of industries in the basin and theirgeographical distribution have a major impact onwater availability, allocation, use and water qualitymanagement. In Gujarat, the Sabarmati basin hasbeen one of the three4 focal points of industryand trade for many centuries. As the region isconducive to cotton growing, some of the earliestimportant industries in the basin had to do withtextiles and dyes, both of which required good
TABLE 6 :Cropping Pattern in Five Talukas in the Sabarmati Basin

A D D R E S S I N G W A T E R S C A R C I T Y
205Source : GOG, 1997.
District
Ahmedabad
Banaskantha
Gandhinagar
Kheda
Mehsana
Sabarkantha
Total
No. ofProjects
28
2
15
9
41
8
106
Per CentProjects
27.18
1.94
14.56
8.74
39.87
7.77
Investmentin Crore
817.69
49.92
324.94
47.66
703.13
215.23
2,208.57
Per Cent TotalInvestment
37.88
2.32
15.05
2.21
32.57
9.97
The Sabarmati
has been a focalpoint of
industry and
trade for manycenturies.
Polluted water into irrigation canal
water sources. During the British period, theseand other industries expanded. Sinceindependence, the trend continued with heavyinvestment in the area, resulting in a generallyrobust industrial economy. In fact, many of theindustries that have grown in the basin over timeare the heavily water consumptive ones such astextile production and processing, chemicals, andstarch and corn products. At present, the textileindustry still dominates, accounting for about 75%of the large-scale and 50% of the medium scaleunits. The next most common industry is thechemical industry accounting for 10-12% of large-scale and 15-18% of medium scale units.
Apart from these industries, other industriesthat are important in the area are dairy andalcohol. In addition, a number of industrial areas/estates have been developed by the GujaratIndustrial Development Corporation (GIDC)during the last two decades. These are dominatedby small and medium sized units involved in someof the industries mentioned above, plusengineering, electronics and the production ofconsumer goods.
The scale of the industrial economy can begauged from the fact that there are around 103large industries in the basin with a cumulativeinvestment of Rs 2,200 crore.5 (Table 7). Inaddition, there are 68 large industrial projectscurrently being implemented with a totalfinancial outlay of Rs 1,662 crore (GOG, 1996p.35). Since economic liberalization, there hasbeen a continuous heavy investment in theindustrial sector throughout Gujarat. A Times ofIndia article on June 14, 1997 stated that a verylarge investment of Rs 118,765 crore is underwayin the industrial sector in the state. Of these,
82.5% are highly water demanding industries suchas petrochemicals and chemicals, drugs andpharmaceuticals, textiles, glass and ceramics, andcement. All these industries are present in theSabarmati basin. Furthermore, industrialdevelopment is a rural as well as urbanphenomenon. It is, for example, proceedingrapidly in rural parts of many districts, includingKutch, Baroda, Ahmedabad, Mehsana,Bhavnagar, Junagadh and Kheda, all of whichhave projects totaling more than Rs 1,000 crore(TOI, 14 June, 1997).
TABLE 7 :Number of Projects and Investment in Industry by District in theSabarmati Basin

206
A D D R E S S I N G W A T E R S C A R C I T Y
Source : Government of Gujarat, 1996.
Sub-basin Domestic Livestock Industrial Irrigation TotalMCM/year MCM/year MCM/year MCM/year MCM/year
Dharoi 8.76 0.88 2.00 163.79 175.43
Hathmati 209.90 21.00 26.00 1,268.55 1,525.45
Watrak 79.69 8.00 1.75 2,055.85 2,145.29
Groundwater ineight out of
twenty-ninetalukas in theSabarmati
basin is “over-exploited”.
Availability of water has not been a limitingfactor for industrial expansion. The ability of theindustry to expand has, in fact, been heavilyinfluenced by the easy availability of groundwaterfrom deep alluvial aquifers underlying most of thebasin. Although overall levels of extraction areunsustainable, most users face few limitations ontheir ability to pump water for use in theirindustrial activities.
From a water consumption perspective, it isimportant to note the concentration of industriesin a few areas. Table 6 shows the number ofindustrial units and size of investment by districtin the Sabarmati basin. It can be seen that outof the total 106 large industrial units, 84 with atotal investment of Rs 1845.6 crores (83.5% interms of investment) are concentrated in the threedistricts of Ahmedabad, Mehsana andGandhinagar, which constitute only 20% of thebasin in terms the geographical area. A CPCB(Central Pollution Control Board) report says thatAhmedabad alone has 80 large and nine mediumscale units. There are also thousands of small scaleunits within this three district area. Overall, itcan be stated that the demand for water is muchgreater in these three districts than elsewhere.
In addition to water demand, effectivemechanisms for disposal of contaminated waterand industrial effluents have not been developed
despite rapid growth of industries in the basin. Theeffluents from new and established industries havea significant impact on water quality. Untreatedor partially treated effluents are disposed of intothe Sabarmati River and sometimes ontosurrounding land areas. They have become majorsources of contamination for the river and(because the river and aquifer are hydraulicallyconnected) for the aquifer as a whole. Pollutionleads to a sharp reduction in the effective wateravailability for all uses.
As can be seen from Table 8, the total industrialwater requirement in the basin is 1 per cent ofthe total water required for the agriculture sector.
Emerging Problems
Groundwater Depletion and WaterScarcity
Demand for water is increasing throughout theregion due to industrialization, population growthand urbanization. This has led to the excessivewithdrawal of groundwater (that is, over-development), causing problems of depletion andscarcity throughout the region.
In contrast to this, the surface water resourceis underutilized. Out of the total water resource of1826 MCM, 1539 MCM is contributed by theGujarat part of Sabarmati basin of which 1320.57MCM has been brought under utilization. With theuse of carry over6 of 275.91 MCM, the untappedwater resource is 494 MCM7 (GOG 1996).
In addition, the government policy ofsubsidizing power and well drilling has increasedaccess to the resource, while reducing incentives
TABLE 8 :Comparative Water Requirements in Different Sub-basins

A D D R E S S I N G W A T E R S C A R C I T Y
207
Banaskantha 1,027.9 873.7 1,120.2 784.1 89.7 Dark
Mehsana 554.1 470.9 1,302.6 911.8 193.6 Dark
Sabarkantha 878.2 746.5 757.2 529.9 70.9 Grey
Gandhinagar 99.8 84.8 100.9 70.6 83.2 Grey
Ahmedabad 900.9 765.8 951.9 666.4 87.0 Dark
Kheda 1,090.1 926.6 705.9 494.1 53.3 WhiteSource : GOG, 1992.
District TotalGround-waterRecharge(MCM/year)
UtilizableGround-waterRecharge(MCM/year)
GrossDraft(MCM/year)
NetDraft(MCM/year)
LevelofGroundwaterDevelopment(%)
Category
for conservation. In some ways, policy incentivesfor groundwater development combined with thespread of mechanized pumping technology havecreated an illusion of plenty by allowing people touse groundwater resources accumulated, in somecases over thousands of years. The disastrous effectsof this mining are compounded by rapid economicexpansion.
Over-development of groundwater is evident inthe government statistics. Out of the 29 talukasin the basin, eight are already in the “over-exploited,” (draft more than 100% of recharge)category, three in the “dark” (draft more than 85%of recharge), and five in the “grey” (draft between65% and 85% of recharge) category. In sum, morethan 55% of the talukas in the basin are alreadyin the warning or over-developed categories. Thisis illustrated in Table 9 showing groundwaterdevelopment levels in each district.
Two clear patterns of groundwater depletionand scarcity emerge in the basin depending onthe prevailing hydrogeology. One occurs in thealluvial areas, while the other is in the hard rockzones. In the alluvial areas of northern Gujarat,which comprises a large part of the Sabarmatibasin, the water storage capacity of the underlyingstrata is generally very good. Nonetheless, over-development has led to the water table falling atalarming rates – in some cases by as much as 3metres per annum. Thousands of shallow wells aredrying up and yield reductions in tubewells arereported across the whole central zone of theSabarmati basin, particularly in Mehsana andAhmedabad districts (GOG, 1992).
Generally, hard rock zones are characterizedby poor long term water storage conditions due to
aquifer characteristics. As a result, in hard rockregions, groundwater availability is often limitedmore by storage capacities than by infiltration ratesor the potential volume of water available forrecharge (Phadtare, 1998). This is reflected in thewater levels which tend to decline rapidly aspumping/extraction takes place. One often hearsfarmers complaining that their wells run dryrapidly soon after the monsoon and remain dryfor substantial portions of the year. This type ofseasonal scarcity has a major impact on irrigationand crop production (Puri and Vermani, 1997),even though no long term water level declines maybe occurring. Under the spell of a good monsoon,water levels may recover to historical levels.Nevertheless, high levels of pumping may resultin rapid seasonal declines. Although data islacking to document this, observations by farmersand experts suggest that as well numbers increase,the rate of seasonal water level decline increasesduring the following monsoon.
The above patterns of depletion are observablein the urban areas of the basin too. Often thedepletion may be acute, but is masked by the
In some areaswater levels are
falling by asmuch as three
metres per year.
TABLE 9 :District-wise Summary of Recharge and Draft

208
A D D R E S S I N G W A T E R S C A R C I T Y
Pollution isemerging as a
major concernand becauseaquifers and the
rivers arehydraulicallyconnected
groundwatercan easily becontaminated.
Milk buffaloes drinking from polluted stream: Rajasthan
enormous economic resources the urban areashave to augment their supplies. The situation inAhmedabad, for instance, is especially welldocumented. As in the rural areas underlain byalluvium, increased demand has resulted in arapidly declining groundwater table and loweredyields in tubewells. As early as 1974, estimatesplaced the annual extraction from aquifersunderlying Ahmedabad at 200 MCM/yr–2.5 timesthe estimated annual recharge of 80 MCM(Pathak, 1985, p.12). Unlike the rural areas, theAhmedabad Municipal Corporation (AMC) andprivate well owners generally have a greater abilityto augment the amount of water available forimmediate use. In Ahmedabad, this is done partlyby increased pumping of groundwater, whichcurrently makes up some 55% of the total quantitysupplied to users by the AMC (Puri and Vermani,1997). Between 1951/52 (when tubewelldevelopment started) and 1996/97, groundwaterextraction from the AMC’s tubewells for themunicipal water supply increased enormously from6.4 MCM to 226 MCM (Puri and Vermani, 1997).
Despite this enormous increase in groundwaterextraction, it has long been realized that increasedpumping alone will not be able to meet the ever-increasing demands of the urban areas such asAhmedabad. Already, as discussed in the followingsection, a large portion of the remaining 45% ofAMC’s supplies are obtained through reallocationof rural water resources to the urban areas.Interestingly, despite the enormous increase inwater supplied by the AMC, the per capita supplyprovided by the AMC has declined over the yearsfrom 197.04 lpcd in 1971-72 to 125.01 lpcd in1996/97 (Source: Ahmedabad MunicipalCorporation, personal communication, 1997).This was a major factor that led to a leap in theinstallation of private wells. Though no officialdocumentation or records of such privateinstallations are available, the trend is clearlyobservable in Ahmedabad.
Pollution and Quality Decline of theResource
Pollution of the Sabarmati River downstreamof Ahmedabad is extensive. It is both a problemin itself and exacerbates water scarcity. Treated anduntreated effluents are disposed of into theSabarmati River both above and downstream ofAhmedabad. This polluted river water finds usein the agricultural fields through the Fatehwadicanal system. According to the Central PollutionControl Board:
“…in the Gandhinagar-Ahmedabad reach, theSabarmati becomes essentially a trunk sewer. Notonly the treated/partially-treated/untreated effluentsfrom the sewage collecting systems of the CRPF(Central Reserve Police Force) colony,Gandhinagar, and the city of Ahmedabad join the

A D D R E S S I N G W A T E R S C A R C I T Y
209
Pollution andover-extraction
have affectedwater quality
throughout the
basin.
river, but the entire sewage, sullage and industrialwastewaters from the fast growing suburbs andshanty-towns flow into the river through thenumerous open drains really meant only to carrystorm run-off, but now acting as open sewers forall types of wastewaters” (CPCB, 1989, p. 43).
To elaborate further, the wastewater inflowsconstitute a significant part of the final run-off inthe river adding to the decline in water quality.Domestic sewage and sullage, industrial effluentsand wastewaters from miscellaneous uses(including cattle watering) makes up 30% , 10%and 9 per cent respectively of the total wastewaters.This contributes organic and bacterial load, whilethe agricultural return water brings sodium andother dissolved inorganic constituents and probablysome residual nitrates and pesticide residues fromthe chemicals applied to crops (GOG, 1996).
Such types of pollution of surface water bodieshave major implications for the quality of thegroundwater resource. The drinking water supplysources based on underground reserves inAhmedabad, for example, are highly vulnerableto pollution as the surface and groundwater bodiesare interconnected. Pollution of groundwatercould render large portions of the entiregroundwater resource unusable for domesticpurposes and irrigation causing major reductionsin the effective overall availability of high qualitywater in the basin.
Over-extraction also appears to have a negativeimpact on water quality in many areas throughoutthe Sabarmati basin. TDS levels in Ahmedabad,for instance, are frequently beyond permissiblelimits, and a widespread incidence of high fluoridelevels in groundwater has recently been reported
from many pumping stations of the AMC.According to newspaper sources, water from AMCtubewells has fluoride levels of 6 parts per million(ppm) as opposed to the desirable limit of 1.0 ppm(Times of India, June 11, 1997). A survey ofprivate tubewells indicated a TDS content as highas 2000 ppm as opposed to the desirable limitof 500 ppm (Times of India, June 19, 1997)in groundwater.
It may be noted in this context that high levelsof pumping often cause migration of low qualitywater from adjacent or interbedded saline aquifersto freshwater aquifers. This may also underliefluoride problems – although mechanisms forfluoride mobilization are not as well understood.Groundwater quality in rural areas of the basinhas declined over the years as well. Out of the 921villages affected in the basin, 532 (58%) villagesare fluoride affected, 216 (23%) are salinityaffected and 173 (19%) had excessive nitratecontent (GOG 1996).
In view of the above, systematic data needsto be collected on the pollution of surface waterand groundwater bodies from the perspective ofsource, type, magnitude and areal spread. Thiswill form one of the focus areas for future researchby VIKSAT.
Competing Uses of Water
Scarcity combined with declines in quality hasled to increased competition for water, especiallybetween the urban or industrial users and the ruralusers. The state of an ever-increasing demandjuxtaposed with inadequate increase in per capitasupplies has already been discussed in connectionwith the situation in Ahmedabad. This city’s

210
A D D R E S S I N G W A T E R S C A R C I T Y
Year Area Irrigated Area Irrigatedby the RBMC (Ha)8 By the LBMC (Ha)9
0
0
628.65
581.20
1,012.51
4,255.70
9,187.94
12,130.90
8,966.30
2,772.80
0.00
3,641.40
11,206.20
5,439.30
10,260.60
10,284.50
12,931.10
9,944.40
7,267.00
1,906.10
Source: Dharoi Project Works, Irrigation Department,Government of Gujarat.
1976
1977
1978
1979
1980
1981
1982
1983
1984
1985
1986
1987
1988
1989
1990
1991
1992
1993
1994
1995
1996
0
0
0
293.58
1,096.70
3,586.48
2,254.90
15,360.00
30,046.10
34,001.07
12,592.90
0.00
6,680.90
27,822.30
16,780.70
40,956.50
43,816.64
51,684.51
45,254.40
49,033.70
3,657.10
Conflicts overequitable
allocation ofavailablesupplies are
major in theSabarmatibasin.
competition for the scarce resource with the ruralareas comes into focus more clearly when we lookat the conspicuous example of the changingnature of water allocation from the DharoiReservoir. This reservoir was built to meet theirrigation needs of the downstream command, butthis goal was never to be fully achieved. This isdue partly to some years of drought (such as the1987), but also because it now supplements theremaining 45% of the AMC’s supply (the portionnot supplied by groundwater development). Thehistorical trends in area irrigated by the DharoiReservoir are given in Table 10.
The planned allocation for release of water forthe Right Bank and the Left Bank command is45,548 ha and 11,130 ha respectively. The abovetable shows that out of 21 years of operation, theplanned allocation of water for irrigation wasreleased during three years only (1993, 1994, and1995) in the RBMC (Right Bank Main Canal) andduring two years (1989 and 1993) in the LBMC(the Left Bank Main Canal). In contrast, theamount of water released for the Ahmedabad andGandhinagar Municipalities from the DharoiReservoir has been steadily increasing. In 1971/72, the quantity released to these municipalitieswas 148.145 MCM. By 1996/97, the quantityreleased was 225.56 MCM (Puri and Vermani,1997). From 1976-77 to 1996-97, water allocationfor urban uses varied from year to year from aminimum of 7 per cent to 100 % of the waterstored in the reservoir. In the drought years of1986-87 and 1987-88, almost all the water storedin the reservoir was allocated to Gandhinagarand Ahmedabad (Shunmugam and Ballabh,1998). The adverse effects of reallocation of waterintended for irrigation has been furthercompounded by decreases in storage availabilityin the Dharoi Reservoir. Sedimentation studiesconducted on the Dharoi Reservoir indicated atotal reduction in the capacity by 13.97 MCM(which is approximately 2 per cent of the designedlive storage capacity of 775.89 MCM of thereservoir) over a four year period from 1990 to1994.10 In sum, it can be concluded that neitherthe groundwater nor surface water sourcescurrently supplying water in the basin are beingmanaged sustainably.
The above is just one illustration of the manytypes of competition that exists in the Sabarmati
TABLE 10 :Area irrigated by Dharoi Reservoir

A D D R E S S I N G W A T E R S C A R C I T Y
211
Existing legaland regulatory
measures do notreflect the
complex factors
that affectavailability of
water and
access to it byusers.
basin. Conflicts around equity is another set ofissues that exists in the basin. This dimension isstudied in depth by Janakarajan at the MadrasInstitute for Development Studies, whose findingsare presented in this publication. The equitydimension in the Sabarmati basin will beinvestigated in the next phase by VIKSAT as partof its continuing research.
Institutional Issues
Existing institutional responses to address waterscarcity and pollution problems in the basin arelimited. Current approaches to the physicalsituation are highly sectoral in nature. They donot take into account the linkages between waterusers or water use sectors and are focused moreon augmenting the available supplies. A fewalternative systems exist, such as those which reuseand recycle wastewater that could increase effectiveavailability of water, in spite of the increasedphysical and social viability of such systems,especially in the urban areas.
The issues which the government has so farattempted through legal and regulatoryapproaches are groundwater overdraft andindustrial pollution. Where groundwater overdraftis concerned, attempts to regulate extraction havebeen made through placing limitations on accessto institutional financing (subsidies throughgovernment controlled banks) for new wells andthrough well spacing regulations. Neitherapproach has been particularly effective. Wells areprivately owned and often located in remote ruralareas, both of which make enforcement difficult.Furthermore, existing legal and regulatorymeasures do not reflect the complex physical
factors affecting the availability of water or thesocioeconomic dynamics controlling the access toit by users. Hydrologically meaningful and sociallyor economically viable regulatory approaches areyet to be developed.
With regard to pollution by industries, pollutioncontrol norms and laws are in place. So far,effective state-level interventions to controlpollution of the Sabarmati River, for example, havebeen judicial through court orders. These haveled to the closure of hundreds of industries inand around Ahmedabad. From the point of viewof industries, the cost of installation of treatmentplants is often prohibitive. The large number ofpolluting small industrial units normally can illafford such plants. In any case, the existing lawsand acts are inadequate and less thancomprehensive as far as the environmentalperformance of the production units is concerned.They are at best “end of the pipe” solutions.Largely disregarded are the possible options ofpollution control that could be adopted in theearlier stages of the process of production or eventhe larger societal issues that encourage pollutionproducing industries.
Summary of Emerging Issues
The pattern that emerges in the Sabarmatibasin is a familiar, global one: Increased demand,arguably fueled by increased access to availableresources, but certainly fueled by the triad ofindustrialization, population growth andurbanization, that lead to increased exploitation.Deliveries to users have grown in absolute termsbut have not kept pace with growing demands.

212
A D D R E S S I N G W A T E R S C A R C I T Y
The governmenthas
traditionallyplayed a majorrole in water
management.
This has led to over-development, a decline inquality of the resource and widespread problemsof scarcity. Scarcity, in turn, has led to increasedcompetition resulting in decreased access to waterfor the disadvantaged segments of the society.
The portentions of the current trend present ableak picture. There is little scope for furtheraugmentation of supplies either by increasedpumping or other extraction methods even tomaintain the current levels of per capita supply.The status quo is unsustainable.
The remainder of this paper focuses onexisting institutions that could be participantsin a reoriented approach to water management,and on the WEAP modelling VIKSAT has done inan attempt to understand the current situation.The potential impact on the balance betweendemand and supply of water under differentmanagement alternatives is also evaluated in apreliminary manner.
Study of Existing Institutionsin the Sabarmati Basin11
Existing institutions that are active on waterissues in the Sabarmati basin and those who couldplay a major role in future management initiativesare described here. The goal of the study is to lookat both the conventional state and governmentalorganizations that have traditionally played asignificant role in water management and at the“less conventional” organizations, such as ruralcooperatives. The latter group has not played muchof a role as yet but has a large rural membershipbase that is directly affected by water problems.They could, as a result, emerge as active players.
Government and ResearchInstitutions
Water and Land Management Institute(WALMI), Anand
The Water and Land Management Institute(WALMI) is an autonomous body under theGujarat Irrigation Management Society (GIMS) setup in 1980-81 with the objective of addressingissues related to land and water in a holisticmanner. The focus has been on bridging theinformation gap between irrigation potential andutilization and also between actual productivityand potential productivity of irrigated land. Theinstitute emphasis is on training and the provisionof technical guidance to farmers and field officersof the various government departments dealingwith water and land related issues. It also providesconsulting services and is engaged in actionresearch. There are two programme units, namelytraining and technical, headed by joint directors,with the following activities: 1) imparting trainingto the in-service personnel of governmentdepartments; 2) carrying out action research withfarmer participation to contribute to the knowledgebase on water management issues; and 3)disseminating information through variouspublications. The thematic training programmes,targeted at farmers and government officials, covera range of topics and issues such as groundwaterrecharging, farm level management of irrigation,and the reclamation of saline, alkaline or waterlogged areas, to farmer participation in irrigationwater management.
The Institute has a staff of about 60professionals with wide ranging expertise in the

A D D R E S S I N G W A T E R S C A R C I T Y
213
Academicinstitutions are
beginning tofocus on water
problems.
fields of agronomy, civil engineering, agriculturalsciences, soil sciences and social sciences. Mostof the professionals are doctorates in theirrespective disciplines. Staff are often deputed tonational and international training programmes,seminars and workshops. Around 70 per cent ofthe professional staff are young (below 40 years),which helps bring innovative thoughts and ideasinto the programme.
Though the Institute has an autonomousstatus, it does not appear to be fully free frombureaucratic aspects that reduce its effectiveness.Often, members of the professional staff at theInstitute are on short term deputation from theirrigation department, making it difficult to carryout activities in a sustained way. The bureaucraticnorms and procedures adversely affect the workculture and the morale of the professional staff,which in turn affects the quality of the work. Inaddition, the Institute has recently started facingfunding constraints resulting in delays in projectcompletion.
It is partly due to similar bureaucraticconstraints that there is little direct interactionbetween the professional staff at the Institute andthe communities on which they do their research.Though WALMI has undertaken action researchprojects involving farmer participation, itsinvolvement in project implementation is by andlarge very limited. The transfer of technology formsan essential component, but is addressed by thelocal staff of the irrigation department. Thisprocess prevents the farmers from getting involvedwith the programmes initiated by WALMI andrestricts the experience the professional staff couldgain by working more closely with the farmers.
Institute of Rural Management, Anand
The Institute of Rural Management, Anand(IRMA) is an autonomous institute, set up in 1979as a society under the Societies Act. It wasestablished primarily to further education andtraining in rural management and to provideresearch and consulting services to cooperativesand other agencies engaged in the socioeconomicdevelopment of rural communities, especially therural poor. Today, IRMA’s activities are governedby the following objectives:
� to provide relevant education and trainingto young men and women for managingincome generating and developingactivities on behalf of rural producers;
� to offer training courses for policy makers,directors, general managers and those incharge of specific managerial functions inrural enterprises and projects;
� to conduct research on operationalproblems in the rural sector in order tohelp improve the management of ruralenterprises and projects; and,
� to undertake basic research into the processof rural management to augment theexisting body of knowledge on the subject.
As a management institution, it concerns itselfprimarily with bringing about change throughenhancing the effectiveness of organizations.IRMA is also expected to be an intellectual resourcebase for the member controlled rural cooperativemovement that functions in most of Gujarat. Apartfrom providing professional training programmesin rural management, IRMA undertakes researchand consultancy in a wide variety of areas in the

214
A D D R E S S I N G W A T E R S C A R C I T Y
The AhmedabadMunicipal
Corporations isthe major entityresponsible for
water supply inthe city.
rural sector. These are intended to build on theexisting body of knowledge of issues in these areas,and ultimately contribute to changes in the relatedpolicies and programmes.
Recognizing the critical role of naturalresources in the rural livelihood systems, IRMAtakes a keen and active interest in research,training and consultancy in the areas of commonproperty resource (CPR) management. Unlike theconventional approach of looking at technicalefficiency, IRMA’s research has always concentratedon exploring options for better management ofCPRs, the idea being that better managementensures easier access to the benefits of the CPRsfor the poor, thereby serving as an instrument ofpoverty alleviation (IRMA, 1995).
In the context of CPR management, focusedresearch is carried out on understanding issueswith reference to groundwater and surfaceirrigation systems. In groundwater, IRMA’s researchhas focused on public tubewell irrigation as ameans of enhancing access of the rural poor togroundwater. Research has also looked at the waysof redesigning tubewell programmes, as well asunderstanding water markets and theirimplications for equity and sustainability ofgroundwater use. IRMA studies on water marketshave highlighted the role of electricity pricing andsupply on the economics of modern waterextraction mechanisms and on the structure andconduct of localized groundwater markets.
Ahmedabad Municipal Corporation
Ahmedabad Municipal Corporation wasestablished in 1858 as a municipality by the Britishgovernment. In 1950, AMC covered a total area of
90 km2. Today it covers an area of 190.84 km2
catering to a population of 2.9 million. AMCemploys 25,000 workers on its payroll, whileanother 5,000 are employed indirectly in schools,hospitals and transport services supported by thecorporation. The structure of AMC is made up oftwo bodies one consists of elected representatives,the other is administrative.
All the departments are headed by deputymunicipal commissioners (Dy. MC) who areresponsible for a range of services. Under the Dy.MC’s, there are different professionals appointedon the basis of work competency. The professionalsare generally engineers, MBAs, diploma holders inengineering, teachers, librarians, clerks and typists.From 1990, a new line of thinking for introducinginnovations has emerged within the AMC. This isbecause AMC had been criticized for lack ofcompetency to deal with issues emerging due torapid industrialization and urbanization in andaround the city of Ahmedabad. Subsequently, theAdministrative Reform Cell was formed within theAMC to identify ways of improved functioning ofeach of the wings and make concrete suggestionsfor ensuring a higher level of efficiency in itsservice delivery systems.
The AMC jurisdiction is divided into 43wards and 5 zones represented by 129 electedcouncilors having different political affiliations.A standing committee has executive powersand is comprised of 12 councilors, the MunicipalCommissioner and Dy. MCs (Figure 6).The committee meets once a week to reviewthe work. The elected representatives enjoy alot of power in the matter of project selectionand implementation as they are also backedby their own political parties. The Municipal

A D D R E S S I N G W A T E R S C A R C I T Y
215
In recent years, AMC has embarked uponspecial human resource development initiatives toimprove the efficiency of its employees. Theinitiatives began with the formation of theAdministrative Reform Cell to look into theloopholes within the present administrativestructure, which is as bureaucratic as any othergovernment institution. A reputed privateconsultancy firm, A. F. Ferguson, based in Bombay,has been assigned the task of reviewing the presentstructure and suggesting alternatives. The firm wasexpected to submit its report in September 1998.As an outcome of the review, some major changesin the structure of AMC were expected. In themeantime, since 1998, staff of AMC have beendeputed for one-month training in batches of 50to the Institute of Local Self Government inAhmedabad. This institute is an autonomous bodyimparting training and skills in the area of localand decentralized governance. The trainingprogrammes are a part of the larger attitudinalchanges of its employees and the corporation bearsall the expenses for the same. Accordingly, thehigher officials are also sent on training and toworkshops according to their area of specializationand interest.
AMC displays immense potential for playing akey role in urban water use management as itpossesses the authority and expertise to deal with
Roads and Building Committee
Secondary School Coordination Committee
Legal Committee
Tax Committee
Octoroy Committee
Recreational and Cultural Committee
Housing and Improvement Committee
Estate Management Committee
Hospital Committee
Solidwaste Management Committee
Health Committeee
Town Planning Committee
Town Planning Committee
Water Supply and Sewerage BoardM
unic
ipal
Chi
ef A
udito
r
the problems. It has the decentralized structurewith representation from the general public thatcan be capitalized on for any intervention.
Gujarat Water Resources DevelopmentCorporation (GWRDC)
Gujarat Water Resources DevelopmentCorporation (GWRDC) branched out as a separatedepartment from the Public Works Department(PWD), Government of Gujarat, in 1976 in
The GujaratWater Resources
DevelopmentCorporation was
established to
assist explorationand development
of groundwater.
Figure 6:Structure of the Ahmedabad Municipal Corporation
Commissioner has to obtain the standingcommittee’s approval for projects whereoutlay exceeds Rs 500.00.12 The standingcommittee also supervises appointments of theClass I officers in the corporation. The municipalboard meets once a month with all the 129elected members and the representatives of theadministrative wings.
SchoolBoard
MunicipalSecretary
TransportCommittee
StandingCommittee
DY. MAYOR
MAYOR

216
A D D R E S S I N G W A T E R S C A R C I T Y
recognition of the increasing need for developmentof groundwater resources. It was set up primarilyto drill tubewells to increase access of resource poorfarmers to groundwater for irrigation. Theseactivities are carried out by different wings of thecorporation, that is, the Geology Wing, MechanicalWing and Civil Wing. These wings cater to differentaspects of groundwater development. For example,the Geology Wing, which comprises geologists,hydrologists, geophysicists and chemists, carriesout groundwater investigation. Similarly, theMechanical and Civil Wing, which comprisesmechanical and civil engineers has professionalcompetence for coordinating various mechanicaland civil works such as well drilling and the layingout of distribution lines.
However, with over-development of groundwateroccurring in certain parts of the state, the strategyof the corporation has begun to change fromdevelopment support to efficient managementthrough farmer participation. The dismal physicaland financial performance of the state ownedtubewells, the increasing financial burden on theGWRDC and the growing recognition of themanagement capabilities of farmers have largelybeen responsible for such a shift in policy andprogrammes of the corporation. As a result, around300 out of the 3,000 odd tubewells owned by thecorporation have been turned over to the farmers’organizations for management (Kumar, 1995).
GWRDC has a very large professional stafffor carrying out groundwater development. Thecorporation regularly sends its staff for trainingto upgrade their skills. The recent World Bankaided Hydrology Project being undertaken bythe corporation has a strong training component.For all training purposes, the corporation is
coordinating with WALMI in Anand. Usually, oncea year, the technical staff attends trainingsessions. The field staff is periodically exposed tomore intensive training courses ranging from 10to 30 days.
The corporation has expertise in the area ofwater resource investigation and management. Itis engaged in the collection of hydrological andgeo-hydrological data for the entire state, and isnow planning to take up recharge activities in theareas where groundwater has been depleted inalarming proportions. Already, projects have beeninitiated to artificially recharge groundwater in thewater scarce areas.13
The corporation is also aware of the fact thatsuch efforts should be supplemented with properregulation to control further development of theresource. It has recognized the increasing need toinvolve the communities in the process ofregulation and management of the preciousresource. Now, even for drilling wells, thecorporation seeks the support of the villagers. Inthe near future, the corporation envisages havingmore such project initiatives taken up for thesustainability of the resource.
Gujarat Water Supply and SewerageBoard (GWSSB)
The board was set up with the objective ofsupplying safe drinking water to urban and ruralareas and creating infrastructure for hygienicsewerage facilities to the people. It was started in1979 as a board, and prior to this, the organizationwas known as the Public Health Department. Theboard is divided into three zones, namely, theSouth Gujarat, Ahmedabad and North Gujarat
The focus of theGujarat Water
ResourcesDevelopmentCorporation has
now shiftedfromdevelopment tomanagement.

A D D R E S S I N G W A T E R S C A R C I T Y
217
zones. The later includes Surendranagar andKachchh and Saurashtra districts. Each zone isheaded by the chief engineer under which thereare three sectors – financial, administration andtechnical. The technical sector is comprised ofvarious departments like material, mechanical,enquiry and quality control, monitoring, trainingand research and development.
The board appoints graduate engineers astrainees who take up senior positions afterpromotion. In addition, the board has recentlystarted appointing people with a background ofsociology and social work because of the changein the thinking from pure technical to more social.This has happened due to a gradual realizationthat drinking water problems cannot be addressedthrough engineering solutions alone but requireunderstanding of the socioeconomic dimensionsas well.
To operationalize its mandate, the board hasclassified villages according to the status of watersupply and availability. These classifications are:
(1) No-source village : Village with no source ofwater supply;
(2) Partly completed (PC)-I : Village havingwater supply of 10 lpcd (litre per capita per day);
(3) PC- II : Village having water supply of 10-20lpcd;
(4) PC-III : Village having water supply of 20-30lpcd;
(5) PC-IV : Village having water supply of 30-40lpcd.
These classifications are based on theMinimum Need Programme developed by theGovernment of India in which the minimumwater need for rural areas is referred to as 40 lpcd.For the urban areas, it is 70 lpcd.
Water supplied by the board is from two mainsources, surface and groundwater. Groundwater isextracted through tubewells and hand pumps,depending upon the availability of the water sourceand the geohydrology of the area. Management ofwater systems developed by the board depends onscale. In the first, smallest, category, one villageis chosen and the maintenance of the waterharvesting structures are handed over to the villagepanchayat. At larger scales (clusters of 10 villagesor larger groups of 25-100 villages), water issupplied through pipelines and the maintenanceis done by the board. Even within the smallestcategory hand pumps in villages are provided andmaintained by the board itself.
The board faces major problems becausedemand generally exceeds supply. Most of the time,the supply is based on the average rainfall of aspecific area. However, rainfall is dependent on thewater cycle of the particular area and hence it isdifficult to maintain regular supplies. Furthermore,large-scale deforestation has occurred whichdisrupts the water cycle in many parts of the stateand affects the distribution of water. This iscompounded by rapid drops in groundwater levelsand competition from industries and agriculture.
Despite the above general pattern, water relatedproblems differ from region to region. Forexample, southern Gujarat has a problem of waterlogging, whereas northern Gujarat faces theproblem of groundwater depletion. Large tracts of
Water problemsdiffer from
region toregion,
complicating the
Gujarat WaterSupply and
SewerageBoard’s mission
of sustainabledrinking water
supply.

218
A D D R E S S I N G W A T E R S C A R C I T Y
inland Kachchh are affected by inherent salinityin groundwater systems, whereas salinity due tosea water intrusion occurs in both Kachchh andSaurashtra. The board has to cope with all theseproblems in its attempts to supply drinking water.
In view of these problems, there is a major shiftin the groundwater extraction policy of thegovernment. A major decision to source drinkingwater supplies from surface water and avoid usinggroundwater, wherever possible, has been taken. Acomprehensive plan has been initiated forMehsana district by Tata Consultancy under whichwater would be supplied to villages through canalsfrom the Dharoi Dam. A defluoridation plant isset up as a pilot project in Chanasma taluka whichfalls outside the river basin in Mehsana district.The plant covers 62 fluoride affected villages.
There is a welcome change in the thinking ofthe board. The board has decided to involvecommunities in the management of water. A socialwing has been created within the organization toinvolve people in the execution of activities relatedto water supply. The board facilitates the formationof pani samiti (water committees) under thesupervision of gram panchayat (elected villagecouncil) for the same. The members include thehealth worker, a gram panchayat member,teachers and an official from GWSSB. The socialwing of the board works with the talukapanchayat, the Taluka Development Officer(TDO), the village panchayat and the officials atthe board for coordination and management ofthe water supply plans. The social wing alsoextends training and other support needed forbetter implementation of the programme.
Gujarat Jalseva Training Institute(GJTI)
Accepting human resources development as asound economic investment, the World Bankappraisal mission in the early 1980’s suggested thatthe Gujarat Water Supply and Sewerage Board(GWSSB) develop a comprehensive trainingscheme and associated infrastructure. The goal wasto create an institute capable of meeting trainingneeds related to the project and the sector beyondthe project period. Accordingly, Gujarat JalsevaTraining Institute (GJTI) was established byGWSSB in October, 1988 with the World Bank’sfinancial support. The aim was to enhance andupgrade the professional skills and the behaviouralattitude of the GWSSB staff to meet the challengingneeds in the field of drinking water supply andsanitation. The institute not only caters to thetraining needs of the GWSSB, but also to the localbodies and NGOs.
GJTI has an extensive training complex. Theinstitute building houses five lecture halls, aseminar hall, a conference room, a library, aremote sensing laboratory a mobile testinglaboratory, a mechanical workshop, a computersystem with high-tech hardware and leadingsoftware including Geographical InformationSystem. GJTI runs more than 50 training andawareness programmes in a year.
GJTI is headed by a director of the rank of chiefengineer assisted by two joint directors, eight seniortraining officers, six training officers and sixassistant training officers. The regular staff of GJTIis 62 with 22 casual workers. GJTI has five separate
Because ofgroundwater
qualityproblems, theGujarat Water
Supply andSewerage Boardhas decided to
supply drinkingwater fromsurface sources
whereverpossible.

A D D R E S S I N G W A T E R S C A R C I T Y
219
wings - civil, mechanical, hydrological, laboratoryand administrative. All the wings include in-houseas well as field training cells. Many of the facultymembers are well qualified and trained under atrainer’s training programme.
The institute’s training plan includes: trainingfor water sector staff from the grass roots to thetop level; field training for junior staff; seminars/workshops for senior officers; awareness andcommunity participation camps for the generalpublic; specialized need-based training and trainerstraining programme for specialized groups andnon government organizations (NGOs).
Gujarat Ecology Commission(GEC)
GEC aims to integrate environmental anddevelopmental concerns to facilitate fulfillment ofbasic needs and improve living standards. Formedin 1988, it works as a state level nodal agency forecological restoration, organizing people’s actionto prevent ecological degradation, planning forsustainable development and establishingappropriate institutions. Replacing the traditionalsectoral approach, GEC strives to develop a holisticoverview of the region through a comprehensive,multi-disciplinary database, compiled from varioussources. With the help of computers and GIS, thedata is presented as a series of maps and analysedby a team of experts to obtain a broad view of thetrends in different parameters, their criticalinterrelationship and the influences of theadjoining regions. People are viewed as partnersin order to evolve a system of sustainable use ofresources without undermining the productivepotentials of the systems.
At the policy level, the GEC works to bringabout a dialogue and get policy makers andenvironmental organizations to understand that acommon vision and cooperation in ecologicalrestoration is the only way to ensure sustainablehuman welfare. At the grass roots level, NGOsare being motivated and mobilized to sow the seedsfor an environment movement. The GEC is in aprocess of developing an action centered networkinvolving different government agencies, scientistsfrom different disciplines, academic institutions,NGOs, individuals, business and industries andcommunication experts to enhance the scale andpace of ecological restoration. Further, acomprehensive, Environment Information System(EIS) is being developed to serve as a databankand provide ecologic data to all actual users(NGOs, cooperatives, government departments andmedia). Multi-disciplinary studies have beencommissioned to prepare a state level environmentscenario, which would form the basis of aproductive plan. The commission has prepared ataluka level profile based on soil and waterparameters. The current ecological status ofKachchh has also been documented.
GEC has been involved in networking withsmall NGOs in order to have a larger outreach.The commission assists NGOs to enable them toachieve ecology related objectives by sharingecological information and organizing exposurevisits/training programmes and motivation camps,identifying suitable projects and funding sources,and developing district level platforms for experts,NGOs and government officials. GEC expected tocreate a network of about 1,000 NGOs in all the19 districts of Gujarat by the end of 1996.
Dialoguebetween policy
makers andenvironmentalorganizations
builds trust.This has been a
major focus of
the GujaratEcology
Commission.
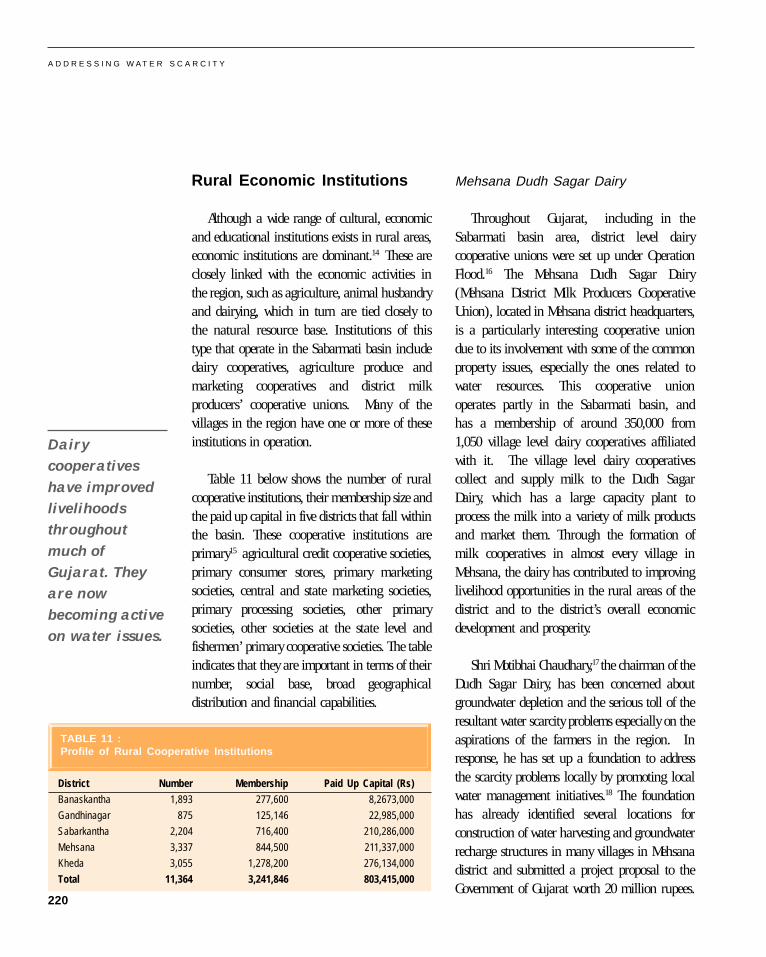
220
A D D R E S S I N G W A T E R S C A R C I T Y
Rural Economic Institutions
Although a wide range of cultural, economicand educational institutions exists in rural areas,economic institutions are dominant.14 These areclosely linked with the economic activities inthe region, such as agriculture, animal husbandryand dairying, which in turn are tied closely tothe natural resource base. Institutions of thistype that operate in the Sabarmati basin includedairy cooperatives, agriculture produce andmarketing cooperatives and district milkproducers’ cooperative unions. Many of thevillages in the region have one or more of theseinstitutions in operation.
Table 11 below shows the number of ruralcooperative institutions, their membership size andthe paid up capital in five districts that fall withinthe basin. These cooperative institutions areprimary15 agricultural credit cooperative societies,primary consumer stores, primary marketingsocieties, central and state marketing societies,primary processing societies, other primarysocieties, other societies at the state level andfishermen’ primary cooperative societies. The tableindicates that they are important in terms of theirnumber, social base, broad geographicaldistribution and financial capabilities.
Mehsana Dudh Sagar Dairy
Throughout Gujarat, including in theSabarmati basin area, district level dairycooperative unions were set up under OperationFlood.16 The Mehsana Dudh Sagar Dairy(Mehsana District Milk Producers CooperativeUnion), located in Mehsana district headquarters,is a particularly interesting cooperative uniondue to its involvement with some of the commonproperty issues, especially the ones related towater resources. This cooperative unionoperates partly in the Sabarmati basin, andhas a membership of around 350,000 from1,050 village level dairy cooperatives affiliatedwith it. The village level dairy cooperativescollect and supply milk to the Dudh SagarDairy, which has a large capacity plant toprocess the milk into a variety of milk productsand market them. Through the formation ofmilk cooperatives in almost every village inMehsana, the dairy has contributed to improvinglivelihood opportunities in the rural areas of thedistrict and to the district’s overall economicdevelopment and prosperity.
Shri Motibhai Chaudhary,17 the chairman of theDudh Sagar Dairy, has been concerned aboutgroundwater depletion and the serious toll of theresultant water scarcity problems especially on theaspirations of the farmers in the region. Inresponse, he has set up a foundation to addressthe scarcity problems locally by promoting localwater management initiatives.18 The foundationhas already identified several locations forconstruction of water harvesting and groundwaterrecharge structures in many villages in Mehsanadistrict and submitted a project proposal to theGovernment of Gujarat worth 20 million rupees.
Dairycooperatives
have improvedlivelihoodsthroughout
much ofGujarat. Theyare now
becoming activeon water issues.
District Number Membership Paid Up Capital (Rs)
Banaskantha 1,893 277,600 8,2673,000
Gandhinagar 875 125,146 22,985,000
Sabarkantha 2,204 716,400 210,286,000
Mehsana 3,337 844,500 211,337,000
Kheda 3,055 1,278,200 276,134,000
Total 11,364 3,241,846 803,415,000
TABLE 11 :Profile of Rural Cooperative Institutions

A D D R E S S I N G W A T E R S C A R C I T Y
221
The foundation also raises its own funds throughfarmers’ contributions through the district dairycooperative. It is an indication of the foundation’sstrength that it has been able to bring in some 11million rupees in one day by collecting one day’scontribution of milk production from eachcooperative member.
Village Dairy Cooperatives
With the formation of regional and village leveldairy cooperatives, dairying has become a majoreconomic activity in the rural areas. Thesecooperatives have now become an integral part ofmost rural communities and are botheconomically strong and socially vibrant. In orderto understand the situation better at the villagelevel, VIKSAT has undertaken studies of the villagesof Umri in Kheralu taluka of Mehsana district andof Nana Kotasana, also in Kheralu taluka.
Umri has a total of 800 households with peoplefrom about 14 castes and communities livingtogether without evident conflict. Out of the 800households, 500 are members of the village dairycooperative. All the major castes and communitiesare well represented. The cooperative collectsaround 1,500 litres of milk every day, which isworth approximately Rs 18,000. This implies thatthe average monthly income from dairying forcooperative members is approximately Rs 1,080.Over time, the cooperative has been able to developits own infrastructure for collection, quality controltesting, storage and sale of milk. Recently, acooperative was formed in the village to addressgroundwater depletion and land degradationproblems. This new cooperative already has amembership of around 100, that is one-eighth ofthe total households in the village.
Nana Kotasana, another village located in thenorthern extreme of the Kheralu taluka has apopulation of around 1,500 people with a total of171 households, which is comprised of 225 nuclearfamilies. All except 10 families own land forcultivation. The unregistered dairy cooperativeworking in the village has 65 members and hasbeen in operation since 1994. The average milkproduction is 400 litres per day, worth around Rs120,000 per month (Rs 1,440,000 per year). Thisimplies that the average income for a family fromdairying is around Rs 24,000 per annum or Rs2,000 per month.
Agriculture Cooperatives
As is the case with dairy cooperatives,agriculture and tree growers cooperatives arecommon throughout rural Gujarat. In Mehsanadistrict, for example, agriculture cooperativeshave been in operation since the early ‘70s. Thesecooperatives have a large number of farmersas members from every village. They supply seedand fertilizers to the member farmers throughtheir outlets spread across the district. Suchagricultural cooperatives have been instrumentalin modernizing agriculture throughout theregion by introducing hybrid varieties oftraditional crops (such as wheat and millets) andalso some of the oilseed cash crops (such as castorand mustard).
Tree Growers’ Cooperative Societies
The last in the series of institutions operatingin the region are the Tree Growers CooperativeSocieties (TGCS), which are less conventional.Though these TGCSs appear to be insignificant interms of number and geographical distribution,
The cooperativemovement has
createdopportunities
for
heterogeneouscommunities to
work together
without conflict.

222
A D D R E S S I N G W A T E R S C A R C I T Y
they are important in that they have begun to dealwith natural resource management issues. Theyare registered under the Cooperatives Act, and thebyelaws of Tree Growers’ Cooperative Societies (ofthe Government of Gujarat) are applicable tothem. One of the prerequisites for the formationand registration of these TGCSs is the availabilityof common land (wasteland, degraded forest landor pasture land) for forestry related activities.
Gadvada, a small region of 32 villages in thenorthern part of Kheralu taluka, is one area whereTGCSs are becoming active. The region facesnatural resource related problems such as soilerosion, land degradation and water scarcity. Allvillages in the region have a reasonably largeamount of village common land, which isdegraded. At present, ten cooperatives areoperational in the area, promoted by VIKSAT toaddress the problems of land degradation andgroundwater depletion. They are involved in forestprotection, wasteland re-vegetation, soil waterconservation and water harvesting activities. Thefirst of such cooperatives was formed in a villagecalled Kubada in 1986. The members of thesecooperatives are small and marginal farmers.
There is a clear distinction between dairycooperatives and TGCSs. In the case of the dairycooperatives, the selling of milk is such a dailyeconomic activity that people have strongincentives to sustain it, while in the case of TGCSs,the activities are more sporadic and dispersed andthe returns less immediate. Typical activitiesundertaken by TGCSs include the planting andprotection of trees, construction of water retentionand harvesting structures and the cutting of
grasses, all of which involve relatively low levelsof investment.
The age profile of members in the variouscooperatives is more or less balanced between theyoung (between 20-40) and the old (above 40years of age). Young people, particularly men,often migrate to cities such as Ahmedabad andSurat, and to towns such as Satlasana, Mehsanaand Kheralu for wage labour.19 They maintainconstant contact with their villages by visiting onceevery two to three months. However, after the ageof 40, they often settle in their native villages topursue their traditional occupations.
In general, the cooperatives have goodrepresentation from all the communities/ castes.The level of education attained by cooperativemembers is generally low, which is a reflection ofthe educational profile of the village itself.However, the fact that many rural inhabitants haveexposure to the outside world, thereby gaining awide range of experience (ideas, technologies,language and culture), helps them gainconfidence to tackle their local problems. Of late,the educated youth in the villages are found takinggreat interest in the cooperatives. This indicatesthat the direction is being set for a vibrant andsustainable cooperative institutions at the microlevel. The fact that these cooperatives have notemerged from any outside interventions (as in thecase of primary agriculture societies), but are aresult of the need to address the resourcedegradation problems at the local level, isconsidered a very healthy sign. Institutions havingthe above characteristics are bound to becomeviable and sustainable for any cooperative action.
Tree grower’scooperatives
are increasinglycommon buttheir activities
are moresporadic anddispersed and
their returnsless immediatethan is the case
with dairycooperatives.

A D D R E S S I N G W A T E R S C A R C I T Y
223
Analysis of ExistingInstitutional Capacity forWater Management
At present, there is no one institution or a setof well-linked institutions able to carry out ormanage the full range of activities necessary for acomprehensive and successful water managementprogramme. Each set of institutions has itsstrengths and weaknesses.
The government and quasi-governmentalinstitutions and other organizations concernedwith water in Gujarat are designed and establishedon the principles of engineering and technologyneeded for water development and are capable ofdealing with technical issues related todevelopment focused functions. More specifically,most government institutions in Gujarat weredesigned to carry out water resource exploration,surveys, drilling, aquifer and surface waterassessment functions. They were also designed asimplementation organizations to undertakeconstruction of water supply and irrigation projectsoften involving interbasin transfers or deep welldrilling. None of the scientific and technicalinstitutions have had much involvement in thescientific and technical issues related to waterresource management as opposed to development.They have, for example, little experience inmonitoring or assessing water use or operatingcombined surface, conveyance and groundwatersystems conjunctively. This is not surprising sincefew regions in the world have considerablepractical experience in these key managementareas. As a result there is a large gap in the skillsessential for management.
In addition to limited experience withmanagement, most government scientific andtechnical organizations lack social perspectives andare not aware of micro-level issues varying fromarea to area. Though there is a growingacknowledgment that water management is asocial activity, the capacity to deal with the socialdimensions of water management issues withinthese institutions is more or less lacking. Mostgovernment institutions also lack skills to analysethe social and economic issues and the socialengineering skills to deal with user groups orcommunities, all of which are prerequisites forimplementing many local management solutions.
The research and training institutions probablyserve as a strong link between the technicalinstitutions, the government institutions and theinstitutions or people at the local level. They arestrong in analysing physical, social and economicissues related to water management and have theability to conceptualize new social and technicalapproaches and act as powerful catalysts for policyand programme change. They can assist thegovernment or non-government technicalinstitutions in developing basin level watermanagement perspectives. These research/traininginstitutions can also train and orient professionalsfrom government technical agencies in tacklingwater management problems, which have manydimensions beyond engineering.
The quasi-government institutions, such asmunicipal corporations and municipalities, havesubstantial financial and technical resources tocarry out technical projects related to waterresource development, water supply, sanitation,
In Gujaratorganizations
concerned withwater focus on
the technical
and engineeringaspects ofresource
development buthave little
expertise in
management.

224
A D D R E S S I N G W A T E R S C A R C I T Y
Introduction
With groundwater overdraft in rural and urbanareas, declining surface water availability
due to pollution and increasing population andwater dependent economic activity, the gap
water recycling, and water harvesting andrecharging. These institutions need statutorypowers to enforce legal and regulatory measuresfor water conservation and management in orderto achieve long term water management objectives,and could benefit from strengthened links with theresearch and training institutions.
The numerous rural village institutions, suchas the village level dairy and agriculturecooperatives in the basin, have a strong social base.Many individuals associated with them have athorough understanding of the natural resourcecondition, factors affecting resource use, resourcemanagement issues and the factors which arecritical to evolving strategies for managing naturalresources. However, their area of expertise orunderstanding is often limited to one village or agroup of villages in their microclimate.
Many individuals involved with largercooperative institutions, on the other hand, oftenhave a similar grasp of the local issues and, withthe geographical distribution of the cooperatives,may be more knowledgeable about conditions andneeds in areas that are much larger than anindividual village. These individuals and/orinstitutions are involved in rural development and
natural resource development activities in andaround the basin and have strong resourcemobilization capabilities and social mobilizationskills. The institutions are, however, designed tosupport farmers with immediate economicactivities – such as the transport, processing andmarketing of milk – not for long term naturalresource management functions. They lack bothexperience with the broad set of issues central towater management and sound technical orengineering capabilities. They also have no legal,statutory or financial powers related to watermanagement. Such institutions do, however, havethe capability to mobilize the existing rural villageinstitutions – dairy cooperatives, agriculturalproduce cooperatives, forest cooperatives and watercooperatives. They are also well aware of themanner in which water problems threaten therural areas in which they work.
Overall, the large cooperatives represent anexisting institutional structure that couldcontribute to attempts to address regional watermanagement needs. Their capacity, however,needs to be strengthened. For this, stronger linksbetween these institutions and the government,technical and research/training institutions needto be forged.
Cooperativesrepresent an
existinginstitutionalframework that
could contributeto regionalwater
management.
Defining the Option Boundaries for Local WaterManagement
between water supply and demand is wideningthroughout the Sabarmati basin. In this section,alternative water management strategies to addresswater scarcity and pollution problems in theSabarmati River basin are investigated – in a verypreliminary manner – using Tellus Institute’s

A D D R E S S I N G W A T E R S C A R C I T Y
225
3�����
5��
���
6�� �3�
���
���
�33
�����
���
���
�%�
��
�5�
���
���
���5�
������
���
��
���
�$�� �����$�<')=
3>��"$���$ ��8�� ��<'=5&������;;����&�"�$�
"&� �>��$"�<*=
��#$"��&�$�
3����"�>���<)=
�& #$�� �$�<(=
�$�$"#&�"�<'=��� ���#$"�"� ������& �5� 4�$�� �����$��$��" �5� 4
�"$���$ ��8�� ���$��" �5� 4
Computermodels can be
used to simulate
differentmanagement
scenarios that
serve as a basisfor dialogue
between
stakeholders.
Water Evaluation and Planning (WEAP) system.This is done by creating water balance scenariosfor the years 2020 and 2050 that can be used tocompare proposed water managementinterventions to a base case scenario in which littlemanagement is attempted, while demandcontinues to grow at historical rates.
WEAP Configuration
The WEAP configuration for the Sabarmatibasin is given in Figure 7. The WEAP model forthe Sabarmati basin has the following components:
Demand Sites
The demand sites identified for the Sabarmatibasin are: Ahmedabad urban demand; Ahmedabadindustrial demand; Gandhinagar urban demand;rural agricultural demand; rural domestic
demand; upper zone agricultural demand; upperzone domestic demand; middle zone agriculturaldemand; middle zone domestic demand; Dholkaagricultural demand; Dholka domestic demand;and Dharoi right and left bank demand.
Supply Sources
The water supply sources in the basin arecategorized into local supply sources and theSabarmati River. Among the local sourcesidentified are the upper alluvial aquifer, upper hardrock aquifer, middle alluvial aquifer and loweralluvial aquifer. Those supply sources identified inthe Sabarmati River are the Dharoi reservoir(which is treated as a reservoir node), midrecharge node (treated as a conjunctive use node),Dudheshwar water works (treated as a withdrawalnode), and the Vasna barrage, which is also awithdrawal node.
Figure 7:WEAP Configuration

226
A D D R E S S I N G W A T E R S C A R C I T Y
Network Links
The network links identified in the model arethe transmission links from all the supply sourcesto all the demand sites. They include: transmissionfrom Dhudheshwar water works to Ahmedabadurban and Gandhinagar urban demands;transmission from the four groundwater basedlocal supply sources to the corresponding eightdemand sites (agricultural and domestic for eachzone); transmission from Vasna barrage to Dholkaagricultural demand; transmission link fromDharoi reservoir to the left and right bankcanal command areas located in Zone II and ZoneI respectively.
Confluence Nodes
Two confluence nodes are identified along themain trunk of the river. They are Hathmati andWatrak confluences.
Demand Site Return Links
All the demand sites have demand site returnlinks identified in order to incorporate the returnflows after use to the supply sources such as riverand aquifer.
Wastewater Treatment Plant
The Effluent Treatment Plant for domesticwaste from Ahmedabad urban water use is treatedas a Wastewater Treatment Plant in WEAP and isconnected to the Ahmedabad Urban Demand Siteby a demand site return link and the effluent fromthe WWTP is taken to the middle zone alluvialaquifer using a treatment plant return link.
Current Water Demand in theBasin
The current water demand in the basin isdivided into agricultural demand, rural domesticdemand, urban demand and industrial demand.The agricultural demand is further divided intosix sub-sectors. The agricultural demand in eachzone is divided into area under various differentirrigated crops in each zone, which is again sub-divided into percentage area under differentirrigation devices such as small border irrigation,furrow irrigation, drip irrigation and sprinklerirrigation. Finally, the actual water use rate perunit area figures (which includes the farm levelefficiencies) estimated through field studies wereused as the water use rate for each irrigation devicefor every crop.
Similar subdivisions are made in the ruraldomestic demand sector within each zone. Theseare divided into end uses such as human uses andlivestock uses in terms of number of users for eachend use. The end use “human uses” is furthersubdivided into devices such as drinking andcooking, and other uses. The “livestock use” isfurther subdivided into devices such as cattledrinking and cattle bathing. Each end use isallocated a specific water use rate.
The urban demand in Ahmedabad is dividedinto subsectors, namely: west AMC area, east AMCarea, western periphery, eastern periphery and FortWall area on the basis of the differential waterdemand and use rates existing in these areas interms of population of each zone (adopted from astudy done by Centre for Environmental Planningand Technology, Ahmedabad). These subsectors
Understandingassumptions is
key to effectiveanalysis.
A D D R E S S I N G W A T E R S C A R C I T Y
227
are further subdivided into end uses namely:drinking and cooking, bathing, washing andcleaning, toilet and gardening (which is applicableonly to western and west AMC areas). The enduses are again subdivided on the basis of wateruse devices (traditional and low flow shower headsfor bathing, traditional and flushing for toiletsand traditional and washing machines for washingrespectively) expressed as percentages, with eachone of them attributed with water use rates specificto the device. Gandhinagar urban demand iscategorized in a similar manner, except that thesector is divided into subsectors reflectingconstruction styles (bungalows and flats) insteadof zones.
Where industry is concerned, only one demandsite is identified in Ahmedabad. This is dividedinto 3 subsectors on the basis of the industrialzones in and around the city, that is, Odhavindustrial zone, Naroda industrial zone and Vatwaindustrial zone. The current industrial water use(volumetric) in each zone is taken as the wateruse rate in each zone.
Current Water Supplies
The parameters used to determine the currentsupplies from the local sources (groundwater)were: the monthly pumping capacities of theaquifers (with one modification anticipatedin the future year, which applies to thesubsequent years);20 the maximum accessiblestorage; the initial accessible storage and theannual natural recharge.
The Sabarmati supplies include: the headflowsinto the Dharoi reservoir, which was given as
monthly inflows into the reservoir in the base year;the storage characteristics of the reservoir; the netmonthly evaporation rates; the initial storagevolume; dead storage; the total storage volume;definition of reservoir operation rules (top ofconservation level, top of buffer pool and the bufferzone coefficient) and the future modifications inthe reservoir storage characteristics.21
Network Losses
The network parameters are used to determinethe actual supply requirement for each demandsite and reflect monthly variation of the demandacross the years, the losses at the demand site andthe conveyance losses in water distribution. Thenetwork data used in the model are: monthlydemand variation coefficients (to apportion theyearly demand into monthly demand values) andthe percentage losses at the demand site and thereuse rates; the transmission losses from supplysources to demand sites, and the capacity of thesource to transmit; percentage losses intransmission from withdrawal nodes (Dharoireservoir node and the mid recharge node) toaquifer, which are treated as conjunctive use links;capacities of wastewater treatment plants (capacityand the annual load factor and the decay andremoval rates in percentages).
Base Case of Water Supplyand Demand
The base case of water demand is generatedusing the following: projected future growth rates22
in cropped area; percentage cropped area underdifferent water use devices in different timehorizons; urban population growth rates, and the
Demand variesaccording to
region, use andtechnology.

228
A D D R E S S I N G W A T E R S C A R C I T Y
Demand Site 1996 2020 2035 2050
Ahd Urb Demand 208.9 389.1 576.4 858.0
Gand Urban Dmd 13.1 23.6 34.18 49.50
Ahd Indu Demand 11.0 26.1 32.50 41.9
Rural RAD 176.1 202.2 219.99 238.4
Dhol Agr. Deman 189.4 476.6 502.9 534.9
Upzone Agr Demd 621.6 706.9 764.7 822.9
Middle Zone RAD 1,592.0 1,850.0 2,038.2 2,246.1
Rural Domestic 2.39 3.85 5.2 7.0
Upzone Domestic 12.7 20.4 27.4 6.9
Midzone Domestic 18.5 29.8 40.1 3.9
Dholka Domestic 32.8 52.7 70.9 95.4
Dharoi Rt Bank 87.2 86.5 85.3 83.5
Left Bank Canal 22.5 22.3 22.0 21.7
Total 2,988.1 3,889.8 4,419.7 5,090.0
growth in water use devices in different sub-sectors;industrial growth rates; and the rural populationgrowth rates (for rural domestic demands). In thecase of agriculture, separate growth rates are usedfor food and cash crops, while for area underdifferent irrigation devices (which refers to systemsof irrigation, that is, long borders, flooding, smallborders, drip, micro-sprinklers, etc.) of differentcrops, an interpolation method was used. In thecase of urban population, the growth rates areestimated on the basis of the historical data of thedemographic trends. In all the cases, historicaldata are the basis for future projections.
Base case projections of demand at the pointof end use, supply requirements (demand plustransmission and other losses), and supplyavailability are presented below:
The figures of supply requirements incorporatethe losses during transmission from the supplysources to the demand sites, and at the demand
sites; and hence, are much higher than thedemand figures.
A comparison of Tables 12, 13 and 14 indicatesthat the gap between the supply requirements andactual supplies widens over a period of time. Thegap becomes 1,017 MCM in the year 2020 and1,875 MCM in the year 2050.
Evaluation of WaterManagement Options
Scenario 1: Local Recharge Options
In this scenario, we have analysed the impactof local interventions to increase availablesupplies by using recharge structures in theupper catchment area and the middle alluvialaquifer. Preliminary results indicate that it wouldbe possible to create, through this type ofintervention, an overall increase in supplies fromboth groundwater and surface water sources, of
Preliminaryresults indicate
that rechargebased on localsources could
reduce the gapbetween supplyand demand by
less than oneper cent.
TABLE 12:Current and Estimated Future Demand in the Sabarmati Basin (MCM)

A D D R E S S I N G W A T E R S C A R C I T Y
229
Source Name 1996 2020 2035 2050
Local Sources
Upper Alluvial Aquifer 209.9 88.7 88.5 89.8
Upper Hard Rock Aquifer 697.9 751.5 785.1 618.9
Mid Alluvial Aquifer 2,250.4 1,355.2 1,423.0 1,561.7
Low Alluvial Aquifer 220.1 294.1 307.2 313.1
Sabarmati
Dharoi Reservoir 149.7 57.6 12.6 30.9
Mid Recharge Node 0.00 0.00 0.00 0.00
Dhudh Water Work 18.7 11.0 1.7 171.2
Vasna Barrage 60.6 248.8 160.1 290.6
Total 3,607.3 2,806.9 2,818.1 3,076.2
Demand Site 1996 2020 2035 2050
Ahd Urb Demand 240.3 342.4 507.3 755.0
Gand Urban Dmd 15.00 15.6 22.56 32.7
Ahd Indu Demand 13.8 14.7 18.28 23.6
RB RAD 176.1 202.2 219.99 238.4
Dhol Agr Demand 189.4 476.6 502.85 534.8
Upzone Agr Demd 621.6 706.9 764.70 822.9
Middle Zone RAD 1,592.0 1,850.0 2,038.21 2,246.2
Rural Domestic 2.4 3.9 5.18 7.00
Upzone Domestic 12.7 20.4 27.42 36.9
Midzone Domestic 18.5 29.8 40.06 53.9
Dholka Domestic 32.8 52.7 70.89 95.4
Dharoi Rt Bank 87.2 86.5 85.34 83.5
Left Bank Canal 22.5 22.3 21.97 21.7
Total 3,024.2 3,823.7 4,324.7 4,951.9
about 8.09 MCM and 10.14 MCM by 2020 and2050 respectively. This is insignificantly incomparison to the gap of 1017 MCM projectedfor 2020 and 1875 MCM projected to occur in2050. In sum, preliminary results indicate thatlocal recharge could reduce the gap between theamount of water available and that required byless than 1 per cent.
Scenario 2: Efficient Water UseTechnologies and ReducedConveyance Losses
In this scenario, the potential impact ofchanges in water use technologies in differentsectors is analysed. The scenario investigates theimpact of use efficiency improvements (such asadoption of improved irrigation technologies inagriculture and packages of technologiessuch as low flow showerheads in householdsand in industries) on overall demand. It isassumed that 50% of the area under every crop(except paddy) will come under one of theefficient irrigation systems (drip/micro tubes,sprinkler, mini sprinkler, small border dependingon its suitability for each crop) by the year 2050.In addition, appropriate percentages areassumed for adoption of efficient water usetechnologies in different sub-sectors (drinking andcooking, bathing, washing and toilet, andgardening) of urban domestic sector. Thisvariation is different for different areas ofAhmedabad city. It also incorporates potentialsavings through reduced losses in conveyancesystems (reduced network losses) in urbanwater supplies, irrigation canal systems, and fielddelivery system in groundwater irrigated areas.In this, it is assumed that by the year 2006,conveyance losses in distribution network catering
to urban domestic and industrial uses will bereduced by 33 per cent and 50 per cent respectively.Also, the water reuse rate in urban and industrialuses will reach 50 per cent by the year 2006.Preliminary results from this scenario are givenin Table 15.
TABLE 13 :Current and Estimated Future Demand in the Sabarmati Basin(MCM)
TABLE 14 :Current and Estimated Future Supply the Sabarmati Basin (MCM)

230
A D D R E S S I N G W A T E R S C A R C I T Y
Efficient wateruse combined
with supplyaugmentationcould eliminate
overdraft andincreasegroundwater
storage.
The combined effect of this scenario isreduction in the demand, leading to reducedreturn flows from various demand sites to theircorresponding aquifer (local sources of supplies)indicated by the negative increase in supplies.
Scenario 3: Conjunctive ManagementOption
In this scenario, the overall impact ofrecharging the mid-alluvial aquifer using waterimported from the Sardar Sarovar Narmadamain canal on the overall supply availability –with no change in water use and conveyanceefficiency – is evaluated. It was assumed thatsurplus run-off water could be diverted from theSardar Sarovar reservoir to the NarmadaMain Canal during the monsoon and used forrecharge. The recharge rate is assumed to be 50m3 per second, and 2006 is the starting year.This water is applied through a large number oflocal storage ponds. The results show that theincrease in the overall supplies in the years 2020
and 2050 will be 157.14 MCM and 156.25 MCMrespectively (Table 16). The increase in storage inthe mid level aquifer is 376 MCM by the year 2020and 423 MCM by 2050. The significant increasein the supplies in the mid alluvial aquifer is notreflected in the overall increase in supplies in thebasin due to the fact that :
� in this scenario, demand and supplyrequirements remain unaltered ascompared to the base case; and
� the local recharge envisaged due to theavailability of surplus Sardar Sarovar wateris applied to recharging the mid alluvialaquifer.
This leads, on one hand, to drawing morewater from various supply sources, including themid alluvial aquifer (since there is no change inwater use efficiency and conveyance efficiency ascompared to the base case). On the other hand,supplies are increasing in the mid alluvial aquifer.The combined affect of these two effects is seen asthe greater increase in supplies in the mid alluvialaquifer as compared to the increase in the overallsupplies.
Scenario 4: Efficient Water Use andSupply Augmentation
In this scenario, efficient water use technologiesare introduced in all the sectors of water use, andsupply is augmented (as in Scenario 1). Here, theconveyance losses are the same as in the base case.So, it differs from the combined scenario of 1 and2. The overall impact on demand, supplyrequirement and overall supplies from thiscombined approach is evaluated and the resultsare presented in Table 17.
2020 370.05 486.62 -227.55 259.93
2050 701.77 944.60 -31.31 913.29
Year DemandReduction(MCM)
Reduction inSupplyRequirement (MCM)
Increase inSupplies(MCM)
Reduction in Gapbetween Suppliesand Demand (MCM)
2020 0 0 157.14 157.14
2050 0 0 156.25 156.25
Year Demand Reduction(MCM)
Reduction inSupply Requirement(MCM)
Increase inSupplies(MCM)
Reduction in Gapbetween Suppliesand Demand (MCM)
TABLE 15 :Change in Gap between Demand and Supply due to Efficient WaterUse and Conveyance Techniques in 2020 and 2050 AD
TABLE 16 :Change in Gap between Demand and Supply due to ConjunctiveManagement in 2020 and 2050 AD

A D D R E S S I N G W A T E R S C A R C I T Y
231
2020 370.05 359.75 -112.28 247.47
2050 701.77 678.35 -47.62 630.73
Year DemandReduction
Reduction inSupply Requirement(MCM)
Increase inSupplies(MCM)
Reduction in Gapbetween Suppliesand Demand (MCM)
Addressingwater scarcity
will requirechanges at the
level of
individualusers,
hydrologic
systems andregions.
This table indicates that the overall supply fromvarious sources declines irrespective of the localrecharge activities initiated in the upper aquiferarea using the excess run-off in the catchment.This is due to the fact that the supply requirementshave declined substantially due to the demand sideinterventions. As a result, less water is suppliedfrom various sources to demand sites. The localrecharge activities and demand side interventions,however, have a major impact on groundwaterstorage – which increases by 726.67 MCM and25.75 MCM in the year 2020 and 2050 respectivelyin this scenario.
Comparison of Options
A comparison of the above scenarios ispresented in Table 18. As mentioned in theintroduction to this section, the above scenariosare preliminary and far from comprehensive. Ofthe scenarios evaluated, the largest overall impacton water scarcity could be achieved throughdemand management coupled with efficient waterconveyance systems. The second best option is local
Type of Reduction in Demand in Supply in Increase inManagement Gap between 2020/2050 2020/2050 GroundwaterInterventions Supplies and (MCM) (MCM) Storage
Demand in 2020/20502020/2050 (MCM) (MCM)
Local Recharge 8.09/ 10.14 3,889.84/5,090.05 2,814.97/3,086.37 215.51/ 11.53Activities
Efficient Use and 259.93/913.29 3,519.79/4,388.28 2,579.33/3,044.92 799.13/726.32ReducedTransmission Losses
Conjunctive 157.14/156.25 3,889.84/5,090.05 2,964.02/3,232.48 -34.51/-10.97Management UtilizingWater from Narmada
Local Recharge and 240.47/630.73 3,519.79/4,388.28 2,694.60/3,028.61 726.67/25.75Efficient Use Practices
recharge combined with efficient water usepractices. We did not run a scenario thatcombined all three of these local options (that is,demand management, efficient conveyance systemsand local recharge). This combination wouldprobably have the largest net impact withoutresorting to water imports.
It is noteworthy that the supply sideinterventions using water from within the basin(as in local recharge Scenario 1) do not makeany significant impact on reducing the gapbetween demand and supplies. This is importantbecause, aside from water import through theSardar Sarovar Project, most governmental and
TABLE 17 :Change in Gap between Demand and Supply due to EfficientWater Use and Local Recharge Activities in 2020 and 2050 AD
TABLE 18 :Comparison of Water Management Options

232
A D D R E S S I N G W A T E R S C A R C I T Y
Newinstitutional
arrangementsfor watermanagement
are needed.
Identifying Institutional Arrangements for WaterManagement
This section explores potential institutionalarrangements for water management in the
Sabarmati basin. Since regional approaches tomanagement have never been attempted in India,models do not exist. As a result, the approach wepropose weaves together the strengths of existinglocal institutions with lessons from other countries.
Underlying Premise
Our approach to devising apprpriateinstitutional arrangements for basin level water
management implementation reflects two coreneeds that essential to achieve the objectives.These objectivse are:
1) the need to maintain the sustainability ofwater use and perform inter-sectoral waterallocation tasks; and,
2) the need to meet the water managementgoals of different localities based onlocation specific issues and local managementneeds.
local initiatives to address water scarcity focus onsmall scale recharge projects. From a technicalperspective, these recharge initiatives are probablyirrelevant except, perhaps, at a very local scale.
A second major point to note from the analysisis that demand side management and reductionsin transmission losses (Scenario 2) probably havemore efficacy in addressing water scarcity problemsby themselves than water imports. Water importsthrough the Sardar Sarovar projects have, however,been the primary focus of governmental efforts toaddress water scarcity. The most sustainablesolution, perhaps, could be found by combiningdemand side management, reductions intransmission losses and conjunctive managementutilizing imported water. This should beinvestigated through detailed scenarios.
Overall, the above scenarios suggest that themost effective avenues for addressing water scarcitywill require changes in water use at:
� the level of individual users (that is,adoption of efficient water use technologiesand practices);
� the level of systems (that is, improvedconveyance systems); and,
� the level of regions (that is, aquifers forconjunctive management).
This will require institutional arrangementscapable of addressing management needsat these three levels. The institutionalcontext must encourage individuals toadopt improved water use technologies anduse water efficiently. It must also encouragesystem improvements by organizations suchas farmer user groups (including well companies),the irrigation department and municipalcorporations. Finally, some overarchingorganization must be present that couldimplement regional scale activities such asconjunctive management. The next sectionfocuses on these issues.

A D D R E S S I N G W A T E R S C A R C I T Y
233
The first need for regional approachesnecessitates institutions that have financial andtechnical resources necessary to perform theanalytical and scientific tasks required fordeveloping basin level water managementperspectives. These institutions also need to becapable of representing the array of politicallypowerful user groups that are regionally important(that is, farmers in the rural areas, the rurallocal governments, urban population, municipalcorporations, industries in the urban and ruralareas, the Irrigation Department and theGujarat State Water Supply and SewerageBoard). The second set of needs requires localinstitutions that are oriented towards the issuesin their respective localities and have athorough understanding of the range of factorsaffecting the success of management withinthose local areas.
In the above context, proposed institutionalarrangements for basin water management willneed to involve a mix of government/quasi-governmental technical and scientific institutions,research/training institutions and non-governmental organizations and rural cooperativeinstitutions (both apex and village) with verticaland horizontal linkages between different types ofinstitutions operating with varying scales ofoperation. The capabilities of existing institutionsand the scale at which they are operating largelydefine their potential role in water managementand their position in the proposed institutionalapproach.
Institutions and Linkages
The institutional arrangement proposed hereis a mix of governmental, urban and rural water
management institutions each operating atdifferent scales. Three to four levels of institutionalhierarchy are considered essential:
1) Basin level – To develop a broad perspectiveon water management needs throughout the basinand to ensure interaction between different partsof the basin, which are reflected in more localizedmanagement approaches.
2) Regional and Watershed – Sub-regions withinthe basin have different contexts andmanagement needs. Many water managementproblems are essentially regional in natureand cannot be addressed either by localizedaction or through management at the basinlevel alone.
3) Local/Village – These institutions are the“natural” primary social unit in the basin formany water management activities, particularlythose involving changes in water use byindividuals, need local level support.
4) Urban – Urban water management needs aredifferent from those in rural areas. This makesseparate urban water management institutions(possibly sub-units of existing municipalcorporations) necessary. These would be the urbanequivalents of the local village institutionsproposed for rural areas.
At the highest level, we propose an overarchingbasin level Sabarmati Basin Water ManagementSociety (SBWMS). The SBWMS is envisionedprimarily as a technical planning forum thatbrings together and coordinates the activities ofgovernment departments and research institutions.This institution is intended to identify broad water
Vertical andhorizontal
linkagesbetween
different types
of organizationsthat operate atvarying scales
are important.

234
A D D R E S S I N G W A T E R S C A R C I T Y
management options for the basin from a systemicperspective and determine the scale at which eachone would need to be implemented in order toensure a balance between demand and supplywithin the basin. The institution would alsoidentify water allocation issues and either allocatewater to meet key needs or propose alternativemechanisms for reallocating supplies. As waterallocation is always a politically sensitive issue, thisinstitution might not be responsible for actualreallocation but could identify options – and thetradeoffs inherent in each – for debate bystakeholders and political decision makers.
SBWMS is proposed primarily as a technicalorganization; hence, it would not be capable ofrepresenting views of users. As a result, aStakeholders’ Forum (SF) is proposed for thebasin. All user groups in the basin would bemembers of this forum. The SF is intended as theprimary institution in which users will have amajor say on water management issues at thebasin level. The issues, needs and prioritiesidentified in the SF are intended to guide SBWMSin its efforts to identify management options thatare socially, technically and economically viableas well as politically acceptable.
In addition to the basin level SBWMS and SF,Regional Water Management Institutions (RWMIs)operating at the district or the taluka level areproposed. These would operate under the SBWMSand SF and provide them with the necessarytechnical information for regional planning. Theprimary mandate of the Regional WaterManagement Institution would be to assist in theidentification of locally viable water managementinterventions, organize existing village levelinstitutions and facilitate formation of new village/
watershed institutions. They would also be theprimary institution responsible for implementingwater management activities at the regional leveland coordinating water management activities.
Finally, local water management organizationsare proposed within each village (or villagecluster) that would be responsible for localplanning, implementation and support toindividual water users.
The following paragraphs discuss the structureand constitution of the institutions proposed forbasin water management, their role inimplementing various management interventionsand their vertical and horizontal linkages.
Sabarmati River Basin WaterManagement Society
As noted above, the mandate of the proposedSabarmati Basin Water Management Society wouldbe to ensure a balance between supply anddemand within the basin and to allocate availablebasin water amongst different sectors of use. Thiscould be done based on an integrated analysis ofbasin water management needs and their physical,social and economic viability of differentapproaches to meeting those needs. In addition,to identify potential water managementinterventions for the basin, the SBWMS would alsosuggest the scale at which each intervention shouldbe implemented in different regions. This wouldprovide guidance to regional and grass root levelinstitutions in their attempts to develop locationspecific plans.
Evolving management strategies for a largebasin calls for expertise in water harvesting/
Water allocationis always a
politicallysensitive issue.

A D D R E S S I N G W A T E R S C A R C I T Y
235
groundwater recharge and water conservationtechnologies in different sectors of water use, suchas agriculture, urban domestic use and industry.This has to be supported by reliable informationon the physical characteristics of the resource, suchas the hydrology, geology and geo-hydrology, thecurrent level of groundwater exploitation, pollutionlevels and the social and economic factors affectingthe resource use in the region.
To meet these requirements, the SabarmatiBasin Water Management Society should functionas an independent technical agency. The mandateof existing governmental organizations focusesprimarily on the development of water resourcesand relatively narrow sectoral functions (such asirrigation or drinking water supply). This mandatehas become obsolete in the present context ofresource over-development. Furthermore in manycase, many existing government organizations arefacing major problems of institutionalsustainability due to financial limitations.
In the above context, it is proposed to constitutethe SBWMS by the pooling of techno-managerialstaff from government departments, such as theIrrigation Department, Department of Narmadaand Water Resources (DONWR), Gujarat Jal SevaTraining Institute (GJTI), GWRDC, WALMI and thewestern regional office of the Central Ground WaterBoard (CGWB) based in Ahmedabad. The SBWMSwould also require the services of social scientists,agronomists and economists, who can be hiredfrom research institutions such as the Institute ofRural Management Anand and VIKSAT. Poolingtechnical staff from these governmentalorganizations into the SBWMS would ensuredevelopment of an integrated perspective on basinwater management needs. It would also help
reduce duplication between agencies, therebyreducing recurring costs.
The SBWMS would ultimately need legal/statutory powers to enact regulations required foreffective implementation of the water managementsolutions proposed for the basin. As a result, oneof its first tasks in conjunction with the SF wouldbe to review existing legal and legislative structuresand to propose alternatives.
Stakeholders’ Forum
It is important to have a forum which canadequately represent the interests of variousstakeholders within the basin and also influencethe management decisions being taken by thebasin level water management committee. Watermanagement needs and priorities often differbetween stakeholders, which frequently conflict. Asa result, achieving larger water management goalsfor the basin would require compromises bystakeholders. Furthermore, consensus is essentialin order to identify management options thatwould be politically possible to implement. For thisreason, participation of the stakeholderscommunities in water management decision-making would be critical to meeting the needs andpriorities of the different stakeholders in the basin.Therefore, institutional avenues would be requiredto evolve stakeholders’ participation in planningand implementing basin plans.
As envisioned here, the Stakeholders’ Forumwill have representation from a wide variety ofprimary stakeholders including:
� farmers using surface water in the basin;� farmers living in Dharoi command;
The scale atwhich
interventionsneed to occur is
an important
aspect ininstitutional
analysis.

236
A D D R E S S I N G W A T E R S C A R C I T Y
� farmers pumping groundwater from thebasin for irrigation;
� farmers in Fatehwadi irrigation command;� industries in and around Ahmedabad
city;23 and,� the AMC and other municipalities, and the
town panchayats.
In addition to primary stakeholders,representation from secondary stakeholder researchinstitutions such as the Physical ResearchLaboratories24 (PRL) and Non-governmentalorganizations working on water and naturalresource related issues in different districts in thebasin (especially those working in Banaskantha,Ahmedabad, Mehsana, Sabarkantha and Kheda)25
will also be important.
Regional and Watershed Institutions
As noted above, there are a number of regional(district-level) cooperative institutions, such as theMehsana Dudh Sagar Dairy, in 4 of the districts26
falling within the basin. These institutions havesubstantial human and material resources, strongorganizational and financial managementcapabilities and social mobilization skills. Theyhave the potential to serve as strong instrumentsfor implementing large-scale water managementprojects and assist in developing managementstrategies covering an entire region. In addition,they can support more localized watermanagement initiatives and serve as a linkbetween villages and the SBWMS by:
1) identifying villages that have scope forintroducing management interventions likeharvesting, recharge, and water conservationtechnologies in irrigation);
2) organizing village communities to form villagelevel institutions (where they are non-existent) andwatershed committees for implementing them;and,
3) managing implementation funds.
As some of the physical activities necessary toaugment groundwater supplies are to be carriedout at the watershed level, the activities taken upin different villages within the same watershedneed to be coordinated so that they becomeeffective. Since regional institutions rarely follownatural units such as watersheds, a “watershedcommittee” may need to be formed at thewatershed level. Such an organization would haverepresentation of village level institutions from allthe villages falling in the watershed.
The case of the Joint Forest Management (JFM)programme has amply demonstrated the role offederations in the “scaling up” of JFM. Thesefederations not only serve as a forum for discussingand solving larger issues facing theimplementation of forest management plans andbring more and more villages in the jointmanagement efforts, but also help resolve inter andintra-village conflicts emerging during the process.
The specific roles of such institutions envisagedare:
� Setting up of village level institutions: It wouldbe the responsibility of the watershed associationto ensure that village level institutions exist in allthe villages falling in the watershed.
� Coordination of various village level physical
activities::::: Since all the physical interventions have
Achieving largerwater
managementgoals willrequire
compromisesamongstakeholders.

A D D R E S S I N G W A T E R S C A R C I T Y
237
to be carried out on a watershed basis, they haveto be implemented in all the villages concerned(wherever the physical situation permits). Effectivecoordination is required to ensure that theactivities are taken up simultaneously.
� Resolving conflicts between villages::::: Conflictsare common in natural resources use andmanagement. It is possible that one villagewould not cooperate with the village institutionof the neighbouring village in implementingthe management plans due to conflictinginterests. In such situations, the watershedcommittee can intervene in the matter and helpthem resolve the conflict and smooth out theimplementation process.
It is important to note that in the case of asmall micro watershed falling completely withinthe administrative boundaries, of a particularvillage, there would not be any need to create orform a separate watershed committee, as thevillage level institution itself would be able totackle all the issues related to implementation ofthe groundwater management plan withinthe watershed.
Village Level Institutions
In the structure proposed here, village levelinstitutions would be responsible for identifyingand carrying out the physical activities concernedwith water management activities in local areas.The role of a village level institution would be asfollows:
� evolving local water management solutionsappropriate for the locality, which wouldinclude identification of possible physical
interventions, like building of rechargesystems and plantation/afforestationactivities, suggesting locations for the same,and identifying potential users of end useconservation schemes;
� framing rules and regulations necessary tohelp affect management decisions, whichfall within the broad water managementframework, and enforcing them; and,
� implementation of physical activities to becarried out at the village level, and resourceallocation according to the use priorities.
As previously discussed, many of the villagesin the Sabarmati basin already have localinstitutions engaged in economic activities, suchas dairying, marketing of agricultural produce,and forestry and water management activities.These institutions have the organizationalcapabilities required to plan and carry out localwater management activities, provided they receivetechnical and financial support from externalinstitutions.
Urban Water Management Institutions
The urban administration has the responsibilityof providing water supplies for domestic,commercial and industrial purposes in municipalareas. The AMC is one such administration withinthe Sabarmati basin. It has considerable financial,technical and intellectual resources to plan andimplement water development and managementprojects within the municipal area. In addition tothese existing capacities, the AMC possessesstatutory powers to enforce regulations (such asthose related to drilling of tubewells by privatehousing societies and industries, and protection ofdrinking water sources from pollution). The AMC
The role ofvillage level
institutionscould include:� the evolution
of localmanagementsystems,
� framing rulesandregulations,
and� implementing
management
activities.

238
A D D R E S S I N G W A T E R S C A R C I T Y
The AhmedabadMunicipal
Corporationshould play amore proactive
role in urbanwatermanagement.
could also enforce measures, such as installationof roof water harvesting structures in existing andnew housing stock. Violation of AMC regulationsmay entail cancellation of building licences,imposition of penalties or severing of water supplyconnections. Funds collected through penalties andwater charges could be used to invest in suchprogrammes a wastewater recycling and waterharvesting by the municipal authorities. The AMChas already formulated a major project to recyclethe urban domestic waste using sand aquifertreatment27 downstream of the Vasna barrage inthe Sabarmati riverbed.
In addition to regulation, the AMC shouldmetre water supplies to all the housing stock inthe municipal area. It is recognized, however, thatthe infrastructure and administrative resourcesrequired for this could be large. Metering wouldenable the AMC to levy water charges or taxes ona volumetric basis. This could be used as a
powerful instrument to create the incentive forurban water users to shift to efficient waterconservation technologies, thus leading to achange in water use practices.
Overall, the AMC has a relatively broad arrayof enforcement and financing mechanismsavailable to it. These provide a strong basis fordeveloping and enforcing urban watermanagement regulations. Its strong financialposition should enable the corporation to developinnovative mechanisms for developing new watersupplies for the urban area. It could, for example,offer subsidies to farmers in the basin (who useboth the surface water and groundwater) and toprivate housing societies and industries in themunicipal area to invest in water conservationtechnologies. The “saved” water could then beused to meet the needs of populations living withinthe area. The corporation could, in effect, buy thewater saved through such conservation practices.
Alternative Water Rights Structures
Beyond the set of organizations proposed abovefor implementing water management in the
Sabarmati basin, water rights issues mayultimately need to be addressed. Many of the watermanagement actions needed for implementationwill conflict with existing legal and customaryrights and use patterns. Water allocation, forexample, conflicts with the established rights ofland owners to drill wells and use groundwater asthey wish. The absence of a well defined propertyrights structure in groundwater provides littleincentive for the users to use the water efficiently.The current institutional vacuum created due tothe absence of clear water rights has also resultedin inequitable access to the resource. Under the
current regulations, water rights are limited to onlythose who own land in which the right to drillwells is part of land ownership. Issues such asaccess equity and efficiency have to be built intothe management goals of any common poolresource. For these reasons, water rights reformissues will probably need to be addressed beforethe management institutions proposed above canbecome fully effective. Rights reform will need toreflect both the practical needs of managing theresource base and equity issues.
In any water management strategy, benefitsand costs are unlikely to be equitably distributedbetween portions of the community. It is, for

A D D R E S S I N G W A T E R S C A R C I T Y
239
example, very likely that only a section of thecommunity will receive benefits in terms ofimproved water levels in the wells, increase in soilmoisture and land fertility. In the local initiativesfor managing groundwater resources, the influenceof recharge efforts is likely to be limited to smallareas surrounding the recharge system and onlythose farmers whose wells fall in the influence areaof the recharge system will receive direct tangiblebenefits. In arid and semi-arid regions (which isthe prevailing condition in most parts of theSabarmati basin), the irrigated area is much lessthan the cropped area. Any increase in supplyavailability can be used to bringing more areaunder irrigated agriculture. There are also manyother users within the basin such as industries andmunicipalities who would grab any new watersupply created. This can undermine the efforts ofthe local management institutions. In short, unlesscommunities can establish rights over the resourcethey protect, and unless the demand of water isproperly controlled by the adoption of efficient usepractices, sustainable solutions to emergingproblems are not likely to evolve, and maintainingthe balance between demand and supply is likelyto become a difficult task. Finally, establishmentof tradable rights and water markets has beensuggested by many researchers as a sustainablemechanism for addressing water allocation andassociated access equity and efficiency issues.
Given the above issues, establishment oftradable water rights for groundwater could be oneof the viable solutions. Such rights could be vestedeither with the State or with the aquifermanagement committees. These committees couldsell the rights to legally registered village levelcooperative institutions. The members of thecooperatives could then buy the rights to use
groundwater. The members would include bothlandholders and the landless. Landholders who donot own wells and the landless could also becomemembers. To ensure equity, every member of thecooperative would have a fixed entitlement on thebasis of the family size. This would be availablefree of cost or at a nominal rate. Entitlements,once allocated, would be tradeable amongcooperative members. This would create incentivesfor the farmer members to adopt efficient wateruse technologies such as drips and sprinklers intheir fields. Water sales by the landless and smalllandowners to other users would also become anavenue for an additional source of income. If thefarmer member uses more than his/her“entitlement” without purchasing supplementsfrom members who wish to sell all or a portion oftheir entitlement, the farmer could be charged ahigher rate than that charged for fixedentitlements by the village cooperative. Overall,the goal would be to develop localized watermarkets that benefit all members of the localcommunity.
In the case of large groundwater basins, manystakeholders for the shared resource (such asindustries, the farming community, urban waterusers and municipalities) will exist. In suchsituations, the extent to which the markets operatecan be as large as the size of the basin, dependingon the geographical spread of the potential waterusers. Establishment of water markets and rightswill create incentives for the users to invest inefficient water use practices to bring down the uselevels or save from the fixed entitlements. As aresult, apart from increasing the use efficiency,such markets (if operated within a rightsframework) could also act as an effective tool foraddressing inter-sectoral water allocation issues.
The currentinstitutional
vacuum createddue to the
absence of clear
water rights hasresulted in
inequitable
access to waterresources.

240
A D D R E S S I N G W A T E R S C A R C I T Y
Preliminary results presented in this paper offertwo conclusions:
1) Addressing water management needs in theSabarmati River basin requires approaches thatfocus on demand side management. Althoughthese results need to be confirmed, preliminarymodelling efforts using WEAP indicate that localrecharge and imported water supplies will beinadequate to significantly reduce the waterscarcity problem in the next century. Localrecharge, in particular, can only contribute in avery minor way to addressing the scarcity problem.Improvements in the system and end-use efficiencyare essential. Demand side managementapproaches combined with conjunctivemanagement of locally available and importedsurface and groundwater supplies could be usedas a basis for arriving at sustainable solutions.
2) The variety of local institutions already exists thatcould contribute to water management in the region.At present, however, these institutions are not linkedor woven into a framework capable of supportingthe evolution or implementation of integrated watermanagement approaches. An institutionalframework for this purpose consisting of state,
regional and village level organizations has beenproposed. This framework needs, however, to bedeveloped in further detail and, if possible, testedthrough pilot implementation projects.
The next phase of research needs to addressdemand side management, local supply andconjunctive management options in much greaterdetail from the perspective of technical andeconomic feasibility combined with socialacceptability. Detailed modelling is required toconfirm current conclusions and to identify thosesets of actions that could really contribute eitherindividually or in coordination with othermanagement options to addressing regional waterscarcity problems. Once physical managementoptions are clarified in greater detail, institutionalquestions will need to be revisited to determinethe kind of structures that might enable theirimplementation.
In addition to analytical activities, research isrequired on social responses to the findingspresented above. Demand side managementconcepts need, for example, to be explored withlocal communities and existing institutions inorder to identify potentially viable strategies.
Establishment ofwater markets
and rights willcreateincentives for
users to makeefficient use oftheir water
entitlement.
Industries or municipalities might, for example,be willing to provide financial assistance to farmersto invest in efficient irrigation technologies. Thefarmers could, in turn, sell the additional watersaved to the same industries. The rationale behindthis idea is that agriculture continues to accountfor the lion’s share of the total water use in anyregion and that a small percentage saving in wateruse will result in a large increase in effective
availability of water for other uses. Such a systemwill also enable water transfers between basins.Furthermore, developing water markets (in areaswhere they are non-existent) would help the wellowners to sell the water saved from his/her usualentitlement to a potential buyer. Overall, extensiveand well-developed water markets could helpaddress issues of access equity and efficiency inwater use.
Conclusions

A D D R E S S I N G W A T E R S C A R C I T Y
241
Notes
1 Collected from the Water Resources Investigation Circle, Narmada and Water Resources Department, Government of Gujarat.
2 Dharoi Dam was constructed in 1976 and is located 165 km upstream of Ahmedabad city.
3 Transmissivity, or the coefficient of transmissibility, is defined as the rate of flow of water through a vertical strip of a waterbearing formation (aquifer) of unit width and entire depth of the aquifer, under unit hydraulic gradient (that is, h/L,where h is the difference in the pressure head at two points situated L units apart).
4 The Naroda-Vatwa belt, Gandhinagar-Kadi belt and the Vadodara-Ankleswar belt are known as Golden Corridors of India inindustry and trade circles. The Naroda-Vatwa corridor falls fully in the Sabarmati basin.
5 1 Crore is 10 million.
6 Carry over denotes the volume carried over to next year in the average monsoon year.
7 1539 - (1320-275.91) = 494 MCM.
8 RBMC - Right Bank Main Canal.
9 LBMC - Left Bank Main Canal.
10 Source: Projects Division, Dharoi Reservoir, Kheralu, Mehsana district.
11 In addition to the institutions covered in this section, there could be other GOs and NGOs who could play a significant rolein water management. Their roles needs to be explored in detail.
12 Rs 500,000
13 The Vijapur project in Mehsana District is focusing on artificial recharge of groundwater whereas the project at Ukai Canalarea is on community lift irrigation. The professional staff of GWRDC who were earlier engaged in groundwater investigationand well drilling are now involved in designing and implementing recharge systems.
14 By economic institutions, we refer to those institutions which are engaged in economic activities.
15 The state of Gujarat has a long history of cooperative movements that are further institutionalized by the state authorities.Therefore a super structure of cooperative societies with an apex bank at the state level, the district central cooperative bankat the district level and the cooperative societies at the village level is built up with the support from the government forstrengthening the rural economy. The societies at the village level are categorized as primary societies. The same nomenclatureis used for all village level societies.
16 A success story on the dairy scene in India during the sixties was the farmer-owned Amul cooperative in Anand (Khedadistrict, Gujarat) with its integrated approach to production, procurement, processing and marketing of milk along cooperativelines. Operation Flood I was launched to create 18 “Anands” with an investment of 1,160 million, generated from giftedcommodities received from the World Food Programme. Operation Flood I led to a resurgence in the dairy industry duringthe seventies. A much larger dairy development programme was initiated as Operation Flood II in 1979 with a soft loan ofUS$ 150 million provided by the World Bank.
17 Shri Motibhai Chaudhary is a well known Gandhian who has done commendable work to improve the livelihoods of therural poor in Mehsana through the dairy cooperative movement.
18 The Motibhai Chaudhary Foundation also focuses on animal husbandry, another key issue in the region.
19 Migration for jobs in the diamond cutting industry is especially common.

242
A D D R E S S I N G W A T E R S C A R C I T Y
20 The monthly pumping capacities of the local supplies (groundwater) in WEAP modelling were reduced in the year 2006 forthe areas where the category of groundwater exploitation is grey/dark and was increased in the area where it is white. Thismodification is made assuming that some legislative measures will be enforced by the year 2006 to control groundwaterextraction in grey/dark areas. In the same time, farmers will be encouraged to use groundwater more in the areas whichfall in the white category.
21 The capacity of Dharoi reservoir is gradually declining due to sedimentation. It is anticipated that by the year 2026,desilting operations would have taken place to restore the original designed capacity of the reservoir.
22 A constant growth rate is adopted in this report, compounded annually.
23 According to the report of the Industries Commissionerate, Government of Gujarat, out of a total of 7,287 factories in the6 districts which fall partly in the basin, 4,946 (68%) are concentrated in Ahmedabad alone and out of the 72,167 SmallScale Industries (SSI) in the 6 districts, 44,570 (61%) are in Ahmedabad.
24 The PRL has done a substantial amount of scientific research studies on the Sabarmati basin, including water balancestudies, artificial recharge experiments and augmentation of water supplies in Ahmedabad by tapping deep aquifers inAhmedabad.
25 Some of the major NGOs having action programmes in the region are SEWA, VIKSAT, UTTHAN, DSC.
26 Mehsana, Banaskantha, Sabarkantha and Kheda have apex cooperative unions, which have a large number of village dairycooperatives working under them.
27 This system has been developed by scientists from the Physical Research Laboratories in Ahmedabad, a premier researchinstitution doing fundamental research on a variety of basic scientific issues. The process involves allowing the sewagewater to pass through the riverbed sand and join the shallow/ phreatic riverbed aquifer. In the process, the BOD and theCOD of the sewage is reduced to minimal levels.

A D D R E S S I N G W A T E R S C A R C I T Y
243
Bibliography
AUDA (1994). Synopsis of Technical Feasibility Report for Water Supply Scheme for West Ahmedabad Urban ComplexArea, report submitted to Ahmedabad Urban Development Authority (AUDA), Multimedia Consultants Pvt Ltd., November,1994.
Bhatia, B (1991). Lush Fields and Parched Throats. Political Economy of Groundwater in Gujarat, Working Paper,Helsinki, Finland, World Institute for Development Economics Research.
Bhatt, T. (1997). Gujarat is Darling of Entrepreneurs, Times of India, Ahmedabad, June 14.
Bhattacharya, R.D and C.B. Pandya (1988). Drinking Water Quality in Ahmedabad, Paper presented at the conference onPollution Trends in Ahmedabad City and the State of Health, Ahmedabad, pp.14.
CEE (1989). Fluorosis Control and Guineaworm Eradication. A Project Report, Sponsored by National Drinking WaterMission, Government of India, Ahmedabad, Centre for Environment Education.
CGWB (1995). Groundwater Resource and Irrigation Potential in Gujarat, Central Groundwater Board, as reported inShah, T. (1997). The Deepening Divide. Diverse Responses to the Challenge of Groundwater Depletion in Gujarat, IDE-FordFoundation Supported Irrigation Against Rural Poverty Research Programme. Anand, Gujarat, Unpublished.
Chaudhari, S. (1997). To Sell A Resource, Down To Earth, February 15.
CPCB (1989). Basin Sub-Basin. Sabarmati Basin Report, Central Pollution Control Board, New Delhi, Government of India,pp. 64.
CSE (1985). The State of India’s Environment. A Citizen’s Report, Centre for Science and Environment, New Delhi,Ambassador Press.
EPW (1994). Farmer’s Initiative to Solve Water Crisis in Saurashtra, Bombay, India, Economic and Political Weekly.
Gangotra, M.M. (1992). Population Growth and Its Impact on Water Resources in Gujarat, paper presented at theWorkshop on Water Resources and Management in Gujarat, Ahmedabad, Sardar Patel Institute.
Government of Gujarat (1995). Gujarat Economic Development through Maps, Directorate of Economics and Statistics,Gandhinagar, Government of Gujarat.
Government of Gujarat (1995). Annual Survey of Industries, Census Sector - Provisional Results 1990-91, Gandhinagar,Directorate of Economics and Statistics.
Government of Gujarat (1995). Annual Survey of Industries, Census Sector - Provisional Results 1991-92, Gandhinagar,Directorate of Economics and Statistics.
Government of Gujarat (1995). Annual Survey of Industries, Census Sector - Provisional Results 1992-93, Gandhinagar,Directorate of Economics and Statistics.
Government of Gujarat (1997). Industries in Gujarat (Some Statistics), Ghandinagar, Industries Commissionerate.
Government of Gujarat (1996). Integrated Plan of Sabarmati River Basin, (Draft), Gujarat State Water Resources PlanningGroup, Gandhinagar, Central Designs Organisation.
Government of India (1991). District Census Handbook. District Ahmedabad, Gujarat, Director of Census Operations.
Government of India (1991). District Census Handbook. District Banaskantha, Gujarat, Director of Census Operations.

244
A D D R E S S I N G W A T E R S C A R C I T Y
Government of India (1991). District Census Handbook. District Gandhinagar, Gujarat, Director of Census Operations.
Government of India (1991). District Census Handbook. District Kheda, Gujarat, Director of Census Operations.
Government of India (1991). District Census Handbook. District Mehsana, Gujarat, Director of Census Operations.
Government of India (1991). District Census Handbook. District Sabarkantha, Gujarat, Director of Census Operations.
Government of Gujarat, (1992). Report of the High Level Committee on Estimation of Groundwater Resources andIrrigation Potential in Gujarat State, Narmada and Water Resources Department, Gandhinagar, Government of Gujarat,pp.66-85
Gujarat Ecology Commission (1994). Taluka level Ecological Profiles, Study sponsored by GEC, Baroda, Operation ResearchGroup.
Institute of Rural Management (1995). Institutions for Rural Change, Anand, Institute for Rural Management.
Institute of Rural Management (1998). International workshop on Shared Resource Management in South Asia. The NextStep, Collection of papers presented at the workshop on Shared Resource Management in South Asia, Anand, Institute ofRural Management.
Janakarajan, S. (1993). Trading in Groundwater. A Source of Power and Accumulation, Paper presented at theInternational Conference on Water Management. India’s Groundwater Challenge, Ahmedabad, VIKSAT, pp. 18.
Kolavalli, S. and Chicoine, D.L. (1987). Groundwater Markets in Gujarat, Ahmedabad, Indian Institute of Management.
Kumar, M.D. (1995). Drinking Water Scarcity in Rural Gujarat. Physical, Social and Institutional Dimensions, paperpresented at the Workshop on Drinking Water in Gujarat. Problems and Prospects, Ahmedabad, Gujarat Institute ofDevelopment Research.
Kumar,M.D. (1996). Tubewell Turn Over . A Study of Groundwater Irrigation Organisations in Mehsana, Ahmedabad,VIKSAT.
Kumar, M.D.(1996). Beyond Recharge. Experiences and New Approaches to Groundwater Management, Gujarat, India,paper presented at the 6th Annual Conference of the International Association for Study of Common Property, Berkeley,University of California.
Kumar, M.D. (1997). Water Use Study, report submitted to the Technical Assistance Team of the Water ResourceDevelopment and Management project in Rajkot, Ahmedabad, VIKSAT.
Kumar, D., Chopde S. and A. Prakash (1998). Banking on Cooperation. A Study of Irrigation Management Institutions inGujarat, Paper Presented at the International Workshop on Shared Resource Management in South Asia. The Next Step,Anand, Institute of Rural Management.
Moench, M. and Metzger, H. (1992). Groundwater Availability for Drinking in Gujarat. Quality, Quantity and HealthDimensions, Ahmedabad, VIKSAT/Pacific Institute Monograph, VIKSAT.
Narmada and Water Resources Department (1984). Sabarmati Reservoir Project at Dharoi, Gandhinagar, Government ofGujarat.
Narmada and Water Resources Department (1991). Report of High Level Committee on Augmenting Surface WaterRecharge in Overexploited Aquifers of North Gujarat, Volume I, Gandhinagar, Government of Gujarat.
Narmada and Water Resources Department (1991). Report of the Committee on Estimation of Groundwater Resource andIrrigation Potential in Gujarat State, Gandhinagar, Government of Gujarat.

A D D R E S S I N G W A T E R S C A R C I T Y
245
Padre, S. (undated). Interview with Shri Shamjibhai J. Antala, President, Saurastra Lok Manch Trust, Rajkot, Interviewappeared in Adike Pathrike, a magazine by All India Areca Growers’ Association, Mangalore.
Palmer-Jones, R. (1994). Groundwater Markets in South Asia. A Discussion of Theory and Evidence In Marcus Moench(ed.) Selling Water. Conceptual and Policy Debates over Groundwater Markets in India, Ahmedabad, Pacific Institute,Natural Heritage Institute and VIKSAT, pp. 47.
Patel E. et al. (1989). Krishi Parfait . Gujaratni Vaigyanik Kheti, Krishi Lekhak Juth Prakashan, Ahmedabad.
Pathak, B.D. (1985). General Review of Artificial Recharge Works in India paper presented at the Seminar on ArtificialRecharge of Groundwater, Ahmedabad, Sponsored by the CGWB, UNDTCD and UNDP, pp. 17.
Prabhakar R. et al. (1997). Case Studies on Fresh Water Management in the Arid Region, Report submitted to UNICEF,New Delhi, Anand, Institute of Rural Management.
Puri, V. and Vermani, A. (1997). Changing Priorities. Increasing Conflicts Between Rural and Urban Water User, report ofthe Management Training Segment of Institute of Rural Management Anand, Ahmedabad, VIKSAT, July.
Rached, E., Eva R. and D. Brooks (ed.) (1996) . Water Management in Africa and the Middle East. Challenges andOpportunities, Ottawa, International Development Research Centre.
Saleth, M.R. (1994). Groundwater Markets in India. A Legal and Institutional Perspective In M. Moench (ed.) SellingWater. Conceptual and Policy Debates over Groundwater Markets in India, Ahmedabad, Pacific Institute, Natural HeritageInstitute and VIKSAT, pp. 62.
Shah,T.(1985). Transforming Groundwater Markets into Powerful Instruments of Small Farmer Development, ODIIrrigation Management Network Paper no. 11d, London, Overseas Development Institute.
Shah, T. and Raju K.V.(1987). Working of Groundwater Markets in Andhra Pradesh and Gujarat. Results of Two VillageStudies, Economic and Political Weekly, 26(3) pp. A23-A28.
Shah, T.(1993). Groundwater Markets and Irrigation Development . Political Economy and Practical Policy, New DelhiOxford University Press.
Shah, T. (1997). The Deepening Divide. Diverse Responses to the Challenge of Groundwater Depletion in Gujarat, IDE-FordFoundation supported Irrigation Against Rural Poverty Research Programme, Unpublished.
Sharma, P. (1994). Beyond Piecemeal Solutions, article published in The Times of India, Ahmedabad.
Shunmugam V. and V. Ballabh (1998). Sharing Responsibilities in Basin Management - A Paradisiacal Denouement?Paper presented at the International workshop on Shared Resource Management in South Asia. The Next Step, February17-19, Anand, Institute of Rural Management.
Singh, K. (1993). Cooperative Property Rights As Instruments for Managing Groundwater, paper presented at the Workshopon Water Management. India’s Groundwater Challenge, Ahmedabad, VIKSAT.
Srinivas, M. (1987). Occurrence and Movement of Groundwater In Deccan Traps, Groundwater News, March.
Times of India (1996). Death of Fish in Narmada River Causes Concern, Times of India News Service, July 6.
WARDEMA (1997). Geohydrology Study Report, draft report prepared for Water Resource Development and Managementproject by Euroconsult, Netherlands and EcoTech Consultants.
Wijdemans, R. (1993). Sustainability of Ground Water for Water Supply. The Competition between the needs of Agricultureand Drinking Water, paper presented at the Workshop on Water Management. India’s Groundwater Challenge, Ahmedabad,VIKSAT.

A Local Response to Water Scarcity
Dug Well Rechargingin Saurashtra, Gujarat
M. Dinesh Kumar, Shashikant Chopde and Anjal Prakash
C H A P T E R 6

D U G W E L L R E C H A R G I N G I N S A U R A S H T R A
248
Introduction
Acute shortageof water has led
to seasonal andpermanentmigration of
members ofvulnerablecommunities.
Over-exploitation of groundwater resources inSaurashtra is causing faster seasonal
depletion of the resource in inland areas and salineintrusion in fresh water aquifers of coastal areasresulting in scarcity of water for irrigation,drinking and domestic uses and industries. Lowannual rainfalls with high inter-annual variabilityand frequent droughts compound this. Theproblems are more acute in the summer monthswhen the wells go dry.
On the whole, government responses to addressthe scarcity problems, such as creation of newdrinking water sources and artificial recharge ofgroundwater in the coastal areas have had alimited impact. These responses also lack aholistic approach to water management. Further,they fail to capture the complex physical, social,cultural and economic conditions prevailing inthe areas of intervention, which strongly influencethe effectiveness of any water managementintervention. As a result, they fail to make anysignificant impact on the overall wateravailability situation.
Acute shortage of water for agriculture anddrinking has resulted in large-scale migration –both seasonal and perennial – of both agriculturaland other vulnerable communities from ruralareas to urban areas in search of labour. Theproblem, if not addressed, poses a serious threatto the sustainability of agriculture, thecommunities dependent on it and the overalleconomy of the region.
In response to the water scarcity problemslooming over the region, a movement has emergedin Saurashtra to recharge aquifers of the region.Farmers are using a simple technique called dugwell recharging to divert and inject the run-offfrom fields and from natural and artificial drainsinto their farm wells. The movement, which wasstarted by a few farmers in Upletta-Dhoraji inRajkot district of Saurashtra, is now claimed tohave spread over the entire Saurashtra regioncovering the rural and urban areas and involvesrecharge of about 300,000 wells.
Diagram of dug well rechargestructure with improved water filter.

D U G W E L L R E C H A R G I N G I N S A U R A S H T R A
249
Dug wellrecharge
involvesdirecting
rainwater and
run-off intoexisting open
wells.
According to Shamjibahi Antala1 , the presidentof Saurashtra Lok Manch Trust (SLMT) which
is a non-governmental organization working forrural development: “It was 1988, when thefarmers of Dhoraji-Upletta, the small townshipsof Saurashtra, started to fill their wells withflood waters passing through nearby their farms.Having been affected by three consecutive yearsof drought, these people have been inspired tocollect rainwater and to their surprise they foundthat the flood water filled in the wells bring thewater table up and they could take the kharif crop.This simple and handy solution touched theleaders of Saurashtra Lok Manch Trust who in turnstudied this system and prepared literature toprovide information to the farmers on the wellrecharging technique”.2
The movement was also picked up on by manyreligious and spiritual institutions, religious heads,saints, scholars, voluntary organizations and ruralcommunities. Some of the key institutions,organizations and individuals associated with themovement are:
� The Swadhyaya Movement: a spiritualmovement led by Shri Pandurang ShastriAtawale working for social and culturalchanges in society
� Lok Bharati Sanosara: a voluntaryorganization working for socialdevelopment mainly through ruraleducation and grass roots action
� Indian Farmers Fertilizers Cooperative
(IFFCO)
� Aga Khan Rural Support Programme India
(AKRSP (I)): a non-government and non-profit organization working on ruraldevelopment in communities in thedistricts of Junagadh, Bharuch andSurendranagar in Gujarat throughparticipatory natural resource developmentand management activities, and
� Vruksh Prem Seva Trust based in Upletta,
Rajkot.
The approach of dug well recharging is basedon two simple facts. First, substantial amounts ofrainwater, which falls on the ground runs off intothe sea or evaporates. Much of this could becollected near the place it falls. Secondly, thecollected water can be stored in the depletedaquifers by directly injecting it into nearby opendug wells. This technical approach is creative andsimple because it minimizes the distance betweenthe point of collection and the use of water, unlikein the case of large water resource systems whichinvolve long distance conveyance systems causinghuge seepage losses and reduced efficiency.
The movement claims to have rechargedabout 300,000 wells in Saurashtra in the last 5years. According to Shamjibhai Antala, at leastone hundred billion gallons of rainwater wereinjected into the wells in June-July 1995. However,no scientific estimates are available on thedifference in water level rise between rechargedareas and areas where recharge activities have nottaken place.
The Well Recharge Movement in Saurashtra

D U G W E L L R E C H A R G I N G I N S A U R A S H T R A
250
Groundwaterlevel declines in
hard rock areasare often aseasonal
phenomenon.Levels riseduring the
monsoon butdrop rapidly aspumping starts.
Water Management Implications of Dug WellRecharging
There are rainwater harvesting projectsundertaken in India which had the goal of
storing water underground, but the dug wellrecharging movement deserves special attention asa water management approach. Implementationof the recharge technology is decentralized andhence, can serve as the basis for a communitybased approach to solving water scarcity problems.In addition, the technology is simple and
financially viable, which makes it attractive evenfor poor farmers to implement. Furthermore, thetechnology has been implemented in an area thatcovers up to 40% of the state of Gujarat that makesthe potential hydrologic and environmentalimpacts large. Finally, two-thirds of India isunderlain by hard rock, which in turn makes thepotential for replicability of the technique high inother water scarce areas.
Physical Science of Well Recharging
Physical Situation
Understanding the physical process of dug wellrecharging requires an understanding of the
geology, geo-hydrology and hydrology of theregion. Hydrologically, Saurashtra is drained by alarge number of rivers and streams that flowsouthwest into the ocean. These rivers have onlymonsoon flows. Though the rainfall is low tomedium, the rainfall mostly occurs in highintensities for short durations. This, coupled withthe presence of heavy, medium and deep blacksoils having poor infiltration capacities and lowthickness, which are underlain by hard rockformations result in high run-off and flash floods.A large number of medium and minor surfacereservoirs have been created to harness surfacerun-off from the catchments in the region forirrigation, drinking and domestic uses, andindustries. The total surface water availability fromthese reservoirs is estimated to be 5,458 MCM.
Geologically, Saurashtra is underlain by thehard rock basalt of the Deccan Trap,
except in the coastal strip, where cavernouslimestone is found. Geo-hydrologically, theaquifers are shallow and confined with noprimary porosity. There is only secondary porositydue to the presence of fractures and weatheredzones. The secondary porosity also reduceswith increasing depth and consolidation.The yield characteristics of the aquifers (that is,specific yield and transmissivity) are generallypoor and also vary significantly across spaceand depth.
There are estimated to be some 700,000 shallowand deep dug wells in the entire region. These areused both for irrigation and drinking purposes.Dug cum borewells and deep borewells are alsofound in limited numbers.
Seasonal depletion of groundwater is awidespread phenomenon in Saurashtra. The waterlevel rises high during the monsoon, but due tothe poor storage capacity of the aquifer, the waterlevel starts receding rapidly as pumping starts.Thousands of wells go dry by the onset of summer.

D U G W E L L R E C H A R G I N G I N S A U R A S H T R A
251
Technical Aspects of Dug WellRecharging
The well recharging technique, whichessentially involves diverting run-off into the wells,has some variations depending upon the point ofcollection of water and the type of well used forinjecting water underground. During fieldwork, twotypes of collection methods were found: collectionof field run-off with diversion directly into dugwells and diversion of water into the wells fromnatural and artificial drains. In the case of directdiversion to the well, it is necessary to have theland sloping toward the well to eliminate the needfor conveyance systems.
In most of the cases studied, run-off water isdiverted directly into the well without any primarytreatment. In some cases, however, water passesthrough one or more filters before beingintroduced into the well. It may pass through filtersmade of gravel, sand and soil, through asedimentation tank or through a graded filter toremove organic matter and fine particles.
In the village Panch Pipalia in Dhoraji it wasfound that out of the 60 farmers who werereported to have done well recharging, nearly50 were diverting water from canals andputting it underground. These farmers are notemploying any filtration technique becausethe water from the canal is clean. Duringdiscussions, two of these farmers pointed out thatthe water being used is that from the flood run-off in the canal during the rainy season and notthe water released into the canal. It also came outclearly during the discussions that these farmersdid not need to make any investment for carryingout these activities.
The Saurashtra Lok Manch Trust has developedtechniques to recharge aquifers using hand pumpsand borewells as well.3 The motivating factor forthis was that dry hand pumps are a commonphenomenon in both urban areas and ruralvillages in Saurashtra, and in the rural areas,frequent failure of borewells drilled for irrigationis widespread. Many farmers are using their failedborewells for rejuvenating the aquifers and therebyimproving the yield of the running open wells,which are close to these borewells. During thefieldwork in one village named Kathrotta, it wasalso found that some farmers are using failedborewells for recharging.4
In the case of hand pumps and borewellslocated adjacent to houses, roof tops are thecollection surfaces. Rainwater collected from theroof-top is diverted directly to the hand pump orborewell through a pipeline without filtration.
Estimates of RechargePotential Through Dug Wells
No systematic hydrologic studies have beenundertaken by any agency to estimate thehydrologic impact of well recharging either for theregion as a whole or for individual wells that arerecharged. The figures available are preliminaryestimates made by Antala and a few others whopromote the dug well recharge movement.
Antala bases his estimates on field observationsof the number of times the well is filled (the“fillings”) and on the storage capacity of localwells. A dug well in Saurashtra has a storagecapacity of nearly 400 m3 and in a normal rainfallyear the well gets at least 4-5 fillings. In that case,the total water stored by a single well in the course
In many casesrun-off water is
diverteddirectly into the
well without
primarytreatment.
Pollution risks
are great.

D U G W E L L R E C H A R G I N G I N S A U R A S H T R A
252
of a year is approximately 1,600 m3. Taking itfurther, SLMT claims that a total of 480 MCM ofwater is recharged through some 300,000 wells inthe region.
These estimates seem to have a weak scientificbasis as they do not take into account the run-offrates and the limited catchment area of therecharge wells. They, in turn, assume that all thewater stored in the well during the monsoon isdue to the recharge installation. A close look atthe hydrologic parameters, such as magnitude ofrainfall, rainfall intensities and soil infiltrationrates, reveals that the recharge figures are likelyto be overestimated. We have made back of envelopcalculation and projections based on the fieldworkcarried out in villages where farmers have takenup recharge activities. The heavy and mediumblack soils have high initial infiltration rates thatbecome almost insignificant after 4-5 hours. Thecumulative infiltration during the initial 4-5 hoursis around 0.30 metres, which means the first fewrainfall events (if the total magnitude is less than
Rainwater fromroof tops can
also be used todirectlyrecharge
aquifers.
Sediment trap for dug well recharge: Gujarat
Holding pond for recharge water: Gujarat
or equal to 300 mm) is most unlikely to causeany run-off. Subsequent wet spells, if they occurimmediately after the first ones, can generatesignificant run-off. In the case of a long gapbetween these wet spells, the infiltration capacityof soil can increase substantially due to shrinkingand cracking at the surface, which in turn willfurther reduce the run-off rates.
The total amount of rainwater falling in theSaurashtra region in a normal year is estimatedto be 33,920 MCM of water with 510 mm of waterfalling over a total area of 64,000 km2. If oneconsiders an optimistic figure of 300 mm as thetotal (most of which will be lost in evaporationand filling the soil moisture deficit), the availablerun-off is only 13,440 MCM. Taking the figures ofthe Government of Gujarat, the net groundwaterrecharge taking place in Saurashtra is estimated

D U G W E L L R E C H A R G I N G I N S A U R A S H T R A
253
to be 4,289 MCM.5 The storage created throughall the surface systems put together comes toaround 5,458 MCM.6 This leaves 3,692 MCM ofwater unaccounted for. Now, on the basis of theassumption that 700,000 wells can be rechargedevery year at a rate of 1,600 m3 per well, a total of1,120 MCM of water will be rechargedunderground. This means that the rainwater tobe captured for the purpose is around 30% of therun-off left out.
Of the above 1,120 MCM only a portion couldbe collected due to variations in local topography.For example, potential catchment areas may notslope toward wells or water may fall on areaswhere it will run-off into streams instead. Itshould be noted that if the estimated water werecaptured, it would be at the cost of reduction instorage in the reservoirs and of monsoon flows inthe local rivers.
Another estimate of the recharge potential ofdug wells comes from discussions with farmerswho use the method. They have indicated that inan average year, the farmers could see a watercolumn of depth ranging from 20-25 feet (about6 to 8 metres) in their wells after each majorrainfall event that vanishes in 12 to 24 hours afterthe rains. This means that 350 m3 of water couldbe recharged (if one considers 5 major rainfallevents for a well with a diameter of 10-12 feet).This is less than one-tenth of the 1,120 MCMestimated above.
To summarize, back of the envelopecalculations based on the hydrological andmeteorological characteristics of Saurashtra andthe primary data collected from the farmers
indicate that the recharge estimates provided bythe promoters of dug well recharging need to beused with caution.
Potential Impact on WaterQuality
The dug well recharging movement posesserious questions about water quality, health,hygiene and environment. First of all, the waterbeing recharged is mostly run-off from fields andthe natural and artificial drains passing by theside of farmers’ fields. The field run-off mightcontain agricultural residues apart from organicmatter. The infiltration tanks, if properly designed,can remove the organic matter and bring downthe Biological Oxygen Demand (BOD), but cannotremove the agriculture residues. Therefore, theChemical Oxygen Demand (COD) of the water ispotentially high. Mr. Ashwin Shah also put forthsimilar arguments. If the water from the well isused for drinking and other human uses, it couldpose health hazards. Again, in none of thesituations that the authors have come across, werefarmers using well designed filters andsedimentation tanks. Secondly, drains and streamsin rural areas flush out garbage and sewage fromvillages and the organic wastes from agriculturalfields during the rainy season. Blocking thesechannels and diversion of water from them cancause unhygienic conditions in and around thevillage due to the dumping of waste.
The counter view of those active in themovement is that the large reservoirs of Saurashtrahave the same sources of water as the rechargedwells, but that there have not been health problemsrelated to the use of water from these sources. This,
Activistssupporting dug
well rechargeneed to aware
of and evaluate
the pollutionsuch activitiescould cause.

D U G W E L L R E C H A R G I N G I N S A U R A S H T R A
254
of course, misses the point that highly centralizedsystems such as the large reservoirs have expensivetreatment plants that are not viable indecentralized, small-scale systems such as therecharge wells.
Economics of Recharging:Myth and Reality
Water being recharged is mainly used forirrigation by the farmers in Saurashtra. Most ofthe wells are farm wells into which field run-offcan be diverted. The extensive work done inSaurashtra has helped collect enough evidence toestablish this fact. The farmers mention that thewater is not potable as it contains mud and silt.Overall, farmers do not perceive significantchanges in water availability in wells that havebeen recharged; additional water available is onlyenough to give one or two supplementaryirrigations. Most of the farmers interviewed duringthe fieldwork said that they could give onesupplementary irrigation to their kharif groundnutin low rainfall years. In high rainfall years theycould increase the area under irrigation for wintercrops in comparison to similar rainfall years beforerecharge activities were initiated. Supplementaryirrigation is, however, critical to obtaining highyields from groundnut. The farmers opined thatin bad rainfall years, without supplementaryirrigation, crop yields fall to 20% of the averageyield. The last support irrigation not onlyhelps prevent crop failure but also increases theyield substantially.
A large amount of anecdotal evidence regardingthe economic benefits of recharge is, however,circulating through the media and other informal
forums. There are, for example, assertions basedon the back of the envelope calculations made byVayak and Khanpara quoted in Shah (1998). Theyestimated that 10,000 wells were recharged inKutch and Saurashtra during 1993-94 and thatthis cost the farmers Rs 500,000 but raised netoutput by Rs 80 crore (Shah, 1998). Theeconomics of well recharge advanced by Vayak andKhanpara were based on the following estimates:Saurashtra receives an average rainfall of 508 mmand a recharged well can irrigate 8 additionalacres during rabi. Recharging a well costs Rs 800at a maximum and an irrigated rabi crop gives anet income of Rs 10,000 per acre. Again, thesefigures are estimates.
The basic flaw in the above economic analysisis overestimation of the irrigation potential createdthrough recharging wells. To irrigate an additional8 acres of rabi crop (let us say winter onion,which requires 700 mm depth of watering) wouldrequire at least 22,680 m3 of water. If one assumesan average run-off of 50 mm (10% of the averagerainfall of 500 mm) to be available for rechargingthe wells, the free catchment required for each wellwill be 110 acres or 0.453 km2. This is impractical,as the average landholding of the farmers isaround 10 acres. The weakness of the argumentcan be more clearly understood from the claimmade by Shri Shamjibhai Antala during hisinterview with the authors that around 700,000wells in Saurashtra can be recharged withincremental hydrologic and economic benefits. If,the entire geographical area of Saurashtra couldbe used as a catchment for recharging the 700,000wells in the region, gross catchment for anindividual recharge well would be only 22 acres.Furthermore the actual catchment area would be
Estimates of theeconomic
benefitsgeneratedthrough
recharge arebased onanecdotal
information.

D U G W E L L R E C H A R G I N G I N S A U R A S H T R A
255
The rechargemovement
emerged as aresponse toincreasing
water scarcity.
Name of Crop
Wheat
Onion
Castor
Coriander
Cumin
Groundnut
Cotton
Before Recharge
No Total Average
3 27.50 9.17
6 57.50 9.60
3 32.00 10.67
2 27.00 13.50
2 * *
9 15.80 1.70
3 4.50 1.50
After Recharge
No Total Average
8 26.50 3.3 0
8 62.60 7.80
5 45.00 9.00
6 21.00 3.50
4 * *
8 28.00 3.50
4 8.75 2.20*Area figures not available.
much smaller if one considers the source area ofthe major, medium and minor surface irrigationschemes (where the water has already beenharnessed), and the land which topographicallycannot be drained into dug wells.
In order to have a more accurate estimate ofthe amount of recharge and the returns, VIKSATcarried out a survey of 15 farmers in Kathrottavillage7 in Rajkot district of Saurashtra who havetaken up dug well recharging. Results of analysisof the primary data collected from these farmersare presented in Table 1.
The results given in Table 1 indicate that thenumber of crops and total area under differentcrops have increased. But the average area undereach crop for the individual farmer has reducedsubstantially for all the rabi crops. Overall, thewatering intensity during rabi has increased. Whilethe hours of watering per bigha8 were 34.55 duringrabi before recharge activities were initiated, it isestimated to be 49.50 after recharge.
The total hours of irrigation possible to providethrough each well has also increased afterrecharges. While the average hours of irrigationper well (based on data of 13 wells) was estimatedat 297 hours before recharges, it was estimated at377 hours after recharge, an increase of 80 hours.This is equivalent to increasing the area underirrigation by nearly 2 bighas (0.80 acres)assuming an average of 40 hours of irrigation perbigha — for a rabi crop (a reasonably accuratenumber based on our field surveys). A closeranalysis shows that the difference is due to theincrease in hours of watering during kharif. Afterrecharge activities, the average total hours of
watering declined by 10 hours in rabi, while itincreased by 90 hours in kharif. The increase inwater availability increases farmers’ ability to givesupport irrigation to groundnut and increasethe productivity.
If one assumes that the farmer grows a highvalued crop like onion which gives a net return ofRs 10,000 per acre of irrigated crop, the additionalreturn will be Rs 8,000 per recharge well. Now, ifone makes a reasonably accurate assumptionthat 50,000 wells in Saurashtra are recharged, thetotal annual economic return would be 400million rupees.
The Social Dynamics Behindthe Movement
The mass movement for well recharging whichhas emerged in response to major increases inwater scarcity problems. It was catalysed first bythe Saurashtra Lok Manch Trust, swadhyayapariwar (spiritual institution). Subsequently, inthe aftermath of the three year drought from 1995to 1997, some Hindu sects, numerous NGOs and
No. of Farmers Having Grown the Crop
TABLE 1:Impact of Recharging on Crops and Cropping Pattern

D U G W E L L R E C H A R G I N G I N S A U R A S H T R A
256
Socialmovements can
have a majorimpact byimproving water
literacy.
other mass based social organizations have playedmajor roles in encouraging the movement.
Swadhyaya pariwar is a closely-knitcommunity. The more devoted and committedamong the swadhyayees spend a good deal of timeand effort in communicating new ideas across theswadhyayee community. Swadhayaya pariwarhas developed an indigenous communicationcapacity that propagates information regardingnew technologies widely and rapidly. Audio andvideo recordings of Athavale’s talks are playedbefore voluntary gatherings of swadhyayees. Theseact as a powerful medium for spreading new ideasand messages. There are several reasons why therecharge initiatives grew into a mass movement.Tushaar Shah9 discusses some of these in hisrecent paper on the issue (Shah, 1998), which wealso think are important: First, the coreswadhyayees showed readiness to give a serioustry to the ideas of the movement founder whocatalysed the first generation of recharge activities.Secondly, the idea of dug well recharging wasmarketed in the packages of instrumental devotion(that is, it was included along with the printedreligious packets handed out by the organisation)and no stage in the earlier years did theswadhayayees ask the farmers to recharge theirwells for economic reasons. Instead, they untiringlycited Athavale’s teachings that, “if you quench thethirst of Mother Earth, she will quench yours”.
The Saurashtra Lok Manch Trust, which is amass based social organization organized ralliesin rural areas to address the masses and propagateconcepts regarding the urgent need for in-situwater harvesting.10 The entire focus of their workwas to place water scarcity issues on the socialand economic agenda, to create water literacy
among the ordinary people and educate themregarding various techniques for aquifer rechargethrough dug wells. The arguments advanced bythe SLMT centered around three basic issues:1)Saurashtra has unique hydrological featureswhere low aquifer storage characteristics and highrainfall intensities result in little groundwaterstorage; 2) the inherent drought proneness of theregion and common occurrence of seasonal as wellas longer-term water scarcity problems; and, 3)well recharging as an in-situ way of harvestingrainfall, the source of all water and thussupplementing other water sources.
Additional factors, however, contributed to thegrowth of well recharging as a broad farmers’movement not restricted to swadhayayees orfollowers of other religious sects. The investmentfor well recharging is small and often negligible;the benefits of recharging are perceptible in termsof rise in water levels in wells and increased wellyield; and the economic returns are much faster.Above all the technology is easy for ordinary peopleto understand, replicate and implement.
Some of these factors also explain why themovement did not pick up in other parts ofGujarat, such as north Gujarat where waterscarcity problems are equally critical. One of thereasons, which is also important from the pointof view of inspiring the people,11 is that the rate ofrun-off in the alluvial areas of north Gujarat,where soils are sandy, is low compared toSaurashtra which has clayey soils. As a result, theamount of water that can be captured from run-off in north Gujarat is small. In addition,landholdings in north Gujarat are rather small,which again reduces the quantum of wateravailable for recharging.

D U G W E L L R E C H A R G I N G I N S A U R A S H T R A
257
Uncertaintiesinclude:
� economicbenefits,
� overall water
balance,� environmental
impacts, and
� water qualityeffects.
Institutional Response to theRecharge Movement
In spite of the fact that the villagers haveresponded positively and transformed rechargeinitiatives into a people’s movement, the movementhas not received enough attention from the policymakers. First, no information is available on theactual scale of recharge undertaken as nosystematic studies have been done. Needless to say,even less information is available on the physical(hydrologic) impact of recharging. Well rechargingis extensive and it could alter the overall waterbalance even in large basins. As a result,information on the number of wells which couldbeneficially be recharged without causingsignificant changes in water available for surfaceschemes is important. This is also importantbecause many financial institutions have startedshowing interest in dug well recharge proposalsas a source of water supply for irrigation and wantto consider them as bankable projects.
The movement to recharge dug wells hasattracted attention from other states in India.Officials of the groundwater departments fromstates such as Rajasthan, Madhya Pradesh andTamil Nadu have visited Saurashtra over the lastfew years to understand the recharge movementand to explore the possibility of replicating thetechnology in their respective states. Orissa hasgone one step ahead in this direction. There thegovernment has already started implementingwater conservation and rainwater harvestingtechniques in some of the water scarce andeconomically backward districts in the state.12
If dug well recharge initiatives are nottechnically and environmentally sound damage to
the aquifers of Saurashtra needs to be avoided.The movement is a creative response to regionalproblems and should be provided with guidanceto make it technically, environmentally andeconomically sound. In addition, if necessary,financial assistance should be provided to improveits success.
Future Areas of Work
Dug well recharge as a technique is promising.The technique is people friendly (low cost,technologically simple and easy to implement); ithas the potential to contribute significantlyto solving problems of individual farmers; itpromotes decentralized water management; andthe entire activity is happening without muchinstitutional support. There is, however, a longway to go before it should be advocated as anenvironmentally sound and sustainable approachto water management. Studies will be requiredto understand:
� the hydrologic, water quality and economicimpacts of dug well recharge for individualwells;
� the change in overall water balance of abasin due to dug well recharge; and,
� the environmental impacts of dug wellrecharge, such as potential pollutionproblems.
Research is also necessary to determine theoptimal number of dug well recharge systems thata region/basin can support and to develop somequantitative criteria for recharge system design.
Beyond the technique itself, it is important torecognize that dug well recharge will not solve the

D U G W E L L R E C H A R G I N G I N S A U R A S H T R A
258
water scarcity problems of arid regions.Where rainfall, the primary source of water, isboth limited and highly variable. Whilethe amount of new supply that can be createdmay be significant, our estimates indicatethat it falls far short of potential waterneeds. Ideally, water harvesting initiatives ofthis type would form part of a largerpackage of management actions designedto increase water use efficiency and reduce
Ultmately, theimpact of theSaurashtra well
rechargemovement maydepend on
whether or notit can evolveinto a wider
social movementfor watermanagement
rather than justsupplyenhancement.
demand as well as to supplement supplies.
The well recharge movement in Saurashtrarepresents a very significant social initiative toaddress water scarcity problems. Ultimately,however, its larger impact may depend on whetheror not it can evolve into a wider social movementfor water management rather than justsupply enhancement. This is perhaps the mostsignificant question for future research and action.

D U G W E L L R E C H A R G I N G I N S A U R A S H T R A
259
Notes
1 Shri Shamjibhai is a self-taught man and is among very few activists and experts who have looked at rain as the fundamentalsource of all water, rather than rivers, to evolve a technical solution to water problems.
2 Personal communication Shri Shamjibhai Antala had with Ashwin Shah, a US based civil engineering consultant workingon water related issues in Gujarat.
3 Personal communication, Shamjibhai Antala.
4 One farmer named Patel Virjibhai Nathabhai Vachchani has four borewells of which one is high yielding, the second oneis low yielding and the remaining four disfunctional. The recharge system designed and installed by him is worth studying.He has constructed a surface tank just on the lower side of his sloping field, which collects field run-off. The water is thenpumped into the borewell, which is disfunctional. This water, according to the farmers, improves the yield of the neighbouringpumping borewell. During the winter and summer, he pumps out the water from the low yielding well and stored in thesame surface storage tank. This water is then taken to the field channel by gravity and mixed with the water from the highyielding well to irrigate the fields.
5 and 6 Personal Communication, Gujarat Water Resources Development Corporation.
7 Kathrotta is a village where recharge activities were carried out by the farmers very systematically with technical andfinancial input from Indian Farmers’ Fertilizer Cooperative (IFFCO). Around 80 farmers in the village have taken up dugwell recharging last year.
8 One bigha equals 0.4 acres.
9 Director Institutions and Governance programme, International Water Management Institute, Colombo.
10 The Saurashtra Lok Manch took out a rally in 1995 in Saurashtra during which volunteers used a large number of pamphletsdescribing the various simple techniques for well recharging. The mass media like newspapers popularized these events.
11 While talking to some farmers from Mehsana in north Gujarat about the scope of dug well recharging in the area, theresponse came immediately from some of the experienced farmers saying, ‘Where is the water to recharge?’ The situation inMehsana is far different from the situation in Saurashtra, as the soils are sandy and allow very little run-off”.
12 Mr Antala, who is spearheading the movement, was recently invited by the Government of Orissa to suggest solutions towater scarcity problems in the state. Based on the suggestions made by him, the district administration of Kalahandi andGhanshyampura – two of the economically backward districts in the state – have already started implementing dug wellrecharging projects in the area with people’s involvement.

D U G W E L L R E C H A R G I N G I N S A U R A S H T R A
260
Bibliography
Shah, T. (1998). The Deepening Divide: Diverse Responses to the Challenge of Groundwater Depletion in Gujarat, IDE-FordFoundation supported Irrigation Against Rural Poverty Research Programme, Anand, The Policy School.

A Study of theShekhawati Basin, Rajasthan
Local Strategies for WaterManagement and Conservation
M.S.Rathore and R. M. Mathur
C H A P T E R 7

L O C A L S T R A T E G I E S F O R W A T E R M A N A G E M E N T A N D C O N S E R V A T I O N
262
Introduction
Groundwater is a primary source of water supplyfor irrigation and domestic use in rural and
urban areas in Rajasthan. Over the past fivedecades agricultural growth in the state has beensupported primarily through increasing the use ofgroundwater. This process has been greatlyencouraged through a combination of direct andindirect subsidies. Credit policies subsidizing thedevelopment of new wells and energy pricingpolicies that subsidize diesel and electricity havereduced costs of extraction. Equally important,however, have been broader agricultural pricesupport and procurement prices for crops andinput subsidies for seed and fertilizer. The packageof direct and indirect support has enabled farmersto expand production greatly and has encouragedgreatly increased levels of groundwater extractionas an integral part of the process.
The main objective of the above policies hasbeen to increase agricultural production andprovide food security for the rapidly growingpopulation. Expanding the use of groundwaterper se was never the primary objective of theseinstruments. Expansion of agriculture and thespread of energized pumping technology have,however, fundamentally changed water usepatterns and resulted in dramatic water leveldeclines. Groundwater extraction now exceedsrecharge in many low recharge areas. Competitionbetween users and uses (agriculture, domestic,industrial, and commercial) is growing fast,which has had a further impact on overdraftconditions. It is clear that the present pattern ofgroundwater utilization is unsustainable.Rajasthan has passed the stage in which societycan focus on groundwater “development” as a
catalyst for agricultural development and enteredinto the phase of groundwater “management”(Shah, 1997).
Attempts to address groundwater overdraft inRajasthan have focused on integratedmanagement, basin management and waterbalance approaches. Each of these has, in oneway or another, failed to deal with the complexproblem. The primary limitation lies inimplementation mechanisms. Approaches focusedon the economics of groundwater extraction(primarily limitations on credit access inoverdeveloped areas) and legislative regulation(primarily restrictions on electricity connectionsand well spacing regulations) have been tested indifferent forms in a number of states inIndia. These policies have generally provedunenforceable and had little impact ongroundwater overdraft problems.
During the last five years subsidies have beenproposed and tested as instruments to directlyinfluence water use. Farmers have beenencouraged to use sprinklers to save water so thatthe area under irrigation could be increased andthe demand for water reduced. Sprinklertechnology is being widely adopted in parts ofRajasthan and the objective of increasing the areairrigated has been fulfilled. Net water savingshave, however, not been realized and there mayhave been a negative impact on the level ofgroundwater exploitation because of the increasedarea under irrigation. Part of this is a result ofcontradictions in the policy objectives. Reductionsin groundwater extraction would only beexpected through improved irrigation technologies
The state hasnow started tofocus on
groundwater“management”not
“development”.

L O C A L S T R A T E G I E S F O R W A T E R M A N A G E M E N T A N D C O N S E R V A T I O N
263
if the cultivated area were to remain relativelyconstant. An additional factor may be the limitedefficiency of many of the sprinklers. Studies inother areas have indicated that overheadsprinklers often lose 40-60 per cent of the waterapplied through evaporation (Moench, 1991a).Since virtually all sprinklers in Rajasthan areof the overhead type, there may be little actualsavings. In any case, although adoption ofsprinkler technology has been relatively widespreadin Rajasthan, this has had little impact on therate of groundwater depletion. Local responses tothe increasing water scarcity associated withoverdraft vary according to location andlandholding patterns. Two common responses,however, are shifting to cropping patterns withlow water demanding crops and the deepeningof wells.
This report is divided into five sections. Thefirst focuses on the objectives of the study. This isfollowed by an overview of the status of waterresources in Rajasthan and includes a descriptionof the supply and utilization of water resourcesand the nature of emerging problems. The nextsection provides background information on theShekhawati Basin and its northeastern sub-basinsin which the case study was conducted. The fourthsection documents the local level responses inmanagement of water resources and presents theresults of the field survey. The final section outlinessuggestions to deal with the groundwater problems.The report is based on the results of the first phaseof research and draws on a combination ofsecondary data and initial field surveys in the casestudy region. The present study covers only thenorthern half of the basin.
Objectives
In order to address groundwater overdraftproblems, it is essential to understand use
responses to varying water availability situations.The present research is part of a broader studyundertaken to identify and communicate the watermanagement needs that can be addressed throughlocal management strategies. The study focuseson case study sites located in the ShekhawatiBasin, an arid zone in northern Rajasthan.Objectives of this study are:
1. To document the range of water managementchallenges facing populations in the casestudy sites;
2. To document existing physical responses tomanagement needs and identify other alternativephysical responses from the perspective of bothlocal and technical/official communities. (Some
of these physical responses include new supplydevelopment, end-use conservation andreallocation).
3. To identify the scale at which different physicalresponses must be implemented in order toaddress the previously identified watermanagement needs;
4. To document existing incentive structurescreated by government policies, water markets,water rights and customary practice that governthe ability of local communities to adopt orimplement alternative physical solutions; and
5. To identify potential avenues for changingincentive structures and developing efficient,equitable and sustainable water resourcemanagement systems.
Local responsesto increasing
water scarcity
vary accordingto location and
landholding
patterns.

L O C A L S T R A T E G I E S F O R W A T E R M A N A G E M E N T A N D C O N S E R V A T I O N
264
GUJARAT
MADHYA PRADESH
UTTAR PRADESH
HARYANA
JAIPUR
SIKAR
JHUNJHUNU
PUNJAB
STUDY BASIN
INDIA
PAKISTAN
International Border
State Boundary
151
6 2
3
4 5
8
711
14 13 12 10
9
Overview: Water Resources in Rajasthan
Rajasthan is a predominantly agricultural statelocated in northwestern India. More than
seventy per cent of the population depends onagriculture, animal husbandry and relatedactivities. Limited availability of water is recognizedas the most important factor constraining growthand development. This is especially the case withregard to agricultural productivity, which isdependent on an assured and timely supply ofwater. As a result, investment in better utilizationof available surface and groundwater resources hasremained a priority in all development plansdrawn up for the state since 1950.
More than two-thirds of the state has arid tosemi-arid climatic conditions. Very low anduncertain rainfall, many rainless months, a highprobability of drought years, and very little surfacewater flow are the characteristics of these regions.The annual average rainfall in much of the aridzone is only 200 mm. More than 90 per cent ofthis rainfall occurs during a few major rainstormsin the four months of the monsoon season. Inaddition, the variability of precipitation over spaceand time is high.
For geographic, economic and technicalreasons, most irrigation projects (except for theRajasthan Canal) are located in the eastern halfof Rajasthan. Most of the economically attractivesites for construction of major and mediumirrigation projects have already been identified anddeveloped to provide irrigation. According to theDepartment of Irrigation the total surface waterpotential within the state is estimated at 1.96million hectare metres. Of this, 1.79 millionhectare metres of water is received under variousinter-state river basin agreements. Since 1951 thestate has begun or completed 9 major, 60 mediumand 1,582 minor irrigation projects. The totalexpenditure incurred until the beginning of theNinth Five Year Plan on Major and MediumProjects amounts to Rs 29,749 million and onminor projects Rs 9,004 million. This investmenthas been used to create an irrigation potential of1.92 million hectares through major and mediumprojects and 290,000 hectares through minorprojects. The cost per hectare of additionalirrigation potential in major and medium projectsduring the Eighth Plan was Rs 57.6 thousand and
RIVER BASINS1. SHEKHAWATI 2. RUPARALI 3. BANGANGA 4. GAMBHIR5. PARBATI 6. SABI 7. BANAS 8. CHAMBAL9. MAHI 10. SABARMATI 11. LUNI 12. WEST BANAS
13. SUKLI 14. OTHER NALLAHS 15. OUTSIDE BASIN
�N
Groundwaterserves seventyper cent of the
irrigated areain Rajasthan.
Figure 1:Location map of Rajasthan.

L O C A L S T R A T E G I E S F O R W A T E R M A N A G E M E N T A N D C O N S E R V A T I O N
265
BANSWARA
HANUMANGARH
BIKANER
CHURU
JHUNJHUNU
SIKAR ALWAR
NAGAUR BHARATPUR
JAISALMERJAIPUR
DAUSADHOLPUR
AJMERJODHPUR
TONKSAWAIMADHOPUR
BARMER
BUNDI
SIROHI CHITTORGARH KOTA
UDAIPUR
DUNGARPUR
GANGA NAGAR
PALI
PAKISTAN
GUJARAT
MADHYA PRADESH
PUNJAB
HARYANA
UTTAR PRADESH
State BoundaryInternational Border
it is increasing over time. In spite of hugeinvestments in surface irrigation structures, canalsystems irrigate only 30 per cent of the net irrigatedarea in the state, the remainder being irrigated bygroundwater.
The assessed groundwater potential (grossrecharge) is estimated as 13,157 MCM (Table 1).Of this, approximately 16% is utilized for drinkingwater purposes and about 84 per cent is utilizedfor irrigation. In terms of volume, industrial useis negligible. Thus, available groundwater potentialfor irrigation is estimated to be 10,975 MCM. At astate level the stage of groundwater development(the proportion of the gross recharge that isextracted) has increased from 31 per cent in 1980to more than 64 per cent in 1996. In manylocations the percentage is much higher and thereare widespread and clear cases of groundwaterover-exploitation. The extent of over-exploitationin the state is evident from the data reported inTables 1 and 2 and Figure 3. The number ofadministrative blocks in which the state classifiesgroundwater as being under critical condition hasincreased from 12 in 1980 to 105 in 1996, and33.8 per cent of the groundwater zones havebecome “dark zones” where exploitation isestimated to be more than 80 per cent of therecharge.
In Rajasthan, rapid population growth and theexpansion of economic activities have led toincreasing demand for water for a variety of uses.Most water use, however, is for irrigation, whichaccounts for nearly 90 per cent of the total waterutilized in the state. Wells are the major sourceof irrigation contributing more than 60 per centof the net irrigated area. In total there are around1.2 million wells. Their use is strongly influenced
TABLE 1:Change in Status of Groundwater in Rajasthan (1990-1995)
Source: Groundwater Department, Government of Rajasthan, Jaipur.
�N
Item 1990 1995
Groundwater Potential Zones (area in km2) 213,144 212,621
Gross Recharge (MCM) 12,708 13,157
Available Groundwater Resource for Irrigation (MCM) 10,801 11,028
Groundwater Draft (gross) (MCM) 9,368 9,916 (a) Domestic 526 697 (b) Irrigation 8,841 9,085 (c) Diverting of mines (kota) - 134
Groundwater Balance (a) Gross 3,340 324 (b) Net 4,981 4,535
Stage of Groundwater Development (%) (a) Overall 74 75 (b) For irrigation 54 59
Category Potential Zones (Number, %) (a) White 484 (61.4%) 322 (54.2%) (b) Grey 84 (10.6%) 71 (12.0%) (c) Dark 221 (28.0%) 20 (33.8%)
Figure 2Districts of Rajasthan.

L O C A L S T R A T E G I E S F O R W A T E R M A N A G E M E N T A N D C O N S E R V A T I O N
266
��������
����������
������ ���������
�������
���
������
����� �����
����� ����� ��
�������� ��������������
������ �������������
�����
����
������ ��� ��������� �
�����
�������
�����������
���������
�������������
��������
����������
����������
�� �����
��������
����������
���������
�����������
������
�����
�����
��������
PAKISTAN
GUJARAT
MADHYA PRADESH
PUNJAB
HARYANA
UTTAR PRADESH
� ! "�� �#���$!% &'�!�#&! �(�! "���&%#&
SOURCE: Ground Water Department, Jodhpur.
by annual rainfall. In wet years, groundwater isused as a major source of supplemental irrigation.In dry years, it is the primary source but use islimited because a large number of wells run dry.Overall, approximately 23% per cent of wells rundry or go out of use every year. In addition toirrigation, groundwater is the primary source ofwater supply for drinking and domestic uses inrural and urban areas of Rajasthan. It is theprimary source of water for approximately 80 percent of Rajasthan’s drinking water needs and isalso an important source for industrial and othereconomic uses.
Groundwater resources in Rajasthan areshowing increasing signs of degradation, as canbe seen in Figure 3, which depicts water levelchanges between 1984 and 1997. In many areasover the last decade water level declines haveranged from 3 to more than 10 metres, with themost affected part being in the centre of the state.Water level declines have also led to declines inwater quality. Almost 30 per cent of the districtshave attained the critical stage (extraction exceeds80% of recharge) and an additional 50 per centare in the semi-critical stage (extractionexceeds 60% of recharge) of groundwaterdevelopment (Table 3).
The most common response to overdraftproblems in Rajasthan, India and elsewhere, hasbeen to seek new external sources of supply – morebig surface water projects, for example. Experienceshows that this solves only part of the problemand at a very high cost. In spite of hugeinvestment in creating surface water harnessingstructures and a major programme of WatershedDevelopment and Management in Rajasthan,groundwater levels continue to decline rapidly.
1980 10,947 3,323 7,624 31 12
1984 13,790 4,927 8,863 36 33
1988 10,967 5,465 5,502 50 65
1990 10,801 5,821 4,981 54 88
1992 9,849 4,714 5,135 48 92
1993 10,881 5,512 5,369 51 96
1995 10,975 6,494 4,481 59 109
1996 (P) 10,975 >7,000 <4,000 >64 105
TABLE 2 :Groundwater Potential in Rajasthan (1980-96)
P - ProvisionalSource: Groundwater Department, Government of Rajasthan, Jaipur.
Years Availablegroundwater resources forirrigation (MCM)
Netirrigationdraft(MCM)
Groundwaterbalance (MCM)
Stage ofgroundwaterdevelopment(per cent)
Blocks undercritical andsemi-criticalcategory (no.)
�N
Figure 3:Change in pre-monsoon water levels between 1984 and 1997.

L O C A L S T R A T E G I E S F O R W A T E R M A N A G E M E N T A N D C O N S E R V A T I O N
267
JHUNJHUNU
KHETRI
RINGUS
AJMER
Banganga basin
AJEETPURA
SAMBHAR LAKE
H A R Y A N A
Outside basin
KRIS
HNAWAT
I RIV
ER
Luni basin
MENDHA RIVER
DOKEN
� ! )�* )(!
Sabi basin
RAI
�����
KA
NTLI R
IVE
R A
ND
SU
B-B
AS
IN
NEEM-KA-THANA
DOHAN
RIV
ER
400 mm
500 mm
Upper and lower basin
Isohyetal Lines
Basin Boundary
State Boundary
JHUNJHUNUDISTRICT
SIKAR DISTRICT
JAIPUR DISTRICT
AJMER DISTRICTDistrict Boundary
Rivers
Given thelimited
availability ofnew water
supplies,
demand sidemanagement is
essential.
to be addressed by adopting an integratedapproach rather than a sectoral or purely supplyfocused approach. Given the limited availabilityof new supplies, demand side management isessential. Theoretically, this could be donethrough enforcement of a central control regimein which a regulatory agency allocates wateroptimally over time. Studies show, however, thatcentral control offers virtually no gain overcommon property arrangements enforced by thecommunity (Provencher and Burt, 1994). Inaddition, it is unclear how water use could actuallybe regulated on a practical basis by a central
Safe Semi Critical Critical
Ajmer Alwar
Barmer Bundi Jaipur
Jaisalmer Chittorgarh Dausa
Bikaner Churu Baran
Ganganagar Dholpur
Hanumangarh Dungarpur Jodhpur
Jhalawar Nagaur
Banswara Kota Sikar
Bhilwara Pali Jhunjhunu
Rajsamand Jalore
Tonk
Sawai Madhopur*
Sirohi*
Udaipur*
Bharatpur**
TABLE 3:Categorization of Rajasthan’s Districts byStatus of Groundwater (1984-99)
Overall, new surface water harnessing structuresare unlikely to have a major impact on thegroundwater overdraft. Limited new water suppliesare available for capture and the cost of doing sowould be high. The potential impact of rechargeis also limited by the unavailability of water, thehigh variability of rainfall over both time andspace, and the large areas of land where rechargedwater is not usable for irrigation or drinkingpurposes because of the salinity of the soils. Inany case, approaches that emphasize supplyaugmentation only address part of the problemand are not sustainable in the long run.
Surface and groundwater are part of the samehydraulic system, and demand and supply are twosides of the same coin. Therefore, the waterresource management problems of Rajasthan have
Figure 4:Shekhawati River showing basin and political boundaries andhydrometeorological details.
�N
Note: * - Sawai Madhopur, Sirohi and Udaipur district beinghard rock area and below normal rainfall of1996 they have increased to critical stage.** - In safe category as per data, but because of saline area,it has been placed in semi-critical category.Source: Groundwater Department, Government of Rajasthan,Jaipur.
L O C A L S T R A T E G I E S F O R W A T E R M A N A G E M E N T A N D C O N S E R V A T I O N
268
Methodology
The Shekhawati Basin in northeasternRajasthan is the focus of a long term study of
which this paper is the first portion. The firstphase of the study has involved collecting
A key policyissue is to definethe level and
scale ofintervention formanagement.
agency in Rajasthan. An alternative option is todevelop a broad based approach to demand sidemanagement of groundwater. This couldencompass a very broad range of interventionsintended to influence access to water and its usepattern. Measures could include introduction ofa new groundwater law covering registration ofwells, restricting water pumping capacity,minimum norms for spacing and depth of wellsand appropriate pricing of water and of energy.The success of these policies largely depends onthe response of the people, particularly the farmers.
Under existing law, which is based on EnglishCommon Law, and regionally accepted traditions,landowners have an “absolute right” to pumpgroundwater. They have the right to sink wellson their land and pump as much water as theycan from it – provided water is available in theaquifer. The doctrine makes groundwater into acommon pool resource in which all overlyinglandowners have a pumping privilege. Under thisright of capture doctrine, groundwater mining isprofitable even when it is unsustainable. As aresult, irrigated acreage has spread and in mostareas water levels have declined precipitously. Bothusers and the government are aware of this andefforts are on to translate government concern into
effective institutional change. Institutional change,particularly when it could affect individualpumping rights is, however, politically sensitive.As a result, substantial debate over what formgroundwater management should take has startedin recognition of the urgent need to slow the rateat which water is pumped. This debate intensifiesin drought years when groundwater pumpingdepths often fall precipitously, spurring debateabout the future of the resource.
In addition to legal issues, a key policy issueis to define the level and scale of interventions fordifferent sets of management actions – forexample, do they need to be implemented at avillage, regional or state scale and can they beimplemented by organizations at these levels.Because demand management depends onchanges in water use by individual farmers, localmanagement approaches may be the mostappropriate for addressing certain sets ofneeds. The political sensitivity of regulatoryapproaches and legal or other institutionalchanges also points toward the need for thedevelopment of participatory, local approaches tomanagement. What these local managementoptions might be has not, however, ever beensystematically investigated.
Research in the Northern Shekhawati Basin
information on the Shekhawati Basin as a wholeand on choosing field study sites in thenortheastern area of the basin, that is, the areasof the Kantli, Krishnawati and Dohan sub-basins(see Figures 4 and 5). Six villages were selectedbased on depth to groundwater. The villages of

L O C A L S T R A T E G I E S F O R W A T E R M A N A G E M E N T A N D C O N S E R V A T I O N
269
A J E E T P U R AJHUNJHUNU
Kantli Sub-basin
Dohan Sub-basin
SUKLI NADI
CHHEU
KHATKAR
Nawal GarhSub-basin
DOKEN
GUMANPURA KIDHANI
Ranoli Sub-basin
SOBAWATI
RIV
ER
Sabi basin
KRIS
HN
AWAT
I RIV
ER
DOHAN RIVER
Out
side
Bas
in
SIKAR
KA
NT
LI R
IVE
R
Minor Project
NEEM-KA-THANA
KHETRI
Basin BoundaryState BoundaryRivers
HARYANA
Study Village
Ajeetpura and Doken, located within the Kantli andKrishnawati sub-basins respectively, were chosenfor the current field study. The remaining villagesto be studied are also in the Kantli sub-basin.
This study was planned to represent an aridagro-climatic region. Of the 14 administrativelydefined “river basins” in the state, only theShekhawati is classified as having arid conditions(the western portion of the state falls in the aridzone but is not officially classified as being partof a river basin). Figures 1, 4 and 5 show thelocations of the river basins in Rajasthan, andfeatures of the whole and then the upperShekhawati Basin.
Low annual rainfall makes groundwater themajor water source in this basin. With depth towater being a major factor determining access,differences in the depth to groundwater across thebasin were taken as the basis of the selection ofvillages for the detailed study. In order to identifypossible study sites, a hydrological map of thestudy area was super-imposed on the basin mapto delineate areas with different depths togroundwater and categorized as: depth less than10 m, 10-20 m, 20-30 m, 30-40 m and 40-50 m.One village from each one of these categories wasrandomly selected for detailed study. Results ofonly two village studies are reported below. Thefirst of the randomly selected villages, Doken, inthe Krishnawati sub-basin, lies in the “less than10 m” belt. The second village, Ajeetpura, in theKantli sub-basin, is in the 40-50 m belt, the deepestzone in the Shekhawati Basin. Figure 6 showsdepth to groundwater in the Upper ShekhawatiBasin and the location of the two study villages.Studies are ongoing in the other selected villagesthat are identified in Figure 4.
Depth to
groundwaterdetermines
access.
For selected villages a list of households wasprepared. Sixty-five households from Doken and45 from Ajeetpura were randomly selected for adetailed survey. A village and householdquestionnaire was prepared for a one-time survey.For analysis of data the sample households werepost stratified on the basis of size of land ownedand size of family. Aside from the individualhousehold survey, group discussions and villagemeetings were organized to understand theperceptions of the people on the emerging waterproblems and their solutions.
�N
Figure 5:Upper Shekhawati Basin showing sub-basins study villages andirrigation projects.

L O C A L S T R A T E G I E S F O R W A T E R M A N A G E M E N T A N D C O N S E R V A T I O N
270
Basin BoundaryState BoundaryRivers
0 - 10 m
10 - 20 m
20 - 30 m
30 - 40 m
40 - 50 m
JHUNJHUNU
SIKAR
Source: Ground Water Development Government of Rajasthan, 1997.
DOKEN
KHETRI
NEEM-KA-THANA
AJEETPURA
HARYANA
Figure 6:Depth to groundwater in the upper Shekhawati Basin.
In theShekhawati
Basin, ninety-two per cent ofrainfall occurs
in the monsoon.
Physical characteristics of thebasin
Climate
The Shekhawati Basin falls within the EastRajasthan subdivision defined by the IndiaMeteorological Department. The year may bedivided into four seasons: The winter season lastsfrom mid November to the beginning of March,the summer season from March to June, themonsoon season from July to mid September andthe post monsoon season from the latter half ofSeptember to mid November.
The summer season between March and Juneis marked by a continuous increase intemperature. June is the hottest month of the yearwith a mean daily maximum and minimumtemperature of 40.6o C and 27.3o C respectively.January is the coldest month, with meanmaximum temperature of 22.2o C and a minimumof 4.1o C.
Relative humidity during the southwestmonsoon season is generally high. During therest of the year, the air is normally dry. Therelative humidity during summer afternoons candrop to 15 to 20 per cent. The mean annualhumidity values are 58% in the morning and 35%in the evening.
The mean annual rainfall over the basin is 476mm, of which about 92 per cent falls during themonths of June to September. July and August arethe wettest months. The coefficient of variationof the annual total rainfall is 11.9 per cent.
Geography
The Shekhawati Basin is an administrativelydefined unit consisting of several sub-basins thathave been clustered by the Government ofRajasthan for administrative purposes. Only theupper portions of the Krishnawati and Dohan riversare located within the Rajasthan portion of theShekhawati Basin, as both rivers cross intoHaryana State. The Shekhawati Basin extends overparts of Churu, Jhunjhunu, Sikar, Jaipur, Nagaurand Ajmer districts. It is divided into an upper andlower basin as shown in Figure 4. The total areaof the basin is 11,522 km2. The northern part,which includes the Kantli, Krishnawati and Dohan
�N

L O C A L S T R A T E G I E S F O R W A T E R M A N A G E M E N T A N D C O N S E R V A T I O N
271
Basin Boundary
Quartzites, Felspathic, etc.
Granites, Pegmatities, etc.
Wind Blown and Alluvial Sand
GroundwaterTable Contour
AJEETPURA
KHETRI
DOKEN
NEEM-KA-THANA
300
350
300
350
400
400
The landscapeis composed
mostly ofmonotonous
sandy plains.
rivers covers an area of 4,495 km2. The Kantli isthe biggest among these rivers originating fromthe centre of the Shekhawati Basin and drainingtowards the north where it vanishes in the TharDesert. The southern portion is an inlanddrainage basin covering 7,027 km2, whose mainriver is the Mendha, which flows to the southwestinto the Sambhar Salt Lake. Orographically, asmall, most eastern portion of the basin is markedby hilly terrain belonging to the Aravalli chain.The northeastern part of the area is fairly flat, butinterspersed with moderately elevated hills.West of this area there are fairly flat valleys alongthe Kantli and Mendha rivers and the tributariesof the latter. The entire western and southernportion of the basin is an extensive alluvial plainsloping gently towards the island drainage area ofthe Thar Desert.
The Kantli River originates in the hillssouth and southwest of Guhala village in SikarDistrict (27o44': 75o32'), flows north throughSikar and Jhunjhunu districts and finallydisappears in the sand dunes near Naurangpuravillage in Churu district (28o22’30": 75o27’30")after flowing a distance of about 134 km.The Dohan River, to the east of the Kantli,rises near Mandoli (27o46’30": 75o48') in thewestern slopes of the Dohan Protected Forest(PF) and flows to the northeast, eventuallydisappearing in the sand dunes of Haryana. TheKrishnawati River, which is directly south of theDohan and east of the Kantli, originates inthe hills of Sikar district, flows northeast forabout 42 km in Rajasthan and subsequentlydisappears in the sand dunes of Haryananear Dilpur village. The drainage pattern isessentially dendritic.
Geology and Landforms
The geological formations in the basin aremostly covered by a thick blanket of wind blownsands and sand dunes, leaving few outcrops in thearea (Figure 7 shows the geology of the sub-basinsthis study is focused on). Isoclinal antiforms andsynforms are, however, present in the rocky strataexposed in the hills. There are three distinct typesof landforms in the basin: hills, dun valleys andsandy plains with sand dunes. The majority of thebasin is comprised of a monotonous sandy plainbroken only by sand dunes that are aligned east-northeast to west-southwest.
�N
Figure 7:Geological map of the upper Shekhawati Basin showingreduced groundwater levels.

L O C A L S T R A T E G I E S F O R W A T E R M A N A G E M E N T A N D C O N S E R V A T I O N
272
Theperformance ofsimilar aquifers
differssignificantlyfrom one
location toanother.
Except for the Khetri hills, whose western slopesconstitute the catchment of the Kantli River, allthe hill ranges lie in the catchment of the Dohanand Krishnawati rivers. These are offshoots of theAravalli range and occur as narrow, elongated anddiscontinuous hill ranges, broadly parallel to eachother. Prominent hill features in the basin arethe Khetri Protected Forest (PF) hills, reaching amaximum elevation of about 790 metres, theGanwari PF hills, with their highest point at 846m, and the Gadrata PF hills. These are allstructural hills, with their axes running northeast-southwest to north-south, similar to the regionalAravalli strike in the area. There are also isolatedremnant hills in the same alignment as theAravallis, standing out here and thereas monadnoks.
The dun valleys are narrow, strike andanticlinal or synclinal that separate the varioushill ranges. They are erosional (and tectonic) inorigin and filled, for the most part, with riveralluvium. Pediment zones and scree deposits arealso likely to occur here.
Hydrogeology
As previously noted, the drainage of theShekhawati Basin can be separated into a northernand a southern zone. These zones appear to bedefined by a dome shaped hump at the centre ofthe basin that also forms the water divide. Thesurface and sub-surface flows from the Kantli,Krishnawati and Dohan sub-basins are drainingin three different directions. The boundariesbetween the three sub-basins are to all intents andpurposes groundwater divides assumed to havebeen formed parallel to the surface water divides.As a result, the “Shekhawati Basin” is more a
combination of hydrological units that have beencombined for administrative and analyticalpurposes by the government.
Two types of aquifers can be classified on thebasis of the lithology of the basin: alluvium orunconsolidated sediments and the hard rock areas(areas of consolidated rocks). Their distributionin the northern sub-basins can be seen on Figure7. More than 80% of the entire basin is covered byunconsolidated sediments in the form of wind-borne sands, sand dunes and fluvial deposits, thatis pebbles, gravel, sand (of various grades), silt,clay, kankar and even hard pan and talusmaterial. Groundwater in these areas occurs underwater table to semi-confined to locally confinedconditions. The hard rock areas, on the otherhand, contain either quartzites or schists, granitesand gneisses. The quartzites occur disconnectedlyas outcrops or in topographic lows where thesediments are thin. They are hard and compactrocks, in which groundwater is very limited andare located in Neem Ka Thana in Sikar districtand in Khetri in Jhunjhunu district. The schists,granites and gneisses occur as a part of the DelhiSuper-group of rocks in Jhunjhunu district. Wherethe schists occur, they are poorly jointed, but, beingsoft, are often weathered down to a depth of 30metres. The granites and gneisses are usuallyhard, massive and poorly jointed with acomparatively thin zone of weathering.Groundwater occurs mostly in the thin weatheredzone under unconfined conditions, but the aquifersare generally poor, capable of exploitation onlylocally and selectively.
The performance of the same general type ofaquifer may differ significantly from area to areadepending, for example, on the thickness and

L O C A L S T R A T E G I E S F O R W A T E R M A N A G E M E N T A N D C O N S E R V A T I O N
273
While waterharvesting
structures have
helped to raisethe water table,
they may reduce
river flow.
composition of alluvium or the degree ofconsolidation in the hard rocks, (that is, thepresence, extent and type of fractures, joints, anddegree of weathering). For example, in the Jaipurarea the alluvium is about 60 metres thick. Inthe Sikar District it is about 30 to 80 metres thick,with the saturated sediment thickness varying from10 to 50 metres, and in the Jhunjhunu area it isabout 53 metres thick, with only a thin veneer inplaces where there are rock outcrops. Thesaturated aquifer thickness in the Jhunjhunu arearanges from 8 to 28 metres.
The available groundwater contour mapsproduced by the Rajasthan GroundwaterDepartment show the depth to water table, flowdirections and groundwater table gradient. Theyindicate that depths to the SWL within the basinrange from 10 to 43 metres. However, shallowerSWL depths, reaching almost ground surface (1to 2 m), have been recorded in exploratoryboreholes drilled to the semi-confined alluvial andBilara limestone aquifers.
Surface Water Resources
There are 60 minor and one medium irrigationprojects in the Shekhawati Basin with a catchmentarea of 97 and 910 km2 respectively and a livestorage of 8 and 46 million cubic metresrespectively. These surface water supplies havebeen reserved exclusively for irrigation purposes,unlike some cases in which such surface watersupplies are diverted to meet urban, industrial ordomestic water requirements. On one hand, theminor water harvesting structures have helped toraise (or diminish the decline) of the water tablein the adjoining areas/villages. On the other hand,however, they have had a negative impact on the
flow of the Krishnawati and Kantli rivers, resultingin declines in the water table at the tail end of theriver. Figure 5 shows the sites of minor andmedium irrigation projects in the upperShekhawati Basin.
Groundwater Resources
Groundwater in the Shekhawati Basin inshallow water table aquifers is tapped by open dugand dug-cum-borewells located mostly in thealluvium but also present in the hard rock areas.The depths of wells vary from 35 to 50 metres inSikar district to 55 metres or more in Jhunjhunudistrict. Groundwater in these wells is under watertable conditions, except in the case of dug-cum-borewells, where the deeper aquifer under pressuremay also have been tapped. The variation inaverage yields obtained from such wells varieswidely, ranging anywhere from 50 to 600 cubicmetres a day depending upon the type of aquifer.
In the case of deep semi-confined and confinedaquifers groundwater is tapped by deep tubewells.Large numbers of such tubewells have beeninstalled during the last 10 years, particularly inSikar and Jhunjhunu districts. The transmissivityof the aquifer in these parts of the basin variesfrom 122 m2/day to 420 m2/day and the reportedspecific yield (storativity) value, that is, water tablecondition, ranges from 6 per cent to 39 per cent.
The groundwater quality within the basin isgenerally high, at times even excellent. Water ofthe highest quality is found in the Kantli sub-basinboth based on electrical conductivity and potabilitycriteria. However, due to over-extraction ofgroundwater in the extreme downstream portionof Kantli sub-basin salinity has increased.

L O C A L S T R A T E G I E S F O R W A T E R M A N A G E M E N T A N D C O N S E R V A T I O N
274
Srimadhopur 7,912 1,926 9,838 9,975 1,682 11,657 12,450 2,150 14,600
Neem ka Thana 4,826 1,477 6,303 5,292 1,613 6,905 6,170 2,210 8,380
Jhunjhunu 1,186 1,804 2,990 3,015 357 3,372 4,072 819 4,891
Chirawa 2,197 1,289 3,486 4,580 0 4,580 7,770 30 7,800
Khetri 3,561 1,318 4,879 4,882 1,208 6,090 5,574 1,815 7,389
Udaipurwati 5,456 1,568 7,024 7,502 1,493 8,995 10,052 1,735 11,787
Basin Total 25,138 9,382 34,520 35,246 6,353 41,599 46,088 8,759 54,847
1980 1985 1993
Tehsils In Use Out Total In Use Out Total In Use Out Totalof Use Wells of Use Wells of Use Wells
Base flow is animportantcomponent in
the basin waterbalance.
Unpublished studies conducted by TahalConsultants based on information supplied by theGroundwater and Irrigation Departments indicatethat groundwater outflow from the basin issignificant. This is mainly due to the fairly hightransmissivity of around 1,000 to 1,500 m2/day inthe downstream stretches of the aquifers. Outflowfrom the Kantli sub-basin, the largest of the threesub-basins, is about 5 to 10 cubic metres a year.From the Krishnawati sub-basin, on the otherhand, it is 10 to 20 cubic metres a year.
Prior to groundwater extraction the entireannual groundwater output, amounting to about100 cubic metres a year (1988-1992 average), leftthe basin. Although the relatively hightransmissivity of the alluvial aquifer in the Kantlisub-basin presumably allowed a significantlyhigher flow in a slightly steeper gradient thanthose existing after groundwater mining and waterlevel decline. It is believed that outflow by meansof base flow after the rainy season used to be animportant component.
Aquifer Yield
About 77 per cent of the Shekhawati Basin isoccupied by groundwater potential zones (regionsidentified by the groundwater department ashaving significant resources available forexploitation). The remaining area constitutes non-potential zones mainly located in the post-Delhiintrusive and Alwar group quartzites made upprimarily of hill ranges and reserved forests. Theaverage natural recharge in the basin amounts to66 Mm3/year. Higher levels of rainfall over thelast four years have, however, generated a higherrecharge rate of around 133 Mm3/year. Thepresent groundwater draft is about 270 Mm3/yearwith an overdraft/over exploitation of about 175Mm3/year. As a result, despite the recent higherlevels of recharge, groundwater withdrawal in thebasin has already exceeded the safe yield, andgroundwater mining is taking place. Table 4indicates the number of wells in the basin andshows the dramatic increase in extractionoccurring over the last decade.
TABLE 4:Number of Wells in the Shekhawati Basin, (1980, 1985 and 1993).
Source: Government of Rajasthan (1995) and Agriculture in Rajasthan, A Statistical Handbook, Jaipur, Government of Rajasthan.

L O C A L S T R A T E G I E S F O R W A T E R M A N A G E M E N T A N D C O N S E R V A T I O N
275
As the watertable declined,
water saving
technologieswere adoptedand land use
and croppingpattern changes
occurred.
Basin Groundwater Use andAgriculture
The population of the basin is growing fast. Itwas 1.31 million in 1971 and had reached 2.24million in 1991. The population density changedfrom 155 to 264 per km2 in the same period.
In the Shekhawati Basin there has been astrong tradition of groundwater irrigation. Thespread of energized pumping technologies in theearly eighties has enabled a rapid increase indemand for irrigation water leading to fastdepletion of groundwater. At first, when the pumpswere introduced, farmers tried to increase the areaunder irrigation. However, as the water table wentdown water saving measures, such as shifting landuse/cropping patterns, became common and watersaving technologies were adopted.
The land use pattern in the Shekhawati Basinas a whole is shown in Table 5 for 3 points intime, 1980, 1990 and 1997. The basin has recorded
an increase of about 19,000 hectares in netarea sown and an increase of about 93,000hectares in area sown more than once. As aresult the total cropped area shows an impressiveincrease of 16 per cent. The increase has resultedfrom a reduction in fallow lands and grazinglands. Furthermore, uncultivable wasteland alsoshows a decline from over 60,000 hectares toless than 30,000 hectares during this period.On the other hand, the area under forests, inthe form of enclosures of forest lands andplantations, has almost doubled because ofafforestation efforts.
The changes in cropped area are reflected inchanges in the cropping pattern (Table 6). This isparticularly so for irrigated crops. It can be seenin Table 7 that the increase in irrigated areabetween 1980 and 1990 is almost 100 per cent.Between 1990 and 1997 there is a further increaseof 30 per cent. This change implies more than adoubling of irrigated area from about 83,000hectares in 1980 to 209,000 hectares in 1997.
YEAR1980 % 1990 % 1997 %
Geographical area (hectares) 849,289 100.00 849,369 100.00 849,369 100.00
Forest 40,197 4.73 73,401 8.64 79,340 9.34
Non-agri. use 25,147 2.96 29,267 3.45 31,152 3.67
Uncultivable waste 60,342 7.11 34,325 4.04 29,217 3.44
Grazing and pasture land 62,792 7.39 57,482 6.77 55,950 6.59
Tree crop 119 0.01 190 0.02 195 0.02
Barren and cultivable waste 15,088 1.78 13,250 1.56 13,442 1.58
Other fallow 25,625 3.02 23,537 2.77 26,562 3.13
Current fallow 53,799 6.33 36,090 4.25 28,775 3.39
Net area sown 566,280 66.68 581,927 68.51 584,736 68.84
Area sown more than once 106,647 186,660 199,511
Total cropped area 672,927 768,787 784,247
Source: Agricultural Statistics Reports for Different Years, Directorate of Economics and Statistics,Government of Rajasthan.
TABLE 5:Land Use Pattern in the Shekhawati Basin (Area in hectare)

L O C A L S T R A T E G I E S F O R W A T E R M A N A G E M E N T A N D C O N S E R V A T I O N
276
Area % Area % Area %
Bajra 248,036 36.86 343,281 44.65 315,359 40.22
Guwar 54,515 8.10 108,607 14.13 106,069 13.53
Juar 3,016 0.45 55 0.01 30 00.0
Wheat 39,641 5.89 45,187 5.88 647,06 8.25
Barley 19,526 2.90 8,810 1.15 111,67 1.42
Gram 76,147 11.32 74,592 9.70 727,44 9.28
Other Pulses 166,803 24.79 91,685 11.93 84,111 10.74
Mustard 5,230 0.78 41,211 5.36 106,453 13.57
Other Oilseeds 2,086 0.31 2,330 0.30 3,402 0.43
Spices 3,461 0.51 5,990 0.78 5,716 0.73
Fruit and Veg. 1,281 0.19 3,439 0.45 2,893 0.37
Others 53,185 7.90 43,600 5.67 11,597 1.48
TOTAL 672,927 100.0 768,787 100.0 784,247 100.0
YEAR Crops 1980 1990 1997
Major shifts incrops haveoccurred with
oilseedsincreasinggreatly.
TABLE 6:Cropping Pattern Changes in the Shekhawati Basin (Area in Hectare)
Area % Area % Area %
Bajra 1,879 2.3 12,268 7.7 3,184 1.5
Wheat 33,949 41.0 50,986 32.0 68,226 32.7
Barley 19,677 23.8 13,169 8.3 10,986 5.3
Gram 5,002 6.0 16,994 10.7 24,360 11.7
Other Pulses 892 1.1 359 0.2 515 0.2
Spices 3,984 4.8 5,722 3.6 5,714 2.7
Fruit and Veg. 1,149 1.4 3,058 1.9 2,841 1.4
Mustard 579 0.7 40,991 25.7 86,568 41.5
Other Oilseeds 352 0.4 1,978 1.3 1,072 0.5
Others 15,248 18.4 13,693 8.6 5,361 2.6
TOTAL 82,711 100.0 159,218 100.0 208,827 100.2
YEARCrops 1980 1990 1997
(Area in Hectare)
Source: Agricultural Statistics Reports for Different Years, Directorate of Economics and Statistics, Government of Rajasthan.
TABLE 7:Area Changes of Irrigated Crops in the Shekhawati Basin
Source: Agricultural Statistics Reports for Different Years, Directorate of Economics and Statistics, Government of Rajasthan.

L O C A L S T R A T E G I E S F O R W A T E R M A N A G E M E N T A N D C O N S E R V A T I O N
277
Village Field Study
In Doken, thewater table hasdeclined by 10
to 14 metresover the last five
decades.
The Sample Villages
Doken is located in a valley and is characterizedby dispersed settlement and diverse caste
composition. Different ethnic and caste groupshave organized in the form of hamlets and livenear their land resources. There are a total of489 households in addition to a school, post-office,and public health centre. The total population ofthe village as per the 1991 census was 3,473. Thevillage is electrified having 80 domesticconnections. Water availability is highly dependenton rainfall. The water table has declined by 10 to14 metres in the last 50 years. During the lastthree years, however, the water table has risenbecause of more than average rainfall. In totalthere are 200 wells of which 150 are fitted withdiesel pumps. Also there are three traditional waterharnessing structures and one minor project torecharge the groundwater. Wheat, mustard, and
gram are the main irrigated crops grown in thevillage. The water management pattern andutilization is affected largely by the location,habitation and land use pattern of the village.
Ajeetpura, located in the Kantli Riversub-basin, has 160 households with a totalpopulation of 1,015. As in Doken, people owningwells have started settling on their agriculturalland. There is a higher secondary school, but nopublic health services. The village was electrifiedin 1969 and most households have domesticconnections. The village has a ground levelreservoir with stand post and domestic waterconnections. In total there are 50 dug-cum-borewells, all electrified and all fitted with sprinklersets for irrigation. The water table has declinedfrom 6 to 50 metres in the last 50 years.Wheat and mustard are the main irrigated cropsof the village.
The most dramatic increase is in area underoilseeds, that is, mustard and rapeseed. Theincrease is from a negligible area in 1980 to closeto 87,000 hectares in 1997. There was more thana doubling of area under oilseeds between 1990and 1997. Oilseeds are grown now on more than40 per cent of the irrigated area. The nextimportant crop is wheat, accounting for about one-third of the irrigated area. The increase in areaunder irrigated wheat is from 34,000 hectares in1980 to more than 68,000 hectares in 1997. Thisis a doubling in 17 years, which implies acompound growth rate of more than 4 per centper annum. Gram in winter is next in importance.
The cropping pattern overall doesn’tcapture the changes as dramatically as thecropping pattern changes of irrigated crops.Overall, the kharif crops of bajra (millet) andguwar constituted 54 per cent of the totalcultivated area (Table 6). The area under pulseshas declined, while the area under oilseeds hasincreased from 1 per cent to about 14 per cent ofthe total. The other important shift is the areaunder barley, the traditional irrigated crop of thearea, to wheat and mustard crops. This shift hasdirect bearing on the use of groundwater, aswheat is a relatively higher water consuming cropthan barley.

L O C A L S T R A T E G I E S F O R W A T E R M A N A G E M E N T A N D C O N S E R V A T I O N
278
Groundwater is the major source of water fordomestic purposes and irrigation. The focus
of this study is confined to these two uses. It isimportant to recognize that access to groundwateris heavily influenced by land ownership. In Doken70% of the households own 30% of the land, whilein Ajeetpura 45% of the households of the smallerholdings cultivate only 18 per cent of total land.This indicates a more skewed distribution in therelatively dry village. This difference should bekept in mind when evaluating comparisonsbetween the villages.
Domestic
In order to estimate domestic consumption,respondents were asked to estimate how many, andwhich sized vessels they use during both the winterand summer. In the absence of running waterthe capacity of these vessels and the frequency ofstorage in the household gives a broad and validestimate of the quantity of water use. Nevertheless,there are a few problems in estimation when wateris directly used for activities like bathing andwashing near a well or a storage tank on the field.In this case, the estimates can only beapproximate. In any case, when water is availableon field the primary use is for irrigation. Thequantity used for washing and bathing is of noconcern to the household.
DataData collected in the survey indicate water use
is more or less the same in the two villages andin different family size categories. The maindifference in both villages is that the smallest
family size category shows higher per capita usefor drinking in both the seasons than the largerfamily size category. In all cases, the summerrequirement is almost double of that in winter.
The total water consumption in both thevillages is much less – almost half – than theWHO prescribed norms. Further, as a result of thesettlement and habitation pattern in Ajeetpura, thedrier village, the consumption of water is morethan the reported consumption in the Doken,village with the higher water table. This is theresult of the assured Public Health EngineeringDepartment (PHED) supply in the village.
The respondents were asked questions aboutwho shares the responsibility of fetching waterfrom the available source. As is expected, thewomen and girls perform these chores (Table 8).Men reportedly fetch water occasionally but at least56 per cent of the men reported that they neverdo the work. Younger members of the familyoccasionally participate in this activity and in thiscase there appears to be less gender bias.
The sources of water for domestic use areshown in Table 9. This shows that wells are themajor sources of domestic water supply in bothvillages. Depending on family size, wells accountfor 60% to 92% of Doken’s sources for all domesticuses and between 50% and 67% of sources for alldomestic uses in Ajeetpura. Aside from the similarimportance of wells in both villages, the othersources of water in the two villages are quitedifferent. Whereas 8% to 40% of respondents inDoken have a hand pump as a source of water,
Access togroundwater isheavily
influenced byland ownership.
Results: Use of Water

L O C A L S T R A T E G I E S F O R W A T E R M A N A G E M E N T A N D C O N S E R V A T I O N
279
Well Hand pump Tank Well Tap
DRINKING WATER
0 - 3 80 20 0 50 50
4 - 5 68 32 0 57 43
6 - 8 71 29 0 61 39
9 and above 85 15 0 67 33
Overall 74 26 0 60 40
COOKING & CLEANING
0 - 3 80 20 0 50 50
4 - 5 68 32 0 57 43
6 - 8 71 29 0 61 39
9 and above 85 15 0 67 33
Overall 74 26 0 60 40
BATHING
0 - 3 60 20 20 50 50
4 - 5 68 32 0 57 43
6 - 8 64 25 11 61 39
9 and above 92 8 0 67 33
Overall 71 23 6 60 40
WASHING CLOTHES
0 - 3 60 20 20 50 50
4 - 5 68 21 11 57 43
6 - 8 64 21 14 61 39
9 and above 92 8 0 67 33
Overall 71 18 11 60 40
ANIMALS
0 - 3 60 20 20 67 33
4 - 5 79 5 16 58 42
6 - 8 57 11 32 67 33
9 and above 54 8 38 67 33
Overall 63 9 28 64 36
Family Size Class Doken AjeetpuraGenerally Sometimes Never
DOKEN (65 respondents)
Adult male 6.2 36.9 56.9
Adult female 83.1 6.2 10.8
Young boys 4.6 35.4 60.0
Young girls 4.6 9.2 86.2
All members 0.0 4.6 95.4
AJEETPURA(45 respondents)
Adult male 0.0 44.4 55.6
Adult female 82.2 2.2 15.6
Young boys 6.7 15.6 77.8
Young girls 0.0 4.4 95.6
All members 4.4 20.0 75.6
COMBINED (110 respondents)
Adult male 3.6 40.0 56.4
Adult female 82.7 4.5 12.7
Young boys 5.5 27.3 67.3
Young girls 2.7 7.3 90.0
All members 1.8 10.9 87.3
Percentage
TABLE 8:Who Fetches Water in a Household
TABLE 9:Domestic Water Sources in Sample Villages (Figures in per cent)
33% to 50% of Ajeetpura’s households have accessto PHED water supply in the form of running tapwater supplied by standpost. There are also a fewhouse connections.
In general, in this region, tank and local waterbodies are used either for animals or for washing.Being an arid zone, the number of such waterbodies is limited. In Ajeetpura, for example, thissource is not available. In this village, water forbathing comes exclusively from tap and well water.
In response to a question as to what is regardedas the best source of water for domestic use, seventyper cent preferred well water (Table 10). This wasso even where tap water is available. No onereported that the traditional sources of water, such
as village ponds are desirable. This indicatesawareness of quality of water and also of thedrudgery involved in the daily fetching of water.
Table 11 shows whether the source is privatelyowned or not. Almost 60 per cent of therequirements in the two villages are met from
Dug wellcontinue to be amajor source of
drinking water.

L O C A L S T R A T E G I E S F O R W A T E R M A N A G E M E N T A N D C O N S E R V A T I O N
280
private sources and one third from governmentsources. The rest comes from sources that areheld by the community, such as hand pumps orthe village water body.
Table 12 shows the distribution of householdsby distance from the source. Fourteen to fifteenper cent had the source within the household.Forty per cent had to fetch water from a sourcemore than 100 metres away. It is presumed thatmore distance means more drudgery and therefore,the tendency to reduce wastage of water.
An attempt was made to estimate costs incurredin the supply of domestic water. This cost couldbe related to payments for access to water sourcesowned by outsiders or it could be for sourcemaintenance (such as repair of pumpsets).Transport and storage costs are also part of theoverall domestic water supply cost structure. Table13 shows the amounts spent. It can be seen thatnone of the households report spending for use ofwater or for carriage of water. They do, however,contribute to and incur costs for maintenance ofthe water sources. This amount is less than Rs 80per household per annum. Water storage structures(cisterns) are found in Ajeetpura but are relativelyuncommon. The amount spent on them isrelatively small – an investment of about Rs 650per household annually.
Table 14 reports responses regarding howvillagers adjust to the problem of water shortage.No respondents support recycling of water. Theydo, however, favour widespread use of otherstrategies for economizing on water use, such ascleaning cooking utensils without water andreducing the frequency of bathing. We attemptedto rank these strategies according to villagerpreferences. Recycling was the last preference,whereas reducing bathing and washing was givenhigh rank by most of the respondents.
Drinking Water Management System inAjeetpura
The water management system described aboveis representative of the existing system in mostRajasthan villages. Before state intervention in the1960’s most of the drinking water needs were metby dug wells, bawri (step well), talab (smallpond) and tanka (cistern), which were mostly
Family Size Class No. of HH Well Tap Hand Pump
DOKEN0 - 3 5 4 0 1
(80%) (20%)4 - 5 19 13 0 6
(68%) (32%)6 - 8 28 22 0 6
(79%) (21%)9 and above 13 10 0 3
(77%) (23%)Overall 65 49 0 16
(75%) (24%)AJEETPURA0 - 3 4 3 1 0
(75%) (25%)4 -5 14 8 6 0
(57%) (42%)6 - 8 18 11 7 0
(61%) (39%)9 and above 9 6 3 0
(67%) (33%)Overall 45 28 17 0
(65%) (35%)COMBINED0 - 3 9 7 1 1
(78%) (11%) (11%)4 -5 33 21 6 6
(64%) (18%) (18%)6 - 8 46 33 7 6
(72%) (15%) (13%)9 and above 22 16 3 3
(73%) (14%) (14%)Overall 110 77 17 16
(70%) (16%) (14%)
Private sources
also fulfilldrinking waterneeds.
TABLE 10:Perception About Best Source of Domestic Water

L O C A L S T R A T E G I E S F O R W A T E R M A N A G E M E N T A N D C O N S E R V A T I O N
281
TABLE 11:Access to Domestic Water by Ownership of Source in Sample Villages (Number ofHouseholds).
Private Govt. Comm- Total Private Govt. Comm- Total Private Govt. Comm- Totalunity unity unity
DRINKING WATER0 - 3 4 1 0 5 2 2 0 4 6 3 0 94 - 5 11 6 2 19 8 6 0 14 19 12 2 336 - 8 15 7 6 28 11 5 2 18 26 12 8 469 and above 7 2 4 13 6 2 1 9 13 4 5 22Overall 37 16 12 65 27 15 3 45 64 31 15 110COOKING & CLEANING0 - 3 4 1 0 5 2 2 0 4 6 3 0 94 - 5 11 6 2 19 8 6 0 14 19 12 2 336 - 8 15 7 6 28 11 5 2 18 26 12 8 469 and above 7 2 4 13 5 2 2 9 12 4 6 22Overall 37 16 12 65 26 15 4 45 63 31 16 110BATHING0 - 3 3 1 1 5 2 2 0 4 5 3 1 94 - 5 11 6 2 19 8 6 0 14 19 12 2 336 - 8 15 7 6 28 10 6 2 18 25 13 8 469 and above 8 1 4 13 5 2 2 9 13 3 6 22Overall 37 15 13 65 25 16 4 45 62 31 17 110WASHING CLOTHES0 - 3 3 1 1 5 2 2 0 4 5 3 1 94 - 5 11 6 2 19 8 6 0 14 19 12 2 336 - 8 15 7 6 28 10 6 2 18 25 13 8 469 and above 8 1 4 13 5 2 2 9 13 3 6 22Overall 37 15 13 65 25 16 4 45 62 31 17 110ANIMALS0 - 3 3 1 1 5 2 2 0 4 5 3 1 94 - 5 11 6 2 19 8 6 0 14 19 12 2 336 - 8 15 7 6 28 10 6 2 18 25 13 8 469 and above 8 1 4 13 5 2 2 9 13 3 6 22Overall 37 15 13 65 25 16 4 45 62 31 17 110
Family Size Class Doken Ajeetpura Combined
community owned and managed. Generalshortage of drinking water was a phenomenon dueto significant seasonal and yearly variations insupply and unequal access both in terms ofdistance and also because of problems arising outof caste and class dynamics in villages.Nonetheless, on the whole, the communityparticipated in creating, running and maintaining
the traditional drinking water sources in spite ofsuch impediments. The situation changeddramatically after the government intervened toaugment the drinking water supply and improveaccessibility to all sections of the society andscattered settlements by digging new wells (mostlytubewells), building hand pumps and constructingground level reservoirs in problem villages. This
Historicallymost drinking
water needs
were metthrough
traditional
systems. Thesehave now been
replaced by
state fundedwater supplysystems. This
has resulted inmajor changes
in consumption
patterns.

L O C A L S T R A T E G I E S F O R W A T E R M A N A G E M E N T A N D C O N S E R V A T I O N
282
Social,economic andpolitical factors
have affectedsupply options.
Within 0-50m 50-100m >100m Within 0-50m 50-100m >100 mHouse House
DRINKING WATER
0 - 3 20 20 20 40 25 25 50 0
4 - 5 0 16 21 63 14 36 21 29
6 - 8 4 14 32 50 44 17 17 22
9 and above 8 23 38 31 11 22 22 44
Overall 5 17 29 49 27 24 22 27
COOKING & CLEANING
0 - 3 20 20 20 40 25 25 50 0
4 - 5 0 16 21 63 14 36 21 29
6 - 8 4 14 36 46 44 17 17 22
9 and above 8 23 38 31 22 22 11 44
Overall 5 17 31 48 29 24 20 27
BATHING
0 - 3 20 20 20 40 25 25 50 0
4 - 5 0 16 21 63 14 36 21 29
6 - 8 4 11 32 54 44 17 17 22
9 and above 8 23 31 38 22 22 11 44
Overall 5 15 28 52 29 24 20 27
WASHING CLOTHES
0 - 3 20 20 20 40 25 25 50 0
4 - 5 0 16 21 63 14 36 21 29
6 - 8 4 7 29 61 44 17 17 22
9 and above 8 23 31 38 22 22 11 44
Overall 5 14 26 55 29 24 20 27
ANIMALS
0 - 3 20 20 20 40 25 25 50 0
4 - 5 0 16 21 63 14 36 21 29
6 - 8 4 7 29 61 39 17 22 22
9 and above 8 23 31 38 22 22 11 44
Overall 5 14 26 55 27 24 22 27
Family Size Class Doken (65 responses) Ajeetpura (45 responses)
TABLE 12:Distribution of Sample Household by Distance of Domestic Water Source (per cent)
mission was quite successful, but resulted in lesscommunity participation. Aside from the effect ofgovernment intervention, there were other social,economic and political reasons for thedisintegration of village communities. Forexample, private profit motives started dominatingover community interests. Nonetheless, there is
still a good deal of community participation ascan be seen in case of Ajeetpura village.
Traditionally the drinking/domestic water needsof the people of Ajeetpura were met by two wellsknown as Ghasi Ram’s well and ChoudharyNarayan Ram’s well. Water used to be lifted by

L O C A L S T R A T E G I E S F O R W A T E R M A N A G E M E N T A N D C O N S E R V A T I O N
283
Family Size Class Maintenance of Structure forDomestic Water Source Storage of Water
DOKEN
0 - 3 6 0
4 -5 183 21
6 - 8 10 5
9 and above 47 6
Overall 68 9
AJEETPURA
0 - 3 5 0
4 -5 79 357
6 - 8 96 372
9 and above 72 1,890
Overall 80 646
COMBINED
0 - 3 6 0
4 -5 139 164
6 - 8 46 157
9 and above 57 777
Overall 73 270
TABLE 13:Average Annual Amount Spent for Procurement of Domestic Water(Rs)
human and animal power. With this system peoplelower in the caste hierarchy naturally facedproblems, as they were not allowed to fetch waterthemselves. The drinking water for animals wasprovided for by a small open water tank near thewell. Every household participated in the filling ofthat tank on a rotation basis.
In 1982, under the state government’s drinkingwater scheme, the well in the centre of the villagewas energized by installing a 10 HP electric motor.A ground level reservoir of 20 thousand litrescapacity was constructed to store water, and twopipes were laid in two directions to supply drinkingwater. In two locations standposts with multipletaps were provided. The cost of construction andelectrification of the well was borne by the PublicHealth Engineering Department (PHED) of thestate government. In terms of the managementand maintenance of the well, the monthlyelectricity charges are paid by the PHED, but themanagement of the supply and maintenance ofthe motor in case of breakdown are theresponsibility of the villagers. The motor is in needof repair or maintenance 4 to 5 times in a year.Each breakdown costs the village around Rs 1,800to Rs 2,000 for rewinding the motor. Breakdownsare common due to the great fluctuations inelectric supply.
In a village level meeting in 1982, a system ofmanagement was developed for maintaining thenewly energized well. This system is still in placeat present. Under this system each householdresiding in the village has to contribute 15 daysof time per annum for running the water supplysystem. If a particular household is not able toprovide its services in the regulation of thedrinking water system, it can hire the services of
Option Within Ranks (4 = most favoured) Total1 2 3 4
DOKEN (65 respondents)
Cut bath 16(25%) 29(45%) 19(29%) 1(2%) 65(100%)
Cut washing of clothes 31(48%) 29(45%) 5(8%) 0(0%) 65(100%)
Cut washing utensils 18(28%) 7(11%) 40(62%) 0(0%) 65(100%)
Recycling of water 0(0%) 0(0%) 1(2%) 64(98%) 65(100%)
AJEETPURA (45 respondents)
Cut bath 12(27%) 19(45%) 13(29%) 1(2%) 45(100%)
Cut washing of clothes 19(42%) 23(51%) 3(7%) 0(0%) 45(100%)
Cut washing utensils 14(31%) 3(7%) 28(62%) 0(0%) 45(100%)
Recycling of water 0(0%) 0(0%) 0(0%) 45(100%) 45(100%)
COMBINED (110 respondents)
Cut bath 28(25%) 48(44%) 32(29%) 2(2%) 110(100%)
Cut washing of clothes 50(45%) 52(47%) 8(7%) 0(0%) 110(100%)
Cut washing utensils 32(29%) 10(62%) 68(0%) 0(0%) 110(100%)
Recycling of water 0(0%) 0(0%) 1(1%) 109(99%) 110(100%)
TABLE 14:Adjustment in Domestic Water Use to Shortage Condition

L O C A L S T R A T E G I E S F O R W A T E R M A N A G E M E N T A N D C O N S E R V A T I O N
284
In Ajeetpura asuccessfulsystem of
managementwas created forthe operation
andmaintenance ofan energized
well provided bythe government.
another household by paying Rs 100 for 15 days.Some of the work involved during this period is tooperate the well to fill the water tank, to see thatthe motor is kept off during low voltage electricsupply, to check that the pipeline is not brokenand taps are intact. In case of breakdown, somevillagers have to join together to haul the motorout of the well and take it to the nearest town,Chirawa, to get it repaired and then reinstall it.Each household drawing water contributes equallyto the cost of repair. Recently the communitydecided to entrust management to a villager at anominal pay of Rs 600 per month. If nobodycomes forward, an individual who has retired fromthe army has volunteered to take on this task.Each household has to contribute a nominal costof Rs 15 per month for drinking water. Fewhouseholds have taken domestic connections byputting in their own pipelines. This institution ofinformal management is functioning despite allkinds of political and social differences.
Conclusions
Domestic water availability does not seem tobe a problem in the basin. Even though thepopulation is increasing very rapidly, the futuredemand for domestic water will not contributemuch to depleting the groundwater resource. Totaldomestic demand, even if doubled, will remain farbelow the irrigation demand. In terms of domesticwater supply, the more important issues to beaddressed in the search for alternate managementsystems will be the issues of distribution, accessand quality of the supply. Greater cooperation ofpeople will be the key to overcoming theseproblems rather than state interventions. The issuesof centralized versus decentralized managementare being debated and likely to be important in
the future (Rathore, 1996, 1997). The presentattempt to hand over village domestic water supplysystems to panchayats will be key to dealing withthe problem of accessibility to domestic water.
Access to drinking water depends upon resourceavailability, well ownership and whether or notdifferent groups of non-owners are socially viewedas entitled to use a given source. Since the shareof domestic water in total water consumption ismarginal and irrigated agriculture is beingpracticed in the village, the basic availability ofwater is not seen to be a problem in the basin.Well locations and ownership therefore directlydetermine access to drinking water for differentsections of the society. In general, the more publicwells (and associated tap stands) the better theaccess to drinking water, particularly for themarginalized castes or other social groupings. Atpresent, 60 per cent of the supply sources areprivately owned, which reflects the inequity inaccess to drinking water. Hence, drinking watershould be supplied by community owned sources,and people’s dependence on private sources shouldbe reduced.
Irrigation
Since the Shekhawati Basin is an agriculturalarea, irrigation dominates most of the water useand water demand is heavily affected by croppingpatterns. Tables 15 and 16 show the croppingpattern of the sample farmers by size class ofholdings in the sample villages. These show thatthe percentage of the area under wheat declineswith the increase in size of holding, and indicatesthat the smaller sized farms devote relatively moreof their agricultural land to water intensive cropsto meet their food requirements. Irrigation in the

L O C A L S T R A T E G I E S F O R W A T E R M A N A G E M E N T A N D C O N S E R V A T I O N
285
kharif season is mostly protective irrigation. In therabi season the mustard crop is currently preferredto the gram crop and the wheat to the barley crop.Gram is now mostly grown in unirrigated areas.Further, it also shows that keeping lands fallow isa practice followed more in the rabi season. Thelarge farmers keep almost 20 to 25 per cent oftheir lands as fallow lands in the rabi season. Inthe case of smaller holdings this percentage is
about 15 per cent. In the rabi season this isbecause of a shortage of groundwater. The practiceof keeping land fallow during the kharif and rabiseasons is an age old traditional practice toimprove the soil fertility. Because of intensificationof agriculture in the area and use of externalinputs such as fertilizers, these soil fertilitymeasures are almost out of practice on irrigatedlands. The trends in cropping pattern followed in
Pearl Millet Irr. 0.00 0.00 0.10 0.00 0.00 0.02 0.00 0.00 3.78 0.00 0.00 0.80
Pearl Millet Un Irr. 0.41 0.79 1.13 1.57 1.65 0.73 61.30 56.29 42.34 28.04 16.25 38.38
Sorghum Un Irr. 0.02 0.00 0.03 0.15 0.00 0.03 3.45 0.00 0.95 2.62 0.00 1.46
(Jawar)
Cluster Un Irr. 0.00 0.00 0.10 0.00 0.63 0.04 0.00 0.00 3.78 0.00 6.25 1.86
Bean (Guwar)
Pulse Irr. 0.00 0.02 0.00 0.33 0.00 0.04 0.00 1.62 0.00 5.82 0.00 2.12
(Arhar)
Fallow 0.23 0.59 1.32 3.56 7.85 1.06 35.25 42.09 49.15 63.52 77.50 55.38
Total 0.66 1.41 2.68 5.61 10.13 1.91 100.00 100.00 100.00 100.00 100.00 100.00
RABI CROPS
Wheat Irr. 0.30 0.48 0.86 1.50 1.65 0.57 45.80 33.87 31.62 26.78 16.25 29.73
Barley Irr. 0.01 0.00 0.00 0.04 0.00 0.01 1.53 0.00 0.00 0.63 0.00 0.40
Mustard Irr. 0.02 0.24 0.51 0.76 0.00 0.22 2.67 16.94 18.71 13.55 0.00 11.68
Mustard Un Irr. 0.03 0.03 0.21 0.11 3.16 0.16 4.58 2.34 7.76 1.94 31.25 8.36
Gram Irr. 0.00 0.04 0.17 0.54 2.53 0.17 0.00 2.88 6.36 9.67 25.00 9.03
Gram Un Irr. 0.18 0.35 0.28 0.90 0.89 0.32 27.10 24.86 10.29 16.12 8.75 16.59
Spices Irr. 0.00 0.00 0.03 0.09 0.00 0.01 0.00 0.00 0.94 1.63 0.00 0.72
(Methi)
Vegetable Irr. 0.00 0.00 0.03 0.00 0.00 0.00 0.00 0.00 0.94 0.00 0.00 0.20
(Brinjal)
Fallow 0.12 0.27 0.63 1.66 1.90 0.44 18.32 19.10 23.39 29.67 18.75 23.28
Total 0.66 1.41 2.71 5.61 10.13 1.91 100.00 100.00 100.00 100.00 100.00 100.00
CropsSize Class of Holding Overall Size Class of Holding Overall(area under crop Ha.) (percentage area under crop)
0-1 1-2 2-4 4i-10 10 & above 0-1 1-2 2-4 4-10 10 & above
KHARIF CROPS
Irr -- Irrigated, Un Irr--Unirrigated
Smalllandholders
devote
propertionatelymore land to
water intensive
crops.
TABLE 15:Cropping Pattern Adopted by Sample Households in Doken

L O C A L S T R A T E G I E S F O R W A T E R M A N A G E M E N T A N D C O N S E R V A T I O N
286
KHARIF CROPS
Pearl Millet Irr. 0.06 0.00 0.32 0.00 - 0.07 4.78 0.00 10.94 0.00 - 3.85
Pearl Millet Un Irr. 0.69 0.93 1.35 3.47 - 1.05 59.13 67.09 46.54 64.47 - 59.25
Sorghum Un Irr. 0.00 0.02 0.00 0.00 - 0.00 0.00 1.46 0.00 0.00 - 0.28 (Jawar)
Pulse Un Irr. 0.00 0.00 0.00 0.23 - 0.02 0.00 0.00 0.00 4.18 - 1.36 (Moth)
Pulse Un Irr. 0.00 0.16 0.25 0.28 - 0.11 0.00 11.52 8.75 5.22 - 6.10 (Mong)
Cluster Bean Un Irr. 0.11 0.17 0.62 0.51 - 0.23 9.57 12.25 21.26 9.40 - 12.95 (Guwar)
Cowpea Un Irr. 0.00 0.00 0.09 0.00 - 0.01 0.00 0.00 3.15 0.00 - 0.79 (Chaula)
Pulse Irr. 0.00 0.00 0.00 0.73 - 0.08 0.00 0.00 0.00 13.58 - 4.43 (Mixed)
Fallow 0.31 0.11 0.27 0.17 - 0.20 26.52 7.68 9.36 3.15 - 10.99
Total 1.16 1.38 2.89 5.39 - 1.78 100.00 100.00 100.00 100.00 - 100.00
RABI CROPS
Wheat Irr. 0.48 0.40 0.79 1.44 - 0.54 41.00 28.94 27.22 26.64 - 30.56
Barley Un Irr. 0.00 0.00 0.13 0.00 - 0.02 0.00 0.00 4.38 0.00 - 1.10
Barley Irr. 0.00 0.11 0.18 0.00 - 0.05 0.00 7.69 6.21 0.00 - 3.03
Mustard Irr. 0.51 0.68 1.11 1.07 - 0.63 43.38 48.90 38.42 19.83 - 35.51
Mustard Un Irr. 0.00 0.00 0.20 0.00 - 0.03 0.00 0.00 6.91 0.00 - 1.73
Gram Irr. 0.08 0.00 0.05 0.14 - 0.05 7.16 0.00 1.84 2.63 - 2.98
Gram Un Irr. 0.04 0.06 0.24 1.42 - 0.22 3.69 4.58 8.14 26.36 - 12.37
Spices Irr. 0.00 0.00 0.05 0.00 - 0.01 0.00 0.00 1.87 0.00 - 0.47 (Methi)
Fallow 0.06 0.14 0.14 1.32 - 0.22 4.77 9.89 5.00 24.53 - 12.25
Total 1.17 1.38 2.89 5.39 - 1.78 100.00 100.00 100.00 100.00 - 100.00
CropsSize Class of Holding Overall Size Class of Holding Overall(area under crop Ha.) (percentage area under crop)
0-1 1-2 2-4 4i-10 10 & above 0-1 1-2 2-4 4-10 10 & above
the sample villages are same as those observed inthe Shekhawati Basin as a whole.
Sources of Irrigation
Table 17 shows the distribution of householdsby number of wells on their farms. Taking the
two villagers together, more than three-fourths ofthe farmers have only one well, 8 per cent havetwo wells, and 16 per cent do not have any well.In Doken the wells are mostly dug wells and wateris drawn with diesel pumps, while in Ajeetpura allwells are dug-cum-borewells fitted withsubmersible pumps. All well owners in Ajeetpura
Sprinklers areused to irrigate
undulatingland, not reduceconsumption.
TABLE 16:Cropping Pattern Adopted by Sample Households in Ajeetpura

L O C A L S T R A T E G I E S F O R W A T E R M A N A G E M E N T A N D C O N S E R V A T I O N
287
have at least one sprinkler set on their farm. Waterlevels are declining rapidly in spite of the use ofwater saving technology.
Table 18 shows the expenditure incurred in theoperation and maintenance of irrigation structures.The total expenditure per hectare is higher for thesmaller farmers both in Doken and in Ajeetpuraindicating some economies of scale.
On Farm Water ManagementStrategies
The local level variability in groundwateravailability and the strategies adopted by farmerswere captured in the survey by first assessing thegap between expected water requirement of thecrops grown and the actual water used. As themeasurement of quantity of water is too difficult,the number of waterings was considered the proxyfor it. As the timing of watering and number ofwaterings are critical to the plant growth ofdifferent crops, information was collected on boththese aspects for the irrigated crops grown in thesample villages. The facts about two majorrabi crops are reported in Table 19. It can be seenthat the gap is small between expected andactual irrigation in the mustard crop in the twosample villages. However, there is a significantgap in wheat crop in Doken. In Ajeetpura,because of the adoption of sprinklers, the cropwater demand is met to a large extent. The smallgap that does exist is there mainly because thefarmers have tried to extend the area underirrigation by using sprinklers and have started tocultivate more rough undulating portions of theland in addition to their ordinary fields. Byexpanding the irrigated area farmers haveprobably neutralized any positive effect of the
Size of Holding (ha.)
No ofHH
One Well No WellsTwo Wells
No % No % No %
DOKEN 0 - 1 23 17 74 0 0 6 26 1 - 2 16 13 81 2 13 1 6 2 - 4 10 8 80 1 10 1 10 4 - 10 7 5 71 2 29 0 0 10 & above 2 1 50 1 50 0 0Sub Total 58 44 76 6 10 8 14
AJEETPURA 0 - 1 9 6 67 1 11 2 22 1 - 2 11 10 91 1 9 0 0 2 - 4 15 11 73 0 0 4 27 4 - 10 9 7 78 0 0 2 22 10 & above 0 0 0 0 0 0 0 Sub Total 44 34 77 2 5 8 18
COMBINED 0 – 1 32 23 72 1 3 8 25 1 – 2 27 23 85 3 11 1 4 2 – 4 25 19 76 1 4 5 20 4 – 10 16 12 75 2 13 2 13 10 & above 2 1 50 1 50 0 0 Total 102 78 76 8 8 16 16
TABLE 17:Ownership of Wells by Sample Households
agricultural price policy in controllinggroundwater depletion.
There are number of ways to bridge the gapbetween supply and demand for water, such asreducing the area irrigated, growing water savingcrops, reducing number of waterings, adoptingwater saving technology, and the extreme case ofabandoning agriculture to look for off-farmemployment within or outside the village. Samplefarmers were asked to rank these choices. Theresults are reported in Table 20. The option ofreducing the area under irrigation was ranked firstby 43 per cent of the farmers. Reducing thenumber of waterings seems to be less preferred.Forty per cent of farmers ranked this option third.
The gapbetween supply
and demand
may be bridgedby reducing
irrigated area,
using watersaving
technology or
abandoningirrigation.

L O C A L S T R A T E G I E S F O R W A T E R M A N A G E M E N T A N D C O N S E R V A T I O N
288
Size of Holding Average Size Operational Maintenance Other Total Total Expen- (ha.) of Holding (Ha.) Expenditure Expenditure Expenditure Expenditure -diture/ha.
DOKEN 0 – 1 0.63 639 296 54 989 1,575 1 – 2 1.40 2,284 916 99 3,299 2,356 2 – 4 2.68 2,295 1,020 280 3,595 1,342 4 – 10 5.71 2,614 1,157 129 3,900 683 10 & above 10.13 2,950 1,500 150 4,600 454Overall 2.14 1,696 737 118 2,551 1,195AJEETPURA 0 – 1 0.60 2,831 2,236 294 5,361 8,973 1 – 2 1.37 1,989 763 32 2,784 2,033 2 – 4 2.87 1,842 1,250 253 3,345 1,166 4 – 10 5.64 3,884 1,470 267 5,621 997 10 & above 0.00 0 0 0 0 0 Overall 2.60 2,499 1,375 209 4,083 1,573 COMBINED 0 – 1 0.62 1,256 841 122 2,219 3,578 1 – 2 1.39 2,164 854 71 3,089 2,227 2 – 4 2.79 2,023 1,158 264 3,445 1,234 4 – 10 5.67 3,328 1,333 206 4,867 858 10 & above 10.13 2,950 1,500 150 4,600 454 Overall 2.33 2,043 1,012 157 3,212 1,376
DOKEN 0 – 1 4.00 4.00 8.00 5.86 1 – 2 2.50 2.25 7.18 5.72 2 – 4 3.00 3.00 6.55 6.11 4 – 10 1.00 1.00 8.83 7.00 10 & above 0.00 0.00 7.50 5.50 Overall 2.75 2.62 7.58 6.02 AJEETPURA 0 – 1 4.00 4.00 7.42 6.58 1 – 2 3.40 2.80 7.50 6.33 2 – 4 4.00 3.00 6.90 5.63 4 – 10 0.00 0.00 7.83 6.00 10 & above 0.00 0.00 0.00 0.00 Overall 3.57 3.00 7.33 6.13 COMBINED 0 – 1 4.00 4.00 7.80 6.18 1 – 2 3.00 2.55 7.29 5.94 2 – 4 3.50 3.00 6.75 5.85 4 – 10 1.00 1.00 8.33 6.50 10 & above 0.00 0.00 7.50 5.50 Overall 3.13 2.80 7.47 6.06
Size of holding (ha.) Crops and number of irrigationsMustard Wheat
Expected Actual Expected Actual
TABLE 19:Cropwise Expected and Actual Number of Waterings in Sample Villages
TABLE 18:Per Household Annual Expenditure Incurred on Running and Maintenance of IrrigationWater Structures in Sample Villages: Rupees/year

L O C A L S T R A T E G I E S F O R W A T E R M A N A G E M E N T A N D C O N S E R V A T I O N
289
Farmers prefer
reducing thearea under
cultivation to
othermechanisms for
demand side
management.
Adoption of new water saving technology isranked almost equally, showing that there areconstraints in adopting these technologies. In spiteof several rural credit and subsidy programmes alack of access to credit may be the most importantobstacle here. Another factor could be the lack ofavailability of electricity and the difficulty ingetting a well electrified. In addition, theprocedure involved in obtaining an electricconnection is very cumbersome.
Farmers were unanimous in giving the possible
option of abandoning agriculture and migratingout of the village the lowest ranking. Nobodyenvisages a need for such a response in the nearfuture. In discussions with farmers it has becomeapparent that this attitude is mainly because thefarmers consider groundwater to be a renewableresource and consider groundwater fluctuations tobe more affected by the amount of rainfall thanby their own actions. Only after detailed discussionsabout the history of water use has there been arealization that the current groundwater usepattern is not sustainable.
Strategy Ranks (1 = most favoured option, 6 least) Not Applicable Total DOKEN 1 2 3 4 5 6
Reduce area under crops 33 (56.9) 12 (20.7) 5 (8.6) 0 (0.0) 0 (0.0) 0 (0.0) 8 (13.8) 58 (100) Adopting less water 16 (27.6) 17 (29.3) 15 (25.9) 2 (3.4) 0 (0.0) 0 (0.0) 8 (13.8) 58 (100) consuming crops
Reduce no of waterings 1 (1.7) 11 (19.0) 25 (43.1) 13 (22.4) 0 (0.0) 0 (0.0) 8 (13.8) 58 (100)
Adopting new technology 10 (17.2) 5 (8.6) 35 (60.3) 0 (0.0) 0 (0.0) 0 (0.0) 8 (13.8) 58 (100)
Abandoning agriculture 0 (0.0) 0 (0.0) 0 (0.0) 0 (0.0) 48 (82.8) 1 (1.7) 9 (15.5) 58 (100) & look for off-farm employment
Migrate from the village 0 (0.0) 0 (0.0) 0 (0.0) 0 (0.0) 1 (1.7) 48 (82.8) 9 (15.5) 58 (100)
AJEETPURA
Reduce area under crops 14 (31.8) 15 (34.1) 6 (13.6) 1 (2.3) 0 (0.0) 0 (0.0) 8 (18.2) 44 (100)
Adopting less water 13 (29.5) 12 (27.3) 7 (15.9) 3 (6.8) 1 (2.3) 0 (0.0) 8 (18.2) 44 (100) consuming crops
Reduce no of waterings 4 (9.1) 5 (11.4) 19 (43.2) 8 (18.2) 0 (0.0) 0 (0.0) 8 (18.2) 44 (100)
Adopting new technology 5 (11.4) 4 (9.1) 3 (6.8) 24 (54.5) 0 (0.0) 0 (0.0) 8 (18.2) 44 (100)
Abandoning agriculture 0 (0.0) 0 (0.0) 1 (2.3) 0 (0.0) 35 (79.5) 0 (0.0) 8 (18.2) 44 (100) & look for off-farm employment
Migrate from the village 0 (0.0) 0 (0.0) 0 (0.0) 0 (0.0) 0 (0.0) 36 (81.8) 8 (18.2) 44 (100)
COMBINED
Reduce area under crops 47 (46.1) 27 (26.5) 11 (10.8) 1 (1.0) 0 (0.0) 0 (0.0) 16 (15.7) 102 (100)
Adopting less water 29 (28.4) 29 (28.4) 22 (21.6) 5 (4.9) 1 (1.0) 0 (0.0) 16 (15.7) 102 (100) consuming crops
Reduce no of waterings 5 (4.9) 16 (15.7) 44 (43.1) 21 (20.6) 0 (0.0) 0 (0.0) 16 (15.7) 102 (100)
Adopting new technology 15 (14.7) 9 (8.8) 38 (37.3) 24 (23.5) 0 (0.0) 0 (0.0) 16 (15.7) 102 (100)
Abandoning agriculture & 0 (0.0) 0 (0.0) 1 (1.0) 0 (0.0) 83 (81.4) 1 (1.0) 17 (16.7) 102 (100) look for off-farm employment
Migrate from the village 0 (0.0) 0 (0.0) 0 (0.0) 0 (0.0) 1 (1.0) 84 (82.4) 17 (16.7) 102 (100)
TABLE 20:Management Strategy in Case of Shortage of Water: Number of Responses (percentage)

L O C A L S T R A T E G I E S F O R W A T E R M A N A G E M E N T A N D C O N S E R V A T I O N
290
The mosteffectiveinstruments to
reduce waterdemand may beagricultural
price policiesand subsidies.
Synthesis
Irrigation water supply and demand aremanaged both at the macro level (that is, the Stateand basin level) and at the micro level — thevillage and household level.
At the macro level, the State tries to work outthe availability of water and its uses and then triesto assess the gap between supply and demand. Thegap, if any, is then typically met by planningsurface irrigation projects to augment supply.Demand side management in Rajasthan has onlybeen attempted to a limited extent, primarily bypricing of agriculture inputs and outputs, budgetallocations for research and development effortsto create low water intensity cropping systems andto develop appropriate technologies. Theseinstruments have been tried in various attemptsto influence water use either directly or indirectly.The most effective instruments may be theagricultural price policy and subsidy. During the1980s two things happened almost simultaneously.First, new oilseeds (mustard and rapeseed) becameavailable. They were well suited to local conditionsand had a better yield. Secondly, at the nationaland state level, a high support price for mustardwas fixed and the state further supported it byimproving marketing facilities. Both these factorgave a tremendous boost to the adoption ofmustard in most parts of Rajasthan, including thestudy area (Acharya, 1997). The relative economicsof Rabi crops changed and mustard became animportant irrigated crop in the rabi season. Priorto this, the Shekhawati Basin had the tradition ofgrowing a barley and/or wheat crop as an irrigatedcrop in rabi season.
Aside from the breakthrough in seed technologyand the appropriate price policy, the otherinstrument of change on the macro level was asubsidy. A special subsidy programme waslaunched by National Bank for Agriculture andRural Development (NABARD) in Sikar districtduring the 1990s to popularize the adoption ofsprinklers as a water saving technology. Althoughthe programme had little impact initially, itexpanded in the early nineties and sprinklers havenow been widely adopted in the Shekhawati Basin.This has been the case in Ajeetpura, where all thewell owners have sprinkler sets. The adoption ofsprinklers definitely resulted in water conservation,if water usage is compared to flood irrigated areason a per hectare basis. However, any savings thatmight have been realized in this way were quicklylost. The number of wells increased along withsprinklers, cropping patterns changed to morewater intensive crops, and sand dunes andundulating terrain now became cultivable.Ultimately, these macro level policies have had amajor impact on the depletion of the water tablein the basin. The demand for groundwater hasrisen so steeply that the Shekhawati Basin is nowidentified as a “dark groundwater zone”.
As regards the micro level strategies adopted atthe village and household level, the village casestudies show that farmers respond in more thanone way to adjust to the changing waterconditions. It is evident that farmers give highvalue to water resources (Reddy, 1997). They alsoput a high discount to the future and exploitgroundwater to their maximum capacity. As thereis very little surface irrigation, local surfacemanagement strategies have not been discussed

L O C A L S T R A T E G I E S F O R W A T E R M A N A G E M E N T A N D C O N S E R V A T I O N
291
in much detail. Most irrigation is from privatelyowned wells. At the farm level, household decisionsare more important. The farmer responds tovarying water availability mainly in two ways: First,by varying the area irrigated and adopting
Suggested Interventions
There are three complementary rather thanalternative options to deal with Rajasthan’s
alarming groundwater situation. These include(i) regulation through market intervention, (ii)enactment of legislation and (iii) people’sparticipation. In this section these options arediscussed in the context of the insights providedby the field study. A few issues for wider discussionare also raised.
Market Intervention
The market is one of the instruments forefficient allocation of resources. Use of resource/good can largely be regulated in the desiredmanner by appropriate market interventions.However, there is only a limited role the marketcan play in the case of natural resources, especiallyin the case of water, because of the institutionaland market failures (Reddy et al., 1997).Nevertheless, price as a market instrument toregulate demand is, directly or indirectly, beingtried in the case of water use for irrigation. But itis considered as part of the larger agriculturalpolicy, rather than as part of a policy designed formanagement of water as an economic resource.In the case of surface irrigation, water is pricedaccording to its use. The existing tariffs areineffective in encouraging efficient use or
conservation of water. When groundwater isprivately managed through wells and tubewellsusing animal, diesel or electric power, no directprice control is possible except through electricityrates and diesel prices, which influence the costof irrigation for the farmer. In fact, energy priceintervention is a weak instrument.
Power rates charged to the agricultural sectorare highly subsidized, as the agricultural powertariff is much lower than the non-agriculturaltariff and is also much below the average cost ofgeneration and transmission. Let us examine thecase of whether power policy as an instrument forchecking groundwater exploitation can be aneffective instrument. Presently the Government ofRajasthan is charging a flat rate, varying as perthe capacity of the machine. There is noconnection of these charges to the area irrigatedor amount of water lifted. The farmer has noincentive to conserve or economize use of water.However, the price of electricity can be fixed onthe following basis: The first is to charge a pricefor power that is based on its cost of generationand distribution. The second is to fix a powertariff based on the price of diesel, as the existingtechnology of diesel pumps and diesel operatedgenerators can be substituted for electricity.However, in the given socio-political milieu it is
Balancingsupply anddemand of
water requiresboth micro and
macro policy
interventions.
cropping patterns based on supply, and secondlyby adopting technology to augment supply, suchas sprinklers and irrigation practices. Areaadjustment was reported as the most preferredmanagement option.

L O C A L S T R A T E G I E S F O R W A T E R M A N A G E M E N T A N D C O N S E R V A T I O N
292
very difficult to change the electricity tariffs, asthe adjoining states are supplying it free of costunder their political commitment to the people.
The present tariffs have failed to bring thedesired level of impact on control over groundwaterdepletion as the demand for electricity isdetermined by several factors, such as availabilityof groundwater, size of farm, cropping pattern,diesel price, standby arrangements in whichfarmers ensure diesel pumps are available whenelectricity supplies are limited, and creditworthiness. Also, as there is a tendency amongfarmers to switch from electric to diesel pumps,and from low value crops to high value crops tocounter the rise in electricity tariffs, it seems clearthat none of the two criteria for determiningagricultural power tariffs listed above will havemuch influence on the groundwater withdrawaldecisions of the farmers. Rather, it will adverselyaffect small and marginal farmers, as they do nothave the capacity to switch from electricity to dieselpumps. More importantly, the issue is a politicalone and is likely to be tackled only at that level.Hence, it can be concluded that groundwater over-exploitation could never be addressed effectivelyvia power tariff policies (Saleth, 1997;Narayanamoormy, 1997).
In Rajasthan a subsidy was used as aneconomic instrument to promote water savingtechnology, particularly sprinklers for irrigation.As intended, it emerged as a powerful instrumentin boosting the adoption of sprinklers in the studyarea. The main objective was to save thegroundwater. The results have been quite theopposite. The water table has continuously gonedown, both because of an increase in the areaunder cultivation and due to the tremendous
number of pumps installed. Hence, there is a needto search for other alternative policy options/instruments whereby farmers could be induced toreduce waste of groundwater.
The above observations are only applicable toareas where the switch to diesel pumps istechnically and economically feasible. In the caseof hard rock and deep groundwater areas, using adiesel pump is either a more costly option or atechnically infeasible option. In these areaselectrical pumps are likely to be used, and anelectricity tariff can definitely have an effect onextraction rates. Still, there are cases wherefarmers opt for the more costly option of usingdiesel operated generators, as in the case of richfarmers in Churu district of Rajasthan.
Presently, the state government is adopting apolicy of power rationing. This is a response tothe overall shortage of power and is unrelated towater management strategy. Let us examine howfar this has been effective in controllinggroundwater use. Power rationing can definitelyreduce power consumption and water withdrawal.This helps in achieving the dual objectives ofsustainability and efficiency in water use. However,power rationing makes the diesel pumpset optionquite attractive and leads to groundwater depletiondepending upon the hydrology of the region.
Power tariffs coupled with power rationingcannot be an effective instrument forsimultaneously achieving the three policy goals ofequity, efficiency and sustainability.
Agricultural price policies along with othermarketing measures seem to have worked ininfluencing groundwater use indirectly via change
Althoughrationing ofelectric power
can reducegroundwaterextraction, it
also createsincentives forfarmers to shift
to dieselpumpsets.

L O C A L S T R A T E G I E S F O R W A T E R M A N A G E M E N T A N D C O N S E R V A T I O N
293
in the economics of cropping in favor of watersaving crops. This instrument, if used with watersaving as its prime objective, can definitely helpin improving the groundwater problems of thestate. In sum, the depletion problem can partly betaken care of by adopting appropriate agriculturalprice policies with groundwater control as a keyobjective. This does not rule out other regulatorymeasures to control groundwater use. Secondly,the economics of cropping pattern seems to be thegreatest source of leverage, but domestic waterconservation actions are a minor point ofintervention in the overall management strategies.
Legal Option
A second option to deal with the problem ofgroundwater over-development involves changingexisting water laws. While enacting any law, socialjustice considerations particularly for poorhouseholds are important to consider. No law canguarantee social justice for all. The problem isthat groundwater depletion will also result ininjustice. It is better to lose access to groundwaterbecause of legal restrictions or to lose it becausethe resource has been depleted? That is a majorissue. In addition, if the state is to use legalmechanisms to regulate the use of water resources,it is equally important to identify how people canuse the law to make the state more accountableand efficient. This is particularly essential becausethe popular impression is that the state itself isinstrumental in bringing about massive depletionof water resources through inappropriate forest andirrigation policies and also in creating inequalitiesin the distribution of water (Singh, 1992).
One of the basic issues in water law is that ofrights, that is, what rights the people have, and
what the rights of the State are. The question ofthe State’s accountability to the people, and thepeople’s accountability to each other and to theState cannot be worked out unless we are clearabout the legal framework of rights in water. Ithas been observed in India, as well as in otherparts of the world, that in the absence of clearlydefined water rights many irrigation schemes havefailed to function desirably (Gerbrandy andHoogendam, 1996; Nederlof and Wayjen, 1996).Likewise, in the case of Rajasthan, the groundwaterrights should be clearly defined before enactingany additional laws to regulate groundwater use.
The present position of laws applicable in thecase of groundwater is as follows: According to theEasement Act of 1882, a person has no natural orcustomary right over groundwater, whethercollected in a well, or passing through springs orflowing in an undefined course. Any diminutionof such water by neighbours, therefore, gives noground for action under the Easement Act.However, rights to groundwater belong to thelandowner, since it forms part of the dominantheritage. Land ownership, in turn, is governed bythe tenancy laws of the State. There is no mentionand limitation on the use of groundwater. Theconsequence of such a legal framework is that onlylandowners can own groundwater. The ultimateresult is over-exploitation of groundwater. It is veryclear in case of the groundwater laws that rightsof the landowners are at present absolute, whilethe State has no rights whatsoever. It is only incase of public wells or tubewells that the State hasthe right to regulate use.
Considering that water is a vital resource forlife, being deprived of it is a violation of afundamental human right. Therefore, the
A centralquestions for
society is
whether it isbetter to accept
legal
restrictions ongroundwater
use or to allow
the resource tobe depleted.

L O C A L S T R A T E G I E S F O R W A T E R M A N A G E M E N T A N D C O N S E R V A T I O N
294
important issue is prioritization of water use, forexample giving precedence over drinking/domesticuses before agricultural and industrial uses. Infact, prioritization of water use must be a centralconcern for water legislation. Law is a double-edged instrument. It can be used to cut or heal,to exploit or to liberate, both by the State and bythe people. So far both the State and the peoplehave failed to behave in a manner that ensuressustainable management of the resource. To dealwith the fast depleting groundwater table all overRajasthan, the state government circulated a draftgroundwater legislation for public debate anddiscussion in January 1998. Several rounds ofmeetings, seminars and discussions were organizedseeking participation of politicians, stakeholders,NGO’s, government officials and academicians.Public commentary suggests that the likelyoutcome of the proposed groundwater legislationis questionable on many counts particularly inexecution of the law.
Many scholars and policy makers believe thatrights to groundwater should be those of use andnot of ownership (Vaidyanathan, 1996). Theauthors of the current report agree with thisassertion. If ownership has to be decided, it couldbe with the State, but with use rights going to thecommunity. This community can be a village ornumber of villages situated in a hydrogeologicalzone. In addition, the regulatory rights should betransferred to the community. The State shouldfacilitate the functioning of the community andthe efforts to harness and conserve water resourcesby providing technical and financial inputs formonitoring groundwater and the status of waterbalance in the zone. It would require some specialefforts to organize communities around waterresources in such a manner.
Community Participation
A third alternative is community participationin management. Traditionally, individuals haveconsidered water fetched from wells located ontheir lands to be private property. Since societyhas sanctioned such treatment, it seems verydifficult to change such de facto property rightsvery quickly. It is often argued that the enactmentof groundwater law to abolish private propertyrights to water can change the situation. On theother hand, refuting this argument, others arguethat in order to enforce such a law the State wouldhave to post agents, thereby adding one more classof “rent seekers” to the existing system and noguarantee of better control over the depletion ofthe resource. This group sees more communitycontrolled water resource management as a morepragmatic approach.
Some problems with community participationare that the process is too slow to be applied widelyand that the notion of community participation ispoorly defined. Secondly, community basedactivities often depend on the driving force of onecharismatic person or a small group of motivatedpeople. In spite of the good intentions of suchpeople, partisan politics have often interfered.Sometimes even the community participationprojects have become manipulative. For suchreasons, most of the cooperatives and communitydevelopment experiments of the 1950’s and 1960’sended in failure.
Some of the other negative outcomes ofparticipation can be that it is possible thatparticipation will bring about the development ofthe “participating elite” in a community andtherefore, contribute to inequality. There is always
Land ownershipis governed bythe tenancy
laws of theState. There isno mention or
limitation onthe use ofgroundwater.

L O C A L S T R A T E G I E S F O R W A T E R M A N A G E M E N T A N D C O N S E R V A T I O N
295
a political dimension to participation since it istied to changes in the control of resources.Regardless of the intentions of those whoadminister programmes, it is even possible thatpolitical demands can lead to violence.
In spite of these negative factors, communityparticipation remains an important factor inaddressing groundwater management issues. Usergroup management of natural resources hasalways existed in some form in India. Recently,successful efforts have been made by a number ofNGO’s to establish that it can even work todayunder a changed environment, and naturalresources can be better managed by user-groups(Moench, 1992).
Management of Groundwateras a Common PropertyResource
Common property resource managementprovides a complex system of rules andconventions regulating individual rights to avariety of natural resources including grazing land,forests and water. Although management ofresources as common property has proved to be astable form of resource management in sometraditional societies, the combination of populationgrowth, technology change, climate and politicalforces has also destabilized many existing commonproperty management institutions. Much of thecurrent literature on CPR’s leads to a general, butfalse, conclusion that common property isuniversally mismanaged. In the context of poverty,natural resource dependency and resultinguncertainties, incentive structures are created thatmay make common property a comparativelyrational solution to certain problems of resource
management. Western economic consultants andplanners have often called for the imposition ofprivate property rights. However, perhaps in mostcases, private rights have failed to stop overusewhen implemented, and in many cases may havecontributed to an even more rapid degradation ofresources and increased inequality in alreadyunequal distribution.
The role of village level conventions, includingcommon property institutions, to reinforceexpectations of collective behaviour leading to acritical mass of individuals to adopt such asolution to groundwater use as a cooperativestrategy is the ultimate solution. If the user groupfunctions optimally, common property institutionscan lead to equilibrium outcomes in which eachindividual is assured that a critical mass of otherswill cooperate, so that they too will have anincentive to do so. Of course, common propertyinstitutions do not always provide this assurance.If the State recognizes these institutions and givesthem the authority to manage groundwaterresources, the chances are good that these willwork efficiently.
Sugden has argued that the morehomogeneous a community is, the more likely itis that the outcomes will be optimal (Sugden,1984). Conversely, the more heterogeneous it is,the more difficult coordination becomes. As theheterogeneity of the group increases, and as theresource constraints facing it become more severe,common property rules may become increasingdifficult to maintain (Johnson and Libecap, 1982).A heterogeneous community will require moreenforcement of agreements. The enforcement mayemerge from inside the group or be imposed fromoutside. The key element determining the success
Participationcan havenegative
consequencesfor effective
groundwater
managementbut
management as
a commonproperty
resource may
still be viable.

L O C A L S T R A T E G I E S F O R W A T E R M A N A G E M E N T A N D C O N S E R V A T I O N
296
Use of a well makes a difference.
or failure of institutions is, therefore, the extent towhich they foster coordinated expectations inrelation to a particular physical and socialenvironment. The fairness implicit in joint accessmay prove a highly assuring feature of commonproperty agreements. Frequently, the relative
benefits accruing to individual members of thegroup are somewhat less than under a system ofexclusive use right. If some assurance regardingthe actions of others is provided, via aninstitutional rule, it is possible to achieve thedesired goal of the group even though the benefitto the individual may be lower.
Cooperative solutions are most likely to succeedwhere the locus of decision-making is a relativelysmall, cohesive body. However, individuals whohave high discount rates and little mutual trusttend to act independently, rarely communicate welland are often unwilling to enter into bindingagreements for monitoring and enforcement.Overall, they are unlikely to choose jointlybeneficial strategies unless such strategies happento be their dominant strategies.
Groundwater in Rajasthan is drawn by diggingwells and tubewells owned under jointor individual private ownership mostly bylandowners. There is little homogeneity in assetownership, caste, class and access to the resources,and yet the chance of coming together to formmanagement systems where everyone canbenefit is strong, as there is a strong trade off infavour of joining. There is a recognition thatacting independently will aggravate thecrisis situation, and may even force people tomigrate or depend on unirrigated crops and nonfarm enterprises.
Both heterogeneity of group members andvariation in availability of groundwater needserious consideration in order to determine thelevel of organization. It seems feasible to form agroup at the village level and also a higher levelgroup of villages at the river basin level.
Families spendsubstantialamounts on
water supplyeach year.

L O C A L S T R A T E G I E S F O R W A T E R M A N A G E M E N T A N D C O N S E R V A T I O N
297
In order todevelopgroundwater
managementinstitutions it isimportant to
know:� what economic
incentives do
users have forcooperation,
� how do these
incentivesdiffer betweenclasses of
users, and� what social or
cultural
characteristicscontribute tocooperation.
River Basin Approach
A river basin is a surface hydrological boundaryhaving an integrated drainage system. A riverbasin is a functional unit established by physicalrelationship for the purpose of water resourcemanagement (both surface and ground) whereactivities in one part can indicate a chain ofenvironmental impacts affecting other parts of thebasin. It is the combination of soil, water andvegetation based activities which affect thesustainability of resource use in a basin. Impactson one resource invariably affect the status ofothers, suggesting that externalities of this type aregenerally not separable.
There are several cases where surface water istreated as a common property resource andcollectively managed successfully. However, in thecase of the groundwater situation, the idea of the“tragedy of the commons” applies all too well.Groundwater is perceived as private property ratherthan as a common pool resource even though theexternalities in groundwater use are fairly widelyunderstood. Too many well owners “ride free”,overly concerned with their own benefit. Thesemultiple individual actions have contributedcollectively to the continuous depletion of thegroundwater resource. The problem comes fromthe fact that individual wells tap water from acommon physical pool. Unless groundwater isperceived in this way, as a “public good”, theproblem cannot be resolved.
In order to develop cooperative institutions ofgroundwater management it is important to askthe following questions: (i) What economicincentives do the well owners have to participatein management? (ii) How do these incentives vary
with the size of landholding? (iii) What socialand cultural attributes are correlated withcooperation or defection?
The collective consequences of individualbehaviour, if properly understood by well ownersand the local population in general may generateenough pressure to enable people to organizearound groundwater issues. However, unless thereis a situation in which there is little loss toindividual well owners and there is a benefit toall other community members, it will be verydifficult to obtain community cooperation. Thereare a number of actions that can be taken toassure widespread access to any benefits. Forexample, it is possible to ensure the same or higherlevel of returns from the land with lessconsumption of water by adopting technologiesthat support the efficient use of water and itsconservation or by changing cropping patterns andirrigation practices. With this goal in mind, thegovernment can extend support with a technologypackage, price incentives, sprinkler and other suchwater saving devices, and prompt and appropriateextension services. The activities planned undervarious government programmes to improvereplenishment of groundwater, such as watersheddevelopment, land development, soil conservation,and afforestation can be carried out at much lowercost if a cooperative institution is already in place.The lessons learned from the watershedprogramme implementation within Rajasthan, aswell as in other Indian states, can be helpful inplanning the formation of such institutions. Alarge number of NGO’s working in the rural areascan be involved in the formation of these groupsand in creating awareness among people of thegroundwater problems. Rather than thinking ofgroundwater based collective action institutions as

L O C A L S T R A T E G I E S F O R W A T E R M A N A G E M E N T A N D C O N S E R V A T I O N
298
Further Research Needs in the Shekhawati Basin
Groundwater depletion is emerging as a majorproblem in the Shekhawati Basin. A number
of direct and indirect measures have been taken,but so far they have failed to arrest the problem.This is partly because of the sectoral approach thathas been adopted to deal with the problem.What is needed is a holistic approach to deal withwater. In this process this study was a first step.There are several dimensions of the problem thatwill need to be researched in the future. One ofthem would be river basin based water resourceplanning that incorporates the local peoples’
responses. What has emerged from this study isthat people have their own perception of theproblem and the strategies they view as appropriateshould be incorporated in basin planning. Furtherresearch on this aspect is important.
A second important dimension to beresearched will be community participation inwater resource management. Villagers inRajasthan have traditionally evolved a variety ofsystems of water harvesting to cope with theconsumption and needs of both humans and
Well functioninguser groupscould lead to
the balancedmanagement ofcommon
propertyresources likegroundwater.
solutions to the regular public good problem,it is perhaps more appropriate to think of suchinstitutions as a bundle of opportunities thatsolve different problems for different individualsbut that link the success of the individualto the survival of the group as a whole. Finally,it seems that village resources can only bemanaged in an efficient and sustainablemanner if the single village panchayat can berevived. This panchayat needs to be focusedon the developmental problems of the villageand have equal participation by all sections of thecommunity, and it needs to be as free of politicalideology as possible.
To initiate efforts to control the groundwateroverdraft the following steps are required:
(i) define water rights in a way that use rightsare held by the community rather than theindividual;
(ii) provide legal support to new institutions andorganizations to manage groundwater resources;
(iii) organize a social movement around waterby creating mass awareness among all sections ofsociety and forming groups at the village level;
(iv) adopt the river basin as the basis of planningfor sustainable management of all naturalresources, including water;
(v) evaluate the impact of economic policies thatmay encourage excess groundwater extraction,particularly the agricultural input and outputpolicies; and
(vi) use price policy and subsidy instruments toconserve groundwater.

L O C A L S T R A T E G I E S F O R W A T E R M A N A G E M E N T A N D C O N S E R V A T I O N
299
Successfulresponse to
groundwater
depletion needto incorporate
community
participation inplanning.
animals. These systems complemented certaincultural practices, which laid a high premium onthe conservation of water as a scarce resource.Built into these practices were attitudes whichfostered a more egalitarian access to andexploitation of the water resources withoutcompromising the frugality if its usage. The mainwater harvesting systems were the tanka,talab, and nadi. These traditional structures wereeither owned privately or by the community.Until some time in the seventeenth century,
each village had a tradition of managing theseresources jointly (Agarwal and Narain, 1997).After this time, the systems gradually declineduntil, by the late nineteenth century thesemanagement systems were no longer in place.Consequently, over time, more and morecentralized state operated systems have beenimposed. Even so, there is good scope for learningfrom past experiences to evolve a strategy toorganize community participation to deal with theemerging challenges.

L O C A L S T R A T E G I E S F O R W A T E R M A N A G E M E N T A N D C O N S E R V A T I O N
300
Bibliography
Acharya, S.S. (1997). Agricultural Price Policy in India: Some Emerging Issues and Suggested Agenda, Working Paper No.89, Jaipur, Institute of Development Studies.
Agarwal, A. and S. Narain, eds. (1997). Dying Wisdom: Rise, Fall and Potential of India’s Traditional Water HarvestingSystems. New Delhi, Centre for Science and Environment.
Gerbrandy, G. and P. Hoogendam (1996). The Materialization of Water Rights: Hydraulic Property in the Extension ofRehabilitation of Two Irrigation Systems in Bolivia, in Diemer, G and Huibers, F. P. (eds), Crops, People and Irrigation,London, Intermediate Technology Publications.
Government of Rajasthan (1995). Vital Agricultural Statistics, Jaipur, Government of Rajasthan.
Government of Rajasthan (1997). Water Resources Planning Study, Draft Report, Jaipur, Government of Rajasthan.
Johnson, R.N. and Libecap, G.D. (1982). Contracting Problems and Regulation: The Case of the Fishery, AmericanEconomic Review, vol. 72: pp. 5-22.
Moench, M. (1991a). Social Issues in Western U.S. Groundwater Management: An Overview, Oakland, Pacific Institute forStudies in Development, Environment and Security.
Moench, M. (1991b). Sustainability, Efficiency, & Equity in Groundwater Development: Issues in India and Comparisonswith the Western U.S., Oakland, Pacific Institute for Studies in Development, Environment and Security.
Moench, M. (1992). Chasing the Watertable: Equity and Sustainability in Groundwater Management, Economic andPolitical Weekly, pp. A171-A177.
Narayanamoorthy, A. (1997). Impact of Electricity Tariff Policies on the Use of Electricity and Groundwater, ArthaVijnana, Vol.39, No.3, pp. 323-340.
Nederlof, M. and Wayjen, EV. (1996). Religion and Local Water Rights Versus Land Owners and State: Irrigation in Izucarde Matamoros (West Bank), in Diemer, G and F.P. Huibers, (eds.), Crops, People and Irrigation, London, IntermediateTechnology Publications.
Provencher, B. and O. Burt (1994). A Private Property Rights Regime for the Commons: The Case for Groundwater,American Journal of Agricultural Economics, Vol. 76, pp. 875-888.
Rathore, M.S. (1996). Community - based Management of Handpumps in Rajasthan - A Search for an Alternative,Workshop Report No.24, Jaipur, Institute of Development Studies.
Rathore, M.S. (1997). Strategies for Managing Drinking Water Crisis in Rajasthan, Working Paper No. 086, Jaipur, Instituteof Development Studies.
Reddy, V.R. et al. (1997). User Valuation of Renewable Natural Resources, Project Report, Jaipur, Institute of DevelopmentStudies.
Saleth, R.M. (1997). Power Tariff Policy for Groundwater Regulation: Efficiency, Equity and Sustainability, Artha Vijnana,Vol.39, No.3, pp.312-322.
Shah, T. (1997). Groundwater Scenario in Rajasthan: Situation Analysis and Possible Areas of Interventions, Anand,unpublished.
Singh, C. (1992). Water Rights , Vol. 1, New Delhi, Indian Law Institute.
Sugden, R. (1984). Reciprocity: The Supply of Public Goods Through Voluntary Contributions, Economic Journal, Vol. 94,pp. 772-87.
Sugden, R. (1986). The Economics of Rights, Co-operation, and Welfare, Oxford: Blackwell.
Vaidyanathan, A. (1996). Depletion of Groundwater: Some Issues, Indian Journal of Agricultural Economics, Vol. 5, No.1&2, pp 184-192.

Ways Forward
C H A P T E R 8

W A Y S F O R W A R D
302

W A Y S F O R W A R D
303
The papers in this volume represent a starting point for research under theLocal Supply and Conservation Responses to Water Scarcity project and, insome ways, for shifting debates over water issues away from static “local” versus“centralized” or “participatory” versus “state” positions. An understanding ofresource and management issues that captures more of the nuances inherent inreal situations is needed if emerging water stress is to be alleviated. Many ofthe core conceptual insights identified at the beginning of the volume reflectthis shift. They represent conclusions regarding flaws in earlier understandingof water management issues. They also represent a starting point toward betterunderstanding and the identification of practical avenues for addressing keywater problems. It is important to emphasize, however, that this is just a startingpoint. The concepts themselves and the courses of action they suggest requiresubstantial refinement if they are to evolve into a practical basis for addressingemerging water resource management needs. This section highlights some ofthe key points of clarification needed and outlines a research agenda to translateinsights into the type of practical and pragmatic understanding on whichimplementation approaches can be built.
Gaps in Understanding
Perhaps the clearest starting issue relates to understanding the physicaldynamics of water resource systems. Most of the papers in this volume arebased on limited data concerning the physical dynamics of water resourcesystems. While more data are almost always desirable, this situation is not atypicalof most water systems under stress. Furthermore, additional data are not alwaysequivalent to better knowledge and understanding of the situation. Except inthe case of the VIKSAT study of the Sabarmati Basin, no attempt has been madeto improve published estimates of emerging problems or the impact differentmanagement actions could have on them. In some cases, such as the Tinausystem in Nepal, data probably do not exist that could be used to improve thatunderstanding without the generation of basic hydro-geological information.In other cases, such as the Palar, substantial data probably exist, but they havenever been put into a framework for systematic analysis. This has significantimplications – in the Palar case, it is unclear how much of the overdraft problemis due to water transport out of local areas for industrial uses and how much isdue to local pumping for agriculture. This situation is typical of much of the
The developmentof water
managementsolutions dependson approaches
that break thebounds of localversus
centralized andparticipatoryversus state
debates.
WAYS FORWARD

W A Y S F O R W A R D
304
world, including relatively data rich areas in theindustrialized West.
The absence of data is not, in itself, a mandatefor extensive data collection. Data are expensiveto collect and, unless their application is clearlyunderstood, often useless. In addition, keyquestions exist regarding who collects the data, forwhat specific use and with what inherent biases.Answers to these questions are important becausethey shape the types of data it may be importantto collect and the degree of accuracy or reliabilitythose data have. Overall, however, there is a clearneed for better understanding of physicalsystems and the degree to which specific uses ormanagement interventions affect them. The realrelevance of some issues, such as the competitionbetween water transporters and local users inportions of the Palar basin, depend heavily on theactual volumes of water used by different groups.In a similar manner, as the VIKSAT case studyhighlights, management responses that arepopular at local levels (in that case rainwaterharvesting for recharge) may have little impacton the actual physical problem. In the Tinau studythe spread of individually controlled pumpsetsthrough the market implies, at least, a changedrole for large government irrigation schemes, ifnot their complete irrelevance.
Beyond the basic understanding of physicalsystems, the manner in which many of theconcepts introduced in this volume can be appliedin practice needs clarification. Some of the keyissues are outlined below:
1. Enabling Civil Environment and the Role of
Auditors: This concept represents a major, andfrom our perspective important, step away from
traditional linear planning and decision-makingprocesses. While we believe it reflects the essentialrole of social dialogue in catalysing effectivemanagement, we also recognize that socialdialogue is not equivalent to effectivemanagement. Dialogue and debate can degenerateinto paralysing deadlock or mere critique withoutthe emergence of alternatives. Furthermore,reliance on social dialogue as a catalyst for actionpresumes widespread understanding. How thatunderstanding can be created among stakeholdersis a critical issue, particularly where theconsequences of misuse or management actionsare irreversible. In some cases the social contextor nature of emerging problems is likely to requiredecisions or courses of action that can only beimplemented through centralized, non-participatory, approaches. This inherent tensionin approaches is not unique to water resourceissues. It underlies most arenas of social decision-making in managing other common propertyresources, and is a central part of balance of powerconcepts between executive, legislative and judicialfunctions in many national constitutions.Translating these or similar concepts into practicalapproaches that shift the balance of power in thewater resource context is essential in order toclarify the practical meaning of an “enabling civilenvironment.”
2. Systemic Perspective: The concept of asystemic perspective has been introduced in orderto highlight both the importance of interactionsbetween systems and the limitations of knowledgeconcerning those interactions. “Comprehensive”analysis is unachievable and the idea that systemshave been analysed “comprehensively” oftencreates a misleading impression concerning howwell problems and their causes are understood.
Data gaps arenot just related
to technicallimitations, butalso concern
who collects thedata, for whatpurpose and
with whatinherent bias.

W A Y S F O R W A R D
305
This said, effective water management does requiredetailed understanding of water resource andhuman use systems. By emphasing systemicperspectives as opposed to “integratedcomprehensive” management we hope toencourage approaches that reflect both theinteraction between systems and the limitations onscientific information available in most realsituations. Clarifying the key factors to considerin developing a systemic perspective andincorporating uncertainty into managementprocesses and decision-making is essential if theconcept is to be widely adopted as an analyticaltool for water management.
3. Adaptive Management: As with the idea ofsystemic perspectives, the concept of “contextreflective” or “adaptive” management needsclarification. Without further definition, theconcept could become little more than a licenceto “do whatever seems best” or an excuse to blameinaction upon. However, given the degree ofuncertainty in our knowledge of physical andsocial systems, interventions may have to bedesigned more humbly enshrining the cautionaryand flexible learning approach.
Solutions to many of the above questionsprobably lie in the arena of social process. Asdiscussed in the chapter on AddressingConstraints in Complex Systems, processes foridentifying emerging problems, developingmanagement approaches and organizing coursesof action may be far more easily generalized thanthe specific issues or courses of action appropriatein any given context. Evaluating the degree towhich social processes can, in practice, begeneralized is critical for evaluating thishypothesis. If processes can be generalized, this
would have major implications for global effortsto address emerging water and other naturalresource management problems.
A Concise Research Agenda
Gaps in understanding outlined in the previoussection provide a broad outline of the issues thatneed to be addressed in order to develop practicalapproaches for addressing water resourcemanagement issues. Many details could, of course,be highlighted. There seem, however, to be twounderlying issues that are particularly critical toaddress in future research initiatives. These are:
1. Understanding, Uncertainty and Risk: In mostareas, there are substantial gaps in understandingof the physical system and the order of magnitudeof the stresses imposed by human use patterns.These gaps in understanding, some of which aredue to lack of systematic analysis and some ofwhich have more fundamental causes, createsubstantial uncertainty regarding the nature ofemerging problems, their larger implications andwhat might be done to address them. Numerousrisks are inherent in this situation. As a result,research needs to focus on mechanisms for“bounding” understanding, uncertainty and risk.Systematic quantitative frameworks for analysis ofwater resource and use data, such as the WEAPmodelling tool used in this project, are essentialfor this. This type of tool provides a clearframework for organizing information and canhelp in clarifying assumptions regarding systemfunctioning. It also assists in the identification ofmajor gaps in data and system understanding.Equally importantly, it enables sensitivity analysisand, through that, delineation of major sourcesof uncertainty and risk. Finally, quantitative
Understandinghow to negotiate
solutions in thecontext of risk
and uncertainty
is a majorchallenge.

W A Y S F O R W A R D
306
analysis can enable a wide variety of second orderquestions to be investigated including:
� What types of data are important and howcan they be made accessible and usableby the sets of actors involved inmanagement debates;
� What are the key physical issues and whattypes of physical responses might be ableto address them;
� What scale does management need tooccur at and what factors should be usedto determine management scale; and
� What are some of the important pointswhere interactions within and betweenresource and use systems occur? Answersto this question would lead, in turn, toidentification of the key social, economicand institutional factors influencingresource condition.
2. The Characteristics of an Enabling Civil
Environment and the Social Processes Occurring
Within It: This research issue relates back to thedichotomy between linear “rationalist” approachesto resource management and the more dynamicsocial process approach that is discussed in thepreface and emerges from the papers presentedabove. We have argued that reform of watermanagement approaches must involve a muchmore open, non-linear and ongoing process ofsocial dialogue and debate than that underlyingmost policy reform and institutional developmentefforts. What this process might look like, howit relates to existing governance structureswithin society and where it could lead remainunexplored. Research on this is essential in orderto identify practical points of intervention toassist societies in responding to the major
water management challenges they face inSouth Asia. Key questions inherent in thisresearch include:
� What is the role of social auditors and how can
they be made more effective? The dynamicprocess approach we see as central to effectivewater resource management depends on informeddebate across broad sections of society. For thisto occur, social auditors, such as the media,NGOs and the courts require access toinformation, understanding and knowledge. Inaddition, processes of social dialogue can easilydegenerate into an impasse. Better understandingof the issues and dynamics involved in this processis critical.
� How does an enabling environment for water
management relate to formal governance
structures and processes within the State and to
informal traditional ones in local regions? Muchresearch on water management has focused onthe development of management institutions.These range from informal “water userassociations” formed at the village level up toformal governmental “basin commissions” thatcross State or national boundaries. Theseinstitutional structures are intended to governwater resources, but their formal relationship toother governance structures within society (villagecouncils, panchayati raj institutions, districtgovernments courts, the legislative and executivebranches of government, etc.) has rarely been partof debates over water management. Our emphasison the wider process of social dialogue highlightsthis disjuncture. Water management is inherentlya governance issue. New approaches to watermanagement need, therefore, to be based on abroad understanding of governance concepts,
Research isneeded to
clarify:� enabling
environment
characteristics,� the role of
social
auditors,� links to formal
state, and
� informal localgovernanceprocesses.

W A Y S F O R W A R D
307
structures and processes within society as a whole.Lack of this is a critical gap in most debates overwater management.
� How should the value of water be reflected in
management of the resource base and its use?
Water markets exist throughout most of South Asia.By their very nature they enable the transfer ofwater between individual users (often adjacentfarmers) and between uses (such as agricultureand industry). Substantial amounts of researchover the past decade have clearly demonstrated therole water markets play in determining access towater within rural and urban communities.Despite this research, however, the dynamics ofwater markets remain poorly understood. Betterunderstanding is essential. Markets represent acore social process shaping the context in whichwater issues emerge and must be managed. Theyalso represent a key point of ideological tensionbetween those who view the sale of water asinherently “bad” (part of an overall economicsystem in which the wealthy exploit the poor) andthose who view markets as inherently “good”(socially neutral mechanisms for allocatingscarce supplies to high value uses). Given themajor role water markets play as part of the
enabling environment within which watermanagement occurs and this ideological tension,better understanding of their dynamics is essential.In particular, it is important to quantify the totaleconomic and social value of water indifferent uses and compare how that relates to thepatterns of allocation emerging in existingunregulated markets. This and related researchon water market dynamics is central to thelarger questions of risk, uncertainty andgovernance that must be addressed for effectivemanagement of scarce water resources. As a result,research on markets, uncertainty and governanceis essential.
� How can analysis of public goods associated
with water be improved and better reflected in
decision-making? The value of water is not justeconomic, although this aspect dominates mostresearch agendas. There are uses, such asenvironmental, cultural and religious where thevalue transcends the market. There is a needto understand and interlink such value systemswith the “rational hierarchic” managementsystems. This is because many water conflictsare conflicts between value systems and can leadto confrontation.
Research isneeded on the
public goodsassociated with
water and the
degree to whichthese are
reflected in
markettransactions.

RE
THIN
KIN
G TH
E MO
SAIC
Investig
atio
ns in
to Lo
cal W
ate
r Managem
ent
Institute of Development Studies (IDS)8-B, Jhalana Institutional Area, Jaipur-302 004
IndiaTel: 0091 141 515726, 517457, Fax: 0091 141 515348
Email: [email protected]
Institute for Social and Environmental Transition (ISET)651 College Avenue
Boulder, Colorado 80302United States of America
Tel: 001 303 413 9140, Fax: 001 303 413 9141Email: [email protected]
Madras Institute of Development Studies (MIDS)79 Second Main RoadGandhi Nagar, Adyar
Chennai 600 020India
Tel: 0091 44 411574, Fax: 0091 44 4910872Email: [email protected]
Nepal Water Conservation Foundation (NWCF)GPO Box No. 2221, Kathmandu,
NepalTel: 00977 1 528111, 542354, Fax: 524816
Email: [email protected]
Vikram Sarabhai Centre for Development Interaction (VIKSAT)Thaltej Tekra Ahmedabad,
Gujarat 380054India
Tel: 0091 79 442651, 442642, Fax: 0091 79 6420242Email: [email protected]