
Amplified Piezoelectric Actuators: Static & Dynamic Applications

Contents lists available at SciVerse ScienceDirect
Journal of Sound and Vibration
Journal of Sound and Vibration 332 (2013) 4656–4667
0022-46http://d
n CorrE-m
journal homepage: www.elsevier.com/locate/jsvi
Piezoelectric energy harvesting from vortex-inducedvibrations of circular cylinder
A. Mehmood a, A. Abdelkefi a, M.R. Hajj a,n, A.H. Nayfeh a, I. Akhtar b, A.O. Nuhait c
a Department of Engineering Science and Mechanics, MC 0219, Virginia Polytechnic Institute and State University,Blacksburg, VA 24061, USAb Department of Mechanical Engineering, NUST College of Electrical & Mechanical Engineering,National University of Sciences & Technology, Islamabad, Pakistanc Department of Mechanical Engineering, King Saud University, Riyadh 11421, Saudi Arabia
a r t i c l e i n f o
Article history:Received 10 September 2012Received in revised form16 March 2013Accepted 19 March 2013
Handling Editor: M.P. Cartmellnization, and post-synchronization regimes. Load resistances (R) in the range 500 Ω≤
Available online 7 May 2013
0X/$ - see front matter & 2013 Elsevier Ltd.x.doi.org/10.1016/j.jsv.2013.03.033
esponding author. Tel.: +1 5402314190; fax:ail address: [email protected] (M.R. Hajj).
a b s t r a c t
The concept of harvesting energy from a circular cylinder undergoing vortex-inducedvibrations is investigated. The energy is harvested by attaching a piezoelectric transducerto the transverse degree of freedom. Numerical simulations are performed for Reynoldsnumbers (Re) in the range 96≤Re≤118, which covers the pre-synchronization, synchro-
R≤5 MΩ are considered. The results show that the load resistance has a significant effecton the oscillation amplitude, lift coefficient, voltage output, and harvested power. Theresults also show that the synchronization region widens when the load resistanceincreases. It is also found that there is an optimum value of the load resistance for whichthe harvested power is maximum. This optimum value does not correspond to the case oflargest oscillations, which points to the need for a coupled analysis as performed here.
& 2013 Elsevier Ltd. All rights reserved.
1. Introduction
Converting ambient and aeroelastic vibrations to a usable form of electric power has been proposed for poweringelectronic components, such as microelectromechanical systems, actuators [1,2], and health monitoring wireless sensors[3–5], or for replacing small batteries that have a finite life span or would require hard and expensive maintenance [6,7].Different transduction mechanisms can be employed for converting these vibrations to electric power, includingelectrostatic [8,9], electromagnetic [10], and piezoelectric [10,11] transduction. Of particular interest is the piezoelectricoption, which has received the most attention because it can be used to harvest energy over a wide range of frequencies [9]and can be easily implemented. To date, most of energy harvesting from mechanical vibrations has concentrated onexploiting base excitations [12–16]. More recently, there has been several investigations into the conversion of aeroelasticvibrations into electric power [17–26].
The flow past a vibrating cylinder is a canonical problem that has been investigated to understand various flow physicsphenomena. When a fluid passes over a cylinder, an organized and periodic array of concentrated vorticity, known asthe von Kármán vortex street, appears in the wake. For stationary cylinders, the vortex-shedding frequency fvs is usuallyexpressed as a nondimensional frequency, called the Strouhal number St ¼ f vsD=U∞, where U∞ and D are, respectively, the
All rights reserved.
+1 5402314574.

A. Mehmood et al. / Journal of Sound and Vibration 332 (2013) 4656–4667 4657
incoming free-stream velocity and the diameter of the cylinder. If the cylinder is allowed to flex or move rigidly, these forcesmay cause it to oscillate; a phenomenon that is usually referred to as vortex-induced vibration (VIV). In cases where thevortices are shed at a frequency near the natural frequency of the cylinder, it undergoes high-amplitude oscillations. Thisphenomenon is called “lock-in” or “synchronization”. In this work, the regimes before and after such synchronization takesplace are, respectively, referred to as pre-synchronous and post-synchronous regimes. For a comprehensive review of theVIV phenomenon of circular cylinders, the reader is referred to Refs. [27–30].
To accurately determine the level of harvested power from vortex-induced vibrations of circular cylinders, one needs toconsider the tight coupling between the mechanical and electrical components of the harvester. This can only be achievedby simultaneously solving the governing equations. In this work, we consider the flow, cylinder's motion and electricaltransduction as one single dynamical system. We then perform tightly coupled simulations to determine the level ofharvested power from this system under different operating conditions including the Reynolds number and load resistance.The focus is on the synchronization region where the oscillation amplitudes remain very high. In Section 2, we discuss thefluid flow solver, piezoaeroelastic modeling and the coupling scheme. In Section 3, validation of the fluid flow solver andthe coupling scheme with previous experimental and numerical results is presented. In Section 4, the effects of the loadresistance on the electromechanical damping and the global natural frequency are discussed. In Section 5, the effects of theReynolds number and the load resistance on the oscillation amplitude, fluctuating lift coefficient, voltage output, andharvested power are discussed. The conclusions are presented in Section 6.
2. Mathematical modeling and numerical simulations
2.1. Fluid flow solver
The numerical simulations of the equations governing the interaction of a flow with a freely oscillating cylinder are verychallenging. The challenge arises because the boundary conditions change as the cylinder moves. Different formulationshave been proposed and developed including the immersed boundary (IB) [31], arbitrary Lagrangian–Eulerian (ALE) [32],and accelerating reference frame (ARF) [33] methods. In this work, we use a parallel CFD code [34,35], in which theincompressible continuity and unsteady Navier–Stokes equations are solved using an accelerated reference frame (ARF)technique. In this technique, the momentum equation is directly coupled with the cylinder motion by adding a referenceframe acceleration term [33,34]; the outer boundary conditions of the flow domain are then updated using the response ofthe cylinder. Note that, in the implemented scheme, the fluid, the cylinder and piezoelectric are considered as elements of asingle dynamical system, and all the governing equations are solved simultaneously. The governing equations of the fluidflow are given by
∂uj
∂xj¼ 0 (1)
∂ui
∂tþ ∂∂xj
ðujuiÞ ¼−∂pρ∂xi
þ ν∂2ui
∂xj∂xj− €xi ; (2)
where i, j¼1,2,3, ui represent the Cartesian velocity components ðu; v;wÞ, ρ, p and ν are the density, pressure and kinematicviscosity of the fluid, respectively. Here, €xi ¼ a is used to denote the cylinder acceleration in the cross-flow direction. In theimplemented flow solver, the governing equations are nondimensionalized using the cylinder diameter D as a referencelength and the incoming free-stream velocity U∞ as a reference velocity. The Reynolds number is defined as Re¼ U∞D=ν.
At the domain boundary, the velocity boundary condition is modified to include the effect of the moving cylinder; that is,
u¼ uD−v; (3)
where uD is the velocity in the inertial frame of reference and v¼ _x is the cylinder velocity. On the cylinder surface, thevelocity boundary condition is ui¼0. The pressure boundary condition is obtained by dotting the domain unit outwardnormal n with Eq. (2) and using the vector identity ∇2u¼∇ð∇:u−∇� ∇� uÞ. The result is
∂p∂n
¼ ρn � u � ∇ð Þu−ν∇�∇� u− €x−∂u∂t
� �(4)
On the far-field boundary, ∂ui=∂t ¼− €xi, whereas on the cylinder surface ∂ui=∂t ¼ 0.The shed vortices generate a time-varying fluid force on the cylinder surface in the cross-stream direction that causes the
vortex-induced vibrations. In our CFD code, this force is computed from the surface pressure as
CL ¼−Z 2π
0p sin θ−
1Re
ωz cos θ� �
dθ; (5)
where ωz is the spanwise vorticity component on the cylinder surface and θ is the angle that the outer normal of the areacomponent makes with the flow direction. As shown in Fig. 1, a body conformal “O”-type grid is employed to simulate theflow over the cylinder. We employ curvilinear coordinates ðξ; η; ζÞ in an Eulerian reference frame. For the specific case of
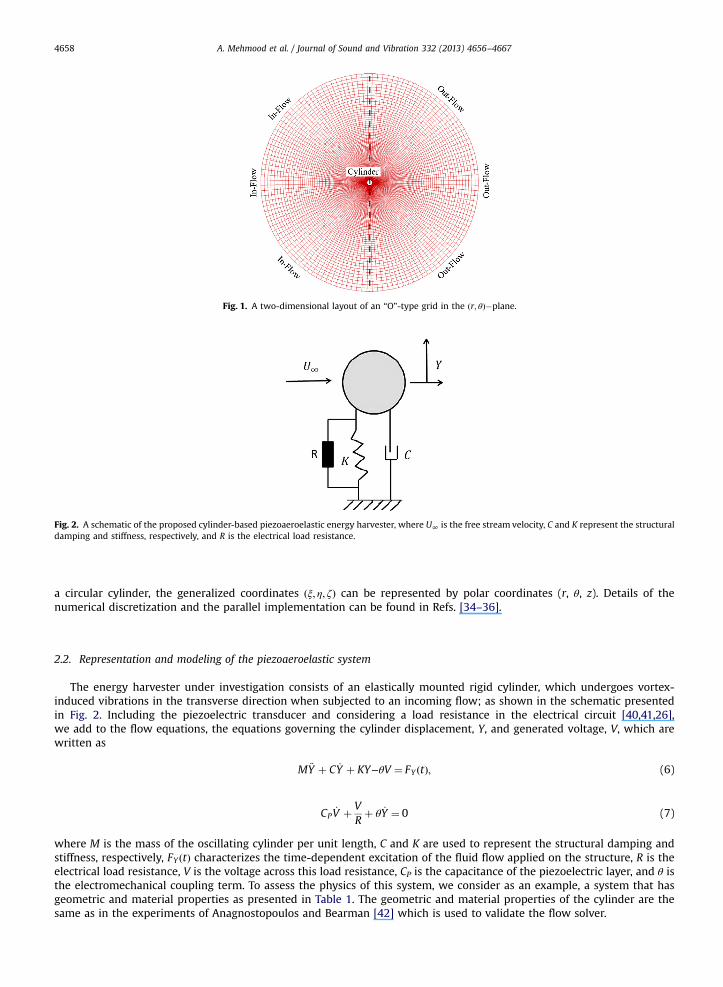
Fig. 1. A two-dimensional layout of an “O”-type grid in the ðr; θÞ�plane.
Fig. 2. A schematic of the proposed cylinder-based piezoaeroelastic energy harvester, where U∞ is the free stream velocity, C and K represent the structuraldamping and stiffness, respectively, and R is the electrical load resistance.
A. Mehmood et al. / Journal of Sound and Vibration 332 (2013) 4656–46674658
a circular cylinder, the generalized coordinates ðξ; η; ζÞ can be represented by polar coordinates (r, θ, z). Details of thenumerical discretization and the parallel implementation can be found in Refs. [34–36].
2.2. Representation and modeling of the piezoaeroelastic system
The energy harvester under investigation consists of an elastically mounted rigid cylinder, which undergoes vortex-induced vibrations in the transverse direction when subjected to an incoming flow; as shown in the schematic presentedin Fig. 2. Including the piezoelectric transducer and considering a load resistance in the electrical circuit [40,41,26],we add to the flow equations, the equations governing the cylinder displacement, Y, and generated voltage, V, which arewritten as
M €Y þ C _Y þ KY−θV ¼ FY ðtÞ; (6)
CP_V þ V
Rþ θ _Y ¼ 0 (7)
where M is the mass of the oscillating cylinder per unit length, C and K are used to represent the structural damping andstiffness, respectively, FY ðtÞ characterizes the time-dependent excitation of the fluid flow applied on the structure, R is theelectrical load resistance, V is the voltage across this load resistance, CP is the capacitance of the piezoelectric layer, and θ isthe electromechanical coupling term. To assess the physics of this system, we consider as an example, a system that hasgeometric and material properties as presented in Table 1. The geometric and material properties of the cylinder are thesame as in the experiments of Anagnostopoulos and Bearman [42] which is used to validate the flow solver.

Table 1Properties of the coupled system.
Physical parameters Values
Mass of the cylinder per unit length (M) [kg] 0.2979Diameter (D) [mm] 1.6Stiffness per unit length (K) [N/m] 579Damping per unit length (C) [N s/m] 0.0325Damping ratio ðζÞ 0.0012Mass ratio ðmnÞ 149.1Cylinder oscillation frequency ðf cÞ [Hz] 7.016Capacitance ðCpÞ [nF] 120Electromechanical coupling ðθÞ [N/V] 1.55�10−3
A. Mehmood et al. / Journal of Sound and Vibration 332 (2013) 4656–4667 4659
2.3. Nondimensionalization and coupling of the piezoaeroelastic system
To generalize and solve the coupled problem, we use the diameter of the cylinder D and the incoming free-streamvelocity U∞ as the length and velocity scales. We then rewrite Eqs. (6) and (7) in nondimensional form as
€Yn þ 4πζ
Ur
� �_Yn þ 2π
UrÞ2
Yn−1Ur
2 !
Vn ¼ 2πmn
CL;
(8)
_Vn þ s1 _Y
n þ s2Ur
Vn ¼ 0 (9)
where Yn ¼ Y=D is the nondimensional transverse cylinder displacement, Ur ¼U∞=f cD is the reduced velocity, ζ¼ C=Ccrit ¼C=2
ffiffiffiffiffiffiffiffiKM
pis the structural damping ratio, mn ¼M=Mf is the mass ratio, Mf¼1
4 ρπD2 represents the fluid mass per unit length
displaced by the cylinder, Vn ¼ V=Vo, Vo ¼Mf 2cD=θ, s1 ¼ θ2=MCPf2c , s2 ¼ 1=RCPf c, and fc is the natural vibration frequency of
the rigid cylinder.The governing electromechanical equations (8) and (9) can be written as a coupled system of three first-order ordinary-
differential equations as
_y1 ¼ y2 (10)
_y2 ¼−2πUr
� �2
y1−4πζUr
y2 þ1
U2r
y3 þ2
πmnCL (11)
_y3 ¼−s1y2−s2Ur
y3 (12)
where y1 ¼ Yn, y2 ¼ _Ynand y3 ¼ Vn.
2.4. Coupling scheme
Numerical simulation of energy harvesting from the vortex-induced vibrations is very challenging as one cannot solve forthe motion of the cylinder and the generated voltage from the load resistance without determining the fluid loads. Yet, onecannot determine the fluid loads without the knowledge of the motion of the cylinder and the effects of energy harvestingon this motion. This complication necessitates that Eqs. (1) and (2), which govern the dynamics of the flow field, and Eqs. (8)and (9), which govern the dynamics of the cylinder and generated voltage, be solved in a coupled manner. To overcome thisdifficulty, we use the Hamming fourth-order predictor–corrector technique [39]. In this technique, the fluid loads (outputof the CFD code) are coupled to ODEs governing the cylinder's motion and harvested voltage. The predicted state of thecylinder, which depends on the load resistance, is then used in the CFD code to compute the new fluid loads. These loads arethen used to compute the new states of the cylinder and voltage using the corrector scheme. The above steps are repeateduntil a match between the fluid loads and the cylinder's motion, as defined by a specified conditional error at each time stepis reached. The Hamming's fourth-order predictor–corrector algorithm requires the solutions at three previous time steps tocompute the solutions (loads and cylinder motion) at the current time step. For the first time step, Euler and modified Eulermethods are used, then Adams–Bashforth two-step predictor and Adams–Moulton two-step corrector schemes are used forsecond time step and Adams–Bashforth three-step predictor and Adams–Moulton three-step corrector schemes are used forthe third time step.

A. Mehmood et al. / Journal of Sound and Vibration 332 (2013) 4656–46674660
To describe the numerical procedure of solving the equations of motion, we represent Eqs. (10)–(12) as
_yt ¼ f ðt; y1ðtÞ; y2ðtÞ; y3ðtÞÞ (13)
1.
The right-hand side of Eq. (13) is evaluated at the present time step t≥4, knowing the solution at the three previous timesteps and the solution is computed using Hamming's predictor asypt ¼ yt−4 þ4Δt3
ð2f t−1−f t−2 þ 2f t−3Þ (14)
2.
The predicted solutions, ytp, are modified by using the truncation-error estimates from the previous time step ðt−1Þ asmpyt ¼ ypt þ1129
et−1 (15)
At this stage (end of predictor section), the response of the cylinder is found and is supplied to the fluid solver in order tocompute the fluid loads at the new time step. Note that the fluid load is computed using the previous flow field with the newstate (i.e., based on the predictor section) of the cylinder. The right-hand sides of Eq. (13) are re-evaluated at the currenttime step.
3.
The modified-predicted solutions are corrected by using the Hamming's corrector equationkþ1yct ¼ 18ð9yt−1−yt−3 þ 3Δtðkf t þ 2f t−1−f t−2ÞÞ (16)
wherekf t ¼ f ðkytÞ (17)
and 1yt ¼ ympt where k is the iteration counter and is set equal to 1 at the beginning of the corrector scheme.
4.
The iterations are stopped after either reaching the specified iterations or after convergence asjkþ1yt−kyt j≤ϵ (18)
where ϵ is the user specified error.
5. After convergence of the solution, the truncation error te for use in the current and next time step is computed aste¼ 9121ðkþ1yt−
kytÞ (19)
6.
The corrected solutions, kþ1yct , are modified by using the new truncation-error estimate, te, asyt ¼ kþ1yct−et (20)
The procedure (1–6) is repeated to march in time. Further details of the numerical discretization, parallel implementation,and the coupling scheme can be found in Refs. [34,35,38,37]. The above overall coupling scheme has been summarized inthe flow chart in Fig. 3.
3. Validation of the fluid flow solver and the coupling scheme
The fluid flow solver and the coupling scheme are validated by comparing the cylinder's displacement with experimental resultsof Anagnostopoulos and Bearman [42] and other numerical simulations performed by Yang et al. [43] and Schulz and Kallinderis[44]. We employ 192�256 grid points in the θ- and z-directions, respectively, with a computational domain of 25D. We increasethe Reynolds number with small increments from Re¼94 to Re¼140. This range corresponds to reduced velocities from Ur ¼ 5:23to Ur ¼ 7:79. We note that the cylinder is allowed to move only in the transverse direction under the action of the fluid forces.
Fig. 4 shows the variation of the nondimensional maximum oscillation amplitude Ymax=D of the cylinder as a function ofthe Reynolds number. From this plot, we note that we are able to obtain a better agreement of the location of the bifurcationpoint (onset of synchronization) with the experimental results than previously reported numerical simulations [43,44]. Still,there is a small difference between our simulations and the experimental data [42] when comparing the maximumamplitude and the range of the synchronization regime. This difference, which has been reported by the other numericalstudies [43,44], could be due to the three-dimensional effects, since the experiments were performed without end plates.
4. Effect of the load resistance on the onset of synchronization
Adding a load resistance results in a variation of the natural frequency and damping of the coupled system. Because theonset of the synchronization region is defined by matching the natural frequency of the coupled electromechanical system

Time step > 3
No
Evaluate RHS of EQM (eqn. 13) with fluid load computed at the previous time step
Compute new fluid load using new state of the cylinder and
previous flow field as initial conditions (i.e., wake is not moved) and
compute the new fluid loads
PREDICTOR
Predict state of the cylinder (eqn. 14)
Modify the predicted state of the cylinder using the
truncation error (eqn. 15)
START
Evaluate RHS of EQM (eqn. 13) with new loads
Correct the new state Of the cylinder (eqn. 16)
Converge (eqn. 18) ?
YES Compute the truncation error (eqn. 19) and final
corrected state of the cylinder (eqn. 20) , and then update the fluid load (Convect the wake)
Final Time step YES
STOP NO
NextIteration
Iterate
CORRECTOR
Fig. 3. Layout of predictor–corrector scheme.
100 110 120 130 1400
0.1
0.2
0.3
0.4
0.5
0.6
0.7
Re
Ym
ax/D
Exp. in Anagnostopoulos et al(1992).Simul. J.Yang et al(2008)Simul. Schulz and Kalilinderis (1998)Simul. Present
Fig. 4. Comparison of maximum displacement amplitudes as predicted in present computations ( ) with the experimental measurements of [42] (-○) andnumerical computations of [43] ( ) and [44] (+). (For interpretation of the references to color in this figure caption, the reader is referred to the webversion of this article.)
A. Mehmood et al. / Journal of Sound and Vibration 332 (2013) 4656–4667 4661

A. Mehmood et al. / Journal of Sound and Vibration 332 (2013) 4656–46674662
with the frequency of the vortex-induced vibration, we perform, as a first step, a linear analysis to determine the variationsin the natural frequency and damping that are due to adding the load resistance. As such, we consider the electromechanicalgoverning equations of the cylinder, which are rewritten as
M €Y þ C _Y þ KY−θV ¼ 0 (21)
CP_V þ V
Rþ θ _Y ¼ 0 (22)
we rewrite Eqs. (21) and (22) as the following set of first-order differential equations:
_X1 ¼ X2; (23)
_X2 ¼−ð2πf cÞ2X1−4πf cζX2 þθ
MX3; (24)
_X3 ¼−θ
CpX2−
1CpR
X3 (25)
where X1 ¼ Y , X2 ¼ _Y and X3 ¼ V .Eqs. (23)–(25) can be expressed in vector form as
_X ¼ AðRÞX (26)
where
AðRÞ ¼0 1 0
−ð2πf cÞ2 −4πf cζ θM
0 − θCp
− 1CpR
0BB@
1CCA
and
X¼X1
X2
X3
0B@
1CA
Variations of the real and imaginary parts of the eigenvalue ki of the linear electromechanical coupled system are shownin Fig. 5. It is clear from Fig. 5(b) that, for the considered parameters of the coupled system, the global natural frequencyremains almost constant, with a value near 44.05 rad/s, for small values of the load resistance Ro30 kΩ. This value of theglobal natural frequency ðR¼ 100 ΩÞ is referred as the short global frequency. For large values of R, the global naturalfrequency becomes equal to 44.8 rad/s. This value of the global natural frequency R¼ 10 MΩÞ is referred to the open globalfrequency. The plot in Fig. 5(a) shows that the electromechanical damping remains very low for small values of the loadresistance, increases to a maximum for load resistance values of nearly 200 kΩ, and then decreases and remains low forlarger values of the load resistance. This maximum value in the coupled electromechanical damping is due to the resistiveshunt damping effect. This analysis shows that the load resistance impacts the natural frequency and damping of thecoupled electromechanical system. The impact of these variations in both of the frequency and damping on the systemoutputs is discussed further in Section 5.2.
R(Ohms)
Re(
k i)
0
0.1
0.2
0.3
0.4
0.5
0.6
R(Ohms)
Im((
k i)
102 103 104 105 106 107102 103 104 105 106 10744
44.4
44.8
45.2
Fig. 5. Variation of the real kr and imaginary ki parts of the eigenvalue k of the linear system with the load resistance.

A. Mehmood et al. / Journal of Sound and Vibration 332 (2013) 4656–4667 4663
5. Results and discussion
5.1. Effect of Reynolds number on the system outputs
To investigate harvesting energy from the considered piezoaeroelastic system, we perform numerical simulations of theflow over a rigid cylinder that moves in the cross-flow direction and has a piezoelectric transducer attached to this direction.As the ultimate goal is to power small sensors and actuators, we limit this study to a Reynolds number in the range96≤Re≤118, which corresponds to a cylinder having a diameter ranging from 0.1 mm to 1.6 mm and placed in a waterstream of 0:96 m=s≤U∞≤1:18 m=s and/or 0:06 m=s≤U∞≤0:07375 m=s. This range corresponds to reduced velocities in therange 5:34≤Ur≤6:57. Note that for all cases the flow over a stationary cylinder was initially computed for the same Reynoldsnumber. Then, the cylinder was allowed to move and the frequency of vortex shedding (fvs), the cylinder oscillationfrequency, the voltage output, and the harvested power are recorded, after reaching steady state.
We conducted numerical simulations for a wide range of load resistances. The same tendency in the system outputs wasobserved over the whole range. To present the important physical observations, we consider the response of the cylinderand the level of generated voltage for R¼ 5 kΩ while varying the Reynolds number. In Fig. 6, we show time histories of thecylinder displacement, lift coefficient, and associated voltage output for the pre-synchronous, synchronous, and post-synchronous regimes. In the pre-synchronous regime (Re¼96), the cylinder oscillations remain very low ðY=D∼10−3Þ, asshown in Fig. 6(a). The lift coefficient, presented in Fig. 6(b), oscillates around a zero mean with a peak value of 0.325. Theresponse in this regime is quasi-periodic consisting of two major frequencies, the shedding frequency and the cylinder
720 730 740 750 760 770 780−5
0
5 x 10⁻³
Time
Y/D
720 740 760 780−0.4
−0.2
0
0.2
0.4
Time
CL
720 740 760 780−1.5
−1
−0.5
0
0.5
1
1.5 x 10⁻⁴
Time
V/V
o
720 730 740 750 760 770 780−0.5
0
0.5
Time
Y/D
720 740 760 780−1.5
−1
−0.5
0
0.5
1
1.5
Time
CL
720 740 760 780−0.02
−0.01
0
0.01
0.02
Time
V/V
o
600 650 700−0.03
−0.02
−0.01
0
0.01
0.02
0.03
Time
Y/D
600 650 700−0.5
0
0.5
Time
CL
600 650 700
−5
0
5
x 10−4
Time
V/V
o
Fig. 6. Time histories of the transverse displacement, fluctuating lift coefficient, and voltage output for the pre-synchronous (Re=96) (a,b,c), synchronous(Re=104) (d,e,f), and post-synchronization (Re=116) (g,h,i) regimes, respectively, when the load resistance R¼ 5 kΩ.

0 0.5 1 1.5 210−15
10−10
10−5
100
Frequency (fD/U∞)
Spe
ctra
l den
sity Lift coefficient
Displacement
0.1602
0 0.5 1 1.5 210−10
10−8
10−6
10−4
10−2
100
Frequency (fD/U∞)
Spe
ctra
l den
sity Lift coefficient
Displacement
0.1717
0 0.5 1 1.5 210−15
10−10
10−5
100
Frequency (fD/U∞)
Spe
ctra
l den
sity Lift coefficient
Displacement
0.1669
Fig. 7. Power spectra of (a) pre-synchronous, (b) synchronous, and (c) post-synchronous regimes for an oscillating cylinder in the cross-flow direction atthe specified Reynolds number when R¼ 5 kΩ.
A. Mehmood et al. / Journal of Sound and Vibration 332 (2013) 4656–46674664
global frequency. The voltage output in Fig. 6(c) shows that, as expected, its time history follows very closely that of thedisplacement. Similar values for the displacement, lift, and voltage are observed for Reynolds numbers up to Re¼ 104.At Re¼ 104, high oscillation amplitudes of the cylinder are observed. Time histories of the cylinder displacement, liftcoefficient, and voltage output at Re¼ 104 are shown in Fig. 6(d), (e), and (f), respectively. These plots show periodicresponses with a dominant frequency, which is the cylinder natural frequency. These large oscillation amplitudes extend upto Re¼114. This is due to the fact that the range from Re¼104 to Re¼114 corresponds to the synchronization regime atR¼ 5 kΩ. At Re¼116, the synchronization phenomenon bifurcates, a high level of modulation is observed in the timehistories of the displacement and voltage, as shown in Fig. 6(g) and (i). Modulations also exist in the time history of the liftcoefficient presented in Fig. 6(h). For all considered cases, we note that the time histories of the transverse displacement andharvested voltage have the same trend. This is expected because the generated voltage is directly related to the transversedisplacement through the Gauss law (Eq. (22)).
Further insight into the different aspects of the displacement and lift coefficient can be obtained from the power spectraof their time histories, as shown in Fig. 7. When Re¼96, in the pre-synchronous regime, Fig. 7(a) shows two spectral peaks:one peak at 0.1602, which is the vortex shedding frequency, and a smaller one at 0.185, which corresponds to the cylinderglobal natural frequency. Here, it can be inferred that the response is quasi-periodic and is not synchronized with thecylinder global frequency. In the synchronous regime (Re¼104), Fig. 7(b) shows that both of the lift and displacement havethe same oscillation frequency. Moreover, the vortices are shed at the cylinder global natural frequency (i.e., f vs≅f c),indicating that synchronization has taken place as the two frequencies have merged. In the post-synchronous regime,(Re¼116), Fig. 7(c) shows three dominant peaks: the vortex shedding frequency ðf vs ¼ 0:1669Þ and two asymmetricsidebands, indicating an amplitude and phase modulated response.
5.2. Effect of the load resistance on the system outputs
Numerical simulations are performed for different values of the electrical load resistances over a range of Reynoldsnumbers that covers the pre-synchronous, synchronous, and post-synchronous regimes. Fig. 8(a) shows variations of theroot mean square (rms) amplitudes of the cylinder oscillations with the Reynolds number and load resistance. The plot showsthat the synchronization phenomenon starts for all load resistances at about the same Reynolds number (i.e., Re¼104). This isdue to the fact that the system overall global frequency does not change appreciably with the load resistance (see Fig. 5(b)).

100 105 110 11510−4
10−3
10−2
10−1
100
101
Re
Vrm
s(vol
ts)
R=500ΩR=5KΩR=100KΩR=5MΩ
103 104 105 106
10−3
10−2
10−1
100
R(Ω)
Vrm
s(vol
ts)
Re=96Re=100Re=104Re=106Re=114Re=116
Fig. 9. Variations of the voltage output with the (a) Reynolds number and (b) load resistance.
100 105 110 1150
0.05
0.1
0.15
0.2
0.25
0.3
0.35
Re
Yrm
s/D
R=5KΩR=100KΩR=500KΩR=5MΩ
100 105 110 1150.1
0.2
0.3
0.4
0.5
0.6
0.7
0.8
Re
CL
R=5KΩR=100KΩR=500KΩR=5M Ω
Fig. 8. Variations of the cylinder displacement (Y rms=D) and lift coefficient (CL) with the Reynolds number for different load resistances: (a) cylinder'sdisplacement, (b) lift coefficient.
A. Mehmood et al. / Journal of Sound and Vibration 332 (2013) 4656–4667 4665
However, it is important to note that the synchronized amplitude of the cylinder oscillations varies significantly with theload resistance. The amplitude of oscillations is high for small values of the load resistance with a maximum value ofYrms=D¼ 0:3229 for R¼ 5 kΩ. This amplitude decreases to 0.0901 for R¼ 100 kΩ and increases again to 0.3107 for R¼ 5 MΩ.For R¼ 100 kΩ, the amplitude of cylinder oscillations is the smallest ones compared to the rest of the considered loadresistances. This is due to the fact that maximum value of the coupled electromechanical damping is obtained at this loadresistance, as shown in the linear analysis performed in Section 4 (see Fig. 5(a)). Variations of the rms fluctuating liftcoefficient with the Reynolds number and load resistances are shown in Fig. 8(b). The plot shows that the behavior of the liftcoefficient is qualitatively similar to that of the cylinder oscillation amplitude. In fact, smaller values of the fluctuating liftcoefficient are obtained for R¼ 100 kΩ and R¼ 500 kΩ. On the other hand, we note the possibility of antiresonanceoccurring after the resonance peak in terms of Reynolds number for load resistance values equal to 100 kΩ, 500 kΩ and5 MΩ.
Variations of the root mean square values of the voltage with the Reynolds number for different values of the electricalload resistance are shown in Fig. 9(a). This figure shows that, for all considered load resistances, the voltage output increasesas the electrical load resistance increases. The maximum voltage is attained when the Reynolds number reaches Re¼104.Above this Reynolds number, the voltage remains almost constant over the whole synchronization regime. It is alsointeresting to note that, by increasing the load resistance, the synchronization regime is slightly expanded to cover higherReynolds numbers. For example, for the load resistance R¼ 500 Ω, synchronization starts at the critical value Re¼104 andextends to Re¼112. In contrast, for R¼ 5 MΩ, synchronization starts at the same critical value Re¼104 but extends toRe¼114. At Re¼116, the voltage is low. Still, the voltage in this regime (post-synchronous regime) is relatively higher incomparison to that in the pre-synchronous regime. This behavior is clearly shown in Fig. 9(b), where the rms values of thevoltage are plotted as a function of the load resistance. In this figure, the voltage output is plotted for the pre-synchronous,synchronous, and post-synchronous regimes. For the sake of discussion, we plot only two values from each regime for allconsidered resistances. Fig. 9(b) shows that the generated voltages at the Reynolds numbers Re¼96 and Re¼100, which arepart of the pre-synchronous regime, are smaller than the corresponding values in the post-synchronous regime (i.e., Re¼114and 116) for all load resistances. However, the voltage output is the largest in the synchronous regime (i.e., Re¼104 and 106).Fig. 9(b) also shows that the voltage is larger at higher values of the load resistance. However, the rate of increase is smaller

100 105 110 11510−12
10−10
10−8
10−7
10−8
10−9
10−10
10−6
10−5
10−6
10−4
Re
Pav
g(wat
t)
R=500ΩR=5KΩR=100KΩR=500KΩR=5MΩ
103 104 105 106
R(Ω)
Pav
g(wat
t)
Re=96Re=100Re=104Re=106Re=114Re=116
Fig. 10. Variations of the harvested power with the (a) Reynolds number and (b) load resistance.
A. Mehmood et al. / Journal of Sound and Vibration 332 (2013) 4656–46674666
for R≥500 kΩ. Similar observations have been made in the literature of piezoelectric energy harvesting from ambientvibrations (based on cantilever beams) [45] and from aeroelastic vibrations (based on wings) [18].
Fig. 10(a) shows variations of the harvested power with the Reynolds number for different values of the electrical loadresistance. The generated power is computed from the voltage according to the following relation:
Pavg ¼ V2rms
R(27)
where V rms is the rms value of the voltage output and R is the electrical load resistance across the piezoceramic layer. Fig. 10(a) shows that the highest levels of harvested power are obtained in the synchronization region for all considered loadresistances. However, unlike the voltage output, the harvested power achieves a maximum and then decreases when usinghigher load resistances. This behavior is clear from Fig. 10(b), where the harvested power is plotted as a function of the loadresistance. The plot shows that the harvested power increases as the electrical load increases from R¼ 500 Ω to R¼ 100 kΩ.When the value of the load resistance is set equal to R¼ 500 kΩ, the harvested power starts to decrease. Here, the maximumpower is harvested at R¼ 500 kΩ. Of interest, however, is the fact that, for this optimum resistance, the electromechanicaldamping is also maximum (see Fig. 5(a)) due to shunt damping effect, this translates into lower amplitudes of the cylinderoscillations (see Fig. 8(b)). This means that the largest oscillations do not lead to maximum generated power, as one wouldexpect from a non-coupled analysis. The existence of an optimum value for the load resistance for which the highest levelsof harvested power are obtained has been observed in the literature of piezoelectric energy harvesting from ambientvibrations (based on cantilever beams) [46,47] and from aeroelastic vibrations (based on wings) [18,20].
6. Conclusions
We investigated in detail the concept of energy harvesting from vortex-induced vibrations of a circular cylinder. Wesolved simultaneously in the time domain for the motions of the cylinder, piezoelectric transducer, and flow using aparallelized computer solver. The simulations were performed for a range of Reynolds numbers that covers the pre-synchronization, synchronization, and post-synchronization regimes. The effect of the load resistance on the harvesterresponse has been analyzed. Based on the linear analysis, we have found that the load resistance impacts the onset ofsynchronization because it affects the global frequency and damping of the electromechanical system. The results also showthat the voltage output continuously increases when increasing the load resistance. In contrast, there is an optimum value ofthe electrical load resistance for which the level of the harvested power is maximum. This value corresponds to theminimum value of the cylinder's displacement which shows that the electrical and mechanical components of the systemare tightly coupled.
Acknowledgment
A. Mehmood gratefully acknowledges the University of Engineering & Technology (UET) Peshawar, Pakistan, for thefinancial support during his graduate studies. The numerical simulations were performed on the Virginia Tech AdvancedResearch Computing - System X. The allocation grant and support provided by the staff are also gratefully acknowledged.
References
[1] P. Muralt, Ferroelectric thin films for micro-sensors and actuators: a review, Journal of Micromechanics and Microengineering 10 (2000) 136–146.[2] W. Zhou, W.H. Liao, W.J. Li, Analysis design of a self-powered piezoelectric microaccelerometer, Proceedings of the Smart Structures and Materials
Conference; Proceedings of SPIE, Vol. 5763, 2005, pp. 233–240.

A. Mehmood et al. / Journal of Sound and Vibration 332 (2013) 4656–4667 4667
[3] D.J. Inman, B.L. Grisso, Towards autonomous sensing, Proceedings of the Smart Structures and Materials Conference; Proceedings of SPIE, Vol. 6174, 2006,p. 61740T.
[4] J.M. Renno, M.F. Daqaq, D.J. Inman, On the optimal energy harvesting from a vibration source, Journal of Sound and Vibration 320 (2009) 386–405.[5] S. Roundy, P.K. Wright, A piezoelectric vibration based generator for wireless electronics, Smart Materials and Structures 13 (2004) 1131–1142.[6] I.D. Capel, H.M. Dorrell, E.P. Spencer, M.W. Davis, The amelioration of the suffering associated with spinal cord injury with subperception transcranial
electrical stimulation, Spinal Cord 41 (2003) 109–117.[7] S. Priya, D. Popa, F. Lewis, Energy efficient mobile wireless sensor networks, Proceedings of the ASME International Mechanical Engineering Congress
Exposition, Chicago, IL, 2006, pp. 491–498.[8] D. Arnold, Review of microscale magnetic power generation, IEEE Transactions on Magnetics 43 (2007) 3940–3951.[9] P.D. Mitcheson, P. Miao, B.H. Start, E.M. Yeatman, A.S. Holmes, T.C. Green, MEMS electrostatic micro-power generator for low frequency operation,
Sensors Actuators A 115 (2004) 523–529.[10] S.R. Anton, H.A. Sodano, A review of power harvesting using piezoelectric materials (2003–2006), Smart Materials and Structures 16 (2007) R1–R21.[11] K.A. Cook-Chennault, N. Thambi, A.M. Sastry, Powering MEMS portable devices—a review of non-regenerative and regenerative power supply systems
with emphasis on piezoelectric energy harvesting systems, Smart Materials and Structures 17 (2008) 043001.[12] M.A. Karami, D.J. Inman, Analytical modeling and experimental verification of the vibrations of the zigzag microstructure for energy harvesting,
Journal of Vibration and Acoustics 133 (2011) 011002.[13] R. Masana, M.F. Daqaq, Electromechanical modeling and nonlinear analysis of axially loaded energy harvesters, Journal of Vibration and Acoustics 133
(2011) 1–10.[14] A. Abdelkefi, A.H. Nayfeh, M.R. Hajj, Global nonlinear distributed-parameter model of parametrically excited piezoelectric energy harvesters, Nonlinear
Dynamics 67 (2012) 1147–1160.[15] A. Abdelkefi, A.H. Nayfeh, M.R. Hajj, Effects of nonlinear piezoelectric coupling on energy harvesters under direct excitation, Nonlinear Dynamics 67
(2012) 1221–1232.[16] M.F. Daqaq, On intentional introduction of stiffness nonlinearities for energy harvesting under white Gaussian excitations, Nonlinear Dynamics 69
(2012) 1063–1079.[17] M. Bryant, E. Garcia, Energy harvesting: a key to wireless sensor nodes, Proceedings of the SPIE 7493 (2009) 74931W.[18] A. Abdelkefi, A.H. Nayfeh, M.R. Hajj, Modeling and analysis of piezoaeroelastic energy harvesters, Nonlinear Dynamics 67 (2011) 925–939.[19] A. Abdelkefi, A.H. Nayfeh, M.R. Hajj, Design of piezoaeroelastic energy harvesters, Nonlinear Dynamics 68 (2011) 519–530.[20] A. Abdelkefi, A.H. Nayfeh, M.R. Hajj, Enhancement of power harvesting from piezoaeroelastic systems, Nonlinear Dynamics 68 (2011) 531–541.[21] C. De Marqui, W.G.R. Vieira, A. Erturk, D.J. Inman, Modeling and analysis of piezoelectric energy harvesting from aeroelastic vibrations using the
doublet-lattice method, Journal of Vibration and Acoustics 133 (2011) 011003.[22] A. Abdelkefi, M.R. Hajj, A.H. Nayfeh, Sensitivity analysis of piezoaeroelastic energy harvesters, Journal of Intelligent Material Systems and Structures 23
(2012) 1523–1531.[23] A. Abdelkefi, Z. Yan, M.R. Hajj, Modeling and nonlinear analysis of piezoelectric energy harvesting from transverse galloping, Smart Materials and
Structures 22 (2013) 025016.[24] A. Abdelkefi, M.R. Hajj, A.H. Nayfeh, Power harvesting from transverse galloping of square cylinder, Nonlinear Dynamics 70 (2012) 1377–1388.[25] H.D. Akaydin, N. Elvin, Y. Andrepoulos, Energy harvesting from highly unsteady fluid flows using piezoelectric materials, Journal of Intelligent Material
Systems and Structures 21 (2010) 1263–1278.[26] A. Abdelkefi, M.R. Hajj, A.H. Nayfeh, Phenomena and modeling of piezoelectric energy harvesting from freely oscillating cylinders, Nonlinear Dynamics
70 (2012) 1355–1363.[27] P.W. Bearman, Vortex shedding from oscillating bluff bodies, Annual Review of Fluid Mechanics 16 (1984) 195–1984.[28] C.H.K. Williamson, Vortex dynamics in the cylinder wake, Annual Review of Fluid Mechanics 28 (1996) 477–539.[29] C.H.K. Williamson, R. Govardhan, Vortex-induced vibrations, Annual Review of Fluid Mechanics 36 (2004) 413–455.[30] R.D. Gabbai, H. Benaroya, An overview of modeling and experiments of vortex-induced vibration of circular cylinder, Journal of Sound and Vibration
282 (2005) 575–616.[31] R. Mittal, G. Iaccarino, Immersed boundary methods, Annual Review of Fluid Mechanics 37 (2005) 199–239-261.[32] C.W. Hirt, A.A. Amsden, J.L. Cook, An arbitrary Lagrangian–Eulerian computing method for all flow speeds, Journal of Computational Physics 14 (1974)
227–253.[33] H.M. Blackburn, R. Henderson, A study of two-dimensional flow past an oscillating cylinder, Journal of Fluid Mechanics385 (1999) 255–286.[34] I. Akhtar, Parallel Simulations, Reduced-order Modeling, and Feedback Control of Vortex Shedding using Fluidic Actuators, PhD Dissertation, Virginia
Tech, Blacksburg, VA, 2008.[35] I. Akhtar, A.H. Nayfeh, C.J. Ribbens, On the stability and extension of reduced-order Galerkin models in incompressible flows: a numerical study of
vortex shedding, Theoretical and Computational Fluid Dynamics 23 (3) (2009) 213–237.[36] I. Akhtar, O.A. Marzouk, A.H. Nayfeh, A van der Pol-duffing oscillator model of hydrodynamic forces on canonical structures, Journal of Computational
Nonlinear Dynamics 4 (2009) 041006.[37] A. Mehmood, A. Abdelkefi, I. Akhtar, A.H. Nayfeh, A. Nuhait, M.R. Hajj, Linear and nonlinear active feedback controls for vortex-induced vibrations of
circular cylinders, Journal of Vibration and Control, doi: http://dx.doi.org/10.1177/1077546312469425, in press.[38] M. Ghommem, A. Abdelkefi, A. Nuhait, M.R. Hajj, Aeroelastic analysis and nonlinear dynamics of an elastically mounted wing, Journal of Sound and
Vibration 331 (2012) 5774–5787.[39] B. Carnahan, H.A. Luther, J.O. Wilkes, Applied Numerical Methods, John Wiley and Sons, Inc., New York, 1969.[40] S. Adhikari, M.I. Friswell, D.J. Inman, Piezoelectric energy harvesting from broadband random vibrations, Smart Materials and Structures 18 (2009)
115005.[41] S.F. Ali, M.I. Friswell, S. Adhikari, Piezoelectric energy harvesting with parametric uncertainty, Smart Materials and Structures 19 (2010) 105010.[42] P. Anagnostopoulos, P.W. Bearman, Response characteristics of a vortex-excited cylinder at low Reynolds numbers, Journal of Fluids and Structures 6
(1992) 39–50.[43] J. Yang, S. Preidikman, E. Balaras, A strongly coupled, embedded-boundary method for fluid–structure interactions of elastically mounted rigid bodies,
Journal of Fluids and Structures 24 (2008) 167–182.[44] K.W. Schulz, Y. Kallinderis, Unsteady flow structure interaction for incompressible flows using deformable hybrid grids, Journal of Computational
Physics 143 (1998) 569–597.[45] A. Erturk, D.J. Inman, A distributed parameter electromechanical model for cantilevered piezoelectric energy harvesters, Journal of Vibration and
Acoustics 130 (2008) 041002.[46] A. Abdelkefi, F. Najar, A.H. Nayfeh, S. Ben Ayed, An energy harvester using piezoelectric cantilever beams undergoing coupled bending–torsion
vibrations, Smart Materials and Structures 20 (2011) 115007.[47] A. Abdelkefi, A.H. Nayfeh, M.R. Hajj, F. Najar, Energy harvesting from a multifrequency response of a tuned bending–torsion system, Smart Materials
and Structures 21 (2012) 075029.
Copyright © 2022 FDOKUMEN