Dielectric and Thermal Investigations on PbNb2O6 in Pure Piezoelectric Phase and Pure...
15
PLEASE SCROLL DOWN FOR ARTICLE This article was downloaded by: [De, U.] On: 16 December 2010 Access details: Access Details: [subscription number 930410133] Publisher Taylor & Francis Informa Ltd Registered in England and Wales Registered Number: 1072954 Registered office: Mortimer House, 37- 41 Mortimer Street, London W1T 3JH, UK Integrated Ferroelectrics Publication details, including instructions for authors and subscription information: http://www.informaworld.com/smpp/title~content=t713618055 Dielectric and Thermal Investigations on PbNb 2 O 6 in Pure Piezoelectric Phase and Pure Non-Piezoelectric Phase Udayan De a ; Kriti Ranjan Sahu ab ; Keka R. Chakraborty a ; Swadesh K. Pratihar c a Variable Energy Cyclotron Centre, Kolkata, India b Physics Dept., Egra SSB College, Egra, W. Bengal, Purba Medinipur, India c Dept. of Ceramic Engg., National Inst. of Tech., Orissa, Rourkela, India Online publication date: 01 December 2010 To cite this Article De, Udayan , Sahu, Kriti Ranjan , Chakraborty, Keka R. and Pratihar, Swadesh K.(2010) 'Dielectric and Thermal Investigations on PbNb 2 O 6 in Pure Piezoelectric Phase and Pure Non-Piezoelectric Phase', Integrated Ferroelectrics, 119: 1, 96 — 109 To link to this Article: DOI: 10.1080/10584587.2010.495666 URL: http://dx.doi.org/10.1080/10584587.2010.495666 Full terms and conditions of use: http://www.informaworld.com/terms-and-conditions-of-access.pdf This article may be used for research, teaching and private study purposes. Any substantial or systematic reproduction, re-distribution, re-selling, loan or sub-licensing, systematic supply or distribution in any form to anyone is expressly forbidden. The publisher does not give any warranty express or implied or make any representation that the contents will be complete or accurate or up to date. The accuracy of any instructions, formulae and drug doses should be independently verified with primary sources. The publisher shall not be liable for any loss, actions, claims, proceedings, demand or costs or damages whatsoever or howsoever caused arising directly or indirectly in connection with or arising out of the use of this material.
-
Upload
independent -
Category
Documents
-
view
0 -
download
0
Transcript of Dielectric and Thermal Investigations on PbNb2O6 in Pure Piezoelectric Phase and Pure...
PLEASE SCROLL DOWN FOR ARTICLE
This article was downloaded by: [De, U.]On: 16 December 2010Access details: Access Details: [subscription number 930410133]Publisher Taylor & FrancisInforma Ltd Registered in England and Wales Registered Number: 1072954 Registered office: Mortimer House, 37-41 Mortimer Street, London W1T 3JH, UK
Integrated FerroelectricsPublication details, including instructions for authors and subscription information:http://www.informaworld.com/smpp/title~content=t713618055
Dielectric and Thermal Investigations on PbNb2O6 in Pure PiezoelectricPhase and Pure Non-Piezoelectric PhaseUdayan Dea; Kriti Ranjan Sahuab; Keka R. Chakrabortya; Swadesh K. Pratiharc
a Variable Energy Cyclotron Centre, Kolkata, India b Physics Dept., Egra SSB College, Egra, W. Bengal,Purba Medinipur, India c Dept. of Ceramic Engg., National Inst. of Tech., Orissa, Rourkela, India
Online publication date: 01 December 2010
To cite this Article De, Udayan , Sahu, Kriti Ranjan , Chakraborty, Keka R. and Pratihar, Swadesh K.(2010) 'Dielectric andThermal Investigations on PbNb2O6 in Pure Piezoelectric Phase and Pure Non-Piezoelectric Phase', IntegratedFerroelectrics, 119: 1, 96 — 109To link to this Article: DOI: 10.1080/10584587.2010.495666URL: http://dx.doi.org/10.1080/10584587.2010.495666
Full terms and conditions of use: http://www.informaworld.com/terms-and-conditions-of-access.pdf
This article may be used for research, teaching and private study purposes. Any substantial orsystematic reproduction, re-distribution, re-selling, loan or sub-licensing, systematic supply ordistribution in any form to anyone is expressly forbidden.
The publisher does not give any warranty express or implied or make any representation that the contentswill be complete or accurate or up to date. The accuracy of any instructions, formulae and drug dosesshould be independently verified with primary sources. The publisher shall not be liable for any loss,actions, claims, proceedings, demand or costs or damages whatsoever or howsoever caused arising directlyor indirectly in connection with or arising out of the use of this material.

Integrated Ferroelectrics, 119:96–109, 2010Copyright © Taylor & Francis Group, LLCISSN: 1058-4587 print / 1607-8489 onlineDOI: 10.1080/10584587.2010.495666
Dielectric and Thermal Investigations on PbNb2O6in Pure Piezoelectric Phase and Pure
Non-Piezoelectric Phase
UDAYAN DE,1,∗ KRITI RANJAN SAHU,1,2
KEKA R. CHAKRABORTY,1 AND SWADESH K. PRATIHAR3
1Variable Energy Cyclotron Centre, 1/AF Bidhannagar, Kolkata 700064, India2Physics Dept., Egra SSB College, Egra, Purba Medinipur 721429, W. Bengal,India3Dept. of Ceramic Engg., National Inst. of Tech., Rourkela 769 008, Orissa, India
A high piezoelectric transition temperature is indicated for present orthorhombic sam-ples of lead meta-niobate (PbNb2O6) by the high value of the temperature (Tm) at whichthe real part (ε′) of electrical permittivity peaks. It is 573 to 580◦C. The imaginarycomponent (ε′′) increases sharply at these temperatures. Cooling run after heating to700◦C gives changed values of ε′ and ε′′ and Tm. Present work reports impedance spec-troscopy (up to 700◦C over 20 Hz to 5.5 MHz) and Differential Scanning Calorimetry orDSC on the pure orthorhombic phase, and, for the first time, on the pure rhombohedralphase. DSC shows an endothermic dip across Tm during heating and an exothermicpeak during cooling for the orthorhombic sample only.
Key words Piezoelectric material; electrical permittivity; impedance spectroscopy andDSC
1. Introduction
Devices, like piezoelectric sensors and actuators, for certain high temperature applicationsin power, automobile and other sectors cannot be constructed from popular piezoelectricmaterials like barium titanate (BT) and lead zirconate titanate (PZT) due to the low valuesof their Curie temperature. Among the few materials in different stages of development forhigher temperature devices, less work has been done on the old but incompletely studiedpiezoelectric material [1] of Lead Meta-Niobate (PbNb2O6 or PN). Room temperaturestructure of PN can be [1–3] either rhombohedral or orthorhombic. Only the latter isferroelectric with possible piezoelectric properties. Fewer studies on PN, in spite of reportsof an attractively high Curie temperature (517◦C [2] to 570◦C [3] in different papers), canbe attributed basically to the problem of preparing the piezoelectric form (the meta-stableorthorhombic structure) in pure phase. We have overcome [3] that problem. Our quenching(Q) led to pure orthorhombic phase of PN, to be called Q PN. Suitable slow-cooling (S)led to S PN sample with almost pure rhombohedral phase.
Received December 22, 2009; in final form March 31, 2010.∗Corresponding author. E-mail: [email protected], [email protected]
[918]/96
Downloaded By: [De, U.] At: 20:08 16 December 2010

Dielectric and Thermal Investigations on PbNb2O6 [919]/97
Curie Temperature (Tc) for BT and PZT based materials cannot be improved above130◦C [4, 5] and 380◦C, respectively, even by the best known substitutions. So, there isan interest in reviving PN as a piezoelectric ceramic for high temperature applications inenergy, automobile and other sectors. The peak (ε′
max) in the permittivity curve (ε′ vs. Tgraph) that defines ferroelectric (at T < Tm) to paraelectric (at T > Tm) phase transition, isa measure of the Curie temperature (Tc). Impedance spectroscopy on Q PN in the presentwork showed this peak at a temperature as high as ∼580◦C at 5.5 MHz and ∼573◦C at 20Hz. In the present work, a detailed dielectric characterization (up to 700◦C over 20 Hz to 5.5MHz frequency range) and Differential Scanning Calorimetry or DSC have been carriedout, since such thermal characterization is important for high temperature piezoelectricapplications. We [3] are first to report DSC in piezoelectric Q PN and non-piezoelectricS PN. Our essential finding is an endothermic minimum at ∼ 571◦C in the heating DSC plotfor piezoelectric PN but none for non-piezoelectric PN, confirming the Curie temperature.In the present work, a different DSC run has been undertaken on powdered Q PN to extendthe work to powdered sample, and confirm the earlier result of the endothermic / exothermicsignals at or near Tm. We also report for Q PN a few new features observed in DSC andimpedance spectroscopy.
With practically no published studies on the rhombohedral lead metaniobate, we in-vestigate dielectric and thermal properties of the rhombohedral PbNb2O6 or S PN in thesame set-up.
Another issue in such a ferroelectric material [1–14] is to examine whether it is arelaxor ferroelectric and the theoretical treatment of the diffused phase transition (DPT)in relaxor ferroelectrics. It has been correctly observed [14] that in most publications,the analysis is for the region above Tm. So, the Santos-Eiras equation was designed tofit the ε′ versus T curves “not just at temperatures above Tm, but also in the dispersionregion, i.e. around Tm” [10]. This Santos-Eiras equation has, therefore, been fitted to thepresent ε′ versus T data over different ranges of T to find the degree of validity in differenttemperature ranges. This validity range has not been explicitly mentioned in the publishedliterature.
2. Experiments
Our multi-step preparation [3, 6] of PbNb2O6 from individual oxides, consists of firingsat 1050◦C, 1290◦C and 1270◦C, with the last step branching into quenched (Q) and slow-cooled (S) samples. All the firings have been done in palletized form to provide intimatecontact and to minimize the loss of volatile components like lead oxide. Grinding andre-palletizing at each step improved the sample quality. X-Ray Rietveld Analysis [6] andTransmission Electron Microscopy [7] have been carried out on Q and S samples.
Transmission Electron Microscopy has been carried out with HR-TEM (“FEI TEMTecnai Super Twin 2” Model) at SINP, India. Powdered ceramics of Q PN and S PN weresuitably sonicated and the fine particles collected on a TEM grid for observation under thetransmission electron microscope.
Present impedance spectroscopy (Figs. 1–4) has been carried out in “SI 1260 ImpedanceGain-Phase Analyzer” of Solatron (UK) with necessary high temperature attachment. Silverpaint coat on the flat faces of the pellet (diameter ∼ 12 mm & 2.2 to 2.4 mm thick)under study has served as the electrodes for IS measurements. Like most authors [10, 14],the pellets have not been poled. This measurement of ε′ and ε′′ (the real and imaginarycomponents, respectively, of the relative permittivity) has been done at different frequencies
Downloaded By: [De, U.] At: 20:08 16 December 2010

98/[920] U. De et al.
350 400 450 500 550 600 650 7000
2000
4000
6000
8000
10000
12000573.2
ε′
Temperature ( °C)
5.5MHz 5MHz 2MHz 1MHz 0.1kHz 0.02kHz
439.9°385.1 C°C
°C
(a)
700600500400300200100
0.0
2.0x10⁵
4.0x10⁵
6.0x10⁵
8.0x10⁵
1.0x10⁶
1.2x10⁶
1.4x10⁶
1.6x10⁶
6005905805705600.0
2.0x10³
4.0x10³
6.0x10³
8.0x10³
1.0x10⁴
3753000
1x1032x1033x1034x1035x1036x1037x103
Temperature (°C)
ε″
Temperature ( °C)
5.5MHz 5MHz 4MHz 3MHz 2MHz 1MHz 500kHz 100kHz 50kHz 10kHz 5kHz 1kHz 0.5kHz 0.1kHz 0.02kHz
Q_PN
(b)
Figure 1. (a) Temperature dependence of the real part of the dielectric constant (ε′) during heating forvarious measuring frequencies from 20 Hz to 5.5 MHz for Q PN, PbNb2O6 sample with orthorhombicphase; (b) Temperature dependence of the imaginary part of the dielectric constant (ε′′), during heatingfor different measuring frequencies in the range 20 Hz to 5.5 MHz for Q PN, PbNb2O6 sample withorthorhombic phase. (See Color Plate XXIV)
covering 20 Hz to 5.5 MHz range at different values the sample temperature (T) whileheating from room temperature to 700◦C and also during many of the cooling runs. Coolingdata is rare in the literature.
In the new DSC run (Figure 5) in the Seiko DSC 6200 set-up, slow heating of 5◦C/min[3] has been used (as higher rates mask finer features of the DSC plot), while resortingto powdered Q PN sample (typically 35 mg). Al-crucible (about 14 mg), lighter thanpreviously used [3] alumina crucible, was utilized in the present work. In all cases, coolingruns have been taken at the same 5◦C/min rate.
Downloaded By: [De, U.] At: 20:08 16 December 2010

Dielectric and Thermal Investigations on PbNb2O6 [921]/99
3. Theory and Data Analysis
Ferroelectric Curie temperature, Tc, is the temperature above which the ferroelectric mate-rial transforms into its paraelectric phase. Curie-Weiss law gives ε′, the real part of relativepermittivity as a function of its temperature (T) by the well-known relation:
1/ε′ = (T − T0)/C0 (1)
It is applicable for a normal ferroelectric in the paraelectric region, with T0 andC0 as constants for the material [8]. This characteristic temperature T0 equals the Curietemperature Tc for a 2nd order transition, while T0 is less than Tc for a 1st order transition[8, 9].
Earlier-mentioned Santos-Eiras equation [10] introduced the degree or width, �T, ofdiffuseness of the transition in the following manner:
ε′ = ε′max
1 + ( |T − Tm| /�T)ξ(2)
where ξ , defining the character of transition, plays a role similar to that of γ in the modifiedCurie-Weiss law [11–13]. Normal or conventional ferroelectric-paraelectric phase transitionshould have ξ = 1, while ξ = 2 implies completely diffused phase transition (DPT).
4. Results and Discussion
4.1. Structural Characterization
Here, 2θ = 28.711◦ and 29.454◦ XRD peaks [2] for our slow-cooled sample, S PN, provethe slow-cooled sample to be rhombohedral. The Rietveld analysis has confirmed thatimpurity in S PN is not above ∼1 at% and PbO is a possible impurity. Rietveld fit [6] wasbest for the space group R3m (hexagonal), No.160, with lattice parameters:
a = 10.473(2) Å and c = 11.534(2) Å.
Our observed XRD pattern [3, 6] of the quenched sample, Q PN, matches well with thebest reported orthorhombic pattern of PN. Its Rietveld analysis [6] showed Cm2m (no.35)space group and lattice parameters:
a = 17.659(5) Å, b = 17.951(4) Å, and c = 3.8717(6) Å.
No second phase or impurity lines have been seen in the x-ray pattern. HRTEM imageof Q PN lattice planes confirmed x-ray diffraction results. For example, planes with d =1.2 nm in TEM observation can be identified to (110) planes.
Each sample has been with high purity and with about 80% of the theoretical densityon average. In fact, Rietveld analysis found no impurity phase in quenched PN. Suchpure sample has not been used in many of the earlier work. This makes the present studyimportant. Venet et al. [2] achieved 81% of the theoretical density with Tc = 517◦C andadded Ti to raise these to 95% and 563◦C. Present work concentrates on pure PN. ObservedXRD line-shapes correspond to Scherrer equation grain size of (5.05 ± 0.28) µm for Q PNand (7.74 ± 0.07) µm for S PN.
Downloaded By: [De, U.] At: 20:08 16 December 2010
100/[922] U. De et al.
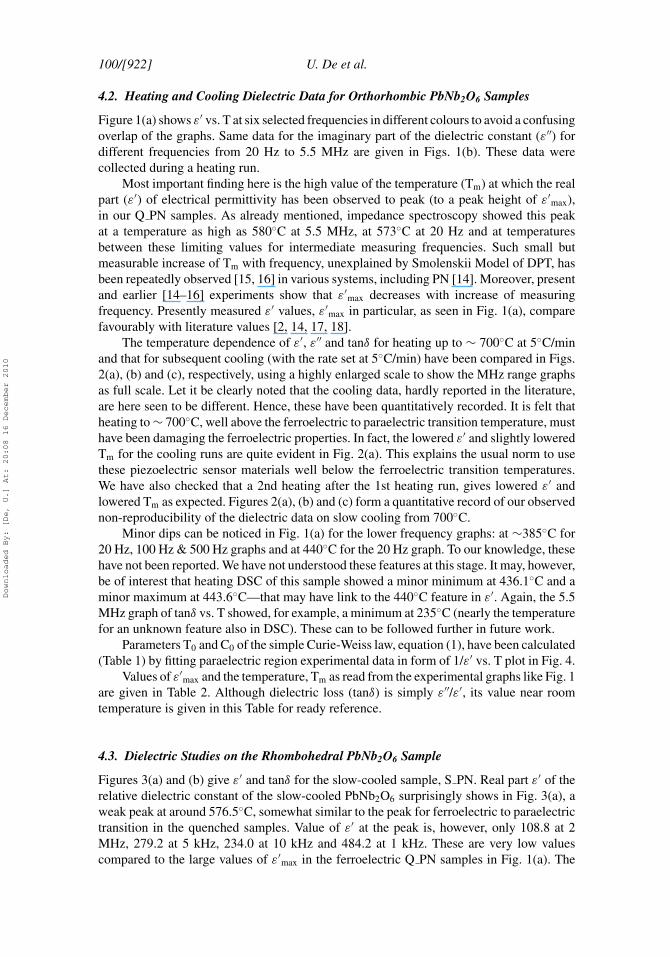
4.2. Heating and Cooling Dielectric Data for Orthorhombic PbNb2O6 Samples
Figure 1(a) shows ε′ vs. T at six selected frequencies in different colours to avoid a confusingoverlap of the graphs. Same data for the imaginary part of the dielectric constant (ε′′) fordifferent frequencies from 20 Hz to 5.5 MHz are given in Figs. 1(b). These data werecollected during a heating run.
Most important finding here is the high value of the temperature (Tm) at which the realpart (ε′) of electrical permittivity has been observed to peak (to a peak height of ε′
max),in our Q PN samples. As already mentioned, impedance spectroscopy showed this peakat a temperature as high as 580◦C at 5.5 MHz, at 573◦C at 20 Hz and at temperaturesbetween these limiting values for intermediate measuring frequencies. Such small butmeasurable increase of Tm with frequency, unexplained by Smolenskii Model of DPT, hasbeen repeatedly observed [15, 16] in various systems, including PN [14]. Moreover, presentand earlier [14–16] experiments show that ε′
max decreases with increase of measuringfrequency. Presently measured ε′ values, ε′
max in particular, as seen in Fig. 1(a), comparefavourably with literature values [2, 14, 17, 18].
The temperature dependence of ε′, ε′′ and tanδ for heating up to ∼ 700◦C at 5◦C/minand that for subsequent cooling (with the rate set at 5◦C/min) have been compared in Figs.2(a), (b) and (c), respectively, using a highly enlarged scale to show the MHz range graphsas full scale. Let it be clearly noted that the cooling data, hardly reported in the literature,are here seen to be different. Hence, these have been quantitatively recorded. It is felt thatheating to ∼ 700◦C, well above the ferroelectric to paraelectric transition temperature, musthave been damaging the ferroelectric properties. In fact, the lowered ε′ and slightly loweredTm for the cooling runs are quite evident in Fig. 2(a). This explains the usual norm to usethese piezoelectric sensor materials well below the ferroelectric transition temperatures.We have also checked that a 2nd heating after the 1st heating run, gives lowered ε′ andlowered Tm as expected. Figures 2(a), (b) and (c) form a quantitative record of our observednon-reproducibility of the dielectric data on slow cooling from 700◦C.
Minor dips can be noticed in Fig. 1(a) for the lower frequency graphs: at ∼385◦C for20 Hz, 100 Hz & 500 Hz graphs and at 440◦C for the 20 Hz graph. To our knowledge, thesehave not been reported. We have not understood these features at this stage. It may, however,be of interest that heating DSC of this sample showed a minor minimum at 436.1◦C and aminor maximum at 443.6◦C—that may have link to the 440◦C feature in ε′. Again, the 5.5MHz graph of tanδ vs. T showed, for example, a minimum at 235◦C (nearly the temperaturefor an unknown feature also in DSC). These can to be followed further in future work.
Parameters T0 and C0 of the simple Curie-Weiss law, equation (1), have been calculated(Table 1) by fitting paraelectric region experimental data in form of 1/ε′ vs. T plot in Fig. 4.
Values of ε′max and the temperature, Tm as read from the experimental graphs like Fig. 1
are given in Table 2. Although dielectric loss (tanδ) is simply ε′′/ε′, its value near roomtemperature is given in this Table for ready reference.
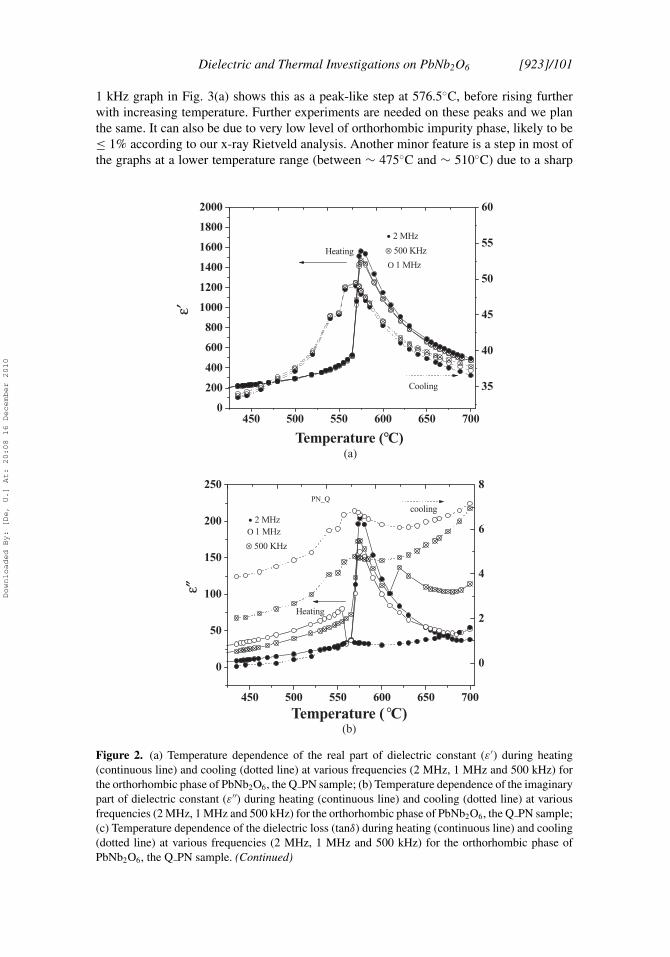
4.3. Dielectric Studies on the Rhombohedral PbNb2O6 Sample
Figures 3(a) and (b) give ε′ and tanδ for the slow-cooled sample, S PN. Real part ε′ of therelative dielectric constant of the slow-cooled PbNb2O6 surprisingly shows in Fig. 3(a), aweak peak at around 576.5◦C, somewhat similar to the peak for ferroelectric to paraelectrictransition in the quenched samples. Value of ε′ at the peak is, however, only 108.8 at 2MHz, 279.2 at 5 kHz, 234.0 at 10 kHz and 484.2 at 1 kHz. These are very low valuescompared to the large values of ε′
max in the ferroelectric Q PN samples in Fig. 1(a). The
Downloaded By: [De, U.] At: 20:08 16 December 2010
Dielectric and Thermal Investigations on PbNb2O6 [923]/101
1 kHz graph in Fig. 3(a) shows this as a peak-like step at 576.5◦C, before rising furtherwith increasing temperature. Further experiments are needed on these peaks and we planthe same. It can also be due to very low level of orthorhombic impurity phase, likely to be≤ 1% according to our x-ray Rietveld analysis. Another minor feature is a step in most ofthe graphs at a lower temperature range (between ∼ 475◦C and ∼ 510◦C) due to a sharp
35
40
45
50
55
60
450 500 550 600 650 7000
200
400
600
800
1000
1200
1400
1600
1800
2000
Ο 1 MHz
ε′
Temperature (°C)
Heating
Cooling
• 2 MHz
⊗ 500 KHz
(a)
0
2
4
6
8
450 500 550 600 650 700
0
50
100
150
200
250
cooling
Heating
⊗ 500 KHz
Ο 1 MHz• 2 MHz
ε″
Temperature ( °C)
PN_Q
(b)
Figure 2. (a) Temperature dependence of the real part of dielectric constant (ε′) during heating(continuous line) and cooling (dotted line) at various frequencies (2 MHz, 1 MHz and 500 kHz) forthe orthorhombic phase of PbNb2O6, the Q PN sample; (b) Temperature dependence of the imaginarypart of dielectric constant (ε′′) during heating (continuous line) and cooling (dotted line) at variousfrequencies (2 MHz, 1 MHz and 500 kHz) for the orthorhombic phase of PbNb2O6, the Q PN sample;(c) Temperature dependence of the dielectric loss (tanδ) during heating (continuous line) and cooling(dotted line) at various frequencies (2 MHz, 1 MHz and 500 kHz) for the orthorhombic phase ofPbNb2O6, the Q PN sample. (Continued)
Downloaded By: [De, U.] At: 20:08 16 December 2010

102/[924] U. De et al.
0.00
0.02
0.04
0.06
0.08
0.10
0.12
0.14
0.16
0.18
0.20
400 450 500 550 600 650 7000.000.020.040.060.080.100.120.140.160.180.200.220.240.26
heating
cooling
⊗ 500 kHzΟ 1 MHz
• 2 MHz
tan
δ
Temperature ( °C)
Q_PN
(c)
Figure 2. (Continued)
Table 1Parameters T0 and C0 of the simple Curie-Weiss law, for orthorhombic PbNb2O6, calculated
by fitting the paraelectric region experimental data on 1/ε′ vs. T (Fig. 4)
Frequency (Hz) T0 (◦C) C0 × 105 (◦C)
5.5 MHz 564 1.1155 MHz 550 1.0393 MHz 532 0.8962 MHz 524 0.85650 kHz 516 1.05130 kHz 515 1.13310 kHz 525 1.20
Table 2Values for orthorhombic PbNb2O6, of dielectric loss (tanδ) = ε′′/ ε′at room temperature,ε′(room temperature), ε′
max and the temperature, Tm, as read from the experimental data
Frequency tanδ (room ε′(room(Hz) temperature) temperature) Tm (◦C) ε′
max
5.5 M 0.0073 151.2 579.49 ± 4 5472.63.0 M 0.0078 125.7 575.16 ± 2 1876.12.0 M 0.0100 119.6 574.78 ± 1 1574.250.0 k 0.0103 117.1 574.91 ± 1 1752.21.0 k 0.0035 119.1 573.84 ± 1 3613.90.5 k 0.0150 120.3 572.95 ± 1 3632.50.1 k 0.0251 137.3 572.53 ± 1 7103.5
Downloaded By: [De, U.] At: 20:08 16 December 2010
Dielectric and Thermal Investigations on PbNb2O6 [925]/103
375 450 525 600 6750
100200300400500600700
10000
12000
ε′
°Temperature ( C)
5.5MHz 5MHz 2MHz 1MHz 30kHz 10kHz 1kHz
S_PN heating
(a)
100 200 300 400 500 600 700
0
20
40
60
80
100
120
140
tan
δ
Temperature ( °C)
5.5MHz 5MHz 2MHz 1MHz 30kHz 10kHz 1kHz
S_PN
(b)
Figure 3. (a) Temperature dependence of the real part of the dielectric constant (ε′) during heating,at various frequencies (5.5 MHz, 5 MHz, 2 MHz, 1 MHz, 30 kHz, 10 kHz and 1 kHz) for therhombohedral phase of PbNb2O6, the S PN sample; (b) Temperature dependence of the dielectricloss (tanδ) during heating, at various frequencies (5.5 MHz, 5 MHz, 2 MHz, 1 MHz, 30 kHz, 10 kHzand 1 kHz) for the rhombohedral phase of PbNb2O6, the S PN sample. (See Color Plate XXV)
change (lowering) of the slope. Fig. 3(b) shows that dielectric loss, as indicated by tanδ,is negligible up to ∼450◦C. But it has frequency and temperature dependent variation athigher temperatures.
4.4. Variation of the Imaginary Part (ε′′) and of Dielectric Loss (tanδ) for Q PN
The imaginary part (ε′′) of dielectric constant for our Q PN in Fig. 1(b) increases marginallyup to temperatures like 450◦C and significantly at higher temperatures, the variation beingmore for lower frequency measurements. It is interesting that this steep increase of slopeis, in fact, at ∼ Tm (Table 2). Here, Tm is the temperature of the peak in ε′ vs. T graph inFig. 1(a). Present results on ε′′ are in line with that of earlier work [19], although details vary.
Downloaded By: [De, U.] At: 20:08 16 December 2010

104/[926] U. De et al.
540 560 580 600 620 640 660 680 7000.0000
0.0005
0.0010
0.0015
0.0020
0.0025
0.0030
1/ε′
Temperature (°C)
5.5MHz
5MHz 4MHz 3MHz 2MHz 1MHz 500kHz 50kHz 30kHz 10kHz
Q_PN
Figure 4. The inverse (1/ε′) of the real part of the dielectric constant as a function of temperature, inthe range 425 to 700◦C, at different frequencies (5.5 MHz, 5 MHz, 4 MHz, 3 MHz, 2 MHz, 1 MHz,500 kHz, 50 kHz, kHz, 30 kHz and 10 kHz) for Q PNO sample, the orthorhombic phase of PbNb2O6.(See Color Plate XXVI)
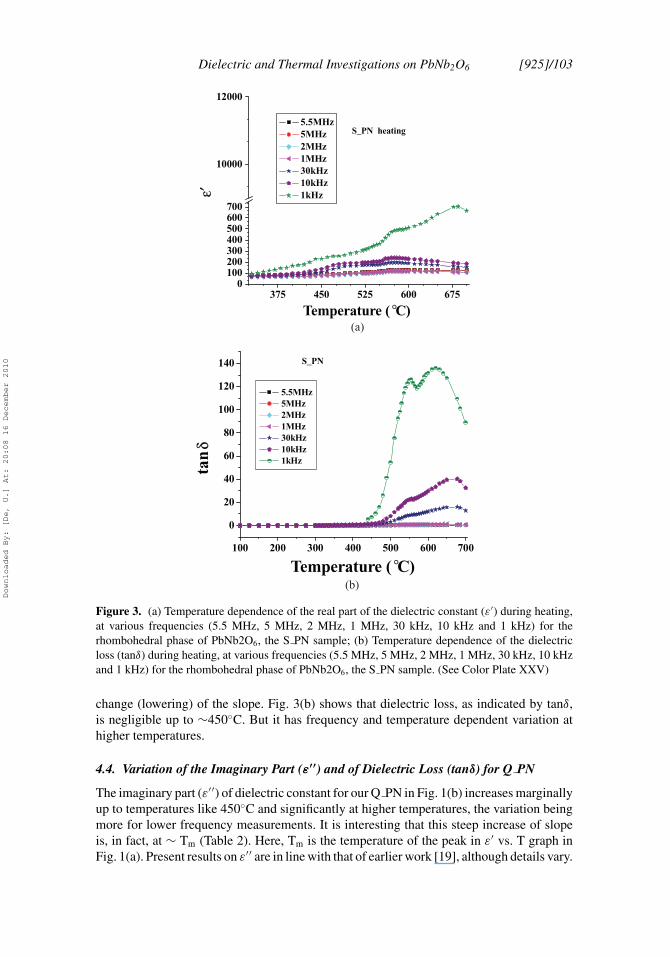
4.5. DSC Based Heat Capacity Studies
DSC signal in [J.g-1.◦C-1] indicates heat capacity of the sample under study. It is importantfrom physics as well as high temperature application aspects. We find that DSC signalvs. temperature graph of quenched PbNb2O6 in palletized form [3] as well as in presentpowdered form (sample for Fig. 5), shows a minimum at 568◦C in Fig. 5(a) for heating runand a maximum at 548◦C in Fig. 5(b) during cooling. These pair of minimum and maximummatch [3] Curie temperature, linked to presently studied Tm. For the slow-cooled PbNb2O6,no such minimum or maximum has been observed [3], linking the origin of these thermalsignals to the transition at Curie temperature. Data in Figs. 5(a) and (b) further tend to showother minor DSC features at different temperatures that need to be further examined andcompared with similar observations in other properties like some unexplained electricalfeatures in Fig. 1 as mentioned briefly later in the text. The interesting DSC feature ator near Curie temperature and the temperature lag of the feature in the cooling curve ofpiezoelectric samples have been observed [3] by various workers in few other piezoelectricsamples like BaTiO3. Present re-observation of the Curie temperature minimum duringheating and maximum during cooling (that followed) in this new DSC run, and particularlyon powdered Q PN, is an important confirmation.
4.6. Analysis of the Real Part (ε′) for Orthorhombic PbNb2O6 Sample
The real part (ε′) of dielectric constant, Fig. 1(a), for Q PN is seen to be of low valueat lower temperatures and its increase is rather slow up to ∼ 450◦C. The most importantfeature with further rise of temperature is the sharp rise in ε′ to reach a maximum, ε′(max)= ε′
max, at a temperature that we called Tm in equation (2). For T > Tm region, ε′ decreaseswith increase of T fairly fast near Tm, with a slowing down of the decrease at highertemperatures at all studied frequencies. The 20 Hz graph shows a maximum ε′
max andthen a 2nd re-increase of ε′ above certain higher temperature (∼ 625◦C) similar to such
Downloaded By: [De, U.] At: 20:08 16 December 2010

Dielectric and Thermal Investigations on PbNb2O6 [927]/105
600525450375300225150
-0.04
-0.02
0.00
0.02
0.04
568 °C
443 °C
434 °C
317 °C303 °C
272 °C
DSC
sig
nal (
J. g
m-1
.°C
-1)
Temperature ((°C)
238 °C
(a)
600525450375300225
0.10
0.12
0.14
0.16
267 °C274 °C
407 °C
413 °C 425 °C
533 °C
548 °C
563 °CDSC
sig
nal (
J. g
m-1
.° C-1
)
Temperature (°C)(b)
Figure 5. (a) DSC signal vs. temperature for heating for powdered sample of quenched PbNb2O6 orQ PN of orthorhombic structure, showing the Curie temperature minimum at 568◦C and additionalfeatures; (b) DSC signal vs. temperature for cooling for powdered sample of quenched PbNb2O6 orQ PN of orthorhombic structure, showing the Curie temperature maximum (at 548◦C) and additionalfeatures.
upturn observed in lower frequency graphs in publications like [19]. There is significantdispersion of ε′ with frequency: ε′
max initially falls from the high value of 11593 for 20Hz measurement, rather sharply with increase of the measuring frequency, to 1451 for 1MHz, and then increases slowly with increase of frequency, becoming 5473 for 5.5 MHzmeasurement. Limited deviation of 1/ε′ vs. T data in Fig. 4 from a 2-branch (branches belowand above Tm) linearity corresponds to deviation of these materials from Curie-Weiss law.These data are, therefore, fitted to equation (2) as detailed later.
The rise to the peak at Tm in ε′ vs. T graphs is sharper in our and Francombe and Lewis[17] work than in most other work, particularly for the lower frequency graphs. Roundingof the peak, indicating diffusiveness of the phase transition is more marked at higherfrequency measurements. Guerrero et al. [14] appeared to have covered ferroelectric as well
Downloaded By: [De, U.] At: 20:08 16 December 2010

106/[928] U. De et al.
Table 3Representative results of Guerrero et al. [14] for comparison to our result in Table 4
Frequency ε′m Tm (◦C) � (◦C) ξ
01 kHz 6106.75 531.17 51.10 1.05350 kHz 5491.67 527.26 40.54 1.15105 MHz 4851.52 530.67 43.22 1.147
as paraelectric regions in fitting Santos-Eiras equation i.e. equation (2) to their experimentaldata on PbNb2O6, although their temperature range for the fit was not specified. Table 3quotes their results [14] for three representative frequencies for ready comparison to ourresults. Our non-linear least square fit of the Santos-Eiras equation to our data in Fig. 6has been purposely made for following ranges: (a) 50 to 700◦C (graph T50), (b) 450 to700◦C (graph T450), and (c) about 573◦C to 700◦C (graph T573). The T573 fit was startedactually from the (ε′,T) point just earlier to Tm and in most graphs it was about 573◦C. TheSantos-Eiras fit in Fig. 6 is seen to be very good only for this limited range, linked to graphT573. The quality of fit was unacceptably poorer on extending the fitting range to lowertemperatures even by a few degrees, poor fit of T450 graph and worse fit of T50 graphbeing shown.
Poorer fit of the Santos-Eiras relation, equation (2), below Tm can be explained. It isknown that neither the Curie-Weiss law, equation (1), nor the modified Curie-Weiss law[11–13] apply well to these materials below Tm. One finds that equation (2) can shown tobe essentially same as the modified Curie-Weiss law. For this, we just rewrite equation (3)
50 100 150 200 250 300 350 400 450 500 550 600 650 7000
500
1000
1500
2000
2500
3000
3500
4000
4500
580 600 620 640 660 680 700
500
1000
1500
2000
2500
3000
3500
4000
4500
ε′
Temperature ( °C)
ε′
Temperature ( °C)
T450 FIT (exp. data) T50 FIT T573 FIT
For 5 MHz (Q_PN sample)
Figure 6. 5 MHz data for the orthorhombic phase of PbNb2O6 (Q PNO sample). The experientialdata (red filled circles) on temperature dependence of the real part of the dielectric constant (ε′) duringheating up to 700◦C have been fitted to the Santos-Eiras’ relation for different starting temperatures(50◦C, 450◦C and 573◦C) of the fit. (See Color Plate XXVII)
Downloaded By: [De, U.] At: 20:08 16 December 2010
Dielectric and Thermal Investigations on PbNb2O6 [929]/107
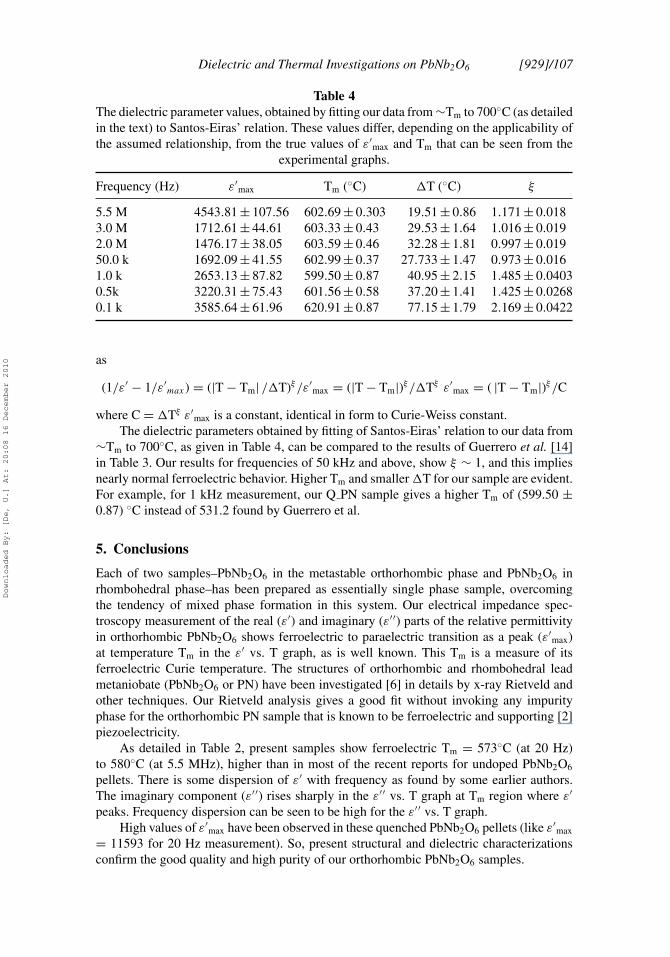
Table 4The dielectric parameter values, obtained by fitting our data from ∼Tm to 700◦C (as detailedin the text) to Santos-Eiras’ relation. These values differ, depending on the applicability ofthe assumed relationship, from the true values of ε′
max and Tm that can be seen from theexperimental graphs.
Frequency (Hz) ε′max Tm (◦C) �T (◦C) ξ
5.5 M 4543.81 ± 107.56 602.69 ± 0.303 19.51 ± 0.86 1.171 ± 0.0183.0 M 1712.61 ± 44.61 603.33 ± 0.43 29.53 ± 1.64 1.016 ± 0.0192.0 M 1476.17 ± 38.05 603.59 ± 0.46 32.28 ± 1.81 0.997 ± 0.01950.0 k 1692.09 ± 41.55 602.99 ± 0.37 27.733 ± 1.47 0.973 ± 0.0161.0 k 2653.13 ± 87.82 599.50 ± 0.87 40.95 ± 2.15 1.485 ± 0.04030.5k 3220.31 ± 75.43 601.56 ± 0.58 37.20 ± 1.41 1.425 ± 0.02680.1 k 3585.64 ± 61.96 620.91 ± 0.87 77.15 ± 1.79 2.169 ± 0.0422
as
(1/ε′ − 1/ε′max) = (|T − Tm| /�T)ξ /ε′
max = (|T − Tm|)ξ /�Tξ ε′max = ( |T − Tm|)ξ /C
where C = �Tξ ε′max is a constant, identical in form to Curie-Weiss constant.
The dielectric parameters obtained by fitting of Santos-Eiras’ relation to our data from∼Tm to 700◦C, as given in Table 4, can be compared to the results of Guerrero et al. [14]in Table 3. Our results for frequencies of 50 kHz and above, show ξ ∼ 1, and this impliesnearly normal ferroelectric behavior. Higher Tm and smaller �T for our sample are evident.For example, for 1 kHz measurement, our Q PN sample gives a higher Tm of (599.50 ±0.87) ◦C instead of 531.2 found by Guerrero et al.
5. Conclusions
Each of two samples–PbNb2O6 in the metastable orthorhombic phase and PbNb2O6 inrhombohedral phase–has been prepared as essentially single phase sample, overcomingthe tendency of mixed phase formation in this system. Our electrical impedance spec-troscopy measurement of the real (ε′) and imaginary (ε′′) parts of the relative permittivityin orthorhombic PbNb2O6 shows ferroelectric to paraelectric transition as a peak (ε′
max)at temperature Tm in the ε′ vs. T graph, as is well known. This Tm is a measure of itsferroelectric Curie temperature. The structures of orthorhombic and rhombohedral leadmetaniobate (PbNb2O6 or PN) have been investigated [6] in details by x-ray Rietveld andother techniques. Our Rietveld analysis gives a good fit without invoking any impurityphase for the orthorhombic PN sample that is known to be ferroelectric and supporting [2]piezoelectricity.
As detailed in Table 2, present samples show ferroelectric Tm = 573◦C (at 20 Hz)to 580◦C (at 5.5 MHz), higher than in most of the recent reports for undoped PbNb2O6
pellets. There is some dispersion of ε′ with frequency as found by some earlier authors.The imaginary component (ε′′) rises sharply in the ε′′ vs. T graph at Tm region where ε′
peaks. Frequency dispersion can be seen to be high for the ε′′ vs. T graph.High values of ε′
max have been observed in these quenched PbNb2O6 pellets (like ε′max
= 11593 for 20 Hz measurement). So, present structural and dielectric characterizationsconfirm the good quality and high purity of our orthorhombic PbNb2O6 samples.
Downloaded By: [De, U.] At: 20:08 16 December 2010

108/[930] U. De et al.
In addition to the ferroelectric–paraelectric phase transition, processes related to grainboundaries, domain wall and measurement artifacts can affect impedance spectroscopy andthermal (DSC) results in such a complex manner that newer features noted in these resultsin present and earlier [3] work cannot be readily attributed to specific causes. Still, it isdesirable to record the dielectric and DSC observations as done here. It can also be definitelyconcluded that the ferroelectric to paraelectric phase transition in the piezoelectric PbNb2O6
sample is endothermic as seen during the heating run. The reverse transition (during thecooling run) is exothermic, as expected. But it has a phase lag and a reduced signal. Thesethermal signals in the DSC runs provide an additional characterization method. A bettercorrelation of the electrical and thermal effects of the piezoelectric phase transition will bewelcome.
Acknowledgments
Present work has been benefited by a partial support by the Alexander von HumboldtFoundation, Germany, to one of the authors (UD) for recent visits to related internationalconferences and laboratories in Germany. Special thanks also to the hosts in KIT, Karlsruhe,and IPF, Dresden, and to Prof. Dr. H. Wuehl (Karlsruhe) in particular.
References
1. G. Goodman, Ferroelectric properties of lead metaniobate. J. Amer. Ceram. Soc. 36, 368–372(1953).
2. M. Venet, A. Vendramini, F. L. Zabotto, F. Guerrero, D. Garcia, and J. A. Eiras, Piezoelectricproperties of undoped and titanium or barium-doped lead metaniobate ceramics. J. Euro. Ceramic.Soc. 25, 2443–2446 (2005).
3. K. R. Sahu and U. De, Thermal characterization of piezoelectric and non-piezoelectric leadmeta-niobate. Thermochimica Acta 490, 75–77 (2009).
4. C. Fu, F. Pan, W. Cai, and X. Deng, Relaxor behavior of BaZr0.2Ti0.8O3 ceramics with differentgrains. Integrated Ferroelectrics 104, 1–7 (2008).
5. N. DattaGupta, K. R. Sahu, I. Das, A. De, and U. De, Synthesis and study of electro-activenano-particles and their polymer composites for novel applications. Ind. J. Phys. (in Press).
6. K. R. Chakraborty, K. R. Sahu, A. De, and U. De, Structural characterization of orthorhom-bic and rhombohedral lead meta-niobate samples. International Conference on ElectroceramicsDecember 13–17, 2009, University of Delhi, New Delhi, India.
7. K. R. Sahu, A. De, K. R. Chakraborty, and U. De, Preparation of PbNb2O6 and FTIR char-acterization, in: 6th International Conference on Inorganic Materials, September 28–30, 2008,Dresden (Germany), www.im-conference.elsevier.com.
8. A. J. Dekker, Solid State Physics. The Macmillan press Ltd.: Macmillan Student Ed. (1975).9. C. Kittel, Introduction to Solid State Physics. Wiley Eastern Private Ltd. 3rd Ed. (1971).
10. I. A. Santos, D. Garcia, and J. A. Eiras, Features of diffuse phase transition in lead barium niobateferroelectric ceramics. J. Appl. Phys. 93, 1701–1706 (2003).
11. K. Uchino and S. Nomura, Critical exponents of the dielectric constants in diffused-phase-transition crystals. Ferroelectr. Lett. Sect. 44, 55–61 (1982).
12. A. W. Tavernor and N. W. Thomas, The dependence of the ‘relaxor’ type of dielectric response onchemical composition: a study of zirconium-substituted lead magnesium niobate. J. Eur. Ceram.Soc. 13, 121–127 (1994).
13. V. V. Kirillov and V. A. Isupov, Relaxation polarization of PbMg 1/3Nb2/3O3(PMN)-A ferroelec-tric with a diffused phase transition. Ferroelectrics 5, 3 (1973).
Downloaded By: [De, U.] At: 20:08 16 December 2010

Dielectric and Thermal Investigations on PbNb2O6 [931]/109
14. F. Guerrero, Y. Leyet, M. Venet, J. de Los S. Guerra, and J. A. Eiras, Dielectric behavior of thePbNb2O6 ferroelectric ceramic in the frequency range of 20 Hz to 2 GHz. J. Euro. Cerm. Soc.27, 4041–4044 (2007).
15. C. Ang, Z. Yu, and Z. Jing, Impurity-induced ferroelectric relaxor behavior in quantum paraelec-tric SrTiO3 and BaTiO3. Phys. Rev. 61, 957–961 (2000).
16. T. Maiti, E. Alberta, R. Guo, and A. S. Bhalla, The polar cluster like behavior in Ti4+ SubstitutedBAZrO3 ceramics. Met. Lett. 60, 3861–3865 (2006).
17. M. H. Francombe and B. Lewis, Structural, dielectric and optical properties of ferroelectric leadmetaniobate. Acta Crystallogr. 11, 696–703 (1958).
18. H. S. Lee and T. Kimura, Preparation of dense PbNb2O6 ceramics from powders with lowtemperature form. J. Ceramic Soc. Japan 113, 525–529 (2005).
19. K. S. Rao, D. M. Prasada, P. M. Krishnaa, and J. H. Lee, Synthesis, electrical and electromechan-ical properties of a tungsten-bronze ceramic oxide: Pb0.68K0.64Nb2O6. Physica B 403, 2079–2087(2008).
Downloaded By: [De, U.] At: 20:08 16 December 2010