An inhibitor of mTOR reduces neoplasia and normalizes p70/S6 kinase activity in Pten+/ mice
Upload
independentCategory
view
1download
0
International Immunology, Vol. 19, No. 4, pp. 509–522doi:10.1093/intimm/dxm017
ª The Japanese Society for Immunology. 2007. All rights reserved.For permissions, please e-mail: [email protected]
PI3K/AKT/mTOR hypersignaling in autoimmunelymphoproliferative disease engendered bythe epistatic interplay of Sle1b and FASlpr
Chun Xie1*, Rahul Patel1*, Tianfu Wu1*, Jiankun Zhu1, Tamika Henry1, Madhavi Bhaskarabhatla1,Renuka Samudrala1, Katalin Tus2, Yimei Gong1, Hui Zhou3, Edward K. Wakeland2, Xin J. Zhou3,*and Chandra Mohan1,*
1Division of Rheumatology, Department of Internal Medicine2Center for Immunology3Department of Pathology, University of Texas Southwestern Medical Center, Dallas, TX 75390, USA
Keywords: auto-antibodies, kinases/phosphatases, signal transduction, systemic lupus erythematosus
Abstract
Previous studies have demonstrated that the NZM2410/NZW ‘z’ allele of Sle1 on telomeric murinechromosome 1 led to lymphoproliferative autoimmunity, when acting in concert with the FASlpr defect onthe C57BL/6 background. The present report shows that the Sle1b sub-locus, harboring the NZM2410/NZW ‘z’ allele of SLAM, in epistasis with FASlpr, may be sufficient to induce lymphoproliferativeautoimmunity. Disease in this simplified genetic model is accompanied by significant activation of theAKT signaling axis in both B- and T cells, as evidenced by increased phosphorylation of AKT, mTOR,4EBP-1 and p70S6K, resulting from increased PI3K and reduced PTEN activity. In addition, blocking thisaxis using RAD001, an mTOR inhibitor, ameliorated lymphoproliferation and modulated serum IgG anti-nuclear auto-antibodies. Finally, mTOR inhibition also dampened signaling via parallel axes, includingthe MAPK and NFkB pathways. Hence, hypersignaling via the PI3K/AKT/mTOR axis appears to be animportant mechanism underlying autoimmune lymphoproliferative disease, presenting itself asa potential target for therapeutic intervention.
Introduction
Autoimmune lymphoproliferative syndrome (ALPS) is a dis-ease marked by autoimmunity and lymphoproliferation, result-ing as a consequence of impaired lymphocytic apoptosis(1–7). Mutations in FAS/FASL and caspases have beenassociated with ALPS. Nevertheless, it has been recognizedthat mutations in these genes alone may not be sufficient toengender ALPS (8, 9). For instance, it is well documentedthat relatives of ALPS patients may harbor the same culpritmutations as the proband, but may not have any phenotypicmanifestations. This alludes to the potential contribution ofadditional genetic factors in disease pathogenesis. Indeed,the above scenario has been faithfully reproduced in animalmodels. Whereas mice with the FASlpr mutation exhibit rathermodest humoral and cellular phenotypes, epistatic interac-tion with the NZM2410/NZW ‘z’ allele of the lupus suscepti-bility locus, Sle1, leads to full-blown lymphoproliferativelupus, characterized by anti-nuclear antibodies, splenomeg-aly, lymphadenopathy, nephritis and early mortality (10).
Intriguingly, mice with PTEN (phosphatase and tensin homo-log) haploinsufficiency or PI3K overactivity, both develop ALPSthat is phenotypically similar to the disease seen in B6.Sle1.-FASlpr mice (11, 12). Importantly, PTEN and PI3K operate indiametrically opposite fashions, to regulate the cellular contentof activated AKT (13–16). As one might have predicted, micethat hyperexpress AKT in their lymphocytes also succumb toALPS (17). It has also become apparent that overactivity ofthis pathway in B cells as well as T cells may lead to ALPS(17–19). In view of these observations, an important goal ofthis study was to ascertain if the PI3K/AKT axis was hyperac-tivated in B6.Sle1.FASlpr mice. Since this axis has beenproven to be an excellent target for therapeutic interventionin other disease states (20, 21), a further goal of this studywas to ascertain if lymphoproliferative lupus in B6.Sle1.FASlpr
mice could also be mitigated by targeting this axis.The NZM2410/NZW Sle1 interval by itself leads to low-
grade autoimmunity (22, 23). It has become clear that the
*These authors have contributed equally as lead authors. Received 27 June 2006, accepted 24 January 2007
Correspondence to: X. J. Zhou, E-mail: [email protected]; C. Mohan, E-mail: [email protected]
Transmitting editor: P. Ohashi Advance Access publication 15 March 2007
by guest on March 4, 2014
http://intimm
.oxfordjournals.org/D
ownloaded from

Sle1 lupus susceptibility interval on mouse chromosome 1 iscomposed of three sub-loci, Sle1a, Sle1b and Sle1c (24).Among these, Sle1b is the strongest locus being associatedwith the highest levels or penetrance of auto-antibodies(24). Recently, it has been shown that polymorphic variantsof the SLAM family of molecules constitute the culprit genesfor Sle1b (25). Hence, to accomplish the aforementionedgoals, the present study utilizes a newly generatedB6.Sle1bNZM/NZM.FASlpr strain (referred to as B6.Sle1bz.lpr inthis manuscript) that is double homozygous for FASlpr andthe NZM2410/NZW allele of Sle1b on chromosome 1.
Methods
Mice
C57BL/6 (B6) mice were obtained from the Jackson Labora-tory (Bar Harbor, ME, USA) and subsequently bred in ouranimal colony. B6.Sle1bNZM2410/NZM2410 mice, simply referredto as B6.Sle1bz (or B6.Sle1b), are B6 mice rendered con-genic for the NZM2410-derived Sle1b interval on chromo-some 1 with termini at D1mit113 and D1mit407, excludingSle1a and Sle1c. B6.FASlpr (or B6.lpr) mice are B6 micebearing the lpr mutation of FAS on a B6 background, exhibit-ing modest autoimmunity (26), obtained from the JacksonLaboratory. B6.Sle1bz.lpr mice expressing Sle1bz and FASlpr,both homozygously, were derived by breeding B6.Sle1bz
with B6.lpr, and then crossing the double heterozygous off-spring with each other and selecting progeny that were ho-mozygous at both loci. All mice used for this study werebred and housed in a specific pathogen-free colony at UTSouthwestern Medical Center, Department of Animal Resour-ces, in Dallas, TX, USA. Both male and female mice wereused, and any observed sex differences are noted.
Flow cytometric analysis and antibodies
Splenocyte preparations were depleted of red blood cellsusing tris–ammonium chloride, and single cell suspensionswere prepared for flow cytometric analysis. Lymph nodes(LNs) were obtained from the inguinal sites, and crushed toobtain single cell suspensions. Peritoneal cavity cells wereobtained by flushing the peritoneal cavities with fresh media.Flow cytometric analysis was performed as described previ-ously (10). Briefly, cells were first blocked with staining me-dium (PBS, 5% horse serum, 0.05% azide) containing 10%normal rabbit serum. Cells were then stained on ice with op-timal amounts of FITC, PE, PerCP or biotin-conjugated pri-mary antibodies, diluted in staining medium for 30 min. Thefollowing dye- or biotin-coupled antibodies were obtainedfrom PharMingen, San Diego, CA, USA: CD4 (RM4-5), CD5(53-7.3), CD8 (Ly-2), CD19 (1D3), CD23 (B3B4), CD44(IM7), CD45R/B220 (RA3-6B2), CD69 (H1.2F3), CD80/B7-1(16-10A1), CD86/B7-2 (GL1), and used at pre-titrated dilu-tions. Cell staining was analyzed using a FACScan (Becton-Dickinson, San Jose, CA, USA). Dead cells were excludedon the basis of scatter characteristics and 10,000 eventswere acquired per sample. The mean linear units on the for-ward scatter channel were used as indicators of cell size.CD3+ve T cells that did not express CD4 or CD8 were clas-sified as double-negative (DN) T cells. B220+ve cells werefurther subdivided into B1a and B2 cells based on whether
or not they expressed surface CD5. In addition, the percen-tages of follicular B cells (B220+ve, CD23+ve, CD21lo), andmarginal zone B cells (B220+ve, CD23lo, CD21hi) were alsodefined. B220+ve, CD21lo, CD23lo B cells were identified asbeing pre-plasmablasts predominantly based on their sur-face expression of syndecan-1, CD43 and other markers asindicated.
T-cell functional studies
For the functional studies, splenic CD4+ T cells were purifiedfrom the indicated strains using anti-CD4 magnetic beads(Miltenyi Biotec, Auburn, CA, USA) and were >95% pure.For the T-cell proliferation assays, the purified splenic T cellswere stimulated with 1 ug ml�1 plate-bound anti-CD3 for 24or 96 h. The degree of cell division was gauged from the se-rial diminution of CFSE (carboxy-fluorescein diacetate, suc-cinimidyl ester), as determined by flow cytometry. Forgauging the degree of apoptosis, the cells were stained withAnnexin V (PharMingen) and 7-AAD (7-amino-actinomycin D,Calbiochem) and examined by flow cytometry at the indicatedtime points.
ELISA for auto-antibodies
The anti-dsDNA, anti-ssDNA, anti-histone and anti-histone/DNA ELISA assays were carried out as described before(10). Raw OD (optical density) was converted to U ml�1 us-ing a positive control serum derived from a B6.Sle1.lprmouse, arbitrarily setting the reactivity of a 1:100 dilution ofthis serum to 100 U/ml. Test sera with reactivity stronger thanthe standard were diluted further and re-assayed. The glo-merular-binding ELISA was performed as described previ-ously (10) using sonicated rat glomeruli as substrate.
Renal disease
Mice were monitored at 3 and 6 months of age for evidenceof nephritis. Urine was collected using metabolic cages andthe total amount of urinary protein was measured by aComassie-based assay (Pierce, Rockford, IL, USA). Bloodurea nitrogen was measured using a commercially availablekit (Sigma Chemicals). Upon sacrifice, kidneys were fixed,sectioned and stained with hematoxylin and eosin and peri-odic acid schiff. At least 100 glomeruli were examined persection, by light microscopy, for evidence of inflammation,and/or tissue damage, and graded as described before(27) in a blinded fashion. The occurrence of any mesangio-pathic, capillary hyaline, proliferative, membranous or cres-centic glomerular changes was also noted.
Western blot analysis
Splenocyte preparations from 2- to 3-month old mice weredepleted of red blood cells using tris–ammonium chloride,and single cell suspensions were lysed using 20 mM Tris–HCl (pH 7.5), 150 mM NaCl, 1 mM Na2EDTA, 1 lg ml�1 leu-petin, 1% Triton X-100, 1 mM phenylmethylsulphonylfluorideand 1 mM Na3VO4. Total protein was quantified by the Brad-ford assay, and 40 lg per lane was loaded onto SDS–PAGEgels. The following primary antibodies were obtained fromCell Signaling Technology (Beverly, MA, USA): anti-mTOR(catalog #2972), anti-phospho-mTOR (Ser2448, catalog#2971), anti-4EB-BP1 (catalog #9452), anti-phospho-4E-BP1
510 AKT/mTOR axis in lymphoproliferative lupus
by guest on March 4, 2014
http://intimm
.oxfordjournals.org/D
ownloaded from

(Thr37/46, catalog #9459), anti-p70S6 kinase (catalog #9202),anti-phospho-p70S6 kinase (Thr389, catalog #9205), anti-AKT(catalog #9279), anti-phospho-AKT (T308, catalog # 9275),anti-phospho-IKKa (Ser180)/IKKb (Ser181) (catalog #2681),anti-PTEN (catalog #9552), anti-phospho-PTEN (S380, T382,T383; catalog #9554), anti-phospho-Erk-1,2 MAPK (catalog#9102) and anti-SAPK/JNK (catalog #9252). Anti-PI3K (p85,catalog # 06-497) was purchased from Upstate Biotechnol-ogy (Waltham, MA, USA), whereas the phospho-specific anti-AKT (pS473) antibody was from Biosource International(Camarillo, CA, catalog # 44-622).
Monoclonal mouse anti-glyceraldehyde-3 phosphatedehydrogenase (GAPDH), or anti-actin, from AdvancedImmunochemical Inc. (Long Beach, CA, catalog # RGM2)was used to further confirm equal protein loading.HRP-conjugated secondary antibodies and the ECL-plusDetection kit (Amersham, Piscatawy, NJ, USA) were usedto develop the blot. The respective band intensities weremeasured using ImageJ (http://rsb.info.nih.gov/ij), and nor-malized based on GAPDH levels. Where samples from dif-ferent strains were compared, all normalized bandintensities were expressed as ratios relative to the B6 lev-els. In some studies, lysates were made from splenic T- orB cells purified using anti-CD4 or anti-CD19 magneticbeads (Miltenyi Biotec); in these studies the resulting cellswere >95% pure.
In vivo treatment protocol
RAD001 (2% w/w stock solution; Novartis, Basel, Switzer-land) was diluted in PBS to 1 mg ml�1. Three to 6-month-oldmice were administered a final dose of 10 mg kg�1 RAD001or vehicle alone (i.e. ‘placebo’), by oral gavage 33/week for4 weeks. Serum and 24-h urine samples were obtained onday 0, day 14 and day 28. All serum samples were assayedfor auto-antibodies by ELISA. The urine samples wereassayed for total protein. On day 28, upon sacrifice, the cel-lular composition of the spleen and nodes were determinedby flow cytometry, and the kidneys were examined for pa-thology, as described above. In addition, the expression ofvarious signaling molecules in the spleens of the treatedmice was assayed by western blot, as described above.
Statistics
Statistical comparisons were performed using the paired or un-paired Students’ t-test, as appropriate, using SigmaStat (Jandelscientific). For all experiments, the mean/SEM is also depicted.
Results
Cellular phenotypes in B6.Sle1bz.lpr mice
As depicted in Fig. 1 and Table 1, the epistatic interactionof Sle1bz and FASlpr led to severe splenomegaly and
Fig. 1. Expansion of unusual subsets of B- and T cells in B6.Sle1bz.lpr spleens. Splenocytes from 6-month-old B6, B6.Sle1bz, B6.lpr andB6.Sle1bz.lpr mice were analyzed by flow cytometry, as described in Materials and Methods. Depicted are the CD4 versus CD8 plots, gated onlive CD3+ve cells (A) and B220 versus CD5 plots, gated on all live cells (B). Indicated in the upper right quadrants of ‘A’ are the respectivepercentages of CD8+ve (upper left), double negative (lower left), and CD4+ve (lower right) T cells within the spleens. Indicated within the plots in‘B’ are the respective percentages of B1a cells (top) and B2 cells (bottom). Plotted also are the percentages of CD4+ve cells that were CD69+(C). Displayed plots are representative of six mice from each strain, as detailed and statistically analyzed in Table 1.
AKT/mTOR axis in lymphoproliferative lupus 511
by guest on March 4, 2014
http://intimm
.oxfordjournals.org/D
ownloaded from
lymphadenopathy, with significantly elevated total lympho-cyte numbers in all secondary lymphoid organs examined.The spleens exhibited significantly expanded numbers ofCD3+ve, CD4�ve, CD8�ve DN T cells, relative to B6 micebearing Sle1bz alone, or FASlpr alone (Fig. 1, Table 1). In ad-dition, both the CD4 and CD8 T cells from B6.Sle1bz.lprmice were significantly more activated, compared withT cells from the control strains (Table 1, Fig. 1; data from6-month-old mice are shown). In the B-cell compartment,a strong skewing to B1a cells was noted both in the spleensas well as in the peritoneal cavity (Table 1). In both the B6and B6.Sle1bz controls, about two-thirds of the splenicB cells were follicular in surface phenotype, whereas abouta fifth were marginal zone B cells. In contrast, B6.Sle1bz.lprmice exhibited a massive expansion of B cells that lackedboth CD21 and CD23, as detailed in Table 1. Staining foradditional surface markers revealed that these cells werepredominantly pre-plasmablasts, as evidenced by their highsurface expression of CD43 and syndecan-1, but low levelsof IgM and various activation markers (Fig. 2). Takentogether, these mice resembled B6.Sle1.lpr mice describedpreviously, bearing the full Sle1 interval (10).
Similar results were noted even at younger ages (data nottabulated); for these repeat studies, anti-CD19 was used in-stead of anti-B220 as the staining reagent to identify B cells.Briefly, B6.Sle1bz.lpr spleens harbored a total of (41 6 1.1)3 106 CD19+ B cells, compared with (36 6 1.5) 3 106 inB6.Sle1bz spleens, and (34 6 2.6) 3 106 in B6.lpr spleens(n = 3 each, aged 3 months; P < 0.02, compared with
B6.Sle1bz.lpr; data not plotted). As noted above using anti-B220, only 49% of CD19-gated splenic B6.Sle1bz.lpr B cellswere follicular in phenotype, compared with 77% and 67%,respectively, in B6.Sle1bz and B6.lpr spleens (n = 3 each,aged 3 months; P < 0.005, compared with B6.Sle1bz.lpr;data not plotted). Likewise, 22% of B6.Sle1bz.lpr splenicB cells were CD23�ve, CD21�ve, and the correspondingvalues for B6.Sle1bz and B6.lpr splenic B cells were 12%and 19%, respectively (n = 3 each, aged 3 months; datanot plotted). In the limited numbers of mice examined, nosignificant gender differences were noted in these cellularphenotypes.
Similar changes were also noted in the LN of these mice.Hence, B6.Sle1bz.lpr-derived submandibular/brachial LNweighed ;424.2 6 96.2 mg, with (76.0 6 9.2) 3 106 cellsper node (representing the mean 6 SEM of six mice, aged6 months). These figures were 50- to 100-fold higher thanthe sizes and cell counts noted in the LN from the controlstrains (10, and data not shown). As was the case withthe spleen, there was a massive expansion of DN T cells(25.9 6 4.4% of all T cells; n = 6) and B1a cells (63.8 6
2.0% of all B cells, n = 6) in B6.Sle1bz.lpr LN, comparedwith the control LN.
Functional differences in B6.Sle1bz.lpr lymphocytes
Since B6.Sle1bz.lpr spleens and nodes harbored increasednumbers of lymphocytes, we proceeded to ask if these dif-ferences were the consequence of reduced apoptosis, orincreased cell division. For this purpose, we focused on
Table 1. Activation status and lymphocyte subsets in B6.Sle1bz.lpr micea
B6 (n = 6) B6.Sle1bz (n = 6) B6.lpr (n = 6) B6.Sle1bz.lpr (n = 6) B6.Sle1bz.lpr compared with
B6b B6.Sle1bz B6.lpr
SpleenWeight (mg) 133.3 6 8.9 131.8 6 10.1 175.0 6 22.4 405.3 6 47.4 *** *** ***Cell count (3106) 95.7 6 7.3 103.8 6 7.3 92.9 6 5.1 239.2 6 15.7 *** *** ***
Splenic T cells%CD4 T cellsc 15.0 6 0.7 14.8 6 0.6 13.7 6 1.1 14.9 6 1.0 NS NS NS%CD8 T cellsc 9.2 6 1.4 11.2 6 0.9 7.0 6 1.1 7.9 6 1.8 NS NS NS%CD3+ DN T cellsc 3.6 6 0.4 3.8 6 0.5 7.5 6 1.5 17.2 6 1.4 *** *** ***CD4 T cells: % CD69+ve 28.2 6 2.3 25.7 6 6.7 38.5 6 3.2 50.1 6 5.2 ** ** *CD4 T cells: mean FSCd 73.8 6 0.8 73.6 6 1.1 74.1 6 1.2 78.6 6 1.4 ** ** *CD8 T cells: % CD69+ve 17.2 6 1.8 17.6 6 4.4 30.6 6 2.6 40.9 6 3.9 *** ** *CD8 T cells: mean FSCd 84.2 6 1.3 81.7 6 1.5 80.8 6 1.9 84.6 6 0.9 NS NS NS
Splenic B cells%B2 cellse 48.6 6 2.3 49.3 6 1.6 36.8 6 3.7 37.5 6 2.7 ** ** NS%B1a cellse 9.3 6 1.3 8.4 6 1.1 13.4 6 0.9 30.8 6 2.4 *** *** ***B220+: %CD23hi, CD21lo e 65.5 6 4.4 72.3 6 3.8 45.9 6 3.3 25.6 6 4.5 *** *** ***B220+: %CD23lo, CD21hi e 25.1 6 3.8 20.6 6 3.0 25.4 6 1.0 28.3 6 2.8 NS * NSB220+: %CD23lo, CD21lo e 6.7 6 1.7 4.9 6 0.4 23.8 6 3.8 41.6 6 4.9 *** *** **
Peritoneal cavity%B1a cellse 10.1 6 4.0 15.8 6 6.2 19.9 6 7.8 67.7 6 26.6 *** *** ***%B2 cellse 75.5 6 29.7 64.9 6 25.6 62.6 6 24.6 18.6 6 7.3 *** *** ***
aIndicated are the mean 6 SEM values of the indicated parameters drawn by observing six mice per strain at the age of 6 months. This includedthree male and three female mice per strain.bIndicated are the results of comparing the values obtained from the B6.Sle1bz.lpr mice against the data from the three control strains using thestudent’s t-test (*P < 0.05; **P < 0.01; ***P < 0.001; NS = not significant).cIndicated are the respective percentages of various T-cell subsets out of all live cells within the lymphocyte gate. DN T cells are T cells that areCD3+ve, but negative for CD4 and CD8.dCell size was inferred from the mean forward scatter (‘FSC’) of the cells, as ascertained by flow cytometry.eIndicated are the respective percentages of various B-cell subsets out of all live cells within the lymphocyte gate. B2 cells were B220+ve,CD5�ve, whereas B1a cells are B220+ve and CD5+ve. B220+ve cells were also subsetted based on their expression of CD23 and CD21.
512 AKT/mTOR axis in lymphoproliferative lupus
by guest on March 4, 2014
http://intimm
.oxfordjournals.org/D
ownloaded from

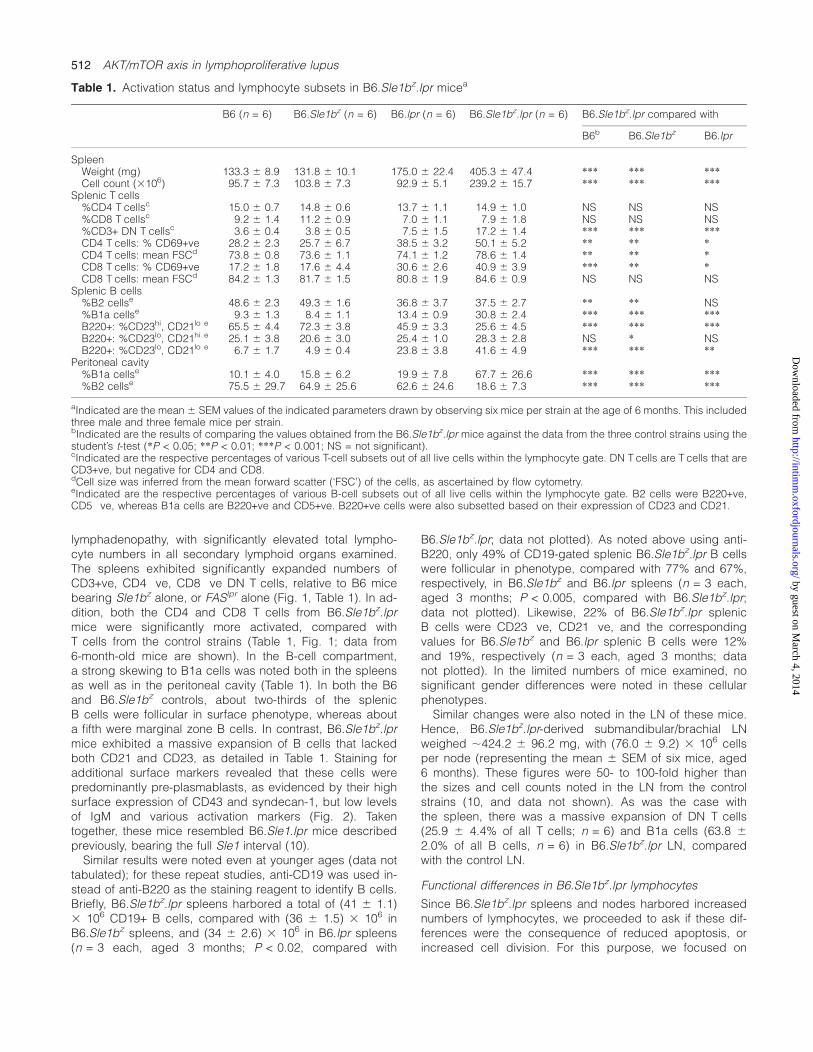
splenic magnetic bead-purified CD4+ T cells from the fourstrains, at the age of 2 months. As noted in Fig. 3, B6.lprand B6.Sle1bz.lpr T cells and T-cell blasts exhibited reducedapoptosis, following anti-CD3 stimulation, unlike Sle1bz andB6 T cells. In contrast, B6.Sle1bz T cells demonstrated in-creased cell division following anti-CD3 stimulation, com-pared with B6 and B6.lpr T cells (Fig. 4). Surprisingly, theT cells from B6.Sle1bz.lpr spleens were rather lethargic in re-sponse to anti-CD3 stimulation, compared with the controlstrains, possibly indicating that a substantial fraction ofT cells from these lupus mice might have already acquireda terminal ‘exhausted’ phenotype (following chronic stimula-tion by endogenous autoantigens).
Auto-antibodies and pathology in B6.Sle1bz.lpr mice
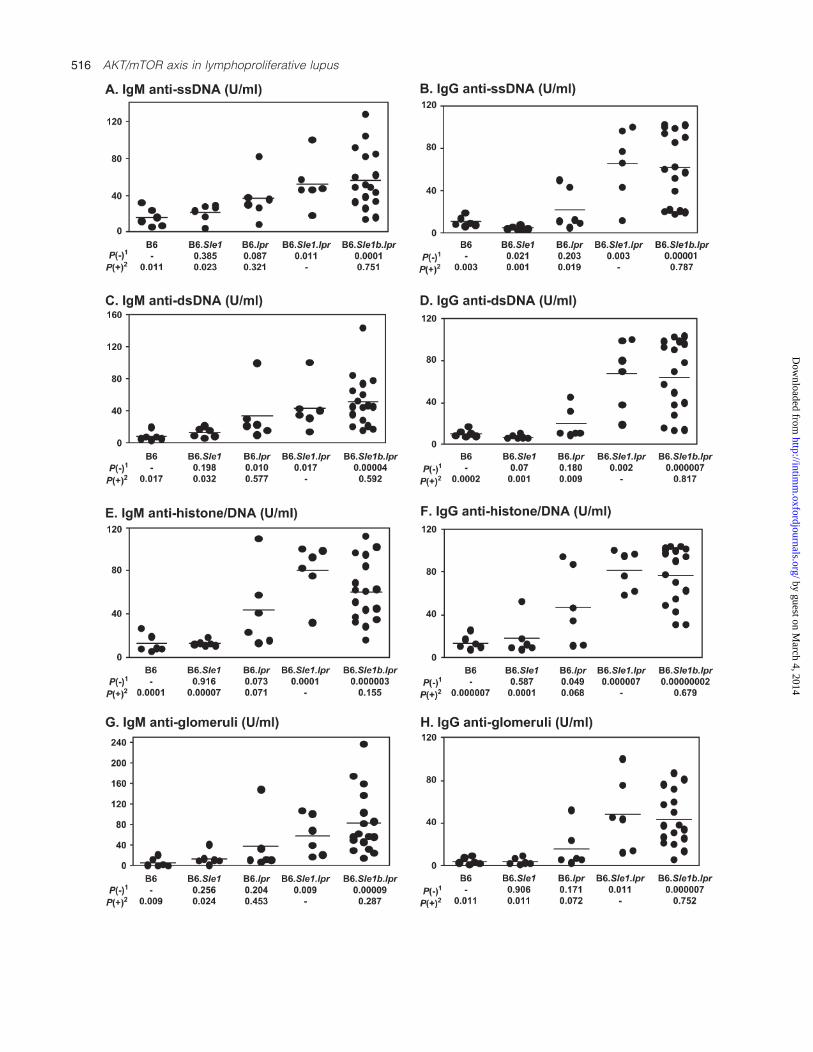
B6.Sle1bz.lpr mice also exhibited high serum levels of IgMand IgG auto-antibodies to ssDNA, dsDNA, histones andhistone/DNA complexes (Fig. 5), compared with the B6.lprand B6.Sle1bz controls. Although B6.Sle1bz mice were rela-tively free of auto-antibodies at this age, B6.lpr miceexhibited a modest degree of serological autoreactivity (Fig. 5),as has been noted previously (10). Also as noted previ-ously, B6.Sle1bz.lpr females exhibited significantly higherlevels of IgG anti-dsDNA (P < 0.0005), anti-ssDNA(P < 0.005), anti-histone (P < 0.002), anti-histone/DNA
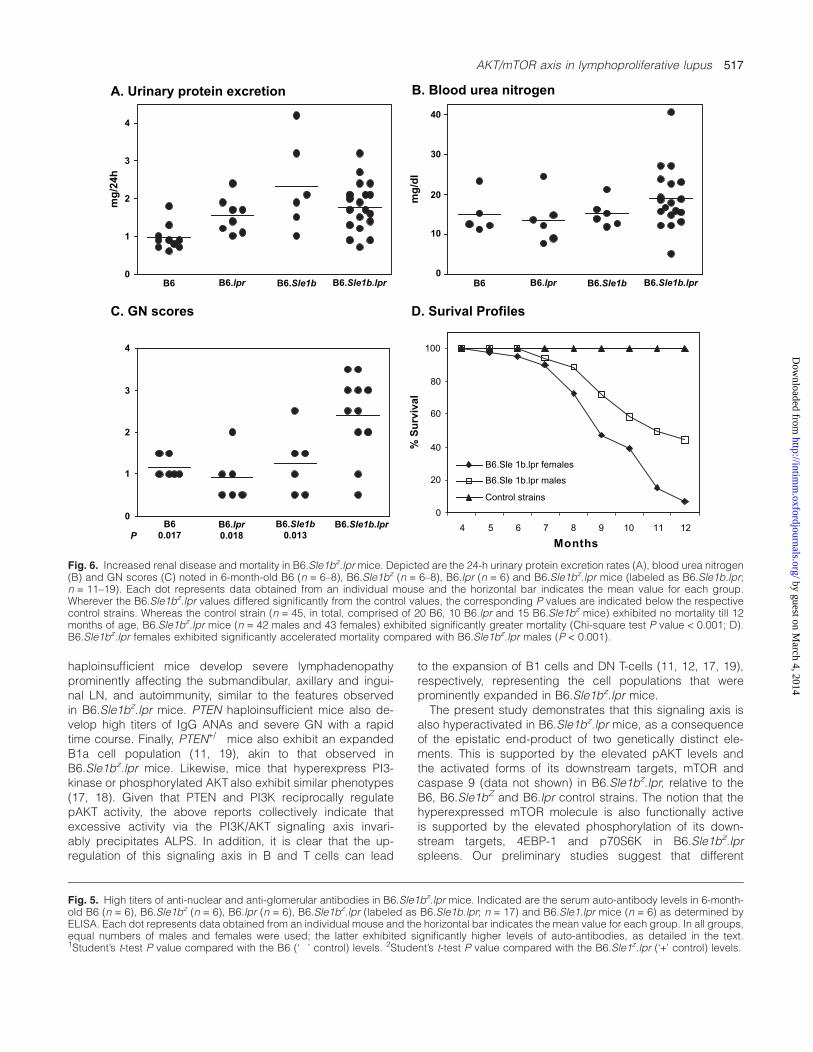
(P < 0.006) and anti-glomerular antibodies (P < 0.015), aswell as IgM anti-dsDNA (P < 0.015), anti-ssDNA (P < 0.01),anti-histone (P < 0.05), anti-histone/DNA (P < 0.003) and anti-glomerular antibodies (P < 0.05), compared with B6.Sle1bz.lprmales (data not separately plotted). As one might havepredicted, B6.Sle1bz.lpr mice also developed nephritis asgauged by various parameters. Although the increased pro-teinuria and azotemia in B6.Sle1bz.lpr mice failed to attainstatistical significance, the histological glomerulonephritis(GN) scores in these mice were significantly higher than thosein all control groups (Fig. 6A–C). In resonance with the genderdifference in auto-antibody profiles, B6.Sle1bz.lpr femalesexhibited significantly more severe renal disease (average GNscore = 2.8, P < 0.05), compared with B6.Sle1bz.lpr males(average GN score = 1.9; data not plotted separately). Finally,B6.Sle1bz.lpr mice exhibited accelerated mortality comparedwith the controls, again with a distinct gender difference(Fig. 6D; P < 0.001).
Hyperactivated PI3K/AKT/mTOR axis in B6.Sle1bz.lpr mice
Given that several genetically engineered mouse modelswith exaggerated PI3K/AKT signaling activity have beennoted to develop ALPS with features similar to those ob-served in B6.Sle1bz.lpr mice (11, 12, 17, 18), we next exam-ined the latter strain for evidence of increased signaling viathis axis. For these studies, females were used for all strainssince they exhibited more severe disease. As depicted inFig. 7A, significantly increased pAKT levels were noted inB6.Sle1bz.lpr spleens compared with the spleens of all threecontrol strains, even after controlling for the levels of totalAKT. Given that the epistatic interaction of Sle1bz and FASlpr
led to significantly elevated pAKT levels, we then analyzedthese mice for the levels of an important downstream targetof pAKT—mTOR. As is evident from Fig. 7(B), B6.Sle1bz.lprspleens exhibited significantly elevated phosphorylatedmTOR levels relative to the levels of total mTOR. Additionally,another downstream target, caspase 9, was also hyperacti-vated in B6.Sle1bz.lpr spleens (data not shown). The expres-sion levels of downstream molecules activated by mTORwere next examined. As depicted in Fig. 7(C), both the ex-pression of phospho-p70S6k and phospho-4EBP-1 were ele-vated in B6.Sle1bz.lpr spleens. Whereas the B6.Sle1bz andB6.lpr mice also showed increased phosphorylation ofp70S6K, relative to B6, the elevated levels of total/phosphor-ylated 4EBP-1 were noted to be particularly dependent uponthe epistatic interplay of Sle1bz and FASlpr (Fig. 7C).
The above studies indicate that several downstream sig-naling rami controlled by pAKT were hyperactivated inB6.Sle1bz.lpr mice. We next examined the expression levelsof ‘upstream’ molecules (PI3K and PTEN) that may poten-tially modulate pAKT activity. Activated PTEN levels weresignificantly reduced in B6.Sle1bz and B6.lpr spleens (rela-tive to B6 controls), with the levels tending to be even lowerin B6.Sle1bz.lpr mice (Fig. 7D). Likewise, elevated PI3K lev-els were noted in B6.Sle1bz.lpr spleens, but these levels didnot appear to be significantly higher than the levels in eithercontrol strains, Sle1bz or FASlpr. Presently, it is not clear if themonitoring of particular activated forms of PI3K or PTENmight uncover any epistatic impacts of Sle1bz and FASlpr onPI3K/PTEN balance. Although the above western blot studies
Fig. 2. Expanded pre-plasmablasts in B6.Sle1bz.lpr spleens.Depicted are the CD21 and CD23 expression profiles on splenicB220+ve B cells from B6.Sle1bz.lpr mice (Top). The percentage of Bcells that were gated within the three regions shown are detailed inTable 1, for the respective strains. Also depicted are the surfacecharacteristics of the three-gated B-cell populations. Annotated arethe percentages of each B-cell population that stained positive for thedifferent surface markers. Shown plots are representative of twoindependent experiments.
AKT/mTOR axis in lymphoproliferative lupus 513
by guest on March 4, 2014
http://intimm
.oxfordjournals.org/D
ownloaded from
were conducted with whole spleens, the AKT axis alsoappeared to be activated in magnetic bead-purified CD4+T- and B cells from B6.Sle1bz.lpr spleens, compared withcontrol CD4+ T- and B cells (Fig. 7E). Notably, this axis wasobserved to be particularly hyperactivated among the CD4 Tcells from B6.Sle1bz.lpr spleens (Fig. 7E).
Blocking mTOR modulated disease in B6.Sle1bz.lpr mice
Given that the PI3K/AKT/mTOR signaling axis was overac-tive in B6.Sle1bz.lpr mice, we asked if pharmacologicalmodulation of this pathway might ameliorate lymphoprolifera-tive lupus. mTOR is a key downstream effector in the PI3K/AKT signaling axis (21, 28) and the phosphorylated form ofthis molecule is evidently hyperexpressed in B6.Sle1bz.lprmice. Importantly, targeting this molecule using rapamycinhas been shown to ameliorate various forms of malignancies(28–31). Recently, a more effective derivative of rapamycin,RAD001, with better pharmacokinetic properties has beendescribed (32–35). Three- to 6-month old B6.Sle1bz.lpr micethat had already developed features of lymphoproliferativelupus were treated with RAD001, or placebo, to gauge theimpact of targeting this specific signaling axis, once lympho-proliferative autoimmunity had already set in.
The most dramatic effect of RAD001 treatment was therapid mitigation of the lymphoproliferative phenotypes inB6.Sle1bz.lpr mice, noted in at least two independent treat-ment studies that were conducted. This was marked by therapid and significant reduction of the spleen and nodes, bothin terms of weight and total cell numbers (Fig. 8A). One ofthe cardinal features that mark the secondary lymphoidorgans of B6.Sle1bz.lpr mice is the massive expansion of twopeculiar cell populations: CD3+, CD4�ve, CD8�ve DN Tcells, as well as CD5+ve B1a cells, as described above (Ta-ble 1, Fig. 1). Importantly, treatment of B6.Sle1bz.lpr mice withRAD001 significantly reduced splenic DN T cells and normal-ized the skewed B1a:B2 ratios in a reproducible fashion (Fig.8A). Similar findings were noted in the LNs as well (data notplotted). Full blood counts on these mice revealed only a re-duction in lymphocytes but not other cell types or the hemo-globin levels (Fig. 8B). Surprisingly, however, substantialincreases were noted in the absolute numbers of platelets,basophils and neutrophils, the significance of which presentlyremains unknown (Fig. 8B).
The impact of RAD001 treatment on the serological phe-notypes was more subtle. When one compared the av-erage levels of serum IgG anti-nuclear antibodies (ANA),
0
10
20
30
40
50 24 h
Sle1b allele
FAS gene
P
B6/B6
B6/B6
0.0005
z/z
B6/B6
0.0005
B6/B6
lpr/lpr
0.1238
z/z
lpr /lpr
-
Sle1b allele
FAS gene
P
B6/B6
B6/B6
0.009
z/z
B6/B6
0.007
B6/B6
lpr/lpr
0.077
z/z
lpr /lpr
-
Sle1b allele
FAS gene
P
B6/B6
B6/B6
0.00003
z/z
B6/B6
0.0002
B6/B6
lpr/lpr
0.012
z/z
lpr /lpr
-
Sle1b allele
FAS gene
P
B6/B6
B6/B6
0.007
z/z
B6/B6
0.008
B6/B6
lpr/lpr
0.151
z/z
lpr /lpr
-
0
10
20
30
40
50 48 h
0
5
10
15
20
25
Experiment 1
0
10
20
30
40
Experiment 2
A. Percentage apoptosis of primary CD4 T-cells
B. Percentage apoptosis among T-cell blasts
Fig. 3. Impact ofSle1bz and FASlpr on lymphocyte apoptosis. (A) Purified primary splenic CD4 Tcells from the four strains (n = 6 mice each) werestimulated with plate-bound anti-CD3 antibody for 24 h and 48 h and assessed for apoptosis using Annexin V and 7-AAD. Plotted are percentageof CD4 T cells that are positive for both Annexin V and 7-AAD. (B) Splenic T cells were stimulated with soluble anti-CD3 for 48 h, then Ficoll-purified and re-stimulated with plate-bound anti-CD3. Apoptosis was assessed 24 h or 48 h later. Depicted are two independent experiments(n = 3 each) showing the percentage of apoptotic cells positive for both Annexin V and 7-AAD among the T-cell blasts 24 h after re-stimulation.Shown P values pertain to Student’s t-test comparison of apoptotic rates of B6.Sle1bz.lpr T cells against that of T cells from the other strains.
514 AKT/mTOR axis in lymphoproliferative lupus
by guest on March 4, 2014
http://intimm
.oxfordjournals.org/D
ownloaded from
the RAD001-treated groups did not significantly differ fromthe placebo groups at the end of the study. However, whenthe serum levels of IgG ANAs from each individual mousewas compared at day 0 and at the conclusion of the studyon day 28, the RAD001-treated mice did not exhibit a signifi-cant change in serum auto-antibody levels, whereas the pla-cebo group of mice continued to exhibit increasing auto-antibody levels to a significant degree (Fig. 8C). Hence, al-though RAD001 appears to have the potential to modulateserum auto-antibodies, perhaps more prolonged, frequentor early therapy may be required to effect more dramaticchanges in serum auto-antibodies. Whereas the placebo-treated mice began exhibiting signs of renal disease by theconclusion of the experiment, the RAD001-treated miceexhibited significantly lower urinary protein levels (Fig. 8D).This brief treatment protocol had a marginal impact on GNscores (1.7 6 0.2 in the RAD001 group, versus 2.5 6 0.5 inthe placebo group, on the average, P < 0.08, data not plot-ted). Finally, as demonstrated in Fig. 9, RAD001 treatmentwas associated with significant dampening of the mTOR-me-diated signaling axis. Interestingly, in addition to the signifi-cant reduction in the phosphorylated form of mTOR, 4EBP-1and p70S6K, the total levels of mTOR and p70S6K were alsoreduced by RAD001 treatment (Fig. 9A).
Status of other signaling axes in B6.Sle1bz.lpr mice
Finally, it became apparent that the PTEN/PI3K/AKT axiswas not the only pathway that was hyperactivated in
B6.Sle1bz.lpr spleens. Among several other signaling path-ways examined, the most dramatic difference was noted inthe expression levels of Erk1,2 MAPK and the Nfkb pathway(based on the increased levels of pIKKab), as depicted inFig. 9(B). It is now clear that there is a substantial degree ofcrosstalk between these other signaling axes and the AKTpathway. Importantly, one of the downstream targets ofphosphorylated mTOR is IKKab, and this might explain itsincreased phosphorylation in B6.Sle1bz.lpr mice. As a testof how independent other signaling pathways may be in thespleens of these mice relative to the AKT axis, additional sig-naling pathways were re-examined after RAD001 treatment.As demonstrated in Fig. 9(C), RAD001 treatment sup-pressed both pIKKab and Erk1,2 significantly with the im-pact on the former being more profound.
Discussion
Given that B6.Sle1z.lpr mice, but not B6.lpr controls,exhibited ALPS, we had earlier reasoned that in addition tothe genetic aberration in FAS, an additional genetic eventas exemplified by the NZM2410/NZW ‘z‘ allele of Sle1 maybe required for full-blown lymphoproliferative lupus to ensue(10). However, the Sle1 genetic interval itself is comprisedof several genetic players including Sle1a, Sle1b and Sle1c(24). The present work illustrates that the Sle1b locus withinthis susceptibility interval bearing the NZM2410/NZW ‘z’ al-lele of the SLAM family of molecules may be sufficient andnecessary for full-blown lymphoproliferative lupus, in thecontext of aberrant FAS function. This is consistent with thenotion that Sle1b may harbor the most ‘potent’ gene withinthe Sle1 interval, and confirms earlier reports indicating thepathogenic relevance of this locus (24, 36). The strainreported in this communication harbors the Sle1bz locus,but excludes the Sle1a and Sle1c loci.
The present report illustrates that the clinical features oflymphoproliferative lupus in B6.Sle1bz.lpr mice appear toarise as a consequence of the epistatic interplay of Sle1bz
with FASlpr. This includes the splenomegaly, lymphadenopa-thy, increased numbers of DN and CD4+ T cells, B1a cells,anti-nuclear and anti-glomerular auto-antibodies, as well asrenal disease. However, the mechanistic contributions of thetwo genetic players appear to be very different—whereasFASlpr (but not Sle1bz) impairs apoptosis of activated maturelymphocytes (7, 23; Fig. 3), Sle1bz appears to impede thecensoring of immature lymphocytes (37), and facilitate theproliferation of mature lymphocytes (Fig. 4). Hence, the ex-panded numbers of lymphocytes and the other epistaticphenotypes observed in B6.Sle1bz.lpr mice appear to bethe consequence of Sle1bz and FASlpr acting upon recipro-cal checkpoints controlling lymphocyte homeostasis.
Literature reports have amply demonstrated that overactiv-ity of the PI3K/AKT signaling cascade invariably leads tolymphoproliferative lupus. Perhaps the closest resemblanceto the B6.Sle1z.lpr and B6.Sle1bz.lpr strains is the PTEN+/�
haploinsufficient strain (11). PTEN encodes a phosphatasethat is mutated or aberrantly expressed in a high percentageof human tumors (15, 16). Although homozygous deficiencyof PTEN leads to embryonic lethality, B6/129.PTEN+/�
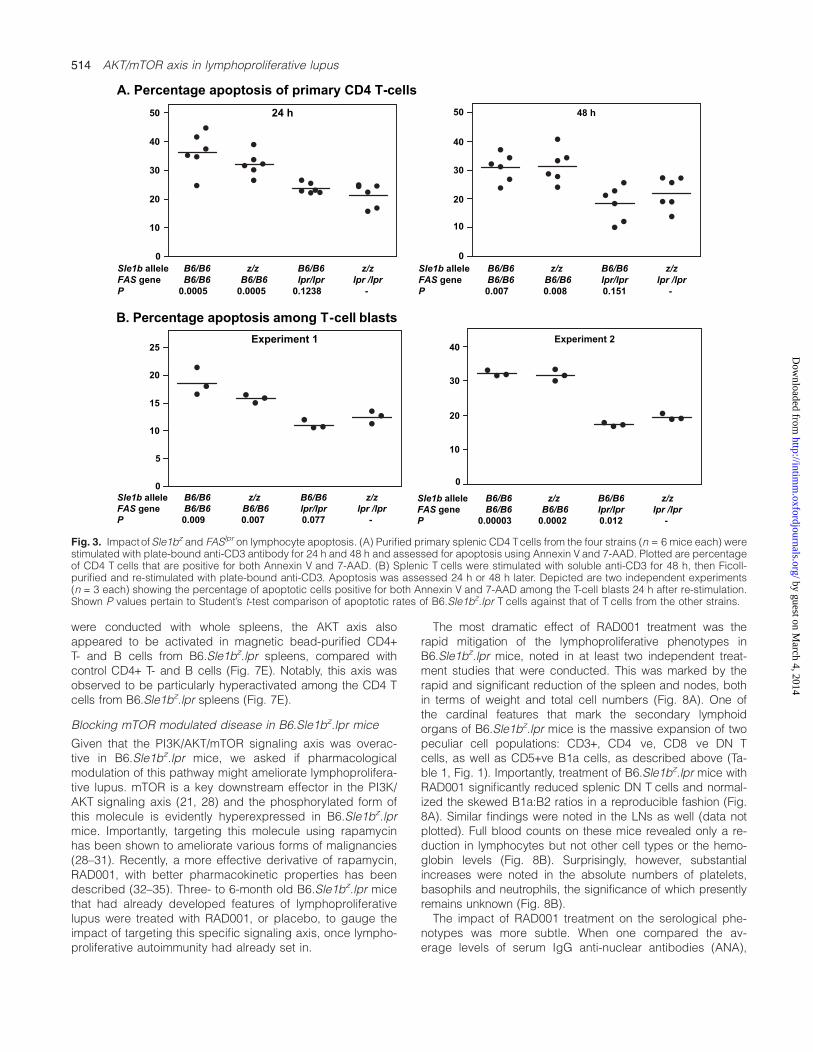
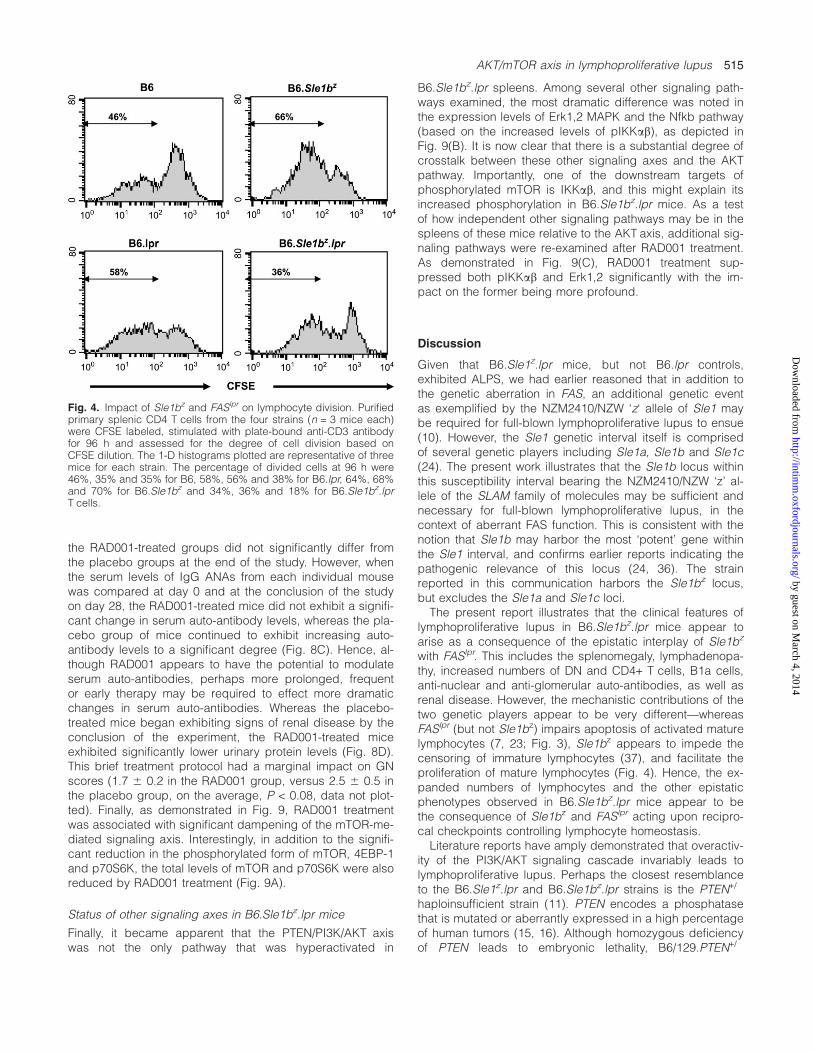
Fig. 4. Impact of Sle1bz and FASlpr on lymphocyte division. Purifiedprimary splenic CD4 T cells from the four strains (n = 3 mice each)were CFSE labeled, stimulated with plate-bound anti-CD3 antibodyfor 96 h and assessed for the degree of cell division based onCFSE dilution. The 1-D histograms plotted are representative of threemice for each strain. The percentage of divided cells at 96 h were46%, 35% and 35% for B6, 58%, 56% and 38% for B6.lpr, 64%, 68%and 70% for B6.Sle1bz and 34%, 36% and 18% for B6.Sle1bz.lprT cells.
AKT/mTOR axis in lymphoproliferative lupus 515
by guest on March 4, 2014
http://intimm
.oxfordjournals.org/D
ownloaded from
516 AKT/mTOR axis in lymphoproliferative lupus
by guest on March 4, 2014
http://intimm
.oxfordjournals.org/D
ownloaded from
haploinsufficient mice develop severe lymphadenopathyprominently affecting the submandibular, axillary and ingui-nal LN, and autoimmunity, similar to the features observedin B6.Sle1bz.lpr mice. PTEN haploinsufficient mice also de-velop high titers of IgG ANAs and severe GN with a rapidtime course. Finally, PTEN+/� mice also exhibit an expandedB1a cell population (11, 19), akin to that observed inB6.Sle1bz.lpr mice. Likewise, mice that hyperexpress PI3-kinase or phosphorylated AKT also exhibit similar phenotypes(17, 18). Given that PTEN and PI3K reciprocally regulatepAKT activity, the above reports collectively indicate thatexcessive activity via the PI3K/AKT signaling axis invari-ably precipitates ALPS. In addition, it is clear that the up-regulation of this signaling axis in B and T cells can lead
to the expansion of B1 cells and DN T-cells (11, 12, 17, 19),respectively, representing the cell populations that wereprominently expanded in B6.Sle1bz.lpr mice.
The present study demonstrates that this signaling axis isalso hyperactivated in B6.Sle1bz.lpr mice, as a consequenceof the epistatic end-product of two genetically distinct ele-ments. This is supported by the elevated pAKT levels andthe activated forms of its downstream targets, mTOR andcaspase 9 (data not shown) in B6.Sle1bz.lpr, relative to theB6, B6.Sle1bZ and B6.lpr control strains. The notion that thehyperexpressed mTOR molecule is also functionally activeis supported by the elevated phosphorylation of its down-stream targets, 4EBP-1 and p70S6K in B6.Sle1bz.lprspleens. Our preliminary studies suggest that different
Fig. 5. High titers of anti-nuclear and anti-glomerular antibodies in B6.Sle1bz.lpr mice. Indicated are the serum auto-antibody levels in 6-month-old B6 (n = 6), B6.Sle1bz (n = 6), B6.lpr (n = 6), B6.Sle1bz.lpr (labeled as B6.Sle1b.lpr; n = 17) and B6.Sle1.lpr mice (n = 6) as determined byELISA. Each dot represents data obtained from an individual mouse and the horizontal bar indicates the mean value for each group. In all groups,equal numbers of males and females were used; the latter exhibited significantly higher levels of auto-antibodies, as detailed in the text.1Student’s t-test P value compared with the B6 (‘�’ control) levels. 2Student’s t-test P value compared with the B6.Sle1z.lpr (‘+’ control) levels.
A. Urinary protein excretion
0
1
2
3
4
mg
/24h
B. Blood urea nitrogen
0
10
20
30
40
mg
/d
l
C. GN scores
0
1
2
3
4
P
D. Surival Profiles
04 5 6 7 8 9 10 1211
20
40
60
80
100
Months
% S
urvival
B6.Sle 1b.lpr females
B6.Sle 1b.lpr males
Control strains
B6 B6.lpr B6.Sle1b B6.Sle1b.lpr
B6
0.017
B6.lpr
0.018
B6.Sle1b
0.013
B6.Sle1b.lpr
B6 B6.lpr B6.Sle1b B6.Sle1b.lpr
Fig. 6. Increased renal disease and mortality in B6.Sle1bz.lpr mice. Depicted are the 24-h urinary protein excretion rates (A), blood urea nitrogen(B) and GN scores (C) noted in 6-month-old B6 (n = 6–8), B6.Sle1bz (n = 6–8), B6.lpr (n = 6) and B6.Sle1bz.lpr mice (labeled as B6.Sle1b.lpr;n = 11–19). Each dot represents data obtained from an individual mouse and the horizontal bar indicates the mean value for each group.Wherever the B6.Sle1bz.lpr values differed significantly from the control values, the corresponding P values are indicated below the respectivecontrol strains. Whereas the control strain (n = 45, in total, comprised of 20 B6, 10 B6.lpr and 15 B6.Sle1bz mice) exhibited no mortality till 12months of age, B6.Sle1bz.lpr mice (n = 42 males and 43 females) exhibited significantly greater mortality (Chi-square test P value < 0.001; D).B6.Sle1bz.lpr females exhibited significantly accelerated mortality compared with B6.Sle1bz.lpr males (P < 0.001).
AKT/mTOR axis in lymphoproliferative lupus 517
by guest on March 4, 2014
http://intimm
.oxfordjournals.org/D
ownloaded from

Fig. 7. Expression of various signaling molecules in splenic lysates. Total lysates from 2-month-old B6, B6.Sle1bz, B6.lpr and B6.Sle1z.lpr(labeled as B6.Sle1b.lpr) spleens (n = 3–5, per strain), were electrophoresed, blotted and probed with antibodies to pAKT or total AKT (A), p-mTOR or total mTOR (B), p4EBP1 or total 4EBP-1 (C), phospho-p70S6K or total p70S6K (C), as well as PI3K (p85), PTEN and pPTEN (D).Depicted on the left are representative blots from the four strains studied. Plotted on the right are mean 6 SEM expression levels of three to fiveindependent spleens per strain, expressed as ratios. For the total levels of signaling molecules, ratios were derived relative to the GAPDH levels;for the phosphorylated forms of the proteins, ratios were derived by dividing the levels of the phosphorylated from by the total levels of thatmolecule in the same lysate. Indicated below each strain are the statistical P values comparing the expression levels in that strain, to thecorresponding levels in B6 spleens, as determined using the Student’s t-test (*P < 0.05; **P < 0.01; ***P < 0.001). Depicted in (E) are the levelsof pAKT in magnetic bead-purified B cells or CD4+ T cells from 2-month-old B6 or B6.Sle1bz.lpr spleens (n = 3 independent spleens per group),expressed as ratios, relative to the actin content (left) or total AKT (right). Each dot represents data obtained from an individual mouse and thehorizontal bar indicates the mean value for each group. Shown experiments are representative of two to three studies each.
518 AKT/mTOR axis in lymphoproliferative lupus
by guest on March 4, 2014
http://intimm
.oxfordjournals.org/D
ownloaded from

Ly108 isoforms, which constitutes a key candidate genewithin Sle1b (37), may impact AKT activation differentially(unpublished observations); in contrast, the contribution ofFASlpr to this axis may be indirect, arising as a consequenceof increased numbers of activated (potentially autoreactive)lymphocytes in the periphery that have failed to be effec-tively removed. Finally, the additional gender differences ob-served in the phenotypes of B6.Sle1bz.lpr mice may wellrelate to how female sex hormones impact signaling via theAKT axis, as has been demonstrated in other model systems(38–40).
Given that the PI3K/AKT/mTOR axis is fired up inB6.Sle1bz.lpr mice, this provides an attractive target for ther-apeutic intervention in this disease. In theory, one couldmodulate this axis at several nodes—PI3K, pAKT, mTOR orany of the downstream mediators. Although wortmanin and
Ly29400 have worked satisfactorily as PI3K inhibitor in vitro,they have not proven to be suitable for clinical therapeuticsfor a variety of reasons, including poor solubility and relativenon-selectivity. Indeed, our initial attempts to use Ly29400as a therapeutic option were not successful due to the poorsolubility of this compound (Patel and Mohan, unpublishedobservations). Although the blocking of pAKT appears to bea reasonable target, the use of selective AKT inhibitors hasbeen infrequently reported. In contrast, mTOR representsa very attractive target for several reasons, as discussedelsewhere (28–35).
Two key molecules activated by phosphorylation ofmTOR—4EBP-1 and p70S6K, play key roles in protein trans-lation (28). Whereas 4EBP-1 is required for cap-dependentprotein synthesis of several downstream effector proteins (in-cluding cyclins, CDKs, CDK-inhibitors, HIF1, VEGF, etc),
Fig. 8. Blocking mTOR function and its impact on lymphoproliferative autoimmunity. The spleen and lymph node sizes and cellular composition(in terms of absolute cell numbers) were compared between the RAD001-treated mice and placebo-treated B6.Sle1bz.lpr mice, at the conclusionof the study on D28 (A, n = 6–8 mice per group). The values in the RAD001 group were expressed as a percentage of the values in the placebogroup. Their full blood count profiles were similarly compared (B). The P values shown on the right in (A) and (B) pertain to Student’s t-testcomparisons of the data obtained from the two groups. Plotted in (C) are the serum IgG auto-antibody levels in the experimental (bottom) andplacebo (top) groups of mice on day 0 and day 28 (connected by dotted lines) of the treatment protocol, with six to seven mice included pergroup. Shown P values pertain to Student’s paired t-test comparisons of the day 0/day 28 data within each group. Treatment of 4- to 6-month oldB6.Sle1bz.lpr mice with RAD001 was not associated with as significant a rise in IgG auto-antibodies within individual mice, when compared withthe serological changes observed in the placebo-treated mice (C). Shown data in (A)–(C) is representative of two independent experiments withsimilar results. Depicted in (D) are the 24-h urinary protein excretion rates in the RAD001-treated mice and the placebo-treated mice on day 0 andday 28, pooled from two independent experiments.
AKT/mTOR axis in lymphoproliferative lupus 519
by guest on March 4, 2014
http://intimm
.oxfordjournals.org/D
ownloaded from

p70S6K is critical for translation of several ribosomal pro-teins, as well as components of the translational machinery.Although the blocking of mTOR function was noted to haveonly a marginal impact on total protein synthesis in normalcells, it has been observed to have a profound impact onmalignant cells (29, 31). Moreover, blocking mTOR functionhas been observed to ameliorate the lymphoproliferativephenotypes attributed to PTEN haploinsufficiency, as well asAKT overactivity, confirming that the disease triggered byaberrant PTEN/AKT function may be critically dependentupon mTOR activation (21, 29, 41, 42).
Several pharmaceutical companies have manufacturedmTOR inhibitors, a couple of which are presently in clinical
trials for cancer treatment. Rapamycin was originally isolatedfrom cultures of Streptomyces hygroscopicus sampled onEaster Island (‘Rapa Nui’) and has also been accorded thebrand name, Rapamune (sirolimus). Rapamycin derivative,including RAD001 (everolimus, Novartis), CCI-779 (Wyerth)and AP23573 (Ariad Pharmaceuticals), have been demon-strated to be particularly effective in treating various malig-nancies (29, 34, 35, 42). Indeed, it was remarkable to notethat the administration of RAD001 to B6.Sle1bz.lpr mice wasable to mitigate most of the examined phenotypes, despitebeginning the treatment after disease onset, with the effecton lymphoproliferation being more dramatic compared withthe impact on autoimmunity. It is conceivable that if therapy
Fig. 9. Blocking mTOR function impacts several signaling targets. (A) Indicated above are the expression profiles of various signaling moleculesin total splenocytes following RAD001 (n = 3–4, rightmost lanes) or control treatment (n = 3, leftmost lanes) of B6.Sle1bz.lpr mice. The mean 6SEM of three to four independent samples per group have been plotted below, normalized against actin levels within the same samples. Shownblots are representative of two independent studies. (B) Total lysates from 2-month-old B6, B6.Sle1bz, B6.lpr and B6.Sle1bz.lpr (labeled asB6.Sle1b.lpr) spleens (n = 3–5 per strain), were electrophoresed, blotted and probed with antibodies to pIKKab, p-Erk1,2 and p-SAPK/JNK.Plotted are the mean expression levels of three to five independent spleens, normalized to the GAPDH levels within the same spleens, andexpressed as ratios, relative to the corresponding B6 levels. Indicated below each strain are the statistical P values comparing the expressionlevels in that strain to the corresponding levels in B6 spleens, as determined using the Student’s t-test (*P < 0.05; **P < 0.01; NS = notsignificant). (C) Indicated are the expression profiles of pIKKab and p-Erk1,2, in total splenocytes, following RAD001 or control treatment of 4- to6-month old B6.Sle1bz.lpr mice. The mean 6 SEM of three to four independent samples per group have been plotted, normalized against actinlevels within the same samples. Shown blots are representative of two repeat experiments.
520 AKT/mTOR axis in lymphoproliferative lupus
by guest on March 4, 2014
http://intimm
.oxfordjournals.org/D
ownloaded from

had been commenced prior to the onset of disease, or ifmore prolonged therapy had been instituted, both featuresof lymphoproliferative autoimmunity might have been amelio-rated more profoundly. In this regard, we have recently ob-served that commencing RAD001 therapy early in diseaseand continuing therapy for 2 months (in another strain of mu-rine lupus) profoundly dampened autoimmunity as well aslymphoproliferation (Wu et al., in preparation).
The observation that RAD001 treatment had significant,but somewhat limited impact on parallel signaling pathwaysalso activated in ALPS (Fig. 9), suggests that the pharmaco-logical blocking of additional signaling axes may yield aug-mented therapeutic benefit. In this context, it has beenreported that intermittent dosing and combination therapywith other modulators may boost the eventual clinical useful-ness of mTOR-targeted therapy in cancer (35, 20). Finally,this treatment regime was not accompanied by any grossside effects, including weight loss, premature death or alter-ations in blood counts (data not shown).
The B6.Sle1bz.lpr model of ALPS has important parallels tohuman ALPS. Besides the strong phenotypic resemblance,both diseases may also share common genetic origins. Aber-rations in FAS have also been implicated in human ALPS (1–4, 8, 9). Moreover, the genetic interval on human chromosome1 that is syntenic to murine Sle1b has also been implicated inhuman lupus (43–45). Given that both the genetic compo-nents studied in this communication may be at play in humandisease as well, the lessons learned using this mouse modelare likely to be of relevance in understanding human lympho-proliferative disease as well. One may predict that this axismay be hyperactivated in human ALPS as well as in subsetsof lupus patients harboring lymphoid malignancies (46–48). Itremains to be determined if this signaling axis might also beup-regulated in lupus patients without any evidence of lym-phoproliferation. Clearly, a detailed workout of the signalingpathways in phenotypically well-defined subsets of lupus/ALPS patients is warranted before this axis can be therapeuti-cally targeted in patients.
Acknowledgements
This work is supported in part by the National Institutes of Healthgrants RO1 AR44894, the Alliance for Lupus Research, as well as theNational Arthritis Foundation.
Disclosures
The authors have no financial conflict of interest.
Abbreviations
ALPS autoimmune lymphoproliferative syndromeDN double negativeGN glomerulonephritisLN lymph node
References
1 Chun, H. J. and Lenardo, M. J. 2001. Autoimmune lymphoprolifer-ative syndrome: types I, II and beyond. Adv. Exp. Med. Biol.490:49.
2 Straus, S. E., Jaffe, E. S., Puck, J. M. et al. 2001. The developmentof lymphomas in families with autoimmune lymphoproliferative
syndrome with germline Fas mutations and defective lymphocyteapoptosis. Blood 98:194.
3 Rieux-Laucat, F., Le Deist, F., Hivroz, C. et al. 1995. Mutations inFas associated with human lymphoproliferative syndrome andautoimmunity. Science 268:1347.
4 Drappa, J., Vaishnaw, A. K., Sullivan, K. E., Chu, J. L. and Elkon,K. B. 1996. Fas gene mutations in the Canale-Smith syndrome, aninherited lymphoproliferative disorder associated with autoimmu-nity. N. Engl. J. Med. 335:1643.
5 Ohashi, P. S. 2002. T-cell signalling and autoimmunity: molecularmechanisms of disease. Nat. Rev. Immunol. 2:427.
6 Scaffidi, C., Kirchhoff, S., Krammer, P. H. and Peter, M. E. 1999.Apoptosis signaling in lymphocytes. Curr. Opin. Immunol.11:277.
7 Refaeli, Y., Van Parijs, L. and Abbas, A. K. 1999. Genetic modelsof abnormal apoptosis in lymphocytes. Immunol. Rev. 169:273.
8 Jackson, C. E., Fischer, R. E., Hsu, A. P. et al. 1999. Autoimmunelymphoproliferative syndrome with defective Fas: genotypeinfluences penetrance. Am. J. Hum. Genet. 64:1002.
9 Bleesing, J. J., Brown, M. R., Straus, S. E. et al. 2001.Immunophenotypic profiles in families with autoimmune lympho-proliferative syndrome. Blood 98:2466.
10 Shi, X., Xie, C., Kreska, D., Richardson, J. A. and Mohan, C. 2002.Genetic dissection of SLE: SLE1 and FAS impact alternatepathways leading to lymphoproliferative autoimmunity. J. Exp.Med. 196:281.
11 Di Cristofano, A., Kotsi, P., Peng, Y. F., Cordon-Cardo, C., Elkon, K.B. and Pandolfi, P. P. 1999. Impaired Fas response andautoimmunity in Pten+/- mice. Science 285:2122.
12 Borlado, L. R., Redondo, C., Alvarez, B. et al. 2000. Increasedphosphoinositide 3-kinase activity induces a lymphoproliferativedisorder and contributes to tumor generation in vivo. FASEB J.14:895.
13 Stambolic, V., Tsao, M. S., Macpherson, D., Suzuki, A., Chapman,W. B. and Mak, T. W. 2000. High incidence of breast andendometrial neoplasia resembling human Cowden syndrome inpten+/- mice. Cancer Res. 60:3605.
14 Cantley, L. C. and Neel, B. G. 1999. New insights into tumorsuppression: PTEN suppresses tumor formation by restraining thephosphoinositide 3-kinase/AKT pathway. Proc. Natl Acad. Sci.USA 96:4240.
15 Dahia, P. L., Aguiar, R. C., Alberta, J. et al. 1999. PTEN is inverselycorrelated with the cell survival factor Akt/PKB and is inactivatedvia multiple mechanisms in haematological malignancies. Hum.Mol. Genet. 8:185.
16 Li, J., Simpson, L., Takahashi, M. et al. 1998. The PTEN/MMAC1tumor suppressor induces cell death that is rescued by the AKT/protein kinase B oncogene. Cancer Res. 58:5667.
17 Parsons, M. J., Jones, R. G., Tsao, M. S., Odermatt, B., Ohashi, P.S. and Woodgett, J. R. 2001. Expression of active protein kinase Bin T cells perturbs both T and B cell homeostasis and promotesinflammation. J. Immunol. 167:42.
18 Suzuki, A., Yamaguchi, M. T., Ohteki, T. et al. 2001. T cell-specificloss of Pten leads to defects in central and peripheral tolerance.Immunity 14:523.
19 Anzelon, A. N., Wu, H. and Rickert, R. C. 2003. Pten inactivationalters peripheral B lymphocyte fate and reconstitutes CD19function. Nat. Immunol. 4:287.
20 Wendel, H. G., De Stanchina, E., Fridman, J. S. et al. 2004.Survival signalling by Akt and eIF4E in oncogenesis and cancertherapy. Nature 428:332.
21 Mills, G. B., Lu, Y. and Kohn, E. C. 2001. Linking moleculartherapeutics to molecular diagnostics: inhibition of the FRAP/RAFT/TOR component of the PI3K pathway preferentially blocksPTEN mutant cells in vitro and in vivo. Proc. Natl Acad. Sci. USA98:10031.
22 Morel, L., Mohan, C., Yu, Y. et al. 1997. Functional dissection ofsystemic lupus erythematosus using congenic mouse strains.J. Immunol. 158:6019.
23 Mohan, C., Alas, E., Morel, L., Yang, P. and Wakeland, E. K. 1998.Genetic dissection of SLE pathogenesis. Sle1 on murinechromosome 1 leads to a selective loss of tolerance to H2A/H2B/DNA subnucleosomes. J. Clin. Invest. 101:1362.
AKT/mTOR axis in lymphoproliferative lupus 521
by guest on March 4, 2014
http://intimm
.oxfordjournals.org/D
ownloaded from

24 Morel, L., Blenman, K. R., Croker, B. P. and Wakeland, E. K. 2001.The major murine systemic lupus erythematosus susceptibilitylocus, Sle1, is a cluster of functionally related genes. Proc. NatlAcad. Sci. USA 98:1787.
25 Wandstrat, A. E., Nguyen, C., Limaye, N. et al. 2004. Associationof extensive polymorphisms in the SLAM/CD2 gene cluster withmurine lupus. Immunity. 21:769.
26 Cohen, P. L. and Eisenberg, R. A. 1991. Lpr and gld: single genemodels of systemic autoimmunity and lymphoproliferative dis-ease. Annu. Rev. Immunol. 9:243.
27 Xie, C., Zhou, X. J., Liu, X. and Mohan, C. 2003. Enhancedsusceptibility to end-organ disease in the lupus-facilitating NZWmouse strain. Arthritis Rheum. 48:1080.
28 Gingras, A. C., Raught, B. and Sonenberg, N. 2001. Regulation oftranslation initiation by FRAP/mTOR. Genes Dev. 15:807.
29 Huang, S. and Houghton, P. J. 2003. Targeting mTOR signaling forcancer therapy. Curr. Opin. Pharmacol. 3:371.
30 Hosoi, H., Dilling, M. B., Shikata, T. et al. 1999. Rapamycin causespoorly reversible inhibition of mTOR and induces p53-indepen-dent apoptosis in human rhabdomyosarcoma cells. Cancer Res.59:886.
31 Panwalkar, A., Verstovsek, S. and Giles, F. J. 2004. Mammaliantarget of rapamycin inhibition as therapy for hematologicmalignancies. Cancer 100:657.
32 Majewski, M., Korecka, M., Kossev, P. et al. 2000. Theimmunosuppressive macrolide RAD inhibits growth of humanEpstein-Barr virus-transformed B lymphocytes in vitro and in vivo:a potential approach to prevention and treatment of posttrans-plant lymphoproliferative disorders. Proc. Natl Acad. Sci. USA97:4285.
33 Majewski, M., Korecka, M., Joergensen, J. et al. 2003. Immuno-suppressive TOR kinase inhibitor everolimus (RAD) suppressesgrowth of cells derived from posttransplant lymphoproliferativedisorder at allograft-protecting doses. Transplantation 75:1710.
34 Podsypanina, K., Lee, R. T., Politis, C. et al. 2001. An inhibitor ofmTOR reduces neoplasia and normalizes p70/S6 kinase activity inPten+/- mice. Proc. Natl Acad. Sci. USA 98:10320.
35 Boulay, A., Zumstein-Mecker, S., Stephan, C. et al. 2004.Antitumor efficacy of intermittent treatment schedules with therapamycin derivative RAD001 correlates with prolonged inactiva-tion of ribosomal protein S6 kinase 1 in peripheral bloodmononuclear cells. Cancer Res. 64:252.
36 Croker, B. P., Gilkeson, G. and Morel, L. 2003. Genetic interactionsbetween susceptibility loci reveal epistatic pathogenic networks inmurine lupus. Genes Immun. 4:575.
37 Kumar, K. R., Li, L., Yan, M. et al. 2006. Regulation of B celltolerance by the lupus susceptibility gene ly108. Science312:1665.
38 Mannella, P. and Brinton, R. D. 2006. Estrogen receptor proteininteraction with phosphatidylinositol 3-kinase leads to activation ofphosphorylated Akt and extracellular signal-regulated kinase 1/2in the same population of cortical neurons: a unified mechanism ofestrogen action. J Neurosci. 26:9439.
39 Guo, R. X., Wei, L. H., Tu, Z. et al. 2006. 17 beta-estradiol activatesPI3K/Akt signaling pathway by estrogen receptor (ER)-dependentand ER-independent mechanisms in endometrial cancer cells.J Steroid Biochem. Mol. Biol. 99:9.
40 Moe-Behrens, G. H., Klinger, F. G., Eskild, W., Grotmol, T.,Haugen, T. B. and De Felici, M. 2003. Akt/PTEN signalingmediates estrogen-dependent proliferation of primordial germcells in vitro. Mol. Endocrinol. 17:2630.
41 Kwon, C. H., Zhu, X., Zhang, J. and Baker, S. J. 2003. mTor isrequired for hypertrophy of Pten-deficient neuronal soma in vivo.Proc. Natl Acad. Sci. USA 100:12923.
42 Shi, Y., Gera, J., Hu, L. et al. 2002. Enhanced sensitivity of multiplemyeloma cells containing PTEN mutations to CCI-779. CancerRes. 62:5027.
43 Kotzin, B. L. 1997. Susceptibility loci for lupus: a guiding light frommurine models? J. Clin. Invest. 99:557.
44 Tsao, B. P., Cantor, R. M., Kalunian, K. C. et al. 1997. Evidence forlinkage of a candidate chromosome 1 region to human systemiclupus erythematosus. J. Clin. Invest. 99:725.
45 Wakeland, E. K., Liu, K., Graham, R. R. and Behrens, T. W. 2001.Delineating the genetic basis of systemic lupus erythematosus.Immunity 15:397.
46 Kinlen, L. J. 1992. Malignancy in autoimmune diseases.J. Autoimmun. 5 Suppl A:363.
47 Sweeney, D. M., Manzi, S., Janosky, J. et al. 1995. Risk ofmalignancy in women with systemic lupus erythematosus.J. Rheumatol. 22:1478.
48 Mellemkjaer, L., Andersen, V., Linet, M. S., Gridley, G., Hoover, R.and Olsen, J. H. 1997. Non-Hodgkin’s lymphoma and othercancers among a cohort of patients with systemic lupuserythematosus. Arthritis Rheum. 40:761.
522 AKT/mTOR axis in lymphoproliferative lupus
by guest on March 4, 2014
http://intimm
.oxfordjournals.org/D
ownloaded from
Copyright © 2022 FDOKUMEN