Shock-induced modulation of lymphocyte reactivity: Suppression, habituation, and recovery
Upload
independentCategory
view
3download
0
For Peer Review
Specific effects exerted by B-lymphoproliferative diseases
on peripheral T-lymphocytes protein expression
Journal: British Journal of Haematology
Manuscript ID: BJH-2010-00302.R1
Manuscript Type: Ordinary Papers
Date Submitted by the Author:
05-May-2010
Complete List of Authors: Borro, Marina; Sapienza University, 2nd Faculty of Medicine; Sant'Andrea Hospital, Unit of Advanced Molecular Diagnostics Gentile, Giovanna; Sapienza University, 2nd Faculty of Medicine; Sant'Andrea Hospital, Unit of Advanced Molecular Diagnostics De Luca, Ottavia; Sant'Andrea Hospital, Unit of Advanced Molecular
Diagnostics Aimati, Laura; Sant'Andrea Hospital, Unit of Advanced Molecular Diagnostics Torre, Maria; Sant'Andrea Hospital, Unit of Advanced Molecular Diagnostics Tatarelli, Caterina; Sant'Andrea Hospital, Haematology Aloe Spiriti, Maria; Sant'Andrea Hospital, Haematology Cox, Maria; Sant'Andrea Hospital, Haematology Simmaco, Maurizio; Sapienza University, 2nd Faculty of Medicine; Sant'Andrea Hospital, Unit of Advanced Molecular Diagnostics
Key Words: Proteomics, biosensor, T-cell, B-lymphoproliferative diseases
British Journal of Haematologype
er-0
0552
603,
ver
sion
1 -
6 Ja
n 20
11Author manuscript, published in "British Journal of Haematology (2010)"
DOI : 10.1111/j.1365-2141.2010.08285.x

For Peer Review
1
Specific effects exerted by B-lymphoproliferative diseases on peripheral T-
lymphocytes protein expression
Marina Borro1,2
, Giovanna Gentile1,2
, Ottavia De Luca2, Maria Simona Torre
2, Laura Aimati
2,
Caterina Tatarelli3, M. Antonietta Aloe Spiriti
3, M. Christina Cox
3, Maurizio Simmaco
1,2
12
nd Faculty of Medicine,
2Unit of Advanced Molecular Diagnostics,
3Department of Hematology, Sant'Andrea
Hospital, Sapienza University of Rome, Italy
Corresponding Author
Maurizio Simmaco
Ospedale Sant’Andrea - Sapienza Università di Roma
Via di Grottarossa, 1035 – 00189 Roma
Telephone +39 06 33775405
Fax +39 06 33776664
e-mail: [email protected]
Running title: Peripheral T-lymphocyte as biosensor
Page 1 of 29 British Journal of Haematology
123456789101112131415161718192021222324252627282930313233343536373839404142434445464748495051525354555657585960
peer
-005
5260
3, v
ersi
on 1
- 6
Jan
2011

For Peer Review
2
Summary
A proteomic approach was applied to study the protein expression profile of peripheral T-cells
derived from patients at the onset of different B-lymphoproliferative diseases, since a rising
interest in specific actions played by T-cells in such pathologies has emerged. Decreased
levels of profilin-1 and cofilin-1 and increased levels of coronin1A and prohibitin were found
in patients, compared with healthy controls. The protein-protein interaction network of these
proteins was studied using a web-based bioinformatics tool, highlighting the actin
cytoskeleton regulation as the main biological process involved in peripheral T-cells of such
patients. Unsupervised cluster analysis of protein expression data shows that the recorded
alteration of T-cell proteome was specifically induced by B-cells pathologies.
Key words: Proteomics, biosensor, T-cell, B-lymphoproliferative diseases
Page 2 of 29British Journal of Haematology
123456789101112131415161718192021222324252627282930313233343536373839404142434445464748495051525354555657585960
peer
-005
5260
3, v
ersi
on 1
- 6
Jan
2011

For Peer Review
3
Introduction
B-lymphoproliferative diseases represent a wide range of neoplastic syndromes:
Hodgkin's lymphoma, aggressive and indolent lymphoma, chronic lymphocytic leukaemia,
plasma cell dyscrasias. The need of stronger and reliable biomarkers for accurate diagnosis of
such diverse pathologies increases together with the need of new tools for therapeutic
monitoring and evaluation of residual disease. Transcriptomics and proteomics have arisen as
promising tools to discover potential biomarkers and can considerably contribute to molecular
characterization of different functional states of immune cells. Since various studies describe
alteration of T-cells in patients affected by B-cells malignancies, suggesting a prognostic
value of their counting and immunophenotyping (Heier et al, 2008; Hasselblom et al, 2007;
Nadal et al, 2007; Glas et al, 2007), we studied the proteome profile of peripheral T-cells in
patients affected by B-lymphoproliferative diseases at the onset. The ex vivo study of
circulating T cells presents the major advantage of analyzing a system with the minimal
modification compared to the living condition. Though, proteomic profiling of blood cells
trough two-dimensional electrophoresis (2DE) needs to match the requirement of a suitable
amount of protein with the ethical guidelines about blood draw for biomedical research.
Choosing to study the total T lymphocytes population allowed us to obtain enough cells with
a reasonable blood volume and to isolate untouched cell trough negative selection. In these
cells, statistical analysis revealed a set of proteins differentially expressed in diseased subjects
compared to healthy subjects. The interaction network among these proteins was analyzed to
detect molecular partners possibly involved in T cell functioning. Proteome profiles of T cells
in different physiological or pathological contexts was also evaluated by unsupervised
hierarchical clustering.
Page 3 of 29 British Journal of Haematology
123456789101112131415161718192021222324252627282930313233343536373839404142434445464748495051525354555657585960
peer
-005
5260
3, v
ersi
on 1
- 6
Jan
2011

For Peer Review
4
Materials and methods
Subjects
Twelve patients (4 females and 8 males, mean age 59±15) with various lymphoproliferative
malignancies were selected for this study by the Haematology division of the Azienda
Ospedaliera Sant’Andrea, Sapienza University of Rome, Italy. Among these, 4 were affected
by diffuse-large-B-cell-lymphoma (DLBCL); 3 by follicular lymphoma (FL); 3 by classical
Hodgkin’s lymphoma (CHL); 2 by chronic lymphocytic leukaemia (CLL). The study was
approved by the institutional Ethics Committee of the Hospital, and the procedures were in
accordance with the Helsinki Declaration of 1975, as revised in 2000. Blood harvest was
drawn at disease onset before starting chemotherapy and steroid administration and after
patients provided written informed consent. The control group was composed by 10 sex- and
age- matched healthy volunteers.
T cells isolation
About 25 ml of EDTA-anticoagulated peripheral blood were collected and immediately
processed for purification of peripheral blood mononuclear cells (PBMC) by density gradient
centrifugation over Ficoll-Hypaque (Nycomed Pharma, Oslo, Norway), according to the
manufacturer’s protocol. T cells were then isolated by negative selection (mean purity ≥95%)
using a magnetic beads system (Pan T Cell Isolation Kit II, human, Miltenyi Biotec, Auburn,
CA), according to manufacturer’s instructions. Briefly, non-T cells are indirectly labelled with
a cocktail of biotin-conjugated monoclonal antibodies against CD14, CD16, CD19, CD36,
CD56, CD123 and glycophorin A, as primary labelling reagent, and anti-biotin monoclonal
antibodies conjugated to magnetic microbeads, as secondary labelling reagent. The
magnetically labelled non-T cells are depleted by retaining them on a magnetisable separation
column which is placed in a strong permanent magnet, while the unlabeled T-cells pass
Page 4 of 29British Journal of Haematology
123456789101112131415161718192021222324252627282930313233343536373839404142434445464748495051525354555657585960
peer
-005
5260
3, v
ersi
on 1
- 6
Jan
2011

For Peer Review
5
through the column. The PBMC and the isolated T-cells samples were counted on an Advia
Haematology Analyzer (Bayer Diagnostics, Leverkusen, GE).
Protein separation
Purified T cells were lysed in 1 ml Trizol/1 x 106 cells (Invitrogen, Carlsbad, CA, USA).
Protein fraction was precipitated with 80% (v/v) cold acetone followed by centrifugation
(20,000 g for 10 min at 4°C). Pellets were dissolved in the rehydration solution (8 M urea/4%
CHAPS) and protein content was determined by the Bradford assay. Equal amounts of
proteins derived from the healthy subjects were mixed to make a reference control pool.
Two-dimensional (2D) gel electrophoresis
Isoelectric focusing (IEF) was performed on an Ettan IPG-Phor system (GE Healthcare,
Uppsala, Sweden), at 16 °C and under a current limit of 50 µA/strip. Sixty µg of proteins in a
final volume of 350 µL of lysis buffer, containing 65 mM dithioerythritol (DTE), 0.5% (v/v)
ampholine pH 3-10 NL and a trace of bromophenol blue, were loaded onto 18 cm pH 3-10
NL Immobiline DryStrip (IPG strip, GE Healthcare, Uppsala, Sweden). The strip re-hydration
step was carried out at 16 °C at a constant voltage of 30V for 4 h and additional 50V for 5 h.
Damp electrode pads were positioned under the re-hydrated strip over the electrodes. The IEF
step was performed using the following parameters: 400 V, 2h; 800 V, 1h; 1200 V, 2h; 3000
V, 3h; 8000 V, 6-8 h, until the total voltage reached 70 kVh. Immediately after the IEF run,
IPG strips were equilibrated for 12 min in 6 M urea, 30% (v/v) glycerol, 2% (w/v) SDS, 50
mM Tris-HCl, pH 6.8, 2% (w/v) DTE, and for 5 min in a similar solution, with a trace of
bromophenol blue, in which 2% DTE was replaced with 2.5% (w/v) iodoacetamide. The
second dimension electrophoresis was run on 9-16% linear gradient polyacrylamide gels (18
cm x 20 cm x 1.5 mm) at 40 mA/gel constant current at 10 °C for approximately 5 h until the
dye front reached the bottom of the gel. Gels were stained with colloidal Coomassie blue and
Page 5 of 29 British Journal of Haematology
123456789101112131415161718192021222324252627282930313233343536373839404142434445464748495051525354555657585960
peer
-005
5260
3, v
ersi
on 1
- 6
Jan
2011

For Peer Review
6
acquired on a BioRad GS-800 Calibrated Imaging Densitometer (Bio-Rad, Veenendaal, The
Netherlands).
Differential analysis of gel images and statistics
The sample from each patient was run in triplicate, while proteins from the 10 control
subjects were pooled and run in six technical replicates. Image analysis was performed using
the Bio-Rad PDQuest software, version 7.1.0. Spot quantity was normalized to the total
density in valid spots. Only valid spots, defined as spots with a CV ≤ 5% inside each technical
replicate group, were included in the analysis. For each spot, the mean quantity ± SD obtained
in the pool of healthy subjects was compared with the mean quantity ± SD obtained averaging
spot quantities in all patients. A 2-fold change and a t-test p-value < 0.05 were applied to
select protein spots differentially expressed among healthy subjects and patients.
Protein identification by MALDI-ToF mass spectrometry
Protein spots of interest were manually excised from the gel, washed with high-purity
water and 50% acetonitrile/water and dehydrated with 100% acetonitrile. The gel slices were
swollen at room temperature in 20 µl of 40 mM NH4HCO3/10% acetonitrile containing 25
ng/µl trypsin (Trypsin Gold, mass spectrometry grade, Promega). After 1 h, 50 µl of 40 mM
NH4HCO3/10% acetonitrile were added and digestion proceeded overnight at 37 °C. The
generated peptides were extracted with 50% acetonitrile/5% trifluoroacetic acid (TFA, 2
steps, 20 min at room temperature each), dried by vacuum centrifugation, suspended in 0.1%
TFA, passed through micro ZipTip C18 pipette tips (Milllipore, Bedford, MA, U.S.A.) and
directly eluted with the spectrometer matrix solution (10 mg/ml α−cyano-4-hydroxycinnamic
acid in 50% acetonitrile/1% TFA). Mass spectra of the tryptic peptides were obtained using a
Voyager-DE MALDI-ToF mass spectrometer (Applied Biosystems, Foster City, CA, USA).
Peptide mass fingerprinting database searching was performed using MASCOT searching
Page 6 of 29British Journal of Haematology
123456789101112131415161718192021222324252627282930313233343536373839404142434445464748495051525354555657585960
peer
-005
5260
3, v
ersi
on 1
- 6
Jan
2011

For Peer Review
7
engine (http://www.matrixscience.com) in the NCBInr/Swiss-Prot databases. Parameters were
set to allow one missed cleavage per peptide, a mass tolerance of 0.5 Da, and considering
carbamido-methylation of cysteines as a fixed modification and oxidation of methionines as a
variable modification. The criteria used to accept identifications included the extent of
sequence coverage, number of matched peptides and probabilistic score, as detailed in Table
1.
Interaction network analysis
Protein-protein interaction analysis was performed using STRING (Search Tool for the
Retrieval of Interacting Genes/Proteins) software version 8.1, which allows selection of
different prediction methods (Jensen et al, 2009). To get a more rigorous prediction, the
database was queried using only experimental data as prediction method and limiting the
search to no more than 100 molecular interactors, with a required minimum confidence score
of 0.4 (medium level).
Hierarchical clustering of proteomic data
Unsupervised analysis of proteomic data was performed by the GeneSpring GX 7.3
expression analysis software (Agilent Technologies, Santa Clara, CA, USA). For each
analyzed patient, the average quantization of spot values inside its replicate group, reported as
the ratio to the average of the control replicate group, was imported as expression data.
Analysis included T-cell proteome profiles of: 12 B-lymphoproliferative disorders, 10
polycystic ovary syndrome (PCO), 5 congenital adrenal hyperplasia (CAH), 2 monoclonal
gammopathy of undetermined significance (MGUS), healthy subjects (single sample
representative of ten pooled control subjects, as described above). Clustering was performed
according to an average linkage algorithm using the following parameters: similarity measure
Page 7 of 29 British Journal of Haematology
123456789101112131415161718192021222324252627282930313233343536373839404142434445464748495051525354555657585960
peer
-005
5260
3, v
ersi
on 1
- 6
Jan
2011

For Peer Review
8
by Pearson correlation, similar branches merged with a separation ratio of 1, minimum
distance 0,001.
Results
Differential analysis of protein expression
The experimental design is depicted in Fig. 1. T-cells were isolated from peripheral blood
of 10 healthy subjects (control) and 12 patients affected by B-cells lymphoproliferative
disorders (comprising Hodgkin’s lymphoma, diffuse large B-cell lymphoma, chronic
lymphocytic leukaemia and follicular lymphoma). Protein samples from control subjects were
pooled and analyzed by 2D-electrophoresis, which allows separation and semi-quantitative
detection of different protein species. Previous studies found no evidence of systematic bias
triggered by sample pooling for 2D-electrophoresis and showed that it is useful in reducing
the variance and increasing the number of technical replicates, which is often limited by the
low amount of available biological samples (Weinkauf et al, 2006; Karp et al, 2009). Also,
data acquired in our laboratory (data not shown) showed no significant sex- or age-related
differences among 2D maps of peripheral T-cells from healthy people. Thus, a “healthy” map
of peripheral T-lymphocytes was obtained (Fig. 2).
Comparison of this reference map with the maps obtained from protein samples of each
patient affected by B-lymphoproliferative disorders allowed to detect in all patients three
spots with decreased and two spots with increased expression levels. These spots were
identified by mass spectral analysis as: profilin-1 (two spots with different isoelectric point)
and cofilin-1, in the first case, and coronin1A and prohibitin, in the second (Table 1 and Fig.
2). Both profilin-1 and cofilin-1 appear in the 2DE maps of T-cells as two spots (Fig. 2),
where the more acidic ones can be attributed to protein phosphorylation (Navakauskiene et al,
2004; Lee et al, 2006). However, whereas both isoforms of profilin-1 display decreased levels
Page 8 of 29British Journal of Haematology
123456789101112131415161718192021222324252627282930313233343536373839404142434445464748495051525354555657585960
peer
-005
5260
3, v
ersi
on 1
- 6
Jan
2011

For Peer Review
9
in T-cells of the patients, only the phosphorylated form of cofilin-1 is decreased, while the
level of the unphosphorylated isoform is similar to the control.
Protein interaction network
To get insight into the biological significance of differential expression of the proteins
identified by proteomic analysis, we performed a search of their molecular partners using the
STRING 8.1 software (http://string-db.org/). STRING is a database which integrates protein-
protein interaction data from different sources and generates a list of known and/or predicted
partners (interaction network) of the input proteins, including both physical and functional
associations. Query of the database using only experimental data as prediction method
produced the interaction network shown in Fig 3. A list of the proteins involved in this
network is reported in the Supplementary Table 1.
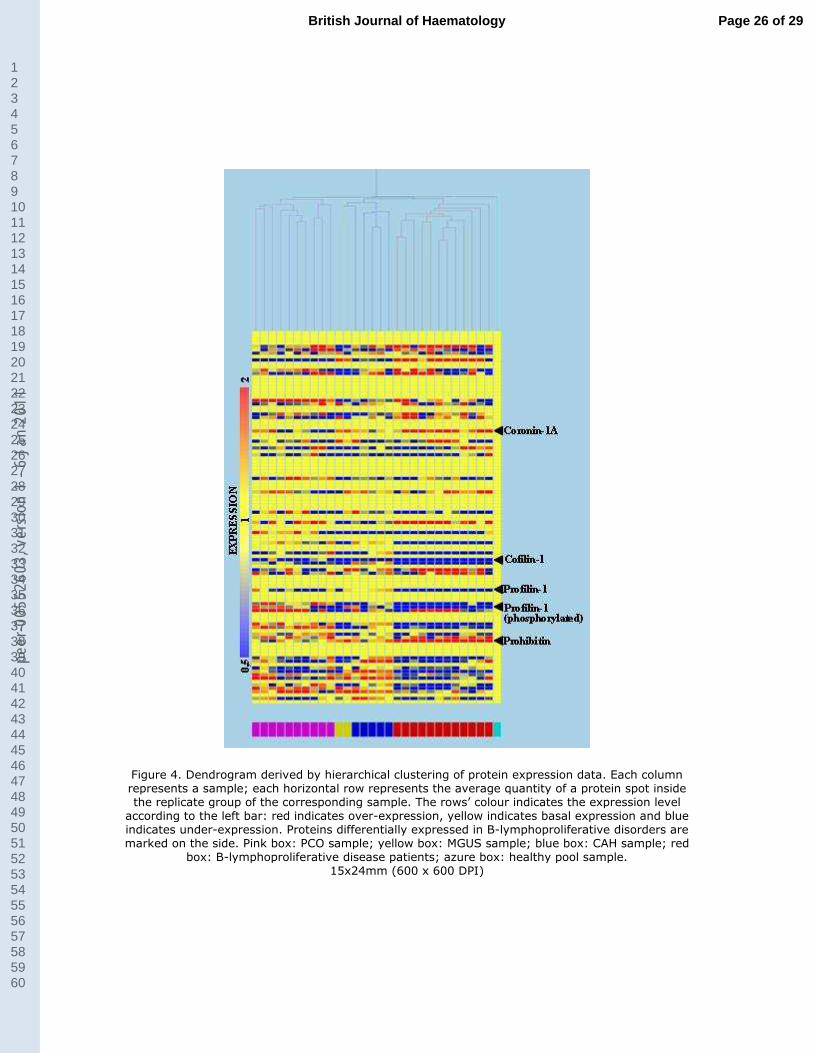
Hierarchical clustering
Qualitative assessment of the separation power of proteome profiling can be achieved by
unsupervised analysis to organize expression data into similar groups. Hierarchical clustering
was applied to compare the protein profiles of peripheral T-cells derived from patients
affected by B-lymphoproliferative diseases, healthy controls and subjects affected by non-
related pathologies: mainly polycystic ovary syndrome (PCO) and congenital adrenal
hyperplasia (CAH), the profiles of which were acquired in our proteomic database during a
previous study (Borro et al, 2007). Clustering of samples by similarity generates the
dendrogram shown in Fig. 4. The algorithm automatically created five principal branches,
each clusters composed by all samples associated with the same condition.
Page 9 of 29 British Journal of Haematology
123456789101112131415161718192021222324252627282930313233343536373839404142434445464748495051525354555657585960
peer
-005
5260
3, v
ersi
on 1
- 6
Jan
2011

For Peer Review
10
Discussion
Proteome analysis allows evaluation of the modifications of the protein expression profile
of a cell type that can be determined by peculiar conditions. The proteins identified as
differentially expressed in healthy or pathological states might represent the main players as
well as downstream and/or minor actors in the biological pathways involved in a given
condition: hence, the functional link between expression levels of a protein and the observed
biological effects often appears not immediately evident. Protein expression data need various
levels of interpretation to achieve a comprehensive explanation and to produce information
relevant to clinical research and practice.
Results of proteome profiling of circulating T-lymphocytes in patients affected by B-cells
lymphoproliferative disorders are discussed below according to different approaches to data
interpretation: i) review of known function of the differentially expressed proteins in relation
with T-cell functions; ii) analysis of protein interaction networks; iii) unsupervised
hierarchical clustering of expression data.
Differentially expressed proteins
Cofilin-1 belongs to a family of ubiquitous actin-binding proteins (Maciver et al, 2002)
which is negatively regulated by phosphorylation of a serine residue (Moriyama et al, 1996).
A decreased expression of the phosphorylated form of cofilin-1 was found, while the level of
the unphosphorylated form is similar in patients and controls. In resting human peripheral
blood T-lymphocytes, cofilin is mainly phosphorylated and thus inactive, while following co-
stimulation via accessory receptors (e.g., CD2 or CD28) undergoes activation through
dephosphorylation (Lee et al, 2000; Samstag et al, 1991).
Profilin-1 is an abundant protein that binds monomeric actin in a 1:1 complex and
catalyzes exchange of the actin-bound nucleotide (ATP/ADP). Formerly known as an
inhibitor of actin polymerization, profilin has been shown to also promote actin
Page 10 of 29British Journal of Haematology
123456789101112131415161718192021222324252627282930313233343536373839404142434445464748495051525354555657585960
peer
-005
5260
3, v
ersi
on 1
- 6
Jan
2011
For Peer Review
11
depolymerization and to bind many ligands other than actin, so playing an important role in
processes like cell motility, development, signalling and membrane trafficking (Yarmola et al,
2006). We detected decreased levels in both total and phosphorylated fractions of profilin-1.
Phosphorylation has been shown to promote actin binding activity of profilin (Sathish et al,
2004), but a detailed description of the influence of phosphorylation on binding to other
molecular partners of profilin is missing.
Coronin-1A, that showed increased expression in T lymphocytes from patients affected by
B-cells disorders, is also involved in cytoskeleton dynamics through its interaction with actin,
and is preferentially expressed in haematopoietic cells (Uetrecht et al, 2006). In mouse,
coronin-1 has been shown to be essential for T-cell survival and its absence resulted in a deep
defect in Ca2+
mobilization, interleukin-2 production, T-cell proliferation and survival
(Mueller et al, 2008). Recently, coronin-1A-deficient mice was found to have specific
alterations in terminal development and survival of αβT cells as well as defects in cell
activation and cytokine production following T-cell receptor (TCR) triggering (Mugnier et al,
2008).
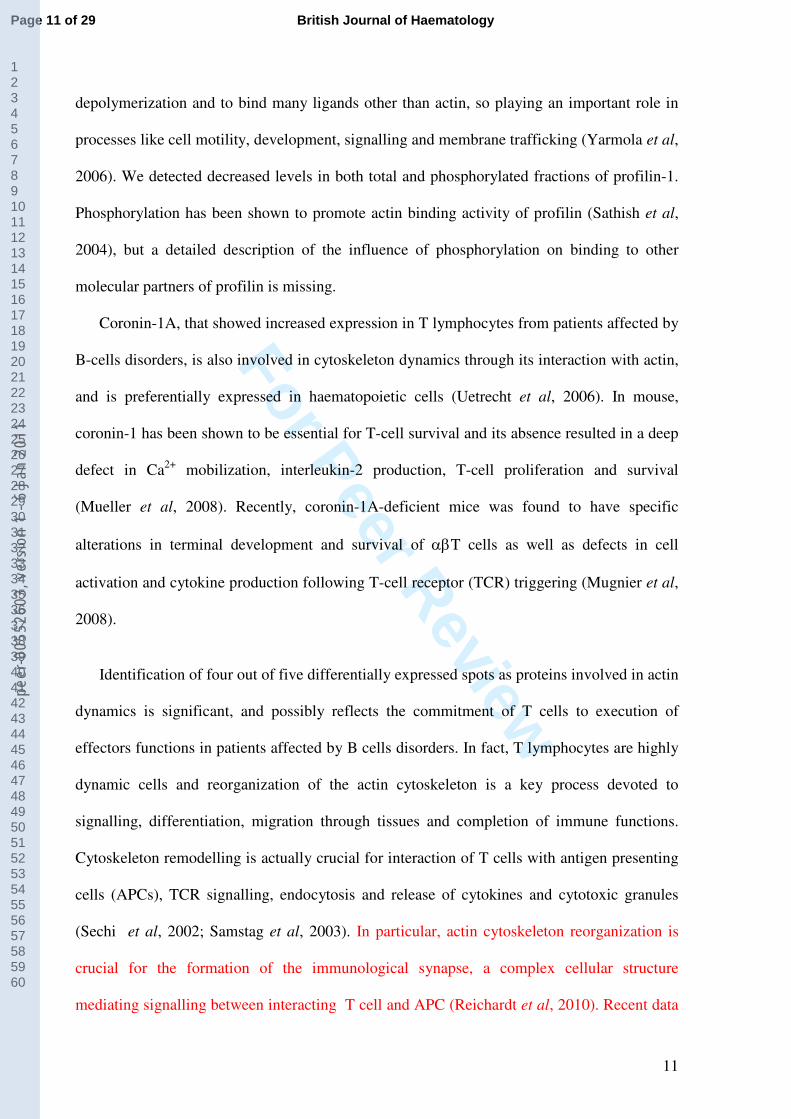
Identification of four out of five differentially expressed spots as proteins involved in actin
dynamics is significant, and possibly reflects the commitment of T cells to execution of
effectors functions in patients affected by B cells disorders. In fact, T lymphocytes are highly
dynamic cells and reorganization of the actin cytoskeleton is a key process devoted to
signalling, differentiation, migration through tissues and completion of immune functions.
Cytoskeleton remodelling is actually crucial for interaction of T cells with antigen presenting
cells (APCs), TCR signalling, endocytosis and release of cytokines and cytotoxic granules
(Sechi et al, 2002; Samstag et al, 2003). In particular, actin cytoskeleton reorganization is
crucial for the formation of the immunological synapse, a complex cellular structure
mediating signalling between interacting T cell and APC (Reichardt et al, 2010). Recent data
Page 11 of 29 British Journal of Haematology
123456789101112131415161718192021222324252627282930313233343536373839404142434445464748495051525354555657585960
peer
-005
5260
3, v
ersi
on 1
- 6
Jan
2011

For Peer Review
12
showed that interaction with the tumour microenvironment induces defective T cell
immunological synapse formation in different B cell malignancies (FL, DLBCL, CLL) and
that lenalidomide, a currently used immunomodulatory drug, can reverse this effect (Ramsay
et al, 2008, 2009). This finding hints molecular pathways involved in actin dynamics as
useful targets of immunotherapeutic strategies aimed to enhance T cell anti-tumour response.
To be noted that regulators of cytoskeleton functions represent key determinants of disease
progression in the lymphoma B cell itself, as recently demonstrated in a mouse model using
RNA interference (Meacham et al. 2009).
The differential expression of prohibitin (up-regulated in T cells of patients affected by B-
cells disorders) can not be simply explained by a single biological process (as cytoskeleton
regulation), since prohibitin (PHB) localizes in multiple cellular compartments and takes part
in many molecular functions: from acting as scaffolding protein at the plasma membrane level
to its role as chaperone protein in mitochondria, to modulation of transcriptional activity by
interacting, directly or indirectly, with various transcription factors (p53, Rb, E2F) (Mishra et
al, 2006). However, PHB was found to be preferentially expressed in non-proliferating
thymocytes and mature splenic T cells, suggesting a possible role in the maturation of T-
lymphocytes (Dixit et al, 2003); it was also detected as an up-regulated factor upon activation
of primary human T-cells (Ross et al, 2008). Thus, up-regulation of prohibitin might be
regarded as a further marker of T-cells commitment in presence of B-lymphoproliferative
diseases.
Protein interaction network
Functional links among the four differentially expressed proteins are evidenced by
analysis of their interaction network. Looking at Fig. 3, actin clearly emerges as the central
node of the protein-protein interaction network, and member of the RhoA/ROCK/LIM-kinase
pathway (as ROCK1, LIMK1, LIMK2, VASP, PIK3R1), implicated in cytotoxic lymphocyte
Page 12 of 29British Journal of Haematology
123456789101112131415161718192021222324252627282930313233343536373839404142434445464748495051525354555657585960
peer
-005
5260
3, v
ersi
on 1
- 6
Jan
2011

For Peer Review
13
activation through cytoskeletal reorganization (Lou et al, 2001; Khurana, et al, 2003) are
highly represented. Furthermore, the interrelations among prohibitin and the other network
nodes are highlighted. A link between prohibitin and T-cell activation through actin
reorganization is given by Raf-1, a MAP3K which functions downstream of the Ras family of
membrane-associated GTPases. Activation of the Ras/Raf/MEK/ERK signalling pathway
follows the activation of the tyrosine kinase Lck during the engagement of the T-cell antigen
receptor (TCR).
A further link between prohibitin and actin dynamics is constituted by factors as
SMARCA4, HDAC1, SIN3A, involved in gene regulation through chromatin remodelling.
SMARCA4 codes for Brg (Brahama related gene), a subunit of the SWI/SNF chromatin
remodelling complex. It is one of the mammalian multi-protein machines, able to modify
chromatin structure with an ATP-driven process, and known to act as a regulator of the
immune system, from lymphocyte development to immune responses (Chi, 2004). The
relation between actin organization and the SWI/SNF complex is well described in the review
of Farrants (2008).
Chromatin structure is also affected by histone acetylation, a reversible post-translational
modification acting as an epigenetic factor for gene regulation in mammalian cells (Haberland
et al, 2009). The level of acetylation is determined by the balance between the opposing
activities of histone acetyltransefases (HAT) and histone deacetylases (HDAC). Histone
deacetylation in the promoters of growth regulatory genes was shown to be implicated in
cancer pathogenesis (Toyota et al, 2005) and inhibitors of deacetylating activity are emerging
as a new class of drugs for treatment of cancer, including haematological malignancies
(Stimson et al, 2009). HDAC1, one of the prohibitin proximal interactors, is a histone
deacetylase whose recruitment to chromatin is mediated by SIN3, a factor that in mouse
appears to be essential for T cell development (Cowley et al, 2005). Besides regulation of
gene expression by modification of histones, acetylation can directly affect protein activity.
Page 13 of 29 British Journal of Haematology
123456789101112131415161718192021222324252627282930313233343536373839404142434445464748495051525354555657585960
peer
-005
5260
3, v
ersi
on 1
- 6
Jan
2011

For Peer Review
14
Interestingly, the fork-head transcription factor Foxp3+, the most specific marker of Treg
cells, is a protein regulated by acetylation, and recent data (Yang et al, 2008; Wang et al,
2009) have shown that HDAC inhibitors enhance the numbers and suppressive functions of
Foxp3+ regulatory T-cells.
T-cell as a biosensor of specific conditions
Aim of this study was the evaluation of the influence played by the onset of a B-cell
lymphoproliferative disease on peripheral T-cell homeostasis. We detected an alteration in the
level of protein factors which can be directly linked to regulation of different effectors
functions of T-cells through cytoskeleton reorganization. Furthermore, protein-protein
interaction network analysis suggests that modified expression of these factors could affect
(or could be an effect of) other processes, such as regulation of gene and protein activity by
acetylation, of proved importance in immune response. Still, our findings need to be assessed
for specificity to get some value as candidate markers for evaluation of disease state.
Coupling conventional proteome analysis to unsupervised clustering techniques represents
a good platform to investigate specificity of T-cells protein profile for a defined condition.
Unsupervised clustering analysis allows classification of a huge bulk of raw data in groups
organized by similarity. This approach takes advantage from the intrinsic function of the
method that includes all the data in the analysis, whereas in a classic proteome analysis only
data above stringent parameters are selected: this can lead to loss of some information.
The protein expression data obtained by the 2DE maps of T-cells derived from patients
affected by B-cell diseases were matched to those obtained from patients affected by non-
related pathologies and to the reference data from healthy subjects. Hierarchical clustering of
our sample cohort showed that all samples sharing the same physio-pathological condition
(i.e., healthy controls, B-lymphoproliferative disorder patients, MGUS, PCO, or CAH
patients) are clustered in a separate branch of the dendrogram, meaning that T-cells can record
Page 14 of 29British Journal of Haematology
123456789101112131415161718192021222324252627282930313233343536373839404142434445464748495051525354555657585960
peer
-005
5260
3, v
ersi
on 1
- 6
Jan
2011

For Peer Review
15
different environmental conditions and that the overall protein profile contains the
information able to distinguish among them.
To be noted that in peripheral T-cells, cofilin-1 has been shown to be differentially
expressed also in PCO and CAH syndromes (Borro et al, 2007) and that the specificity of T-
cell proteome variation is given by the combination of factors which modify their expression
concomitantly. The clinical impact of proteomics relies on its power to indicate many
candidate factors for prognostic and/or diagnostic purposes, but it is crucial to evaluate their
potential predictive strength jointly, not separately. We suggest analysis of protein-protein
interaction network as a powerful tool to extract information underlying the results of
classical differential proteomics, thus overcoming the detection limits of the 2DE technology.
Furthermore, it provides a functional interpretation of the data based on the overall of the
actual knowledge which may guide the selection of the more promising markers for further
evaluation.
Peripheral T-lymphocytes represent easily available living biosensors, and proteins whose
expression level changes significantly in specific pathological states, and their proximal
interactors, might represent new molecular markers for follow-up testing of the disease state.
All patients enrolled in this study were at the on-set of the disease, and the identified proteins
differentially expressed can be regarded as markers of T-cell activation, according to many
recent works reporting alterations of T-cells functionality, number and functional class
balance in B-lymphoproliferative disorders (Mittal et al, 2008; Ramsay et al, 2008, 2009; Cox
et al, 2008; Bari et al, 2009). Besides, interaction network analysis suggests candidate
biomarkers which escaped direct characterization by proteomics techniques.
The identified protein signatures may surely derive from unbalance of the normal
(healthy) repertoire of specific T cell subsets in patients affected by B cell malignancies, but
the possibility to detect and quantify them also in the total T cell population is an appealing
suggestion for biomarkers research.
Page 15 of 29 British Journal of Haematology
123456789101112131415161718192021222324252627282930313233343536373839404142434445464748495051525354555657585960
peer
-005
5260
3, v
ersi
on 1
- 6
Jan
2011

For Peer Review
16
In conclusion, we believe it interesting to evaluate the potential prognostic and/or
diagnostic value of monitoring the expression level of some of the described factors during
the therapy.
Acknowledgements
This work was supported in part by grants from ‘Ministero dell’Università e della Ricerca’
and the Sapienza University of Rome.
References
Bari, A., Marcheselli, L., Sacchi, S., Marcheselli, R., Pozzi, S., Ferri, P., Balleari, E., Musto,
P., Neri, S., Aloe Spiriti, M.A. & Cox, M.C. (2009) Prognostic models for diffuse large B-
cell lymphoma in the rituximab era: a never-ending story. Annals of Oncology, 2009; e-pub
ahead of print 17Nov.
Borro, M., Gentile, G., Stigliano, A., Misiti, S., Toscano, V. & Simmaco, M. (2007)
Proteomic analysis of peripheral T lymphocytes, suitable circulating biosensors of strictly
related diseases. Clinical and Experimental Immunology, 150, 494-501.
Chi, T. (2004) A BAF-centred view of the immune system. Nature Reviews Immunology, 4,
965-977.
Cowley, S.M., Iritani, B.M., Mendrysa, S.M., Xu, T., Cheng, P.F., Yada, J., Liggitt, H.D. &
Eisenman, R.N. (2005) The mSin3A chromatin-modifying complex is essential for
embryogenesis and T-cell development. Molecular and Cellular Biology, 25, 6990-7004.
Cox, M.C., Nofroni, I., Ruco, L., Amodeo, R., Ferrari, A., La Verde, G., Cardelli, P.,
Montefusco, E., Conte, E., Monarca, B. & Aloe-Spiriti, M.A. (2008) Low absolute
Page 16 of 29British Journal of Haematology
123456789101112131415161718192021222324252627282930313233343536373839404142434445464748495051525354555657585960
peer
-005
5260
3, v
ersi
on 1
- 6
Jan
2011

For Peer Review
17
lymphocyte count is a poor prognostic factor in diffuse-large-B-cell-lymphoma. Leukemia
& Lymphoma, 49, 1745-1751.
Dixit, V.D., Sridaran, R., Edmonsond, M.A., Taub, D. & Thompson, W.E. (2003)
Gonadotropin-releasing hormone attenuates pregnancy-associated thymic involution and
modulates the expression of antiproliferative gene product prohibitin. Endocrinology,144,
1496-1505.
Farrants, A.K. (2008) Chromatin remodelling and actin organisation. FEBS Letters, 582,
2041-2050.
Glas, A.M., Knoops, L., Delahaye, L., Kersten, M.J, Kibbelaar, R.E., Wessels, L.A., van
Laar, R., van Krieken, J.H., Baars, J.W., Raemaekers, J., Kluin, P.M., van't Veer, L.J. & de
Jong, D. (2007) Gene-expression and immunohistochemical study of specific T-cell subsets
and accessory cell types in the transformation and prognosis of follicular lymphoma.
Journal of Clinical Oncology, 25, 390-398.
Haberland, M., Montgomery, R.L. & Olson, E.N. (2009) The many roles of histone
deacetylases in development and physiology: implications for disease and therapy. Nature
Reviews Genetics, 10, 32–42.
Hasselblom, S., Sigurdadottir, M., Hansson, U., Nilsson-Ehle, H., Ridell, B. & Andersson, P.
(2007) The number of tumour-infiltrating TIA-1+ cytotoxic T cells but not FOXP3+
regulatory T cells predicts outcome in diffuse large B-cell lymphoma. British Journal of
Haematology, 137, 364–373.
Heier, I., Hofgaard, P.O., Brandtzaeg, P., Jahnsen, F.L. & Karlsson, M. (2008) Depletion of
CD4+ CD25+ regulatory T cells inhibits local tumour growth in a mouse model of B cell
lymphoma. Clinical and Experimental Immunology, 152, 381-387.
Jensen, L.J., Kuhn, M., Stark, M., Chaffron, S., Creevey, C., Muller, J., Doerks, T., Julien, P.,
Roth, A., Simonovic, M., Bork, P. & von Mering, C. (2009) STRING 8--a global view on
Page 17 of 29 British Journal of Haematology
123456789101112131415161718192021222324252627282930313233343536373839404142434445464748495051525354555657585960
peer
-005
5260
3, v
ersi
on 1
- 6
Jan
2011

For Peer Review
18
proteins and their functional interactions in 630 organisms. Nucleic Acids Research, 37,
D412-416.
Karp, N.A. & Lilley, K.S. (2009) Investigating sample pooling strategies for DIGE
experiments to address biological variability. Proteomics, 9, 388–397.
Khurana, D. & Leibson, P.J. (2003) Regulation of lymphocyte-mediated killing by GTP-
binding proteins. Journal of Leukocyte Biology, 73, 333-338.
Lee, C.K., Park, H.J., So, H.H., Kim, H.J., Lee, K.S., Choi, W.S., Lee, H.M., Won, K.J.,
Yoon, T.J., Park, T.K. & Kim, B. (2006) Proteomic profiling and identification of cofilin
responding to oxidative stress in vascular smooth muscle Proteomics, 6, 6455–6475.
Lee, K.H., Meuer, S.C. & Samstag, Y. (2000) Cofilin: a missing link between T cell
costimulation and rearrangement of the actin cytoskeleton. European Journal of
Immunology, 30, 892–899.
Lou, Z., Billadeau, D.D., Savoy, D.N., Schoon, R.A. & Leibson, P.J. (2001) A role for a
RhoA/ROCK/LIM-kinase pathway in the regulation of cytotoxic lymphocytes. The Journal
of Immunology, 167, 5749-5757.
Maciver, S.K. & Hussey, P.J. (2002) The ADF/cofilin family: actin-remodeling proteins.
Genome Biology, 3, reviews3007.
Meacham, C.E., Ho, E.E., Dubrovsky, E., Gertler, F.B. & Hemann, M.T. (2009) In vivo
RNAi screening identifies regulators of actin dynamics as key determinants of lymphoma
progression. Nature Genetics 41, 1133-1137.
Mishra, S., Murphy, L.C. & Murphy, L.J. (2006) The Prohibitins: emerging roles in diverse
functions. Journal of Cellular and Molecular Medicine, 10, 353-363.
Mittal, S., Marshall, N.A., Duncan, L., Culligan, D.J., Barker, R.N. & Vickers, M.A. (2008)
Local and systemic induction of CD4+CD25+ regulatory T-cell population by non-
Hodgkin lymphoma. Blood, 111, 5359-5370.
Page 18 of 29British Journal of Haematology
123456789101112131415161718192021222324252627282930313233343536373839404142434445464748495051525354555657585960
peer
-005
5260
3, v
ersi
on 1
- 6
Jan
2011

For Peer Review
19
Moriyama, K., Iida, K. & Yahara, I. (1996) Phosphorylation of Ser-3 of cofilin regulates its
essential function on actin. Genes to Cells, 1, 73–86.
Mueller, P., Massner, J., Jayachandran, R., Combaluzier, B., Albrecht, I., Gatfield, J., Blum,
C., Ceredig, R., Rodewald, H.R., Rolink, A.G. & Pieters, J. (2008) Regulation of T cell
survival through coronin-1-mediated generation of inositol-1,4,5-trisphosphate and calcium
mobilization after T cell receptor triggering. Nature Immunology, 9, 424-431.
Mugnier, B., Nal, B., Verthuy, C., Boyer, C., Lam, D., Chasson, L., Nieoullon, V., Chazal,
G., Guo, X.J., He, H.T., Rueff-Juy, D., Alcover, A. & Ferrier, P. (2008) Coronin-1A links
cytoskeleton dynamics to TCRαβ-induced cell signaling. PLoS One, 3, e3467.
Nadal, E., Garin, M., Kaeda, J., Apperley, J., Lechler, R. & Dazzi, F. (2007) Increased
frequencies of CD4(+)CD25(high) T(regs) correlate with disease relapse after allogeneic
stem cell transplantation for chronic myeloid leukemia. Leukemia, 21, 472–479.
Navakauskiene, R., Treigyte, G., Gineitis, A. & Magnusson, K.E. (2004) Identification of
apoptotic tyrosine-phosphorylated proteins after etoposide or retinoic acid treatment.
Proteomics, 4, 1029-1041.
Ramsay, A.G., Clear, A.J., Kelly, G., Fatah, R., Matthews, J., Macdougall, F., Lister, T.A.,
Lee, A.M., Calaminici, M. & Gribben, J.G. (2009) Follicular lymphoma cells induce T-cell
immunologic synapse dysfunction that can be repaired with lenalidomide: implications for
the tumor microenvironment and immunotherapy. Blood, 114, 4713-4720.
Ramsay, A.G., Johnson, A.J., Lee, A.M., Gorgün, G., Le Dieu, R., Blum, W., Byrd, J.C. &
Gribben, J.G. (2008) Chronic lymphocytic leukemia T cells show impaired immunological
synapse formation that can be reversed with an immunomodulating drug. The Journal of
Clinical Investigation, 118, 2427-2437.
Reichardt, P., Dornbach, B. & Gunzer, M. (2010) APC, T cells, and the immune synapse.
Current Topics in Microbiology and Immunology, 340, 229-249.
Page 19 of 29 British Journal of Haematology
123456789101112131415161718192021222324252627282930313233343536373839404142434445464748495051525354555657585960
peer
-005
5260
3, v
ersi
on 1
- 6
Jan
2011

For Peer Review
20
Ross, J.A., Nagy, Z.S. & Kirken, R.A. (2008) The PHB1/2 phosphocomplex is required for
mitochondrial homeostasis and survival of human T cells. Journal of Biological Chemistry,
283, 4699-4713.
Samstag, Y., Bader, A. & Meuer, S.C. (1991) A serine phosphatase involved in CD2-
mediated activation of human T lymphocytes and natural killer cells. The Journal of
Immunology, 147, 788–794.
Samstag, Y., Eibert, S.M., Klemke, M. & Wabnitz, G.H. (2003) Actin cytoskeletal dynamics
in T lymphocyte activation and migration. Journal of Leukocyte Biology, 73, 30-48.
Sathish, K., Padma, B., Munugalavadla, V., Bhargavi, V., Radhika, K.V., Wasia, R., Sairam,
M. & Singh, S.S. (2004) Phosphorylation of profilin regulates its interaction with actin and
poly (L-proline). Cellular Signalling, 16, 589-596.
Sechi, A.S., Buer, J., Wehland, J. & Probst-Kepper, M. (2002) Changes in actin dynamics at
the T-cell/APC interface: implications for T-cell anergy? Immunological Reviews, 189, 98–
110.
Stimson, L., Wood, V., Khan, O., Fotheringham, S. & La Thangue, N.B. (2009) HDAC
inhibitor-based therapies and haematological malignancy Annals of Oncology, 20, 1293-
1302.
Toyota, M. & Issa, J.P. (2005) Epigenetic changes in solid and hematopoietic tumors.
Seminars in Oncology, 32, 521–530.
Uetrecht, A.C. & Bear, J.E. (2006) Coronins: the return of the crown. Trends in Cell Biology,
16, 421-426.
Wang, L., Tao, R. & Hancock, W.W. (2009) Using histone deacetylase inhibitors to enhance
Foxp3+ regulatory T-cell function and induce allograft tolerance. Immunology and Cell
Biology, 87, 195-202.
Page 20 of 29British Journal of Haematology
123456789101112131415161718192021222324252627282930313233343536373839404142434445464748495051525354555657585960
peer
-005
5260
3, v
ersi
on 1
- 6
Jan
2011

For Peer Review
21
Weinkauf, M., Hiddemann, W. & Dreyling, M. (2006) Sample pooling in 2-D gel
electrophoresis: a new approach to reduce nonspecific expression background.
Electrophoresis, 27, 4555–4558.
Yang, X.J. & Seto, E. (2008) Lysine acetylation: codified crosstalk with other
posttranslational modifications. Molecular Cell, 31, 31449–31461.
Yarmola, E.G. & Bub, M.R. (2006) Profilin: emerging concepts and lingering
misconceptions. Trends in Biochemical Sciences, 31, 197-205.
Page 21 of 29 British Journal of Haematology
123456789101112131415161718192021222324252627282930313233343536373839404142434445464748495051525354555657585960
peer
-005
5260
3, v
ersi
on 1
- 6
Jan
2011

For Peer Review
22
Legends to the figures
Figure 1. Experimental work-flow.
Figure 2. Representative 2DE map of a protein sample from peripheral T-lymphocytes
(pooled healthy subjects). Proteins are separated according to their isoelectric point (pH range
3-10) and molecular mass (Mw, range 10-200 kDa). Proteins of interest are circled.
Figure 3. Protein-protein interaction network view. Stronger associations are represented by
thick lines. Each protein is labelled with the gene name, as reported in Supplementary Table
1.
Figure 4. Dendrogram derived by hierarchical clustering of protein expression data. Each
column represents a sample; each horizontal row represents the average quantity of a protein
spot inside the replicate group of the corresponding sample. The rows’ colour indicates the
expression level according to the left bar: red indicates over-expression, yellow indicates
basal expression and blue indicates under-expression. Proteins differentially expressed in B-
lymphoproliferative disorders are marked on the side. Pink box: PCO sample; yellow box:
MGUS sample; blue box: CAH sample; red box: B-lymphoproliferative disease patients;
azure box: healthy pool sample.
Page 22 of 29British Journal of Haematology
123456789101112131415161718192021222324252627282930313233343536373839404142434445464748495051525354555657585960
peer
-005
5260
3, v
ersi
on 1
- 6
Jan
2011

For Peer Review
Figure 1. Experimental work-flow. 24x23mm (600 x 600 DPI)
Page 23 of 29 British Journal of Haematology
123456789101112131415161718192021222324252627282930313233343536373839404142434445464748495051525354555657585960
peer
-005
5260
3, v
ersi
on 1
- 6
Jan
2011

For Peer Review
Figure 2. Representative 2DE map of a protein sample from peripheral T-lymphocytes (pooled healthy subjects). Proteins are separated according to their isoelectric point (pH range 3-10) and
molecular mass (Mw, range 10-200 kDa). Proteins of interest are circled. 21x21mm (600 x 600 DPI)
Page 24 of 29British Journal of Haematology
123456789101112131415161718192021222324252627282930313233343536373839404142434445464748495051525354555657585960
peer
-005
5260
3, v
ersi
on 1
- 6
Jan
2011

For Peer Review
Figure 3. Protein-protein interaction network view. Stronger associations are represented by thick lines. Each protein is labelled with the gene name, as reported in Supplementary Table 1.
51x50mm (600 x 600 DPI)
Page 25 of 29 British Journal of Haematology
123456789101112131415161718192021222324252627282930313233343536373839404142434445464748495051525354555657585960
peer
-005
5260
3, v
ersi
on 1
- 6
Jan
2011
For Peer Review
Figure 4. Dendrogram derived by hierarchical clustering of protein expression data. Each column represents a sample; each horizontal row represents the average quantity of a protein spot inside the replicate group of the corresponding sample. The rows’ colour indicates the expression level
according to the left bar: red indicates over-expression, yellow indicates basal expression and blue indicates under-expression. Proteins differentially expressed in B-lymphoproliferative disorders are marked on the side. Pink box: PCO sample; yellow box: MGUS sample; blue box: CAH sample; red
box: B-lymphoproliferative disease patients; azure box: healthy pool sample. 15x24mm (600 x 600 DPI)
Page 26 of 29British Journal of Haematology
123456789101112131415161718192021222324252627282930313233343536373839404142434445464748495051525354555657585960
peer
-005
5260
3, v
ersi
on 1
- 6
Jan
2011

For Peer Review
Table 1. Proteins identified as differentially expressed. Experimental parameters allowing
unambiguous identification by mass spectrometry are reported.
Mean spot quantity
± SDc (x10
-3)
Protein name UniProtKB
a
(Accession no)
Theoretical
pI/Mw Score
b
No. of
matching
peptides
Sequence
coverage
(%)
Healthy
subjects
(n=10,
pooled)
Patients
(n=12)
FCd p
e
Profilin-1 P07737 8.5/14.9 90 8 62 13.09±0.61 5.82±2.28 -2.2 4.7 x10⁻⁵
Profilin-1
(phosphorylated) P07737 8.5/14.9 90 8 62 3.11±0.13 0.41±0.24 -7.6 1.67x10
-7
Cofilin-1
(phosphorylated) P23528 8.2/18.7 69 7 30 5.33±0.25 0.91±0.45 -5.8 6.5 x10
-6
Coronin-1A P31146 6.2/50.9 97 10 26 17.13±0.84 120.38±76.85 +7.0 4.5 x10⁻³
Prohibitin P35232 5.6/29.8 87 7 37 3.27±0.15 36.97±30.30 +11.3 1.9 x10⁻³
aProtein Knowledgebase (UniprotKB) is a main protein database freely available at
http://au.expasy.org
bMascot score represents the probability that the observed match is a random event. Protein scores greater
than 61 are significant (p < 0.05).
cSpot quantity is the total density of a defined spots in a gel image. Since the mean spot quantity for healthy
subjects derives from technical replicates of a pooled sample, the associated SD is smaller compared to the
SD computed for the patients’ group (see Materials and methods).
dFC: Fold-change variation of protein expression level, calculated dividing the average spot quantity in all
patients by the average spot quantity in the healthy subjects pool.
ep <0,05 represents a statistically significant change in protein expression level, according to the Student's t-
test.
Page 27 of 29 British Journal of Haematology
123456789101112131415161718192021222324252627282930313233343536373839404142434445464748495051525354555657585960
peer
-005
5260
3, v
ersi
on 1
- 6
Jan
2011

For Peer Review
Supplementary Table 1. List of the proteins interacting with profilin-1, cofilin-1,
coronin-1A and prohibitin, as generated by the STRING software version 8.1 (http://string-
db.org/).
Gene
Symbol Protein name
Interaction
Scorea
CORO1A Coronin-1A -
PFN1 Profilin-1 -
CFL1 Cofilin-1 -
PHB Prohibitin -
E2F1 Transcription factor E2F1 0.976
LIMK1 LIM domain kinase 1 0.976
YWHAZ 14-3-3 protein zeta/delta (Protein kinase C inhibitor protein 1) 0.867
ACTB Actin, cytoplasmic 1 0.855
TP53 Cellular tumor antigen p53 0.855
HDAC1 Histone deacetylase 1 0.853
ACTA1 Actin, alpha skeletal muscle (Alpha-actin-1) 0.851
WASL Neural Wiskott-Aldrich syndrome protein (N-WASP) 0.851
LIMK2 LIM domain kinase 2 0.851
RB1 Retinoblastoma-associated protein (PP110) 0.849
WDR1 WD repeat protein 1 0.656
XPO1 Exportin-1 0.633
TPI1 Triosephosphate isomerase 0.633
CLCN5 Chloride channel protein 5 0.633
ANXA2 Annexin A2 0.633
NCF4 Neutrophil cytosol factor 4 0.633
P42POP Myb protein P42POP 0.633
YWHAG 14-3-3 protein gamma (Protein kinase C inhibitor protein 1) 0.633
ATP1A1 Sodium/potassium-transporting ATPase alpha-1 chain 0.633
ACTC1 Actin, alpha cardiac muscle 1 0.633
PIK3R1 Phosphatidylinositol 3-kinase regulatory subunit alpha 0.633
THBS1 Thrombospondin-1 0.633
MAP3K10 Mitogen-activated protein kinase kinase kinase 10 0.633
CMA1 Chymase precursor 0.633
NRK Nik-related protein kinase 0.633
RHOQ Rho-related GTP-binding protein RhoQ precursor 0.633
ACTN1 Alpha-actinin-1 0.633
XPO6 Exportin-6 0.631
NDUFS2 NADH dehydrogenase [ubiquinone] iron-sulfur protein 2 0.631
HSPH1 Heat-shock protein 105 kDa 0.631
SSH1 Protein phosphatase Slingshot homolog 1 0.631
SSH3 Protein phosphatase Slingshot homolog 3 0.631
SSH2 Protein phosphatase Slingshot homolog 2 0.631
NDUFS3 Protein-tyrosine phosphatase mitochondrial 1 0.631
MLLT4 Afadin (Protein AF-6) 0.631
GPHN Gephyrin 0.63
ROCK1 Rho-associated protein kinase 1 0.627
APBB1IP Amyloid β A4 precursor protein-binding family B member 1- interacting protein 0.625
TESK2 Dual specificity testis-specific protein kinase 2 0.625
ACTA2 Actin, aortic smooth muscle 0.625
Page 28 of 29British Journal of Haematology
123456789101112131415161718192021222324252627282930313233343536373839404142434445464748495051525354555657585960
peer
-005
5260
3, v
ersi
on 1
- 6
Jan
2011

For Peer Review
SIN3A Paired amphipathic helix protein Sin3a 0.625
BRMS1 Breast cancer metastasis-suppressor 1 0.625
SMARCA
4
Probable global transcription activator SNF2L4 0.625
TESK1 Dual specificity testis-specific protein kinase 1 0.625
DNM2 Dynamin-2 0.625
NCOR1 Nuclear receptor corepressor 1 0.625
SMARCA
2
Probable global transcription activator SNF2L2 0.625
RAF1 RAF proto-oncogene serine/threonine-protein kinase 0.625
VASP Vasodilator-stimulated phosphoprotein 0.625
TXNL5 Thioredoxin-like protein 5 0.623
RBL1 Retinoblastoma-like protein 1 0.623
CAP1 Adenylyl cyclase-associated protein 1 0.623
WASF1 Wiskott-Aldrich syndrome protein family member 1 0.623
PLD1 Phospholipase D1 0.623
FMNL1 Formin-like protein 1 (Leukocyte formin) 0.623
VIPR1 Vasoactive intestinal polypeptide receptor 1 0.623
WIPF2 WAS/WASL interacting protein family member 2 0.623
DBN1 Drebrin 0.623
NCK1 Cytoplasmic protein NCK1 (NCK adaptor protein 1) 0.623
ENAH Protein enabled homolog 0.623
PLD2 Phospholipase D2 0.623
RBL2 Retinoblastoma-like protein 2 0.623
DKK1 Dickkopf-related protein 1 precursor (Dkk-1) 0.571
UBE2G2 Ubiquitin-conjugating enzyme E2 G2 0.561
SLC2A4 Solute carrier family 2, facilitated glucose transporter member 4 0.54
SUMO4 Small ubiquitin-related modifier 4 (SUMO-4) 0.492
ACTG1 Actin, cytoplasmic 2 0.447 aInteraction score is automatically generated by the software. For details about the applied prediction
algorithms see: Jensen, L.J., Kuhn, M., Stark, M., Chaffron, S., Creevey, C., Muller, J., Doerks, T.,
Julien, P., Roth, A., Simonovic, M., Bork, P. & von Mering, C. (2009) STRING 8--a global view on
proteins and their functional interactions in 630 organisms. Nucleic Acids Research, 37, D412-416.
Page 29 of 29 British Journal of Haematology
123456789101112131415161718192021222324252627282930313233343536373839404142434445464748495051525354555657585960
peer
-005
5260
3, v
ersi
on 1
- 6
Jan
2011
Copyright © 2022 FDOKUMEN