Phytoalexins from crucifers: synthesis, biosynthesis, and biotransformation
146
Phytoalexins from crucifers: synthesis, biosynthesis, and biotransformation M. Soledade C. Pedras*, Francis I. Okanga, Irina L. Zaharia, Abdul Q. Khan Department of Chemistry, University of Saskatchewan, 110 Science Place, Saskatoon SK, Canada, S7N 5C9 Received 8 July 1999; received in revised form 2 September 1999 Abstract Phytoalexins play a significant role in the defense response of plants. These secondary metabolites, which are synthesized de novo in response to diverse forms of stress, including fungal infection, are part of the plants’ chemical and biochemical defense mechanisms. Phytoalexins from crucifers are structurally and biogenetically related, but display significantly dierent biological activities. Here, we review work reporting the chemical structures, synthesis, biosynthesis and metabolism of cruciferous phytoalexins, as well as their biological activity towards dierent microorganisms. # 2000 Elsevier Science Ltd. All rights reserved. Keywords: Biosynthesis; Brassica; Crucifer; Cruciferae; Metabolism; Phytoalexin; Synthesis Contents 1. Introduction .......................................................... 161 2. Chemical structures, elicitation, and biological activity ............................ 162 3. Detection, isolation, and HPLC analysis ...................................... 165 4. Synthesis ............................................................ 166 5. Biosynthesis .......................................................... 169 6. Microbial biotransformations .............................................. 172 7. Applications .......................................................... 175 References ................................................................ 175 1. Introduction Similar to other plants (Keen, 1993; Staskawicz, Ausubel, Baker, Ellis & Jones, 1995; Hammond-Kosac & Jones, 1996; Osbourn, 1996), the disease resistance of crucifers is related with both constitutive and induced defenses. Phytoalexins are part of the induced chemical defenses produced by plants in response to several forms of stress, including microbial attack (Bailey & Mansfield, 1982; Brooks & Watson, 1985). In general, the timing, rate of accumulation, and rela- Phytochemistry 53 (2000) 161–176 0031-9422/00/$ - see front matter # 2000 Elsevier Science Ltd. All rights reserved. PII: S0031-9422(99)00494-X www.elsevier.com/locate/phytochem * Corresponding author. Tel.: +1-306-966-4772; fax: +1-306-966- 4730. E-mail address: [email protected] (M.S.C. Pedras).
-
Upload
independent -
Category
Documents
-
view
0 -
download
0
Transcript of Phytoalexins from crucifers: synthesis, biosynthesis, and biotransformation
Phytoalexins from crucifers: synthesis, biosynthesis, andbiotransformation
M. Soledade C. Pedras*, Francis I. Okanga, Irina L. Zaharia, Abdul Q. Khan
Department of Chemistry, University of Saskatchewan, 110 Science Place, Saskatoon SK, Canada, S7N 5C9
Received 8 July 1999; received in revised form 2 September 1999
Abstract
Phytoalexins play a signi®cant role in the defense response of plants. These secondary metabolites, which are synthesized denovo in response to diverse forms of stress, including fungal infection, are part of the plants' chemical and biochemical defensemechanisms. Phytoalexins from crucifers are structurally and biogenetically related, but display signi®cantly di�erent biological
activities. Here, we review work reporting the chemical structures, synthesis, biosynthesis and metabolism of cruciferousphytoalexins, as well as their biological activity towards di�erent microorganisms. # 2000 Elsevier Science Ltd. All rightsreserved.
Keywords: Biosynthesis; Brassica; Crucifer; Cruciferae; Metabolism; Phytoalexin; Synthesis
Contents
1. Introduction . . . . . . . . . . . . . . . . . . . . . . . . . . . . . . . . . . . . . . . . . . . . . . . . . . . . . . . . . . 161
2. Chemical structures, elicitation, and biological activity . . . . . . . . . . . . . . . . . . . . . . . . . . . . 162
3. Detection, isolation, and HPLC analysis . . . . . . . . . . . . . . . . . . . . . . . . . . . . . . . . . . . . . . 165
4. Synthesis . . . . . . . . . . . . . . . . . . . . . . . . . . . . . . . . . . . . . . . . . . . . . . . . . . . . . . . . . . . . 166
5. Biosynthesis . . . . . . . . . . . . . . . . . . . . . . . . . . . . . . . . . . . . . . . . . . . . . . . . . . . . . . . . . . 169
6. Microbial biotransformations . . . . . . . . . . . . . . . . . . . . . . . . . . . . . . . . . . . . . . . . . . . . . . 172
7. Applications . . . . . . . . . . . . . . . . . . . . . . . . . . . . . . . . . . . . . . . . . . . . . . . . . . . . . . . . . . 175
References . . . . . . . . . . . . . . . . . . . . . . . . . . . . . . . . . . . . . . . . . . . . . . . . . . . . . . . . . . . . . . . . 175
1. Introduction
Similar to other plants (Keen, 1993; Staskawicz,
Ausubel, Baker, Ellis & Jones, 1995; Hammond-Kosac
& Jones, 1996; Osbourn, 1996), the disease resistance
of crucifers is related with both constitutive and
induced defenses. Phytoalexins are part of the induced
chemical defenses produced by plants in response to
several forms of stress, including microbial attack
(Bailey & Mans®eld, 1982; Brooks & Watson, 1985).
In general, the timing, rate of accumulation, and rela-
Phytochemistry 53 (2000) 161±176
0031-9422/00/$ - see front matter # 2000 Elsevier Science Ltd. All rights reserved.
PII: S0031-9422(99 )00494 -X
www.elsevier.com/locate/phytochem
* Corresponding author. Tel.: +1-306-966-4772; fax: +1-306-966-
4730.
E-mail address: [email protected] (M.S.C. Pedras).

tive amounts of phytoalexins play signi®cant roles inplant resistance to pathogen invasion (Dixon, 1986;Dixon, Harrison & Lamb, 1994; Ku c, 1995; Smith,1996). Although phytoalexins from over 30 di�erentplant families have been isolated since Muller(Deverall, 1982; MuÈ ller, 1958) ®rst proposed this termin 1940, cruciferous phytoalexins were the ®rstreported sulfur-containing phytoalexins.Glucosinolates are also sulfur- containing metabolitesproduced by crucifers and thought to be part of thecrucifer constitutive defenses (Fenwick, Heaney &Mawson, 1989; Giamoustaris & Mithen, 1997).Interestingly, and perhaps justi®ably, the cruciferousfamily (Cruciferae syn. Brassicaceae ) has high sulfurrequirements (Marquard & Walker, 1995).
Cruciferous crops are cultivated worldwide and con-stitute an extremely valuable group of plants.Enormous quantities of vegetable crucifers, such asbroccoli (Brassica oleracea var. botrytis ), cauli¯ower(B. oleracea var. italica ), kale (B. oleracea var. ace-phala ), radish (Raphanus sativus ), and a variety ofcabbages (B. oleracea ) are consumed annually(Kimber & McGregor, 1995). Oilseed crucifers(Brassica spp.) constitute the third largest source of ed-ible vegetable oils annually (Kimber & McGregor,1995) and brown (B. juncea ) and white (Sinapis alba )mustard seeds (Hemingway, 1995), as well as wasabi(Wasabiae japonica ) (Chadwick, Lumpkin & Elberson,1993) are well-known condiments. In fact, the world-wide impact of cruciferous crops is best assessed by
the tremendous number and variety of scienti®carticles published annually.
2. Chemical structures, elicitation, and biologicalactivity
Phytoalexins from crucifers were ®rst reported in1986 by Takasugi and co-workers (Takasugi, Katsui,& Shirata, 1986). Since then, although a relatively lar-ger number of cruciferous species remain to be investi-gated, close to thirty cruciferous phytoalexins havebeen isolated and their structures elucidated (Fig. 1,compounds 1±25). Most interestingly, crucifers appearto be the only plant family producing sulfur-containingphytoalexins. Several of these phytoalexins are pro-duced by more than one species and can be elicited bydiverse pathogens and/or abiotic factors, as shown inTable 1. Brassinin (1) and 1-methoxybrassinin (3),which contain a dithiocarbamate group attached to a3-methylindolyl moiety, and cyclobrassinin (8) werethe ®rst brassica phytoalexins to be reported (Fig. 1)(Takasugi et al., 1986). It is worthy to note that,although dithiocarbamates have long been known asimportant pesticides and herbicides (Thorn & Ludwig,1962), so far crucifers appear to be the only plantsproducing these compounds. Methyl 1-methoxyindole-3-carboxylate (17) appears to be the ®rst non-sulfur-containing phytoalexin isolated from a crucifer (Pedras& Sorensen, 1998). A compound similar to 17, methyl
Fig. 1. Structures of cruciferous phytoalexins: 1 brassinin, 2 brassitin, 3 1-methoxybrassinin, 4 4-methoxybrassinin, 5 1-methoxybrassitin, 6 1-
methoxybrassenin A, 7 1-methoxybrassenin B, 8 cyclobrassinin, 9 cyclobrassinin sulfoxide, 10 cyclobrassinone, 11 dehydro-4-methoxycyclobrassi-
nin, 12 spirobrassinin, 13 1-methoxyspirobrassinin, 14 1-methoxyspirobrassinol, 15 1-methoxyspirobrassinol methyl ether, 16 dioxibrassinin, 17
methyl 1-methoxyinodole-3-carboxylate, 18 brassilexin, 19 sinalexin, 20 brassicanal A, 21 brassicanal B, 22 brassicanal C, 23 camalexin, 24 6-
methoxycamalexin, 25 1-methylcamalexin.
M.S.C. Pedras et al. / Phytochemistry 53 (2000) 161±176162

Table 1
Phytoalexins from crucifers, inducing agent, and biological activity
Phytoalexin (#) (reference
for ®rst isolation)
Plant species (inducing agent, reference) Antimicrobial activity (reference)
Brassicanal A (20)
(Monde et al., 1990a).
Brassica oleracea (Pseudomonas cichorii, Monde et al., 1991a). Bipolaris leersiae
(Monde et al., 1990a, 1990b).
B. rapa syn. B. campestris (P. cichorii, Monde et al., 1990a) Phoma lingam (Pedras & Khan, 1996;
Pedras et al., 1997b)
Raphanus sativus (P. cichorii, Monde et al., 1995).
Brassicanal B (21)
(Monde et al., 1990a,
1990b).
B. rapa (P. cichorii, Monde et al., 1990a, 1990b). B. leersiae (Monde et al., 1990a, 1990b).
Brassicanal C (22)
(Monde, Sasaki, Shirata
& Takasugi, 1991b).
B. oleracea (P. cichorii, Monde et al., 1991a, 1991b). B. leersiae (Monde et al., 1991b).
Brassilexin (18)
(Devys et al., 1988)
B. carinata (abiotic Ð CuCl2, P. lingam, Rouxel, Kollman,
Boulidard & Mithen, 1991; Storck & Sacristan, 1995).
P. lingam
(Pedras & Okanga, 1999;
Pedras et al., 1997b).
B. juncea (abiotic Ð CuCl2, Alternaria brassicae, P. lingam,
(Devys et al., 1988; Rouxel et al., 1991; Storck & Sacristan, 1995).
B. napus (abiotic Ð CuCl2, P. lingam, Rouxel et al., 1991;
Storck & Sacristan, 1995).
B. nigra (abiotic Ð CuCl2, Rouxel et al., 1991)
B. oleracea (abiotic Ð CuCl2, Rouxel et al., 1991).
B. rapa (abiotic Ð CuCl2, Rouxel et al., 1991)
Sinapis arvensis (P. lingam, Storck & Sacristan, 1995).
Brassinin (1)
(Takasugi et al., 1986).
B. napus (abiotic Ð CuCl2, Rouxel et al., 1991). B. leersiae, Pyricularia orizae
(Takasugi et al., 1986, 1988).
B. oleracea (P. cichorii, Monde et al., 1991a). P. lingam (Pedras et al., 1992).
B. rapa (abiotic Ð UV light, Erwinia carotovora, P. cichorii,
Takasugi et al., 1986, Takasugi et al., 1988; Monde et al., 1994b).
R. sativus (P. cichorii, Monde et al., 1995).
Brassitin (2)
(Monde et al., 1995).
R. sativus (P. cichorii, Monde et al., 1995). B. leersiae (Monde et al., 1995).
Camalexin (23)
(Browne et al., 1991).
A. thaliana (P. syringae, Tsuji, Zook, Jackson, Cage,
Hammerschmidt & Somerville, 1992).
A. brassicae, Cladosporium sp.
(Jimenez et al., 1997;
Browne et al., 1991)
Arabis lyrate (Cochliobolus carhonum, P. syringae, Zook, Leege,
Jackson & Hammerschmidt, 1998).
Bacillus subtilis, Escherichia coli,
Fusarium oxysporum,
Listeria monocytogenes,
P. syringae, Saccharomyces cerevisiae,
Xanthomonas campestris
(Rogers, Glazebrook & Ausubel, 1996).
Capsella bursa-pastoris (A. brassicae, Jimenez et al., 1997). C. cucumerinum, P. syringae
(Tsuji et al., 1992).
E. carotovora, P. cichorii,
P. lingam, P.syringae,
R. solani, X. campestris
(Pedras et al., 1998a).
Rhizoctonia solani
(Conn, Browne, Tewari & Ayer, 1994).
Cyclobrassinin (8),
(Takasugi et al., 1986).
B. carinata (abiotic Ð CuCl2, Rouxel et al., 1991). B. leersiae, P. orizae
(Takasugi et al., 1986, 1988)
B. juncea (abiotic Ð CuCl2, Rouxel et al., 1991).
B. napus (P. lingam, Dahyia & Rimmer, 1988). A. brassicae, Botrytis cinerea,
C. cucumerinum, F. nivale,
P. lingam, Pythium ultimum,
R. solani, Sclerotinia sclerotiorum
(Conn et al., 1994).
B. nigra (abiotic Ð CuCl2, Rouxel et al., 1991).
(continued on next page)
M.S.C. Pedras et al. / Phytochemistry 53 (2000) 161±176 163

Table 1 (continued )
Phytoalexin (#) (reference
for ®rst isolation)
Plant species (inducing agent, reference) Antimicrobial activity (reference)
B. oleracea (P. cichorii, Monde et al., 1990a).
B. rapa (abiotic Ð UV light, E. carotovora, P. cichorii,
Takasugi et al., 1986, 1988; Monde et al., 1994b).
R. solani, P. lingam
(Pedras & Okanga, 1999).
Cyclobrassininsulfoxide (9)
(Devys, Barbier, Kollmann,
Rouxel & Bousquet, 1990).
B. carinata (P. lingam, Storck & Sacristan, 1995). Cladosporium sp.
(Devys et al., 1990)
B. juncea (P. lingam, Storck & Sacristan, 1995; Devys et al., 1990).
B. napus (P. lingam, Storck & Sacristan, 1995).
B. nigra (abiotic Ð CuCl2, Rouxel et al., 1991).
B. oleracea (abiotic Ð CuCl2, Rouxel et al., 1991).
B. rapa (abiotic Ð CuCl2, Rouxel et al., 1991).
S. arvensis (P. lingam, Storck & Sacristan, 1995).
Cyclobrassinone (10)
(Gross et al., 1994).
B. oleracea (abiotic Ð UV light, Gross et al., 1994). C. cucumerinum (Gross et al., 1994).
Dehydro-4-methoxy
cyclobrassinin (11)
(Monde et al., 1994b).
B. rapa (P. cichorii, Monde et al., 1994b). B. leersiae (Monde et al., 1994b).
Dioxibrassinin (16)
(Monde et al., 1991a).
B. oleracea (P. cichorii, Monde et al., 1991a). B. leersiae (Monde et al., 1991a).
P. lingam (Pedras & Okanga, 1999).
1-Methoxybrassenin A (6)
(Monde et al., 1991b).
B. oleracea (P. cichorii, Monde et al., 1991b). B. leersiae (Monde et al., 1991b).
1-Methoxybrassenin B (7)
(Monde et al., 1991b).
B. oleracea (P. cichorii, Monde et al., 1991b). B. leersiae (Monde et al., 1991b).
1-Methoxybrassinin (3)
(Takasugi et al., 1986).
B. carinata (abiotic Ð CuCl2, Rouxel et al., 1991). B. leersiae, P. orizae
(Takasugi et al., 1986, 1988).
B. napus (P. lingam, Storck & Sacristan, 1995; Dahyia & Rimmer,
1988)
B. oleracea (abiotic Ð UV light, P. cichorii, Gross et al., 1994;
Monde et al., 1990b).
A. brassicae, Botrytis cinerea,
C. cucumerinum, F. nivale, P. lingam,
Pythium ultimum, R. solani,
S. sclerotiorum,
(Dahyia & Rimmer, 1988)
B. rapa (abiotic Ð UV light, E. carotovora, P. cichorii,
Takasugi et al., 1986, 1988; Monde et al., 1994b).
C. cucumerinum (Gross et al., 1994)
R. sativus (P. cichorii, Monde et al., 1995).
4-Methoxybrassinin (4)
(Monde et al., 1990b).
B. oleracea (P. cichorii, Monde et al., 1990b). B. leersiae (Monde et al., 1990b, 1994b).
B. rapa (P. cichorii, Monde et al., 1994b).
1-Methoxybrassitin (5)
(Takasugi et al., 1988).
B. oleracea (abiotic Ð UV light, P. cichorii, Gross et al., 1994;
Monde et al., 1990b).
C. cucumerinum (Gross et al., 1994).
B. rapa (P. cichorii, Takasugi et al., 1988). B. leersiae, P. orizae
(Takasugi et al., 1988;
Monde et al., 1990b,
Monde et al., 1995).
R. sativus (P. cichorii, Monde et al., 1990b, 1995).
6-Methoxycamalexin (24)
(Browne et al., 1991).
C. bursa-pastoris (A. brassicae, Jimenez et al., 1997). A. brassicae, Cladosporium sp.
(Browne et al., 1991;
Jimenez et al., 1997).
C. sativa (A. brassicae, Browne et al., 1991).
1-Mehoxyspirobrassinin
(13) (Gross et al., 1994)
B. oleracea (abiotic - UV light, Gross et al., 1994). C. cucumerinum (Gross et al., 1994).
1-Methoxyspirobrassinol
(14) (Monde et al., 1995).
R. sativus (P. cichorii, Monde et al., 1995). B. leersiae (Monde et al., 1995).
1-Methoxyspirobrassinol
methylether (15)
(Monde et al., 1995).
R. sativus (P. cichorii, Monde et al., 1995). B. leersiae (Monde et al., 1995).
1-Methylcamalexin (25)
(Jimenez et al., 1997).
C. bursa-pastoris (A. brassicae, Jimenez et al., 1997). Cladosporium sp. (Jimenez et al., 1997)
M.S.C. Pedras et al. / Phytochemistry 53 (2000) 161±176164

1-methylindole-3-carboxylate is a constitutive antifun-gal metabolite isolated from the crucifer Camelinasativa (Jimenez, Ayer & Tewari, 1997). Despite theirrelated biogenetic origin, the cruciferous phytoalexinshave rather di�erent structures, which would suggestsubstantially di�erent biological activities; however,few correlations have been established among thedi�erent structural types and corresponding activities.In most of the cases shown in Table 1, the antimicro-bial activity of phytoalexins 1±25 was established atthe time of isolation and no further biological evalu-ations were made.
The antifungal activity of the phytoalexins brassinin(1), cyclobrassinin (8), spirobrassinin (12), brassilexin(18), camalexin (23), and dioxibrassinin (16) to isolatesof the virulent and avirulent groups of Phoma lingam(Tode ex Fr.) Desm. [asexual stage of Leptosphaeriamaculans (Desm.) Ces. et de Not.] employing a fungalradial growth assay was compared (Pedras, 1998).Brassinin and cyclobrassinin at 5 � 10ÿ4 M completelyinhibited the spore germination of both avirulent andvirulent type isolates of P. lingam up to four days (ger-mination of controls in 30±36 h), while brassilexin atsimilar concentration caused complete germination in-hibition for at least two weeks. In addition, cyclobras-sinin (8), dioxibrassinin (16), spirobrassinin (12),brassicanal A (20), and camalexin (23) did not signi®-cantly a�ect the mycelial growth of both avirulent andvirulent type isolates of P. lingam, while brassinin (1)and brassilexin (18) signi®cantly decreased the mycelialgrowth rate relative to control cultures. These resultsindicated that brassilexin (18) and brassinin (1) dis-played the strongest antifungal activity against P. lin-gam. Interestingly, methoxyindole 17 was as inhibitoryto virulent P. lingam as to P. wasabiae at 5 � 10ÿ4 M,
but signi®cantly less inhibitory to avirulent P. lingam(Pedras & Sorensen, 1998). The fungus Bipolaris leer-siae appeared more sensitive to brassinin (1) thanPhoma species, as its growth was completely inhibitedat a concentration ®ve times lower (Kutschy et al.,1998). Camalexin (23), however, inhibited strongly themycelial growth of the fungal pathogen Rhizoctoniasolani (Pedras, 1998).
Not surprisingly, brassinin (1) and cyclobrassinin (8)showed also phytotoxic activity; leaf uptake exper-iments indicated that both brassinin and cyclobrassininat 4 � 10ÿ4 M caused substantial wilting and yellowingof petiole and foliar tissue in B. carinata (Pedras,Loukaci & Okanga, 1998b). A few of the phytoalexinsfrom crucifers have been shown to inhibit the growthof cultures of human cancer cells and thus may havepotential use as chemopreventive agents (Mehta et al.,1995).
3. Detection, isolation, and HPLC analysis
The detection of phytoalexins in extracts of elicitedtissues of crucifers has been carried out by TLC withbiodetection utilizing spores of Cladosporium orBipolaris species, and HPLC with UV or photodiodearray detection (Pedras & Sorensen, 1998). In general,following phytoalexin extraction with polar solventslike methanol, ethanol, or acetone, the detection ofcruciferous phytoalexins utilizing HPLC requires a pre-liminary extract clean up utilizing RP-18 cartridges.Due to their polarity range, HPLC analysis of crucifer-ous phytoalexins has been carried out utilizing reversedphase silica gel and gradient elutions (Pedras, 1998). Agood HPLC separation of thirteen phytoalexins was
Table 1 (continued )
Phytoalexin (#) (reference
for ®rst isolation)
Plant species (inducing agent, reference) Antimicrobial activity (reference)
Methyl 1-methoxyindole-3-
carboxylate (17)
(Pedras & Sorensen, 1998)
Eutrewma wasabiae, Pedras & Sorensen, 1998). P. lingam, P. wasabiae (Pedras & Sorensen,
1998).
Sinalexin (19)
(Pedras & Smith, 1998).
Sinapis alba (abiotic Ð CuCl2, A. brassica, Pedras & Smith, 1998). C. cucumericum (Pedras & Smith, 1998).
Spirobrassinin (12)
(Takasugi, Monde, Katsui
& Shirata, 1987).
B. carinata (P. lingam, Storck & Sacristan, 1995). C. cucumerinum (Storck & Sacristan, 1995).
B. juncea (P. lingam, Storck & Sacristan, 1995). C. cucumerinum (Storck & Sacristan, 1995).
B. napus (P. lingam, Storck & Sacristan, 1995; Pedras & Se guin-
Swartz, 1992).
P. oryzae (Takasugi et al., 1987).
B. oleracea (abiotic Ð UV light, P. cichorii, Monde et al., 1990a;
Gross et al., 1994).
P. lingam (Pedras et al., 1997b).
B. rapa (abiotic Ð UV light, P. cichorii, Monde et al., 1990a;
Monde et al., 1994b).
R. sativus (P. cichorii, Takasugi et al., 1987; Monde et al., 1995).
M.S.C. Pedras et al. / Phytochemistry 53 (2000) 161±176 165
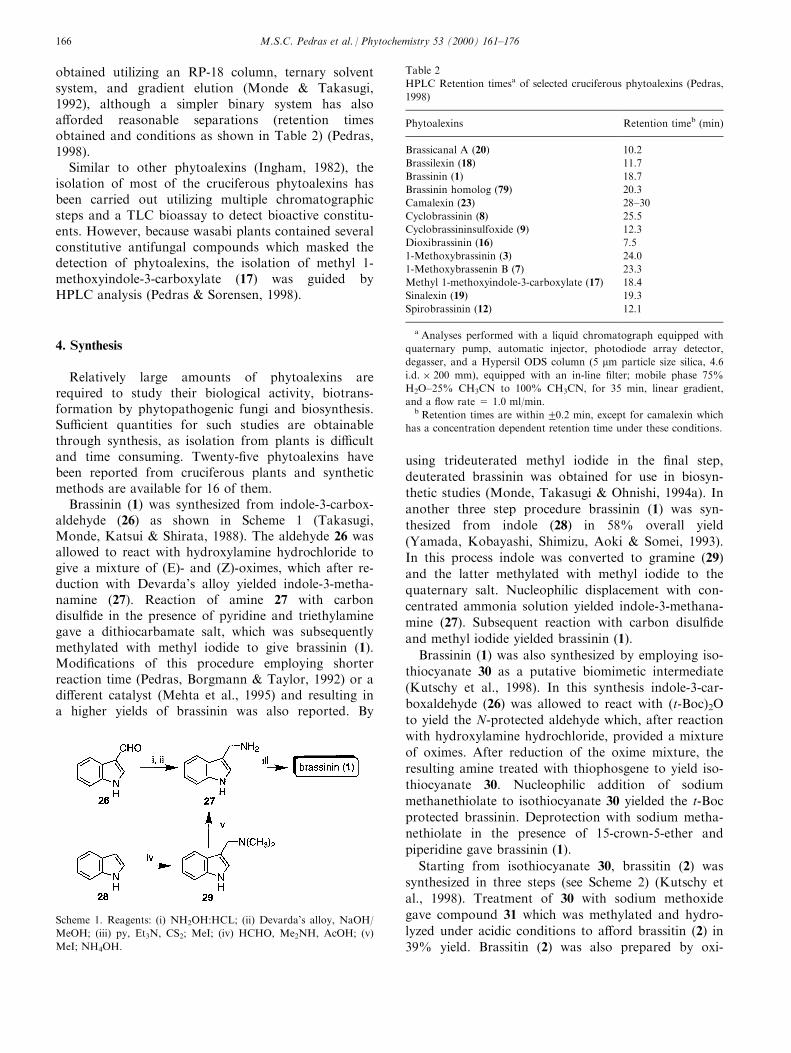
obtained utilizing an RP-18 column, ternary solventsystem, and gradient elution (Monde & Takasugi,1992), although a simpler binary system has alsoa�orded reasonable separations (retention timesobtained and conditions as shown in Table 2) (Pedras,1998).
Similar to other phytoalexins (Ingham, 1982), theisolation of most of the cruciferous phytoalexins hasbeen carried out utilizing multiple chromatographicsteps and a TLC bioassay to detect bioactive constitu-ents. However, because wasabi plants contained severalconstitutive antifungal compounds which masked thedetection of phytoalexins, the isolation of methyl 1-methoxyindole-3-carboxylate (17) was guided byHPLC analysis (Pedras & Sorensen, 1998).
4. Synthesis
Relatively large amounts of phytoalexins arerequired to study their biological activity, biotrans-formation by phytopathogenic fungi and biosynthesis.Su�cient quantities for such studies are obtainablethrough synthesis, as isolation from plants is di�cultand time consuming. Twenty-®ve phytoalexins havebeen reported from cruciferous plants and syntheticmethods are available for 16 of them.
Brassinin (1) was synthesized from indole-3-carbox-aldehyde (26) as shown in Scheme 1 (Takasugi,Monde, Katsui & Shirata, 1988). The aldehyde 26 wasallowed to react with hydroxylamine hydrochloride togive a mixture of (E)- and (Z)-oximes, which after re-duction with Devarda's alloy yielded indole-3-metha-namine (27). Reaction of amine 27 with carbondisul®de in the presence of pyridine and triethylaminegave a dithiocarbamate salt, which was subsequentlymethylated with methyl iodide to give brassinin (1).Modi®cations of this procedure employing shorterreaction time (Pedras, Borgmann & Taylor, 1992) or adi�erent catalyst (Mehta et al., 1995) and resulting ina higher yields of brassinin was also reported. By
using trideuterated methyl iodide in the ®nal step,
deuterated brassinin was obtained for use in biosyn-thetic studies (Monde, Takasugi & Ohnishi, 1994a). In
another three step procedure brassinin (1) was syn-
thesized from indole (28) in 58% overall yield
(Yamada, Kobayashi, Shimizu, Aoki & Somei, 1993).
In this process indole was converted to gramine (29)
and the latter methylated with methyl iodide to the
quaternary salt. Nucleophilic displacement with con-centrated ammonia solution yielded indole-3-methana-
mine (27). Subsequent reaction with carbon disul®de
and methyl iodide yielded brassinin (1).
Brassinin (1) was also synthesized by employing iso-
thiocyanate 30 as a putative biomimetic intermediate
(Kutschy et al., 1998). In this synthesis indole-3-car-
boxaldehyde (26) was allowed to react with (t-Boc)2Oto yield the N-protected aldehyde which, after reaction
with hydroxylamine hydrochloride, provided a mixture
of oximes. After reduction of the oxime mixture, the
resulting amine treated with thiophosgene to yield iso-
thiocyanate 30. Nucleophilic addition of sodium
methanethiolate to isothiocyanate 30 yielded the t-Boc
protected brassinin. Deprotection with sodium metha-nethiolate in the presence of 15-crown-5-ether and
piperidine gave brassinin (1).
Starting from isothiocyanate 30, brassitin (2) was
synthesized in three steps (see Scheme 2) (Kutschy et
al., 1998). Treatment of 30 with sodium methoxide
gave compound 31 which was methylated and hydro-
lyzed under acidic conditions to a�ord brassitin (2) in39% yield. Brassitin (2) was also prepared by oxi-
Scheme 1. Reagents: (i) NH2OH:HCL; (ii) Devarda's alloy, NaOH/
MeOH; (iii) py, Et3N, CS2; MeI; (iv) HCHO, Me2NH, AcOH; (v)
MeI; NH4OH.
Table 2
HPLC Retention timesa of selected cruciferous phytoalexins (Pedras,
1998)
Phytoalexins Retention timeb (min)
Brassicanal A (20) 10.2
Brassilexin (18) 11.7
Brassinin (1) 18.7
Brassinin homolog (79) 20.3
Camalexin (23) 28±30
Cyclobrassinin (8) 25.5
Cyclobrassininsulfoxide (9) 12.3
Dioxibrassinin (16) 7.5
1-Methoxybrassinin (3) 24.0
1-Methoxybrassenin B (7) 23.3
Methyl 1-methoxyindole-3-carboxylate (17) 18.4
Sinalexin (19) 19.3
Spirobrassinin (12) 12.1
a Analyses performed with a liquid chromatograph equipped with
quaternary pump, automatic injector, photodiode array detector,
degasser, and a Hypersil ODS column (5 mm particle size silica, 4.6
i.d. � 200 mm), equipped with an in-line ®lter; mobile phase 75%
H2O±25% CH3CN to 100% CH3CN, for 35 min, linear gradient,
and a ¯ow rate = 1.0 ml/min.b Retention times are within 20.2 min, except for camalexin which
has a concentration dependent retention time under these conditions.
M.S.C. Pedras et al. / Phytochemistry 53 (2000) 161±176166
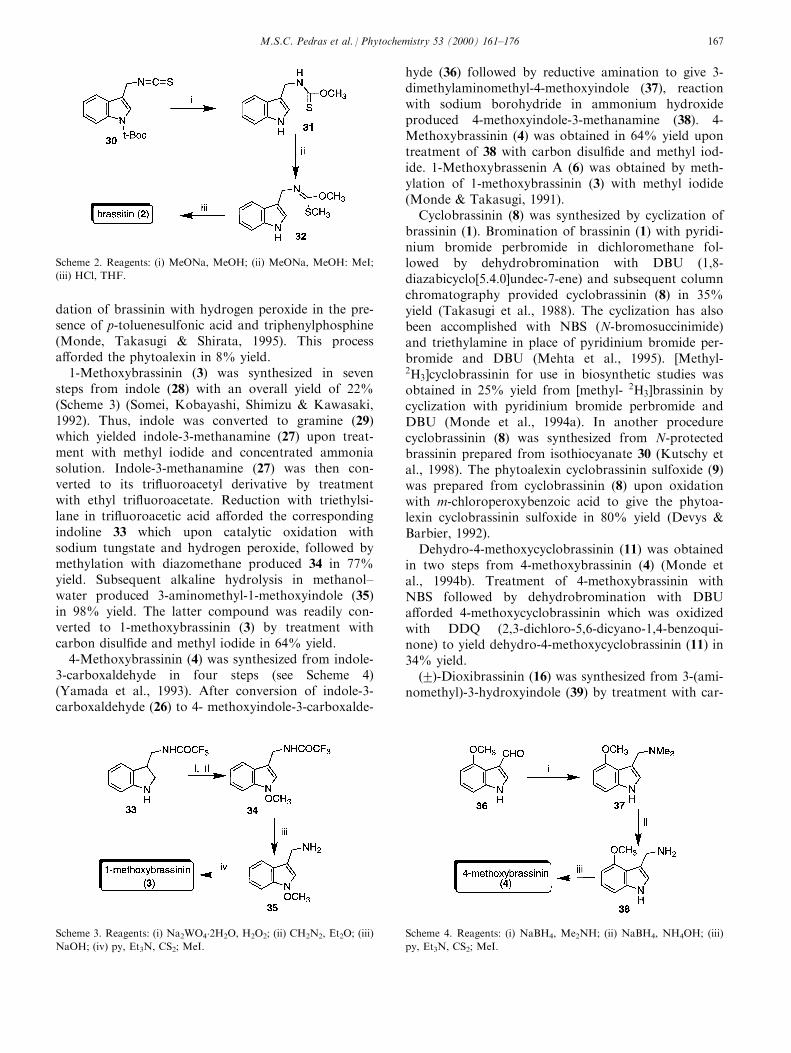
dation of brassinin with hydrogen peroxide in the pre-sence of p-toluenesulfonic acid and triphenylphosphine(Monde, Takasugi & Shirata, 1995). This processa�orded the phytoalexin in 8% yield.
1-Methoxybrassinin (3) was synthesized in sevensteps from indole (28) with an overall yield of 22%(Scheme 3) (Somei, Kobayashi, Shimizu & Kawasaki,1992). Thus, indole was converted to gramine (29)which yielded indole-3-methanamine (27) upon treat-ment with methyl iodide and concentrated ammoniasolution. Indole-3-methanamine (27) was then con-verted to its tri¯uoroacetyl derivative by treatmentwith ethyl tri¯uoroacetate. Reduction with triethylsi-lane in tri¯uoroacetic acid a�orded the correspondingindoline 33 which upon catalytic oxidation withsodium tungstate and hydrogen peroxide, followed bymethylation with diazomethane produced 34 in 77%yield. Subsequent alkaline hydrolysis in methanol±water produced 3-aminomethyl-1-methoxyindole (35)in 98% yield. The latter compound was readily con-verted to 1-methoxybrassinin (3) by treatment withcarbon disul®de and methyl iodide in 64% yield.
4-Methoxybrassinin (4) was synthesized from indole-3-carboxaldehyde in four steps (see Scheme 4)(Yamada et al., 1993). After conversion of indole-3-carboxaldehyde (26) to 4- methoxyindole-3-carboxalde-
hyde (36) followed by reductive amination to give 3-dimethylaminomethyl-4-methoxyindole (37), reactionwith sodium borohydride in ammonium hydroxideproduced 4-methoxyindole-3-methanamine (38). 4-Methoxybrassinin (4) was obtained in 64% yield upontreatment of 38 with carbon disul®de and methyl iod-ide. 1-Methoxybrassenin A (6) was obtained by meth-ylation of 1-methoxybrassinin (3) with methyl iodide(Monde & Takasugi, 1991).
Cyclobrassinin (8) was synthesized by cyclization ofbrassinin (1). Bromination of brassinin (1) with pyridi-nium bromide perbromide in dichloromethane fol-lowed by dehydrobromination with DBU (1,8-diazabicyclo[5.4.0]undec-7-ene) and subsequent columnchromatography provided cyclobrassinin (8) in 35%yield (Takasugi et al., 1988). The cyclization has alsobeen accomplished with NBS (N-bromosuccinimide)and triethylamine in place of pyridinium bromide per-bromide and DBU (Mehta et al., 1995). [Methyl-2H3]cyclobrassinin for use in biosynthetic studies wasobtained in 25% yield from [methyl- 2H3]brassinin bycyclization with pyridinium bromide perbromide andDBU (Monde et al., 1994a). In another procedurecyclobrassinin (8) was synthesized from N-protectedbrassinin prepared from isothiocyanate 30 (Kutschy etal., 1998). The phytoalexin cyclobrassinin sulfoxide (9)was prepared from cyclobrassinin (8) upon oxidationwith m-chloroperoxybenzoic acid to give the phytoa-lexin cyclobrassinin sulfoxide in 80% yield (Devys &Barbier, 1992).
Dehydro-4-methoxycyclobrassinin (11) was obtainedin two steps from 4-methoxybrassinin (4) (Monde etal., 1994b). Treatment of 4-methoxybrassinin withNBS followed by dehydrobromination with DBUa�orded 4-methoxycyclobrassinin which was oxidizedwith DDQ (2,3-dichloro-5,6-dicyano-1,4-benzoqui-none) to yield dehydro-4-methoxycyclobrassinin (11) in34% yield.
(2)-Dioxibrassinin (16) was synthesized from 3-(ami-nomethyl)-3-hydroxyindole (39) by treatment with car-
Scheme 3. Reagents: (i) Na2WO4�2H2O, H2O2; (ii) CH2N2, Et2O; (iii)
NaOH; (iv) py, Et3N, CS2; MeI.
Scheme 2. Reagents: (i) MeONa, MeOH; (ii) MeONa, MeOH: MeI;
(iii) HCl, THF.
Scheme 4. Reagents: (i) NaBH4, Me2NH; (ii) NaBH4, NH4OH; (iii)
py, Et3N, CS2; MeI.
M.S.C. Pedras et al. / Phytochemistry 53 (2000) 161±176 167

bon disul®de in the presence of triethylamine and pyri-dine followed by methylation with methyl iodide(Monde, Sasaki, Shirata & Takasugi, 1991a). This pro-cess gave dioxibrassinin (16) in 75% yield. By employ-ing trideuterated methyl iodide for the methylationstep (2)-[methyl-2H3]dioxibrassinin was obtained foruse in biosynthetic studies (Monde et al., 1994a).Spirobrassinin (12) was synthesized by treatment ofdioxibrassinin with thionyl chloride (Monde et al.,1994a).
Brassilexin (18) was synthesized in 18% overall yieldin a three step procedure starting with indole-3-carbox-aldehyde (Devys & Barbier, 1990b). The aldehyde wastreated with hydroxylamine hydrochloride to yield amixture of (E)- and (Z)-oximes, which upon reactionwith sulfur chloride in acetic acid provided the mono-sul®de 40 in 67% yield. The monosul®de cyclized tobrassilexin (18) at room temperature upon treatmentwith polyphosphoric acid. In a one-pot procedure alsostarting with indole-3-carboxaldehyde, brassilexin wassynthesized in 30% yield (Devys & Barbier, 1993). Thealdehyde was ®rst treated with sulfur monochloride inacetic acid to yield a disul®de which, after removal ofexcess acid, was treated with ammonia in methanol toprovide brassilexin. Brassilexin (18) was also syn-thesized by oxidative ring contraction of cyclobrassinin(8) with m-chloroperoxybenzoic acid to give cyclobras-sinin sulfoxide (9). The latter compound was then oxi-dized with sodium periodate to provide brassilexin (18)in 60% yield from cyclobrassinin sulfoxide (Devys &Barbier, 1992). Direct oxidation of cyclobrassinin withsodium periodate gave brassilexin in a lower yield(30%) (Devys & Barbier, 1990a).
In an e�cient four step procedure brassilexin (18)was synthesized from 2-indolinethione (41) in 64%overall yield (Scheme 5) (Pedras & Okanga, 1998b).Formylation of 2-indolinethione (41) with ethyl for-mate gave 2-mercaptoindole-3-carboxaldehyde (42) in92% yield. Treatment of this aldehyde with hydroxyla-mine hydrochloride under standard conditions quanti-tatively yielded a mixture of (E)- and (Z)-oximes (43).Reduction of the oxime mixture with sodium cyano-borohydride in the presence of titanium chlorideyielded 3- methylenaminoindole-2-thione which upontreatment with activated charcoal in methanol a�ordedbrassilexin (18).
Brassicanal A (20) was synthesized by Vilsmeier for-
mylation of 2-(methylthio) indole (Monde, Katsui,Shirata & Takasugi, 1990a). In another synthesis, bras-
sicanal A (20) was obtained by methylation of 2-mer-
captoindole-3-carboxaldehyde (42) with diazomethane
(Pedras & Okanga, 1998b). Brassicanal B (21) was syn-thesized by treatment of 2-indolinethione (41) with
bromoacetone followed by Vilsmeier formylation
(Monde et al., 1990b).
Camalexin (23) was synthesized from indole in atwo step procedure (Ayer, Craw, Ma & Miao, 1992).
Reaction of indolylmagnesium iodide (prepared in situ
from indole and methylmagnesium iodide) with 2-bro-
mothiazole (44) in re¯uxing benzene a�orded cama-lexin (23) in 68±76% yield. In a four step procedure
camalexin was synthesized from 2-trimethylsilyl thia-
zole (45) (Scheme 6) (FuÈ rstner & Ernst, 1995). The lat-
ter compound provided ketone 46 in good yield uponacylation with 2-nitrobenzoyl chloride. Standard
hydrogenation of 46 over palladium on charcoal fol-
lowed by formylation of the resulting amino group
with formic acid and acetic anhydride gave oxoamide47, which was reductively cyclized upon heating with
titanium chloride and zinc dust in DME (1,2-
dimethoxyethane) to a�ord camalexin (23) in 71%
yield. Camalexin (23) was also synthesized from 2-bro-mothiazole (44) by an alternative procedure amenable
to large scale preparations (Scheme 6) (FuÈ rstner &
Ernst, 1995). Lithiation of 2-bromothiazole (44) and
subsequent reaction with 2-nitrobenzaldehyde gave analcohol, which was oxidized to the corresponding
ketone 46 using pyridinium dichromate (PDC) in
dichloromethane.
6-Methoxycamalexin (24) was obtained from 4-methyl-3-nitrophenol, prepared in 75% overall yield
from 4-methyl-3-nitroaniline (48), and then methylated
to yield nitroanisole 49 (Scheme 7) (Ayer et al., 1992).
Treatment of 4-methyl-3-nitroanisole (49) withdimethylformamide dimethyl acetal and pyrrolidine
gave b-pyrrolidinostyrene (50) which was reduced with
titanium chloride in ammonium acetate bu�er to
Scheme 5. Reagents: (i) NaH, HCOOEt; (ii) NH2OH4 �HCl, NaOAc,
EtOH; (iii) NaBH3CN, TiCl3, MeOH; (iv) activated charcoal.
M.S.C. Pedras et al. / Phytochemistry 53 (2000) 161±176168

a�ord 6-methoxyindole (51) in 73±78% overall yield.Alkylation of 6-methoxyindolyl magnesium iodidewith 2-bromothiazole (44), according to the procedureused to prepare camalexin, gave 6-methoxycamalexin(24) in good yield.
The phytoalexin methyl 1-methoxyindole-3-carboxy-late (17) was obtained from indoline (52) in six steps(Scheme 8), requiring only two chromatographic separ-ations (Pedras & Sorensen, 1998), a simpli®cation of apreviously published procedure (Acheson, Aldridge,Choi, Nwankwo, Ruscoe & Wallis, 1984). Indolinewas reacted with sodium tungstate and hydrogen per-oxide, followed by treatment with diazomethane toyield 1-methoxyindole (53). Chlorosulfonylisocyanatewas added to methoxyindole to yield 54 which uponalkaline hydrolysis and methylation with diazomethaneyielded methyl 1-methoxyindole-3-carboxylate (17) in9% overall yield.
5. Biosynthesis
Scheme 9 summarizes the presently known biosyn-
thetic relationships among the diverse cruciferous phy-toalexins and their precursors. The amino acid L-tryptophan (56) is the biogenetic precursor of most ofthese phytoalexins (Monde et al., 1994a). Tryptophanis biosynthesized from anthranilic acid (55) via the shi-kimate pathway, which has been the subject of severalreviews (Dewick, 1998). However, anthranilic acid(55), but not tryptophan is a precursor of the phytoa-lexin camalexin (23) (Tsuji, Zook, Somerville, Last &Hammerschmidt, 1993). Aside from tryptophan (56),closer precursors of brassinin (1) such as indole gluco-sinolate (glucobrassicin) (57) and indole isothiocyanate58 were suggested (Monde et al., 1994a). In fact,indole glucosinolates such as glucobrassicin (57) arealso biosynthesized from L-tryptophan and are knownto give the respective isothiocyanates upon enzymic hy-drolysis followed by a Lossen-type rearrangement(Fenwick et al., 1989). Furthermore, time-course stu-dies in UV-irradiated turnip root tissue (B. campestrisL. ssp. rapa ) indicated that the levels of indole glucosi-nolates and phytoalexins increased in the UV-irra-diated tissue, whereas only indole glucosinolate levelsincreased in non-irradiated control tissue (Monde,Takasugi, Lewis & Fenwick, 1991). As depicted inScheme 9, it is likely that brassinin (1) derives via iso-thiocyanate 58 from glucobrassicin (57), although a re-lated intermediate cannot be ruled out (Monde et al.,1994a).
The biosynthesis of brassinin (1), cyclobrassinin (8)and spirobrassinin (12) was studied using isotopicallylabeled �13C and 2H� precursors administered to turniptissue obtained from turnip root (B. campestris L. ssp.rapa ) (Monde et al., 1994a; Monde & Takasugi, 1991).In order to con®rm the origin of the indole moiety ofbrassinin, incorporation of L-tryptophan was exam-ined. When L-[4 '-2H]tryptophan was administered toUV-irradiated turnip tissue and incubated for 37 h,spirobrassinin (12) was isolated as the main metabolite.Spectroscopic analysis revealed incorporation of the2H label into the oxindole nucleus of both 8 and 12. Afeeding experiment with L-[methyl-2H3]methionine indi-
Scheme 6. Reagents: (i) 2-nitrobenzoyl chloride, CH2Cl2; (ii) H2, Pd-
charcoal, EtOAc; (iii) HCOOH, Ac2O; (iv) TiCl3, Zn-dust, DME,
re¯ux; EDTA disodium salt, H2O; (v) n-BuLi, Et2O, ÿ788C; 2-nitro-benzaldehyde, Et2O, ÿ788C; (vi) PDC, CH2Cl2.
Scheme 7. Reagents: (i) NaNO2, H2SO4; H2O; (ii) Me2SO4, K2CO3,
MeCN; (iii) dimethylformamide dimethyl acetal, pyrrolidine; (iv)
TiCl3, NH4OAc; (v) MeMgI, Et2O; (vi) 2-bromothiazole, benzene.
Scheme 8. Reagents: (i) Na2 WO4�2H2O, H2O2; (ii) CH2N2, Et2O;
(iii) ClSO2NCO; (iv) NaOH; (v) CH2N2, Et2O.
M.S.C. Pedras et al. / Phytochemistry 53 (2000) 161±176 169

cated that the methyl groups of brassinin, cyclobrassi-nin, and spirobrassinin derived from L-methionine.Administration of [methyl-2H3]brassinin to the turniptissue, followed by incubation led to e�ective incorpor-ation of the 2H label into cyclobrassinin (8) and spiro-brassinin (12). These results demonstrated that L-tryptophan (56) was the precursor of brassinin (1) andthat 1 was an advanced precursor of cyclobrassinin (8)and spirobrassinin (12). However, neither cyclobrassi-nin (8) nor dioxibrassinin (16) were incorporated intospirobrassinin (12) (Monde et al., 1994a). In addition,it was shown that the thiocarbonyl carbon of brassinin(1), and the imino carbon of spirobrassinin (12), origi-nated from the C-2 carbon of tryptophan (Monde &Takasugi, 1991). An analogous experiment with DL-[2-13C]tryptophan resulted in a four-fold enhancementof the imino carbon NMR signal of spirobrassinin andindicated the involvement of a molecular rearrange-ment in the pathway from tryptophan to brassinin.This result was suggestive of the isothiocyanate 58 as akey intermediate to brassinin (1).
To examine the possible role of isothiocyanates inthe biosynthesis of cruciferous phytoalexins, benzylisothiocyanate was chosen as a model substrate andadministered to the turnip tissue (Monde et al.,1994a). A new metabolite was isolated and identi®ed
as methyl benzyldithiocarbamate by direct comparisonwith a synthetic sample. Formation of this metabolitein the turnip tissue indicated that indol-3-ylmethyl iso-thiocyanate (58) (Scheme 9) was involved in the bio-synthesis of brassinin. In order to detect the labileindol-3-ylmethyl isothiocyanate intermediate, a trap-ping experiment with methanethiolate was done(Monde et al., 1994a). Turnip roots were homogenizedwith 15% aqueous sodium methanethiolate and thehomogenate extracted with ethyl acetate. Fractionationof this extract gave brassinin (1), which was not iso-lated in the absence of sodium methanethiolate. Theisolation of brassinin (1) suggested a transient for-mation of isothiocyanate 58 as a reaction intermediate.
In order to clarify whether the methylthio group ofbrassinin (1) was introduced directly or in a stepwisemanner, a mixture of L-[methyl-3H3]methionine and L-[35S]methionine was simultaneously administered toUV-elicited turnip tissue (Monde et al., 1994a). Forty-eight hours after administration of the mixture, metab-olites were extracted and separated to yield brassinin(1) and spirobrassinin (12). The ratio of 35S=3H of iso-lated brassinin and spirobrassinin was unchangedduring biosynthesis of brassinin (1) and spirobrassinin(12) an indication that brassinin was biosynthesized byintact incorporation of the methylthio group from L-methionine into the isothiocyanate 58. Further exper-iments with L-[35S]cysteine supported the conclusionthat the thiocarbonyl sulfur atom of brassinin (1) ori-ginated from L-cysteine.
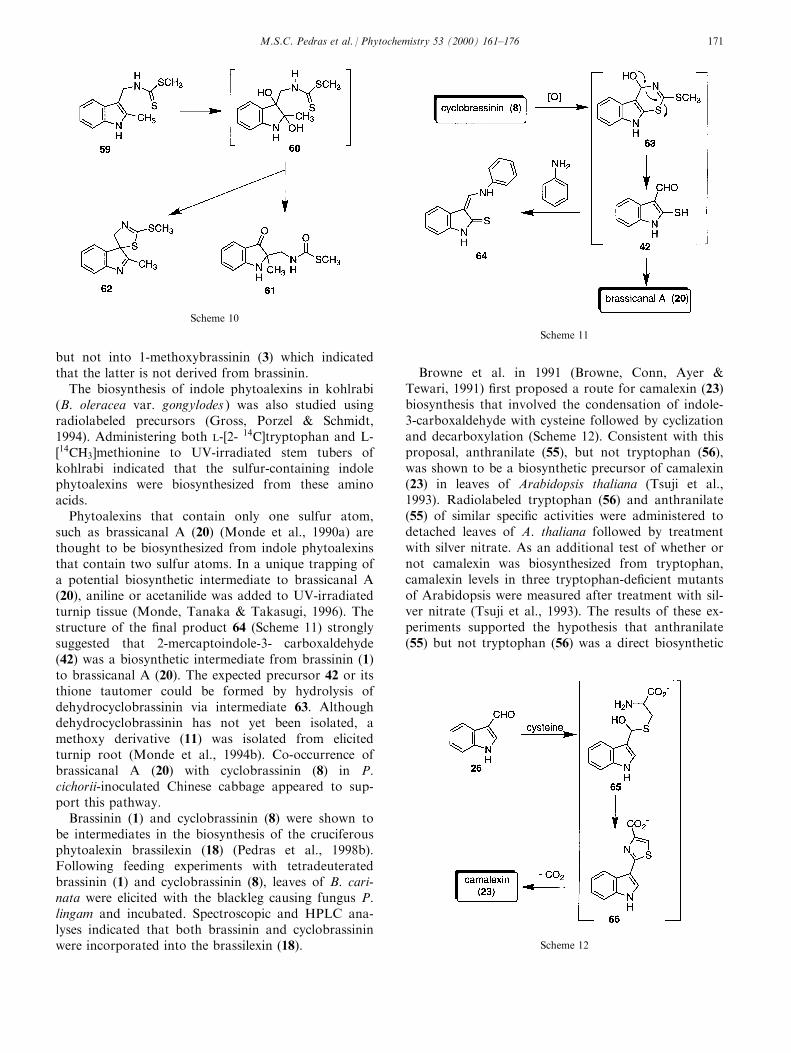
Production of a variety of indole-related phytoalex-ins can be explained by postulating a common inter-mediate which bridges brassinin and other cruciferousphytoalexins (Monde et al., 1994a). To determine thenature of the intermediate, 2-methylbrassinin (59)(Scheme 10) was chosen as a probe. Since compound59 had a methyl group at the C-2 position, the for-mation of a cyclobrassinin-type or a spirobrassinin-type structure was structurally prohibited, thus iso-lation of a corresponding intermediate was expected.After dithiocarbamate 59 was administered to UV-eli-cited turnip tissue and incubated, two new compoundswere isolated which were not detected in the controltissue. Spectroscopic analysis led to their identi®cationas 61 and 62. Formation of these two metabolites(Scheme 10) suggested the diol 60 as the immediateprecursor, likely via a pinacol-type rearrangement(Monde et al., 1994a).
The co-occurrence of 1-methoxybrassinin (3) withbrassinin (1) and cyclobrassinin (8) in elicited Chinesecabbage and Japanese radish suggested that N-hydrox-ylation of brassinin, followed by biological methylationcould lead directly to 3 or 8, through eliminative cycli-zation (Monde et al., 1995). However, [methyl-2H3]brassinin was incorporated into cyclobrassinin (8)
Scheme 9.
M.S.C. Pedras et al. / Phytochemistry 53 (2000) 161±176170
but not into 1-methoxybrassinin (3) which indicatedthat the latter is not derived from brassinin.
The biosynthesis of indole phytoalexins in kohlrabi(B. oleracea var. gongylodes ) was also studied usingradiolabeled precursors (Gross, Porzel & Schmidt,1994). Administering both L-[2- 14C]tryptophan and L-[14CH3]methionine to UV-irradiated stem tubers ofkohlrabi indicated that the sulfur-containing indolephytoalexins were biosynthesized from these aminoacids.
Phytoalexins that contain only one sulfur atom,such as brassicanal A (20) (Monde et al., 1990a) arethought to be biosynthesized from indole phytoalexinsthat contain two sulfur atoms. In a unique trapping ofa potential biosynthetic intermediate to brassicanal A(20), aniline or acetanilide was added to UV-irradiatedturnip tissue (Monde, Tanaka & Takasugi, 1996). Thestructure of the ®nal product 64 (Scheme 11) stronglysuggested that 2-mercaptoindole-3- carboxaldehyde(42) was a biosynthetic intermediate from brassinin (1)to brassicanal A (20). The expected precursor 42 or itsthione tautomer could be formed by hydrolysis ofdehydrocyclobrassinin via intermediate 63. Althoughdehydrocyclobrassinin has not yet been isolated, amethoxy derivative (11) was isolated from elicitedturnip root (Monde et al., 1994b). Co-occurrence ofbrassicanal A (20) with cyclobrassinin (8) in P.cichorii-inoculated Chinese cabbage appeared to sup-port this pathway.
Brassinin (1) and cyclobrassinin (8) were shown tobe intermediates in the biosynthesis of the cruciferousphytoalexin brassilexin (18) (Pedras et al., 1998b).Following feeding experiments with tetradeuteratedbrassinin (1) and cyclobrassinin (8), leaves of B. cari-nata were elicited with the blackleg causing fungus P.lingam and incubated. Spectroscopic and HPLC ana-lyses indicated that both brassinin and cyclobrassininwere incorporated into the brassilexin (18).
Browne et al. in 1991 (Browne, Conn, Ayer &Tewari, 1991) ®rst proposed a route for camalexin (23)biosynthesis that involved the condensation of indole-3-carboxaldehyde with cysteine followed by cyclizationand decarboxylation (Scheme 12). Consistent with thisproposal, anthranilate (55), but not tryptophan (56),was shown to be a biosynthetic precursor of camalexin(23) in leaves of Arabidopsis thaliana (Tsuji et al.,1993). Radiolabeled tryptophan (56) and anthranilate(55) of similar speci®c activities were administered todetached leaves of A. thaliana followed by treatmentwith silver nitrate. As an additional test of whether ornot camalexin was biosynthesized from tryptophan,camalexin levels in three tryptophan-de®cient mutantsof Arabidopsis were measured after treatment with sil-ver nitrate (Tsuji et al., 1993). The results of these ex-periments supported the hypothesis that anthranilate(55) but not tryptophan (56) was a direct biosynthetic
Scheme 10
Scheme 11
Scheme 12
M.S.C. Pedras et al. / Phytochemistry 53 (2000) 161±176 171
precursor of camalexin (23). Recently, the origin of thesulfur atom in the thiazole ring of camalexin wasestablished after incubation of leaves of A. thalianawith �35S]cysteine and �35S]methionine (Zook &Hammerschmidt, 1997). The incorporation of radioac-tivity into camalexin (23) provided strong evidencethat the sulfur atom of the thiazole ring originatedfrom cysteine. Additional feeding experiments withcysteine labeled with either 2H or 13C and 13C sup-ported the previous conclusion. This camalexin (23)biosynthetic pathway was con®rmed to occur in cellcultures of A. thaliana where, not surprisingly, indolewas also established to be a precursor of camalexin(23) (Zook, 1998).
6. Microbial biotransformations
Phytopathogenic fungi are able to circumvent someof the plant chemical defences through metabolismand detoxi®cation. When phytopathogenic fungi cane�ectively detoxify phytoalexins, the outcome of theplant-pathogen interaction can favor the pathogen andbe detrimental to the plant. To date, several examplesdemonstrate that fungal pathogens can detoxify cruci-ferous phytoalexins e�ciently (Pedras, 1998). Multipleexamples of phytoalexin detoxi®cation have beenreported in other plant families (VanEtten, Mathews &Mathews, 1989; VanEtten, Sandrock, Wasmann, Soby,McCluskey & Wang, 1995; Daniel & Purkayastha,1995).
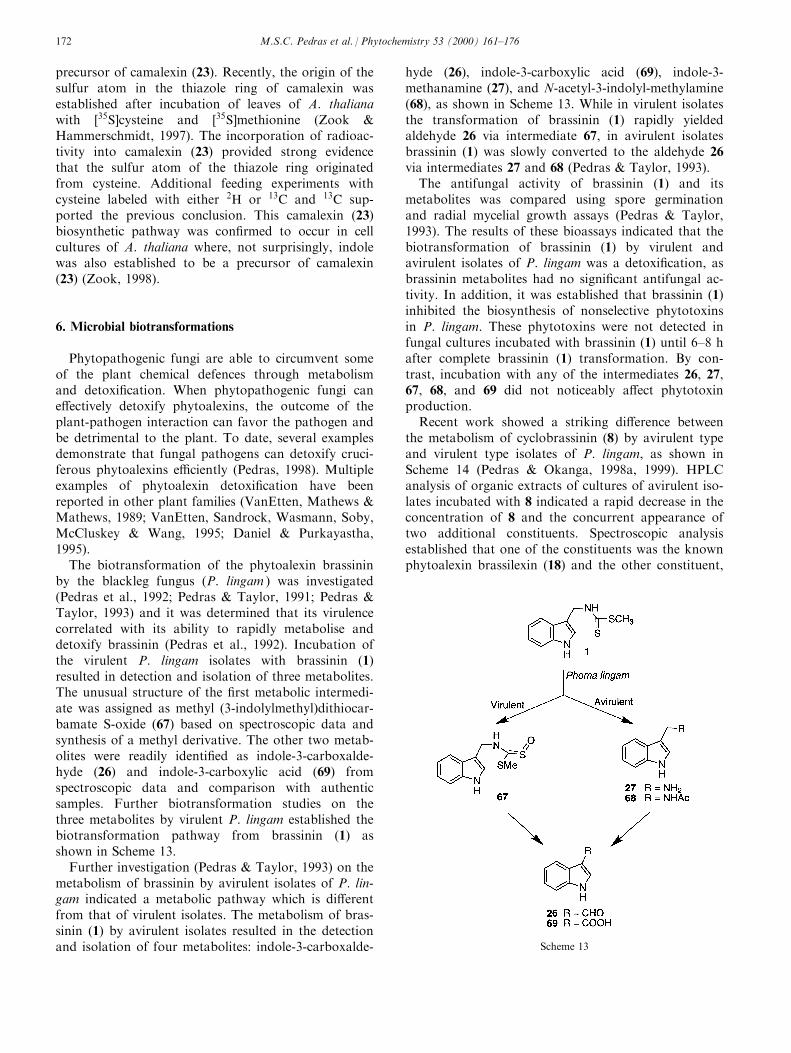
The biotransformation of the phytoalexin brassininby the blackleg fungus (P. lingam ) was investigated(Pedras et al., 1992; Pedras & Taylor, 1991; Pedras &Taylor, 1993) and it was determined that its virulencecorrelated with its ability to rapidly metabolise anddetoxify brassinin (Pedras et al., 1992). Incubation ofthe virulent P. lingam isolates with brassinin (1)resulted in detection and isolation of three metabolites.The unusual structure of the ®rst metabolic intermedi-ate was assigned as methyl (3-indolylmethyl)dithiocar-bamate S-oxide (67) based on spectroscopic data andsynthesis of a methyl derivative. The other two metab-olites were readily identi®ed as indole-3-carboxalde-hyde (26) and indole-3-carboxylic acid (69) fromspectroscopic data and comparison with authenticsamples. Further biotransformation studies on thethree metabolites by virulent P. lingam established thebiotransformation pathway from brassinin (1) asshown in Scheme 13.
Further investigation (Pedras & Taylor, 1993) on themetabolism of brassinin by avirulent isolates of P. lin-gam indicated a metabolic pathway which is di�erentfrom that of virulent isolates. The metabolism of bras-sinin (1) by avirulent isolates resulted in the detectionand isolation of four metabolites: indole-3-carboxalde-
hyde (26), indole-3-carboxylic acid (69), indole-3-methanamine (27), and N-acetyl-3-indolyl-methylamine(68), as shown in Scheme 13. While in virulent isolatesthe transformation of brassinin (1) rapidly yieldedaldehyde 26 via intermediate 67, in avirulent isolatesbrassinin (1) was slowly converted to the aldehyde 26via intermediates 27 and 68 (Pedras & Taylor, 1993).
The antifungal activity of brassinin (1) and itsmetabolites was compared using spore germinationand radial mycelial growth assays (Pedras & Taylor,1993). The results of these bioassays indicated that thebiotransformation of brassinin (1) by virulent andavirulent isolates of P. lingam was a detoxi®cation, asbrassinin metabolites had no signi®cant antifungal ac-tivity. In addition, it was established that brassinin (1)inhibited the biosynthesis of nonselective phytotoxinsin P. lingam. These phytotoxins were not detected infungal cultures incubated with brassinin (1) until 6±8 hafter complete brassinin (1) transformation. By con-trast, incubation with any of the intermediates 26, 27,67, 68, and 69 did not noticeably a�ect phytotoxinproduction.
Recent work showed a striking di�erence betweenthe metabolism of cyclobrassinin (8) by avirulent typeand virulent type isolates of P. lingam, as shown inScheme 14 (Pedras & Okanga, 1998a, 1999). HPLCanalysis of organic extracts of cultures of avirulent iso-lates incubated with 8 indicated a rapid decrease in theconcentration of 8 and the concurrent appearance oftwo additional constituents. Spectroscopic analysisestablished that one of the constituents was the knownphytoalexin brassilexin (18) and the other constituent,
Scheme 13
M.S.C. Pedras et al. / Phytochemistry 53 (2000) 161±176172
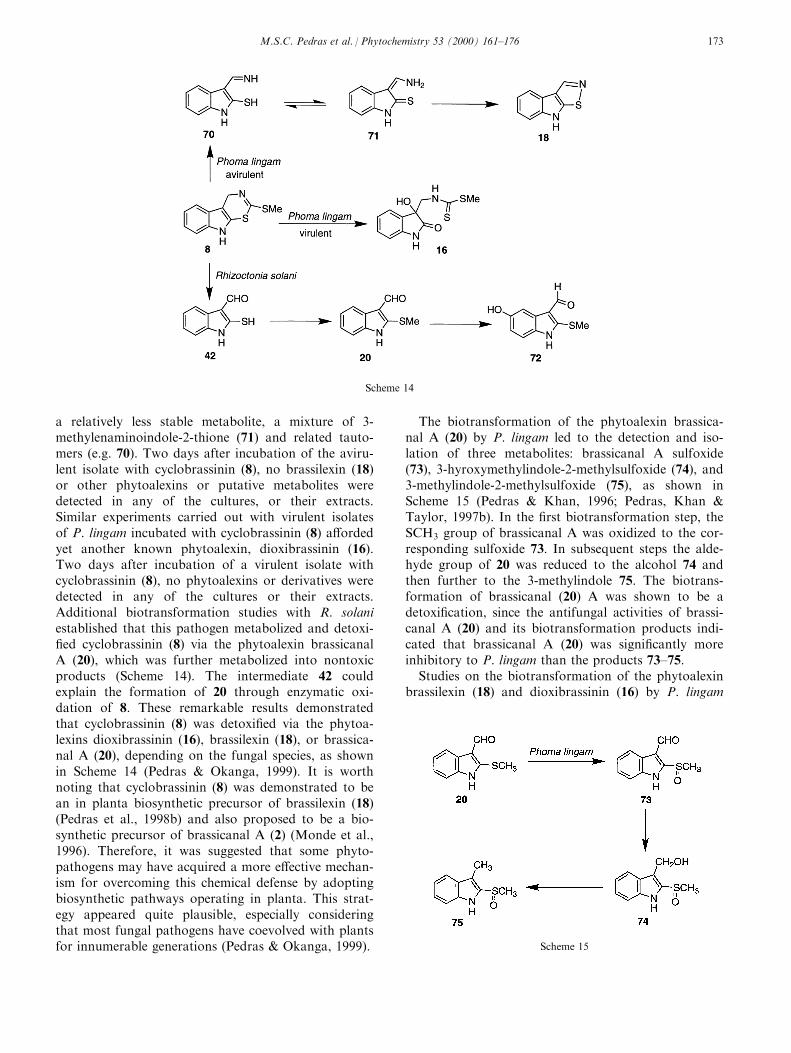
a relatively less stable metabolite, a mixture of 3-methylenaminoindole-2-thione (71) and related tauto-mers (e.g. 70). Two days after incubation of the aviru-lent isolate with cyclobrassinin (8), no brassilexin (18)or other phytoalexins or putative metabolites weredetected in any of the cultures, or their extracts.Similar experiments carried out with virulent isolatesof P. lingam incubated with cyclobrassinin (8) a�ordedyet another known phytoalexin, dioxibrassinin (16).Two days after incubation of a virulent isolate withcyclobrassinin (8), no phytoalexins or derivatives weredetected in any of the cultures or their extracts.Additional biotransformation studies with R. solaniestablished that this pathogen metabolized and detoxi-®ed cyclobrassinin (8) via the phytoalexin brassicanalA (20), which was further metabolized into nontoxicproducts (Scheme 14). The intermediate 42 couldexplain the formation of 20 through enzymatic oxi-dation of 8. These remarkable results demonstratedthat cyclobrassinin (8) was detoxi®ed via the phytoa-lexins dioxibrassinin (16), brassilexin (18), or brassica-nal A (20), depending on the fungal species, as shownin Scheme 14 (Pedras & Okanga, 1999). It is worthnoting that cyclobrassinin (8) was demonstrated to bean in planta biosynthetic precursor of brassilexin (18)(Pedras et al., 1998b) and also proposed to be a bio-synthetic precursor of brassicanal A (2) (Monde et al.,1996). Therefore, it was suggested that some phyto-pathogens may have acquired a more e�ective mechan-ism for overcoming this chemical defense by adoptingbiosynthetic pathways operating in planta. This strat-egy appeared quite plausible, especially consideringthat most fungal pathogens have coevolved with plantsfor innumerable generations (Pedras & Okanga, 1999).
The biotransformation of the phytoalexin brassica-nal A (20) by P. lingam led to the detection and iso-lation of three metabolites: brassicanal A sulfoxide(73), 3-hyroxymethylindole-2-methylsulfoxide (74), and3-methylindole-2-methylsulfoxide (75), as shown inScheme 15 (Pedras & Khan, 1996; Pedras, Khan &Taylor, 1997b). In the ®rst biotransformation step, theSCH3 group of brassicanal A was oxidized to the cor-responding sulfoxide 73. In subsequent steps the alde-hyde group of 20 was reduced to the alcohol 74 andthen further to the 3-methylindole 75. The biotrans-formation of brassicanal (20) A was shown to be adetoxi®cation, since the antifungal activities of brassi-canal A (20) and its biotransformation products indi-cated that brassicanal A (20) was signi®cantly moreinhibitory to P. lingam than the products 73±75.
Studies on the biotransformation of the phytoalexinbrassilexin (18) and dioxibrassinin (16) by P. lingam
Scheme 14
Scheme 15
M.S.C. Pedras et al. / Phytochemistry 53 (2000) 161±176 173
indicated that the phytoalexins were transformed butno biotransformation products were detected or iso-lated (Pedras, 1998; Pedras et al., 1997b). This workcon®rmed the results of a previous study on fungalmetabolism of brassilexin (18) (Rouxel, Kollman &Ballesdent, 1995). Possible metabolic products of bras-silexin might be very polar and more soluble in theaqueous medium than in organic solvents, thus pre-cluding extraction and detection. On the other hand,spirobrassinin (12) was stable in fungal cultures anddid not appear to be metabolized or interfere with theproduction of fungal toxins (Pedras, 1998).
Although blackleg fungi could metabolize anddetoxify brassinin (1), cyclobrassinin (8), dioxibrassinin(16), brassilexin (18), and brassicanal A (20), cama-lexin (23) was not metabolized by either virulent oravirulent type isolates of P. lingam. None of the black-leg fungal isolates tested metabolized camalexin (23) orappeared to be a�ected by a concentration of 5 � 10ÿ4
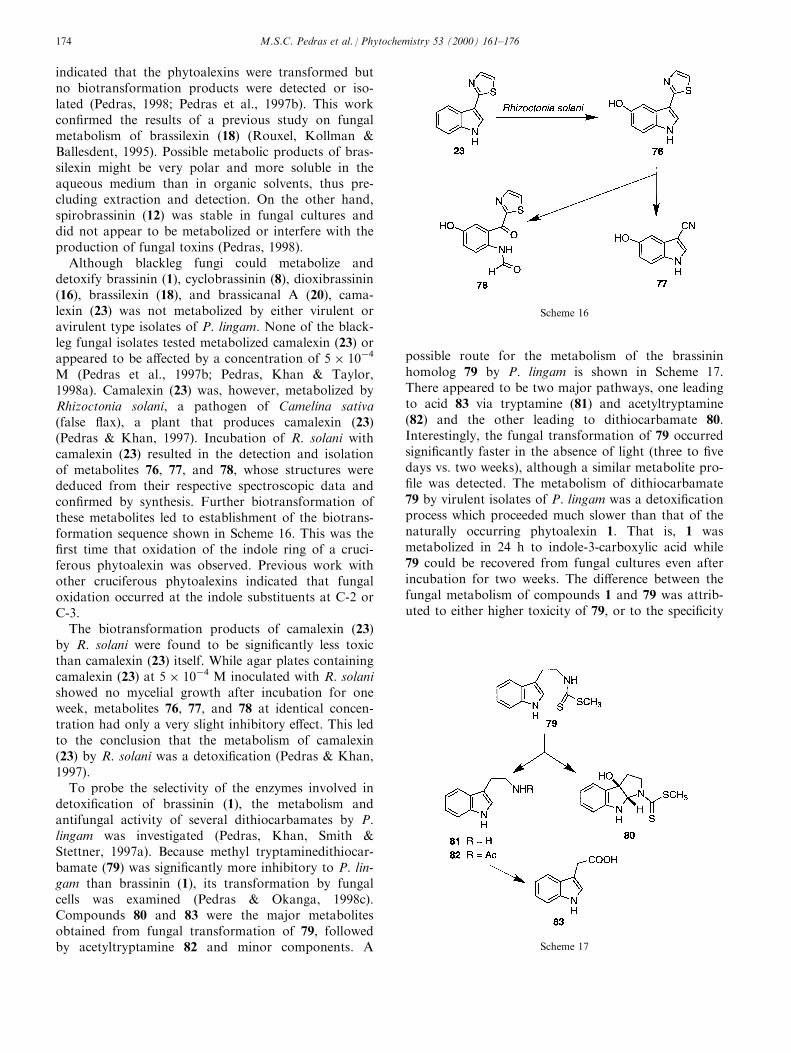
M (Pedras et al., 1997b; Pedras, Khan & Taylor,1998a). Camalexin (23) was, however, metabolized byRhizoctonia solani, a pathogen of Camelina sativa(false ¯ax), a plant that produces camalexin (23)(Pedras & Khan, 1997). Incubation of R. solani withcamalexin (23) resulted in the detection and isolationof metabolites 76, 77, and 78, whose structures werededuced from their respective spectroscopic data andcon®rmed by synthesis. Further biotransformation ofthese metabolites led to establishment of the biotrans-formation sequence shown in Scheme 16. This was the®rst time that oxidation of the indole ring of a cruci-ferous phytoalexin was observed. Previous work withother cruciferous phytoalexins indicated that fungaloxidation occurred at the indole substituents at C-2 orC-3.
The biotransformation products of camalexin (23)by R. solani were found to be signi®cantly less toxicthan camalexin (23) itself. While agar plates containingcamalexin (23) at 5 � 10ÿ4 M inoculated with R. solanishowed no mycelial growth after incubation for oneweek, metabolites 76, 77, and 78 at identical concen-tration had only a very slight inhibitory e�ect. This ledto the conclusion that the metabolism of camalexin(23) by R. solani was a detoxi®cation (Pedras & Khan,1997).
To probe the selectivity of the enzymes involved indetoxi®cation of brassinin (1), the metabolism andantifungal activity of several dithiocarbamates by P.lingam was investigated (Pedras, Khan, Smith &Stettner, 1997a). Because methyl tryptaminedithiocar-bamate (79) was signi®cantly more inhibitory to P. lin-gam than brassinin (1), its transformation by fungalcells was examined (Pedras & Okanga, 1998c).Compounds 80 and 83 were the major metabolitesobtained from fungal transformation of 79, followedby acetyltryptamine 82 and minor components. A
possible route for the metabolism of the brassininhomolog 79 by P. lingam is shown in Scheme 17.There appeared to be two major pathways, one leadingto acid 83 via tryptamine (81) and acetyltryptamine(82) and the other leading to dithiocarbamate 80.Interestingly, the fungal transformation of 79 occurredsigni®cantly faster in the absence of light (three to ®vedays vs. two weeks), although a similar metabolite pro-®le was detected. The metabolism of dithiocarbamate79 by virulent isolates of P. lingam was a detoxi®cationprocess which proceeded much slower than that of thenaturally occurring phytoalexin 1. That is, 1 wasmetabolized in 24 h to indole-3-carboxylic acid while79 could be recovered from fungal cultures even afterincubation for two weeks. The di�erence between thefungal metabolism of compounds 1 and 79 was attrib-uted to either higher toxicity of 79, or to the speci®city
Scheme 16
Scheme 17
M.S.C. Pedras et al. / Phytochemistry 53 (2000) 161±176174
of the enzymes involved in the transformations (Pedras& Okanga, 1998c).
7. Applications
It is of great importance to determine the antifungalactivity of cruciferous phytoalexins, since from this in-formation a `phytoalexin blend' which could makeplant defense mechanisms more e�ective againstdiverse fungal pathogens may be established. The tar-geted phytoalexin blend could be introduced eitherthrough genetic manipulation of biosynthetic path-ways, or by screening brassica lines generated indiverse breeding programs. Furthermore, an under-standing of the detoxi®cation mechanisms employedby phytopathogens to overcome cruciferous phytoalex-ins should result from current biotransformation stu-dies. Such studies may lead to the biorational designof antifungal agents selective against phytopathogens(Pedras, 1998). Results discussed above on the bio-transformation of cruciferous phytoalexins indicatedthat di�erent pathogens utilized di�erent enzymes totransform the same phytoalexin and that those pro-cesses may contribute to successful plant colonization.For example, a possible strategy for deterring P. lin-gam could be the design of analogs that would inhibitthe enzyme(s) involved in the detoxi®cation of brassi-nin (1). Its analogs might have the advantage of actingsynergistically with the natural disease resistance fac-tors of plants.
Furthermore, the unusual chemical structures of cru-ciferous phytoalexins have suggested a new perspectiveof the fungal degradation of their host plants' defenses.Recent studies (Pedras & Okanga, 1998a; Pedras &Okanga, 1999) suggested the exciting possibility ofestablishing biosynthetic pathways of cruciferous phy-toalexins in fungi, since the detoxi®cation of cyclobras-sinin (8) by di�erent fungal species appeared to mimicbiosynthetic pathways in plants. However, a betterunderstanding will emerge upon tracing a completemap of phytoalexin transformation in both crucifersand their pathogenic fungi.
References
Acheson, R. M., Aldridge, G. N., Choi, M. C. K., Nwankwo, J. O.,
Ruscoe, M. A., & Wallis, J. D. (1984). Journal of Chemical
Research (M), 1301.
Ayer, W. A., Craw, P. A., Ma, Y., & Miao, S. (1992). Tetrahedron,
48, 2919.
Bailey, J. A., & Mans®eld, J. W. (1982). Phytoalexins (p. 334).
Glasgow, UK: Blackie.
Brooks, C. J. W., & Watson, D. G. (1985). Natural Product Reports,
427.
Browne, L. M., Conn, K. L., Ayer, W. A., & Tewari, J. P. (1991).
Tetrahedron, 47, 3909.
Chadwick, C. I., Lumpkin, T. A., & Elberson, L. R. (1993). Econ.
Bot, 47, 113.
Conn, K. L., Browne, L. M., Tewari, J. P., & Ayer, W. A. (1994).
Journal of Plant Biochemistry & Biotechnology, 3, 125.
Dahyia, J. S., & Rimmer, S. R. (1988). Phytochemistry, 27, 3105.
Daniel, M., & Purkayastha, R. P. (1995). Handbook of phytoalexin
metabolism and action (p. 615). New York: Marcel Dekker.
Deverall, B. J. (1982). In J. A. Bailey, & J. W. Mans®eld,
Phytoalexins (p. 294). Glasgow, UK: Blackie.
Devys, M., & Barbier, M. (1990a). Journal of the Chemical Society,
Perkin Transactions I, 2856.
Devys, M., & Barbier, M. (1990b). Synthesis, 214.
Devys, M., & Barbier, M. (1992). Zeitschrift fuÈr Naturforschung, 47c,
318.
Devys, M., & Barbier, M. (1993). Organic preparations & procedures,
International, 25, 344.
Devys, M., Barbier, M., Kollmann, A., Rouxel, T., & Bousquet, J.
F. (1990). Phytochemistry, 29, 1087.
Devys, M., Barbier, M., Loiselet, I., Rouxel, T., Sarniguet, A.,
Kollmann, A., & Bousquet, J. (1988). Tetrahedron Letters, 29,
6447.
Dewick, P. M. (1998). Natural Product Reports, 15, 17.
Dixon, R. A. (1986). Biological Reviews, 61, 239.
Dixon, R. A., Harrison, M. J., & Lamb, C. J. (1994). Annual Review
of Phytopathology, 32, 479.
Fenwick, G. R., Heaney, R. K., & Mawson, R. (1989). In P. R.
Cheeke, Toxicants of plant origin, II (p. 1). Boca Raton, FL:
CRC Press.
FuÈ rstner, A., & Ernst, A. (1995). Tetrahedron, 51, 773.
Giamoustaris, A., & Mithen, R. (1997). Plant Pathol, 46, 271.
Gross, D., Porzel, A., & Schmidt, J. (1994). Zeitschrift fuÈr
Naturforschung, 49c, 281.
Hammond-Kosac, K. E., & Jones, J. D. G. (1994). The Plant Cell, 8,
1773.
Hemingway, J. S. (1995). In D. Kimber, & D. I. McGregor, Brassica
oilseeds (p. 373). Wallingford, UK: CAB International.
Ingham, J. L. (1982). In J. A. Bailey, & J. W. Mans®eld,
Phytoalexins (p. 21). Glasgow, UK: Blackie.
Jimenez, L. D., Ayer, W. A., & Tewari, J. P. (1997). Phytoprotection,
78, 99.
Keen, N. T. (1993). In B. Fritig, & M. Legrand, Mechanisms of plant
defense responses (p. 3). Dordrecht, The Netherlands: Kluwer
Academic Publishers.
Kimber, D. S., & McGregor, D. I. (1995). In D. Kimber, & D. I.
McGregor, Brassica oilseeds (p. 1). Wallingford, UK: CAB
International.
Ku c, J. (1995). Annual Review of Phytopathology, 33, 275.
Kutschy, P., Dzurilla, M., Takasugi, M., ToÈ roÈ k, M., Achbergerova ,
I., Homzova , R., & Ra cova , M. (1998). Tetrahedron, 54, 3549.
Marquard, R., & Walker, K. C. (1995). In D. Kimber, & D. I.
McGregor, Brassica oilseeds (p. 195). Wallingford, UK: CAB
International.
Mehta, R. G., Liu, J., Constantinou, A., Thomas, C. F.,
Howthorne, M., You, M., GerhaÈ user, C., Pezzuto, J. M., Moon,
R. C., & Moriarty, R. M. (1995). Carcinogenesis, 16, 399.
Monde, K., Katsui, N., Shirata, A., & Takasugi, M. (1990a).
Chemistry Letters, 209.
Monde, K., Sasaki, K., Shirata, A., & Takasugi, M. (1990b).
Phytochemistry, 29, 1499.
Monde, K., Sasaki, K., Shirata, A., & Takasugi, M. (1991a).
Phytochemistry, 30, 2915.
Monde, K., Sasaki, K., Shirata, A., & Takasugi, M. (1991b).
Phytochemistry, 30, 3921.
Monde, K., & Takasugi, M. (1991). Journal of the Chemical Society,
Chemical Communications, 1582.
M.S.C. Pedras et al. / Phytochemistry 53 (2000) 161±176 175

Monde, K., & Takasugi, M. (1992). Journal of Chromatography, 598,
147.
Monde, K., Takasugi, M., Lewis, J. A., & Fenwick, G. R. (1991).
Zeitschrift fuÈr Naturforschung, 46c, 189.
Monde, K., Takasugi, M., & Ohnishi, T. (1994a). Journal of the
American Chemical Society, 116, 6650.
Monde, K., Tamura, K., Takasugi, M., Kobayashi, K., & Somei, M.
(1994b). Heterocycles, 38, 263.
Monde, K., Takasugi, M., & Shirata, A. (1995). Phytochemistry, 39,
581.
Monde, K., Tanaka, A., & Takasugi, M. (1996). Journal of Organic
Chemistry, 61, 9053.
MuÈ ller, K. O. (1958). Australian Journal of Biological Sciences, 11,
275.
Osbourn, A. E. (1996). The Plant Cell, 8, 1821.
Pedras, M. S. C. (1996). Recent Research Developments in
Phytochemistry, 2, 259.
Pedras, M. S. C., Borgmann, I., & Taylor, J. L. (1992). Life Science
Advances (Phytochemistry), 11, 1.
Pedras, M. S. C., & Khan, A. Q. (1996). Journal of Agricultural and
Food Chemistry, 44, 3403.
Pedras, M. S. C., & Khan, A. Q. (1997). Bioorganic & Medicinal
Chemistry Letters, 7, 2255.
Pedras, M. S. C., Khan, A. Q., Smith, K. C., & Stettner, S. L.
(1997a). Canadian Journal of Chemistry, 75, 825.
Pedras, M. S. C., Khan, A. Q., & Taylor, J. L. (1997).
Phytochemicals for pest control. ACS Symposium Series, vol. 658,
p. 155.
Pedras, M. S. C., Khan, A. Q., & Taylor, J. L. (1998). Plant Science,
139, 1.
Pedras, M. S. C., Loukaci, A., & Okanga, F. I. (1998). Bioorganic &
Medicinal Chemistry Letters, 8, 3037.
Pedras, M. S. C., & Okanga, F. I. (1998a). Journal of the Chemical
Society, Chemical Communications, 67.
Pedras, M. S. C., & Okanga, F. I. (1998b). Journal of the Chemical
Society, Chemical Communications, 1565.
Pedras, M. S. C., & Okanga, F. I. (1998c). Journal of Organic
Chemistry, 63, 416.
Pedras, M. S. C., & Okanga, F. I. (1999). Journal of Agricultural and
Food Chemistry, 47, 1196.
Pedras, M. S. C., & Se guin-Swartz, G. (1992). Canadian Journal of
Plant Pathology, 14, 67.
Pedras, M. S. C., & Smith, K. C. (1998). Phytochemistry, 46, 833.
Pedras, M. S. C., & Sorensen, J. L. (1998). Phytochemistry, 49, 1959.
Pedras, M. S. C., & Taylor, J. L. (1991). Journal of Organic
Chemistry, 56, 2619.
Pedras, M. S. C., & Taylor, J. L. (1993). Journal of Natural
Products, 56, 731.
Rogers, E. E., Glazebrook, J., & Ausubel, F. M. (1996). Molecular
Plant Microbe Interactions, 9, 748.
Rouxel, T., Kollman, A., & Ballesdent, M. H. (1995). In M. Daniel,
& R. P. Purkayastha, Handbook of phytoalexin metabolism and
action (p. 229). New York: Marcel Dekker.
Rouxel, T., Kollman, A., Boulidard, L., & Mithen, R. (1991).
Planta, 184, 271.
Smith, C. J. (1996). New Phytologist, 132, 1.
Somei, M., Kobayashi, K., Shimizu, K., & Kawasaki, T. (1992).
Heterocycles, 33, 77.
Staskawicz, B. J., Ausubel, F. M., Baker, B. J., Ellis, J. G., & Jones,
G. D. G. (1995). Science, 268, 661.
Storck, M., & Sacristan, M. D (1988). Zeitschrift fuÈr Naturforschung,
50c, 15.
Takasugi, M., Katsui, N., & Shirata, A. (1986). Journal of the
Chemical Society, Chemical Communications, 1077.
Takasugi, M., Monde, K., Katsui, N., & Shirata, A. (1987).
Chemistry Letters, 1631.
Takasugi, M., Monde, K., Katsui, N., & Shirata, A. (1988). Bulletin
of the Chemical Society of Japan, 61, 285.
Thorn, G. D., & Ludwig, R. A. (1962). In The dithiocarbamates and
related compounds (p. 169). New York: Elsevier.
Tsuji, J., Zook, M., Jackson, E. P., Cage, D. A., Hammerschmidt,
R., & Somerville, S. (1992). Plant Physiology, 98, 1304.
Tsuji, J., Zook, M., Somerville, S., Last, R. L., & Hammerschmidt,
R. (1993). Physiological and Molecular Plant Pathology, 43, 221.
VanEtten, H. D., Mathews, D. E., & Mathews, P. S. (1989). Annual
Review of Phytopathology, 27, 143.
VanEtten, H. D., Sandrock, R. W., Wasmann, C. C., Soby, S. D.,
McCluskey, K., & Wang, P. (1995). Canadian Journal of Botany,
73(1), S518.
Yamada, F., Kobayashi, K., Shimizu, A., Aoki, N., & Somei, M.
(1993). Heterocycles, 36, 2783.
Zook, M., & Hammerschmidt, R. (1997). Plant Physiology, 113, 463.
Zook, M., Leege, L., Jackson, E. P., & Hammerschmidt, R. (1998).
Phytochemistry, 49, 2287.
Zook, M. (1998). Plant Physiology, 118, 1389.
M.S.C. Pedras et al. / Phytochemistry 53 (2000) 161±176176

Puri®cation, stabilization and characterization of tomato fattyacid hydroperoxide lyase
Catherine N.S.P. Suurmeijera, Manuela Pe rez-Gilaberta, Dirk-Jan van Unena, HarryT.W.M. van der Hijdenb, Gerrit A. Veldinka,*, Johannes F.G. Vliegentharta
aBijvoet Center, Department of Bio-organic Chemistry, Utrecht University, Padualaan 8, NL-3584 CH, Utrecht, The NetherlandsbUnilever Research Vlaardingen, Olivier van Noortlaan 120, NL-3133 AT, Vlaardingen, The Netherlands
Received 31 March 1999; received in revised form 28 July 1999; accepted 16 August 1999
Abstract
Fatty acid hydroperoxide lyase (HPO-lyase) was puri®ed 300-fold from tomatoes. The enzymatic activity appeared to be veryunstable, but addition of Triton X100 and b-mercaptoethanol to the bu�er yielded an active enzyme that could be stored for
several months at ÿ808C. The enzyme was inhibited by desferoxamine mesylate (desferal), 2-methyl-1,2-di-3-pyridyl-1-propanone(metyrapone), nordihydroguaiaretic acid (NDGA), n-propyl gallate and butylated hydroxyanisole, suggesting the involvement offree radicals in the reaction mechanism and the existence of a prosthetic group in the active center. However, no heme groupcould be demonstrated with the methods commonly used to identify heme groups in proteins. Only 13-hydroperoxides from
linoleic acid (13-HPOD) and a-linolenic acid (a-13-HPOT) were cleaved by the tomato enzyme, with a clear preference for thelatter substrate. The pH-optimum was 6.5, and for concentrations lower than 300 mM a typical Michaelis±Menten curve wasfound with a Km of 77 mM. At higher a-13-HPOT concentrations inhibition of the enzyme was observed, which could (at least
in part) be attributed to 2E-hexenal. A curve of the substrate conversion as a function of the enzyme concentration revealed that1 nkat of enzyme activity converts 0.7 mmol a-13-HPOT before inactivation. Headspace analysis showed that tomato HPO-lyaseformed hexanal from 13-HPOD and 3Z-hexenal from a-13-HPOT. A trace of the latter compound was isomerized to 2E-
hexenal. In addition to the aldehydes, 12-oxo-9Z-dodecenoic acid was found by GC/MS analysis. To a small extent,isomerization to 12-oxo-10E-dodecenoic acid occurred. # 2000 Elsevier Science Ltd. All rights reserved.
Keywords: Lycopersicon esculentum; Solanaceae; Tomato; Fatty acid hydroperoxide lyase
1. Introduction
Fatty acid hydroperoxide lyases (HPO-lyases) cleavehydroperoxides of unsaturated fatty acids, such aslinoleic and linolenic acids, into an aldehyde and anoxo-acid. They are part of the lipoxygenase pathwayin plants, which is considered to be the equivalent ofthe arachidonic acid cascade in animals (Gardner,1991). The reaction products are important ¯avours infood products (Hatanaka, 1993).
13-HPO-lyases that speci®cally cleave 13-hydroper-oxy-octadecadienoic acid (13-HPOD) and a-13-hydro-peroxy-octadecatrienoic acid (a-13-HPOT), formhexanal and 3Z-hexenal, respectively, and 12-oxo-9Z-dodecenoic acid. The latter is a precursor of traumatin,a compound involved in wound healing (Gardner,1991; Hsieh, 1994). Hexanal and 3Z-hexenal are ¯a-vour compounds with a ``green'' odour. They can beconverted into other aldehydes and alcohols that alsobelong to the class of green odour notes (Hatanaka,1993; Phillips, Matthew, Reynolds & Fenwick, 1979;Olõ as, Pe rez, Rõ os & Sanz, 1993). The biological func-tion of the aldehydes is unclear but they have beenreported to inhibit germination of soybean seeds(Gardner, Dornbos & Desjardins, 1990). Furthermore,
Phytochemistry 53 (2000) 177±185
0031-9422/00/$ - see front matter # 2000 Elsevier Science Ltd. All rights reserved.
PII: S0031-9422(99 )00504 -X
www.elsevier.com/locate/phytochem
* Corresponding author. Tel.: +31-30-302532661; fax: +31-30-
2540980.
E-mail address: [email protected] (G.A. Veldink).

their application to cotton bolls induced the formationof phytoalexins (Zeringue, 1992), and they have beensuggested to be involved in anti-bacterial responses(Croft, Juttner & Slusarenko, 1993). Recently, Koshio,Takahashi and Ota (1995) showed that 2E-hexenal, de-rived from 3Z-hexenal, plays an important role in thebrowning of male ¯owers of Cryptomerica japonica.
HPO-lyase from green bell pepper fruits was ident-i®ed as a cytochrome P-450 protein (Matsui,Shibutani, Hase & Kajiwara, 1996), which makes theinvolvement of a substrate-derived free radical in thecleavage reaction likely. However, for HPO-lyase fromtea leaves a reaction mechanism was proposed inwhich fatty acid hydroperoxides are heterolyticallycleaved by an amino acid in the active site that acts asa Lewis acid. Oxygen isotope labeling experiments cor-roborate the latter mechanism (Gardner & Plattner,1984; Hatanaka, Kajiwara, Sekiya & Toyota, 1986).Support for a role for heme instead of an acidic aminoacid may be found in the observation that inactivatedheme proteins convert linolenic acid into 2E-hexenal(Coggon, Romanczyk & Sanderson, 1977). Moreover,it was found that hydrophobic radical scavengers pro-tect HPO-lyase from inactivation when it is incubatedwith its substrate. This may indicate the involvementof a substrate-derived free radical species in the inacti-vation of HPO-lyase (Matsui, Kajiwara & Hatanaka,1992).
A few studies on HPO-lyase from tomato fruit haveappeared thus far. The enzyme speci®cally cleaves 13-hydroperoxides (Jadhav, Singh & Salunkhe, 1972;Galliard & Matthew, 1977; Galliard, Matthew, Wright& Fishwick, 1977), although in crude enzyme prep-arations some formation of 2E-nonenal from 9-HPODwas observed (Hatanaka, Kajiwara, Matsui &Kitamura, 1992). Schreier and Lorenz (1982) achieveda 5-fold puri®cation of the enzyme but further enrich-ment was di�cult because the activity was rapidly lost.Although this partially puri®ed HPO-lyase had a pre-ference for a-13-HPOT over 13-HPOD as substrate,the pH optimum of the enzyme (5.5) and the Km (26mM) were determined with 13-HPOD.
In this paper a 300-fold puri®cation of HPO-lyasefrom tomatoes is described, and the enzyme is charac-terized with a-13-HPOT as substrate. Furthermore, the
volatile and non-volatile products of the enzyme wereidenti®ed.
2. Results and discussion
2.1. Enzyme stability and puri®cation
HPO-lyase was partially puri®ed from ``Trust''tomatoes to a speci®c activity of 65 nkat/mg (Table 1).The same procedure was carried out with several othertomato varieties with no signi®cant di�erence in theresulting speci®c activity.
The enzyme activity appeared to be very sensitive topH: when the crude extract was stored at 48C at pH5.5, 50% of the activity was lost within 1 day, whereasat pH 8.5, the activity decreased by only 40% in 12days. Upon inclusion of 0.1% (w/v) Triton X-100 and0.01 M b-mercaptoethanol in the bu�er (pH 8.5), thecrude extract showed no activity loss over 20 days sto-rage. However, after DEAE-chromatography HPO-lyase was inactivated within 24 h at 48C. Dialysis ofthe crude extract against bu�er A also caused adecrease in activity, although less dramatic. Since theenzyme precipitated together with pectins upon ad-dition of calcium chloride to the ®ltrate, it could bethat calcium ions or the increased viscosity caused bythe high carbohydrate concentration were additionalstabilizing factors in the crude extract. However, theaddition of divalent cations after dialysis in concen-trations between 10 mM and 1 mM, did not protectthe enzyme activity at 48C. To test the in¯uence of vis-cosity, sucrose (0.4 M) or glycerol (10% v/v) wasadded to the DEAE-pool. Because the enzyme wasstill inactivated within 1 day when stored at 48C, aninteraction more speci®c than viscosity seemed to bethe stabilizing factor in the crude extract. At ÿ208C,the residual activity is higher in the samples withsucrose or glycerol than without it. This can probablybe explained by the in¯uence of these compounds onfreezing and thawing. At ÿ808C, the enzyme activitywas best retained, also in the absence of the additives.Therefore, it was decided to store the enzyme withoutadditives at ÿ808C after DEAE-chromatography.Under these storage conditions, the enzyme activity
Table 1
Puri®cation of HPO-lyas from tomato fruits (996 g)
Fraction Activity (nkat/ml) Total activity (mkat) Speci®c activity (nkat/mg) Recovery Puri®cation factor
Filtrate 4.8 12.1 0.2 100% 1
Crude extract 8.4 5.4 7.5 45% 35
Concentrate 16.4 3.9 12.5 32% 58
G-100 pool 12.0 1.9 65.1 16% 126
DEAE pool 21.7 0.9 65.1 8% 300
C.N.S.P. Suurmeijer et al. / Phytochemistry 53 (2000) 177±185178
remained stable for several months. A minor loss ofactivity �210%) occurred, due to freeze-thawing.
Although gel electrophoresis still showed threebands after silver staining, at 65, 47 and 35 kDa, thepurity of the enzyme signi®cantly improved by thisprocedure.
Moreover, the enzyme preparation showed no ac-tivity in lipoxygenase assays. Therefore, the methodpresented here yields a highly puri®ed enzyme prep-aration that can be used to study HPO-lyase in moredetail.
2.2. Prosthetic group
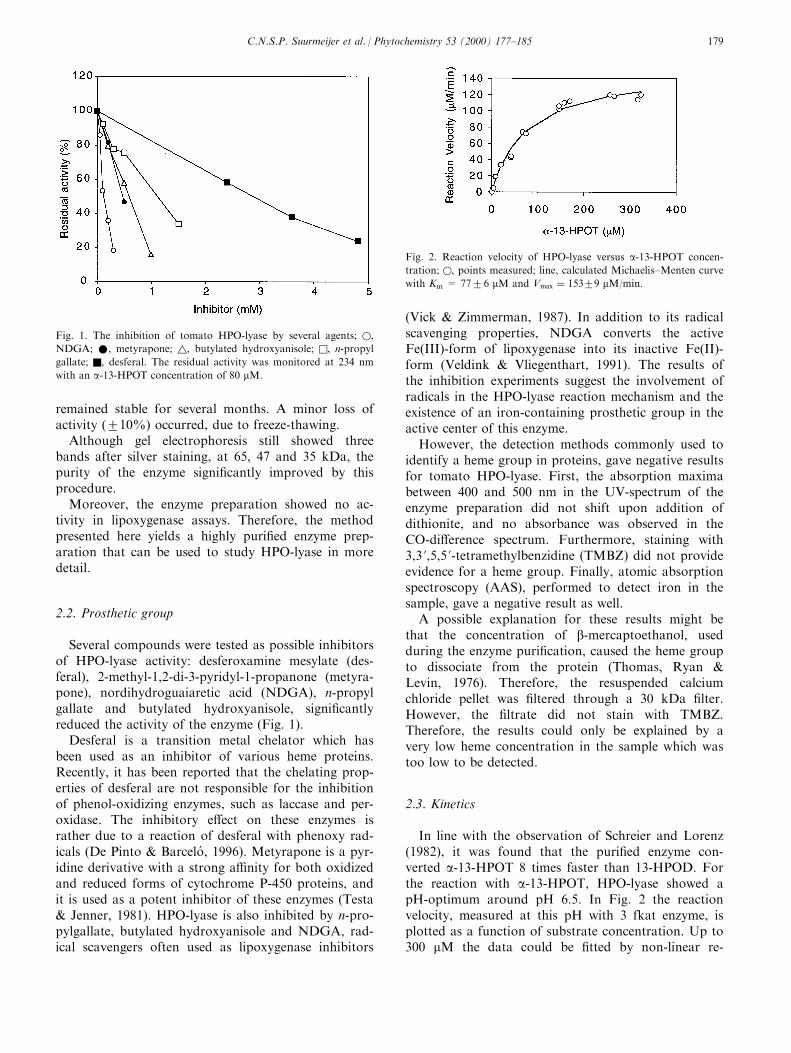
Several compounds were tested as possible inhibitorsof HPO-lyase activity: desferoxamine mesylate (des-feral), 2-methyl-1,2-di-3-pyridyl-1-propanone (metyra-pone), nordihydroguaiaretic acid (NDGA), n-propylgallate and butylated hydroxyanisole, signi®cantlyreduced the activity of the enzyme (Fig. 1).
Desferal is a transition metal chelator which hasbeen used as an inhibitor of various heme proteins.Recently, it has been reported that the chelating prop-erties of desferal are not responsible for the inhibitionof phenol-oxidizing enzymes, such as laccase and per-oxidase. The inhibitory e�ect on these enzymes israther due to a reaction of desferal with phenoxy rad-icals (De Pinto & Barcelo , 1996). Metyrapone is a pyr-idine derivative with a strong a�nity for both oxidizedand reduced forms of cytochrome P-450 proteins, andit is used as a potent inhibitor of these enzymes (Testa& Jenner, 1981). HPO-lyase is also inhibited by n-pro-pylgallate, butylated hydroxyanisole and NDGA, rad-ical scavengers often used as lipoxygenase inhibitors
(Vick & Zimmerman, 1987). In addition to its radicalscavenging properties, NDGA converts the activeFe(III)-form of lipoxygenase into its inactive Fe(II)-form (Veldink & Vliegenthart, 1991). The results ofthe inhibition experiments suggest the involvement ofradicals in the HPO-lyase reaction mechanism and theexistence of an iron-containing prosthetic group in theactive center of this enzyme.
However, the detection methods commonly used toidentify a heme group in proteins, gave negative resultsfor tomato HPO-lyase. First, the absorption maximabetween 400 and 500 nm in the UV-spectrum of theenzyme preparation did not shift upon addition ofdithionite, and no absorbance was observed in theCO-di�erence spectrum. Furthermore, staining with3,3 ',5,5 '-tetramethylbenzidine (TMBZ) did not provideevidence for a heme group. Finally, atomic absorptionspectroscopy (AAS), performed to detect iron in thesample, gave a negative result as well.
A possible explanation for these results might bethat the concentration of b-mercaptoethanol, usedduring the enzyme puri®cation, caused the heme groupto dissociate from the protein (Thomas, Ryan &Levin, 1976). Therefore, the resuspended calciumchloride pellet was ®ltered through a 30 kDa ®lter.However, the ®ltrate did not stain with TMBZ.Therefore, the results could only be explained by avery low heme concentration in the sample which wastoo low to be detected.
2.3. Kinetics
In line with the observation of Schreier and Lorenz(1982), it was found that the puri®ed enzyme con-verted a-13-HPOT 8 times faster than 13-HPOD. Forthe reaction with a-13-HPOT, HPO-lyase showed apH-optimum around pH 6.5. In Fig. 2 the reactionvelocity, measured at this pH with 3 fkat enzyme, isplotted as a function of substrate concentration. Up to300 mM the data could be ®tted by non-linear re-
Fig. 1. The inhibition of tomato HPO-lyase by several agents; w,
NDGA; *, metyrapone; r, butylated hydroxyanisole; q, n-propyl
gallate; Q, desferal. The residual activity was monitored at 234 nm
with an a-13-HPOT concentration of 80 mM.
Fig. 2. Reaction velocity of HPO-lyase versus a-13-HPOT concen-
tration; w, points measured; line, calculated Michaelis±Menten curve
with Km = 7726 mM and Vmax � 15329 mM/min.
C.N.S.P. Suurmeijer et al. / Phytochemistry 53 (2000) 177±185 179

gression to the standard Michaelis±Menten equation,yielding a Km of 77 mM (26 mM) and a Vmax of 153mM/min (29 mM/min), however, at higher concen-trations the reaction rate decreased. Both the pH-opti-mum and the Km di�er signi®cantly from the valuesreported for tomato HPO-lyase with 13-HPOD as sub-strate (Schreier & Lorenz, 1982). This may either beexplained by the use of a-13-HPOT as substrateinstead of 13-HPOD, or by the di�erences in use of
detergents. In the experiments described here theamount of detergent was constant during the assaywhile it increases with substrate concentration with themethod of Schreier and Lorenz (1982). For tomatolipoxygenase, it was found that this can lead to di�er-ent progress curves (Suurmeijer, Pe rez-Gilabert, vander Hijden, Veldink & Vliegenthart, 1998).
The decline in reaction rate for concentrationshigher than 300 mM is possibly caused by product inhi-bition. This is in agreement with the observation thatthe reaction velocity of a-13-HPOT cleavage increasedwhen it was measured indirectly, by converting thealdehydes formed immediately into the correspondingalcohols (Vick, 1991). Furthermore, it was found thatthe presence of 400 mM 2E-hexenal in the direct spec-trophotometric assay lowered the reaction rate to66%, while 1 mM 2E-hexenal inhibited HPO-lyasecompletely. At 0.4 and 1 mM 3Z-hexenal the enzymewas not a�ected. A partial inhibition was observed at2 mM 3Z-hexenal, but this was probably an e�ect ofthe partial 3Z : 2E-isomerization of the compound.Hexanal concentrations of 400 mM and 4 mM did notin¯uence the reaction velocity. From this experiment itmay be concluded that the inhibiting e�ect is causedby 2E-hexenal. a, b-Unsaturated aldehydes are knownto react with proteins and particularly sulfhydryl
Fig. 3. Substrate conversion as a function of the amount of HPO-
lyase, measured spectrophotometrically. The reaction was allowed to
proceed until no further decrease in absorbance at 234 nm was
observed. The percent conversion was calculated from the decrease
in absorbance, assuming e � 25,000 for a-13-HPOT.
Fig. 4. Headspace analysis of the incubation with 100 mM a-13-HPOT at pH 6.5, volatiles were, immediately after collection in the headspace,
desorbed at 2008C in the injection port of the GC/MS. Panel A: incubation, panel B: control without enzyme, and panel C: control without sub-
strate. P1 was identi®ed as 3Z-hexenal, P2 as 2E-hexenal.
C.N.S.P. Suurmeijer et al. / Phytochemistry 53 (2000) 177±185180

enzymes are inactivated by this process (Schauenstein,Esterbauer & Zollner, 1977). Therefore, 12-oxo-10E-dodecenoic acid, one of the other products of 13-HPO-lyases could have an inhibiting e�ect as well.These results are in agreement with the ®ndingreported by Matsui, Kajiwara and Hatanaka (1992)that HPO-lyase from tea has a sulfhydryl group in itsactive centre.
The conversion of a-13-HPOT was determined spec-trophotometrically as a function of the enzyme concen-tration (see Fig. 3). When less than 0.08 nkat ofenzyme was added to the reaction mixture containing200 mM a-13-HPOT, the substrate was not completelyconsumed, suggesting that the enzyme is irreversiblyinactivated. Because the conversion was linearly pro-portional to the amount of enzyme �r2 � 0:993� itcould be derived that 1 nkat of enzyme can convertaround 0.7 mmol of a-13-HPOT before it is inacti-vated.
2.4. Product identi®cation
The volatile products formed by HPO-lyase, wereidenti®ed by headspace analysis with GC/MS. Theenzyme was incubated with 9- or 13-hydroperoxides oflinoleic, a-linolenic and g-linolenic acid respectively.Only 13-HPOD and a-13-HPOT yielded aldehydes,re¯ecting cleavage by the enzyme. The C9-aldehydesthat Hatanaka et al. (1992) found in incubations oflinoleic acid and 9-HPOD with crude tomato extractare thus formed by another enzyme. Two peaks appearin the incubation with a-13-HPOT, that are absent inthe controls in which either enzyme or substrate is leftout (see Fig. 4). The retention time and mass spectrumof the major product, P1, correspond to those of thereference aldehyde 3Z-hexenal, EIMS, 70 eV, m/z (rel.int.): 98 [M]+ (10), 97 [MÿH]+ (7), 83 [MÿCH3]
+
(23), 69 [MÿCH2CH3]+ (58), 55 [MÿCH2CH2CH3]
+
(44), 41 [MÿCH2CH2CH2CH3]+ (100), 39 (38). The
Fig. 5. GC/MS-chromatogram of the non-volatile products from a-13-HPOT. After extraction, the compounds were reduced, methylated and
silylated before injection. Panel A: incubation, panel B: control without enzyme, and panel C: control without substrate. P3 was identi®ed as 12-
oxo-9Z-dodecenoic acid and P4 as 12-oxo-10E-dodecenoic acid.
C.N.S.P. Suurmeijer et al. / Phytochemistry 53 (2000) 177±185 181
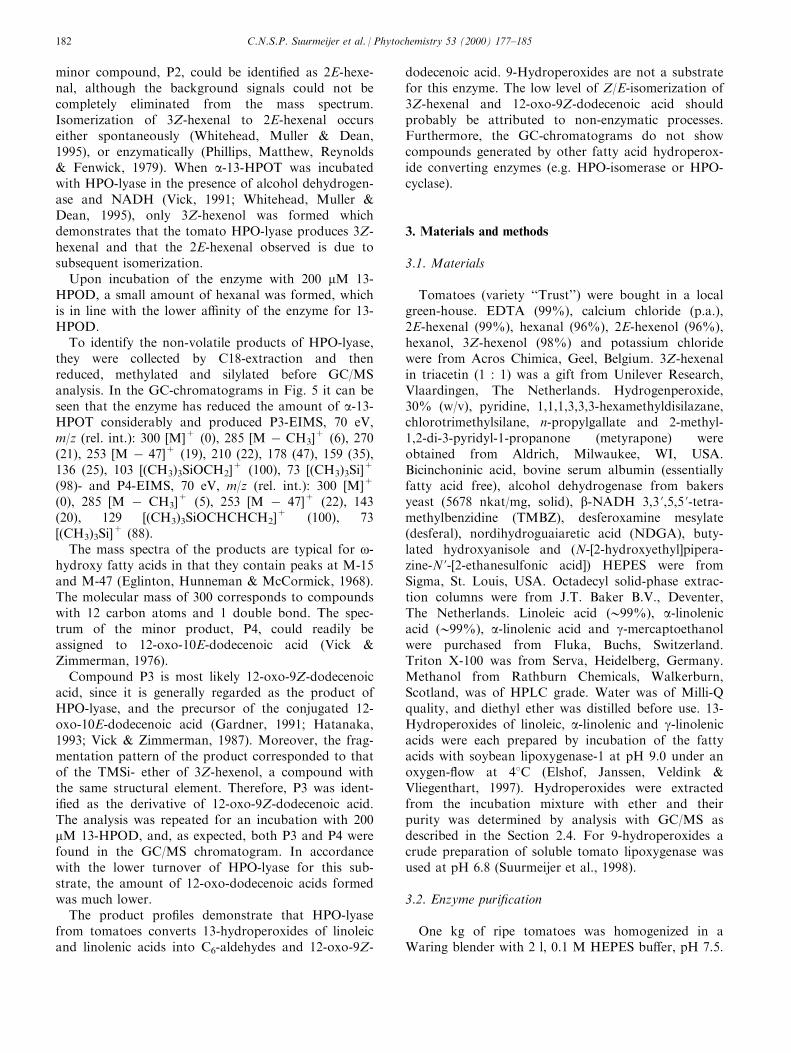
minor compound, P2, could be identi®ed as 2E-hexe-nal, although the background signals could not becompletely eliminated from the mass spectrum.Isomerization of 3Z-hexenal to 2E-hexenal occurseither spontaneously (Whitehead, Muller & Dean,1995), or enzymatically (Phillips, Matthew, Reynolds& Fenwick, 1979). When a-13-HPOT was incubatedwith HPO-lyase in the presence of alcohol dehydrogen-ase and NADH (Vick, 1991; Whitehead, Muller &Dean, 1995), only 3Z-hexenol was formed whichdemonstrates that the tomato HPO-lyase produces 3Z-hexenal and that the 2E-hexenal observed is due tosubsequent isomerization.
Upon incubation of the enzyme with 200 mM 13-HPOD, a small amount of hexanal was formed, whichis in line with the lower a�nity of the enzyme for 13-HPOD.
To identify the non-volatile products of HPO-lyase,they were collected by C18-extraction and thenreduced, methylated and silylated before GC/MSanalysis. In the GC-chromatograms in Fig. 5 it can beseen that the enzyme has reduced the amount of a-13-HPOT considerably and produced P3-EIMS, 70 eV,m/z (rel. int.): 300 [M]+ (0), 285 [M ÿ CH3]
+ (6), 270(21), 253 [M ÿ 47]+ (19), 210 (22), 178 (47), 159 (35),136 (25), 103 [(CH3)3SiOCH2]
+ (100), 73 [(CH3)3Si]+
(98)- and P4-EIMS, 70 eV, m/z (rel. int.): 300 [M]+
(0), 285 [M ÿ CH3]+ (5), 253 [M ÿ 47]+ (22), 143
(20), 129 [(CH3)3SiOCHCHCH2]+ (100), 73
[(CH3)3Si]+ (88).
The mass spectra of the products are typical for o-hydroxy fatty acids in that they contain peaks at M-15and M-47 (Eglinton, Hunneman & McCormick, 1968).The molecular mass of 300 corresponds to compoundswith 12 carbon atoms and 1 double bond. The spec-trum of the minor product, P4, could readily beassigned to 12-oxo-10E-dodecenoic acid (Vick &Zimmerman, 1976).
Compound P3 is most likely 12-oxo-9Z-dodecenoicacid, since it is generally regarded as the product ofHPO-lyase, and the precursor of the conjugated 12-oxo-10E-dodecenoic acid (Gardner, 1991; Hatanaka,1993; Vick & Zimmerman, 1987). Moreover, the frag-mentation pattern of the product corresponded to thatof the TMSi- ether of 3Z-hexenol, a compound withthe same structural element. Therefore, P3 was ident-i®ed as the derivative of 12-oxo-9Z-dodecenoic acid.The analysis was repeated for an incubation with 200mM 13-HPOD, and, as expected, both P3 and P4 werefound in the GC/MS chromatogram. In accordancewith the lower turnover of HPO-lyase for this sub-strate, the amount of 12-oxo-dodecenoic acids formedwas much lower.
The product pro®les demonstrate that HPO-lyasefrom tomatoes converts 13-hydroperoxides of linoleicand linolenic acids into C6-aldehydes and 12-oxo-9Z-
dodecenoic acid. 9-Hydroperoxides are not a substratefor this enzyme. The low level of Z/E-isomerization of3Z-hexenal and 12-oxo-9Z-dodecenoic acid shouldprobably be attributed to non-enzymatic processes.Furthermore, the GC-chromatograms do not showcompounds generated by other fatty acid hydroperox-ide converting enzymes (e.g. HPO-isomerase or HPO-cyclase).
3. Materials and methods
3.1. Materials
Tomatoes (variety ``Trust'') were bought in a localgreen-house. EDTA (99%), calcium chloride (p.a.),2E-hexenal (99%), hexanal (96%), 2E-hexenol (96%),hexanol, 3Z-hexenol (98%) and potassium chloridewere from Acros Chimica, Geel, Belgium. 3Z-hexenalin triacetin (1 : 1) was a gift from Unilever Research,Vlaardingen, The Netherlands. Hydrogenperoxide,30% (w/v), pyridine, 1,1,1,3,3,3-hexamethyldisilazane,chlorotrimethylsilane, n-propylgallate and 2-methyl-1,2-di-3-pyridyl-1-propanone (metyrapone) wereobtained from Aldrich, Milwaukee, WI, USA.Bicinchoninic acid, bovine serum albumin (essentiallyfatty acid free), alcohol dehydrogenase from bakersyeast (5678 nkat/mg, solid), b-NADH 3,3 ',5,5 '-tetra-methylbenzidine (TMBZ), desferoxamine mesylate(desferal), nordihydroguaiaretic acid (NDGA), buty-lated hydroxyanisole and (N-[2-hydroxyethyl]pipera-zine-N '-[2-ethanesulfonic acid]) HEPES were fromSigma, St. Louis, USA. Octadecyl solid-phase extrac-tion columns were from J.T. Baker B.V., Deventer,The Netherlands. Linoleic acid (099%), a-linolenicacid (099%), a-linolenic acid and g-mercaptoethanolwere purchased from Fluka, Buchs, Switzerland.Triton X-100 was from Serva, Heidelberg, Germany.Methanol from Rathburn Chemicals, Walkerburn,Scotland, was of HPLC grade. Water was of Milli-Qquality, and diethyl ether was distilled before use. 13-Hydroperoxides of linoleic, a-linolenic and g-linolenicacids were each prepared by incubation of the fattyacids with soybean lipoxygenase-1 at pH 9.0 under anoxygen-¯ow at 48C (Elshof, Janssen, Veldink &Vliegenthart, 1997). Hydroperoxides were extractedfrom the incubation mixture with ether and theirpurity was determined by analysis with GC/MS asdescribed in the Section 2.4. For 9-hydroperoxides acrude preparation of soluble tomato lipoxygenase wasused at pH 6.8 (Suurmeijer et al., 1998).
3.2. Enzyme puri®cation
One kg of ripe tomatoes was homogenized in aWaring blender with 2 l, 0.1 M HEPES bu�er, pH 7.5.
C.N.S.P. Suurmeijer et al. / Phytochemistry 53 (2000) 177±185182

The homogenate was ®ltered through four layers ofcheesecloth and to the ®ltrate 2% (v/v) of a 1 MCaCl2-solution was added. After stirring for 2 h thesuspension was centrifuged at 30,000 g for 20 min andthe pellet was resuspended in bu�er A (0.02 M Tris/HCl bu�er, pH 8.5, containing 0.1% (w/v) Triton X-100 and 0.01 M b-mercaptoethanol). Maximum solu-bilization of HPO-lyase activity was achieved with 4ml bu�er A per g pellet. The suspension was clari®edby centrifugation at 15,000 g for 30 min and the HPO-lyase solution (further referred to as crude extract) wasconcentrated by ultra®ltration (PM30-membrane,Amicon). The concentrate was puri®ed over a G-100-Sephadex column (35 cm � 5.0 cm i.d.), eluted withbu�er A (0.5 ml/min), and then the active fractionswere combined and loaded onto a DEAE-Sephadex(A-50) column (30 cm � 2.5 cm i.d.). Activity waseluted at 0.75 ml/min with a gradient of 0±300 mMKCl in bu�er A. The fractions were assayed immedi-ately after elution and HPO-lyase was stored atÿ808C. During the entire procedure the protein waskept at 48C or on ice.
3.3. Heme analyses
The CO-di�erence spectrum was recorded asdescribed by Rutten et al. (1987). A lyase sample wasdiluted to a concentration of 5.0 nkat/ml with 0.1 Mphosphate bu�er, pH 7.4, containing 1 mM EDTAand 20% (v/v) glycerol. The sample was bubbled withCO for 1 min at a ¯ow of 5 bubbles/s and then dividedover sample and reference cuvette. Dithionite (10 ml,1.25 M) was added to the sample cuvette and thedi�erence spectrum was recorded after 7 min on aShimadzu UV-160 A double beam spectrophotometer.As a positive reference a cytochrome P-450 from ratliver was used.
Heme staining was performed by a procedureadapted from Thomas et al. (1976). For this purposethree volumes of a 6.3 mM TMBZ-solution in metha-nol were mixed with seven volumes 0.25 M sodiumacetate bu�er, pH 5.0. One ml of this freshly preparedreagent was added to 50 ml protein solution and 35 ml0.3% H2O2 was added. Presence of heme was indi-cated in the reference proteins hemoglobin and myo-globin by appearance of a blue colour after 1 minwhich further intensi®ed during 30 min.
3.4. HPO-lyase activity assay
During the puri®cation, activities were assessed rou-tinely by the indirect assay described by Vick (1991),in order to distinguish between HPO-lyase and otherhydroperoxide-converting enzymes. The reaction wasstarted by adding 20 ml 5 mM a-13-HPOT to a mix-ture of 100 mM NADH, 835 nkat alcohol dehydrogen-
ase, 100 ml enzyme sample and 50 mM phosphatebu�er, pH 6.5, to a total volume of 980 ml. Thedecrease of NADH during the conversion of aldehydesto alcohols was followed at 340 nm as a measure ofthe rate of aldehyde formation.
Protein concentrations were measured with thebicinchoninic acid method (Smith et al., 1985).Because b-mercaptoethanol disturbs this assay, it wasremoved by lyophilizing the samples and redissolvingthem in water.
For the kinetic measurements HPO-lyase activitywas determined spectrophotometrically by measuringthe decrease in absorbance at 234 nm due to the clea-vage of a-13-HPOT. For ®nal substrate concentrationslower than 40 mM, 20 ml of an a-13-HPOT solution inmethanol was mixed with 880 ml, 50 mM phosphatebu�er, pH 6.5 and 100 ml of tomato HPO-lyase in a1 cm cuvette. Higher substrate concentrations (up to350 mM) were measured in a 2 mm cuvette. Because ofthe smaller volume of this cuvette, the reaction mixturewas halved leaving the ratio methanol/bu�er/enzymeunchanged.
For measurements that were done at a constant sub-strate concentration, 200 mM a-13-HPOT was used,with the exception of the inhibition measurements withcompounds that also absorb at 234 nm. The opticallimitations of the spectrophotometer (HP 8452A,diode array) required a substrate concentration R 100mM when measuring the e�ect of 2E-hexenal, and R80mM during the experiments with desferal, metyrapone,NDGA, n-propyl gallate and butylated hydroxyani-sole.
3.5. Product identi®cation
For the identi®cation of volatiles 7.5 ml of a 100mM solution of a-13-HPOT or 13-HPOD in 50 mMphosphate bu�er, pH 6.5, was prepared. Immediatelyafter starting the reaction by adding 500 ml of HPO-lyase (4 nkat), the reaction vessel (20 ml) was closedwith a septum, and a solid phase micro extraction(SPME) ®ber, coated with 100 mm polydimethylsilox-ane (Supelco Inc., Bellefonte, USA), was placed abovethe reaction mixture. Volatiles were collected in theheadspace for 30 min, whereupon they were desorbedfrom the ®ber at 2008C for 1 min in the injection portof a GC/MS (Fisons GC 8000 series and FisonsInstruments MD 800 MassLab spectrometer). Thetemperature program was started at the same time asthe desorption: it was kept at 358C for 2 min and thenraised at 108C/min to 2008C. The column used was anHP-Innowax, (0.25 mm ®lm thickness; 30 m � 0.32 mmi.d.; Hewlett-Packard). Eluted compounds were com-pared to reference aldehydes or alcohols which werecollected on the SPME ®ber (1 ml in 8 ml bu�er) andanalyzed with the same method.
C.N.S.P. Suurmeijer et al. / Phytochemistry 53 (2000) 177±185 183
Non-volatiles were analyzed from identical incu-bations which were now stopped after 30 min by acidi-fying with HCl to pH 4.0. The products were extractedwith an octadecyl solid-phase extraction column,rinsed with water to remove salts and then eluted withmethanol to obtain the products. The solvent wasevaporated to remove traces of water. The residue wasredissolved in methanol and the compounds werereduced by addition of an excess of NaBH4 at 08C.After 30 min, 50 ml water was added, the reactionmixture was acidi®ed until a precipitate appeared andthe reduced products were extracted with an octadecylsolid-phase extraction column as described above. Thesolvent was evaporated and the fatty acids were esteri-®ed with ethereal diazomethane. After 30 min, etherand diazomethane were removed with a nitrogen ¯owand replaced by a few drops of silylating reagent (pyri-dine/1,1,1,3,3,3-hexamethyldisilazane/chlorotrimethylsi-lane 5:1:1 v/v/v).
GC/MS analysis of the compounds was performedon the same apparatus as the volatiles, for this purposeequipped with a DB-1 column (0.25 mm ®lm thickness;30 m � 0.32 mm i.d.; J and W Scienti®c) using a tem-perature program from 1408C (2 min), rising at 68C/min to 2808C (2 min). All mass spectra were recordedunder electron impact with an ionization energy of 70eV.
Acknowledgements
This work was supported by Unilever N.V. and apostdoctoral grant from the European Union toManuela Pe rez-Gilabert: No FAIR-CT 96-5010. Theauthors thank G. van Zadelho� for his support withthe headspace analyses, I. van Holsteijn for her helpwith recording the CO-di�erence spectrum and R. vanVeen for conducting the AAS-measurements.
References
Coggon, P., Romanczyk, L. J., & Sanderson, G. W. (1977).
Extraction, puri®cation, and partial characterization of a tea
metalloprotein and its role in the formation of black tea aroma
constituents. Journal of Agricultural and Food Chemistry, 25, 278±
283.
Croft, K. P. C., Juttner, F., & Slusarenko, A. J. (1993). Volatile pro-
ducts of the lipoxygenase pathway evolved from Phaseolus vul-
garis (L) leaves inoculated with Pseudomonas syringae pv-
Phaseolicola. Plant Physiology, 101, 13±24.
De Pinto, M. C., & Barcelo , A. R. (1996). Inhibition of both peroxi-
dase and laccase by desferal (desferrioxamine mesylate).
Phytochemistry, 42, 283.
Eglinton, G., Hunneman, D. H., & McCormick, A. (1968). Gas
chromatographic-mass spectrometric studies of long chain
hydroxy acids. Organic Mass Spectrometry, 1, 593±611.
Elshof, M. B. W., Janssen, M., Veldink, G. A., & Vliegenthart, J. F.
G. (1997). Biocatalytic large-scale production of 13(S )-hydroper-
oxy-9(Z ),11(E )-octadecadienoic acid from hydrolysed sa�ower
oil by a crude soybean ¯our extract as lipoxygenase source.
Recueil des Travaux Chimiques des Pays-Bas, 115, 499±504.
Galliard, T., & Matthew, J. A. (1977). Lipoxygenase-mediated clea-
vage of fatty acids to carbonyl fragments in tomato fruits.
Phytochemistry, 16, 339±343.
Galliard, T., Matthew, J. A., Wright, A. J., & Fishwick, M. J.
(1977). The enzymic breakdown of lipids to volatile and non-vol-
atile carbonyl fragments in disrupted tomato fruits. Journal of
Science of Food and Agriculture, 28, 863±868.
Gardner, H. W. (1991). Recent investigations into the lipoxygenase
pathway of plants. Biochimica et Biophysica Acta, 1084, 221±239.
Gardner, H. W., & Plattner, R. D. (1984). Linoleate hydroperoxides
are cleaved heterolytically into aldehydes by a Lewis acid in apro-
tic solvent. Lipids, 19, 294±299.
Gardner, H. W., Dornbos, D. L., & Desjardins, A. E. (1990).
Hexanal, trans-2-hexenal, and trans-2-nonenal inhibit soybean,
Glycine-max, seed germination. Journal of Agricultural and Food
Chemistry, 38, 1316±1320.
Hatanaka, A. (1993). The biogeneration of green odour by green
leaves. Phytochemistry, 34, 1201±1218.
Hatanaka, A., Kajiwara, T., Matsui, K., & Kitamura, A. (1992).
Expression of lipoxygenase and hydroperoxide lyase activities in
tomato fruits. Zeitschrift fuÈr Naturforschung, 47c, 369±374.
Hatanaka, A., Kajiwara, T., Sekiya, J., & Toyota, H. (1986).
Oxygen incorporation in cleavage of 18O-labeled 13-hydroperoxy-
linoleyl alcohol into 12-hydroxy-3(Z )-dodecenal in tea chloro-
plasts. Zeitschrift fuÈr Naturforschung, 41C, 359±362.
Hsieh, R. J. (1994). Contribution of lipoxygenase pathway to food
¯avors. In C.-T. Ho, & T. G. Hartman, Lipids in food ¯avors
(558 ed) (pp. 30±48). Washington, DC: American Chemical
Society.
Jadhav, S., Singh, B., & Salunkhe, D. K. (1972). Metabolism of
unsaturated fatty acids in tomato fruit: linoleic and linolenic acid
as precursors of hexanal. Plant Cell Physiology, 13, 449±459.
Koshio, K., Takahashi, H., & Ota, Y. (1995). Induction of browning
of male ¯owers of Cryptomeria japonica by treatment with fatty
acids: mechanism and the role of trans-2-hexenal. Plant Cell
Physiology, 36, 1511±1517.
Matsui, K., Kajiwara, T., & Hatanaka, A. (1992). Inactivation of tea
leaf hydroperoxide lyase by fatty acid hydroperoxide. Journal of
Agricultural and Food Chemistry, 40, 175±178.
Matsui, K., Shibutani, M., Hase, T., & Kajiwara, T. (1996). Bell
pepper fruit fatty acid hydroperoxide lyase is a cytochrome P450
(CYP74B). FEBS Letters, 394, 21±24.
Olõ as, J. M., Pe rez, A. G., Rõ os, J. J., & Sanz, L. C. (1993). Aroma
of virgin olive oil-biogenesis of the green odor notes. Journal of
Agricultural and Food Chemistry, 41, 2368±2373.
Phillips, D. R., Matthew, J. A., Reynolds, J., & Fenwick, G. R.
(1979). Partial puri®cation and properties of a cis-3:trans-
2-enal isomerase from cucumber fruit. Phytochemistry, 18, 401±
404.
Rutten, A. A. J. J. L., Falke, H. E., Catsburg, J. F., Topp, R.,
Blaauboer, B. J., van Holsteijn, I., Doorn, L., & van Leeuwen,
R. F. X. (1987). Interlaboratory comparison of total cytochrome
P-450 and protein determinations in rat liver chromosomes.
Archives of Toxicology, 61, 27±33.
Schauenstein, E., Esterbauer, H., & Zollner, H. (1977). a,b-Unsaturated aldehydes. In J. R. Lagnado, Aldehydes in biological
systems: their natural occurrence and biological activities (pp. 25±
102). London: Pion.
Schreier, P., & Lorenz, G. (1982). Separation, partial puri®cation
and characterization of a fatty acid hydroperoxide cleaving
enzyme from apple and tomato fruits. Zeitschrift fuÈr
Naturforschung, 37c, 165±173.
Smith, P. K., Krohn, R. I., Hermanson, G. T., Mallia, A. K.,
C.N.S.P. Suurmeijer et al. / Phytochemistry 53 (2000) 177±185184

Gartner, F. H., Provenzano, M. D., Fujimoto, E. K., Goeke, N.
M., Olson, B. J., & Klenk, D. C. (1985). Measurement of protein
using bicinchoninic acid. Analytical Biochemistry, 150, 76.
Suurmeijer, C. N. S. P., Pe rez-Gilabert, M., van der Hijden, H. T.
W. M., Veldink, G. A., & Vliegenthart, J. F. G. (1998).
Puri®cation, product characterization and kinetic properties of
soluble tomato lipoxygenase. Plant Physiology and Biochemistry,
36, 657±663.
Testa, B., & Jenner, P. (1981). Inhibitors of cytochrome P-450s
and their mechanism of action. Drug Metabolism Reviews, 12,
1±117.
Thomas, P. E., Ryan, D., & Levin, W. (1976). An improved staining
procedure for the detection of the peroxidase activity of cyto-
chrome P-450 on sodium dodecyl sulfate polyacrylamide gels.
Analytical Biochemistry, 75, 168±176.
Veldink, G. A., & Vliegenthart, J. F. G. (1989). Substrates and pro-
ducts of lipoxygenase catalysis. In Atta-ur-Rahman, Studies in
natural products chemistry, vol. 9 (pp. 559±589). Amsterdam:
Elsevier Science Publishers BV.
Vick, B. A., & Zimmerman, D. C. (1987). Oxidative systems for
modi®cation of fatty acids: the lipoxygenase pathway. In P. K.
Stumpf, The biochemistry of plants Ð A comprehensive treatise,
vol. 9 (pp. 53±90). New York: Academic Press.
Vick, B. A. (1991). A spectrophotometric assay for hydroperoxide
lyase. Lipids, 26, 315±320.
Vick, B. A., & Zimmerman, D. C. (1976). Lipoxygenase and hydro-
peroxide lyase in germinating watermelon seedlings. Plant
Physiology, 57, 780±788.
Whitehead, I. M., Muller, B. L., & Dean, C. (1995). Industrial use
of soybean lipoxygenase for the production of natural green note
¯avor compounds. Cereal Foods World, 40, 193±197.
Zeringue, H. J. (1992). E�ects of C6±C10 alkenals and alkanals on
eliciting a defence response in the developing cotton boll.
Phytochemistry, 31, 2305±2308.
C.N.S.P. Suurmeijer et al. / Phytochemistry 53 (2000) 177±185 185

Hydroquinone:O-glucosyltransferase from cultivated Rauvol®acells: enrichment and partial amino acid sequences
Joachim Arend, Heribert Warzecha, Joachim StoÈ ckigt*
Department of Pharmaceutical Biology, Institute of Pharmacy, Staudinger Weg 5, Johannes Gutenberg-University, 55099 Mainz, Germany
Received 26 July 1999; received in revised form 4 October 1999; accepted 6 October 1999
Abstract
Plant cell suspension cultures of Rauvol®a are able to produce a high amount of arbutin by glucosylation of exogenouslyadded hydroquinone. A four step puri®cation procedure using anion exchange, hydrophobic interaction, hydroxyapatite-chromatography and chromatofocusing delivered in a yield of 0.5%, an approximately 390 fold enrichment of the involved
glucosyltransferase. SDS-PAGE showed a Mr for the enzyme of 52 kDa. Proteolysis of the pure enzyme with endoproteinaseLysC revealed six peptide fragments with 9±23 amino acids which were sequenced. Sequence alignment of the six peptidesshowed high homologies to glycosyltransferases from other higher plants. # 2000 Elsevier Science Ltd. All rights reserved.
Keywords: Rauvol®a serpentina cell culture; Apocynaceae; Hydroquinone; Uridine-diphosphate-glucose transferase; Arbutin; Partial puri®cation;
Partial amino acid sequence
1. Introduction
The O-û-D-glucoside of hydroquinone (HQ), alsonamed arbutin, is a widely distributed compound invarious higher plants. Especially in species such asVaccinium vitis-idaea (L.) and Arctostaphylos uva-ursi(L.) SPRENG of the plant family Ericaceae (Steglich,Fugmann & Lang-Fugmann, 1997) and in the plantBergenia crassifolia (L.) FRITSCH of the familySaxifragaceae, arbutin is accumulated in leaves in sig-ni®cant amounts of up to 20% of the dry weight(Tschitschibabin, Kirssanow & Rudenko, 1930).
From the pharmacological point of view, arbutinhas attracted much interest for two therapeutical appli-cations. As it exhibits an antibacterial e�ect, the leavesof A. uva-ursi are used as tea preparations for thetreatment of infections of the urogenital tract (Weiss &Fintelmann, 1997). Furthermore, arbutin is known tobe an inhibitor of the biosynthesis of the human pig-
ment melanin (Akiu, Suzuki, Fujinuma, Asahara &Fukada, 1988) and is used by the cosmetic company,Shiseido, as a lightener in cosmetics. Because of thisapplication various attempts have been made in thepast to generate arbutin in a biotechnological wayinstead of using a chemical synthesis. One of the mostpromising procedures for biological arbutin productionwas the biotransformation in plant cell suspension cul-tures of exogenously added aglycone hydroquinonewith resultant detoxi®cation by glucosylation. Earlierexperiments with cell systems clearly indicated suchbiotransformations but the yields were relatively low(Suzuki, Yoshioka, Tabata & Fujita, 1987; Mizukami,Hirano & Ohashi, 1987). However, cultivated cells ofthe alkaloid-delivering Apocynaceous speciesCatharanthus roseus (L.) G. DON were proven to beable to produce up to 9 g of pure arbutin per litre cellsuspension (Inomata, Yokoyama, Seto & Yanagi,1991) which was the highest production of a naturalproduct by cultivated plant cells at that time.Commercial production of the glucoside by biotrans-formation has therefore tentatively been suggested(Yokoyama & Yanagi, 1991). When a similar processwas developed with a high density Rauvol®a cell sus-
Phytochemistry 53 (2000) 187±193
0031-9422/00/$ - see front matter # 2000 Elsevier Science Ltd. All rights reserved.
PII: S0031-9422(99 )00539 -7
www.elsevier.com/locate/phytochem
* Corresponding author. Tel.: +49-6131-3925751; fax: +49-6131-
3923752.
E-mail address: [email protected] (J. StoÈ ckigt).

pension instead of the C. roseus cells, the amounts offormed arbutin could be considerably enhanced withan optimum accumulation of 18 g/l nutrition medium(Lutterbach & StoÈ ckigt, 1992), demonstrating theexceptional glucosylation potential of these cells. Inorder to understand this glucosylation process moreprecisely, a prerequisite is the investigation of theinvolved enzyme system.
Here, we report the enrichment and the partialamino acid sequences of the hydroquinone:O-glucosyl-transferase (E.C. 2.4.1 . . . ), including sequence com-parison to other glycosyltransferases from higherplants.
2. Results and discussion
The structure of the enzyme product was determined
after acetylation by EI±MS, showing identical frag-mentation pattern with a reference sample. A shortHPLC assay which takes 5 min only was developed tomonitor the activity of the enzyme hydroquinone:O-glucosyltransferase during formation of arbutin. Agood separation of the cofactor uridine diphosphateglucose (UDPG), the substrate hydroquinone and theenzyme product arbutin with retention times of 1 min6 s, 2 min 42 s and 3 min 35 s, respectively, allowedexact quantitation of the catalysed reaction. Based onthis assay, kinetics could be established to compare thecell culture growth of R. serpentina suspensions andenzyme production (data not shown). Because of theexcellent growth characteristics of the Rauvol®a cells inthe standard LS nutrition medium described byLinsmaier and Skoog (1965) and in 1 l Erlenmeyer¯asks, these conditions were used to generate kilo-grams of cell material. These cultures showed optimum
Fig. 1. Puri®cation of hydroquinone:O-glucosyltransferase. (A) elution pro®le of DEAE-sepharose anion exchanger with linear gradient 0.03±
0.15 M KCl; (B) enrichment of the enzyme by the fast ¯ow Phenyl-sepharose CL-4b with a linear gradient of 250 to 0 mM (NH4)2SO4; (C)
seperation on a ceramic hydroxyapatite column with a linear gradient of 0.01±0.4 M KPi; (D) Chromatofocusing on a Mono P column starting
at pH 7.5 followed by elution with 5% polybu�er 74 pH 4.0 (- - - -), UV absorption; (-*-), speci®c activity; (-w-), KCl gradient; (±r±)
(NH4)2SO4 gradient (±q ±), KPi gradient; ±r ±, pH value; (ÐÐ), pooled fraction.
J. Arend et al. / Phytochemistry 53 (2000) 187±193188

transferase activities. About 5.5 kg fresh Rauvol®a cellswere grown and harvested for enzyme isolation andpuri®cation. After (NH4)2SO4 fractionation about 5.5g soluble protein was obtained which was further puri-®ed by four steps of column chromatography (see Fig.1). As illustrated in Table 1, the separation withDEAE ion exchange chromatography of crude proteinmixture from (NH4)2SO4 precipitation resulted in a 16fold enrichment with an acceptable yield of 70%. Afurther 3 fold enrichment was achieved, when the
remaining protein from DEAE chromatography wassubjected to fast ¯ow Phenyl-sepharose Cl-4b chroma-tography which gave a relatively broad protein and ac-tivity peak; therefore only the fractions at the peakmaximum, similar to highest enzyme activity, werepooled (Fig. 1(B)). The ®nal yield of active enzyme inthis step was rather low, amounting to 23%. Whenthese prepuri®ed protein fractions were tested by SDS-PAGE, the enrichment of the enzyme, which shouldappear at 52 kDa (determined by gel chromatographywith a Sephacryl S-100 column), was not visible. WhenHydroxyapatite chromatography was employed theactive enzyme was eluted as a mixture with manyother remaining proteins forming a sharp peak, butclearly showing pronounced tailing. As the activitymaximum of the enzyme appeared in the ascending¯ank of the peak, only fractions of the ®rst half of thepeak were combined leading to a 70 fold enrichmentand a low yield of 3% compared to the originalenzyme activity (Table 1). In contrast to this step thechromatofocusing on a Mono P column was moree�ective. More than 50% of the proteins did not bindduring the sample loading and enzyme activity elutedas a sharp peak from which only one fraction at thepeak maximum was used for further investigations(Fig. 1(D)). As 3 mg of protein has been applied tothis step of chromatography, su�cient enzyme for par-tial sequencing should remain at the end. In fact ca.0.1 mg of the enzyme remained, which on SDS-PAGEwas not homogeneous but showed a very strongenrichment remaining as the strongest protein bandwhich could be assigned by its molecular mass of 052kDa (Fig. 2(A)). The identi®cation of the correct pro-tein band was con®rmed by the fact that with higheramounts of this protein band the enzyme activityincreased at the corresponding rate. Furthermore, weused native PAGE, followed by detection of enzymeactivity and SDS-PAGE as a second dimension, whichcon®rmed the identi®cation of the correct protein band(Fig. 2(B)). By digestion of this band (Fig. 2(C)) withproteinase LysC, six peptide fragments were separatedby HPLC and then sequenced (see Table 2).
The comparison of all six peptide sequences againstdatabases (FASTA) (Pearson & Lipman, 1988) showedhomologies (up to 100%) to other glycosyltransferases.
Table 1
Puri®cation of hydroquinone:O-glucosyltransferase
Puri®cation step Volume (ml) Total protein (mg) Total activity (nkat) Recovery (%) Speci®c Activity (nkat/mg) Enrichment (x-fold)
Crude extract 7100 7650 510 100 0.067 1
(NH4)2SO4 (30±70%) 750 5520 443 86.6 0.08 1.2
DEAE-sepharose 300 340 365 71.6 1.07 16
Phenyl-sepharose CL-4b 140 34 120 23.5 3.53 52.7
Hydroxyapatite 15 2.9 13.8 2.7 4.75 70.1
Mono P 1.5 0.095 2.5 0.5 26.32 390
Fig. 2. SDS-PAGE of hydroquinone:O-glucosyltransferase after com-
plete puri®cation procedure. (A) SDS-PAGE (11%); lane 1: fraction
showing highest enzyme activity, eluted from Mono P column; lane
2: molecular weight marker mixture. (B) SDS-PAGE (8%) as second
dimension after native PAGE; lane 3: protein, eluted from native
PAGE, showing transferase activity; lane 4: molecular weight marker
mixture; lane 5: fraction with highest enyme activity after chromato-
focusing (see gel A, lane 1). (C) SDS-PAGE (11%) that was used for
sequencing after digestion of transferase band with endoproteinase
LysC; lane 6: molecular weight marker mixture; lane 7: fraction with
highest enzyme activity after chromatofocusing (see gel A, lane 1).
The arrow indicates protein band of hydroquinone:O-glucosyltrans-
ferase.
J. Arend et al. / Phytochemistry 53 (2000) 187±193 189

Fig. 3 displays the regions of di�erent glycosyltrans-ferases from various plants with homologies to thetransferase isolated from Rauvol®a. Some of theenzymes exhibit homologies to all six peptides. As theputative glucosyltransferases from Arabidopsis andManihot (Hughes & Hughes, 1994), whose functionsare not published yet, all other transferases seem to beinvolved in secondary metabolism. Based on sequencecomparison, most of them, such as the transferases iso-lated from Perilla, Verbena, Ipomoea and Vigna, areexpected to be involved in the biosynthesis of ¯avonol
or anthocyanin glycosides, compounds involved in pig-ment formation. A few other transferases are knownto glucosylate plant hormones (Bandurski, Cohen,Slovin & Reinecke, 1995).
As far as we know, none of these enzymes isdescribed as accepting hydroquinone as a substrate.Several glucosyltransferases, acting on phenolic sub-strates, have been described in detail (Gross, 1983;Tabata, Umetani, Ooya & Tanaka, 1988; Parry &Edwards, 1994; Politycka, 1997), but no sequence dataare available till now. In addition, the substrate prefer-
Table 2
Sequence of 6 peptide fragments after hydroquinone:O-glucosyltransferase digestion with endoproteinase LysC, separated by HPLC
Peptide fragment Amino acid sequence
Peptide 7a Asp-Ala-Ala-Ser-Arg-Ala-Leu-Ser-Asp-Asp-Gly-Ser-Ser-Thr-Lys
Peptide 7b Ile-Ala-Asn-Ala-Thr-Tyr-Phe-Ser-Ile-Gln-Asn-Glu-Asn-Asp-Ala-Leu-Ala-Tyr-Leu-Pro-Glu-Gly-Phe
Peptide 13 Ala-Leu-Ala-Ala-Glu-Leu-Ala-Glu-Lys
Peptide 18 Asp-Phe-Leu-Asp-Pro-Ala-Gln-Asp-Arg-Lys
Peptide 26 Ala-Gly-Glu-Asn-Gly-Leu-Ile-Gly-Arg-Val-Glu-Ile-Ala-Asn-Ala-Val-Lys
Peptide 30 Arg-Tyr-Arg-Leu-Ala-Glu-Gly-Ile-Met-Val-Asn-Thr-Phe-Asn-Asp-Leu-Glu-Pro
Fig. 3. Sequence comparision of hydroquinone:O-glucosyltransferase fragments against Swiss Prot data base using FASTA. Enzymes are: (AT)
Putative glucosyltransferase from Arabidopsis thaliana (AAB61023). (PF) Anthocyanin 5-O-glucosyltransferase Perilla frutescens (BAA36421).
(6T) Flavonol 3-O-glucosyltranferase from Gentiana trifolia (Q96493). (VH) Anthocyanin 5-O-glucosyltransferase from Verbena x hybrida
(BAA36423). (ME) Flavonol 3-O-glucosyltransferase from Manihot esculenta (Q40287). (SB) UDPG glucosyltransferase from Solanum berthaultii
(AAB62270). (PS) UDP-glucuronosyltransferase from Pisum sativum (AAB99950). (IP) Flavonoid 3-O-glucosyltransferase from Ipomoea purpurea
(AAB86473). (VM) Flavonoid glycosyltransferase from Vigna mungo (BAA36412).
J. Arend et al. / Phytochemistry 53 (2000) 187±193190
ences of most of the plant glucosyltransferases, whichsequences are known, have not been determined. Themost important reasons for this have been undoubt-edly the di�culties experienced in obtaining plant glu-cosyltransferases in a homogeneous state as discussedby Ford, Boss and Hùj (1998), although few examplesof successful work in this ®eld were recently reported(Vogt, Zimmermann, Grimm & Strack, 1997, Ford etal., 1998).
Because hydroquinone and arbutin seem not to benaturally occurring compounds in Rauvol®a plants orcell cultures, the enzyme must have another substratespeci®city. However, the homologies of the peptidefragments to other plant glycosyltransferases indicatethat, most probably, the Rauvol®a transferasedescribed here is also involved in secondary metab-olism. To settle this question additional testing of theenzyme speci®city is necessary, but the need for higherquantities of pure protein for future investigationscould only be satis®ed by heterologous expression ofactive enzyme.
The sequence information discussed herein will bevery useful because it can be a tool for the isolation ofthe appropriate cDNA or genomic clone encoding forthis particular enzyme.
If this is successful, the UDPG dependent transfer-ase might be expressed heterologously as demonstratedfor a number of other enzymes of the secondarymetabolism from plant cell suspension cultures(Kutchan, 1989; Dittrich & Kutchan, 1991; Kutchan,1998) in order to obtain enough protein to perform adetailed analysis of this enzyme for the ®rst time. Thiscould, however, also o�er the possibility of generationof the required commercially employed arbutin by anenzyme mediated synthesis or by biotransformation ofhydroquinone with genetically engineered organismslike E. coli or yeast systems. The appropriate investi-gations are currently in progress.
3. Experimental
3.1. Plant cell material
Cell suspension cultures of R. serpentina were grownin 1 l Erlenmeyer ¯asks in Linsmaier and Skoog med-ium (1965) for 10 days under continuous light (600lux) and shaking (100 rpm) at 24228C. For an opti-mum enzyme isolation, transferase activities and cellgrowth were determined every day after inoculation.The cell material was harvested by suction ®ltration,frozen with liquid nitrogen and stored at ÿ268C.
3.2. HPLC and transferase assay
HPLC was performed on a Merck-Hitachi system
connected to a LiChrospher1 60 RP Ð select B col-umn (125 � 4 mm, 5 mm). Product separation wasachieved in an isocratic mode with 5% MeOH in H2Oadjusted with H3PO4 to pH 2.5 with a ¯ow rate of 1ml/min and UV detection at 284 nm; Rt UDPG 1 min06 s, HQ 2 min 42 s, arbutin 3 min 35 s.
The enzyme incubation mixture (total volume 125ml) contained 100 mM Tris±HCl bu�er (pH 7.5), 2mM UDPG, 1 mM HQ and various amounts of pro-tein. The incubation time varied between 10 and 60min, depending on enzyme activity. The standardassay temperature was 508C.
3.3. Protein determination
Protein concentrations were determined by themethod of Bradford (1976) mixing 0.1 ml protein sol-ution, 0.9 ml Bradford reagent and measuring theabsorption at 595 nm. For calibration bovine serumalbumin was used. For estimating protein amountsduring enzyme enrichment by column chromatog-raphy, the UV curves were integrated with the AÈ KTA-Explorer Software.
3.4. SDS-PAGE protein staining
Staining of proteins in SDS gels was carried outwith Coomassie solution (0.25% Coomassie BrilliantBlue R-250, 45% MeOH and 9% HOAc in water);destaining of background was performed with a sol-ution of 30% MeOH and 9% HOAc in water. Silverstaining was performed as published previously(Heukeshoven & Dernick, 1985). Enzyme enrichmentduring the puri®cation of the glucosyltransferase waschecked by SDS-PAGE under denaturing conditionsusing acrylamide amounts ranging between 8 and11%. Marker protein used was the LMW marker mix-ture (Amersham Pharmacia Biotech, Freiburg); fornative PAGE CleanGel 25S (Pharmacia) was applied.
3.5. Bu�ers
Bu�er A: 0.15 M Tris±HCl, 20 mM û-mercaptoetha-nol (EtSH), pH 7.5. Bu�er B: 20 mM Tris±HCl, 10mM EtSH, pH 7.5. Bu�er C: as bu�er B and 1 MKCl. Bu�er D: as bu�er B and 250 mM (NH4)2SO4.Bu�er E: 10 mM KPi, 10 mM EtSH, pH 7.5. Bu�er F:0.4 M KPi, 10 mM EtSH, pH 7.5. Bu�er G: 5%Polybu�er 74 (Pharmacia), 10 mM EtSH, pH 4.0.Bu�er H: 20 mM Tris±HCl, 10 mM EtSH, pH 7.5,20% polyethylen glycol 20,000. Bu�er I: as Bu�er Band 150 mM NaCl.
3.6. MS measurements
For MS investigation of the enzyme product arbu-
J. Arend et al. / Phytochemistry 53 (2000) 187±193 191

tin, a Finnigan MAT 44 S quadrupole instrument wasused under direct inlet conditions (70 eV) at an ionsource temperature of 2008C; arbutin was acetylatedby a mixture of acetic anhydride and dried pyridine(1:1) in the MS tube for 12 h and dried under vacuumfor the same time before measurement.
3.7. Preparation of crude protein extracts
Cells of R. serpentina cell suspensions (5.5 kg, freshweight) were frozen with liquid nitrogen, added to2.5 l bu�er A and mixture-aliquots were homogenizedwith an ultraturrax for 1 min each, then ®lteredthrough cheese cloth. The resulting solution was centri-fuged at 10.000 � g for 30 min and the supernatant(7.1 l) was used for the next puri®cation step. All puri-®cation procedures were carried out at 48C.
3.8. Fractional precipitation with (NH4)2SO4
The protein in the resulting supernatant was sub-jected to (NH4)2SO4 precipitation. The precipitatedprotein between 30 and 70% (NH4)2SO4 was collectedafter centrifugation (30 min, 10.000 � g), solubilised in500 ml bu�er A and centrifuged. The supernatant wasdialyzed twice against 10 l bu�er B for 8 h each time.Centrifugation (20 min, 10,000 � g) and resolution ofthe precipitate yielded the soluble protein fraction (750ml, 7.4 mg/ml).
3.9. Anion exchange chromatography on fast-¯owDEAE-sepharose
The obtained protein solution was added at a ¯owrate of 10 ml/min to a fast-¯ow DEAE-sepharose col-umn (20.3 � 5 cm, vol 400 ml, XK50/30-column,Pharmacia) which had been equilibrated with bu�er B.After washing the column with one column volume(CV, 400 ml) of bu�er B, one CV 0.03 M KCl in buf-fer B, the enzyme was eluted with a linear KCl-gradi-ent (4 CV, 0.03±0.15 M KCl) prepared from bu�ers Band C. Enzyme activity appeared at 0.1 M KCl.Fractions containing transferase activity were pooledand prepared for the next puri®cation step by adding(NH4)2SO4 to a ®nal concentration of 250 mM (300ml).
3.10. Hydrophobic interaction chromatography on fast-¯ow Phenyl-sepharose Cl-4b
The resulting protein solution from anion exchangechromatography was pumped with a ¯ow rate of 5 ml/min through a fast-¯ow Phenyl-sepharose column(38 � 2.6 cm, CV 200 ml, XK26/40-column,Pharmacia) which had been equilibrated with bu�er D.After washing the column with 1 CV of bu�er D, the
enzyme was eluted with a gradient from 250±0 mM(NH4)2SO4 prepared from bu�ers D and B. Fractionscontaining >0.86 nkat/mg enzyme activity were com-bined (140 ml) and concentrated by dialysis overnightagainst 3 l of bu�er H to a remaining volume ofaround 1 ml.
3.11. Hydroxyapatite chromatography
This concentrated protein solution was diluted to avolume of 56 ml with bu�er E and was added to aMacro-Prep1 Ceramic Hydroxyapatite (Bio-Rad,Krefeld)) column �1:5� 1:6 cm, CV 3 ml, XK16/20-column, Pharmacia), equilibrated before with bu�er Eat a ¯ow rate of 2 ml/min. After washing the columnwith 7 CV of bu�er E proteins were eluted with aKPi-gradient (10±400 mM, 35 CV) prepared with buf-fers E and F. 3 Fractions (15 ml) containing >4 nkat/mg enzyme activity were combined and dialyzed over-night against 2 l of bu�er B.
3.12. Chromatofocusing with mono P
The dialyzed enzyme solution (55 ml) was addedwith a ¯ow rate of 0.5 ml/min to a Mono P HR 5/20column (Pharmacia) which had been equilibrated withbu�er B. Proteins were fractionated with 30 ml bu�erG at a ¯ow rate of 0.5 ml/min generating an almostlinear pH-gradient from pH 7.5 to 4.0. Transferase ac-tivity was eluted at a pH around 5.3.
3.13. Mr determination by sephacryl S-100chromatography
An enzyme solution (0.5 ml) obtained by concen-tration with bu�er H after chromatography on Phenyl-sepharose was applied to a calibrated HiPrep 16/60Sephacryl S-100 HR column (Pharmacia) and elutedwith bu�er I (18 ml/h, FPLC, Pharmacia). Fractionsof 1 ml were collected and in each fraction the enzymeactivity was determined. Highest activities were moni-tored after 48 ml, corresponding to a relative molecu-lar weight of the enzyme of 52 kDa (2 8%).
3.14. Sequencing of the enzyme and peptide sequencealignment
The enzyme was digested with endoproteinase LysCin the gel. After separation and fractionation offormed peptide fragments by HPLC on a Supersphere60 RP select B column (Merck, Darmstadt), the pep-tides were sequenced.
J. Arend et al. / Phytochemistry 53 (2000) 187±193192

Acknowledgements
Our thanks are due to Professor Dr. F. Lottspeich,Max Planck Institut fuÈ r Biochemie (Martinsried,Germany) for performing the amino acid sequencingof the enzyme. We are also indebted to Professor Dr.W.E. Court (Mold, Wales) for correcting the Englishversion of the manuscript, to the Fonds derChemischen Industrie (Frankfurt/Main, Germany) andto the Deutsche Forschungsgemeinschaft (Bonn,Germany) for ®nancial support.
References
Akiu, S., Suzuki, Y., Fujinuma, Y., Asahara, T., & Fukada, M.
(1988). Inhibitory e�ect of arbutin on melanogenesis: biochemical
study in cultured B16 melanoma cells and e�ect on the UV-
induced pigmentation in human skin. Proc. Jpn. Soc. Invest.
Dermatol, 12, 138±139.
Bandurski, R. S., Cohen, J. D., Slovin, J., & Reinecke, D. M.
(1995). In P. J. Davies, Plant hormones: physiology, biochemistry,
and molecular biology (2nd ed) (pp. 39±65). Dordrecht,
Netherlands: Kluwer Academic Publishers.
Bradford, M. M. (1976). A rapid and sensitive method for quanti-
tation of microgram quantities of protein utilizing the principle of
protein-dye binding. Anal. Biochem, 72, 248±254.
Dittrich, H., & Kutchan, T. M. (1991). Molecular cloning, ex-
pression, and induction of berberine bridge enzyme, an enzyme
essential to the formation of benzophenanthridine alkaloids in the
response of plant pathogenic attack. Proc. Natl. Acad. Sci.
U.S.A, 88, 9969±9973.
Ford, C. M., Boss, P. K., & Hùj, P. B. (1998). Cloning and charac-
terization of vitis vinifera UDP-glucose:¯avonoid 3-O-glucosyl-
transferase, a homologue of the enzyme encoded by the maize
Bronze-1 locus that may primarily serve to glucosylate anthocya-
nidins in vivo. J. Biol. Chem, 273, 9224±9233.
Gross, G. G. (1983). Partial puri®cation and properties of UDP-glu-
cose:vanillate 1-O-glucosyltransferase from oak leaves.
Phytochemistry, 22, 2179±2182.
Heukeshoven, J., & Dernick, R. (1985). Simpli®ed method for silver
staining of proteins in polyacrylamide gels and the mechanism of
silver staining. Electrophoresis, 6, 103±112.
Hughes, J., & Hughes, M. A. (1994). Multiple secondary plant pro-
duct UDP-glucose glucosyltransferase genes expressed in cassava
(Manihot esculenta Crantz) cotyledons. DNA-Seq, 5, 41±49.
Inomata, S., Yokoyama, M., Seto, S., & Yanagi, M. (1991). High-
level production of arbutin from hydroquinone in suspension cul-
tures of Catharanthus roseus plant cells. Appl. Microbiol.
Biotechnol, 36, 315±319.
Kutchan, T. M. (1989). Expression of enzymatically active cloned
strictosidine synthase from the higher plant Rauvol®a serpentina.
FEBS Lett, 257, 127±130.
Kutchan, T.M. (1998). Molecular genetics of plant alkaloid biosyn-
thesis. In G.A. Cordell (Ed.), The alkaloids (Vol. 50, pp. 257±
316).
Linsmaier, E. M., & Skoog, F. (1965). Organic growth factor
requirements of tobacco tissue cultures. Physiol. Plant, 18, 100±
127.
Lutterbach, R., & StoÈ ckigt, J. (1992). High-yield formation of arbu-
tin from hydroquinone by cell-suspension cultures of Rauwol®a
serpentina. Helv. Chim. Acta, 75, 2009±2011.
Mizukami, H., Hirano, A., & Ohashi, H. (1987). E�ect of substituent
groups on the glucosylation of xenobiotic phenols by cultured
cells of Gardenia jasminoides. Plant Sci, 48, 11±15.
Parry, A. D., & Edwards, R. (1994). Characterization of O-glucosyl-
transferases with activities toward phenolic substrates in alfalfa.
Phytochemistry, 37, 655±661.
Pearson, W. R., & Lipman, D. J. (1988). Improved tools for biologi-
cal sequence comparison. Proc. Natl. Acad. Sci. U.S.A, 85, 2444±
2448.
Politycka, B. (1997). Free and glucosylated phenolics, phenolbeta-
glucosyltransferase activity and membrane permeability in cucum-
ber roots a�ected by derivatives of cinnamic and benzoic acids.
Acta Physiol. Plant, 19, 311±317.
Steglich, W., Fugmann, B., & Lang-Fugmann, S. (1997). ROÈMPP
Lexikon-Natursto�e (p. 53). Stuttgart, New York: Georg Thieme
Verlag.
Suzuki, T., Yoshioka, T., Tabata, M., & Fujita, Y. (1987). Potential
of Datura innoxia cell suspension cultures for glycosylating hydro-
quinone. Plant Cell Rep, 6, 275±278.
Tabata, M., Umetani, Y., Ooya, M., & Tanaka, S. (1988).
Glucosylation of phenolic compounds by plant cell cultures.
Phytochemistry, 27, 809±813.
Tschitschibabin, A. E., Kirssanow, A. W., & Rudenko, M. G.
(1930). UÈ ber nicht gerbende Substanzen aus Badan (Saxi-
fraga crassifolia ) Part II: Arbutin. Liebigs Ann. Chem, 479, 303±
306.
Vogt, T., Zimmermann, E., Grimm, R., & Strack, D. (1997). Are the
characteristics of betanidin glucosyltransferases from cell-suspen-
sion cultures of Dorotheanthus bellidiformis indicative of their
phylogenetic relationship with ¯avonoid glucosyltransferases?
Planta, 203, 349±361.
Weiss, R. F., & Fintelmann, V. (1997). Lehrbuch der Phytotherapie
(p. 47). Stuttgart: Hippokrates Verlag.
Yokoyama, M., & Yanagi, M. (1991). High level production of
arbutin by biotransformation. In A. Komamine, M. Misawa, &
F. DiCosmo, Plant cell culture in Japan (pp. 79±91). Tokyo:
CMC Co.
J. Arend et al. / Phytochemistry 53 (2000) 187±193 193

Characterization of isoforms of hexose kinases in rice embryo
Lorenzo Guglielminetti a,b, Pierdomenico Peratac, Akiyoshi Moritab, Elena Loreti a,Junji Yamaguchib, Amedeo Alpia,*
aDipartimento di Biologia delle Piante Agrarie, Sezione di Fisiologia Vegetale, UniversitaÁ degli Studi di Pisa, via Mariscoglio 34, 56124, Pisa, ItalybBioscience Center and Graduate School of Bioagricultural Sciences, Nagoya University, Chikusa-ku, Nagoya 464-8601, Japan
cDipartimento di Biologia e Patologia Vegetale, UniversitaÁ di Bari, Via Orabona 4, Bari, Italy
Received 8 June 1999; received in revised form 4 October 1999; accepted 6 October 1999
Abstract
Hexose kinases in rice embryos have been characterized. Six isoforms were detected: i.e. three glucokinases (GK1±3), two
hexokinases (HK1 and HK2) and one fructokinase (FK1). Out of these, GK3, HK1 and HK2 were inhibited bymannoheptulose and glucosamine, known inhibitors of hexokinase activity. These inhibitors are also known to be modulators ofsugar sensing processes. The results suggest that GK3, HK1 and HK2 may play a role in sensing the cellular sugar status in therice embryo. # 2000 Elsevier Science Ltd. All rights reserved.
Keywords: Oryza sativa L; Sugar sensing; Fructokinase; Glucokinase; Glucosamine; Hexokinase; Mannoheptulose
1. Introduction
Sugars are an important source of energy and car-bon skeletons for plant growth and development, butthey also act as signaling molecules a�ecting develop-mental and metabolic processes. In fact, a variety ofgenes, whose translation products are involved indiverse metabolic pathways, are regulated dependingon the availability of sugars in di�erent living organ-isms ranging from bacteria to eukaryotic cells (Ronne,1995; Thevelein & Hohmann, 1995). Understandinghow cells sense sugars and how the signal is trans-duced to a�ect these processes is an important issue.
Hexose kinases, catalyzing the production of hexose-6-phosphate from hexoses such as glucose or fructose,are involved in the initial metabolic step of glycolysisin cells growing on free sugars, but experimental evi-dence suggests that they may also act as sugar sensors.
Analyses of several yeast mutants revealed that hex-okinase PII encoded by HXK2, one of the three yeast
hexose kinase genes, plays a major role as a glucose
sensor, i.e., the entry of glucose into glycolysis
mediated by the HXK2 gene product is a key step in
glucose sensing in yeast (Trumbly, 1992). In mamma-
lian cells, glucokinase (hexokinase IV) has been impli-
cated as a glucose sensor involved in insulin release in
the pancreatic b-cell (Matschinsky, Liang, Kesavan &
Wang, 1993; Grupe, Hultgren, Ryan, Ma, Bauer &
Stewart, 1995).
In plants, one of the most studied physiological
process concerning sugar regulation is the transcrip-
tional control of photosynthetic genes (Sheen, 1990;
Smeekens, 1998). It has been reported that repres-
sion of transcription of many photosynthetic genes is
triggered by sugars that act as substrates for hexoki-
nase, suggesting this enzyme as a putative sugar sen-
sor in plants (Smeekens, 1998; Jang & Sheen, 1994;
Graham, Demby, and Leaver, 1994; Koch, 1996).
Mannoheptulose, a hexokinase inhibitor, causes the
derepression of photosynthetic genes (Jang & Sheen,
1994). In addition, Jang, Leon, Zhou & Sheen, 1997
showed that the over-expression of hexokinase genes
in transgenic Arabidopsis plants results in increased
sugar sensitivity and that, on the contrary, the corre-
Phytochemistry 53 (2000) 195±200
0031-9422/00/$ - see front matter # 2000 Elsevier Science Ltd. All rights reserved.
PII: S0031-9422(99 )00541 -5
www.elsevier.com/locate/phytochem
* Corresponding author. Tel.: +39-050-542898; fax: +39-050-
540296.
E-mail address: [email protected] (A. Alpi).
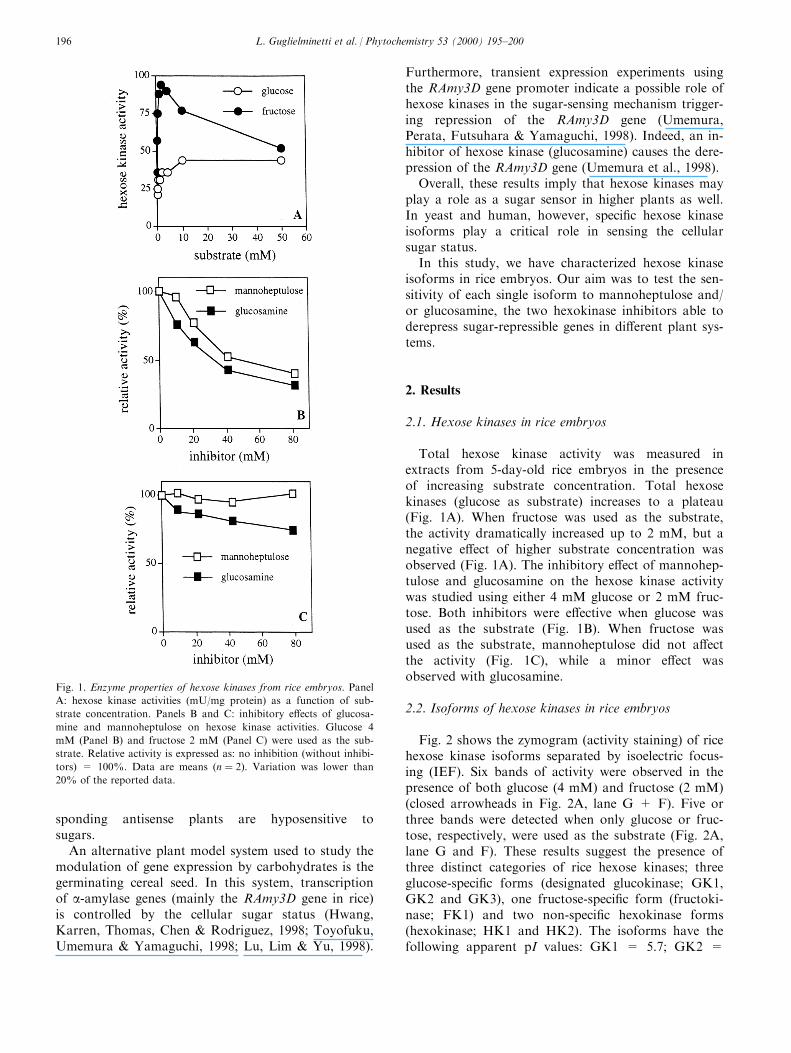
sponding antisense plants are hyposensitive tosugars.
An alternative plant model system used to study themodulation of gene expression by carbohydrates is thegerminating cereal seed. In this system, transcriptionof a-amylase genes (mainly the RAmy3D gene in rice)is controlled by the cellular sugar status (Hwang,Karren, Thomas, Chen & Rodriguez, 1998; Toyofuku,Umemura & Yamaguchi, 1998; Lu, Lim & Yu, 1998).
Furthermore, transient expression experiments usingthe RAmy3D gene promoter indicate a possible role ofhexose kinases in the sugar-sensing mechanism trigger-ing repression of the RAmy3D gene (Umemura,Perata, Futsuhara & Yamaguchi, 1998). Indeed, an in-hibitor of hexose kinase (glucosamine) causes the dere-pression of the RAmy3D gene (Umemura et al., 1998).
Overall, these results imply that hexose kinases mayplay a role as a sugar sensor in higher plants as well.In yeast and human, however, speci®c hexose kinaseisoforms play a critical role in sensing the cellularsugar status.
In this study, we have characterized hexose kinaseisoforms in rice embryos. Our aim was to test the sen-sitivity of each single isoform to mannoheptulose and/or glucosamine, the two hexokinase inhibitors able toderepress sugar-repressible genes in di�erent plant sys-tems.
2. Results
2.1. Hexose kinases in rice embryos
Total hexose kinase activity was measured inextracts from 5-day-old rice embryos in the presenceof increasing substrate concentration. Total hexosekinases (glucose as substrate) increases to a plateau(Fig. 1A). When fructose was used as the substrate,the activity dramatically increased up to 2 mM, but anegative e�ect of higher substrate concentration wasobserved (Fig. 1A). The inhibitory e�ect of mannohep-tulose and glucosamine on the hexose kinase activitywas studied using either 4 mM glucose or 2 mM fruc-tose. Both inhibitors were e�ective when glucose wasused as the substrate (Fig. 1B). When fructose wasused as the substrate, mannoheptulose did not a�ectthe activity (Fig. 1C), while a minor e�ect wasobserved with glucosamine.
2.2. Isoforms of hexose kinases in rice embryos
Fig. 2 shows the zymogram (activity staining) of ricehexose kinase isoforms separated by isoelectric focus-ing (IEF). Six bands of activity were observed in thepresence of both glucose (4 mM) and fructose (2 mM)(closed arrowheads in Fig. 2A, lane G + F). Five orthree bands were detected when only glucose or fruc-tose, respectively, were used as the substrate (Fig. 2A,lane G and F). These results suggest the presence ofthree distinct categories of rice hexose kinases; threeglucose-speci®c forms (designated glucokinase; GK1,GK2 and GK3), one fructose-speci®c form (fructoki-nase; FK1) and two non-speci®c hexokinase forms(hexokinase; HK1 and HK2). The isoforms have thefollowing apparent pI values: GK1 = 5.7; GK2 =
Fig. 1. Enzyme properties of hexose kinases from rice embryos. Panel
A: hexose kinase activities (mU/mg protein) as a function of sub-
strate concentration. Panels B and C: inhibitory e�ects of glucosa-
mine and mannoheptulose on hexose kinase activities. Glucose 4
mM (Panel B) and fructose 2 mM (Panel C) were used as the sub-
strate. Relative activity is expressed as: no inhibition (without inhibi-
tors) = 100%. Data are means �n � 2). Variation was lower than
20% of the reported data.
L. Guglielminetti et al. / Phytochemistry 53 (2000) 195±200196

5.5; GK3 = 5.1; FK1 = 4.6; HK1 = 5.0; and HK2= 4.9. A similar pattern was also observed when ahigher concentration of the substrate was used (50mM in Fig. 2B). Weakly stained bands correspondingto GK1, GK2 and GK3 were detected when fructosewas used as the substrate (lane F in Fig. 2B). We alsoexamined the inhibitory e�ect of glucosamine andmannoheptulose on activities of the isoforms. Asshown in Fig. 2C, both inhibitors weakly a�ect thetwo hexokinases (HK1 and HK2) when glucose wasused as the substrate (Fig. 2C, lanes G + m and G +g compared with G). When fructose was used as thesubstrate (Fig. 2D, lane F), FK1 was not a�ected bythe inhibitors, while the HK1 and HK2 bands disap-peared when using either glucosamine (lane F + g) ormannoheptulose (lane F + m).
2.3. Enzymatic properties of the hexose kinase isoforms
We attempted to separate the hexose kinase isoformsfrom crude extracts of rice by using a preparativeliquid IEF system.
When glucose (4 mM) was used as the substrate(Fig. 3A), hexokinase activity was detectable in frac-tions 13±19 with a peak between fractions 14 and 16.When the glucose concentration was increased up to50 mM, a higher activity was observed in fractions 15and 16. Isoform analysis in IEF gels allowed us toidentify HK2 in fraction 13, a mixture of HK1 andHK2, partially contaminated by GK3, in fraction 14,GK3 in fractions 15 and 16, GK2 in fraction 18 andGK1 in fraction 19 (see Fig. 3A, activity staining).
Enzyme kinetic analysis (Fig. 3A, upper panel)revealed a low Km value for glucose in fractions 13and 14 (mainly HK1 and HK2), as well as in fractions18 (predominantly GK2) and 19 (predominantlyGK1), while a higher Km value was estimated for ac-tivities present in fractions 15 and 16 (enriched inGK3).
When fructose was used as the substrate, activitywas detected in two di�erent peaks (Fig. 3B), the ®rstcorresponding to fraction 10 and the second to frac-tion 14. Isoform analysis allowed the identi®cation ofFK1 in fraction 10 and a mixture of HK1 and HK2 infraction 14 (see Fig. 3B, activity staining). These ac-tivity peaks, however, showed a distinct a�nitytowards fructose: a reduced activity when the substrateconcentration was increased from 2 to 50 mM in frac-tion 10 (FK1), while an enhanced activity wasobserved in fraction 14 (HK1 and HK2), indicatingsubstrate inhibition of FK1. A low Km value for fruc-tose was determined for FK1, while higher Km valueswere found for the mixture of HK1 and HK2.
We also examined the inhibitory e�ect of manno-heptulose (m) and glucosamine (g) on the active frac-tions. An inhibitory e�ect was detected in fraction 14(HK1 and HK2) by both inhibitors when fructose wasused as the substrate, while no inhibition was observedin fraction 10 (FK1) (see upper panel in Fig. 3B).When glucose was used as the substrate (upper panelin Fig. 3A), a weak inhibitory e�ect was observed infractions 18 and 19 (GK1 and GK2), and activity wasinhibited by about 50% in fractions 13±16 (HK1,HK2 and GK3).
Fig. 2. Pattern of hexose kinase isoforms in the presence of various substrates and inhibitors. The procedures for sample preparation and activity
staining after IEF are described in Sections 2.1 and 2.2. The concentrations of substrates and inhibitors are indicated in the upper part of the
®gure and the substrate (and inhibitor) used in each lane is indicated in the lower part of the ®gure; G, glucose; F, fructose; m, mannoheptulose;
g, glucosamine. The pI value of each isoform is given on the right side. In panel A, as a reference, each isoform band is indicated by closed
arrowhead (lane G + F) and bands disappearing depending on the substrate used are indicated by open arrowheads (lane G and F).
L. Guglielminetti et al. / Phytochemistry 53 (2000) 195±200 197

3. Discussion
3.1. Hexose kinase isoforms in plants
In this study, rice embryo hexose kinases have beencharacterized with respect to their isoform pattern andtheir sensitivity to mannoheptulose and glucosamine.Six isoforms were identi®ed: three glucokinases (GK1,GK2 and GK3), two hexokinases (HK1 and HK2),and one fructokinase (FK1) (Fig. 2). GK1 and GK2have low apparent Km values (less than 0.2 mM),while GK3 has a higher Km value (4±7.5 mM) for glu-cose (Fig. 3A). HK1 and HK2 have low Km values(0.1±0.6 mM) for glucose but high (about 5 mM) forfructose. FK1 has a low Km value (about 0.2 mM) forfructose (Fig. 3B).
Several plant hexose kinases have previously beencharacterized (Schnarrenberger, 1990; Renz & Stitt,1993; Martinez-Barajas & Randall, 1998).Schnarrenberger (1990) analyzed hexose kinases par-tially puri®ed from spinach leaves, resolving two hexo-kinases (I and II) and two fructokinases (I and II).Renz & Stitt (1993) identi®ed three hexokinases(HK1±3) and three fructokinases (FK1±3) from potatotubers. Plant hexokinases (also including glucokinases)usually have low Km values for glucose and high values(millimolar range) for fructose. Rice GK1 and GK2appear to resemble potato HK2, having low Km valuesfor glucose, but very high Km values or no a�nity atall for fructose. Rice HK1 and HK2 resemble some-how spinach hexokinase I and II and potato HK1 andHK3, in having low Km values for glucose, but rela-tively high Km values for fructose. On the contrary,rice GK3 is unique in showing high Km value for glu-cose and no a�nity for fructose. Plant fructokinases,including rice FK1, are highly speci®c for fructose,with low Km values in the micromolar range and sub-strate inhibition in the millimolar range (Kanayama etal., 1998).
3.2. Hexose kinase isoform(s) as a sugar sensor
Several lines of evidence suggest a possible role ofhexose kinases as sugar sensors in plants (Smeekens,1998; Jang & Sheen, 1994; Graham et al., 1994; Koch,1996; Jang et al., 1997; Perata, Matsukura, Vernieri &Yamaguchi, 1997). In yeast and mammalian cells, cer-tain hexose kinases have a central role in the earlystage of sugar perception (Trumbly, 1992; Matschinskyet al., 1993). However, little is known about hexosekinase isoforms as putative sugar sensor(s) in plantcells.
Jang & Sheen (1994) succeeded in uncoupling photo-synthetic genes from sugars repression by the use of 10mM mannoheptulose.
In rice embryo, transcription of the RAmy3D gene is
Fig. 3. Enzymic properties of hexose kinase isoforms from rice
embryos. In panels A and B: activity pattern of hexose kinase in
each fraction after preparative IEF (pH 4±6.5), using glucose (A)
and fructose (B) as the substrate. Hexose kinase activity: mU/frac-
tion. Zymogram in panels A and B: activity staining of hexose
kinases in the active fractions using glucose (A) and fructose (B) as
the substrate. The marked band in fraction 16 of zymogram in panel
A is due to non-speci®c staining since staining was also observed
without substrate addition (data not shown). Insert in panels A and
B: Km values (mM) for glucose (A) and fructose (B) in each active
fraction. Percentage inhibition of hexose kinase activities by 10 mM
mannoheptulose (m) or 20 mM glucosamine (g) is also reported
using 4 mM glucose (A) or 2 mM fructose (B) as the substrate. n.i.:
no inhibition. pH value of each fraction is also given.
L. Guglielminetti et al. / Phytochemistry 53 (2000) 195±200198

strictly under sugar control, and sugar-repression ofthis gene does likely involve a hexose kinase-mediatedsignaling process (Umemura et al., 1998). Umemura etal. (1998) also reported that another inhibitor of hex-ose kinase activity, glucosamine, used at 20 mM con-centration, is able to relieve the RAmy3D promoteractivity from repression by endogenous sugars.Assuming that the glucosamine e�ect is due to in vivoinhibition of speci®c isoform(s) of hexose kinase trig-gering sugar repression in rice embryo, the respectiveisoform(s) might be a putative sugar sensor. One canhypothesize that rice HK1, HK2 and GK3 isoforms,which are sensitive to inhibition by mannoheptuloseand glucosamine (Fig. 3), when used at concentrationsclose to those able to uncouple sugar-repressed genesfrom the e�ects of various carbohydrates, are involvedin the sugar-sensing process in rice embryos. However,while mannoheptulose is able to derepress photosyn-thetic genes in vivo (Jang et al., 1997), in the riceembryos system, glucosamine, but not mannoheptu-lose, is e�ective in derepressing the Ramy3D gene(Umemura et al., 1998). On the contrary, in vitro,both inhibitors e�ect the same rice hexose kinase iso-forms (Fig. 3). It is possible that, in the rice system,mannoheptulose uptake into the embryos is impaired.Further experiments will be needed to clarify the roleof hexose kinases in sugar sensing.
4. Experimental
4.1. Plant materials
Rice seeds (Oryza sativa L. cv. Nipponbare) weresurface-sterilized with a 3% NaClO solution contain-ing 0.1% Tween 20 for 30 min, washed 10 times withsterile distilled water (DW), and sown with sterile DWat 258C in the dark. After 5 days, embryos were dis-sected from the endosperm. The plumule and rootwere also removed.
Embryos as described above were extracted in 50mM Tris±HCl bu�er (pH 7.6, containing 10 mM DTTand 10% glycerol). The extract was centrifuged at15,000 g for 15 min, and the resulting supernatant wasdesalted on a Sephadex G25 column equilibrated with20 mM Tris±HCl bu�er (pH 7.6, containing 10 mMDTT).
4.2. Hexose kinase assay and activity staining
Hexose kinase activity was measured according tothe method described previously (Guglielminetti,Perata & Alpi, 1995). When used, glucosamine andmannoheptulose were added together with the sub-strates.
Samples were loaded on an IEF ampholine gel (pHrange: 4±6.5). Preliminary experiments revealed that allthe hexose kinase isoforms had isoelectric points ran-ging from pH 4.5 to 6. After electrophoresis, the gelwas incubated in the following staining mixture: 50mM Hepes±KOH bu�er (pH 7.5), containing 2 mMMgCl2, 1 mM EDTA, 15 mM KCl, 2 mM ATP, 0.75mM NADP, 2 U/ml G6PDH (glucose-6-phosphate de-hydrogenase), 0.25 mg/ml MTT (3-[4,5-dimethylthia-zol-2yl]-2,5-diphenyltetrazolium bromide), 0.075 mg/mlPMS (phenazine methosulfate). When fructose wasused as the substrate, 2 U/ml PGI (phosphoglucoseisomerase) were added to the staining mixture.Concentrations of glucose, fructose, mannoheptulose,or glucosamine used in the mixture were as reported inthe ®gures. A concentrated (4%) solution of meltedagarose (type I-A: Low EEO) was added to the mix-ture, when the temperature of the agarose was lowerthan 558C, to a ®nal concentration of 1%. After add-ing the staining mixture, gels were incubated at 378Cfor 30 min in the dark. An acetic acid solution (1%)was used to stop the reaction. Each activity stainingwas also conducted without substrates to evaluateunspeci®c staining.
4.3. Preparative isoelectric focusing
The hexose kinase isoforms were separated by pre-parative IEF methodology. Rice embryos wereextracted and the extract dialyzed according to theprocedures described above. The crude extract (60 ml)was concentrated to 3 ml using a Centripep-10(Amicon) at 3000 g, 48C and loaded into a 50 mlRotofor cell (Bio-Rad). Prefocusing was performed asfollows: the cell contained 2.5 ml ampholite (40%, pH4±6, LKB), 8.6 ml glycerol and 36.9 ml DW (45 minat 3000 V, 150 mA, and 12 W, 48C, using 0.1 MH3PO4 as the anode solution, and 0.1 M NaOH as thecathode solution). The concentrated extract was loadedat the estimated pH 5 loading position. Isoelectricfocusing (4 h) was performed under the same runningconditions of prefocusing. Twenty fractions of 2.5 mlwere collected.
Acknowledgements
The assistance of Prof. L. Galleschi and his group(Dipartimento di Scienze Botaniche, University ofPisa) during preparative IEF and of Mr. S. Mattiello(Dipartimento di Biologia delle Piante Agrarie,University of Pisa) to prepare plant material is grate-fully acknowledged.
L. Guglielminetti et al. / Phytochemistry 53 (2000) 195±200 199
References
Graham, I. A., Denby, K. J., & Leaver, C. J. (1994). Carbon catabo-
lite repression regulates glyoxylate cycle gene expression in
cucumber. Plant Cell, 6, 761±772.
Grupe, A., Hultgren, B., Ryan, A., Ma, Y. H., Bauer, M., &
Stewart, T. A. (1995). Transgenic knockouts reveal a critical
requirement for pancreatic b-cell glucokinase in maintaining glu-
cose homeostasis. Cell, 83, 69±78.
Guglielminetti, L., Perata, P., & Alpi, A. (1995). E�ect of anoxia on
carbohydrate metabolism in rice seedlings. Plant Physiology, 108,
735±741.
Hwang, Y. S., Karrer, E. E., Thomas, B. R., Chen, L., & Rodriguez,
R. L. (1998). Three cis-elements required for rice a-amylase
Amy3D expression during sugar starvation. Plant Molecular
Biology, 36, 331±341.
Jang, J. C., & Sheen, J. (1994). Sugar sensing in higher plants. Plant
Cell, 6, 1665±1679.
Jang, J. C., Leon, P., Zhou, L., & Sheen, J. (1997). Hexokinase as a
sugar sensor in higher plants. Plant Cell, 9, 5±19.
Kanayama, Y., Granot, D., Dai, N., Petreikov, M., Scha�er, A.,
Powell, A., & Bennett, A. B. (1998). Tomato fructokinases exhibit
di�erential expression and substrate regulation. Plant Physiology,
117, 85±90.
Koch, K. E. (1996). Carbohydrate-modulated gene expression in
plants. Annual Review of Plant Physiology and Plant Molecular
Biology, 47, 509±540.
Lu, C. A., Lim, E. K., & Yu, S. M. (1998). Sugar response sequence
in the promoter of a rice a-amylase gene serves as a transcrip-
tional enhancer. Journal of Biological Chemistry, 273, 10120±
10131.
Martinez-Barajas, E., & Randall, D. D. (1998). Puri®cation and
characterization of a glucokinase from young tomato
(Lycopersicon esculentum L. Mill.) fruit. Planta, 205, 567±573.
Matschinsky, F., Liang, Y., Kesavan, P., & Wang, L. (1993).
Glucokinase as pancreatic bcell glucose sensor and diabetes gene.
Journal of Clinical Investigation, 92, 2092±2098.
Perata, P., Matsukura, C., Vernieri, P., & Yamaguchi, J. (1997).
Sugar repression of a gibberellin-dependent signaling pathway in
barley embryos. Plant Cell, 9, 2197±2208.
Renz, A., & Stitt, M. (1993). Substrate speci®city and product inhi-
bition of di�erent forms of fructokinases and hexokinases in
developing potato tubers. Planta, 190, 166±175.
Ronne, H. (1995). Glucose repression in fungi. Trends in Genetics,
11, 12±17.
Schnarrenberger, C. (1990). Characterization and compartimentation
in green leaves of hexokinases with di�erent speci®cities for glu-
cose fructose and mannose and for nucleoside triphosphates.
Planta, 181, 249±255.
Sheen, J. (1990). Metabolic repression of transcription in higher
plants. Plant Cell, 2, 1027±1038.
Smeekens, S. (1998). Sugar regulation of gene expression in plants.
Current Opinion in Plant Biology, 1, 230±234.
Thevelein, J. M., & Hohmann, S. (1995). Trehalose synthase: guard
to the gate of glycolysis in yeast? Trends in Biochemical Sciences,
20, 3±10.
Toyofuku, K., Umemura, T. A., & Yamaguchi, J. (1998). Promoter
elements required for sugar-repression of the RAmy3D gene for
a-amylase in rice. FEBS Letters, 428, 275±280.
Trumbly, R. J. (1992). Glucose repression in the yeast
Saccharomyces cerevisiae. Molecular Microbiology, 6, 15±22.
Umemura, T. A., Perata, P., Futsuhara, Y., & Yamaguchi, J. (1998).
Sugar sensing and a-amylase gene repression in rice embryos.
Planta, 204, 420±428.
L. Guglielminetti et al. / Phytochemistry 53 (2000) 195±200200
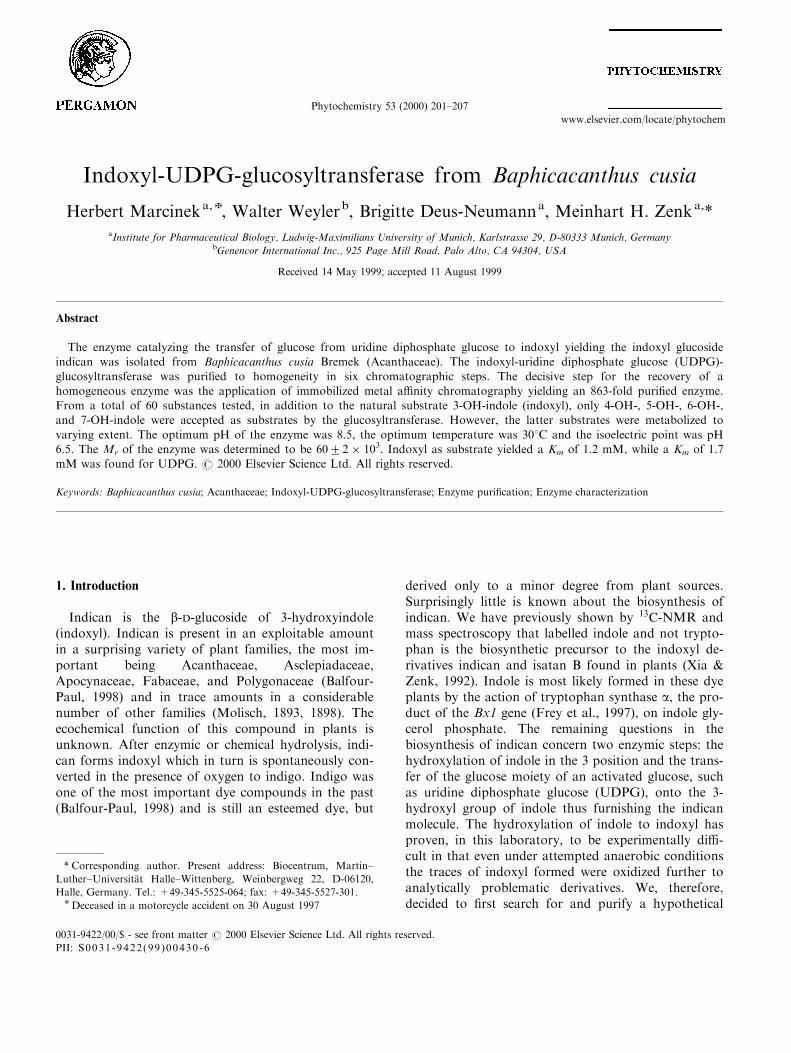
Indoxyl-UDPG-glucosyltransferase from Baphicacanthus cusia
Herbert Marcineka, ,, Walter Weylerb, Brigitte Deus-Neumanna, Meinhart H. Zenka,*aInstitute for Pharmaceutical Biology, Ludwig-Maximilians University of Munich, Karlstrasse 29, D-80333 Munich, Germany
bGenencor International Inc., 925 Page Mill Road, Palo Alto, CA 94304, USA
Received 14 May 1999; accepted 11 August 1999
Abstract
The enzyme catalyzing the transfer of glucose from uridine diphosphate glucose to indoxyl yielding the indoxyl glucosideindican was isolated from Baphicacanthus cusia Bremek (Acanthaceae). The indoxyl-uridine diphosphate glucose (UDPG)-
glucosyltransferase was puri®ed to homogeneity in six chromatographic steps. The decisive step for the recovery of ahomogeneous enzyme was the application of immobilized metal a�nity chromatography yielding an 863-fold puri®ed enzyme.From a total of 60 substances tested, in addition to the natural substrate 3-OH-indole (indoxyl), only 4-OH-, 5-OH-, 6-OH-,and 7-OH-indole were accepted as substrates by the glucosyltransferase. However, the latter substrates were metabolized to
varying extent. The optimum pH of the enzyme was 8.5, the optimum temperature was 308C and the isoelectric point was pH6.5. The Mr of the enzyme was determined to be 6022 � 103. Indoxyl as substrate yielded a Km of 1.2 mM, while a Km of 1.7mM was found for UDPG. # 2000 Elsevier Science Ltd. All rights reserved.
Keywords: Baphicacanthus cusia; Acanthaceae; Indoxyl-UDPG-glucosyltransferase; Enzyme puri®cation; Enzyme characterization
1. Introduction
Indican is the b-D-glucoside of 3-hydroxyindole(indoxyl). Indican is present in an exploitable amountin a surprising variety of plant families, the most im-portant being Acanthaceae, Asclepiadaceae,Apocynaceae, Fabaceae, and Polygonaceae (Balfour-Paul, 1998) and in trace amounts in a considerablenumber of other families (Molisch, 1893, 1898). Theecochemical function of this compound in plants isunknown. After enzymic or chemical hydrolysis, indi-can forms indoxyl which in turn is spontaneously con-verted in the presence of oxygen to indigo. Indigo wasone of the most important dye compounds in the past(Balfour-Paul, 1998) and is still an esteemed dye, but
derived only to a minor degree from plant sources.Surprisingly little is known about the biosynthesis ofindican. We have previously shown by 13C-NMR andmass spectroscopy that labelled indole and not trypto-phan is the biosynthetic precursor to the indoxyl de-rivatives indican and isatan B found in plants (Xia &Zenk, 1992). Indole is most likely formed in these dyeplants by the action of tryptophan synthase a, the pro-duct of the Bx1 gene (Frey et al., 1997), on indole gly-cerol phosphate. The remaining questions in thebiosynthesis of indican concern two enzymic steps: thehydroxylation of indole in the 3 position and the trans-fer of the glucose moiety of an activated glucose, suchas uridine diphosphate glucose (UDPG), onto the 3-hydroxyl group of indole thus furnishing the indicanmolecule. The hydroxylation of indole to indoxyl hasproven, in this laboratory, to be experimentally di�-cult in that even under attempted anaerobic conditionsthe traces of indoxyl formed were oxidized further toanalytically problematic derivatives. We, therefore,decided to ®rst search for and purify a hypothetical
Phytochemistry 53 (2000) 201±207
0031-9422/00/$ - see front matter # 2000 Elsevier Science Ltd. All rights reserved.
PII: S0031-9422(99 )00430 -6
www.elsevier.com/locate/phytochem
, Deceased in a motorcycle accident on 30 August 1997
* Corresponding author. Present address: Biocentrum, Martin±
Luther±UniversitaÈ t Halle±Wittenberg, Weinbergweg 22, D-06120,
Halle, Germany. Tel.: +49-345-5525-064; fax: +49-345-5527-301.
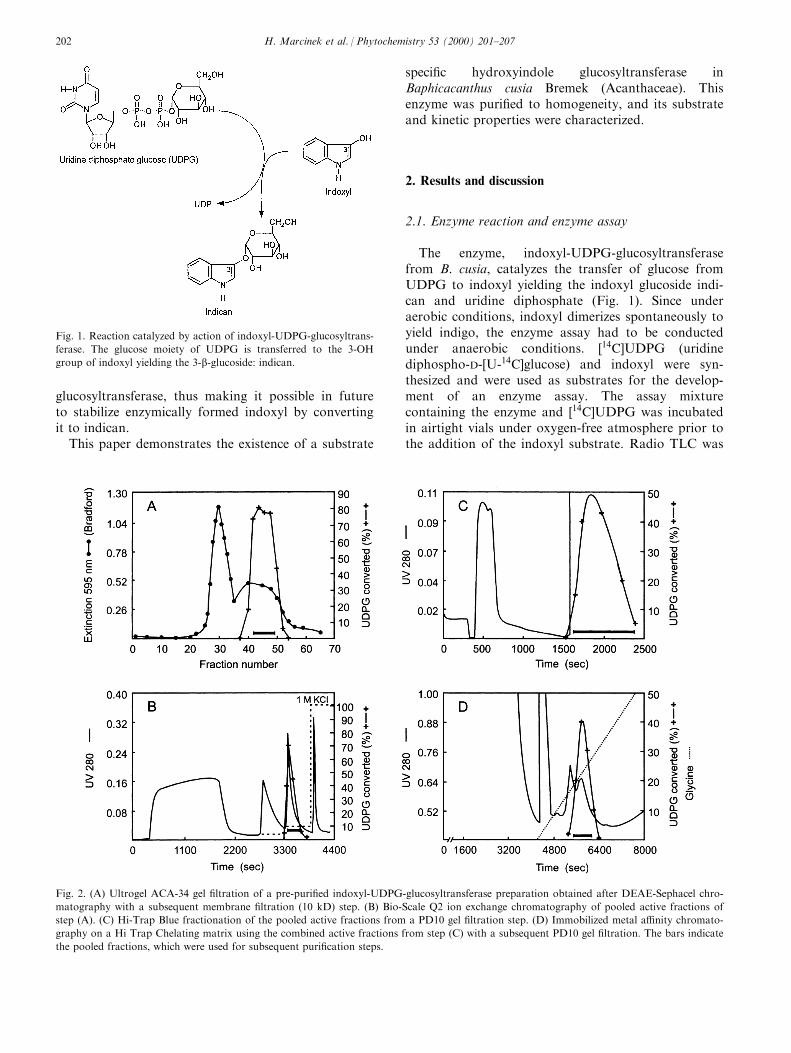
glucosyltransferase, thus making it possible in futureto stabilize enzymically formed indoxyl by convertingit to indican.
This paper demonstrates the existence of a substrate
speci®c hydroxyindole glucosyltransferase inBaphicacanthus cusia Bremek (Acanthaceae). Thisenzyme was puri®ed to homogeneity, and its substrateand kinetic properties were characterized.
2. Results and discussion
2.1. Enzyme reaction and enzyme assay
The enzyme, indoxyl-UDPG-glucosyltransferasefrom B. cusia, catalyzes the transfer of glucose fromUDPG to indoxyl yielding the indoxyl glucoside indi-can and uridine diphosphate (Fig. 1). Since underaerobic conditions, indoxyl dimerizes spontaneously toyield indigo, the enzyme assay had to be conductedunder anaerobic conditions. �14C]UDPG (uridinediphospho-D-[U-14C]glucose) and indoxyl were syn-thesized and were used as substrates for the develop-ment of an enzyme assay. The assay mixturecontaining the enzyme and �14C]UDPG was incubatedin airtight vials under oxygen-free atmosphere prior tothe addition of the indoxyl substrate. Radio TLC was
Fig. 1. Reaction catalyzed by action of indoxyl-UDPG-glucosyltrans-
ferase. The glucose moiety of UDPG is transferred to the 3-OH
group of indoxyl yielding the 3-b-glucoside: indican.
Fig. 2. (A) Ultrogel ACA-34 gel ®ltration of a pre-puri®ed indoxyl-UDPG-glucosyltransferase preparation obtained after DEAE-Sephacel chro-
matography with a subsequent membrane ®ltration (10 kD) step. (B) Bio-Scale Q2 ion exchange chromatography of pooled active fractions of
step (A). (C) Hi-Trap Blue fractionation of the pooled active fractions from a PD10 gel ®ltration step. (D) Immobilized metal a�nity chromato-
graphy on a Hi Trap Chelating matrix using the combined active fractions from step (C) with a subsequent PD10 gel ®ltration. The bars indicate
the pooled fractions, which were used for subsequent puri®cation steps.
H. Marcinek et al. / Phytochemistry 53 (2000) 201±207202
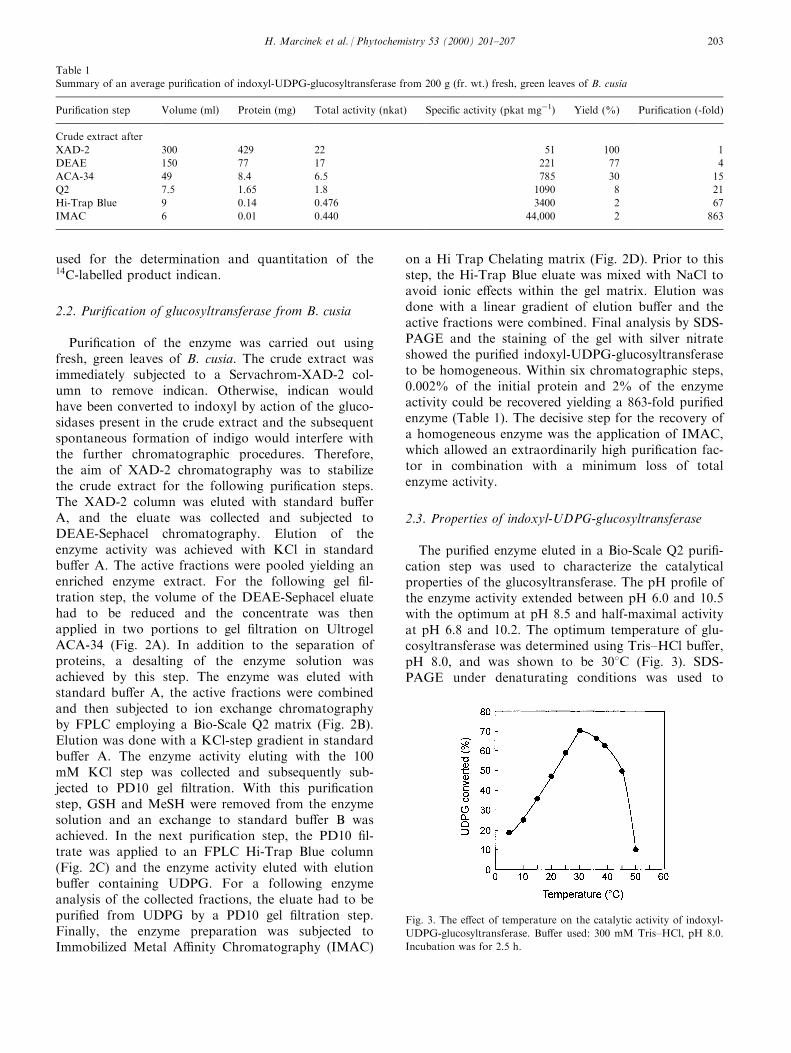
used for the determination and quantitation of the14C-labelled product indican.
2.2. Puri®cation of glucosyltransferase from B. cusia
Puri®cation of the enzyme was carried out usingfresh, green leaves of B. cusia. The crude extract wasimmediately subjected to a Servachrom-XAD-2 col-umn to remove indican. Otherwise, indican wouldhave been converted to indoxyl by action of the gluco-sidases present in the crude extract and the subsequentspontaneous formation of indigo would interfere withthe further chromatographic procedures. Therefore,the aim of XAD-2 chromatography was to stabilizethe crude extract for the following puri®cation steps.The XAD-2 column was eluted with standard bu�erA, and the eluate was collected and subjected toDEAE-Sephacel chromatography. Elution of theenzyme activity was achieved with KCl in standardbu�er A. The active fractions were pooled yielding anenriched enzyme extract. For the following gel ®l-tration step, the volume of the DEAE-Sephacel eluatehad to be reduced and the concentrate was thenapplied in two portions to gel ®ltration on UltrogelACA-34 (Fig. 2A). In addition to the separation ofproteins, a desalting of the enzyme solution wasachieved by this step. The enzyme was eluted withstandard bu�er A, the active fractions were combinedand then subjected to ion exchange chromatographyby FPLC employing a Bio-Scale Q2 matrix (Fig. 2B).Elution was done with a KCl-step gradient in standardbu�er A. The enzyme activity eluting with the 100mM KCl step was collected and subsequently sub-jected to PD10 gel ®ltration. With this puri®cationstep, GSH and MeSH were removed from the enzymesolution and an exchange to standard bu�er B wasachieved. In the next puri®cation step, the PD10 ®l-trate was applied to an FPLC Hi-Trap Blue column(Fig. 2C) and the enzyme activity eluted with elutionbu�er containing UDPG. For a following enzymeanalysis of the collected fractions, the eluate had to bepuri®ed from UDPG by a PD10 gel ®ltration step.Finally, the enzyme preparation was subjected toImmobilized Metal A�nity Chromatography (IMAC)
on a Hi Trap Chelating matrix (Fig. 2D). Prior to thisstep, the Hi-Trap Blue eluate was mixed with NaCl toavoid ionic e�ects within the gel matrix. Elution wasdone with a linear gradient of elution bu�er and theactive fractions were combined. Final analysis by SDS-PAGE and the staining of the gel with silver nitrateshowed the puri®ed indoxyl-UDPG-glucosyltransferaseto be homogeneous. Within six chromatographic steps,0.002% of the initial protein and 2% of the enzymeactivity could be recovered yielding a 863-fold puri®edenzyme (Table 1). The decisive step for the recovery ofa homogeneous enzyme was the application of IMAC,which allowed an extraordinarily high puri®cation fac-tor in combination with a minimum loss of totalenzyme activity.
2.3. Properties of indoxyl-UDPG-glucosyltransferase
The puri®ed enzyme eluted in a Bio-Scale Q2 puri®-cation step was used to characterize the catalyticalproperties of the glucosyltransferase. The pH pro®le ofthe enzyme activity extended between pH 6.0 and 10.5with the optimum at pH 8.5 and half-maximal activityat pH 6.8 and 10.2. The optimum temperature of glu-cosyltransferase was determined using Tris±HCl bu�er,pH 8.0, and was shown to be 308C (Fig. 3). SDS-PAGE under denaturating conditions was used to
Table 1
Summary of an average puri®cation of indoxyl-UDPG-glucosyltransferase from 200 g (fr. wt.) fresh, green leaves of B. cusia
Puri®cation step Volume (ml) Protein (mg) Total activity (nkat) Speci®c activity (pkat mgÿ1) Yield (%) Puri®cation (-fold)
Crude extract after
XAD-2 300 429 22 51 100 1
DEAE 150 77 17 221 77 4
ACA-34 49 8.4 6.5 785 30 15
Q2 7.5 1.65 1.8 1090 8 21
Hi-Trap Blue 9 0.14 0.476 3400 2 67
IMAC 6 0.01 0.440 44,000 2 863
Fig. 3. The e�ect of temperature on the catalytic activity of indoxyl-
UDPG-glucosyltransferase. Bu�er used: 300 mM Tris±HCl, pH 8.0.
Incubation was for 2.5 h.
H. Marcinek et al. / Phytochemistry 53 (2000) 201±207 203
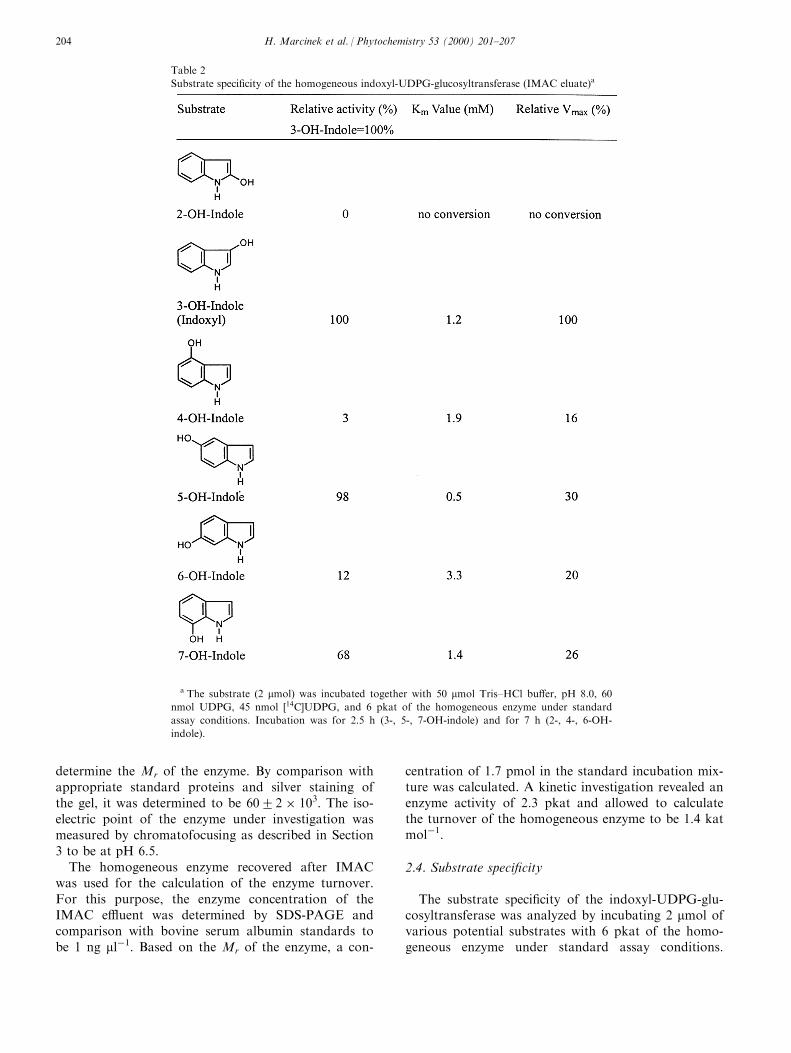
determine the Mr of the enzyme. By comparison withappropriate standard proteins and silver staining ofthe gel, it was determined to be 6022 � 103. The iso-electric point of the enzyme under investigation wasmeasured by chromatofocusing as described in Section3 to be at pH 6.5.
The homogeneous enzyme recovered after IMACwas used for the calculation of the enzyme turnover.For this purpose, the enzyme concentration of theIMAC e�uent was determined by SDS-PAGE andcomparison with bovine serum albumin standards tobe 1 ng mlÿ1. Based on the Mr of the enzyme, a con-
centration of 1.7 pmol in the standard incubation mix-ture was calculated. A kinetic investigation revealed anenzyme activity of 2.3 pkat and allowed to calculatethe turnover of the homogeneous enzyme to be 1.4 katmolÿ1.
2.4. Substrate speci®city
The substrate speci®city of the indoxyl-UDPG-glu-cosyltransferase was analyzed by incubating 2 mmol ofvarious potential substrates with 6 pkat of the homo-geneous enzyme under standard assay conditions.
Table 2
Substrate speci®city of the homogeneous indoxyl-UDPG-glucosyltransferase (IMAC eluate)a
a The substrate (2 mmol) was incubated together with 50 mmol Tris±HCl bu�er, pH 8.0, 60
nmol UDPG, 45 nmol �14C]UDPG, and 6 pkat of the homogeneous enzyme under standard
assay conditions. Incubation was for 2.5 h (3-, 5-, 7-OH-indole) and for 7 h (2-, 4-, 6-OH-
indole).
H. Marcinek et al. / Phytochemistry 53 (2000) 201±207204

Among these potential substrates were 2-OH-, 4-OH-,5-OH-, 6-OH-, and 7-OH-indole as well as di�erentlysubstituted indole carboxylic acids, methylindoles, andphenols. To allow the determination of minuteamounts of substrate conversion, the concentration ofunlabelled UDPG in the incubation mixture wasreduced to 60 nmol, which made a higher assay sensi-tivity possible. TLC analysis of the reaction mixturesafter incubation for 2.5±7 h demonstrated that from60 substances tested only ®ve were converted to theirrespective glucosides. The results of this investigationare partly shown in Table 2. While 2-OH-indole wasnot accepted as substrate by the glucosyltransferase,all other hydroxylated indoles were glucosylated bythis enzyme. Minor activity was found with 4-OH- and6-OH-indole, while 5-OH-indole was converted toalmost the same extent as the natural substrate, the 3-OH-indole indoxyl. Since HPLC analysis and GC±MSproved that the tested substrates were free of impuri-ties, the presence of indoxyl in these substrates can be
excluded. The reason for the almost identical conver-sion of 5-OH- and 3-OH-indole may be the similarityof their three-dimensional structures. Obviously, 5-OH-indole ®ts equally well into the active center of theenzyme, while the structures of the other indoles di�erfrom indoxyl more clearly and were converted by theindoxyl-UDPG-glucosyltransferase to only a lowerextent.
Michaelis±Menten kinetics were recorded for thosesubstrates that were glucosylated by the enzyme underinvestigation as well as for UDPG. The plots of turn-over rate versus substrate concentration for indoxyland UDPG, respectively, are shown in Fig. 4. Theinserts are showing the respective Lineweaver±Burktransformations for the determination of Km values.For indoxyl, an apparent Km value of 1.2 mM wasdetected with UDPG at a concentration of 1.8 mM.With 8.5 mM indoxyl as second substrate, UDPGshowed an apparent Km value of 1.7 mM. Kinetic in-vestigations prior to the determination of Km valuescon®rmed that the glucosyltransferase reaction was lin-ear up to 3.5 h of incubation. The enzyme reaction didnot slow down due to UDPG exhaustion during therelatively long times of incubation used for Km valuedetermination. The Km values of all further substancesaccepted as substrates by the indoxyl-UDPG-glucosyl-transferase are summarized in Table 2. For these deter-minations, the concentration of unlabelled UDPG inthe enzyme assay mixture (155 ml) had to be reducedto 60 nmol to allow the radiodetection of even verysmall substrate conversions. Since the enzyme reactionthus could not proceed with UDPG saturation, theresults could only be calculated by Lineweaver±Burktransformation. The double reciprocal Lineweaver±Burk plot yields, however, linear kinetics even at lowsubstrate concentrations thus allowing the graphicaldetermination of Km values. At low substrate concen-trations, the UDPG concentration is not limiting andthe enzyme kinetic is still linear. Furthermore, the rela-tive Vmax was calculated for every substrate tested. Acomparison of the results (Table 2) showed that thenatural substrate of the glucosyltransferase, the 3-OH-indole indoxyl, was glucosylated most rapidly by theenzyme showing the highest Vmax value among all thesubstrates tested.
Moreover, the kinetic optimum of the enzyme wascalculated, taking into account the Km value forindoxyl and was determined to be kcat=Km � 1166:7sÿ1 Mÿ1.
3. Experimental
3.1. Plant material
Baphicacanthus cusia was collected as cuttings in
Fig. 4. The e�ect of substrate concentration on the activity of
indoxyl-UDPG-glucosyltransferase. (A) Indoxyl: standard incubation
mixture with 1.8 mM UDPG and 18 mg protein. (B) UDPG: stan-
dard incubation mixture with 8.5 mM indoxyl and 18 mg protein.
Incubation was for 2.5 h at 308C and pH 8.0. The insert show the re-
spective Lineweaver±Burk plots.
H. Marcinek et al. / Phytochemistry 53 (2000) 201±207 205
Thailand, and the plants were rooted and cultivatedunder greenhouse conditions. Intact green leaveswithout obvious injuries were used for enzyme puri®-cation.
3.2. Chemicals
Indoxyl was enzymically synthesized from indoxylphosphate under anaerobic conditions according toHeymann and Seligmann (1967). Alkaline phosphatase(5 mg, Sigma P 5521) was suspended in 0.5 ml Tris±HCl bu�er (50 mM, pH 7.95) in 0.8 ml airtight vialsand the solution gassed with 5% H2/95% N2 for 3min. Indoxyl phosphate (27.5 mg) was separately dis-solved in 1 ml of the above Tris±HCl bu�er and dis-tributed to three airtight vials under oxygen-freeconditions. Thereafter, 1 mg (0.1 ml) of phosphatasein solution (see above) was injected with a 1 ml syringeinto every vial containing the indoxyl phosphate sol-ution (100 mM), and the reaction mixture was incu-bated for 5 h at 378C. Subsequently, the mixture wasincubated for 10 min at 968C to denature the phospha-tase and enzyme impurities. With this procedure, a 77mM indoxyl solution was obtained that was stored atÿ208C until use.
[14C]UDPG was enzymically synthesized as follows:170 ml [U-14C]glucose-1-phosphate (11 mmol, 16.6 mCi,Boehringer±Mannheim, dissolved in 50 mM Tris±HClbu�er, pH 7.4), 300 ml UTP (30 mmol, Sigma, dis-solved in 50 mM Tris±HCl bu�er, pH 7.4), 10 ml pyro-phosphatase (10 U, Sigma, aqueous solution) and 66ml UDPG-pyrophosphorylase (33 U, Sigma, aqueoussolution) were incubated for 12 h at 308C. Thereafter,the reaction mixture was separated by PC in solventsystem H2O±HOAc±EtOH (3:2:5) and the product,�14C]UDPG (Rf 0.5), eluted with 1 ml H2O in 85%yield (14.2 mCi).
Materials for chromatography were purchased fromServa (Servachrom-XAD-2), Pharmacia (DEAE-Sephacel, Hi-Trap Blue, Hi Trap Chelating), and fromBio-Rad (Bio-Scale Q2). All other solvents and re-agents were of the highest purity commercially avail-able.
3.3. Enzyme assay
The enzyme assay was conducted under anaerobicconditions in airtight vials by treatment with 5% H2/95% N2. The standard assay mixture contained in atotal volume of 155 ml: 300 nmol UDPG (20 ml, 10 mgmlÿ1), 45 nmol �14C]UDPG (5 ml, 67 nCi), 50 mmol (50ml) Tris±HCl bu�er, pH 8.0 and 80 ml enzyme solution(150 mg protein). The reaction was started by the injec-tion of 770 nmol (10 ml) of the above prepared indoxylsolution, and the mixture was incubated for 4 h at308C. Thereafter, 8 ml of the reaction mixture was
applied to TLC (Polygram SIL G/UV254, Machereyand Nagel, EtOAc±2-BuOH±HCO2H±H2O, 5:3:1:1)and the product, �14C]indican (Rf 0.6), quanti®ed byradio scanning (Berthold linear analyser, Tracemaster20).
3.4. Enzyme puri®cation
Fresh intact green leaves (200 g) of B. cusia weremixed with 250 ml ice cold standard bu�er A (50 mMTris±HCl, pH 8.0, containing 20 mM MeSH, 20% gly-cerol and 2 mg mlÿ1 GSH) and macerated in a mixeruntil a homogeneous brei was obtained, which waspressed through four layers of cheesecloth and sub-sequently centrifuged at 20,000 g. The supernatant wasapplied to a Servachrom-XAD-2 column (5 � 25 cm),pre-equilibrated with the above bu�er and elution wasperformed with the same bu�er at a ¯ow rate of 50 mlminÿ1. The crude extract was then applied to aDEAE-Sephacel column (6 � 20 cm), pre-equilibratedwith standard bu�er A. After washing with 400 ml ofthe bu�er (2 ml minÿ1), elution was performed with100 mM KCl in the same bu�er (400 ml; 10 ml frs) ata ¯ow rate of 2 ml minÿ1. The enzyme eluted betweenfr. 87 and 132. Frs showing the highest enzyme activitywere pooled (150 ml) and concentrated by membrane®ltration (10 kD). The concentrate (6 ml) was sub-sequently subjected in two portions to gel ®ltration onUltrogel ACA-34. For each run, 3 ml of the concen-trate was applied to an ACA-34 column (2.4 � 95 cm),pre-equilibrated with 400 ml standard bu�er A at a¯ow rate of 20 ml hÿ1. The enzyme was eluted withthe same bu�er at a ¯ow rate of 18 ml hÿ1 and frs of6 ml were collected. The active frs were combined (46ml) and subsequently loaded onto an FPLC Bio-ScaleQ2 column (0.7 � 5.2 cm; ¯ow rate: 2 ml minÿ1), pre-equilibrated with standard bu�er A. After washingwith 20 ml of the same bu�er, the bound enzyme waseluted with a KCl-step gradient (40 mM KCl, 20 ml;100 mM KCl, 20 ml; 1 M KCl, 15 ml) in standard buf-fer A at a ¯ow rate of 2 ml minÿ1 and frs of 3 ml werecollected. The enzyme was eluted with the 100 mMKCl step. The active frs were pooled and subjected toPD10 gel ®ltration for bu�er exchange and to removeGSH and MeSH. The enzyme was eluted with stan-dard bu�er B (50 mM Tris±HCl, pH 8.0, containing20% glycerol) and 7 ml of the eluate subjected to anFPLC Hi-Trap Blue column (2 � 1 ml; ¯ow rate: 1 mlminÿ1), pre-equilibrated with standard bu�er B. Theenzyme was eluted with 10 ml elution bu�er (50 mMTris±HCl, pH 8.0, containing 20% glycerol and 20mM UDPG) and frs of 2.5 ml were collected. Forenzyme analysis, UDPG had to be removed by a sub-sequent PD10 gel ®ltration step. The pooled active frsof the Hi-Trap Blue chromatography (9 ml) weremixed with 0.5 M NaCl and then subjected to IMAC
H. Marcinek et al. / Phytochemistry 53 (2000) 201±207206

on Hi Trap Chelating. For this purpose, 10 ml of aZnCl solution (4 mg mlÿ1) was loaded onto a Hi TrapChelating column (1 ml) at a ¯ow rate of 1 ml minÿ1
and subsequently washed with 20 ml H2O. The columnwas equilibrated with standard bu�er C (50 mM Tris±HCl, pH 7.7, containing 20% glycerol and 0.5 MNaCl), and 5 ml of the Hi-Trap Blue eluate was admi-nistered at a ¯ow rate of 0.5 ml minÿ1. After washingwith 10 ml standard bu�er C, the enzyme was elutedwith a linear gradient (0±50%) of elution bu�er (50mM Tris±HCl, pH 7.7, containing 20% glycerol, 0.5M NaCl and 200 mM glycine) within 30 ml at a ¯owrate of 0.5 ml minÿ1. The active frs were combined,the homogeneity of the enzyme proved by SDS-PAGE(Laemmli, 1970) and the protein was detected by stain-ing the gel with silver nitrate (Blum, Beier & Gross,1989).
3.5. Analytical procedures
Relative protein values were analyzed according toBradford (1976). The molecular weight of the enzymewas determined by SDS-PAGE (Laemmli, 1970) andcomparison with molecular weight standards (rainbowmarker, Amersham). The isoelectric point of the gluco-syltransferase was measured by chromatofocusing onan FPLC Mono P column (HR 5/20, Pharmacia),equilibrated with 25 mM Tris±HCl bu�er, pH 8.2.After applying 3 ml of a Bio-Scale Q2 eluate, the col-umn was washed with 10 ml 25 mM Tris±HCl bu�er,pH 8.2, and the enzyme eluted with a diluted (1:10with H2O) mixture of Polybu�er 96 and 74 (3:7). Frs
of 2 ml were collected and tested for pH and enzymeactivity. For the determination of enzyme activity, areduced amount of unlabelled UDPG (145 nmolinstead of 300 nmol) was used.
The pH pro®le of the enzyme activity was deter-mined using 300 mM bu�er (citrate pH 5±6.5; Tris±HCl pH 6.5±10.5; glycine pH 10±11).
Acknowledgements
Our thanks are due to Dr J. Page for his linguistichelp in the preparation of this manuscript. This workwas supported by SFB 369 of DeutscheForschungsgemeinschaft, Bonn, and by Fonds derChemischen Industrie, Frankfurt/Main.
References
Balfour-Paul, J. (1998). Indigo. UK: British Museum Press.
Blum, H., Beier, H., & Gross, H. J. (1989). Electrophoresis, 8, 93±99.
Bradford, M. M. (1976). Anal. Biochem, 72, 248±254.
Frey, M., Chomet, P., Glawischnig, E., Stettner, C., GruÈ n, S.,
Winklmair, A., Eisenreich, W., Bacher, A., Meeley, R. B., Briggs,
S. P., Simcox, K., & Gierl, A. (1997). Science, 277, 696±699.
Heymann, H., & Seligmann, A. (1967). J. Med. Chem, 10, 662±664.
Laemmli, U. K. (1970). Nature, 227, 680±685.
Molisch, H. (1893). Sitzungsber. Akad. Wissensch. Abt. Mineralogie,
102, 269±289.
Molisch, H. (1898). Kaiserl. Akad. Wissensch. Wien. Math. Nat.
Klasse. Sitzungsber. Abt. 1, 107, 747±779.
Xia, Z.-Q., & Zenk, M. H. (1992). Phytochemistry, 31, 2695±2697.
H. Marcinek et al. / Phytochemistry 53 (2000) 201±207 207

Sulfation of naringenin by Cunninghamella elegans
Abdel-Rahim S. Ibrahim
Department of Pharmacognosy, Faculty of Pharmacy, Tanta University, Tanta, Egypt
Received 27 April 1999; accepted 9 September 1999
Abstract
A new ¯avonoid sulfate, naringenin-7-sulfate, was obtained by fermentation of naringenin using the fungus Cunninghamellaelegans NRRL 1392 in 23% yield. Structural elucidation of the metabolite was achieved using EIMS, UV, IR, 1D and 2D
NMR spectroscopy beside acid and enzyme hydrolyses. # 2000 Elsevier Science Ltd. All rights reserved.
Keywords: Naringenin; Sulfation; Cunninghamella elegans; NMR
1. Introduction
Flavonoids are ubiquitous plant natural productsthat possess many pharmacological actions (Cos et al.,1998; Constantinou, Mehta, Runyan, Rao, Vaughan &Moon, 1995). The interest in studying the e�ects of ¯a-vonoids is attributed to their presence in appreciableamount in a normal human diet (Pierpoint, 1986). Ofthese ¯avonoids, the sulfates caused an enhancementof the known ¯avonoid anti-oxidant activity (Yagi,Uemura, Okamura, Haraguchi, Imoto & Hashimoto,1994) and an inhibition of lens aldose reductase(Haraguchi et al., 1996).
The use of microorganisms in studying metabolismof natural and synthetic drugs has been documented(Lin & Rosazza, 1998). Thus, many studies on mi-crobial metabolism of ¯avonoids have been conducted(Ibrahim & Abul-Hajj, 1989, 1990a, 1990b, 1990c). Ofthese studies, the sulfation of 5-hydroxy¯avone byStreptomyces fulvissimus (Ibrahim & Abul-Hajj, 1989)and glucosidation of the ¯avones of Psiadia arabica byCunninghamella elegans (Ibrahim, Galal, Mossa & El-Feraly, 1997) are particularly interesting. The latterorganism, namely C. elegans, was also the sole organ-ism to convert naringenin, a ¯avanone which enhancescytotoxicity of tumor necrosis factor (Habtemariam,1997), into a highly polar, unstable metabolite. Thepresent study describes the isolation and identi®cationof this polar metabolite.
2. Results and discussion
Screening 5,7,4 '-trihydroxy¯avanone (naringenin,1)with several microorganisms showed that only C. ele-gans NRRL 1392 was able to produce a highly polarmetabolite (2). Trials to isolate this metabolite fromlarge-scale incubations, using EtOAc as extraction sol-vent, were unsuccessful and only the substrate (1)could be recovered. This may be attributed to traces ofHOAc in the EtOAc. However, the metabolite wasremarkably stable when extracted with n-BuOH.
To determine the structure of this unknown sub-stance, NMR spectroscopy was carried out, whichshowed no sugar signals in both 1H- and 13C-NMRspectra. Since C. elegans is known to convert phenolichydrocarbons into their sulfate or glucuronide conju-gates (Cerniglia, Freeman & Mitchum, 1982), themetabolite 2 was presumed to be a sulfate of narin-genin (1). To con®rm the presence of a sulfate group,the unknown metabolite was hydrolyzed by treatmentwith acid at room temperature to yield the aglycone,which was identi®ed as naringenin (1). The aqueousfraction from acid hydrolysis was treated with BaCl2,resulting in a white precipitate presumed to be BaSO4.Further support for the presence of sulfate conjugatewas obtained after treatment of 2 with Helix pomatiaaryl sulfatase, which was also coincident with that of asubstance formed from sulfate and naringenin. Thepresence of naringenin was also indicated by EIMS
Phytochemistry 53 (2000) 209±212
0031-9422/00/$ - see front matter # 2000 Elsevier Science Ltd. All rights reserved.
PII: S0031-9422(99 )00487 -2
www.elsevier.com/locate/phytochem
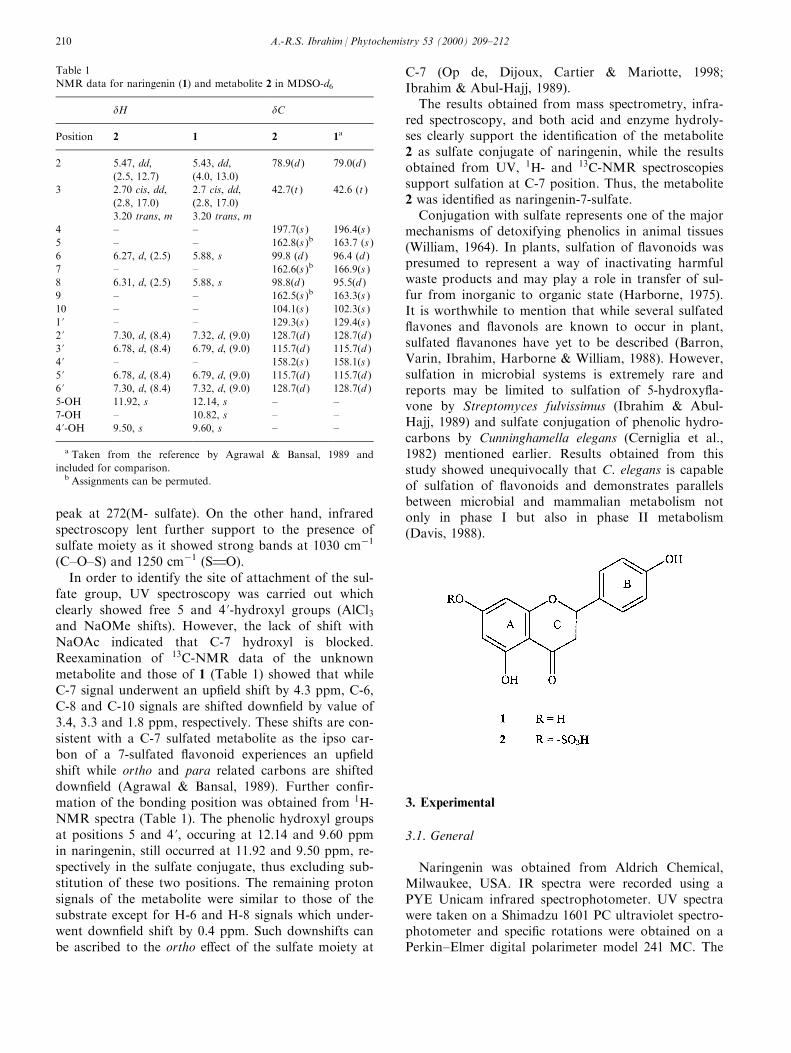
peak at 272(M- sulfate). On the other hand, infraredspectroscopy lent further support to the presence ofsulfate moiety as it showed strong bands at 1030 cmÿ1
(C±O±S) and 1250 cmÿ1 (S1O).
In order to identify the site of attachment of the sul-fate group, UV spectroscopy was carried out whichclearly showed free 5 and 4 '-hydroxyl groups (AlCl3and NaOMe shifts). However, the lack of shift withNaOAc indicated that C-7 hydroxyl is blocked.Reexamination of 13C-NMR data of the unknownmetabolite and those of 1 (Table 1) showed that whileC-7 signal underwent an up®eld shift by 4.3 ppm, C-6,C-8 and C-10 signals are shifted down®eld by value of3.4, 3.3 and 1.8 ppm, respectively. These shifts are con-sistent with a C-7 sulfated metabolite as the ipso car-bon of a 7-sulfated ¯avonoid experiences an up®eldshift while ortho and para related carbons are shifteddown®eld (Agrawal & Bansal, 1989). Further con®r-mation of the bonding position was obtained from 1H-NMR spectra (Table 1). The phenolic hydroxyl groupsat positions 5 and 4 ', occuring at 12.14 and 9.60 ppmin naringenin, still occurred at 11.92 and 9.50 ppm, re-spectively in the sulfate conjugate, thus excluding sub-stitution of these two positions. The remaining protonsignals of the metabolite were similar to those of thesubstrate except for H-6 and H-8 signals which under-went down®eld shift by 0.4 ppm. Such downshifts canbe ascribed to the ortho e�ect of the sulfate moiety at
C-7 (Op de, Dijoux, Cartier & Mariotte, 1998;Ibrahim & Abul-Hajj, 1989).
The results obtained from mass spectrometry, infra-red spectroscopy, and both acid and enzyme hydroly-ses clearly support the identi®cation of the metabolite2 as sulfate conjugate of naringenin, while the resultsobtained from UV, 1H- and 13C-NMR spectroscopiessupport sulfation at C-7 position. Thus, the metabolite2 was identi®ed as naringenin-7-sulfate.
Conjugation with sulfate represents one of the majormechanisms of detoxifying phenolics in animal tissues(William, 1964). In plants, sulfation of ¯avonoids waspresumed to represent a way of inactivating harmfulwaste products and may play a role in transfer of sul-fur from inorganic to organic state (Harborne, 1975).It is worthwhile to mention that while several sulfated¯avones and ¯avonols are known to occur in plant,sulfated ¯avanones have yet to be described (Barron,Varin, Ibrahim, Harborne & William, 1988). However,sulfation in microbial systems is extremely rare andreports may be limited to sulfation of 5-hydroxy¯a-vone by Streptomyces fulvissimus (Ibrahim & Abul-Hajj, 1989) and sulfate conjugation of phenolic hydro-carbons by Cunninghamella elegans (Cerniglia et al.,1982) mentioned earlier. Results obtained from thisstudy showed unequivocally that C. elegans is capableof sulfation of ¯avonoids and demonstrates parallelsbetween microbial and mammalian metabolism notonly in phase I but also in phase II metabolism(Davis, 1988).
3. Experimental
3.1. General
Naringenin was obtained from Aldrich Chemical,Milwaukee, USA. IR spectra were recorded using aPYE Unicam infrared spectrophotometer. UV spectrawere taken on a Shimadzu 1601 PC ultraviolet spectro-photometer and speci®c rotations were obtained on aPerkin±Elmer digital polarimeter model 241 MC. The
Table 1
NMR data for naringenin (1) and metabolite 2 in MDSO-d6
dH dC
Position 2 1 2 1a
2 5.47, dd, 5.43, dd, 78.9(d ) 79.0(d )
(2.5, 12.7) (4.0, 13.0)
3 2.70 cis, dd, 2.7 cis, dd, 42.7(t ) 42.6 (t )
(2.8, 17.0) (2.8, 17.0)
3.20 trans, m 3.20 trans, m
4 ± ± 197.7(s ) 196.4(s )
5 ± ± 162.8(s )b 163.7 (s )
6 6.27, d, (2.5) 5.88, s 99.8 (d ) 96.4 (d )
7 ± ± 162.6(s )b 166.9(s )
8 6.31, d, (2.5) 5.88, s 98.8(d ) 95.5(d )
9 ± ± 162.5(s )b 163.3(s )
10 ± ± 104.1(s ) 102.3(s )
1 ' ± ± 129.3(s ) 129.4(s )
2 ' 7.30, d, (8.4) 7.32, d, (9.0) 128.7(d ) 128.7(d )
3 ' 6.78, d, (8.4) 6.79, d, (9.0) 115.7(d ) 115.7(d )
4 ' ± ± 158.2(s ) 158.1(s )
5 ' 6.78, d, (8.4) 6.79, d, (9.0) 115.7(d ) 115.7(d )
6 ' 7.30, d, (8.4) 7.32, d, (9.0) 128.7(d ) 128.7(d )
5-OH 11.92, s 12.14, s ± ±
7-OH ± 10.82, s ± ±
4 '-OH 9.50, s 9.60, s ± ±
a Taken from the reference by Agrawal & Bansal, 1989 and
included for comparison.b Assignments can be permuted.
A.-R.S. Ibrahim / Phytochemistry 53 (2000) 209±212210
1H- and 13C-NMR spectra were obtained in DMSO-d6on a Bruker DRX-500 NMR spectrometer operatingat 500 and 125 MHz, respectively. The chemical shiftvalues are reported as ppm using tetramethylsilane(TMS) as internal standard and coupling constants areexpressed in Hz. Electron ionization (EI) mass spectrawere taken on Shimadzu QP5000 mass spectrometer.
3.2. Microorganisms and culture conditions
Microorganisms were obtained from eitherAmerican Type Culture Collection (ATCC) orNorthern Regional Research Laboratories (NRRL).Organisms were maintained on Sabouraud dextroseagar (Oxoid) slants at 48 and were used to inoculatethe autoclaved culture medium. Twenty microorgan-isms were used for the preliminary screening as fol-lows.
Aspergillus alliaceous NRRL 315, A. ¯avips ATCC11013, A. niger NRRL 599, A. niger NRRL 2295, A.ochraceous NRRL 398, A. ochraceous NRRL 405,Candida albicans, Lab isolate, Cunninghamella blacke-sleeana MR 198, C. echinulata NRRL 1382 (ATCC42616), C. elegans NRRL 1392 (ATCC 10028a),Gymnascella citrina NRRL 6050 (ATCC 16956),Lindera pinnespora NRRL 2237, Penicillium chryso-genum ATCC 10002, P. chrysogenum ATCC 10002-K,P. purpureus UI 193, P. vermiculatum NRRL 1009,Rhizopus nigricans NRRL 1477, Rhodotorula rubraNRRL y1592, Saccharomyces cerevisae (Baker's yeast)and Streptomyces fulvissimus NRRL 1453B.
3.3. Components of culture medium (Ibrahim et al.,1997)
All fermentation experiments were carried out in amedium of the following composition: 10 g dextrose,10 ml glycerol, 5 g yeast extract, 5 g peptone, 5 gK2HPO4, 5 g NaCl and 1000 ml distilled water. ThepH was adjusted to 6.0 before autoclaving at 1218 for15 min.
3.4. Cultivation of microorganisms (Ibrahim et al.,1997)
Cells of microorganisms were transferred from 2-week old slants into sterile culture medium and kepton a gyratory shaker for 72 h to give stage I culture. 5ml of stage I cultures were used as inoculum for stageII cultures (50 ml per 250 ml ¯ask). After 24 h incu-bation of stage II cultures, naringenin (1) was addedas a solution in dimethylformamide (10 mg 0.25 mlÿ1).Both substrate and organism controls were made.Fermentations were sampled by extracting 5 ml culturewith 5 ml EtOAc or n-BuOH. After evaporation of thesolvent, the residue was chromatographed on silica gel
plates F254 using CHCl3±MeOH (4:1) or EtOAc±MeCOEt±HCO2H±H2O (5:3:1:1) as solvent systems.Flavonoid spots were examined in UV light (254 nm),then sprayed with P-anisaldehyde, AlCl3 or NH3 sol-utions.
3.5. Fermentation of naringenin (1) with C. elegans
Naringenin [1, 600 mg], dissolved in 15 ml dimethyl-formamide, was evenly distributed among 60 ¯askscontaining stage II cultures. Fermentation was stoppedafter 3 weeks, the cells were removed by ®ltration andthe fermentation broth was extracted with an equalvolume of n-BuOH. Repeated sephadex LH20 columnchromatography of the butanolic residue (1.8 g), usingMeOH as eluent, gave 140 mg of pure 2; mp > 3008;�a�D+21. UV lMeOH
max nm: 228, 281, 334 (sh ); +AlCl3:223, 306, 390; + NaOAc: 280, 330 (sh ); +NaOMe:244, 324; EIMS m/z (rel. int.): 272 (M-80)+ (12), 166(7), 153 (19), 83 (27); IR �nmax� (KBr)cmÿ1: 1640(C1O), 1250 (S1O), 1030 (C±O±S), 800 (S±O); 1H-and 13C-NMR (DMSO-d6)d (see Table 1).
3.6. Acid hydrolysis (Mann, Tofern, Kaloga & Eich,1999)
5 mg of 2 was dissolved in 10 ml MeOH and mixedwith 25 ml 3% HCl at room temperature. After evap-oration of MeOH, the aglycone (1) was extracted withEt2O and analyzed by TLC on silica gel with CH2Cl2±Me2CO±HCO2H (76:16:8). Sulfate was detected in theconcentrated aqueous layer by giving white precipitatewith BaCl2.
3.7. Enzyme hydrolysis (Hackett & Gri�th, 1982)
5 mg of 2 was incubated with aryl sulfatase from thesnail, Helix pomatia (Sigma) in 5 ml of 0.1 M acetatebu�er (pH = 5) at 378. Complete hydrolysis wasobserved after 3 h of incubation. The mixture wasthen extracted with Et2O and the concentrated organicphase was analyzed by TLC, which showed a com-pound identical with naringenin (mp, Rf and NMRsignals). Again, addition of BaCl2 to concentrated aqu-eous layer resulted in formation of white precipitate.
Acknowledgements
The author is grateful to Dr. Charles, D. Hu�ord,School of Pharmacy, University of Mississippi, USA,for the NMR spectra.
A.-R.S. Ibrahim / Phytochemistry 53 (2000) 209±212 211
References
Agrawal, P. K., & Bansal, M. C. (1989). In P. Agrawal, Carbon-13
NMR of Flavonoids (pp. 149±150). Berlin: Elsevier.
Barron, D., Varin, L., Ibrahim, R. K., Harborne, J. B., & William,
C. A. (1988). Phytochemistry, 27, 2375.
Cerniglia, C. E., Freeman, J. P., & Mitchum, R. K. (1982). Appl.
Environ. Microbiol, 43, 1070.
Constantinou, A., Mehta, R., Runyan, C., Rao, K., Vaughan, A., &
Moon, R. (1995). J. Nat. Prod, 58, 217.
Cos, P., Ying, L., Calomme, M., Hu, J. P., Cimanga, K., Poel, B.
V., Pieters, L., Vlietinck, A. J., & Berghe, D. V. (1998). J. Nat.
Prod, 61, 71.
Davis, P. J. (1988). Devel. Indust. Microbiol, 29, 197.
Habtemariam, S. (1997). J. Nat. Prod, 60, 775.
Hackett, A. M., & Gri�th, L. A. (1982). Xenobiotica, 12, 447.
Haraguchi, H., Ohmi, I., Sakai, S., Fukuda, A., Toihara, Y.,
Fujimoto, T., Okamura, N., & Yagi, A. (1996). J. Nat. Prod, 59,
443.
Harborne, J. (1975). Phytochemistry, 14, 1147.
Ibrahim, A.-R. S., & Abul-Hajj, Y. J. (1989). Appl. Environ.
Microbiol, 55, 3140.
Ibrahim, A.-R. S., & Abul-Hajj, Y. J. (1990a). J. Nat. Prod, 53, 644.
Ibrahim, A.-R. S., & Abul-Hajj, Y. J. (1990b). J. Nat. Prod, 53,
1471.
Ibrahim, A.-R. S., & Abul-Hajj, Y. J. (1990c). Xenobiotica, 20, 363.
Ibrahim, A.-R. S., Galal, A. M., Mossa, J., & El-Feraly, F. S.
(1997). Phytochemistry, 46, 1193.
Lin, S. T., & Rosazza, J. P. (1998). J. Nat. Prod, 61, 922.
Mann, P., Tofern, B., Kaloga, M., & Eich, E. (1999).
Phytochemistry, 50, 267.
Op de, B., Dijoux, M. G., Cartier, G., & Mariotte, A. M. (1998).
Phytochemistry, 47, 1171.
Pierpoint, W. S. (1986). In V. Cody, E. Middleton, & J. Harborne,
Plant ¯avonoids in biology and medicine. New York: Alan R. Liss.
Inc.
William, R. T. (1964). In J. B. Harborne, Biochemistry of phenolic
compounds (p. 205). London: Academic Press.
Yagi, A., Uemura, T., Okamura, N., Haraguchi, H., Imoto, T., &
Hashimoto, K. (1994). Phytochemistry, 35, 885.
A.-R.S. Ibrahim / Phytochemistry 53 (2000) 209±212212

Benzoxazinoids±cyclic hydroxamic acids, lactams and theircorresponding glucosides in the genus Aphelandra (Acanthaceae)
Andreas Baumeler, Manfred Hesse, Christa Werner*
Organisch-chemisches Institut der UniversitaÈt ZuÈrich, Winterthurerstrasse 190, 8057 ZuÈrich, Switzerland
Received 6 April 1999; received in revised form 12 July 1999; accepted 15 September 1999
Abstract
An improved method of sample preparation and simultaneous HPLC separation was developed that allowed the separation of2,4-dihydroxy-1,4-benzoxazin-3(4H )-one (DIBOA), 2,4-dihydroxy-7-methoxy-1,4-benzoxazin-3(4H )-one (DIMBOA), 2-hydroxy-1,4-benzoxazine-3(2H )-one (HBOA), 2-hydroxy-7-methoxy-1,4-benzoxazine-3(2H )-one (HMBOA) and their corresponding
glucosides as well as the benzoxazolinones BOA and MBOA. The amount and distribution of these compounds was determinedin the roots of Aphelandra squarrosa and A. fuscopunctata plants. There is a signi®cant di�erence in the amount and distributionof this substance class in the two species analyzed. The results are discussed in relation to their function as defence compoundsand allelochemicals. # 2000 Elsevier Science Ltd. All rights reserved.
Keywords: Aphelandra; Roots; Hydroxamic acids; HPLC separation; Allelopathy; Benzoxazinoids
1. Introduction
The ®rst discovery of benzoxazolin-2(3H )-one(BOA) in plants was reported in 1955 in rye (Secalecereale L.) (Virtanen & Hietala, 1955). Shortly after,the methoxy derivative 6-methoxy-benzoxazolin-2(3H )-one (MBOA) was isolated from wheat (Triticumaestivum L.) and maize (Zea mays L.) (Virtanen,Hietala & Wahlroos, 1956). In 1959 it was shown thatthese compounds do not occur in planta but are degra-dation products of 2,4-dihydroxy-1,4-benzoxazin-3(4H )-one, its 7-methoxy derivative, and their corre-sponding glucosides (Wahlroos & Virtanen, 1959;Virtanen & Hietala, 1960).
Today a broad variety of hydroxamic acids, lactamsand their glucosides are known. The main structuresare shown in Scheme 1. Besides an intensive researchon their functions as allelochemicals and chemical re-sistance factors against insects, fungi, bacteria and
virus in many important crop plants of the familyGramineae (Niemeyer, 1988) also inhibitory e�ects onhuman cancer cell lines were reported (Zhang et al.,1995). The chemical synthesis and an overview treatingthe chemistry and the structural requirements for thebiological activity was published recently (Sicker,Hartenstein & Kluge, 1997; Hashimoto & Shudo,1996).
Despite of the intensive studies performed withmonocot crop plants there are few studies on distri-bution of benzoxazinoids in dicots. DIBOA, DIBOA-Glc and BOA were isolated from dried seeds ofAcanthus mollis (Wolf, Spencer & Plattner, 1985),HBOA and HBOA-Glc from seeds of Blepharis edulis(Chatterjee, Sharma, Banerji & Basa, 1990), bothAcanthaceae species. In Consolida orientalis ¯owers(Ranunculaceae) DIBOA, DIBOA-Glc and BOA werereported (Oezden, Oezden, Attila, KuÈ cuÈ kislamoglu& Okatan, 1992) and in Scoparia dulcis(Scrophulariaceae) MBOA was isolated from roots(Chen & Chen, 1976). Recently Pratt, Kumar andChilton (1995) reported the occurrence of the cyclichydroxamic acids DIBOA and DIMBOA in six of 34
Phytochemistry 53 (2000) 213±222
0031-9422/00/$ - see front matter # 2000 Elsevier Science Ltd. All rights reserved.
PII: S0031-9422(99 )00508 -7
www.elsevier.com/locate/phytochem
* Corresponding author: Tel.: +1-635-4292; fax: +1-635-6812.
E-mail address: [email protected] (C. Werner).
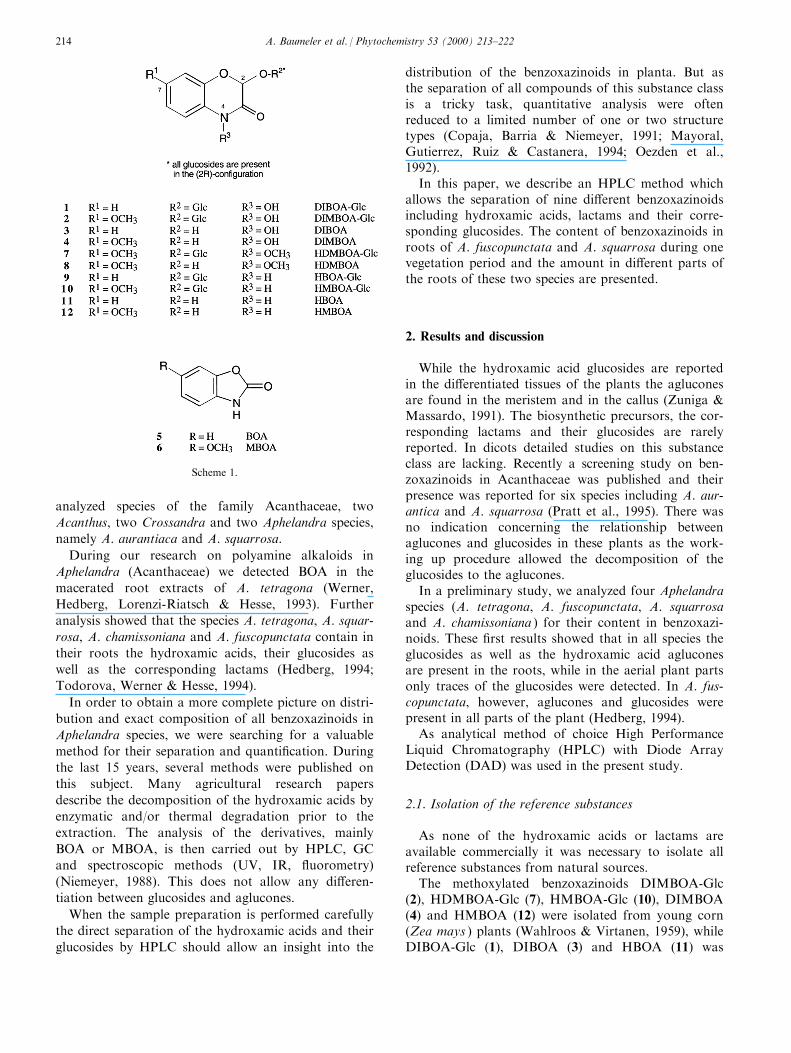
analyzed species of the family Acanthaceae, two
Acanthus, two Crossandra and two Aphelandra species,
namely A. aurantiaca and A. squarrosa.
During our research on polyamine alkaloids in
Aphelandra (Acanthaceae) we detected BOA in the
macerated root extracts of A. tetragona (Werner,
Hedberg, Lorenzi-Riatsch & Hesse, 1993). Further
analysis showed that the species A. tetragona, A. squar-
rosa, A. chamissoniana and A. fuscopunctata contain in
their roots the hydroxamic acids, their glucosides as
well as the corresponding lactams (Hedberg, 1994;
Todorova, Werner & Hesse, 1994).
In order to obtain a more complete picture on distri-
bution and exact composition of all benzoxazinoids in
Aphelandra species, we were searching for a valuable
method for their separation and quanti®cation. During
the last 15 years, several methods were published on
this subject. Many agricultural research papers
describe the decomposition of the hydroxamic acids by
enzymatic and/or thermal degradation prior to the
extraction. The analysis of the derivatives, mainly
BOA or MBOA, is then carried out by HPLC, GC
and spectroscopic methods (UV, IR, ¯uorometry)
(Niemeyer, 1988). This does not allow any di�eren-
tiation between glucosides and aglucones.
When the sample preparation is performed carefully
the direct separation of the hydroxamic acids and their
glucosides by HPLC should allow an insight into the
distribution of the benzoxazinoids in planta. But asthe separation of all compounds of this substance classis a tricky task, quantitative analysis were oftenreduced to a limited number of one or two structuretypes (Copaja, Barria & Niemeyer, 1991; Mayoral,Gutierrez, Ruiz & Castanera, 1994; Oezden et al.,1992).
In this paper, we describe an HPLC method whichallows the separation of nine di�erent benzoxazinoidsincluding hydroxamic acids, lactams and their corre-sponding glucosides. The content of benzoxazinoids inroots of A. fuscopunctata and A. squarrosa during onevegetation period and the amount in di�erent parts ofthe roots of these two species are presented.
2. Results and discussion
While the hydroxamic acid glucosides are reportedin the di�erentiated tissues of the plants the agluconesare found in the meristem and in the callus (Zuniga &Massardo, 1991). The biosynthetic precursors, the cor-responding lactams and their glucosides are rarelyreported. In dicots detailed studies on this substanceclass are lacking. Recently a screening study on ben-zoxazinoids in Acanthaceae was published and theirpresence was reported for six species including A. aur-antica and A. squarrosa (Pratt et al., 1995). There wasno indication concerning the relationship betweenaglucones and glucosides in these plants as the work-ing up procedure allowed the decomposition of theglucosides to the aglucones.
In a preliminary study, we analyzed four Aphelandraspecies (A. tetragona, A. fuscopunctata, A. squarrosaand A. chamissoniana ) for their content in benzoxazi-noids. These ®rst results showed that in all species theglucosides as well as the hydroxamic acid agluconesare present in the roots, while in the aerial plant partsonly traces of the glucosides were detected. In A. fus-copunctata, however, aglucones and glucosides werepresent in all parts of the plant (Hedberg, 1994).
As analytical method of choice High PerformanceLiquid Chromatography (HPLC) with Diode ArrayDetection (DAD) was used in the present study.
2.1. Isolation of the reference substances
As none of the hydroxamic acids or lactams areavailable commercially it was necessary to isolate allreference substances from natural sources.
The methoxylated benzoxazinoids DIMBOA-Glc(2), HDMBOA-Glc (7), HMBOA-Glc (10), DIMBOA(4) and HMBOA (12) were isolated from young corn(Zea mays ) plants (Wahlroos & Virtanen, 1959), whileDIBOA-Glc (1), DIBOA (3) and HBOA (11) was
Scheme 1.
A. Baumeler et al. / Phytochemistry 53 (2000) 213±222214
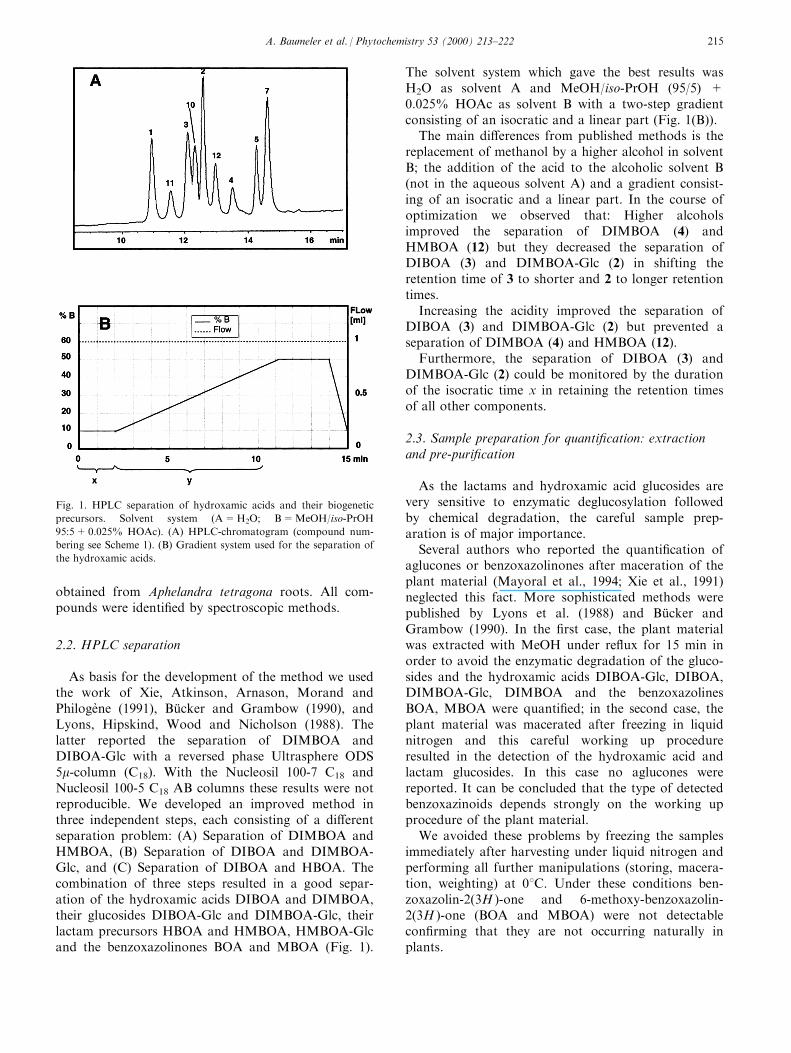
obtained from Aphelandra tetragona roots. All com-pounds were identi®ed by spectroscopic methods.
2.2. HPLC separation
As basis for the development of the method we usedthe work of Xie, Atkinson, Arnason, Morand andPhilogeÁ ne (1991), BuÈ cker and Grambow (1990), andLyons, Hipskind, Wood and Nicholson (1988). Thelatter reported the separation of DIMBOA andDIBOA-Glc with a reversed phase Ultrasphere ODS5m-column (C18). With the Nucleosil 100-7 C18 andNucleosil 100-5 C18 AB columns these results were notreproducible. We developed an improved method inthree independent steps, each consisting of a di�erentseparation problem: (A) Separation of DIMBOA andHMBOA, (B) Separation of DIBOA and DIMBOA-Glc, and (C) Separation of DIBOA and HBOA. Thecombination of three steps resulted in a good separ-ation of the hydroxamic acids DIBOA and DIMBOA,their glucosides DIBOA-Glc and DIMBOA-Glc, theirlactam precursors HBOA and HMBOA, HMBOA-Glcand the benzoxazolinones BOA and MBOA (Fig. 1).
The solvent system which gave the best results wasH2O as solvent A and MeOH/iso-PrOH (95/5) +0.025% HOAc as solvent B with a two-step gradientconsisting of an isocratic and a linear part (Fig. 1(B)).
The main di�erences from published methods is thereplacement of methanol by a higher alcohol in solventB; the addition of the acid to the alcoholic solvent B(not in the aqueous solvent A) and a gradient consist-ing of an isocratic and a linear part. In the course ofoptimization we observed that: Higher alcoholsimproved the separation of DIMBOA (4) andHMBOA (12) but they decreased the separation ofDIBOA (3) and DIMBOA-Glc (2) in shifting theretention time of 3 to shorter and 2 to longer retentiontimes.
Increasing the acidity improved the separation ofDIBOA (3) and DIMBOA-Glc (2) but prevented aseparation of DIMBOA (4) and HMBOA (12).
Furthermore, the separation of DIBOA (3) andDIMBOA-Glc (2) could be monitored by the durationof the isocratic time x in retaining the retention timesof all other components.
2.3. Sample preparation for quanti®cation: extractionand pre-puri®cation
As the lactams and hydroxamic acid glucosides arevery sensitive to enzymatic deglucosylation followedby chemical degradation, the careful sample prep-aration is of major importance.
Several authors who reported the quanti®cation ofaglucones or benzoxazolinones after maceration of theplant material (Mayoral et al., 1994; Xie et al., 1991)neglected this fact. More sophisticated methods werepublished by Lyons et al. (1988) and BuÈ cker andGrambow (1990). In the ®rst case, the plant materialwas extracted with MeOH under re¯ux for 15 min inorder to avoid the enzymatic degradation of the gluco-sides and the hydroxamic acids DIBOA-Glc, DIBOA,DIMBOA-Glc, DIMBOA and the benzoxazolinesBOA, MBOA were quanti®ed; in the second case, theplant material was macerated after freezing in liquidnitrogen and this careful working up procedureresulted in the detection of the hydroxamic acid andlactam glucosides. In this case no aglucones werereported. It can be concluded that the type of detectedbenzoxazinoids depends strongly on the working upprocedure of the plant material.
We avoided these problems by freezing the samplesimmediately after harvesting under liquid nitrogen andperforming all further manipulations (storing, macera-tion, weighting) at 08C. Under these conditions ben-zoxazolin-2(3H )-one and 6-methoxy-benzoxazolin-2(3H )-one (BOA and MBOA) were not detectablecon®rming that they are not occurring naturally inplants.
Fig. 1. HPLC separation of hydroxamic acids and their biogenetic
precursors. Solvent system (A=H2O; B=MeOH/iso-PrOH
95:5+0.025% HOAc). (A) HPLC-chromatogram (compound num-
bering see Scheme 1). (B) Gradient system used for the separation of
the hydroxamic acids.
A. Baumeler et al. / Phytochemistry 53 (2000) 213±222 215

Another problem is the pre-puri®cation of thesamples prior to HPLC analysis. This sample prep-aration was neglected in all cited publications wherethe raw extracts were injected directly. Only the workof Lyons et al. (1988) reports a pre-puri®cation, butthe proposed method is not useful for measurementsof large series of samples.
In the raw extracts of plants, the broad variety ofsubstances (salts, lipids, glycosides, phosphates, pep-tides, macromolecules, chlorophyll) and their seasonalvariation can in¯uence HPLC quanti®cations. In ad-dition, secondary compounds with identical retentiontimes might interfere. During our analysis of samplesof Aphelandra we observed that some peaks (accordingto their UV spectra probably ¯avonoids or ¯avonoidglycosides) eluted with identical retention times as thebenzoxazinoids.
While using a Sep-pak1 C18 cartridge for solid-phase extraction (SPE) we could eliminate these com-pounds by a simple pre-puri®cation procedure.
The improvement of the HPLC chromatograms canbe seen in Fig. 2. The chromatogram of the rawextract of A. squarrosa before and after puri®cation on
Sep-pac1 are shown (Fig. 2(A) and (B)). Compound 3is overlapping with a compound which has disap-peared after pre-puri®cation on Sep-pac1. After puri®-cation the peaks showed the pure UV spectra of thebenzoxazinoids while earlier overlapping spectra indi-cated a mixture (data not shown). Without the possi-bility of a DAD-detector where UV-spectra of eachpeak are registered they would have been interpretedas benzoxazinoids.
2.4. Content of the hydroxamic acids and theirglucosides in di�erent root segments of A. squarrosa andA. fuscopunctata
Root segments of ®ve plants (25 weeks after shootpropagation) of A. squarrosa and A. fuscopunctatawere analyzed for their content in benzoxazinoids.
In both species the highest amount of benzoxazi-noids was found in the root tip. In A. fuscopunctatathe total amount is four times higher than in A. squar-rosa (Fig. 3). While in A. squarrosa the root tip con-tains only glucosides, more than 50% of thebenzoxazinoids are present as aglucones in A. fusco-punctata. Only the side roots of A. squarrosa containglucosides and aglucones.
In Gramineae, by contrast, the aglucones appearonly in the meristematic tissue in very small amounts.Di�erentiated tissue contains only glucosides (Zuniga& Massardo, 1991). In the roots of A. fuscopunctataalso elder parts contain aglucones. Considering thatthese compounds may have an allelopathic function(Schulz, Friebe, Kuck, Seipel & Schnabl, 1994) it isinteresting that the most exposed root parts, the roottips and the growing side roots, contain higher amountof the toxic aglucones. In A. squarrosa only the sideroots contain aglucones. The lactams HBOA andHMBOA were only detected in traces in di�erent rootsegments indicating that they are metabolic intermedi-ates which are not accumulated. The correspondingglucosides were not detected.
2.5. Time course of benzoxazinoid content in A.squarrosa and A. fuscopunctata roots
The content of benzoxazinoids was monitoredduring 22 weeks in the roots of A. squarrosa and A.fuscopunctata (Fig. 4).
In A. sqarrosa the highest amount of benzoxazinoidswas found in 5±7 week old roots. The main compounddetected was DIBOA glucoside which reached 3 mmol/g fr.wt. at week 5. The level decreased till the 9th weekand then ¯uctuated between 0.5 and 1 mmol. Duringthe interval between week 5 and 10 the decrease ofDIBOA-Glc was paralleled with a strong increase ofDIBOA which decreased later to a constant level of0.2 mmol/g fr.wt. DIMBOA-Glc and DIMBOA were
Fig. 2. Example of a HPLC chromatogram of extracts from roots of
Aphelandra squarrosa for the quanti®cation of hydroxamic acids. (A)
Extract before puri®cation on Sep-Pac1 C18, column. (B) Extract
after puri®cation on Sep-Pac1 C18 column.
A. Baumeler et al. / Phytochemistry 53 (2000) 213±222216

Fig. 3. Hydroxamic acid content in di�erent root segments of Aphelandra. (A) Aphelandra squarrosa. (B) Aphelandra fuscopunctata.
A. Baumeler et al. / Phytochemistry 53 (2000) 213±222 217
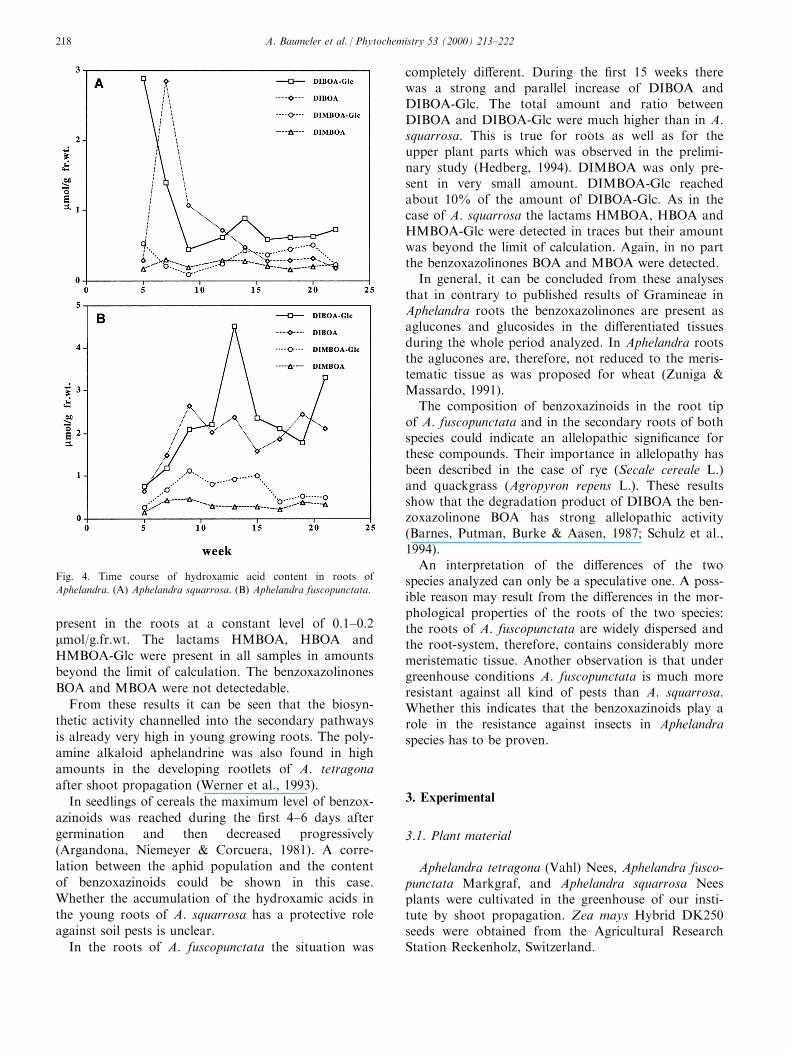
present in the roots at a constant level of 0.1±0.2mmol/g.fr.wt. The lactams HMBOA, HBOA andHMBOA-Glc were present in all samples in amountsbeyond the limit of calculation. The benzoxazolinones
BOA and MBOA were not detectedable.
From these results it can be seen that the biosyn-thetic activity channelled into the secondary pathwaysis already very high in young growing roots. The poly-amine alkaloid aphelandrine was also found in highamounts in the developing rootlets of A. tetragona
after shoot propagation (Werner et al., 1993).
In seedlings of cereals the maximum level of benzox-azinoids was reached during the ®rst 4±6 days aftergermination and then decreased progressively(Argandona, Niemeyer & Corcuera, 1981). A corre-lation between the aphid population and the content
of benzoxazinoids could be shown in this case.Whether the accumulation of the hydroxamic acids inthe young roots of A. squarrosa has a protective roleagainst soil pests is unclear.
In the roots of A. fuscopunctata the situation was
completely di�erent. During the ®rst 15 weeks therewas a strong and parallel increase of DIBOA andDIBOA-Glc. The total amount and ratio betweenDIBOA and DIBOA-Glc were much higher than in A.squarrosa. This is true for roots as well as for theupper plant parts which was observed in the prelimi-nary study (Hedberg, 1994). DIMBOA was only pre-sent in very small amount. DIMBOA-Glc reachedabout 10% of the amount of DIBOA-Glc. As in thecase of A. squarrosa the lactams HMBOA, HBOA andHMBOA-Glc were detected in traces but their amountwas beyond the limit of calculation. Again, in no partthe benzoxazolinones BOA and MBOA were detected.
In general, it can be concluded from these analysesthat in contrary to published results of Gramineae inAphelandra roots the benzoxazolinones are present asaglucones and glucosides in the di�erentiated tissuesduring the whole period analyzed. In Aphelandra rootsthe aglucones are, therefore, not reduced to the meris-tematic tissue as was proposed for wheat (Zuniga &Massardo, 1991).
The composition of benzoxazinoids in the root tipof A. fuscopunctata and in the secondary roots of bothspecies could indicate an allelopathic signi®cance forthese compounds. Their importance in allelopathy hasbeen described in the case of rye (Secale cereale L.)and quackgrass (Agropyron repens L.). These resultsshow that the degradation product of DIBOA the ben-zoxazolinone BOA has strong allelopathic activity(Barnes, Putman, Burke & Aasen, 1987; Schulz et al.,1994).
An interpretation of the di�erences of the twospecies analyzed can only be a speculative one. A poss-ible reason may result from the di�erences in the mor-phological properties of the roots of the two species:the roots of A. fuscopunctata are widely dispersed andthe root-system, therefore, contains considerably moremeristematic tissue. Another observation is that undergreenhouse conditions A. fuscopunctata is much moreresistant against all kind of pests than A. squarrosa.Whether this indicates that the benzoxazinoids play arole in the resistance against insects in Aphelandraspecies has to be proven.
3. Experimental
3.1. Plant material
Aphelandra tetragona (Vahl) Nees, Aphelandra fusco-punctata Markgraf, and Aphelandra squarrosa Neesplants were cultivated in the greenhouse of our insti-tute by shoot propagation. Zea mays Hybrid DK250seeds were obtained from the Agricultural ResearchStation Reckenholz, Switzerland.
Fig. 4. Time course of hydroxamic acid content in roots of
Aphelandra. (A) Aphelandra squarrosa. (B) Aphelandra fuscopunctata.
A. Baumeler et al. / Phytochemistry 53 (2000) 213±222218

3.2. Chemicals
Solvents: All solvents for extractions were distilledprior to their use. The solvents for HPLC were fromScharlau (Barcelona, Spain). Standard reagents werefrom Fluka (Buchs, Switzerland), Silicagel from Merck(Darmstadt, Germany), Cellulose from Whatman,Sephadex G-10 from Pharmacia (DuÈ bendorf,Switzerland), and Sep-Pak1-columns from WatersCorp. (Milford, MA, USA).
3.3. Analytic
Melting points (mp): Mettler FP-5.IR-spectra �vmax in cmÿ1, in KBr): Perkin-Elmer 1600Series FTIR.UV-spectra �lmax in nm, MeOH, e): Perkin-Elmer 555spectrophotometer.1H-NMR spectra at 300 MHz: Bruker AC 300 orBruker ARX-300; chemical shifts d in ppm, couplingconstants J in Hz, using TMS �d � 0 ppm) as refer-ence.13C-NMR at 75.6 MHz in MeOD: Bruker ARX-300; din ppm relative to MeOD.CI-MS with NH3 as reactant gas, and EI-MS: VarianMAT-112S.ESI-MS: Finnigan TSQ 700 mass spectrometer.HPLC-separation: Hewlett Packard 1090; DAD detec-tion, for quanti®cation LDC/Milton Roy SpectraMonitor 3000 UV detection at 280 nm.Analytical columns: Nucleosil 100-7 C18 and 100-5 C18
AB, Macherey Nagel GmbH. Oensingen, Switzerland.
3.4. Isolation of the reference substances
DIBOA-Glc (1), DIBOA (3) and HBOA (11) wereisolated from A. tetragona roots. 80 g of lyophilizedroots were extracted three times for 24 h, each timewith 400 ml of MeOH/H2O (9:1) containing 3% ofHOAc. The combined extracts were reduced to avolume of 100 ml in vacuo. The aqueous phase soobtained was diluted to 300 ml with H2O and adjustedto pH 3 with 1 N HCl.
The aglucones were obtained by extracting the waterphase three times with EtOAc. After drying the or-ganic phase over Na2SO4 and concentration in vacuotwo fractions were eluted by column chromatographyon Silicagel60 (40±60 mm) with CHCl3±MeOH±Hexane±HOAc (8:1:1.5:0.2). Fr. 1 (35 mg orange crys-tals) contained mainly DIBOA and fr. 2 (white pow-der) mainly HBOA. Further puri®cation with prep.HPLC (see analytical gradient) led to 10 mg DIBOA(3), 5 mg HBOA (11) and 2 mg HMBOA (11).
The glucosides were obtained by extracting thewater phase ®ve times with n-BuOH. After evapor-ation of the organic phase and dilution of the residue
with 20 ml H2O the extract was puri®ed on aSephadex G10-column with H2O as solvent. The frac-tion containing the hydroxamic acid glucosides wasIyophilized (181 mg light brown powder). After furthercolumn chromatography on cellulose (Whatman CF1)with toluene : n-BuOH (1:1) 171 mg of a beige powderwas obtained containing mainly DIBOA-Glc (1).
DIMBOA-Glc (2), HDMBOA-Glc (7), HMBOA-Glc (10), DIMBOA (4) and HMBOA (12) were iso-lated from Zea mays Hybrid DK250: 400 g of 4-weekold corn plantlets were placed into boiling water for 3min prior to maceration in liquid N2. The plant pow-der was then extracted three times with 400 mlMeOH±H2O (9:1+3% HOAc). Each extraction wasstirred for 24 h. The MeOH from the combinedextracts was evaporated and the remaining 100 ml ofwater phase was adjusted to pH 3 with 1 N HCl. Theprecipitated chlorophyll was discarded by ®ltrationover Celite. Aglucones were extracted by EtOAc andGlucosides by n-BuOH as described earlier.
3.5. 2,4-Dihydroxy-2H-1,4-benzoxazin-3(4H)-one(DIBOA, 3)
Light orange crystals, mp 198±2018C (lit. 1528C,Virtanen & Hietala, 1960). IR nmax: 3270, 1653, 1490,1093, 1039. 1H-NMR (300 MHz, MeOD): 7.38 (m,1H); 7.05 (m, 3H); 5.70 (s, 1H). 13C-NMR (50.4 MHz,MeOD): 160.5 (C-3), 142.8 (C-8a), 130.0 (C-8), 125.9(C-5), 124.1 (C-6), 118.8 (C-7), 114.7 (C-4a), 94.0(C-2). El-MS: 181 (30, [M]+), 165 (9, [MÿOH]+),152 (11, [MÿCHO]+), 136 (40), 135 (100,[MÿHCOOH]+), 108 (19), 79 (53).
3.6. 2-Hydroxy-2H-1,4-benzoxazin-3(4H)-one (HBOA;11)
White powder, mp 198±2018C (lit. 206±2078C,Sicker & Hartenstein, 1993). IR nmax: 3250, 1620, 1475,1180, 1104, 1057, 1028. 1H-NMR (300 MHz, MeOD):7.42 (d, J = 7.1, 1H); 7.01 (m, 4H); 5.53 (s, 1H). ESI-MS: 353 ([2M + Na]+), 188 ([M + Na]+).
3.7. (2R)-2-O-b-D-Glucopyranosyl-4-hydroxy-2H-1,4-benzoxazin-3(4H)-one (DIBOA-Glc, 1)
Beige needles, mp 183±1858C (lit. 256±2578C,Hartenstein & Sicker, 1994). UV/Vis (MeOH) lmax:287 �e 9551), 259 sh �e 7300), 202 �e 24,681). CD(MeOH): 310 (0), 281 (ÿ0.16), 250 (0), 227 (+0.62),217 (0), 213 (ÿ0.53). �a�20D (MeOH): +75.88 (+1068(H2O), Nagao, Otsuka, Kohda, Sato & Yamasaki,1985). IR nmax: 3402, 1683, 1494, 1100±1000 (br). 1H-NMR (300 MHz, MeOD): 7.33 (m, 1H); 7.04 (m, 3H);5.87 (s, 1H); 3.80 (d, J=11.4, 1H); 3.62 (dd, J=11.4,
A. Baumeler et al. / Phytochemistry 53 (2000) 213±222 219
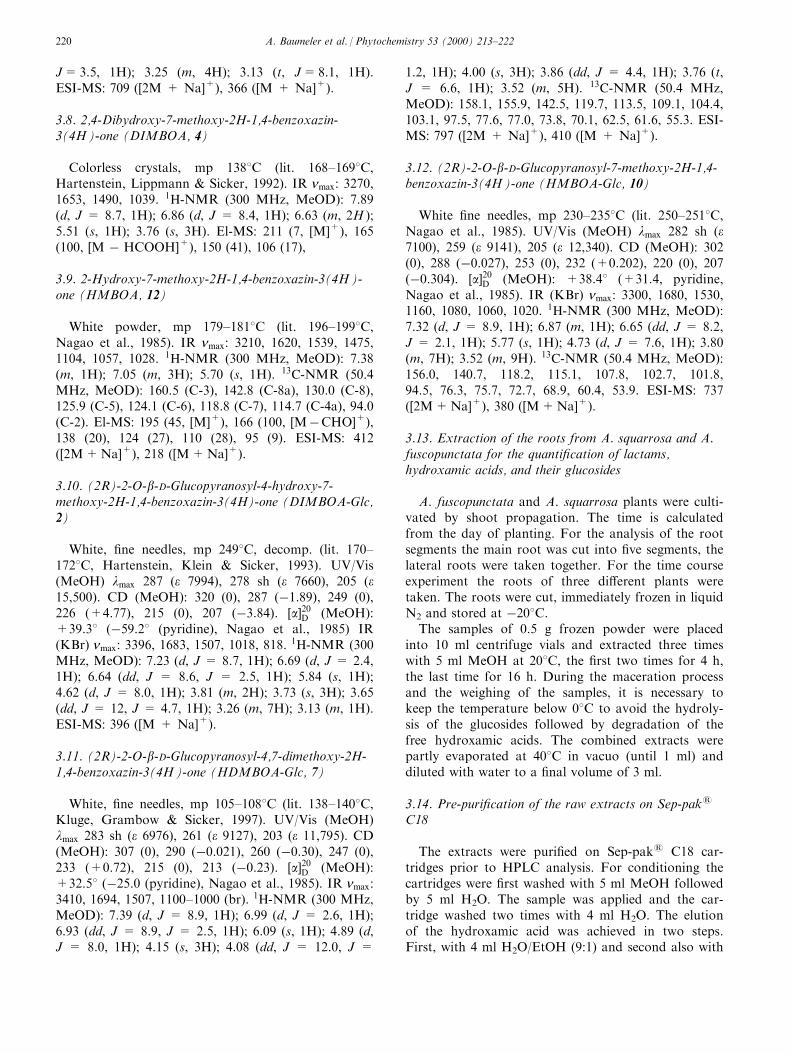
J=3.5, 1H); 3.25 (m, 4H); 3.13 (t, J=8.1, 1H).ESI-MS: 709 ([2M + Na]+), 366 ([M + Na]+).
3.8. 2,4-Dibydroxy-7-methoxy-2H-1,4-benzoxazin-3(4H)-one (DIMBOA, 4)
Colorless crystals, mp 1388C (lit. 168±1698C,Hartenstein, Lippmann & Sicker, 1992). IR nmax: 3270,1653, 1490, 1039. 1H-NMR (300 MHz, MeOD): 7.89(d, J = 8.7, 1H); 6.86 (d, J = 8.4, 1H); 6.63 (m, 2H );5.51 (s, 1H); 3.76 (s, 3H). El-MS: 211 (7, [M]+), 165(100, [M ÿ HCOOH]+), 150 (41), 106 (17),
3.9. 2-Hydroxy-7-methoxy-2H-1,4-benzoxazin-3(4H)-one (HMBOA, 12)
White powder, mp 179±1818C (lit. 196±1998C,Nagao et al., 1985). IR nmax: 3210, 1620, 1539, 1475,1104, 1057, 1028. 1H-NMR (300 MHz, MeOD): 7.38(m, 1H); 7.05 (m, 3H); 5.70 (s, 1H). 13C-NMR (50.4MHz, MeOD): 160.5 (C-3), 142.8 (C-8a), 130.0 (C-8),125.9 (C-5), 124.1 (C-6), 118.8 (C-7), 114.7 (C-4a), 94.0(C-2). El-MS: 195 (45, [M]+), 166 (100, [MÿCHO]+),138 (20), 124 (27), 110 (28), 95 (9). ESI-MS: 412([2M+Na]+), 218 ([M+Na]+).
3.10. (2R)-2-O-b-D-Glucopyranosyl-4-hydroxy-7-methoxy-2H-1,4-benzoxazin-3(4H)-one (DIMBOA-Glc,2)
White, ®ne needles, mp 2498C, decomp. (lit. 170±1728C, Hartenstein, Klein & Sicker, 1993). UV/Vis(MeOH) lmax 287 �e 7994), 278 sh �e 7660), 205 �e15,500). CD (MeOH): 320 (0), 287 (ÿ1.89), 249 (0),226 (+4.77), 215 (0), 207 (ÿ3.84). �a�20D (MeOH):+39.38 (ÿ59.28 (pyridine), Nagao et al., 1985) IR(KBr) nmax: 3396, 1683, 1507, 1018, 818.
1H-NMR (300MHz, MeOD): 7.23 (d, J = 8.7, 1H); 6.69 (d, J = 2.4,1H); 6.64 (dd, J = 8.6, J = 2.5, 1H); 5.84 (s, 1H);4.62 (d, J = 8.0, 1H); 3.81 (m, 2H); 3.73 (s, 3H); 3.65(dd, J = 12, J = 4.7, 1H); 3.26 (m, 7H); 3.13 (m, 1H).ESI-MS: 396 ([M + Na]+).
3.11. (2R)-2-O-b-D-Glucopyranosyl-4,7-dimethoxy-2H-1,4-benzoxazin-3(4H)-one (HDMBOA-Glc, 7)
White, ®ne needles, mp 105±1088C (lit. 138±1408C,Kluge, Grambow & Sicker, 1997). UV/Vis (MeOH)lmax 283 sh �e 6976), 261 �e 9127), 203 �e 11,795). CD(MeOH): 307 (0), 290 (ÿ0.021), 260 (ÿ0.30), 247 (0),233 (+0.72), 215 (0), 213 (ÿ0.23). �a�20D (MeOH):+32.58 (ÿ25.0 (pyridine), Nagao et al., 1985). IR nmax:3410, 1694, 1507, 1100±1000 (br). 1H-NMR (300 MHz,MeOD): 7.39 (d, J = 8.9, 1H); 6.99 (d, J = 2.6, 1H);6.93 (dd, J = 8.9, J = 2.5, 1H); 6.09 (s, 1H); 4.89 (d,J = 8.0, 1H); 4.15 (s, 3H); 4.08 (dd, J = 12.0, J =
1.2, 1H); 4.00 (s, 3H); 3.86 (dd, J = 4.4, 1H); 3.76 (t,J = 6.6, 1H); 3.52 (m, 5H). 13C-NMR (50.4 MHz,MeOD): 158.1, 155.9, 142.5, 119.7, 113.5, 109.1, 104.4,103.1, 97.5, 77.6, 77.0, 73.8, 70.1, 62.5, 61.6, 55.3. ESI-MS: 797 ([2M + Na]+), 410 ([M + Na]+).
3.12. (2R)-2-O-b-D-Glucopyranosyl-7-methoxy-2H-1,4-benzoxazin-3(4H)-one (HMBOA-Glc, 10)
White ®ne needles, mp 230±2358C (lit. 250±2518C,Nagao et al., 1985). UV/Vis (MeOH) lmax 282 sh �e7100), 259 �e 9141), 205 �e 12,340). CD (MeOH): 302(0), 288 (ÿ0.027), 253 (0), 232 (+0.202), 220 (0), 207(ÿ0.304). �a�20D (MeOH): +38.48 (+31.4, pyridine,Nagao et al., 1985). IR (KBr) nmax: 3300, 1680, 1530,1160, 1080, 1060, 1020. 1H-NMR (300 MHz, MeOD):7.32 (d, J = 8.9, 1H); 6.87 (m, 1H); 6.65 (dd, J = 8.2,J = 2.1, 1H); 5.77 (s, 1H); 4.73 (d, J = 7.6, 1H); 3.80(m, 7H); 3.52 (m, 9H). 13C-NMR (50.4 MHz, MeOD):156.0, 140.7, 118.2, 115.1, 107.8, 102.7, 101.8,94.5, 76.3, 75.7, 72.7, 68.9, 60.4, 53.9. ESI-MS: 737([2M+Na]+), 380 ([M+Na]+).
3.13. Extraction of the roots from A. squarrosa and A.fuscopunctata for the quanti®cation of lactams,hydroxamic acids, and their glucosides
A. fuscopunctata and A. squarrosa plants were culti-vated by shoot propagation. The time is calculatedfrom the day of planting. For the analysis of the rootsegments the main root was cut into ®ve segments, thelateral roots were taken together. For the time courseexperiment the roots of three di�erent plants weretaken. The roots were cut, immediately frozen in liquidN2 and stored at ÿ208C.
The samples of 0.5 g frozen powder were placedinto 10 ml centrifuge vials and extracted three timeswith 5 ml MeOH at 208C, the ®rst two times for 4 h,the last time for 16 h. During the maceration processand the weighing of the samples, it is necessary tokeep the temperature below 08C to avoid the hydroly-sis of the glucosides followed by degradation of thefree hydroxamic acids. The combined extracts werepartly evaporated at 408C in vacuo (until 1 ml) anddiluted with water to a ®nal volume of 3 ml.
3.14. Pre-puri®cation of the raw extracts on Sep-pak1
C18
The extracts were puri®ed on Sep-pak1 C18 car-tridges prior to HPLC analysis. For conditioning thecartridges were ®rst washed with 5 ml MeOH followedby 5 ml H2O. The sample was applied and the car-tridge washed two times with 4 ml H2O. The elutionof the hydroxamic acid was achieved in two steps.First, with 4 ml H2O/EtOH (9:1) and second also with
A. Baumeler et al. / Phytochemistry 53 (2000) 213±222220
4 ml H2O/EtOH (8.5:1.5). Both fractions were com-bined and evaporated to dryness in vacuo. For regen-eration the cartridge was ®rst washed with 5 mlMeOH, then with 5 ml H2O in backwards ¯ow direc-tion. The cartridge can be used up to ®ve times.
3.15. HPLC-quanti®cation
For the HPLC analysis the dried samples were dis-solved in an aliquot of MeOH. The quanti®cation wasachieved by the external standard method. Every com-pound was calculated individually with the help of itscalibration curve. The standard deviations were in allmeasurements below 10%.
Acknowledgements
This work is supported by the Swiss NationalFoundation which is gratefully acknowledged. Specialthanks are extended to Dr. L. Bigler for the MS-spec-tra and to Dr. G. Hopp, M. Binder and N. Walch forthe NMR-service.
References
Argandona, V. H., Niemeyer, H. M., & Corcuera, L. J. (1981).
E�ect of content and distribution of hydroxamic acids in wheat
on infestation by the aphid Schizaphis graminum. Phytochemistry,
20, 673±676.
Barnes, J. P., Putman, A. R., Burke, B. A., & Aasen, A. J. (1987).
Isolation and characterization of allelochemicals in rye herbage.
Phytochemistry, 26, 1385±1390.
BuÈ cker, C., & Grambow, H. J. (1990). Alterations in 1,4-benzoxazi-
none levels following inoculation with stem rust in wheat leaves
carrying various alleles for resistance and their possible role as
phytoalexins in moderately resistant leaves. Zeitschrift fuÈr
Naturforschung, 45c, 1151±1155.
Chatterjee, A., Sharma, N. J., Banerji, J., & Basa, S. C. (1990).
Studies on Acanthaceae±benzoxazine glucoside and benzoxazo-
lone from Blepharis edulis Pers. Indian Journal of Chemistry, 29B,
132±134.
Chen, C.-M., & Chen, M.-T. (1976). 6-Methoxybenzoxazolinone and
triterpenoids from roots of Scoparia dulcis. Phytochemistry, 15,
1997±1999.
Copaja, S. V., Barria, B. N., & Niemeyer, H. N. (1991). Hydroxamic
acid content of perennial triticeae. Phytochemistry, 30, 1531±1534.
Hartenstein, H., Lippmann, T., & Sicker, D. (1992). An e�cient pro-
cedure for the isolation of pure 2,4-dihydroxy-7-methoxy-2H-1,4-
benzoxazin-3(4H )-one (DIMBOA) from maize. Indian Journal of
Heterocyclic Chemistry, 2, 75±76.
Hartenstein, H., Klein, J., & Sicker, D. (1993). E�cient isolation
procedure for (2R)-b-D-glucopyranosyloxy-4-hydroxy-7-methoxy-
2H-1,4-benzoxazin-3(4H )-one from maize. Indian Journal of
Heterocyclic Chemistry, 2, 151±153.
Hartenstein, H., & Sicker, D. (1994). (2R)-2-b-D-Glucopyranosyloxy-
4-hydroxy-2H-1,4-benzoxazin-3(4H )-one from Secale cereale.
Phytochemistry, 35, 827±828.
Hashimoto, Y., & Shudo, K. (1996). Chemistry of biologically active
benzoxazinoids. Phytochemistry, 43, 551±559.
Hedberg, C. (1994). I. Spermine and spermidine hydroxy-cinnamoyl-
transferases in Aphelandra tetragona (Vahl) Nees. II. Hydroxamic
acids, their glucosides, and benzoxazolinones in the genus
Aphelandra (Acanthaceae). Inaugural-Dissertation, University of
ZuÈ rich.
Kluge, M., Grambow, H. J., & Sicker, D. (1997). (2R)-2-b-D-Glucopyranosyloxy-4,7-dimethoxy-2H-1,4-benzoxazin-3(4H)-one
from Triticum aestivum. Phytochemistry, 33, 639±641.
Lyons, P. C., Hipskind, J. D., Wood, K. V., & Nicholson,
R. L. (1988). Separation and quanti®cation of cyclic hydroxamic
acids and related compounds by high-pressure liquid chro-
matography. Journal of Agricultural and Food Chemistry, 36, 57±
60.
Mayoral, A. M., Gutierrez, C., Ruiz, M. L., & Castanera, P. (1994).
A high performance liquid chromatography method for quanti®-
cation of DIBOA, DIMBOA and MBOA from aqueous extracts
of corn and winter cereal plants. Journal of Liquid
Chromatography, 17, 2651±2665.
Nagao, T. N., Otsuka, H., Kohda, H., Sato, T., & Yamasaki, K.
(1985). Benzoxazinones from Coix lachryma-jobi var. Ma-yuen.
Phytochemistry, 24, 2959±2962.
Niemeyer, H. M. (1988). Hydroxamic acids (4-hydroxy-1,4-benzoxa-
zin-3-ones), defence chemicals in the gramineae. Phytochemistry,
27, 3349±3358.
Oezden, S., Oezden, T., Attila, I., KuÈ cuÈ kislamoglu, M., & Okatan,
A. (1992). Isolation and identi®cation via high-performance liquid
chromatography and thin-layer chromatography of benzoxazoli-
none precursors from Consolida orientalis ¯owers. Journal of
Chromatography, 609, 402±406.
Pratt, K., Kumar, P., & Chilton, W. S. (1995). Cyclic hydroxamic
acids in dicotyledonous plants. Biochemical Systematics and
Ecology, 23, 781±785.
Schulz, M., Friebe, A., Kuck, P., Seipel, M., & Schnabl, H. (1994).
Allelopathic e�ects of living quackgrass (Agropyron repens L.).
Identi®cation of inhibitory allellochemicals exuded from rhizome
borne roots. Angew. Bot, 68, 195±200.
Sicker, D., & Hartenstein, H. (1993). A new general approach to the
2-hydroxy-2H-1,4-benzoxazin-3(4H )-one skeleton via diisobutyla-
luminium hydride reduction of 2,3-dioxo-1,4-benzoxazines.
Synthesis, 771±772.
Sicker, D., Hartenstein, H., & Kluge, M. (1997). Natural benzoxazi-
noids Ð synthesis of acetal glucosides, aglucones, and analogues.
Recent Research Developments in Phytochemistry, 1, 203±223.
Todorova, M., Werner, C., & Hesse, M. (1994). Enzymatic phenol
oxidation and polymerization of the spermine alkaloid aphelan-
drine. Phytochemistry, 37, 1251±1256.
Virtanen, A. l., & Hietala, P. K. (1955). 2(3)-Benzoxazolinone, an
anti-Fusarium factor in rye seedlings. Acta Chemica Scandinavica,
9, 1543±1544.
Virtanen, A. l., Hietala, P. K., & Wahlroos, O. (1956). An anti-fun-
gal factor in maize and wheat plants. Suomen Kemistilehti, B29,
143.
Virtanen, A. l., & Hietala, P. K. (1960). Precursors of benzoxazoli-
none in rye plants. Acta Chemica Scandinavica, 14, 499±507.
Wahlroos, O., & Virtanen, A. l. (1959). The precursors of 6-methox-
ybenzoxazolinone in maize and wheat plants, their isolation and
some of their properties. Acta Chemica Scandinavica, 13, 1906±
1908.
Werner, C., Hedberg, C., Lorenzi-Riatsch, A., & Hesse, M. (1993).
Accumulation and metabolism of the spermine alkaloid aphelan-
drine in roots of Aphelandra tetragona. Phytochemistry, 33, 1033±
1036.
Wolf, R. B., Spencer, G. F., & Plattner, R. D. (1985).
Benzoxazolinone, 2,4-dihydroxy-1,4-benzoxazin-3-one, and its
glucoside from Acanthus mollis seeds inhibit velvetleaf germina-
tion and growth. Journal of Natural Products, 48, 59±63.
Xie, Y. S., Atkinson, J., Arnason, J. T., Morand, P., & PhilogeÁ ne, B.
A. Baumeler et al. / Phytochemistry 53 (2000) 213±222 221

J. R. (1991). Separation and quanti®cation of 1,4-benzoxazin-3-
ones and benzoxazolin-2-ones in maize root extract by high-per-
formance liquid chromatography. Journal of Chromatography,
543, 389±395.
Zhang, X., Habib, F. K., Ross, M., Burger, U., Lewenstein, A.,
Rose, K., & Jaton, J.-C. (1995). Isolation and characterization of
a cyclic hydroxamic acid from a pollen extract, which inhibits
cancerous cell growth in vitro. Journal of Medicinal Chemistry,
38, 735±738.
Zuniga, G. E., & Massardo, F. (1991). Hydroxamic acid content in
undi�erentiated and di�erentiated tissue of wheat.
Phytochemistry, 30, 3281±3283.
A. Baumeler et al. / Phytochemistry 53 (2000) 213±222222
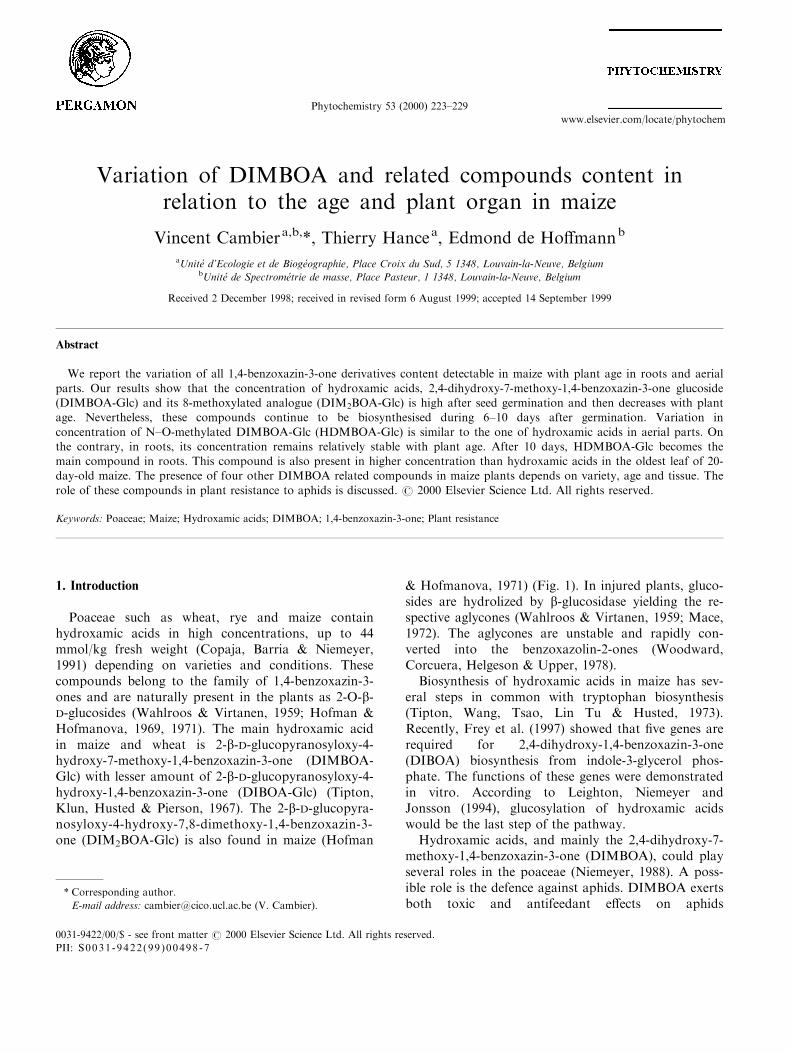
Variation of DIMBOA and related compounds content inrelation to the age and plant organ in maize
Vincent Cambiera,b,*, Thierry Hancea, Edmond de Ho�mannb
aUnite d'Ecologie et de BiogeÂographie, Place Croix du Sud, 5 1348, Louvain-la-Neuve, BelgiumbUnite de SpectromeÂtrie de masse, Place Pasteur, 1 1348, Louvain-la-Neuve, Belgium
Received 2 December 1998; received in revised form 6 August 1999; accepted 14 September 1999
Abstract
We report the variation of all 1,4-benzoxazin-3-one derivatives content detectable in maize with plant age in roots and aerial
parts. Our results show that the concentration of hydroxamic acids, 2,4-dihydroxy-7-methoxy-1,4-benzoxazin-3-one glucoside(DIMBOA-Glc) and its 8-methoxylated analogue (DIM2BOA-Glc) is high after seed germination and then decreases with plantage. Nevertheless, these compounds continue to be biosynthesised during 6±10 days after germination. Variation in
concentration of N±O-methylated DIMBOA-Glc (HDMBOA-Glc) is similar to the one of hydroxamic acids in aerial parts. Onthe contrary, in roots, its concentration remains relatively stable with plant age. After 10 days, HDMBOA-Glc becomes themain compound in roots. This compound is also present in higher concentration than hydroxamic acids in the oldest leaf of 20-day-old maize. The presence of four other DIMBOA related compounds in maize plants depends on variety, age and tissue. The
role of these compounds in plant resistance to aphids is discussed. # 2000 Elsevier Science Ltd. All rights reserved.
Keywords: Poaceae; Maize; Hydroxamic acids; DIMBOA; 1,4-benzoxazin-3-one; Plant resistance
1. Introduction
Poaceae such as wheat, rye and maize containhydroxamic acids in high concentrations, up to 44mmol/kg fresh weight (Copaja, Barria & Niemeyer,1991) depending on varieties and conditions. Thesecompounds belong to the family of 1,4-benzoxazin-3-ones and are naturally present in the plants as 2-O-b-D-glucosides (Wahlroos & Virtanen, 1959; Hofman &Hofmanova, 1969, 1971). The main hydroxamic acidin maize and wheat is 2-b-D-glucopyranosyloxy-4-hydroxy-7-methoxy-1,4-benzoxazin-3-one (DIMBOA-Glc) with lesser amount of 2-b-D-glucopyranosyloxy-4-hydroxy-1,4-benzoxazin-3-one (DIBOA-Glc) (Tipton,Klun, Husted & Pierson, 1967). The 2-b-D-glucopyra-nosyloxy-4-hydroxy-7,8-dimethoxy-1,4-benzoxazin-3-one (DIM2BOA-Glc) is also found in maize (Hofman
& Hofmanova, 1971) (Fig. 1). In injured plants, gluco-sides are hydrolized by b-glucosidase yielding the re-spective aglycones (Wahlroos & Virtanen, 1959; Mace,1972). The aglycones are unstable and rapidly con-verted into the benzoxazolin-2-ones (Woodward,Corcuera, Helgeson & Upper, 1978).
Biosynthesis of hydroxamic acids in maize has sev-eral steps in common with tryptophan biosynthesis(Tipton, Wang, Tsao, Lin Tu & Husted, 1973).Recently, Frey et al. (1997) showed that ®ve genes arerequired for 2,4-dihydroxy-1,4-benzoxazin-3-one(DIBOA) biosynthesis from indole-3-glycerol phos-phate. The functions of these genes were demonstratedin vitro. According to Leighton, Niemeyer andJonsson (1994), glucosylation of hydroxamic acidswould be the last step of the pathway.
Hydroxamic acids, and mainly the 2,4-dihydroxy-7-methoxy-1,4-benzoxazin-3-one (DIMBOA), could playseveral roles in the poaceae (Niemeyer, 1988). A poss-ible role is the defence against aphids. DIMBOA exertsboth toxic and antifeedant e�ects on aphids
Phytochemistry 53 (2000) 223±229
0031-9422/00/$ - see front matter # 2000 Elsevier Science Ltd. All rights reserved.
PII: S0031-9422(99 )00498 -7
www.elsevier.com/locate/phytochem
* Corresponding author.
E-mail address: [email protected] (V. Cambier).

(Niemeyer, Pesel, Franke & Francke, 1989; Givovich& Niemeyer, 1995). Negative relationships were foundbetween DIMBOA concentration in several poaceae(wheat mainly) and aphids performance (Bohidar,Wratten & Niemeyer, 1986; Thackray, Wratten,Edwards & Niemeyer, 1990; Nicol, Copaja, Wratten &Niemeyer, 1992).
DIMBOA-Glc measured as DIMBOA is notdetected in cereal seeds (Argandona, Niemeyer &Corcuera, 1981). According to Argandona et al.(1981), a few days after germination, concentration inthe plant increases abruptly reaching a maximum andthen decreases progressively with plant age.Nevertheless, concentration in the younger leaves atdi�erent plant age is always higher (Argandona et al.,1981; Thackray et al., 1990). A substantial variationwas also found between the concentrations of hydroxa-mic acid of di�erent plants (Argandona et al., 1981;Nicol et al., 1992; Xie, Arnason, PhilogeÁ ne,Olechowski & Hamilton, 1992) and plant organs(Argandona et al., 1981; Argandona & Corcuera,1985).
Other 1,4-benzoxazin-3-one derivatives belonging totwo other classes, lactams and N±O-methylated hydro-xamic acids, are also found in poaceae (Fig. 1)(Cambier, Hance & de Ho�man, 1999). These com-pounds are only present as glucosides in noninjuredplants (Cambier et al., 1999). Their roles in the plantare not well known, and no data is available in the lit-erature on their distribution and variation in concen-tration with plant age.
Our objective is to examine variation with age and
plant organ of the compounds genuinely present in theplant, the glucosides. This study will give informationon the period of biosynthesis of these compounds inthe plant. The results obtained will help to understandtheir roles in maize resistance to aphids.
2. Results
No 1,4-benzoxazin-3-one derivatives were detectedin dry seeds. In noninjured maize seedlings, seven 1,4-benzoxazin-3-one glucosides were found. They belongto three classes: hydroxamates (DIBOA-Glc,DIMBOA-Glc and DIM2BOA-Glc), lactams(HMBOA-Glc and HM2BOA- Glc) and N±O-methyl-ated derivatives (HDMBOA-Glc and HDM2BOA-Glc)(Fig. 1). Only three compounds, DIMBOA-Glc,DIM2BOA-Glc and HDMBOA-Glc, were present bothin roots and aerial parts during all 20 days. The con-centrations and total amounts per plant were followedfor a period of 20 days after germination.
2.1. Variation with plant age
In aerial parts, DIMBOA-Glc concentration washigh two days after germination for Magda (11.7mmol/kg fresh weight) and Sesnord (12.9 mmol/kgfresh weight) varieties. Then, it decreased rapidly withage (Fig. 2a). After 20 days, the concentration was re-spectively 23 and 43 times lower than after 2 days.DIM2BOA-Glc (Fig. 2b) and HDMBOA-Glc (Fig. 2c)concentration also decreased rapidly with plant age.DIMBOA-Glc remained the major 1,4-benzoxazin-3-one derivative during the 20 days following germina-tion.
Although concentrations decreased with plant age,total amounts of each compound increased during the®rst 10 days after germination (Fig. 2f, g and h). Thissuggests that these compounds continue to be bio-synthesised by the plant. The decrease of DIMBOA-Glc and DIM2BOA-Glc content, observed after 10days suggests that these compounds are transformed,released and/or degraded by the plant.
In roots, changes of DIMBOA-Glc (Fig. 2d) andDIM2BOA-Glc (data not shown) concentration weresimilar to those in aerial parts. Nevertheless, concen-trations were always lower. These hydroxamic acidsare probably synthesised during the ®rst days anddegraded, released and/or transformed by the plantafter 10 days (Fig. 2i). Changes of HDMBOA-Glc inroots were very di�erent than those of hydroxamicacids (Fig. 2e). Indeed, the concentration did notdecrease with plant age but remained quite stable.Fig. 2j suggests that HDMBOA-Glc is biosynthesisedby the plant during the ®rst 15 days. The ®rst six daysafter germination, the DIMBOA-Glc concentration
Fig. 1. Benzoxazinone derivatives present in maize plants (Magda
and Sesnord varieties).
V. Cambier et al. / Phytochemistry 53 (2000) 223±229224

Fig. 2. Variation of benzoxazinone derivatives with age in aerial parts and roots of maize seedlings (Magda variety). (a)±(e): Variation in concen-
tration. (a): DIMBOA-Glc in aerial parts. (b): DIM2BOA-Glc in aerial parts. (c): HDMBOA-Glc in aerial parts. (d): DIMBOA-Glc in roots. (e):
HDMBOA-Glc in roots. (f)±(j): Variation in total amounts per plant. (f): DIMBOA-Glc in aerial parts. (g): DIM2BOA-Glc in aerial parts. (h):
HDMBOA-Glc in aerial parts. (i): DIMBOA-Glc in roots. (j): HDMBOA-Glc in roots. Each point on the graph represents the mean of three
replicates. One plant per replicate was used. Vertical lines at data points show standard deviations.
V. Cambier et al. / Phytochemistry 53 (2000) 223±229 225
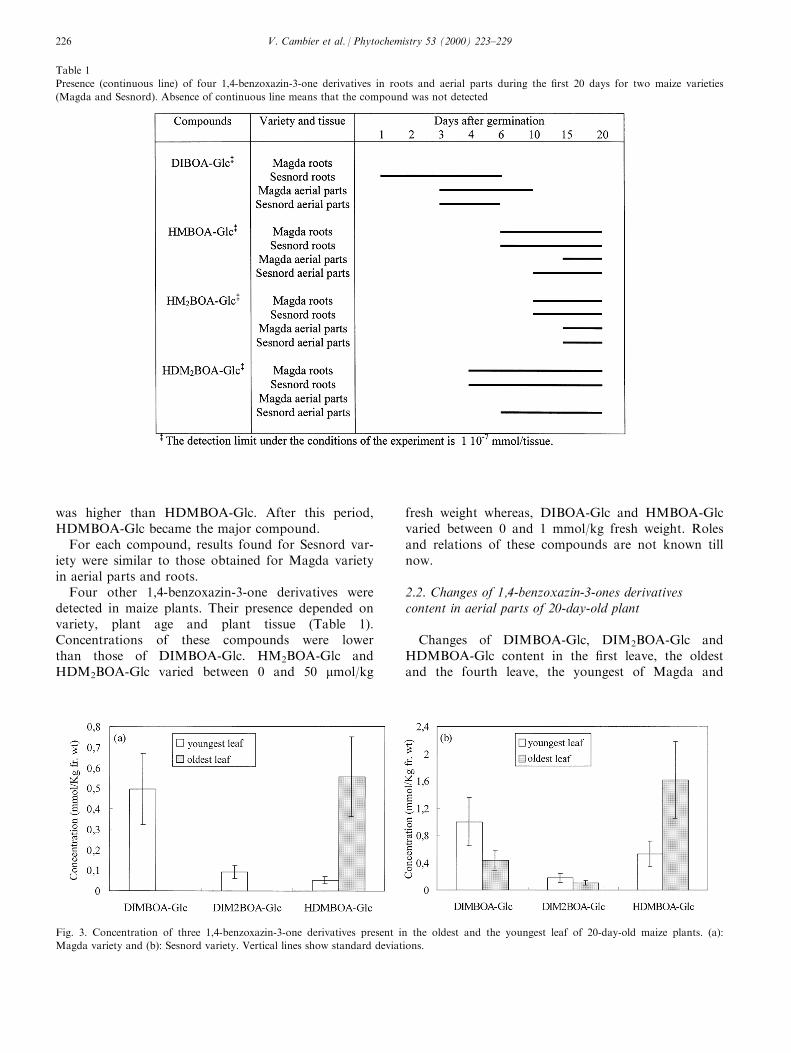
was higher than HDMBOA-Glc. After this period,HDMBOA-Glc became the major compound.
For each compound, results found for Sesnord var-iety were similar to those obtained for Magda varietyin aerial parts and roots.
Four other 1,4-benzoxazin-3-one derivatives weredetected in maize plants. Their presence depended onvariety, plant age and plant tissue (Table 1).Concentrations of these compounds were lowerthan those of DIMBOA-Glc. HM2BOA-Glc andHDM2BOA-Glc varied between 0 and 50 mmol/kg
fresh weight whereas, DIBOA-Glc and HMBOA-Glcvaried between 0 and 1 mmol/kg fresh weight. Rolesand relations of these compounds are not known tillnow.
2.2. Changes of 1,4-benzoxazin-3-ones derivativescontent in aerial parts of 20-day-old plant
Changes of DIMBOA-Glc, DIM2BOA-Glc andHDMBOA-Glc content in the ®rst leave, the oldestand the fourth leave, the youngest of Magda and
Table 1
Presence (continuous line) of four 1,4-benzoxazin-3-one derivatives in roots and aerial parts during the ®rst 20 days for two maize varieties
(Magda and Sesnord). Absence of continuous line means that the compound was not detected
Fig. 3. Concentration of three 1,4-benzoxazin-3-one derivatives present in the oldest and the youngest leaf of 20-day-old maize plants. (a):
Magda variety and (b): Sesnord variety. Vertical lines show standard deviations.
V. Cambier et al. / Phytochemistry 53 (2000) 223±229226
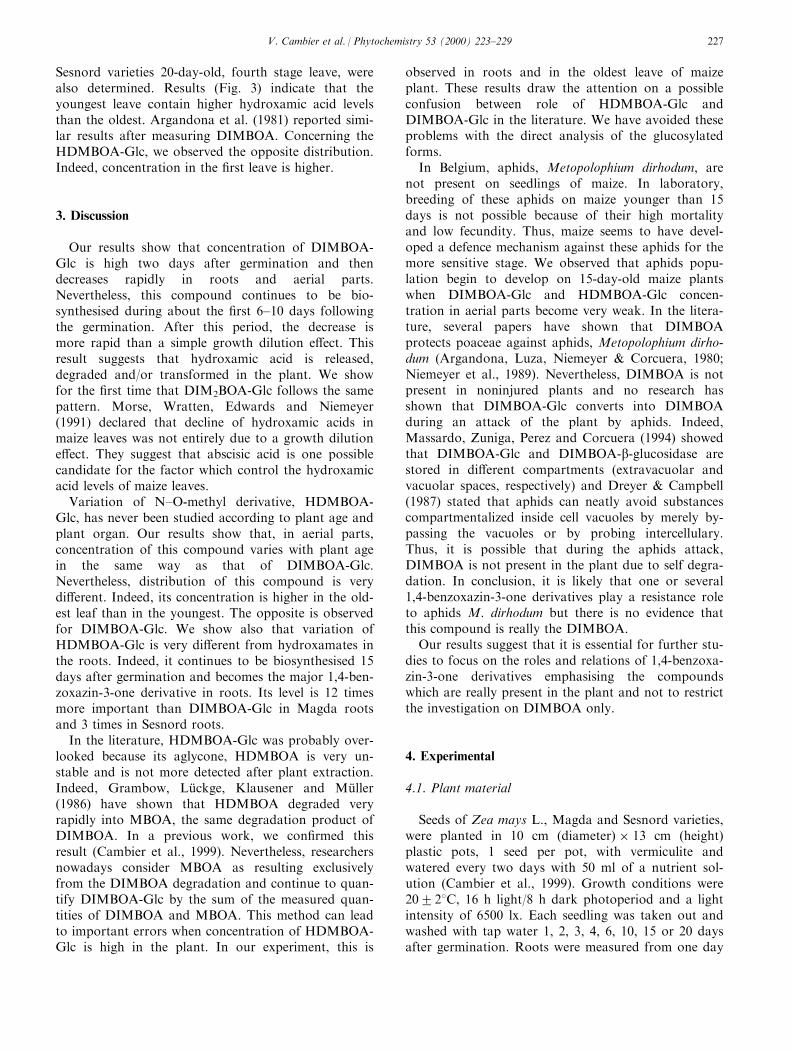
Sesnord varieties 20-day-old, fourth stage leave, werealso determined. Results (Fig. 3) indicate that theyoungest leave contain higher hydroxamic acid levelsthan the oldest. Argandona et al. (1981) reported simi-lar results after measuring DIMBOA. Concerning theHDMBOA-Glc, we observed the opposite distribution.Indeed, concentration in the ®rst leave is higher.
3. Discussion
Our results show that concentration of DIMBOA-Glc is high two days after germination and thendecreases rapidly in roots and aerial parts.Nevertheless, this compound continues to be bio-synthesised during about the ®rst 6±10 days followingthe germination. After this period, the decrease ismore rapid than a simple growth dilution e�ect. Thisresult suggests that hydroxamic acid is released,degraded and/or transformed in the plant. We showfor the ®rst time that DIM2BOA-Glc follows the samepattern. Morse, Wratten, Edwards and Niemeyer(1991) declared that decline of hydroxamic acids inmaize leaves was not entirely due to a growth dilutione�ect. They suggest that abscisic acid is one possiblecandidate for the factor which control the hydroxamicacid levels of maize leaves.
Variation of N±O-methyl derivative, HDMBOA-Glc, has never been studied according to plant age andplant organ. Our results show that, in aerial parts,concentration of this compound varies with plant agein the same way as that of DIMBOA-Glc.Nevertheless, distribution of this compound is verydi�erent. Indeed, its concentration is higher in the old-est leaf than in the youngest. The opposite is observedfor DIMBOA-Glc. We show also that variation ofHDMBOA-Glc is very di�erent from hydroxamates inthe roots. Indeed, it continues to be biosynthesised 15days after germination and becomes the major 1,4-ben-zoxazin-3-one derivative in roots. Its level is 12 timesmore important than DIMBOA-Glc in Magda rootsand 3 times in Sesnord roots.
In the literature, HDMBOA-Glc was probably over-looked because its aglycone, HDMBOA is very un-stable and is not more detected after plant extraction.Indeed, Grambow, LuÈ ckge, Klausener and MuÈ ller(1986) have shown that HDMBOA degraded veryrapidly into MBOA, the same degradation product ofDIMBOA. In a previous work, we con®rmed thisresult (Cambier et al., 1999). Nevertheless, researchersnowadays consider MBOA as resulting exclusivelyfrom the DIMBOA degradation and continue to quan-tify DIMBOA-Glc by the sum of the measured quan-tities of DIMBOA and MBOA. This method can leadto important errors when concentration of HDMBOA-Glc is high in the plant. In our experiment, this is
observed in roots and in the oldest leave of maizeplant. These results draw the attention on a possibleconfusion between role of HDMBOA-Glc andDIMBOA-Glc in the literature. We have avoided theseproblems with the direct analysis of the glucosylatedforms.
In Belgium, aphids, Metopolophium dirhodum, arenot present on seedlings of maize. In laboratory,breeding of these aphids on maize younger than 15days is not possible because of their high mortalityand low fecundity. Thus, maize seems to have devel-oped a defence mechanism against these aphids for themore sensitive stage. We observed that aphids popu-lation begin to develop on 15-day-old maize plantswhen DIMBOA-Glc and HDMBOA-Glc concen-tration in aerial parts become very weak. In the litera-ture, several papers have shown that DIMBOAprotects poaceae against aphids, Metopolophium dirho-dum (Argandona, Luza, Niemeyer & Corcuera, 1980;Niemeyer et al., 1989). Nevertheless, DIMBOA is notpresent in noninjured plants and no research hasshown that DIMBOA-Glc converts into DIMBOAduring an attack of the plant by aphids. Indeed,Massardo, Zuniga, Perez and Corcuera (1994) showedthat DIMBOA-Glc and DIMBOA-b-glucosidase arestored in di�erent compartments (extravacuolar andvacuolar spaces, respectively) and Dreyer & Campbell(1987) stated that aphids can neatly avoid substancescompartmentalized inside cell vacuoles by merely by-passing the vacuoles or by probing intercellulary.Thus, it is possible that during the aphids attack,DIMBOA is not present in the plant due to self degra-dation. In conclusion, it is likely that one or several1,4-benzoxazin-3-one derivatives play a resistance roleto aphids M. dirhodum but there is no evidence thatthis compound is really the DIMBOA.
Our results suggest that it is essential for further stu-dies to focus on the roles and relations of 1,4-benzoxa-zin-3-one derivatives emphasising the compoundswhich are really present in the plant and not to restrictthe investigation on DIMBOA only.
4. Experimental
4.1. Plant material
Seeds of Zea mays L., Magda and Sesnord varieties,were planted in 10 cm (diameter) � 13 cm (height)plastic pots, 1 seed per pot, with vermiculite andwatered every two days with 50 ml of a nutrient sol-ution (Cambier et al., 1999). Growth conditions were20228C, 16 h light/8 h dark photoperiod and a lightintensity of 6500 lx. Each seedling was taken out andwashed with tap water 1, 2, 3, 4, 6, 10, 15 or 20 daysafter germination. Roots were measured from one day
V. Cambier et al. / Phytochemistry 53 (2000) 223±229 227

after germination, and aerial parts from the time whenthey become visible, two days after germination. Rootsand aerial parts were cut at their junction with theseed and then weighed. The ®rst and the fourth leaf of20-day-old maize plants, fourth leaf stage, were alsocut.
4.2. Extraction method
Roots or aerial parts of each plant were cut in smallpieces, put in 60 ml of boiling methanol and heatedfor 30 min. A standard was then added (1 ml of BOA0,65 mM per sample). The methanol extract was separ-ated by decantation and evaporated under vacuum.The residue was redissolved in 200 ml of methanol.Preliminary tests showed that over 95% of each 1,4-benzoxazin-3-one derivative were extracted with thismethod. Each process was repeated at least threetimes. Samples were stored in a freezer (ÿ208C) beforeanalysis.
Nongerminated dry maize seeds were macerated inboiling methanol during 30 min. Solid residue wascrushed with 10 ml of methanol and a small amountof ®ne sand. The homogenate was centrifuged (2000 g)for 5 min and the supernatant was combined with theprevious extract. The methanol was then evaporatedunder vacuum. The residue was redissolved in 200 mlof methanol.
4.3. Instrumentation and HPLC±APCI procedures
The method employed for HPLC was similar to theone described by Lyons, Hipskind, Wood andNicholson (1988) and Cambier et al. (1999). Sampleswere chromatographed with a Spectra System AS 3000on a 2,1 mm � 25 cm microbore reversed phase C18column (5 mm, adsorbosphere). A two-solvent systemwas used to generate the mobile phase: solvent A was1% acetic acid in water and solvent B was 100%methanol. Solvents were degassed and ®ltered perma-nently. The ¯ow rate was 200 ml/min. The mobilephase at the initiation of each run was a 8:2 ratio (Ato B). Before analysis, all samples were passed througha 0.2 mm ®lter. After injection of 3 ml of this ®ltrate, a3 min linear gradient from 8:2 to 5:5 A/B was appliedand held for another 17 min. Elution was monitoredat 280 nm with a Spectra System UV 1000 detectorand mass spectrometry.
The mobile phase ¯ow was connected to a FinniganMAT (San Jose, CA) TSQ 7000 triple quadrupolemass spectrometer with an atmospheric pressurechemical ionisation source (APCI) interface. Nitrogenwas used as both nebulizer (70 psi) and auxiliary (10psi) gas of the liquid inlet. The APCI source was oper-ated at 7 kV corona discharge. The capillary tempera-
ture was 2208C and the vaporiser temperature was4008C. Spectra were acquired in negative ion mode.
4.4. Semi-quantitative analysis of 1,4-benzoxazin-3-onederivatives
The concentration of DIMBOA-Glc + DIM2BOA-Glc (two coeluting compounds), and HDMBOA-Glcwere estimated using UV detection by comparison oftheir peak area with the peak area of standard (BOA).The UV extinction coe�cients (280 nm) of these com-pounds were determined in water/methanol (50/50). eBOA = 28002200, e DIMBOA-Glc = 10,3002500,e HDMBOA-Glc = 83002400. e DIMBOA-Glc ande DIM2BOA-Glc were supposed to be identical. Massspectrometry allowed the semi-quantitative analysis ofDIMBOA-Glc and DIM2BOA-Glc separately. Ratioof peak intensity of DIMBOA-Glc deprotonated mol-ecular ion (372 u) and peak intensity of DIM2BOA-Glc deprotonated molecular ion (402 u) was used tomeasure relative concentration of these two com-pounds supposing the constant response factor. Withthese methods, the concentrations of these compoundsare not exactly known but they give good approxi-mations, maximum experimental error being 25%.
Acknowledgements
V. Cambier has been supported by a Ph.D. fellow-ship from the Fonds pour la Formation aÁ laRecherche dans l'Industrie et dans l'Agriculture(F.R.I.A.). T. Hance is a Research Associate of theNational Fund for Scienti®c Research (Belgium). Theauthors are indebted to the Belgium National Fundfor Scienti®c Research (F.N.R.S.).
References
Argandona, V. H., & Corcuera, L. J. (1985). Phytochemistry, 24, 1.
Argandona, V. H., Luza, J. G., Niemeyer, H. M., & Corcuera, L. J.
(1980). Phytochemistry, 19, 1665.
Argandona, V. H., Niemeyer, H. M., & Corcuera, L. J. (1981).
Phytochemistry,, 20, 673.
Bohidar, K., Wratten, S. D., & Niemeyer, H. M. (1986). Annals of
Applied Biology, 109, 193.
Cambier, V., Hance, T., & de Ho�mann, E. (1999). Phytochemical
Analysis, 10, 119.
Copaja, S. V., Barria, B. N., & Niemeyer, H. M. (1991).
Phytochemistry, 30, 1531.
Dreyer, D. L., & Campbell, B. C. (1987). Plant, Cell and
Environment, 10, 353.
Frey, M., Chomet, P., Glawischnig, E., Stettner, C., Grun, S.,
Winklmair, A., Eisenreich, W., Bacher, A., Meeley, R. B., Briggs,
S. P., Simcox, K., & Gierl, A. (1997). Science, 277, 696.
Givovich, A., & Niemeyer, H. M. (1995). Entomologia
Experimentalis et Applicata, 74, 115.
V. Cambier et al. / Phytochemistry 53 (2000) 223±229228

Grambow, H. J., LuÈ ckge, J., Klausener, A., & MuÈ ller, E. (1986).
Zeitschrift fur Naturforschung, 41c, 684.
Hofman, J., & Hofmanova, O. (1969). European Journal of
Biochemistry,, 8, 109.
Hofman, J., & Hofmanova, O. (1971). Phytochemistry, 10, 1441.
Leighton, V., Niemeyer, H. M., & Jonsson, L. M. V. (1994).
Phytochemistry, 36, 887.
Lyons, P. C., Hipskind, J. D., Wood, K. V., & Nicholson, R. L.
(1988). Journal of Agricultural and Food Chemistry, 36, 57.
Mace, M. E. (1972). Phytopathology, 63, 243.
Massardo, F., Zuniga, G. E., Perez, L. M., & Corcuera, L. J. (1994).
Phytochemistry, 35, 873.
Morse, S., Wratten, S. D., Edwards, P. J., & Niemeyer, H. M.
(1991). Annals of Applied Biology, 119, 239.
Nicol, D., Copaja, S. V., Wratten, S. D., & Niemeyer, H. M. (1992).
Annals of Applied Biology, 121, 11.
Niemeyer, H. M., Pesel, E., Franke, S., & Francke, W. (1989).
Phytochemistry, 28, 2307.
Niemeyer, H. M. (1988). Phytochemistry, 27, 3349.
Thackray, D. J., Wratten, S. D., Edwards, P. J., & Niemeyer, H. M.
(1990). Annals of Applied Biology, 116, 573.
Tipton, C. L., Klun, J. A., Husted, R. R., & Pierson, M. D. (1967).
Biochemistry, 6, 2866.
Tipton, C. L., Wang, M.-C., Tsao, F. H.-C., Lin Tu, C.-C., &
Husted, R. R. (1973). Phytochemistry, 12, 347.
Wahlroos, O., & Virtanen, I. (1959). Acta Chemica Scandinavica,
1906, 13.
Woodward, M. D., Corcuera, L. J., Helgeson, J. P., & Upper, C. D.
(1978). Plant Physiology, 61, 796.
Xie, Y., Arnason, J. T., PhilogeÁ ne, B. J. R., Olechowski, H. T., &
Hamilton, R. I. (1992). Journal of Economic Entomology, 85,
2478.
V. Cambier et al. / Phytochemistry 53 (2000) 223±229 229

Trans-4-aminoproline, a phytotoxic metabolite with herbicidalactivity produced by Ascochyta caulina
Antonio Evidentea,*, Anna Andol®a, Maurizio Vurrob, Maria Chiara Zonnob,Andrea Mottac
aDipartimento di Scienze Chimico-Agrarie, Universita di Napoli Federico II, Via Universita 100, I-80055 Portici, ItalybIstituto Tossine e Micotossine da Parassiti Vegetali, CNR, Viale L. Einaudi 51, I-70125 Bari, Italy
cIstituto per la Chimica di Molecole di Interesse Biologico, CNR, Via Toiano 6, I-80072 Arco Felice, Italy
Received 8 July 1999; received in revised form 14 September 1999; accepted 15 September 1999
Abstract
A phytotoxic metabolite, characterized through NMR techniques and synthetic methods as trans-4-aminoproline, was isolatedfrom the culture ®ltrates of Ascochyta caulina, a promising mycoherbicide for biological control of Chenopodium album. Themetabolite, which shows interesting phytotoxic properties, together with ascaulitoxin (recently characterized as N 2-b-D-glucosideof the unusual bis-amino acid 2,4,7-triamino-5-hydroxyoctandioc acid) and another unidenti®ed compound, compose an activefraction of A. caulina culture ®ltrates with promising herbicidal properties. When assayed on leaves of host and non host dicots,including wild and cultivated plants, the trans-4-aminoproline showed a wide range of toxicity, with leaves of C. album being the
most sensitive. Other interesting aspects were its ine�cacy on several monocots, both cultivated and wild, and its lack ofantifungal, antibiotic and zootoxic activities. This is the ®rst report on trans-4-aminoproline as naturally occurring compoundand phytotoxic metabolite produced by A. caulina. # 2000 Elsevier Science Ltd. All rights reserved.
Keywords: Chenopodium album; Ascochyta caulina; Phytotoxins; Nonproteigenic amino acids; Trans-4-aminoproline; Weed biocontrol
1. Introduction
The perthotrophic fungal species Ascochyta caulina(P. Karst.) v.d. Aa and v. Kest. has been proposed asa mycoherbicide against Chenopodium album (L.)(Kempenaar, 1995). This is known as common lambs-quarter or fat hen and is a common world-wide weedof many arable crops as sugar beet and maize (Holm,Pluckett, Pancho & Herberger, 1977). The applicationof pycnidiospores of the fungus to C. album plantscauses the appearance of large necrosis of leaves andstems, and depending on the amount of necrosis devel-oped, plants show retarded growth or death.Preliminary experiments had showed that A. caulina
produced in vitro phytotoxic hydrophilic low molecu-lar weight metabolites (Scheepens, Kempenaar,Adreanas, Eggers, Netland & Vurro, 1997), whichcould be relevant for an alternative, or in addition, tothe use of pathogens in weed biocontrol (Strobel,Kien®eld, Bunkers, Sugawara & Clardy, 1991).Recently, the main phytotoxin, named ascaulitoxin,has been isolated and characterized as N 2-b-D-gluco-side of the unusual bis-amino acid 2,4,7-triamino-5-hydroxyoctandioc acid (Evidente et al., 1998).Considering that the other toxic metabolites alsoexhibited an amino acidic nature, the culture ®ltrateswere preliminarily fractionated by cationic-exchangechromatography obtaining a mixture of phytotoxins.The puri®cation of this mixture by gel ®ltration chro-matography allowed isolation of a further phytotoxinwhich, together with ascaulitoxin and other stillunknown metabolites, is responsible for the high phy-totoxicity of the fungal culture ®ltrate.
Phytochemistry 53 (2000) 231±237
0031-9422/00/$ - see front matter # 2000 Elsevier Science Ltd. All rights reserved.
PII: S0031-9422(99 )00507 -5
www.elsevier.com/locate/phytochem
* Corresponding author. Tel.: +39-081-7885224; fax: +39-081-
7755130.
E-mail address: [email protected] (A. Evidente).
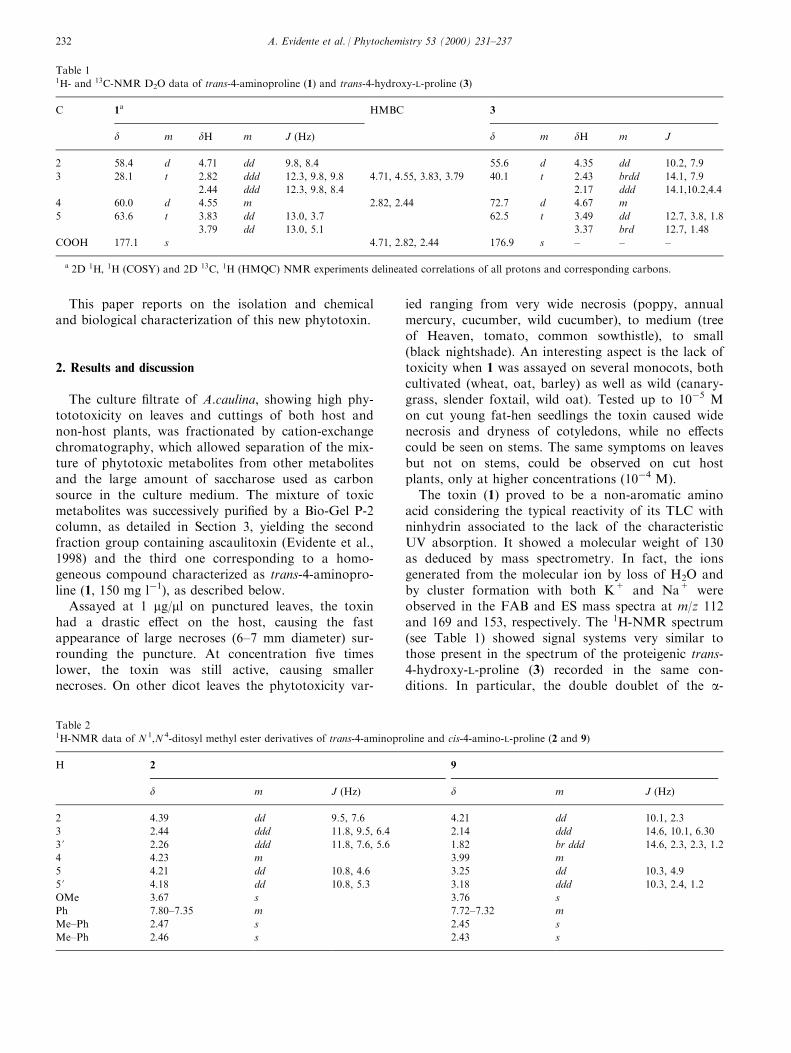
This paper reports on the isolation and chemicaland biological characterization of this new phytotoxin.
2. Results and discussion
The culture ®ltrate of A.caulina, showing high phy-tototoxicity on leaves and cuttings of both host andnon-host plants, was fractionated by cation-exchangechromatography, which allowed separation of the mix-ture of phytotoxic metabolites from other metabolitesand the large amount of saccharose used as carbonsource in the culture medium. The mixture of toxicmetabolites was successively puri®ed by a Bio-Gel P-2column, as detailed in Section 3, yielding the secondfraction group containing ascaulitoxin (Evidente et al.,1998) and the third one corresponding to a homo-geneous compound characterized as trans-4-aminopro-line (1, 150 mg lÿ1), as described below.
Assayed at 1 mg/ml on punctured leaves, the toxinhad a drastic e�ect on the host, causing the fastappearance of large necroses (6±7 mm diameter) sur-rounding the puncture. At concentration ®ve timeslower, the toxin was still active, causing smallernecroses. On other dicot leaves the phytotoxicity var-
ied ranging from very wide necrosis (poppy, annualmercury, cucumber, wild cucumber), to medium (treeof Heaven, tomato, common sowthistle), to small(black nightshade). An interesting aspect is the lack oftoxicity when 1 was assayed on several monocots, bothcultivated (wheat, oat, barley) as well as wild (canary-grass, slender foxtail, wild oat). Tested up to 10ÿ5 Mon cut young fat-hen seedlings the toxin caused widenecrosis and dryness of cotyledons, while no e�ectscould be seen on stems. The same symptoms on leavesbut not on stems, could be observed on cut hostplants, only at higher concentrations (10ÿ4 M).
The toxin (1) proved to be a non-aromatic aminoacid considering the typical reactivity of its TLC withninhydrin associated to the lack of the characteristicUV absorption. It showed a molecular weight of 130as deduced by mass spectrometry. In fact, the ionsgenerated from the molecular ion by loss of H2O andby cluster formation with both K+ and Na+ wereobserved in the FAB and ES mass spectra at m/z 112and 169 and 153, respectively. The 1H-NMR spectrum(see Table 1) showed signal systems very similar tothose present in the spectrum of the proteigenic trans-4-hydroxy-L-proline (3) recorded in the same con-ditions. In particular, the double doublet of the a-
Table 11H- and 13C-NMR D2O data of trans-4-aminoproline (1) and trans-4-hydroxy-L-proline (3)
C 1a HMBC 3
d m dH m J (Hz) d m dH m J
2 58.4 d 4.71 dd 9.8, 8.4 55.6 d 4.35 dd 10.2, 7.9
3 28.1 t 2.82 ddd 12.3, 9.8, 9.8 4.71, 4.55, 3.83, 3.79 40.1 t 2.43 brdd 14.1, 7.9
2.44 ddd 12.3, 9.8, 8.4 2.17 ddd 14.1,10.2,4.4
4 60.0 d 4.55 m 2.82, 2.44 72.7 d 4.67 m
5 63.6 t 3.83 dd 13.0, 3.7 62.5 t 3.49 dd 12.7, 3.8, 1.8
3.79 dd 13.0, 5.1 3.37 brd 12.7, 1.48
COOH 177.1 s 4.71, 2.82, 2.44 176.9 s ± ± ±
a 2D 1H, 1H (COSY) and 2D 13C, 1H (HMQC) NMR experiments delineated correlations of all protons and corresponding carbons.
Table 21H-NMR data of N 1,N 4-ditosyl methyl ester derivatives of trans-4-aminoproline and cis-4-amino-L-proline (2 and 9)
H 2 9
d m J (Hz) d m J (Hz)
2 4.39 dd 9.5, 7.6 4.21 dd 10.1, 2.3
3 2.44 ddd 11.8, 9.5, 6.4 2.14 ddd 14.6, 10.1, 6.30
3 ' 2.26 ddd 11.8, 7.6, 5.6 1.82 br ddd 14.6, 2.3, 2.3, 1.2
4 4.23 m 3.99 m
5 4.21 dd 10.8, 4.6 3.25 dd 10.3, 4.9
5 ' 4.18 dd 10.8, 5.3 3.18 ddd 10.3, 2.4, 1.2
OMe 3.67 s 3.76 s
Ph 7.80±7.35 m 7.72±7.32 m
Me±Ph 2.47 s 2.45 s
Me±Ph 2.46 s 2.43 s
A. Evidente et al. / Phytochemistry 53 (2000) 231±237232

amino acidic proton (H-2) at d 4.71, coupled, in theCOSY spectrum (Bax & Freeman, 1981), with bothprotons of the adjacent methylene group (H2C-3),which appeared as two double doublets at d 2.82 and2.44. Both of them correlated with the H-4 protonresonating as a complex multiplet at d 4.55, a chemicalshift characteristic of a secondary carbon bearing anamino group (Pretsch, Clerc, Seibl & Simon, 1983).
Finally, the latter coupled with the protons of afurther methylene group (H2C-5), appearing as twodouble doublets at d 3.83 and 3.79, which are typicalof the methylene bonded to the nitrogen of proline de-rivatives (Pretsch et al., 1983). Taken together, thesedata suggest the structure of 4-aminoproline for thisnew toxin. The 13C-NMR data were consistent withthose of 3 (Table 1) but with an amino group and acarboxylic groups at C-4 and C-2, respectively resonat-ing at the typical chemical shift values of d 60.0 and58.4, together with the signi®cant singlet of the car-boxylic group observed at d 177.1 (Pretsch et al., 1983;Breitmaier & Voelter, 1987). Furthermore, the struc-ture 1 was corroborated by the correlations recordedin the HMQC spectrum (Table 1) (Bax, Ikura, Kay,Torchia & Tschudin, 1990).
The structure of 4-aminoproline was con®rmed bypreparing the corresponding N 1,N 4-ditosylmethyl esterderivative (2). Its 1H-NMR (see Table 2), besides thesignals of the two tosyl (Ts) groups and the singlet ofthe ester methoxy group at d 3.67, showed a signalpattern very similar to that of 1 except for the down-®eld shift �Dd 0.38 and 0.39, respectively) of both H-5and H-5 ', observed as two double doublets at d 4.21and 4.18. The EIMS did not show the molecular ionat m/z 452 but the ion at m/z 394, generated from it
by loss of the a-lactone (2-etanolide), which is a frag-mentation mechanism typical of proline derivatives(Porter, 1985). Similarly, the parent ion, by successiveloss of CO2Me and Ts residues, generated the ion atm/z 222. By an alternative fragmentation mechanism,the molecular ion, losing in succession two TsNH, orTsNH2 residues, produced the ions at m/z 282, 92 and281, respectively. The base peak, corresponding to theexpected tropylium ion, was recorded at m/z 91.
Considering that 4-aminoproline can exist as fourstereoisomers and that biological activity of pyrrolidinederivatives depend on their substitution pattern, func-tionalization and absolute con®guration (Massiot &Delaude, 1986; Numata & Ibuka, 1987; Tanaka,Suzuki & Sawanishi, 1996; Thorbek, Hjeds &Schaumburg, 1981), a study was undertaken to deter-mine the stereochemistry of the toxin. Unfortunately, 1and crystals of derivative 2 proved to be unsuitable forX-ray analysis. Therefore, the determination of therelative stereochemistry of 4-aminoproline was carriedout by chemical methods and comparing the physicaland the spectroscopic properties of the N 1,N 4-ditosylmethyl ester derivative, obtained from 1, and from thecommercially available trans-4-hydroxy-L-proline (3),whose absolute con®guration is 2S, 4R.
The well known synthetic procedure (Andreatta,Nair, Robertson, & Simpson, 1967; Portoghese &Mikhail, 1966) adopted to convert 3 into the corre-sponding N 1,N 4-ditosyl methyl ester derivative, isdepicted in Fig. 1. The proteigenic amino acid (3) was®rst transformed into the N-tosyl derivative (4), whichin turn was esteri®ed with ethereal diazomethane andthen the resulting methyl ester (5) converted into thecorresponding N,O-ditosyl derivative (6). The latter,
Fig. 1. Synthesis of N 1,N 4-ditosyl-cis-4-amino-L-proline methyl ester.
A. Evidente et al. / Phytochemistry 53 (2000) 231±237 233

by nucleophilic substitution, was transformed into thecorresponding azido derivative (7) with inversion ofthe con®guration at C-4. This was ®rst reduced by cat-alytic hydrogenation and the resulting very unstableamino derivative converted into N 1,N 4-ditosyl-cis-4-amino-L-proline methyl ester (9). Derivative 9 provedto be di�erent from the N 1,N 4-ditosyl methyl ester (2)prepared starting from 1. In fact, 2 and 9 showeddi�erent optical rotations and TLC behaviours inthree di�erent systems (see Section 3). Moreover, their1H-NMR spectra (Table 2), recorded in the same con-ditions, appeared signi®cantly di�erent in terms ofchemical shifts and coupling constants. In particular,comparing 2 and 9, the H-3 ', H-4 and both H-5 andH-5 ' appeared low®eld shifted �Dd 0.44, 0.24, 0.96 and1.00, respectively) at d 2.26, 4.23, 4.21 and 4.18, re-spectively, while the coupling constants between H-3 'with both H-2 and H-4 and H-4 with H-5 ' were mark-edly di�erent. On these bases the two ditosyl methylester derivatives (2 and 9) appeared to be diastereo-mers and therefore the relative stereostructure of trans-4-aminopyrrolidine-2-carboxylic acid can be assignedto 4-aminoproline (1). Furthermore, the speci®c opticalrotation value ��a�21D +47.2) measured for 1 and thatreported for the trans-4-amino-L-proline ��a�21D ÿ57.8)shared their enantiomeric relation, therefore suggestingthe absolute trans-4-amino-D-proline stereostructurefor 1. Further attempts are in progress to con®rm thisrelative and possibly absolute stereochemistry by X-ray analysis of a suitable derivative.
Chiral non racemic pyrrolydines are common struc-tural subunits found in many natural and syntheticproducts with biological activity (Massiot & Delaude,1986; Numata & Ibuka, 1987). Biological activities ofpyrrolidines are a�ected by both the functionalizationand stereochemistry of the pyrrolidine ring (Massiot &Delaude, 1986; Numata & Ibuka, 1987; Tanaka et al.,1996; Thorbek et al., 1981). Among these, cucurbitine(Tanaka et al., 1996; Fang, Li, Niu & Tseng, 1961;Shiao, Shao, Ho, Yang & Mao, 1962), containing (S )-a-amino acid function at 3-position in the pyrrolidinering and cis-3-amino-L-proline (Hatanaka, 1969) arethe naturally occurring non proteigenic bioactiveamino acids more related to trans-4-aminoproline (1).Trans-4-aminoproline is already known as syntheticproduct (Andreatta et al., 1967; Mauger & Witkop,1966), but this is its ®rst report as naturally occurringcompound and as phytotoxin produced by A. caulinawith potential bioherbicidal activity.
Considering the high phytotoxic activity of the com-pound on fat-hen, the range of activity for otherdicots, and its ine�cacy against monocots associatedto the lack of antifungal, antibiotic and zootoxic ac-tivity in the used assays, investigations on the practicaluse of the toxin as natural herbicide, as alternative orin addition to the use of the producing pathogen are
very interesting and are in progress.
3. Experimental
3.1. General
Mp were taken on a Reichert Thermovar and areuncorrected; optical rotations were measured in CHCl3on a JASCO DIP 370 Digital polarimeter, unlessotherwise noted; IR spectra were recorded (neat) on aPerkin-Elmer FT-IR 1720X spectrometer. UV spectrawere taken on a Perkin-Elmer Lamba 3B UV/Vis spec-trophotometer in MeCN, unless otherwise noted. 1H-and l3C-NMR: were recorded in CDCl3 (unless other-wise noted) at 500 or 250 and at 125 or 62.5 MHz, re-spectively, on DRX 500 and AM 250 Brukerspectrometers. The same solvent used as internal stan-dard. For spectra recorded in D2O, TPS (sodium-3-tri-methylsylilpropionate-2,2,3,3-d4) was used as internalstandard. Carbon multiplicities were determined byDEPT spectra (Breitmaier & Voelter, 1987). DEPT,COSY-45, HMQC and HMBC (Bax & Summers,1986) NMR experiments were performed using Brukermicroprograms. EI and Electrospray MS wererecorded at 70 eV on a Fisons Trio-2000 and a Perkin-Elmer API-100 spectrometer, respectively. FAB MSwere recorded in glycerol/thioglycerol using Cs asbombarding atoms on a VG ZAB 2SE. Analytical andpreparative TLC were performed on silica gel (Merck,Kieselgel, 60 F254, 0.25 and 0.50 mm, respectively) oron reverse phase (Whatman, KC18 F254, 0.20 mm)plates; the spots werc visualized by exposure to UVradiation and/or by spraying with 0.5% ninhydrin inMe2CO followed by heating at 1108C for 10 min. CC:Dowex-50 and Bio-Gel P-2. Solvent systems: (A)BuOH±HOAc±H2O (3:1:1); (B) iso-PrOH±H2O (7:3);(C) CHCl3-iso-PrOH (49:1); (D) CHCl3-iso-PrOH(97:3), (E) CHCl3-iso-PrOH (9:1), (F) CHCl3-iso-PrOH(19:1); (G) EtOAc-n-hexane (1:1); (H) EtOH±H2O(1.5:1).
A. Evidente et al. / Phytochemistry 53 (2000) 231±237234
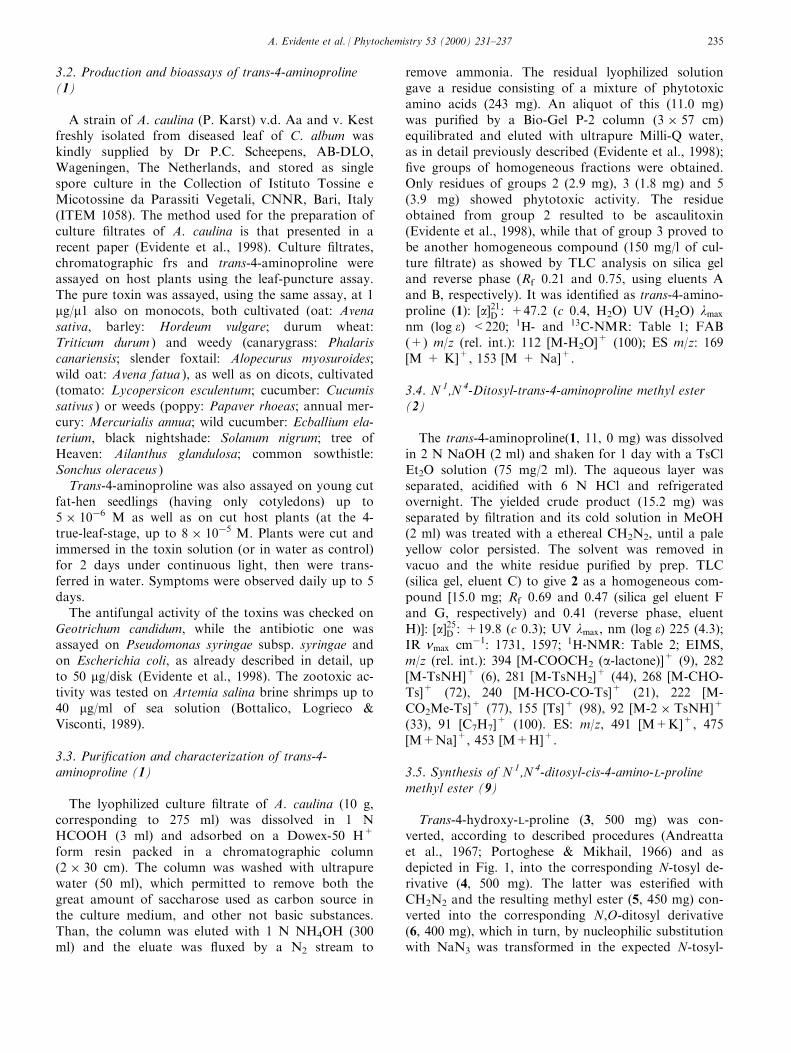
3.2. Production and bioassays of trans-4-aminoproline(1)
A strain of A. caulina (P. Karst) v.d. Aa and v. Kestfreshly isolated from diseased leaf of C. album waskindly supplied by Dr P.C. Scheepens, AB-DLO,Wageningen, The Netherlands, and stored as singlespore culture in the Collection of Istituto Tossine eMicotossine da Parassiti Vegetali, CNNR, Bari, Italy(ITEM 1058). The method used for the preparation ofculture ®ltrates of A. caulina is that presented in arecent paper (Evidente et al., 1998). Culture ®ltrates,chromatographic frs and trans-4-aminoproline wereassayed on host plants using the leaf-puncture assay.The pure toxin was assayed, using the same assay, at 1mg/m1 also on monocots, both cultivated (oat: Avenasativa, barley: Hordeum vulgare; durum wheat:Triticum durum ) and weedy (canarygrass: Phalariscanariensis; slender foxtail: Alopecurus myosuroides;wild oat: Avena fatua ), as well as on dicots, cultivated(tomato: Lycopersicon esculentum; cucumber: Cucumissativus ) or weeds (poppy: Papaver rhoeas; annual mer-cury: Mercurialis annua; wild cucumber: Ecballium ela-terium, black nightshade: Solanum nigrum; tree ofHeaven: Ailanthus glandulosa; common sowthistle:Sonchus oleraceus )
Trans-4-aminoproline was also assayed on young cutfat-hen seedlings (having only cotyledons) up to5 � 10ÿ6 M as well as on cut host plants (at the 4-true-leaf-stage, up to 8 � 10ÿ5 M. Plants were cut andimmersed in the toxin solution (or in water as control)for 2 days under continuous light, then were trans-ferred in water. Symptoms were observed daily up to 5days.
The antifungal activity of the toxins was checked onGeotrichum candidum, while the antibiotic one wasassayed on Pseudomonas syringae subsp. syringae andon Escherichia coli, as already described in detail, upto 50 mg/disk (Evidente et al., 1998). The zootoxic ac-tivity was tested on Artemia salina brine shrimps up to40 mg/ml of sea solution (Bottalico, Logrieco &Visconti, 1989).
3.3. Puri®cation and characterization of trans-4-aminoproline (1)
The lyophilized culture ®ltrate of A. caulina (10 g,corresponding to 275 ml) was dissolved in 1 NHCOOH (3 ml) and adsorbed on a Dowex-50 H+
form resin packed in a chromatographic column(2 � 30 cm). The column was washed with ultrapurewater (50 ml), which permitted to remove both thegreat amount of saccharose used as carbon source inthe culture medium, and other not basic substances.Than, the column was eluted with 1 N NH4OH (300ml) and the eluate was ¯uxed by a N2 stream to
remove ammonia. The residual lyophilized solutiongave a residue consisting of a mixture of phytotoxicamino acids (243 mg). An aliquot of this (11.0 mg)was puri®ed by a Bio-Gel P-2 column (3 � 57 cm)equilibrated and eluted with ultrapure Milli-Q water,as in detail previously described (Evidente et al., 1998);®ve groups of homogeneous fractions were obtained.Only residues of groups 2 (2.9 mg), 3 (1.8 mg) and 5(3.9 mg) showed phytotoxic activity. The residueobtained from group 2 resulted to be ascaulitoxin(Evidente et al., 1998), while that of group 3 proved tobe another homogeneous compound (150 mg/l of cul-ture ®ltrate) as showed by TLC analysis on silica geland reverse phase (Rf 0.21 and 0.75, using eluents Aand B, respectively). It was identi®ed as trans-4-amino-proline (1): �a�21D : +47.2 (c 0.4, H2O) UV (H2O) lmax
nm �log e� <220; 1H- and 13C-NMR: Table 1; FAB(+) m/z (rel. int.): 112 [M-H2O]+ (100); ES m/z: 169[M + K]+, 153 [M + Na]+.
3.4. N 1,N 4-Ditosyl-trans-4-aminoproline methyl ester(2)
The trans-4-aminoproline(1, 11, 0 mg) was dissolvedin 2 N NaOH (2 ml) and shaken for 1 day with a TsClEt2O solution (75 mg/2 ml). The aqueous layer wasseparated, acidi®ed with 6 N HCl and refrigeratedovernight. The yielded crude product (15.2 mg) wasseparated by ®ltration and its cold solution in MeOH(2 ml) was treated with a ethereal CH2N2, until a paleyellow color persisted. The solvent was removed invacuo and the white residue puri®ed by prep. TLC(silica gel, eluent C) to give 2 as a homogeneous com-pound [15.0 mg; Rf 0.69 and 0.47 (silica gel eluent Fand G, respectively) and 0.41 (reverse phase, eluentH)]: �a�25D : +19.8 (c 0.3); UV lmax, nm �log e� 225 (4.3);IR nmax cmÿ1: 1731, 1597; 1H-NMR: Table 2; EIMS,m/z (rel. int.): 394 [M-COOCH2 (a-lactone)]+ (9), 282[M-TsNH]+ (6), 281 [M-TsNH2]
+ (44), 268 [M-CHO-Ts]+ (72), 240 [M-HCO-CO-Ts]+ (21), 222 [M-CO2Me-Ts]+ (77), 155 [Ts]+ (98), 92 [M-2 � TsNH]+
(33), 91 [C7H7]+ (100). ES: m/z, 491 [M+K]+, 475
[M+Na]+, 453 [M+H]+.
3.5. Synthesis of N 1,N 4-ditosyl-cis-4-amino-L-prolinemethyl ester (9)
Trans-4-hydroxy-L-proline (3, 500 mg) was con-verted, according to described procedures (Andreattaet al., 1967; Portoghese & Mikhail, 1966) and asdepicted in Fig. 1, into the corresponding N-tosyl de-rivative (4, 500 mg). The latter was esteri®ed withCH2N2 and the resulting methyl ester (5, 450 mg) con-verted into the corresponding N,O-ditosyl derivative(6, 400 mg), which in turn, by nucleophilic substitutionwith NaN3 was transformed in the expected N-tosyl-
A. Evidente et al. / Phytochemistry 53 (2000) 231±237 235

cis-4-azido-L-proline (7, 200 mg). The intermediates 4±7 were characterized by the following physical andspectroscopic properties compared with the very fewspectroscopic data available from literature (Andreattaet al., 1967; Portoghese & Mikhail, 1966 ).
3.6. N-Tosyl-trans-4-hydroxy-L-proline (4)
4 had: mp 148±1508C; �a�25D : ÿ101.3 (c 0.6, EtOH);[Portoghese & Mikhail, 1966: mp 153±1558C.; �a�23D
ÿ105.48 (c 2% EtOH)]; UV (MeOH) lmax nm �log e�228 (4.0); IR nmax cmÿ1: 3395, 1736, 1598; 1H-NMRdata (CD3OD), d: 7.77 (2H, Ph), 7.41 (2H, Ph), 4.35(1H, m, H-4), 4.25 (1H, t, J2; 3 � J2; 3 0 � 7:9 Hz, H-2),3.59 (1H, dd, J4, 5 � 4:2 and J5, 5 0 � 10:9 Hz, H-5),3.28 (1H, ddd, J3, 5 0 = 1.5, J4, 5 0 � 2:6 and J5, 5 0 � 10:9Hz, H-5 '), 2.44 (3H, s, MePh), 2.11 (2H, m, H2-3); EIMS, m/z (rel. int.): 240 [M-COOH]+ (43), 155 [Ts]+
(29), 91 [C7H7]+ (81), 86 [M-Co2-Ts]
+ (30), 58 (100)
3.7. N-Tosyl-trans-4-hydroxy-L-proline methyl ester (5 )
5 had: mp 98±1008C; �a�25D ÿ102.1 (c 0.5); [Andreattaet al., 1967: mp 103±1048C; �a�20D ÿ98.548 (c 1%CHCl3)]; UV lmax �log e� 225 (4.3); IR nmax cmÿ1: 3515,1741, 1598; 1H-NMR: d: 7.79 (2H, Ph ), 7.32 (2H, Ph),4.46 (1H, m, H-4), 4.43 (1H, t, J2; 3�J2; 3 0 �8:1 Hz, H-2), 3.75 (3H, s, OMe), 3.62 (1H, dd, J4, 5 � 4:1 andJ5, 5 � 11:4 Hz, H-5), 3.40 (1H, dt, J4; 5 0 � J3; 5 0 � 1:8and J5, 5 0 � 11:4 Hz, H-5 '), 2.44 (3H, s, MePh), 2.20(1H, m, H-3), 2.13 (1H, m, H-3 '); EIMS, m/z (rel.int.): 240 [M-CO2Me]+ (49), 155 [Ts]+ (40), 91[C7H7]
+ (100), 58 (55).
3.8. N,O-Ditosyl-trans-4-hydroxy-L-proline methyl ester(6)
6 had: mp 92±948C; �a�25D : ÿ49.5 (c 0.5); [Andreattaet al., 1967: mp 958C; �a�20D ÿ54.88 (c 2% CHCl3)]; UVlmax nm �log e� 225 (4.3); IR nmax cmÿ1: 1757, 1598;1H-NMR, d: 7.72 (2H, Ph), 7.63 (2H, Ph), 7.34 (2H,Ph), 7.29 (2H, Ph), 5.00 (1H, m, H-4), 4.29 (1H, t, J2; 3� J2; 3 0 � 7:8 Hz, H-2), 3.75 (3H, s, OMe), 3.69 (1H,dd, J4, 5 � 4:4 and J5, 5 0 � 12:3Hz, H-5), 3.58 (1H, dt,J3; 5 0 �J4; 5 0 �1:9 and J5, 5 0 � 12:3 Hz, H-5 '), 2.47 (3H,s, MePh), 2.45 (3H, MePh), 2.35 (1H, br ddd,J2, 3 � 7:8, J3, 3 0 � 12:3 and J3, 5 0 � 1:9 Hz, H-3), 2.20(1H, ddd, J2, 3 0=7.8, J3, 3 0 � 12:3 and J3 0, 4 � 5:0 Hz,H-3 '); EIMS, m/z (rel. int.): 394 [M-CO2Me]+ (27),240 [M-CO2Me-Ts]+ (50), 222 [M-CO2Me-Ts-H2O]+
(98), 155 [Ts]+ (96), 91 [C7H7]+ (100).
3.9. N-Tosyl-cis-4-azido-L-proline methyl ester (7)
7 had: mp 65±688C; �a�25D : ÿ44.3 (c 0.5); [Andreattaet al., 1967: mp 69±708C; �a�20D ÿ47.88 (c 2% CHCl3)];
UV lmax nm �log e� 227 (4.1); IR nmax cmÿ1: 2108,1757, 1598 [lit. 15: nmax (CHCl3) 2108, 1750]; 1H-NMR, d: 7.82 (2H, Ph), 7.34 (2H, Ph), 4.53 (1H, dd,J2, 3 � 9:0 and J2, 3 0 � 4:1 Hz, H-2), 4.07 (1H, m, H-4),3.75 (3H, s, OMe), 3.65 (1H, dd, J4, 5 � 6:0 andJ5, 5 0 � 10:9 Hz, H-5), 3.33 (1H, ddd, J3, 5 0 � 1:0,J4, 5 0 � 4:0 and J5, 5 0 � 10:9 Hz, H-5 '), 2.46 (3H, s,MePh), 2.36 (1H, dddd, J2, 3 � 9:0, J3, 3 0 � 13:4, J3, 4 �4:5 and J3, 5 0 � 1:0 Hz, H-3), 2.26 (1H, dt, J2; 3 0 � J3 0 ,4 � 4:5 and J3, 3 0 � 13:4 Hz, H-3 '); EIMS, m/z (rel.int.): 265 [M-CO2Me]+ (55), 237 [M-CO2Me-N2]
+
(27), 155 [Ts]+ (88), 91 [C7H7]+ (100).
3.10. N 1,N 4-Ditosyl-cis-4-amino-L-proline methyl ester(9)
N-Tosyl-cis-4-azido-L-proline methyl ester (7, 24 mg)in MeOH (1 ml) was hydrogenated in the presence of10% Pd on charcoal (100 mg) at room temperatureand 1 atmospheric pressure. After 4 h the catalyst was®ltrated o� and the solvent was removed under vac-uum. The reaction mixture (28 mg) was puri®ed byTLC prep. on silica gel (eluent E) giving the very un-stable N-tosyl-cis-4-amino-L-proline (8, 7.0 mg) ashomogeneous compound, which was immediately con-verted into the corresponding ditosylderivative as fol-lows: 8 (7 mg) was dissolved in dry pyridine (100 ml)and the solution was chilled in an ice-bath. A cold sol-ution of TsCl (28 mg) in dry pyridine (100 ml) wasadded and the reaction mixture was left at 08 for 3days. The oily residue left by the reaction work-up waspuri®ed by prep. TLC (silica gel, eluent F) givingN 1,N 4-ditosyl-cis-4-amino-L-proline methyl ester (9) ashomogeneous compound (9.5 mg): �a�25D : ÿ10.4 (c0.12); UV lmax nm �log e� 226 (4.3); IR nmax cmÿ1:1738, 1598; 1H-NMR: Table 2. EIMS, m/z (rel. int.):394 [M-COOCH2 (a-lactone)]+ (2), 393 [M-CO2Me]+
(10), 282 [M-TsNH]+ (4), 281 [M-TsNH2]+ (28), 268
[M-CHO-Ts]+ (9), 222 [M-CO2Me-Ts]+ (100), 155[Ts]+ (81), 92 [M-2 � TsNH]+ (29), 91 [C7H7]
+ (86)
Acknowledgements
This investigation was supported in part by grantsto A.E. from the European Project entitled``Optimizing biological control of a dominant weed inmajor crops'' (FAIR5-PL97-3525) and in part bygrants from the Italian Ministry of University andScienti®c and Technological Research. The authorsthank the `Centro Interdipartimentale di MetodologieChimico-Fisiche, Universita di Napoli Federico II,Napoli', Italy for NMR spectra and Mr. C. Iodice(ICMIB-CNR, Arco Felice) for technical assistance.Mass spectral data were provided by `Servizio diSpettrometria di Massa del CNR e dell'Universita di
A. Evidente et al. / Phytochemistry 53 (2000) 231±237236
Napoli Federico II'. The assistance of the sta� is grate-fully acknowledged. Contribution N 182 (DISCA).
References
Andreatta, R. H., Nair, V., Robertson, A. V., & Simpson, W. R. J.
(1967). Synthesis of cis and trans isomers of 4-chloro-L-proline, 4-
bromo-L-proline, and 4-amino-L-proline. Australian Journal of
Chemistry, 20(7), 1493±1509.
Bax, A., & Freeman, R. (1981). Investigation of complex networks
of spin-spin coupling by two-dimensional NMR. Journal of
Magnetic Resonances, 44, 542±561.
Bax, A., Ikura, M., Kay, L. E., Torchia, D. A., & Tschudin, R.
(1990). Comparison of di�erent modes of two-dimensional
reverse-correlation NMR for the study of proteins. Journal of
Magnetic Resonance, 86, 304±318.
Bax, A., & Summers, M. F. (1986). 1H and 13C assignments from
sensitivity±enhanced detection of heteronuclear multiple±bond
connectivity by 2D multiple quantum NMR. Journal of American
Chemical Society, 108, 2093±2094.
Bottalico, A., Logrieco, A., & Visconti, A. (1989). In J. Chelkowsky,
Fusarium: mycotoxins, taxonomy and pathogenicity (pp. 85±119).
Amsterdam: Elsevier.
Breitmaier, E., & Voelter, W. (1987). Carbon-13 NMR spectroscopy.
Weinheim: VCH (pp. 80-84, 236-238, 414-420).
Evidente, A., Capasso, R., Cutignano, A., Taglialatela-Scafati, O.,
Vurro, M., Zonno, M. C., & Motta, A. (1998). Ascaulitoxin, a
phytotoxic bis-amino acid N-glucoside from Ascochyta caulina.
Phytochemistry, 48(7), 1131±1137.
Fang, S-D., Li, L-C., Niu, C-I., & Tseng, K-F. (1961). Chemical stu-
dies on Cucurbita moschata Duch. Scientia Sinica, 10(7), 845±853.
Hatanaka, S. I. (1969). A new amino acid isolated from Morchella
esculenta and related species. Phytochemistry, 8, 1305±1308.
Holm, L. G., Pluckett, D. L., Pancho, J. V., & Herberger, J. P.
(1977). In The world's worst weed (distribution and biology) (p.
84). Honoloulou: University Press of Haway.
Kempenaar, C. (1995). Studies on the biological control of
Chenopodium album by Ascochyta caulina. Ph.D. Thesis,
Wageningen, The Netherlands.
Massiot, G., & Delaude, C. (1986). In A. Brossi, Alkaloids, vol. 27.
New York: Academic Press (Chapter 3).
Mauger, A. B., & Witkop, B. (1966). Analogs and homologs of pro-
line and hydroxyproline. Chemical Review, 66, 47±86.
Numata, A., & Ibuka, T. (1987). In A. Brossi, Alkaloids, vol. 31.
New York: Academic Press (Chapter 6).
Porter, Q. N. (1985). In Mass spectrometry of heterocyclic compounds
(pp. 489±490). New York: Wiley.
Portoghese, P. S., & Mikhail, A. A. (1966). Bicyclic bases: synthesis
of 2,5 diazabicyclol[2.2.1] heptanes. Journal of Organic Chemistry,
3, 1059±1062.
Pretsch, E., Clerc, T., Seibl, J., & Simon, W. (1983). In W.
Fresenius, J. F. K. Huber, E. Pungor, G. A. Rechnitz, W. Simon,
& Th. S. West, Tables of spectral data for structure determination
of organic compounds (p. C205, H195, H354). Berlin: Springer±
Verlag.
Scheepens, P. C., Kempenaar, C., Adreanes, C., Eggers, T. H.,
Netlands, J., & Vurro, M. (1997). Biological control of the annual
weed Chenopodium album, with emphasis on the application of
Ascochyta caulina as a microbial herbicide. Integrated Pest
Management Reviews, 2, 71±76.
Shiao, S. H., Shao, B. J., Ho, Y. H., Yang, Y. C., & Mao, C. P.
(1962). Studies on the prophylactico-therapeutic e�ect of cucurbi-
tine in experimental schistosomiasis japonica in mice. Scientia
Sinica, 11(11), 1527±1532.
Strobel, G. A., Ken®eld, D., Bunkers, G., Sugawara, F., & Clardy,
J. (1991). Phytotoxins as potential herbicides. Experientia, 47,
819±826.
Tanaka, K., Suzuki, H., & Sawanishi, H. (1996). Asymmetric synth-
eses of (2R, 4S )-4-amino-4-carboxy-2-methylpyrrolidine and
(2R, 4S )-4-amino-2-carboxy-2-ethylpyrrolidine as novel 2-alkyl-
substituted (ÿ)-cucurbitine analogues. Heterocycles, 43(1), 205±
219.
Thorbek, P., Hjeds, H., & Schaumburg, K. (1981). Syntheses and1H-NMR spectroscopic investigations of some pyrrolidine car-
boxylic acids designed as potential glial GABA uptake inhibitors.
Acta Chemica Scandinavica, B35, 473±479.
A. Evidente et al. / Phytochemistry 53 (2000) 231±237 237
Phytochelatin homologs induced in hairy roots of horseradish
Hiroki Kubota, Kyoko Sato, Takashi Yamada, Tamio Maitani*
National Institute of Health Sciences, Kamiyoga 1-18-1, Setagaya, Tokyo 158-8501, Japan
Received 25 May 1999; received in revised form 5 August 1999
Abstract
When exposed to excess heavy metals, plants induce phytochelatins and related peptides (all designated as PCAs). Thus, whenhairy roots of horseradish (Armoracia rusticana ) were exposed for 3 days to cadmium (1 mM) along with reduced glutathione (2
mM), PCA induction occurred. Moreover, a new family of thiol peptides was detected as well as the previously known PCAs, asrevealed by postcolumn-derivatization HPLC. Two were isolated and their structures were identi®ed as (g-Glu-Cys)n-Gln (n = 3and 4) by electrospray ionization-mass spectrometer spectra, this being con®rmed by chemical synthesis of the peptides. These
new analogs constitute the sixth PCA family identi®ed to date. # 2000 Elsevier Science Ltd. All rights reserved.
Keywords: Armoracia rusticana; Cadmium; Cell culture; Cruciferae; Horseradish; Metallothionein; Phytochelatin
1. Introduction
When exposed to excess heavy metal ions, higherplants induce thiol peptides called phytochelatins (PCs)to protect against toxicity (Rauser, 1990), whose gen-eral structure is (g-Glu-Cys)n-Gly (nr2). So far, PCswith n = 2±11 have been reported (Gekeler, Grill,Winnacker & Zenk, 1989).
Some analogous families of PCs have also beenfound. Homo-phytochelatins, which are (g-Glu-Cys)n-b-Ala (n = 2±7), are found in the family Fabaceae(Grill, Gekeler, Winnacker & Zenk, 1986).Hydroxymethyl-phytochelatins, namely (g-Glu-Cys)n-Ser (n = 2±4) are detected in rice (Klapheck, Chrost,Starke & Zimmermann, 1992). A family of peptideswith a glutamyl residue at the C-terminus (n = 2±3)has also been reported in maize (Meuwly, Thibault,Schwan & Rauser, 1995). Moreover, desglycyl PCs (g-Glu-Cys)n (n = 2±5) have been found in severalspecies such as Candida glabrata (Mehra, Tarbet, Gray& Winge, 1988) and Schizosaccharomyces pombe(Mehra & Winge, 1988; Konya, Yoshimura, Yamazaki
& Toda, 1990). Thus, ®ve families of PC-related pep-tides have been reported to date (Rauser, 1995; Zenk,1996). PCs and related peptides, all designated asPCAs, are a family of metallothioneins (Binz & KaÈ gi,1999).
Previously, we detected a series of desglycyl peptidesin Rubia tinctorum which is a source of a red pigment(Kubota, Sato, Yamada & Maitani, 1995; Maitani,Kubota, Sato & Yamada, 1996). In the present study,we examined PCA-induction in hairy roots of horse-radish which is a source of pungent components andidenti®ed a new family of PC-related peptides, (g-Glu-Cys)3-Gln and (g-Glu-Cys)4-Gln.
2. Results
Fig. 1 shows the postcolumn-derivatization HPLCchromatograms for the hairy roots of horseradish inthe presence or absence of Cd. Many additional peakswere noted in the Cd-exposed hairy roots. By co-chro-matography with Cd-exposed root cultures of R. tinc-torum L. (Kubota et al., 1995), the peaks 1, 3, and 5were assigned to PCs with n = 2, 3, and 4, respect-ively. In addition, some unknown peaks were observedin the Cd-exposed hairy roots, but these were not des-
Phytochemistry 53 (2000) 239±245
0031-9422/00/$ - see front matter # 2000 Elsevier Science Ltd. All rights reserved.
PII: S0031-9422(99 )00493 -8
www.elsevier.com/locate/phytochem
* Corresponding author. Tel.: +81-3-3700-9409; fax: +81-3-3700-
9403 or +81-3-3707-6950.
E-mail address: [email protected] (T. Maitani).

glycyl PCs (Kubota et al., 1995). The unknown peakswere also detected by Cd-treatment without reducedglutathione (GSH), but induction was at a lower level.
To clarify whether unknown peaks were PC-relatedpeptides, peaks 2 and 4 were isolated and electrosprayionization-mass spectrometer (ESI-MS) spectra weremeasured (Fig. 2). The largest peak was detected at anm/z value of 843.2 in peak 2 and the largest and thesecond largest peaks at 1000.3 and 1075.3 in peak 4.Therefore, the peaks at m/z 843.2 and 1075.3 were pre-sumed to be quasi-molecular ion peaks [M + H]+,because the di�erence, 232, corresponds to a mass ofg-Glu-Cys. The peak at 1000.3 also may be quasi-mol-ecular ion peaks of other compounds, since peak 4 isbroad and so may contain two compounds.
The m/z values of 843.2 and 1075.3, however, didnot correspond to the mass of the quasi-molecular ion(exact mass + 1.0) of PC-related peptides reported sofar. The closest values were 844.2 and 1076.3 of (g-Glu-Cys)3-Glu and (g-Glu-Cys)4-Glu, respectively.Unexpectedly, the m/z values agreed completely withthe exact mass of quasi-molecular ion of (g-Glu-Cys)3-Gln (843.2) and (g-Glu-Cys)4-Gln (1075.3).
To con®rm the structures of peaks 2 and 4 includingthe presence of the g-linkage, (g-Glu-Cys)3-Gln and (g-Glu-Cys)4-Gln were chemically synthesized and ESI-MS spectra were measured (Fig. 3). The tandem mass(MS-MS) spectra (Fig. 3, lower) quite closely re-sembled those observed previously for peaks 2 and 4(Fig. 2, lower). The presence of fragment ions at 714.2and 946.2 clearly demonstrates the presence of the Glnresidue as understood from the fragmentation patternsshown in Fig. 3 (upper). Thus, peaks 2 and 4 wereidenti®ed as (g-Glu-Cys)3-Gln and (g-Glu-Cys)4-Gln,respectively.
The synthetic (g-Glu-Cys)3-Gln and (g-Glu-Cys)4-Gln were added to the supernatant fraction of Cd-
exposed hairy roots, and postcolumn-derivatizationHPLC analysis of the sample was performed; synthetic(g-Glu-Cys)3-Gln and (g-Glu-Cys)4-Gln co-eluted withpeaks 2 and 4, respectively (data not shown).
In Fig. 1, (g-Glu-Cys)2-Gln is not detectable. Underthe present HPLC conditions, (g-Glu-Cys)n-Gln (n =3 and 4) eluted faster than the corresponding PCs ((g-Glu-Cys)n-Gly), Fig. 1, whereas g-Glu-Cys-Gln elutedslower than GSH (g-Glu-Cys-Gly) (see below, Fig. 5).This may explain why (g-Glu-Cys)2-Gln cannot beseen in Fig. 1.
The retention times of peptides on an ODS columnin a linear gradient elution mode are linearly related tothe logarithm of the sum of the retention constant forthe constituent amino acids (Sasagawa, Okuyama &Teller, 1982). Based on this fact, Gekeler et al. (1989)applied the formula to PCs and obtained a linear re-lationship between the retention time of PCs and thelogarithm of the number of g-Glu-Cys units when theywere plotted.
To estimate the retention time of (g-Glu-Cys)2-Gln,the plot method was employed. Fig. 4 shows the plotsfor PCs ((g-Glu-Cys)n-Gly) (n = 1, 2, 3, and 4) andthe new family of peptides ((g-Glu-Cys)n-Gln) (n = 1,3 and 4). A good linear relationship was observed forboth (g-Glu-Cys)n-Gly (r2 = 0.9999) and (g-Glu-Cys)n-Gln (r2 = 1.0000), and both lines intersected at theretention time of (g-Glu-Cys)2-Gly. This ®ndingsuggested that peak 1 in Fig. 1 is a mixture of (g-Glu-Cys)2-Gly and (g-Glu-Cys)2-Gln. In fact, (g-Glu-Cys)2-Gln was detected by ESI-MS (data not shown).
The induction of (g-Glu-Cys)n-Gln may suggest thepresence of g-Glu-Cys-Gln. To identify the peak of g-Glu-Cys-Gln, chemically synthesized g-Glu-Cys-Glnwas added to the supernatant fraction of Cd-exposedhairy roots, and HPLC analysis was performed. Thespiked g-Glu-Cys-Gln overlapped a small peak adja-cent to the peak of GSH (Fig. 5). The small peak wastentatively assigned to g-Glu-Cys-Gln.
3. Discussion
On exposure to Cd, the hairy roots of horseradishinduced a new group of SH-containing peptides aswell as PCs. They are (g-Glu-Cys)3-Gln and (g-Glu-Cys)4-Gln. So far, ®ve families of PC-related peptideshave been reported, namely, (g-Glu-Cys)n-Gly, (g-Glu-Cys)n-b-Ala, (g-Glu-Cys)n-Ser, (g-Glu-Cys)n-Glu, and(g-Glu-Cys)n. PC-related peptides with Gln as the C-terminus were ®rst identi®ed in this study.
Meuwly, Thibault & Rauser (1993) reported similarpeptides (g-Glu-Cys)n-Glu in maize. To con®rm thatour new peptides were not (g-Glu-Cys)n-Glu, we alsosynthesized (g-Glu-Cys)3-Glu chemically and this wasco-chromatographed with the supernatant fraction of
Fig. 1. HPLC chromatograms for control (upper) and Cd-exposed
(lower) root cultures of horseradish generated by postcolumn deriva-
tization. Hairy roots of horseradish were exposed to CdCl2 (1 mM)
with GSH (2 mM) for 3 days. The induced PCs and related peptides
were analyzed as thiol-containing compounds as described in Section
4. Peaks 1, 3, and 5 were assigned to (g-Glu-Cys)n-Gly with n = 2,
3, and 4, respectively.
H. Kubota et al. / Phytochemistry 53 (2000) 239±245240
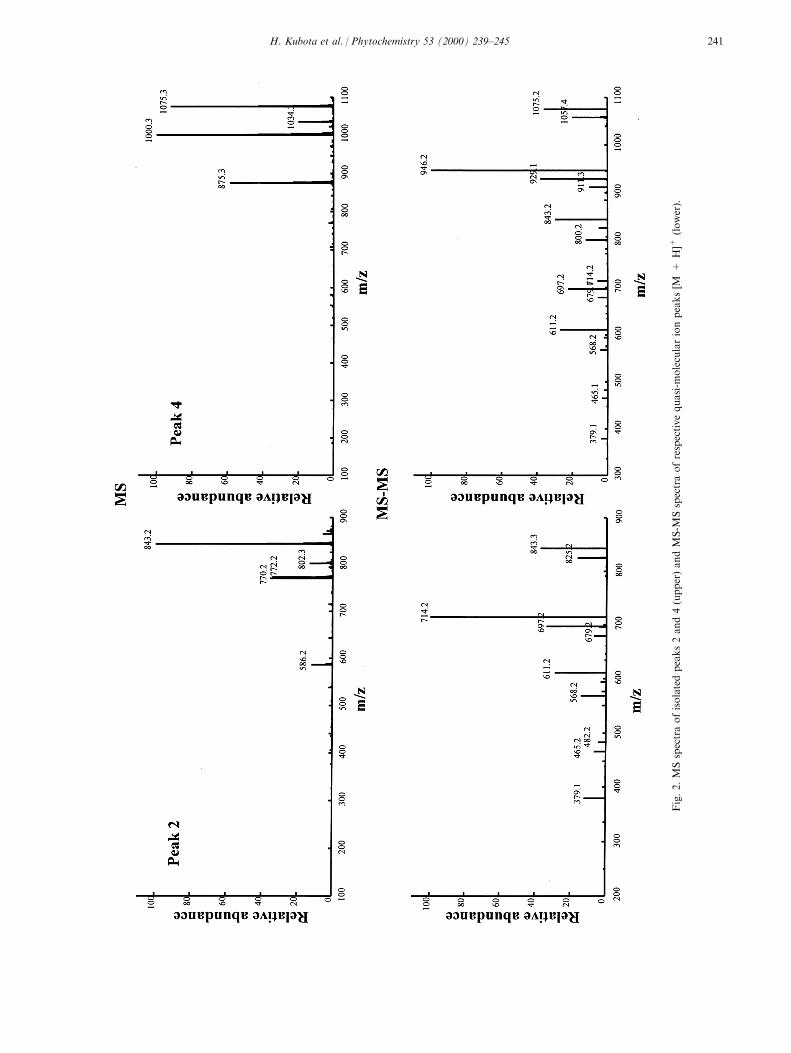
Fig.2.MSspectraofisolatedpeaks2and4(upper)andMS-M
Sspectraofrespectivequasi-m
olecularionpeaks[M
+H]+
(lower).
H. Kubota et al. / Phytochemistry 53 (2000) 239±245 241
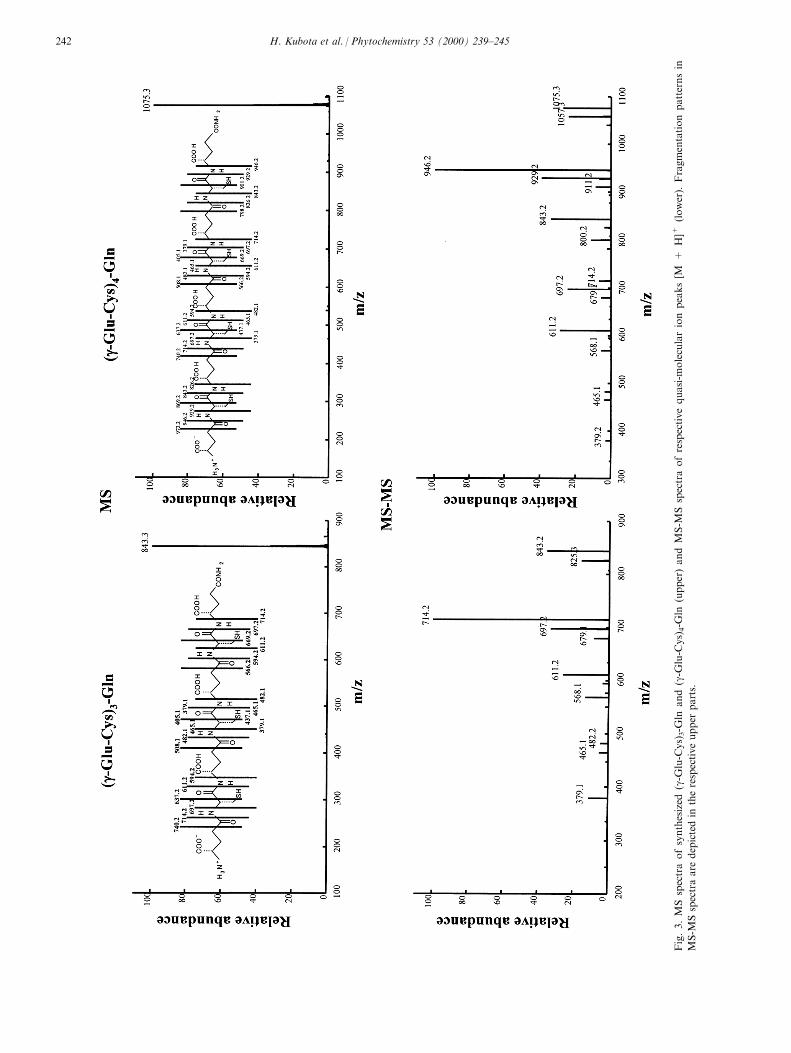
Fig.3.MSspectraofsynthesized
(g-G
lu-C
ys)3-G
lnand(g-G
lu-C
ys)4-G
ln(upper)andMS-M
Sspectraofrespectivequasi-m
olecularionpeaks[M
+H]+
(lower).
Fragmentationpatternsin
MS-M
Sspectraare
depictedin
therespectiveupper
parts.
H. Kubota et al. / Phytochemistry 53 (2000) 239±245242

the Cd-exposed hairy roots. (g-Glu-Cys)3-Glu eluted atalmost the same retention time as that of correspond-ing desglycyl PC ((g-Glu-Cys)3) (data not shown).Namely, (g-Glu-Cys)n-Glu eluted slower than the cor-responding PC. On the other hand, (g-Glu-Cys)n-Glnelutes faster than the corresponding PC as shown inFig. 1.
In the structural determination of PC-related pep-tides, amino acid analysis is frequently employed(Klapheck et al., 1992; Meuwly et al., 1995). However,Glu and Gln cannot be distinguished by the usualamino acid analysis. Therefore, it could not beemployed in the present study.
It is considered that PCs are synthesized from GSH(RuÈ egsegger, Schmutz & Brunold, 1990; Tukendorf &Rauser, 1990). PC-related peptides may also be syn-thesized from the GSH-related peptides. In fact, g-Glu-Cys-b-Ala (Gekeler et al., 1989), g-Glu-Cys-Ser(Klapheck, Fliegner & Zimmer, 1994), and g-Glu-Cys-Glu (Meuwly et al., 1993) were detected in the plantsthat induced (g-Glu-Cys)n-b-Ala, (g-Glu-Cys)n-Ser, and(g-Glu-Cys)n-Glu, respectively.
In this study, a small peak was detected at the reten-tion time of g-Glu-Cys-Gln. However, the completeidenti®cation could not be made because of its lowquantity. Therefore, the presence of g-Glu-Cys-Gln inthe hairy roots of horseradish and, furthermore, in theintact horseradish plant itself remains to be estab-lished.
4. Experimental
4.1. Reagent
Fmoc-Gln(Trt)-Wang resin and Fmoc-Glu-a-O-t-Bufor peptide synthesis were purchased fromCalbiochem±Novabiochem (La Jolla, CA). Fmoc-S-(t-Bu)-L-Cys, BOP (benzotriazol-1-yloxytris(dimethylami-no)phosphonium hexa¯uorophosphate) reagent,dimethylformamide (DMF, grade for peptide analysis),N-methyl-morpholine, thioanisole, ethane-1,2-dithiol(EDT), cadmium chloride hemipentahydrate, andreduced glutathione (GSH) were obtained from WakoPure Chemical Industries (Osaka, Japan).Tri¯uoromethanesulfonic acid (TFM) and tris(hydrox-ymethyl)aminomethane (Tris) were purchased fromKanto Chemical (Tokyo, Japan) and Sigma (St. Louis,MO), respectively. Other chemicals used were either ofreagent grade or of the highest grade commerciallyavailable.
4.2. Tissue culture
Hairy roots of Armoracia rusticana were establishedas reported (Sakamoto et al., 1992) according to amethod described previously (Saitou, Kamada &Harada, 1991), and were subcultured every 3 weeks.After the last subculture, the hairy roots (0.25 g) weremaintained for 7 days in 10 ml of Murashige±Skoogliquid medium in 50 ml Erlenmeyer ¯asks on a rotaryshaker at 100 rpm at 258C in the dark. Cadmiumchloride (1 mM) and GSH (2 mM) were then added to
Fig. 4. The plots of the retention times in HPLC versus logarithm of
the number of g-Glu-Cys units for the families of (g-Glu-Cys)n-Gly
and (g-Glu-Cys)n-Gln. ., (g-Glu-Cys)n-Gly with n = 1±4; R, (g-Glu-
Cys)n-Gln with n = 1, 3, and 4.
Fig. 5. HPLC chromatograms for the supernatant fraction of Cd-
exposed hairy roots of horseradish before (upper) and after (lower)
addition of synthesized g-Glu-Cys-Gln (gECQ). (gEC)nG and
(gEC)nQ mean (g-Glu-Cys)n-Gly and (g-Glu-Cys)n-Gln, respectively.
H. Kubota et al. / Phytochemistry 53 (2000) 239±245 243

the medium. Hairy roots were maintained for 3 days,then washed with puri®ed water, and stored at ÿ808C.
4.3. Postcolumn-derivatization HPLC analysis of PC-related peptides
PCAs were analyzed by postcolumn derivatizationHPLC as reported previously (Kubota et al., 1995) byusing 0.1% tri¯uoroacetic acid instead of 0.05% phos-phoric acid.
4.4. Puri®cation of isolated peptides
The hairy roots were homogenized with a Polytrontissue grinder (Kinematica GmgH, Littau, Switzerland)in 2 volumes of 10 mM Tris±HCl bu�er solution (pH7.4) containing 10 mM KCl and 1 M MgCl2 under anN2 atmosphere to prevent oxidation. The homogenateswere centrifuged at 100,000 � g for 60 min at 48C. A500-ml portion of the supernatant fraction was sub-jected to HPLC (LC-6A, Shimadzu, Kyoto, Japan)using a gel-®ltration column (Asahipak GS520HQ, 7.6mm i.d. � 300 mm, Showa Denko, Tokyo, Japan) with10 mM Tris±HCl bu�er (pH 7.4). The column waseluted with the 10 mM Tris±HCl bu�er (pH 7.4) at a¯ow rate of 0.6 ml/min, and the Cd-containing fractionwas collected; the collection was repeated about 50times. The pooled solution was concentrated to about500 ml. The solution was mixed with 500 ml of 0.1%NaBH4 solution and centrifuged (11,000 � g, 5 min).Each 100-ml portion of the supernatant fraction wasacidi®ed with 3.6 M HCl (20 ml) and the precipitateswere separated by centrifugation (11,000 � g, 5 min).The supernatant fraction (100 ml) was subjected toHPLC (LC-10AD � 2, Shimadzu, Kyoto, Japan) usinga C18 column (Inertsil ODS-80A, 4.6 mm i.d. � 250mm, GL Sciences, Tokyo, Japan). Fractions corre-sponding to respective thiol-containing peptides werecollected as described previously (Kubota et al., 1995).The collection procedure was repeated 10 times, andpooled fractions were concentrated and freeze-dried.
4.5. Chemical synthesis of peptides
The authentic standard peptides were chemicallysynthesized by the Fmoc solid-phase method(Merri®eld, 1997). Fmoc-Gln(Trt)-Wang resin waswashed with DMF, and the Fmoc-group of the resin(0.5 g, 0.2 mmol) was removed with 10% piperidine/DMF solution. The Gln moiety was coupled withFmoc-S-(t-Bu)-L-Cys (0.6 mEq) and Fmoc-Glu-a-O-t-Bu (0.6 mEq) successively for 2 h each, with the acti-vation by BOP Reagent (0.6 mEq) and N-methyl-mor-pholine (1.8 mEq). Completion of the respectivecoupling reactions was con®rmed by the ninhydrin-testreported by Kaiser, Colescott, Bossinger & Cook
(1970). Removal of protecting groups and detachmentfrom the support were performed by treating with amixture of thioanisole and EDT, tri¯uoroacetic acid,and TFM successively. The peptides obtained werepuri®ed by HPLC, using a C18 column as described in``puri®cation of isolated peptides''.
4.6. ESI-MS (electrospray ionization-mass spectro-meter) analysis
Each peptide (isolated or synthesized) was dissolvedin 2.5% acetic acid in 10% aqueous methanol (v/v)and introduced into an ESI-MS (LCQ, Thermo Quest,San Jose, CA) by infusion.
Acknowledgements
A part of this study was supported in part by theJapan Health Sciences Foundation. We thank Dr.Yagami and Mr. Takatsuki in NIHS for helpful sug-gestions on chemical synthesis of peptides and MSmeasurements, respectively.
References
Binz, P.-A., & KaÈ gi, J. H. R. (1999). In Metallothionein IV (pp. 7±
13). Basel: BirkhaÈ user±Verlag.
Gekeler, W., Grill, E., Winnacker, E. L., & Zenk, M. H. (1989).
Survey of the plant kingdom for the ability to bind heavy metals
through phytochelatins. Z. Naturforschung, 44c, 361±369.
Grill, E., Gekeler, W., Winnacker, E. L., & Zenk, M. H. (1986).
Homo-phytochelatins are metal-binding peptides of homo-gluta-
thione containing Fabales. FEBS Lett, 205, 47±50.
Kaiser, E., Colescott, R. L., Bossinger, C. D., & Cook, P. I. (1970).
Color test for detection of free terminal amino groups in the
solid-phase synthesis of peptides. Anal. Biochem, 34, 595±598.
Klapheck, S., Chrost, B., Starke, J., & Zimmermann, H. (1992). g-Glutamylcysteinylserine Ð a new homolog of glutathione in
plants of the family Poaceae. Bot. Acta, 105, 174±179.
Klapheck, S., Fliegner, W., & Zimmer, I. (1994). [(g-Glutamylcysteine)n-serine] are metal-induced peptides of the
Poaceae. Plant Physiol, 104, 1325±1332.
Konya, Y., Yoshimura, E., Yamazaki, S., & Toda, S. (1990).
Identi®cation of Cd-binding peptides of Fission yeast
Schizosaccharomyces pombe by FRIT-FAB LC/MS. Agric. Biol.
Chem, 54, 3327±3329.
Kubota, H., Sato, K., Yamada, T., & Maitani, T. (1995).
Phytochelatins (class III metallothioneins) and their desglycyl
peptides induced by cadmium in normal root cultures of Rubia
tinctorum L. Plant Science, 106, 157±166.
Maitani, T., Kubota, H., Sato, K., & Yamada, T. (1996). The com-
position of metals bound to class III metallothionein (phytochela-
tin and its desglycyl peptide) induced by various metals in root
cultures of Rubia tinctorum. Plant Physiol, 110, 1145±1150.
Mehra, R. K., & Winge, D. R. (1988). Cu(I) binding to the
Schizosaccharomyces pombe g-glutamyl peptides varying chain
lengths. Arch. Biochem. Biophys, 265, 381±389.
Mehra, R. K., Tarbet, E. B., Gray, W. R., & Winge, D. R. (1988).
Metal-speci®c synthesis of two metallothioneins and g-glutamyl
H. Kubota et al. / Phytochemistry 53 (2000) 239±245244

peptides in Candida glabrata. Proc. Natl. Acad. Sci. USA, 85,
8815±8819.
Merri®eld, B. (1997). Methods in Enzymology, vol. 289 (pp. 3±13).
San Diego: Academic Press.
Meuwly, P., Thibault, P., & Rauser, W. E. (1993). g-Glutamylcysteinylglutamic acid Ð a homolog of glutathione in
maize seedlings exposed to cadmium. FEBS Lett, 336, 472±476.
Meuwly, P., Thibault, P., Schwan, A. L., & Rauser, W. E. (1995).
Three families of thiol peptides are induced by cadmium in
maize. Plant J, 7, 391±400.
Rauser, W. E. (1990). Phytochelatins. Annu. Rev. Biochem, 59, 61±
86.
Rauser, W. E. (1995). Phytochelatins and related peptides. Plant
Physiol, 109, 1141±1149.
RuÈ egsegger, A., Schmutz, D., & Brunold, S. (1990). Regulation of
glutathione synthesis by cadmium in Pisum sativum L. Plant
Physiol, 93, 1579±1584.
Saitou, T., Kamada, H., & Harada, H. (1991). Isoperoxidase in
hairy roots and regenerated plants of horseradish (Armoracia
lapathifolia ). Plant Science, 75, 195±201.
Sakamoto, S., Sato, K., Iwakami, S., Goda, Y., Maitani, T.,
Takeda, M., Yoshihira, K., Saito, T., & Kamada, H. (1992). The
identi®cation of pungent components in hairy roots and regener-
ated plants of horseradish (Armoracia rusticana ). Plant Tissue
Culture Lett, 9, 43±46.
Sasagawa, T., Okuyama, T., & Teller, D. C. (1982). Prediction of
peptide retention time in reversed-phase high-performance liquid
chromatograpgy during linear gradient elution. J.
Chromatography, 240, 329±340.
Tukendorf, A., & Rauser, W. E. (1990). Changes in glutathione and
phytochelatins in roots of maize seedlings exposed to cadmium.
Plant Science, 70, 155±166.
Zenk, M. H. (1996). Heavy metal detoxi®cation in higher plants Ð a
review. Gene, 179, 21±30.
H. Kubota et al. / Phytochemistry 53 (2000) 239±245 245

Sesqui- and diterpenes from the liverwort Gackstroemia decipiensp
Wolfgang Geis, Hans Becker*
FR 12.3, Pharmakognosie und Analytische Phytochemie, UniversitaÈt des Saarlandes, D 66041 SaarbruÈcken, Germany
Received 17 June 1999; received in revised form 20 August 1999; accepted 8 September 1999
Abstract
Six rosanes, 5b,11b-dihydroxy-ros-15-ene, 5b,12b-dihydroxy-ros-15-ene, 11b-hydroxy-7-oxo-rosa-5,15-diene, 1a,5b,11b-trihydroxy-7-oxo-ros-15-ene, 5b,20-epoxy-20-hydroxy-ros-15-ene and 5b,20-epoxy-20-methoxy-ros-15-ene along with the
enantiomer of the already reported 11b-hydroxy-rosa-5,15-diene and the known 5b-hydroxy-ros-15-ene have been isolated fromthe liverwort Gackstroemia decipiens. Furthermore, the sesquiterpenes 3-acetoxy-7,11-dihydroxy-farnesa-1,5,9-triene and 1b,10b-epoxy-nardosin-7,11-diene were identi®ed. Their structures were elucidated by NMR spectroscopy. # 2000 Elsevier Science Ltd.
All rights reserved.
Keywords: Gackstroemia decipiens; Lepidolaenaceae; Hepaticae; Liverwort; Rosane; Nardosinane; Farnesane
1. Introduction
Liverworts have yielded a wide range of natural pro-ducts, including some unique sesqui- and diterpenoids(Asakawa, 1995; Lorimer, Perry, Burgess & Foster,1997). In the course of our investigations on terpenoidsfrom liverworts, we have studied Gackstroemia deci-piens HaÈ ssel (Lepidolaenaceae). This species grows onsoil and logs in forests throughout Tierra del Fuegoand Patagonia. So far, there has been only onedetailed report on the chemistry of the genusGackstroemia. Asakawa & Inoue (1984) used GC±MSto examine a lipophilic extract of G. magellanica.Within this studies, a-pinene, elemol, g-muurolene,germacrene D, b-caryophyllene, and b-santalene weredetected. The present paper describes the isolation andcharacterization of six new and two known rosane de-rivatives together with a new nardosinane- and a newfarnesane-type sesquiterpenoid.
2. Results and discussion
A combination of size exclusion chromatography,vacuum liquid chromatography and HPLC of theether extract of the plant led to the isolation of 11b-hydroxy-rosa-5,15-diene (1) whose 1H- and 13C-NMRwere in good agreement with ent-11b-hydroxy-rosa-5,15-diene (Garcia-Alvarez, Rodriguez, Valverde,Fraga & Gonzalez, 1981). However, the isolated com-pound showed a positive rotation ��a�20D � 50:48� incontrast to the ent-rosane-derivative previously iso-lated. Therefore 1 belongs to the rosane-series. Thesame is true for 5b-hydroxy-ros-15-ene (2) which alsoshowed a positive rotation ��a�20D � 718� in contrast toliterature data (Bohlmann et al., 1984). Besides, thefollowing six new rosane derivatives were isolated:5b,11b-dihydroxy-ros-15-ene (3), 5b,12b-dihydroxy-ros-15-ene (4), 11b-hydroxy-7-oxo-rosa-5,15-diene (5),1a,5b,11b-trihydroxy-7-oxo-ros-15-ene (6), 5b,20-epoxy-20-hydroxy-ros-15-ene (7), and 5b,20-epoxy-20-methoxy-ros-15-ene (8). Furthermore, the nardosinane,1b,10b-epoxy-nardosin-7,11-diene (9) and the farne-sane derivative, 3-acetoxy-7,11-dihydroxy-farnesa-1,5,9-triene (10) were obtained. Their structures werededuced from NMR and mass spectral data.
The spectroscopic data of 1 and 2, together with
Phytochemistry 53 (2000) 247±252
0031-9422/00/$ - see front matter # 2000 Elsevier Science Ltd. All rights reserved.
PII: S0031-9422(99 )00500 -2
www.elsevier.com/locate/phytochem
pPublication No. 143 in the series of `Arbeitskreis Chemie und
Biologie der Moose'
* Corresponding author. Tel.: +49-681-302-2420; fax: +49-681-
302-2476.
E-mail address: [email protected] (H. Becker).
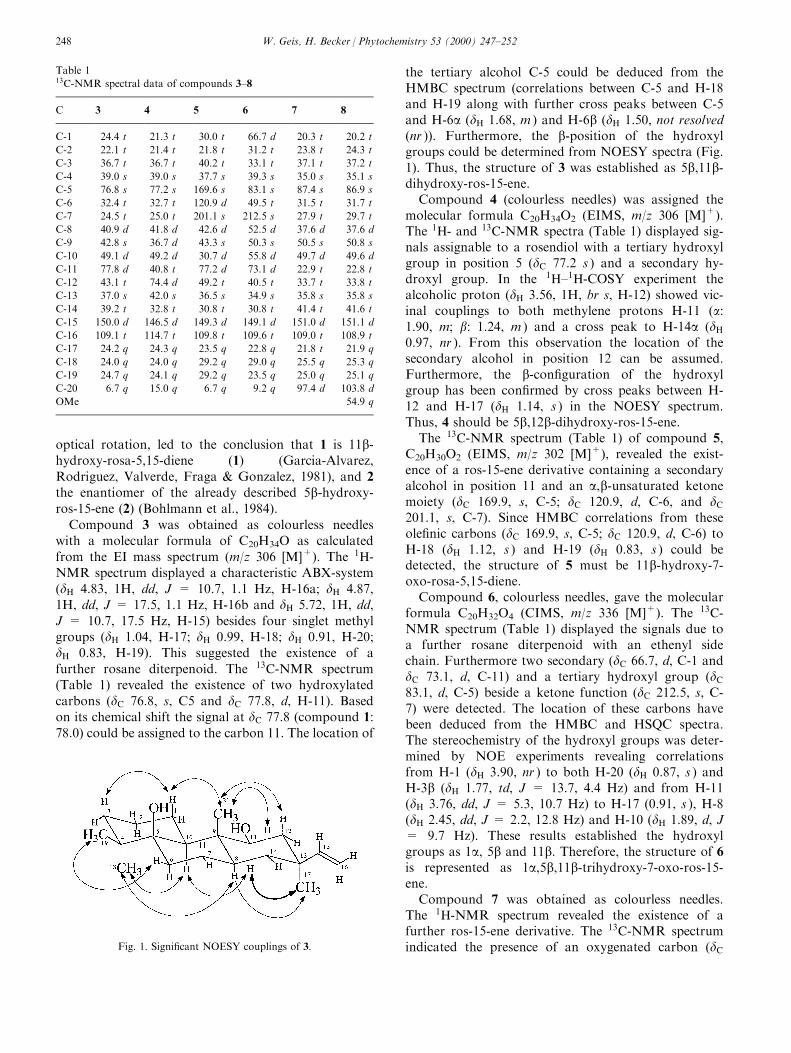
optical rotation, led to the conclusion that 1 is 11b-hydroxy-rosa-5,15-diene (1) (Garcia-Alvarez,Rodriguez, Valverde, Fraga & Gonzalez, 1981), and 2the enantiomer of the already described 5b-hydroxy-ros-15-ene (2) (Bohlmann et al., 1984).
Compound 3 was obtained as colourless needleswith a molecular formula of C20H34O as calculatedfrom the EI mass spectrum (m/z 306 [M]+). The 1H-NMR spectrum displayed a characteristic ABX-system�dH 4.83, 1H, dd, J = 10.7, 1.1 Hz, H-16a; dH 4.87,1H, dd, J = 17.5, 1.1 Hz, H-16b and dH 5.72, 1H, dd,J = 10.7, 17.5 Hz, H-15) besides four singlet methylgroups �dH 1.04, H-17; dH 0.99, H-18; dH 0.91, H-20;dH 0.83, H-19). This suggested the existence of afurther rosane diterpenoid. The 13C-NMR spectrum(Table 1) revealed the existence of two hydroxylatedcarbons �dC 76.8, s, C5 and dC 77.8, d, H-11). Basedon its chemical shift the signal at dC 77.8 (compound 1:78.0) could be assigned to the carbon 11. The location of
the tertiary alcohol C-5 could be deduced from theHMBC spectrum (correlations between C-5 and H-18and H-19 along with further cross peaks between C-5and H-6a �dH 1.68, m ) and H-6b �dH 1.50, not resolved(nr )). Furthermore, the b-position of the hydroxylgroups could be determined from NOESY spectra (Fig.1). Thus, the structure of 3 was established as 5b,11b-dihydroxy-ros-15-ene.
Compound 4 (colourless needles) was assigned themolecular formula C20H34O2 (EIMS, m/z 306 [M]+).The 1H- and 13C-NMR spectra (Table 1) displayed sig-nals assignable to a rosendiol with a tertiary hydroxylgroup in position 5 �dC 77.2 s ) and a secondary hy-droxyl group. In the 1H±1H-COSY experiment thealcoholic proton �dH 3.56, 1H, br s, H-12) showed vic-inal couplings to both methylene protons H-11 �a:1.90, m; b: 1.24, m ) and a cross peak to H-14a �dH
0.97, nr ). From this observation the location of thesecondary alcohol in position 12 can be assumed.Furthermore, the b-con®guration of the hydroxylgroup has been con®rmed by cross peaks between H-12 and H-17 �dH 1.14, s ) in the NOESY spectrum.Thus, 4 should be 5b,12b-dihydroxy-ros-15-ene.
The 13C-NMR spectrum (Table 1) of compound 5,C20H30O2 (EIMS, m/z 302 [M]+), revealed the exist-ence of a ros-15-ene derivative containing a secondaryalcohol in position 11 and an a,b-unsaturated ketonemoiety �dC 169.9, s, C-5; dC 120.9, d, C-6, and dC
201.1, s, C-7). Since HMBC correlations from theseole®nic carbons �dC 169.9, s, C-5; dC 120.9, d, C-6) toH-18 �dH 1.12, s ) and H-19 �dH 0.83, s ) could bedetected, the structure of 5 must be 11b-hydroxy-7-oxo-rosa-5,15-diene.
Compound 6, colourless needles, gave the molecularformula C20H32O4 (CIMS, m/z 336 [M]+). The 13C-NMR spectrum (Table 1) displayed the signals due toa further rosane diterpenoid with an ethenyl sidechain. Furthermore two secondary �dC 66.7, d, C-1 anddC 73.1, d, C-11) and a tertiary hydroxyl group �dC
83.1, d, C-5) beside a ketone function �dC 212.5, s, C-7) were detected. The location of these carbons havebeen deduced from the HMBC and HSQC spectra.The stereochemistry of the hydroxyl groups was deter-mined by NOE experiments revealing correlationsfrom H-1 �dH 3.90, nr ) to both H-20 �dH 0.87, s ) andH-3b �dH 1.77, td, J = 13.7, 4.4 Hz) and from H-11�dH 3.76, dd, J = 5.3, 10.7 Hz) to H-17 (0.91, s ), H-8�dH 2.45, dd, J = 2.2, 12.8 Hz) and H-10 �dH 1.89, d, J= 9.7 Hz). These results established the hydroxylgroups as 1a, 5b and 11b. Therefore, the structure of 6is represented as 1a,5b,11b-trihydroxy-7-oxo-ros-15-ene.
Compound 7 was obtained as colourless needles.The 1H-NMR spectrum revealed the existence of afurther ros-15-ene derivative. The 13C-NMR spectrumindicated the presence of an oxygenated carbon �dC
Table 113C-NMR spectral data of compounds 3±8
C 3 4 5 6 7 8
C-1 24.4 t 21.3 t 30.0 t 66.7 d 20.3 t 20.2 t
C-2 22.1 t 21.4 t 21.8 t 31.2 t 23.8 t 24.3 t
C-3 36.7 t 36.7 t 40.2 t 33.1 t 37.1 t 37.2 t
C-4 39.0 s 39.0 s 37.7 s 39.3 s 35.0 s 35.1 s
C-5 76.8 s 77.2 s 169.6 s 83.1 s 87.4 s 86.9 s
C-6 32.4 t 32.7 t 120.9 d 49.5 t 31.5 t 31.7 t
C-7 24.5 t 25.0 t 201.1 s 212.5 s 27.9 t 29.7 t
C-8 40.9 d 41.8 d 42.6 d 52.5 d 37.6 d 37.6 d
C-9 42.8 s 36.7 d 43.3 s 50.3 s 50.5 s 50.8 s
C-10 49.1 d 49.2 d 30.7 d 55.8 d 49.7 d 49.6 d
C-11 77.8 d 40.8 t 77.2 d 73.1 d 22.9 t 22.8 t
C-12 43.1 t 74.4 d 49.2 t 40.5 t 33.7 t 33.8 t
C-13 37.0 s 42.0 s 36.5 s 34.9 s 35.8 s 35.8 s
C-14 39.2 t 32.8 t 30.8 t 30.8 t 41.4 t 41.6 t
C-15 150.0 d 146.5 d 149.3 d 149.1 d 151.0 d 151.1 d
C-16 109.1 t 114.7 t 109.8 t 109.6 t 109.0 t 108.9 t
C-17 24.2 q 24.3 q 23.5 q 22.8 q 21.8 t 21.9 q
C-18 24.0 q 24.0 q 29.2 q 29.0 q 25.5 q 25.3 q
C-19 24.7 q 24.1 q 29.2 q 23.5 q 25.0 q 25.1 q
C-20 6.7 q 15.0 q 6.7 q 9.2 q 97.4 d 103.8 d
OMe 54.9 q
Fig. 1. Signi®cant NOESY couplings of 3.
W. Geis, H. Becker / Phytochemistry 53 (2000) 247±252248

87.4, d, C-5) and an acetalic carbon �dC 97.4, s, C-20),
each belonging to an epoxide moiety, since a molecular
formula of C20H32O2 (corresponding to a tetracyclic
structure) could be calculated from EI mass spectrum
(m/z 304, [M]+). Based on 1H±1H-COSY, 1H±13C-
COSY, and NOESY data (Fig. 2), structure 7, 5b,20-epoxy-20-hydroxy-ros-15-ene, is assigned to this com-
pound.
The CIMS of compound 8 displayed the molecular
ion at m/z 318, corresponding to a molecular formula
of C21H32O2. The1H-NMR data were very similar to
that of 7, but showed a signi®cant low ®eld shift of H-
20 �dH 4.64, s ) and an additional singlet at dH 3.35
(3H), assignable to a methyl ether group. Thus, 8 mustbe 5b,20-epoxy-20-methoxy-ros-15-ene, the methylether
of 7, what could be proved by further HMBC-,
HSQC-, and NOESY-experiments.
Compound 9 was obtained as a colourless oil with a
molecular formula of C15H22O as calculated from the
EI mass spectrum (m/z 218, [M]+). 1H-NMR and 13C-
NMR displayed the signals of an exomethylene group
�dH 4.85, 2H, s, H-12; dC 145.6, s, C-11; dC 115.7, t, C-
12), and two methine protons, each belonging to a
double bond �dH 5.50, 1H, m, H-7; dH 5.65, 1H, m, H-
8; dC 129.9, d, C-7; dC 123.4, d, C-8). Based on their
chemical shift the signals at dC 57.0 (d, C-1) and dC
61.6 (s, C-10) could be assigned to the bridgehead car-
bons of an epoxide ring. Furthermore, the 1H-NMR
spectrum showed signals due to three methyl groups
�dH 1.83, s, H-13; dH 1.03, s, H-14; dH 0.76, d, J = 6.6
Hz, H-15). The 1H- and 13C-NMR assignments by 1H±1H-COSY, 1H±13C-COSY, DEPT experiments revealed
the constitution of compound 9 as 1,10-epoxy-nardo-
sin-7,11-diene. As there were NOESY correlations
(Fig. 3) of H-14 with H-15, H-6 �dH 2.86, dd, J = 3.5,
2.7 Hz), and 9a �dH 1.91, m ), together with cross
peaks between H-4 �dH 1.67, m ) and H-2b �dH 1.85,
m ), both methyl groups C-14 and C-15 had to be in
the a-position, whereas the epoxide-ring has to be in
the b-position, proved by further NOESY-signals
between H-1 and H-9b �dH 2.73, ddd, J = 2.7, 19.2,
4.9 Hz). Therefore, the structure of 9 was established
as 1b,10b-epoxy-nardosin-7,11-diene. The absolute
con®guration of this compound remained to be clari-
®ed.
Compound 10 with the molecular formula C17H28O4
(EIMS, m/z 296, [M]+) was obtained as a colourless
oil. The 13C-NMR spectrum showed signals due to
four methyls, two methylenes, six ole®nic carbons,
three quaternary carbons with an oxygen shift, and a
acetoxy group. Based on their chemical shifts the sig-
nals at dC 113.5 (t, C-1) and dC 141.5 (d, C-2) could be
assigned to an exocyclic double bond. These spectro-
scopic data coupled with the molecular formula indi-
cated a farnesane sesquiterpenoid. The location of the
double bonds could be deduced from the HMBC and
HSQC spectra, as correlations of C-11 �dC 70.6, s ), C-
12 �dC 29.9, q ), and C-13 �dC 29.9, q ) to H-10 �dH
5.68, d, J = 15.8) and H-9 �dH 5.60, m ) along with
cross peaks between C-14 �dC 27.9, q ) and H-6 �dH
5.55, nr ), and H-5 �dH 5.57, nr ), respectively, were
observed. On the basis of these results, structure
10, 3-acetoxy-7,11-dihydroxy-farnesa-1,5,9-triene, was
assigned to this compound.
Rosanes are new diterpenoids for Hepaticae whereas
a nardosinane sesquiterpenoid and farnesane deriva-
tives have been reported from di�erent species
(Asakawa, 1995). Rosanes arise by migration of the C-
10 methyl group of pimaranes to C-9 and occur in
both enantiomeric series predominantly in higher
plants whereas nardosinanes, isolated from marine
organism and higher plants, are eremophilanes in
which the isopropyl group has migrated to carbon 6
(Connolly & Hill, 1992). Apart from the reported sub-
stances, b-santalane-type sesquiterpenoids and a berga-
motane derivative, which showed an intensive odour,
were isolated from G. decipiens (Geis & Becker, 1999).
Our results showed, that this species produces a con-
siderable number of new and interesting compounds.
In conclusion, G. decipiens has no chemotaxonomic re-
lationships to any other liverworts, apart from the re-
lated species G. magellanica (Asakawa & Inoue, 1984).
Fig. 2. Signi®cant HMBC and NOESY (bold) couplings of 7.
Fig. 3. Signi®cant NOESY couplings of 8.
W. Geis, H. Becker / Phytochemistry 53 (2000) 247±252 249
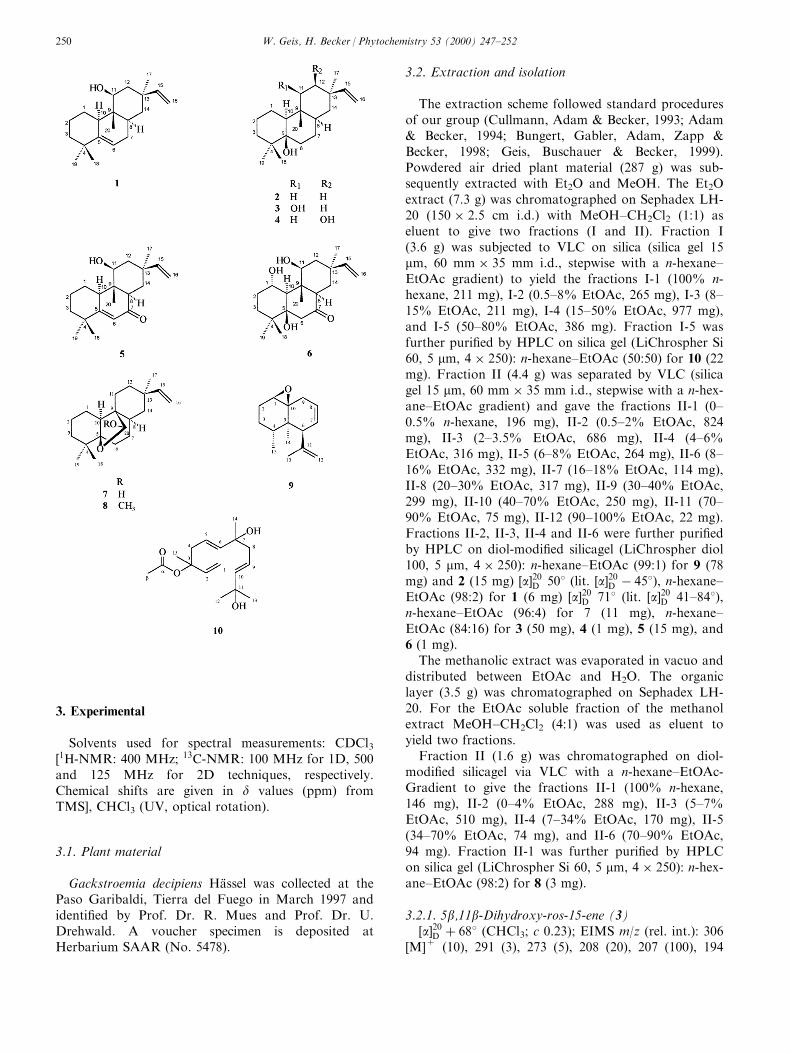
3. Experimental
Solvents used for spectral measurements: CDCl3�1H-NMR: 400 MHz; 13C-NMR: 100 MHz for 1D, 500and 125 MHz for 2D techniques, respectively.Chemical shifts are given in d values (ppm) fromTMS], CHCl3 (UV, optical rotation).
3.1. Plant material
Gackstroemia decipiens HaÈ ssel was collected at thePaso Garibaldi, Tierra del Fuego in March 1997 andidenti®ed by Prof. Dr. R. Mues and Prof. Dr. U.Drehwald. A voucher specimen is deposited atHerbarium SAAR (No. 5478).
3.2. Extraction and isolation
The extraction scheme followed standard proceduresof our group (Cullmann, Adam & Becker, 1993; Adam& Becker, 1994; Bungert, Gabler, Adam, Zapp &Becker, 1998; Geis, Buschauer & Becker, 1999).Powdered air dried plant material (287 g) was sub-sequently extracted with Et2O and MeOH. The Et2Oextract (7.3 g) was chromatographed on Sephadex LH-20 (150 � 2.5 cm i.d.) with MeOH±CH2Cl2 (1:1) aseluent to give two fractions (I and II). Fraction I(3.6 g) was subjected to VLC on silica (silica gel 15mm, 60 mm � 35 mm i.d., stepwise with a n-hexane±EtOAc gradient) to yield the fractions I-1 (100% n-hexane, 211 mg), I-2 (0.5±8% EtOAc, 265 mg), I-3 (8±15% EtOAc, 211 mg), I-4 (15±50% EtOAc, 977 mg),and I-5 (50±80% EtOAc, 386 mg). Fraction I-5 wasfurther puri®ed by HPLC on silica gel (LiChrospher Si60, 5 mm, 4 � 250): n-hexane±EtOAc (50:50) for 10 (22mg). Fraction II (4.4 g) was separated by VLC (silicagel 15 mm, 60 mm � 35 mm i.d., stepwise with a n-hex-ane±EtOAc gradient) and gave the fractions II-1 (0±0.5% n-hexane, 196 mg), II-2 (0.5±2% EtOAc, 824mg), II-3 (2±3.5% EtOAc, 686 mg), II-4 (4±6%EtOAc, 316 mg), II-5 (6±8% EtOAc, 264 mg), II-6 (8±16% EtOAc, 332 mg), II-7 (16±18% EtOAc, 114 mg),II-8 (20±30% EtOAc, 317 mg), II-9 (30±40% EtOAc,299 mg), II-10 (40±70% EtOAc, 250 mg), II-11 (70±90% EtOAc, 75 mg), II-12 (90±100% EtOAc, 22 mg).Fractions II-2, II-3, II-4 and II-6 were further puri®edby HPLC on diol-modi®ed silicagel (LiChrospher diol100, 5 mm, 4 � 250): n-hexane±EtOAc (99:1) for 9 (78mg) and 2 (15 mg) �a�20D 508 (lit. �a�20D ÿ 458), n-hexane±EtOAc (98:2) for 1 (6 mg) �a�20D 718 (lit. �a�20D 41±848),n-hexane±EtOAc (96:4) for 7 (11 mg), n-hexane±EtOAc (84:16) for 3 (50 mg), 4 (1 mg), 5 (15 mg), and6 (1 mg).
The methanolic extract was evaporated in vacuo anddistributed between EtOAc and H2O. The organiclayer (3.5 g) was chromatographed on Sephadex LH-20. For the EtOAc soluble fraction of the methanolextract MeOH±CH2Cl2 (4:1) was used as eluent toyield two fractions.
Fraction II (1.6 g) was chromatographed on diol-modi®ed silicagel via VLC with a n-hexane±EtOAc-Gradient to give the fractions II-1 (100% n-hexane,146 mg), II-2 (0±4% EtOAc, 288 mg), II-3 (5±7%EtOAc, 510 mg), II-4 (7±34% EtOAc, 170 mg), II-5(34±70% EtOAc, 74 mg), and II-6 (70±90% EtOAc,94 mg). Fraction II-1 was further puri®ed by HPLCon silica gel (LiChrospher Si 60, 5 mm, 4 � 250): n-hex-ane±EtOAc (98:2) for 8 (3 mg).
3.2.1. 5b,11b-Dihydroxy-ros-15-ene (3)�a�20D � 688 (CHCl3; c 0.23); EIMS m/z (rel. int.): 306
[M]+ (10), 291 (3), 273 (5), 208 (20), 207 (100), 194
W. Geis, H. Becker / Phytochemistry 53 (2000) 247±252250
(10), 173 (5), 161 (4), 147 (5), 135 (4), 123 (20), 55(20); IR nKBr
max cmÿ1: 3359, 2900, 2870; 1H-NMR(CDCl3) dH 5.72 (1H, dd, J = 10.7, 17.5 Hz, H-15),4.87 (1H, dd, J = 17.5, 1.1 Hz, H-16a), 4.83 (1H, dd,J = 10.7, 1.1 Hz, H-16b), 3.57 (1H, dd, J = 11.1, 4.8Hz, H-11), 1.04 (3H, s, H-17), 0.99 (3H, s, H-18), 0.91(3H, s, H-20), 0.83 (3H, s, H-19), 13C-NMR (CDCl3):Table 1.
3.2.2. 5b,12b-Dihydroxy-ros-15-ene (4)�a�20D � 578 (CHCl3; c 0.27); EIMS m/z (rel. int.): 306
[M]+ (17), 291 (90), 273 (12), 247 (20), 219 (85), 207(12), 177 (10), 161 (10), 149 (20), 133 (20), 119 (25),105 (25), 95 (45), 79 (55), 69 (60), 55 (100); IR nKBr
max
cmÿ1: 3300, 2950, 2870; 1H-NMR (CDCl3) dH 5.83(1H, dd, J = 10.8, 17.4 Hz, H-15), 5.15 (1H, d, J =10.8 Hz, H-16a), 5.12 (1H, d, J = 17.4 Hz, H-16b),3.56 (1H, br s, H-11), 1.21 (3H, s, H-20), 1.14 (3H, s,H-17), 1.04 (3H, s, H-18), 0.83 (3H, s, H-19), 13C-NMR (CDCl3): Table 1.
3.2.3. 11b-Hydroxy-7-oxo-rosa-5,15-diene (5)�a�20D � 768 (CHCl3; c 0.41); EIMS m/z (rel. int.): 302
[M]+ (17), 284 (15), 269 (20), 256 (10), 241 (20), 228(18), 215 (25), 203 (25), 191 (27), 177 (40), 163 (100),151 (40), 135 (30), 121 (80), 107 (45), 91 (45), 79 (55),69 (30), 55 (60); IR nKBr
max cmÿ1: 3400, 2950, 2900, 1645;1H-NMR (CDCl3) dH 5.94 (1H, br d, J = 1.4 Hz, H-6), 5.79 (1H, dd, J = 10.6, 17.4 Hz, H-15), 4.96 (1H,dd, J = 17.4, 0.9 Hz, H-16a), 4.88 (1H, dd, J = 10.6,0.9 Hz, H-16b), 3.91 (1H, t, J = 8.0 Hz, H-11), 1.12(6H, s, H-17, H-18), 0.83 (3H, s, H-19), 0.73 (3H, s,H-20); 13C-NMR (CDCl3): Table 1.
3.2.4. 1a,5b,11b-Trihydroxy-7-oxo-ros-15-ene (6)�a�20D � 768 (CHCl3; c 0.17); EIMS m/z (rel. int.): 336
[M]+ (20), 319 (70), 301 (100), 283 (30), 274 (5), 255(7), 231 (4), 221 (18), 203 (20), 189 (7), 175 (5), 161(10), 147 (10), 135 (8), 119 (10), 107 (10), 91 (20), 79(25), 67 (20), 55 (25); IR nKBr
max cmÿ1: 3400, 3200, 2950,2900, 1680; 1H-NMR (CDCl3) dH 5.73 (1H, dd, J =10.7, 17.5 Hz, H-15), 4.87 (1H, dd, J = 17.5, 0.8 Hz,H-16a), 4.79 (1H, dd, J = 10.7, 0.8 Hz, H-16b), 3.90(1H, m, H-1), 3.76 (1H, dd, J = 5.3, 10.7 Hz, H-11),1.02 (3H, s, H-19), 0.91 (3H, s, H-17), 0.87 (3H, s, H-20), 0.75 (3H, s, H-18); 13C-NMR (CDCl3): Table 1.
3.2.5. 5b,20-Epoxy-20-hydroxy-ros-15-ene (7)�a�20D � 358 (CHCl3; c 0.22); EIMS m/z (rel. int.): 304
[M]+ (10), 289 (3), 275 (5), 258 (7), 243 (12), 215 (5),202 (8), 193 (100), 178 (15), 163 (8), 147 (15), 133 (12),119 (10), 107 (15), 91 (20), 79 (18), 67 (15), 55 (25); IRnKBr
max cmÿ1: 3400, 3000, 2900, 1H-NMR (CDCl3) dH
5.78 (1H, dd, J = 10.7, 17.5 Hz, H-15), 5.20 (1H, br d,J = 3.9 Hz, H-11), 4.90 (1H, dd, J = 17.5, 1.0 Hz, H-16a), 4.83 (1H, dd, J = 10.7, 1.0 Hz, H-16b), 1.02
(3H, s, H-17), 0.93 (3H, s, H-18), 0.88 (3H, s, H-19);13C-NMR (CDCl3): Table 1.
3.2.6. 5b,20-Epoxy-20-methoxy-ros-15-ene (8)�a�20D � 338 (CHCl3; c 0.12); EIMS m/z (rel. int.): 318
[M]+ (10), 303 (5), 287 (3), 271 (2), 258 (10), 243 (12),229 (4), 216 (5), 207 (100), 194 (10), 189 (7), 175 (4),161 (8), 147 (35), 133 (12), 119 (12), 105 (15), 91 (20),79 (18), 67 (15), 55 (25); IR nKBr
max cmÿ1: 3400, 2950,1650; 1H-NMR (CDCl3) dH 5.76 (1H, dd, J = 10.7,17.5 Hz, H-15), 4.87 (1H, dd, J = 17.5, 1.3Hz, H-16a),4.82 (1H, dd, J = 10.7, 1.3 Hz, H-16b), 4.64 (1H, s,H-20), 3.35 (1H, s, H-a), 1.00 (3H, s, H-17), 0.93 (3H,s, H-18), 0.85 (3H, s, H-19); 13C-NMR (CDCl3):Table 1.
3.2.7. 1b,10b-Epoxy-nardosin-7,11-diene (9)�a�20D � 1958 (CHCl3; c 0.61); EIMS m/z (rel. int.):
218 [M]+ (3), 203 (4), 189 (3), 175 (6), 160 (10), 145(12), 133 (7), 121 (15), 105 (15), 95 (60), 79 (100), 67(30), 55 (22); IR nKBr
max cmÿ1: 2950, 2930; 1H-NMR(CDCl3) dH 5.65 (1H, m, H-8), 5.50 (1H, m, H-8), 4.85(1H, s, H-12), 2.86 (1H, dd, J = 3.5, 2.7 Hz, H-6),2.80 (1H, t, J = 2.3 Hz, H-1), 2.73 (1H, ddd, J = 2.7,4.9, 19.2 Hz, H-9b), 1.85 (2H, m, H-2a, H-2b), 1.83(3H, s, H-13), 1.67 (3H, m, H-4), 1.61 (3H, m, H-9a),1.03 (3H, s, H-14), 0.76 (3H, d, J = 6.6 Hz, H-15);13C-NMR (CDCl3): 145.6 (s, C-11), 129.9 (d, C-7),123.4 (d, C-8), 115.7 (t, C-12), 61.6 (s, C-10), 57.0 (d,C-1), 54.1 (d, C-6), 37.8 (s, C-5), 32.7 (t, C-9), 29.1 (d,C-4), 25.5 (t, C-3), 22.4 (t, C-2), 20.7 (q, C-4), 17.6 (q,C-14), 16.4 (q, C-15).
3.2.8. 3-Acetoxy-7,11-dihydroxy-farnesa-1,5,9-triene(10)�a�20D � 58 (CHCl3; c 0.24); EIMS m/z (rel. int.): 296
[M]+ (8), 279 (22), 261 (13), 233 (6), 219 (40), 201(20), 151 (12), 137 (100), 121 (10), 109 (10), 95 (15), 82(35), 71 (10), 55 (5); IR nKBr
max cmÿ1: 3350, 2900, 2850;1H-NMR (CDCl3) dH 5.90 (1H, m, H-2), 5.68 (1H, d,J = 15.8 Hz, H-10), 5.60 (1H, m, H-9), 5.57 (1H, nr,H-6), 5.55 (1H, nr, H-5), 5.11 (1H, m, H-1), 2.57 (1H,m, H-4), 2.19 (1H, m, H-8), 1.97 (3H, s, H-b), 1.48(3H, s, H-15), 1.29 (6H, s, H-12, H-13), 1.23 (3H, s,H-14); 13C-NMR (CDCl3): 169.9 (s, C-a), 142.6 (d, C-10), 141.5 (d, C-2), 122.2 (d, C-5), 121.9 (d, C-9), 113.5(t, C-1), 140.9 (d, C-6), 82.2 (s, C-3), 72.2 (s, C-7), 70.6(s, C-11), 45.5 (t, C-8), 42.2 (t, C-4), 29.9 (q, C-12, C-13), 27.9 (q, C-14), 23.7 (q, C-15), 22.1 (q, C-b).
Acknowledgements
The authors thank Prof. R. Mues, SaarbruÈ cken, forproviding the plant material and Dr. Josef Zapp forrecording the NMR spectra.
W. Geis, H. Becker / Phytochemistry 53 (2000) 247±252 251
References
Adam, K. P., & Becker, H. (1994). Phenanthrenes and other pheno-
lics from in vitro cultures of Marchantia polymorpha.
Phytochemistry, 35, 139±143.
Asakawa, Y. (1995). Chemical constituents of bryophytes. In W.
Herz, G. W. Kirby, R. E. Moore, W. Steglich, & C. Tamm,
Progress in the chemistry of organic natural products, vol. 65 (pp.
1±168). Wien, New York: Springer Verlag.
Asakawa, Y., & Inoue, H. (1984). Chemical constituents of selected
Chilean liverworts. In H. Inoue, Studies on cryptogames in
southern Chile (pp. 109±115). Tokyo: Kenseisha.
Bohlmann, F., Zdero, C., Jakupovic, J., Gerke, T., Wallmeyer, M.,
King, R. M., & Robinson, H. (1984). Neue Sesquiterpenlactone
und Rosan-Derivate aus Trichogonia-Arten. Liebigs Annalen der
Chemie, 162±185.
Bungert, M., Gabler, J., Adam, K. P., Zapp, J., & Becker, H. (1998).
Pinguisane sesquiterpenes from the liverwort Porella navicularis.
Phytochemistry, 49, 1079±1083.
Connolly, J. D., & Hill, R. A. (1992). Dictionary of terpenoids.
Mono- and sesquiterpenoids, vol. 1 (pp. 1±653). London, New
York, Tokyo, Melbourne: Chapman & Hall.
Cullmann, F., Adam, K. P., & Becker, H. (1993). Bisbibenzyles
and lignans from Pellia epiphylla. Phytochemistry, 34, 831±
834.
Garcia-Alvarez, M. C., Rodriguez, B., Valverde, S., Fraga, M. F., &
Gonzales, G. (1981). Carbon-13 NMR spectra of some ent-rosane
diterpenoids. Phytochemistry, 20, 167±169.
Geis, W., & Becker, H. (1999). Odoriferous sesquiterpenoids from
the liverwort Gackstroemia decipiens. Flavour and Fragrance
Journal (submitted).
Geis, W., Buschauer, B., & Becker, H. (1999). cis-Clerodanes from
axenic cultures of the liverwort Scapania nemorea.
Phytochemistry, 51, 643±649.
Lorimer, S. D., Perry, N. B., Burgess, E. J., & Foster, L. M. (1997).
1-Hydroxyditerpenes from two New Zealand liverworts,
Paraschistochila pinnatifolia and Trichocolea mollissima. Journal
of Natural Products, 60, 421±424.
W. Geis, H. Becker / Phytochemistry 53 (2000) 247±252252
Antinociceptive substances from Incarvillea delavayi
Motoyuki Nakamura, Katsumi Kido, Junei Kinjo, Toshihiro Nohara*
Faculty of Pharmaceutical Sciences, Kumamoto University, Oe-Honmachi 5-1, Kumamoto 862-0973, Japan
Received 19 February 1999; received in revised form 10 September 1999; accepted 11 October 1999
Abstract
Antinociceptive activities of an Incarvillea delavayi extract, as well as its constituents, 8-epideoxyloganic acid and delavayineA, were evaluated in the acetic acid induced writhing test in mice. An oral administration of the delavayi extract weakly
decreased the number of writhings and stretchings in this test, in a dose-dependent manner. Furthermore, orally administered 8-epideoxyloganic acid showed weak antinociceptive activity, whereas administration by subcutaneous injection did not. However,subcutaneous injection of delavayine A, a novel monoterpene alkaloid, showed a more signi®cant level of antinociceptive
activity. # 2000 Elsevier Science Ltd. All rights reserved.
Keywords: Incarvillea delavayi; Bignoniaceae; Monoterpene alkaloid; Iridoid; Antinociception
1. Introduction
We have previously reported various novel monoter-pene alkaloid derivatives obtained from Incarvilleasinensis which display signi®cant antinociception andanti-in¯ammatory e�ects (Chi, Hashimoto, Yan &Nohara, 1995a, 1995b; Chi, Hashimoto, Yan, Nohara,Yamashita & Marubayashi, 1997a; Chi, Hashimoto,Yan & Nohara, 1997b; Chi et al., 1997c; Nakamura etal., 1999). However, Incarvillea delavayi, which is usedhorticulturally in China, has not been chemically andpharmacologically investigated. As part of our conti-nuing study of Incarvillea spp., we now report thestructural elucidation and antinociceptive activity of anew monoterpene alkaloid and a known iridoidobtained from I. delavayi.
2. Results and discussion
The aerial parts of I. delavayi were extracted withMeOH, and the extract was partitioned with 80%
MeOH and n-hexane. The 80% MeOH-soluble frac-
tion was subjected to Diaion HP-20, Sephadex LH20
and silica gel column chromatography, respectively, to
yield 1 as a major component and 2 as a minor com-
ponent.
Compound 1 was identi®ed as 8-epideoxyloganic
acid by the aid of 1H±1H, 1H±13C COSY and HMBC
spectra, and by comparison of its NMR spectral data
with those of an authentic sample (Uesato, Miyauchi,
Itoh & Inouye, 1986).
Compound 2, delavayine A, showed a [M]+ ion
peak at m/z 302 in the positive FABMS, and its mol-
ecular formula was established as C19H28NO2 by high
resolution mass spectros copy. The 1H-NMR spectrum
of 2 contained signals for three methyl groups �d 0.88,
d 3.50 and d 3.83) and three methine groups �d 8.25, d7.50 and d 7.56) linked to the aromatic ring of benzoic
acid. The 13C-NMR spectrum of 2 revealed two qua-
ternary carbons �d 130.7, C-1 ' and d 166.6, C-7 ')linked to benzoic acid and 12 signals belonging to a
monoterpene alkaloid unit; suggesting that benzoic
acid was attached to the hydroxy group at C-11 of the
monoterpene alkaloid. This was con®rmed by analysis
of the 1H±1H COSY, HMBC and NOESY spectra
(Table 1, Fig. 1). Therefore, the structure of compound
2 was established as shown in the formula, although
Phytochemistry 53 (2000) 253±256
0031-9422/00/$ - see front matter # 2000 Elsevier Science Ltd. All rights reserved.
PII: S0031-9422(99 )00536 -1
www.elsevier.com/locate/phytochem
* Corresponding author. Tel.: +81-96-371-4380; fax: +81-96-362-
7799.
E-mail address: [email protected] (T. Nohara).
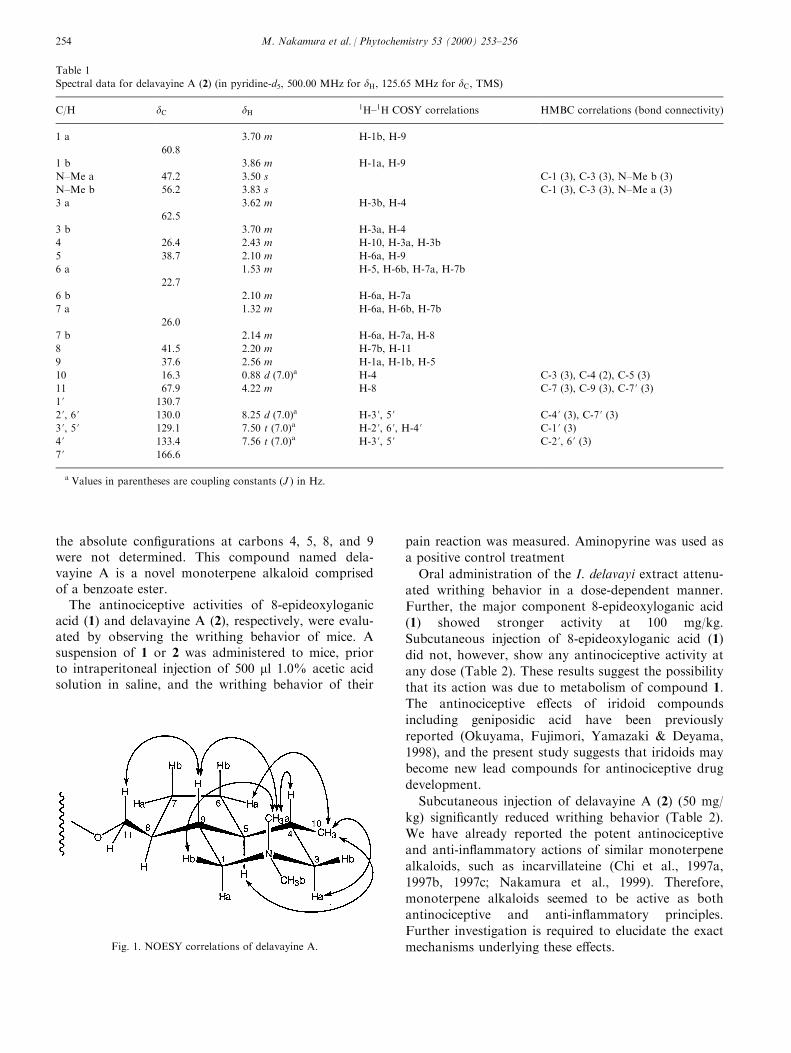
the absolute con®gurations at carbons 4, 5, 8, and 9were not determined. This compound named dela-vayine A is a novel monoterpene alkaloid comprisedof a benzoate ester.
The antinociceptive activities of 8-epideoxyloganicacid (1) and delavayine A (2), respectively, were evalu-ated by observing the writhing behavior of mice. Asuspension of 1 or 2 was administered to mice, priorto intraperitoneal injection of 500 ml 1.0% acetic acidsolution in saline, and the writhing behavior of their
pain reaction was measured. Aminopyrine was used as
a positive control treatment
Oral administration of the I. delavayi extract attenu-
ated writhing behavior in a dose-dependent manner.
Further, the major component 8-epideoxyloganic acid(1) showed stronger activity at 100 mg/kg.
Subcutaneous injection of 8-epideoxyloganic acid (1)
did not, however, show any antinociceptive activity at
any dose (Table 2). These results suggest the possibility
that its action was due to metabolism of compound 1.
The antinociceptive e�ects of iridoid compounds
including geniposidic acid have been previously
reported (Okuyama, Fujimori, Yamazaki & Deyama,
1998), and the present study suggests that iridoids may
become new lead compounds for antinociceptive drug
development.
Subcutaneous injection of delavayine A (2) (50 mg/
kg) signi®cantly reduced writhing behavior (Table 2).
We have already reported the potent antinociceptive
and anti-in¯ammatory actions of similar monoterpene
alkaloids, such as incarvillateine (Chi et al., 1997a,
1997b, 1997c; Nakamura et al., 1999). Therefore,
monoterpene alkaloids seemed to be active as bothantinociceptive and anti-in¯ammatory principles.
Further investigation is required to elucidate the exact
mechanisms underlying these e�ects.
Table 1
Spectral data for delavayine A (2) (in pyridine-d5, 500.00 MHz for dH, 125.65 MHz for dC, TMS)
C/H dC dH1H±1H COSY correlations HMBC correlations (bond connectivity)
1 a 3.70 m H-1b, H-9
60.8
1 b 3.86 m H-1a, H-9
N±Me a 47.2 3.50 s C-1 (3), C-3 (3), N±Me b (3)
N±Me b 56.2 3.83 s C-1 (3), C-3 (3), N±Me a (3)
3 a 3.62 m H-3b, H-4
62.5
3 b 3.70 m H-3a, H-4
4 26.4 2.43 m H-10, H-3a, H-3b
5 38.7 2.10 m H-6a, H-9
6 a 1.53 m H-5, H-6b, H-7a, H-7b
22.7
6 b 2.10 m H-6a, H-7a
7 a 1.32 m H-6a, H-6b, H-7b
26.0
7 b 2.14 m H-6a, H-7a, H-8
8 41.5 2.20 m H-7b, H-11
9 37.6 2.56 m H-1a, H-1b, H-5
10 16.3 0.88 d (7.0)a H-4 C-3 (3), C-4 (2), C-5 (3)
11 67.9 4.22 m H-8 C-7 (3), C-9 (3), C-7 ' (3)1 ' 130.7
2 ', 6 ' 130.0 8.25 d (7.0)a H-3 ', 5 ' C-4 ' (3), C-7 ' (3)3 ', 5 ' 129.1 7.50 t (7.0)a H-2 ', 6 ', H-4 ' C-1 ' (3)4 ' 133.4 7.56 t (7.0)a H-3 ', 5 ' C-2 ', 6 ' (3)7 ' 166.6
a Values in parentheses are coupling constants (J ) in Hz.
Fig. 1. NOESY correlations of delavayine A.
M. Nakamura et al. / Phytochemistry 53 (2000) 253±256254
3. Experimental
3.1. General
1H- and 13C-NMR, DEPT, 1H±1H COSY andHMBC spectra were recorded on a JEOL JNM-GX-400 and a-500 in C5D5N. TMS was used as inter-national standard. FABMS (negative ion mode): 2±3kV. HR-FABMS: JEOL DX-303HF. CC: silica gel 60(spherical, 40±100 mesh, Kanto Chemicals),Chromatorex Chromatography Silica gel (DM-1020,100±200 mesh, FUJI Silylia), Sephadex LH-20(Pharmacia), Diaion HP-20 (Mitsubishi Chemical).TLC: silica gel 60 F254 (0.2 mm, Merck); visualizedunder UV light (254 and 366 nm). TLC solvent sys-tem: CHCl3±MeOH±H2O (7: 3: 0.5).
3.2. Plant material
The bulbs of Incarvillea delavayi (Bignoniaceae)were purchased from Heiwa-en, Japan, with the plantsthen grown in our garden (Botany section of Facultyof Pharmaceutical Sciences, Kumamoto University).
3.3. Extraction and separation
Dried aerial parts of delavayi (1.5 kg) were exhaus-tively extracted with MeOH. The MeOH extract wasconcentrated under reduced pressure to a�ord a syrup(yield 128 g), which was partitioned between 80%MeOH and n-hexane. The 80% MeOH-sol. fractionwas subjected to various chromatographic steps,including Diaion HP-20 column chromatography,using H2O±MeOH (10:04 0:10) as eluant, subjectedto silica gel column chromatography using CHCl3±MeOH±H2O (30:1:0 4 6: 4: 1) as eluant, chromatorexcolumn chromatography with CHCl3±MeOH±NH3 (8:
Table 2
Inhibitory e�ect of I. delavayi extract, 8-epideoxyloganic acid and delavayine A on acetic acid-induced writhing in micea
Drug Dose (mg/kg) Administration No. of writhings (counts/20 min) % Inhibition
2.5% Tween 80/saline ± p.o 31.324.3 ±
± s.c. 32.022.7 ±
I. delavayi ext. 200 p.o. 31.021.4 1
400 p.o. 20.522.9b 35
8-Epideoxyliganic acid (1) 50 p.o. 33.527.2 ÿ5100 p.o. 16.022.0b 49
50 s.c. 32.023.2 0
100 s.c. 30.027.9 6
Delavayine A (2) 50 s.c. 17.623.4b 45
Aminopyrine (positive control) 50 p.o. 4.022.9b 87
50 s.c. 1.822.1b 94
a Each value is the mean of ®ve mice with S.E.M. % inhibition produced by the p.o. of I. delavayi ext. 8-eoideoxyliganic acid and Aminopyrine
was calculated with respect to p.o. of 2.5% Tween 80/saline, while s.c. of 8-eoideoxyliganic acid, delavayine A and aminopyrine with respect to
s.c. of 2.5% Tween 80/saline.b p < 0:01 compared with 2.5% Tween 80/saline group (Dunnett's test).
M. Nakamura et al. / Phytochemistry 53 (2000) 253±256 255
2: 0.2 4 6: 4: 1) as eluant and Sephadex LH-20 col-umn chromatography with MeOH as eluant to a�ordcompounds 1 (18 mg) and 2 (11 mg), respectively.
3.4. 8-Epideoxyloganic acid (1)
Yellow powder, �a�23D ÿ 22.58 �c � 0:50, C5H5N);Positive ion FABMS m/z: 361 [M+H]+, Negative ionFABMS m/z : 359 [M±H]ÿ; 1H-NMR (pyridine d5); d1.10 (3H, d, J � 7:0 Hz, 10-H), 1.34 (1H, m, 7-Ha ),1.65 (1H, m, 7-Hb ), 1.84 (1H, m, 6-Ha ), 2.08 (1H, m,8-H), 2.20 (1H, m, 6-Hb ), 2.39 (1H, dd, J � 7:0, 8.0Hz, 9-H), 3.24 (1H, dd, J � 7:0, 8.0 Hz, 5-H), 4.02(1H, brs, glc 5 '-H), 4.08 (1H, t, J � 8:0 Hz, glc 2 '-H),4.26 (1H, m, glc 4 '-H), 4.28 (1H, m, glc 3 '-H), 4.40(1H, m, glc 6 '-Ha ), 4.58 (1H, m, glc 6 '-Hb ), 5.42 (1H,d, J � 8:0 Hz, glc 1 '-H), 5.76 (1H, d, J � 5:0 Hz, 1-H),7.92 (1H, s, 3-H); 13C-NMR spectral data (pyridine-d5); d 16.5 (10 '-Me), 31.8 (C-6), 32.6 (C-7), 34.0 (C-5),36.5 (C-8), 43.6 (C-9), 62.8 (glc-6 '), 71.6 (glc-4 '), 74.9(glc-2 '), 78.5 (glc-3 '), 78.8 (glc-5 '), 95.5 (C-1), 100.5(glc-1 '), 113.5 (C-4), 151.3 (C-3), 169.6 (COO).
3.5. Delavayine A (2)
Yellow powder, �a�22D ÿ 5.18 �c � 0:90, C5H5N);Positive FABMS m/z: 302[M]+, Negative ion FABMSm/z: 372 [M+2Cl]ÿ. HR-FABMS m/z: 302.2119[M]+
(calcd. for C19H28NO2: 302.2120).1H-NMR and 13C-
NMR spectral data (pyridine-d5); see Table 1.
3.6. Animals
Male ICR mice (Charles Liver) weighing 25±35 gwere used in this study. Prior to experiments, animalswere housed for at least one week in the laboratoryanimal room. Housing conditions were maintained at23218C with 60% humidity, in 12: 12 h light±darkcycle. Food and water were given ad libitum.
3.7. Writhing test and treatments
A modi®ed Whittle's method was used (Whittle,1964). The tested drugs were prepared as suspensionswith 2.5% Tween 80/saline. Oral administration;MeOH extract (200, 400 mg/kg), 8-Epideoxyloganic
acid (1) (50, 100 mg/kg), aminopyrine (reference drug,50 mg/kg) and 2.5% Tween 80/saline (vehicle) wereadministered 20 min prior to the injection of an indu-cer (1% acetic acid/saline, 500 ml, i. p.). Subcutaneousadministration; 8-epideoxyloganic acid (1) (50, 100 mg/kg), Delavayine A (2) (50 mg/kg), aminopyrine (50mg/kg) and 2.5% Tween 80/saline (vehicle) were admi-nistered 10 min prior to injection of inducer. The num-ber of writhings and stretchings was counted over 20min, beginning 5 min after introduction of the inducerby injection. The percentage of inhibition was deter-mined for each experimental group of ®ve mice as fol-lows
inhibition �%� � 100� �1ÿ experimental=control�
3.8. Statistical analysis
The data are shown as mean2SE �n � 5). TheDunnett's test was employed to determine the signi®-cance of di�erence between control and experimentalsamples.
References
Chi, Y. M., Hashimoto, F., Yan, W. M., & Nohara, T. (1995a).
Phytochemistry, 40, 353.
Chi, Y. M., Hashimoto, F., Yan, W. M., & Nohara, T. (1995b).
Phytochemistry, 39, 1485.
Chi, Y. M., Hashimoto, F., Yan, W. M., Nohara, T., Yamashita,
M., & Marubayashi, N. (1997a). Chemical and Pharmceutical
Bulletin, 45, 495.
Chi, Y. M., Hashimoto, F., Yan, W. M., & Nohara, T. (1997b).
Phytochemistry, 46, 763.
Chi, Y. M., Hashimoto, F., Nohara, T., Yan, W. M., Nakamura,
M., Nakasugi, Y., Yoshizawa, T., & Sakurada, S. (1997c). In H.
Itokawa, 11th Symposium on the Development and Application of
Naturally Occurring Drug Materials, Tokyo, 1±2 August (p. 91)
(Abstract paper).
Nakamura, M., Chi, Y.M., Yan, W.M., Nakasugi, Y., Yoshizawa,
T., Irino, N., Hashimoto, F., Kinjo, J., Nohara, T., & Sakurada,
S. (1999). Journal of Natural Products, in press.
Okuyama, E., Fujimori, S., Yamazaki, M., & Deyama, T. (1998).
Chemical and Pharmceutical Bulletin, 46, 655.
Uesato, S., Miyauchi, M., Itoh, H., & Inouye, H. (1986).
Phytochemistry, 25, 2515.
Whittle, B. A. (1964). British Journal of Pharmacology, 22, 246.
M. Nakamura et al. / Phytochemistry 53 (2000) 253±256256

Study of sesquiterpene lactones from Milleria quinque¯ora ontheir anti-in¯ammatory activity using the transcription factor NF-
kB as molecular targetp
V. Castroa, P. RuÈ ngelerb, R. Murilloa, E. Hernandeza, G. Morac, H.L. Pahld,I. Merfortb,*
aUniversidad de Costa Rica, Escuela de QuõÂmica and CIPRONA, San JoseÂ, Costa RicabInstitute of Pharmaceutical Biology, Albert-Ludwigs-UniversitaÈt, SchaÈnzlestr. 1, 79104, Freiburg, Germany
cUniversidad de Costa Rica, Faculdad de Farmacia and CIPRONA, San JoseÂ, Costa RicadDepartment of Experimental Anaesthesiology, University Hospital, Freiburg, Germany
Received 14 April 1999; received in revised form 24 June 1999; accepted 13 September 1999
Abstract
In Central America aerial parts of the Asteraceae Milleria quinque¯ora are used in traditional medicine as a remedy for skininfections. Reinvestigation of this plant a�orded thirteen sesquiterpene lactones (Sls), three of them are new. All isolated Slswere studied for their anti-in¯ammatory activity using the transcription factor NF-kB as molecular target. NF-kB is involved in
the synthesis of in¯ammatory mediators, such as cytokines and chemokines. NF-kB DNA binding was inhibited at micromolarconcentrations by all Sls. # 2000 Elsevier Science Ltd. All rights reserved.
Keywords: Milleria quinque¯ora; Asteraceae; Sesquiterpene lactones; Anti-in¯ammatory activity; NF-kB
1. Introduction
In Central America aerial parts of the AsteraceaeMilleria quinque¯ora L. are used in traditional medi-cine as a remedy for skin infections (Heinrich, 1996).Previously several sesquiterpene lactones (Sls) from thegermacranolide type (melampolides and millerenolides)have been isolated (Jakupovic, Castro & Bohlmann,1987). Few of them were investigated for their anti-in-¯ammatory activity using the transcription factor NF-kB as molecular target. It was shown that they wereable to inhibit DNA binding of NF-kB in micromolarconcentrations (RuÈ ngeler et al., 1999). NF-kB, a cen-tral mediator of the human immune response, regu-
lates the transcription of genes encoding variousin¯ammatory cytokines, chemokines, adhesion mol-ecules and in¯ammatory enzymes like iNOS, COX-2,5-LOX and cytosolic phospholipase A2 (Baeuerle &Henkel, 1994; Barnes & Karin, 1997).
In this paper, we report on the reinvestigation of theaerial parts of M. quinque¯ora (see Fig. 1). Altogether,thirteeen Sls were isolated and identi®ed, three arereported for the ®rst time. All compounds were studiedfor their ability to inhibit the transcription factor NF-kB. To gain information, whether NF-kB inhibitionmay correlate with the lipophilicity of the Sls, we ad-ditionally determined the octanol/water partition coe�-cient �log P� of each compound, from which penetrationbehavior through biomembranes may be deduced.
2. Results and discussion
The lipophilic extract prepared from the aerial parts
Phytochemistry 53 (2000) 257±263
0031-9422/00/$ - see front matter # 2000 Elsevier Science Ltd. All rights reserved.
PII: S0031-9422(99 )00510 -5
www.elsevier.com/locate/phytochem
pPart III in the series `Phytochemical and Biological Studies of
Costa Rican Asteraceae'.
* Corresponding author. Tel.: +49-761-203-2804; fax: +49-761-
203-2803.
E-mail address: [email protected] (I. Merfort).
of M. quinque¯ora a�orded, after chromatography,thirteen germacranolide-type Sls. Eight of them, com-pounds 2±7, 9 and 10, are already known from thisplant (Jakupovic et al., 1987). Since the 13C-NMRspectral data of Sls 2, 4, 5 and 7 had not been pre-viously reported, they are included in Table 1.
Compound 1 possesses a molecular mass of 346(CI(isobutane) and ESI MS). The 13C-and 1H-NMRdata were close to those of 9a-hydroxy-8û-methacry-loyloxy-14-oxo-acanthospermolide (2) (see Tables 1and 2) (Jakupovic et al., 1987). Only the chemicalshifts for the protons eight and nine as well as thosefor the carbons one, eight, nine and ten showed signi®-cant di�erences. Therefore, it can be concluded thatcompounds 1 and 2 are isomers, di�ering only in theside of esteri®cation. Consequently, Sl 1 is 8û-hydroxy-9a-methacryloyloxy-14-oxo-acanthospermolide. Allproton and carbon resonances were assigned on thebasis of 1H±1H COSY, DEPT, GHSQCR andGHMQCR experiments (Tables 1 and 2).
The 13H-NMR spectrum of Sl 8, from which themolecular mass of 376 was deduced from the CI (iso-butane) and ESI mass spectra, was very close to that
of 1û-ethoxymiller-9Z-enolide (Jakupovic et al., 1987).The only di�erence was the additional singlet for amethoxy group at d 3.25 ppm and the lack of the sig-nals for the ethoxy group. Thus, 8 was 1û- methoxy-miller-9Z-enolide, which is an artefact arising duringextraction with methanol. This was proved by extract-ing a small amount of the plant material with ethanol.In this extract compound 8 could not be detected.
The 1H-NMR data of 11 were similar to thosereported for the millerenolide miller-1(10)Z-enolide(Jakupovic et al., 1987). However, the molecular masswhich was deduced from the mass spectra (CI (iso-butane) and ESI) increased to 376 due to the presenceof an additional methoxy group which is con®rmed bythe singlet at d 3.18 in the 1H-NMR spectrum. Themethoxy group was located at carbon nine. This wasdeduced from the down®eld shifts of H-9 and H-8compared to the unsubstituted miller-1(10)Z-enolideand the long range H±C correlations observed in theGHMQCR spectrum between the signal of the meth-oxy group and that of C-9. According to the largecoupling constant J8, 9 � 9:3 Hz the methoxy groupwas a-orientated. Assignments of the protons and car-
Fig. 1. Structures of the investigated sesquiterpene lactones (Meacr = methacryloyl, E = trans, Z = cis).
V. Castro et al. / Phytochemistry 53 (2000) 257±263258
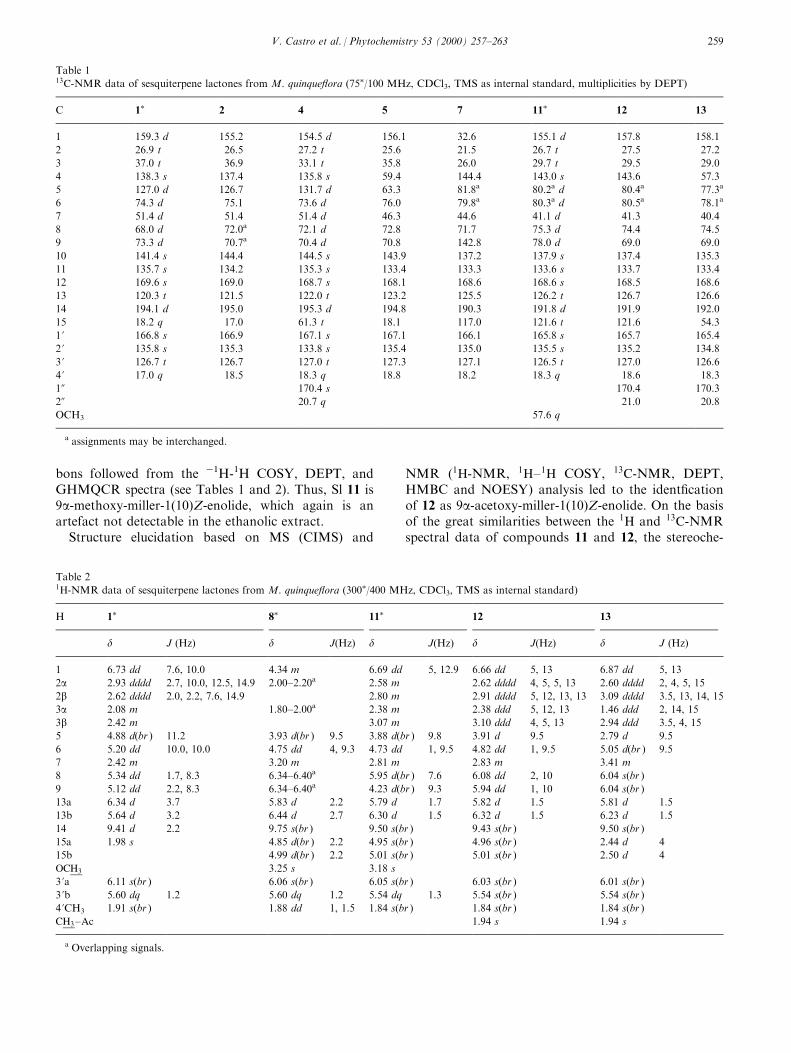
bons followed from the ÿ1H-1H COSY, DEPT, andGHMQCR spectra (see Tables 1 and 2). Thus, Sl 11 is9a-methoxy-miller-1(10)Z-enolide, which again is anartefact not detectable in the ethanolic extract.
Structure elucidation based on MS (CIMS) and
NMR �1H-NMR, 1H±1H COSY, 13C-NMR, DEPT,HMBC and NOESY) analysis led to the ident®cationof 12 as 9a-acetoxy-miller-1(10)Z-enolide. On the basisof the great similarities between the 1H and 13C-NMRspectral data of compounds 11 and 12, the stereoche-
Table 21H-NMR data of sesquiterpene lactones from M. quinque¯ora (300�/400 MHz, CDCl3, TMS as internal standard)
H 1� 8� 11� 12 13
d J (Hz) d J(Hz) d J(Hz) d J(Hz) d J (Hz)
1 6.73 dd 7.6, 10.0 4.34 m 6.69 dd 5, 12.9 6.66 dd 5, 13 6.87 dd 5, 13
2a 2.93 dddd 2.7, 10.0, 12.5, 14.9 2.00±2.20a 2.58 m 2.62 dddd 4, 5, 5, 13 2.60 dddd 2, 4, 5, 15
2b 2.62 dddd 2.0, 2.2, 7.6, 14.9 2.80 m 2.91 dddd 5, 12, 13, 13 3.09 dddd 3.5, 13, 14, 15
3a 2.08 m 1.80±2.00a 2.38 m 2.38 ddd 5, 12, 13 1.46 ddd 2, 14, 15
3b 2.42 m 3.07 m 3.10 ddd 4, 5, 13 2.94 ddd 3.5, 4, 15
5 4.88 d(br ) 11.2 3.93 d(br ) 9.5 3.88 d(br ) 9.8 3.91 d 9.5 2.79 d 9.5
6 5.20 dd 10.0, 10.0 4.75 dd 4, 9.3 4.73 dd 1, 9.5 4.82 dd 1, 9.5 5.05 d(br ) 9.5
7 2.42 m 3.20 m 2.81 m 2.83 m 3.41 m
8 5.34 dd 1.7, 8.3 6.34±6.40a 5.95 d(br ) 7.6 6.08 dd 2, 10 6.04 s(br )
9 5.12 dd 2.2, 8.3 6.34±6.40a 4.23 d(br ) 9.3 5.94 dd 1, 10 6.04 s(br )
13a 6.34 d 3.7 5.83 d 2.2 5.79 d 1.7 5.82 d 1.5 5.81 d 1.5
13b 5.64 d 3.2 6.44 d 2.7 6.30 d 1.5 6.32 d 1.5 6.23 d 1.5
14 9.41 d 2.2 9.75 s(br ) 9.50 s(br ) 9.43 s(br ) 9.50 s(br )
15a 1.98 s 4.85 d(br ) 2.2 4.95 s(br ) 4.96 s(br ) 2.44 d 4
15b 4.99 d(br ) 2.2 5.01 s(br ) 5.01 s(br ) 2.50 d 4
OCH3 3.25 s 3.18 s
3 'a 6.11 s(br ) 6.06 s(br ) 6.05 s(br ) 6.03 s(br ) 6.01 s(br )
3 'b 5.60 dq 1.2 5.60 dq 1.2 5.54 dq 1.3 5.54 s(br ) 5.54 s(br )
4 'CH3 1.91 s(br ) 1.88 dd 1, 1.5 1.84 s(br ) 1.84 s(br ) 1.84 s(br )
CH3±Ac 1.94 s 1.94 s
a Overlapping signals.
Table 113C-NMR data of sesquiterpene lactones from M. quinque¯ora (75�/100 MHz, CDCl3, TMS as internal standard, multiplicities by DEPT)
C 1� 2 4 5 7 11� 12 13
1 159.3 d 155.2 154.5 d 156.1 32.6 155.1 d 157.8 158.1
2 26.9 t 26.5 27.2 t 25.6 21.5 26.7 t 27.5 27.2
3 37.0 t 36.9 33.1 t 35.8 26.0 29.7 t 29.5 29.0
4 138.3 s 137.4 135.8 s 59.4 144.4 143.0 s 143.6 57.3
5 127.0 d 126.7 131.7 d 63.3 81.8a 80.2a d 80.4a 77.3a
6 74.3 d 75.1 73.6 d 76.0 79.8a 80.3a d 80.5a 78.1a
7 51.4 d 51.4 51.4 d 46.3 44.6 41.1 d 41.3 40.4
8 68.0 d 72.0a 72.1 d 72.8 71.7 75.3 d 74.4 74.5
9 73.3 d 70.7a 70.4 d 70.8 142.8 78.0 d 69.0 69.0
10 141.4 s 144.4 144.5 s 143.9 137.2 137.9 s 137.4 135.3
11 135.7 s 134.2 135.3 s 133.4 133.3 133.6 s 133.7 133.4
12 169.6 s 169.0 168.7 s 168.1 168.6 168.6 s 168.5 168.6
13 120.3 t 121.5 122.0 t 123.2 125.5 126.2 t 126.7 126.6
14 194.1 d 195.0 195.3 d 194.8 190.3 191.8 d 191.9 192.0
15 18.2 q 17.0 61.3 t 18.1 117.0 121.6 t 121.6 54.3
1 ' 166.8 s 166.9 167.1 s 167.1 166.1 165.8 s 165.7 165.4
2 ' 135.8 s 135.3 133.8 s 135.4 135.0 135.5 s 135.2 134.8
3 ' 126.7 t 126.7 127.0 t 127.3 127.1 126.5 t 127.0 126.6
4 ' 17.0 q 18.5 18.3 q 18.8 18.2 18.3 q 18.6 18.3
10 170.4 s 170.4 170.3
20 20.7 q 21.0 20.8
OCH3 57.6 q
a assignments may be interchanged.
V. Castro et al. / Phytochemistry 53 (2000) 257±263 259
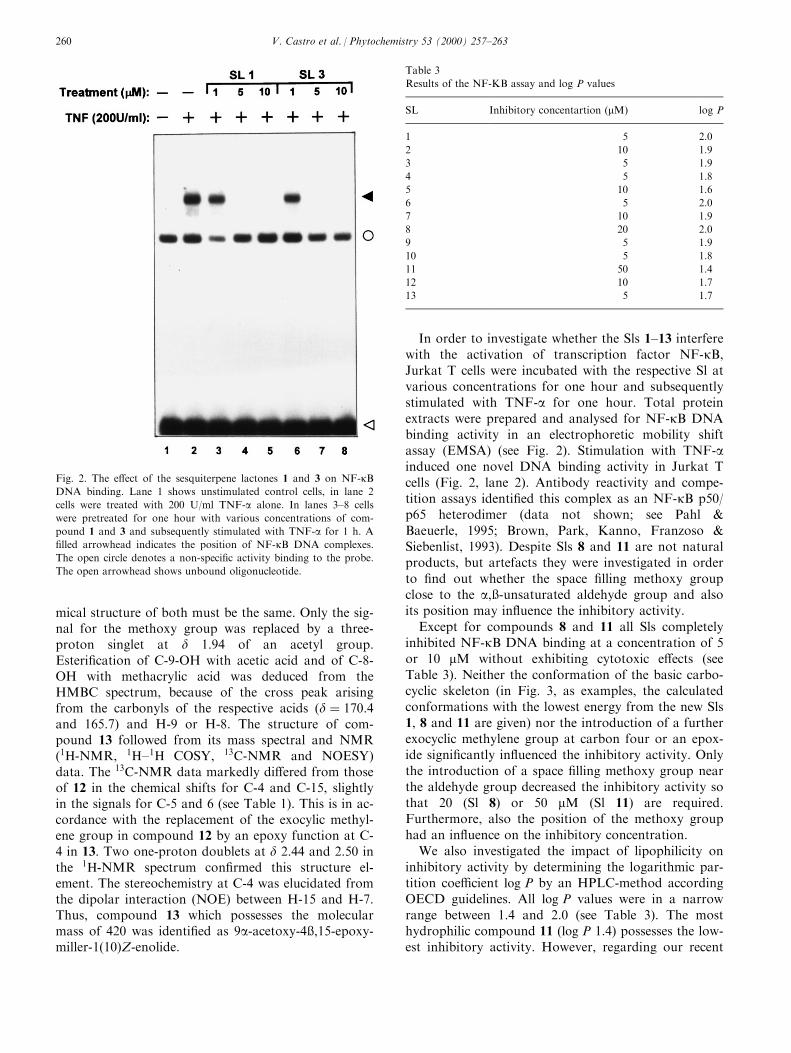
mical structure of both must be the same. Only the sig-nal for the methoxy group was replaced by a three-proton singlet at d 1.94 of an acetyl group.Esteri®cation of C-9-OH with acetic acid and of C-8-OH with methacrylic acid was deduced from theHMBC spectrum, because of the cross peak arisingfrom the carbonyls of the respective acids �d � 170:4and 165.7) and H-9 or H-8. The structure of com-pound 13 followed from its mass spectral and NMR�1H-NMR, 1H±1H COSY, 13C-NMR and NOESY)data. The 13C-NMR data markedly di�ered from thoseof 12 in the chemical shifts for C-4 and C-15, slightlyin the signals for C-5 and 6 (see Table 1). This is in ac-cordance with the replacement of the exocylic methyl-ene group in compound 12 by an epoxy function at C-4 in 13. Two one-proton doublets at d 2.44 and 2.50 inthe 1H-NMR spectrum con®rmed this structure el-ement. The stereochemistry at C-4 was elucidated fromthe dipolar interaction (NOE) between H-15 and H-7.Thus, compound 13 which possesses the molecularmass of 420 was identi®ed as 9a-acetoxy-4û,15-epoxy-miller-1(10)Z-enolide.
In order to investigate whether the Sls 1±13 interferewith the activation of transcription factor NF-kB,Jurkat T cells were incubated with the respective Sl atvarious concentrations for one hour and subsequentlystimulated with TNF-a for one hour. Total proteinextracts were prepared and analysed for NF-kB DNAbinding activity in an electrophoretic mobility shiftassay (EMSA) (see Fig. 2). Stimulation with TNF-ainduced one novel DNA binding activity in Jurkat Tcells (Fig. 2, lane 2). Antibody reactivity and compe-tition assays identi®ed this complex as an NF-kB p50/p65 heterodimer (data not shown; see Pahl &Baeuerle, 1995; Brown, Park, Kanno, Franzoso &Siebenlist, 1993). Despite Sls 8 and 11 are not naturalproducts, but artefacts they were investigated in orderto ®nd out whether the space ®lling methoxy groupclose to the a,û-unsaturated aldehyde group and alsoits position may in¯uence the inhibitory activity.
Except for compounds 8 and 11 all Sls completelyinhibited NF-kB DNA binding at a concentration of 5or 10 mM without exhibiting cytotoxic e�ects (seeTable 3). Neither the conformation of the basic carbo-cyclic skeleton (in Fig. 3, as examples, the calculatedconformations with the lowest energy from the new Sls1, 8 and 11 are given) nor the introduction of a furtherexocyclic methylene group at carbon four or an epox-ide signi®cantly in¯uenced the inhibitory activity. Onlythe introduction of a space ®lling methoxy group nearthe aldehyde group decreased the inhibitory activity sothat 20 (Sl 8) or 50 mM (Sl 11) are required.Furthermore, also the position of the methoxy grouphad an in¯uence on the inhibitory concentration.
We also investigated the impact of lipophilicity oninhibitory activity by determining the logarithmic par-tition coe�cient log P by an HPLC-method accordingOECD guidelines. All log P values were in a narrowrange between 1.4 and 2.0 (see Table 3). The mosthydrophilic compound 11 �log P 1.4) possesses the low-est inhibitory activity. However, regarding our recent
Fig. 2. The e�ect of the sesquiterpene lactones 1 and 3 on NF-kBDNA binding. Lane 1 shows unstimulated control cells, in lane 2
cells were treated with 200 U/ml TNF-a alone. In lanes 3±8 cells
were pretreated for one hour with various concentrations of com-
pound 1 and 3 and subsequently stimulated with TNF-a for 1 h. A
®lled arrowhead indicates the position of NF-kB DNA complexes.
The open circle denotes a non-speci®c activity binding to the probe.
The open arrowhead shows unbound oligonucleotide.
Table 3
Results of the NF-KB assay and log P values
SL Inhibitory concentartion (mM) log P
1 5 2.0
2 10 1.9
3 5 1.9
4 5 1.8
5 10 1.6
6 5 2.0
7 10 1.9
8 20 2.0
9 5 1.9
10 5 1.8
11 50 1.4
12 10 1.7
13 5 1.7
V. Castro et al. / Phytochemistry 53 (2000) 257±263260

studies which showed that Sls with a similar log Pexhibit signi®cant di�erences in their ability to inhibitNF-kB it is unlikely that lipophilicity in¯uences NF-kB inhibitory activity to a large degree.
Our results with the bifunctional Sls from M. quin-que¯ora are in accordance with our recent studies(Lyû, Knorre, Schmidt, Pahl & Merfort, 1998;RuÈ ngeler et al., 1999). Here, we provided evidence thatSls selectively alkylate the p65 subunit of NF-kB thuspreventing its DNA binding. The number of alkylatingcenters of the Sls plays the most important role indetermining a strong NF-kB inhibitory activity. Slswhich possess two reactive centres in form of an a-methylene-g-lactone group and an a,û- or a,û,g,d-unsa-turated carbonyl group are the most active ones.Based on computer molecular modelling, we proposeda molecular mechanism of action how these bifunc-tional Sls may alkylate the p65 subunit of NF-kB.They can crosslink two cysteine residues, Cys 38 beinglocated within the DNA binding domain and Cys 120being found in a proximal loop, thereby inhibitingDNA binding (Chen, Ghosh & Ghosh, 1998).
In summary, our study shows that the isolated Slspossess a high anti-in¯ammatory activity by inhibitingthe transcription factor NF-kB at micromolar concen-trations. Thereby they are able to contribute to thehealing e�ects of preparations from M. quinque¯oraused in traditional medicine for the treatment of skininfections. Furthermore, Sls could serve as lead com-pounds for the development of novel, potent anti-in-¯ammatory drugs for the treatment of in¯ammatorydisorders such as rheumatoid arthritis.
3. Experimental
3.1. List of abbreviations
BSA: bovine serum albumen; c.p.m.: counts perminute; DTT: dithiothreitol; EDTA: ethylenediamine-tetraacetic acid; EGTA: ethylene glycol-bis(b-ami-noethyl ether) N,N,N ';N ' tetraacetic acid; HEPES: (N-[2-hydroxyethyl] piperazine-N '-[2-ethanesulfonic acid]);NP-40: (nonylphenoxy)-(polyethoxy)-ethanol; PMSF:phenylmethylsulfonyl ¯uoride; Poly (dI-dC): poly-deoxyinosinicdeoxycytidylic acid, double-strandedalternating copolymer.
3.2. Plant material
Aerial parts of M. quinque¯ora L. were collected inTurrialba, Costa Rica, in February 1998 and identi®edby L. Poveda, Professor of Botany, UniversidadNacional, Costa Rica. Voucher specimens (no.108510a) are deposited at the National Herbarium ofCosta Rica.
Fig.3.Calculatedconform
ationsofsesquiterpenelactones
1,8and11.
V. Castro et al. / Phytochemistry 53 (2000) 257±263 261

3.3. Cell culture
Jurkat T cells were maintained in RPMI 1640 med-ium supplemented with 10% fetal calf serum and 100IU/ml penicillin and 100 mg/ml streptomycin (allGibco-BRL).
3.4. Electrophoretic mobility shift assays
Total protein extracts from Jurkat T cells were pre-pared using a high-salt detergent bu�er (Totex: 20 mMHepes, pH 7.9, 350 mM NaCl, 20% (v/v) glycerol, 1%(w/v) NP-40, 1 mM MgCl2, 0.5 mM EDTA, 0.1 mMEGTA, 0.5 mM DTT, 0.1% PMSF, 1% aprotinin).Cells were harvested by centrifugation, washed once inicecold PBS (Sigma) and resuspended in four cellvolumes of Totex bu�er. The cell lysate was incubatedon ice for 30 min, then centrifuged for 5 min at 13,000rpm at 48C. The protein content of the supernatantwas determined and equal amounts of protein (10±20mg) added to a reaction mixture containing 20 mgbovine serum albumen, BSA, (Sigma), 2 mg poly (dI-dC) (Boehringer), 2 ml bu�er D+ (20 mM Hepes, pH7.9; 20% glycerol, 100 mM KCl, 0.5 mM EDTA,0.25% NP-40, 2 mM DTT, 0.1% PMSF), 4 ml bu�erF (20% Ficoll 400, 100 mM Hepes, 300 mM KCl, 10mM DTT, 0.1% PMSF) and 100000 c.p.m.(Cerenkov) of a 32P-labeled oligonucleotide, made upto a ®nal volume of 20 ml with destilled water. Sampleswere incubated at room temperature for 25 min. NF-kB oligonucleotide (Promega) was labeled using g-[32P]-ATP (3000 Ci/mmol; Amersham) and a T4 poly-nucleotide kinase (Promega).
3.5. Partition coe�cient (n-octanol/water); HPLC-method
The partition coe�cients of the di�erent compoundswere determined using an HPLC method following theOECD guideline for testing of chemicals No. 117(1989) (adopted 30.03.1989). HPLC was performed onan analytical RP-18 column (Bischo� ODS-Hypersil 5mm; 125 � 4.6 mm) with mixtures of HPLC-grademethanol and distilled water (30%, 40% or 50%methanol). A diode array detector was used. The deadtime t0 was measured with thiourea (Fluka), whichleaves the column unretained. As reference compoundswe used 2-butanone �log P: 0:3; Merck), benzyl alcohol�log P: 1.1; Roth), benzonitrile �log P: 1.6; Fluka), acet-ophenone �log P: 1.7; Fluka), cinnamic alcohol �log P:1.9; Roth), anisole �log P: 2.1; Merck), methyl benzo-ate �log P: 2,1; Fluka), 1,1,1-trichloroethane �log P:2,4; Fluka), ethyl benzoate �log P: 2.6; Fluka), allylphenyl ether �log P: 2.9; Fluka), thymol �log P: 3.3;Merck) and naphthalene �log P: 3.6; Aldrich). The par-tition coe�cient is deduced from the capacity factor k,
which is derived from the following formula:
k � tR ÿ t0t0
where tR is the retention time of the substance. Thelogarithms of the capacity factors of the referencecompounds, log k, are calculated and plotted as a func-tion of log P: The log P of Sls is obtained by measur-ing the retention times and interpolating the calculatedcapacity factors on the calibration graph. For eachcompound retention times were measured twice. Thecalibration was performed once daily.
3.6. Calculation of the conformations for Sls 1, 8 and 11
We generated low-energy conformations of the Slsusing the conformational search option of ChemPlus1
(v. 1.6), which is operated under the MolecularModelling package Hyperchem1 (v. 5.1). Energy mini-mizations were performed with Hyperchem's force®eld MM+ using the Polak-Ribiere minimization al-gorithm. Starting structures were created withHyperchem and initially minimized to an RMS gradi-ent <0.01 kcal molÿ1 AÊ ÿ1. All rotatable cyclic bondswere included as variable torsions and allowed to bechanged simultaneously. The search was performedapplying a usage directed search method and standardsettings for duplication tests. A search run was termi-nated after energy minimization of 2500 unique start-ing geometries. Acyl side chains of the respective Slswere not included in the conformational search. Theywere added manually to the most favorable Sl-confor-mers. The resulting structures were energy minimizedto an RMS gradient as above.
3.7. Extraction and isolation
Aerial parts of M. quinque¯ora (3600 g) were airdried, powdered and extracted with ether. The etherextract was defatted with MeOH and separated as pre-viously described (Jakupovic et al., 1987). The follow-ing amounts of the respective compounds wereobtained: 1: 34 mg, 2: 20 mg, 3: 17 mg, 4: 84 mg, 5: 6mg, 6: 47 mg, 7: 7 mg, 8: 6 mg, 9: 250 mg, 10: 480 mg,11: 13 mg, 12: 140 mg, 13: 73 mg.
3.7.1. 8û-Hydroxy-9a-methacryloyloxy-14-oxo-acanthospermolide (1)
CIMS (iso-butane) m/z (rel. int.): 347 [M + H]+
(46), 261 [M ÿ C4O2H6 + H]+ (100), 243 [261 ÿH2O]+ (83), 233 (29), 217 (46), 201 (31), 177 (40), 87[C4O2H6 + H]+ (93). ESIMS m/z (rel. int.): 715[2 �M + Na]+ (19), 401 [M + 54 + H]+ (51), 385[M + K]+ (33), 369 [M + Na]+ (100), 347 [M +H]+ (10), 261 (13).
V. Castro et al. / Phytochemistry 53 (2000) 257±263262

3.7.2. 1û-Methoxymiller-9Z-enolide (8)CIMS (iso-butane) m/z (rel. int.): 377 [M + H]+
(3), 291 [M ÿ C4O2H6 + H]+ (9), 267 (30), 197 (100),87 [C4O2H6 + H]+ (97). ESIMS m/z (rel. int.): 776[2 �M + Na + H]+ (5), 431 [M + 54 + H]+ (51),415 [M + K]+ (33), 399 [M + Na]+ (100), 377 [M +H]+ (8), 291 (18).
3.7.3. 9a-Methoxy-miller-1(10)Z-enolide (11)CIMS (iso-butane) m/z (rel. int.): 377 [M + H]+
(30), 291 [M ÿ C4O2H6 + H]+ (58), 275 (18), 261[291 ÿ CH2O]+ (35), 247 (24), 243 (20), 231 (20), 217(25), 215 (33), 87 [C4O2H6 + H]+ (100). ESIMS m/z(rel. int.): 776 [2 �M + Na + H]+ (0.9), 415 [M +K]+ (29), 399 [M + Na]+ (100), 377 [M + H]+ (5),291 (2).
3.7.4. 9a-Acetoxy-miller-1(10)Z-enolide (12)CIMS (iso-butane) m/z (rel. int.): 405 [M + H]+
(12), 345 [M ÿ C2H4O2 + H]+ (29), 319 [M ÿC4O2H6 + H]+ (10), 301 (12), 277 (15), 259 (76), 241(36), 213 (31), 207 (35), 183 (40), 87 [C4O2H6 + H]+
(100), 79 (76).
3.7.5. 9a-Acetoxy-4û,15-epoxymiller-1(10)Z-enolide(13)
CIMS (iso-butane) m/z (rel. int.): 421 [M + H]+
(7), 361 [M ÿ C2H4O2 + H]+ (81), 335 [M ÿ C4O2H6
+ H]+ (60), 307 (11), 275 (100), 257 (39), 229 (42),201 (22), 87 [C4O2H6 + H]+ (78), 79 (63).
Acknowledgements
We are grateful to V. Brecht, PharmazeutischesInstitut, University of Freiburg for recording the 300/75 MHz NMR spectra, to Dr. J. WoÈ rth and C. Warth,Institut fuÈ r Organische Chemie, University of Freiburgfor measuring the mass spectra, to Dr. T.J. Schmidt,Institute of Pharmaceutical Biology, University ofDuÈ sseldorf for the help with the calculation of the con-formations, to Prof. L. Poveda for identi®cation of theplant material. This work was supported by a grantfrom the Albert-Ludwigs-UniversitaÈ t and the DAAD(to V.C. and E.H.).
References
Baeuerle, P., & Henkel, T. (1994). Annu. Rev. Immunol, 12, 141.
Barnes, P. J., & Karin, M. (1997). N. Engl. J. Med, 336, 1066.
Brown, K., Park, S., Kanno, T., Franzoso, G., & Siebenlist, U.
(1993). Proc. Natl. Acad. Sci. USA, 90, 2532.
Chen, Y.-Q., Ghosh, S., & Ghosh, G. (1998). Nat. Struct. Biol, 5,
76.
Heinrich, M. (1996). In D. J. N. Hind, Biology and Utilization (p.
475). In Proceedings of the International Compositae Conference,
Kew, 1994, vol. 2. Kew: Royal Botanic Gardens.
Jakupovic, J., Castro, V., & Bohlmann, F. (1987). Phytochemistry,
26, 2011.
Lyû, G., Knorre, A., Schmidt, T. J., Pahl, H. L., & Merfort, I.
(1998). J. Biol. Chem, 273, 33508.
OECD guideline for testing of chemicals No. 117 (adopted
30.03.1989).
Pahl, H. L., & Baeuerle, P. A. (1995). EMBO J, 14, 2580.
RuÈ ngeler, P., Castro, V., Mora, G., GoÈ ren, N.,Vichnewski, W., Pahl,
H.L., Merfort, I., & Schmidt, T.J. (1999). Bioorg. Med. Chem., in
press.
V. Castro et al. / Phytochemistry 53 (2000) 257±263 263
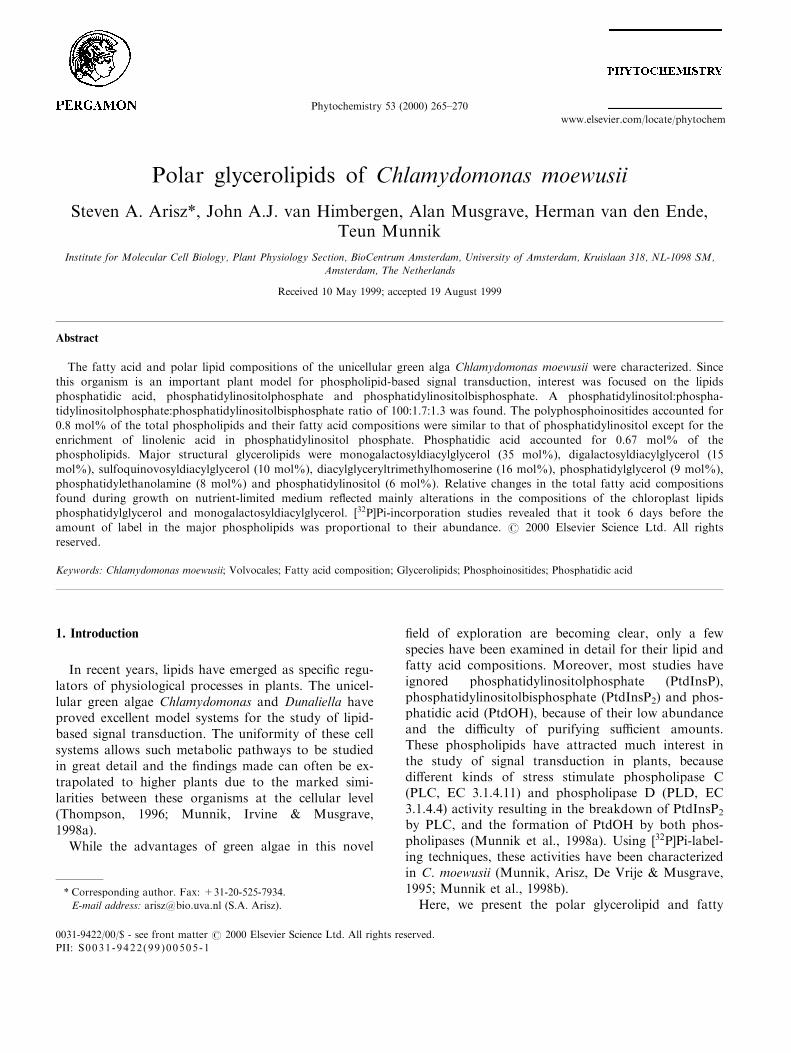
Polar glycerolipids of Chlamydomonas moewusii
Steven A. Arisz*, John A.J. van Himbergen, Alan Musgrave, Herman van den Ende,Teun Munnik
Institute for Molecular Cell Biology, Plant Physiology Section, BioCentrum Amsterdam, University of Amsterdam, Kruislaan 318, NL-1098 SM,
Amsterdam, The Netherlands
Received 10 May 1999; accepted 19 August 1999
Abstract
The fatty acid and polar lipid compositions of the unicellular green alga Chlamydomonas moewusii were characterized. Since
this organism is an important plant model for phospholipid-based signal transduction, interest was focused on the lipidsphosphatidic acid, phosphatidylinositolphosphate and phosphatidylinositolbisphosphate. A phosphatidylinositol:phospha-tidylinositolphosphate:phosphatidylinositolbisphosphate ratio of 100:1.7:1.3 was found. The polyphosphoinositides accounted for
0.8 mol% of the total phospholipids and their fatty acid compositions were similar to that of phosphatidylinositol except for theenrichment of linolenic acid in phosphatidylinositol phosphate. Phosphatidic acid accounted for 0.67 mol% of thephospholipids. Major structural glycerolipids were monogalactosyldiacylglycerol (35 mol%), digalactosyldiacylglycerol (15
mol%), sulfoquinovosyldiacylglycerol (10 mol%), diacylglyceryltrimethylhomoserine (16 mol%), phosphatidylglycerol (9 mol%),phosphatidylethanolamine (8 mol%) and phosphatidylinositol (6 mol%). Relative changes in the total fatty acid compositionsfound during growth on nutrient-limited medium re¯ected mainly alterations in the compositions of the chloroplast lipids
phosphatidylglycerol and monogalactosyldiacylglycerol. �32P]Pi-incorporation studies revealed that it took 6 days before theamount of label in the major phospholipids was proportional to their abundance. # 2000 Elsevier Science Ltd. All rightsreserved.
Keywords: Chlamydomonas moewusii; Volvocales; Fatty acid composition; Glycerolipids; Phosphoinositides; Phosphatidic acid
1. Introduction
In recent years, lipids have emerged as speci®c regu-lators of physiological processes in plants. The unicel-lular green algae Chlamydomonas and Dunaliella haveproved excellent model systems for the study of lipid-based signal transduction. The uniformity of these cellsystems allows such metabolic pathways to be studiedin great detail and the ®ndings made can often be ex-trapolated to higher plants due to the marked simi-larities between these organisms at the cellular level(Thompson, 1996; Munnik, Irvine & Musgrave,1998a).
While the advantages of green algae in this novel
®eld of exploration are becoming clear, only a fewspecies have been examined in detail for their lipid andfatty acid compositions. Moreover, most studies haveignored phosphatidylinositolphosphate (PtdInsP),phosphatidylinositolbisphosphate (PtdInsP2) and phos-phatidic acid (PtdOH), because of their low abundanceand the di�culty of purifying su�cient amounts.These phospholipids have attracted much interest inthe study of signal transduction in plants, becausedi�erent kinds of stress stimulate phospholipase C(PLC, EC 3.1.4.11) and phospholipase D (PLD, EC3.1.4.4) activity resulting in the breakdown of PtdInsP2
by PLC, and the formation of PtdOH by both phos-pholipases (Munnik et al., 1998a). Using �32P]Pi-label-ing techniques, these activities have been characterizedin C. moewusii (Munnik, Arisz, De Vrije & Musgrave,1995; Munnik et al., 1998b).
Here, we present the polar glycerolipid and fatty
Phytochemistry 53 (2000) 265±270
0031-9422/00/$ - see front matter # 2000 Elsevier Science Ltd. All rights reserved.
PII: S0031-9422(99 )00505 -1
www.elsevier.com/locate/phytochem
* Corresponding author. Fax: +31-20-525-7934.
E-mail address: [email protected] (S.A. Arisz).

acid composition of this alga. Since our interest wasfocused on the polyphosphoinositides (PPIs), pro-cedures for their puri®cation, solid-phase extractionand 2D-TLC separation were developed. Because ofan apparent discrepancy in the measured phospholipidmasses with previous in vivo labeling experiments, a�32P]Pi-incorporation study is included, showing label-ing trends towards molar ratios.
2. Results and discussion
Plant glycerolipids are synthesized in the chloroplastand the endoplasmic reticulum, where phosphatidicacid moieties are formed as precursors of all diglycer-ides (Frentzen, 1986; Ohlrogge & Browse, 1995). As aresult of the activities of speci®c acyltransferases anddesaturases in these compartments, each lipid class hasits own characteristic fatty acid content. In glyceroli-pids of the Chlorophytae, which are considered veryclose to higher plants with respect to lipid compositionand metabolism, polyunsaturated fatty acids (PUFAs)of 16 and 18 carbon atoms predominate (Thompson,1996).
In order to characterize the fatty acid content of C.moewusii gametes, cells were grown on nutrient-limited
medium, which enhances the production of gameteswhich have been used in most studies on cell signaling.Since this environmental restriction could a�ect lipidcomposition, cells were sampled after 1 to 5 weeks ofculture (see Table 1). The PUFAs 16:3, 16:4 and 18:3,characteristic of the plastidic galactolipids, and 16:1�D3-trans ), speci®c for plastidic phosphatidylglycerol(PtdGro) (Thompson, 1996), decreased from week 1 toweek 5. Changes in monogalactosyldiacylglycerol(MGDG) and plastid PtdGro have been found as acorollary to changes in temperature, nutrient avail-ability and irradiance level (Kuiper, 1985; Sukenik,Yamagutchi & Livne, 1993), and may be regarded as ageneral response to unfavourable growth conditions.The unusual fatty acid 16:1 �D3-trans ), which isbelieved to play a structural role in chloroplast lipid±protein complexes (Tre molieÁ res, Roche, Dubertret,Guyon & Garnier, 1991), accounted for 24 mol% ofthe total fatty acids in PtdGro after 1 week and 9mol% after 5 weeks (not shown). This may be relatedto the morphological changes in thylakoids describedfor other Chlamydomonas cells (Martin &Goodenough, 1975), and is consistent with the re-duction in chloroplast lipids described elsewhere(Piorreck & Pohl, 1984). The concomitant rise in 16:0and 18:1 may re¯ect synthesis of neutral storage lipid
Table 1
Changes in fatty acid composition of C. moewusii after 1±5 weeks of growtha
Week no. Fatty acid (mol%)
14:0 16:0 16:1(D3t) 16:1o9 16:2 16:3o3 16:4 18:1o7 18:1o9 18:2 18:3o3 18:4
1 6.7 13.7 1.5 1.7 1.5 7.1 16.4 1.3 7.2 6.8 31.8 3.0
3 4.6 16.4 0.9 2.4 2.7 3.4 18.1 2.1 12.0 7.0 25.7 3.9
5 4.1 22.2 0.7 1.2 2.7 2.9 12.4 3.2 15.6 9.1 21.1 3.8
a Fatty acids found in trace amounts, including 14:3, 18:0 and 18:3o6, are omitted.
Table 2
Major lipids of C. moewusii and their fatty acid compositionsa
Lipid % of totalb Fatty acid (mol%)a
14:3 16:0 16:1c 16:2 16:3 16:4 18:0 18:1o7 18:1o9 18:2 18:3o3 18:4
MGDG 35 < 1 2 1 2 4 36 < 1 ± 2 9 43 ±
DGDG 15 ± 28 2 8 11 2 ± 2 19 10 18 ±
SQDG 10 ± 81 ± ± ± ± 1 2 3 5 9 1
DGTS 16 ± 71 ± < 1 2 3 < 1 2 4 3 8 7
PtdGro 9 12 35 25 ± < 1 ± 1 2 5 10 11 1
PtdEtn 8 ± 5 ± ± < 1 ± < 1 ± 92 1 2 ±
PtdIns 6 ± 50 ± ± 1 ± ± 20 14 9 7 ±
a Two- to three-week-old cultures. Values represent the averages of at least four independent analyses ; s.d. R 4 for glycolipids and s.d. R 2 for
other lipids. Fatty acids only found in trace amounts including 16:1o7, 16:3o3 and 18:3o6, are omitted.b Values represent mole percentages of total polar glycerolipids as determined by reference to internal GC standard and/or P-determination.c 16:1o9 or, in the case of PtdGro, 16(D3-trans ).
S.A. Arisz et al. / Phytochemistry 53 (2000) 265±270266

(Piorreck & Pohl, 1984), since these fatty acids predo-minate in neutral lipids of C. moewusii (data notshown).
To minimize these culture-age-dependent changes,two- to three-week-old cultures were routinely used forthe analysis of lipids and fatty acids (see Table 2).Quantities were deduced from GC mass analysis of thecomponent fatty acids and, for phospholipids, byphosphorus determination. The plastid glycolipidsMGDG, digalactosyldiacylglycerol (DGDG) and sul-foquinovosyldiacylglycerol (SQDG) accounted for 60mol% of total polar glycerolipids. The structural phos-pholipids PtdGro, phosphatidylethanolamine (PtdEtn)and phosphatidylinositol (PtdIns) accounted for 23mol% and were found in a molar ratio of 39:35:27, inagreement with phosphorus determinations. Whilephosphatidylcholine is absent from Chlamydomonas(Harwood & Jones, 1989), diacylglyceryltrimethylho-moserine (DGTS), another zwitterionic lipid commonto green algae (Eichenberger, 1993), accounted for 16mol% of the total polar glycerolipid.
Galactolipids, as compared to phospholipids, werecharacterized by an abundance of C16- and C18-poly-unsaturates (Table 2), largely accounting for the highPUFA content of the total extracts (Table 1). PtdEtncontained mainly oleic acid (18:1o9), consistent withits extraplastidic glycerolipid synthesis (Frentzen,1986). Only one isomer of linolenic acid, 18:3o3, wasconsistently found in the polar glycerolipid classes,although the 18:3o6 isomer was found in traceamounts in total extracts and sometimes in DGTS.This is in contrast to C. reinhardtii (Giroud, Gerber &Eichenberger, 1988), where 18:3o6 is a major com-ponent and the exclusive isomer in PtdEtn and DGTS,while 18:3o3 is the exclusive isomer in MGDG andDGDG. Apart from these interspecies di�erences,their glycerolipid and fatty acid compositions are simi-lar. In both species, PtdGro was characterized by thepresence of 16:1 �D3-trans ). The fatty acid 14:3, whichis almost limited to PtdGro in C. moewusii, has alsobeen found in PtdGro of C. reinhardtii (Janero &Barnett, 1981). In C. moewusii, the relative fatty acidcompositions of vegetative cells and gametes of both
mating types were found to be the same (data notshown).
Due to their roles in intracellular signal transduc-tion, the minor phospholipids PtdInsP, PtdInsP2 andPtdOH are interesting new subjects for lipid and fattyacid analysis. In C. moewusii, PtdInsP2-hydrolyzingPLC activity has been characterized under variousstimulatory conditions (Munnik et al., 1998a, 1998b).Although PtdIns is the precursor to the PPIs, its fattyacid composition is not necessarily the same. Forexample, in some mammalian cells, it is enriched inarachidonic acid (Augert, Blackmore & Exton, 1989).
The small amount of PtdInsP, PtdInsP2 and PtdOHcompared with the large background of structurallipids makes their analysis a di�cult task.Combinations of solid-phase extraction and TLC wereutilized to resolve su�cient quantities for analysis. We,therefore, developed a modi®ed elution protocol forsilica columns that resulted in the recovery of 70% ofthe total PPIs and 92% of the PtdOH. The results ofthese analyses were con®rmed using neomycin-coatedglass beads (Schacht, 1978) for puri®cation. Due to thehigh selectivity of neomycin, this method proved moree�cient in the extraction of PtdInsP and PtdInsP2
(recovery 96%).The quantities of these lipids are expressed in
Table 3 as mole percentages of the total phospholipids,which were quantitated from the same extract. Per 109
cells, C. moewusii contained 1.4, 1.1 and 2.1 nmoles ofPtdInsP, PtdInsP2 and PtdOH, respectively. ThePtdIns:PtdInsP:PtdInsP2 molar ratio was calculated tobe 100:1.7:1.3. No signi®cant di�erences were found inthe fatty acid compositions of PtdIns, PtdInsP andPtdInsP2 except for an enrichment of 18:3 in PtdInsP.In contrast to reports on mammalian PPIs (Augert etal., 1989), but concurring with those on carnation(Munnik, Musgrave & De Vrije, 1994a) and carrot(Van Breemen, Wheeler & Boss, 1990), these lipids hadno distinctive fatty acids such as long-chain PUFAs.Also, analysis of D. salina showed the presence ofmainly 16:0 and 18:1 (Ha & Thompson, 1991).Previous analyses with contrary results, are likely tohave employed insu�cient puri®cation protocols
Table 3
Minor phospholipids of C. moewusiia
Lipid Mole percentages of phospholipids Fatty acids (mol%)b
16:0 18:1o7 18:1o9 18:2 18:3o3
PtdInsP 0.45 44 15 14 13 13
PtdInsP2 0.34 53 19 15 9 5
PtdOH 0.67 20 2 73 2 3
a Two- to three-weeks-old cultures.b Values represent the averages of at least four independent analyses (s.d. R 2).
S.A. Arisz et al. / Phytochemistry 53 (2000) 265±270 267

(Brederoo, De Wildt, Popp-Snijders, Irvine, Musgrave& Van den Ende, 1991). The discrepancy with mam-mals may be related to speci®c physiological functionsof these lipids in plants (Munnik et al., 1998a).
While PtdOH can function as a second messenger insignaling cascades and can be generated via both PLD(Munnik et al., 1995) and PLC activities (Munnik etal., 1998b), its fatty acid composition in non-stimu-lated cells is likely to re¯ect its role as intermediate inde novo glycerolipid synthesis. The predominance of
16:0 and 18:1 (Table 3) supports this idea since thesefatty acids are esteri®ed to glycerolphosphate in newlyformed PtdOH. This lipid is the precursor to variouscomplex glycerolipids which serve as substrates forfurther fatty acid desaturation, for which evidence hasbeen found in C. reinhardtii (Giroud & Eichenberger,
1989).
Metabolic radiolabeling strategies have been utilizedto investigate pathways of glycerolipid biosynthesis(Giroud & Eichenberger, 1989; Harwood & Jones,
1989) and signal transduction in plants (Einspahr,Peeler & Thompson, 1988; Munnik et al., 1998b). Themolar ratios determined here by fatty acid and phos-phorus analysis are not consistent with the ratios seenin �32P]Pi-labeling studies of C. moewusii, which showheavily labeled phosphoinositides and relatively small
amounts of PtdEtn (Munnik et al., 1998b; Brederoo etal., 1991). However, due to divergent rates of label in-corporation and lipid turnover, amounts of radioac-tivity need not re¯ect the molecular abundance ofdi�erent lipid classes. For example, short-term labelingof phospholipids with �32P]Pi has been shown to re¯ectturnover rates rather than abundance (Einspahr et al.,1988; Munnik et al., 1994a; Munnik et al., 1994b;Munnik et al., 1998b). However, by extending the timeof labeling and adding unlabeled carrier-phosphate,the in¯uence of di�erent metabolic rates is overruledby di�erences in pool sizes. To investigate whethersuch a labeling protocol can generate a phospholipidlabeling pattern equivalent to the mass ratios, a cellsuspension was labeled with �32P]Pi in a 1 mM K±Pibu�er and sampled at subsequent time points (Fig.1(A)). After 6 days the �32P]PtdGro:[32P]PtdEtn:[32P]PtdIns ratio was 42:34: 25, a close approximationto their molar ratios, as determined by fatty acid andphosphorus analysis, indicating that the lipids hadbecome equally labeled.
[32P]Pi-labeling of the PPIs is usually very rapid dueto their high turnover rates (Munnik et al., 1994a;Munnik et al., 1994b; Munnik et al., 1998b). This is il-lustrated in Fig. 1(B) as the high proportion of labelthey contain during the ®rst hours of labeling.However, over a six-day period, labeling of PtdOH,PtdInsP and PtdInsP2 changed to represent 1.76, 0.92and 0.77%, respectively, of the total �32P]phospho-lipids, approaching their molar ratios in the cell. Theapparent overestimation relative to the major phos-pholipids may be due to the particular conditions ofthe labeling experiment.
While radiolabeling is the method of choice for ana-lyzing rapid changes in phospholipid metabolism in re-sponse to environmental stimuli, knowledge of thelipid mass levels and fatty acid compositions will beuseful for further characterization of the signal trans-duction pathways. Such information may reveal pre-cursor-product relations and thus elucidate themetabolic origin and fate of lipid signals.
3. Experimental
3.1. Cell cultures
Chlamydomonas moewusii strain UTEX 10 (matingtype minus) from the Culture Collection of Algae,University of Texas (Austin) and strain 17.17.2 (mat-ing type plus) were autotrophically grown as describedbefore (Schuring, Smeenk, Homan, Musgrave & Vanden Ende, 1987). Swimming gamete suspensions wereobtained by ¯ooding each plate culture with 20 mlHMCK (10 mM HEPES, 1 mM MgCl2, 1 mM CaCl2,1 mM KCl; pH 7.4). After 16 h, cells were harvested.
Fig. 1. [32P]Pi-labeling of C. moewusii phospholipids with time.
Labeling is expressed as a percentage of the total labeled lipid. (A)
Structural lipids; PtdGro (w), PtdEtn (*) and PtdIns (r). (B)
Minor lipids; PtdOH (w), PtdInsP (*) and PtdInsP2 (r).
S.A. Arisz et al. / Phytochemistry 53 (2000) 265±270268
Vegetative cells were grown in the liquid mediumdescribed by Kates and Jones (1964).
3.2. Lipid isolation
Lipids were extracted by a modi®cation of the Blighand Dyer method (Munnik, De Vrije, Irvine &Musgrave, 1996) and separated by TLC (silica gel 60)using the following solvent systems (volume ratiosgiven): A: CHCl3±MeOH±NH4OH±H2O (90:70:4:16);B: CHCl3±Me2CO±MeOH±HAc±H2O (80:30:28:26:15);C: CHCl3±MeOH±H2O, (65:25:4); D: CHCl3±MeOH±NH4OH (65:35:5); E: EtOAc-iso-octane±HCO2H±H2O(13:2:3:10). PtdGro, PtdEtn and PtdIns were separatedby 2D-TLC using solvent A in the ®rst dimension andsolvent B in the second dimension. Other structurallipids were separated by 2D-TLC using solvent C inthe ®rst and D in the second dimension (Allen &Good, 1971). Lipids were localized by autoradiog-raphy, iodine or dichloro¯uoresceine staining andidenti®ed on the basis of their migration, speci®c stain-ing and 32P-labeling properties.
For the puri®cation of minor phospholipids, theextract was fractionated by column-adsorption chro-matography on a 2 g-silica column. Brie¯y, 10 mglipid was applied to the column in n-hexane. 32P-lipidmarkers were included to monitor phospholipids andto calculate the recovery. Elution solvents were (1)hexane±Et2O (99:1, 18 ml), (2) hexane±Et2O (4:1, 15ml), (3) CHCl3 (10 ml), (4) Me2CO±CHCl3 (2:1, 25ml), (5) Me2CO±MeOH (29:1, 10 ml), (6) Me2CO±MeOH (19:1, 30 ml), (7) Me2CO±MeOH (2:1, 25 ml),(8) CHCl3±MeOH±H2O±HCl (50:100:40:1, 10 ml).Lipids were extracted from the last fraction by a nor-mal two-phase lipid extraction, treating the eluate as ahomogeneous phase. After drying the eluates, the PPIswere resolved by TLC using solvent C, followed bysolvent A in the same direction. PtdOH from fraction7 was separated using solvent E.
Alternatively, PtdInsP and PtdInsP2 were puri®ed bysolid-phase extraction with neomycin-coated glassbeads (Schacht, 1978), kindly provided by R.F. Irvine(Cambridge, UK). The extract was dissolved inCHCl3±MeOH-170 mM HCO2NH4 (5:10:2) and mixedwith beads for 15 min at 48C. After several washeswith the solvent, the beads were clear of all lipids,except the PPIs that were quantitatively recovered bywashing with CHCl3±MeOH-2.4 N HCl (2:4.5:2).These lipids were extracted from the aqueous phaseinto CHCl3 and resolved by TLC using solvent A.
3.3. Fatty acid derivatization and analysis
Lipid spots were scraped o� the plates directly intothe transmethylation reagent. Known concentrationsof heptadecanoic (17:0) and heneicosanoic (21:0) acid
methyl esters served as internal standards. The concen-trated FAME extract was analyzed in a GC equippedwith a 50 m WCOT fused silica column and FID withcarrier gas N2 at 30 ml minÿ1 and a split ratio of 1:75.Injection volume was 1 ml and operating conditionswere 1808C isothermal or temperature programmed180±2208C at 0.58C minÿ1 with injector and detectortemperatures at 250 and 2708C, respectively.Phosphorus determination was by the method ofRouser, Fleischer and Yamamoto (1970).
3.4. Metabolic radiolabeling
40 mCi �32P]Pi in a 1 mM K±Pi bu�er pH 7.4 wasadded to 4 ml of cell suspension in HMCK. Sampleswere taken at the time points indicated, lipidsextracted and separated by TLC using solvent A asdescribed earlier (Munnik et al., 1994a). Radioactivitywas quantitated by phosphoimaging.
Acknowledgements
We thank Frans Martens (Free University,Amsterdam) for help with gas chromatographic tech-niques and GC-MS analyses of lipid samples. We arealso grateful to Harold Meijer for his help with theneomycin bead chromatography and to our colleaguesin the lab for helpful discussions.
References
Allen, C. F., & Good, P. (1971). Acyl lipids in photosynthetic sys-
tems. Methods Enzymol, 23, 523±547.
Augert, G., Blackmore, P. F., & Exton, J. H. (1989). Changes in the
concentration and fatty acid composition of phosphoinositides
induced by hormones in hepatocytes. J. Biol. Chem, 264, 2574±
2580.
Brederoo, J., de Wildt, P., Popp-Snijders, C., Irvine, R. F.,
Musgrave, A., & van den Ende, H. (1991). Polyphosphoinositol
lipids in Chlamydomonas eugametos. Planta, 184, 175±181.
Eichenberger, W. (1993). Betaine lipids in lower plants. Distribution
of DGTS, DGTA and phospholipids, and the intracellular local-
ization and site of biosynthesis of DGTS. Plant Physiol. Biochem,
31(2), 213±221.
Einspahr, K. J., Peeler, T. C., & Thompson Jr., G. A. (1988). Rapid
changes in polyphosphoinositide metabolism associated with the
response of Dunaliella salina to hypoosmotic shock. J. Biol.
Chem, 263, 5775±5779.
Frentzen, M. (1986). Biosynthesis and desaturation of the di�erent
diacylglycerol moieties in higher plants. J. Plant Physiol, 124,
193±209.
Giroud, C., & Eichenberger, W. (1989). Lipids of Chlamydomonas
reinhardtii. Incorporation of �14C]acetate, �14C]palmitate and
�14C]oleate into di�erent lipids and evidence for lipid-linked desa-
turation of fatty acids. Plant Cell Physiol, 30(1), 121±128.
Giroud, C., Gerber, A., & Eichenberger, W. (1988). Lipids of
Chlamydomonas reinhardtii. Analysis of molecular species and in-
S.A. Arisz et al. / Phytochemistry 53 (2000) 265±270 269

tracellular site(s) of biosynthesis. Plant Cell Physiol, 29(4), 587±
595.
Ha, K.-S., & Thompson Jr., G. A. (1991). Diacylglycerol metabolism
in the green alga Dunaliella salina under osmotic stress. Plant
Physiol, 97, 921±927.
Harwood, J. L., & Jones, A. L. (1989). Lipid metabolism in algae.
Adv. Bot. Res, 16, 1±53.
Janero, D. R., & Barnett, R. (1981). Cellular and thylakoid-mem-
brane lipids of Chlamydomonas reinhardtii 137+. J. Lipid Res, 22,
1126±1130.
Kates, J. R., & Jones, R. F. (1964). The control of gametic di�eren-
tiation in liquid cultures of Chlamydomonas. J. Cell. Comp.
Physiol, 63, 157±164.
Kuiper, P. J. C. (1985). Environmental changes and lipid metabolism
of higher plants. Physiol. Plant, 64, 118±122.
Martin, N. C., & Goodenough, U. W. (1975). Gametic di�eren-
tiation in Chlamydomonas reinhardtii. Part I: production of
gametes and their ®ne structure. J. Cell. Biol, 67, 587±605.
Munnik, T., Irvine, R. F., & Musgrave, A. (1994a). Rapid turnover
of phosphatidylinositol 3-phosphate in the green alga
Chlamydomonas eugametos: signs of a phosphatidylinositide 3-
kinase signaling pathway in lower plants? Biochem. J, 298, 269±
273.
Munnik, T., Musgrave, A., & de Vrije, T. (1994b). Rapid turnover
of polyphosphoinositides in carnation ¯ower petals. Planta, 193,
89±98.
Munnik, T., Arisz, S. A., de Vrije, T., & Musgrave, A. (1995). G
protein activation stimulates PLD activity in plants. Plant Cell, 7,
2197±2210.
Munnik, T., de Vrije, T., Irvine, R. F., & Musgrave, A. (1996).
Identi®cation of diacylglycerol pyrophosphate as a novel meta-
bolic product of phosphatidic acid during G-protein activation in
plants. J. Biol. Chem, 271, 15708±15715.
Munnik, T., Irvine, R. F., & Musgrave, A. (1998a). Phospholipid
signalling in plants. Biochem. Biophys. Acta, 1389, 222±272.
Munnik, T., van Himbergen, J. A. J., ter Riet, B., Braun, F.-J.,
Irvine, R. F., van den Ende, H., & Musgrave, A. (1998b).
Detailed analysis of the turnover of polyphosphoinostides and
phosphatidic acid upon activation of phospholipases C and D in
Chlamydomonas cells treated with non-permeabilizing concen-
trations of mastoparan. Planta, 207, 133±145.
Ohlrogge, J., & Browse, J. (1995). Lipid biosynthesis. Plant Cell, 7,
957±970.
Piorreck, M., & Pohl, P. (1984). Formation of biomass, total protein,
chlorophylls, lipids and fatty acids in green and blue-green algae
during one growth phase. Phytochem, 23, 217±223.
Rouser, G., Fleischer, S., & Yamamoto, A. (1970). Two dimensional
thin layer chromatographic separation of polar lipids and deter-
mination of phospholipids by phosphorus analysis of spots.
Lipids, 5, 494±498.
Schacht, J. (1978). Puri®cation of polyphosphoinositides by chroma-
tography on immobilized neomycin. J. Lipid Res, 19, 1063±1067.
Schuring, F., Smeenk, J. W., Homan, W. L., Musgrave, A., & van
den Ende, H. (1987). Occurrence of O-methylated sugers in sur-
face glycoconjugates in Chlamydomonas eugametos. Planta, 170,
322±327.
Sukenik, A., Yamagutchi, Y., & Livne, A. (1993). Alterations in
lipid molecular species of the marine eustigmatophyte
Nannochloropsis SP. J. Phycol, 24, 620±626.
Thompson Jr., G. A. (1996). Lipids and membrane function in green
algae. Biochem. Biophys. Acta, 1302, 17±45.
Tre molieÁ res, A., Roche, O., Dubertret, G., Guyon, D., & Garnier, J.
(1991). Restoration of thylakoid appression by D3-trans-hexade-canoic acid containing phosphatidylglycerol in a mutant of
Chlamydomonas reinhardtii. Relationships with the regulation of
excitation energy distribution. Biochim. Biophys. Acta, 1059, 286±
292.
Van Breemen, R. B., Wheeler, J. J., & Boss, W. F. (1990).
Identi®cation of carrot inositol phospholipids by fast atom bom-
bardment mass spectrometry. Lipids, 25, 328±334.
S.A. Arisz et al. / Phytochemistry 53 (2000) 265±270270
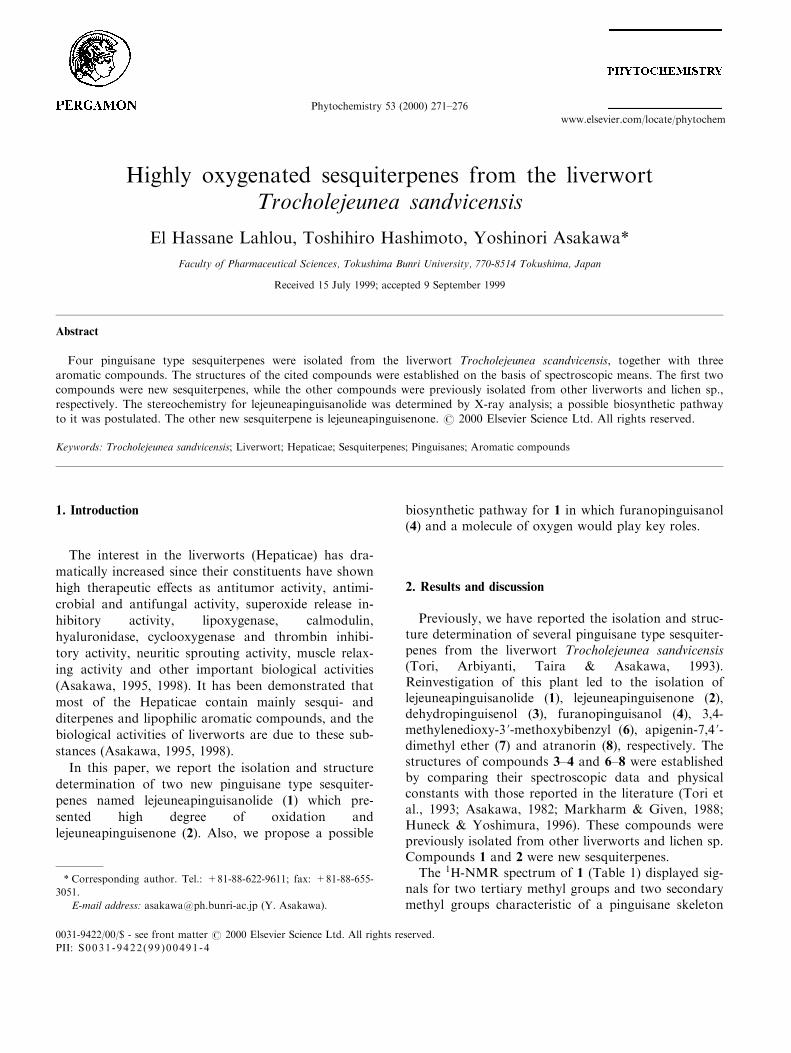
Highly oxygenated sesquiterpenes from the liverwortTrocholejeunea sandvicensis
El Hassane Lahlou, Toshihiro Hashimoto, Yoshinori Asakawa*
Faculty of Pharmaceutical Sciences, Tokushima Bunri University, 770-8514 Tokushima, Japan
Received 15 July 1999; accepted 9 September 1999
Abstract
Four pinguisane type sesquiterpenes were isolated from the liverwort Trocholejeunea scandvicensis, together with threearomatic compounds. The structures of the cited compounds were established on the basis of spectroscopic means. The ®rst twocompounds were new sesquiterpenes, while the other compounds were previously isolated from other liverworts and lichen sp.,
respectively. The stereochemistry for lejeuneapinguisanolide was determined by X-ray analysis; a possible biosynthetic pathwayto it was postulated. The other new sesquiterpene is lejeuneapinguisenone. # 2000 Elsevier Science Ltd. All rights reserved.
Keywords: Trocholejeunea sandvicensis; Liverwort; Hepaticae; Sesquiterpenes; Pinguisanes; Aromatic compounds
1. Introduction
The interest in the liverworts (Hepaticae) has dra-
matically increased since their constituents have shown
high therapeutic e�ects as antitumor activity, antimi-
crobial and antifungal activity, superoxide release in-
hibitory activity, lipoxygenase, calmodulin,
hyaluronidase, cyclooxygenase and thrombin inhibi-
tory activity, neuritic sprouting activity, muscle relax-
ing activity and other important biological activities
(Asakawa, 1995, 1998). It has been demonstrated that
most of the Hepaticae contain mainly sesqui- and
diterpenes and lipophilic aromatic compounds, and the
biological activities of liverworts are due to these sub-
stances (Asakawa, 1995, 1998).
In this paper, we report the isolation and structure
determination of two new pinguisane type sesquiter-
penes named lejeuneapinguisanolide (1) which pre-
sented high degree of oxidation and
lejeuneapinguisenone (2). Also, we propose a possible
biosynthetic pathway for 1 in which furanopinguisanol(4) and a molecule of oxygen would play key roles.
2. Results and discussion
Previously, we have reported the isolation and struc-ture determination of several pinguisane type sesquiter-penes from the liverwort Trocholejeunea sandvicensis(Tori, Arbiyanti, Taira & Asakawa, 1993).Reinvestigation of this plant led to the isolation oflejeuneapinguisanolide (1), lejeuneapinguisenone (2),dehydropinguisenol (3), furanopinguisanol (4), 3,4-methylenedioxy-3 '-methoxybibenzyl (6), apigenin-7,4 '-dimethyl ether (7) and atranorin (8), respectively. Thestructures of compounds 3±4 and 6±8 were establishedby comparing their spectroscopic data and physicalconstants with those reported in the literature (Tori etal., 1993; Asakawa, 1982; Markharm & Given, 1988;Huneck & Yoshimura, 1996). These compounds werepreviously isolated from other liverworts and lichen sp.Compounds 1 and 2 were new sesquiterpenes.
The 1H-NMR spectrum of 1 (Table 1) displayed sig-nals for two tertiary methyl groups and two secondarymethyl groups characteristic of a pinguisane skeleton
Phytochemistry 53 (2000) 271±276
0031-9422/00/$ - see front matter # 2000 Elsevier Science Ltd. All rights reserved.
PII: S0031-9422(99 )00491 -4
www.elsevier.com/locate/phytochem
* Corresponding author. Tel.: +81-88-622-9611; fax: +81-88-655-
3051.
E-mail address: [email protected] (Y. Asakawa).
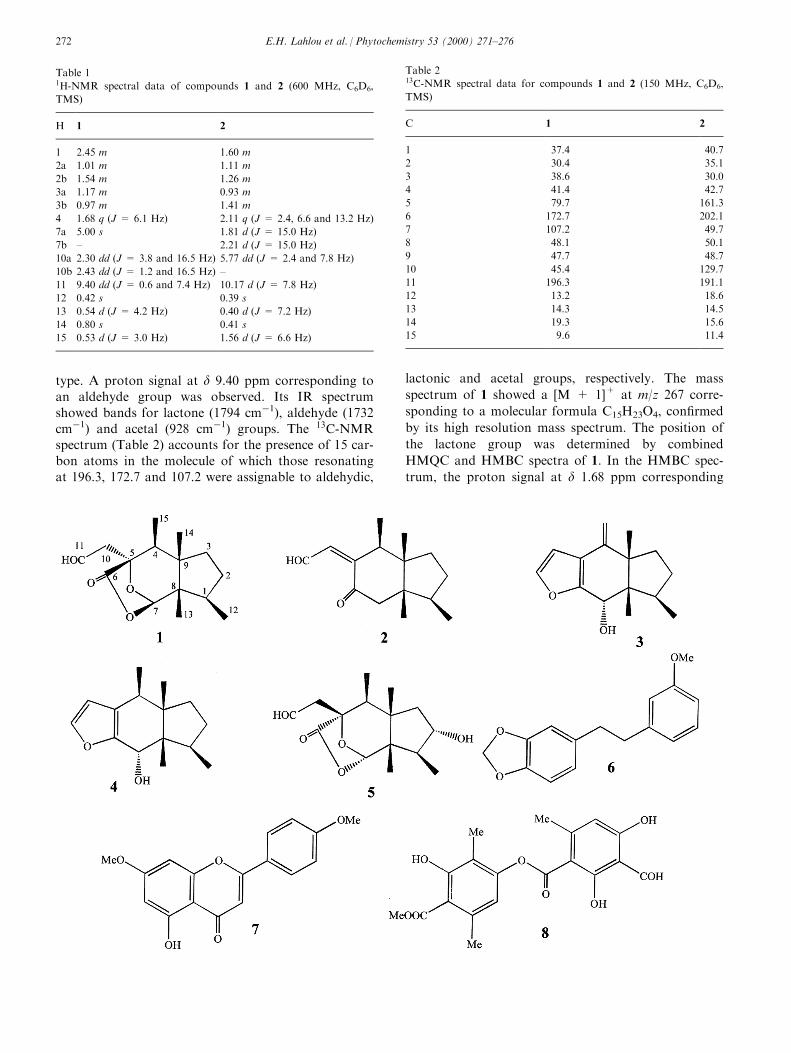
type. A proton signal at d 9.40 ppm corresponding toan aldehyde group was observed. Its IR spectrumshowed bands for lactone (1794 cmÿ1), aldehyde (1732cmÿ1) and acetal (928 cmÿ1) groups. The 13C-NMRspectrum (Table 2) accounts for the presence of 15 car-bon atoms in the molecule of which those resonatingat 196.3, 172.7 and 107.2 were assignable to aldehydic,
lactonic and acetal groups, respectively. The mass
spectrum of 1 showed a [M + 1]+ at m/z 267 corre-
sponding to a molecular formula C15H23O4, con®rmed
by its high resolution mass spectrum. The position of
the lactone group was determined by combined
HMQC and HMBC spectra of 1. In the HMBC spec-
trum, the proton signal at d 1.68 ppm corresponding
Table 11H-NMR spectral data of compounds 1 and 2 (600 MHz, C6D6,
TMS)
H 1 2
1 2.45 m 1.60 m
2a 1.01 m 1.11 m
2b 1.54 m 1.26 m
3a 1.17 m 0.93 m
3b 0.97 m 1.41 m
4 1.68 q (J = 6.1 Hz) 2.11 q (J = 2.4, 6.6 and 13.2 Hz)
7a 5.00 s 1.81 d (J = 15.0 Hz)
7b ± 2.21 d (J = 15.0 Hz)
10a 2.30 dd (J = 3.8 and 16.5 Hz) 5.77 dd (J = 2.4 and 7.8 Hz)
10b 2.43 dd (J = 1.2 and 16.5 Hz) ±
11 9.40 dd (J = 0.6 and 7.4 Hz) 10.17 d (J = 7.8 Hz)
12 0.42 s 0.39 s
13 0.54 d (J = 4.2 Hz) 0.40 d (J = 7.2 Hz)
14 0.80 s 0.41 s
15 0.53 d (J = 3.0 Hz) 1.56 d (J = 6.6 Hz)
Table 213C-NMR spectral data for compounds 1 and 2 (150 MHz, C6D6,
TMS)
C 1 2
1 37.4 40.7
2 30.4 35.1
3 38.6 30.0
4 41.4 42.7
5 79.7 161.3
6 172.7 202.1
7 107.2 49.7
8 48.1 50.1
9 47.7 48.7
10 45.4 129.7
11 196.3 191.1
12 13.2 18.6
13 14.3 14.5
14 19.3 15.6
15 9.6 11.4
E.H. Lahlou et al. / Phytochemistry 53 (2000) 271±276272

to the methine H-4 showed correlation at two bonds
with a quaternary carbon signal at 79.7 ppm attributed
to the (C-5). The C-5 was three bonds away from the
methine proton signal at d 5.00 ppm in the HMBC.
This proton was linked to a carbon signal at 107.2
ppm in the HMQC which was assigned to C-7. The H-
7 signal exhibited correlations at three bonds with C-9
and with a carbon signal at 172.7 ppm ascribed to the
carbonyl group at (C-6) in the HMBC spectrum.
These correlations indicated that the lactone group
was located between C-5 and C-7. Other important
correlations were depicted in Fig. 1. The relative
stereochemistry around C-5 and C-7 was deduced
from the NOESY spectrum of 1, since weak NOE was
observed between the proton H-7 and the methyl H-
12, while the proton H-1 did not show NOE with H-7.
A molecular mechanic calculation using the MNDO
program, showed that the H-7 is far from the H-1.
The distance is about 3.08 AÊ , which explained the
absence of NOE between these two protons in the
NOESY spectrum. These results suggested an a equa-
torial position for the H-7 and a b diaxial position for
the lactone group. A good crystal was obtained and
the stereostructure of lejeuneapinguisanolide for 1 was
established by X-ray di�raction analysis as shown in
Fig. 2.
The 1H-NMR spectrum of 2 (Table 1) was similar to
that of 1, and presented two tertiary methyl groups
and two secondary methyl groups of a pinguisane skel-
eton type. An ole®nic proton as a double doublet at d5.77 ppm (J = 2.4, 7.8 Hz) and an aldehydic proton
as a doublet at d 10.17 ppm (J = 7.8 Hz) were also
found in the same spectrum, suggesting an adjacent
position for these protons. The presence of the alde-
hyde group and the double bond in the molecule was
con®rmed by the observation of the carbon signals at
d 191.1, 161.3 and 129.7 ppm in the 13C-NMR spec-
trum of 2 (Table 2), while carbon signal at d 202.1
ppm indicated the existence of a ketone group in the
Fig. 2. An ORTEP view of compound 1.
Fig. 1. Three-and two-bond correlations for compound 1 in the
HBMC spectrum.
E.H. Lahlou et al. / Phytochemistry 53 (2000) 271±276 273
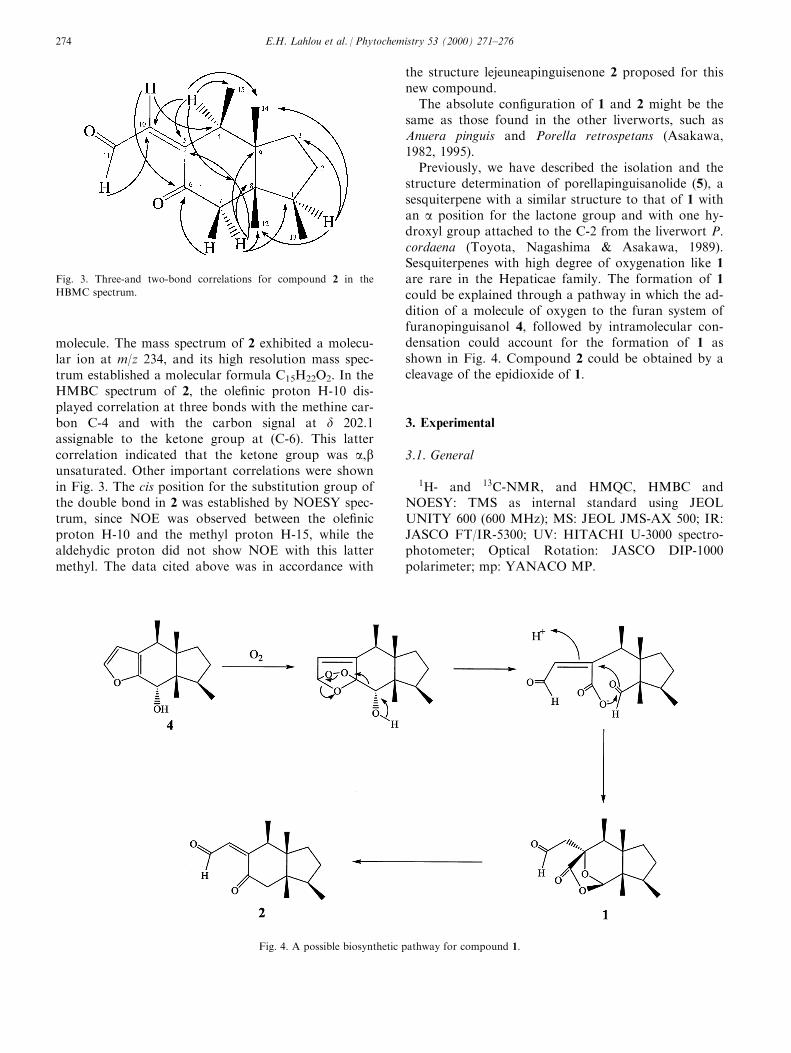
molecule. The mass spectrum of 2 exhibited a molecu-lar ion at m/z 234, and its high resolution mass spec-trum established a molecular formula C15H22O2. In theHMBC spectrum of 2, the ole®nic proton H-10 dis-played correlation at three bonds with the methine car-bon C-4 and with the carbon signal at d 202.1assignable to the ketone group at (C-6). This lattercorrelation indicated that the ketone group was a,bunsaturated. Other important correlations were shownin Fig. 3. The cis position for the substitution group ofthe double bond in 2 was established by NOESY spec-trum, since NOE was observed between the ole®nicproton H-10 and the methyl proton H-15, while thealdehydic proton did not show NOE with this lattermethyl. The data cited above was in accordance with
the structure lejeuneapinguisenone 2 proposed for thisnew compound.
The absolute con®guration of 1 and 2 might be thesame as those found in the other liverworts, such asAnuera pinguis and Porella retrospetans (Asakawa,1982, 1995).
Previously, we have described the isolation and thestructure determination of porellapinguisanolide (5), asesquiterpene with a similar structure to that of 1 withan a position for the lactone group and with one hy-droxyl group attached to the C-2 from the liverwort P.cordaena (Toyota, Nagashima & Asakawa, 1989).Sesquiterpenes with high degree of oxygenation like 1are rare in the Hepaticae family. The formation of 1could be explained through a pathway in which the ad-dition of a molecule of oxygen to the furan system offuranopinguisanol 4, followed by intramolecular con-densation could account for the formation of 1 asshown in Fig. 4. Compound 2 could be obtained by acleavage of the epidioxide of 1.
3. Experimental
3.1. General
1H- and 13C-NMR, and HMQC, HMBC andNOESY: TMS as internal standard using JEOLUNITY 600 (600 MHz); MS: JEOL JMS-AX 500; IR:JASCO FT/IR-5300; UV: HITACHI U-3000 spectro-photometer; Optical Rotation: JASCO DIP-1000polarimeter; mp: YANACO MP.
Fig. 4. A possible biosynthetic pathway for compound 1.
Fig. 3. Three-and two-bond correlations for compound 2 in the
HBMC spectrum.
E.H. Lahlou et al. / Phytochemistry 53 (2000) 271±276274

3.2. Plant material
Trocholejeunea sandvicensis (Gott.) Mizut. was col-lected on the rock in Omichi, Tokushima, Japan, inMarch 1999, and identi®ed by Yoshinori Asakawa.
3.3. Extraction and isolation
The plant material (1406 g) was extracted with Et2Ofor one month. The crude extract was ®ltered andevaporated in vacuum to give a residue (20.51 g)which was subjected to a silica gel column (300 g).Elution was carried out using gradients of n-hexane±EtOAc, EtOAc and MeOH.
The material eluted with 100% n-hexane was sub-jected to a Sephadex LH-20 (100 g) column, previouslyequilibrated with n-hexane±CHCl3±MeOH (2:1:1), andeluted with the same mixture, to give 3,4-methylene-dioxy-3 '-methoxybibenzyl (6) as a yellow solid (341mg) (Asakawa, 1982).
Two fractions were obtained from the materialeluted with 10% EtOAc. The ®rst fraction was sub-mitted to a Sephadex LH-20 (100 g) column previouslyequilibrated, and eluted with the same mixture of sol-vent mentioned above, to give dehydropinguisenol 3(1.80 g) and furanopinguisanol 4 (520 mg) (Tori et al.,1993). The second fraction was applied to a SephadexLH-20 (100 g) column, fraction containing (2) wassubjected to a prep. TLC developed with benzene±EtOAc (95:5). The material at an Rf 0.7 was recov-ered and puri®ed by HPLC in an CHEMCOSORB5Si-U column (10 � 250 (w) C/N. 02511), eluting withn-hexane±EtOAc (8:2) at a ¯ow rate of 3.0 ml minÿ1
with detection at 254 nm. The material eluted at Rt
10.4 min was collected, and concentrated to a�ord 2(7.4 mg) as a colorless oil. The fraction containing (8)was submitted to a prep. TLC developed with ben-zene±EtOAc (95:5) to give atranorin 8 (5 mg) as awhite powder (Huneck & Yoshimura, 1996).
The material eluted with 50% EtOAc was subjectedto a Sephadex LH-20 (100 g) column, fractions thatshowed the existence of (7) were combined and sub-mitted to a silica gel column (33 g) eluted with n-hex-ane±EtOAc (9:1) to give apigenin-7,4 '-dimethyl ether 7(10 mg) as a yellow solid (Markharm & Given, 1988).
The material eluted with 100% EtOAc was appliedto a Sephadex LH-20 (100 g) column, fraction contain-ing 1 was subjected to a prep. TLC developed with n-hexane±EtOAc (6:4). The band with an Rf 0.6 was cuto� and injected to a HPLC column (CHEMCOSORB5Si-U, 10 � 250 (w) C/N. 02511), eluting with n-hex-ane±EtOAc (6:2) at a ¯ow rate of 3.0 ml minÿ1 withdetection at 254 nm. The material eluted at Rt 8.25min was collected, and concentrated to a�ord 1 (3.0mg) as a colorless solid.
3.4. Lejeuneapinguisanolide (1)
Mp 180±1978C; fag25D +238 (c 0.1, CHCl3); FTIRnmax cmÿ1: 1794, 1732, 928; UV lma nm �log e): 236(2.04), 233 (2.03) (c 0.38 � 10ÿ3, EtOH); 1H- and 13C-NMR: see (Tables 1 and 2); HREIMS: found 267.1592C15H22O4 requires 267.692; EIMS m/z (rel. int.): 267[M + 1]+ (52), 223 (100), 221 (89), 176 (41), 137 (45),123 (46), 95 (42).
3.5. X-ray crystallographic analysis of 1
Compound 1 was recrystallized from n-hexane±EtOAc. X-ray crystallographic analysis was carried outon a Mac Science MXC 18 di�ractometer with Cu Ka
radiation. The structure of 1 was solved by directmethod using CRYSTAN SIR92 and re®ned byfull-matrix least squares using CRYSTAN;Mf =C15H22O4, Mr=268.00, monoclinic, P21,a=11.324 (6) AÊ , b = 6.400 (4) AÊ , c = 10.190 (7) AÊ ,b � 103:74 (5)8, V = 717.4 (8) AÊ 3, Z = 2, Dx � 1:240Mg mÿ3, Dm � 1:300 Mg mÿ3, l (Cu Ka� = 0.71073AÊ , m � 0:828 mmÿ1, cell parameters from 20 re¯ec-tions, y � 1±158, m � 0:828 mmÿ1, T = 298 K,absorption correction: none, Rint � 0:092,ymax � 25:068, 1929 measured re¯ections, 1337 inde-pendent re¯ections, 503 observed re¯ections, re®ne-ment on F, R = 0.060, wR = 0.073, S = 1.748, 503re¯ections, 171 parameters, only coordinates of Hatoms re®ned, �D=s�max � 0:3468, Drmax � 0:18 AÊ ÿ3,Drmax � ÿ0:23 AÊ ÿ3, extinction correction: none.
3.6. Lejeuneapinguisenone (2)
HREIMS: found 234.1587 C15H22O2 requires230.8587; EIMS m/z (rel. int.): 234 [M]+ (6), 232 (20),216 (73), 201 (38), 175 (34), 109 (100), 95 (81); 1H- and13C-NMR: see Tables 1 and 2). IR and �a�D for 2 werenot recorded, because the compound was unstable anddecomposed when it was stored in the refrigerator.
Acknowledgements
We thank Dr. M. Tanaka (TBU) and Miss Y.Okamoto (TBU) for 600 MHz NMR spectra and massspectra. Thanks are also given to Mr. Takaoka for X-ray analysis. This work was supported in part by aGrant-in-Aid for Scienti®c Research (No. 09771933)from the Ministry of Education, Science, Sport andCulture of Japan.
References
Asakawa, Y. (1982). In W. Herz, H. Grisebach, & G. W. Kirby,
E.H. Lahlou et al. / Phytochemistry 53 (2000) 271±276 275

Progress in the chemistry of organic natural products, vol. 42
(p. 1). Vienna: Springer.
Asakawa, Y. (1995). In W. Herz, G. W. Kirby, R. E. Moore, W.
Steglich, & Ch. Tamm, Progress in the chemistry of organic natu-
ral products, vol. 65 (p. 1). Vienna: Springer.
Asakawa, Y. (1998). Journal of Hottori Botanical Laboratory, 84,
91.
Huneck, S., & Yoshimura, I. (1996). In Identi®cation of lichen sub-
stances (p. 238). Berlin: Springer.
Markharm, K. R., & Given, D. R. (1988). Phytochemistry, 27, 2834.
Tori, M., Arbyanti, H., Taira, Z., & Asakawa, Y. (1993).
Phytochemistry, 32, 335.
Toyota, M., Nagashima, F., & Asakawa, Y. (1989). Phytochemistry,
28, 3383.
E.H. Lahlou et al. / Phytochemistry 53 (2000) 271±276276
Alkaloids from Ruta montana
Driss Touatia,*, Atta-ur-Rahmanb, Ayhan Ulubelenc
aLaboratory of Pharmacognosy, Faculty of Medicine and Pharmacy, Rabat, MoroccobH.E.J. Research Institute of Chemistry, University of Karachi, 75270 Karachi, Pakistan
cDepartment of Chemistry, Faculty of Pharmacy, University of Istanbul, 34452 Istanbul, Turkey
Received 26 April 1999; accepted 9 September 1999
Abstract
Two known and four new quinoline and 4-quinolone type alkaloids were isolated from Ruta montana collected fromRommani (Morocco). The known compounds were 1-methyl-4-methoxy-2-quinolone and evolitrine. The structures of the newcompounds were established from 1D and 2D NMR experiments including HMQC, HMBC and MS spectral methods as 2-
(nonan-8-one)-(1H)-4-quinolone, 2-(nonan-8-one)-4-methoxy-quinoline, 2-(nonan-8-one)-N-methyl-4-quinolone and 2-(decan-9-one)-N-methyl-4-quinolone. # 2000 Elsevier Science Ltd. All rights reserved.
Keywords: Ruta montana; Rutaceae; New quinoline alkaloids; Quinolone alkaloids; 1-Me-4-OMe-2-quinolone; Evolitrine
1. Introduction
In previous studies with Ruta montana (L.) L. thepresence of alkaloids (Vasudevan & Luckner, 1968;Ulubelen, 1990) and coumarins (Burges del Castillo,Rodriguez, Rodriguez & Secundino, 1985; S° ener &Mutlugil, 1985) were shown. In the present study withthe Morocco collection we have isolated six alkaloidstwo of which were known compounds 1-methyl-4-methoxy-2-quinolone (Nayar, Sutar & Bhan, 1971),and evolitrine (Baudouin, Tillequin, Koch, Pusset &Sevenet, 1981; Dreyer, 1980). The new compoundswere 2-(nonan-8-one)-(1H)-4-quinolone (1), 2-(nonan-8-one)-4-methoxy-quinoline (2), 2-(nonan-8-one)-N-methyl-4-quinolone (3), 2-(decan-9-one)-N-methyl-4-quinolone (4).
2. Results and discussion
The UV spectra for compounds 1, 3, 4 showed typi-cal 4-quinolone peaks at 330±332, 320, 235±236, 215±
220 nm. The 1H-NMR spectra of these three com-pounds correlated the quinolone structure with thebroad doublet for 1 and double doublet for 3 and 4signals at d 8.35±8.48 corresponding to H-5 and indi-cating the presence of a carbonyl group at C-4. TheHR-MS indicated the molecular formulae C18H23NO2
(m/z 285.1832) for 1, C19H25NO2 (m/z 299.1976) for 3and C20H27O2 (m/z 313.2136) for 4, all correspondingto eight degrees of unsaturation as double bond equiv-alent, of which two were accounted for by the bicyclicring system, four for the double bonds, one for thecarbonyl group and the remaining one for the carbonylgroup on the side chain. The mass fragmentation ofthe three compounds 1, 3, 4 showed [M-Me]+, [M-COMe]+ and successive loss of (±CH2) until basepeaks m/z 173 for 3 and 4 and m/z 159 for 1 whichindicated nonan-8-one side chain for 1 and 3 anddecan-9-one for 4. The 1H-NMR spectrum showed thesignals for the aliphatic side chain in all compounds asgiven in (Table 1).
The placement of the side chain was decided byHMBC experiment for compounds 1 and 2. Due tothe small amounts of compounds 3 and 4 13C-NMRspectra were not recorded, from the spectral simi-larities the side chain of 3 and 4 should also be placed
Phytochemistry 53 (2000) 277±279
0031-9422/00/$ - see front matter # 2000 Elsevier Science Ltd. All rights reserved.
PII: S0031-9422(99 )00486 -0
www.elsevier.com/locate/phytochem
* Corresponding author.
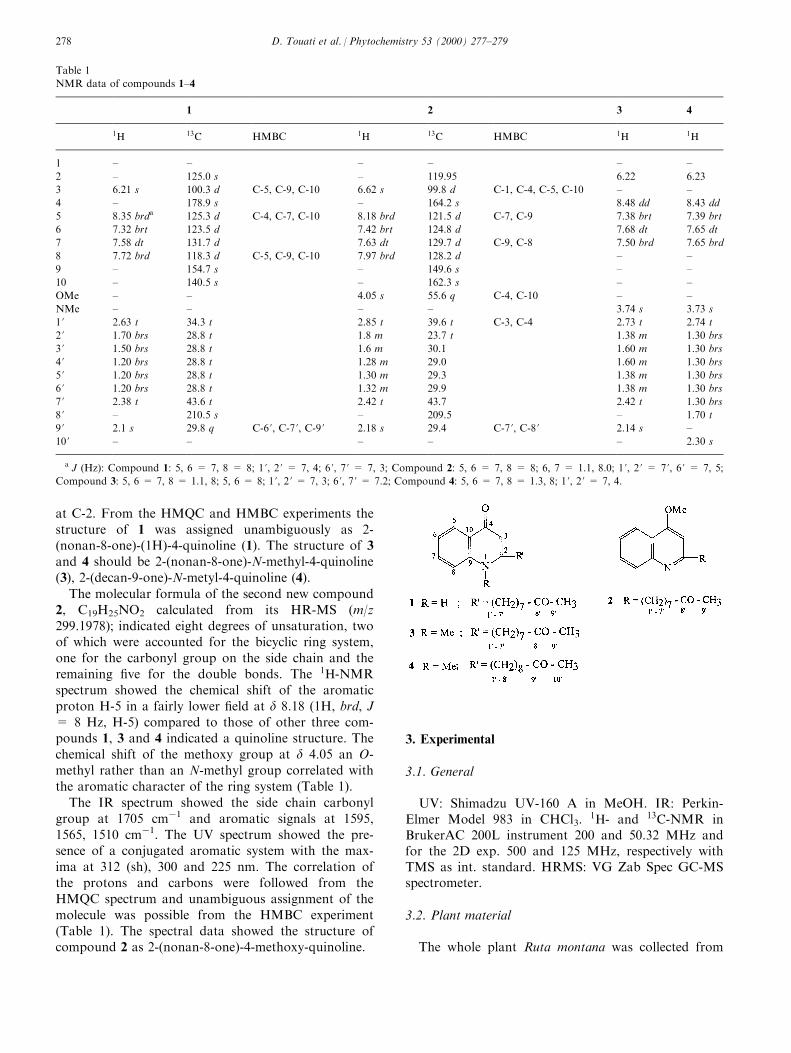
at C-2. From the HMQC and HMBC experiments thestructure of 1 was assigned unambiguously as 2-(nonan-8-one)-(1H)-4-quinoline (1). The structure of 3and 4 should be 2-(nonan-8-one)-N-methyl-4-quinoline(3), 2-(decan-9-one)-N-metyl-4-quinoline (4).
The molecular formula of the second new compound2, C19H25NO2 calculated from its HR-MS (m/z299.1978); indicated eight degrees of unsaturation, twoof which were accounted for the bicyclic ring system,one for the carbonyl group on the side chain and theremaining ®ve for the double bonds. The 1H-NMRspectrum showed the chemical shift of the aromaticproton H-5 in a fairly lower ®eld at d 8.18 (1H, brd, J= 8 Hz, H-5) compared to those of other three com-pounds 1, 3 and 4 indicated a quinoline structure. Thechemical shift of the methoxy group at d 4.05 an O-methyl rather than an N-methyl group correlated withthe aromatic character of the ring system (Table 1).
The IR spectrum showed the side chain carbonylgroup at 1705 cmÿ1 and aromatic signals at 1595,1565, 1510 cmÿ1. The UV spectrum showed the pre-sence of a conjugated aromatic system with the max-ima at 312 (sh), 300 and 225 nm. The correlation ofthe protons and carbons were followed from theHMQC spectrum and unambiguous assignment of themolecule was possible from the HMBC experiment(Table 1). The spectral data showed the structure ofcompound 2 as 2-(nonan-8-one)-4-methoxy-quinoline.
3. Experimental
3.1. General
UV: Shimadzu UV-160 A in MeOH. IR: Perkin-Elmer Model 983 in CHCl3.
1H- and 13C-NMR inBrukerAC 200L instrument 200 and 50.32 MHz andfor the 2D exp. 500 and 125 MHz, respectively withTMS as int. standard. HRMS: VG Zab Spec GC-MSspectrometer.
3.2. Plant material
The whole plant Ruta montana was collected from
Table 1
NMR data of compounds 1±4
1 2 3 4
1H 13C HMBC 1H 13C HMBC 1H 1H
1 ± ± ± ± ± ±
2 ± 125.0 s ± 119.95 6.22 6.23
3 6.21 s 100.3 d C-5, C-9, C-10 6.62 s 99.8 d C-1, C-4, C-5, C-10 ± ±
4 ± 178.9 s ± 164.2 s 8.48 dd 8.43 dd
5 8.35 brda 125.3 d C-4, C-7, C-10 8.18 brd 121.5 d C-7, C-9 7.38 brt 7.39 brt
6 7.32 brt 123.5 d 7.42 brt 124.8 d 7.68 dt 7.65 dt
7 7.58 dt 131.7 d 7.63 dt 129.7 d C-9, C-8 7.50 brd 7.65 brd
8 7.72 brd 118.3 d C-5, C-9, C-10 7.97 brd 128.2 d ± ±
9 ± 154.7 s ± 149.6 s ± ±
10 ± 140.5 s ± 162.3 s ± ±
OMe ± ± 4.05 s 55.6 q C-4, C-10 ± ±
NMe ± ± ± ± 3.74 s 3.73 s
1 ' 2.63 t 34.3 t 2.85 t 39.6 t C-3, C-4 2.73 t 2.74 t
2 ' 1.70 brs 28.8 t 1.8 m 23.7 t 1.38 m 1.30 brs
3 ' 1.50 brs 28.8 t 1.6 m 30.1 1.60 m 1.30 brs
4 ' 1.20 brs 28.8 t 1.28 m 29.0 1.60 m 1.30 brs
5 ' 1.20 brs 28.8 t 1.30 m 29.3 1.38 m 1.30 brs
6 ' 1.20 brs 28.8 t 1.32 m 29.9 1.38 m 1.30 brs
7 ' 2.38 t 43.6 t 2.42 t 43.7 2.42 t 1.30 brs
8 ' ± 210.5 s ± 209.5 ± 1.70 t
9 ' 2.1 s 29.8 q C-6 ', C-7 ', C-9 ' 2.18 s 29.4 C-7 ', C-8 ' 2.14 s ±
10 ' ± ± ± ± ± 2.30 s
a J (Hz): Compound 1: 5, 6 = 7, 8 = 8; 1 ', 2 ' = 7, 4; 6 ', 7 ' = 7, 3; Compound 2: 5, 6 = 7, 8 = 8; 6, 7 = 1.1, 8.0; 1 ', 2 ' = 7 ', 6 ' = 7, 5;
Compound 3: 5, 6 = 7, 8 = 1.1, 8; 5, 6 = 8; 1 ', 2 ' = 7, 3; 6 ', 7 ' = 7.2; Compound 4: 5, 6 = 7, 8 = 1.3, 8; 1 ', 2 ' = 7, 4.
D. Touati et al. / Phytochemistry 53 (2000) 277±279278
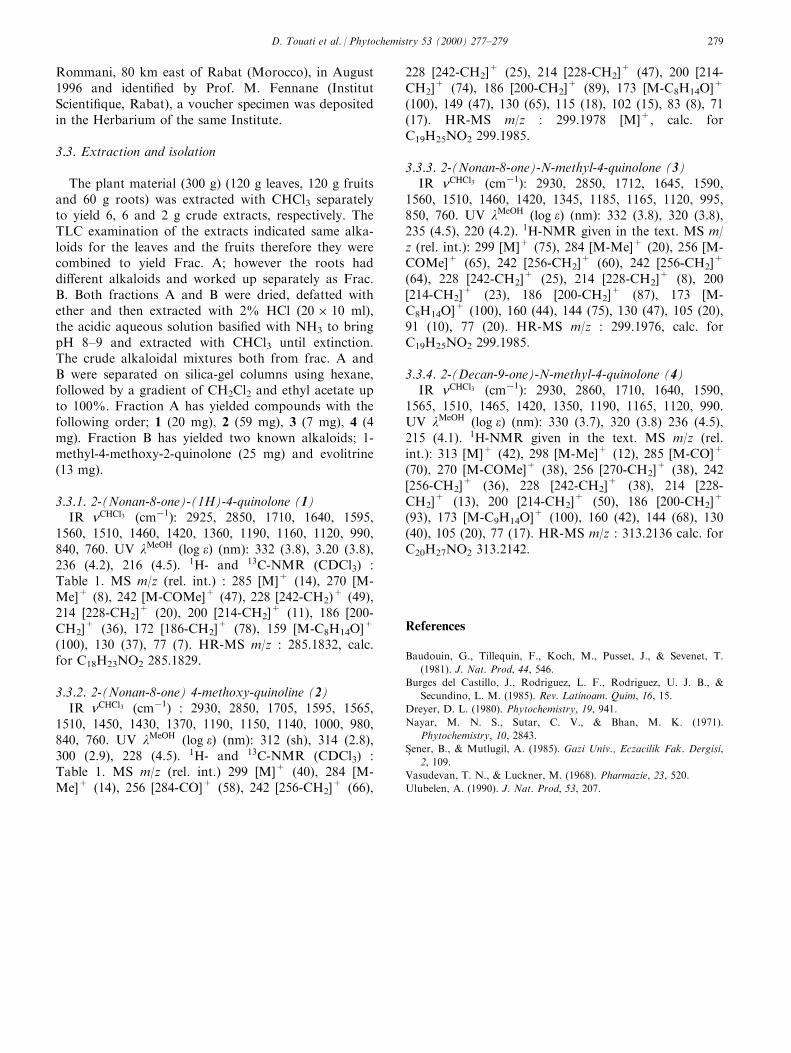
Rommani, 80 km east of Rabat (Morocco), in August1996 and identi®ed by Prof. M. Fennane (InstitutScienti®que, Rabat), a voucher specimen was depositedin the Herbarium of the same Institute.
3.3. Extraction and isolation
The plant material (300 g) (120 g leaves, 120 g fruitsand 60 g roots) was extracted with CHCl3 separatelyto yield 6, 6 and 2 g crude extracts, respectively. TheTLC examination of the extracts indicated same alka-loids for the leaves and the fruits therefore they werecombined to yield Frac. A; however the roots haddi�erent alkaloids and worked up separately as Frac.B. Both fractions A and B were dried, defatted withether and then extracted with 2% HCl (20 � 10 ml),the acidic aqueous solution basi®ed with NH3 to bringpH 8±9 and extracted with CHCl3 until extinction.The crude alkaloidal mixtures both from frac. A andB were separated on silica-gel columns using hexane,followed by a gradient of CH2Cl2 and ethyl acetate upto 100%. Fraction A has yielded compounds with thefollowing order; 1 (20 mg), 2 (59 mg), 3 (7 mg), 4 (4mg). Fraction B has yielded two known alkaloids; 1-methyl-4-methoxy-2-quinolone (25 mg) and evolitrine(13 mg).
3.3.1. 2-(Nonan-8-one)-(1H)-4-quinolone (1)IR nCHCl3 (cmÿ1): 2925, 2850, 1710, 1640, 1595,
1560, 1510, 1460, 1420, 1360, 1190, 1160, 1120, 990,840, 760. UV lMeOH �log e� (nm): 332 (3.8), 3.20 (3.8),236 (4.2), 216 (4.5). 1H- and 13C-NMR (CDCl3) :Table 1. MS m/z (rel. int.) : 285 [M]+ (14), 270 [M-Me]+ (8), 242 [M-COMe]+ (47), 228 [242-CH2)
+ (49),214 [228-CH2]
+ (20), 200 [214-CH2]+ (11), 186 [200-
CH2]+ (36), 172 [186-CH2]
+ (78), 159 [M-C8H14O]+
(100), 130 (37), 77 (7). HR-MS m/z : 285.1832, calc.for C18H23NO2 285.1829.
3.3.2. 2-(Nonan-8-one) 4-methoxy-quinoline (2)IR nCHCl3 (cmÿ1) : 2930, 2850, 1705, 1595, 1565,
1510, 1450, 1430, 1370, 1190, 1150, 1140, 1000, 980,840, 760. UV lMeOH �log e� (nm): 312 (sh), 314 (2.8),300 (2.9), 228 (4.5). 1H- and 13C-NMR (CDCl3) :Table 1. MS m/z (rel. int.) 299 [M]+ (40), 284 [M-Me]+ (14), 256 [284-CO]+ (58), 242 [256-CH2]
+ (66),
228 [242-CH2]+ (25), 214 [228-CH2]
+ (47), 200 [214-CH2]
+ (74), 186 [200-CH2]+ (89), 173 [M-C8H14O]+
(100), 149 (47), 130 (65), 115 (18), 102 (15), 83 (8), 71(17). HR-MS m/z : 299.1978 [M]+, calc. forC19H25NO2 299.1985.
3.3.3. 2-(Nonan-8-one)-N-methyl-4-quinolone (3)IR nCHCl3 (cmÿ1): 2930, 2850, 1712, 1645, 1590,
1560, 1510, 1460, 1420, 1345, 1185, 1165, 1120, 995,850, 760. UV lMeOH �log e� (nm): 332 (3.8), 320 (3.8),235 (4.5), 220 (4.2). 1H-NMR given in the text. MS m/z (rel. int.): 299 [M]+ (75), 284 [M-Me]+ (20), 256 [M-COMe]+ (65), 242 [256-CH2]
+ (60), 242 [256-CH2]+
(64), 228 [242-CH2]+ (25), 214 [228-CH2]
+ (8), 200[214-CH2]
+ (23), 186 [200-CH2]+ (87), 173 [M-
C8H14O]+ (100), 160 (44), 144 (75), 130 (47), 105 (20),91 (10), 77 (20). HR-MS m/z : 299.1976, calc. forC19H25NO2 299.1985.
3.3.4. 2-(Decan-9-one)-N-methyl-4-quinolone (4)IR nCHCl3 (cmÿ1): 2930, 2860, 1710, 1640, 1590,
1565, 1510, 1465, 1420, 1350, 1190, 1165, 1120, 990.UV lMeOH �log e� (nm): 330 (3.7), 320 (3.8) 236 (4.5),215 (4.1). 1H-NMR given in the text. MS m/z (rel.int.): 313 [M]+ (42), 298 [M-Me]+ (12), 285 [M-CO]+
(70), 270 [M-COMe]+ (38), 256 [270-CH2]+ (38), 242
[256-CH2]+ (36), 228 [242-CH2]
+ (38), 214 [228-CH2]
+ (13), 200 [214-CH2]+ (50), 186 [200-CH2]
+
(93), 173 [M-C9H14O]+ (100), 160 (42), 144 (68), 130(40), 105 (20), 77 (17). HR-MS m/z : 313.2136 calc. forC20H27NO2 313.2142.
References
Baudouin, G., Tillequin, F., Koch, M., Pusset, J., & Sevenet, T.
(1981). J. Nat. Prod, 44, 546.
Burges del Castillo, J., Rodriguez, L. F., Rodriguez, U. J. B., &
Secundino, L. M. (1985). Rev. Latinoam. Quim, 16, 15.
Dreyer, D. L. (1980). Phytochemistry, 19, 941.
Nayar, M. N. S., Sutar, C. V., & Bhan, M. K. (1971).
Phytochemistry, 10, 2843.
S° ener, B., & Mutlugil, A. (1985). Gazi Univ., Eczacilik Fak. Dergisi,
2, 109.
Vasudevan, T. N., & Luckner, M. (1968). Pharmazie, 23, 520.
Ulubelen, A. (1990). J. Nat. Prod, 53, 207.
D. Touati et al. / Phytochemistry 53 (2000) 277±279 279

Benzophenones of Garcinia pseudoguttifera (Clusiaceae)
Sadaquat Alia, Renee Goundara, Subramaniam Sotheeswarana,*, Christian Beaulieub,Claude Spinob
aDepartment of Chemistry, The University of the South Paci®c, Suva, FijibDepartement de Chimie, Universite de Sherbrooke, QC, Canada J1K 2R1
Received 19 April 1999; accepted 20 September 1999
Abstract
Four biogenetically related benzophenones have been isolated from the Fijian Garcinia pseudoguttifera. They are: 6-hydroxy-
2,4-dimethoxy-3,5-bis(3-methyl-2-butenyl)benzophenone (myrtiaphenone-A); 2,2-dimethyl-8-benzoyl-7-hydroxy-5-methoxy-6-(3-methyl-2-butenyl)benzopyran (myrtiaphenone-B); 2,6-dihydroxy-4-methoxy-3,5-bis(3-methyl-2-butenyl)benzophenone (vis-miaphenone-C) and a new benzophenone, 2,2-dimethyl-8-benzoyl-3,7-dihydroxy-5-methoxy-6-(3-methyl-2-butenyl)-3,4-
dihydrobenzopyran (pseudoguttiaphenone-A). Pseudoguttiaphenone-A could be biogenetically derived from vismiaphenone-C.The major component of G. pseudoguttifera was identi®ed as eupha-8,24-dien-3b-ol. # 2000 Elsevier Science Ltd. All rightsreserved.
Keywords: Garcinia pseudoguttifera; Clusiaceae; Heartwood; Benzophenones; Myrtiaphenones; Vismiaphenone-C; Pseudoguttiaphenone-A; Triter-
pene; Eupha-8,24-dien-3b-ol
1. Introduction
Six Garcinia species are recorded in Fiji (Parham,1972). Out of the six, only two species, G. pseudogutti-fera and G. sessilis, are recorded as medicinal plants inthe South Paci®c traditional system of medicine(Sotheeswaran, Doyle & Aalbersberg, 1998; Cambie &Ash, 1994). An extract of the leaves of G. pseudogutti-fera is mixed with coconut oil and used to relieve painin the limbs (Cambie & Ash, 1994). In this current in-vestigation, a phytochemical study of G. pseudogutti-fera was undertaken and the benzophenones:vismiaphenone-C (1), myrtiaphenone-A (2), myrtiaphe-none-B (3); a new benzophenone named pseudoguttia-phenone-A (4), and a triterpene, eupha-8,24-dien-3b-olwere isolated from the heartwood extracts.
2. Results and discussion
Vismiaphenone-C (1), myrtiaphenone-A (2) andmyrtiaphenone-B (3) were previously isolated bySpino, Lal, Sotheeswaran and Aalbersberg (1995) fromanother Garcinia species (G. myrtifolia ) from theSouth Paci®c.
The hexane extract of the heartwood of G. pseudo-guttifera had a new benzophenone (pseudoguttiaphe-none-A) in an overall yield of 0.026% and wasseparated by combined chromatographic techniques(vacuum liquid chromatography (VLC) and repeatedpreparative thick layer chromatography (PTLC)). Thehigh resolution-electron ionization mass spectra (HR-EIMS) (M+, m/z 396.1934) indicated pseudoguttiaphe-none-A to have the formula, C24H28O5.
Intense peaks in the mass spectrum at m/z 77 [Ph]+
and at m/z 105 [Ph-CO]+ indicated the new naturalproduct to be a benzophenone with a monosubstitutedbenzene ring (Locksley & Murray, 1971).
The 13C- and 1H-NMR signals at �dH 7.54±7.50 (m,2H) and 7.48±7.26 (m, 3H), dC 141.8 (s, 1C), 130.8 (d,
Phytochemistry 53 (2000) 281±284
0031-9422/00/$ - see front matter # 2000 Elsevier Science Ltd. All rights reserved.
PII: S0031-9422(99 )00511 -7
www.elsevier.com/locate/phytochem
* Corresponding author.
E-mail address: [email protected] (S. Sotheeswaran).
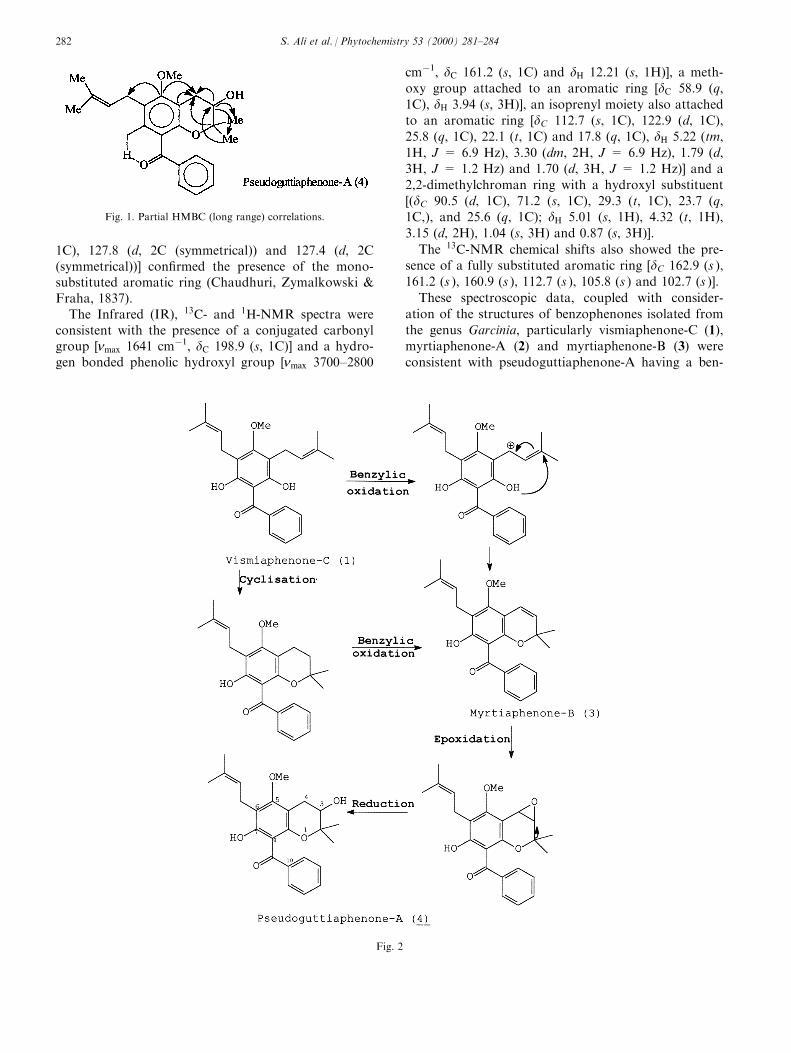
1C), 127.8 (d, 2C (symmetrical)) and 127.4 (d, 2C(symmetrical))] con®rmed the presence of the mono-substituted aromatic ring (Chaudhuri, Zymalkowski &Fraha, 1837).
The Infrared (IR), 13C- and 1H-NMR spectra wereconsistent with the presence of a conjugated carbonylgroup �nmax 1641 cmÿ1, dC 198.9 (s, 1C)] and a hydro-gen bonded phenolic hydroxyl group �nmax 3700±2800
cmÿ1, dC 161.2 (s, 1C) and dH 12.21 (s, 1H)], a meth-oxy group attached to an aromatic ring �dC 58.9 (q,1C), dH 3.94 (s, 3H)], an isoprenyl moiety also attachedto an aromatic ring �dC 112.7 (s, 1C), 122.9 (d, 1C),25.8 (q, 1C), 22.1 (t, 1C) and 17.8 (q, 1C), dH 5.22 (tm,1H, J = 6.9 Hz), 3.30 (dm, 2H, J = 6.9 Hz), 1.79 (d,3H, J = 1.2 Hz) and 1.70 (d, 3H, J = 1.2 Hz)] and a2,2-dimethylchroman ring with a hydroxyl substituent[(dC 90.5 (d, 1C), 71.2 (s, 1C), 29.3 (t, 1C), 23.7 (q,1C,), and 25.6 (q, 1C); dH 5.01 (s, 1H), 4.32 (t, 1H),3.15 (d, 2H), 1.04 (s, 3H) and 0.87 (s, 3H)].
The 13C-NMR chemical shifts also showed the pre-sence of a fully substituted aromatic ring �dC 162.9 (s ),161.2 (s ), 160.9 (s ), 112.7 (s ), 105.8 (s ) and 102.7 (s )].
These spectroscopic data, coupled with consider-ation of the structures of benzophenones isolated fromthe genus Garcinia, particularly vismiaphenone-C (1),myrtiaphenone-A (2) and myrtiaphenone-B (3) wereconsistent with pseudoguttiaphenone-A having a ben-
Fig. 1. Partial HMBC (long range) correlations.
Fig. 2
S. Ali et al. / Phytochemistry 53 (2000) 281±284282
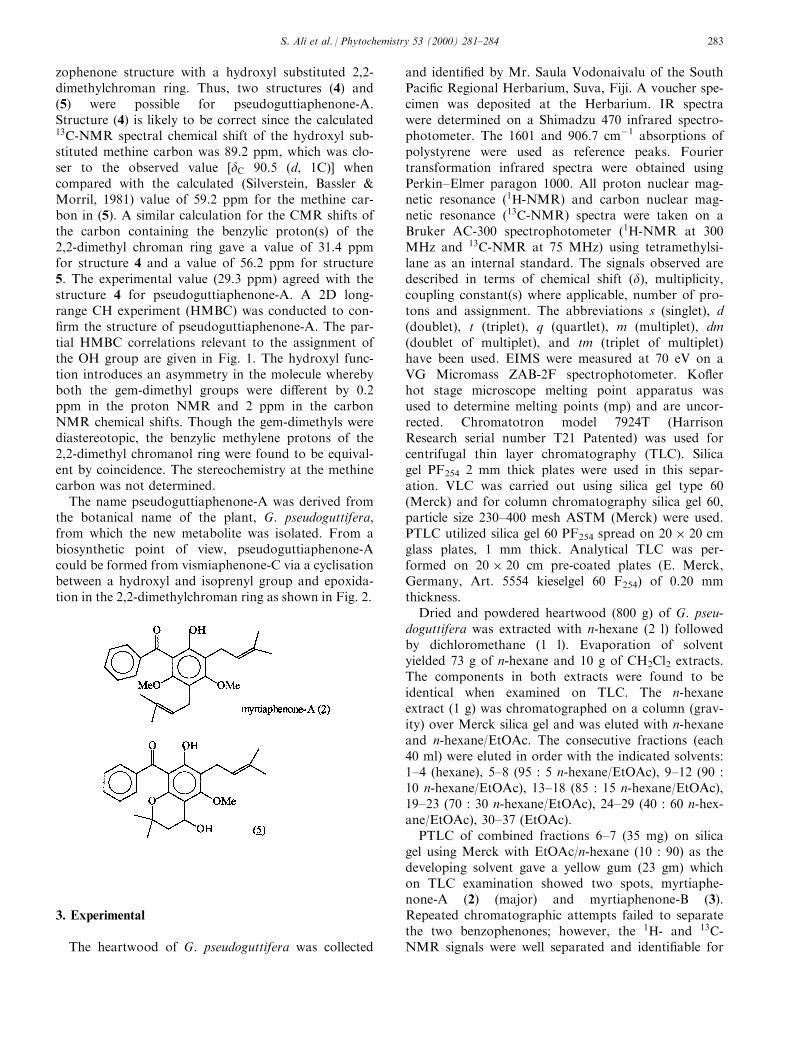
zophenone structure with a hydroxyl substituted 2,2-dimethylchroman ring. Thus, two structures (4) and(5) were possible for pseudoguttiaphenone-A.Structure (4) is likely to be correct since the calculated13C-NMR spectral chemical shift of the hydroxyl sub-stituted methine carbon was 89.2 ppm, which was clo-ser to the observed value �dC 90.5 (d, 1C)] whencompared with the calculated (Silverstein, Bassler &Morril, 1981) value of 59.2 ppm for the methine car-bon in (5). A similar calculation for the CMR shifts ofthe carbon containing the benzylic proton(s) of the2,2-dimethyl chroman ring gave a value of 31.4 ppmfor structure 4 and a value of 56.2 ppm for structure5. The experimental value (29.3 ppm) agreed with thestructure 4 for pseudoguttiaphenone-A. A 2D long-range CH experiment (HMBC) was conducted to con-®rm the structure of pseudoguttiaphenone-A. The par-tial HMBC correlations relevant to the assignment ofthe OH group are given in Fig. 1. The hydroxyl func-tion introduces an asymmetry in the molecule wherebyboth the gem-dimethyl groups were di�erent by 0.2ppm in the proton NMR and 2 ppm in the carbonNMR chemical shifts. Though the gem-dimethyls werediastereotopic, the benzylic methylene protons of the2,2-dimethyl chromanol ring were found to be equival-ent by coincidence. The stereochemistry at the methinecarbon was not determined.
The name pseudoguttiaphenone-A was derived fromthe botanical name of the plant, G. pseudoguttifera,from which the new metabolite was isolated. From abiosynthetic point of view, pseudoguttiaphenone-Acould be formed from vismiaphenone-C via a cyclisationbetween a hydroxyl and isoprenyl group and epoxida-tion in the 2,2-dimethylchroman ring as shown in Fig. 2.
3. Experimental
The heartwood of G. pseudoguttifera was collected
and identi®ed by Mr. Saula Vodonaivalu of the SouthPaci®c Regional Herbarium, Suva, Fiji. A voucher spe-cimen was deposited at the Herbarium. IR spectrawere determined on a Shimadzu 470 infrared spectro-photometer. The 1601 and 906.7 cmÿ1 absorptions ofpolystyrene were used as reference peaks. Fouriertransformation infrared spectra were obtained usingPerkin±Elmer paragon 1000. All proton nuclear mag-netic resonance �1H-NMR) and carbon nuclear mag-netic resonance �13C-NMR) spectra were taken on aBruker AC-300 spectrophotometer �1H-NMR at 300MHz and 13C-NMR at 75 MHz) using tetramethylsi-lane as an internal standard. The signals observed aredescribed in terms of chemical shift �d), multiplicity,coupling constant(s) where applicable, number of pro-tons and assignment. The abbreviations s (singlet), d(doublet), t (triplet), q (quartlet), m (multiplet), dm(doublet of multiplet), and tm (triplet of multiplet)have been used. EIMS were measured at 70 eV on aVG Micromass ZAB-2F spectrophotometer. Ko¯erhot stage microscope melting point apparatus wasused to determine melting points (mp) and are uncor-rected. Chromatotron model 7924T (HarrisonResearch serial number T21 Patented) was used forcentrifugal thin layer chromatography (TLC). Silicagel PF254 2 mm thick plates were used in this separ-ation. VLC was carried out using silica gel type 60(Merck) and for column chromatography silica gel 60,particle size 230±400 mesh ASTM (Merck) were used.PTLC utilized silica gel 60 PF254 spread on 20 � 20 cmglass plates, 1 mm thick. Analytical TLC was per-formed on 20 � 20 cm pre-coated plates (E. Merck,Germany, Art. 5554 kieselgel 60 F254) of 0.20 mmthickness.
Dried and powdered heartwood (800 g) of G. pseu-doguttifera was extracted with n-hexane (2 l) followedby dichloromethane (1 l). Evaporation of solventyielded 73 g of n-hexane and 10 g of CH2Cl2 extracts.The components in both extracts were found to beidentical when examined on TLC. The n-hexaneextract (1 g) was chromatographed on a column (grav-ity) over Merck silica gel and was eluted with n-hexaneand n-hexane/EtOAc. The consecutive fractions (each40 ml) were eluted in order with the indicated solvents:1±4 (hexane), 5±8 (95 : 5 n-hexane/EtOAc), 9±12 (90 :10 n-hexane/EtOAc), 13±18 (85 : 15 n-hexane/EtOAc),19±23 (70 : 30 n-hexane/EtOAc), 24±29 (40 : 60 n-hex-ane/EtOAc), 30±37 (EtOAc).
PTLC of combined fractions 6±7 (35 mg) on silicagel using Merck with EtOAc/n-hexane (10 : 90) as thedeveloping solvent gave a yellow gum (23 gm) whichon TLC examination showed two spots, myrtiaphe-none-A (2) (major) and myrtiaphenone-B (3).Repeated chromatographic attempts failed to separatethe two benzophenones; however, the 1H- and 13C-NMR signals were well separated and identi®able for
S. Ali et al. / Phytochemistry 53 (2000) 281±284 283
each benzophenone except for the phenyl protons.PTLC of fractions 13±17 (120 mg) using silica gel andwith EtOAc/n-hexane (10 : 90) as the eluent gavecrude vismiaphenone-C (1) (90 mg) which was furtherpuri®ed using PTLC with EtOAc/n-hexane (15 : 85) asthe eluent. Pure vismiaphenone-C (1) (41 mg) was iso-lated as a yellow gum. A portion of the hexane extract(2 g) was subjected to VLC on silica gel to yield 12fractions (150 ml each) with the following indicatedsolvents: 1±5 (20 : 80), 6±7 (40 : 60), 8±9 (50 : 50), 10±12 (60 : 40) CH2Cl2/n-hexane. On extended puri®cationusing VLC, the residue from combined fractions 8 and9 (95 mg) gave 34 50 ml subfractions: n-hexane (1±10),99 : 1 n-hexane/CH2Cl2 (11±14), 98 : 2 n-hexane/CH2Cl2 (15±18), 95 : 5 in-hexane/CH2Cl2 (19±22), 50 :50 n-hexane/CH2Cl2 (23±34). Part of the residue fromcombined subfractions 26±28 (16 mg) on further puri®-cation using PTLC and developing solvent 20 : 80EtOAc/n-hexane, yielded yellow, gummy pseudoguttia-phenone-A (4) (6 mg).
About 18 g of n-hexane extract was subjected toVLC on silica gel to yield 20 (100 ml each) fractions,1±8, 9±18, 19±20, on successive elution with n-hexane,95 : 5 n-hexane/EtOAc, and 90 : 10 n-hexane/EtOAc,respectively. Puri®cation of fraction 12 (0.2 g) on chro-matotron using 95 : 5 n-hexane/EtOAc gave a crudetriterpene (72 mg). PTLC of 10 mg of the crude triter-pene using silica gel and 2 : 98 EtOAc/n-hexane as elu-ent gave the pure triterpene (8 mg), which was isolatedas a white solid, mp 117±1198C and was identi®ed(Spino et al., 1995) as eupha-8,24-dien-3b-ol.
The spectral data for vismiaphenone-C (1), myrtia-phenone-A (2) and myrtiaphenone-B (3) were identical
to those published previously (Spino et al., 1995).Complete 1H- and 13C-NMR data for pseudoguttia-phenone-A (4) are given in Section 2.
3.1. Pseudoguttiaphenone-A (4)
EIMS (probe) 70 eV, m/z (relative intensity): 396[M]+ (100); 381 [M ÿ 15]+ (15); 363 (32); 341 [M ÿ55]+ (31); 323 (10.6); 309 (7.5); 149 (79); 105 [PhCO]+
(65); 84 (61); 77 [Ph]+ (26). �a�25D = +2.48 (c 1.1CHCl3).
Molecular formula: C24H28O5; exact mass calculated:396.1937, found: 396.1934.
References
Cambie, R. C., & Ash, J. (1994). In Fijian Medical Plants (p. 121).
Australia: CSIRO.
Chaudhuri, R. K., Zymalkowski, F., & Fraha, A. W. (1978).
Tetrahedron, 34, 1837.
Locksley, H.D., & Murray, I.G. (1971). J. Chem. Soc. C, 7, 1332.
Parham, J. W. (1972). In Plants of Fiji Islands (p. 194). Suva, Fiji:
Government Printer.
Silverstein, R. M., Bassler, G. C., & Morril, T. C. (1981). In
Spectrometric identi®cation of organic compounds (4th ed) (p.
261). Singapore: Wiley.
Sotheeswaran, S., Doyle, M., & Aalbersberg, W. G. L. (1990).
Medicinal Plants in the South Paci®c. Western Paci®c Series No.
19 (p. 83). Manila, Philippines: WHO Regional Publications.
Spino, C., Lal, J., Sotheeswaran, S., & Aalbersberg, W. (1995).
Phytochemistry, 38, 233.
S. Ali et al. / Phytochemistry 53 (2000) 281±284284
Tyrosinase catalysed biphenyl construction from ¯avan-3-olsubstrates
Werner Janse van Rensburga,*, Daneel Ferreirab, Elfranco Malana, JacobusA. Steenkampa,*
aDepartment of Chemistry, University of the Orange Free State, P.O. Box 339, Bloemfontein, 9300 South AfricabNational Center for the Development of Natural Products, Research Institute of Pharmaceutical Sciences, School of Pharmacy, The University of
Mississippi, MS 38677, USA
Received 29 April 1999; accepted 1 September 1999
Abstract
Mushroom tyrosinase catalysed oxidation of three ¯avan-3-ols, viz. catechin, ®setinidol and mesquitol, was conducted to
construct biphenyl bonds. Exposure of the ¯avan-3-ols to tyrosinase and subsequent trapping of the o-quinone intermediatesresulted in the formation of novel ¯avan-3-ol derivatives, the structures of which were elucidated by mono- and two-dimensional1H-NMR experiments. Application of the methodology resulted in the improved synthesis of the natural ¯avan-3-ol dimer,
mesquitol-[5 4 8]-catechin, previously isolated from Prosopis glandulosa. # 2000 Elsevier Science Ltd. All rights reserved.
Keywords: Oxidative coupling; Polyphenol oxidase; Tyrosinase; Biphenyl; Flavan-3-ol dimer
1. Introduction
The browning of injured tissues of plant organs is amajor cause of quality degradation in fruits and fruit-derived foods and beverages, e.g. in the wine industryduring early stages of processing (Mathew & Parpia,1971; Rouet-Mayer, Ralambosa & Philippon, 1990).The fundamental step in browning is the polyphenoloxidase (PPO, EC 1.14.18.1), also referred to as tyrosi-nase or phenol oxidase, catalysed transformation of o-diphenols to the corresponding richly coloured o-qui-nones via the interaction of molecular oxygen (Burton,1994). The reactive o-quinones undergo a complexseries of non-enzymatic chemical changes involved inseveral biosynthetic pathways including lignin, tanninand melanin formation (Brown, 1967).
The oxidation of catechin (1), present in numer-ous fruits, was reported by using PPO (Ahn &
Gstirner, 1970; Goodenough, Kessell, Lea &Loe�er, 1983; Oszmianski & Lee, 1990; Rouet-Mayer et al., 1990; Guyot, Cheynier, Souquet &Moutounet, 1995) and also by chemical means(Young, Young, Roux, Brandt & Ferreira, 1987;Oszmianski, Cheynier & Moutounet, 1996). In manystudies, complex mixtures of yellow pigments andcolourless C±C and C±O±C linked dimers wereobtained. Several derivatives obtained from thechemical oxidation of catechin (Young et al., 1987)were structurally elucidated, but the complete identi-®cation of condensation products from PPO inter-action is limited only to the elegant paper byGuyot, Vercauteren and Cheynier (1996).
Hence, a study was launched to construct the biphe-nyl moiety in three ¯avan-3-ol substrates, viz. catechin(1), ®setinidol (2) and mesquitol (3), utilising mush-room tyrosinase (Sigma) as PPO source at pH 7. Thenovel ¯avan-3-ol derivatives were characterised byspectrometric techniques (NMR and MS) and animproved synthesis of the two atropisomers of mesqui-tol-(54 8)-catechin, isolated from Prosopis glandulosa,was accomplished.
Phytochemistry 53 (2000) 285±292
0031-9422/00/$ - see front matter # 2000 Elsevier Science Ltd. All rights reserved.
PII: S0031-9422(99 )00476 -8
www.elsevier.com/locate/phytochem
* Corresponding authors.
E-mail addresses: [email protected] (W. J. van
Rensburg); [email protected] (J.A. Steenkamp).

Table
11H-N
MR
(300MHz,
208C
)data
ofcompounds4,6,11,14,16,19and24
Ring
H4[(CD
3) 2CO]
6 (CDCl 3)
11
(CDCl 3)
14
(CDCl 3)
16[(CD
3) 2CO]
19[(CD
3) 2CO]
24
(CDCl 3)
A5
±±
6.92(d,8.8)
±±
±±
65.84(d,2.5)a
6.18(d,2.2)a
6.52(dd,8.8,2.5)
6.44(s)
6.43(s)
6.33(s)
6.72(s)
86.00(d,2.5)a
6.08(d,2.2)a
6.48(d,8.8)
±±
±±
B2'
7.00(br.s)
6.94(br.s)
6.92(br.s)
6.92(d,2.0)
6.87±6.64(m
)6.96±6.70(m
)6.98(d,2.0)
5'
6.63(s)
6.64(s)
6.64(s)
6.84(d,8.2)
6.87±6.64(m
)6.96±6.70(m
)6.82(d,9.0)
6'
±±
±6.95(dd,8.2,2.0)
6.87±6.64(m
)6.96±6.70(m
)6.97(dd,9.0,2.0)
C2
4.59(d,8.2)
4.85(d,6.3)
4.92(d,6.0)
5.22(d,5.6)
4.64(d,6.9)a
4.59(d,8.0)a
5.42(dd,5.1,0.8)
34.09±4.00(m
)5.35±5.25(m
)5.29±5.23(m
)5.30±5.23(m
)4.12±3.80(m
)4.11±3.96(m
)5.50(ddd,5.1,5.1,
5.1)
4eq
2.95(dd,15.9,5.5)
2.83(dd,16.7,5.2)
2.95(dd,11.5,4.8)
2.63(dd,16.5,4.7)
2.85(dd,16.2,5.2)b
2.97(dd,16.2,5.1)b
2.89(ddd,17.0,5.1,
0.8)
4ax
2.41(dd,15.9,9.0)
2.56(dd,16.7,6.4)
2.68(dd,11.5,6.3)
2.45(dd,16.5,5.9)
2.53(dd,16.2,9.0)c
2.62(dd,16.2,8.0)c
2.89(ddd,17.0,5.1)
D30
6.01(dd,2.5)a
6.25(d,2.2)a
6.25(d,2.2)a
6.23(d,2.2)a
±±
±
50
6.02(dd,2.5)a
6.20(d,2.2)a
6.21(d,2.2)a
6.18(d,2.2)a
±±
±
6±
±±
±6.17(s)
6.15(s)
±
8±
±±
±±
±7.12(s)
11
±±
±±
±±
7.50(s)
E2
±±
±±
6.87±6.64(m
)6.96±6.70(m
)±
5±
±±
±6.87±6.64(m
)6.96±6.70(m
)±
6±
±±
±6.87±6.64(m
)6.96±6.70(m
)±
F2
±±
±±
4.53(d,7.7)a
4.58(d,7.3)a
±
3±
±±
±4.12±3.80(m
)4.11±3.96(m
)±
4eq
±±
±±
2.77(dd,16.1,5.3)b
2.75(dd,16.3,6.0)b
±
4ax
±±
±±
2.64(dd,16.1,7.2)c
2.84(dd,16.3,8.6)c
±
OMe
3.88,3.84,3.77,
3.75,3.73(5�
s),
3.76(2�
s)
3.88,3.84,3.78,3.76
(4�
s),3.74(2�
s)
3.95,3.89,3.87,
3.85,3.84,3.76,3.62
(7�
s)
3.98(M
eO-9),3.92
(MeO
-10),3.88
(MeO
-5),3.87
(MeO
-4'),
3.79
(MeO
-3')(5�
s)
OAc
1.86(s)
1.86(s)
1.95(s)
2.05(s)
a,b,cAllocationsinterchangeable.
W.J. van Rensburg et al. / Phytochemistry 53 (2000) 285±292286

2. Results and discussion
The selected ¯avan-3-ols (1, 2 and 3) were separatelyexposed to catalytic quantities of mushroom tyrosinaseand excess phloroglucinol in an aqueous phosphatebu�er (0.05 M, pH 7, 308C). The reactions were fol-lowed by TLC and work±up started after the ®rstdetection of polymers to ensure the recovery of anypossible Michael type addition products.
Interaction of catechin and phloroglucinol with tyro-sinase, a�orded (2R,3S )-2,3-trans-6 '-(20,40,60-trihy-droxyphenyl)-3 ',4 ',5,7-tetrahydroxy¯avan-3-ol1 (4) asthe only product in 46% yield after 24h together withunreacted substrates. The mechanism for the for-mation of 4 presumably involves the tyrosinase cata-lysed oxidation of the B-ring of catechin to yield thecorresponding reactive o-quinone intermediate (7). 1,4-Michael addition of nucleophilic phloroglucinol at C-6 ' of the electrophilic o-quinone moiety yields 4 as the®nal product. This mechanistic rationale is corrobo-rated by the work of Guyot et al. (1996) in which atwo-electron process is favoured over a one-electronprocess at relative high pH values. Enhanced catechinnucleophilicity, due to a higher proportion of phenol-ate ions, is evident from a relative high pH of the reac-tion medium.
1H-NMR data (Table 1) of the free phenolic, 4,showed an ABMX-spin pattern reminiscent of the pro-tons of the heterocyclic C-ring of catechin (YoungCronje , Botes, Ferreira & Roux, 1985). From theremaining spin systems two AX-spin patterns for aro-matic protons, one reminiscent for the A-ring of acatechin unit and the other corresponding to a phloro-glucinol unit functionalised at an aromatic carbon,were evident. Two aromatic singlets at d 7.00 and d6.63, for H-2 ' and H-5 ', respectively, con®rmed thecatechin B-ring functionalisation at C-6 '. The m-doub-let resonances for H-30 and H-50, despite their chemi-cal equivalence, propounded the barrier to rotation ofthe phloroglucinol D-ring of 4. The 1H-NMR data ofthe heptamethyl ether acetate, 6, (Table 1) con®rmedthe structure. The EIMS data of 6 indicated a molecu-lar ion at m/z 554 (24%) in agreement with a molecu-lar formula of C30H34O10. A RDA fragment of m/z388 (21%), representing the BD-moiety, establishedthe B-ring substitution.
Fisetinidol (2) obtained from Colophospermummopane (Drewes & Roux, 1966) was exposed to cataly-tic quantities of tyrosinase and an excess of phloroglu-cinol. It a�orded the novel B-ring functionalised®setinidol derivative, (2R,3S )-2,3-trans-6 '-(20,40,60-tri-hydroxyphenyl)-3 ',4 ',7-trihydroxy¯avan-3-ol (9) and
was characterised after methylation and acetylation of
the free phenolic product in 14% yield. A similar 1,4-
Michael addition mechanism, via intermediate 8, as
proposed for catechin accounted for the product for-
mation. 1H-NMR data of the hexamethyl ether acetate
11 (Table 1) showed the ABMX-spin pattern reminis-
cent of the heterocyclic protons of the C-ring of ®seti-
nidol (Drewes & Roux, 1966). The ABX-spin pattern
for the aromatic protons of the ®setinidol A-ring
established the unfunctionalised nature of the ring.
From the remaining aromatic resonances two one-pro-
ton singlets at d 6.92 (H-2 ') and d 6.64 (H-5 '), indicat-ing a C-6 ' functionalised B-ring, and an AX-spin
pattern of the phloroglucinol D-ring at d 6.25 and d6.21 for H-30 and H-50, established the structure. The
limited rotational ability of the D-ring is augmented
by the AX-spin pattern. The EIMS data of 11 showed
a molecular ion at m/z 524 (26%) in agreement with a
molecular formula of C29H32O9, and a RDA fragment
of m/z 388 (22%) representing the BD-moiety and con-
®rming the B-ring substitution.
The existence of rival catechol and pyrogallol moi-
eties in mesquitol (3), which is a predominant metab-
olite in the heartwood of P. glandulosa (Young,
Brandt, Young, Ferreira & Roux, 1986) a�orded an
ideal opportunity to compare a possible preference for
biocatalytic oxidation of either the A-ring or the B-
ring. The interaction between mesquitol and an excess
of phloroglucinol, in the presence of catalytic quan-
tities of tyrosinase, resulted in regioselective functiona-
lisation at the mesquitol A-ring to yield the novel
product, (2R,3S )-2,3-trans-5-(20,40,60-trihydroxyphe-nyl-3 ',4 ',7,8-tetrahydroxy¯avan-3-ol (12), in 11% yield.
The structure was elucidated after methylation, acety-
lation and separation of the free phenolic product mix-
ture. The preference for A-ring coupling via a 1,4-
Michael addition by phloroglucinol, may be attributed
to a regioselective oxidation of the A-ring by tyrosi-
nase, because of a higher susceptibility of the pyrogal-
Fig. 1. NOESY associations of 14.
1 In order to retain the 3,4-dihydroxylation numbering for the B-
ring, the introduced substituent is placed at C-6 '.
W.J. van Rensburg et al. / Phytochemistry 53 (2000) 285±292 287
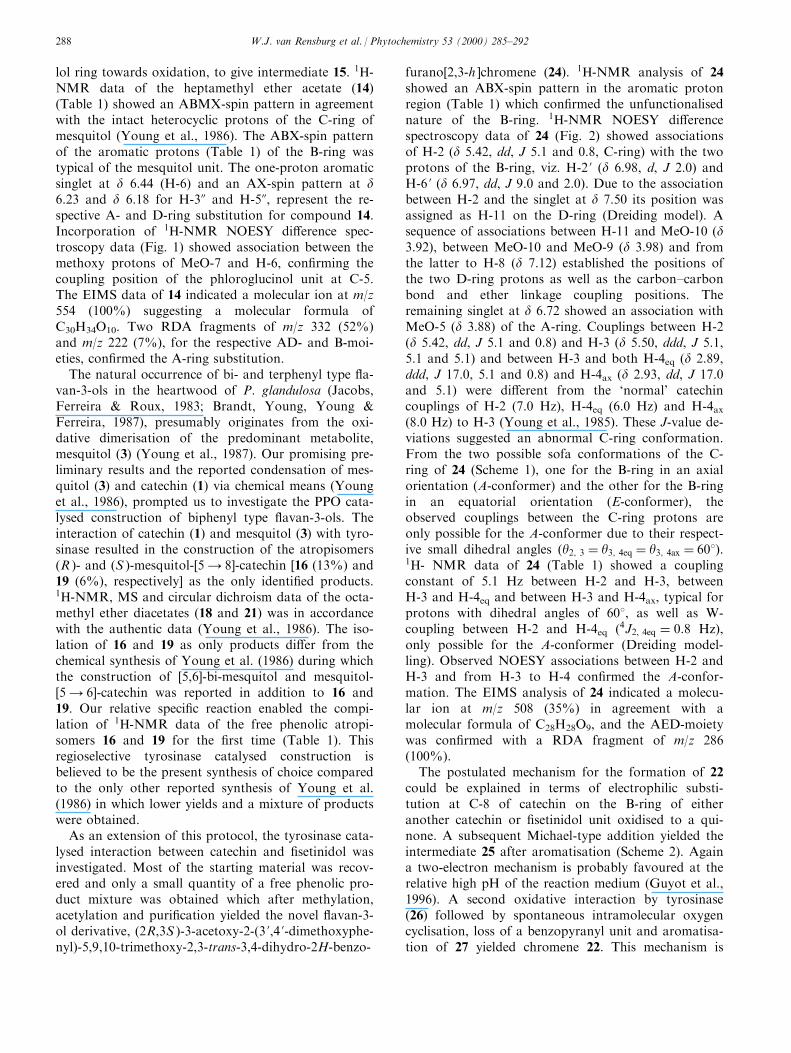
lol ring towards oxidation, to give intermediate 15. 1H-NMR data of the heptamethyl ether acetate (14)(Table 1) showed an ABMX-spin pattern in agreementwith the intact heterocyclic protons of the C-ring ofmesquitol (Young et al., 1986). The ABX-spin patternof the aromatic protons (Table 1) of the B-ring wastypical of the mesquitol unit. The one-proton aromaticsinglet at d 6.44 (H-6) and an AX-spin pattern at d6.23 and d 6.18 for H-30 and H-50, represent the re-spective A- and D-ring substitution for compound 14.Incorporation of 1H-NMR NOESY di�erence spec-troscopy data (Fig. 1) showed association between themethoxy protons of MeO-7 and H-6, con®rming thecoupling position of the phloroglucinol unit at C-5.The EIMS data of 14 indicated a molecular ion at m/z554 (100%) suggesting a molecular formula ofC30H34O10. Two RDA fragments of m/z 332 (52%)and m/z 222 (7%), for the respective AD- and B-moi-eties, con®rmed the A-ring substitution.
The natural occurrence of bi- and terphenyl type ¯a-van-3-ols in the heartwood of P. glandulosa (Jacobs,Ferreira & Roux, 1983; Brandt, Young, Young &Ferreira, 1987), presumably originates from the oxi-dative dimerisation of the predominant metabolite,mesquitol (3) (Young et al., 1987). Our promising pre-liminary results and the reported condensation of mes-quitol (3) and catechin (1) via chemical means (Younget al., 1986), prompted us to investigate the PPO cata-lysed construction of biphenyl type ¯avan-3-ols. Theinteraction of catechin (1) and mesquitol (3) with tyro-sinase resulted in the construction of the atropisomers(R )- and (S )-mesquitol-[5 4 8]-catechin [16 (13%) and19 (6%), respectively] as the only identi®ed products.1H-NMR, MS and circular dichroism data of the octa-methyl ether diacetates (18 and 21) was in accordancewith the authentic data (Young et al., 1986). The iso-lation of 16 and 19 as only products di�er from thechemical synthesis of Young et al. (1986) during whichthe construction of [5,6]-bi-mesquitol and mesquitol-[54 6]-catechin was reported in addition to 16 and19. Our relative speci®c reaction enabled the compi-lation of 1H-NMR data of the free phenolic atropi-somers 16 and 19 for the ®rst time (Table 1). Thisregioselective tyrosinase catalysed construction isbelieved to be the present synthesis of choice comparedto the only other reported synthesis of Young et al.(1986) in which lower yields and a mixture of productswere obtained.
As an extension of this protocol, the tyrosinase cata-lysed interaction between catechin and ®setinidol wasinvestigated. Most of the starting material was recov-ered and only a small quantity of a free phenolic pro-duct mixture was obtained which after methylation,acetylation and puri®cation yielded the novel ¯avan-3-ol derivative, (2R,3S )-3-acetoxy-2-(3 ',4 '-dimethoxyphe-nyl)-5,9,10-trimethoxy-2,3-trans-3,4-dihydro-2H-benzo-
furano[2,3-h ]chromene (24). 1H-NMR analysis of 24showed an ABX-spin pattern in the aromatic protonregion (Table 1) which con®rmed the unfunctionalisednature of the B-ring. 1H-NMR NOESY di�erencespectroscopy data of 24 (Fig. 2) showed associationsof H-2 �d 5.42, dd, J 5.1 and 0.8, C-ring) with the twoprotons of the B-ring, viz. H-2 ' �d 6.98, d, J 2.0) andH-6 ' �d 6.97, dd, J 9.0 and 2.0). Due to the associationbetween H-2 and the singlet at d 7.50 its position wasassigned as H-11 on the D-ring (Dreiding model). Asequence of associations between H-11 and MeO-10 �d3.92), between MeO-10 and MeO-9 �d 3.98) and fromthe latter to H-8 �d 7.12) established the positions ofthe two D-ring protons as well as the carbon±carbonbond and ether linkage coupling positions. Theremaining singlet at d 6.72 showed an association withMeO-5 �d 3.88) of the A-ring. Couplings between H-2�d 5.42, dd, J 5.1 and 0.8) and H-3 �d 5.50, ddd, J 5.1,5.1 and 5.1) and between H-3 and both H-4eq �d 2.89,ddd, J 17.0, 5.1 and 0.8) and H-4ax �d 2.93, dd, J 17.0and 5.1) were di�erent from the `normal' catechincouplings of H-2 (7.0 Hz), H-4eq (6.0 Hz) and H-4ax(8.0 Hz) to H-3 (Young et al., 1985). These J-value de-viations suggested an abnormal C-ring conformation.From the two possible sofa conformations of the C-ring of 24 (Scheme 1), one for the B-ring in an axialorientation (A-conformer) and the other for the B-ringin an equatorial orientation (E-conformer), theobserved couplings between the C-ring protons areonly possible for the A-conformer due to their respect-ive small dihedral angles �y2; 3 � y3; 4eq � y3; 4ax � 608).1H- NMR data of 24 (Table 1) showed a couplingconstant of 5.1 Hz between H-2 and H-3, betweenH-3 and H-4eq and between H-3 and H-4ax, typical forprotons with dihedral angles of 608, as well as W-coupling between H-2 and H-4eq �4J2, 4eq � 0:8 Hz),only possible for the A-conformer (Dreiding model-ling). Observed NOESY associations between H-2 andH-3 and from H-3 to H-4 con®rmed the A-confor-mation. The EIMS analysis of 24 indicated a molecu-lar ion at m/z 508 (35%) in agreement with amolecular formula of C28H28O9, and the AED-moietywas con®rmed with a RDA fragment of m/z 286(100%).
The postulated mechanism for the formation of 22could be explained in terms of electrophilic substi-tution at C-8 of catechin on the B-ring of eitheranother catechin or ®setinidol unit oxidised to a qui-none. A subsequent Michael-type addition yielded theintermediate 25 after aromatisation (Scheme 2). Againa two-electron mechanism is probably favoured at therelative high pH of the reaction medium (Guyot et al.,1996). A second oxidative interaction by tyrosinase(26) followed by spontaneous intramolecular oxygencyclisation, loss of a benzopyranyl unit and aromatisa-tion of 27 yielded chromene 22. This mechanism is
W.J. van Rensburg et al. / Phytochemistry 53 (2000) 285±292288
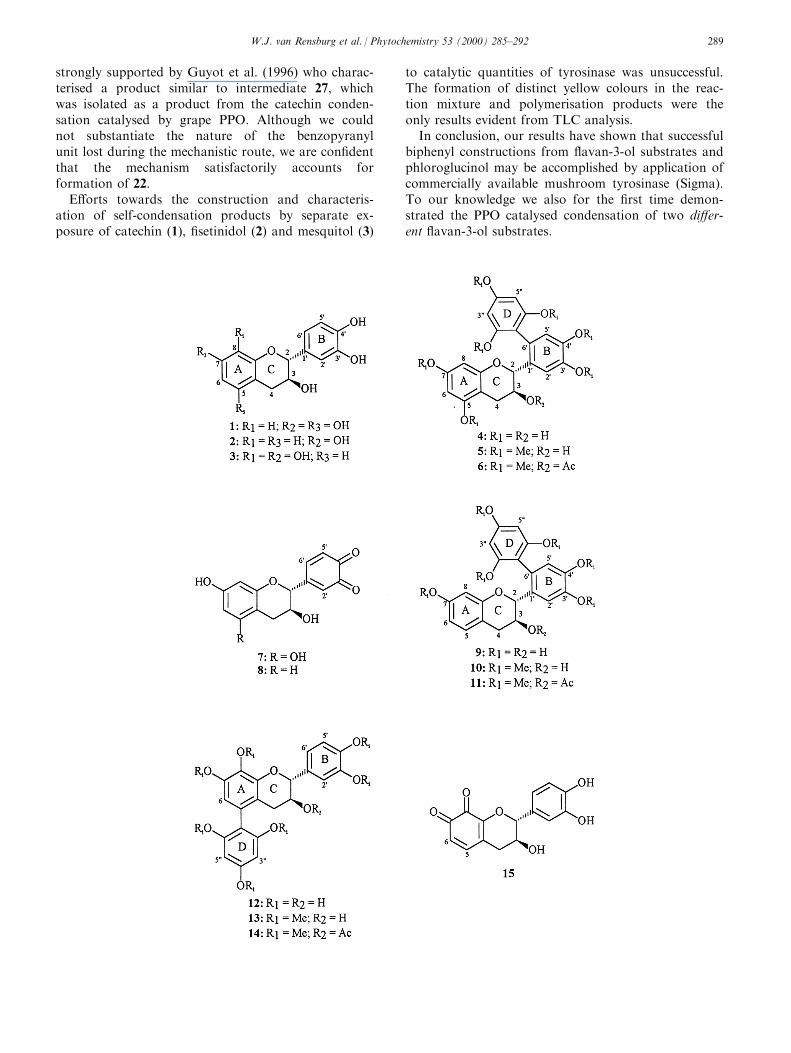
strongly supported by Guyot et al. (1996) who charac-terised a product similar to intermediate 27, whichwas isolated as a product from the catechin conden-sation catalysed by grape PPO. Although we couldnot substantiate the nature of the benzopyranylunit lost during the mechanistic route, we are con®dentthat the mechanism satisfactorily accounts forformation of 22.
E�orts towards the construction and characteris-ation of self-condensation products by separate ex-posure of catechin (1), ®setinidol (2) and mesquitol (3)
to catalytic quantities of tyrosinase was unsuccessful.The formation of distinct yellow colours in the reac-tion mixture and polymerisation products were theonly results evident from TLC analysis.
In conclusion, our results have shown that successfulbiphenyl constructions from ¯avan-3-ol substrates andphloroglucinol may be accomplished by application ofcommercially available mushroom tyrosinase (Sigma).To our knowledge we also for the ®rst time demon-strated the PPO catalysed condensation of two di�er-ent ¯avan-3-ol substrates.
W.J. van Rensburg et al. / Phytochemistry 53 (2000) 285±292 289
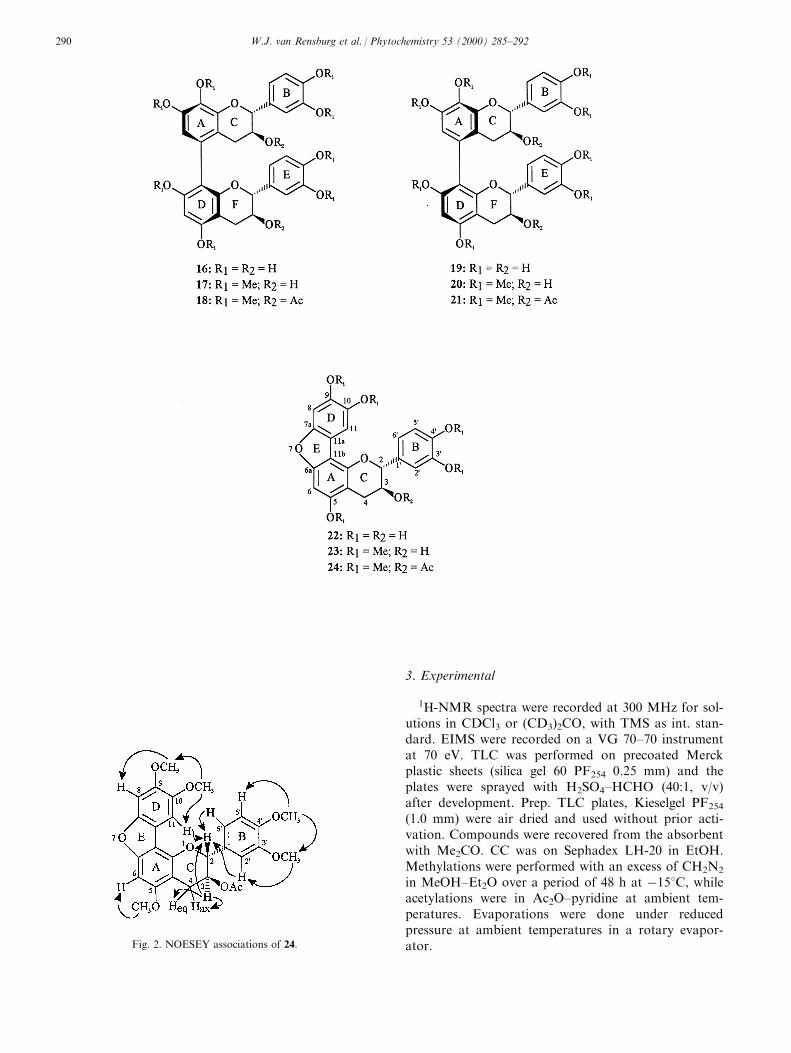
3. Experimental
1H-NMR spectra were recorded at 300 MHz for sol-utions in CDCl3 or (CD3)2CO, with TMS as int. stan-dard. EIMS were recorded on a VG 70±70 instrumentat 70 eV. TLC was performed on precoated Merckplastic sheets (silica gel 60 PF254 0.25 mm) and theplates were sprayed with H2SO4±HCHO (40:1, v/v)after development. Prep. TLC plates, Kieselgel PF254
(1.0 mm) were air dried and used without prior acti-vation. Compounds were recovered from the absorbentwith Me2CO. CC was on Sephadex LH-20 in EtOH.Methylations were performed with an excess of CH2N2
in MeOH±Et2O over a period of 48 h at ÿ158C, whileacetylations were in Ac2O±pyridine at ambient tem-peratures. Evaporations were done under reducedpressure at ambient temperatures in a rotary evapor-ator.Fig. 2. NOESEY associations of 24.
W.J. van Rensburg et al. / Phytochemistry 53 (2000) 285±292290

3.1. MaterialsCatechin, phloroglucinol and mushroom tyrosinase
were purchased from Sigma. Fisetinidol from C.mopane (Drewes & Roux, 1966) and mesquitol from P.glandulosa (Jacobs et al., 1983) were used from our pri-vate collection of ¯avan-3-ols.
3.2. Oxidation procedureFlavan-3-ol (100 mg) and phloroglucinol (1 g) were
dissolved in 0.05 M phosphate bu�er (30 ml, pH 7)and after temperature stabilisation (308C) in a waterbath, tyrosinase (10 mg), dissolved in phosphate bu�er(2 ml), was added and the reaction mixture gently sha-ken. After the ®rst detection of polymeric material byTLC, an EtOAc extraction (3 � 30 ml) was performed,the organic layers combined, washed with brine(3 � 30 ml), dried (NaSO4) and EtOAc removed undervacuum. Sephadex LH-20 a�orded the separation offree phenolic product(s) from the starting material.
3.3. (2R,3S)-2,3-trans-6 '-(20,40,60-Trihydroxyphenyl)-3 ',4 ',5,7-tetrahydroxy¯avan-3-ol 4
Application of the oxidation procedure on catechina�orded unreacted catechin (33.9 mg), unreactedphloroglucinol (632.7 mg) and compound 4 (60.8 mg,46%) as a brown amorphous solid (Ahn & Gstirner,1970). Rf 0.31 C6H6±Me2CO±MeOH (5:4:1); 1H-NMR(Table 1); methylation and acetylation of 4 (60.8 mg)a�orded the heptamethyl ether acetate (6) as a lightyellow amorphous solid (43.2 mg, 52%). Rf 0.82 C6H6±Me2CO±MeOH (18:1:1); 1H-NMR (Table 1); EIMSm/z (rel. int.): 554 [M]+ (24), 512 [M-CH2CO]+ (6),494 [M-HOAc]+ (64), 463 [M-HOAc-OMe]+ (100),388 (21), 346 (43), 328 (12), 167 (54) (found M+,554.2152, C30H34O10 requires M
+, 554.2152).
3.4. (2R,3S)-2,3-trans-6 '-(20,40,60-Trihydroxyphenyl)-3 ',4 ',7-trihydroxy¯avan-3-ol 9
Application of the oxidation procedure on ®setinidola�orded unreacted ®setinidol (42.1 mg), unreacted
phloroglucinol (712.3 mg) and an inseparable fractionof products (36.7 mg). Methylation, acetylation andTLC separation a�orded the hexamethyl ether acetate(11) as a light yellow amorphous solid (29.6 mg, 14%).Rf 0.83 C6H6±Me2CO±MeOH (38:1:1); 1H-NMR(Table 1); EIMS m/z (rel. int.) 524 [M]+ (26), 482 [M-CH2CO]+ (10), 464 [M-HOAc]+ (23), 433 [M-HOAc-OMe]+ (100), 388 (22), 346 (29), 328 (23) (found M+,524.2044. C29H32O9 requires M
+, 524.2046).
Scheme 1.
Scheme 2.
W.J. van Rensburg et al. / Phytochemistry 53 (2000) 285±292 291
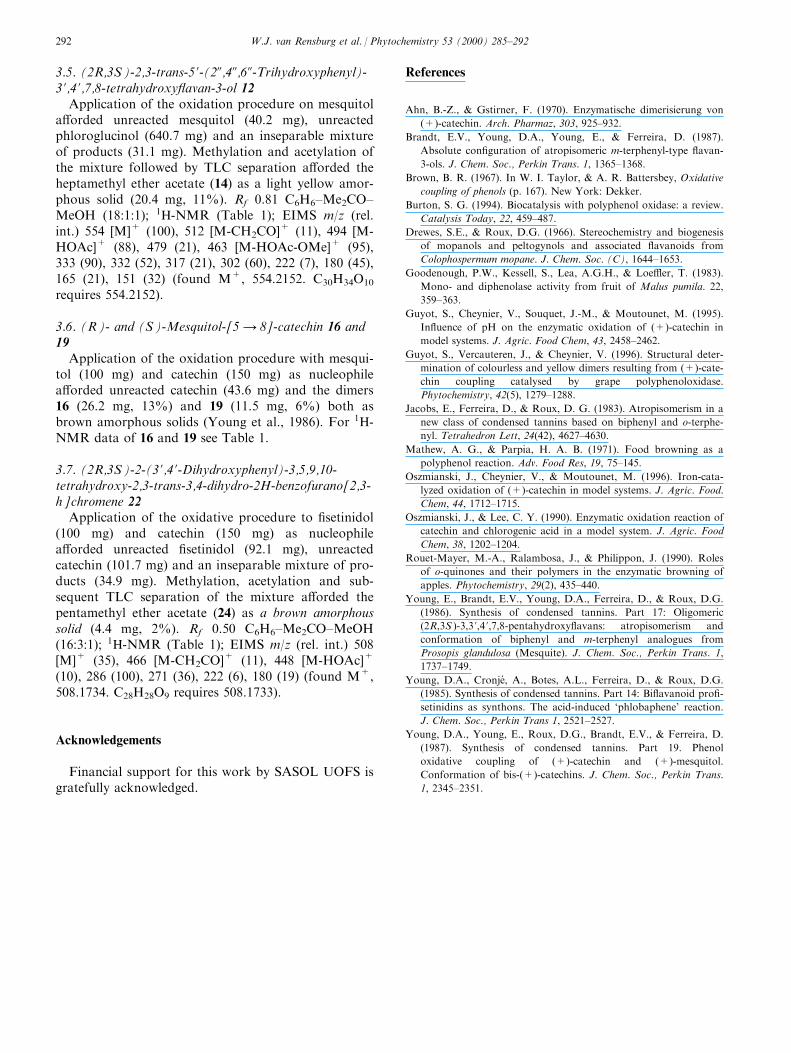
3.5. (2R,3S)-2,3-trans-5 '-(20,40,60-Trihydroxyphenyl)-3 ',4 ',7,8-tetrahydroxy¯avan-3-ol 12
Application of the oxidation procedure on mesquitola�orded unreacted mesquitol (40.2 mg), unreactedphloroglucinol (640.7 mg) and an inseparable mixtureof products (31.1 mg). Methylation and acetylation ofthe mixture followed by TLC separation a�orded theheptamethyl ether acetate (14) as a light yellow amor-phous solid (20.4 mg, 11%). Rf 0.81 C6H6±Me2CO±MeOH (18:1:1); 1H-NMR (Table 1); EIMS m/z (rel.int.) 554 [M]+ (100), 512 [M-CH2CO]+ (11), 494 [M-HOAc]+ (88), 479 (21), 463 [M-HOAc-OMe]+ (95),333 (90), 332 (52), 317 (21), 302 (60), 222 (7), 180 (45),165 (21), 151 (32) (found M+, 554.2152. C30H34O10
requires 554.2152).
3.6. (R)- and (S)-Mesquitol-[5 4 8]-catechin 16 and19
Application of the oxidation procedure with mesqui-tol (100 mg) and catechin (150 mg) as nucleophilea�orded unreacted catechin (43.6 mg) and the dimers16 (26.2 mg, 13%) and 19 (11.5 mg, 6%) both asbrown amorphous solids (Young et al., 1986). For 1H-NMR data of 16 and 19 see Table 1.
3.7. (2R,3S)-2-(3 ',4 '-Dihydroxyphenyl)-3,5,9,10-tetrahydroxy-2,3-trans-3,4-dihydro-2H-benzofurano[2,3-h ]chromene 22
Application of the oxidative procedure to ®setinidol(100 mg) and catechin (150 mg) as nucleophilea�orded unreacted ®setinidol (92.1 mg), unreactedcatechin (101.7 mg) and an inseparable mixture of pro-ducts (34.9 mg). Methylation, acetylation and sub-sequent TLC separation of the mixture a�orded thepentamethyl ether acetate (24) as a brown amorphoussolid (4.4 mg, 2%). Rf 0.50 C6H6±Me2CO±MeOH(16:3:1); 1H-NMR (Table 1); EIMS m/z (rel. int.) 508[M]+ (35), 466 [M-CH2CO]+ (11), 448 [M-HOAc]+
(10), 286 (100), 271 (36), 222 (6), 180 (19) (found M+,508.1734. C28H28O9 requires 508.1733).
Acknowledgements
Financial support for this work by SASOL UOFS isgratefully acknowledged.
References
Ahn, B.-Z., & Gstirner, F. (1970). Enzymatische dimerisierung von
(+)-catechin. Arch. Pharmaz, 303, 925±932.
Brandt, E.V., Young, D.A., Young, E., & Ferreira, D. (1987).
Absolute con®guration of atropisomeric m-terphenyl-type ¯avan-
3-ols. J. Chem. Soc., Perkin Trans. 1, 1365±1368.
Brown, B. R. (1967). In W. I. Taylor, & A. R. Battersbey, Oxidative
coupling of phenols (p. 167). New York: Dekker.
Burton, S. G. (1994). Biocatalysis with polyphenol oxidase: a review.
Catalysis Today, 22, 459±487.
Drewes, S.E., & Roux, D.G. (1966). Stereochemistry and biogenesis
of mopanols and peltogynols and associated ¯avanoids from
Colophospermum mopane. J. Chem. Soc. (C), 1644±1653.
Goodenough, P.W., Kessell, S., Lea, A.G.H., & Loe�er, T. (1983).
Mono- and diphenolase activity from fruit of Malus pumila. 22,
359±363.
Guyot, S., Cheynier, V., Souquet, J.-M., & Moutounet, M. (1995).
In¯uence of pH on the enzymatic oxidation of (+)-catechin in
model systems. J. Agric. Food Chem, 43, 2458±2462.
Guyot, S., Vercauteren, J., & Cheynier, V. (1996). Structural deter-
mination of colourless and yellow dimers resulting from (+)-cate-
chin coupling catalysed by grape polyphenoloxidase.
Phytochemistry, 42(5), 1279±1288.
Jacobs, E., Ferreira, D., & Roux, D. G. (1983). Atropisomerism in a
new class of condensed tannins based on biphenyl and o-terphe-
nyl. Tetrahedron Lett, 24(42), 4627±4630.
Mathew, A. G., & Parpia, H. A. B. (1971). Food browning as a
polyphenol reaction. Adv. Food Res, 19, 75±145.
Oszmianski, J., Cheynier, V., & Moutounet, M. (1996). Iron-cata-
lyzed oxidation of (+)-catechin in model systems. J. Agric. Food.
Chem, 44, 1712±1715.
Oszmianski, J., & Lee, C. Y. (1990). Enzymatic oxidation reaction of
catechin and chlorogenic acid in a model system. J. Agric. Food
Chem, 38, 1202±1204.
Rouet-Mayer, M.-A., Ralambosa, J., & Philippon, J. (1990). Roles
of o-quinones and their polymers in the enzymatic browning of
apples. Phytochemistry, 29(2), 435±440.
Young, E., Brandt, E.V., Young, D.A., Ferreira, D., & Roux, D.G.
(1986). Synthesis of condensed tannins. Part 17: Oligomeric
(2R,3S )-3,3 ',4 ',7,8-pentahydroxy¯avans: atropisomerism and
conformation of biphenyl and m-terphenyl analogues from
Prosopis glandulosa (Mesquite). J. Chem. Soc., Perkin Trans. 1,
1737±1749.
Young, D.A., Cronje , A., Botes, A.L., Ferreira, D., & Roux, D.G.
(1985). Synthesis of condensed tannins. Part 14: Bi¯avanoid pro®-
setinidins as synthons. The acid-induced `phlobaphene' reaction.
J. Chem. Soc., Perkin Trans 1, 2521±2527.
Young, D.A., Young, E., Roux, D.G., Brandt, E.V., & Ferreira, D.
(1987). Synthesis of condensed tannins. Part 19. Phenol
oxidative coupling of (+)-catechin and (+)-mesquitol.
Conformation of bis-(+)-catechins. J. Chem. Soc., Perkin Trans.
1, 2345±2351.
W.J. van Rensburg et al. / Phytochemistry 53 (2000) 285±292292

Lipid composition of the extracellular matrix of Botrytis cinereagermlings
p
Lol L.D. Coopera,b,*, James E. Oliverc, E. David De Vilbissc, Robert P. Dossa,b
aUSDA-ARS, Horticulture Crops Research Unit, 3420 NW Orchard Avenue, Corvallis, OR 97330, USAbDepartment of Horticulture, Oregon State University, Corvallis, OR 97331, USA
cUSDA-ARS, Insect Chemical Ecology Laboratory, Building 007, BARC-W, Beltsville, MA 20705, USA
Received 2 June 1999; received in revised form 23 August 1999
Abstract
Six simple lipid classes (mono-, di- and tri-acylglycerols, free fatty acids, free fatty alcohols and wax esters) were identi®ed byTLC in the extracellular matrix of Botrytis cinerea germlings and the molecular components of each class were characterized
using GC-MS. The relative amounts of fatty acids and fatty alcohols within each lipid class were determined by GC-FID. Overall the lipid classes, the most abundant saturated fatty acids were palmitic (ca. 30%) and stearic acid (ca. 22%). Palmitoleic andoleic acids made up ca. 21% and 24% (respectively) of the free fatty acids, while erucic (ca. 4.1%) and linoleic (ca. 3.6%) acids
were the most abundant unsaturated fatty acids in the acylglycerides. The acylglycerides also contained almost 35% long chainfatty acids (C20:0 to C28:0). Six fatty acids were identi®ed which had odd-numbered carbon chain lengths (C15:0, C17:0, C19:0,C21:0, C23:0 and C25:0). Of these, pentacosanoic acid made up almost 14% of the fatty acids in the acylglycerides. Three
methyl-branched chain fatty acids, namely isopalmitic, isoheptadecanoic and anteisopalmitic, were identi®ed in the ECM, all insmall amounts. Of the fatty alcohols identi®ed, only palmityl and stearyl alcohols were found in the free form (ca. 57% and43%, respectively) but arachidyl alcohol (ca. 47%) and 1-octacosanol (ca. 30%) were the most abundant fatty alcohols found inthe wax ester fraction. Published by Elsevier Science Ltd.
Keywords: Botrytis cinerea; Scelerotiniaceae; Gray mold; Extracellular matrix; Characterization; Lipids; Fatty acids; Fatty alcohols
1. Introduction
The deuteromycete (Hyphomycete) fungus, Botrytiscinerea Pers:Fr. is responsible for important diseases inan extremely wide range of plants, including ®eld andglasshouse vegetables, small berry fruits includinggrapes, ornamentals, bulb and corm-producing mono-cotyledons and forest tree seedlings (Coley-Smith,1980). It is also responsible for the post-harvest spoi-lage of many fruits and vegetables during storage andtransport (Cole, Dewey & Hawes, 1996). Conidia of B.cinerea, the primary inoculum source, ®rst attach tothe host surface by a hydrophobic interaction that is
easily disrupted. After germination, the germ tubes
and appressoria secrete an extracellular matrix (ECM)
that acts, in part, as a strong adhesive (Doss, Potter,
Chastagner & Christian, 1993; Doss, Potter, Soeldner,
Christian & Fukunaga, 1995; Doss, 1999).
Extracellular matrices have been observed in associ-
ation with many fungal species, including, B. cinerea
and B. fabae (Cole et al., 1996), B. ellipitica (Doss,
Christian & Chastagner, 1988; Ward, 1888),
Colletotrichum graminicola (Nicholson & Moraes,
1980), Phyllosticta ampelicida (Kuo & Hoch, 1995) and
Uromyces viciae-fabae (Clement, Butt & Beckett,
1993). The ECM are believed to be involved with ad-
hesion of the germling or mycelium to the substrate
(Epstein & Nicholson, 1994; Jones, 1994; Moloshok,
Leinhos, Staples & Hoch, 1993; Moloshok, Terhune,
Lamboy & Hoch, 1994; Nicholson, 1996; Sugui, Leite
Phytochemistry 53 (2000) 293±298
0031-9422/00/$ - see front matter Published by Elsevier Science Ltd.
PII: S0031-9422(99 )00495 -1
www.elsevier.com/locate/phytochem
pTechnical paper No. 11525 of the Agricultural Experiment
Station, Oregon State University, Corvallis, OR 97331, USA.
* Corresponding author.
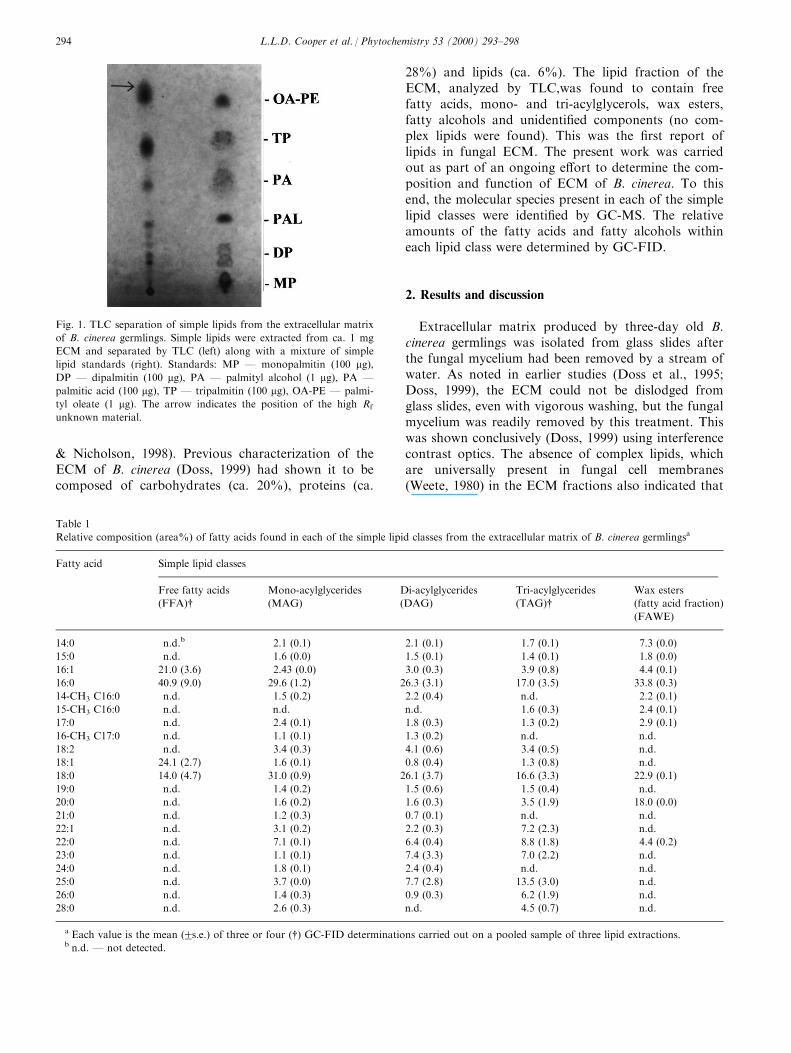
& Nicholson, 1998). Previous characterization of theECM of B. cinerea (Doss, 1999) had shown it to becomposed of carbohydrates (ca. 20%), proteins (ca.
28%) and lipids (ca. 6%). The lipid fraction of theECM, analyzed by TLC,was found to contain freefatty acids, mono- and tri-acylglycerols, wax esters,fatty alcohols and unidenti®ed components (no com-plex lipids were found). This was the ®rst report oflipids in fungal ECM. The present work was carriedout as part of an ongoing e�ort to determine the com-position and function of ECM of B. cinerea. To thisend, the molecular species present in each of the simplelipid classes were identi®ed by GC-MS. The relativeamounts of the fatty acids and fatty alcohols withineach lipid class were determined by GC-FID.
2. Results and discussion
Extracellular matrix produced by three-day old B.cinerea germlings was isolated from glass slides afterthe fungal mycelium had been removed by a stream ofwater. As noted in earlier studies (Doss et al., 1995;Doss, 1999), the ECM could not be dislodged fromglass slides, even with vigorous washing, but the fungalmycelium was readily removed by this treatment. Thiswas shown conclusively (Doss, 1999) using interferencecontrast optics. The absence of complex lipids, whichare universally present in fungal cell membranes(Weete, 1980) in the ECM fractions also indicated that
Fig. 1. TLC separation of simple lipids from the extracellular matrix
of B. cinerea germlings. Simple lipids were extracted from ca. 1 mg
ECM and separated by TLC (left) along with a mixture of simple
lipid standards (right). Standards: MP Ð monopalmitin (100 mg),DP Ð dipalmitin (100 mg), PA Ð palmityl alcohol (1 mg), PA Ð
palmitic acid (100 mg), TP Ð tripalmitin (100 mg), OA-PE Ð palmi-
tyl oleate (1 mg). The arrow indicates the position of the high Rf
unknown material.
Table 1
Relative composition (area%) of fatty acids found in each of the simple lipid classes from the extracellular matrix of B. cinerea germlingsa
Fatty acid Simple lipid classes
Free fatty acids
(FFA)$Mono-acylglycerides
(MAG)
Di-acylglycerides
(DAG)
Tri-acylglycerides
(TAG)$Wax esters
(fatty acid fraction)
(FAWE)
14:0 n.d.b 2.1 (0.1) 2.1 (0.1) 1.7 (0.1) 7.3 (0.0)
15:0 n.d. 1.6 (0.0) 1.5 (0.1) 1.4 (0.1) 1.8 (0.0)
16:1 21.0 (3.6) 2.43 (0.0) 3.0 (0.3) 3.9 (0.8) 4.4 (0.1)
16:0 40.9 (9.0) 29.6 (1.2) 26.3 (3.1) 17.0 (3.5) 33.8 (0.3)
14-CH3 C16:0 n.d. 1.5 (0.2) 2.2 (0.4) n.d. 2.2 (0.1)
15-CH3 C16:0 n.d. n.d. n.d. 1.6 (0.3) 2.4 (0.1)
17:0 n.d. 2.4 (0.1) 1.8 (0.3) 1.3 (0.2) 2.9 (0.1)
16-CH3 C17:0 n.d. 1.1 (0.1) 1.3 (0.2) n.d. n.d.
18:2 n.d. 3.4 (0.3) 4.1 (0.6) 3.4 (0.5) n.d.
18:1 24.1 (2.7) 1.6 (0.1) 0.8 (0.4) 1.3 (0.8) n.d.
18:0 14.0 (4.7) 31.0 (0.9) 26.1 (3.7) 16.6 (3.3) 22.9 (0.1)
19:0 n.d. 1.4 (0.2) 1.5 (0.6) 1.5 (0.4) n.d.
20:0 n.d. 1.6 (0.2) 1.6 (0.3) 3.5 (1.9) 18.0 (0.0)
21:0 n.d. 1.2 (0.3) 0.7 (0.1) n.d. n.d.
22:1 n.d. 3.1 (0.2) 2.2 (0.3) 7.2 (2.3) n.d.
22:0 n.d. 7.1 (0.1) 6.4 (0.4) 8.8 (1.8) 4.4 (0.2)
23:0 n.d. 1.1 (0.1) 7.4 (3.3) 7.0 (2.2) n.d.
24:0 n.d. 1.8 (0.1) 2.4 (0.4) n.d. n.d.
25:0 n.d. 3.7 (0.0) 7.7 (2.8) 13.5 (3.0) n.d.
26:0 n.d. 1.4 (0.3) 0.9 (0.3) 6.2 (1.9) n.d.
28:0 n.d. 2.6 (0.3) n.d. 4.5 (0.7) n.d.
a Each value is the mean (2s.e.) of three or four ($) GC-FID determinations carried out on a pooled sample of three lipid extractions.b n.d. Ð not detected.
L.L.D. Cooper et al. / Phytochemistry 53 (2000) 293±298294
washing resulted in the isolation of the ECM from thefungal mycelium (Doss, 1999).
Based upon weight lost occurring as a result of theextraction of the ECM with CHCl3:MeOH (2:1), lipidswere estimated to comprise 6.7%20.4% (mean2s.e.for three determinations) of the ECM. This is verysimilar to The value of (6.2%21.1) reported pre-viously (Doss, 1999). Total lipids were extracted frompreparations of ECM and separated into simple lipidclasses by one-dimensional TLC (Christie, 1982). Lipidextract from ca. 1 mg ECM was used for each of threeprep. TLC analyses. Fig. 1 illustrates the chromato-graphic separation of a representative sample of ECMlipids in comparison to a mixture of simple lipid stan-dards. Six lipid classes were identi®ed in the ECMbased upon their comigration with standard com-pounds. The lipid classes in the ECM were designatedfree fatty acids (FFA), mono- (MAG), di- (DAG) andtri-acylglycerols (TAG), free fatty alcohols (FFAL)and wax esters (WE). The WE class was made up oftwo fractions, fatty acids (FAWE) and fatty alcohols(FALWE). In addition there was one spot observed onTLC plates (indicated by the arrow) that did not comi-grate with any of the simple lipid standards, or withany other standards available. This material was desig-nated the high Rf unknown.
In the preliminary characterization of the ECMcomponents by Doss (1999), diacylglycerides were notdetected in the ECM, whereas in this study, they wereeasily identi®ed by TLC. This may have been a func-tion of the amount of ECM lipid extract applied tothe plate, as in this study lipid extract from ca. 1 mgECM was applied to the plate, whereas in the previouswork (Doss, 1999) only ca. 200 mg ECM was used.
Most of the simple lipid classes identi®ed in theECM have been reported to occur in various structuresof other fungi (Weete, 1980). Triacylglycerols are com-monly produced as storage reserves of energy and car-bon skeletons for growth and development since theyare twice as e�cient for metabolic energy than eitherproteins or carbohydrates. Diacylglycerols are present
in trace amounts in fresh animal and plant tissues, andmay be intermediates in the synthesis of triacylglycer-ols (Christie, 1989). Fatty alcohols have been identi®edas components of wax esters in fungi (Clark &Watkins, 1978) and in the free form in the extracellularenvironment of certain bacteria (Boulton, 1989), butfree fatty alcohols in fungi were only recently reportedfor the ®rst time by Doss (1999).
The fatty acid (FA) composition of the simple lipidclasses was more complex (Table 1) than expected,considering what is known about the FA compositionof fungal lipids (Weete, 1980; Harwood & Russell,1984). The most abundant saturated FAs in all classeswere palmitic (C16:0, ca. 30%), and stearic acid(C18:0, ca. 22%). There was a relatively a high pro-portion of free palmitoleic (C16:1, ca. 21%) and oleic(C18:1, ca. 24%) acids; whereas in the MAG, DAG,TAG classes and the FAWE fraction, the palmitoleic(ca. 3%) and oleic acids (ca. 2%) comprised a muchsmaller proportion of the total FAs. Unlike the FFAor the FAWE, the acylglycerides contained ca. 4% ofeach of the unsaturated FAs linoleic acid (C18:2) anderucic acid (C22:1). Also somewhat unusual is the pro-portion of long chain fatty acids (C20:0 to C28:0)found in the MAG (ca. 24%), DAG (ca. 29%) andTAG (ca. 51%) classes. Generally, very long chainfatty acids (
%
$C20:0) are a minor component of the fun-gal fatty acids (Harwood & Russell, 1984), althoughconidia of Erysiphe graminis were found to contain ahigh proportion (90%) of long chain FAs (Senior,Hollomon & Holloway, 1993), and an albino mutantof Monascus purpureus has been reported to contain36% long chain FAs (Juzlova, Rezanka, Martinkova& Kren, 1996). Six fatty acids were identi®ed whichhad odd-numbered carbon chain lengths (C15:0,C17:0, C19:0, C21:0, C23:0 and C25:0). Of these, thepentacosanoic (C25:0) acid made up almost 14% ofthe fatty acids in the acylglycerides.
Three di�erent methyl-branched chain fatty acidswere identi®ed in the ECM: isopalmitic (15-CH3
C16:0), isoheptadecanoic (16-CH3 C17:0) and anteiso-
Table 2
Relative composition (area%) of fatty alcohols found in each of the simple lipid classes from the extracellular matrix of B. cinerea germlingsa
Fatty alcohol Simple lipid classes
Free fatty alcohols (FFAL) Wax esters (fatty alcohol fraction) (FALWE)$
16:0 57.1 (7.9) 3.7 (0.9)
18:0 42.9 (7.9) 4.6 (2.0)
20:0 n.d.b 47.2 (11.8)
21:0 n.d. 8.7 (3.1)
22:0 n.d. 5.9 (3.7)
28:0 n.d. 29.9 (7.8)
a Each value is the mean (2s.e.) of three or four ($) GC-FID determinations carried out on a pooled sample of three lipid extractions.b n.d. Ð not detected.
L.L.D. Cooper et al. / Phytochemistry 53 (2000) 293±298 295

palmitic (14-CH3 C16:0). Isopalmitic acid was found insmall amounts (ca. 2%) in the TAGs and FAWEs.There was ca. 1% isoheptadecanoic acid in the MAGand DAG classes. Anteisopalmitic acid was found inthe MAGs, DAGs and FAWEs (ca. 2%). Methyl-branched chain fatty acids are common in bacteria(Weete, 1980), and have also been known to occur infungi, for example Pithomyces chartarum,Cylindrocarpon radicicola and Stemphylin dendriticum(Hartman, Hawke, Morice & Shorland, 1960;Hartman, Morice & Shorland, 1962).
Fatty alcohols were identi®ed in the ECM in boththe free form (FFAL) and esteri®ed to fatty acids inthe WE class (FALWE) (Table 2). Of the fatty alco-hols identi®ed, only palmityl (C16:0) and stearyl(C18:0) alcohols were found in the free form (ca. 57%and 43%, respectively). The FFAL class also con-tained appreciable amounts of FAs, primarily palmiticand stearic acids. This may have been a result of FAscomigrating with the FFALs during TLC separation.A similar situation was observed when the palmitylalcohol standard was eluted from a mixture of stan-dards separated by TLC. After derivatization and GC-MS analysis, we observed a considerable amount ofpalmitic acid in the standard as well.
The FALWE fraction contained approximately 47%arachidyl alcohol (C20:0) and 30% octacosanol(C28:0). Wax esters composed of long chain fatty acidsand fatty alcohols (C28:0 to C36:0) constitute a majornon-glyceride portion of fungal lipids (Weete, 1980).We also observed a considerable amount of FAs in theFALWE fraction. The FAs may not have been com-pletely separated from fatty alcohols during partition-ing of the hydrolyzed wax ester. In the FALWE, mostof the FA found in the sample was behenic (C22:0). Ina separate GC-MS analysis, we detected that the OA-PE standard was contaminated with a number of fattyacids. Carryover of fatty acids, primarily palmitic andoleic acids into the palmityl alcohol fraction (as aresult of incomplete partitioning) was observed whenthe wax ester standard (palmityl oleate) was subjectedto chromatographic separation, elution, derivatizationand GC-MS analysis.
One spot on the TLC plate did not correspond toany of the simple lipid standards tested (including waxester or cholesterol oleate). The Rf of the unidenti®edmaterial was slightly higher than those of the waxester unknowns and standards. Although the spots onthe TLC plate shown in Fig. 1 were not well resolved,they, in fact, represent two di�erent fractions. The sep-aration is more apparent when there is less lipidextract loaded on the TLC plates, as in Doss (1999).The high Rf unknown was hydrolyzed and the saponi-®able fraction was partitioned from the diethyl ether-soluble nonsaponi®able components and methylated.It was found to contain a variety of FAs, the most
abundant one being the branched chain FA, anteiso-palmitic and appreciable amounts of palmitic and stea-ric acids. Almost half of the FAs were 20 carbons inlength or longer. TMSi derivatives for GC-MS analysiswere made from the nonsaponi®able fraction and itwas found to contain a mixture of FAs and FALs.The most abundant FA was pentacosanoic acid, withpalmitic, stearic and behenic acids as well. The follow-ing FALs were found in the mixture; behenyl, heneico-sanyl (C21:0), palmityl, stearyl and arachidyl. Basedupon the migration of this material on TLC and theanalysis of its chemical composition, we have con-cluded that it is probably neither a sterol ester nor awax ester.
3. Experimental
3.1. Fungal culture
An isolate of B. cinerea (Bc-1) used in earlier studieswas cultured on potato dextrose agar as described pre-viously (Doss et al., 1993; Doss, 1999). This isolate hasbeen provided to the American Type CultureCollection (accession number 204446).
3.2. Collection of ECM
Extracellular matrix preparations were obtained asdescribed in Doss (1999), with the following modi®-cations. Glass microscope slides inoculated with 1.5 mlconidial suspension (in 0.1 � potato dextrose broth)were incubated at 18±208C and 100% relative humid-ity under a near UV light (Doss et al., 1993). Isolationof the ECM was accomplished as described previously(Doss, 1999). Samples for lipid analysis were dried invacuo and stored at ÿ208C. Dried ECM preparationswere weighed using a Cahn-31 microbalance.
3.3. Extraction of lipids
Total lipids were extracted using CHCl3:MeOH (2:1)(Christie, 1989). Extracted lipids were taken to drynessat 408C with a stream of N2 and reconstituted in 25 mlCHCl3. Lipid extracts, if not analyzed immediately,were stored at ÿ208C under N2 until required. All sol-vents used in the extraction, separation, elution andchromatographic steps contained 50 ppm butylatedhydroxytoluene (BHT) as an antioxidant (Christie,1989).
3.4. Lipid separations
Prep. TLC was carried out in one dimension usingsilica gel plates (150 AÊ , 250 mm layer thickness). Lipidsextracted from ca. 1 mg ECM were spotted onto TLC
L.L.D. Cooper et al. / Phytochemistry 53 (2000) 293±298296

plates that had been prewashed with CHCl3:MeOH(1:1). Simple lipid standards were spotted alongside theextract. Separation of the simple lipid classes wasachieved using a hexanes:Et2O:HCO2H (80:20:2) sol-vent system. After development, the lanes containingthe standards were removed (by breaking the plate)from the TLC plate and visualized by spraying withH2SO4:MeOH (1:1) and charring. The locations ofsimple lipid classes were identi®ed by comparison withthe migration of the charred standards. After scrapingthe separated ECM lipid fractions from the TLCplates, they were eluted from the silica gel withEtOAc. Eluted lipids were taken to dryness at 408Cwith a stream of N2 and reconstituted in 25 mlCH2Cl2. Extracts not analyzed immediately werestored at ÿ208C under N2 until needed. Standard com-pounds (monopalmitin, dipalmitin, tripalmitin, palmi-tyl oleate and palmityl alcohol) were eluted from prep.TLC plates after separation and derivatized for GC-MS analyses.
3.5. Preparation of derivatives
Fatty acid methyl esters were prepared from freefatty acids (FFA) and from fatty acid fraction(FAWE) of the wax esters by reacting with etherealCH2N2. Mono-, di- and tri-acylglycerols (MAG,DAG, TAG) were transesteri®ed using 5% methanolicHCl (Christie, 1989). Before GC-MS analysis, thetransesteri®ed samples were treated with etherealCH2N2 to ensure all FAs were in the methyl esterform. Wax esters were hydrolyzed by re¯uxing with 1M KOH in 95% EtOH. The fatty alcohol fraction(FALWE) was partitoned from the hydrolyzate bydiethyl ether extraction and derivatized. The hydroly-zate was then acidi®ed and the fatty acids were parti-tioned out by diethyl ether extraction and methylated(Christie, 1989). TMSi derivatives of FFAL andthe FALWE fraction were prepared usingTMSCl:HMDS:pyridine (1:3:9). A second derivatiza-tion step was carried out using 1% TMSCl in BSTFAbefore GC-MS analysis.
3.6. Gas chromatography
The derivatized lipid samples were analyzed on anSPB-1 WCOT, capillary column (30 m, 0.25 mm i.d.,0.25 mm ®lm thickness) with an FID (3008C), con-nected to an HP Chemstation (Version 3.02) integra-tor. The operating conditions were as follows; 1 mlinjections in CH2Cl2 (splitless, inlet temperature2808C) using He carrier gas at 3.7 ml minÿ1 (temp.program: 1508C for 4 min, increased 48C minÿ1 to3008C and held for up to 20 min). Individual fattyacid methyl esters and TMSi ethers were identi®ed bycomparison with authentic standards. Initially, three
independent sets of simple lipid derivatives (one setfrom each of three prep. TLC analyses) were analyzedindependently using GC-FID. After determining thatall three preparations yielded similar fatty acid andfatty alcohol pro®les, the three sets were pooled inorder to have su�cient sample for mass spectral analy-sis. Relative mass% of the components of each simplelipid class was determined. Means and s.e. are basedon three (MAG, DAG, FAWE, FFAL) or four (FFA,TAG, FALWE) replicate runs on the GC-FID.Unknown compounds were identi®ed by comparingtheir retention times to those of authentic standards.
3.7. Mass spectrometry
Mass spectral analysis was performed on a GC-MSwith a DB-5 WCOT, capillary column (60 m, 0.25 mmi.d., 0.25 mm ®lm thickness), using a temperature pro-gram as follows: 1508C for 4 min, then increasing 78Cper minute to 2808C, and held for 40 min. Sampleswere introduced in hexanes using 1 ml injections (split-less, inlet temp. 2508C) using He carrier gas at 1.3 mlminÿ1 (ionization energy; 70 eV). The mass spectrawere analyzed using a Wiley 275 library using HPChemstation software (version 3.01). The mass spectraof the unknown compounds were compared to thoseof authentic standards for identi®cation.
References
Boulton, C. A. (1989). In C. Ratledge, & S. G. Wilkinson, Microbial
lipids, 2 (pp. 667±690). London: Academic Press.
Christie, W. W. (1982). Lipid analysis (2nd ed.). Oxford, UK:
Pergamon Press.
Christie, W. W. (1989). Gas chromatography and lipids; a practical
guide. Ayr, Scotland: The Oily Press.
Clark, T., & Watkins, D. A. M. (1978). Phytochemistry, 17, 943.
Clement, J. A., Butt, T. M., & Beckett, A. (1993). Mycol. Res, 97,
594.
Cole, L., Dewey, F. M., & Hawes, C. R. (1996). Mycol. Res, 100,
277.
Coley-Smith, J. R. (1980). In J. R. Coley-Smith, K. Verhoe�, & W.
R. Jarvis, The biology of botrytis (p. vii). London: Academic
Press.
Doss, R. P. (1999). Appl. Environ. Microbiol, 65, 404.
Doss, R. P., Potter, S. W., Christian, J. K., & Fukunaga, L. E.
(1995). Appl. Environ. Microbiol, 61, 260.
Doss, R. P., Potter, S. W., Chastagner, G. A., & Christian, J. K.
(1993). Appl. Environ. Microbiol, 59, 1786.
Doss, R. P., Christian, J. K., & Chastagner, G. A. (1988). Can. J.
Bot, 66, 1204.
Epstein, L., & Nicholson, R. (1994). In G. C. Carroll, & P.
Tudzynski, Plant relationships (pp. 11±25). New York: Springer±
Verlag.
Hartman, L., Morice, I. M., & Shorland, F. B. (1962). Biochem. J,
82, 76.
Hartman, L., Hawke, J. C., Morice, I. M., & Shorland, F. B. (1960).
Biochem. J, 75, 274.
Harwood, J. L., & Russell, N. J. (1984). Lipids in plants and mi-
crobes. London: George Allen and Unwin.
L.L.D. Cooper et al. / Phytochemistry 53 (2000) 293±298 297

Jones, E. B. G. (1994). Mycol. Res, 98, 961.
Juzlova, P., Rezanka, T., Martinkova, L., & Kren, V. (1996).
Phytochemistry, 43, 151.
Kuo, K. C., & Hoch, H. C. (1995). Mycologia, 87, 759.
Moloshok, T. D., Leinhos, G. M. E., Staples, R. C., & Hoch, H. H.
(1993). Mycologia, 85, 392.
Moloshok, T. D., Terhune, B. T., Lamboy, J. S., & Hoch, H. C.
(1994). Mycologia, 86, 787.
Nicholson, R. L. (1996). In M. Nicole, & V. Gianinazzi-Pearson,
Ultrastructure and molecular cytology of plant±microorganism
interactions (pp. 117±134). Dordrecht, The Netherlands:
Kluwer.
Nicholson, R. L., & Moraes, W. B. C. (1980). Phytopathology, 70, 255.
Senior, I. J., Hollomon, D. W., & Holloway, P. J. (1993).
Phytochemistry, 34, 65.
Sugui, J. A., Leite, B., & Nicholson, R. L. (1998). Physiol. Mol.
Plant Pathol, 52, 411.
Ward, H. M. (1888). Ann. Bot, 2, 319.
Weete, J. D. (1980). Lipid biochemistry of fungi and other organisms.
New York: Plenum Press.
L.L.D. Cooper et al. / Phytochemistry 53 (2000) 293±298298

Two ¯avonoid glycosides from Chenopodium murale
Ahmed A. Gohara,*, Galal T. Maatooqa, Masatake Niwab
aDepartment of Pharmacognosy, Faculty of Pharmacy, Mansoura University, Mansoura 35516, EgyptbDepartment of Medicinal Resources Chemistry, Faculty of Pharmacy, Meijo University, Tempaku, Nagoya 4688503, Japan
Received 23 June 1999; accepted 23 June 1999
Abstract
Two new triglycosides, kaempferol-3-O-{(4-b-D-apiofuranosyl)-a-L-rhamnopyranoside}-7-O-a-L-rhamnopyranoside andkaempferol-3-O-{(4-b-D-xylopyranosyl)-a-L-rhamnopyranoside}-7-O-a-L-rhamnopyranoside were isolated from the methanol
extract of Chenopodium murale, together with a known diglycoside, kaempferol-3-O-b-D-glucopyranoside-7-O-a-L-rhamnopyranoside. The characterization of the three compounds was achieved by various spectroscopic methods. # 2000Elsevier Science Ltd. All rights reserved.
Keywords: Chenopodium murale; Chenopodiaceae; Flavonoids; Flavonols; Kaempferol; Glycosides
1. Introduction
In the previous paper, the presence of ¯avonoidshaving dose-related hypotensive activity was reportedin Chenopodium murale L. (Gohar & Elmazar, 1997).TLC and gravity column chromatography of theBuOH fraction a�orded three ¯avonoids, one of themwas identi®ed as kaempferol-3,7-dirhamnoside. Theidentity of the other two compounds was not veri®ed(Gohar & Elmazar, 1997). In this report, a full analysisof these ¯avonoids is presented.
2. Results and discussion
TLC and gravity column chromatography of theBuOH fraction of the methanolic extract ofChenopodium murale L. a�orded three ¯avonoids.Kaempferol-3,7-dirhamnoside 1 in addition to com-pounds 2 and 3 were obtained (Gohar & Elmazar,1997). Compound 2 was proved to be a mixture byNMR experiments. The TLC of 2 using chromato-graphic system A (Gohar & Elmazar, 1997), doubledevelopment, resulted in resolution of 2 into two com-
pounds (Rf 0.53 and 0.51). RpC18 Ð TLC of 2 using40% aqueous methanol resolved it into two com-ponents which were isolated by preparative reversedphase HPLC using 45% aqueous methanol as mobilephase by isocratic elution (Carotenuto, Fattorusso,Lanzotti, Magno, de Feo, Cicala, 1997). The resolvedcompounds were noted as 2A (Rt 2.82; TLC, systemA, Rf 0.53, double run) and 2B (Rt 7.55, TLC systemA, Rf 0.51 double run). Compound 2A was identi®edas kaempferol-3-O-b-D-glucopyranoside-7-O-a-L-rham-noside. Its identity was veri®ed by comparison of itsspectral data with those reported in the literature(Markham & Mahan Chari, 1982; Kowalewski &Wierzbicka, 1971; Mabry, Markham & Thomas, 1970;Gieger & Schwinger, 1980; Markham, Ternai, Stanley,Geiger & Mabry, 1978).
The IR spectrum of compound 2B showed strongabsorption bands at 3420 (OH), 1610 (C.O), 2950 (C±H), 1650 (C.C, aromatic), and broad band at 1130±1000 cmÿ1 indicating its glycosidic nature (Jain,Sarwar-Alam, Kamil, Ilyas, Niwa & Sakae, 1990). Itsreaction (¯uorescent yellow in UV with AlCl3) and UVspectral data with diagnostic shift reagents (Mabry etal., 1970; Markham & Mabry, 1975) suggested thelikely presence of 3,7-disubstituted ¯avonol glycosidewith free hydroxyl groups at 5 and 4 '-positions. Twointermediate spots were detected upon mild acid hy-
Phytochemistry 53 (2000) 299±303
0031-9422/00/$ - see front matter # 2000 Elsevier Science Ltd. All rights reserved.
PII: S0031-9422(99 )00525 -7
www.elsevier.com/locate/phytochem
* Corresponding author.
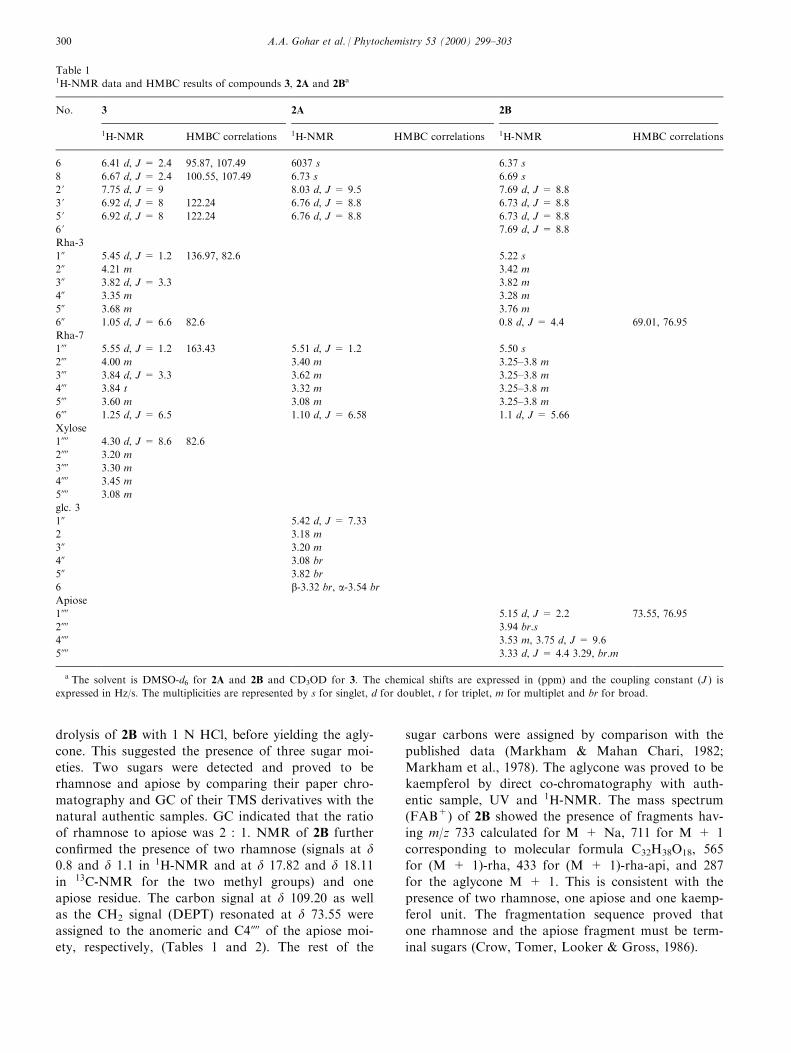
drolysis of 2B with 1 N HCl, before yielding the agly-
cone. This suggested the presence of three sugar moi-
eties. Two sugars were detected and proved to be
rhamnose and apiose by comparing their paper chro-
matography and GC of their TMS derivatives with the
natural authentic samples. GC indicated that the ratio
of rhamnose to apiose was 2 : 1. NMR of 2B further
con®rmed the presence of two rhamnose (signals at d0.8 and d 1.1 in 1H-NMR and at d 17.82 and d 18.11
in 13C-NMR for the two methyl groups) and one
apiose residue. The carbon signal at d 109.20 as well
as the CH2 signal (DEPT) resonated at d 73.55 were
assigned to the anomeric and C42 of the apiose moi-
ety, respectively, (Tables 1 and 2). The rest of the
sugar carbons were assigned by comparison with the
published data (Markham & Mahan Chari, 1982;
Markham et al., 1978). The aglycone was proved to be
kaempferol by direct co-chromatography with auth-
entic sample, UV and 1H-NMR. The mass spectrum
(FAB+) of 2B showed the presence of fragments hav-
ing m/z 733 calculated for M + Na, 711 for M + 1
corresponding to molecular formula C32H38O18, 565
for (M + 1)-rha, 433 for (M + 1)-rha-api, and 287
for the aglycone M + 1. This is consistent with the
presence of two rhamnose, one apiose and one kaemp-
ferol unit. The fragmentation sequence proved that
one rhamnose and the apiose fragment must be term-
inal sugars (Crow, Tomer, Looker & Gross, 1986).
Table 11H-NMR data and HMBC results of compounds 3, 2A and 2Ba
No. 3 2A 2B
1H-NMR HMBC correlations 1H-NMR HMBC correlations 1H-NMR HMBC correlations
6 6.41 d, J = 2.4 95.87, 107.49 6037 s 6.37 s
8 6.67 d, J = 2.4 100.55, 107.49 6.73 s 6.69 s
2 ' 7.75 d, J = 9 8.03 d, J = 9.5 7.69 d, J = 8.8
3 ' 6.92 d, J = 8 122.24 6.76 d, J = 8.8 6.73 d, J = 8.8
5 ' 6.92 d, J = 8 122.24 6.76 d, J = 8.8 6.73 d, J = 8.8
6 ' 7.69 d, J = 8.8
Rha-3
10 5.45 d, J = 1.2 136.97, 82.6 5.22 s
20 4.21 m 3.42 m
30 3.82 d, J = 3.3 3.82 m
40 3.35 m 3.28 m
50 3.68 m 3.76 m
60 1.05 d, J = 6.6 82.6 0.8 d, J = 4.4 69.01, 76.95
Rha-7
11 5.55 d, J = 1.2 163.43 5.51 d, J = 1.2 5.50 s
21 4.00 m 3.40 m 3.25±3.8 m
31 3.84 d, J = 3.3 3.62 m 3.25±3.8 m
41 3.84 t 3.32 m 3.25±3.8 m
51 3.60 m 3.08 m 3.25±3.8 m
61 1.25 d, J = 6.5 1.10 d, J = 6.58 1.1 d, J = 5.66
Xylose
12 4.30 d, J = 8.6 82.6
22 3.20 m
32 3.30 m
42 3.45 m
52 3.08 m
glc. 3
10 5.42 d, J = 7.33
2 3.18 m
30 3.20 m
40 3.08 br
50 3.82 br
6 b-3.32 br, a-3.54 br
Apiose
12 5.15 d, J = 2.2 73.55, 76.95
22 3.94 br.s
42 3.53 m, 3.75 d, J = 9.6
52 3.33 d, J = 4.4 3.29, br.m
a The solvent is DMSO-d6 for 2A and 2B and CD3OD for 3. The chemical shifts are expressed in (ppm) and the coupling constant (J ) is
expressed in Hz/s. The multiplicities are represented by s for singlet, d for doublet, t for triplet, m for multiplet and br for broad.
A.A. Gohar et al. / Phytochemistry 53 (2000) 299±303300
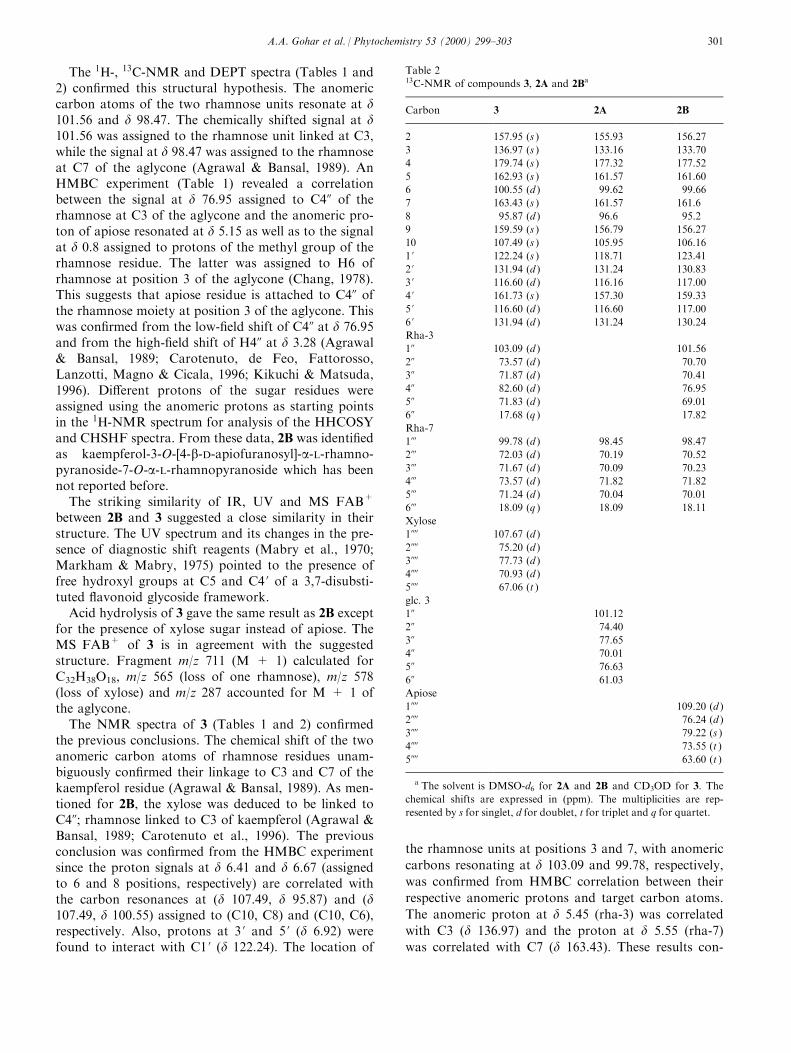
The 1H-, 13C-NMR and DEPT spectra (Tables 1 and2) con®rmed this structural hypothesis. The anomericcarbon atoms of the two rhamnose units resonate at d101.56 and d 98.47. The chemically shifted signal at d101.56 was assigned to the rhamnose unit linked at C3,while the signal at d 98.47 was assigned to the rhamnoseat C7 of the aglycone (Agrawal & Bansal, 1989). AnHMBC experiment (Table 1) revealed a correlationbetween the signal at d 76.95 assigned to C40 of therhamnose at C3 of the aglycone and the anomeric pro-ton of apiose resonated at d 5.15 as well as to the signalat d 0.8 assigned to protons of the methyl group of therhamnose residue. The latter was assigned to H6 ofrhamnose at position 3 of the aglycone (Chang, 1978).This suggests that apiose residue is attached to C40 ofthe rhamnose moiety at position 3 of the aglycone. Thiswas con®rmed from the low-®eld shift of C40 at d 76.95and from the high-®eld shift of H40 at d 3.28 (Agrawal& Bansal, 1989; Carotenuto, de Feo, Fattorosso,Lanzotti, Magno & Cicala, 1996; Kikuchi & Matsuda,1996). Di�erent protons of the sugar residues wereassigned using the anomeric protons as starting pointsin the 1H-NMR spectrum for analysis of the HHCOSYand CHSHF spectra. From these data, 2B was identi®edas kaempferol-3-O-[4-b-D-apiofuranosyl]-a-L-rhamno-pyranoside-7-O-a-L-rhamnopyranoside which has beennot reported before.
The striking similarity of IR, UV and MS FAB+
between 2B and 3 suggested a close similarity in theirstructure. The UV spectrum and its changes in the pre-sence of diagnostic shift reagents (Mabry et al., 1970;Markham & Mabry, 1975) pointed to the presence offree hydroxyl groups at C5 and C4 ' of a 3,7-disubsti-tuted ¯avonoid glycoside framework.
Acid hydrolysis of 3 gave the same result as 2B exceptfor the presence of xylose sugar instead of apiose. TheMS FAB+ of 3 is in agreement with the suggestedstructure. Fragment m/z 711 (M + 1) calculated forC32H38O18, m/z 565 (loss of one rhamnose), m/z 578(loss of xylose) and m/z 287 accounted for M + 1 ofthe aglycone.
The NMR spectra of 3 (Tables 1 and 2) con®rmedthe previous conclusions. The chemical shift of the twoanomeric carbon atoms of rhamnose residues unam-biguously con®rmed their linkage to C3 and C7 of thekaempferol residue (Agrawal & Bansal, 1989). As men-tioned for 2B, the xylose was deduced to be linked toC40; rhamnose linked to C3 of kaempferol (Agrawal &Bansal, 1989; Carotenuto et al., 1996). The previousconclusion was con®rmed from the HMBC experimentsince the proton signals at d 6.41 and d 6.67 (assignedto 6 and 8 positions, respectively) are correlated withthe carbon resonances at �d 107.49, d 95.87) and �d107.49, d 100.55) assigned to (C10, C8) and (C10, C6),respectively. Also, protons at 3 ' and 5 ' �d 6.92) werefound to interact with C1 ' �d 122.24). The location of
the rhamnose units at positions 3 and 7, with anomeric
carbons resonating at d 103.09 and 99.78, respectively,
was con®rmed from HMBC correlation between their
respective anomeric protons and target carbon atoms.
The anomeric proton at d 5.45 (rha-3) was correlated
with C3 �d 136.97) and the proton at d 5.55 (rha-7)
was correlated with C7 �d 163.43). These results con-
Table 213C-NMR of compounds 3, 2A and 2Ba
Carbon 3 2A 2B
2 157.95 (s ) 155.93 156.27
3 136.97 (s ) 133.16 133.70
4 179.74 (s ) 177.32 177.52
5 162.93 (s ) 161.57 161.60
6 100.55 (d ) 99.62 99.66
7 163.43 (s ) 161.57 161.6
8 95.87 (d ) 96.6 95.2
9 159.59 (s ) 156.79 156.27
10 107.49 (s ) 105.95 106.16
1 ' 122.24 (s ) 118.71 123.41
2 ' 131.94 (d ) 131.24 130.83
3 ' 116.60 (d ) 116.16 117.00
4 ' 161.73 (s ) 157.30 159.33
5 ' 116.60 (d ) 116.60 117.00
6 ' 131.94 (d ) 131.24 130.24
Rha-3
10 103.09 (d ) 101.56
20 73.57 (d ) 70.70
30 71.87 (d ) 70.41
40 82.60 (d ) 76.95
50 71.83 (d ) 69.01
60 17.68 (q ) 17.82
Rha-7
11 99.78 (d ) 98.45 98.47
21 72.03 (d ) 70.19 70.52
31 71.67 (d ) 70.09 70.23
41 73.57 (d ) 71.82 71.82
51 71.24 (d ) 70.04 70.01
61 18.09 (q ) 18.09 18.11
Xylose
12 107.67 (d )
22 75.20 (d )
32 77.73 (d )
42 70.93 (d )
52 67.06 (t )
glc. 3
10 101.12
20 74.40
30 77.65
40 70.01
50 76.63
60 61.03
Apiose
12 109.20 (d )
22 76.24 (d )
32 79.22 (s )
42 73.55 (t )
52 63.60 (t )
a The solvent is DMSO-d6 for 2A and 2B and CD3OD for 3. The
chemical shifts are expressed in (ppm). The multiplicities are rep-
resented by s for singlet, d for doublet, t for triplet and q for quartet.
A.A. Gohar et al. / Phytochemistry 53 (2000) 299±303 301

®rm the previous assignment based on the conclusionof Agrawal and Bansal (1989). The xylose moiety wasdeduced to be attached to C40 of the rhamnose at pos-ition-3 from HMBC correlation of its anomeric proton�d 4.3) with the rhamnose C40 �d 82.6) which, in turn,was correlated with the 6-methyl protons of rhamnoseat position-3. From these data, 3 was identi®ed askaempferol-3-O-(4-b-D-xylopyranosyl)-a-L-rhamnopyr-anoside-7-O-a-L-rhamnopyranoside.
From the chemotaxonomic point of view, the genusChenopodium contains both ¯avones and ¯avonols.Flavones are reported in C. graveolens (Mata,Navarrete, Alvarez, Pereda-Miranda, Delgado & Romode Vivar, 1987), methoxylated ¯avones in C. botrys (dePascual-T, Gonzalez, Vicente & Bellido, 1981), 3-O-sub-stituted ¯avonol glycosides in C. quinoa and C. ambro-sioides (Jain et al., 1990; de Simone, Dini, Pizza,Saturnino & Schettino, 1990). Concerning C. murale,this is the ®rst report for all the discussed compounds.The presence of apiose in C. murale supports the pre-vious reports of its presence in C.quinoa (de Simone etal., 1990) as well as in another genus in the familyChenopodiaceae; Spinacia (Aritomi, Komori &Kawasaki, 1986; Williams & Harborne, 1994).
3. Experimental
3.1. General
Mps uncorr., UV spectra were run in MeOH and IR
spectra in KBr discs. NMR spectra were run at 600MHz �1H� and 150 MHz �13C� in DMSO-d6 (com-pound 2A and 2B) or in CD3OD (compound 3) usingTMS as internal standard. MS were obtained byFAB+ at 70 eV. TLC was performed using silica gelGF254 (Merck), EtOAc±MeOH±H2O (100 : 15 : 10)mixture was used as solvent (A). Whatmann No. 1paper was used in PC, 15% AcOH and EtOAc±Pyridine±H2O (5 : 5 : 4) mixtures were used as solvents(B and C, respectively). AlCl3 (+UV 366 nm) and ani-line hydrogen phthalate spray reagents were used fordetection.
Plant materials, extraction, chromatography, andpreparation of fraction II (Gohar & Elmazar, 1997)Fraction II was subjected to repeated column chroma-tography (250 silica gel). Elution was done usingEtOAc±MeOH±H2O (100 : 10 : 5) mixture, 100 mlfractions were collected. Two groups of the resolvedcompounds were separately collected.
From the ®rst group (900 ml), compound 1 wasrecovered (Gohar & Elmazar, 1997). The secondgroup, following 1200 ml gave a residue (4.8 g) whichwas subjected to repeated column chromatography,using the same condition. From the ®rst 1200 ml elu-ate, compound 2 was obtained (2.8 g). From the next800 ml eluate, compound 3 was recovered by repeatedrecrystallization from MeOH (255 mg). RpC18 ÐTLC of 2 using 40% MeOH followed preparativereversed phase HPLC using 45% aqueous MeOHresulted in resolution of 2 into 2A (137 mg) and 2B(157 mg); Waters 600E-Millipore 6plepf504 attached towaters 486 Tunable Absorbence detector, column7.8 � 300 mm, C18 prep., lmax 345 nm, aufs 0.05, att.,variable 512±1024, ¯ow rate 4 ml/min, chart speed0.25 cm/min.
3.2. Kaempferol-3-O-b-D-glucopyranoside-7-O-a-L-rhamnopyranoside 2A
Pale yellow crystals, mp 2548C; �a�25D � ÿ748(MeOH: c 0.25); FAB-MS (positive ion) m/z 595 M +1; 617, M + Na; 433, (M + 1)-gluc; UV spectra, lmax
nm MeOH 210, 266, 347; + NaOMe 212, 266, 396; +AlCl3 212, 274, 301sh, 350, 397; + AlCl3±HCl 212,274, 301sh, 349, 397; + NaOAc 213, 266, 352; +NaOAc±H3BO3 213, 266, 352; IR. 3420 (OH), 2950(C±H), 1650 (C.C aromatic), 1610 (C.O), 1130±1000cmÿ1 (glycosidic linkage); NMR data (Tables 1 and 2).
3.3. Acid hydrolysis
An alcoholic solution (20 mg) was re¯uxed on boil-ing water bath with 1 N HCl. The solution was moni-tored by PC System B, time interval 5 min, for 1 h.The excess acid was precipitated with Ag2O, the alco-hol evaporated and the aglycone extracted with EtOAc
A.A. Gohar et al. / Phytochemistry 53 (2000) 299±303302
and recrystallized from methanol. The sugars in theaqueous solution were examined by PC (System C)and by GLC, and the aglycone was subjected to UVand 1H-NMR analysis.
3.4. GLC analysis of sugars
The neutral aqueous hydrolysates were silylated withBSFTA/TMS for 15 min at room temperature in pyri-dine. Silylated samples were subjected to GLC analy-sis: column BP5-25 m, 0.25 mm id; columntemperature 200±3008C; 58C/min; 20 min; dect, tem-perature 3008C (Fid); helium.
3.5. Identi®cation of aglycone (kaempferol)
Yellow needles, mp 2808C, UV lmax nm: MeOH265, 371; + NaOMe 263, 285, 359sh, 451; + AlCl3261, 300sh, 364, 426; + AlCl3±HCl 261, 300sh, 346sh,427; + NaOAc 262, 322sh, 384; + NaOAc±H3BO3
257, 314sh, 369. 1H-NMR d 8.07, d, J = 8.69 Hz(H2 ',6 '); d 6.89, d, J = 8.79 Hz (H3 ',5 '); d 6.39, d, J= 1.46 Hz (H8); d 6.17, d, J = 2.19 Hz (H6).
3.6. Kaempferol-3-O-[4-b-D-apiofuranosyl]-a-L-rham-nopyranoside-7-O-a-L-rhamnopyranoside 2B
Yellow crystals, mp 2248C; �a�25D � ÿ1818 (MeOH: c0.15), FAB-MS (positive ion) m/z 733 (13.5) M + Na,711 (10.18) M + 1, 565 (1), (M + 1)-rha, 433 (M +1)-rha-api, 287 (2.5) M + 1 for aglycone; UV spectralmax nm: MeOH 210, 265, 343; + NaOMe 211, 265,387 + AlCl3 212, 268, 398; + AlCl3±HCl 210, 267,343sh, 397; + NaOAc 210, 265, 343; + NaOAc±H3BO3 212, 265, 344; IR 3420 (OH), 2950 (C±H),1650 (C.C), 1610 (C.0), 1130±1000 cmÿ1 (glycosidiclinkage); NMR data (Tables 1 and 2). Acid hydrolysisand identi®cation of sugars and aglycone as compound2A.
3.7. Kaempferol-3-O-(4-b-D-xylopyranosyl)-a-L-rhamnopyranoside-7-O-a-L-rhamnoside 3
Pale yellow crystals, mp 2328C; �a�25D � ÿ1548(MeOH: c 0.114); FAB-MS (positive ion) m/z 711 (2.5)M + 1, 578 (10) (M + 1)-xyl, 565 (6.5) (M + 1)-rha,
287 M + 1 for aglycone; UV spectra lmax nm MeOH209, 265, 326+; + NaOMe 210, 247, 390; + AlCl3210, 247, 301sh, 349, 398; + AlCl3±HCl 210, 275,301sh, 344, 397; + NaOAc 214, 248, 350; + NaOAc±H3BO3 212, 247, 344; IR. 3420 (OH), 2950 (C±H),1650 (C.C), 1610 (C.O), 1130±1100 cmÿ1 (glycosidiclinkage); NMR experiments (Tables 1 and 2). Acid hy-drolysis and identi®cation of sugars and aglycone ascompound 2A.
References
Agrawal, P. K., & Bansal, M. C. (1989). Flavonoid glycosides. In P.
K. Agrawal, Carbon-13 NMR of ¯avonoids (p. 283). Amesterdam:
Elsevier.
Aritomi, M., Komori, T., & Kawasaki, T. (1986). Phytochemistry,
25, 231.
Carotenuto, A., de Feo, V., Fattorusso, E., Lanzotti, V., Magno, S.,
& Cicala, C. (1996). Phytochemistry, 41, 531.
Carotenuto, A., Fattorusso, E., Lanzotti, V., Magno, S., de Feo, V.,
& Cicala, C. (1997). Phytochemistry, 44, 949.
Chang, C. (1978). Lloydia, 41, 17.
Crow, W. F., Tomer, B. K., Looker, H. J., & Gross, L. M. (1986).
Anal. Biochem, 155, 286.
de Pascual-T, J., Gonzalez, S. M., Vicente, S., & Bellido, S. I.
(1981). Planta Medica, 41, 389.
de Simone, F., Dini, A., Pizza, C., Saturnino, P., & Schettino, O.
(1990). Phytochemistry, 29, 3690.
Gieger, H., & Schwinger, G. (1980). Phytochemistry, 19, 897.
Gohar, A. A., & Elmazar, M. M. A. (1997). Phytotherapy Research,
11, 564.
Jain, N., Sarwar-Alam, M., Kamil, M., Ilyas, M., Niwa, M., &
Sakae, A. (1990). Phytochemistry, 29, 3988.
Kikuchi, M., & Matsuda, N. (1996). J. Nat. Prod, 59, 314.
Kowalewski, Z., & Wierzbicka, K. (1971). Planta Medica, 20, 328.
Mabry, T. J., Markham, K. R., & Thomas, M. B. (1970). The sys-
tematic identi®cation of ¯avonoids. New York: Springer±Verlag.
Markham, K. R., & Mabry, T. J. (1989). In J. B. Harborne, T. J.
Mabry, & H. Mabry,. In The ¯avonoids, vol. 48. London:
Chapman and Hall.
Markham, K. R., & Mahan Chari, V. (1982). In J. B. Harborne, &
T. J. Mabry, The ¯avonoids: advances in research (p. 19). London:
Chapman and Hall.
Markham, K. R., Ternai, B., Stanley, R., Geiger, H., & Mabry, T. J.
(1978). Tetrahedron, 34, 1389.
Mata, R., Navarrete, A., Alvarez, L., Pereda-Miranda, R., Delgado,
G., & Romo de Vivar, A. (1987). Phytochemistry, 26, 191.
Williams, C. A., & Harborne, J. B. (1994). In J. B. Harborne, The
¯avonoids, advances in research since 1986 (p. 358). London:
Chapman and Hall.
A.A. Gohar et al. / Phytochemistry 53 (2000) 299±303 303
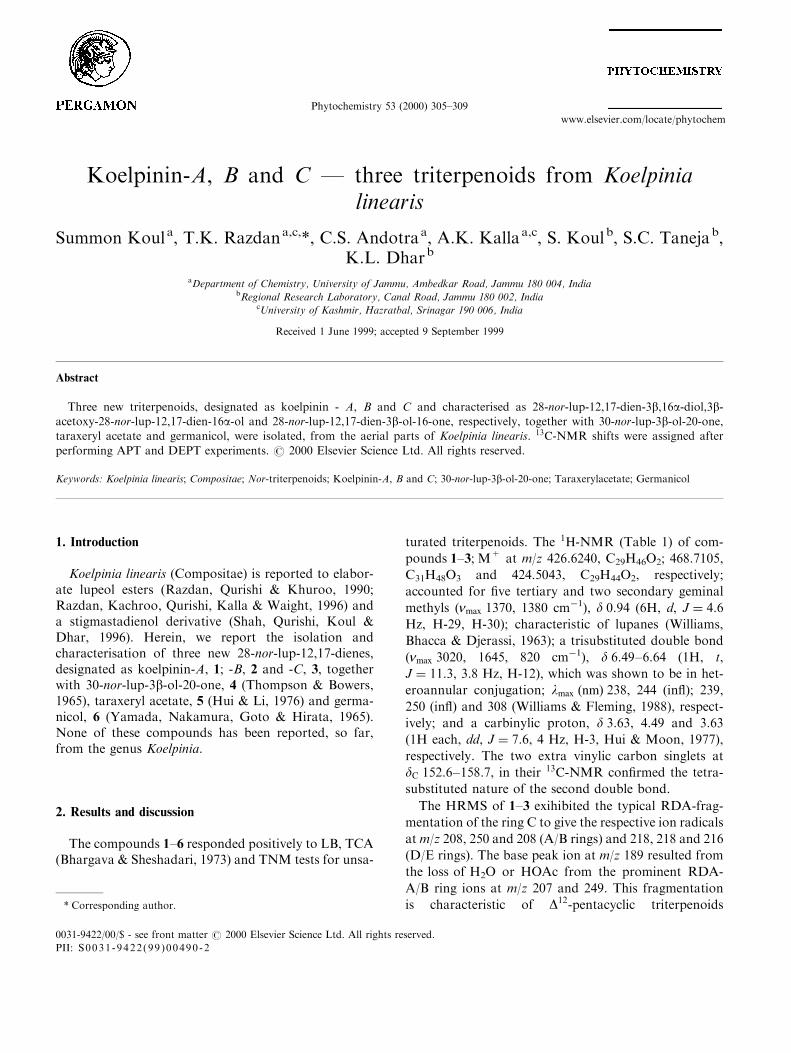
Koelpinin-A, B and C Ð three triterpenoids from Koelpinialinearis
Summon Koula, T.K. Razdana,c,*, C.S. Andotraa, A.K. Kallaa,c, S. Koulb, S.C. Tanejab,K.L. Dharb
aDepartment of Chemistry, University of Jammu, Ambedkar Road, Jammu 180 004, IndiabRegional Research Laboratory, Canal Road, Jammu 180 002, India
cUniversity of Kashmir, Hazratbal, Srinagar 190 006, India
Received 1 June 1999; accepted 9 September 1999
Abstract
Three new triterpenoids, designated as koelpinin - A, B and C and characterised as 28-nor-lup-12,17-dien-3b,16a-diol,3b-acetoxy-28-nor-lup-12,17-dien-16a-ol and 28-nor-lup-12,17-dien-3b-ol-16-one, respectively, together with 30-nor-lup-3b-ol-20-one,taraxeryl acetate and germanicol, were isolated, from the aerial parts of Koelpinia linearis. 13C-NMR shifts were assigned after
performing APT and DEPT experiments. # 2000 Elsevier Science Ltd. All rights reserved.
Keywords: Koelpinia linearis; Compositae; Nor-triterpenoids; Koelpinin-A, B and C; 30-nor-lup-3b-ol-20-one; Taraxerylacetate; Germanicol
1. Introduction
Koelpinia linearis (Compositae) is reported to elabor-ate lupeol esters (Razdan, Qurishi & Khuroo, 1990;Razdan, Kachroo, Qurishi, Kalla & Waight, 1996) anda stigmastadienol derivative (Shah, Qurishi, Koul &Dhar, 1996). Herein, we report the isolation andcharacterisation of three new 28-nor-lup-12,17-dienes,designated as koelpinin-A, 1; -B, 2 and -C, 3, togetherwith 30-nor-lup-3b-ol-20-one, 4 (Thompson & Bowers,1965), taraxeryl acetate, 5 (Hui & Li, 1976) and germa-nicol, 6 (Yamada, Nakamura, Goto & Hirata, 1965).None of these compounds has been reported, so far,from the genus Koelpinia.
2. Results and discussion
The compounds 1±6 responded positively to LB, TCA(Bhargava & Sheshadari, 1973) and TNM tests for unsa-
turated triterpenoids. The 1H-NMR (Table 1) of com-
pounds 1±3; M+ at m/z 426.6240, C29H46O2; 468.7105,
C31H48O3 and 424.5043, C29H44O2, respectively;
accounted for ®ve tertiary and two secondary geminal
methyls �nmax 1370, 1380 cmÿ1), d 0:94 (6H, d, J � 4:6Hz, H-29, H-30); characteristic of lupanes (Williams,
Bhacca & Djerassi, 1963); a trisubstituted double bond
�nmax 3020, 1645, 820 cmÿ1), d 6:49±6:64 (1H, t,
J � 11:3, 3.8 Hz, H-12), which was shown to be in het-
eroannular conjugation; lmax �nm� 238, 244 (in¯); 239,
250 (in¯) and 308 (Williams & Fleming, 1988), respect-
ively; and a carbinylic proton, d 3:63, 4.49 and 3.63
(1H each, dd, J � 7:6, 4 Hz, H-3, Hui & Moon, 1977),
respectively. The two extra vinylic carbon singlets at
dC 152:6±158:7, in their 13C-NMR con®rmed the tetra-
substituted nature of the second double bond.
The HRMS of 1±3 exihibited the typical RDA-frag-
mentation of the ring C to give the respective ion radicals
at m/z 208, 250 and 208 (A/B rings) and 218, 218 and 216
(D/E rings). The base peak ion at m/z 189 resulted from
the loss of H2O or HOAc from the prominent RDA-
A/B ring ions at m/z 207 and 249. This fragmentation
is characteristic of D12-pentacyclic triterpenoids
Phytochemistry 53 (2000) 305±309
0031-9422/00/$ - see front matter # 2000 Elsevier Science Ltd. All rights reserved.
PII: S0031-9422(99 )00490 -2
www.elsevier.com/locate/phytochem
* Corresponding author.

(Budzikiewicz, Wilson & Djerassi, 1963) and placed anoxygen function and the tetrasubstituted double bondin D/E rings and the second oxygen function (OH orOAc) in A/B rings, at the usual C-3 position. Thelupane skeleton, in 1±3, was forti®ed by the facile lossof C3H7
�from (M+-H2O), (M+-HOAc) and RDA-D/E
ring fragment ions (Thompson & Bowers, 1965). Thepresence of seven methyls only, their chemical shiftsand heteroannular conjugation besides MS placed thetetrasubstituted double bond at C-17 (18). Thus 1±3were derived from 28-nor-lup-12,17-diene and carried ahydroxyl or acetoxyl at C-3b equatorial position.
The compounds 1 and 2 displayed a down®eld car-binylic proton resonance signal at d 4:60 (1H, s ). 2resisted acetylation with Ac2O±C5H5N, at room tem-perature, but 1 formed monoacetate which was identi-cal (mp, cotlc, 1H-NMR) to 2. However, on heatingwith Ac2O±C5H5N both formed a diacetate 7, M+ atm/z 510.6398, C33H50O4, nmax 1730, 1740 cmÿ1, d 2:01,2.20 (3H each). On Sarett oxidation 2 readily gave theacetoxy ketone 8; M+ at m/z 466.6160, C31H46O3,dC 218:9 (C1O), 170.2, 21.3 (OAc) whose 1H-NMRdisplayed a doublet at d 2:66 (2H, J � 9:5 Hz, H-15).The chemical shift and multiplicity of the down®eldcarbinylic proton, the resistance to acetylation and theease of oxidation of 2 (Schreiber & Eschemnoser,1955; Grinner, 1960; Fried & Edwards, 1972; Razdan,Kachroo, Harkar & Koul, 1982) placed the hydroxylat C-16 a axial position in 1 and 2.
On treatment with Ac2O±C5H5N, at room tempera-ture, 3 formed a monoacetate which was identical to 8.On Sarett oxidation, it gave a diketone 9; M+ at m/z422.5924, C29H42O2, d 2:40 (2H, m, H-2), 2.68 (2H, d,
Table 11H-NMR shifts (CDCl3)
H 1 2 3 4 7 8 9 10
H-2 (m ) ± ± ± ± ± ± ± ±
H-3 (dd, J = 7.6, 4 Hz) 3.63 4.49 3.63 3.20 4.49 4.48 ± 4.48 (J = 9, 6.5 Hz)
H-11 (dd, W 1/2 = 8.4, 6 Hz) 2.40 2.40 2.46 ± 2.35 2.46 2.40 (submerged) ±
H-12 (t, J = 11.3, 3.8 Hz) 6.49 6.49 6.64 ± 6.54 6.64 6.23 (dd, J = 11.3, 3.8 Hz) ±
H-15 (d, J = 9.2 Hz) ± ± 2.66 ± ± 2.66 2.68 ±
H-16 (s ) 4.60 ± ± ± ± ± ± ±
H-19 (m ) 2.24 2.24 2.24 ± 2.26 2.24 2.20 ±
H-23 (s ) 0.84 0.85 0.84 0.80 0.85 0.85 0.90 0.80
H-24 (s ) 0.80 0.78 0.80 0.84 0.78 0.78 0.85 0.86
H-25 (s ) 0.97 0.98 0.95 0.88 0.98 0.98 0.80 0.88
H-26 (s ) 1.02 1.00 0.99 1.02 1.01 1.01 0.99 1.03
H-27 (s ) 1.24 1.28 1.36 0.97 1.23 1.30 1.33 0.97
H-28 (s ) ± ± ± 0.95 ± ± ± 0.78
H-29 (d, J = 4.6 Hz) 0.95 0.94 0.94 2.15 0.94 0.94 0.93 2.15
H-30 (d, J = 4.6 Hz) 0.95 0.94 0.94 ± 0.94 0.94 0.93 ±
OAc-3b ± 2.01 ± ± 2.01 2.01 ± ±
OAc-16a ± ± ± ± 2.20 ± ± ±
Table 213C-NMR chemical shifts (CDCl3)
dC 1 2 3 4 7 8 9
1 38.7 38.5 38.1 39.2 38.9 38.4 39.6
2 25.6 23.8 25.4 25.2 23.6 23.8 34.2
3 77.5 80.4 77.4 76.3 80.8 80.5 217.1
4 38.2 40.7 38.6 38.4 40.5 40.2 47.5
5 55.1 48.6 55.0 55.2 55.4 55.3 55.9
6 18.4 18.2 18.3 18.1 18.5 18.5 19.6
7 34.2 32.3 34.2 34.2 32.3 32.6 34.0
8 41.2 39.9 41.5 41.1 39.4 41.3 41.3
9 50.7 48.5 50.7 50.1 48.2 38.3 48.9
10 36.3 38.5 36.0 36.3 38.7 38.2 39.8
11 31.9 32.2 31.5 22.6 32.2 31.9 32.7
12 128.6 128.5 130.9 28.7 129.1 131.4 131.6
13 149.2 149.3 151.8 37.5 149.6 151.9 151.7
14 45.4 45.5 51.4 43.6 49.3 51.2 51.8
15 28.3 28.6 33.5 27.4 26.9 33.2 33.3
16 78.2 78.2 219.5 35.5 82.3 218.9 219.1
17 154.3 154.5 158.7 42.9 152.9 157.9 157.8
18 152.6 152.6 155.5 48.2 154.8 155.8 155.7
19 47.5 47.5 48.2 47.9 47.7 48.3 48.6
20 28.0 28.0 28.2 207.3 29.2 28.4 28.3
21 30.6 30.6 31.2 31.0 31.6 31.2 31.4
22 48.9 48.8 48.3 40.1 46.2 48.3 48.3
23 28.2 27.3 28.2 28.5 27.4 28.3 28.1
24 15.6 15.2 15.6 15.4 15.8 15.5 15.5
25 16.7 17.1 16.7 16.2 17.3 16.5 16.5
26 18.9 18.9 19.2 15.9 18.6 19.1 19.2
27 20.3 20.5 23.8 14.5 20.9 23.8 23.6
28 ± ± ± 18.4 ± ± ±
29 16.9 16.8 16.8 23.5 16.4 16.5 16.5
30 17.8 17.8 17.6 ± 17.8 17.4 17.5
OAc (3b) ± 170.0 (C1O) ± ± 170.4 170.2 ±
± 21.2 (CH3) ± ± 21.3 21.3 ±
OAc (16a) ± ± ± ± 172.2 ± ±
± ± ± ± 22.5 ± ±
S. Koul et al. / Phytochemistry 53 (2000) 305±309306
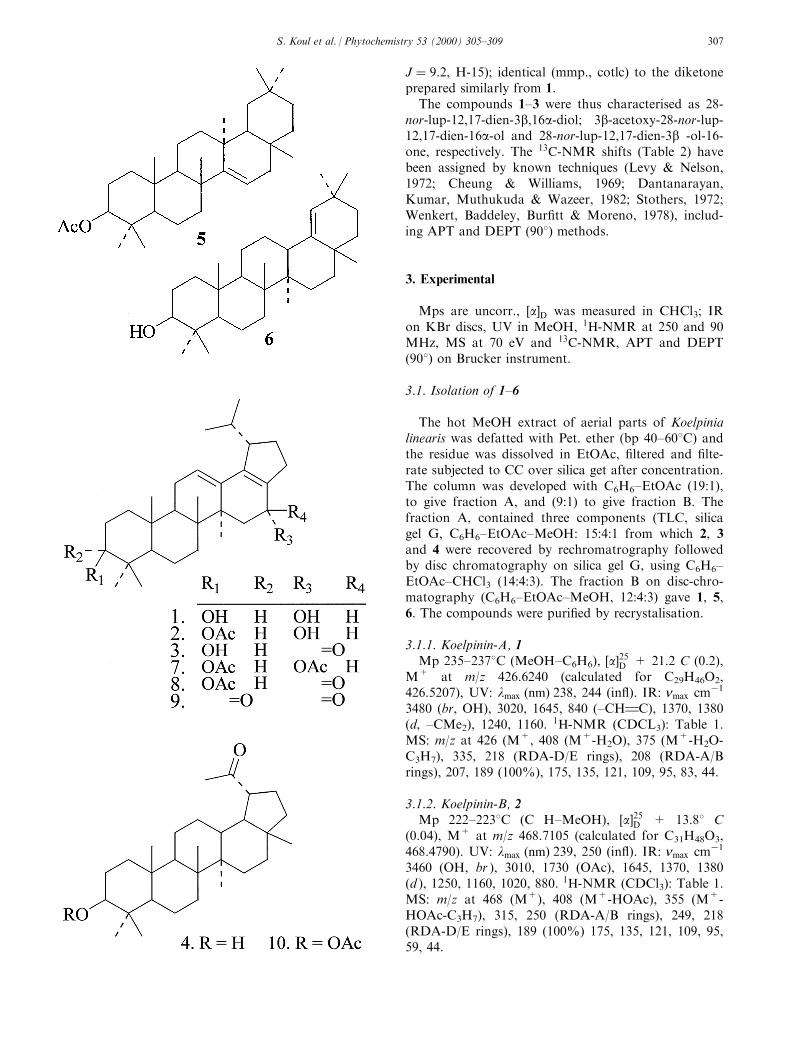
J � 9:2, H-15); identical (mmp., cotlc) to the diketoneprepared similarly from 1.
The compounds 1±3 were thus characterised as 28-nor-lup-12,17-dien-3b,16a-diol; 3b-acetoxy-28-nor-lup-12,17-dien-16a-ol and 28-nor-lup-12,17-dien-3b -ol-16-one, respectively. The 13C-NMR shifts (Table 2) havebeen assigned by known techniques (Levy & Nelson,1972; Cheung & Williams, 1969; Dantanarayan,Kumar, Muthukuda & Wazeer, 1982; Stothers, 1972;Wenkert, Baddeley, Bur®tt & Moreno, 1978), includ-ing APT and DEPT (908) methods.
3. Experimental
Mps are uncorr., �a�D was measured in CHCl3; IRon KBr discs, UV in MeOH, 1H-NMR at 250 and 90MHz, MS at 70 eV and 13C-NMR, APT and DEPT(908) on Brucker instrument.
3.1. Isolation of 1±6
The hot MeOH extract of aerial parts of Koelpinialinearis was defatted with Pet. ether (bp 40±608C) andthe residue was dissolved in EtOAc, ®ltered and ®lte-rate subjected to CC over silica get after concentration.The column was developed with C6H6±EtOAc (19:1),to give fraction A, and (9:1) to give fraction B. Thefraction A, contained three components (TLC, silicagel G, C6H6±EtOAc±MeOH: 15:4:1 from which 2, 3and 4 were recovered by rechromatrography followedby disc chromatography on silica gel G, using C6H6±EtOAc±CHCl3 (14:4:3). The fraction B on disc-chro-matography (C6H6±EtOAc±MeOH, 12:4:3) gave 1, 5,6. The compounds were puri®ed by recrystalisation.
3.1.1. Koelpinin-A, 1Mp 235±2378C (MeOH±C6H6), �a�25D + 21.2 C (0.2),
M+ at m/z 426.6240 (calculated for C29H46O2,426.5207), UV: lmax �nm� 238, 244 (in¯). IR: nmax cmÿ1
3480 (br, OH), 3020, 1645, 840 (±CH1C), 1370, 1380(d, ±CMe2), 1240, 1160.
1H-NMR (CDCL3): Table 1.MS: m/z at 426 (M+, 408 (M+-H2O), 375 (M+-H2O-C3H7), 335, 218 (RDA-D/E rings), 208 (RDA-A/Brings), 207, 189 (100%), 175, 135, 121, 109, 95, 83, 44.
3.1.2. Koelpinin-B, 2Mp 222±2238C (C H±MeOH), �a�25D + 13.88 C
(0.04), M+ at m/z 468.7105 (calculated for C31H48O3,468.4790). UV: lmax �nm� 239, 250 (in¯). IR: nmax cmÿ1
3460 (OH, br ), 3010, 1730 (OAc), 1645, 1370, 1380(d ), 1250, 1160, 1020, 880. 1H-NMR (CDCl3): Table 1.MS: m/z at 468 (M+), 408 (M+-HOAc), 355 (M+-HOAc-C3H7), 315, 250 (RDA-A/B rings), 249, 218(RDA-D/E rings), 189 (100%) 175, 135, 121, 109, 95,59, 44.
S. Koul et al. / Phytochemistry 53 (2000) 305±309 307

3.1.3. Koelpinin-C, 3Mp 208±2098C (C6H6±MeOH), �a�25D + 6.5 C (0.01),
M+ at m/z 424.5043 (calculated for C29H44O2
424.3341). UV: lmax 308 nm. IR: nmax cmÿ1 3440 (OH),3010, 1705 (C1O), 1650, 1370, 1380, 1250, 1020, 870.1H-NMR (CDCl3): Table 1. MS: m/z at 422 (M+), 404(M+-H2O), 361, 216 (RDA-D/E rings), 208 (RDA-A/B rings), 207 (RDA-A/B+), 189 (100%) 173, 133, 123,119, 95, 44.
3.2. Acetylation of 1, 2, 3
1, 2 and 3 in C5H5N (2 ml) were treated with Ac2O(3 ml) and left overnight, at room temperature Afterusual work up 1 formed monoacetate identical with 2;2 did not undergo any change. The compound 3 gavemonoacetate 8, mp 189±1908C, M+ at m/z 466.6160(calculated for C31H46O3, 466.2401). UV: lmax 307 nm.IR: nmax cmÿ1 3050, 1730, 1650, 1370, 1360, 1250,1020, 870. 1H-NMR: Table 1. MS: m/z at 466, 406(M+-HOAc), 363, 323, 295, 250, 249, 216, 189(100%), 173, 133, 105, 81, 44.
The compound 2 and monoacetate of 1 were heatedwith C5H5N and Ac2O, on a water bath for 6 h. Afterusual work up colourless crystals of 7, mp 216±2178C,M+ at m/z 510.6398 (calculated for C33H50O4;510.7406) were recovered UV: lmax 247, 250 (in¯.) nm.IR: nmax cmÿ1 3010, 1730, 1740 (2 � AOC), 1645,1380, 1370, 1245, 870. 1H-NMR (CDCl3): Table 1.MS: m/z at 510 (M+), 450, (M+-HOAc), 407 (M+-HOAc-C3H7
�), 367, 260 (RDA, D/E rings), 250, 249,
(RDA-A+/B rings), 217, 189 (100%), 177, 135, 109,59, 44.
3.3. Sarett oxidation of 1, 2 and 3
1, 2 and 3 in CHCl3 were stirred with freshly pre-pared CrO3±C5H5N complex at room temperature for2 h. After usual work up the products were recoveredand crystalised from petrol±MeOH. 1 and 3 gave iden-tical diketone 9, mp 185±1868C, M+ at m/z 422.5924(calculated for C29H42O2, 422.4730). UV: lmax 310, 260(in¯.) nm. IR: nmax cmÿ1 3015, 1705, 1695, 1640, 1370,1360, 1045, 890. 1H-NMR (CDCl3): Table 1. MS: 422(M+), 407 (M+-CH3), 394 (M+-CH3-CO
�), 379, 216
(RDA-D/E), 206 (RDA-A/B) 205 (100%), 190, 173,162, 133, 113, 105, 95, 94, 44. The compound 2 formeda monoketone, mp 189±1908C, which had UV, IR, 1H-NMR and MS similar to 8. Its identity was con®rmedby Co-TLC and mmp.
3.3.1. 30-nor-lupan-3b-ol-20-one, 4Mp 238±2398C, lit. (Thompson & Bowers, 1965)
237±2398C �a�25D ÿ 10.2 (C.O. 30), M+ at m/z 428.4996(calculated for C29H48O2 428. 3581). IR: nmax cmÿ1
3457, 3200, 1687 (C10), 1037, 870. 1H-NMR (CDCl3):
Table 1. MS: m/z at 428 (M+), 413 (M+-CH3), 410(M+-H2O), 395 (M+-H2O-CH3CO), 207, 189 (100%).On acetylation with C5H5N±Ac2O at room tempera-ture (overnight) it gave colourless needles of 10, mp276±2778C (MeOH±CHCl3) M
+ at m/z 470.3627 (cal-culated for C31H50O3, 470.3647) IR: nmax cmÿ1 3200,1722 (OAc), 1705 (C1O), 1245, 870. 1H-NMR(CDCl3): Table 1. MS: m/z at 470 (M+), 410 (M+-HOAc), 395, 231, 207, 189, (100%), 157, 133, 105, 95,94, 44.
3.3.2. Taraxeryl acetate, 5Mp 301±3028C (C6H6±EtOAc), lit. (Hui & Li, 1976)
304±2058, M+ m/z 468.3310 (calculated for C32H52O2
468.3381). IR: nmax cmÿ1 1720, 1638, 1243, 815. 1H-NMR (CDCl3): d 0:82 (3H, s, H-28), 0.86 (3H, s, H-25), 0.88 (3H, s, H-23), 0.90 (3H, s, H-24), 0.91 (3H, s,H-26), 0.95 (6H, s, H.30), 1.07 (3H, s, H-27), 2.04 (3H, s,OCOCH3), 4.46 (1H, dd, J � 11:6, 6.5 Hz, H-3) 5.53(1H, dd, J � 8:3, 3.7 Hz, H-15). MS: m/z at 468 (M+),453, 408 (M+-HOAc), 344, 329, 284, 269, 204 (100%).On acetylation with C5H5N±Ac2O, at room tempera-ture (overnight), colourless compound, 11, mp 278±2798C (MeOH±CHCl3) was recovered. IR: nmax cmÿ1
3030, 1375, 1640, 1258, 868. 1H-NMR (CDCl3): d 0:73(3H, s, H-23), 0.84 (3H, s, H-28), 0.85 (3H, s, H-25),0.91 (3H, s, H-24), 0.93 (3H, s, H-26), 0.96 (3H, s, H-29), 1.02 (3H, s, H-30), 1.08 (3H, s, H-27), 2.05 (3H, s,OCOCH3) 4.49 (1H, dd, J � 11:5, 6.2 Hz, H-3), 4.86(1H, s, H-19). MS: m/z at 468, 453 (M+-CH3), 408(M+-HOAc), 231, 218, 207, 204, 189 (100%).
3.3.3. Germanicol, 6Mp 175±1768C (MeOH±CHCl3), lit. (Yamada et al.,
1965) 176±1778, M+ at m/z 426.3926 (calculated forC30H50O, 426.3936), �a�25D + 6.0 (C.O. 40). IR: nmax
cmÿ1 3600, 3030, 2940, 2850, 1630, 1450, 1360, 1040,855 1H-NMR (CDCl3): d 0:75 (3H, s, H-23), 0.77 (3H, s,H-25), 0.88 (3H, s, H-24), 0.95 (6H, s, H-28), 0.98 (3H, s,H-28), 1.03 (3H, s, H-29), 1.08 (3H, s, H-30), 3.96 (1H,dd, J � 11:5, 6.2 Hz, H-3), 4.86 (1H, s, H-19), MS:m/z at426 (M+), 411 (M+-Me), 408, (M+-H2O), 231, 218,189, 77.
Acknowledgements
We are thankful to Prof. B.L. Kalsotra, Ex-H.O.D.Chemistry, and Prof. Rajive Gupta, H.O.D.Chemistry, University of Jammu, for providing Lab.facilities. We remain indebted to Prof. E.S. Waight,Imperial College of Science and Technology, London,for recording NMR, APT and DEPT spectral data.
S. Koul et al. / Phytochemistry 53 (2000) 305±309308
References
Bhargava, K. K., & Sheshadari, T. R. (1973). Curr. Science, 42, 59.
Budzikiewicz, H., Wilson, J. M., & Djerassi, C. (1963). J. Am. Chem.
Soc, 85, 3688.
Cheung, H. T., & Williams, D. G. (1969). Tetrahedron, 25, 119.
Dantanarayan, A. P., Kumar, N. S., Muthukuda, M., & Wazeer, M.
I. M. (1982). Phytochemistry, 21, 2065±2068.
Fried, J., & Edwards, J. A. (1972). Organic reactions in steroid chem,
vol. 1. New York: Van Nostrand Reinhold.
Grinner, G. (1960). Ann. Chem., 13, 636.
Hui, W. H., & Li, M. M. (1976). Phytochemistry, 15, 563.
Hui, W. H., & Moon, L. M. (1977). Phytochemistry, 16, 111.
Levy, G. C., & Nelson, G. L. (1972). C-13NMR for organic chemists.
New York: Wiley.
Razdan, T. K., Kachroo, V., Harkar, S., & Koul, G. L. (1982).
Tetrahedron, 38, 991.
Razdan, T. K., Kachroo, P. K., Qurishi, M. A., Kalla, A. K., &
Waight, E. S. (1996). Phytochemistry, 41, 1437±1438.
Razdan, T. K., Qurishi, M. A., & Khuroo, M. A. (1990). In Proc.
XVIIth IUPAC Symp. on Natural Products, ND (p. 254).
Schreiber, J., & Eschemnoser, A. (1955). Helv. Chem. Acta, 38, 1529.
Shah, W. A., Qurishi, M. A., Koul, S. K., & Dhar, K. L. (1996).
Phytochemistry, 41, 595±597.
Stothers, J. B. (1972). 13C-NMR spectroscopy. New York: Academic
Press.
Thompson, M. J., & Bowers, W. S. (1965). Phytochemistry, 7,
845.
Wenkert, E., Baddeley, G. V., Bur®tt, I. R., & Moreno, L. N.
(1978). Org. Magn. Reson, 11, 337.
Williams, D. H., Bhacca, N. S., & Djerassi, C. (1963). J. Am. Chem.
Soc, 85, 2810.
Williams, D. H., & Fleming, I. (1988). In Spectroscopic methods in
organic chemistry (pp. 9±17). UK: Tata McGraw-Hill.
Yamada, T., Nakamura, S., Goto, T., & Hirata, Y. (1965). Chem.
Soc. Jpn, 86, 1315.
S. Koul et al. / Phytochemistry 53 (2000) 305±309 309

Oxidation and epimerization of epigallocatechin in banana fruits
Takashi Tanaka, Kouhei Kondou, Isao Kouno*
School of Pharmaceutical Sciences, Nagasaki University, 1-14 Bunkyo-Machi, Nagasaki, 852-8521, Japan
Received 8 July 1999; received in revised form 10 September 1999; accepted 5 October 1999
Abstract
To examine the metabolism of proanthocyanidins in banana fruit, (ÿ)- epigallocatechin was treated with the homogenate ofthe fruit ¯esh to yield (ÿ)-gallocatechin and an oxidation product, 1-(3,4,5-trihydroxyphenyl)-3-(2,4,6-trihydroxyphenyl)-2-
hydroxy-1-propanone. The latter product is a stable form of a key intermediate in the oxidative metabolism of ¯avan-3-ols, andis also related to the biogenesis of A-type proanthocyanidins. In addition, treatment of the reaction mixture with o-phenylenediamine a�orded monomeric and dimeric phenazine derivatives generated by condensation with the o-quinone form of
the oxidation product. # 2000 Published by Elsevier Science Ltd. All rights reserved.
Keywords: Musa acuminata; Musaceae; Proanthocyanidin; Oxidation; Epimerization; Epigallocatechin; Prodelphinidin
1. Introduction
In the course of our chemical studies on insolubleproanthocyanidins in fruits (Tanaka, Takahashi,Kouno & Nonaka, 1994), prodelphinidin A-2 4 '-thioether was obtained by thiol degradation of insolu-ble proanthocyanidin of banana fruit, together with(ÿ)-epigallocatechin 4-thioether derived from themajor extension unit of the proanthocyanidin. The for-mer product indicated the presence of extension unitshaving A-type (C-4 to C-8 and C-2 to O-7) linkages(Weinges, Kaltenhuser, Marx, Nader & Nader, 1968;Jacques, Haslam, Bedford & Greatbanks, 1974). TheA-type extension unit was supposed to be formed byoxidation of proanthocyanidin with a B-type linkage(C-4 to C-8) (Jacques, Opie, Porter & Haslam, 1977;Nonaka, Morimoto, Kinjo, Nohara & Nishioka,1987). Although the oxidation mechanism of thesephenolic compounds by polyphenol oxidase has beendeduced from the structure of the stable metabolites,
the intermediates have not been chemically character-ized. Hence, in order to clarify the oxidative mechan-ism of ¯avan-3-ols and proanthocyanidins in plants,we examined the oxidation of (ÿ)-epigallocatechin inbanana fruits, and isolated a stable form of a keymetabolite. In addition, the presence of two unstablemetabolites having o-quinone structures was indicatedby isolation of their phenazine derivatives. This paperdescribes the isolation and structure determination ofthese compounds.
2. Results and discussion
Thiol degradation of insoluble proanthocyanidin,which remained in plant debris of banana fruit afterextraction with aqueous acetone, a�orded three ¯avan-3-ol thioethers: (ÿ)-epigallocatechin 4-(2-hydro-xyethyl)thio ether (1), (ÿ)-epicatechin 4-(2-hydro-xyethyl)thio ether (2), and (ÿ)-epiafzerechin 4-(2-hydroxyethyl)thio ether (3). Compounds 1 and 2 wereidenti®ed by direct comparison of the 1H-NMR spec-tral data and speci®c rotation values with those of theauthentic samples obtained from persimmon fruits
Phytochemistry 53 (2000) 311±316
0031-9422/00/$ - see front matter # 2000 Published by Elsevier Science Ltd. All rights reserved.
PII: S0031-9422(99 )00533 -6
www.elsevier.com/locate/phytochem
* Corresponding author. Tel.: +81-958-47-1111; fax: +81-958-48-
4387.
E-mail address: [email protected] (I. Kouno).

(Tanaka et al., 1994). The structure of 3 was deter-mined by 1H-NMR spectral comparison, the spectrumwas closely related to those of 1 and 2 except for thepresence of A2X2-type signals due to the p-substitutedB-ring of 3. The yields of the thioethers indicated thatthe major extension unit of the insoluble proanthocya-nidins was epigallocatechin. In persimmon fruits, theinsolubilization of proanthocyanidins was caused bycondensation with acetaldehyde, and ¯avan-3-olthioethers having a carbon branch originating fromacetaldehyde were isolated from the insolubilizedproanthocyanidins (Tanaka et al., 1994). However, inthis experiment, no such chemical evidence for insolu-bilization was obtained. In addition to the monomericproducts, a thioether of the dimeric proanthocyanidin(4) was obtained from the insoluble banana proantho-cyanidin. The [M-H]ÿ ion peak at m/z 683 in the nega-tive ion FABMS and two aromatic singlet signals dueto two pyrogallol-type B-rings in the 1H-NMR spec-trum, along with signals of a hydroxyethylthio group,suggested that 4 was a thioether of prodelphinidindimer. However, only one signal attributable to H-2 ofC-ring was observed at d 5.22 (H-2 '), and one of theC-2 carbons appeared at d 103.5 (C-2 ') in the 13C-NMR spectrum. These ®ndings indicated that 4 is aprodelphinidin 4-thioether having A-type linkage. Thiswas further con®rmed by the 1H- and 13C-NMR spec-tral comparison with those of the thioether 4a derivedfrom epicatechin-(4b 4 8, 2b 4 O4 7)-epicatechin-(4a 4 8)-epicatechin (5) (Kashiwada, Morita, Nonaka& Nishioka, 1990). Both spectra of 4a was almostsuperimposable with those of 4 except for signals aris-ing from the B-rings.
Since banana fruit contains polyphenol oxidase cata-lyzing the oxidation of catechols to o-quinones (Sojo,Nunez-Delicado, Garcia-Carmona & Sanchez-Ferrer,1998), the A-type linkage of the proanthocyanidin was
probably formed by enzymatic oxidation of the B-ringof the upper unit and subsequent addition of the C-7hydroxyl group of the lower unit to the C-2 positionof the resulting quinonoidal structure (see Fig. 1). Toobtain the chemical evidence for this oxidative mech-anism, the chemical conversion of (ÿ)-epigallocatechin(6), the major extension unit of banana proanthocyani-din, was next examined. Thus, compound 6 was hom-ogenized with banana fruit ¯esh, and the resultingproducts were separated by Sephadex LH-20 and ODScolumn chromatography to a�ord compounds 7(1.8%), 8 (0.2%) and 6 (48%). Most of the startingmaterial seemed to be polymerized, since the productsremained at the origin on the TLC plate. By compari-son of its 1H-NMR data and �a�D value, 7 was ident-i®ed as (ÿ)-gallocatechin, which indicated thatepimerization at C-2 position of 6 had occurred(Kiatgrajai, Wellons, Gollob & White, 1982). The pro-duct 8 showed an [M-H]ÿ ion peak at m/z 321 in thenegative ion FABMS spectrum, which was 16 massunits larger than that of 6. The 1H-NMR spectrum of8 was related to that of 6, and indicated the presenceof a pyrogallol ring �d 7.27, 2H, s ), a phloroglucinolring �d 5.98, 2H, s ), an oxygen bearing methine �d5.13, dd, J = 3, 9 Hz) and a benzylic methylene �d3.21, dd, J = 3, 14 Hz; d 2.68, dd, J = 9, 14 Hz). Inaddition to signals due to the aromatic and aliphaticparts, a conjugated carbonyl carbon signal at d 200.2was observed in the 13C-NMR spectrum. Based on theabove evidence, the structure of 8 was concluded to be1-(3,4,5-trihydroxyphenyl)-3-(2,4,6-trihydroxyphenyl)-2-hydroxy-1-propanone. This compound can beregarded as a stable form of an oxidation product of6 formed by hydration of the quinone methide struc-ture (8b) and simultaneous opening of the hemiacetalring (see Fig. 2). As far as we know, this is the ®rstisolation of the intermediate generated at the ®rst
T. Tanaka et al. / Phytochemistry 53 (2000) 311±316312

step of the oxidation of ¯avan-3-ol by a polyphenoloxidase.
Since 8 and related metabolites are metabolised con-tinuously, it was presumed di�cult to isolate the otherintermediates. However,the presence of the metaboliteshaving an o-diquinone structure (8c) was easily pre-dictable from the structure of 8. To trap the unstableo-diquinone metabolites, o-phenylenediamine wasadded to the extract of the reaction mixture. As a
result, two phenazine derivatives 9 and 10 wereobtained. The 1H-NMR spectrum of 9 was closely re-lated to that of 6, except for the appearance of signals�d 7.48, d, J = 1.5 Hz; d 7.93, br s; d 7.96, 2H, m; d8.26, 2H, m ) due to a hydroxyphenazine moiety (ringsB, D and E) instead of the pyrogallol ring in 6. The13C-NMR spectrum also supported the presence of themonohydroxyphenazine moiety, and showed signalsdue to A- and C-rings which were similar to those of
Fig. 1
Fig. 2
T. Tanaka et al. / Phytochemistry 53 (2000) 311±316 313

6. Furthermore, the negative ion FABMS showed a
Mÿ ion peak at m/z 376. On the basis of these spectraldata, the structure of this derivative was determined as
shown by 9, which was derived from o-quinone tauto-
mer 8c (Fig. 2).
Derivative 10 showed a Mÿ ion peak at m/z 680,
suggesting that this compound has a dimeric structure.
The 1H-NMR spectrum showed signals due to a phe-nazine moiety �d 8.28 and 7.95, each 2H, m ) and two
aromatic singlet signals �d 7.03 and 8.21, each 1H).
The remaining signals due to two sets of A- and C-
ring protons, were similar to those of the theasinensinsC (11) and E (12), a pair of rotational isomers of an
epigallocatechin dimer isolated from semi-fermented
tea (Oolong tea) (Hashimoto, Nonaka & Nishioka,
1988). This observation suggested that 10 was a phena-zine derivative of dimer formed by carbon-to-carbon
coupling between B-rings of 6 and 8c. The 13C-NMR
spectrum also showed signals arising from two sets ofA- and C-rings, the chemical shifts of which were simi-
lar to those of 11 and 12. In addition, six aromatic
carbon signals �d 108.1 (C-16 '), 117.3 (C-12 '), 130.3
(C-11 '), 133.2 (C-14 '), and two of the four signalsbetween 143.9 and 144.6 (C-13 ' and 15 ')] were related
to those of the B-ring of 11 and 12. Hence, the struc-
ture of this dimeric product was deduced to be asshown by 10. Although the position of the biphenyl
bond in the phenazine moiety still remained undeter-
mined, comparison of the chemical shifts of 10 with
those of 9 suggested that it was located ortho to a hy-droxyl group. In the 1H- and 13C-NMR spectra, some
minor peaks arising from a closely related isomer were
observed, suggesting the presence of a rotational orpositional isomer. A possible mechanism of the for-
mation of 10 is shown in Fig. 2.
From the results obtained in this experiment, theoxidation mechanism of ¯avan-3-ol in banana fruit
may be summarized as shown in Fig. 2. The outline
of the mechanism is similar to that proposed for rad-
ical oxidation of ¯avan-3-ols (Kondo, Kurihara,Miyata, Suzuki & Toyoda, 1999). When the B-ring of
an extension unit of proanthocyanidin is oxidized in
a manner similar to the formation of 8, subsequent
addition of the C-7 hydroxyl group of the lower ¯a-van-3-ol unit generates the A-type inter¯avan bond
(Fig. 1). Although the mechanism for the epimeriza-
tion at C-2 position is still not clear, it may be re-lated to reduction of the quinone methide form.
Hence, the isolation of intermediate 8 and derivative
9 achieved in this experiment is important from the
viewpoint of metabolism of proanthocyanidins. In ad-dition, isolation of derivative 10 is also of great sig-
ni®cance for understanding the mechanism of
polymerization of ¯avan-3-ols and proanthocyanidinsby polyphenol oxidase.
3. Experimental
3.1. General
(ÿ)-Epigallocatechin was isolated from green teaand recrystallized from water. The purity (>98%) andabsence of gallocatechin was con®rmed by HPLC (themajor impurity was (ÿ)-epicatechin, <2%).Proanthocyanidin 5 was isolated from Dicranopterispedata (Kashiwada et al., 1990). Column chromatog-raphy was performed with Sephadex LH-20 (25±100mm, Pharmacia Fine Chemical), MCI-gel CHP 20P(75±150 mm, Mitsubishi Chemical Industries),Bondapak ODS (Waters) and Chromatorex ODS (FujiSilysia). Thin layer chromatography was performed onprecoated Silica gel 60 F254 plates (0.2 mm thick,Merck) with benzene±EtOAC±HCO2H (1:7:1 or 1:7:2v/v), as eluant, with constituents detected by ultra-violet (UV) illumination and by spraying with 2%ethanolic FeCl3 reagent, and by p-anisaldehyde-H2SO4
reagent. Analytical HPLC was performed on aCosmosil 5C18-AR (Nacalai Tesque) column (4.6 mmi.d. � 250 mm) (mobile phase, CH3CN-50 mM H3PO4,gradient elution from 10 to 50% CH3CN for 60 min;¯ow rate, 0.8 ml/min, detection: UV absorption at 280nm). Negative FABMS were recorded on a JEOLJMX DX-303 spectrometer with glycerol as a matrix.1H- and 13C-NMR spectra were obtained with VarianUnity plus 500 and Varian Gemini 300 spectrometersoperating at 500 and 300 MHz for 1H and 125 and 75MHz for 13C, respectively; chemical shifts are reportedin parts per million on the d scale with TMS as the in-ternal standard, and coupling constants are in Hertz.
3.2. Thiol degradation of insoluble proanthocyanidin
The ripe fruit ¯esh (4.3 kg) of Musa acuminata Collacv. giant cavendish, imported from the Philippines,was macerated with 1.5 l of water in a Warring blen-der and extracted with acetone±water (4:1 v/v, 1 l).After ®ltration, the plant debris remaining on the ®lterpaper was extracted three times with acetone±water1.5 l, (7:3 v/v). The ®ltrate was combined and concen-
T. Tanaka et al. / Phytochemistry 53 (2000) 311±316314
trated by rotary evaporator below 408C. The debriswas washed with acetone, dried in vacuo for two days,and suspended in 10% mercaptoethanol solution (pH2, adjusted with concentrated HCl, total volume 1 l).The suspension was heated at 608C for one day andkept at room temperature for three days. The mixturewas ®ltered and the ®ltrate was subjected to columnchromatography over MCI-gel CHP 20P (6.0 cmi.d. � 30 cm). After washing the column with water,stepwise gradient elution with 10±70% methanola�orded four fractions containing FeCl3 positive com-pounds; fr. 1 (2.86 g), fr. 2 (3.24 g), fr. 3 (3.20 g), andfr. 4 (1.63 g). The fractions were separately subjectedto a combination of column chromatography overSephadex LH-20, MCI-gel CHP 20P, Bondapak ODS,and Chromatorex ODS with water containing increas-ing amounts of methanol to yield (ÿ)-epigallocatechin4-(2-hydroxyethyl)thio ether (1, 1.6 g from frs. 1 and2), (ÿ)-epicatechin 4-(2-hydroxyethyl)thio ether (2, 84mg from fr. 3), prodelphinidin A-2 4-(2-hydro-xyethyl)thio ether (4, 36 mg from fr. 3), and (ÿ)-epiaf-zerechin 4-(2-hydrozyethyl)thio ether (3, 4 mg from fr.4). The acetone±water extract of the fruits was alsosubjected to thiol degradation in a manner similar tothat described for the debris. MCI-gel CHP 20P col-umn separation of the reaction mixture a�orded afraction containing phenolic compounds (2.4 g).Repeated column chromatography of the fraction overSephadex LH-20, Chromatorex ODS, and MCI-gelCHP 20P yielded 1 (5 mg), 2 (4 mg), and ca�eic acid(5 mg).
3.2.1. Prodelphinidin A-2 4 '-(2-hydroxyethyl)thio ether(4)
Red amorphous powder, �a�D ÿ 18.68 (MeOH, c0.2), negative ion FABMS m/z: 683 (M-H)ÿ, 1H-NMRspectral data [300 MHz, (CD3)2CO + D2O] d: 2.70±3.01 (2 H, m, ±SCH2±), 3.71±4.00 (2H, m, ±CH2OH),4.09 (1H, d, J = 2 Hz, H-3 '), 4.12 (1H, d, J = 3 Hz,H-3), 4.18 (1H, d, J = 2 Hz, H-4 '), 4.34 (1H, d, J = 3Hz, H-4), 5.22 (1H, s, H-2 '), 5.98 (1H, d, J = 2 Hz,H-6), 6.07 (1H, J = 2 Hz, H-8), 6.14 (1H, s, H-6 '),6.76, 6.88 (each 2H, s, H-12, 16; H-12 ', 16 '); 13C-NMR spectral data [75 MHz, (CD3)2CO] d: 28.7 (C-4),35.3 (±SCH2±), 44.4 (C-4 '), 62.6 (±CH2OH), 67.3 (C-3 '), 71.0 (C-3 '), 77.2 (C-2 '), 96.2, 97.1, 97.9 (C-6, 8,6 '), 99.7, 102.3 (C-10, 10 '), 103.5 (C-2), 106.7 (C-8 '),107.2 (2C), 108.2 (2C) (C-12, 16; C-12 ', 16 '), 129.6,131.3 (C-11, 11 '), 133.7, 133.8 (C-14, 14 '), 145.7 (2C),146.2 (2C) (C-13, 15, 13 ', 15 '), 151.3, 153.3, 153.7,156.5, 157.0, 157.9 (C-5, 7, 9, 5 ', 7 ', 9 '). Assignmentswere made by comparison with the data for the relatedthioether previously described (Kashiwada et al.,1990).
3.2.2. (ÿ)-Epiafzerechin 4-(2-hydroxyethyl)thio ether(3)
Red amorphous powder, �a�D+208.58 (MeOH, c0.4,), 1H-NMR spectral data [300 MHz, (CD3)2CO +D2O] d: 2.70±3.00 (2H, m, ±SCH2±), 3.71±4.02 (2H,m, ±CH2OH), 4.06 (1H, br s, H-4), 4.10 (1H, br s, H-3), 5.28 (1H, s, H-2), 5.91 (1H, d, J = 2 Hz, H-6),6.04 (1H, d, J = 2 Hz, H-8), 6.95 (2H, d, J = 8 Hz,H-3 ', 5 '), 7.47 (2H, d, J = 8 Hz, H-2 ', 6 ').
3.2.3. Preparation of thioether 4a from trimer 5A solution of 5 (38 mg) and mercaptoethanol (0.3
ml) in EtOH±0.1 M HCl (2:1 v/v 3 ml) was heated at50 8C for 30 h. The mixture was applied to a columnof MCI-gel CHP 20P with water and eluted with 20±40 % MeOH (stepwise gradient) to a�ord 4a (13 mg);white amorphous powder, �a�D ÿ 64.18 (MeOH, c 0.9).negative ion FABMS m/z: 651 (M-H)ÿ, 1H-NMRspectral data [300 MHz, (CD3)2CO] d: 2.70±3.01 (2 H,m, ±SCH2±), 3.74±4.00 (2H, m, ±CH2OH), 4.11 (1H,d, J = 2 Hz, H-3 '), 4.14 (1H, d, J = 3 Hz, H-3), 4.20(1H, d, J = 2 Hz, H-4 '), 4.34 (1H, d, J = 3 Hz, H-4),5.30 (1H, s, H-2 '), 5.98, 6.08 (each 1H, d, J = 2 Hz,H-6, 8), 6.16 (1H, s, H-6 '), 6.85, 6.91 (each 1H, d, J =8 Hz, H-15, 15 '), 7.05, 7.14 (each 1H, dd, J = 2, 8 Hz,H-16, 16 '), 7.19, 7.37 (each 1H, d, J = 2 Hz, B ringH-12, 12 '); 13C-NMR spectral data [75 MHz,(CD3)2CO] d: 28.7 (C-4), 35.3 (±SCH2±), 44.4 (C-4 '),62.6 (±CH2OH), 67.2 (C-3 '), 71.0 (C-3), 77.2 (C-2),96.1, 97.1, 97.9 (C-6, 8, 6), 99.7, 102.3 (C-10, 10),103.6 (C-2), 106.7 (C- 8 '), 115.1, 115.3, 115.6, 116.3(C-12, 15, 12 ', 15 '), 119.5, 120.8 (C-16, 16 '), 130.2,132.0 (C-11, 11 '), 145.4, 145.6, 145.8, 146.1 (C-13, 14,13 ', 14 '), 151.3, 153.2, 153.8, 156.6, 157.0, 157.9 (C-5,7, 9, 5 ', 7 ', 9 ').
3.3. Isolation of metabolites of epigallocatechin
The ¯esh (81 g) of banana fruit was homogenized inWaring blender. TLC analysis of the homogenate didnot show any components corresponding to ¯avan-3-ols and related compounds, which were positive to ani-saldehyde±H2SO4 reagent. An aqueous solution (5 ml)of (ÿ)-epigallocatechin (6, 1.0 g) was mixed with thehomogenate and stirred for 30 min at room tempera-ture. The mixture was extracted with acetone±water(4:1 v/v 200 ml) three times. After removal of acetoneby rotary evaporator, the extract was partitioned withEtOAC (4�). The EtOAC layer was concentrated andapplied to a column of Sephadex LH-20 (3.0 cmi.d. � 40 cm) eluting with 60% MeoH to give two frac-tions positive to FeCl3 reagent. The ®rst fraction con-tained polymeric products and was not separatedfurther. The second fraction was chromatographed onChromatorex ODS with water containing increasingamounts of methanol to give (ÿ)-gallocatechin (7, 18
T. Tanaka et al. / Phytochemistry 53 (2000) 311±316 315

mg) and a metabolite 8 (2.0 mg), along with 6 (482mg).
3.3.1. (ÿ)-Gallocatechin (7)Red amorphous powder, �a�D ÿ 5.48 (MeOH, c 0.5),
1H-NMR spectral data [300 MHz, (CD3)2CO + D2O]d: 2.50 (1H, dd, J = 9, 16 Hz, H-4a), 2.89 (1H, dd, J= 6, 16 Hz, H-4b), 3.97 (1H, m, H-3), 4.47 (1H, d, J= 8 Hz, H-2), 5.86, 6.02 (each 1H, d, J = 2 Hz, H-6,H-8), 6.47 (2H, s, H-2 ', H-6 ').
3.3.2. 1-(3,4,5-Trihydroxyphenyl)-3-(2,4,6-trihydroxyphenyl)-2-hydroxy-1-propanone (8)
Red amorphous powder, �a�D + 234.68(MeOH, c0.8,), negative ion FABMS m/z: 321 (M-H)ÿ, 1H-NMR spectral data [300 MHz, (CD3)2CO + D2O] d:2.68 (1H, dd, J = 14, 9 Hz, H-3a), 3.21 (1H, dd, J =14, 3 Hz, H-3b), 5.13 (1H, dd, J = 9, 3 Hz, H-2), 5.98(2H, s, H-3 ', 5 '), 7.27 (2H, s, H-2 ', 6 '); 13C-NMR spec-tral data [75 MHz, (CD3)2CO + D2O] d: 29.5±30.6(C-3, overlapped with solvent signal), 74.5 (C- 2), 95.8(C-3 ' ', 5 ' '), 103.9 (C-1 ' '), 109.4 (C-2 ', 6 '), 126.0 (C-1 '),133.9 (C-4 '), 146.1 (C-3 ', 5 '), 157.8 (C-2 ' ', 4 ' ', 6 ' '),200.2 (C-1).
3.4. Isolation of phenazine derivatives of metabolites
(ÿ)-Epigallocatechin, 6 (1.0 g) was treated with ahomogenate of fruit ¯esh (86 g) for 30 min asdescribed above, and the mixture was extracted withacetone±water (4:1 v/v 200 ml) three times. The extractwas concentrated until acetone was completelyremoved, and the aqueous solution (50 ml) was mixedwith a solution of o-phenylenediamine (1 g) in 20%acetic acid±ethanol (20 ml). After stirring for 30 min,the mixture was ®ltered and the ®ltrate was partitionedwith EtOAC (4�). The EtOAC layer was concentratedand separated by column chromatography as describedabove to a�ord derivatives 9 (5 mg) and 10 (7 mg)together with 6 (571 mg).
3.4.1. Phenazine derivative (9)Red amorphous powder, �a�D ÿ 61.38 (MeOH, c
0.5,), negative ion FABMS m/z: 376 (Mÿ), 1H-NMRspectral data [300 MHz, (CD3)2CO + D2O] d: 2.80(1H, dd, J = 4, 7 Hz, H-4), 2.99 (1H, dd, J = 4, 7Hz, H-4), 4.52 (1H, br s, H-3), 5.31 (1H, br s, H-2),6.08 (2H, br s, H-6, 8), 7.48 (1H, d, J = 1.5 Hz, H-2 '),7.93 (1H, br s, H-6 ') 7.90±8.3 (2H, m, H-4 ' ' 5 ' '), 8.23±8.29 (2H, m, H-3 ' ', 6 ' '); 13C-NMR spectral data [75MHz, (CD3)2CO + D2O] d: 29.8 (C-4), 66.5 (C-3),79.3 (C-2), 95.4 (C-8), 96.3 (C-6), 99.5 (C-4a), 110.1(C-2 '), 117.8 (C-6 '), 130.2 (2C), 131.0, 131.6 (C-3 ' ',
4 ' ', 5 ' ', 6 ' '), 135.8 (C-1 '), 142.0, 144.4, 144.5, 145.2 (C-4 ', 5 ', 1 ' ', 2 ' '), 152.9 (C-3 '), 156.3, 157.6 (2C) (C-5, 7,8a).
3.4.2. Phenazine derivative (10)Brown amorphous powder, �a�D + 43.38(MeOH, c
0.1), negative ion FABMS m/z: 680 (Mÿ), 1H-NMRspectral data [300 MHz, (CD3)2CO + D2O] d: 2.12(1H, dd, J = 4, 16 Hz, H-4 or 4 '), 2.42 (1H, dd, J =4, 16 Hz, H-4 or 4 '), 2.54 (1H, d, J = 16 Hz, H-4 or4 '), 2.76 (1H, d, J = 16 Hz, H-4 or 4 '), 4.11, 4.30(each 1H, br s, H-3, 3 '), 4.55, 4.98 (each 1H, s, H-2,2 '), 5.83, 5.88, 6.00, 6.02 (each 1H, br s, H-6, 8, 6 ', 8 '),7.04 (1H, s, H-16), 7.92±7.99 (2H, m, H-4 ' ', 5 ' '), 8.21(1H, s, H-16), 8.25±8.31 (2H, m, H-3 ' ', 6 ' '); 13C-NMRspectral data [75 MHz, (CD3)2CO + D2O] d: 28.9±30.5 (C-4, 4 ', overlapped with solvent signal), 63.8,64.9 (C-3, 3 '), 77.3, 77.7 (C-2, 2 '), 95.5, 95.6, 96.0, 96.3(C-6, 8, 6 ', 8 '), 99.0, 99.1 (C-10, 10 '), 108.1 (C-16 '),117.3 (C-12 '), 119.3 (C-16), 129.2 (C-12), 130.1 (2C),131.1, 131.6 (C-19, 20, 21, 22), 130.3 (C-11 '), 133.3 (C-14 '), 135.5 (C-11), 142.0, 143.9, 144.1, 144.5, 144.6,146.0 (C-14, 15, 13 ', 15 ', 1 ' ', 2 ' '), 151.3 (C-13), 156.9,157.0, 157.1, 157.3, 157.4, 157.6 (C-5, 5 ', 7, 7 ', 9, 9 ').
Acknowledgements
The authors are grateful to Mr. K. Inada and Mr.N. Yamaguchi (Nagasaki University) for NMR andMS measurements.
References
Hashimoto, F., Nonaka, G., & Nishioka, I. (1988). Chem. Pharm.
Bull, 36, 1676.
Jacques, D., Haslam, E., Bedford, G. R., & Greatbanks, D. (1974).
J. Chem. Soc. Perkin Trans, 1, 2263.
Jacques, D., Opie, C. T., Porter, L. J., & Haslam, E. (1977). J.
Chem. Soc. Perkin Trans, 1, 1637.
Kashiwada, Y., Morita, M., Nonaka, G., & Nishioka, I. (1990).
Chem. Pharm. Bull, 38, 856.
Kiatgrajai, P., Wellons, J. D., Gollob, L., & White, J. D. (1982). J.
Org. Chem, 47, 2910.
Kondo, K., Kurihara, M., Miyata, N., Suzuki, T., & Toyoda, M.
(1999). Arch. Biochem. Biophys, 362, 79.
Nonaka, G., Morimoto, S., Kinjo, J., Nohara, T., & Nishioka, I.
(1987). Chem. Pharm. Bull, 35, 149.
Sojo, M. M., Nunez-Delicado, E., Garcia-Carmona, F., & Sanchez-
Ferrer, A. (1998). J. Agric. Food Chem, 46, 4924.
Tanaka, T., Takahashi, R., Kouno, I., & Nonaka, G. (1994). J.
Chem. Soc. Perkin Trans, 1, 3013.
Weinges, K., Kaltenhuser, W., Marx, H., Nader, E., Nader, F.,
Perner, J., & Seiler, D. (1968). Justus Liebigs Ann. Chem, 711,
184.
T. Tanaka et al. / Phytochemistry 53 (2000) 311±316316