Trichoderma-fortified compost extracts for the control of choanephora wet rot in okra production
Upload
independentCategory
view
3download
0
Available online at www.sciencedirect.com
www.elsevier.com/locate/chemosphere
Chemosphere 70 (2008) 1097–1107
Coupling occurs before breakdown during biotransformationof Acid Blue 62 by white rot fungi
Sophie Vanhulle a,*, Estelle Enaud a, Marie Trovaslet a, Ludovic Billottet b,Laurence Kneipe a, Jean-Louis Habib Jiwan c, Anne-Marie Corbisier a,
Jacqueline Marchand-Brynaert b
a Microbiology Unit, Universite catholique de Louvain, Croix du Sud 3 boıte 6, B-1348 Louvain-la-Neuve, Belgiumb Unit of Organic and Medicinal Chemistry, Universite catholique de Louvain, Place Louis Pasteur 1, B-1348 Louvain-la-Neuve, Belgium
c Mass Spectrometry Laboratory, Universite catholique de Louvain, Place Pasteur 1, 1348 Louvain-la-Neuve, Belgium
Received 15 April 2007; received in revised form 23 July 2007; accepted 24 July 2007Available online 6 September 2007
Abstract
Only few data exist on the metabolites produced during the biotransformation of anthraquinonic dyes by white rot fungi (WRF).During the biotransformation of an anthraquinonic dye Acid Blue 62 (ABu62) using Pycnoporus sanguineus MUCL 41582 strain, itwas previously demonstrated that the blue colour of the medium turned to red before complete dye decolourisation. To better under-stand the phenomenon, this study carried out ABu62 biotransformation with five different WRF strains (Coriolopsis polyzona MUCL38443, Perenniporia ochroleuca MUCL 41114, Perenniporia tephropora MUCL 41562, P. sanguineus MUCL 38531 and Trametes versi-
color MUCL 38412) and compared with P. sanguineus MUCL 41582 previously described. A multi-methodological approach (using cap-illary electrophoresis, mass spectrometry, HPLC, UV, NMR and IR spectroscopies) was developed to characterise the metabolitesinvolved and monitor their apparition. Seven metabolites were commonly found with all strains, suggesting a common metabolic path-way for ABu62 biotransformation. During the first days, dimer and oligomers of the initial ABu62 molecule were observed: the main oneabsorbed in the 500 nm region, explaining the red colour appearance of the medium. This main metabolite was made up of two moleculesof ABu62 linked by an azo bond, minus a cyclohexyl moiety. After a longer incubation time, breakdown products were observed. Basedon these products characterizations, a bioconversion pathway was proposed.� 2007 Elsevier Ltd. All rights reserved.
Keywords: Bioremediation; Metabolic pathway; Capillary electrophoresis; Mass spectrometry; Anthraquinonic dye
1. Introduction
In the textile industry, the dyeing process results in theproduction of large amounts of wastewater exhibitingintense colouration that has to be eliminated before releaseinto natural water streams. Common wastewater treat-ments are usually not effective against synthetic dyes which
0045-6535/$ - see front matter � 2007 Elsevier Ltd. All rights reserved.
doi:10.1016/j.chemosphere.2007.07.069
* Corresponding author. Tel.: +32 479 71 53 21/32 10 47 37 37; fax: +3210 45 15 01.
E-mail address: [email protected] (S. Vanhulle).URL: www.sophied.net (S. Vanhulle).
are designed to be resistant to physical, chemical andmicrobial fading (Wesenberg et al., 2003). Biological treat-ments involving white rot fungi (WRF) have attractedincreasing interest since several studies revealed theirpotential to combine decolourisation and toxicity reduc-tion, even if decolourisation is not always linked to toxicityremoval (Cerniglia et al., 1982a,b; Ramsay and Nguyen,2002; Vanhulle et al., 2007b).
WRF were shown to be efficient in decolourising severaldyes from different chemical classes (Wesenberg et al.,2003). Many wastewater treatments studies were devotedto the overall decolourising effects, while the produced
1098 S. Vanhulle et al. / Chemosphere 70 (2008) 1097–1107
metabolites remain rarely identified. Recent studies aimedat determining the chemical mechanism of azo dye decolo-urisation (Zille et al., 2005). As an example, the biotrans-formation of Acid Orange II by a manganese peroxidase(MnP) was studied by Lopez et al. (2004), using LC–ESI-MS (ESI: electrospray ionization) and NMR techniques.Concerning anthraquinonic dyes some data on physico-chemical transformations are available (Saquib andMuneer, 2002; Bouzaida et al., 2004; Carneiro et al.,2005). However, no data exist on metabolites formed dur-ing WRF biotransformation.
It was previously demonstrated that, during the in vivo
biotransformation of Acid Blue 62 (ABu62) by Pycnoporus
sanguineus MUCL 41582, the medium colour first turnedto red before complete decolourisation (Vanhulle et al.,2007a). In this context, identification of metabolites formedupon WRF biotransformation of ABu62 was attempted.To this aim, ABu62 biotransformation was studied usingsix highly efficient dye-transforming basidiomycetousWRF selected among a panel of 350 fungi (Vanhulleet al., 2003). ABu62 biotransformation was first monitoredby capillary electrophoresis (CE) and electrospray ioniza-tion mass spectrometry (ESI-MS). CE is a widely usedand well accepted method for dye separation (Blatnyet al., 1995; Jandera et al., 1996; Borros et al., 1999), whileup to now, only few studies (Conneely et al., 2002) haveused it to follow fungal biotransformation of dyes. Thismethod offers excellent separation at low running costs,simple operation and method development, and goodreproducibility (Burkinshaw et al., 1993). ConventionalESI allows the analysis of a wide range of polar com-pounds. Furthermore, isolation of metabolites wasattempted using semi-preparative HPLC and structuraldetermination was based on UV, IR, 1H NMR and 13CNMR spectroscopies.
2. Materials and methods
2.1. Strains
Strains of Coriolopsis polyzona, Perenniporia tephropora,Perenniporia ochroleuca, P. sanguineus MUCL 38531, P.
sanguineus MUCL 41582 and Trametes versicolor were pre-viously selected (Vanhulle et al., 2003) and deposited at theBCCMTM/MUCL collection (Mycotheque de l’Universitecatholique de Louvain, Louvain-la-Neuve, Belgium). Stockcultures were maintained at 4 �C on malt agar 2% (w/v),under a layer of mineral oil.
2.2. Medium and culture conditions
Decolourisations were studied in 100 ml flask containing50 ml of malt extract 20 g l�1 (Duchefa, Haarlem Nether-lands). The strains were precultured on Petri dishes (on maltagar 2% (w/v)), incubated for 7 d at 25 �C. Five fragments ofthe mycelia were sampled at the margin of the colonies witha hollow-punch of 3 mm diameter and used to inoculate
50 ml of broth containing a stainless steel support to allowimmobilization of the fungi (Vanhulle et al., 2003) and sup-plemented with 0.7 g l�1 of tyndallized ABu62 C.I. 62045(purity over 98%). ABu62 was courteously supplied byYorkshire Europe (Tertre, Belgium). The cultures were incu-bated at 25 �C for 14 d, on a rotary shaker at 125 rpm(stroke 50 mm, shaking plate dimensions 760 · 600 (W ·D) mm), with a daily sampling. Cultures were triplicated.
2.3. Decolourisation measurement
Absorbance spectra of filtered broth from shaken flaskscultures were recorded between 200 and 800 nm using aSpectronic Genesys 2 PC (Analis, Gent, Belgium). The bio-transformation of ABu62 was analysed at 595 and 500 nm.Adsorptions on living fungi mycelia were quantified color-imetrically after desorption in methanol. Results were com-pared with the adsorption on dead biomass.
2.4. Capillary electrophoresis (CE)
Each day, 100 ll of the culture medium were sampled,diluted 20 times in demineralised water and 200 ll wereanalysed with a P/ACE MDQ Beckman Coulter equippedwith a photodiode array UV/Vis detector controlled by aP/ACE station software (Analis, Gent, Belgium). Thefused-silica capillary (Analis, Gent, Belgium) (50 cm ·75 lm ID) was maintained in a cartridge with a detectionwindow of 100 · 800 lm. The separation voltage was25 kV. The procedure consisted of an initial 1 min washwith NaOH 0.1 M under 138 kPa followed by a 1 min washwith the initiator (provided by Analis) under 138 kPa. Thecapillary was then flushed with the buffer MEKC 9.2 dur-ing 2 min at 138 kPa. When a constant run current wasachieved, the sample was injected by hydrodynamic injec-tion for 5 s under 3.5 kPa, followed by injection of waterduring 10 s under 0.7 kPa. A 20 min separation step wasperformed under a 25 kV potential. After the completionof the procedure, the capillary was rinsed with NaOH0.1 M during 1 min under 138 kPa. The absorbance from190 to 600 nm was monitored with an on-column photodi-ode array detector and acquisition of the electrophoregramwas done at 190 nm in order to observe as much metabo-lites as possible. Characterization of some purified com-pounds was achieved by capillary electrophoresisanalyses, with comparisons of tm (migration time) andUV–Vis spectra.
2.5. HPLC
The LC system consisted of a Waters pump, a Waters996 photodiode array detector (for analytical separations)or a Waters 486 absorbance detector (for semi-preparativeHPLC) (Waters, Milford, MA, USA). Analytical separa-tions were performed with a Waters Novapack C-18column (4.6 · 250 mm). The mobile phase was acetoni-trile/water (10/90 of analytical grade). The flow rate was
S. Vanhulle et al. / Chemosphere 70 (2008) 1097–1107 1099
0.3 ml min�1. Samples were filtered and injected. Detectionwas performed at 220 nm and on-line UV–Vis absorbancescans were performed. Semi-preparative HPLC was per-formed with a Waters Novapack C-18 column (22 ·250 mm) (Waters, Milford, MA, USA). The mobile phasewas acetonitrile as elutent A and water as elutent B. Thegradient applied was 10/90 (A/B: v/v) over 10 min, 15/85(A/B: v/v) over 10 min, 20/80 (A/B: v/v) over 10 min and25/75 (A/B: v/v) over 10 min. The flow rate was 20 mlmin�1. On-line UV–Vis absorbance scans were performed.
2.6. NMR
The 1H and 13C NMR spectra were recorded using aBruker Avance 500 spectrometer (Bruker, Wissembourg,France) in D2O or MeOD as solvent. Spectra are reportedin ppm. Spectra in D2O were obtained with 2,2-dimethyl-2-silapentane-5-sulfonate sodium (DSS) as internal standard.
2.7. IR
Infra red spectra were acquired using a Bruker Equinox55 spectrometer (Bruker, Wissembourg, France). Sampleswere ground in a KBr matrix (2 mg of sample in 200 mgof KBr) and pressed into a translucent disc.
2.8. ESI-MS
One issue of our work was due to the use of malt extractmedium. ABu62 metabolites were attempted over the massto charge range m/z 50 to m/z 1500, but they could hardlybe seen because of the presence numerous signals, withhigh abundance, of malt extract compounds. Prior purifi-cation through solid phase extraction was therefore neces-sary. Culture medium sample (4 ml) were loaded on a C18
BakerbondTM cartridge. The cartridge was washed with5 ml of aqueous triethylamine (0.01%). Dye and metabo-lites were recovered with 3 ml of methanol containing0.01% triethylamine. The methanolic solution was concen-trated under vaccum.
The mass spectra were acquired using a Thermo Finni-gan Ion Trap LCQ spectrometer, equipped with an ESIsource (Thermo electron, San Jose, CA, USA). High Res-olution Mass Spectrometry (HRMS) analysis was per-formed at University of Mons-Hainaut (Belgium).
2.8.1. 1-[(4-Amino-9,10-dioxo-3-sulfo-9,10-dihydroanthracen-1-yl)diazenyl]-4-cyclohexylamino-9,10-
dioxo-9,10-dihydroanthracene-2-sulfonic acid, sodium salt
(5)
C34H24N4O10S2Na2. Preparative HPLC tR: 31 min; ana-lytical HPLC tR: 10 min; CE tm: 9.5 min; IR (KBr) m 3500,2931, 1666, 1629, 11593, 1582, 1484, 1402, 1204, 1047, 1021,732 cm�1; 1H NMR d (500.2 MHz, MeOD) 1.44 (1H, m),1.55 (4H, m), 1.71 (1H, m), 1.86 (2H, m), 2.16 (2H, m),3.78 (1H, m), 7.71 (2H, t), 7.79 (2H, q), 7.89 (1H, s), 7.97(2H, t), 8.26 (2H, dd), 8.65 (1H, s); 13C NMR d
(125.8 MHz, MeOD) 25.48, 26.82, 33.93, 52.12, 114.31,114.44, 118.00, 127.22, 127.48, 127.82, 127.85, 129.41,132.16, 134.38, 134.52, 134.76, 134.90, 135.35, 135.49,135.90, 136.19, 143.45, 144.52, 145.91, 150.91, 151.38,185.40, 185.62, 186.37, 186.55; MS (ESI negative mode)m/z (%) 356 (100, [M�2Na]2�), 713 (58, [M�2Na+H]�),735 (33, [M�Na]�); HRMS (ESI positive mode) m/z found:715.1165, calc.: 715.1169 (C34H27N4O10S2).
2.8.2. 1-Amino-9,10-dioxo-9,10-dihydroanthracene-2-
sulfonic acid, sodium salt (6)
CE tm: 11.8 min (M7); MS (ESI) m/z (%) 302 (100,[M�Na]�), 238 (25, [M�SO2�Na]�).
2.8.3. 1,2-Dihydroxybenzene (7)1H NMR d (500.2 MHz, D2O) 7.51 (2H, dd), 7.64 (2H,
dd).
2.8.4. 2,5-Diamino-3,4-dicarboxy-benzenesulfonic acid (8)1H NMR d (500.2 MHz, D2O) 8.41 (1H, m); 13C NMR
d (125.8 MHz, D2O) 163.
3. Results and discussion
3.1. Time course decolourisation of ABu62 by six WRF
WRF decolourisation can result from both adsorptionof the dye to the fungal mycelium and/or biotransforma-tion of the dye molecule (Fu and Viraraghavan, 2001).The ratio of adsorbed dye is not always easy to quantify,as it may be difficult to obtain an enzymatically inactivebiomass as control. In this study, ABu62 decolourisationwas carried out using six different WRF strains C. polyzo-
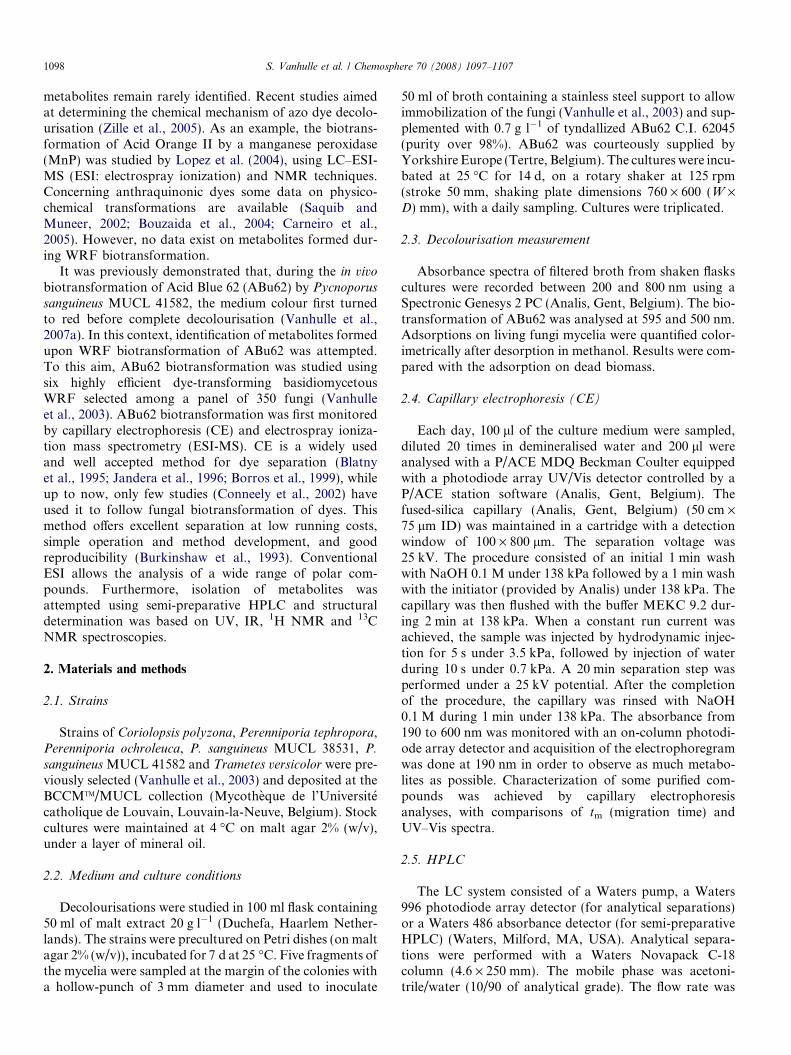
na, P. tephropora, P. ochroleuca, P. sanguineus MUCL38531, P. sanguineus MUCL 41582 and T. versicolor. Thesedecolourisations were mainly due to ABu62 biotransfor-mation rather than to adsorption on the mycelia since: (i)desorption of the dye adsorbed on biomass, estimated after3 d of culture, was between 5% and 10% of the initial dyecontent and nil at the end of the experiment; (ii) UV–Visspectrum of cultures showed an hypsochromic shift (from595 to 500 nm) within the first wk of culture. As previouslydescribed by Tatarko and Bumpus (1998) and Wang andYu (1998) a rapid initial adsorption of the dye was fol-lowed by its slow oxidative biotransformation, whateverthe strain studied. Therefore, the evolution of the mediumcolour was monitored at 595 nm (Fig. 1a) and 500 nm(Fig. 1b) during the dye biotransformation. The reductionof absorbance at 595 nm was observed for all strains(Fig. 1a), and was correlated with the appearance of thered colour (Fig. 1b) at 500 nm. However, according tothe strains, significant variations of the transformativecapacities were observed. Main differences between thefastest strains and the slowest ones were found to be relatedto adaptation before starting decolourisation (phase oflatency) which was longer in the case of the slower strains;
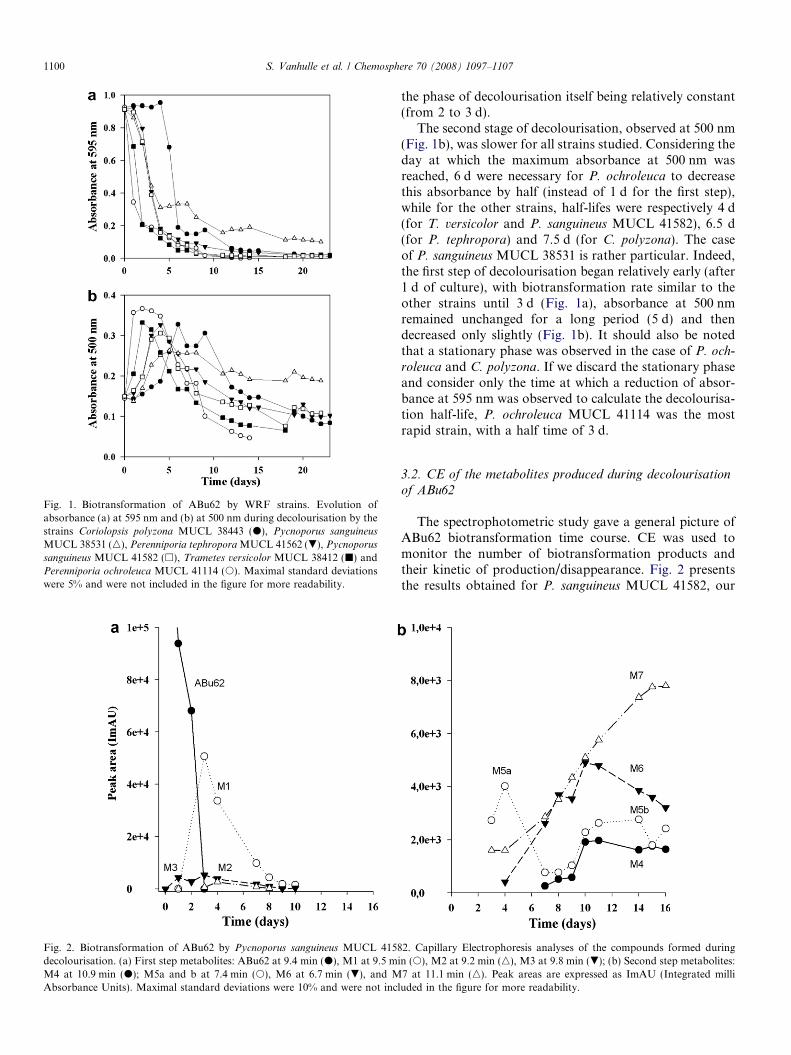
Fig. 1. Biotransformation of ABu62 by WRF strains. Evolution ofabsorbance (a) at 595 nm and (b) at 500 nm during decolourisation by thestrains Coriolopsis polyzona MUCL 38443 (d), Pycnoporus sanguineus
MUCL 38531 (n), Perenniporia tephropora MUCL 41562 (.), Pycnoporus
sanguineus MUCL 41582 (h), Trametes versicolor MUCL 38412 (j) andPerenniporia ochroleuca MUCL 41114 (s). Maximal standard deviationswere 5% and were not included in the figure for more readability.
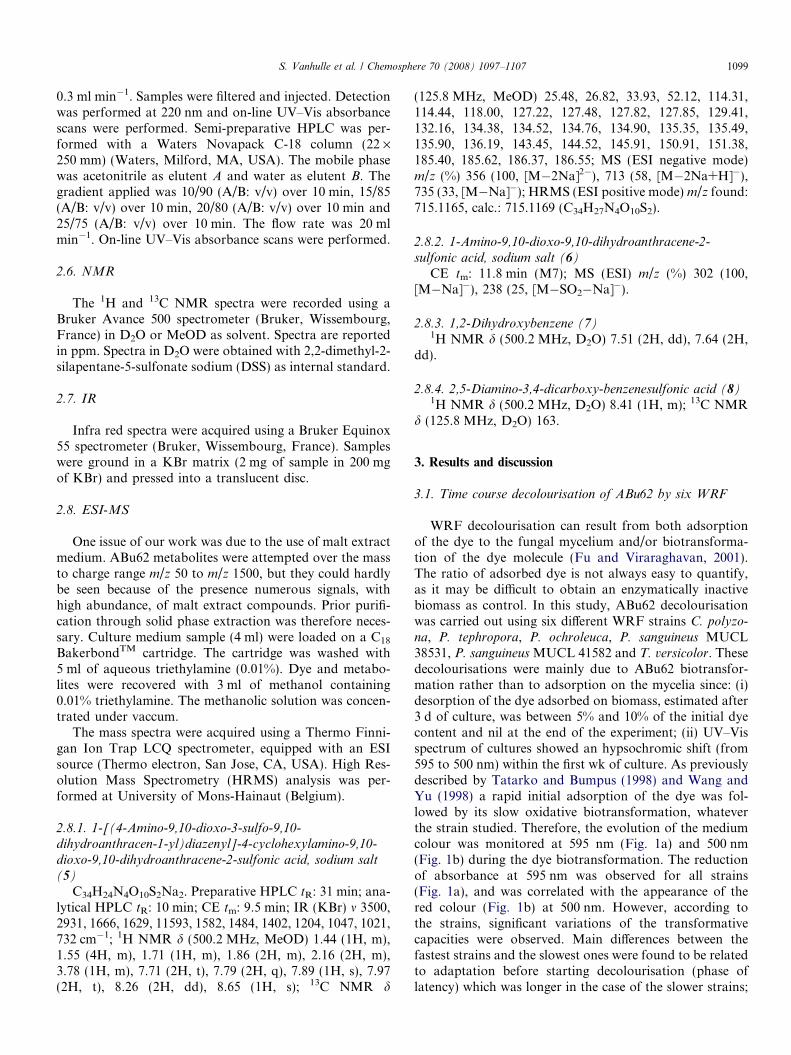
Fig. 2. Biotransformation of ABu62 by Pycnoporus sanguineus MUCL 4158decolourisation. (a) First step metabolites: ABu62 at 9.4 min (d), M1 at 9.5 miM4 at 10.9 min (d); M5a and b at 7.4 min (s), M6 at 6.7 min (.), and MAbsorbance Units). Maximal standard deviations were 10% and were not incl
1100 S. Vanhulle et al. / Chemosphere 70 (2008) 1097–1107
the phase of decolourisation itself being relatively constant(from 2 to 3 d).
The second stage of decolourisation, observed at 500 nm(Fig. 1b), was slower for all strains studied. Considering theday at which the maximum absorbance at 500 nm wasreached, 6 d were necessary for P. ochroleuca to decreasethis absorbance by half (instead of 1 d for the first step),while for the other strains, half-lifes were respectively 4 d(for T. versicolor and P. sanguineus MUCL 41582), 6.5 d(for P. tephropora) and 7.5 d (for C. polyzona). The caseof P. sanguineus MUCL 38531 is rather particular. Indeed,the first step of decolourisation began relatively early (after1 d of culture), with biotransformation rate similar to theother strains until 3 d (Fig. 1a), absorbance at 500 nmremained unchanged for a long period (5 d) and thendecreased only slightly (Fig. 1b). It should also be notedthat a stationary phase was observed in the case of P. och-
roleuca and C. polyzona. If we discard the stationary phaseand consider only the time at which a reduction of absor-bance at 595 nm was observed to calculate the decolourisa-tion half-life, P. ochroleuca MUCL 41114 was the mostrapid strain, with a half time of 3 d.
3.2. CE of the metabolites produced during decolourisationof ABu62
The spectrophotometric study gave a general picture ofABu62 biotransformation time course. CE was used tomonitor the number of biotransformation products andtheir kinetic of production/disappearance. Fig. 2 presentsthe results obtained for P. sanguineus MUCL 41582, our
2. Capillary Electrophoresis analyses of the compounds formed duringn (s), M2 at 9.2 min (n), M3 at 9.8 min (.); (b) Second step metabolites:7 at 11.1 min (n). Peak areas are expressed as ImAU (Integrated milliuded in the figure for more readability.

Tab
le1
Su
mm
ary
of
the
rele
van
td
ata
con
cern
ing
met
abo
lite
so
bse
rved
by
cap
illa
ryel
ectr
op
ho
resi
sd
uri
ng
the
dec
olo
uri
sati
on
of
AB
u62
by
six
WR
Fst
rain
s
Met
abo
lite
(tm
)b,c
AB
u62
(9.1
)M
1(9
.5)
M2
(9.2
)M
3(9
.8)
M4
(10.
9)M
5a(7
.4)
M5b
(7.4
)M
6(6
.7)
M7
(11.
8)K
max
(nm
)20
0-25
0-59
520
0-25
0-52
020
0-25
0-53
020
0-25
0-53
519
5-26
0-53
019
0-25
5-52
019
5-26
020
0-23
0-25
0-28
0-50
019
5-27
0
Im
AU
aD
ayd
Im
AU
aD
ayd
Im
AU
aD
ayd
Im
AU
aD
ayd
Im
AU
aD
ayd
Im
AU
aD
ayd
Im
AU
aD
ayd
Im
AU
aD
ayd
T.
vers
ico
lor
MU
CL
3841
210
470
02
6160
317
100
218
507
550
711
900
757
507
02
720
100
1035
010
4600
1446
0014
7170
1412
200
14P
.o
chro
leu
caM
UC
L41
114
133
200
286
004
1940
01
1250
710
507
7950
742
507
02
680
100
100
1034
5014
4050
1439
5014
9550
14P
.sa
ngu
ineu
sM
UC
L41
582
5710
03
2650
453
503
250
777
07
4900
1028
507
03
1600
100
1030
010
1600
1427
5014
3850
1473
5014
P.
tep
hro
po
raM
UC
L41
562
5090
03
5600
448
003
07
700
714
507
1400
70
812
600
1012
5010
2250
1055
014
790
1437
5014
3650
14C
.p
oly
zon
aM
UC
L38
443
3530
08
7610
07
5890
07
250
70
728
007
2050
70
70
1015
5010
5900
1012
0014
1300
1431
5014
6200
14P
.sa
ngu
ineu
sM
UC
L38
531
5990
07
2250
1053
004
07
1050
815
008
1100
80
823
100
1044
0014
3450
1015
0014
3000
1437
5014
3650
14
aP
eak
area
inI
mA
U(I
nte
grat
edm
illi
Ab
sorb
ance
Un
its)
.b
t mm
igra
tio
nti
me
of
each
met
abo
lite
.c
Mo
rem
etab
oli
tes
may
be
pre
sen
tat
the
end
of
the
cult
ure
s.d
Fo
rea
chst
rain
the
firs
tli
ne
give
the
max
imal
rela
tive
inte
nsi
tyac
hie
ved
for
each
met
abo
lite
wit
hth
ed
ayat
wh
ich
the
leve
lw
asm
axim
al.
Th
ese
con
dli
ne
give
the
min
imal
leve
lfo
rea
chm
etab
oli
tean
dth
ed
ayat
wh
ich
itw
aso
bse
rved
.
S. Vanhulle et al. / Chemosphere 70 (2008) 1097–1107 1101
‘‘model strain’’ and Table 1 summarizes for each of the sixstrains studied the peak area of the seven main metabo-lites observed by CE, their mean tm and their maximalabsorbances in the 190–550 nm region.
It was not possible to link the peak area to the metab-olite concentration as most are unidentified and no stan-dard was, hence, available to construct a calibrationcurve. As molecular absorption coefficients are differentfrom one metabolite to another no comparison of the con-centration of the different metabolites was established.However, it is possible to discuss the relative quantitiesof the same metabolite during the biotransformation timecourse and between the different strains.
The amount of ABu62 decreased rapidly from day 1and was no longer detectable after 3 d of culture for thefastest decolourising strains P. sanguineus MUCL 41582,T. versicolor and P. ochroleuca (Table 1). Between day 1and day 3, three new compounds named M1, M2 andM3 appeared in the medium broth of the six strains andtheir relative concentrations increased during 2–10 d ofcultivation depending on the strain (Table 1). These threecompounds presented differences in their UV–Vis spectrabut had as common characteristic band of absorbancearound 530 nm. This suggests that the metabolic pathwayfollowed during this step may be identical amongst the sixWRF. M1 was the major product formed and its tm wasclose to the one of ABu62. Due to its important absor-bance around 500 nm, this molecule can be consideredas the main responsible for the red colour of the mixture.Moreover, significant differences were observed betweenthe strains, in terms of maximum M1 level as well as theday at which this maximum was reached. There is a goodcorrelation between the appearance of M1 (Table 1) andprevious measurement of the evolution of the absorbanceat 500 nm (Fig. 1). In the case of P. sanguineus MUCL41582, T. versicolor, and P. ochroleuca, M1, M2, andM3 concentrations were maxima by day 1–4 and thendecreased to disappear after day 10 (Table 1). Thesemetabolites were transformed more slowly by the otherstrains studied, and up to 15 d were necessary to C. poly-
zona, P. tephropora, and P. sanguineus MUCL 38531 tocarry out the complete M1 biotransformation. In thesame time, five new metabolites were observed (Fig. 2b)namely M4, M5a, M5b, M6 and M7. M5a and b werenamed accordingly since, at the same migration time,the UV–Vis spectrum displayed absorption at 500 nm inthe first step, which was no more observed in the last cul-tivation days. We have, hence, concluded that two differ-ent metabolites had same tm, they were named M5a andM5b and quantified together. The UV–Vis spectrum ofM4 M5a and M6 showed a peak around 500 nm, whileM5b, and M7 presented absorption in UV region butdid not exhibit any peak in the visible region. It is impor-tant to note that less coloured metabolites were predomi-nant at the end of the experiment, explaining thedecolourisation observed. M7 was the major productfound at the end of the experiment.
1102 S. Vanhulle et al. / Chemosphere 70 (2008) 1097–1107
Metabolites M5a, M5b, and M6 displayed reducedmigration times as compared to the other metabolites (closeto 10 min). The rise of the velocity showed that the com-pounds formed present higher electrophoretic mobilitywhich suggested that these molecules may have higher netcharge and/or reduced friction coefficient due to a significantmodification of the size or shape of the molecules. It is sug-gested that these compounds may be breakdown products.
More products were observed together with these fivemain metabolites in the electrophoregram and especiallyduring the last cultivation days. It is difficult to determineif these products were similar among the strains as theyonly absorbed in the UV region. M6 was probably respon-sible of the remaining colour at the end of the experiment.It should be noted that the number of unidentified UVabsorbing compounds observed after 14 d was significantlyhigher for a slow decolouriser strain such as C. polyzona
Table 2Summary of ESI-MS signals (negative mode) observed during Pycnoporus sang
for intermediates
m/z Structures m/z
302 O
O
NH2S O
OO
6
399
315
O
O
SNH
NH
O
OO
10415
316
O
O
SNH2
NH
O
OO O
O
SNH
NH2
O
OO
3 3'
317
O
O
SNH2
NH2
O
OO
9
735, 713,
333
O
O
NH2
NH OH
S O
OO
O
O NH2
NH2
S O
OO
O
O
O
NH2
NH2
S O
OOOH
11 11'
11''
827, 923,
Not all isomers are presented.
(up to 21 compounds) than for a more efficient strain suchas P. sanguineus MUCL 41582 (only nine compounds left).
Whatever the differences recorded, at this point, it isimportant to notice that seven main compounds wereobserved in all WRF biotransformations studied, suggest-ing the existence of similar metabolic pathways for theABu62 biotransformation.
3.3. Characterization of the metabolites produced duringdecolourisation of ABu62 by P. sanguineus MUCL 41582 by
MS, semi-preparative HPLC and NMR
The molecular formula of ABu62 was C20H19N2O5SNawith a MW = 422 g mol�1. The mass spectrum of ABu62was firstly determined as {MS (ESI) m/z (%) 399 (100,[M�Na]�)}, and MS–MS peaks were assigned as {MS
uineus MUCL 41582 biotransformation of ABu62 and structures proposed
Structures
O
O
NH2
NH
S O
OO
1
O
O
NH
NH
S O
OOOH
O
O NH2
NH
S O
OO
O12'12
O
O
NH2
NH
S O
OOOH
12''
356
O
O
NH2
N
S O
OO
O
O
N
NH
S O
OO
5
989, 1151, 1313, 1475 Undetermined oligomers

S. Vanhulle et al. / Chemosphere 70 (2008) 1097–1107 1103
(ESI) m/z (%) 381 (100, M-41), 316 (80, M-106), 335 (31,M-87), 299 (10, M-123)}. Upon in vivo ABu62 biotransfor-
100 150 200 250 300 350 400 45
m/
05
101520253035404550556065707580859095
100 399.31
400.26
401.24
291.27 317.07 367.47262.87 447.19123.03 213.23192.12
100 200 300 400 500m
05
101520253035404550556065707580859095
100 399.32
356.27
401.37
333.36
291.24
415.34
535448.84221.06115.32 187.35
100 200 300 400 500 600 70005
101520253035404550556065707580859095
100 302.27
303.22418.22
511.29304.18
432.09291.22 665.14554.59345.27 712.38256.61199.18145.98
O
O
NH2S
O
O O
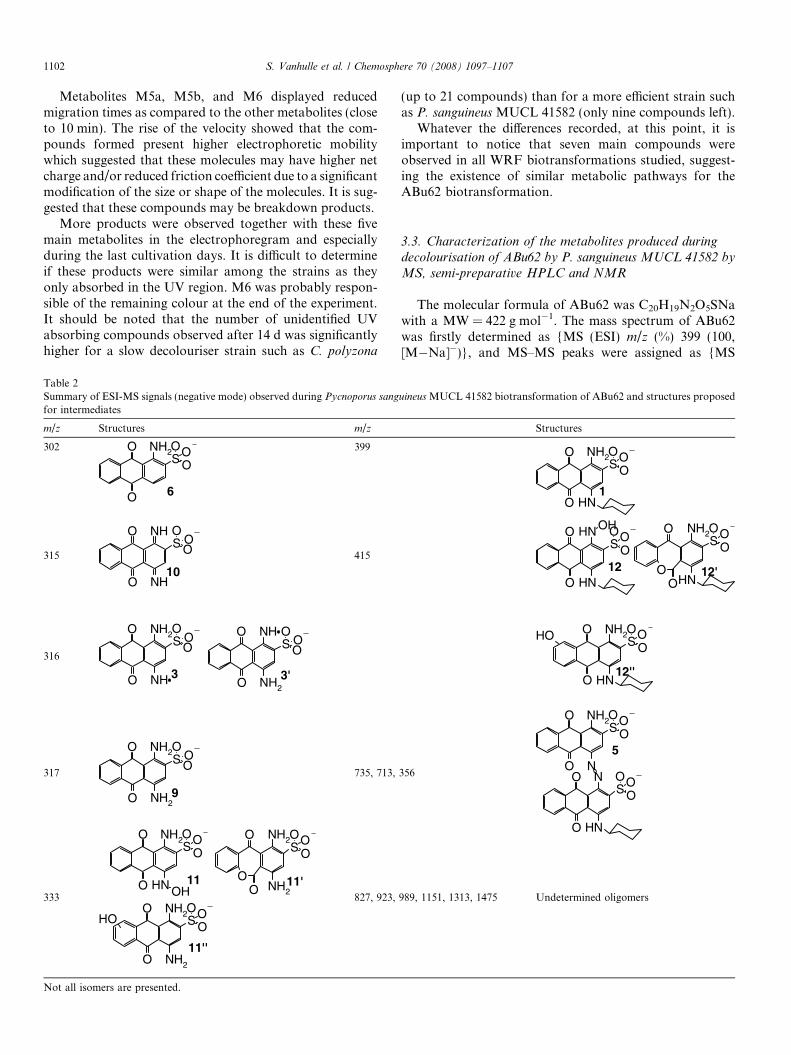
Fig. 3. Decolourisation of ABu62 by Pycnoporus sanguineus MUCL 41582. M(a) initial medium; (b) after 4 d; (c) after 14 d.
mation by P. sanguineus MUCL 41582, the evolution bymass spectroscopy was followed (Table 2 and Fig. 3).
0 500 550 600 650 700 750 800
z
821.04754.70520.26 664.06542.40478.91 592.05 697.98
600 700 800 900 1000/z
713.21
735.22
736.22.34 1013.42569.48 751.25 814.12710.25 859.93631.21 980.63928.31
800 900 1000 1100 1200 1300 1400 1500
m/z
923.71
989.121151.10827.04
1313.911475.13
1090.87861.72 1367.081170.87
O
O
NH2
NN
S O
O O
O
O NH
SO
O OH
O
O
NH2
NH
S O
O O
ass spectrometry analysis of the medium during the biotransformation:
O
O
NH2
NH
SO
O O
O
O
NH2S
O
O O
OH
OH
O
O
SNH2
NH
O
OO
O
O
SNH
NH2
O
OO
O
O
NH
NH
SO
O O
O
O
NH2
NHNH
S O
O O
O
O NH
SO
O O
O
O
NH2
NN
S O
O O
O
O NH
SO
O O
OH
O
O
NH2
NH2
SO
O O
OH
M7
polymers
1 2
3
5
6
M1
laccase
laccase
coupling
4
oxidation
8
+
7
3'
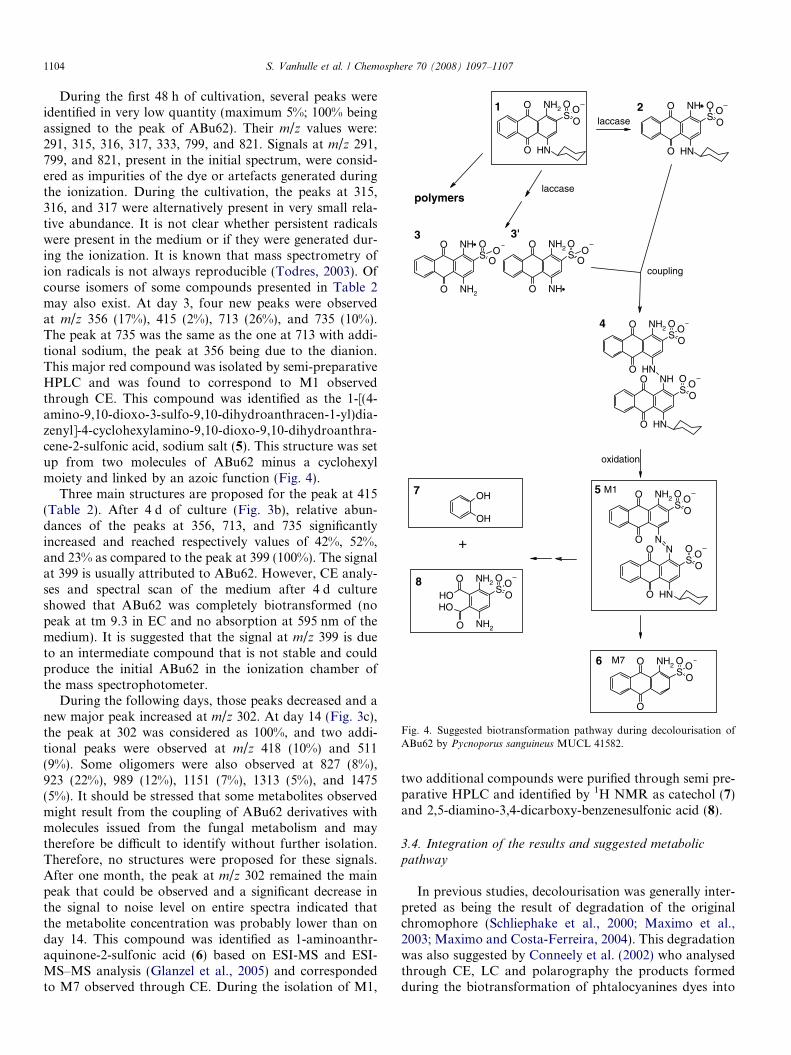
Fig. 4. Suggested biotransformation pathway during decolourisation ofABu62 by Pycnoporus sanguineus MUCL 41582.
1104 S. Vanhulle et al. / Chemosphere 70 (2008) 1097–1107
During the first 48 h of cultivation, several peaks wereidentified in very low quantity (maximum 5%; 100% beingassigned to the peak of ABu62). Their m/z values were:291, 315, 316, 317, 333, 799, and 821. Signals at m/z 291,799, and 821, present in the initial spectrum, were consid-ered as impurities of the dye or artefacts generated duringthe ionization. During the cultivation, the peaks at 315,316, and 317 were alternatively present in very small rela-tive abundance. It is not clear whether persistent radicalswere present in the medium or if they were generated dur-ing the ionization. It is known that mass spectrometry ofion radicals is not always reproducible (Todres, 2003). Ofcourse isomers of some compounds presented in Table 2may also exist. At day 3, four new peaks were observedat m/z 356 (17%), 415 (2%), 713 (26%), and 735 (10%).The peak at 735 was the same as the one at 713 with addi-tional sodium, the peak at 356 being due to the dianion.This major red compound was isolated by semi-preparativeHPLC and was found to correspond to M1 observedthrough CE. This compound was identified as the 1-[(4-amino-9,10-dioxo-3-sulfo-9,10-dihydroanthracen-1-yl)dia-zenyl]-4-cyclohexylamino-9,10-dioxo-9,10-dihydroanthra-cene-2-sulfonic acid, sodium salt (5). This structure was setup from two molecules of ABu62 minus a cyclohexylmoiety and linked by an azoic function (Fig. 4).
Three main structures are proposed for the peak at 415(Table 2). After 4 d of culture (Fig. 3b), relative abun-dances of the peaks at 356, 713, and 735 significantlyincreased and reached respectively values of 42%, 52%,and 23% as compared to the peak at 399 (100%). The signalat 399 is usually attributed to ABu62. However, CE analy-ses and spectral scan of the medium after 4 d cultureshowed that ABu62 was completely biotransformed (nopeak at tm 9.3 in EC and no absorption at 595 nm of themedium). It is suggested that the signal at m/z 399 is dueto an intermediate compound that is not stable and couldproduce the initial ABu62 in the ionization chamber ofthe mass spectrophotometer.
During the following days, those peaks decreased and anew major peak increased at m/z 302. At day 14 (Fig. 3c),the peak at 302 was considered as 100%, and two addi-tional peaks were observed at m/z 418 (10%) and 511(9%). Some oligomers were also observed at 827 (8%),923 (22%), 989 (12%), 1151 (7%), 1313 (5%), and 1475(5%). It should be stressed that some metabolites observedmight result from the coupling of ABu62 derivatives withmolecules issued from the fungal metabolism and maytherefore be difficult to identify without further isolation.Therefore, no structures were proposed for these signals.After one month, the peak at m/z 302 remained the mainpeak that could be observed and a significant decrease inthe signal to noise level on entire spectra indicated thatthe metabolite concentration was probably lower than onday 14. This compound was identified as 1-aminoanthr-aquinone-2-sulfonic acid (6) based on ESI-MS and ESI-MS–MS analysis (Glanzel et al., 2005) and correspondedto M7 observed through CE. During the isolation of M1,
two additional compounds were purified through semi pre-parative HPLC and identified by 1H NMR as catechol (7)and 2,5-diamino-3,4-dicarboxy-benzenesulfonic acid (8).
3.4. Integration of the results and suggested metabolic
pathway
In previous studies, decolourisation was generally inter-preted as being the result of degradation of the originalchromophore (Schliephake et al., 2000; Maximo et al.,2003; Maximo and Costa-Ferreira, 2004). This degradationwas also suggested by Conneely et al. (2002) who analysedthrough CE, LC and polarography the products formedduring the biotransformation of phtalocyanines dyes into
S. Vanhulle et al. / Chemosphere 70 (2008) 1097–1107 1105
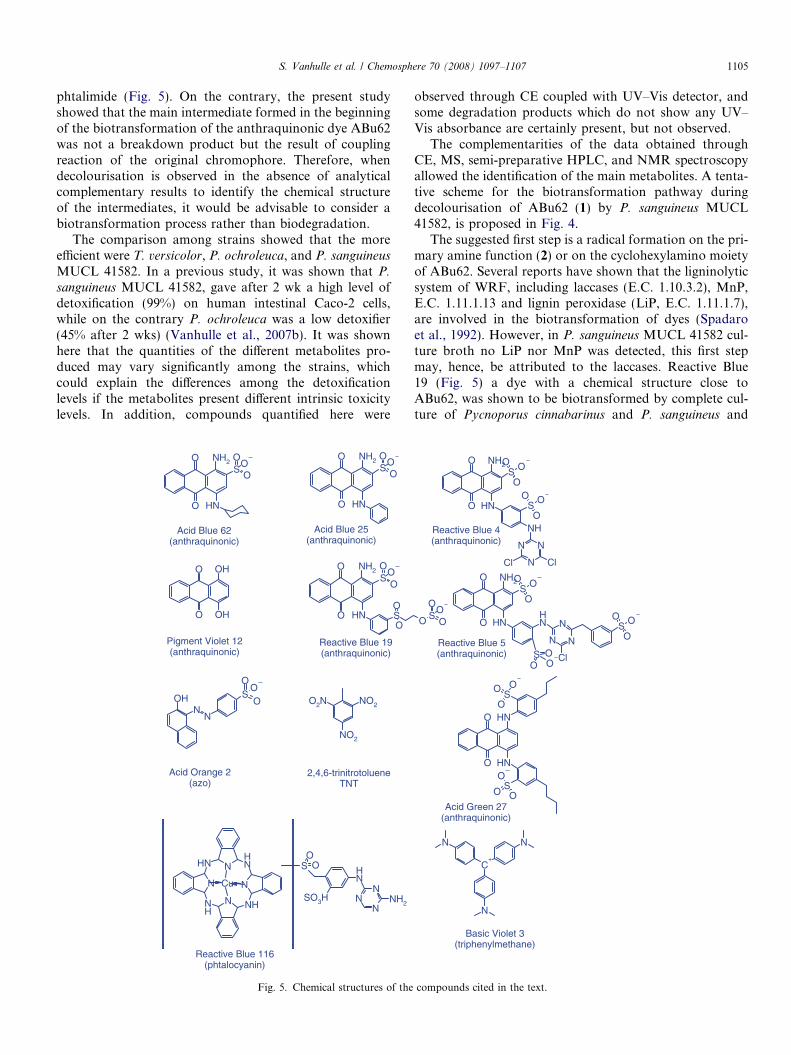
phtalimide (Fig. 5). On the contrary, the present studyshowed that the main intermediate formed in the beginningof the biotransformation of the anthraquinonic dye ABu62was not a breakdown product but the result of couplingreaction of the original chromophore. Therefore, whendecolourisation is observed in the absence of analyticalcomplementary results to identify the chemical structureof the intermediates, it would be advisable to consider abiotransformation process rather than biodegradation.
The comparison among strains showed that the moreefficient were T. versicolor, P. ochroleuca, and P. sanguineus
MUCL 41582. In a previous study, it was shown that P.
sanguineus MUCL 41582, gave after 2 wk a high level ofdetoxification (99%) on human intestinal Caco-2 cells,while on the contrary P. ochroleuca was a low detoxifier(45% after 2 wks) (Vanhulle et al., 2007b). It was shownhere that the quantities of the different metabolites pro-duced may vary significantly among the strains, whichcould explain the differences among the detoxificationlevels if the metabolites present different intrinsic toxicitylevels. In addition, compounds quantified here were
O
O
NH2
NH
SO
OO
O
O
NH2
NH
SO
OO
O
O
NH2
NH
SO
OO
SO
O
OHN
N
SO
OO
O
O
OH
OH
NO2
NO2
O2N
N
NH
NH
NNH
N
NH N
Cu
SO
ONH
NN
NNH2
SO3H
Acid Orange 2(azo)
Acid Blue 62(anthraquinonic)
Acid Blue 25(anthraquinonic)
Pigment Violet 12(anthraquinonic)
2,4,6-trinitrotolueneTNT
Reactive Blue 19(anthraquinonic)
Reactive Blue 116(phtalocyanin)
Fig. 5. Chemical structures of the
observed through CE coupled with UV–Vis detector, andsome degradation products which do not show any UV–Vis absorbance are certainly present, but not observed.
The complementarities of the data obtained throughCE, MS, semi-preparative HPLC, and NMR spectroscopyallowed the identification of the main metabolites. A tenta-tive scheme for the biotransformation pathway duringdecolourisation of ABu62 (1) by P. sanguineus MUCL41582, is proposed in Fig. 4.
The suggested first step is a radical formation on the pri-mary amine function (2) or on the cyclohexylamino moietyof ABu62. Several reports have shown that the ligninolyticsystem of WRF, including laccases (E.C. 1.10.3.2), MnP,E.C. 1.11.1.13 and lignin peroxidase (LiP, E.C. 1.11.1.7),are involved in the biotransformation of dyes (Spadaroet al., 1992). However, in P. sanguineus MUCL 41582 cul-ture broth no LiP nor MnP was detected, this first stepmay, hence, be attributed to the laccases. Reactive Blue19 (Fig. 5) a dye with a chemical structure close toABu62, was shown to be biotransformed by complete cul-ture of Pycnoporus cinnabarinus and P. sanguineus and
O SO
OO
SO
O O
O
O
NH2
NH
SO
O O
NH
N
N
N
Cl Cl
SO O
O
SO
O O
O
O
NH
NH
SO
O ONH
N N
N
ClSO
OO
O
O
NH2
NH
SO
O O
C+
N N
N
Reactive Blue 4(anthraquinonic)
Acid Green 27(anthraquinonic)
Reactive Blue 5(anthraquinonic)
Basic Violet 3(triphenylmethane)
compounds cited in the text.
1106 S. Vanhulle et al. / Chemosphere 70 (2008) 1097–1107
laccases were reported to be implicated in the biotransfor-mation (Schliephake and Lonergan, 1996; Camarero et al.,2005; Trovaslet et al., 2007; Vanhulle et al., 2007a).
Other reactions may produce radicals having lost thecyclohexyl moiety (3, 3 0, Table 2) and the reduced or oxi-dized forms (9, 10). Compounds 9 and 10 being alwaysobserved at the trace level (peaks at m/z 317 and 315), itis supposed that they are promptly converted to otherproducts. Compound 9 was already proposed: by Bouzaidaet al. (2004) during the photooxidation of Acid Blue 25(Fig. 5), which is structurally closely related to ABu62. Inaddition, the imine form 10 was proposed by Carneiroet al. (2005) during the electrochemical oxidation of Reac-tive Blue 4 (Fig. 5). Other MS signals, 333 (11, 11 0, 1100) and415 (12, 12 0, 1200) (Table 2), were observed in reduced rela-tive abundance and may be intermediates with short livetimes. The position of the oxygen could not be determinedas it was not possible to isolate these compounds.
The coupling between radicals 2, 2 0 and 3, 3 0 could leadto the formation of the azodianthraquinone 5 (M1) after anoxidative step (which could be catalysed by laccase). Theazoic compound 5, may also be formed through an azoxyintermediate issued from compounds 11 and 12 as previ-ously proposed in the case of trinitrotoluene reactions(Hawari et al., 2000; Esteve-Nunez et al., 2001). The com-pounds 6–7–8 could be obtained through degradation of 5
by fungi but also from other intermediates through the for-mation of lactones such as compound 11 0 since Itoh et al.(1998) proposed a lactone (similar to 11 0) during the degra-dation of Pigment violet 12 by Coriolus versicolor. We sug-gest that formation of hydroxylamines 11 and 12 mayresult from the action of hydroxyl radicals which couldbe provided through Fenton reaction catalysed by cellobi-ose dehydrogenases (Mason et al., 2003). The presence ofthis last enzyme in P. sanguineus MUCL 41582 mediumbroth was already observed (Vanhulle et al., 2007a). Occur-rence of hydroxylamine was observed during fungalbiotransformation of TNT (Hawari et al., 2000; Esteve-Nunez et al., 2001). However, they were formed by reduc-tion of nitro compound and not by oxidation of amine.
WRF are known for their ability to mineralise xenobiot-ics (Semple and Fermor, 1997; Eggen and Majcherczyk,1998), however this study was focussed on the organicintermediates observable through CE and ESI-MS.
Other dyes with chemical structures close to ABu62(Fig. 5) are widely used such as Reactive Blue 19 (RemazolBrilliant Blue R), Acid Blue 25 or Acid Green 27 (Soareset al., 2001; Claus et al., 2002; Kiiskinen et al., 2004; Cham-pagne and Ramsay, 2005; Eichlerova et al., 2005; Palmieriet al., 2005). However no data on their biotransformationproducts are available. Therefore, the present results canbe of great interest for the study of the bioconversion path-ways of other anthraquinonic dyes. In addition, the forma-tion of red compounds from blue anthraquinone wasalready observed during the biotransformation of ReactiveBlue 5 using WRF peroxidases (Sugano et al., 2006).
4. Conclusions
This study aimed at comparing the decolourisation of ananthraquinonic acid dye ABu62 by six WRF strains, todetermine the metabolites produced and to propose a met-abolic pathway. The first step was the formation of radicalsthrough the action of laccase. Our results showed that allstrains produced seven common main metabolites. In 2–7 d, the formation of a main red compound was observed.It was characterized as a dimer of the initial moleculeminus a cyclohexyl moiety with the formation of an azobond. The biotransformation of the red products wasslower and led mainly to the formation of uncolouredmetabolites. The main aromatic metabolite produced dur-ing the second phase was shown to be a breakdown prod-uct. Further experiments are under progress to identifyother enzymes and reactions that are involved in the meta-bolic pathway.
Acknowledgements
This work was supported by the Directorate forTechnology, Research and Energy of the WalloonRegional Government of Belgium (BIOVAL 981/3870and CHAMBOIS) as well as the European Commission,Sixth Framework Program (SOPHIED contract NMP2-CT2004-505899). The authors would like to thank Pr.Rebecca Pogni for helpful discussions. Raoul Rosenbergand David Chapon are kindly acknowledged for recordingmass and NMR spectra. Technical assistance of V. Mer-tens, F. Naveau, Trieu-Tran Van and H.C. Massart isgratefully acknowledged. Jacqueline Marchand-Brynaertis senior research-associate of the FNRS (Belgium).
References
Blatny, P., Fischer, C.H., Rizzi, A., Kenndler, E., 1995. Linear polymersapplied as pseudo-phases in capillary zone electrophoresis of azocompounds used as textile dyes. J. Chromatogr. A 717, 157–166.
Borros, S., Barbera, G., Biada, J., Agullo, N., 1999. The use of capillaryelectrophoresis to study the formation of carcinogenic aryl amines inazo dyes. Dyes Pigm. 43, 189–196.
Bouzaida, I., Ferronato, C., Chovelon, J.M., Rammah, M.E., Herrmann,J.M., 2004. Heterogeneous photocatalytic degradation of the anthra-quinonic dye, Acid Blue 25 (AB25): a kinetic approach. J. Photochem.Photobiol. A 168, 23–30.
Burkinshaw, S.M., Hinks, D., Lewis, D.M., 1993. Capillary zoneelectrophoresis in the analysis of dyes and other compounds employedin the dye-manufacturing and dye-using industries. J. Chromatogr.640, 413–417.
Camarero, S., Ibarra, D., Martinez, M.J., Martinez, A.T., 2005. Lignin-derived compounds as efficient laccase mediators for decolorization ofdifferent types of recalcitrant dyes. Appl. Environ. Microb. 71, 1775–1784.
Carneiro, P.A., Osugi, M.E., Fugivara, C.S., Boralle, N., Furlan, M.B.,Zanoni, M.V., 2005. Evaluation of different electrochemical methodson the oxidation and degradation of Reactive Blue 4 in aqueoussolution. Chemosphere 59, 431–439.
Cerniglia, C.E., Freeman, J.P., Franklin, W., Pack, L.D., 1982a. Meta-bolism of azo dyes derived from benzidine, 3,30-dimethyl-benzidine

S. Vanhulle et al. / Chemosphere 70 (2008) 1097–1107 1107
and 3,30-dimethoxybenzidine to potentially carcinogenic aromaticamines by intestinal bacteria. Carcinogenesis 3, 1255–1260.
Cerniglia, C.E., Freeman, J.P., Franklin, W., Pack, L.D., 1982b. Metab-olism of benzidine and benzidine-congener based dyes by human,monkey and rat intestinal bacteria. Biochem. Biophys. Res. Co. 107,1224–1229.
Champagne, P.P., Ramsay, J.A., 2005. Contribution of manganeseperoxidase and laccase to dye decoloration by Trametes versicolor.Appl. Microbiol. Biotechnol. 69, 276–285.
Claus, H., Faber, G., Konig, H., 2002. Redox-mediated decolorization ofsynthetic dyes by fungal laccases. Appl. Microbiol. Biotechnol. 59,672–678.
Conneely, A., Smyth, W.F., McMullan, G., 2002. Study of the white-rotfungal degradation of selected phthalocyanine dyes by capillaryelectrophoresis and liquid chromatography. Anal. Chim. Acta 451,259–270.
Eggen, T., Majcherczyk, A., 1998. Removal of polycyclic aromatichydrocarbons (PAH) in contaminated soil by white rot fungusPleurotus ostreatus. Int. Biodeter. Biodegr. 41, 111–117.
Eichlerova, I., Homolka, L., Lisa, L., Nerud, F., 2005. Orange G andRemazol Brilliant Blue R decolorization by white rot fungi Dichomitus
squalens, Ischnoderma resinosum and Pleurotus calyptratus. Chemo-sphere 60, 398–404.
Esteve-Nunez, A., Caballero, A., Ramos, J.L., 2001. Biological degrada-tion of 2,4,6-trinitrotoluene. Microbiol. Mol. Biol. R. 65, 335–352.
Fu, Y., Viraraghavan, T., 2001. Fungal decolorization of dye wastewaters:a review. Biores. Technol. 79, 251–262.
Glanzel, M., Bultmann, R., Starke, K., Frahm, A.W., 2005. Structure-activity relationships of novel P2-receptor antagonists structurallyrelated to Reactive Blue 2. Eur. J. Med. Chem. 40, 1262–1276.
Hawari, J., Beaudet, S., Halasz, A., Thiboutot, S., Ampleman, G., 2000.Microbial degradation of explosives: biotransformation versus miner-alization. Appl. Microbiol. Biotechnol. 54, 605–618.
Itoh, K., Kitade, Y., Yatome, C., 1998. Oxidative biodegradation of ananthraquinone dye, pigment violet 12, by Coriolus versicolor. Bull.Environ. Contam. Toxicol. 60, 786–790.
Jandera, P., Fischer, J., Stanek, V., Kucerova, M., Zvonicek, P., 1996.Separation of aromatic sulphonic acid dye intermediates by high-performance liquid chromatography and capillary zone electrophore-sis. J. Chromatogr. A 738, 201–213.
Kiiskinen, L.L., Ratto, M., Kruus, K., 2004. Screening for novel laccase-producing microbes. J. Appl. Microbiol. 97, 640–646.
Lopez, C., Valade, A.G., Combourieu, B., Mielgo, I., Bouchon, B., Lema,J.M., 2004. Mechanism of enzymatic degradation of the azo dyeOrange II determined by ex situ 1H nuclear magnetic resonance andelectrospray ionization–ion trap mass spectrometry. Anal. Biochem.335, 135–149.
Mason, M.G., Nicholls, P., Wilson, M.T., 2003. Rotting by radicals – therole of cellobiose oxidoreductase? Biochem. Soc. T. 31, 1335–1336.
Maximo, C., Amorim, M.T.P., Costa-Ferreira, M., 2003. Biotransforma-tion of industrial reactive azo dyes by Geotrichum sp. CCMI 1019.Enzyme Microb. Technol. 32, 145–151.
Maximo, C., Costa-Ferreira, M., 2004. Decolourisation of reactive textiledyes by Irpex lacteus and lignin modifying enzymes. Process Biochem.39, 1475–1479.
Palmieri, G., Cennamo, G., Sannia, G., 2005. Remazol Brilliant Blue Rdecolourisation by the fungus Pleurotus ostreatus and its oxidativeenzymatic system. Enzyme Microb. Technol. 36, 17–24.
Ramsay, J.A., Nguyen, T., 2002. Decoloration of textile dyes by Trametes
versicolor and its effect on dye toxicity. Biotechnol. Lett. 24, 1757–1761.
Saquib, M., Muneer, M., 2002. Semiconductor mediated photocatalyseddegradation of an anthraquinone dye, Remazol Brilliant Blue R undersunlight and artificial light source. Dyes Pigm. 53, 237–249.
Schliephake, K., Lonergan, G.T., 1996. Laccase variation during dyedecolourisation in a 200 l packed-bed bioreactor. Biotechnol. Lett. 18,881–886.
Schliephake, K., Mainwaring, D.E., Lonergan, G.T., Jones, I.K., Baker,W.L., 2000. Transformation and degradation of the disazo dyeChicago Sky Blue by a purified laccase from Pycnoporus cinnabarinus.Enzyme Microb. Technol. 27, 100–107.
Semple, K.T., Fermor, T.R., 1997. Enhanced mineralization of UL-14C-pentachlorophenol by mushroom composts. Res. Microbiol. 148, 795–798.
Soares, G.M., Costa-Ferreira, M., Pessoa de Amorim, M.T., 2001.Decolorization of an anthraquinone-type dye using a laccase formu-lation. Biores. Technol. 79, 171–177.
Spadaro, J.T., Gold, M.H., Renganathan, V., 1992. Degradation of azodyes by the lignin-degrading fungus Phanerochaete chrysosporium.Appl. Environ. Microb. 58, 2397–2401.
Sugano, Y., Matsushima, Y., Shoda, M., 2006. Complete decolorizationof the anthraquinone dye Reactive blue 5 by the concerted action oftwo peroxidases from Thanatephorus cucumeris. Appl. Microbiol.Biotechnol. 73, 862–871.
Tatarko, M., Bumpus, J.A., 1998. Further studies on the inactivation bysodium azide of lignin peroxidase from Phanerochaete chrysosporium
arch. Biochem. Biophys. 349, 200–209.Todres, Z., 2003. Organic Ion Radical – Chemistry and Application.
Marcel Dekker Inc., New york.Trovaslet, M., Enaud, E., Guiavarc’h, Y., Corbisier, A.M., Vanhulle, S.,
2007. Potential of a Pycnoporus sanguineus laccase in bioremediationof wastewater and kinetic activation in the presence of an anthraqui-nonic acid dye. Enzyme Microb. Technol. 41, 368–376.
Vanhulle, S., Enaud, E., Trovaslet, M., Nouaimeh, N., Bols, C.M.,Keshavarz, T., Tron, T., Sannia, G., Corbisier, A.M., 2007a. Overlapof laccases/cellobiose dehydrogenase activities during the decolourisa-tion of anthraquinonic dyes with close chemical structure by Pycnop-
orus strains. Enzyme Microb. Technol. 40, 1723–1731.Vanhulle, S., Trovaslet, M., Enaud, E., Lucas, M., Sonveaux, M., Decock,
C., Onderwater, R., Schneider, Y.-J., Corbisier, A.-M., 2007b.Cytotoxicity and genotoxicity evolution during decolourisation ofdyes by White Rot Fungi. World J. Microbiol. Biotechnol., in press,doi:10.1007/s11274-007-9475-7.
Vanhulle, S., Lucas, M., Mertens, V., Gobeaux, B., Corbisier, A.M., Bols,C.M., Buchon, F., Wesenberg, D., Agathos, S.N. 2003. Sustainableprocess for the treatment and detoxification of liquid waste. PatentWO 03/035561.
Wang, Y., Yu, J., 1998. Adsorption and degradation of synthetic dyes onthe mycelium of Trametes versicolor. Water Sci. Technol. 38 (4–5),233–238.
Wesenberg, D., Kyriakides, I., Agathos, S.N., 2003. White-rot fungi andtheir enzymes for the treatment of industrial dye effluents. Biotechnol.Adv. 22, 161–187.
Zille, A., Gornacka, B., Rehorek, A., Cavaco-Paulo, A., 2005. Degrada-tion of azo dyes by Trametes villosa laccase over long periods ofoxidative conditions. Appl. Environ. Microb. 71, 6711–6718.
Copyright © 2022 FDOKUMEN