Using Fluorescence Spectroscopy to Detect Rot in Fruit and ...
11
Citation: Matveyeva, T.A.; Sarimov, R.M.; Simakin, A.V.; Astashev, M.E.; Burmistrov, D.E.; Lednev, V.N.; Sdvizhenskii, P.A.; Grishin, M.Y.; Pershin, S.M.; Chilingaryan, N.O.; et al. Using Fluorescence Spectroscopy to Detect Rot in Fruit and Vegetable Crops. Appl. Sci. 2022, 12, 3391. https://doi.org/ 10.3390/app12073391 Academic Editors: Daniel Cozzolino, Alexey V. Shkirin and Leonid L. Chaikov Received: 18 February 2022 Accepted: 22 March 2022 Published: 27 March 2022 Publisher’s Note: MDPI stays neutral with regard to jurisdictional claims in published maps and institutional affil- iations. Copyright: © 2022 by the authors. Licensee MDPI, Basel, Switzerland. This article is an open access article distributed under the terms and conditions of the Creative Commons Attribution (CC BY) license (https:// creativecommons.org/licenses/by/ 4.0/). applied sciences Article Using Fluorescence Spectroscopy to Detect Rot in Fruit and Vegetable Crops Tatiana A. Matveyeva 1, *, Ruslan M. Sarimov 1 , Alexander V. Simakin 1 , Maxim E. Astashev 1 , Dmitriy E. Burmistrov 1 , Vasily N. Lednev 1 , Pavel A. Sdvizhenskii 1 , Mikhail Ya. Grishin 1 , Sergey M. Pershin 1 , Narek O. Chilingaryan 2 , Natalya A. Semenova 2 , Alexey S. Dorokhov 2 and Sergey V. Gudkov 1,2,3 1 Prokhorov General Physics Institute of the Russian Academy of Sciences (GPI RAS), 119991 Moscow, Russia; [email protected] (R.M.S.); [email protected] (A.V.S.); [email protected] (M.E.A.); [email protected] (D.E.B.); [email protected] (V.N.L.); [email protected] (P.A.S.); [email protected] (M.Y.G.); [email protected] (S.M.P.); [email protected] (S.V.G.) 2 Federal State Budgetary Scientific Institution “Federal Scientific Agroengineering Center VIM”, 109428 Moscow, Russia; [email protected] (N.O.C.); [email protected] (N.A.S.); [email protected] (A.S.D.) 3 The Institute of Biology and Biomedicine, Lobachevsky State University of Nizhny Novgorod, 603105 Nizhny Novgorod, Russia * Correspondence: [email protected] Abstract: The potential of the method of fluorescence spectroscopy for the detection of damage and diseases of fruits and vegetables was studied. For this purpose, the spectra of fluorescence of healthy and rotten apples and potatoes have been investigated. Excitation of samples was carried out using a continuous semiconductor laser with a wavelength of 405 nm and a pulsed solid-state laser with a wavelength of 527 nm. Peaks in the region of 600–700 nm in rotten samples were shifted towards shorter wavelengths for most samples in both modes of spectroscopy. The differences in the fluorescence spectra of a healthy and rotten apple surface have been revealed to be in the spectral range of 550–650 nm for 405 nm continuous excitation. When exposed to a laser in a pulsed mode (527 nm), the contribution of the 630 nm peak in the spectrum increases in rotten samples. The observed differences make it possible to use this method for separating samples of healthy and rotten fruits and vegetables. The article paid attention to the influence of many factors such as sample thickness, time after excitation, contamination by soil and dust, cultivar, and location of the probing on fluorescence spectra. Keywords: fluorescence; rot detection; apple; potato 1. Introduction Population growth opens new challenges for improving efficiency and productivity of the agriculture and food production industry, which can be solved with the development of new sensing technologies capable of providing in vivo or/and onsite monitoring. One of the high-tech solutions in this field is fluorescence spectroscopy. Fluorescence is used to test authenticity of different categories of food products [1–3], analyze the quality of fruits [4,5], diagnose of plant diseases [6,7], and obtain information about the influence of environmental stress factors on agricultural crops [6,8–11]. The kinetics of the development of apple disease at the early stage of fungal infection is studied under laboratory conditions using chlorophyll fluorescence [12]. In addition, fluorescence under laboratory conditions was used to detect patulin toxin in apples [13] and diagnose fungal diseases or substances harmful to humans in potato tubers [14,15]. On the other hand, the development of inexpensive, sensitive methods for detection of fluorescence leads to the development of portable devices that can diagnose the content Appl. Sci. 2022, 12, 3391. https://doi.org/10.3390/app12073391 https://www.mdpi.com/journal/applsci
-
Upload
khangminh22 -
Category
Documents
-
view
1 -
download
0
Transcript of Using Fluorescence Spectroscopy to Detect Rot in Fruit and ...
�����������������
Citation: Matveyeva, T.A.; Sarimov,
R.M.; Simakin, A.V.; Astashev, M.E.;
Burmistrov, D.E.; Lednev, V.N.;
Sdvizhenskii, P.A.; Grishin, M.Y.;
Pershin, S.M.; Chilingaryan, N.O.;
et al. Using Fluorescence
Spectroscopy to Detect Rot in Fruit
and Vegetable Crops. Appl. Sci. 2022,
12, 3391. https://doi.org/
10.3390/app12073391
Academic Editors: Daniel Cozzolino,
Alexey V. Shkirin and Leonid
L. Chaikov
Received: 18 February 2022
Accepted: 22 March 2022
Published: 27 March 2022
Publisher’s Note: MDPI stays neutral
with regard to jurisdictional claims in
published maps and institutional affil-
iations.
Copyright: © 2022 by the authors.
Licensee MDPI, Basel, Switzerland.
This article is an open access article
distributed under the terms and
conditions of the Creative Commons
Attribution (CC BY) license (https://
creativecommons.org/licenses/by/
4.0/).
applied sciences
Article
Using Fluorescence Spectroscopy to Detect Rot in Fruit andVegetable CropsTatiana A. Matveyeva 1,*, Ruslan M. Sarimov 1 , Alexander V. Simakin 1, Maxim E. Astashev 1,Dmitriy E. Burmistrov 1 , Vasily N. Lednev 1 , Pavel A. Sdvizhenskii 1, Mikhail Ya. Grishin 1 ,Sergey M. Pershin 1, Narek O. Chilingaryan 2 , Natalya A. Semenova 2 , Alexey S. Dorokhov 2
and Sergey V. Gudkov 1,2,3
1 Prokhorov General Physics Institute of the Russian Academy of Sciences (GPI RAS), 119991 Moscow, Russia;[email protected] (R.M.S.); [email protected] (A.V.S.); [email protected] (M.E.A.);[email protected] (D.E.B.); [email protected] (V.N.L.); [email protected] (P.A.S.);[email protected] (M.Y.G.); [email protected] (S.M.P.); [email protected] (S.V.G.)
2 Federal State Budgetary Scientific Institution “Federal Scientific Agroengineering Center VIM”,109428 Moscow, Russia; [email protected] (N.O.C.); [email protected] (N.A.S.);[email protected] (A.S.D.)
3 The Institute of Biology and Biomedicine, Lobachevsky State University of Nizhny Novgorod,603105 Nizhny Novgorod, Russia
* Correspondence: [email protected]
Abstract: The potential of the method of fluorescence spectroscopy for the detection of damageand diseases of fruits and vegetables was studied. For this purpose, the spectra of fluorescence ofhealthy and rotten apples and potatoes have been investigated. Excitation of samples was carriedout using a continuous semiconductor laser with a wavelength of 405 nm and a pulsed solid-statelaser with a wavelength of 527 nm. Peaks in the region of 600–700 nm in rotten samples were shiftedtowards shorter wavelengths for most samples in both modes of spectroscopy. The differences in thefluorescence spectra of a healthy and rotten apple surface have been revealed to be in the spectralrange of 550–650 nm for 405 nm continuous excitation. When exposed to a laser in a pulsed mode(527 nm), the contribution of the 630 nm peak in the spectrum increases in rotten samples. Theobserved differences make it possible to use this method for separating samples of healthy and rottenfruits and vegetables. The article paid attention to the influence of many factors such as samplethickness, time after excitation, contamination by soil and dust, cultivar, and location of the probingon fluorescence spectra.
Keywords: fluorescence; rot detection; apple; potato
1. Introduction
Population growth opens new challenges for improving efficiency and productivity ofthe agriculture and food production industry, which can be solved with the developmentof new sensing technologies capable of providing in vivo or/and onsite monitoring. Oneof the high-tech solutions in this field is fluorescence spectroscopy. Fluorescence is usedto test authenticity of different categories of food products [1–3], analyze the quality offruits [4,5], diagnose of plant diseases [6,7], and obtain information about the influence ofenvironmental stress factors on agricultural crops [6,8–11].
The kinetics of the development of apple disease at the early stage of fungal infectionis studied under laboratory conditions using chlorophyll fluorescence [12]. In addition,fluorescence under laboratory conditions was used to detect patulin toxin in apples [13]and diagnose fungal diseases or substances harmful to humans in potato tubers [14,15].
On the other hand, the development of inexpensive, sensitive methods for detectionof fluorescence leads to the development of portable devices that can diagnose the content
Appl. Sci. 2022, 12, 3391. https://doi.org/10.3390/app12073391 https://www.mdpi.com/journal/applsci
Appl. Sci. 2022, 12, 3391 2 of 11
of chlorophyll and some other compounds in fruits and leaves with accuracy comparableto laboratory studies [16].
The study of fluorescence spectra of the main diseases of fruit and vegetable cropsare of interest not only from a scientific point of view, but also for solving many ap-plied problems in agriculture. Therefore, the main goal of the work is the application ofinexpensive methods of fluorescence spectroscopy for rot disease diagnosis and separa-tion/quantification of healthy and diseased fruits and vegetables.
2. Materials and Methods
Fluorescence spectroscopy using laser sources was used for the detection of apple andpotato rot infection. Two radiation sources and various spectrometers, as well as varioussamples, were used for the study.
2.1. Experiments with a 405 nm Continuous Laser
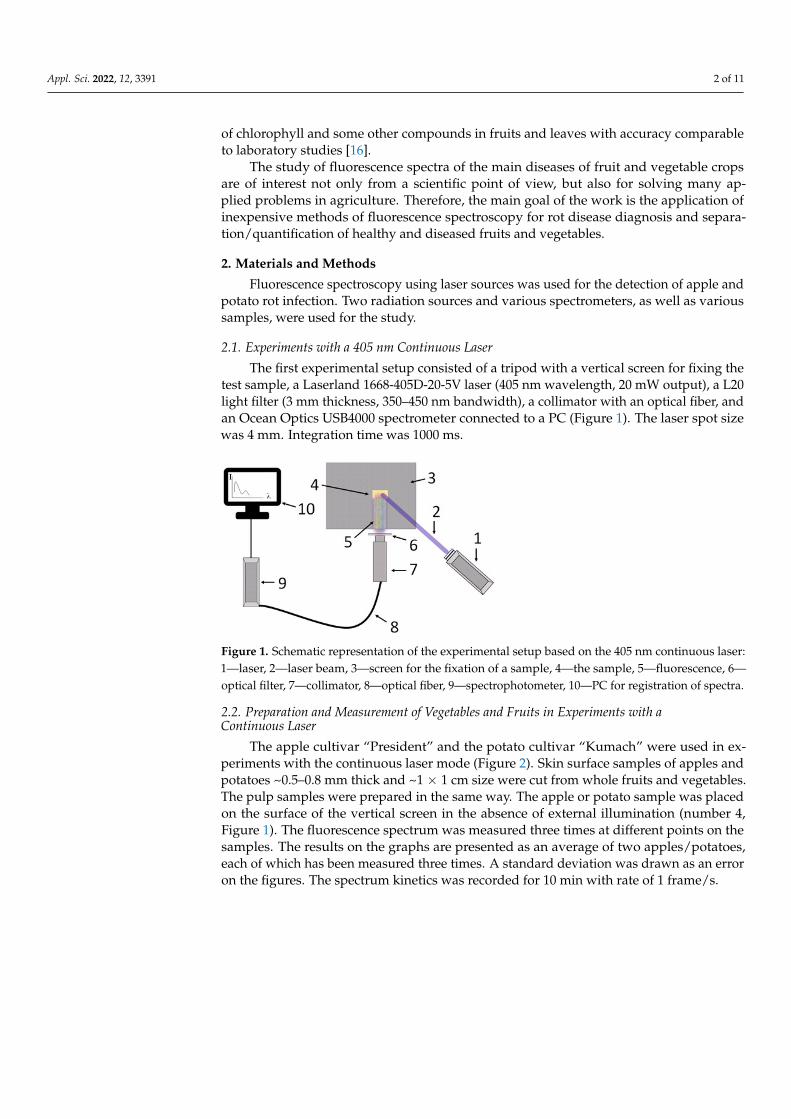
The first experimental setup consisted of a tripod with a vertical screen for fixing thetest sample, a Laserland 1668-405D-20-5V laser (405 nm wavelength, 20 mW output), a L20light filter (3 mm thickness, 350–450 nm bandwidth), a collimator with an optical fiber, andan Ocean Optics USB4000 spectrometer connected to a PC (Figure 1). The laser spot sizewas 4 mm. Integration time was 1000 ms.
Figure 1. Schematic representation of the experimental setup based on the 405 nm continuous laser:1—laser, 2—laser beam, 3—screen for the fixation of a sample, 4—the sample, 5—fluorescence, 6—optical filter, 7—collimator, 8—optical fiber, 9—spectrophotometer, 10—PC for registration of spectra.
2.2. Preparation and Measurement of Vegetables and Fruits in Experiments with aContinuous Laser
The apple cultivar “President” and the potato cultivar “Kumach” were used in ex-periments with the continuous laser mode (Figure 2). Skin surface samples of apples andpotatoes ~0.5–0.8 mm thick and ~1 × 1 cm size were cut from whole fruits and vegetables.The pulp samples were prepared in the same way. The apple or potato sample was placedon the surface of the vertical screen in the absence of external illumination (number 4,Figure 1). The fluorescence spectrum was measured three times at different points on thesamples. The results on the graphs are presented as an average of two apples/potatoes,each of which has been measured three times. A standard deviation was drawn as an erroron the figures. The spectrum kinetics was recorded for 10 min with rate of 1 frame/s.

Appl. Sci. 2022, 12, 3391 3 of 11
Figure 2. Apples and potatoes were used in experiments with continuous-wave fluorescence spec-troscopy. Healthy (left) and rotten (right) samples.
2.3. Experiments with a 527 nm Pulsed Laser
A compact Raman lidar was used to record the fluorescence spectra in the secondpart of experiment. Lidar is based on a diode-pumped pulsed Nd:YLiF4 solid-state laser(Laser Compact, DTL-319QT: 527 nm, 5 ns, 1 kHz, 200 µJ/pulse) [17]. The laser beam wasdirected to the sample using two rotating prisms. The laser spot diameter was 0.5 mm(measured by burn paper). The radiation scattered from the object was collected using aquartz lens. The signal recording system consists of the compact spectrograph (SpectraPhysics, MS127i) (Andor Technology Ltd., Belfast, Northern Ireland) (with an opticalresolution of 0.22 nm) equipped with the intensified CCD (ICCD) camera (Andor iStar)(Andor Technology Ltd., Belfast, Northern Ireland). To increase the signal-to-noise ratio,a diffraction grating with a small dispersion (400 lines/mm) and a 250 µm micron wideinput slit were used. In order to avoid damage of the detector by scattered laser radiation,a band-pass light filter OS-13 was used for signal registration (Figure 3). The use of Lidardoes not require sample darkening from external illumination since a pulsed source and agated detector are used; however, this is necessary for a continuous laser. All gating wasperformed with the help of a built-in pulse generator in an ICCD camera. Chlorophyllfluorescence delay depends on different environments, but is generally less than 3 ns for insitu measurements [18]. Consequently, the detection gate was set to 10 ns in order to fitthe pumping laser pulse duration, fluorescence delay, and jitter of gating (3 ns). The delaybetween the laser pulse and detection gate was varied in order to maximize backscatteredelastic scattering; fluorescence spectrum intensity was also maximized (due to chosen gateduration).
Figure 3. Scheme of an experimental setup based on pulsed fluorescence spectroscopy: 1—laser, 2—prisms, 3—Al mirror, 4—lens, 5—the sample, 6—motorized stage, 7—spectrograph with intensifiedCCD ICCD camera, 8—fluorescence spectrum.

Appl. Sci. 2022, 12, 3391 4 of 11
2.4. Preparation and Measurement of Vegetables and Fruits in Experiments Pulsed Laser Mode
Two apple cultivars and potato cultivars “Udacha” (healthy) and “Zhukovsky” (rotten)were used in the experiments with the pulsed laser. All apple and potato samples wereprovided by the Federal Scientific Agroengineering Center VIM (Moscow) (Figure 4).
Figure 4. Apples and potatoes used in experiments with pulsed fluorescence spectroscopy. Healthy(top) and rotten (bottom) samples.
Initially, the fluorescence spectra of unwashed potatoes were recorded. The spectrumwas averaged from the entire potato surface. Next, the potatoes were thoroughly washedfrom dust and soil residues without damaging the peel. The fluorescence spectra of washedand unwashed potatoes were compared to assess the contribution of dust and soil to theoverall spectrum. Moreover, the fluorescence spectra for different zones of the rottenpotatoes were recorded. Samples of potatoes were cut in half to examine the internal partsof the potatoes. Spectra were recorded in various tuber regions, the area in the center of thepotato (clearly visible to the eye), and the main volume of the potato.
The fluorescence spectra of outer parts of healthy and rotting apples were regis-tered. Apples were cut and the spectra of the spoiled pulp and the healthy sampleswere compared.
3. Results and Discussion3.1. Experiments with a 405 nm Continuous Laser
Figure 5 shows the spectrum of fluorescence of the surface (left) and pulp (right)of a healthy and rotten apple. Two peaks can be identified on the spectra: in the green(520–530 nm) and in the red (680 nm) regions. Peaks in the blue-green fluorescence region(440–540 nm) are mainly associated with cinnamic and coumarin acids, some alkaloidsand flavonoids [19]. The latter are usually located in the cell wall [19] and perform mainlyantioxidant functions and protect against fungal and viral diseases [20].
The peak in the red area is well described in many studies; it is the peak of chlorophyll.Previously, for green leaves, it was shown that the ratio of the intensities of the peaks680/740 depends on the concentration of chlorophyll [21]. The existence of a peak at680 nm and the absence of a peak at an excitation of 405 nm at 740 nm confirms thepresence of a small amount of chlorophyll in apple samples.

Appl. Sci. 2022, 12, 3391 5 of 11
Figure 5. (a) Continuous-wave fluorescence spectra of healthy (blue) and rotten (red) surface of apple;(b) continuous-wave fluorescence spectra of healthy (blue) and rotten (red) pulp of apple.
In Figure 5, the spectral differences between healthy and rot-affected fruits are visible.In samples affected by rotting, the peak of the maximum of chlorophyll is shifted from680 nm to 675.5 nm, indicating a decrease in chlorophyll concentration. The seconddifference in the surface is the “plateau” between peaks in green (520 nm) and red (680 nm)regions. Healthy samples do not show a significant decrease in intensity between peaks.This plateau in the yellow-orange region (550–650 nm) is most likely due to the presence ofriboflavin, carotenoids, and flavonoids [19]. The differences are even more pronounced forthe apple pulp (Figure 5b). The fluorescence amplitude of the apple pulp affected by rot isreliably much smaller than the healthy specimens in the whole investigated region.
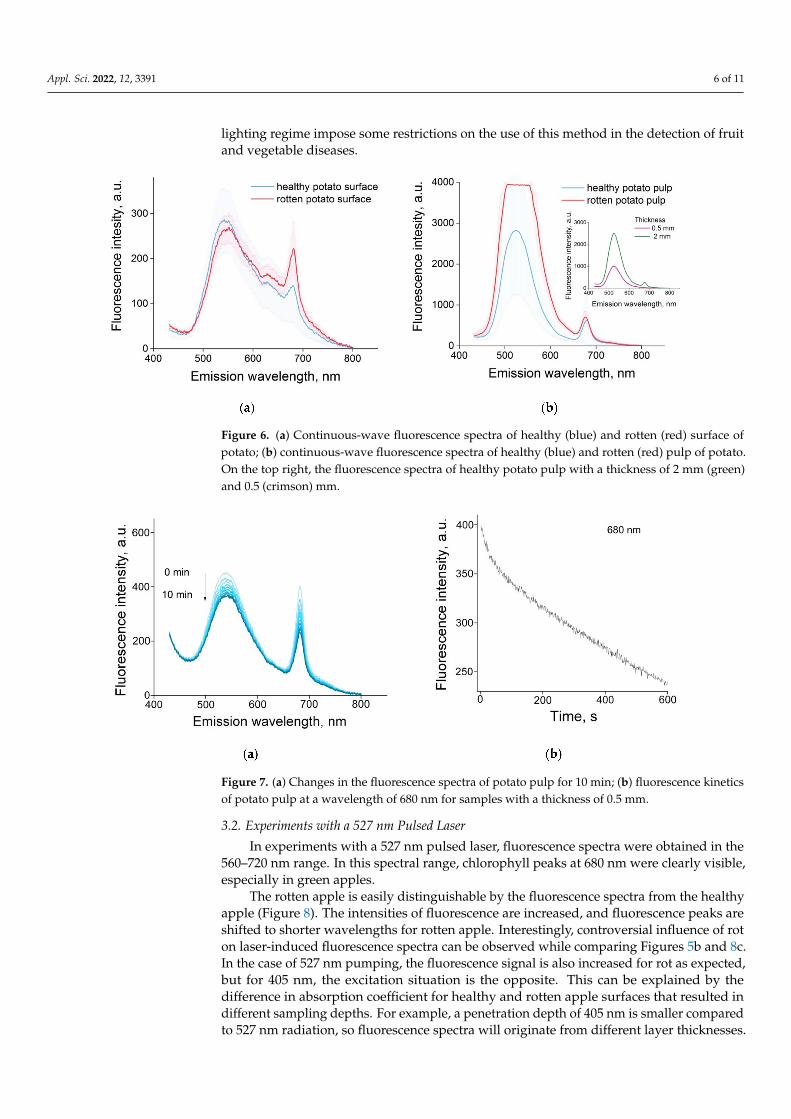
Healthy and rotten potato surface is less different in fluorescence spectra in contrastto apple. The peak of chlorophyll (680 nm) for healthy potatoes is less pronounced thanfor the rotten samples, and the peaks in the green region (530 nm) are the same (Figure 6).However, there are reliable differences in the pulp. The spectrum of the rotten samplegoes beyond the sensitivity of the spectrometer in the green area (Figure 6b). This can beexplained by the assumption that rotten potato pulp absorbs laser radiation much moreefficiently, which leads to increased fluorescence. The efficiency of fluorescence quenchingis rather high for the healthy plant, so any damage of the plant material should resultin a change of its chemical composition; thus, this will decrease the quenching efficiencyand hence the induced fluorescence intensity should be increased. Additionally, bacteriaand fungi in rotten potato had high fluorescence, so with the increase of such organisms’concentration, the fluorescence will be higher.
An increase in fluorescence occurs when the thickness of healthy potato pulp changes(Figure 6b, top right). The amplitude of the fluorescence spectrum increases 2.5–3 timeswith an increase in the slice thickness from 0.5 to 2 mm. Intensity of fluorescence is notlinearly proportional to the sample thickness.
Figure 7 shows the kinetics of the decrease in fluorescence over time. The observedeffect is similar, with the well-known Kautsky effect observed for the chlorophyll peak ingreen leaves [22]. However, there are differences; the Kautsky effect occurs in leaves previ-ously placed in the dark, and times of growth of the fluorescence are ~300–500 ms, and decaytimes are ~1–10 s, although in some cases the fluorescence decay takes ~1–10 min [21,23].Such kinetics (Figure 7b), where chlorophyll fluorescence decreases with a time of 1–10 min,has been described by many authors [1,24], and may be associated with several processes:changes in the uptake of photosynthetic complex II during long illumination, changesin the rate of carbon metabolism and the release of oxygen by cells, and due to the factthat oxygen in air can probably receive electrons from the photosynthetic complexes I andII [25]. The presence of kinetic dependencies and the dependence of fluorescence on the
Appl. Sci. 2022, 12, 3391 6 of 11
lighting regime impose some restrictions on the use of this method in the detection of fruitand vegetable diseases.
Figure 6. (a) Continuous-wave fluorescence spectra of healthy (blue) and rotten (red) surface ofpotato; (b) continuous-wave fluorescence spectra of healthy (blue) and rotten (red) pulp of potato.On the top right, the fluorescence spectra of healthy potato pulp with a thickness of 2 mm (green)and 0.5 (crimson) mm.
Figure 7. (a) Changes in the fluorescence spectra of potato pulp for 10 min; (b) fluorescence kineticsof potato pulp at a wavelength of 680 nm for samples with a thickness of 0.5 mm.
3.2. Experiments with a 527 nm Pulsed Laser
In experiments with a 527 nm pulsed laser, fluorescence spectra were obtained in the560–720 nm range. In this spectral range, chlorophyll peaks at 680 nm were clearly visible,especially in green apples.
The rotten apple is easily distinguishable by the fluorescence spectra from the healthyapple (Figure 8). The intensities of fluorescence are increased, and fluorescence peaks areshifted to shorter wavelengths for rotten apple. Interestingly, controversial influence of roton laser-induced fluorescence spectra can be observed while comparing Figures 5b and 8c.In the case of 527 nm pumping, the fluorescence signal is also increased for rot as expected,but for 405 nm, the excitation situation is the opposite. This can be explained by thedifference in absorption coefficient for healthy and rotten apple surfaces that resulted indifferent sampling depths. For example, a penetration depth of 405 nm is smaller comparedto 527 nm radiation, so fluorescence spectra will originate from different layer thicknesses.
Appl. Sci. 2022, 12, 3391 7 of 11
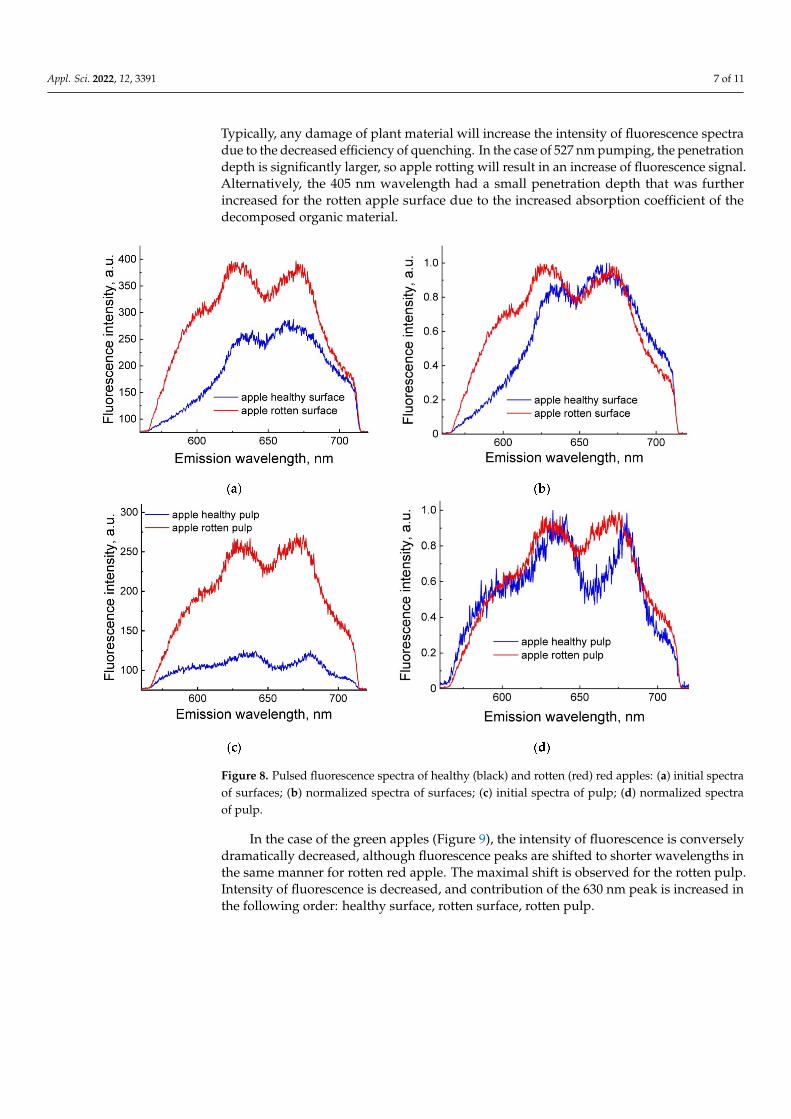
Typically, any damage of plant material will increase the intensity of fluorescence spectradue to the decreased efficiency of quenching. In the case of 527 nm pumping, the penetrationdepth is significantly larger, so apple rotting will result in an increase of fluorescence signal.Alternatively, the 405 nm wavelength had a small penetration depth that was furtherincreased for the rotten apple surface due to the increased absorption coefficient of thedecomposed organic material.
Figure 8. Pulsed fluorescence spectra of healthy (black) and rotten (red) red apples: (a) initial spectraof surfaces; (b) normalized spectra of surfaces; (c) initial spectra of pulp; (d) normalized spectraof pulp.
In the case of the green apples (Figure 9), the intensity of fluorescence is converselydramatically decreased, although fluorescence peaks are shifted to shorter wavelengths inthe same manner for rotten red apple. The maximal shift is observed for the rotten pulp.Intensity of fluorescence is decreased, and contribution of the 630 nm peak is increased inthe following order: healthy surface, rotten surface, rotten pulp.
Appl. Sci. 2022, 12, 3391 8 of 11
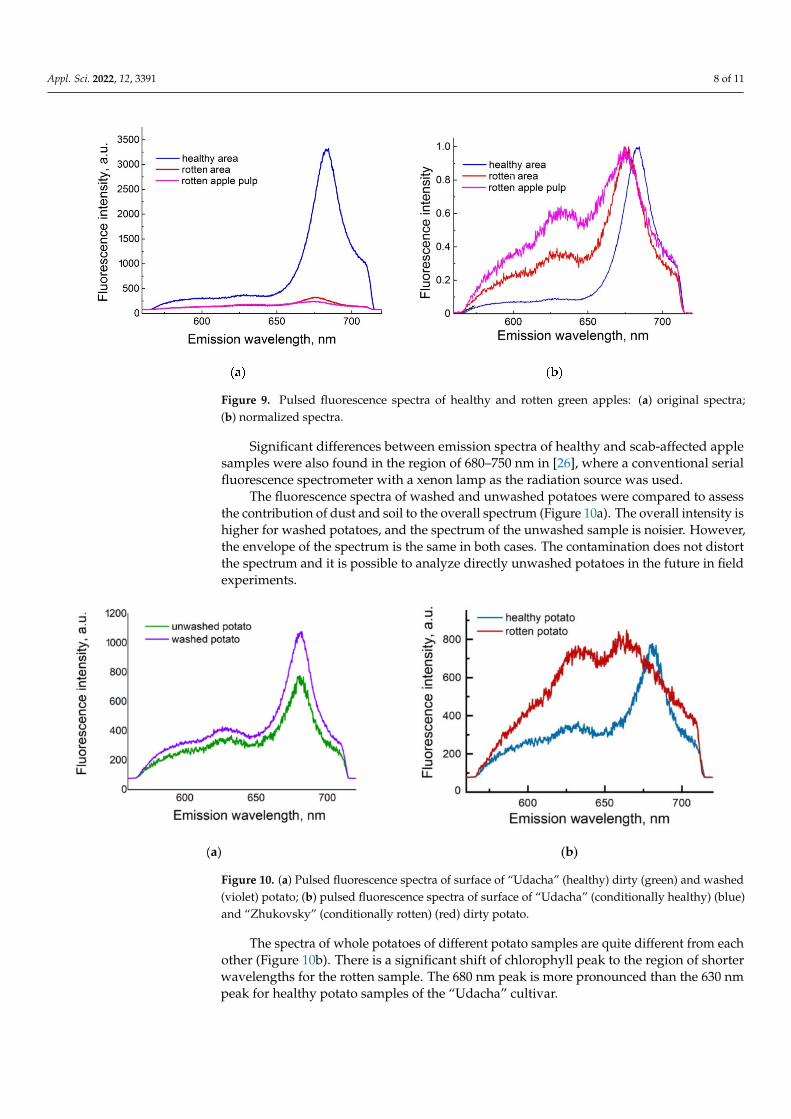
Figure 9. Pulsed fluorescence spectra of healthy and rotten green apples: (a) original spectra;(b) normalized spectra.
Significant differences between emission spectra of healthy and scab-affected applesamples were also found in the region of 680–750 nm in [26], where a conventional serialfluorescence spectrometer with a xenon lamp as the radiation source was used.
The fluorescence spectra of washed and unwashed potatoes were compared to assessthe contribution of dust and soil to the overall spectrum (Figure 10a). The overall intensity ishigher for washed potatoes, and the spectrum of the unwashed sample is noisier. However,the envelope of the spectrum is the same in both cases. The contamination does not distortthe spectrum and it is possible to analyze directly unwashed potatoes in the future in fieldexperiments.
Figure 10. (a) Pulsed fluorescence spectra of surface of “Udacha” (healthy) dirty (green) and washed(violet) potato; (b) pulsed fluorescence spectra of surface of “Udacha” (conditionally healthy) (blue)and “Zhukovsky” (conditionally rotten) (red) dirty potato.
The spectra of whole potatoes of different potato samples are quite different from eachother (Figure 10b). There is a significant shift of chlorophyll peak to the region of shorterwavelengths for the rotten sample. The 680 nm peak is more pronounced than the 630 nmpeak for healthy potato samples of the “Udacha” cultivar.
Appl. Sci. 2022, 12, 3391 9 of 11
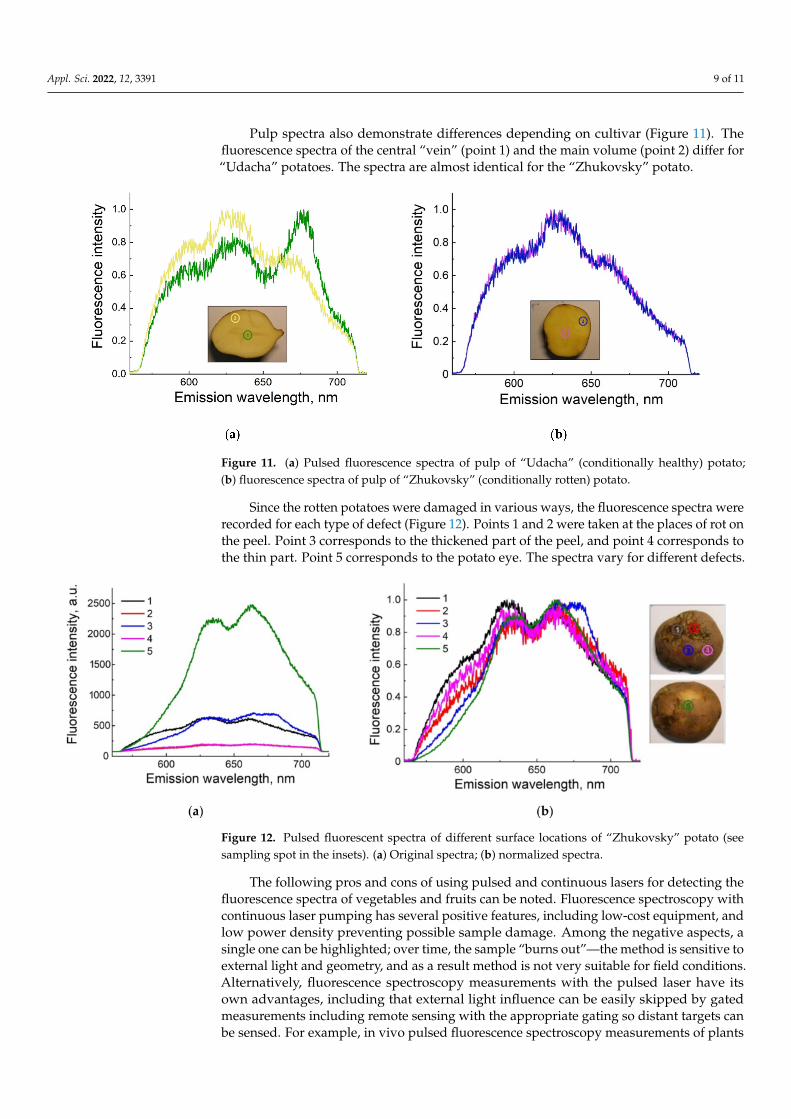
Pulp spectra also demonstrate differences depending on cultivar (Figure 11). Thefluorescence spectra of the central “vein” (point 1) and the main volume (point 2) differ for“Udacha” potatoes. The spectra are almost identical for the “Zhukovsky” potato.
Figure 11. (a) Pulsed fluorescence spectra of pulp of “Udacha” (conditionally healthy) potato;(b) fluorescence spectra of pulp of “Zhukovsky” (conditionally rotten) potato.
Since the rotten potatoes were damaged in various ways, the fluorescence spectra wererecorded for each type of defect (Figure 12). Points 1 and 2 were taken at the places of rot onthe peel. Point 3 corresponds to the thickened part of the peel, and point 4 corresponds tothe thin part. Point 5 corresponds to the potato eye. The spectra vary for different defects.
Figure 12. Pulsed fluorescent spectra of different surface locations of “Zhukovsky” potato (seesampling spot in the insets). (a) Original spectra; (b) normalized spectra.
The following pros and cons of using pulsed and continuous lasers for detecting thefluorescence spectra of vegetables and fruits can be noted. Fluorescence spectroscopy withcontinuous laser pumping has several positive features, including low-cost equipment, andlow power density preventing possible sample damage. Among the negative aspects, asingle one can be highlighted; over time, the sample “burns out”—the method is sensitive toexternal light and geometry, and as a result method is not very suitable for field conditions.Alternatively, fluorescence spectroscopy measurements with the pulsed laser have itsown advantages, including that external light influence can be easily skipped by gatedmeasurements including remote sensing with the appropriate gating so distant targets canbe sensed. For example, in vivo pulsed fluorescence spectroscopy measurements of plants

Appl. Sci. 2022, 12, 3391 10 of 11
can be done onsite in the field during different daylight conditions; additionally, long timeperiod measurements can be conducted. The negative aspects of a pulsed laser-inducedfluorescence spectroscopy include the potential damage of biological structures induced byhigh peak power density, and the high cost of equipment.
4. Conclusions
The observed differences (Figures 5–12) allow the use of fluorescent spectroscopy forthe separation of healthy and rotting fruit and vegetable samples. Its application is basedon changes in the fluorescence of plant fluorophores, mainly chlorophyll. During rotting, ashift of chlorophyll peaks to the region of shorter wavelengths and a decrease in the ratioof the intensities of the peaks 680/630 was observed.
Both pulse and continuous modes of light source operation have shown the potentialfor scanning rotten fruits and vegetables, thus opening up the possibility of using variousfluorescence-based devices for the detection of plant diseases.
The revealed variety of spectra showed that it is necessary to consider the charac-teristics of the cultivars, as well as the probe areas when selecting the parameters of thefluorescence analysis for detecting rot.
The practical aspect of the approach is automation of the process of crop sorting. Wehope it could be used in the future by implementation in real conditions, on the field or onsorting lines.
Author Contributions: Conceptualization, R.M.S. and S.V.G.; Methodology, A.V.S. and V.N.L.; inves-tigation, T.A.M., R.M.S., A.V.S., D.E.B., M.E.A., V.N.L., P.A.S. and M.Y.G.; resources, A.V.S., S.M.P.,N.A.S. and N.O.C.; formal analysis, R.M.S., D.E.B., M.E.A., V.N.L., P.A.S. and M.Y.G.; writing—original draft preparation, T.A.M., R.M.S.; writing—review and editing, T.A.M., R.M.S., S.V.G.;visualization, R.M.S., D.E.B., V.N.L., P.A.S. and M.Y.G.; supervision, S.V.G.; project administration,A.S.D. All authors have read and agreed to the published version of the manuscript.
Funding: This research was funded by the Ministry of Science and Higher Education of the RussianFederation for large scientific projects in priority areas of scientific and technological development,grant number 075-15-2020-774.
Institutional Review Board Statement: Not applicable.
Informed Consent Statement: Not applicable.
Data Availability Statement: Data are available from the authors upon request.
Conflicts of Interest: The authors declare no conflict of interest.
References1. Yamagishi, A.; Satoh, K.; Katoh, S. Fluorescence induction in chloroplasts isolated from the green alga Bryopsis maxima III. A
fluorescence transient indicating proton gradient across the thylakoid membrane. Plant Cell Physiol. 1978, 19, 17–25.2. Hassoun, A.; Mage, I.; Schmidt, W.F.; Temiz, H.T.; Li, L.; Kim, H.Y.; Nilsen, H.; Biancolillo, A.; Ait-Kaddour, A.; Sikorski, M.; et al.
Fraud in Animal Origin Food Products: Advances in Emerging Spectroscopic Detection Methods over the Past Five Years. Foods2020, 9, 1069. [CrossRef] [PubMed]
3. Sikorska, E.; Khmelinskii, I.; Sikorski, M. Fluorescence spectroscopy and imaging instruments for food quality evaluation. InEvaluation Technologies for Food Quality; Zhong, J., Wang, X., Eds.; Woodhead Publishing Series in Food Science Technology andNutrition; Elsevier: Amsterdam, The Netherlands, 2019; pp. 491–533.
4. Gao, F.; Dong, Y.J.; Xiao, W.M.; Yin, B.; Yan, C.S.; He, S.L. LED-induced fluorescence spectroscopy technique for apple freshnessand quality detection. Postharvest Biol. Technol. 2016, 119, 27–32. [CrossRef]
5. Noh, H.K.; Lu, R.F. Hyperspectral laser-induced fluorescence imaging for assessing apple fruit quality. Postharvest Biol. Technol.2007, 43, 193–201. [CrossRef]
6. Belasque, J.; Gasparoto, M.C.G.; Marcassa, L.G. Detection of mechanical and disease stresses in citrus plants by fluorescencespectroscopy. Appl. Opt. 2008, 47, 1922–1926. [CrossRef]
7. Saleem, M.; Atta, B.M.; Ali, Z.; Bilal, M. Laser-induced fluorescence spectroscopy for early disease detection in grapefruit plants.Photochem. Photobiol. Sci. 2020, 19, 713–721. [CrossRef]
8. Chappelle, E.W.; McMurtrey, J.E.; Wood, F.M.; Newcomb, W.W. Laser-induced fluorescence of green plants. 2: LIF caused bynutrient deficiencies in corn. Appl. Opt. 1984, 23, 139–142. [CrossRef]

Appl. Sci. 2022, 12, 3391 11 of 11
9. Chappelle, E.W.; Wood, F.M.; McMurtrey, J.E.; Newcomb, W.W. Laser-induced fluorescence of green plants. 1: A technique for theremote detection of plant stress and species differentiation. Appl. Opt. 1984, 23, 134–138. [CrossRef]
10. Lichtenthaler, H.K.; Miehé, J.A. Fluorescence imaging as a diagnostic tool for plant stress. Trends Plant Sci. 1997, 2, 316–320.[CrossRef]
11. Samson, G.; Tremblay, N.; Dudelzak, A.; Babichenko, S.; Dextraze, L.; Wollring, J. Nutrient stress of corn plants: Early detectionand discrimination using a compact multiwavelength fluorescent lidar. In Proceedings of the 20th EARSeL Symposium, Dresden,Germany, 14–16 June 2000; pp. 214–223.
12. Pieczywek, P.M.; Cybulska, J.; Szymariska-Chargot, M.; Siedliska, A.; Zdunek, A.; Nosalewicz, A.; Baranowski, P.; Kurenda, A.Early detection of fungal infection of stored apple fruit with optical sensors—Comparison of biospeckle, hyperspectral imagingand chlorophyll fluorescence. Food Control 2018, 85, 327–338. [CrossRef]
13. De Champdore, M.; Bazzicalupo, P.; De Napoli, L.; Montesarchio, D.; Di Fabio, G.; Cocozza, I.; Parracino, A.; Rossi, M.; D’Auria,S. A new competitive fluorescence assay for the detection of patulin toxin. Anal. Chem. 2007, 79, 751–757. [CrossRef] [PubMed]
14. Lu, B.; Sun, J.; Yang, N.; Hang, Y.Y. Fluorescence hyperspectral image technique coupled with HSI method to predict solaninecontent of potatoes. J. Food Process Preserv. 2019, 43, 9. [CrossRef]
15. Xie, K.Z.; Yue, Y.; Qiu, H.Z. Effects of Infection by Fusarium Tricinctum on Photosynthetic and Chlorophyll FluorescenceCharacteristics of Potato. Basic Clin. Pharmacol. Toxicol. 2020, 126, 433–434.
16. Cerovic, Z.G.; Moise, N.; Agati, G.; Latouche, G.; Ben Ghozlen, N.; Meyer, S. New portable optical sensors for the assessment ofwinegrape phenolic maturity based on berry fluorescence. J. Food Compos. Anal. 2008, 21, 650–654. [CrossRef]
17. Bunkin, A.F.; Klinkov, V.K.; Lednev, V.N.; Lushnikov, D.L.; Marchenko, A.V.; Morozov, E.G.; Pershin, S.M.; Yulmetov, R.N. Remotesensing of seawater and drifting ice in Svalbard fjords by compact Raman lidar. Appl. Opt. 2012, 51, 5477–5485. [CrossRef]
18. Bukhov, N.G.; Heber, U.; Wiese, C.; Shuvalov, V.A. Energy dissipation in photosynthesis: Does the quenching of chlorophyllfluorescence originate from antenna complexes of photosystem II or from the reaction center? Planta 2001, 212, 749–758. [CrossRef]
19. Lang, M.; Stober, F.; Lichtenthaler, H.K. Fluorescence emission spectra of plant leaves and plant constituents. Radiat. Environ.Biophys. 1991, 30, 333–347. [CrossRef]
20. Vermerris, W.; Nicholson, R. Phenolic Compound Biochemistry; Springer Science & Business Media: New York, NY, USA, 2007.21. Hak, R.; Lichtenthaler, H.K.; Rinderle, U. Decrease of the chlorophyll fluorescence ratio F690/F730 during greening and
development of leaves. Radiat. Environ. Biophys. 1990, 29, 329–336. [CrossRef]22. Kautsky, H.; Hirsch, A. Neue versuche zur kohlensäureassimilation. Naturwissenschaften 1931, 19, 964. [CrossRef]23. Buschmann, C.; Langsdorf, G.; Lichtenthaler, H.K. Imaging of the blue, green, and red fluorescence emission of plants: An
overview. Photosynthetica 2000, 38, 483–491. [CrossRef]24. Kalaji, H.M.; Goltsev, V.; Bosa, K.; Allakhverdiev, S.I.; Strasser, R.J. Experimental in vivo measurements of light emission in plants:
A perspective dedicated to David Walker. Photosynth. Res. 2012, 114, 69–96. [CrossRef] [PubMed]25. Lazar, D. Chlorophyll a fluorescence induction. Biochim. Biophys. Acta-Bioenerg. 1999, 1412, 1–28. [CrossRef]26. Sarimov, R.M.; Lednev, V.N.; Sibirev, A.V.; Gudkov, S.V. The Use of Fluorescence Spectra for the Detection of Scab and Rot in Fruit
and Vegetable Crops. Front. Phys. 2021, 8, 672. [CrossRef]