Phylogenetic Analysis of the Homologous Proteins of the Terminal Complement Complex Supports the...
8
Phylogenetic Analysis of the Homologous Proteins of the Terminal Complement Complex Supports the Emergence of C6 and C7 Followed by C8 and C9 Mariana Mondrago ´n-Palomino, 1 Daniel Pin ˜ ero, 2 Anne Nicholson-Weller, 3 Juan P. Laclette 1 1 Department of Immunology, Instituto de Investigaciones Biome ´dicas, Universidad Nacional Auto ´noma de Me ´xico, A.P. 70228, 04510 Me ´xico, D.F., Me ´xico 2 Department of Evolutionary Ecology, Instituto de Ecologı ´a, Universidad Nacional Auto ´noma de Me ´xico, Me ´xico, D.F., Me ´xico 3 Department of Medicine, Harvard Medical School and Beth Israel Deaconess Medical Center, Boston, Massachusetts, USA Received: 16 August 1998 / Accepted: 12 March 1999 Abstract. The plasma complement system comprises several activation pathways that share a common termi- nal route involving the assembly of the terminal comple- ment complex (TCC), formed by C5b–C9. The order of emergence of the homologous components of TCC (C6, C7, C8a, C8b, and C9) has been determined by phylo- genetic analyses of their amino acid sequences. Using all the sequence data available for C6–C9 proteins, as well as for perforins, the results suggested that these TCC components originated from a single ancestral gene and that C6 and C7 were the earliest to emerge. Our evidence supports the notion that the ancestral gene had a complex modular composition. A series of gene duplications in combination with a tendency to lose modules resulted in successive complement proteins with decreasing modu- lar complexity. C9 and perforin apparently are the result of different selective conditions to acquire pore-forming function. Thus C9 and perforin are examples of evolu- tionary parallelism. Key words: Evolution — Complement system — Ter- minal complement complex — Membrane attack com- plex — Perforin Introduction The terminal half of the complement cascade is a com- mon pathway shared by all the pathways of complement activation. The proteins involved, C5, C6, C7, C8a, C8b, and C9, with the exception of C5, are comprised of sev- eral conserved cysteine-rich modules and a cysteine-poor region. Interestingly, the g chain of C8 does not partici- pate in the formation of the C5b–9 complex (Brickner and Sodetz 1984). Although C5b–9 is often called the membrane attack complex (MAC), this martial term is appropriate only for the defense against Neisseria patho- gens and for the pathologic effects of C5b–9. It is more accurate to refer to C5b–9 as a terminal complement complex (TCC), because it is normally involved in sig- naling to host cells (reviewed by Nicholson-Weller and Halperin 1993). C5b–9 can insert into membranes and interact directly with G proteins, thus effecting signaling in the absence of a specific receptor (Niculescu et al. 1994). The first step in activating C5b–9 is to activate C5. While the amino acid sequence of C5 is homologous to that of C3 and C4 (Nonaka and Takahashi 1992), C6, C7, C8a, C8b, and C9 are homologous to perforin, the lytic protein of NK cells and cytotoxic lymphocytes (Young et al. 1986a). The similarity in size, sequence and function between perforin and C9 (reviewed by Tschopp et al. 1986; Young et al. 1986b), led to the hypothesis that C9 emerged from the original duplication of the common ancestral gene to perforins and to TCC Correspondence to: J.P. Laclette; e-mail: laclette@servidor. unam.mx J Mol Evol (1999) 49:282–289 © Springer-Verlag New York Inc. 1999
Transcript of Phylogenetic Analysis of the Homologous Proteins of the Terminal Complement Complex Supports the...

Phylogenetic Analysis of the Homologous Proteins of the TerminalComplement Complex Supports the Emergence of C6 and C7 Followed byC8 and C9
Mariana Mondragon-Palomino,1 Daniel Pinero,2 Anne Nicholson-Weller,3 Juan P. Laclette1
1 Department of Immunology, Instituto de Investigaciones Biome´dicas, Universidad Nacional Auto´noma de Me´xico, A.P. 70228, 04510Mexico, D.F., Mexico2 Department of Evolutionary Ecology, Instituto de Ecologı´a, Universidad Nacional Auto´noma de Me´xico, Mexico, D.F., Mexico3 Department of Medicine, Harvard Medical School and Beth Israel Deaconess Medical Center, Boston, Massachusetts, USA
Received: 16 August 1998 / Accepted: 12 March 1999
Abstract. The plasma complement system comprisesseveral activation pathways that share a common termi-nal route involving the assembly of the terminal comple-ment complex (TCC), formed by C5b–C9. The order ofemergence of the homologous components of TCC (C6,C7, C8a, C8b, and C9) has been determined by phylo-genetic analyses of their amino acid sequences. Using allthe sequence data available for C6–C9 proteins, as wellas for perforins, the results suggested that these TCCcomponents originated from a single ancestral gene andthat C6 and C7 were the earliest to emerge. Our evidencesupports the notion that the ancestral gene had a complexmodular composition. A series of gene duplications incombination with a tendency to lose modules resulted insuccessive complement proteins with decreasing modu-lar complexity. C9 and perforin apparently are the resultof different selective conditions to acquire pore-formingfunction. Thus C9 and perforin are examples of evolu-tionary parallelism.
Key words: Evolution — Complement system — Ter-minal complement complex — Membrane attack com-plex — Perforin
Introduction
The terminal half of the complement cascade is a com-mon pathway shared by all the pathways of complementactivation. The proteins involved, C5, C6, C7, C8a, C8b,and C9, with the exception of C5, are comprised of sev-eral conserved cysteine-rich modules and a cysteine-poorregion. Interestingly, theg chain of C8 does not partici-pate in the formation of the C5b–9 complex (Bricknerand Sodetz 1984). Although C5b–9 is often called themembrane attack complex (MAC), this martial term isappropriate only for the defense againstNeisseriapatho-gens and for the pathologic effects of C5b–9. It is moreaccurate to refer to C5b–9 as a terminal complementcomplex (TCC), because it is normally involved in sig-naling to host cells (reviewed by Nicholson-Weller andHalperin 1993). C5b–9 can insert into membranes andinteract directly with G proteins, thus effecting signalingin the absence of a specific receptor (Niculescu et al.1994). The first step in activating C5b–9 is to activateC5. While the amino acid sequence of C5 is homologousto that of C3 and C4 (Nonaka and Takahashi 1992), C6,C7, C8a, C8b, and C9 are homologous to perforin, thelytic protein of NK cells and cytotoxic lymphocytes(Young et al. 1986a). The similarity in size, sequenceand function between perforin and C9 (reviewed byTschopp et al. 1986; Young et al. 1986b), led to thehypothesis that C9 emerged from the original duplicationof the common ancestral gene to perforins and to TCC
Correspondence to:J.P. Laclette;e-mail: [email protected]
J Mol Evol (1999) 49:282–289
© Springer-Verlag New York Inc. 1999
proteins (Podack et al. 1988). According to this hypoth-esis C8, C7, and C6 should have successively emergedfrom C9 through later gene duplication events. Recently,a more complex evolutionary history for the TCC com-ponents has been advanced, proposing that the ancestralprotein was a C6/C7-like molecule (Hobart et al. 1993,1995; Hobart 1998) and that the evolution of these pro-teins proceeded from the complex to the simple. Despitethe fact that more than a dozen amino acid sequences ofC6–C9 are already available, no phylogenetic analysishas been reported to test the two hypotheses. Therefore,we carried out standard analyses with all available aminoacid sequences of C6–C9 and perforins as outgroups.Reconstructed trees suggest that C6 and C7, which sharethe greatest similarity to each other (Haeflinger et al.1989; DiScipio et al. 1988), were the earliest TCC com-ponents to emerge.
Materials and Methods
Phylogenetic Analysis of Amino Acid Sequences.Phylogeneticanalyses were based on the amino acid sequence similarity of C6, C7,C8a, C8b, C9 (C6–C9), and perforin. All of these are mosaic proteinsformed by a set of one to eight cysteine-rich modules of 30–70 aminoacids each and one central cysteine-poor region of approximately 350residues (Gonza´lez et al. 1996). The cysteine-rich regions include mod-ules that show similarity to sequences in other proteins, namely, throm-bospondin, low-density lipoprotein receptor, epidermal growth factor,complement factor I, and the short consensus repeats present in the“regulators of complement activation” gene cluster of the complementcontrol proteins (Reid and Day 1989). The epidermal growth factormodule and a partial cysteine-poor region are also present in perforin.
The amino- and carboxyl-terminal thrombospondin, low-densitylipoprotein receptor, cysteine-poor, and epidermal growth factor mod-ules of all amino acid sequences available for C6–C9 in the GenBank
database, as well as the cysteine-poor and epidermal growth factorsequences of human, rat, and mouse perforins, were initially alignedusing the Clustal algorithm (Higgins and Sharp 1988) in DNAMAN(Lynnon BioSoft 1994–1997) and then adjusted by eye. SequencesincludedHomo sapiens(human) C6, C7, C8a, C8b, and C9;Orycto-lagus cunniculus(rabbit) C8a, C8b, and C9; andRattus norvegicus(rat), Mus musculus(mouse),Equus caballus(horse),Fugu rubripes(puffer fish), andOncorhynchus mykiss(rainbow trout) C9. A branch-and-bound parsimony analysis was carried out by 100 bootstrap repli-cates with a prerelease version (4.0.0d61a) of PAUP (Swofford 1990),using the perforins as outgroups. Only the thrombospondin, low-density lipoprotein receptor, and epidermal growth factor modules plusthe cysteine-poor region were included in the analysis because they arepresent in all the TCC proteins and can be reliably aligned, excludingall sites for which positional homology is uncertain (Swofford et al.1996) (Fig. 1). All other conditions were set at “default” for PAUPanalysis. Distance phylogenetic analyses were also performed withPAUP by neighbor-joining searches in a bootstrap of 100 replicates.The distance measure is equal to the mean character difference. Allother conditions were set at “default.”
Relative Rate Test.Evolutionary rates of change of perforins andTCC proteins were evaluated using the two-cluster relative rate test(Takezaki et al. 1995) for the Poisson pairwise distances of the alignedsequences. The test was carried out on all sequences that were used forphylogenetic analysis, as well as on individual modules; gaps withinsequences were always excluded. The relative rate test calculationswere performed using the program PHYLTEST (Kumar 1996). In thistest,La andLb are the averages of observed numbers of substitutionsper site from the common ancestor of each sequence cluster; thenLa 4
Lb is the null hypothesis under the constancy of the molecular clock,i.e., d = La − Lb 4 0. Because the variance ofd can be estimated, thedeviation of d from 0 and thus the constancy of evolutionary ratesbetween lineage A and lineage B could be examined with a two-tailednormal deviate test, where the statisticZ should not be larger than 1.96to accept the rate constancy (null hypothesis) at the 5% level.
Statistic Analyses.Identity was estimated by pairwise comparisonof the sequences used for phylogenetic analysis as well as of individual
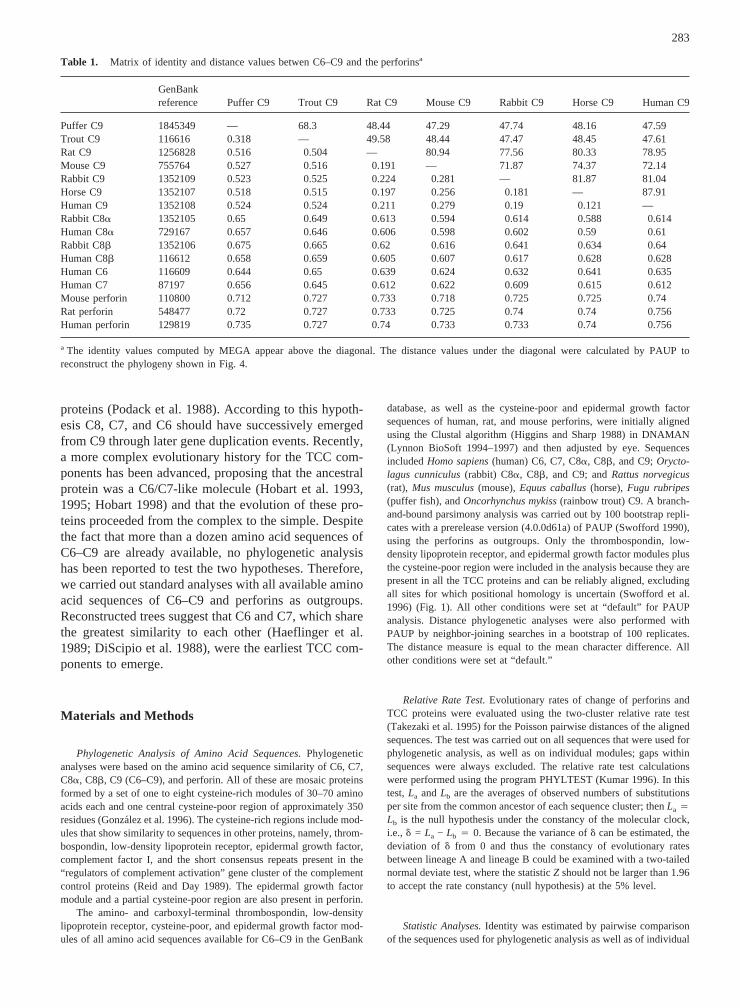
Table 1. Matrix of identity and distance values betwen C6–C9 and the perforinsa
GenBankreference Puffer C9 Trout C9 Rat C9 Mouse C9 Rabbit C9 Horse C9 Human C9
Puffer C9 1845349 — 68.3 48.44 47.29 47.74 48.16 47.59Trout C9 116616 0.318 — 49.58 48.44 47.47 48.45 47.61Rat C9 1256828 0.516 0.504 — 80.94 77.56 80.33 78.95Mouse C9 755764 0.527 0.516 0.191 — 71.87 74.37 72.14Rabbit C9 1352109 0.523 0.525 0.224 0.281 — 81.87 81.04Horse C9 1352107 0.518 0.515 0.197 0.256 0.181 — 87.91Human C9 1352108 0.524 0.524 0.211 0.279 0.19 0.121 —Rabbit C8a 1352105 0.65 0.649 0.613 0.594 0.614 0.588 0.614Human C8a 729167 0.657 0.646 0.606 0.598 0.602 0.59 0.61Rabbit C8b 1352106 0.675 0.665 0.62 0.616 0.641 0.634 0.64Human C8b 116612 0.658 0.659 0.605 0.607 0.617 0.628 0.628Human C6 116609 0.644 0.65 0.639 0.624 0.632 0.641 0.635Human C7 87197 0.656 0.645 0.612 0.622 0.609 0.615 0.612Mouse perforin 110800 0.712 0.727 0.733 0.718 0.725 0.725 0.74Rat perforin 548477 0.72 0.727 0.733 0.725 0.74 0.74 0.756Human perforin 129819 0.735 0.727 0.74 0.733 0.733 0.74 0.756
a The identity values computed by MEGA appear above the diagonal. The distance values under the diagonal were calculated by PAUP toreconstruct the phylogeny shown in Fig. 4.
283
homologous modules of C6–C9 and perforins. Identity (I) between agiven pair of sequences was calculated by substituting intoI 4 1 − P× 100, whereP is the number of differences (P distance) obtained usingMEGA (Kumar et al. 1994). To estimate if the individual modules havediverged at different rates, the means and standard deviations werecalculated from the identity values of individual modules. The statis-tical significance of differences in identity values among modules wastested using the Wilcoxon two-sample test included in the SAS Institutepackage (SAS Institute, 1985), at a 5% significance level.
Results
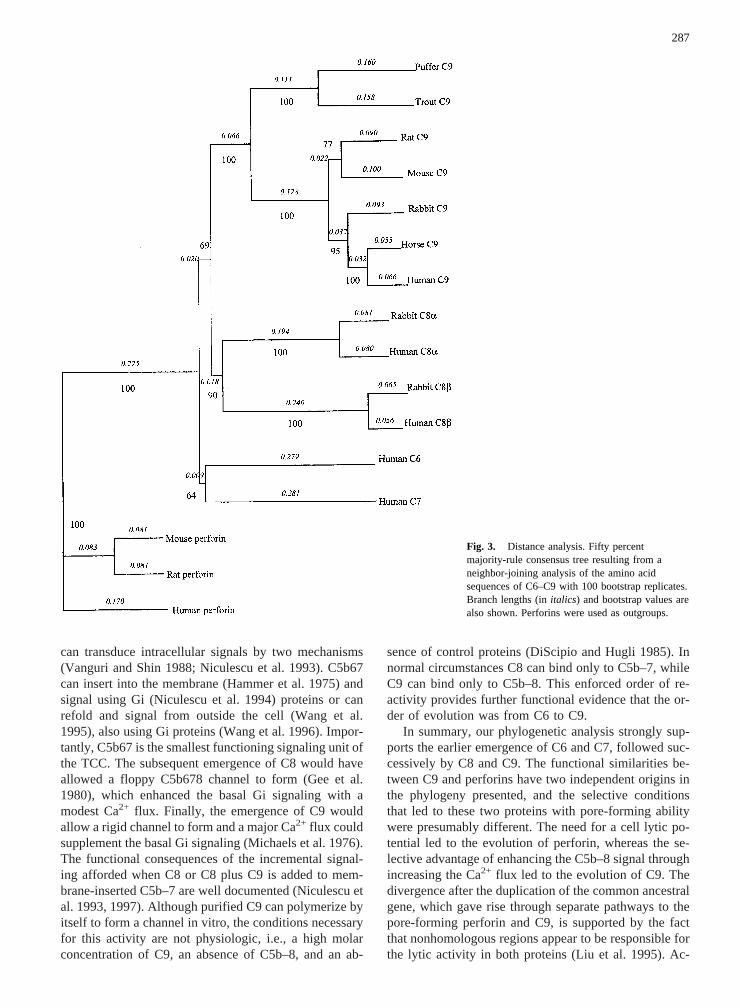
Phylogenetic Analysis.All C6, C7, C8a, C8b, and C9share thrombospondin, low-density lipoprotein receptor,cysteine-poor, and epidermal growth factor modules,with a total of 444 positions, including 314 informativepositions (Fig. 1). Perforins share part of the cysteine-poor and the complete epidermal growth factor modules,involving 168 positions that can be reliably aligned toC6–C9, including 133 informative positions. Identityvalues from pairwise comparison of sequences range be-tween 23.66 and 87.91 (Table 1). The branch-and-boundparsimony analysis resulted in a tree showing C8a andC8b grouped and segregated from all seven C9, C6, andC7 (Fig. 2). The internal arrangement of the C9 group,with the exception of horse C9, is in good agreementwith the well-known phylogeny of these species. How-ever, there was no resolution for the order of emergenceof TCC components, as all C6–C9 appear to emerge atthe base of the branch of the complement proteins. Incontrast, a neighbor-joining analysis using PAUP re-sulted in a fully resolved tree with bootstrap values betterthan those obtained by parsimony phylogenetic analysis(Fig. 3). In this tree, the clade formed by C6 and C7 isplaced as the sister group of the rest of the TCC com-
ponents. The only anomaly in the arrangement of C9sequences is the placement of horse C9, which also oc-curred in the parsimony analysis. Distance values ob-tained in this analysis are also shown in Table 1. Oneexplanation for the lack of resolution of the parsimonyanalysis is related to the mosaic structure of C6–C9genes; if the modules in the different proteins change atdifferent rates, the definition of some relationships couldbe hindered in a parsimony analysis.
Rate of Evolutionary Change of TCC Protein Genes.To determine the rate of evolutionary change within thecomplete sequence data used for the analysis, a relativerate test was carried out using all pairwise comparisonsamong proteins (Fig. 4). Each point on the graph repre-sents theZ value obtained by comparing the distancesbetween a given pair of TCC proteins and perforins. Twogroups of change trends were observed: C8b proteinsgroup with all C9 except human (Fig. 4A), whereas hu-man and rabbit C8a group with C6 and C7, which followan opposite rate trend (Fig. 4C). A significant rate diver-gence (at the 5% confidence level) was observed onlywhen human C9 was compared with C6 and C7 (Figs. 4Band C), however, divergences close to the cutoff value of1.96 were also observed between human C9 and bothC8a (Fig. 4C). Most of the other pairwise comparisonswith human C9 resulted inZ values higher than the rest(Fig. 4A and B). Additional relative rate tests carried outon pairwise comparisons of individual cysteine-poor orepidermal growth factor modules indicated that signifi-cant deviations of the rate constancy were caused by thecysteine-poor module (not shown). This divergence inthe change rates most likely explains the lack of resolu-tion of the parsimony phylogenetic analysis, which doesnot consider heterogeneity in evolutionary rates.
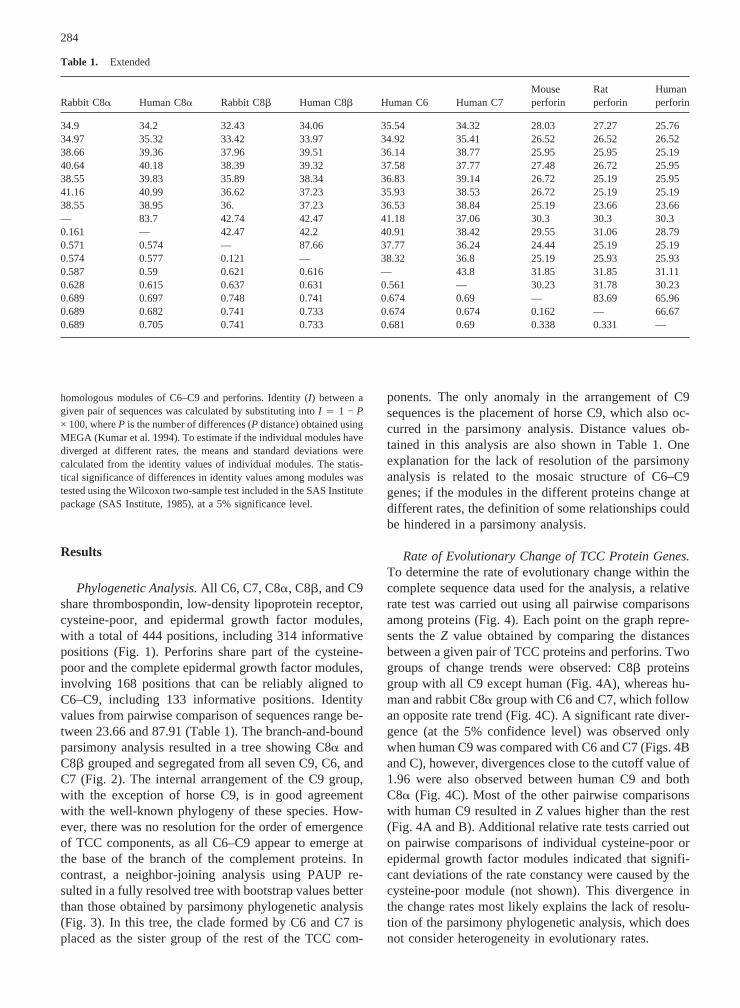
Table 1. Extended
Rabbit C8a Human C8a Rabbit C8b Human C8b Human C6 Human C7Mouseperforin
Ratperforin
Humanperforin
34.9 34.2 32.43 34.06 35.54 34.32 28.03 27.27 25.7634.97 35.32 33.42 33.97 34.92 35.41 26.52 26.52 26.5238.66 39.36 37.96 39.51 36.14 38.77 25.95 25.95 25.1940.64 40.18 38.39 39.32 37.58 37.77 27.48 26.72 25.9538.55 39.83 35.89 38.34 36.83 39.14 26.72 25.19 25.9541.16 40.99 36.62 37.23 35.93 38.53 26.72 25.19 25.1938.55 38.95 36. 37.23 36.53 38.84 25.19 23.66 23.66— 83.7 42.74 42.47 41.18 37.06 30.3 30.3 30.30.161 — 42.47 42.2 40.91 38.42 29.55 31.06 28.790.571 0.574 — 87.66 37.77 36.24 24.44 25.19 25.190.574 0.577 0.121 — 38.32 36.8 25.19 25.93 25.930.587 0.59 0.621 0.616 — 43.8 31.85 31.85 31.110.628 0.615 0.637 0.631 0.561 — 30.23 31.78 30.230.689 0.697 0.748 0.741 0.674 0.69 — 83.69 65.960.689 0.682 0.741 0.733 0.674 0.674 0.162 — 66.670.689 0.705 0.741 0.733 0.681 0.69 0.338 0.331 —
284

Fig. 1. Alignment of partial amino acid sequences of C6–C9 andperforins used for the phylogenetic analyses. All sites for which posi-tional homology was uncertain were excluded (listed at the end of thealignment). Numbering of sequences is used as they appear in
GenBank. puffer, puffer fish; trout, rainbow trout; mus, mouse; rabb,rabbit; perfomus, mouse perforin; perforat, rat perforin; perfohum, hu-man perforin.
285

If a given module has changed at a rate significantlydifferent from the others, its identity values should cor-relate with these differences. As shown in Table 2, iden-tity values of the low-density lipoprotein and carboxyl-terminal thrombospondin modules are significantlydifferent from those of the other modules, whereas thecysteine-poor and amino-terminal thrombospondin iden-tity values are not significantly different from that of theepidermal growth factor module. The mean of identityvalues within the cysteine-poor region is the lowest, sug-gesting that this module has changed more rapidly thanthe rest.
Discussion
Our results from the distance phylogenetic analysis usingall deduced amino acid sequences available for perforinsand C6–C9 suggest that C6 and C7 were the earliest ofthe homologous TCC proteins to emerge during evolu-tion. Perforins have a simple modular composition in-cluding single cysteine-poor and epidermal growth factormodules. Among TCC components, the C9 proteins arethe simplest, with cysteine-poor and epidermal growthfactor modules like the perforins, plus thrombospondinand low-density lipoprotein receptor modules. In ad-dition to the cysteine-poor, epidermal growth factor,low-density lipoprotein receptor, and thrombospondinmodules of C9, C8a and C8b possess an extra throm-
bospondin module (also present in C9 from fish). Themore complex modular structures of C6 and C7 showadditionally two short consensus repeats and twocomplement factor I modules; finally, C6 also possessesone more amino-terminal thrombospondin module (Ho-bart et al. 1995). The tree obtained from our distanceanalysis suggests that duplication of the ancestral genewith a complex modular composition evolved throughtwo pathways, each characterized by a tendency to losemodules: one pathway led to the simple structure of per-forin, which functions independently to form pores. Thesecond evolutionary pathway produced the ancestor ofC6–C7, with its complex modular structure. Further du-plications and loss of modules led successively to C8 andC9. The TCC evolutionary pathway, unlike the perforinpathway, retained the evolutionary intermediate proteins(C6–C8), presumably because of their function in sig-naling,vide infra.
Our results suggest a single origin for C6–C9 proteinsand that the minimum common ancestor of the terminalcomponents must have possessed a complex modularstructure, in agreement with the concept that it extendedfrom the amino-terminal region of C6 up to exon 10 or11 of the carboxyl-terminal of C8 (Hobart et al. 1993,1995; Hobart 1998). The fact that puffer fish and troutC9’s are similar in their modular composition to humanrabbit C8a and C8b (Yeo et al. 1997; Tomlinson et al.1993), and different from the more recent C9 of mam-mals, might be indicative of this tendency to lose mod-ules after the emergence of the ancestral complex gene.Hobart et al. (1993, 1995; Hobart 1998) also proposedthat C6 and C7 emerged first, then C8, and later C9. Intheir genetic analysis of C6 and C7 proteins, they notedthat intron–exon boundaries occurred commonly withinmodules, as opposed to between modules. This complexintron–exon relationship between the low-density lipo-protein receptor and the cysteine-poor, as well as be-tween the low-density lipoprotein receptor and the adja-cent thrombospondin module is conserved from C6 toC9. Thus, it would be unlikely that C9 could have arisenby simple exon shuffling.
The earlier emergence of C6 and C7 has functionalimplications: C5b and C5b6 cannot signal, but C5b67
Table 2. Average pairwise identity values for individual thrombo-spondin, low-density lipoprotein receptor, cysteine-poor, and epider-mal growth factor modules among TCC proteins
Module Average SDa
Low-density lipoprotein receptor 63.9 11.5 aThrombospondin C terminal 50.1 11.5 bThrombospondin N Terminal 43.8 15.3 cEpidermal growth factor 42.2 16.7 cdCysteine-poor region 38.4 16.7 d
a Letters following the SD values show the results from a Wilcoxontwo-sample test. Data followed by different letters are significantlydifferent from each other (p 4 0.05).
Fig. 2. Parsimony analysis. Fifty percent majority-rule consensustree resulting from a branch-and-bound analysis of the amino acidsequences of C6–C9 with 100 bootstrap replicates. Perforins were usedas outgroups.
286
can transduce intracellular signals by two mechanisms(Vanguri and Shin 1988; Niculescu et al. 1993). C5b67can insert into the membrane (Hammer et al. 1975) andsignal using Gi (Niculescu et al. 1994) proteins or canrefold and signal from outside the cell (Wang et al.1995), also using Gi proteins (Wang et al. 1996). Impor-tantly, C5b67 is the smallest functioning signaling unit ofthe TCC. The subsequent emergence of C8 would haveallowed a floppy C5b678 channel to form (Gee et al.1980), which enhanced the basal Gi signaling with amodest Ca2+ flux. Finally, the emergence of C9 wouldallow a rigid channel to form and a major Ca2+ flux couldsupplement the basal Gi signaling (Michaels et al. 1976).The functional consequences of the incremental signal-ing afforded when C8 or C8 plus C9 is added to mem-brane-inserted C5b–7 are well documented (Niculescu etal. 1993, 1997). Although purified C9 can polymerize byitself to form a channel in vitro, the conditions necessaryfor this activity are not physiologic, i.e., a high molarconcentration of C9, an absence of C5b–8, and an ab-
sence of control proteins (DiScipio and Hugli 1985). Innormal circumstances C8 can bind only to C5b–7, whileC9 can bind only to C5b–8. This enforced order of re-activity provides further functional evidence that the or-der of evolution was from C6 to C9.
In summary, our phylogenetic analysis strongly sup-ports the earlier emergence of C6 and C7, followed suc-cessively by C8 and C9. The functional similarities be-tween C9 and perforins have two independent origins inthe phylogeny presented, and the selective conditionsthat led to these two proteins with pore-forming abilitywere presumably different. The need for a cell lytic po-tential led to the evolution of perforin, whereas the se-lective advantage of enhancing the C5b–8 signal throughincreasing the Ca2+ flux led to the evolution of C9. Thedivergence after the duplication of the common ancestralgene, which gave rise through separate pathways to thepore-forming perforin and C9, is supported by the factthat nonhomologous regions appear to be responsible forthe lytic activity in both proteins (Liu et al. 1995). Ac-
Fig. 3. Distance analysis. Fifty percentmajority-rule consensus tree resulting from aneighbor-joining analysis of the amino acidsequences of C6–C9 with 100 bootstrap replicates.Branch lengths (initalics) and bootstrap values arealso shown. Perforins were used as outgroups.
287

cording to this view, the pore-forming ability shared byC9 and perforin is an example of parallelism.
Acknowledgments. We thank T. Pe´rez for her critical review of themanuscript and T. Govezensky for her aid in the statistical analysis ofdata. This paper was partially supported by Grants IN 207195 fromDGAPA–UNAM and L0042M from CONACYT (J.P.L.) and GrantNIH RO1HL33768 from the U.S. Public Health Service (A.N.W.).M.M.P. was supported by a fellowship from Fundacio´n UNAM.
References
Brickner A, Sodetz JM (1984) Function of subunits within the eighthcomponent of human complement: Selective removal of theg chainreveals it has no direct role in cytolysis. Biochemistry 23:832–837
DiScipio RG, Hugli TE (1985) The architecture of complement com-ponent C9 and poly (C9). J Biol Chem 260:14802–14809
DiScipio RG, Chakravarti DN, Mu¨ller-Eberhard HJ, Fey GH (1988)
The structure of human complement component C7 and the C5b-7complex. J Biol Chem 263:549–560
Gee AP, Boyle MDP, Borsos T (1980) Distinction between C8-mediated and C8/C9-mediated hemolysis on the basis of indepen-dent86Rb and hemoglobin release. J Immunol 124:1905–1910
Gonzalez S, Setie´n F, Coto E, Lo´pez-Larrea C (1996) Genetic structureand organization of the membrane attack complement components.Eur J Immunogen 23:181–197
Haefliger J-A, Tschopp J, Vial N, Jenne DE (1989) Complete primarystructure and functional characterization of the sixth component ofthe human complement system. J Biol Chem 264:18041–18051
Hammer CH, Nicholson A, Mayer MM (1975) On the mechanism ofcytolysis by complement: Evidence on the insertion of the C5b andC7 subunits of the C5b,6,7 complex into the phospholipid bilayer ofthe erythrocyte membrane. Proc Natl Acad Sci USA 72:5076–5080
Higgins DG, Sharp PM (1988) Clustal: A package for performingmultiple sequence alignment on a microcomputer. Gene 73:237–244
Hobart MJ (1998) The evolution of the terminal complement genes:Ancient and modern. Exp Clin Immunogenet 15:235–243
Fig. 4. Heterogeneity of evolutionary changeamong C6–C9. StatisticZ values obtained fromthe relative rate test by pairwise comparisonsamong sequences. Each point on the graphrepresents theZ value obtained from comparingthe distance from a couple of sequences to theperforins. Points are joined by lines only forpresentation purposes. Thehorizontal lineshowsthe cutoff value (above 1.96 is considered to beout of a constant evolution rate). C9.puf, pufferfish C9; C9.tro, rainbow trout C9; C9.mus, mouseC9; C9.rat, rat C9; C9.rab, rabbit C9; C9.hor,horse C9; C9.hum, human C9; C8a.rab, rabbitC8a; C8a.hum, human C8a; C8b.rab, rabbit C8b;C8b.hum, human C8b; C6.hum, human C6;C7.hum, human C7.
288

Hobart MJ, Fernie B, DiScipio RG (1993) Structure of the human C6gene. Biochemistry 32:6198–6205
Hobart MJ, Fernie BA, DiScipio RG (1995) Structure of the human C7gene and comparison with the C6, C8A, C8B and C9 genes. JImmunol 154:5188–5194
Kumar S (1996) PHYLTEST: A program for testing phylogenetic hy-pothesis, Version 2.0. Pennsylvania State University, UniversityPark
Kumar S, Tamura K, Nei M (1994) MEGA: Molecular EvolutionaryGenetics Analysis software for microcomputer. Comput ApplBiosci 10:189–191
Liu C-C, Walsh CM, Young JD-E (1995) Perforin: Structure and func-tion. Immunol Today 16:194–201
Lynnon BioSoft (1994–1997) DNAMAN for Windows, Version 2.6.Lynnon BioSoft Montreal, Canada
Michaels DW, Abramovitz AS, Hammer CH, Mayer MM (1976) In-creased ion permeability of planar lipid bilayer membranes aftertreatment with the C5b-9 cytolytic attack mechanism of comple-ment. Proc Natl Acad Sci USA 73:2852–2856
Nicholson-Weller A, Halperin JA (1993) Membrane signaling bycomplement C5b-9, the membrane attack complex. Immunol Res12:244–257
Niculescu F, Rus HG, Shin S, Lang T, Shin ML (1993) Generation ofdiacylglycerol and ceramide during homologous complement acti-vation. J Immunol 150:214–224
Niculescu F, Rus H, Shin ML (1994) Receptor-independent activationof guanine nucleotide-binding regulatory proteins by terminalcomplement complexes. J Biol Chem 269:4417–4423
Niculescu F, Rus H, van Biesen T, Shim ML (1997) Activation of Rasand mitogen-activated protein kinase pathway by terminal comple-ment complexes is G protein dependent. J Immunol 158:4405–4412
Nonaka M, Takahashi M (1992) Complete complementary DNA se-quence of the third component of complement of lamprey. J Im-munol 148:3290–3295
Podack ER, Olsen KJ, Lowrey DM, Lichtenheld M (1988) Structureand function of perforin. Curr Top Microbiol Immunol 140:11–17
Reid KBM, Day AJ (1989) Structure-function relationships of thecomplement components. Immunol Today 10:177–180
SAS Institute (1985) V6.02. SAS Institute Inc., Cary, NC 27511, USA
Swofford DL (1990) PAUP: Phylogenetic analysis using parsimony,Version 4.0.0d61a, Beta version computer program. Laboratory ofMolecular Systematics and prerelease testers, National Museum ofNatural History, Smithsonian Institution. Washington, DC
Swofford DL, Olsen GJ, Waddell PJ, Hillis DM (1996) Phylogeneticinference. In: Hillis DM, Mable BK, Moritz C (eds) Molecularsystematics, 2nd ed. Sinauer, Sunderland, MA, pp 407–514
Takezaki NA, Rzhetsky A, Nei M (1995) Phylogenetic test of themolecular clock and linearized trees. Mol Biol Evol 12:823–833
Tomlinson S, Stanley KK, Esser AF (1993) Domain structure, func-tional activity and polymerization of trout complement protein C9.Dev Comp Immunol 17:67–76
Tschopp J, Masson D, Stanley KK (1986) Structural/functional simi-larity between proteins involved in complement- and cytotoxic T-lymphocyte-mediated cytolysis. Nature 322:831–834
Vanguri P, Shin ML (1988) Hydrolysis of myelin basic protein inhuman myelin by terminal complement complexes. J Biol Chem263:7228–7234
Wang C, Barbashov S, Jack RM, Weller PF, Barrett T, Nicholson-Weller A (1995) Hemolytically inactive C5b67: An agonist of poly-morphonuclear leukocytes. Blood 85:2570–2578
Wang C, Gerard NP, Nicholson-Weller A (1996) Signaling by hemo-lytically inactive C5b67 (iC5b67), an agonist of polymorpho-nuclear leukocytes. J Immunol 156:786–792
Yeo GSH, Elgar G, Sandford R, Brenner S (1997) Cloning and se-quencing of complement component C9 and its linkage to DOC-2in the pufferfishFugu rubripes.Gene 200:203–211
Young JD-E, Liu CC, Leong LG, Cohn ZA (1986a) The pore-formingprotein (perforin) of cytolytic T lymphocytes is immunologicallyrelated to the components of membrane attack complex of comple-ment through cysteine-rich domains. J Exp Med 164:2077–2082
Young JD-E, Cohn ZA, Podack ER (1986b) The ninth component ofcomplement and the pore-forming protein (perforin 1) from cyto-lytic T cells: structural, immunological and functional similarities.Science 233:184–190
289