Photohuperzine A—A new photoisomer of huperzine A: Structure elucidation, formation kinetics and...
17
Chapter 4 Photohuperzine A – A photoisomer of huperzine A: structure elucidation, formation kinetics and activity assessment Adapted from: Lygia Azevedo Marques*, Martin Giera*, Frans de Kanter, Wilfried Niessen, Henk Lingeman and Hubertus Irth. Photohuperzine A – A photoisomer of huperzine A: structure elucidation, formation kinetics and activity assessment. Journal of Pharmaceutical and Biomedical Analysis 52 (2010) 190-194. * Authors contributed equally to this work
-
Upload
independent -
Category
Documents
-
view
1 -
download
0
Transcript of Photohuperzine A—A new photoisomer of huperzine A: Structure elucidation, formation kinetics and...

Chapter 4
Photohuperzine A – A photoisomer of huperzine A: structure elucidation, formation kinetics and activity assessment
Adapted from: Lygia Azevedo Marques*, Martin Giera*, Frans de Kanter, Wilfried Niessen, Henk Lingeman and Hubertus Irth. Photohuperzine A – A photoisomer of huperzine A: structure elucidation, formation kinetics and activity assessment. Journal of Pharmaceutical and Biomedical Analysis 52 (2010) 190-194. * Authors contributed equally to this work


95
Chapter 4 Photohuperzine A – A photoisomer of huperzine A
Abstract
A new photoisomer of the promising “anti-Alzheimer” drug candidate (±) huperzine A is described. The new substance was formed via a photoisomerization reaction and was found to be 1-amino-13-ethylidene-11-methyl-6-aza-tetracyclo-[7.3.1.02.7.04.7]-trideca-2,10-diene-5-one using NMR analysis. The kinetics of its formation was studied and proven to be of first-order. The described photoisomer showed a significant loss in activity, being more than 100 times less active than (−) huperzine A itself. The new substance was named photohuperzine A, referring to its photopyridone substructure.

96
Chapter 4 Photohuperzine A – A photoisomer of huperzine A
4.1 Introduction
Huperzine A is a promising substance for the treatment of Alzheimer’s disease (AD) (Patocka, 1998, Wang and Tang, 2005). It is a natural Acetylcholinesterase (AChE) inhibitor extracted from the club moss Huperzia serrata (Liu and Zhu, 1986). Currently, it is being used for the treatment of AD in China (Ma et al., 2007). Furthermore, the substance is at present under a clinical phase II trial by the National Institute of Health (NIH) for the treatment of AD. The aforementioned facts underline the increasing interest in possible new huperzine A derivatives (Kozikowski et al., 1995) or metabolites (Xiaochao et al., 2003) as new AChE inhibitors. The racemate (±) huperzine A (1) was first synthesized by Kozikowski (Kozikowski et al., 1991) and Qian (Qian and Ji, 1989).
As 1 already entered phase II (NIH) in the drug development process, stability testing is truly one of the key issues that has to be addressed. In previous stability studies, it was shown that the analyte was highly stable under most stress conditions (e.g., pH, temperature, ionic strength, solvents) (Ashani et al., 1992, Wang et al., 2004, Wei et al., 2006, Ye et al., 2005). However, after irradiation the analyte showed significant transformation to an unknown compound. In the present study, the preparation/isolation, structure elucidation, formation kinetics, and activity determination of the new (±) huperzine A (1) photoisomer called pho-tohuperzine A (2) is reported. Photohuperzine A (2) was isolated in a semi-preparative manner, employing liquid/liquid extraction and semi-preparative HPLC. The obtained substance was characterized by NMR and LC/MS.
4.2 Experimental
4.2.1 Materials
All solvents were of HPLC grade. Methanol and acetonitrile were purchased from Biosolve (Valkenswaard, The Netherlands). Acetic acid and trifluoroacetic acid were purchased from Riedel-de-Haen (Seelze, Germany). Milli-Q water was obtained from a Milli-Q purification system, Millipore (Bedford, MA, USA). (±) Huperzine A was purchased from Cfm Oskar Tropitzsch e.K (Marktredwitz, Germany). For bioassay measurements, the Acetylcholinester-ase (AChE) (EC 3.1.1.7) type VI-S from Electrophorus electricus (electric eel) was from Sigma–Aldrich (Zwijndrecht, The Netherlands). 7-Acetoxy-1-methylquinolinium iodide (AMQI) was supplied by Fluka (Buchs, Switzerland). The enzyme and the substrate stock solutions were kept at −80 °C until use. 384 black, solid well plates were from Brand (Wertheim, Germany). All other chemicals were purchased from Sigma–Aldrich (Schnelldorf, Germany).
97
Chapter 4 Photohuperzine A – A photoisomer of huperzine A
4.2.2 Apparatus
The Xenon lamp which was used for irradiating 1 was from AEG (Nürnberg, Germany). The degradation was followed using a Varian Cary 50 spectrophotometer (Varian, Darmstadt, Germany). All measurements were carried out at 308 nm with background correction and water was used as a blank. The liquid chromatographic (LC) analysis was performed on a Shimadzu (‘s Hertogenbosch, The Netherlands) LC20 AB quaternary pump delivering an eluent of water/acetonitrile (ACN) at 60 μL/min (solvent A water:ACN:acetic acid:trifluoroacetic acid (95:5:0.1:0.02, v/v/v/v) and solvent B: water:ACN:acetic acid 5:95:0.1 (v/v/v)). The autosampler was a Shimadzu type SIL 20 A (injection volume 5 μL) and the photodiode array detector (PDA) also was a Shimadzu (type SPD 20A). The applied column was an Ultra C18 (50 mm × 1 mm I.D.) column packed with 3 μm particles (Restek GmbH, Bad Homburg, Germany). Chroma-tography was performed at 40 °C using a Shimadzu CTO 10 AC column oven. A gradient starting at 3.5% (v/v) of solvent B, ramping to 40% (v/v) B in 10 min was applied. At 10.1 min the eluent was switched to 85% (v/v) B. The analysis was stopped at 15 min. The employed mass spectrometer (MS) was a Micromass Ultima Q-TOF (Waters, Milford, MA, USA). During all experiments, the MS was operated in positive-ion electrospray ionization mode (ESI+), the capillary voltage was 2.5 kV, the source temperature 120 °C, the desolvation temperature was set at 350 °C, and the cone voltage was 35 V. Nitrogen (99.9990%) was used as the cone gas at a flow rate of 50 l/h and at 400 l/h for desolvation. MS data were acquired from m/z 220 to 750.
For the semi-preparative isolation of 2, the instrumentation consisted of two isocratic HPLC Agilent 1100 series pumps which were controlled as a single gradient LC (Agilent, Waldbronn, Germany). The autosampler was a Gilson model 234 (Villiers Le Bel, France). The separation was performed on a Waters X-Bridge C18 (100 mm × 4.6 mm I.D., 5 μm) column which was used in combination with a Phenomenex C18 (4 mm × 2 mm I.D., 5 μm) precolumn cartridge (Aschaffenburg, Germany). The temperature was held at 40 °C and the flow rate was 800 μL/min. A gradient run starting at 6.3% (v/v) of solvent B, increasing to 18.8% (v/v) of eluent B at 5 min. This concentration was maintained for 3 min. The column effluent was monitored by UV absorption measurement (305 + 220 nm) with an Agilent 1100 series diode array detec-tor (DAD) (Agilent, Waldbronn, Germany). All fractions were collected manually. The high resolution MS (HRMS) data were recorded on a micrOTof (Bruker Daltonics, Bremen, Germany) with direct infusion in ESI + mode. All NMR measurements were performed on a Bruker Avance 500, equipped with a cryoprobe and the residual CHCl3 signal at 7.26 (1H) or 77.00 (13C, CDCl3) ppm was used as reference. 1H NMR measurements were done at 500 MHz while the 13C experiments were performed at 125 MHz. The nJ(C,H) coupling constant used in the HMBC experiment was 8 Hz. For the bioactivity measurements, a Victor3 plate reader (Perki-nElmer, Waltham, MA, USA) was used.

98
Chapter 4 Photohuperzine A – A photoisomer of huperzine A
4.2.3 Kinetics determination
To perform the kinetic determinations, a calibration curve with 1 as standard substance was generated from 10 to 250 μM at a wavelength of 308 nm with the above described spectropho-tometer. The calibration curve had the function y = 0.008x with a R2 of 0.9997. Every day, a 50 μM sample of 1 was measured as a control. A solution of 210 μM of 1 was prepared by dissolving 5.1 mg in 2 mL of water, adding 7 μL of 5 M hydrochloric acid and diluting this solution up to 100.0 mL with water. All solutions were kept in Duran® glass, which has a “natural” cut off at 310 nm according to the manufacturer’s specifications. The sample solutions were irradiated with a Xenon lamp at 150 W. In order to check for thermal degradation effects, a solution of 200 μM 1 was wrapped in aluminum foil and irradiated under the same conditions as a blank sample (no degradation was observed over 36 h). During the kinetic determinations, a 1 mL aliquot was taken at the specified time intervals and measured with the spectropho-tometer. At the time intervals t = 0 h, t = 24 h (only for the LC–MS measurements) and t = 42 h, 75 μL of the sample solution was diluted to 1.0 mL with solvent A and additionally analyzed by LC–MS and LC-PDA. All calculations were done with Graph Pad Prism 4.
Figure 4.1 Extracted ion chromatogram (EIC) (m/z 226 + 243) of a purity control of the photohuperzine A (2) material used for bioactivity determination: A solution of 200 μM 2 was injected into the analytical LC system described in the manuscript. A standard of 4 μM huperzine A (1) analyzed under the same conditions gave a signal/noise (peak to peak) of 146, thereby proving that no huperzine A (1) was present in the sample used for the bioassay.
99
Chapter 4 Photohuperzine A – A photoisomer of huperzine A
4.2.4 Synthesis and extraction of photohuperzine (2)The sample of 2 applied in structure elucidation by NMR was generated by irradiation of two separate reaction batches of 5 mg of 1 in 100.0 mL of water, acidified with 7 μL of 5 M HCl for 24 h. The solutions were alkalized with a few drops (approximately 200 μL) of an aqueous 5 M sodium hydroxide solution and extracted with three portions of 20 mL of dichloromethane (DCM). The combined organic layers were washed carefully with 20 mL of water. The organic phase was dried over anhydrous magnesium sulphate, filtered and evaporated to dryness under a gentle stream of nitrogen. The resulting residue was dissolved in 2× 500 μL of eluent A and 100 μL portions were subsequently injected into the specified LC system for a semi-preparative sample clean-up. The collected fractions (~ 50 mL) were pooled and the DCM extraction was repeated, the solid residue was dried under vacuum. For the material used for the bioassay, the semi-pre-parative HPLC clean-up procedure was repeated and 130 μg of pure 2 were obtained (see Figure 4.1).
4.2.5 Acetylcholinesterase (AChE) fluorescence-based assayA 4 mM stock solution of 2 in 0.1% formic acid (FA) was prepared from the purified material and used for further dilutions. The AChE bioactivity assay was measured in a 384 black, solid well plate using AChE (EC 3.1.1.7) (0.1 U/mL) from electric eel dissolved in 20 mM Tris–HCl buffer pH 7.5, 2 g/L PEG 6000 and 1 g/L ELISA blocking reagent. As substrate, AMQI 2 μM in 50 mM of citrate buffer at pH 5 was used. 2 μL of a solution containing 2 (4 mM, 0.8 mM) in 0.1% (v/v) FA were mixed with 40 μL of the enzyme solution. After 5 min of incubation, 40 μL of the substrate solution were added. The final concentrations for enzyme and substrate were 0.05 U/mL and 1 μM, respectively. The final concentrations of 2 were 100 and 20 μM, respectively. The fluorescence intensity was measured after a reaction time of 2 min using a Victor3 plate reader at 405 nm and 520 nm for excitation and emission, respectively. As posi-tive control, a solution of 160 μM (−) huperzine A (2 μM final concentration) was used.
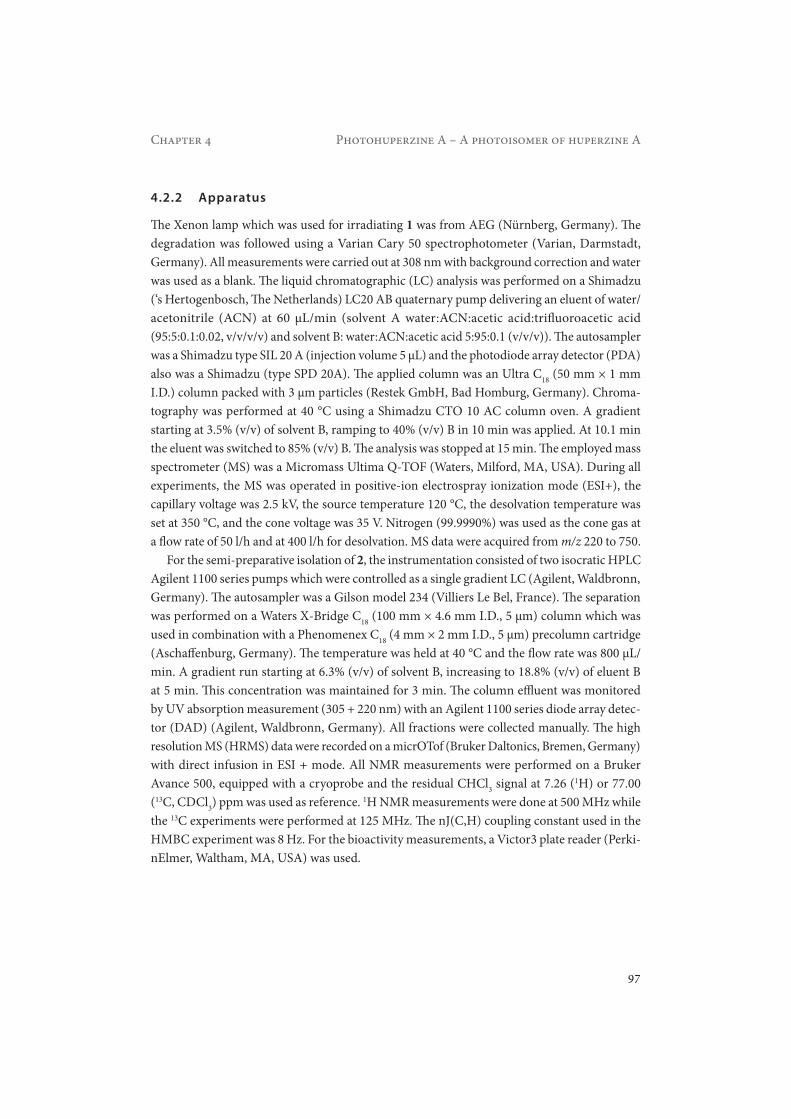
Figure 4.2 Photo-induced transformation of huperzine A (1) to photohuperzine A (2).
100
Chapter 4 Photohuperzine A – A photoisomer of huperzine A
4.3 Results and discussion
4.3.1 Synthesis and extraction of photohuperzine A (2)After the initial detection of the new huperzine A derivative, the solute was prepared and iso-lated for a complete structure elucidation. The reaction (Figure 4.2) yielded 18% of >95% (LC/MS) pure photohuperzine A (2). This material was used for all further spectroscopic analyses.
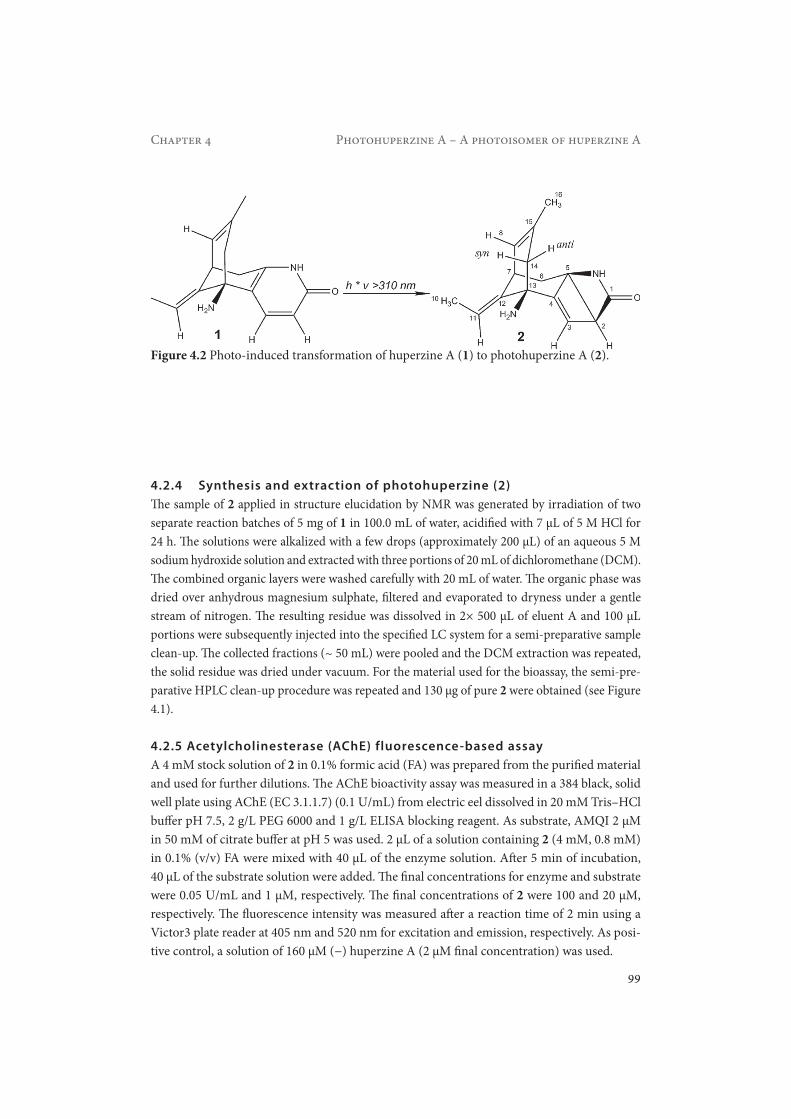
4.3.2 Structure elucidationThe commonly accepted biosynthetic numbering of 1 (Niemitz et al., 2007) was also applied to 2 (see Figure 4.2) and is used in discussing the interpretation of the NMR data below. In LC–MS and HRMS, the compounds 1 and 2 are found to be isomers (elemental composition C15H19N2O). The LC–MS spectra of 1 showed a much stronger fragment ion with m/z 226 [M+H−NH3]+ than 2 (see Figure 4.3). Additional MS/MS measurements did not provide any insights into the structure of 2.
Figure 4.3 Mass spectrum of compound (1), on the left side and mass spectrum of compound (2) on the right side.
(1) (2)

101
Chapter 4 Photohuperzine A – A photoisomer of huperzine A
The UV spectrum of 1 showed the typical 2-pyridon absorption, having a maximum at 308 nm, whereas the UV spectrum of 2 completely lacks this absorption maximum. These findings were leading to the assumption that photoisomerization involving the 2-pyridone substructure of 1 had occurred. Photoreaction of 2-pyridones is a well known process leading to valence isomerization in dilute solutions, thereby forming so called photopyridones (Hongo et al., 1997, Matsushima and Terada, 1985).
The structure of 2 was further elucidated by 1H, 13C, APT, HSQC, COSY, HMBC and NOESY NMR measurements. In Table 4.1, the spectroscopic data are summarized. Figure 4.4 and Figure 4.5 show the most important HMBC and NOESY correlations.
The trans-(E) configuration of the 11(12) double bond was proven by the NOESY coupling of H-10 with H-7. The conformation with the NHCO group standing “upwards” into the direc-
High resolution mass data [M + H]+
Found: 243.1489 Calculated for C15H19N2O: 243.1492 (- 1.2 ppm)
UV max (0.1% FA) < 220 nm
NMR data position δ 13C (ppm), mult. δ 1H (ppm) (J, Hz)5.72 s (NH)
1 172.69, C 2 58.93, CH 3.78 m 3 120.40, CH 6.05 m 4 162.56, C 5 57.44, C
6 34.81, CH26 eq 2.17 dd (2,3J =13.7, 2.8) with underneath 14
syn; 6ax 2.00 dd (2,3J =13.7, 3.3) 7 35.11, CH 3.61 m 8 123.94, CH 5.43 d (3J = 4.8)10 12.98, CH3 1.66 d (3J = 6.8)11 112.85, CH 5.50 q (3J = 6.8)12 143.18, C13 55.87, C
14 45.85, CH214 anti 2.29 d (2J = 17) 14 syn 2.17 d, underneath
6eq15 134.66, C16 22.79, CH3 1.68 s
Table 4.1 Spectroscopic data of 2, δ chemical shift, J coupling constant, s singlet, d doublet,t triplet, m multiplet.

102
Chapter 4 Photohuperzine A – A photoisomer of huperzine A
Figure 4.4 Selected HMBC correlations (C → H).
Figure 4.5 Selected NOESY correlations.
103
Chapter 4 Photohuperzine A – A photoisomer of huperzine A
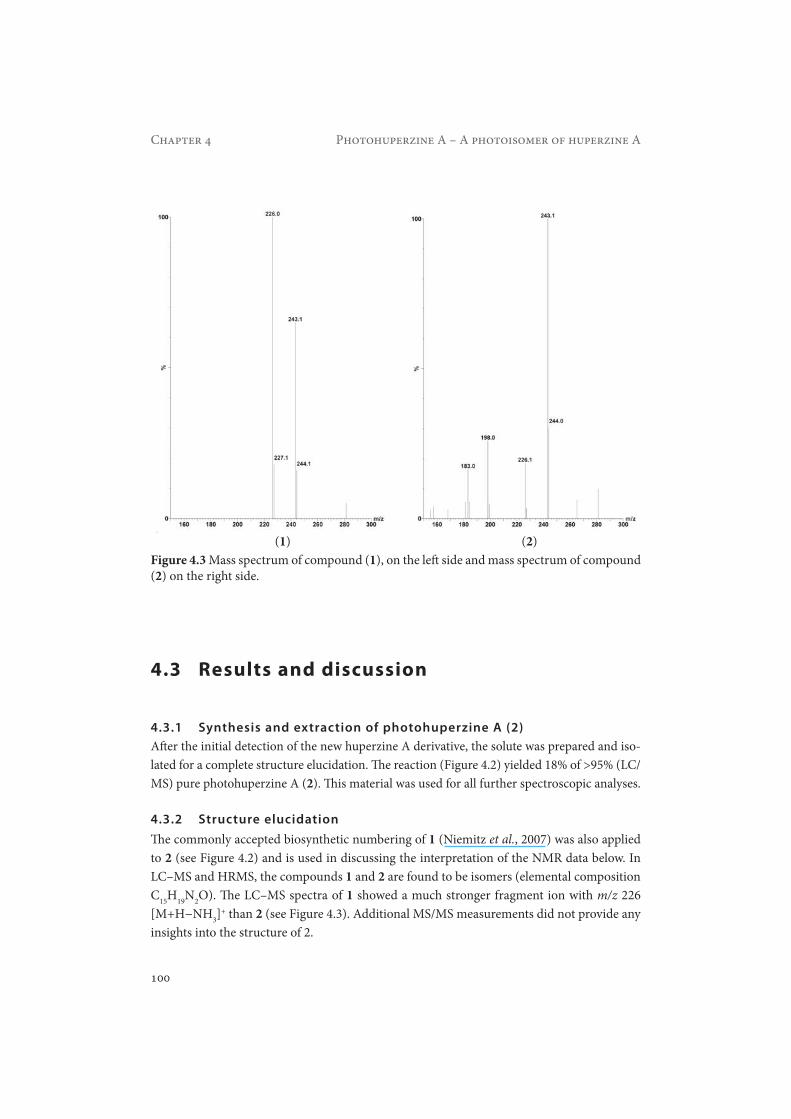
Figure 4.6 MM2 energy minimized structures of huperzine A (left) and photohuperzine A (right), nitrogen atoms are labeled blue, oxygen red and free electron pairs pink, the dotted lines show the measured distances between the NHCO group and protons H-8 and H-16.
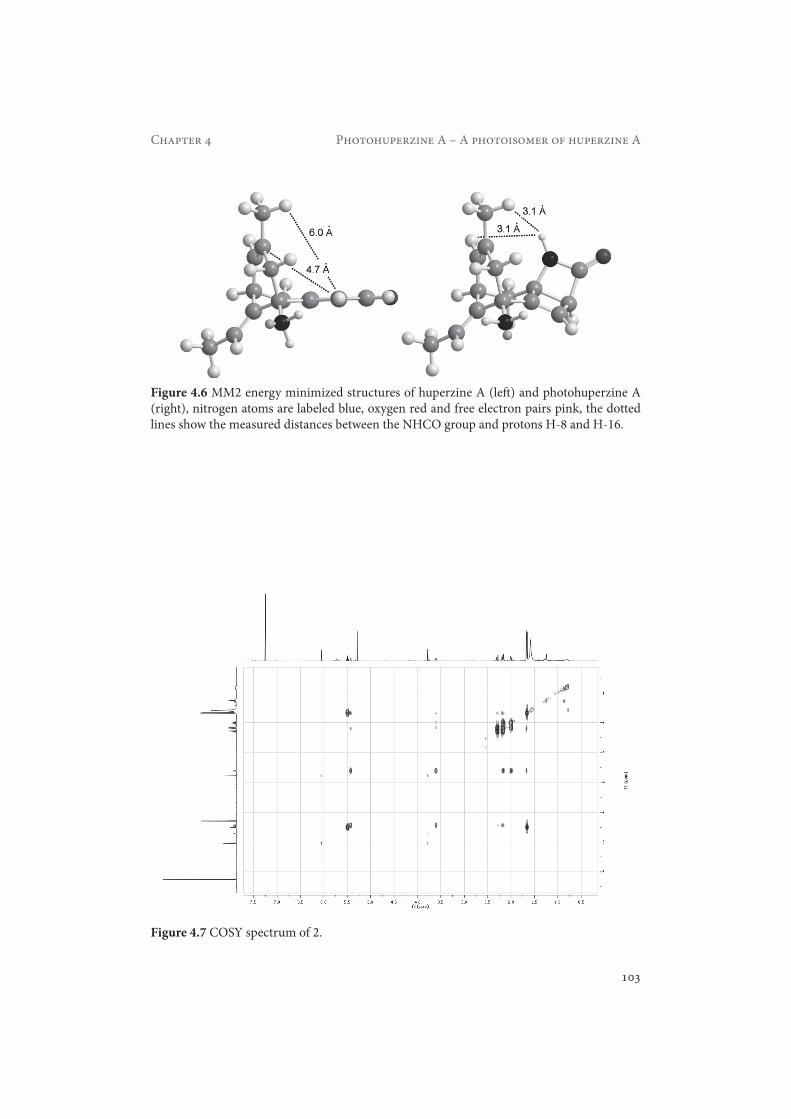
Figure 4.7 COSY spectrum of 2.

104
Chapter 4 Photohuperzine A – A photoisomer of huperzine A
Figure 4.8 HMBC spectrum of 2.
Figure 4.9 HSQC spectrum of 2.
105
Chapter 4 Photohuperzine A – A photoisomer of huperzine A
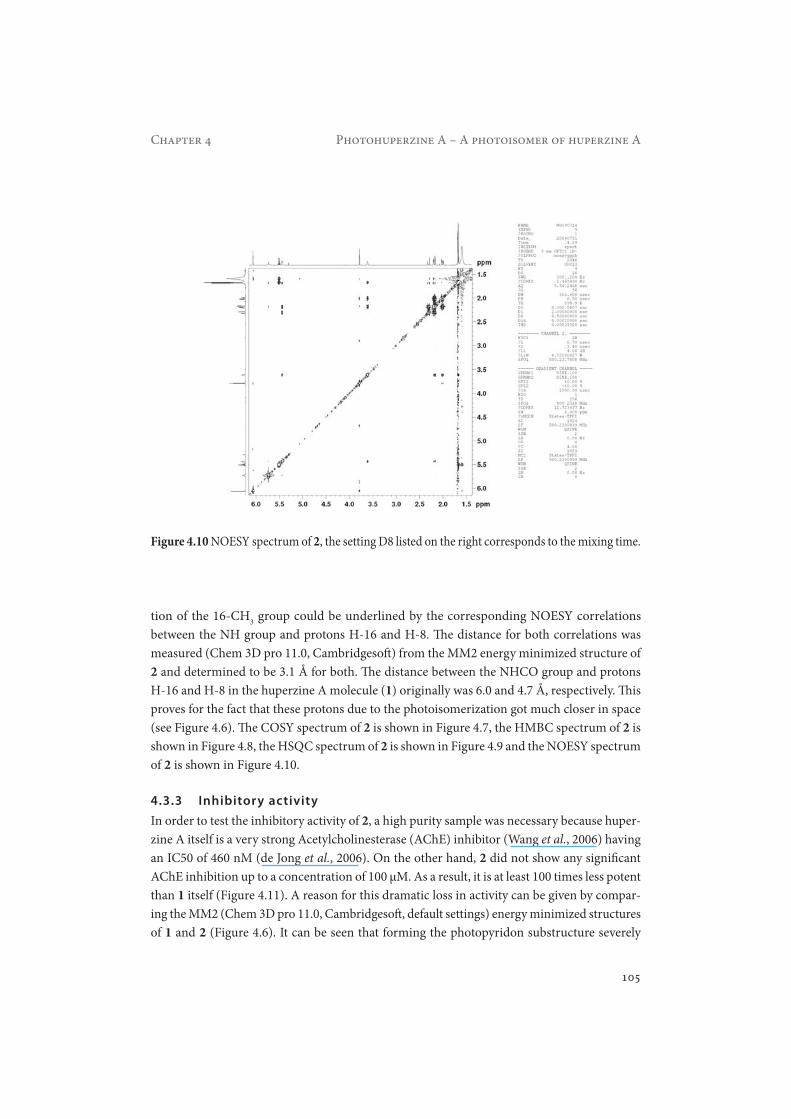
Figure 4.10 NOESY spectrum of 2, the setting D8 listed on the right corresponds to the mixing time.
tion of the 16-CH3 group could be underlined by the corresponding NOESY correlations between the NH group and protons H-16 and H-8. The distance for both correlations was measured (Chem 3D pro 11.0, Cambridgesoft) from the MM2 energy minimized structure of 2 and determined to be 3.1 Å for both. The distance between the NHCO group and protons H-16 and H-8 in the huperzine A molecule (1) originally was 6.0 and 4.7 Å, respectively. This proves for the fact that these protons due to the photoisomerization got much closer in space (see Figure 4.6). The COSY spectrum of 2 is shown in Figure 4.7, the HMBC spectrum of 2 is shown in Figure 4.8, the HSQC spectrum of 2 is shown in Figure 4.9 and the NOESY spectrum of 2 is shown in Figure 4.10.
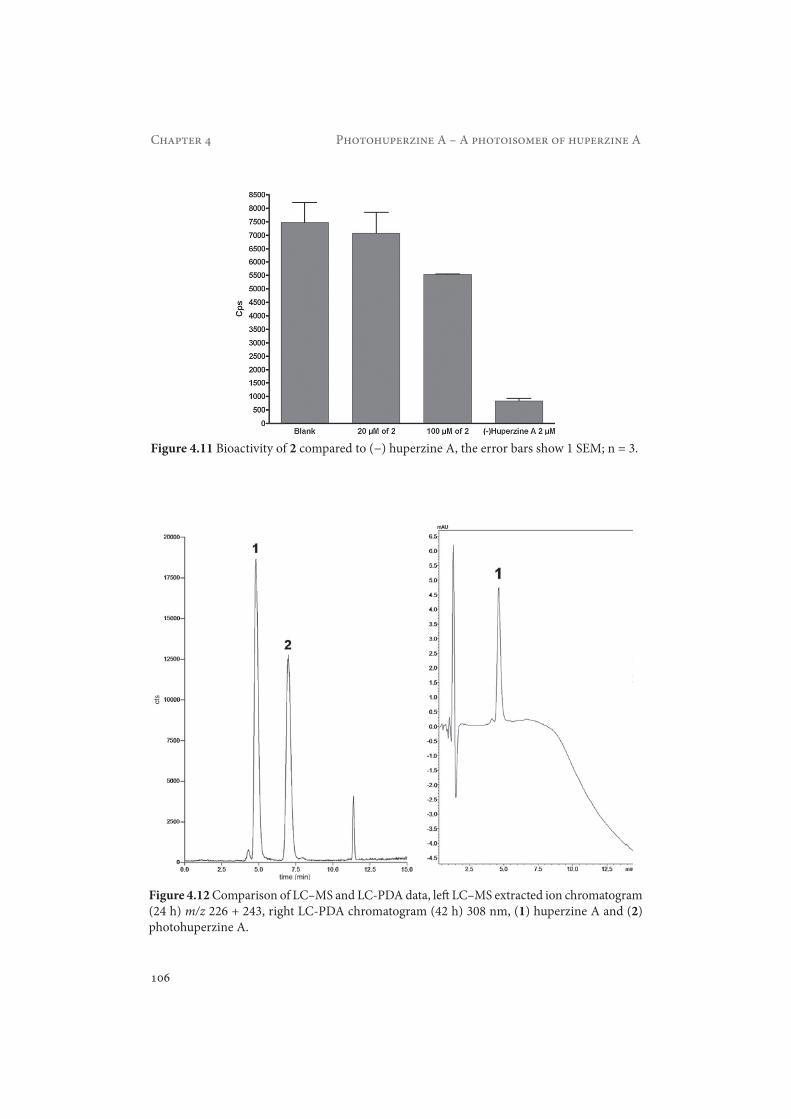
4.3.3 Inhibitory activityIn order to test the inhibitory activity of 2, a high purity sample was necessary because huper-zine A itself is a very strong Acetylcholinesterase (AChE) inhibitor (Wang et al., 2006) having an IC50 of 460 nM (de Jong et al., 2006). On the other hand, 2 did not show any significant AChE inhibition up to a concentration of 100 μM. As a result, it is at least 100 times less potent than 1 itself (Figure 4.11). A reason for this dramatic loss in activity can be given by compar-ing the MM2 (Chem 3D pro 11.0, Cambridgesoft, default settings) energy minimized structures of 1 and 2 (Figure 4.6). It can be seen that forming the photopyridon substructure severely
106
Chapter 4 Photohuperzine A – A photoisomer of huperzine A
Figure 4.11 Bioactivity of 2 compared to (−) huperzine A, the error bars show 1 SEM; n = 3.
Figure 4.12 Comparison of LC–MS and LC-PDA data, left LC–MS extracted ion chromatogram (24 h) m/z 226 + 243, right LC-PDA chromatogram (42 h) 308 nm, (1) huperzine A and (2) photohuperzine A.

107
Chapter 4 Photohuperzine A – A photoisomer of huperzine A
alters the planarity of the original 2-pyridon part of the molecule. In addition, this part of the molecule also loses its aromatic character. Overall, the investigated double bond-isomerization leads to severe changes in the conformation of the molecule, which possibly explains the loss of activity. An in depth description of the interactions between (±) huperzine A and its target enzyme can be found in the literature (Dvir et al., 2002, Raves et al., 1997).
4.3.4 Kinetics of formationAs can be seen from Figure 4.12, none of the formed photoproducts shows a significant absorption at 308 nm. Next to the formation of the new photoisomer 2, the LC–MS data revealed the occurrence of a minor photoproduct with a retention time of 11.5 min. This substance was not investigated further during this study as its present amount was not sufficient for characterization. The strong baseline drift in the PDA chromatogram can be explained by the fact that trifluoroacetic acid was only present in eluent A.
Figure 4.13 shows that the photodegradation of 1 is following first-order kinetics, with the equation ln c = ln c0 − kt, where c (μM) is the concentration at time t (h), c0 is the starting concentration and k is the rate constant (h−1). This means that k is equal to the slope of the obtained plot. Under the described experimental conditions, the regression coefficient (R2) for the logarithmic plot was determined to be 0.9912, while k was −0.03331 ± 0.0005161 h−1.
Figure 4.13 First-order (logarithmic) photodegradation of (±) huperzine A, upper right corner, UV absorbance spectra at different time points, the arrow indicates the measurement wavelength (308 nm).

108
Chapter 4 Photohuperzine A – A photoisomer of huperzine A
4.4 Conclusions
The study presents a new photo-derivative of (±) huperzine A (1) generated after irradiation with a Xenon lamp using wavelengths of 310 nm and higher. Formation of the photoisomer, named photohuperzine A (2), followed first-order kinetics, as expected for a photodegradation reaction. The new substance was formed by a photoisomerization reaction leading to a photo-pyridone type of structure possessing a β-lactam substructure. The bioactivity assessment with an AChE assay showed the poor activity of 2 against the target enzyme AChE having at least a 100 times lower bioactivity than (−) huperzine A. A likely explanation for this is the signifi-cant difference in the molecular conformation between the two compounds. Overall, the photoreactivity determined for 1 has to be considered for its storage conditions and future studies.
Acknowledgements
M. Giera was supported by the German Academic Exchange Programme (DAAD) and L. Azevedo Marques was supported by the Alban programme, the European Union programme of high level scholarships for Latin America (scholarship E06D102010BR).

109
Chapter 4 Photohuperzine A – A photoisomer of huperzine A
References
Ashani Y, Peggins JO and Doctor BP. Mechanism of Inhibition of Cholinesterases by Huperzine-A. Biochemical and Biophysical Research Communications 1992; 184: 719-726.
de Jong CF, Derks RJ, Bruyneel B, Niessen W and Irth H. High-performance liquid chromatography-mass spectrometry-based acetylcholinesterase assay for the screening of inhibitors in natural extracts. Journal of Chromatography A 2006; 1112: 303-310.
Dvir H, Jiang HL, Wong DM, Harel M, Chetrit M, He XC, Jin GY, Yu GL, Tang XC, Silman I, Bai DL and Sussman JL. X-ray structures of Torpedo californica acetylcholinesterase complexed with (+)-huperzine A and (-)-huperzine B: structural evidence for an active site rearrangement. Biochemistry 2002; 41: 10810-10818.
Hongo H, Iwasa K, Kabuto C, Matsuzaki H and Nakano H. Preparation of optically active photopyridone by lipase-catalyzed asymmetric resolution. Journal of Chemical Society Perkin Transactions I 1997: 1747-1754.
Kozikowski AP, Campiani G, Saxenac A and Doctor BP. Synthesis and acetylcholinesterase inhibitory activity of several pyrimidone analogues of huperzine A. Journal of the Chemical Society, Chemical Communications 1995: 283-285.
Kozikowski AP, Xia Y, Reddy ER, Tuckmantel W, Hanin I and Tang XC. Synthesis of huperzine-A and its analogs and their anticholinesterase activity. Journal of Organic Chemistry 1991; 56: 4636-4645.
Liu JS and Zhu YL. The structures of huperzine A and B, two new alkaloids exhibiting marked anticholinesterase activ-ity. Canadian Journal of Chemistry 1986; 64: 837-839.
Ma X, Tan C, Zhu D, Zhu DR and Xiao P. Huperzine A from Huperzia species--an ethnopharmacolgical review. Journal of Ethnopharmacology 2007; 113: 15-34.
Matsushima R and Terada K. Photoreactions of alkylated 2-pyridones. Journal of Chemical Society Perkin Transactions II 1985: 1445-1448.
Niemitz M, Laatikainen R, Chen SN, Kleps R, Kozikowski AP and Pauli G. Complete 1H NMR spectral fingerprint of huperzine A. Magnetic Resonance in Chemistry 2007; 45: 878-882.
Patocka J. Huperzine A - an interesting anticholinesterase compound from the Chinese herbal medicine. Acta Medica 1998; 41: 155-157.
Qian L and Ji R. A total synthesis of (±)-huperzine A Tetrahedron Letters 1989; 30: 2089-2090.
Raves ML, Harel M, Pang YP, Silman I, Kozikowski AP and Sussman JL. Structure of the acetylcholine esterase complexed with the nootropic alkoid (–)-huperzine. Nature Structural Biology 1997; 4: 57-63.
Wang R and Tang XC. Neuroprotective effects of huperzine A. A natural cholinesterase inhibitor for the treatment of Alzheimer’s disease. Neurosignals 2005; 14: 71-82.
Wang R, Yan H and Tang XC. Progress in studies of huperzine A, a natural cholinesterase inhibitor from Chinese herbal medicine. Acta Pharmacologica Sinica 2006; 27: 1-26.
Wang Y, Chu D, Gu J, Fawcett JP, Wu Y and Liu W. Liquid chromatographic-tandem mass spectrometric method for the quantitation of huperzine A in dog plasma. Journal of Cromatography B 2004; 803: 375-378.
Wei G, Xiao S, Lu R and Liu C. Simultaneous determination of ZT-1 and its metabolite Huperzine A in plasma by high-performance liquid chromatography with ultraviolet detection. Journal of Cromatography B 2006; 830: 120-125.
Xiaochao M, Haixue W, Jian X, Zhang T and Zenghong T. Identification of cytocrome P450 1A2 as enzyme involved in the microsomal metabolism of Huperzine A. European Journal of Pharmacology 2003; 461: 89-92.
Ye J, Zeng S, Zhang W and Chen G. Ion-pair reverse-phase high performance liquid chromatography method for deter-mination of Huperzine-A in beagle dog serum. Journal of Chromatography B 2005; 817: 187-191.


![Analysis of [FeFe]hydrogenase genes for the elucidation of a ...](https://static.fdokumen.com/doc/165x107/6324e1b9051fac18490cfd07/analysis-of-fefehydrogenase-genes-for-the-elucidation-of-a-.jpg)