Computing Optimal Policies for Markovian Decision Processes Using Simulation
Upload
independentCategory
view
0download
0
Journal of Pharmacokinetics and Biopharmaceutics, Vol. 22, No. 5, 1994
A Non-Markovian Model for Calcium Kinetics in the Body
George H. Weiss, ~'5 Ronald E. Goans, 2 Moshe Gitterman, 1'3 Steven A. Abrams, 4 Nancy E. Vieira, ~ and Alfred L. Yergey 2
Received May 10, 1994--Final December 14, 1994
We present a new generalized compartmental model for calcium kinetics as measured by tracer concentration in blood plasma. The parameter measuring incorporation of calcium in bone discrimi- nates between different levels of physical development in female teenagers and between teenagers and adults.
KEY WORDS: calcium kinetics; bone.
INTRODUCTION
Calcium tracer experiments offer a unique probe of the bone micro- environment, and a characterization of calcium kinetics can provide an important tool for investigating biochemical phenomena in vivo a t the blood-bone interface. Standard models that describe the kinetics of such experiments rely heavily on mathematical formalism derived from the ana- lysis of compartmental models (1). Such models generally consist of a finite number of distinct compartments, the rate of transfer of chemical species between compartments being modeled in terms of first-order kinetics. The resulting mathematical expression for the concentration in any compartment consists of a weighted sum of negative exponential terms unless the rate constants satisfy special conditions.
~Physical Sciences Laboratory, DCRT, National Institutes of Health, Bethesda, Maryland 20892.
2Laboratory of Theoretical and Physical Biology, NICHD, National Institutes of Health, Bethesda, Maryland 20892,
3Department of Physics, Bar-Ilan University, Ramat-Gan, Israel, 52100. 4Department of Pediatrics, Baylor College of Medicine and USDA/ARS Children's Nutrition Research Center, Houston, Texas 77030.
5To whom correspondence should be addressed.
367 0090-466X/94/t000-0367507.00/0 �9 1994 Plenum Publishing Corporation
368 Weiss et al.
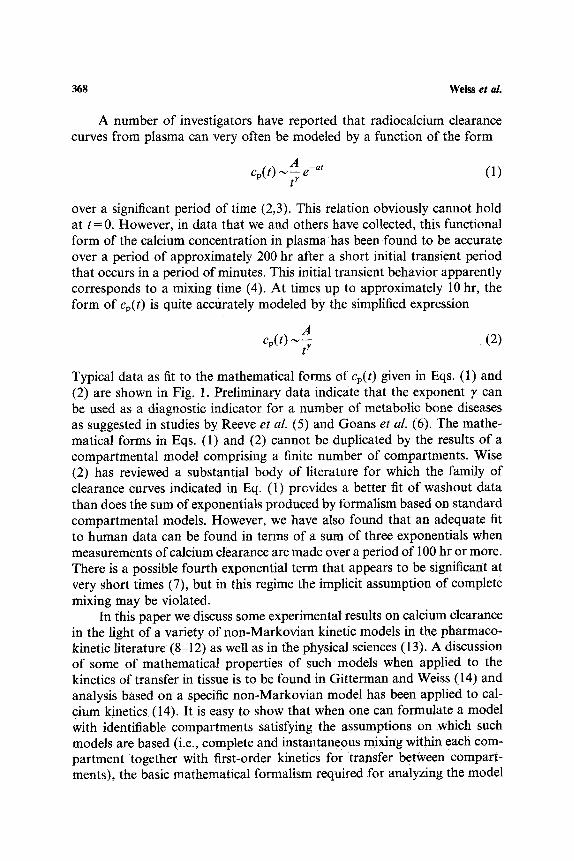
A number of investigators have reported that radiocalcium clearance curves from plasma can very often be modeled by a function of the form
c p ( t ) ~ e -~t t 7 (1)
over a significant period of time (2,3). This relation obviously cannot hold at t = 0. However, in data that we and others have collected, this functional form of the calcium concentration in plasma has been found to be accurate over a period of approximately 200 hr after a short initial transient period that occurs in a period of minutes. This initial transient behavior apparently corresponds to a mixing time (4). At times up to approximately 10 hr, the form of Cp(t) is quite accurately modeled by the simplified expression
A ep(t) , ,~ (2)
Typical data as fit to the mathematical forms of Cp(t) given in Eqs. (1) and (2) are shown in Fig. 1. Preliminary data indicate that the exponent 7, can be used as a diagnostic indicator for a number of metabolic bone diseases as suggested in studies by Reeve et al. (5) and Goans et al. (6). The mathe- matical forms in Eqs. (1) and (2) cannot be duplicated by the results of a compartmental model comprising a finite number of compartments. Wise (2) has reviewed a substantial body of literature for which the family of clearance curves indicated in Eq. (1) provides a better fit of washout data than does the sum of exponentials produced by formalism based on standard compartmental models. However, we have also found that an adequate fit to human data can be found in terms of a sum of three exponentials when measurements of calcium clearance are made over a period of 100 hr or more. There is a possible fourth exponential term that appears to be significant at very short times (7), but in this regime the implicit assumption of complete mixing may be violated.
In this paper we discuss some experimental results on calcium clearance in the light of a variety of non-Markovian kinetic models in the pharmaco- kinetic literature (8-12) as well as in the physical sciences (13). A discussion of some of mathematical properties of such models when applied to the kinetics of transfer in tissue is to be found in Gitterman and Weiss (14) and analysis based on a specific non-Markovian model has been applied to cal- cium kinetics (14). It is easy to show that when one can formulate a model with identifiable compartments satisfying the assumptions on which such models are based (i.e., complete and instantaneous mixing within each com- partment together with first-order kinetics for transfer between compart- ments), the basic mathematical formalism required for analyzing the model

Non-Markovian Model for Calcium Kinetics
Z
10 0
10 -I
1 I I (a)
1 0 - 2 i I , I m I ,
0 25 50 75 100 125 150 175 200
TIME (HOURS)
369
10 0
I2C
10 -I
0.1
�9 (b)
i i I i i
0.3 o.s 1 3 s 1o
TIME (HOURS)
Fig. 1. (a) A gamma function approximation [Eq. (1)] to the plasma clearance curve of 42Ca in a normal 33-year-old female subject. Systematic deviations from the curve begin to appear in the vicinity of 150-200 hr. (b) An approximation by the power law function in Eq. (2) to the same plasma clearance curve over a period of approximately 10 hr.

370 W ~ s s e t a l .
can be derived in terms of the compartmental model. On the other hand, non-Markovian models are able to encompass a much broader class of kinetic behavior, and, in particular, can be formulated to describe washout curves of the type shown in Eqs. (1) and (2). This would not be possible with standard compartmental models without the use of an infinite number of compartments. The use of non-Markovian models with a small number of physiologically identifiable compartments can therefore provide a concep- tually simpler framework in which to analyze kinetic data than the standard compartmental model.
As mentioned, standard compartmental modeling is based on a picture in which interchanges of molecules between compartments follows first-order kinetics. The concentration of a molecular species in any single compartment can often be expressed
cp(t) = Z A j e -;~jt (3) J
the exceptions to this general form arising from cases in which the character- istic roots of the system are degenerate. Since it is generally assumed that any system comprises only a finite number of compartments, the model of Cp(t) in this last equation cannot necessarily reproduce the kinetic behavior indicated by Eqs. (1) and (2). This deficiency can be overcome by casting some of the problems raised in a description of the kinetics of calcium deposition into bone in the framework defined by the class ~ of non- Markovian models.
THEORETICAL DEVELOPMENT
The main idea in our development is to model the dynamic equilibrium and bone surface as a composite two-compartment model. Intravenous tracer is injected into plasma as a bolus, and rapidly equilibrates with bone fluid. Some of this tracer can be lost into urine, feces, and intracellular compartments. The kinetics of calcium flow out of plasma to any of the remaining compartments is assumed to be first-order, although more com- plicated kinetic behavior can be incorporated into the formalism. The bone may consist of many compartments together with a network of possibly complicated interconnections as indicated schematically in Fig. 2. One of the compartments of our two-compartment model is the plasma in which the calcium concentration is presumed to be experimentally measurable. Our phenomenological model replaces the complementary set of compartments associated with bone by a single composite compartment. However, the kinetics of this composite compartment is not presumed to be first order as in standard compartmental modeling.

Non-Markovian Model for Calcium Kinetics 371
1
Fig. 2. A schematic diagram of the generalized calcium deposition model. The function ~,(t) accounts for a possibly complex kinetic behavior in exchangeable bone.
One way to condense the effects of compartments associated with bone into a single equivalent compartment is by introducing a retention time density function which we denote by ~(t). This function is a probability density for the time spent by a calcium atom in reversible receptors in bone f rom the time it enters the bone until the earliest time at which it returns to the plasma. The function ~(t) can be regarded as incorporating, at least on a phenomenological level, highly complex kinetic proceses that occur in the bone. Of course, the process of a single calcium atom shuttling between plasma and bone may be repeated a number of times before the calcium is either excreted or else is permanently incorporated into bone. Since ~(t) is a probability density, it cannot be negative. We can consider models that may or may not incorporate the possibility of permanent binding of calcium to bone. In the absence of permanent binding or any form of permanent outflow, ~(t) is characterized by the property
o ~ ~ ( t ) d t = 1
If there is any mechanism that would lead to permanent loss of calcium from plasma the value of the integral would be strictly less than 1. When the kinetics correspond to those of a standard compartmental model, one can always calculate a function ~(t) which corresponds to, and can be calculated from, parameters of that model.
372 Weiss et al.
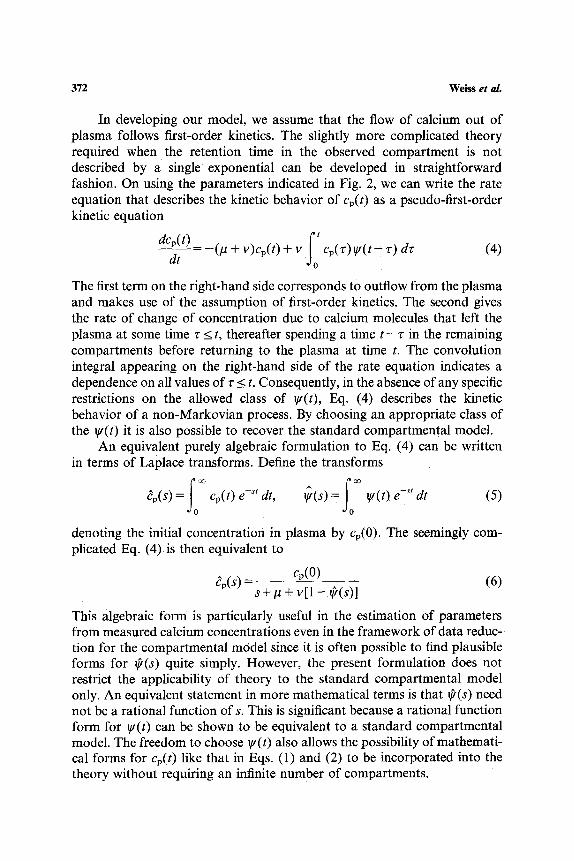
In developing our model, we assume that the flow of calcium out of plasma follows first-order kinetics. The slightly more complicated theory required when the retention time in the observed compartment is not described by a single exponential can be developed in straightforward fashion. On using the parameters indicated in Fig. 2, we can write the rate equation that describes the kinetic behavior of Cp(t) as a pseudo-first-order kinetic equation
dcp(t) _ fo' dt (P "+" V)Cp(t) "k V Cp('~') vt(t -- r) dr (4)
The first term on the right-hand side corresponds to outflow from the plasma and makes use of the assumption of first-order kinetics. The second gives the rate of change of concentration due to calcium molecules that left the plasma at some time r < t, thereafter spending a time t - r in the remaining compartments before returning to the plasma at time t. The convolution integral appearing on the right-hand side of the rate equation indicates a dependence on all values of r _< t. Consequently, in the absence of any specific restrictions on the allowed class of gt(t), Eq. (4) describes the kinetic behavior of a non-Markovian process. By choosing an appropriate class of the V(t) it is also possible to recover the standard compartmental model.
An equivalent purely algebraic formulation to Eq. (4) can be written in terms of Laplace transforms. Define the transforms
;0 j0 8p(S) = Cp(t) e -st dt, ~(s) = ~(t ) e -st dt (5)
denoting the initial concentration in plasma by Cp(0). The seemingly com- plicated Eq. (4)is then equivalent to
Op(S) = cp(O) (6) s + n § v[1 - 0 ( s ) l
This algebraic form is particularly useful in the estimation of parameters from measured calcium concentrations even in the framework of data reduc- tion for the compartmental model since it is often possible to find plausible forms for r quite simply. However, the present formulation does not restrict the applicability of theory to the standard compartmental model only. An equivalent statement in more mathematical terms is that @(s) need not be a rational function of s. This is significant because a rational function form for ~t(t) can be shown to be equivalent to a standard compartmental model. The freedom to choose ~,(t) also allows the possibility of mathemati- cal forms for cp(t) like that in Eqs. (1) and (2) to be incorporated into the theory without requiring an infinite number of compartments.
Non-Markovian Model for Calcium Kinetics 373
EXPERIMENTAL METHODS
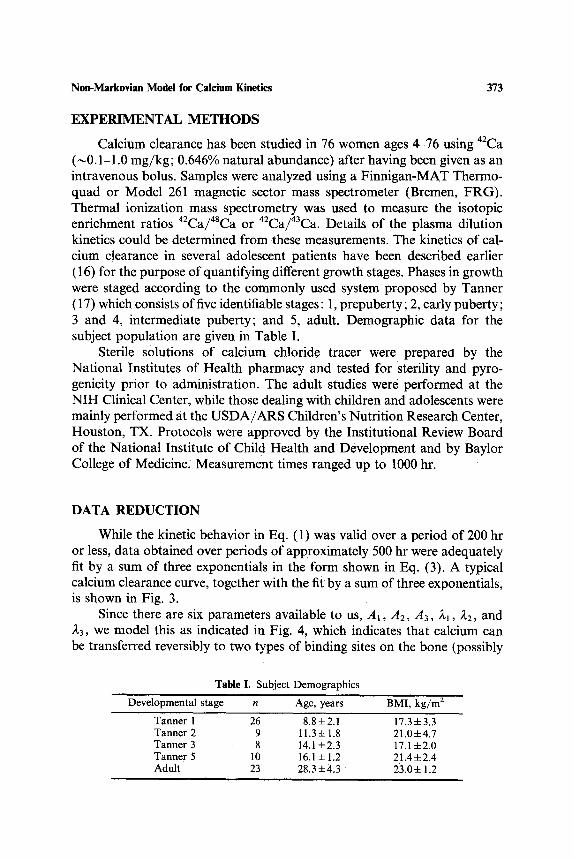
Calcium clearance has been studied in 76 women ages 4-76 using 42Ca (~0.1-1.0 mg/kg; 0.646% natural abundance) after having been given as an intravenous bolus. Samples were analyzed using a Finnigan-MAT Thermo- quad or Model 261 magnetic sector mass spectrometer (Bremen, FRG). Thermal ionization mass spectrometry was used to measure the isotopic enrichment ratios 42Ca/48Ca or 42ca/aaca. Details of the plasma dilution kinetics could be determined from these measurements. The kinetics of cal- cium clearance in several adolescent patients have been described earlier (16) for the purpose of quantifying different growth stages. Phases in growth were staged according to the commonly used system proposed by Tanner (17) which consists of five identifiable stages: 1, prepuberty; 2, early puberty; 3 and 4, intermediate puberty; and 5, adult. Demographic data for the subject population are given in Table I.
Sterile solutions of calcium chloride tracer were prepared by the National Institutes of Health pharmacy and tested for sterility and pyro- genicity prior to administration. The adult studies were performed at the NIH Clinical Center, while those dealing with children and adolescents were mainly performed at the USDA/ARS Children's Nutrition Research Center, Houston, TX. Protocols were approved by the Institutional Review Board of the National Institute of Child Health and Development and by Baylor College of Medicine. Measurement times ranged up to 1000 hr.
DATA REDUCTION
While the kinetic behavior in Eq. (1) was valid over a period of 200 hr or less, data obtained over periods of approximately 500 hr were adequately fit by a sum of three exponentials in the form shown in Eq. (3). A typical calcium clearance curve, together with the fit by a sum of three exponentials, is shown in Fig. 3.
Since there are six parameters available to us, A~, A2, A3, A,l, ~2, and A,3, we model this as indicated in Fig. 4, which indicates that calcium can be transferred reversibly to two types of binding sites on the bone (possibly
Table I. Subject Demographics
Developmental stage n Age, years BMI, k g / m 2
Tanner 1 26 8.8 -4- 2.1 17.3 • 3.3 Tanner 2 9 11.3 • 1.8 21.0 -4- 4.7 Tanner 3 8 14.1-4-2.3 17.1 • Tanner 5 10 16.1-4-1.2 21 .4• Adult 23 28.3 + 4 . 3 23.0 • 1.2

374 Weiss et aL
0 ( , , , i , , , , i . . . . i , , , ~ l , , , , i , , , , i , , ~ l , , , ~ l , , , , i , , , , l , , , ~ i , , , , IL . 1 0 ] -I
h~m,,Ip~,,l~,,~lJ,,,lJ~,,l,t,,l,J~,l,~,l,,,,Ir 0 100 200 300 400 500 600
rIME (HOURS) Fig. 3. A three-exponential fit to plasma clearance data over a period of approximately 600 hr from the subject whose shorter term data are shown in Fig. 1. There is some indication of systematic deviations from the proposed fitting function, but these remain fairly small over the entire time course.
related to the two classes of binding sites suggested by Bronner and Stein, ref. !8). There is also an irreversible outflow of calcium which is converted to excretory products, incorporated into intercellular compartments, or is irreversibly bound to bone. These are modeled in terms of first-order kinetics.
/ V r , I Exchangeable
t """" ) r 2 - A ~
Fig. 4. A six-parameter model for the kinetics of calcium transfer which generates the fitted curve used in Fig. 3.

Non-Markovian Model for Calcium Kinetics 375
It proved to be impossible to differentiate between different developmental subgroups on the basis of the A's and 2/s in the representation in Eq. (3) and applying standard parametric statistical tests to the data. However, our suggested formulation of the system kinetics in terms of rl, r2, 0, p, and v did allow us to differentiate between several of the classes.
Consider the composite compartment consisting of the two classes of binding sites that appear in Fig. 4. The kinetics of each class are mimicked by choosing the residence time density ~(t) to have the form
g( t) = Or~ e-r" + ( 1 - O)r2 e -r2' (7)
describing a system consisting of two types of reversible binding sites. Flow from plasma into the system of the two irreversible binding sites will be assumed to follow first-order kinetics with a rate constant equal to v, and irreversible outflow of calcium from plasma also will be assumed to be characterized by as first-order kinetics with a rate constant equal to/1. Since irreversible binding to bone is an important process, we separate out this rate constant by decomposing/~ into a sum of three components as
/t =/~b+/~u+/tr (8)
where Pb is the rate constant for permanent incorporation into bone, and /~u and/~r are outflow rates of calcium into urine and feces, respectively. Analysis of the compartment model yields an estimate of the parameter/~ and the rates/~u and/~r have been measured independently for each member of our healthy population. These proved to be nearly equal in all of the subgroups. In reducing our data we assumed that the irreversible uptake into bone is by far the major outflow from plasma, although it is possible to make independent measurements of excretory outflow. When the Laplace transform of Vt(t) given in Eq. (7) is substituted into Eq. (6) we can write the formal expression for dp(s) as
cp(O)(s + r0(s + r2) _ N(s)
cp=(S+l~)(s+rO(s+rz)+VS{s+Orz+(1-O)rl} D(S) (9)
where N(s) and D(s) are the numerator and denominator, respectively, on the right-hand side of the equation. Since a satisfactory fit to the data is found by assuming that Cp(t) is fit by a linear combination of three exponen- tials, we can also write
~p(s)= A, + A2 4 A3 _ N ( s ) (10) s+2,1 s+X2 s+2,3 D(s)
in which the 2,'s are the roots of the cubic D(s). It can be shown that the &'s in this equation must be both real and negative when D(s) has the form

376 Weiss et aL
indicated in Eq. (9). It is not known whether this property carries over when there are more than two exponentials in V(t).
We next consider the problem of finding the six parameters of our model, p, v, 0, rl, r2, and Cp(0) in terms of the A's and the 2's. By conven- tion we set the initial concentration equal to 1 which is equivalent to A1 +A2+A3 = 1. For the purpose of finding the remaining parameters it is convenient to remain in the Laplace transform domain and equate the coefficients of the different powers of s in the two expressions given for N(s) and D(s) in Eqs. (9) and (10). When we equate the powers of s 2 and s in the numerator, we find that r~ and r2 are the solution to the pair of equations
r 1 + r 2 = a (11)
rlr2=b
in which a and b are found from the experimentally determined A's and 2's a s
a = A1(A2 + A3) + A2(21 +23) + Aa(A1 +22) (12)
b = A12223 + A2A1A3 + A3AIA2
Both lines of Eq. (11) can be combined to yield a single quadratic equation whose roots are
rl,2=�89 ) (13)
Notice that the two lines in Eq. (11) are symmetric in r~ and r2, which reflects the symmetry in our formulation of the kinetic model. The parameter /1 is found by equating the constant terms of D(s) in the representations given in Eqs. (9) and (10), yielding the relation
21Av~3 p = - - (14)
b
If we now equate the coefficient of s 2 in D(s) we find that v is
I,' = 21-~- 22 -{- 23 " 11 --a (15)
Finally, the parameter 0 is found by equating the coefficients of s in the denominators of the two expressions for dp(S). This leads to
0 =2(21 + A2 + A3-/1 - a ) - vr~ (16) v(r2 - r,)
Thus, the five required coefficients in our kinetic model are given in Eqs. (13)-(16).
Non-Markovian Model for Calcium Kinetics 377
RESULTS
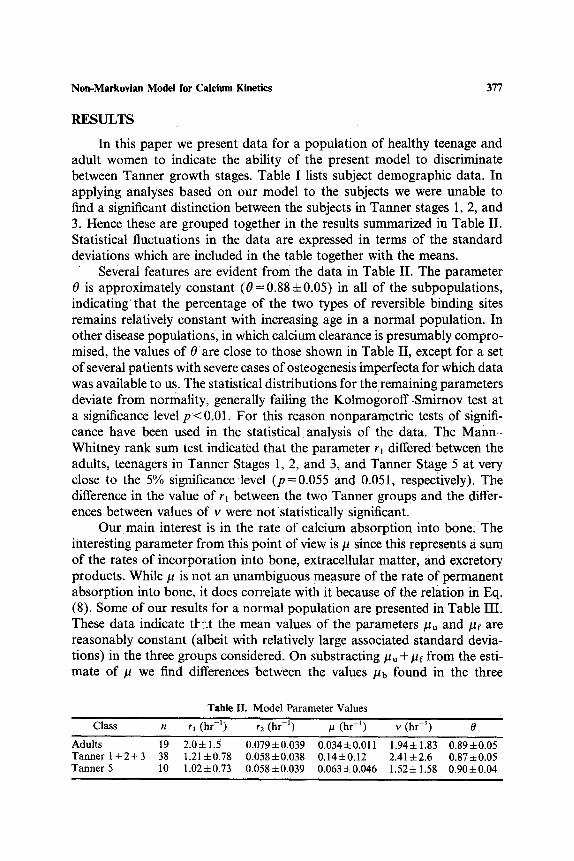
In this paper we present data for a population of healthy teenage and adult women to indicate the ability of the present model to discriminate between Tanner growth stages. Table I lists subject demographic data. In applying analyses based on our model to the subjects we were unable to find a significant distinction between the subjects in Tanner stages 1, 2, and 3. Hence these are grouped together in the results summarized in Table II. Statistical fluctuations in the data are expressed in terms of the standard deviations which are included in the table together with the means.
Several features are evident from the data in Table II. The parameter 0 is approximately constant (0 =0.88 4-0.05) in all of the subpopulations, indicating that the percentage of the two types of reversible binding sites remains relatively constant with increasing age in a normal population. In other disease populations, in which calcium clearance is presumably compro- mised, the values of 0are close to those shown in Table II, except for a set of several patients with severe cases of osteogenesis imperfecta for which data was available to us. The statistical distributions for the remaining parameters deviate from normality, generally failing the Kolmogoroff-Smirnov test at a significance level p<0.01. For this reason nonparametric tests of signifi- cance have been used in the statistical analysis of the data. The Mann- Whitney rank sum test indicated that the parameter r~ differed between the adults, teenagers in Tanner Stages 1, 2, and 3, and Tanner Stage 5 at very close to the 5% significance level (p=0.055 and 0.051, respectively). The difference in the value of r~ between the two Tanner groups and the differ- ences between values of v were not statistically significant.
Our main interest is in the rate of calcium absorption into bone, The interesting parameter from this point of view is p since this represents a sum of the rates of incorporation into bone, extracellular matter, and excretory products. While p is not an unambiguous measure of the rate of permanent absorption into bone, it does correlate with it because of the relation in Eq. (8). Some of our results for a normal population are presented in Table III. These data indicate tl-~.t the mean values of the parameters pu and pf are reasonably constant (albeit with relatively large associated standard devia- tions) in the three groups considered. On substracting Pu + Pr from the esti- mate of p we find differences between the values Pb found in the three
Table II. Model Parameter Values
Class n rl (hr -I) r2 (hr -I) p (hr -1) v (hr -l) 0
Adults 19 2.0• 0.079+0.039 0.034+0.011 1.94-4-1.83 0.895:0.05 Tanner 1 + 2 + 3 38 1.215:0.78 0.058q-0.038 0.145:0.12 2.415:2.6 0.874-0.05 Tanner 5 10 1.02 5:0.73 0.058 5:0.039 0.063 5:0.046 1.52 5:1.58 0.90 5:0.04

378 Weiss et at,.
Table Ill. Plasma Outflow Rates
Class #~ (hr L) /~r (hr -I) ~ (hr -~)
AdUlts 4.9+215 x 10 -3 3.0+-2.0 • 10 -3 2.64- 1.I x 10 -2 Tanner 1 + 2 + 3 4.5-4- 3.7 x 10 -3 2 .7+2.3 x i0 -3 1 . 3 + 1 . 2 x 10 -1 Tanner 5 4 .5+2 .0 x 10 -3 3.0+- 1.4 x 10- 3 5.6+-4,6 x 10 -2
identifiable groups that significant at the p=0.01 level. The value of/ab is seen to be 311% higher in the combined Tanner 1 + 2 + 3 group than that for adults while the same rate is 85% higher than for the adults in our study. These changes roughly parallel relative growth curves for adolescents. The more interesting parameter from the physiological point of view is the rate of absorption into bone,/Zb. These are found in the third column of Table [II and the indicated differences are also found to be significant at the p=0 .01 level. The group whose physiological growth is the most rapid is the Tanner 1 + 2 + 3. The computed value of ]-/b for this group is the largest among the three groups, followed by that for Tanner Group 5, which approaches the slowest absorption rate found in healthy adults.
Additional manifestations of growth kinetics are found in the trend towards an increased half-life of calcium on both types of reversible binding sites, as measured by the rate constants rl and r2. for adults as compared to the adolescent population. The fact that the half-life of a calcium ion on one of the binding sites is between 15 and 20 times as great as that for the other suggests that the binding sites with the shorter retention times are important for minute-to-minute regulation of plasma ion concentration, while the second type of binding sites appear to relate to long-term aspects of mineralizations.
II has been suggested by Jung et al. (19) that parameter estimates in noncompartmental models of calcium kinetics are often less sensitive to measurement errors than are those of standard compartmental models. Whether that is also true for the formulation suggested in the present paper has not yet been investigated.
A CKNOW LEDGMENT
We are extremely grateful to Dr. JoseP Porrfi for providing a proof of the fact t ha t t he ~'s in Eq~ (10) are all positive.
REFERENCES 1. K: Godfrey. Compartmental Models and their Applications, Academic Press, New York,
1983. :2. M. El Wise. Negative power functions of time in pharmacokinetics ar/4 their implications.
J. Pharmacokin. Biopha~m. 13:309-346 ([985).

Non-Markovian Model for Calcium Kinetics 379
3. J. H. Marshall. Calcium pools and the power function. In Per-E. E. Bergner and C. C. Lushbaugh (eds.), Compartments, Pools and Spaces in Medical Physiology, Vol. 11, 1967, pp. 451-468.
4. M. Weiss. Modeling of initial distribution of drugs following intravenous bolus injection. Eur. J. Clin. Pharmacol. 23:121-126 (1983).
5. J. Reeve, R. Wootton, and R. Hesp. A new method for calculating the accretion rate of bone calcium and some observations on the suitability of strontium-85 as a tracer for bone calcium. Calcif. Tiss. Res. 20:121-135 (1976).
6. R. E. Goans, S. A. Abrams, N. E. Vieira, J. C. Marini, M. D. Perez, and A. L. Yergey. A three hour measurement to evaluate bone calcium turnover. Bone 16:33-38 (1995).
7. R. M. Neer, M. Berman, L. Fisher, and L. E. Rosenberg. Multicompartmental analysis of calcium kinetics in normal adult males. J. Clin. Invest. 41:1364-1379 (1967).
8. E. B. Reeve and H. R. Bailey. Mathematical models describing the distribution of I TM
in man. J. Lab. Clin. Med. 60:923-943 (1962). 9. A. H. Marcus. Power laws in compartmental models. I. A unified stochastic model.
Math. Biosci. 23:337 350 (1975). 10. A. H. Marcus and A. Becker. Power laws in compartmental models. II. Numerical
evaluation of semi-Markov models. Math. Biosci. 35:27-45 (1977). 11. A. H. Marcus and A. Becker. Alkaline earth metabolism: The ICRP model reformulated
as a semi-Markov model. Health Physics 38:825-832 (1980). 12. W. R. Gillespie. Generalized pharmacokinetic modelling for drugs with nonlinear
binding. 1. Theoretical framework. J. Pharmacokin. Biopharm. 21:99-124 (1993). 13. G. H. Weiss. On a generalized transport equation for chromatographic systems. In
J. Klafter, R. J. Rubin, and M. F. Shlesinger (eds.), Transport and Relaxation in Random Materials, World Scientific, Singapore, 1986, pp. 394-406.
14. M. Gitterman and G. H. Weiss, Generalized theory of the kinetics of tracers in biological systems. J. Math. Biol. 56:171-186 (1994).
15. J. H. Matis and T. E. Wehrly. Generalized stochastic compartmental models with Erlang transit times. J. Pharmacokin. Biopharm. 18:589-607 (1990).
16. S. A. Abrams. Pubertal changes in calcium kinetics in girls assessed using 42Ca. Pediatr. Res. 34:455-459 (1993).
17. J. M. Tanner. Growth at Adolescence, 2nd ed., Blackwell, Oxford, 1962. 18. F. Bronner and W. D. Stein. Modulation of bone calcium-binding sites regulates plasma
calcium: an hypothesis. Calcif. Tissue Int. 50:483-492 (1992). 19. A. Jung, P. Bartholdi, B. Mermillod, J. Reeve, and R. Neer. Critical analysis of methods
for analyzing human calcium kinetics. J. Theoret. Biol. 73:131-57 (1978).
Copyright © 2022 FDOKUMEN