Elucidation of the crystallization kinetics for sodium-alumino-silicate glasses containing different...
19
PLEASE SCROLL DOWN FOR ARTICLE This article was downloaded by: [Aisha] On: 21 November 2010 Access details: Access Details: [subscription number 929947012] Publisher Taylor & Francis Informa Ltd Registered in England and Wales Registered Number: 1072954 Registered office: Mortimer House, 37- 41 Mortimer Street, London W1T 3JH, UK Phase Transitions Publication details, including instructions for authors and subscription information: http://www.informaworld.com/smpp/title~content=t713647403 Elucidation of the crystallization kinetics for sodium-alumino-silicate glasses containing different amounts of manganese oxide A. A. Soliman a ; I. Kashif b ; E. M. Sakr a ; A. Ratep a a Faculty of Girls, Department of Physics, Ain Shams University, Heliopolis, Cairo, Egypt b Faculty of Science, Department of Physics, Al-Azhar University, Nasr City, Cairo, Egypt Online publication date: 20 November 2010 To cite this Article Soliman, A. A. , Kashif, I. , Sakr, E. M. and Ratep, A.(2010) 'Elucidation of the crystallization kinetics for sodium-alumino-silicate glasses containing different amounts of manganese oxide', Phase Transitions, 83: 12, 1096 — 1113 To link to this Article: DOI: 10.1080/01411594.2010.508459 URL: http://dx.doi.org/10.1080/01411594.2010.508459 Full terms and conditions of use: http://www.informaworld.com/terms-and-conditions-of-access.pdf This article may be used for research, teaching and private study purposes. Any substantial or systematic reproduction, re-distribution, re-selling, loan or sub-licensing, systematic supply or distribution in any form to anyone is expressly forbidden. The publisher does not give any warranty express or implied or make any representation that the contents will be complete or accurate or up to date. The accuracy of any instructions, formulae and drug doses should be independently verified with primary sources. The publisher shall not be liable for any loss, actions, claims, proceedings, demand or costs or damages whatsoever or howsoever caused arising directly or indirectly in connection with or arising out of the use of this material.
Transcript of Elucidation of the crystallization kinetics for sodium-alumino-silicate glasses containing different...
PLEASE SCROLL DOWN FOR ARTICLE
This article was downloaded by: [Aisha]On: 21 November 2010Access details: Access Details: [subscription number 929947012]Publisher Taylor & FrancisInforma Ltd Registered in England and Wales Registered Number: 1072954 Registered office: Mortimer House, 37-41 Mortimer Street, London W1T 3JH, UK
Phase TransitionsPublication details, including instructions for authors and subscription information:http://www.informaworld.com/smpp/title~content=t713647403
Elucidation of the crystallization kinetics for sodium-alumino-silicateglasses containing different amounts of manganese oxideA. A. Solimana; I. Kashifb; E. M. Sakra; A. Ratepa
a Faculty of Girls, Department of Physics, Ain Shams University, Heliopolis, Cairo, Egypt b Faculty ofScience, Department of Physics, Al-Azhar University, Nasr City, Cairo, Egypt
Online publication date: 20 November 2010
To cite this Article Soliman, A. A. , Kashif, I. , Sakr, E. M. and Ratep, A.(2010) 'Elucidation of the crystallization kineticsfor sodium-alumino-silicate glasses containing different amounts of manganese oxide', Phase Transitions, 83: 12, 1096 —1113To link to this Article: DOI: 10.1080/01411594.2010.508459URL: http://dx.doi.org/10.1080/01411594.2010.508459
Full terms and conditions of use: http://www.informaworld.com/terms-and-conditions-of-access.pdf
This article may be used for research, teaching and private study purposes. Any substantial orsystematic reproduction, re-distribution, re-selling, loan or sub-licensing, systematic supply ordistribution in any form to anyone is expressly forbidden.
The publisher does not give any warranty express or implied or make any representation that the contentswill be complete or accurate or up to date. The accuracy of any instructions, formulae and drug dosesshould be independently verified with primary sources. The publisher shall not be liable for any loss,actions, claims, proceedings, demand or costs or damages whatsoever or howsoever caused arising directlyor indirectly in connection with or arising out of the use of this material.
Phase TransitionsVol. 83, No. 12, December 2010, 1096–1113
Elucidation of the crystallization kinetics for sodium-alumino-silicate
glasses containing different amounts of manganese oxide
A.A. Solimana*, I. Kashif b, E.M. Sakra and A. Ratepa
aFaculty of Girls, Department of Physics, Ain Shams University, Heliopolis, Cairo, Egypt;bFaculty of Science, Department of Physics, Al-Azhar University, Nasr City, Cairo, Egypt
(Received 17 April 2010; final version received 12 July 2010)
The glass samples [40SiO2þ 5Al2O3þ {55� x}Na2Oþ xMnO2] where x¼ 0.05,0.2, 0.4, 0.6, 0.8, and 1mol% MnO2 before and after being heat treated weresubjected to X-ray diffraction. The diffraction lines provided clear evidence of thenucleation and growth, which are characteristic of sodium silicate phase.Crystallization studies were conducted using differential thermal analysis.Crystallization peak temperatures were identified and the transformed fractionswere determined. Both the rate of growth, K0, and the activation energy, E,depend on the influence of manganese ions in the glass network as a modifier oras a former and the manganese content. The values of the Avrami parameter, n,were calculated using two methods and were in excellent agreement. The processof nucleation and growth rate depends on the manganese content.
Keywords: non-isothermal DTA; crystallization kinetics; nucleation and growth;silicate glasses
1. Introduction
The element of manganese has at least five stable oxidation states with distinctive colors(as is typical of transition metals). It is commonly encountered in the laboratory as thecompound KMnO4 which is a strong oxidizing agent. MnO2 catalyzes the decompositionof H2O2 and is sometimes used for the small scale production of oxygen gas in the lab. Theelectronic structure of the manganese atom is [Ar] 3d54s2 and its stable ionic states areMn2þ. In oxide glasses such as silicate, manganese ions could enter as Mn3þ and Mn2þ
species, so that it is possible that these ions enter both network former and networkmodifier sites [1,2]. Structure studies and mechanical properties of manganese ions insodium-alumino-silicate glasses prepared by adding 0.05–1.0mol% of Mn2O3 in the glasscomposition were performed. Depending on manganese concentrations, both Mn2þ andMn3þ species were present [3]. Crystallization of glass samples involves both nucleationand growth of the crystallites and possibly amorphous phase separation processes [4–6].Knowledge of crystal growth and nucleation rates in glasses at different temperatures isessential for applications in which nucleation must be avoided. The transformation from
*Corresponding author. Email: [email protected]
ISSN 0141–1594 print/ISSN 1029–0338 online
� 2010 Taylor & Francis
DOI: 10.1080/01411594.2010.508459
http://www.informaworld.com
Downloaded By: [Aisha] At: 18:54 21 November 2010
amorphous to crystalline in glasses can be investigated by isothermal and non-isothermal
methods [7–9]. In the isothermal method, the sample is brought near the crystallization
temperature very quickly and then any physical quantity, which changes drastically,
is measured as a function of time. In the non-isothermal method, the sample is heated at a
fixed rate and the physical quantity is recorded as a function of time or temperature.
A disadvantage of the isothermal method is the impossibility of reaching a test
temperature instantaneously and during the time, which system needs to stabilize, no
measurements are possible. However, the non-isothermal method does not have this
drawback [10,11]. Due to the above-mentioned reason, non-isothermal method has been
used before [11–15] and in this study for the study of crystallization kinetics. The non-
isothermal differential thermal analysis (DTA) was carried out at four different heating
rates in order to elucidate the crystallization mechanism for sodium-alumino-silicate
glasses containing different amounts of manganese oxide. Four different methods of
analysis [16–21] have been used to calculate the parameters of crystallization kinetics of the
investigated glass samples.
2. Basic theory
The theoretical basis for interpreting the crystallization kinetics of isothermal phase
change can be formally described by Johnson–Mehl–Avrami (JMA) theory [22,23]. This
model predicts that the volume fraction crystallized (x) after a time t, for an isothermal
process, can be expressed by the following equation:
� ¼ 1� expð�ðktÞnÞ, ð1Þ
where n is a characteristic transformation constant, which characterizes the shape of the
transformed domain together with the transformation rate. Alternatively, the logarithmic
transformation of Equation (1) leads to [24]:
ln ln1
1� x
� �� �¼ n lnðkÞ þ n lnðtÞ, ð2Þ
where K is defined as the effective overall reaction rate constant, which reflects the rates of
both nucleation and growth. This is usually assigned to Arrhenion temperature
dependence as
k ¼ k0 exp�E
RT
� �, ð3Þ
where E (kJmol�1) is the effective activation energy describing the overall crystallization
process and R (JK�1) is a gas constant. In a non-isothermal regime, the rate constant K
changes continually with time due to the change of the temperature and Equation (1) can
be rewritten in the form [25]:
�ðtÞ ¼ 1� exp �
Z t
0
K½Tð�tÞ�d �t
� �n� �¼ 1� expð�I nÞ: ð4Þ
Deriving Equation (4) with respect to time, the crystallization rate is obtained as:
_� ¼ nKð1� �ÞI n�1: ð5Þ
Phase Transitions 1097
Downloaded By: [Aisha] At: 18:54 21 November 2010
The maximum rate of crystallization occurs at the peak of the exothermic at
time tp and temperature Tp [26]. The differentiation of Equation (5) with respect to
time yields
€� ¼ nKpðInÞp � ðn� 1ÞKp �
�EIpRT 2
p
¼ 0: ð6Þ
The time integral in Equation (4) is transformed to a temperature integral yielding
IðT Þ ¼K0
�
Z T
T0
exp�E
R �Td �T: ð7Þ
The integral I can be expressed, according to the literature [27], by the sum of the
alternating series:
Sð �yÞ ¼�e� �y
�y2
Xk¼1k¼0
ð�1Þkðkþ 1Þ!
�yk, ð8Þ
where �y ¼ E=R �T. Considering that in this type of series, the error produced is less than the
first term neglected and bearing in mind that in most crystallization reactions�y ¼ E=R �T� 1, it is possible to use only the first two terms of this series, and the error
introduced is not greater than 1%. In addition, if it is assumed that T�T0, (T0 is the
starting temperature), so that �y 0 can be taken as infinity [27], then the last expression of the
integral is
Ip ¼1� 2RTp
nE
� �1=n
: ð9Þ
Substituting for Ip into Equation (6) and taking the logarithmic form, we get
lnðT 2p=�Þ þ lnðK0R=E Þ � E=RTp ¼ ð2RTp=E Þð1� n�2Þ: ð10Þ
It should be noted that for most crystallization reactions, the right-hand side (RHS) of
Equation (10) is generally negligible in comparison to the individual terms on the left-hand
side for common heating rates (�100Kmin�1). Therefore, the approximation in Equation
(10) (RHS¼ 0) might introduce a 3% error in the value of E/R in the worst cases [27], and
Equation (10) becomes
lnT 2p
�
!¼
Ec
RTpþ ln
E
K0R
� �: ð11Þ
Then, the activation energy of crystallization process, Ec, was developed by Kissinger’s
[16], Augis–Bennett’s [19], Matusita–Sakka’s [17,18], and Ozawa–Chen’s [20,21] methods.
In this article, the activation energy of crystallization has been calculated by using the
above different methods that evaluated, E, from different thermograms held at different
heating rates. The first three methods are based on the determination of the fraction of
crystallization, x, for different heating rates using the dependence of peak crystallization
temperature, Tp, on the heating rates, �, while the last method (Ozawa–Chen) is based on
the effect of heating rate, �, on the temperature at which the crystallization fraction, x, is
constant.
1098 A.A. Soliman et al.
Downloaded By: [Aisha] At: 18:54 21 November 2010
3. Experimental work
A series of glass samples of [40SiO2þ 5Al2O3þ {55� x} Na2Oþ xMnO2], where x¼ 0.05,0.2, 0.4, 0.6, 0.8, and 1mol% MnO2, as shown in Table 1, were prepared by using rawmaterials. All of these are chemically pure and they were finally pulverized. Thehomogeneous mixture was melted in a porcelain crucible in an electrically programmableheated furnace, type (VAF 15/10) LENTON thermal designs, equipped with an automatictemperature controller. The samples were melted at about 1100� 20 for 2 h with heatingrate 30�Cmin�1. The molten material was quenched in air and poured at roomtemperature between two steel plates. The quenched samples were annealed at 300�Cfor 20min. The as-made glasses were immediately stored in vacuum desiccators until usedfor measurement. The samples were examined by using Philips analytical X-ray diffraction(XRD) system, Type PW 3710 based with Cu tube anode, which confirms the amorphousnature of the investigated glass samples. Each glass sample is heat treated at around thecrystallization temperature (Tc). The measurements were carried out using a non-isothermal method with DTA techniques. The DTA measurements were carried out usinga SHIMADZU DTA-50 ANALYZER between 25�C and 1100�C (in N2 gas using Al2O3
powder as a reference material), at different heating rates �¼ 15, 25, 35, and 40Kmin�1.
4. Results and discussions
4.1. XRD investigations
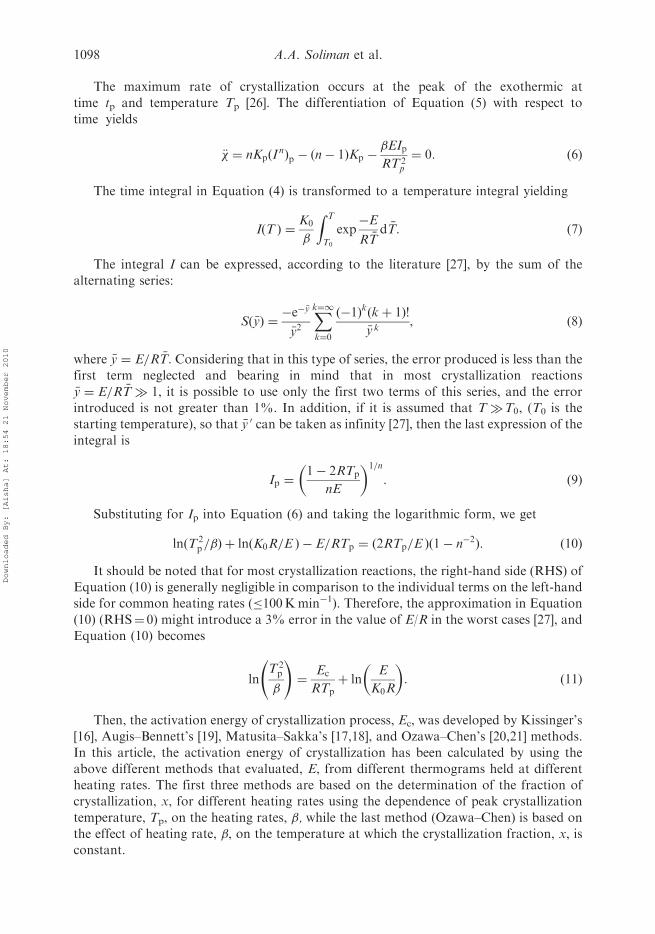
XRD pattern of the investigated glass samples {40mol% SiO2þ 5mol%Al2O3þ (55� x)mol% Na2Oþ xmol% MnO2} with x¼ 0.05, 0.2, 0.4, 0.6, 0.8, and1mol% MnO2 before and after heat treatment at about the crystallization temperature areshown in Figure 1(a) and (b), respectively. Figure 1(a) shows a broad halo peak at arounddiffraction angles (2�) 32�, which is characteristic of the fully amorphous structure,confirming that these glass samples are composed of a glassy phase. The glass sampleswere heat treated at about Tp and partly crystallized as shown in Figure 1(b).The diffraction lines are providing a clear evidence of the nucleation process and thegrowth, which are characteristic for the formation of sodium silicate phase in all the glasssamples. The broad XRD diffraction line indicates that the sodium silicate particles areof nano size.
4.2. Composition dependence
The DTA curves of the glass samples {40mol% SiO2þ 5mol% Al2O3þ (55� x) mol%Na2Oþ xmol% MnO2}, where x¼ 0.05, 0.2, 0.4, 0.6, 0.8, and 1mol% MnO2 were
Table 1. Code and silicate glass composition (mol%).
Code SiO2 Al2O3 Na2O MnO2
S1 40 5 54.95 0.05S2 40 5 54.8 0.2S3 40 5 54.6 0.4S4 40 5 54.4 0.6S5 40 5 54.2 0.8S6 40 5 54 1
Phase Transitions 1099
Downloaded By: [Aisha] At: 18:54 21 November 2010
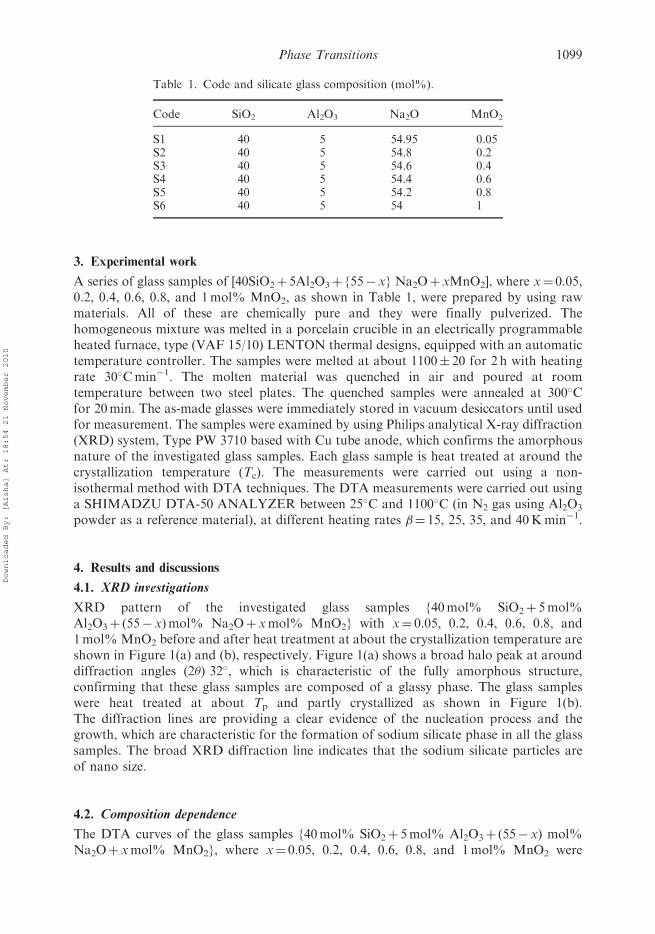
obtained at four heating rates (�¼ 15, 25, 35, and 40Kmin�1) for each composition.Figure 2 shows the non-isothermal DTA curves for glass sample S6 at chosen heating ratefrom 15 to 40Kmin�1 as an example. It is clear that the peak temperature, which is takenas the crystallization temperature, Tp shifts towards higher temperatures as the heatingrate is increased from 15 to 40Kmin�1 as shown in Table 2. The effect of heating rate onthe variation of Tp with the composition of manganese contents is shown in Figure 3. It isfound that the value of Tp, decreases comparatively in the glass samples containing05 x� 0.4mol% MnO2, and then shows the dramatic change step-wisely inx4 0.4mol% MnO2. The average value of Tp with the manganese content confirmsthis trend as shown in Figure 3 and listed in Table 2. It shows that there is a gradual
S6
S5
S3
S1
S6
S5
S3
S1
18 32 46 60 74
2q
2q
Inte
nsity
(a.
u.)
Inte
nsity
(a.
u.)
Sodium silicate
4 18 32 46 60 74
(a)
(b)
Figure 1. The XRD of the investigated glass samples (a) before heat treated and (b) after heattreated at Tp.
1100 A.A. Soliman et al.
Downloaded By: [Aisha] At: 18:54 21 November 2010

decrease in Tp average values up to 0.4mol% MnO2, followed by a sharp drop in Tp’s
beyond 0.4mol% MnO2. Then the investigated glass samples seem to have two regions
of affect, one up to 0.4mol% MnO2 and another one beyond 0.4mol% MnO2, which
could be attributed to the effect of the different oxidation states of manganese ions in theglass network, since the SiO2/Al2O3 ratio, is constant in all the glass samples and the ratio
of SiO2/Na2O depends on the manganese concentration.
Figure 2. The non-isothermal DTA curves for glass sample S6 at chosen heating rates, as anexample.
Table 2. The crystallization temperature Tp with different heating rates and the parameters A and Bof Equation (1).
Tp (K)The average
valuesThe valuesof A and B
Code15
(Kmin�1)25
(Kmin�1)35
(Kmin�1)40
(Kmin�1) Tp (K)Heatingrate A B
S1 912 929.02 941 948 932.51 28.75 814.07 35.967S2 892 916 933.5 939.5 918.75 28.75 759.76 48.739S3 884.4 910 929.5 940 915.97 28.75 732.31 55.78S4 835.4 861 873.5 889.4 864.83 28.75 695.34 51.471S5 804 826.25 844 853.5 831.94 28.75 668.42 49.66S6 797.01 823.86 837.5 847.5 826.47 28.75 661.91 49.977
Phase Transitions 1101
Downloaded By: [Aisha] At: 18:54 21 November 2010
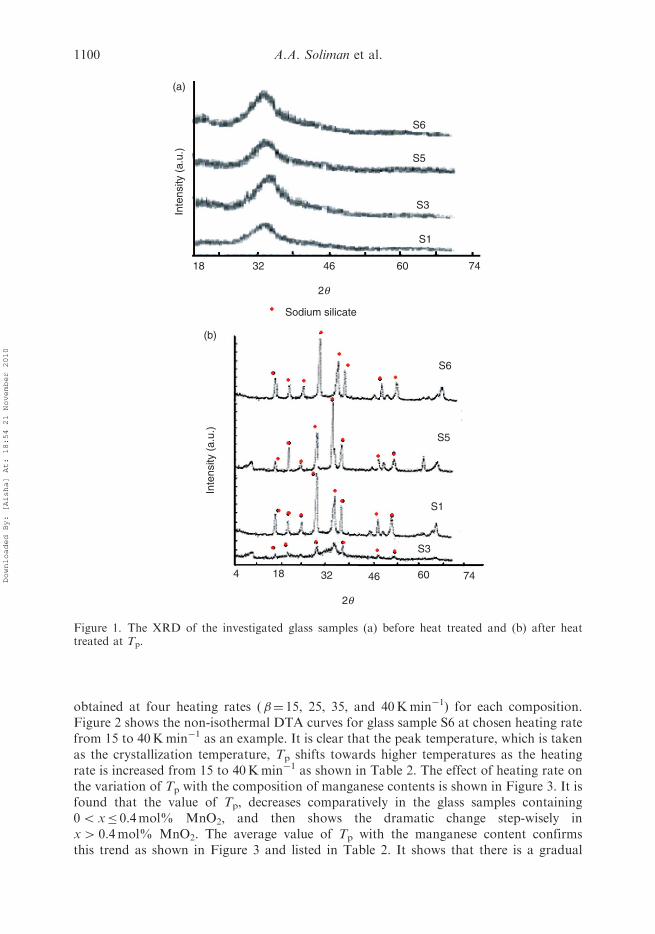
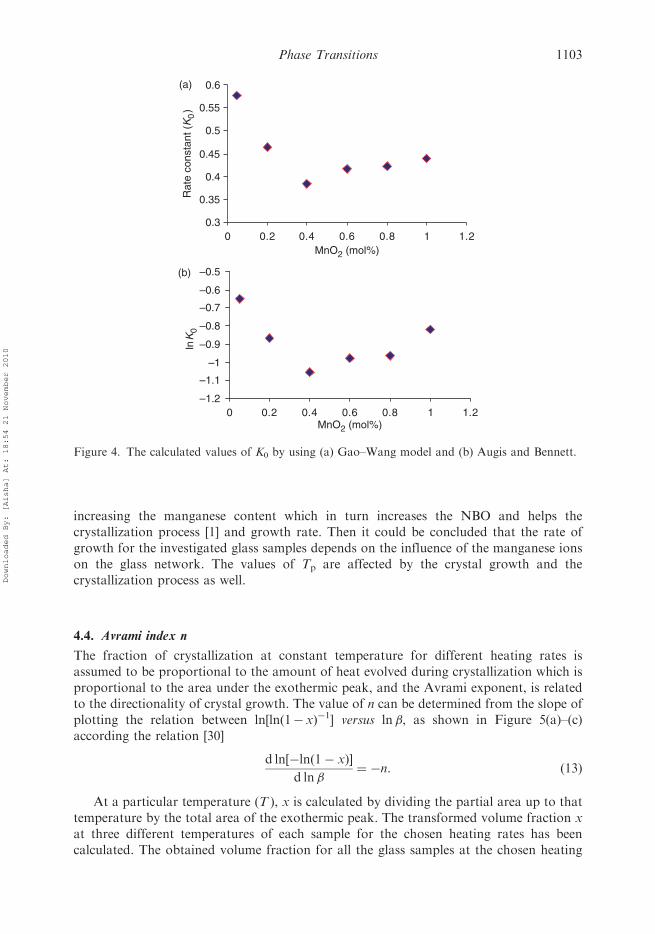
4.3. Calculation of rate constant of crystallization process (K0)
To get information about the morphology of the nucleation and growth, the following
equation from the Gao–Wang model [28] has been used to calculate the value of the rateconstant K0 at peak crystallization temperature (Tp) for a constant heating rate:
K0 ¼ ð�E Þ=RT2p : ð12Þ
The calculated values of K0 at constant heating rate for all the glass samples are shownin Figure 4(a). Augis and Bennett [19] is another method which has been used to calculate
the values of the rate constant, as shown in Figure 4(b). The two figures are shown in thesame trend at which K0 is decreased rapidly up to 0.4mol% MnO2 reaching a minimum
value at S3 (0.4mol% MnO2) and then increased gradually beyond 0.4mol% MnO2. Thisbehavior could be used to interpret the trend of the variation of Tp. Since K0 is measuringthe growth rate, it can be seen that the growth rate decreases for the glass samples
containing manganese up to 0.4mol% MnO2 and then increases by the addition of moremanganese. As far as is known, the application of controlled crystallization process
required that attention be paid to both nucleation and growth rates. Therefore, the reasonfor this behavior could be due to the fact that the investigated glass samples are highlynucleated initially, and the nucleation decreases by increasing the MnO content up to
0.4mol% MnO2, reaching a minimum at 0.4mol% MnO2. Beyond 0.4mol% MnO2, ahigh amount of manganese contents can induce a high crystal growth rate and increase the
nucleation process resulting in the glass samples. Then, the rate of constant K0 has twoaffected regions as Tp. The structural and chemical local order within the network insilicate glasses can be characterized by the concentration of various types of Si
environment, typically expressed as Qn species, where n varies between 0 and 4 anddenotes the number of bridging oxygens [29]. Therefore, in the concentration
region�0.4mol% MnO2, the manganese ions may mostly exist in Mn2þ state, occupynetwork forming positions with MnO4 structural units and in turn increase the bridgingoxygen, which increases the polymerization of the silicate glass network and weakens the
crystallization process at this region of manganese content [1,2]. Above 0.4mol% MnO2,the manganese ions may change to Mn3þ state and occupy modifying positions with
790
810
830
850
870
890
910
930
950
970
0 0.2 0.4 0.6 0.8 1 1.2MnO2 (mol%)
Tp
(K)
Tp K at 15Kmin–1
Tp at 25Tp at 35Tp at 40Taverage
Figure 3. The effect of heating rates on the variation of Tp with the Manganese contents.
1102 A.A. Soliman et al.
Downloaded By: [Aisha] At: 18:54 21 November 2010
increasing the manganese content which in turn increases the NBO and helps thecrystallization process [1] and growth rate. Then it could be concluded that the rate ofgrowth for the investigated glass samples depends on the influence of the manganese ionson the glass network. The values of Tp are affected by the crystal growth and thecrystallization process as well.
4.4. Avrami index n
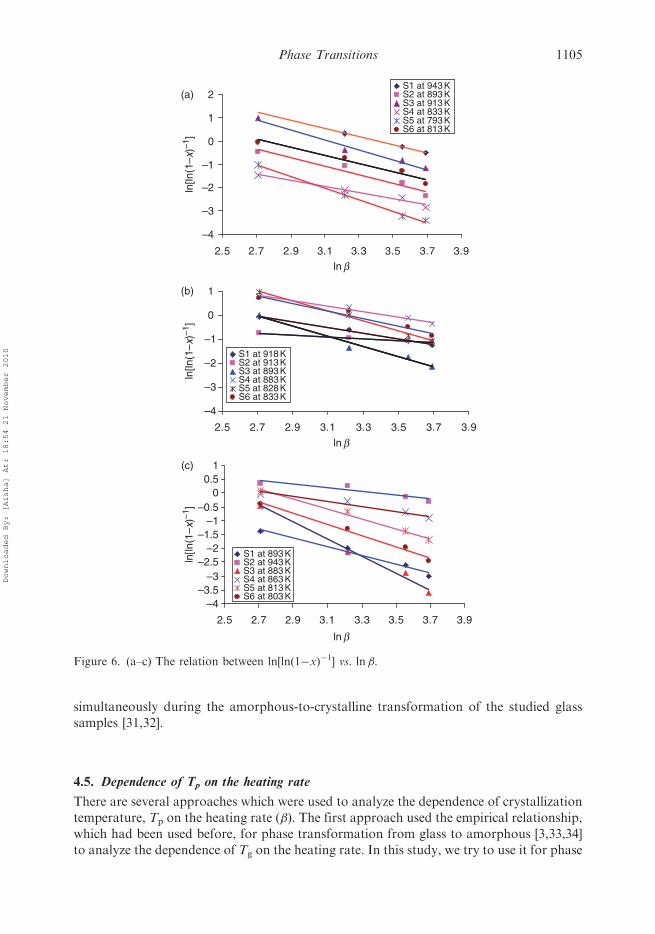
The fraction of crystallization at constant temperature for different heating rates isassumed to be proportional to the amount of heat evolved during crystallization which isproportional to the area under the exothermic peak, and the Avrami exponent, is relatedto the directionality of crystal growth. The value of n can be determined from the slope ofplotting the relation between ln[ln(1� x)�1] versus ln�, as shown in Figure 5(a)–(c)according the relation [30]
d ln½�lnð1� xÞ�
d ln�¼ �n: ð13Þ
At a particular temperature (T ), x is calculated by dividing the partial area up to thattemperature by the total area of the exothermic peak. The transformed volume fraction xat three different temperatures of each sample for the chosen heating rates has beencalculated. The obtained volume fraction for all the glass samples at the chosen heating
(a)
0.3
0.35
0.4
0.45
0.5
0.55
0.6
MnO2 (mol%)
Rat
e co
nsta
nt (
K0)
(b)
–1.2
–1.1
–1
–0.9
–0.8
–0.7
–0.6
–0.5
0 0.2 0.4 0.6 0.8 1 1.2
0 0.2 0.4 0.6 0.8 1 1.2MnO2 (mol%)
lnK
0
Figure 4. The calculated values of K0 by using (a) Gao–Wang model and (b) Augis and Bennett.
Phase Transitions 1103
Downloaded By: [Aisha] At: 18:54 21 November 2010
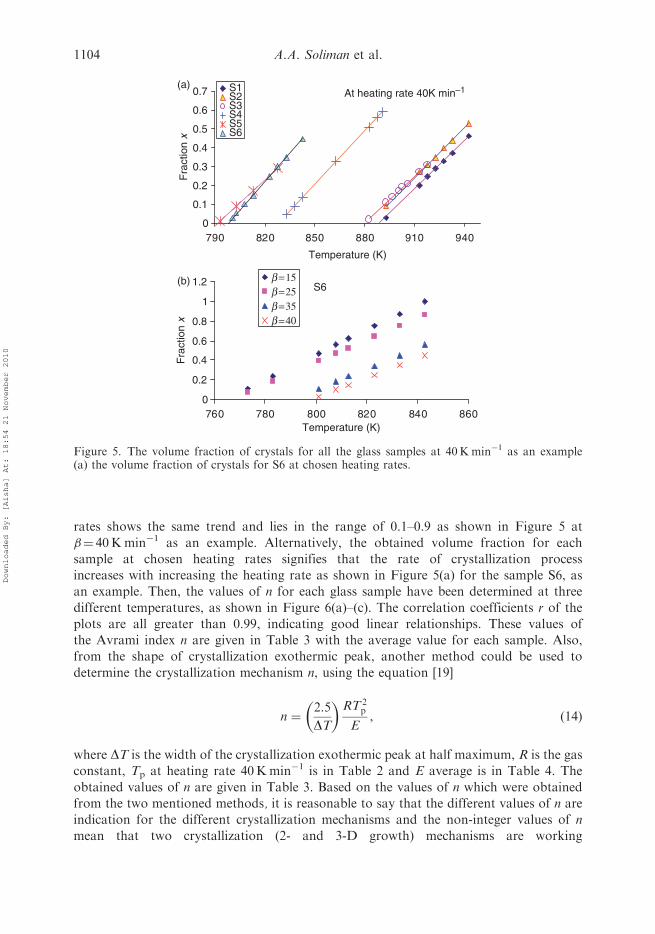
rates shows the same trend and lies in the range of 0.1–0.9 as shown in Figure 5 at
�¼ 40Kmin�1 as an example. Alternatively, the obtained volume fraction for each
sample at chosen heating rates signifies that the rate of crystallization process
increases with increasing the heating rate as shown in Figure 5(a) for the sample S6, as
an example. Then, the values of n for each glass sample have been determined at three
different temperatures, as shown in Figure 6(a)–(c). The correlation coefficients r of the
plots are all greater than 0.99, indicating good linear relationships. These values of
the Avrami index n are given in Table 3 with the average value for each sample. Also,
from the shape of crystallization exothermic peak, another method could be used to
determine the crystallization mechanism n, using the equation [19]
n ¼2:5
DT
� �RT 2
p
E, ð14Þ
where DT is the width of the crystallization exothermic peak at half maximum, R is the gas
constant, Tp at heating rate 40Kmin�1 is in Table 2 and E average is in Table 4. The
obtained values of n are given in Table 3. Based on the values of n which were obtained
from the two mentioned methods, it is reasonable to say that the different values of n are
indication for the different crystallization mechanisms and the non-integer values of n
mean that two crystallization (2- and 3-D growth) mechanisms are working
At heating rate 40K min–1(a)
(b)
0
0.1
0.2
0.3
0.4
0.5
0.6
0.7
790 820 850 880 910 940
Temperature (K)
Fra
ctio
n x
S1S2S3S4S5S6
S6
0
0.2
0.4
0.6
0.8
1
1.2
760 780 800 820 840 860Temperature (K)
Fra
ctio
n x
b =15b =25b =35b =40
Figure 5. The volume fraction of crystals for all the glass samples at 40Kmin�1 as an example(a) the volume fraction of crystals for S6 at chosen heating rates.
1104 A.A. Soliman et al.
Downloaded By: [Aisha] At: 18:54 21 November 2010
simultaneously during the amorphous-to-crystalline transformation of the studied glasssamples [31,32].
4.5. Dependence of Tp on the heating rate
There are several approaches which were used to analyze the dependence of crystallizationtemperature, Tp on the heating rate (�). The first approach used the empirical relationship,which had been used before, for phase transformation from glass to amorphous [3,33,34]to analyze the dependence of Tg on the heating rate. In this study, we try to use it for phase
–4
–3
–2
–1
0
1
2(a)
(b)
(c)
ln b
ln[ln
(1–x
)–1]
S1 at 943 KS2 at 893 KS3 at 913 KS4 at 833 KS5 at 793 KS6 at 813 K
–4
–3
–2
–1
0
1
ln b
ln[ln
(1–x
)–1]
S1 at 918 KS2 at 913 KS3 at 893 KS4 at 883 KS5 at 828 KS6 at 833 K
–4–3.5
–3–2.5
–2–1.5
–1–0.5
00.5
1
2.5 2.7 2.9 3.1 3.3 3.5 3.7 3.9
2.5 2.7 2.9 3.1 3.3 3.5 3.7 3.9
2.5 2.7 2.9 3.1 3.3 3.5 3.7 3.9
ln b
ln[ln
(1–x
)–1]
S1 at 893 KS2 at 943 KS3 at 883 KS4 at 863 KS5 at 813 KS6 at 803 K
Figure 6. (a–c) The relation between ln[ln(1�x)�1] vs. ln�.
Phase Transitions 1105
Downloaded By: [Aisha] At: 18:54 21 November 2010
Table
3.Avramiindex,n,in
thestudiedglass
samples.
Theinvestigatedglass
samples
S1
S2
S3
S4
S5
S6
T(K
)n
T(K
)n
T(K
)n
T(K
)n
T(K
)n
T(K
)n
Thevalues
ofnfrom
theslope
893
1.6
893
1.84
883
3.08
833
1.35
793
2.48
803
1.56
918
1.2
913
0.96
893
2.11
863
0.89
813
1.79
813
1.72
943
1.7
943
0.67
913
2.14
883
1.13
828
2.12
833
2.02
n(average)
n(average)
n(average)
n(average)
n(average)
n(average)
1.5
1.16
2.44
1.12
2.13
1.77
Thevalues
ofDT
(K)
59.015
56.491
60.501
83.23
69.31
61.04
Thevalues
ofnfrom
calculations
1.737
2.401
2.648
1.799
2.053
2.314
1106 A.A. Soliman et al.
Downloaded By: [Aisha] At: 18:54 21 November 2010

transformation from amorphous to crystallization phase, using Tp instead of Tg to analyzethe dependence of Tp on the heating rate that can be written in the following form:
Tp ¼ Aþ B ln�, ð15Þ
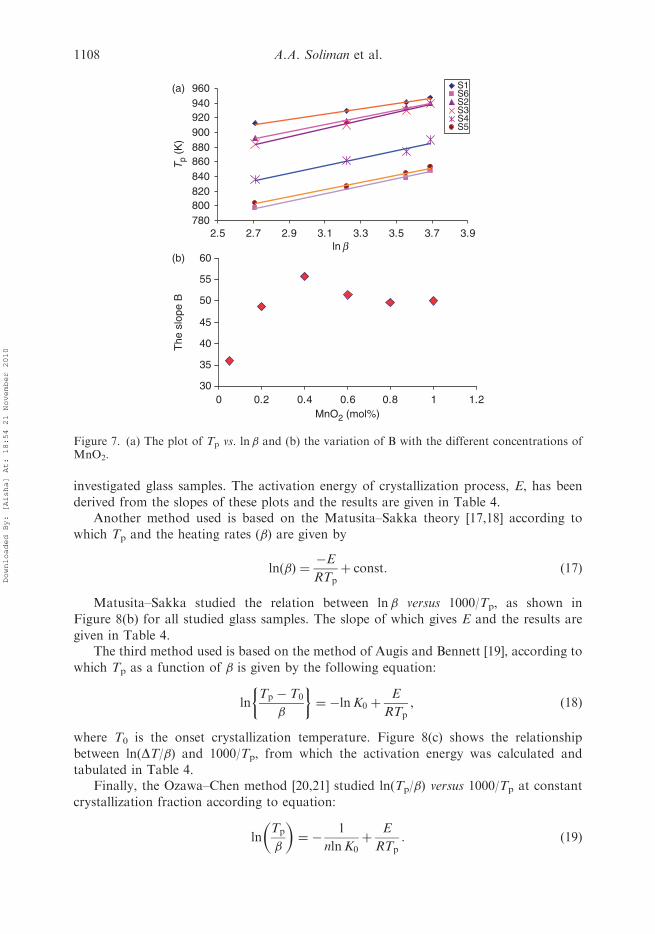
where A and B are constants for a given glass composition and � is the rate of heating.Then the plot of Tp versus ln� gives a straight line, the slope of which gives B. The plot ofthe results shown in Figure 7(a) indicated the validity of Equation (14) for the investigatedglass samples. The obtained values of A and B are given in Table 2. For a betterunderstanding of the variation of the values B, let us think of the variation of B withdifferent concentrations of MnO2 which is shown in Figure 7(b). It shows that the trend ofthe variation of values of B is exactly in the direction opposite to that of the values of K0
(rate of crystallization process) with the manganese content, which is shown in Figure 3(a)and (b). It is obvious that the values of B are increased as the manganese content isincreased up to 0.4mol% at which it has a decrease in the values of the rate constant K0.Beyond 0.4mol% MnO2, the value of B shows a decrease while the rate of crystallization,K0 shows an increase. Then the slope B is related to the crystal growth and thecrystallization process, where the lower value of B, corresponds to the higher the rate ofcrystallization and crystal growth and vice versa. This signifies that B is related with theresponse of the construction changes within the crystallization transition region Tp.
4.6. Activation energy of crystallization process (E)
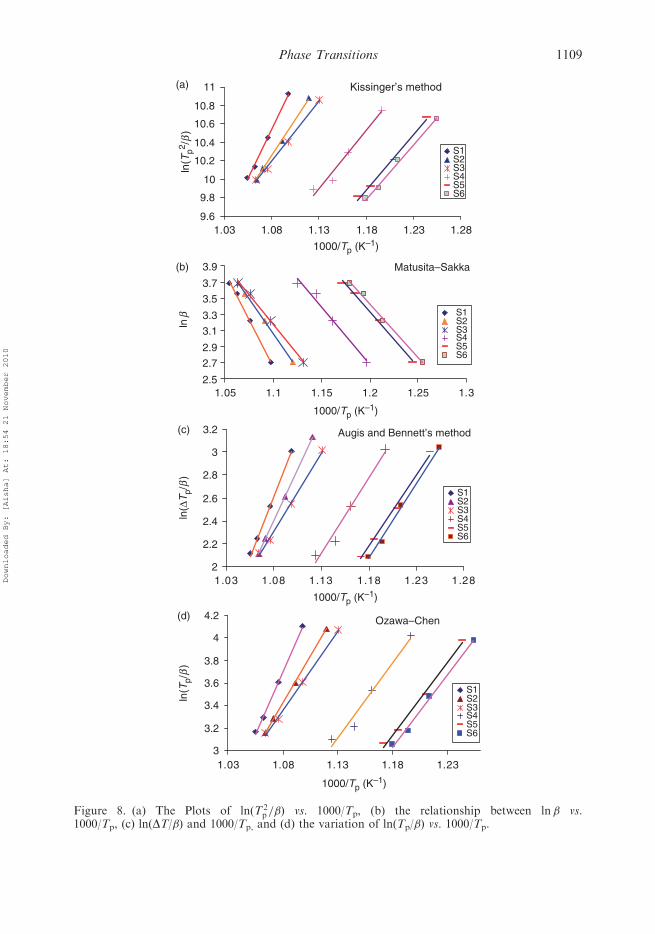
The second approach which was used is the determination of the activation energy ofcrystallization process of each glass sample to analyze the dependence of crystallizationtemperature on the heating rate (�). It has been calculated by four different methods usedin the literature and the correlation coefficients r of the plots in four methods are allgreater than 0.99, indicating good linear relationships. The first method used is Kissinger’smethod [16], according to which the peak temperature of crystallization Tp is expressed asa function of heating rate by the following equation:
lnT 2p
�
!¼ ln
E
R
� �� lnAþ
E
RTp, ð16Þ
where A is constant which depends on the material and R is the gas constant. Plots oflnðT 2
p=�Þ as a function of 1000/Tp have been made as shown in Figure 8(a) for the
Table 4. The crystallization activation energy Ec (kJmol�1) in the investigated glass systems.
Crystallization activation energy Ec (kJmol�1)
Sample (a) Kissinger (b) Matusita–Sakka (c) Augis–Bennett (d) Ozawa–Chen Ec (average)
S1 177.296 192.203 174.877 184.513 182.222S2 129.757 145.212 151.315 137.414 135.263S3 108.339 122.074 113.369 114.766 114.637S4 102.611 116.928 110.052 109.637 109.807S5 100.259 114.002 104.258 107.126 106.411S6 97.972 110.809 108.315 105.629 105.681
Phase Transitions 1107
Downloaded By: [Aisha] At: 18:54 21 November 2010
investigated glass samples. The activation energy of crystallization process, E, has been
derived from the slopes of these plots and the results are given in Table 4.Another method used is based on the Matusita–Sakka theory [17,18] according to
which Tp and the heating rates (�) are given by
lnð�Þ ¼�E
RTpþ const: ð17Þ
Matusita–Sakka studied the relation between ln� versus 1000/Tp, as shown in
Figure 8(b) for all studied glass samples. The slope of which gives E and the results are
given in Table 4.The third method used is based on the method of Augis and Bennett [19], according to
which Tp as a function of � is given by the following equation:
lnTp � T0
�
� �¼ �lnK0 þ
E
RTp, ð18Þ
where T0 is the onset crystallization temperature. Figure 8(c) shows the relationship
between ln(DT/�) and 1000/Tp, from which the activation energy was calculated and
tabulated in Table 4.Finally, the Ozawa–Chen method [20,21] studied ln(Tp/�) versus 1000/Tp at constant
crystallization fraction according to equation:
lnTp
�
� �¼ �
1
nlnK0þ
E
RTp: ð19Þ
780800820840860880900920940960(a)
(b)ln b
Tp
(K)
S1S6S2S3S4S5
2.5 2.7 2.9 3.1 3.3 3.5 3.7 3.9
30
35
40
45
50
55
60
MnO2 (mol%)
The
slo
pe B
0 0.2 0.4 0.6 0.8 1 1.2
Figure 7. (a) The plot of Tp vs. ln� and (b) the variation of B with the different concentrations ofMnO2.
1108 A.A. Soliman et al.
Downloaded By: [Aisha] At: 18:54 21 November 2010
Kissinger’s method
9.6
9.8
10
10.2
10.4
10.6
10.8
11
1.03 1.08 1.13 1.18 1.23 1.28
1000/Tp (K–1)
ln(T
p2 /b
)
S1S2S3S4S5S6
(b)
(a)
2.5
2.7
2.9
3.1
3.3
3.5
3.7
3.9
1000/Tp (K–1)
lnb S1
S2 S3 S4 S5 S6
Matusita–Sakka
(c)
2
2.2
2.4
2.6
2.8
3
3.2
1000/Tp (K–1)
ln(Δ
Tp/
b)
S1S2S3S4S5S6
Augis and Bennett’s method
(d) Ozawa–Chen
3
3.2
3.4
3.6
3.8
4
4.2
1.05 1.1 1.15 1.2 1.25 1.3
1.03 1.08 1.13 1.18 1.23 1.28
1.03 1.08 1.13 1.18 1.23
1000/Tp (K–1)
ln(T
p/b
)
S1S2S3S4S5S6
Figure 8. (a) The Plots of lnðT 2p=�Þ vs. 1000/Tp, (b) the relationship between ln � vs.
1000/Tp, (c) ln(DT/�) and 1000/Tp, and (d) the variation of ln(Tp/�) vs. 1000/Tp.
Phase Transitions 1109
Downloaded By: [Aisha] At: 18:54 21 November 2010
Figure 8(d) shows this relationship for different heating rates from which the activationenergy has been calculated and tabulated in Table 4. It can be observed that the values ofthe activation energy for crystallization of the Na2SiO3 phase, which are obtained by fourmethods, are reinforcing each other. The values of the activation energy obtained from theKissinger method have found to be much smaller than those obtained from other methodsand those obtained by Matusita–Sakka are larger than others. There is a noticeabledifference between the results obtained by the Kissinger model and those obtained byOzawa–Chen’s, Matusita–Sakka’s, and Augis–Bennett’s methods (the Kissinger method iscommonly used, which is one of the most used methods for crystallization kinetic studies).The activation energy of crystallization can be determined by using the Kissinger equation,which could be attributed to the applicability of the Kissinger equation to non-isothermalkinetics and this activation energy is deduced without taking into account thecrystallization mechanisms [24]. In some cases, surface and bulk crystallization occursimultaneously. The Kissinger equation is valid only when crystal growth occurs on a fixednumber of nuclei during crystallization process [24]. Incorrect values for the activationenergy can be obtained if a majority of the nuclei are formed during crystallization.A comparison among all the above different calculation methods for the activation energyand its average value has been made from which it can be deduced that all the usedmethods are valid to determine the activation energy for the studied glasses with differentlevels of accuracy. The most accurate method deduced according to this study is suggestedto be Ozawa–Chen’s method, since it has shown the minimum deviation from the average.The average values of the obtained values of the crystallization transition activation energyEc (average) from the above models were plotted as a function of MnO2 content andshown in Figure 9(a). It shows that the activation energy for the crystallization transition,Ec (average), decreases rapidly in the glass samples containing 05 x� 0.4mol% MnO2,and then shows the comparative change in x4 0.4mol% MnO2. From energy point ofview, the state of a crystallization system, which has the lowest energy, is the best of thecrystallization process and growth rate. Larger levels of activation energy for thecrystallization transition correspond to a low level of nucleation and growth rate system,which is consistent with the results of the rate constant K0. Then, this confirms that theinvestigated glass samples have a weakening crystallization process and a growth rate inlow manganese oxide content up to 0.4mol% MnO2, and beyond 0.4mol% MnO2
the crystallization process has been improved by increasing the manganese content. Also,the activation energies involved in crystallization process, Ec, were compared with theactivation energies of glass transition process from the dependence of Tg on the heatingrate, Eg, shown in Figure 9(b) [3]. It is found that they are closely inverse related i.e.,the maximum value of Ec at 0.05mol% MnO2 is related to a minimum value of Eg
and the maximum value of Eg at 1mol% MnO2 records a minimum value of Ec.Accordingly, the minimum value of Ec gives an indication of the retardation of thecrystallization with high thermal relaxation helping rearrangement of the atoms aroundTg, while the lower Eg is attributed to the stability and glass-forming ability (GFA) [35].
5. Conclusions
The effect of different amounts of manganese on the crystallization kinetics of heat-treated40SiO25Al2O355Na2O glasses has been studied using non-isothermal DTA at four heatingrates. The crystallization kinetic parameters Ec, K0, and n have been calculated usingdifferent methods, from which it can be deduced that all the used methods are valid to
1110 A.A. Soliman et al.
Downloaded By: [Aisha] At: 18:54 21 November 2010

determine the values of activation energy for the studied glasses with different levels ofaccuracy. The most accurate method deduced according to this study is suggested to be
Ozawa–Chen’s method, since it has shown the minimum deviation from the average.The values of the Avrami parameter, n, were calculated using two methods and both
indicated a mixed mechanism of 2- and 3-D growth. The rate of growth, K0, and Ec depend
on the influence of manganese ions in the glass network as a modifier or as a former and
the manganese content.
References
[1] D.K. Durga and N. Veeraiah, Role of manganese ions on the stability of ZnF2-P2O5-TeO2 glass
system by the study of dielectric dispersion and some other physical properties, J. Phys. Chem.
Solids 64 (2003), pp. 133–146.
[2] N. Krishna Mohan, M. Rami Reddy, C.K. Jayasankar, and N. Veeraiah, Spectroscopic and
dielectric studies on MnO doped PbO–Nb2O5–P2O5 glass system, J. Alloys Compd. 458 (2008),
pp. 66–76.[3] A.A. Soliman, E.M. Sakr, A. Ratep, and I. Kashif, Role of manganese on glass forming ability,
hardness, fragility, glass activation energy and stability of sodium-alumino-silicate glasses, Phys.
Chem. Glasses (2010), in press.[4] M.C. Weinberg, Glass-formation and crystallization kinetics, Thermochim. Acta 280/281 (1996),
pp. 63–71.
100
110
120
130
140
150
160
170
180
190(a)
(b)
0 0.2 0.4 0.6 0.8 1
MnO2 (mol%)
Ec
(ave
rage
) (K
Jm
ol–1
)
250
280
310
340
370
400
0 0.2 0.4 0.6 0.8 1 1.2
MnO2 (mol%)
E (
aver
age)
(K
Jm
ol–1
)
Figure 9. (a) The average values of the activation energy for the crystallization and (b) the activationenergies of glass transition process from reference [3].
Phase Transitions 1111
Downloaded By: [Aisha] At: 18:54 21 November 2010
[5] W.L. Johnson, Bulk glass-forming metallic alloys: Science and Technology, Mater. Res. Bull.
24 (1999), pp. 42–56.
[6] R. Busch, A. Masuhr, and W.L. Johnson, Thermodynamics and kinetics of Zr–Ti–Cu–Ni–Be
bulk metallic glass forming liquids, Mater. Sci. Eng. A 304–306 (2001), pp. 97–102.
[7] N. Rysava, T. Spasov, and L. Tichy, Isothermal DSC method for evaluation of the kinetics of
crystallization in the Ge-Sb-S glassy system, J. Therm. Anal. 32 (1987), p. 1015.
[8] A. Giridhar and S. Mahadevan, Studies on the As–Sb–Se glass system, J. Non-Cryst. Solids
51 (1982), pp. 305–315.
[9] N. Afify, Kinetics study of non-isothermal crystallization in Se0.7Te0.3 chalcogenide glass,
J. Non-Cryst. Solids 136 (1991), pp. 67–75.
[10] M.J. Starink and A.M. Zahra, Determination of the transformation exponents from experiments
at constant heating rate, ThermoChim. Acta 298 (1997), pp. 179–189.
[11] S. Srivastava, M. Zulfequar, S.K. Agrahari, and A. Kumar, Kinetics of crystallization in glassy
Se70Te30�xZnx using DSC technique, Physica B 403 (2008), pp. 3429–3433.
[12] J.L. Cardenas-Leal, J. Vazquez, P.L. Lopez-Alemany, P. Villares, and R. Jimenez-Garay,
A study on the dimensionality of the crystal growth and the exponents of the power laws of the
time-dependence for the nucleation frequency and for the crystal growth, J. Alloys Compd. 471
(2009), pp. 44–51.[13] J. Vazquez, R. Gonzalez-Palma, J.L. Cardenas-Leal, D. Garcia-G. Barreda, P.L. Lopez-
Alemany, and P. Villares, On the glass–crystal transformation kinetics in materials which fulfil the
conditions of ‘‘site saturation’’. Application to the crystallization of some alloys of Sb–As–Se and
Ge–Sb–Se glassy systems, J. Mater. Sci. 45 (2010), pp. 2974–2982.[14] K. Ogusu, T. Kumagai, Y. Fujimori, and M. Kitao, Thermal analysis and Raman scattering
study on crystallization and structure of Agx (As0.4Se0.6)100�x glasses, J. Non-Cryst. Solids 324
(2003), pp. 118–126.[15] N. Mehta and A. Kumar, Thermal characterization of glassy Se70Te20M10 using DSC technique,
J. Mater. Sci. 39 (2004), pp. 6433–6437.[16] H.E. Kissinger, Reaction kinetics in differential thermal analysis, J. Anal. Chem. 29 (1957),
pp. 1702–1706.[17] K. Matusita and S. Sakka, Kinetic study on crystallization of glass in glass by differential thermal
analysis, Phys. Chem. Glasses 20 (1979), pp. 81–84.[18] K. Matusita and S. Sakka, Kinetic study on non-isothermal crystallization of glass by thermal
analysis, Bull. Inst. Chem. Res. Kyoto Univ. 59 (1981), pp. 159–171.[19] J.A. Augis and J.E. Bennett, Calculation of the Avrami parameters for heterogeneous solid state
reactions using a modification of the Kissinger method, J. Therm. Anal. Calorim 13 (1978),
pp. 283–292.[20] T. Ozawa, A new spectrophotometric method for the determination of small amounts of chloride
using the mercuric thiocyanate method, Bull. Chem. Soc. Jpn. 35 (1956), p. 1881.[21] H.S. Chen, A method for evaluating viscosities of metallic glasses from the rates of thermal
transformations, J. Non-Cryst. Solids 27 (1978), pp. 257–263.[22] W.A. Johnson and F. Mehl, Reaction kinetics in process of nucleation and growth, Trans. Am.
Inst. Min. Metall. Pet. Eng. 135 (1939), pp. 416–458.[23] M. Avrami, Kinetics of phase change II. Transformation-time relations for random distribution of
nuclei, J. Chem. Phys. 8 (1940), pp. 212–224.[24] I. Kashif, A.A. Soliman, and Z.M. El-Bahy, Effect of heat-treatment on cobalt–molybdenum
system, J. Alloys Compd. 452 (2008), pp. 384–388.[25] N.P. Bansal, R.H. Doremus, A.J. Bruce, and C.T. Moynihan, Kinetics of crystallization of
ZrF4–Ba2–LaF3 glass by differential scanning calorimetry, J. Am. Ceram. Soc. 66 (1983),
pp. 233–238.
[26] W.A. Johnson and K.F. Mehl, Reaction kinetics in processes of nucleation and growth, Trans.
Am. Inst. Min. Metall. Pet. Eng. 135 (1941), pp. 416–442.
1112 A.A. Soliman et al.
Downloaded By: [Aisha] At: 18:54 21 November 2010

[27] D. Garcia-G. Barreda, J. Vazquez, P.L. Lo0pez-Alemany, P. Villares, and R. Jimenez-Garay,A comparative study on the glass-forming ability of some alloys in the Sb–As–Se system bydifferential scanning calorimetry, J. Phys. Chem. Solids 66 (2005), pp. 1783–1787.
[28] Y.Q. Gao and W. Wang, On the activation energy of crystallization in metallic glasses,
J. Non-Cryst. Solids 81 (1986), pp. 129–134.[29] G.N. Greaves and S. Sen, Inorganic glasses, glass-forming liquids and amorphizing solids,
Adv. Phys. 56(1) (2007), pp. 1–166.
[30] T. Ozawa, Kinetics of non-isothermal crystallization, Polymer 12 (1971), pp. 150–158.[31] S. Srivastava, M. Zulfequar, S.K. Agrahari, and A. Kumar, Kinetics of crystallization in glassy
Se70Te30�xZnx using DSC technique, Physica B 403 (2008), pp. 3429–3433.
[32] I. Kashif, A.A. Soliman, H. Farouk, and A.M. Sanad, Effect of titanium addition oncrystallization kinetics of lithium borosilicate glass, J. Alloys Compd. 475 (2009), pp. 712–717.
[33] N. Mehta, R.K. Shukla, and A. Kumar, Glass transition kinetics of some Se, Chalco. Lett. 1(10)
(2004), p. 131.[34] K.A. Aly, A.A. Othman, and A.M. Abousehly, Effect of Te additions on the glass transition and
crystallization kinetics of (Sb15As30Se55)100�xTex amorphous solids, J. Alloys Compd. 467(2009), pp. 417–423.
[35] A.A. Soliman and I. Kashif, Copper oxide content dependence of crystallization behaviour, glassforming ability, glass stability and fragility of lithium borate glasses, Physica B 405 (2010),pp. 247–253.
Phase Transitions 1113
Downloaded By: [Aisha] At: 18:54 21 November 2010


![A Bibliography of the Hodayot, 1948-1996 [second author, with E.M. Schuller]](https://static.fdokumen.com/doc/165x107/631b019c68e6f36d03044f4f/a-bibliography-of-the-hodayot-1948-1996-second-author-with-em-schuller.jpg)