Mass spectrometric detection of attomole amounts of the prion protein by nanoLC/MS/MS

Annals of Botany 86: 859±909, 2000doi:10.1006/anbo.2000.1253, available online at http://www.idealibrary.com on
Nuclear DNA Amounts in Angiosperms and their Modern UsesÐ807 New Estimates
MICHAEL D. BENNETT*, PARMJIT BHANDOL and ILIA J. LEITCH
Jodrell Laboratory, Royal Botanic Gardens, Kew, Richmond, Surrey TW9 3DS, UK
Received: 6 June 2000 Returned for revision: 22 June 2000 Accepted: 28 June 2000
nucleus of a
0305-7364/0
CONTENTS
INTRODUCTION 859The Angiosperm Genome Size Workshop, September 1997 860
IDENTIFYING GAPS IN OUR KNOWLEDGE OF PLANT C-VALUES 861FILLING MAJOR GAPS IN OUR KNOWLEDGE OF PLANT C-VALUES 862
Recent progress towards meeting the targets for angiosperms 862Recent progress towards meeting the targets for non-angiosperms 863
TECHNICAL TRENDS AND LIMITING FACTORS IN C-VALUE WORK 863Recent trends in methods of choice for plant C-value estimation 863The `obsolescence time bomb' threatening plant C-value research 864Connecting C-values given only in arbitrary units with the database 865
MODERN USES OF PLANT C-VALUE AND GENOME SIZE DATA 865DNA C-values in modern molecular practice 865DNA C-values and mechanisms in genome size evolution 865C-value constancy and variationÐa new C-value paradox? 867Using C-values to probe phylogenetic dimensions 867DNA amounts as predictors and indicators 868C-values as ecological and environmental indicators 868Using inferred C-values to reveal paleobiological trends 868DNA amounts and their conservation interest 869
LITERATURE CITED 869APPENDIX 872
Notes to the Appendix 872Original references for DNA values 907
* For correrbgkew.org.uk
The DNA amount in the unreplicated haploid nucleus of an organism is known as its C-value. C-values di�er about1000-fold among angiosperms and are characteristic of taxa. The data are used in many biological ®elds, so theyshould be easily available. Values for 2802 angiosperm species (1%) were estimated during 1950±1997, and ®vecollected lists of C-values were published for reference purposes during 1976±1997. Numbers of new angiospermC-values published recently remained high, necessitating a further supplementary list. This paper lists DNAC-valuesfor 807 angiosperm species from 70 original sources, including 520 (75.2%) from sources published after 1996, and691 for species not included in any of the previous ®ve lists. There is a continuing need to estimate accurate DNAC-values for plant taxa, as shown in a workshop on this biodiversity topic sponsored by Annals of Botany and held atKew in 1997. Its key aim was to identify major gaps in our knowledge of plant DNA amounts and to recommendtargets and priorities for new work to ®ll them. A target of estimating ®rst C-values for the next 1% of angiospermspecies in 5 years was set. The proportion of such C-values in the present work (85.6%) is very high; and the numberbeing published (approx. 220 per annum) has never been exceeded. In 1997, C-values were still unknown for most(68%) families, so a target of complete coverage was set. This paper includes ®rst C-values for 12 families, but as lessthan 2% of such values listed here targeted new families, the need to improve familial representation remains.
# 2000 Annals of Botany Company
Key words: Angiosperm DNA amounts, DNA C-values, nuclear genome sizes, plant DNA database.
INTRODUCTION
The DNA amount in the unreplicated haploid or gametic
n organism is referred to as its C-value (Swift,0/100859+51 $35.00/00
spondence. Fax �44(0)20 8332 5310, e-mail m.bennett@
1950), irrespective of the ploidy level of the taxon. C-valueequals genome size in diploid species, but always exceedsgenome size(s) in polyploid species. Nuclear DNAC-valuesdi�er by approx. 1000-fold among angiosperms, rangingfrom about 0.1 pg to about 125 pg, and tend to be
characteristic for a taxon. C-values are used in many# 2000 Annals of Botany Company
250
200
150
100
50
0
Mea
n n
um
ber
of e
stim
ates
954
959
964
969
974
979
984
989
994
999
A Amounts in Angiosperms
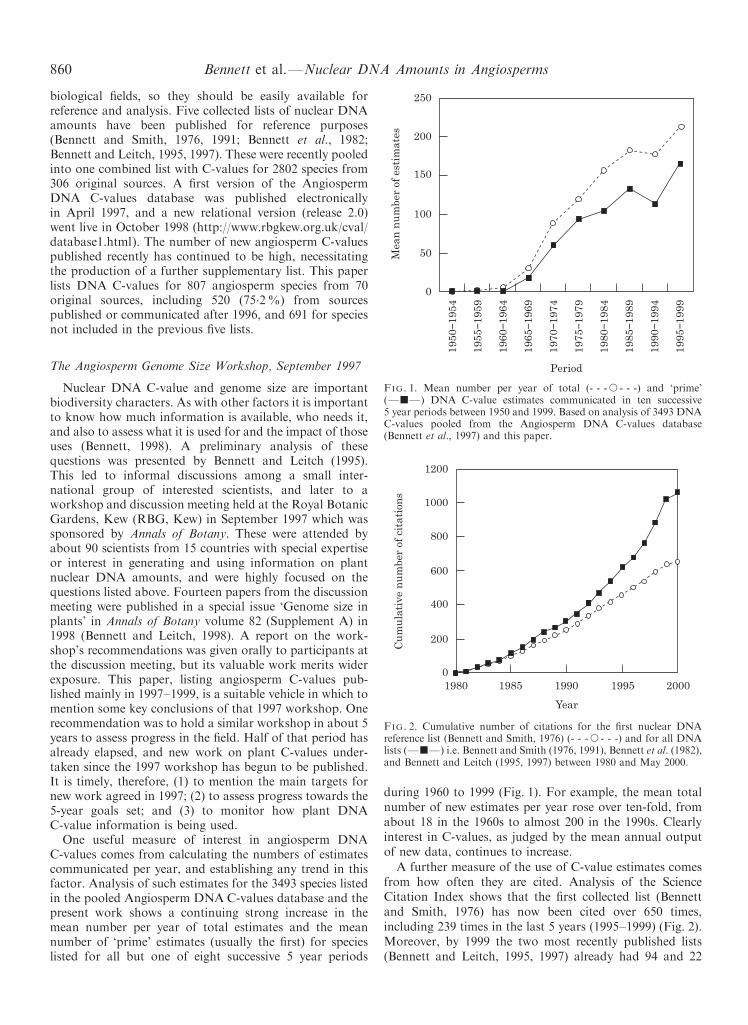
biological ®elds, so they should be easily available forreference and analysis. Five collected lists of nuclear DNAamounts have been published for reference purposes(Bennett and Smith, 1976, 1991; Bennett et al., 1982;Bennett and Leitch, 1995, 1997). These were recently pooledinto one combined list with C-values for 2802 species from306 original sources. A ®rst version of the AngiospermDNA C-values database was published electronicallyin April 1997, and a new relational version (release 2.0)went live in October 1998 (http://www.rbgkew.org.uk/cval/database1.html). The number of new angiosperm C-valuespublished recently has continued to be high, necessitatingthe production of a further supplementary list. This paperlists DNA C-values for 807 angiosperm species from 70original sources, including 520 (75.2%) from sourcespublished or communicated after 1996, and 691 for species
860 Bennett et al.ÐNuclear DN
not included in the previous ®ve lists.
1950
−1
1955
−1
1960
−1
1965
−1
1970
−1
1975
−1
1980
−1
1985
−1
1990
−1
1995
−1
Period
FIG. 1. Mean number per year of total (- - -s - - -) and `prime'(ÐjÐ) DNA C-value estimates communicated in ten successive5 year periods between 1950 and 1999. Based on analysis of 3493 DNAC-values pooled from the Angiosperm DNA C-values database(Bennett et al., 1997) and this paper.
1200
1000
800
600
400
200
01980 1985 1990 1995 2000
Year
Cu
mu
lati
ve n
um
ber
of c
itat
ion
s
FIG. 2. Cumulative number of citations for the ®rst nuclear DNAreference list (Bennett and Smith, 1976) (- - -s - - -) and for all DNAlists (ÐjÐ) i.e. Bennett and Smith (1976, 1991), Bennett et al. (1982),
The Angiosperm Genome Size Workshop, September 1997
Nuclear DNA C-value and genome size are importantbiodiversity characters. As with other factors it is importantto know how much information is available, who needs it,and also to assess what it is used for and the impact of thoseuses (Bennett, 1998). A preliminary analysis of thesequestions was presented by Bennett and Leitch (1995).This led to informal discussions among a small inter-national group of interested scientists, and later to aworkshop and discussion meeting held at the Royal BotanicGardens, Kew (RBG, Kew) in September 1997 which wassponsored by Annals of Botany. These were attended byabout 90 scientists from 15 countries with special expertiseor interest in generating and using information on plantnuclear DNA amounts, and were highly focused on thequestions listed above. Fourteen papers from the discussionmeeting were published in a special issue `Genome size inplants' in Annals of Botany volume 82 (Supplement A) in1998 (Bennett and Leitch, 1998). A report on the work-shop's recommendations was given orally to participants atthe discussion meeting, but its valuable work merits widerexposure. This paper, listing angiosperm C-values pub-lished mainly in 1997±1999, is a suitable vehicle in which tomention some key conclusions of that 1997 workshop. Onerecommendation was to hold a similar workshop in about 5years to assess progress in the ®eld. Half of that period hasalready elapsed, and new work on plant C-values under-taken since the 1997 workshop has begun to be published.It is timely, therefore, (1) to mention the main targets fornew work agreed in 1997; (2) to assess progress towards the5-year goals set; and (3) to monitor how plant DNAC-value information is being used.
One useful measure of interest in angiosperm DNAC-values comes from calculating the numbers of estimatescommunicated per year, and establishing any trend in thisfactor. Analysis of such estimates for the 3493 species listedin the pooled Angiosperm DNA C-values database and thepresent work shows a continuing strong increase in themean number per year of total estimates and the meannumber of `prime' estimates (usually the ®rst) for species
listed for all but one of eight successive 5 year periodsduring 1960 to 1999 (Fig. 1). For example, the mean totalnumber of new estimates per year rose over ten-fold, fromabout 18 in the 1960s to almost 200 in the 1990s. Clearlyinterest in C-values, as judged by the mean annual outputof new data, continues to increase.
A further measure of the use of C-value estimates comesfrom how often they are cited. Analysis of the ScienceCitation Index shows that the ®rst collected list (Bennettand Smith, 1976) has now been cited over 650 times,including 239 times in the last 5 years (1995±1999) (Fig. 2).Moreover, by 1999 the two most recently published lists
and Bennett and Leitch (1995, 1997) between 1980 and May 2000.
(Bennett and Leitch, 1995, 1997) already had 94 and 22

TABLE 1. The level of representation at di�erent taxonomiclevels for the 2802 species listed in the Angiosperm DNA
C-values database in September 1997
Taxonomiclevel
Numberrecognized
Number withDNA C-values
availableRepresentation
(%)
Families approx. 475* 151 approx. 31.8Genera approx. 13 479* 772 approx. 5.7Species approx. 250 000{ 2802 approx. 1.1
*Brummitt (1992); {Mabberley (1997).
TABLE 2. The level of representation of C-value data fornon-angiosperm plants in September 1997
Group
Number ofspecies
recognized
Number ofspecies with
DNA C-valuesavailable
Representation(%)
Gymnosperms approx. 730* 117 approx. 16.03Pteridophytes approx. 9250{ 39 approx. 0.42Bryophytes approx. 18 400{ 18 approx. 0.10
A Amounts in Angiosperms 861
citations listed, respectively. Altogether the various listshave been cited over 1060 times.
The Angiosperm DNA C-values database availableon the internet (http://www.rbgkew.org.uk/cval/database1.html) has automatic logging of the e-mail address,taxonomic query, and number of species' C-values supplied(including zero), for all enquiries. The log shows that therewere 6955 successful scienti®c enquiries in the ®rst 18months, and over 10 000 in the 16 months after release 2.0went live in October 1998. So there is also a large andgrowing use of C-value data by this means.
Examining the database log and the Science CitationsIndex of DNA C-value reference lists reveals a wide rangeof countries and disciplines using these data. C-valueenquiries logged in 1999 came from at least 43 countries on®ve continents. Moreover, since 1995 the DNA C-valuereference lists were cited, or provided data used forcomparative studies at levels ranging from the biosphereto genome organization and the size of introns, and inmany diverse disciplines including: taxonomy and systema-tics (Kiehn, 1995; Ebert et al., 1996; Cox et al., 1998; Ohriet al., 1998); genome evolution and phylogeny (Bennetzenand Kellogg, 1997; Bennetzen et al., 1998; Kellogg, 1998;Leitch et al., 1998; Voytas and Naylor, 1998; Vinogradov,1999); ecology and the environment (MacGillivray andGrime, 1995; Bennett et al., 1998); genomics (Dunford et al.,1995; Moore, 1995; Foote et al., 1997; Geisler et al., 1999;Somerville and Somerville, 1999); plant breeding (RieraLizarazu et al., 1996); cell and molecular biology (Dean andSchmidt, 1995; Jeddeloh and Richards, 1996; Vershinin andHeslop-Harrison, 1998); conservation (Rejmanek, 1996;Bennett and Leitch, 2000); and physiology and develop-ment (Butterfass, 1995; Xia Xh, 1995; Bharathan, 1996;Convey, 1996; Raven, 1999). Some of these uses aredescribed in more detail below. Several authors haverecently noted a need for additional C-value data formore plant species in order to extend their comparativestudies. For example, speci®c needs were for more grasstaxa (Jasienski and Bazzaz, 1995), and for more higher
Bennett et al.ÐNuclear DN
order taxa among angiosperms (Leitch et al., 1998).
IDENTIFYING GAPS IN OUR KNOWLEDGEOF PLANT C-VALUES
Given the broad and growing demand for plant DNAC-values it is clearly important to monitor what is known,and to recognize what is unknown and needed most(Bennett, 1998). Consequently, a ®rst key aim of the 1997workshop was to identify major gaps in our knowledge ofplant DNA C-values and to recommend targets andpriorities for new work to ®ll them by international collab-oration. Presentations on regional ¯oras, and analysis ofrepresentation of data in the Angiosperm DNA C-valuesdatabase, highlighted huge gaps in our knowledge, both interms of the low numbers of species represented, but also interms of systematic, life form, ecological and geographicrepresentation. For example, a ®rst DNA C-value estimatewas still unavailable for the large majority (approx. 68%)
of angiosperm families (Table 1).At the workshop Murray reviewed our knowledge ofC-values in non-angiosperm plants where, in some groups,there were not `intermittent gaps' but almost `one contin-uous gap' (Table 2). Representation was much better forgymnosperms than angiosperms, as values were publishedfor approx. 16% of gymnosperm species (Murray, 1998)compared with approx. 1% for angiosperms. The situationwas worse for pteridophytes (approx. 0.42%), and almostno C-value data were known for bryophytes (approx.0.1%), although locating data for these two groups hadproved very di�cult [e.g. 23 of the 39 C-values known forpteridophytes were published only in a Ph.D thesis(Bouchard, 1976)].
The workshop concluded that this level of ignorance wasunsafe and unacceptable. New targeted work was essentialto improve representation of both the angiosperm ¯ora andof the other least-known plant groups. The di�cultiesencountered in locating DNA amount data for review at theworkshop clearly demonstrated the value of user-friendlyreference works. Thus, there was a clear need to bringtogether DNA amount data for species in other groupsbesides angiosperms, and make them easily accessible inone plant C-values database.
Long-term and 5-year targets were set. The ideal of aC-value for every taxon is unrealistic. However, estimatesfor 10±20% of plants seemed both ultimately achievableand adequate for all conceivable uses, provided these werecarefully targeted to represent the various taxonomicgroups, geographical regions, and life forms in the global¯ora. C-values for about 2800 (approx. 1%) angiospermspecies had been estimated in the last 40 years. However, a5-year target of estimating ®rst C-values for the next 1% of
*Murray (1998); {Mabberley (1997); {Scho®eld (1995).
angiosperm species (i.e. an additional 2500 species) by 2002

A
seemed possible and was therefore recommended. Meetingthis target would require on average at least 500 ®rst
862 Bennett et al.ÐNuclear DN
C-value estimates per year.
families. The 1997 workshop con®rmed this, and set a
100
90
80
70
60
50
40
30
20
10
01965 1970 1975 1980 1985 1990 1995 2000
Year
Per
cen
tage
of
C-v
alu
e es
tim
ates
pu
blis
hed
that
are
`n
ew�
FIG. 3. Percentage of DNA C-value estimates published or commu-nicated during 1965±2000 that are ®rst values for species listed in theAngiosperm DNA C-values database (Bennett et al., 1997) or the
FILLING MAJOR GAPS IN OURKNOWLEDGE OF PLANT C-VALUES
Recent progress towards meeting the targets for angiosperms
Only 33 months elapsed between closing the angiospermC-value list for Bennett and Leitch (1997) in January 1997,and for the present work in October 1999. This paper lists®rst DNAC-values for 691 angiosperm species known to us(520 published in papers dated 1997±1999), so an averageof at least 165 ®rst estimates for such species was publishedper annum in this period. On past record this is anunderestimate, as about 25% of the values estimated insuch a period are missed or uncommunicated, but areincluded in a later supplement (N.B. 520/691 � 75.3%). Ifso, at least 220 ®rst estimates were published in each recentyear. How does this compare with the long-term historicalrate, recent trends, and with the target set at the 1997workshop?
The total number of angiosperm species whose C-valuesare listed in the pooled Angiosperm DNA C-valuesdatabase and the present work is 3493, published since1960 at an average rate of about 85 per year. Numbers¯uctuate considerably between years (Bennett and Leitch,1995). However, analysis shows a continuing strongincrease in the mean number of `prime' estimates (usuallythe ®rst) for species (Fig. 1) listed in the four successivedecades from 1960±1999. The mean total number of `new/prime' estimates per year rose steadily from 8.6 in the 1960sto almost 140 in the 1990s, reaching 165.4 in 1995±99, and203 in 1998±99. Thus, the output of such values is rising inthe long term, and increasingly so in recent years.
Clearly, good progress has been made towards achievingthe target set at the 1997 workshop. First C-value estimatesfor angiosperm species are being published at the highestrate known (approx. 220 per annum), but even at thisrecord rate the total number of such values estimated by2002 (approx. 1100) would be 550% of the minimum(2500) target set. To reach this target, output of ®rstC-value estimates for angiosperms must triple to about 600per annum in 2000±2002. Normally at least 2 years elapsebetween planning C-value research and publishing newdata. Work in¯uenced by the September 1997 workshopwould not appear before late 1999, so its impact on annualoutput should be very minimal so far. Whether the targetset in 1997 has been in¯uential in raising the annual outputof ®rst C-values for angiosperm species signi®cantly abovethe historical trend may be unclear before 2002.
It is also important to monitor other qualitative aspectsof new C-value estimates. Bennett and Leitch (1995) noteda need for new work to focus on obtaining ®rst C-values forspecies rather than unnecessarily multiplying DNA esti-mates for taxa whose C-values are already well known.Analysis shows (Fig. 3) that while the proportion ofC-values for `new' taxa tended to fall ( from approx. 80%
to approx. 60%) in the 1970s and 1980s, it has tended torise again ( from approx. 60 to approx. 80%) in the 1990s,since this problem was ®rst noted. Indeed the proportion ofsuch C-values in the present Appendix (691/807 � 85.6%)is encouragingly high.
Bennett and Leitch (1995) noted that none of the 269original references to DNAC-values listed was from China,and this remained so for 306 original references listedbefore the 1997 workshop. However, the present workincludes values for taxa of Vicia from North East China (Liand Liu, 1996) and for grain amaranths (Sun et al., 1999),both by ®rst authors in China. It also lists the ®rst estimatescontributed with ®rst authors of original sources fromseveral other countries including: Bulgaria (Dimitrova et al.,1999), Croatia (ZoldosÏ et al., 1998), Finland (Antonius andAhokas, 1996; Bukhari, 1997; Keskitalo et al., 1998) andTurkey (Akpinar and Yildes, 1999), besides Ethiopia (Ayeleet al., 1996) and Colombia (MartõÂ nez et al., 1994). Suchwork is now less concentrated in a few ®rst world countrieslike the UK (down from 29.7% of 306 original sourcespreviously, to 11.4% for the present Appendix), but Africaremains an unexplored continent. Whereas six out of 377original sources have ®rst authors with addresses in Africa,still none has an angiosperm C-value estimated in Africa, asall six report work done in Europe or the USA. Moreencouragingly, C-values for 42 Lonchocarpus (Legumino-sae) taxa represent the ®rst large sample (31% of species)from a tropical arboreal genus (Palomino and Sousa, 2000).Moreover, nuclear DNA amounts for 41 primitive dicotspecies (Morawetz and Samuel, pers. comm.) more thandoubled our knowledge of C-values in this importantphylogenetic group as values for only 31 species wereknown previously.
Bennett and Leitch (1997) also noted a need to targetnew work to achieve better systematic representation, as noestimate was available for about 68% of angiosperm
Amounts in Angiosperms
present work.

A
target of complete familial coverage by 2002. The presentAppendix lists ®rst C-values for 12 families unrepresentedon previous lists (namely: Anemarrhenaceae, Calycantha-ceae, Canellaceae, Chloranthaceae, Eupomatiaceae, Her-nandiaceae, Juglandaceae, Monimiaceae, Myristicaceae,Paeoniaceae, Phytolaccaceae and Schisandraceae). This isuseful progress, but it shows that less than 2% of the 691®rst C-value estimates for angiosperms listed in the presentAppendix were targeted on new families. The need toimprove representation at the family level remains, so worktargeted to ®ll this gap for 50 unrepresented families by
Bennett et al.ÐNuclear DN
2001 is ongoing at RBG, Kew.
3500 angiosperms.
Recent progress towards meeting the target fornon-angiosperms
The 1997 workshop concluded that new work on otherplant groups besides angiosperms was essential, and therewas a clear need to bring together published C-value datafor these groups and to make them easily accessible. Soonafterwards a list of DNA C-values for 117 gymnospermspecies was published (Murray, 1998), making themavailable in a user-friendly form as a reference source forthe ®rst time. These data, with their associated informationwere presented in a table similar to that used forangiosperm C-values in recent papers (Bennett and Leitch,1995, 1997). This standard format was adopted to helpusers move easily from one to the other, and to facilitatecombining them into a uni®ed plant DNA C-valuesdatabase in 2000.
Murray (1998) listed C-values for 12 out of 17gymnosperm families, noting that systematic coverage wasvery uneven, and that `the order Gnetales would appear tobe a group where more measurements of genome size areneeded if any meaningful phylogenetic relationship ingenome size is to be revealed'. Few C-values have beenestimated for gymnosperms since 1997. Hall et al. (2000)give values for 11 Pinus taxa from Central America, whichinclude eight species not previously listed by Murray (1998).Estimates for six previously unlisted Ephedra species(Gnetales) were also made (Win®eld and Leitch, unpubl.res.). Thus, scope remains to improve the systematiccoverage of gymnosperms, with ®rst C-values for the ®veas yet unrepresented families being addressed at RBG, Kewas a prime target.
Published estimates of C-values for pteridophytesremained rare in the 1990s. Tan and Thompson (1990)gave C-values for several subgroups in the genus Pteridium(including P. aquilinum and P. esculentum). RecentlyC-values for eight species in the Aspleniaceae (Redondoet al., 1999a) and three Polypodium species (Redondo et al.,1999b) were published. The need for targeted work onC-values in pteridophytes seems undiminished.
The most signi®cant recent advance in systematic cover-age is for mosses (Bryatae) where estimates for only aboutten species were known before 1997 (Reski et al., 1994;Renzaglia et al., 1995). Since 1997, estimates for a further34 species were published (Lamparter et al., 1998; Temschet al., 1998, 1999; Zouhair and Lecocq, 1998). Voglmayr
(2000) estimated C-values for 289 accessions of 138di�erent moss taxa in 34 families in a carefully targetedstudy whose main aim was to cover a representativespectrum of moss taxa. This benchmark study showedthat 1C-values in these bryophytes varied only about 12-fold ( from 0.174 to 2.16 pg), which is remarkable comparedwith about 1000-fold variation in angiosperms. Moreover,the relative constancy of C-values in many genera andfamilies suggests that the incidence of secondary polyploidyamong mosses is much lower than has been claimed(Ramsay, 1983; Voglmayr, 2000). These results agree withthose obtained by Renzaglia et al. (1995) for 17 bryophytespecies (hornworts, liverworts and mosses) showing only24-fold variation. Renzaglia et al. (1995) suggested thatselection for a narrow range of low C-values may act on thereduced e�ciency of bi¯agellate motile sperm cells withincreasing ploidy level and/or DNA C-values.
Together, the new work already completed or known tobe in hand suggests that the recommendations of the 1997workshop will have been in¯uential in achieving somesigni®cant improvement in our knowledge of, and access to,DNA C-values in non-angiosperm groups. Thus, by 2001we plan to release a ®rst electronic plant DNA C-valuesdatabase combining data for at least 325 species ofpteridophytes, bryophytes and gymnosperms, and about
Amounts in Angiosperms 863
TECHNICAL TRENDS AND LIMITINGFACTORS IN C-VALUE WORK
Recent trends in methods of choice for plant C-valueestimation
Limited space precludes an analysis of all the technicalrecommendations of the 1997 workshop, so discussion hereis limited to a few key points. Further details are given onthe web [http://www.rbgkew.org.uk/cval/conference.html(under Angiosperm Genome Size Discussion Meeting)].
Several authors have discussed the choice of material(s)for use as calibration standard(s) to estimate C-values inplants, and/or the reliability of their assumed C-values(Bennett and Smith, 1976; Price et al., 1980; Greilhuber andEbert, 1994; Bennett and Leitch, 1995; Johnston et al.,1999). Bennett and Leitch (1995) stated: (1) that ideallyonly one strain of a standard species from a single sourceshould be used to improve comparability between labora-tories; (2) for technical reasons several species are neededwhose DNA C-values are distributed at suitable intervalsover the large range of C-values known for plants; and (3)such calibration standards should all be calibrated againstone base calibration standard. This `ideal' is approached bythe use of Allium cepa `Ailsa Craig' and of de®ned cultivarsof several other species all calibrated against it (Bennett andSmith, 1976). As noted by Bennett et al. (2000), Allium cepahas been informally adopted by common usage as the maincalibration standard for C-value estimations in angio-sperms. At least 143 (� 46.7%) of 306 original sourcesof data listed in Bennett et al. (1997) used A. cepa with anassumed 4C DNA amount of 67.1 (or 67.0) pg, as a
calibration standard.
at the workshop.
they used for Feulgen microdensitometry was considered
TABLE 3. Analysis of the type of ¯uorochrome used toestimate C-values by ¯ow cytometry in plant taxa listed in
Bennett and Leitch (1995, 1997) and this paper
Fluorochrome
Number of C-values
Bennett andLeitch (1995)
Bennett andLeitch (1997) This paper
Base-speci®cDAPI 27 (9%) 34 (23%) 3 (1%)Mithromycin 35 (12%) 0 (0%) 4 (1%)Subtotal 62 (21%) 34 (23%) 7 (2%)
IntercalatingEthidium bromide 37 (13%) 13 (9%) 50 (11%)Propidium iodide 195 (66%) 104 (69%) 390 (87%)Subtotal 232 (79%) 117 (77%) 440 (98%)
Total 294 (100%) 151 (100%) 447 (100%)
A
Calibration standards are of fundamental importance foraccurate plant C-value estimations. Indeed, many discre-pancies in C-values reported for the same species probablyre¯ect problems associated with the choice and use ofcalibration standards rather than genuine intraspeci®cvariation. C-values for chicken red blood cells (CRBC)vary between authorities and breeds. Moreover, CRBCshow di�erent hydrolysis curves from plants (Johnstonet al., 1999). In view of these problems the 1997 workshoprecommended that animal standards, such as CRBC,should not be used as calibration standards for estimatingplant C-values.
The characteristics of ideal plant calibration standardswere discussed. It was agreed that they should be diploid (tominimize variation owing to aneuploidy), single cultivars ofa species, easily available from more than one source,stable, and suitable for both ¯ow cytometry and Feulgenmicrodensitometry. Three basic standards conforming tothese criteria were recommended at the workshop (Alliumcepa `Ailsa Craig', Hordeum vulgare `Sultan', and Pisumsativum `Minerva Maple'). Collaborative work to identifyand agree other suitable calibration standards is needed.Candidates included: Raphanus sativus, Lycopersicon escu-lentum and Vicia faba.
Analysis shows that 77.2% of DNA estimates in theAppendix of the present work were made using a plantcalibration standard, but 22.8% used an animal calibrationstandard. Thus, the recommendation made by Price et al.(1980) and con®rmed at the 1997 workshop is only partlyfollowed as yet. However, while 97.1% of estimates basedon an animal calibration standard used one species(chicken), estimates based on plant standards used manytaxa for calibration [see (b) and (e) in `Notes to theAppendix'], and no one species predominated. Analysis ofthe data in the Appendix shows that 237 such estimates(25.7%) used Hordeum vulgare, 235 (25.6%) used Alliumcepa, but only 55 (6.0%) used Pisum sativum. Thus,457%of such estimates used the three plant species recommendedin 1997 as calibration standards.
Work to improve further the accuracy and reliability of,and con®dence in, plant calibration standards has begun(e.g. Johnston et al., 1999; Bennett et al., 2000). It has alsobeen suggested that extra calibration standards are neededwhich readily produce seed in tropical conditions (Guerra,pers. comm. 1998). Recommended standards which thrivein temperate environments (e.g. Pisum sativum, Allium cepaand Hordeum vulgare) can be di�cult to maintain intropical conditions.
A key observation regarding ¯ow cytometry was that co-chopping of tissues from a calibration standard and anunknown is essential, as using an external standard toestimate C-values can cause unacceptable errors (Price,pers. comm. 1998). The 1997 workshop also recommendedthat the non-base speci®c intercalating stain propidiumiodide be used as the ¯uorochrome of choice for DNAestimations by ¯ow cytometry, at a concentration of 50 to70 ppm. Analysis of the ¯uorochromes used to estimateC-values among the 447 taxa in the Appendix studied using¯ow cytometry (Table 3) shows that 390 and 50 (i.e. over
864 Bennett et al.ÐNuclear DN
98%) used propidium iodide or ethidium bromide,
respectively, while only four and three used mithramycinor DAPI, respectively. These proportions represent a majorshift from earlier work (Table 3). Thus, the advice to usenon-base speci®c ¯uorochromes rather than base speci®c¯uorochromes (DolezÏ el et al., 1992, 1998; Bennett andLeitch, 1995) which was recommended as best practice bythe recent workshop, is now widely followed. Moreover, theuse of propidium iodide (as the ¯uorochrome of ®rstchoice) outstrips that of ethidium bromide by almost 8 :1,which may re¯ect health and safety concerns as the latter isa known frame shift and UV-sensitive mutagen in man.
Bennett and Leitch (1995, 1997) compared strengths andweaknesses of ¯ow cytometry and Feulgen microdensito-metry as the two main modern methods of choice forestimating DNA C-values in angiosperms, and describedtrends in their use. Analysis of the data for 919 C-valueestimates in the present Appendix shows that 472 (51.4%)were obtained using Feulgen microdensitometry and 437(48.6%) using ¯ow cytometry. These proportions aresimilar to those for 469 estimates listed by Bennett andLeitch (1995) for original data published during 1990±1994,namely 51% ¯ow cytometry and 49% Feulgen micro-densitometry, but show a reduction in the proportionestimated by Feulgen microdensitometry from 65.6% for629 taxa listed by Bennett and Leitch (1997). Nevertheless,these new data continue to con®rm the conclusion (Bennettand Leitch, 1997) that despite its potential, ¯ow cytometryis unlikely to replace Feulgen microdensitometry for esti-mating DNA C-values in the short term. Indeed, Feulgenmethods will probably be preferred in many places,although an important imminent problem was identi®ed
Amounts in Angiosperms
The `obsolescence time bomb' threatening plant C-valueresearch
A major factor likely to limit progress in plant C-valueresearch is the `obsolescence time bomb' of ageing micro-densitometers. Several workers noted that the equipment
DAPI, 40,6-diamidino-2-phenylindole.

A
obsolete and close to irreparable failure. For example, ahigh proportion of new C-value estimates were estimatedusing Vickers M85 microdensitometers made in the 1980sbut now unsupported by the manufacturer. Withoutreplacements there was already a serious risk that C-valueestimation may cease in several countries (Mexico, Argen-tina etc.), so preventing regional and global targets frombeing met. Specialist replacement microdensitometers,developed mainly for medical purposes, are expensive,probably prohibitively so, especially for developingcountries. Two alternative technologies considered were¯ow cytometry, provided that a rugged, low-cost machinesuited for conditions in developing countries becomesavailable, and computerized image analysis systems. In1997 the latter seemed too expensive for most users, butrecently several papers have presented C-value estimates forangiosperms (Dimitrova et al., 1999), bryophytes (Temschet al., 1998) and fungi (Voglmayr and Greilhuber, 1998),obtained using a basic video-based image analysis method.Unlike ¯ow cytometry, where nuclei are unseen by theoperator and chromosome numbers must be checked inseparate cytological studies, this method is highly advan-tageous, allowing chromosome number and ploidy level tobe assessed directly in Feulgen-stained nuclei on the sameslide used to estimate C-values. Thus, Feulgen stainingseems likely to continue as a method of choice but will
Bennett et al.ÐNuclear DN
increasingly use computerized image analysis techniques.
sequences will remain unsequenced as gaps.
Connecting C-values given only in arbitrary units with thedatabase
About 10% of all angiosperm DNA estimates have beenpublished only in arbitrary units and do not connect with adatabase for taxa given in absolute units. Action to avoidwasting so much potential information is worthwhile. Theimportance of including a taxon of known C-value as acalibration standard in work to study DNA amounts intaxa where this is unknown to maximize the value of thework has often been noted (Bennett and Smith, 1976,1991). Analysis of the new data in the Appendix shows thatthe practice of publishing relative DNA amounts inarbitrary units alone is now generally defunct. Data fromonly two original references giving DNA amounts inarbitrary units are included in the Appendix. However,both were published in 1984. These data for 37 Carex and12 Marantaceae species were all converted to absolutevalues in our laboratory [see Appendix footnotes (ao) and(ap)]. Overall, using this approach, we have broughtabsolute C-values for 490 species (14% of the total) ontothe quantitative list since 1976, and this contributes `prime'values for 343 species (9.8% of the total) in theAngiosperm DNA C-values database and the presentwork. More opportunities to increase substantially ourknowledge of C-values in this way seem unlikely, as we areunaware of further references giving signi®cant numbers ofprime DNA estimates in arbitrary units alone. However, wewould welcome information of references or unpublisheddata of any further bodies of such data if, as seems likely,
some examples still exist.MODERN USES OF PLANT C-VALUE ANDGENOME SIZE DATA
DNA C-values in modern molecular practice
DNA C-value remains a key character in biology andbiodiversity. Genome size has many important practicalimplications at many di�erent levels. For example, specieswith large DNA amounts (i.e. 1C greater than 20 pg) canbe problematic when studying genome diversity using thestandard AFLPTM technique [designed for genomes of 500±6000 Mbp (approx. 0.5±6 pg); Perkin-Elmer, 1996] withthree selective bases on each primer, and it may benecessary to increase the number of selective bases or tochange the restriction enzymes. AFLP traces for Cypripe-dium calceolus using the standard protocol are suboptimal(Fay and Cowan, pers. comm.) as a result of its large DNAamount (1C � 32.4 pgÐsee Appendix). Similar problemshave been encountered by Han et al. (1999) in Alstroemeriaspecies (1C � approx. 22 pg), and by Costa et al. (2000) inPinus pinaster (1C � 24 pg).
Moreover, possession of a very small DNA content hasbeen a major factor in determining which taxa were chosenas the ®rst candidates for genome sequencing, and whichchromosome(s) in the karyotypes of various organismswere sequenced ®rst. Arabidopsis thaliana was the ®rst plantchosen for genome sequencing, partly because it had one ofthe smallest C-values known for an angiosperm (NSF,1990; Anderson, 1991). A grass in the genus Brachypodium(e.g. diploid B. distachyonÐ1C � 0.25±0.3 pg) was pro-posed as a ®rst monocot for genome sequencing on similargrounds (Bablak et al., 1995; Catalan et al., 1995), but rice(Oryza sativa, 1C � approx. 0.5 pg) was chosen because ithas the smallest C-value among the world's major cerealcrops (Sasaki, 1998; Somerville and Somerville, 1999). In1999 DNA sequences were published for the ®rst humanchromosome (number 22) as part of the human genomeproject (Dunham et al., 1999), chosen because it is one ofthe smallest human chromosomes. Among autosomes onlychromosome 21 is smaller (Little, 1999) and its DNAsequence was also recently published (Hattori et al., 2000).
Estimates of the 1C-value for Arabidopsis thaliana, oftentaken for convenience by molecular biologists as about100 Mbp (�approx. 0.1 pg), have increased from about70 Mbp (Leutwiler et al., 1984; Marie and Brown, 1993) to130±155 Mbp (Arumuganathan and Earle, 1991; Somer-ville and Somerville, 1999), or higher (1C � approx.0.19 pg: DolezÏ el et al., 1998), and hence towards the valuesobtained by Feulgen microdensitometry (0.175 pg �170 Mbp, re-estimated by Bennett and Smith, 1991;0.167 pg � 162 Mbp, Krisai and Greilhuber, 1997). Sum-ming DNA sequences for each A. thaliana chromosome willsoon yield a ®rst angiosperm C-value based on this newapproach, but it will still be a best estimate based onassumptions, as several segments containing repeated DNA
Amounts in Angiosperms 865
DNA C-values and mechanisms in genome size evolution
Genome sizes range over ®ve orders of magnitude in
eukaryotes (Cavalier-Smith, 1985), and approx. 1000-fold
A
in angiosperms (Bennett and Smith, 1976). However, we arestill unsure in theory or practice what are the smallest andlargest C-values and/or genome sizes for taxa in di�erentgroups of organisms. Leutwiler et al. (1984) put thetheoretical minimum C-value for an angiosperm at about1C � 0.025 pg (assuming 15 000 di�erent genes and anaverage of 1.5 kb of DNA per gene) and suggested thatdiploid Arabidopsis thaliana (assumed 1C � 0.07 pg)approached that limit within three±four fold. However, itwas recently shown that duplications cover considerablymore than half of the genome and at least 30% ofA. thaliana genes are duplicated, raising the intriguingpossibility that it could be a degenerate tetraploid (Blancet al., 2000). If so, diploids with only half the C-value ofA. thalianamay exist, approaching the theoretical minimummore closely. The report that Rosa wichuriana had a 1CDNA amount of only 0.05 pg (Bennett and Smith, 1991)must now be discounted as an artefact, perhaps caused byself-tanning, as Yokoya et al. (2000) recently estimated thistaxon as 1C � 0.55 pg. Another angiosperm C-value below0.1 pg is known (1C � 0.05 pg for the crucifer Cardamineamara; S.R. Band pers. comm.Ðlisted in Bennett andSmith, 1991), but its validity needs con®rmation. Withestimates available for only about 1% of species, the fullrange of C-values and genome sizes in angiosperms is stilluncertain (Bennett, 1998) and may include taxa withamounts signi®cantly larger or smaller than those alreadyknown.
What determines C-value size, and how genome size iscontrolled, is an ongoing debate (Beaton and Cavalier-Smith, 1999). In particular there is considerable interest inthe molecular mechanisms responsible for the gain or lossof DNA. Kubis et al. (1998) proposed that changes innucleosome structure and size (including potentiallyspecies-speci®c modi®cations such as histone acetylationunder genetic control) may be a driver to directionalchanges in DNA amount. They found small di�erences inthe average size of repeated DNA sequences coiled aroundnucleosomes between wheat and rye (Vershinin andHeslop-Harrison, 1998). If one repeated sequence is morestable in packing around a particular nucleosome structureand size, then its ampli®cation could be favoured overothers, leading to the gain or loss of DNA.
There is considerable new evidence for the role ofretrotransposons and satellite DNA in enlarging theamount of repeated sequences and therefore DNAC-value. Elegant work on Zea mays has described howdi�erent retrotransposons have sequentially inserted onewithin another, in `Russian doll' fashion, and then spreadin its genomes (SanMiguel et al., 1998). This phenomenoncan be used as a type of molecular clock to study thesequence and timing of such events in genome evolution(Voytas and Naylor, 1998). Knowledge of this process,coupled with some phylogenetic comparisons for grasses,led Bennetzen and Kellogg (1997) to ask if plants have aone-way ticket to genomic obesity. This idea was based onthe current `absence of a known mechanism that couldsubstantially reduce nuclear DNA content in plants'.However, they noted that a failure to identify such
866 Bennett et al.ÐNuclear DN
processes `does not indicate of course that such a
mechanism is not present'. C-values may often tend togrow by such processes until selection acts on somenucleotypic character(s) related with C-value (Bennett,1987a).
There is also good reason to believe that C-values canoften decrease during evolution, although better knowledgeis needed of the molecular mechanisms involved. Evidencethat DNA loss can occur has been seen at the cytologicallevel. Deletion of segments of heterochromatin from Secalechromosomes, known to contain highly repeated DNAsequences visible in the light microscope, were seen inTriticale, leading to a reduced C-value detectable byFeulgen microdensitometry (Gustafson et al., 1983). Suchlosses, each equivalent to one±three complete Arabidopsisgenomes, need not be detrimental to ®tness. Indeed, theresulting line may be improved, as judged by the award ofplant breeders rights (Bennett, 1985). Such loss was due tochromosome breakage, and may be associated withincomplete late DNA replication, although the precisemolecular mechanism is uncertain. Work on insects givesan interesting insight into DNA loss at the molecular level.Petrov et al. (2000) tested the hypothesis that some variationin genome size can be attributed to di�erences in the patternof insertion and deletion (indel) mutations among organ-isms. They compared the indel spectrum in Laupala crickets,whose genome size is 11 times larger than that ofDrosophila.DNA loss of non-transposing copies of a `dead on arrival'pseudogene was 40 times slower in the former than in thelatter. They concluded that some di�erences in haploidgenome size may result from variation in the rate ofspontaneous loss of non-essential DNA.
An interesting question meriting further research con-cerns the proportion and parts of the genome that aredispensable in taxa with specialist life styles. Insights intomolecular mechanisms in¯uencing genome size evolutionmay be obtained from studies of genomes in highlyspecialized taxa, such as parasites and symbionts. Gilsonand McFadden (1997) reported that the vestigial nucleus ofa chlorarachniophyte endosymbiont, termed the nucleo-morph, had a haploid genome size of 380 kbpÐthen `thesmallest eukaryotic genomes known'. [The smallest eukary-ote genome known now is 225 kbp (Beaton and Cavalier-Smith, 1999) in the microsporidian Encephalitozoon intes-tinalis.] They described its stripped-down eukaryoticgenome, only a little larger than some chloroplast genomes,as the quintessence of compactness whose features includedoverlapping genes. Intensive reductive pressures hadapparently squeezed spliceosome-type introns down toonly 18±20 bases in length. Comparing nuclear andnucleomorph genome sizes shows such reductive pressuresin natural selection can readily eliminate functionlessnuclear DNA, refuting `sel®sh' and `junk' theories ofsecondary DNA (Beaton and Cavalier-Smith, 1999).
Comparisons of related diploids and polyploids may alsoincrease our knowledge of changes in DNA amount and ofthe mechanisms involved. All else being equal, the DNAamounts for polyploids are expected to increase in directproportion to ploidy level. Tetraploids and hexaploids areexpected to show double and treble the mean C-value for
Amounts in Angiosperms
diploids. This expectation is obeyed in many polyploid
A
series, especially those newly formed, but the literatureabounds with examples where genome size in polyploids issmaller than expected. While some of these are technicalartefacts, others seem real (Ohri and Khoshoo, 1986).Moreover, analysis of 2452 angiosperm taxa of knownploidy showed that mean C-values for diploids andpolyploids were more similar than expected. DNA amountdid not increase in direct proportion with ploidy level, andmean DNA amount per basic genome actually decreasedwith increasing ploidy in many cases. Polyploidy is oftenassociated with selection and adaptation for rapid celldevelopment, which in turn is correlated with smallC-values and genome size, as in ephemeral weeds such asArabidopsis thaliana (Bennett et al., 1998). If so, DNA lossmay commonly occur from constituent genomes in manypolyploids after their formation. The alternative expla-nation, that C-value and genome size increase in diploidsbut not in their derived polyploids seems unlikely. Whilethe case for reduced genome size in many polyploids seemsstrong, more work is needed to con®rm this at themolecular level and to describe the sequences involved.
Recent work has focused on how repetitive DNAsequences (both tandem and dispersed repeats) evolve inpolyploids. Evidence from several polyploids includingwheat (Triticum) and cotton (Gossypium) showed that theybehave in a dynamic and varied manner undergoing varioustypes of concerted evolutionÐthe non-independent evol-ution of sequences at multiple loci (Wendel et al., 1995;Hanson et al., 1998). The mechanisms involved are not wellunderstood but include unequal crossing over, geneampli®cation, gene conversion and replicative transposi-tion. The extent to which intensive selection for a reducedgenome size could drive concerted evolution has yet to beinvestigated but may help explain how changes in genomesize following polyploidy could occur. The report by Liuet al. (1998) that allopolyploid formation in synthetic wheatis accompanied by rapid and non-random elimination ofcertain low copy non-coding DNA sequences in a genome-speci®c manner provides direct evidence that loss of DNAfrom genomes in polyploids does occur. Chenuil et al.(1997) noted that polyploid barbel ®sh (Barbus) had fewerand shorter microsatellites than their diploid relatives. Theysuggested that a bias in the mismatch repair system towardsdeletion could account for this, providing an e�cient wayof eliminating excess DNA in polyploids. Further, it wasrecently suggested that following polyploidy, extensivemethylation and other gene silencing mechanisms areactivated, in part, to repress the spread of transposableelements (Matzke and Matzke, 1998). Such methylatedsequences could themselves also become targets forelimination, providing a further way to remove excess
Bennett et al.ÐNuclear DN
DNA from genomes in polyploids.
elements.
C-value variation and constancyÐa new C-value paradox?Di�erences in nuclear DNA amounts among organismsarise as variation between individuals within species.However, views on the incidence and magnitude of extantintraspeci®c variation in C-values remain hotly debated
(Bennett and Leitch, 1995, 1997). New evidence on thisissue is too extensive to review here, but many reportedexamples were unrepeatable using the same materials (e.g.Greilhuber and Obermayer, 1997, 1998; Baranyi andGreilhuber, 1999) and probably re¯ect technical artefactsof one sort or another (Greilhuber, 1998). Consequent onsuch studies, the idea of the plastic genome has beenquestioned, at least with respect to its gross size (Greilhuberand Obermayer, 1998) though not with respect to itsconstituent DNA sequences, as the concept of relativegenome size constancy within species has recently receivednew support (Baranyi and Greilhuber, 1999; Bennett et al.,2000).
Part of the current interest in C-values and whatdetermines genome size focuses on a tension between themassive variation in DNA amounts existing between taxawithin the angiosperms, and the surprisingly high degree ofgenome constancy found in many widely distributedspecies, including the base calibration standard for estimat-ing C-valuesÐAllium cepa (Bennett et al., 2000). In view ofthe molecular mechanisms now known which can rapidlygenerate considerable variation in DNA C-value andgenome size (Kubis et al., 1998; SanMiguel et al., 1998),the degree of C-value constancy found in many species isremarkable, and needs explanation. Indeed, it is arguablethat such constancy would not be expected without somemechanism(s) to select for constancy (or against drift) inC-value, which thereby controls variation in C-value backtowards some encoded norm for each species. Were it notso, the frequency and extent of intraspeci®c variation inDNA amount would surely be much larger, and theobserved degree of species DNA constancy would presenta new C-value paradox (Bennett et al., 2000). Genome sizeis widely perceived as free to vary, changes being undetectedand uncorrected by internal control mechanisms. Yet manyresults challenge this view, suggesting instead that DNAamount may normally be subject to innate controls by`counting' mechanisms which somehow detect, quantifyand regulate genomic size characters within quite tightlyde®ned or preselected limits (Bennett, 1987b; Bennett et al.,2000).
Thus, C-value and genome size can be perceived ascharacters subject to a tight genotypic control, rather thanas merely the end product of the interaction of evolutionarydrift and natural selection against the consequences ofdisadvantageous obesity. DNA C-value can be perceived asa genetically set `mould' within whose constraint di�erentfamilies of repeated sequences may compete and varyrapidly in identity and copy number, subject to theircompetitive strengths as preferred replicators, etc. This viewsees nuclear DNA not only or just as the genotype, but asthe environment of the essential information encoded in itsgenes, with its own ecology represented by di�erentcompeting species of non-essential repetitive DNA
Amounts in Angiosperms 867
Using C-values to probe phylogenetic dimensions
C-values are increasingly useful in a phylogeneticcontext. Much research has looked for evolutionary trends
in DNA amount at the species, genus and family level, but
the utility of C-value data as a predictor.
A
most studies were ¯awed by the lack of a rigorousphylogenetic framework on which to analyse the data.However, there is a phylogenetic component to genome sizevariation which needs evaluation before any evolutionarysigni®cance of C-value variation can be explained fully(Bharathan, 1996). New availability for angiosperms ofboth a DNA C-values database and a consensus higherlevel phylogeny recently opened the way for such studies,super-imposing data from the former on the latter (Coxet al., 1998; Kellogg, 1998; Leitch et al., 1998), whichsupport a range of interesting conclusions. Leitch et al.(1998) compared C-value data for 152 families covering allfour major subdivisions and 15 out of 20 higher levelgroups among angiosperms. Every higher level group forwhich data were available contained species with smallC-values (3.5 pg or less) and (with one exception) verysmall C-values (1.4 pg or less). Species with large C-values(14.0 pg or more) were found in only six groups, while onlytwo had very large C-values (35.0 pg or more). It seems thatancestral angiosperm genomes were small, whereas verylarge C-values represent a derived condition that arose atleast twice in angiosperm evolution, in the higher eudicotsand in the monocots (Bharathan, 1996; Leitch et al., 1998).Such analysis not only provides information on thedirection of genome size evolution in di�erent plant groupsbut, as noted above, it can also provide a frameworkessential for directing studies on the mechanism(s) andtiming of genome size changes at many taxonomic levelsranging from grass tribes (Kellogg, 1998), to species such asZea mays (SanMiguel et al., 1998; Voytas and Naylor,
868 Bennett et al.ÐNuclear DN
1998).
at Chernobyl in 1986 (Van't Hof, pers. comm.).
DNA amounts as predictors and indicatorsNuclear DNA amount shows nucleotypic correlationswith many widely di�erent phenotypic and phenologicalcharacters at cell, tissue and organismic levels. C-value is,therefore, an important fundamental factor involved inscaling of living systems. The extensive literature onnucleotypic correlations is reviewed elsewhere (Bennett,1973, 1987a; Cavalier-Smith, 1985). The 70 new originalsources listed in the Appendix report or con®rm severalrelationships between nuclear DNA amounts and widelydi�erent characters, including C-value and genomicchromosome volume in Zingiber o�cinale cultivars (Raiet al., 1997) and C-value and nuclear size in Hedysarumtaxa (Akpinar and Yildez, 1999). Among relationships withreproductive characters, C-value was directly correlatedwith chiasma frequency in Mammillaria species (Das et al.,1997); and pollen diameter signi®cantly correlated to DNAcontent for populations of Armeria maritima (Vekemanset al., 1996) `con®rming the relationship between genomesize and pollen size (Bennett, 1972), but at the intraspeci®clevel'. Baranyi and Greilhuber (1999) found signi®cantnegative correlations between genome size and ®rst monthof ¯owering for Allium taxa, con®rming the hypothesis(Grime and Mowforth, 1982) that species ¯owering veryearly in spring have large genomes. Signi®cant negativecorrelations were also noted between DNA amount per
nucleus or per genome and the probability of being arecognized weed species (Bennett et al., 1998). Correlationsvary in `tightness', but are often surprisingly close forbiological systems and more reminiscent of chemical orphysical relationships (Bennett, 1977). The closer thecorrelation between a character and C-value, the greater
Amounts in Angiosperms
C-values as ecological or environmental indicators
Clearly interest in C-values is not limited to biologicalmatters internal to organisms, such as genome evolution,but extends to a broad range of external ecological issuesand environmental concerns (Grime, 1983, 1996, 1998).Thus, DNA amounts are known to correlate with plant lifehistories (Bennett, 1972, 1987a), the geographical distri-bution of crop plants (Bennett, 1976), plant phenology(Grime and Mowforth, 1982; Grime et al., 1985), biomass(Jasienski and Bazzaz, 1995), sensitivity of growth toenvironmental variables such as temperature and frost(Grime, 1983; MacGillivray and Grime, 1995), besidespredicting changes in vegetation caused by long-termchanges such as global warming (Grime, 1990, 1996).Moreover, C-value has been suggested as a prime predictorof the likely responses of vegetation to man-madecatastrophes such as nuclear winter (Grime, 1986), orother nuclear incidents. Experimental results relating plantDNA amounts with known doses of ionizing radiation(Sparrow and Miksche, 1961; Underbrink and Pond, 1976)obtained at the Brookhaven National Laboratory in the1960s and 1970s, were used to predict the e�ects ofradiation on vegetation in the Ukraine after the accident
Using inferred C-values to reveal paleobiological trends
Not only do C-values have predictive value based ontheir close relationships with phenotypic characters (Ben-nett, 1996, 1998), but conversely such correlations allowC-values to be predicted from such characters. For example,it seems possible to infer the genome content of fossils, ascell size is proportional to quantity of DNA. If so, inprospect is the possibility of investigating changes ingenome size through geological time and on a macro-evolutionary scale encompassing the origin of major groupsand the e�ects of extinctions. A pioneering survey ofinferred variation in genome content in fossils was based onmeasurements of epithelial cells in extinct conodonts over aperiod of 270 million years (Conway Morris and Harper,1988). These inferred C-values in extinct taxa vary by atleast one, and perhaps two orders of magnitude (approx. 1±150 pg). Even when they entered their ®nal Triassic decline,inferred C-values remained widely variable, showing noevidence that conodont extinction was linked to increas-ingly small genome size. Relationships between cell size andDNA amount also mean that sizes of de®ned cell types(such as stomatal guard cells) can be used to estimate DNAamounts in fossil plants, and to track evolutionary trends in
C-values over geological time (Masterson, 1994).
A
DNA amounts and their conservation interest
We face a mass extinction of biodiversity, losing plantspecies at 10 000 times the normal rate (May et al., 1995).Knowledge of C-values and genome sizes may also besigni®cant for conservation. Whether relationships existbetween genome size and species loss is unknown, but itseems likely. Slow-developing gymnosperm taxa with longminimum generation times, which produce relatively fewlarge seeds, are probably at increased risk of extinction(Rejmanek, 1996). These characters, obligately associatedwith very high C-values, occur in many perennial mono-cots. Massive C-values may identify over-specialized endproducts of evolutionary lineages with slim chances of areturn from extreme genomic obesity, and also conferincreased chances of extinction (Bennett and Leitch, 2000).Prospects for survival may re¯ect genome size more thanC-value, and hence may be modi®ed by ploidy level. Weneed to know if, for a given high C-value, diploids andpolyploids are equally at risk. If so, because allopolyploidyis common, the loss of genomes may be proportionallymore than the loss of species. However, if polyploids aremore adaptable, and more likely to survive than parentaldiploids, as many have argued, then the proportion ofpolyploids among surviving taxa in the angiosperm ¯orawill increase, while mean genome size (taken as C-valuedivided by ploidy level) will decrease during a wave of
Bennett et al.ÐNuclear DN
extinction.
LITERATURE CITED
Akpinar N, Yildez B. 1999. Nuclear DNA contents of some endemicHedysarum L. species. Turkish Journal of Botany 23: 229±232.
Anderson GC. 1991. Green scheme avoids quarrels. Nature 345: 654.Angiosperm Phylogeny Group. 1998. An ordinal classi®cation for the
families of ¯owering plants. Annals of the Missouri BotanicalGarden 85: 531±553.
Antonius K, Ahokas H. 1996. Flow cytometric determination of poly-ploidy level in spontaneous clones of strawberries. Hereditas 124:285.
Arumaganathan K, Earle ED. 1991. Nuclear DNA content of someimportant plant species. Plant Molecular Biology Reporter 9:208±219.
Ayele M, DolezÏ el J, van Duren M, Brunner H, Zapata-Arias FJ. 1996.Flow cytometric analysis of nuclear genome of the Ethiopiancereal Tef [Eragrostis tef (Zucc.) Trotter]. Genetica 98: 211±215.
Bablak P, Draper J, Davey MR, Lynch PT. 1995. Plant regenerationand micropropagation of Brachypodium distachyon. Plant Cell,Tissue and Organ Culture 42: 97±107.
Baranyi M, Greilhuber J. 1999. Genome size in Allium: in quest ofreproducible data. Annals of Botany 83: 687±695.
Barkworth ME, Dewey DR. 1985. Genomically based genera in theperennial Triticeae of North America: identi®cation and member-ship. American Journal of Botany 72: 767±776.
Beaton MJ, Cavalier-Smith T. 1999. Eukaryotic non-coding DNA isfunctional: evidence from the di�erential scaling of cryptomonadgenomes. Proceedings of the Royal Society of London B 266:2053±2059.
Bennett MD. 1972. Nuclear DNA content and minimum generationtime in herbaceous plants. Proceedings of the Royal Society ofLondon B 181: 109±135.
Bennett MD. 1973. Nuclear characters in plantsBasic mechanisms inplant morphogenesis. Brookhaven Symposium in Biology 25:344±366.
Bennett MD. 1976. DNA amount, latitude and crop plant distribution.Environmental and Experimental Botany 16: 93±108.
Bennett MD. 1977. The time and duration of meiosis. PhilosophicalTransactions of the Royal Society of London B 277: 201±277.
Bennett MD. 1985. Intraspeci®c variation in DNA amount and thenucleotypic dimension in plant genetics. In: Freeling M, ed.UCLA symposia on molecular and cellular biology. New seriesvolume 35, `Plant genetics'. New York: Alan Liss, 283±302.
Bennett MD. 1987a. Variation in genomic form in plants and itsecological implications. New Phytologist 106 (Supplement):177±200.
Bennett MD. 1987b. Nucleotypic change and its consequences.Symposium on mechanisms of karyotype evolution `XIV Inter-national Botanical Congress', Berlin (West), Germany, p. 153(Abstract).
Bennett MD. 1996. The nucleotype, the natural karyotype and theancestral genome. In: Heslop-Harrison JS, ed. Unifying plantgenomes. Symposia of the Society for Experimental Biology,Number L. Cambridge: Society for Experimental Biology, 45±52.
Bennett MD. 1998. Plant genome valuesÐhow much do we know?.Proceedings of the National Academy of Sciences (USA) 95:2011±2016.
Bennett MD, Leitch IJ. 1995. Nuclear DNA amounts in angiosperms.Annals of Botany 76: 113±176.
Bennett MD, Leitch IJ. 1997. Nuclear DNA amounts in angios-permsÐ583 new estimates. Annals of Botany 80: 169±196.
Bennett MD, Leitch IJ. 1998. Nuclear DNA amount and genome sizein angiosperms. Annals of Botany 82 (Supplement A): 1.
Bennett MD, Leitch IJ. 2000. Variation in nuclear DNA amount(C-value) in monocots and its signi®cance. In: Wilson KL,Morrison DA, eds. Moncots: systematics and evolution. Mel-bourne: CSIRO, 137±146.
Bennett MD, Smith JB. 1976. Nuclear DNA amounts in angiosperms.Philosophical Transactions of the Royal Society of London B 274:227±274.
Bennett MD, Smith JB. 1991. Nuclear DNA amounts in angiosperms.Philosophical Transactions of the Royal Society of London B 334:309±345.
Bennett MD, Cox AV, Leitch IJ. 1997. Angiosperm DNA C-valuesdatabase. http://www.rbgkew.org.uk/cval/database1.html.
Bennett MD, Johnston S, Hodnett GL, Price HJ. 2000. Allium cepa L.cultivars from four continents compared by ¯ow cytometry shownuclear DNA constancy. Annals of Botany 85: 351±357.
Bennett MD, Leitch IJ, Hanson L. 1998.DNA amounts in two samplesof angiosperm weeds. Annals of Botany 82 (Supplement A):121±134.
Bennett MD, Smith JB, Heslop-Harrison JS. 1982. Nuclear DNAamounts in angiosperms. Proceedings of the Royal Society ofLondon B 216: 179±199.
Bennetzen JL, Kellogg EA. 1997. Do plants have a one-way ticket togenomic obesity?. Plant Cell 9: 1509±1514.
Bennetzen JL, SanMiguel P, Chen M, Tikhonov A, Francki M,Avramova Z. 1998. Grass genomes. Proceedings of the NationalAcademy of Sciences (USA) 95: 1975±1978.
Bharathan G. 1996. Reproductive development and nuclear DNAcontent in angiosperms. Genome 39: 379±394.
Blanc G, Barakat A, Guyot R, Cooke R, Delseny M. 2000. Extensiveduplication and reshu�ing in the Arabidopsis thaliana genome.Plant Cell 12: 1093±1102.
Blondon F, Marie D, Brown S. 1994. Genome size and base com-position in Medicago sativa and M. truncatula species. Genome 37:264±270.
Bouchard RA. 1976. DNA amount and organisation in some lowervascular plants. PhD Thesis. University of Chicago, USA.
BraÈ utigam S, BraÈ utigam E. 1996. Determination of the ploidy level inthe genus Hieracium subgenus Pilosella (Hill) S.F. Gray by ¯owcytometric DNA analysis. Folia Geobotanica and Phytotaxono-mica 31: 315±321.
Brummitt RK. 1992. Vascular plant families and genera. Kew: RoyalBotanic Gardens.
Bukhari YM. 1997. Nuclear DNA amounts in Acacia and Prosopis(Mimosaceae) and their evolutionary implications. Hereditas 126:45±51.
Amounts in Angiosperms 869
Butterfass T. 1995. Reproduction and continuity of chloroplasts inspermatophytes. Botanical Review 61: 1±27.

A
Catalan P, Shi Y, Armstrong L, Draper J, Stace CA. 1995. Molecularphylogeny of the grass genus Brachypodium P. Beauv. based onRFLP and RAPD analysis. Botanical Journal of the LinneanSociety 117: 263±280.
Cavalier-Smith T. 1985. The evolution of genome size. Chichester: JohnWiley and Sons.
Ceccarelli M, Morosi L, Cionini PG. 1998. Chromocenter associationin plant cell nuclei: determinants, functional signi®cance, andevolutionary implications. Genome 41: 96±103.
Chenuil A, Desmarais E, Pouyaud L, Berrebi P. 1997. Does polyploidylead to fewer and shorter microsatellites in Barbus (Teleostei:Cyprinidae)?. Molecular Ecology 6: 169±178.
Convey P. 1996. Reproduction of Antarctic ¯owering plants. AntarcticScience 8: 127±134.
Conway Morris S, Harper E. 1988. Genome size in Conodonts(Chordata): inferred variation during 270 million years. Science241: 1230±1232.
Costa P, Pot D, Dubos C, Frigerio JM, Pion C, Bodenes C, Berticchi E,Cervera M-T, Remington DL, Plomion C. 2000. A genetic map ofmaritime pine based on AFLP, RAPD and protein markers.Theoretical and Applied Genetics 100: 39±48.
Cox AV, Abdelnour GJ, Bennett MD, Leitch IJ. 1998. Genome size andkaryotype evolution in the slipper orchids (Cypripedioideae:Orchidaceae). American Journal of Botany 85: 681±687.
Creber HMC, Davies MS, Francis D, Walker HD. 1994. Variation inDNAC value in natural populations of Dactylis glomerata L. NewPhytologist 128: 555±561.
Cremonini R, Colonna N, Stefani A, Galasso I, Pignone D. 1994.Nuclear DNA content, chromatin organization and chromosomebanding in brown and yellow seeds of Dasypyrum villosum (L.) P.Candargy. Heredity 72: 365±373.
Cros J, Gavalda MC, Chabrillange N, Re calt C, Duperray C, Hamon S.1994. Variations in the total nuclear DNA content in AfricanCo�ea species (Rubiaceae). Cafe Cacao 38: 3±10.
Das AB, Mohanty S, Das P. 1997. Meiotic behaviour and nuclearDNA variation in some species of Mammillaria (Cactaceae).Cytologia 62: 253±257.
De Rocher EJ, Harkins KR, Galbraith DW, Bohnert HJ. 1990.Developmentally regulated systemic endopolyploidy in succulentswith small genomes. Science 250: 99±101.
Dean C, Schmidt R. 1995. Plant genomesÐa current moleculardescription. Annual Review of Plant Physiology and PlantMolecular Biology 46: 395±418.
Dewey DR. 1984. The genomic system of classi®cation as a guide tointergeneric hybridization with the perennial Triticeae. In:Gustafson JP, ed. Gene manipulation in plant improvement. 16thStadler Genetics Symposium, Columbia, MO. New York: PlenumPress, 209±279.
Dimitrova D, Ebert I, Greilhuber J, Kozhuharov S. 1999. Karyotypeconstancy and genome size variation in Bulgarian Crepis foetidas.l. (Asteraceae). Plant Systematics and Evolution 217: 245±257.
DolezÏ el J, Sgorbati S, Lucretti S. 1992. Comparison of three DNA¯uorochromes for ¯ow cytometry estimation of nuclear DNAcontent in plants. Physiologia Plantarum 85: 625±631.
DolezÏ el J, Greilhuber J, Lucretti S, Meister A, Lysak MA, Nardie L,Obermayer R. 1998. Plant genome size by ¯ow cytometry: Inter-laboratory comparison. Annals of Botany 82 (Supplement A):17±26.
Dunford RP, Kurata N, Laurie DA, Money TA, Minobe Y, Moore G.1995. Conservation of ®ne-scale DNA marker order in thegenomes of rice and the Triticeae. Nucleic Acid Research 23:2724±2728.
Dunham I, and 216 others. 1999. The DNA sequence of humanchromosome 22. Nature 402: 489±495.
Ebert I. 1993. Systematische Karyologie und Embryologie von ProsperoSalisb. und Barnardia Lindl. (Hyacinthaceae). PhD Thesis,University of Vienna, Austria.
Ebert I, Greilhuber J, Speta F. 1996. Chromosome banding andgenome size di�erentiation in Prospero (Hyacinthaceae): Diploids.Plant Systematics and Evolution 203: 143±177.
Evans GM, Rees H, Snell CL, Sun S. 1972. The relation between
870 Bennett et al.ÐNuclear DN
nuclear DNA amount and the duration of the mitotic cycle.Chromosomes Today 3: 24±31.
Foote T, Roberts M, Kuruta N, Sasaki T, Moore G. 1997. Detailedcomparative mapping of cereal chromosome regions correspond-ing to the Ph1 locus in wheat. Genetics 147: 801±807.
Galbraith DW, Harkins KR, Maddox JM, Ayres NM, Sharma DP,Firoozabady E. 1983. Rapid ¯ow cytometric analysis of the cellcycle in intact plant tissues. Science 220: 1049±1051.
Geisler R, and 40 others. 1999. A radiation hybrid map of the zebra®sh. Nature Genetics 23: 86±89.
Gilson PR, McFadden GI. 1997. Good things in small packages: thetiny genomes of chlorarachniophyte endosymbionts. BioEssays19: 167±173.
Greilhuber J. 1998. Intraspeci®c variation in genome size: a criticalreassessment. Annals of Botany 82 (Supplement A): 27±35.
Greilhuber J, Baranyi M. 1999. Feulgen densitometry: Importance of astringent hydrolysis regime. Plant Biology 1: 538±540.
Greilhuber J, Ebert I. 1994. On genome size in Pisum sativum. Genome37: 646±655.
Greilhuber J, Obermayer R. 1997. Genome size and maturity group inGlycine max (soybean). Heredity 78: 547±551.
Greilhuber J, Obermayer R. 1998. Genome size variation in Cajanuscajan (Fabaceae): a reconsideration. Plant Systematics andEvolution 212: 135±141.
Greuter W, Barrie FR, Burdet HM, Chaloner WG, Demoulin V,Hawksworth DL, Jùrgensen PM, Nicolson DH, Silva PC, TrehaneP, McNeil J. 1994. International code of botanical nomenclature(Tokyo Code) adopted by the Fifteenth International BotanicalCongress, Yokohama, August-September 1993. Regnum Vegeta-bile 131.
Grime JP. 1983. Prediction of weed and crop response to climate basedupon measurements of nuclear DNA content. Aspects of AppliedBiology 4: 87±98.
Grime JP. 1986. Prediction of terrestrial vegetation responses tonuclear winter conditions. International Journal of EnvironmentalStudies 28: 11±19.
Grime JP. 1990. Ecological e�ect of climate change on plantpopulations and vegetative composition with particular referenceto the British ¯ora. In: Jackson M, Ford BV, Parry ML, eds.Climatic change and plant genetic resources. London: BelhavenPress, 40±60.
Grime JP. 1996. Testing predictions of the impacts of global change onterrestrial ecosystems. Aspects of Applied Biology 45: 3±13.
Grime JP. 1998. Plant classi®cation for ecological purposes: is there arole for genome size?. Annals of Botany 82 (Supplement A):117±120.
Grime JP, Mowforth MA. 1982. Variation in genome sizeÐanecological interpretation. Nature 209: 151±153.
Grime JP, Shacklock JML, Band SR. 1985. Nuclear DNA contents,shoot phenology and species co-existence in a limestone grasslandcommunity. New Phytologist 100: 435±445.
Gustafson JP, Lukaszeski AJ, Bennett MD. 1983. Somatic deletion andredistribution of telomeric heterochromatin in the genus Secaleand in Triticale. Chromosoma 88: 293±298.
Hall SE, Dvorak WS, Johnston JS, Price HJ, Williams CG. 2000. Flowcytometric analysis of DNA content for tropical and temperateNew World pines. Annals of Botany 86 (in press).
Han TH, van Eck HJ, De Jeu MJ, Jacobsen E. 1999. Optimization ofAFLP ®ngerprinting of organisms with a large-sized genome: astudy on Alstroemeria spp. Theoretical and Applied Genetics 98:465±471.
Hanson RE, Zhao X-P, Islam-Faridi MN, Paterson AH, Zwick MS,Crance CF, McKnight TD, Stelly DM, Price HJ. 1998. Evolutionof interspersed repetitive elements in Gossypium (Malvaceae).American Journal of Botany 85: 1364±1368.
Hattori M, and 61 others. 2000. The DNA sequence of humanchromosome 21. Nature 405: 311±319.
Hopkins AA, Taliaferro CM, Murphy CD, Christian D. 1996.Chromosome number and nuclear DNA content of severalswitchgrass populations. Crop Science 36: 1192±1195.
Hopping ME. 1994. Flow cytometric analysis of Actinidia species. NewZealand Journal of Botany 32: 85±93.
Horjales M, Redondo N, Pe rez B, Brown S. 1995. Presencia en Galicia
Amounts in Angiosperms
de Dactylis glomerata L. Hexaploide. Boletim da SociedadeBroteriana (Ser. 2) 67: 223±230.

A
Hultquist SJ, Vogel KP, Lee DJ, Arumuganathan K, Kaeppler S. 1997.DNA content and chloroplast DNA polymorphisms amongswitchgrasses from remnant midwestern prairies. Crop Science37: 595±598.
Jasienski M, Bazzaz FA. 1995. Genome size and high CO2. Nature 376:559±560.
Jeddeloh JA, Richards EJ. 1996. (m)CCG methylation in angiosperms.Plant Journal 9: 579±586.
Johnston JS, Bennett MD, Rayburn AL, Galbraith DW, Price HJ.1999. Reference standards for determination of DNA content ofplant nuclei. American Journal of Botany 86: 609±613.
Jones RN, Brown LM. 1976. Chromosome evolution and DNAvariation in Crepis. Heredity 36: 91±104.
Jones WE, Kuehnle AR. 1998. Ploidy identi®cation using ¯owcytometry in tissues of Dendrobium species and cultivars.Lindleyana 13: 11±18.
Jones WE, Kuehnle AR, Arumuganathan K. 1998. Nuclear DNAcontent of 26 Orchid (Orchidaceae) genera with emphasis onDendrobium. Annals of Botany 82: 189±194.
Kellogg EA. 1998. Relationships of cereal crops and other grasses.Proceedings of the National Academy of Sciences (USA) 95:2005±2010.
Keskitalo M, Linde n A, Valkonen JPT. 1998. Genetic and morpho-logical diversity of Finnish tansy (Tanacetum vulgare L.,Asteraceae). Theoretical and Applied Genetics 96: 1141±1150.
Kiehn M. 1995. Chromosome survey of the Rubiaceae. Annals of theMissouri Botanical Garden 82: 398±408.
Kubis S, Schmidt T, Heslop-Harrison JS. 1998. Repetitive DNAelements as a major component of plant genomes. Annals ofBotany 82 (Supplement A): 44±55.
Krisai R, Greilhuber J. 1997. Cochlearia pyrenaica DC,. dasLoÈ �elkraut, in OberoÈ sterreich (mit Anmerkungen zur Karyologieund zur GenomgroÈ sse). BeitraÈge zur Naturkunde OberoÈsterreichs5: 151±160.
Lamparter T, BruÈ cker G, Esch H, Hughes J, Meister A, Hartmann E.1998. Somatic hybridisation with aphototrophic mutants of themoss Ceratodon purpureus: genome size, phytochrome reversibil-ity, tip-cell phototropism and chlorophyll regulation. Journal ofPlant Physiology 153: 394±400.
Leitch IJ, Chase MW, Bennett MD. 1998. Phylogenetic analysis ofDNAC-values provides evidence for a small ancestral genome sizein ¯owering plants. Annals of Botany 82 (Supplement A): 85±94.
Leutwiler LS, Hough-Evans BR, Meyerowitz EM. 1984. The DNA ofArabidopsis thaliana. Molecular and General Genetics 194: 15±23.
Li R, Liu C. 1996. DNA content of some taxa of Vicia sect. Vicilla innortheast China. Cytologia 61: 225±228.
Lindsay GC, Hopping ME, O'Brien IEW. 1994. Detection ofprotoplast-derived DNA tetraploid Lisianthus (Eustoma grand-i¯orum) plants by leaf and ¯ower characteristics and by ¯owcytometry. Plant Cell, Tissue and Organ Culture 38: 53±55.
Little P. 1999. The book of genes. Nature 402: 467±468.Liu B, Vega JM, Segal G, Abbo S, Rodova M, Feldman M. 1998. Rapid
genomic changes in newly synthesized amphiploids of Triticumand Aegilops. I. Changes in low-copy non-coding DNA sequences.Genome 41: 272±277.
Lu K, Kaeppler SM, Vogel KP, Arumuganathan K, Lee DJ. 1998.Nuclear DNA content and chromosome numbers in switchgrass.Great Plains Research 8: 269±280.
Lysa k MA, DolezÏ el J. 1998. Estimation of nuclear DNA content inSesleria (Poaceae). Caryologia 52: 123±132.
Mabberley DJ. 1997. The plant book. Cambridge: CambridgeUniversity Press.
MacGillivray CW, Grime JP. 1995. Genome size predicts frost-resistance in British herbaceous plantsÐImplications for ratesof vegetation response to global warming. Functional Ecology 9:320±325.
Marie D, Brown SC. 1993. A cytometric exercise in plant DNAhistograms, with 2C values for 70 species. Biology of the Cell 78:41±51.
MartõÂ nez CP, Arumuganathan K, Kikuchi H, Earle ED. 1994. Nuclear
Bennett et al.ÐNuclear DN
DNA content of ten rice species as determined by ¯ow cytometry.Japanese Journal of Genetics 69: 513±523.
Masterson J. 1994. Stomatal size in fossil plants: evidence for poly-ploidy in majority of angiosperms. Science 264: 421±424.
Matzke MA, Matzke AJM. 1998. Polyploidy and transposons. Trendsin Ecology and Evolution 13: 241.
May RM, Lawton JH, Stork NE. 1995. Assessing extinction rates. In:Lawton JH, May RM, eds. Extinction rates. Oxford: OxfordUniversity Press, 1±24.
Moore G. 1995. Cereal genome evolutionÐpastoral pursuits with legogenomes. Current Opinion in Genetics and Development 5:717±724.
Morgan ER, Burge GK, Seelye JF, Grant JE, Hopping ME. 1995.Interspeci®c hybridisation between Limonium perigrinum Bergiusand Limonium purpuratum L. Euphytica 83: 215±224.
Morgan ER, Burge GK, Seelye JF, Hopping ME, Grant JE. 1998.Production of inter-speci®c hybrids between Limonium perezii(Stapf) Hubb. and Limonium sinuatum (L.) Mill. Euphytica 102:109±115.
Murray BG. 1998. Nuclear DNA amounts in gymnosperms. Annals ofBotany 82 (Supplement A): 3±15.
Narayan RKJ, Parida A, Vij SP. 1989. DNA variation in Orchidaceae.Nucleus 32: 71±75.
Nishikawa K, Furuta Y, Ishitoba K. 1984. Chromosomal evolution ingenus Carex as viewed from nuclear DNA content, with specialreference to its aneuploidy. Japanese Journal of Genetics 59:465±472.
NSF. 1990. Document 90-80. A long range plan for the multinationalcoordinated Arabidopsis thaliana genome research project.Washington, DC: National Science Foundation.
Ohri D, Khoshoo TN. 1986. Plant DNA contents and systematics. In:Dutta SK, ed. DNA systematics. Vol II. Plants. Florida: CRCPress, 2±19.
Ohri D, Fritsch RM, Hanelt P. 1998. Evolution of genome size inAllium. Plant Systematics and Evolution 210: 57±86.
Ohri D, Jha SS, Kumar S. 1994. Variability in nuclear DNA contentwithin pigeonpea (Cajanus cajan (L.) Millsp.). Plant Systematicsand Evolution 189: 211±216.
Ollitrault P, Dambier D, Luro F, Duperray C. 1994. Nuclear genomesize variation in Citrus. Fruits 49: 390±393.
Palomino G, Sousa SM. 2000. Variation of nuclear DNA content in thebi¯orus species of Lonchocarpus (Leguminosae). Annals of Botany85: 69±76.
Palomino G, DolezÏ el J, Cid R, Brunner I, Me ndez I, Rubluo A. 1999.Nuclear genome stability of Mammillaria san-angelensis (Cacta-ceae) regenerants induced by auxins in long-term in vitro culture.Plant Science 141: 191±200.
Perkin-Elmer. 1995. AFLPTM Plant mapping kit Protocol. (P/N402083).
Petrov DA, Sangster TA, Johnson JS, Hartu DL, Shaw KL. 2000.Evidence for DNA loss as a determinant of genome size. Science287: 1060±1062.
Price HJ, Bachmann K, Chambers KL, Riggs J. 1980. Detection ofintraspeci®c variation in nuclear DNA content in Microserisdouglasii. Botanical Gazette 141: 195±198.
Rai S, Das AB, Das P. 1997. Estimation of 4C DNA and karyotypeanalysis in ginger (Zingiber o�cinale Rosc.). Cytologia 62:133±141.
Ramsay HP. 1983. Cytology of mosses. In: Schuster RM, ed. Newmanual of bryology Vol. 1. Japan: The Hattori BotanicalLaboratory Nichinan, Miyuzaki, 149±221.
Raven JA. 1999. The size of cells and organisms in relation to theevolution of embryophytes. Plant Biology 1: 2±12.
Redondo N, Horjales M, Blanco A. 1999a. Cantidades de DNA nucleareporas en Aspleniaceae: Asplenium L. Phyllitis Hill y CeterachWilld. Polypodium L. Nova Acta Cienti®ca Compostelana (Bio-loxõÂa) 9: 99±107.
Redondo N, Blanco A, Horjales M. 1999b. Estudio del ge neroPolypodium L. del noroeste Ibe rico: Cantidades de DNA nuclear.Nova Acta Cienti®ca Compostelana (BioloxõÂa) 9: 109±116.
Rejmanek M, 1996. A theory of seed plant invasiveness: the ®rst sketch.Biological Conservation 78: 171±181.
Renzaglia KS, Rasch EM, Pike LM. 1995. Estimates of nuclear DNA
Amounts in Angiosperms 871
content in bryophyte sperm cells: phylogenetic considerations.American Journal of Botany 82: 18±25.

in column 15 of the Appendix by the appropriate Key letter
TABLE 4. The 11 angiosperm species recommended for useas calibration standards
Key Standard species Amount (pg)
A Triticum aestivum `Chinese Spring' 69.27B Allium cepa `Ailsa Craig' 67.00C Vicia faba PBI, inbred line 6 53.31D Anemone virginiana line AV 200 35.67E Secale cereale `Petkus Spring' 33.14F Hordeum vulgare `Sultan' 22.24G Pisum sativum `Minerva Maple' 19.46H Zea mays `W64A' 10.93I Senecio vulgaris (PBI population) 6.33J Vigna radiata `Berken' 2.12
.
A
Reski R, Faust M, Wang Xiao-Ho, Wehe M, Abel WO. 1994. Genomeanalysis of the moss Physcomitrella patens (Hedw.) B. S. G.Molecular and General Genetics 244: 352±359.
Riera Lizarazu O, Rines HW, Phillips RL. 1996. Cytological andmolecular characterisation of oat � maize partial hybrids. Theor-etical and Applied Genetics 93: 123±135.
SanMiguel P, Gault BS, Tikhonov A, Nakajima Y, Bennetzen JL. 1998.The paleontology of intergene retrotransposons of maize. NatureGenetics 20: 43±45.
Sasaki T. 1998. The rice genome project in Japan. Proceedings of theNational Academy of Sciences (USA) 95: 2027±2028.
Schi®no MT, Winge H. 1983. Systematics and evolution of the Brizacomplex (Gramineae). 2. Karyotypes and nuclear-DNA contentof species of the Briza complex and some other genera of Poaceae(Gramineae). Revista Brasileira de Genetica 6: 245±259.
Scho®eld WB. 1995. Introduction to bryology. London: WH Freeman.Sharma AK, Mukhopadhyay S. 1984. Feulgen microspectrophoto-
metric estimation of nuclear DNA of species and varieties of threedi�erent genera of Marantaceae. Proceedings of the IndianAcademy of Science (Plant Science) 93: 337±347.
Soltis DE, Soltis PS. 1999. Polyploidy: recurrent formation andgenome evolution. Trends in Ecology and Evolution 14: 348±352.
Somerville C, Somerville S. 1999. Plant functional genomics. Science285: 380±383.
Sparrow AH, Miksche JP. 1961. Correlations of nuclear volume andDNA content with higher plant tolerance to chronic radiation.Science 134: 282±283.
Strauss NA. 1971. Comparative DNA renaturation kinetics inamphibians. Proceedings of the National Academy of Sciences(USA) 68: 799±802.
Sun M, Hu YZ, Chen H. 1999. Genome size, copy number of Copia-like retrotransposons and phylogenetic relationships of grainamaranths and their wild relatives. XVI International BotanicalCongress, St. Louis, USA, August 1±7, 1999, Poster Abstracts, No306, 344.
Swift H. 1950. The constancy of desoxyribose nucleic acid in plantnuclei. Proceedings of the National Academy of Sciences (USA)36: 643±654.
Tan MK, Thompson JA. 1990. Variation in genome size in Pteridium.In: Thomson JA, Smith RT, eds. Bracken biology and manage-ment. Occasional Publication 40, Sydney: Australian Institute ofAgricultural Science, 87±93.
Temsch EM, Greilhuber J, Krisai R. 1998. Genome size in Sphagnum(peat moss). Botanica Acta 111: 325±330.
Temsch EM, Greilhuber J, Voglmayr H, Krisai R. 1999. Genome-groÈ ben-Bestimmung bei Sphagnum: ein Methodenvergleich. In:Zechmeister HG, ed. Bryologische Forschung in OÈsterreich.Abhandlungen de Zoologisch-Botanischen Gesellschaft in OÈsterreich30: 159±167.
Tiersch TR, Chandler RW, Wachtel SS, Elias S. 1989. Referencestandards for ¯ow cytometry and application in comparativestudies of nuclear DNA content. Cytometry 10: 706±710.
Underbrink AG, Pond V. 1976. Cytological factors and their predictiverole in comparative radiosensitivity. Current Topics in RadiationResearch Quarterly 11: 251±306.
Valkonen JPT. 1994. Nuclear DNA content of the Solanum spp. in theseries Etuberosa as determined by laser ¯ow cytometry. Annals ofApplied Biology 125: 589±600.
van Raamsdonk LWD, de Vries T. 1992. Systematics and phylogeny ofAllium cepa L. and allies. In: Hanelt P, Hammer K, Knup�er H,eds. The genus AlliumÐtaxonomic problems and genetic resources.Proceedings of an International Symposium held at Gatersleben,Germany, June 11±13, 1991, 257±263.
Vekemans X, Lefe bvre C, Coulaud J, Blaise S, Gruber W, SÏ iljak-Yakovlev S, Brown SC. 1996. Variation in nuclear DNA content atthe species level in Armeria maritima. Hereditas 124: 237±242.
Vershinin AV, Heslop-Harrison JS. 1998. Comparative analysis of thenucleosomal structure of rye, wheat and their relatives. PlantMolecular Biology 36: 149±161.
Vinogradov AE. 1999. Intron-genome relationship on a large evol-utionary scale. Journal of Molecular Evolution 49: 376±384.
872 Bennett et al.ÐNuclear DN
Vogel KP, Arumuganathan K, Jensen KB. 1999. Nuclear DNA contentof perennial grasses of the Triticeae. Crop Science 39: 661±667.
Voglmayr H. 2000. Nuclear DNA amounts in mosses (Musci). Annalsof Botany 85: 531±546.
Voglmayr H, Greilhuber J. 1998. Genome size determination inPeronosporales (Oomycota) by Feulgen image analysis. FungalGenetics and Biology 25: 181±195.
Vosa CG, Bassi P. 1991. Cromosome [sic.] studies in the SouthernAfrican ¯ora. The basic karyotype of eight species of succulentEuphorbia L. Caryologia 44: 27±33.
Voytas DF, Naylor GJP. 1998. Rapid ¯ux in plant genomes. NatureGenetics 20: 6±7.
Wendel JF, Schnabel A, Seelanan T. 1995. Bidirectional interlocusconcerted evolution following allopolyploidy speciation in cotton(Gossypium). Proceedings of the National Academy of Sciences(USA) 92: 280±284.
Xia Xh. 1995. Body-temperature, rate of biosynthesis, and evolution ofbody size. Molecular Biology and Evolution 12: 834±842.
Yokoya K, Roberts AV, Mottley J, Lewis R, Brandham PE. 2000.Nuclear DNA amounts in roses. Annals of Botany 85: 557±562.
ZoldosÏ V, PapesÏ D, Brown SC, Panaud O, SÏ iljak-Yakovlev S. 1998.Genome size and base composition of seven Quercus species: inter-and intra-population variation. Genome 41: 162±168.
Zouhair R, Lecocq M. 1998. Organisation nucleaire et teneur en ADNde plusiers especes de cryptogames. Revu de Cytologie et BiologieVeÂgeÂtaleÐLe Botaniste 21: 15±32.
Notes to the Appendix
The Appendix appears on pp. 878±906.Named references in the following notes are given above
in `Literature cited', while numbered references are given in`Original references for DNA values' below.
(a) The original references for species DNA amounts inthe Appendix are given in a numbered list following the`Notes to the Appendix'. Reference numbers follow onsequentially from those given in `Notes to Table 8' byBennett and Smith (1976; references 1±54), `Notes toTable 1' by Bennett et al. (1982; references 55±107) andBennett and Smith (1991; references 108±163), `Notes tothe Appendix' by Bennett and Leitch (1995; references 165±269), and in `Notes to the Appendix' by Bennett and Leitch(1997; references 270±306).
(b1) Bennett and Smith (1991) gave absolute 4C DNAvalues for 11 angiosperm species recommended for use ascalibration standards to estimate DNA amounts in otherspecies. The 11 standard species and their 4C DNAamounts are shown in Table 4. If a species was calibratedin direct comparison with any one or more of the 11standard species then the standard species used is identi®ed
Amounts in Angiosperms
K Oryza sativa `IR36' 2 02

A
(e.g. F is Hordeum vulgare, etc.). If a species was ®rstcalibrated using a standard species listed in Table 4, thenthe original standard species is identi®ed ®rst and theintermediate standard species used to calibrate those specieslisted with it is also denoted by its number in column 1 ofthe Appendix. For instance, standard J (V. radiata) wasused to calibrate Carex ciliatomarginata (species 198 in theAppendix) which was then used as an intermediate assumedstandard to calibrate other Carex species given byNishikawa et al. (1984; Ref. 357). The calibration standardfor such Carex species is therefore given as J-198.
(b2) In Ref. 338, Keskitalo et al. (1998) used Hordeumvulgare `Sultan' as the calibration standard but assumed a4C DNA value of 21.88 pg (Valkonen, 1994) instead of22.24 pg which is the value given in Bennett and Smith(1976). The 4C value of H. vulgare `Sultan' used byKeskitalo et al. (Ref. 338) was estimated using Gallus as thecalibration standard with an assumed 4C DNA content of4.66 pg. Similarly, in Refs 348 (Grauke et al., pers. comm.),349 (Wendel et al., pers. comm.), and 373 (Bennett et al.,pers. comm.) Pisum sativum `Minerva Maple' was used asthe calibration standard but with a 4C value of 19.12 pg(Johnston et al., 1999) instead of 19.46 pg, the value givenin Bennett and Smith (1976). The 4C value of P. sativum`Minerva Maple' used in Refs 348, 349, and 373 wasestimated using H. vulgare `Sultan' as the calibrationstandard with an assumed 4C DNA content of 22.24 pg.
(c) In several of the references listed in `Originalreferences for DNA values' the authors used a cultivar ofa standard species di�erent from that listed in note (b1)above. Thus for Allium cepa the following cultivars wereused instead of `Ailsa Craig': `Alice' (Ref. 371), `Wolska'(Ref. 326), `Deshi' (Refs 324, 334), `FruÈ hstamn' (Refs 350,360), `Kantar Topu' (Ref. 363), `Stuttgart Riesen' (Ref. 341)and `Madras Local' (Ref. 364). For Zea mays, cultivars`Va35' and `CE-777' were used instead of `W64A' in Refs311, 344 and 370 respectively. For Pisum sativum, thefollowing cultivars were used instead of `Minerva Maple':`Express Long' (Ref. 342) and `Kleine RheinlaÈ nderin' (Refs350, 360, 361). For Hordeum vulgare, the cultivar `Stark'was used in Refs 343, 345, and 368 and the cultivar `Ditta'was used in Ref. 371 instead of `Sultan'. For Vicia faba, thecultivar `Aquadulce' was used instead of PBI inbred line 6in Ref. 310. In Ref. 343, the cultivar `Arapahoe' of Triticum
Bennett et al.ÐNuclear DN
aestivum was used instead of `Chinese Spring'. In Ref. 329
TABLE 5. Plant species used as a calibrat
Original ref. Plant calibration standard used As
308 Medicago sativa ssp. � varia `Rambler' 6.9314, 318, 323,
330, 366Petunia hybrida `P � Pc6' 5.7
325 Petunia hybrida cv. not given 5.7Lycopersicon esculentum
328, 332 `Stupicke polni rane ' 3.9330, 356 `Montfavet 63/5' 4.0331 `Rutgers' 4.0360, 361, 369 Glycine max `Ceresia' 4.5335 Citrus limon `Lisbon' 1.5
plants from the Palmerston North population in NewZealand of Senecio vulgaris were used instead of the PBIpopulation.
In some cases the C-value of the cultivar used wasassumed or estimated to be the same as that of the standardspecies listed in note (b1). Evidence of intraspeci®cvariation in a number of species suggests that suchassumptions may sometimes be incorrect. In other casesthe C-value of the cultivar was determined by the authorsand was di�erent from that of the standard species listedin (b1). For example Ref. 342 used the cultivar `ExpressLong' of Pisum sativum with a 4C DNA value of 16.74 pg.This value is lower than the 4C DNA amount of thecultivar `Minerva Maple' of 19.46 pg. Similarly Refs 350,360 and 361 used the cultivar `Kleine RheinlaÈ nderin' with a4C DNA amount of 17.68 pg. Other examples of thisinclude a low assumed value for Hordeum vulgare `Stark'(4C � 21.36 pg used in Refs 343, 345, 368) relative to the4C DNA amount of `Sultan' (22.24 pg).
(d) In Ref. 313 (Ceccarelli et al., 1998) the cultivar ofVicia faba used as a calibration standard was not given eventhough the authors assumed the same 4C value as for PBIinbred line 6 (i.e. 53.3 pg). If this species exhibitsintraspeci®c variation then such assumptions may beincorrect. In Ref. 344 (Hopping, 1994) the cultivar ofHordeum vulgare used as the calibration standard was notgiven. Hopping (loc. cit.) estimated the 4C DNA amountfor the material to be 20.14 pg.
(e) In a number of original references for DNAvalues theauthors used a plant species not listed in note (b) as acalibration standard. These are listed in Table 5.
( f) Several papers listed in `Original references for DNAvalues' used animal cells as the calibration standards. ThusRefs 307, 309, 320, 337, 339, 351, 352, 358, 362, 365, 367 allused chicken erythrocytes with an assumed 4C DNA valueof 4.66 pg (Galbraith et al., 1983). The calibration standardis abbreviated to Gallus in column 15 of the Appendix. InRef. 331 blood cells from the cat®sh Ictalurus punctatuswere used as a calibration standard with an assumed 4Cvalue of 4.00 pg (Tiersch et al., 1989); this is abbreviated toIctal. in column 15 of the Appendix.
If a species was ®rst calibrated using an animal species,then the original animal species is identi®ed ®rst and theintermediate standard species used to calibrate those species
Amounts in Angiosperms 873
listed with it is denoted by its number in column 1 of the
ion standard but not listed in note (b1)
sumed 4C DNA amount (pg)Abbreviation used in
column 15 of Appendix
4 (Blondon et al., 1994) Medic.(Marie and Brown, 1993) Petunia
(Marie and Brown, 1993) PetuniaLycopers.
2 (DolezÏ el et al., 1992)2 (Marie and Brown, 1993)
(no reference given)4 (Greilhuber and Obermayer, 1997) Glycine8 (Ollitrault et al., 1994) Citrus

A
Appendix. For example, in Ref. 352, BraÈ utigam andBraÈ utigam (1996) used Gallus with an assumed 4C DNAamount of 4.66 pg to calibrate Hieracium lactucella (species388 in the Appendix) which was then used as an internalstandard to estimate the DNA C-values of other Hieraciumspecies given by BraÈ utigam and BraÈ utigam (loc. cit.). Thecalibration standard for these Hieracium species is given asGallus-388. Similary, Ollitrault et al. (1994, Ref. 358) usedGallus to estimate the DNA C-value of Citrus `Tahiti Lime'(species 236 in the Appendix) which was then used toestimate the DNA C-values of other Citrus species listed inRef. 358. The calibration standard for these Citrus species isgiven as Gallus-236.
(g) When a new estimate (or estimates) is given for aspecies or subspecies already listed by Bennett and Smith(1976, 1991), Bennett et al. (1982) or Bennett and Leitch(1995, 1997) the estimate is given a number and a lower caseletter in column 1 of the Appendix. An `a' implies that thevalue is preferred to any estimate for that species listedpreviously by the ®rst author. Where several estimates areavailable for the same species, the `a' value would beautomatically chosen to represent the species in anyarithmetical or statistical calculations. In this context,single estimates for species and `a' values are referred toas `prime entries'.
(h) Intraspeci®c variation in nuclear DNA amount isclaimed to occur in this species. Consequently the valuesgiven in the Appendix should not be assumed to be correctfor all accessions of the species. Where several DNAC-values are listed for a single species with the same ploidylevel, or chromosome number, within a taxon then only theminimum and maximum values reported from a singlereference are listed in the Appendix (e.g. Co�ea specieslisted in Ref. 309 by Cros et al., 1994).
(i) A range of nuclear DNA amounts was reported forthis species in the reference cited in column 13 of theAppendix. Intraspeci®c variation was not claimed to occur,so the nature of this variation is unclear. Where theestimates di�ered by more than 10% the minimum andmaximum values are given for the same ploidy level orchromosome number in the Appendix, otherwise only thehighest value is given.
( j) According to the International Code of BotanicalNomenclature (Greuter et al., 1994) the names of plantfamilies must end in -aceae. However, eight plant familiesare exceptions in that each has two alternative names, bothof which are correct under the Botanical Code. One is astandard name, ending in -aceae, the other is an exception,sanctioned by long usage. These and their alternatives arethe following: Palmae (Arecaceae), Gramineae (Poaceae),Cruciferae (Brassicaceae), Leguminosae (Fabaceae), Gutti-ferae (Clusiaceae), Umbelliferae (Apiaceae), Labiatae(Lamiaceae) and Compositae (Asteraceae). To be consistentwith previous DNA lists (Bennett and Smith, 1976, 1991;Bennett et al., 1982; Bennett and Leitch, 1995, 1997) the`non-standard' plant names are retained in the presentwork.
(k) Recent cladistic analysis using both molecular andnon-molecular phylogenetic data has resulted in a revised
874 Bennett et al.ÐNuclear DN
classi®cation of 464 ¯owering plant families [Angiosperm
Phylogeny Group (APG), 1998]. The familial names used inthe APG classi®cation are followed in the Appendix of thispaper. Thus, although Bukhari (1997, Ref. 320) placed thegenera Acacia and Prosopis in Mimosaceae, recent molecu-lar and non-molecular phylogenetic data recognize that thisfamily (although monophyletic) is embedded within theLeguminosae (APG, 1998) so Leguminosae is given as thefamily in the Appendix. This also agrees with previousDNA C-value lists (i.e. Bennett and Leitch, 1995, 1997)where both Acacia and Prosopis were listed underLeguminosae. Similarly, the APG (1998) now recognizesthat Chenopodiaceae is embedded within the Amarantha-ceae, so Chenopodium album which was placed in Cheno-podiaceae in Ref. 375 (Bennett et al., 1998) is listed underAmaranthaceae in the Appendix.
(l) The authority for this species is either unknown orunclear to the present authors.
(m) Whether or not voucher specimens exist for thisspecies is unknown to the present authors.
(n) The chromosome number of this species is eitherunknown or unclear to the present authors.
(o) The chromosome count for this species was takenfrom the literature and not determined by the authors of thereference cited.
(p) The ploidy level of this species is either uncertain orunclear to the present authors.
(q) The life cycle type of this species is either unknown orunclear to the present authors.
(r) The method used to measure the DNA amount isunclear.
(s) DNA amounts are often given in picograms (pg) ormegabase pairs (Mbp). Hitherto, collected lists of DNAamounts by Bennett and co-authors gave DNA amountsonly in picograms, noting a conversion factor from Strauss(1971) of 1 pg � 965 Mbp. The Appendix of the presentwork gives a range of C-values in picograms for each taxonas before, except that the 3C value is omitted here as thisvalue is rarely used today. (3C values are easily obtainedfrom the data given, but to minimize rounding errors theyshould be calculated as 0.75 of the 4C value, rather thanthree times the 1C value.)
The present work also gives 1C values in Mbp for the®rst time (see column 9 of the Appendix). Please note thatthe factor used to convert picograms to Mbp di�ers fromthat given previously. Thus, a value of 1 pg � 980 Mbp(Cavalier-Smith, 1985) was used, rather than that fromStrauss (1971) mentioned above.
When converting picogram values to base pairs it isoften permissible to use the rough approximation 1 pg � 1million base pairs � 1000 Mbp. The conversion factor usedin the present work (1 pg � 980 Mbp) is more accurate,but it is also an approximation. Di�erent factors forconverting picograms and daltons may re¯ect authors usingdi�erent approximations for the atomic weights of elementsin DNA (i.e. 1 or 1.00797 for hydrogen), or assumingdi�erent states of the DNA molecule (i.e. dissociated ornon-dissociated). Assuming the following atomic weights(H � 1.00797; C � 12.0115; N � 14.0067; O � 15.9994;and P � 30.9738), 1 dalton � 1.65979 � 10ÿ24 g), and an
Amounts in Angiosperms
AT:GC base ratio of 1 :1, then a more accurate factor for

A
converting pg to Mbp is 1 pg � 978.3 Mbp for dissociatedDNA and 975.0 Mbp for non-dissociated DNA. Themolecular weights of the nucleotide pairs are, for A-T,615.39361 and 617.40955 in dissociated and non-dissociatedDNA, respectively, and for C-G 616.38119 and 618.39713in dissociated and non-dissociated DNA, respectively. TheAT:GC base ratios vary between taxa, e.g. the % GCranges from 38.0 to 45.4% in angiosperms (Marie andBrown, 1993). As noted above the molecular weights of thenucleotide pairs A-T and G-C di�er slightly (by about0.15%). Thus, small additional errors are caused byvariation in AT:GC ratios of the nuclear DNA amongdi�erent taxa. While the values for A-T and C-G di�erslightly, the di�erence is insu�cient to require a di�erentconversion factor for transforming pg to Mbp in taxa withdi�erent DNA base pair ratios. The resulting error (nomore than 0.15%) is similar to the accepted error of0.5% caused by the approximation which rounds1 pg � 975 Mbp to 1 pg � 980 Mbp for non-dissociatedDNA.
(t) In Refs 307, 332, 351, 363, 366 and 370, 1C DNAvalues are given in Mbp calculated from DNA estimatesexpressed in picograms using a factor other than1 pg � 980 Mbp. Refs 307, 332, 351 and 370 used aconversion factor of 1 pg � 965 Mbp, whereas Ref. 363used 1 pg � 912 Mbp. For each of these original references,the 1C DNA values in Mbp were re-calculated using thefactor 1 pg � 980 Mbp [see note (s)] before listing incolumn 9 of the Appendix.
(u) There is no obvious basic number for the genus Carexdue to the presence of holocentric chromosomes, it istherefore impossible to allocate Carex species with highchromosome numbers to any ploidy level with certainty.
(v) In several original references the DNA C-value of ataxon to be used as an internal standard was determinedfrom a regression of nuclear ¯uorescence vs. nuclear DNAcontent for a few calibration standards whose DNAC-values were already known. For example, Morgan et al.(1995, Ref. 315) and Morgan et al. (1998, Ref. 316)obtained the regression from Zea mays inbred line Va35,Hordeum vulgare `Sultan' and Triticum aestivum `ChineseSpring' with assumed 4C DNA values of 10.30, 21.88 and69.26 pg, respectively (but note that all of these 4C DNAamounts are non-standard values compared with 4C valuesgiven for these species in note (b1) above). Morgan et al.(1995, Ref. 315) used this regression to determine thenuclear DNA content of Avena sativa `Awapuni'(4C � 50.10 pg) which was added to Limonium extractionsto serve as an internal standard. The calibration standardwas abbreviated to Avena in column 15 of the Appendix.Morgan et al. (1998, Ref. 316) also used this regression todetermine the DNA content of Secale cereale `Rahu'(4C � 31.78 pg) which was added to Limonium extractionsas an internal standard. Yokoya et al. (1999, Ref. 346) useda similar approach to obtain their regression from Vignaradiata `Berken' (4C � 2.12 pg), Lycopersicon esculentum`Stupicke polni rane ' (4C � 3.92 pg), Glycine max`Polanka' (4C � 5.00 pg) and Hordeum vulgare `Sultan'(4C � 22.24 pg). They used this regression to determine the
Bennett et al.ÐNuclear DN
DNA content of Petroselinum crispum `Champion Moss
Curled' (4C � 8.92 pg) which was added to many Rosasamples studied by ¯ow cytometry as an internal standard.This calibration standard was abbreviated to Petrosel. incolumn 15 of the Appendix.
(w) The standard species used to convert arbitrary unitsinto absolute DNA amounts is unclear to the presentauthors.
(x) The DNA value given for this species in the originalreference di�ers considerably (i.e. 4100%) from that givenin other original references cited in previous compiled listsof DNA amounts (i.e. Bennett and Smith, 1976, 1991;Bennett et al., 1982; Bennett and Leitch, 1995, 1997). Thereason(s) for this is unknown. Thus this C-value should beused with caution until the question is resolved.
(y) The speci®c status of the material available for studyis unclear. The data are included since information onDNA amounts for this genus is relatively sparse so anindication of genome size in the genus may be useful.
(z) Jones et al. (1998, Ref. 307) and Jones and Kuehnle(1998, Ref. 362) estimated the 4C DNA amount ofDendrobium moschatum as 7.0 pg. This value di�ersconsiderably from the 4C value of 18.6 pg obtained byNarayan et al. (1989). The discrepancy was noted by Joneset al. (1998) who stated `The reason for this is unknown butcould arise from di�erences between varieties or betweenmethods of DNA content analysis'.
(aa) Cremonini et al. (1994, Ref. 310) studied C-values inDasypyrum villosum (syn. Haynaldia villosa) and reported4C amounts of 23.7 and 19.1 pg for yellow and browncaryopses respectively. They used Vicia faba as thecalibration standard, but did not state the assumed 4CDNA amount. Cremonini et al. (loc. cit.) stated that theirvalues contradicted a previous report by Bennett (1972).However, the 3C value (19.6 pg) given by Bennett (1972)was later corrected and a recalibrated value (4C � 21.4 pg)was given by Bennett and Smith (1976) using Hordumvulgare `Sultan' (4C DNA amount � 22.24 pg) as thecalibration standard. Contrary to Cremonini et al. (1994)the most recent 4C estimate for Dasypyrum villosum givenby Bennett and Smith (1976) does not contradict theirresults, but is within their range of reported values (19.1±23.7 pg) and identical with their mean of 21.4 pg.
(ab) In Ref. 311 (Lindsay et al., 1994), the DNA amountwas estimated in Eustoma grandi¯orum `Hakusen' using¯ow cytometry. Although no chromosome counts weremade it was assumed that the DNA content from the ¯owcytometric histograms corresponded to the 2C value. Onlyif this assumption is correct is the C-value valid.
(ac) Horjales et al. (1995, Ref. 314) checked thechromosome number (2n � 42) cytologically in theirhexaploid plants. However, their claim that DNA measure-ments made by ¯ow cytometry, without such counts, o�er areliable method to detect ploidy level/chromosome numberroutinely (see their English abstract) in these materials maybe premature. The 2C DNA amounts for diploid andtetraploid Dactylis glomerata estimated by ¯ow cytometryin Horjales et al. (1995) are about half as large as thosereported for this taxon by several previous authors using
Amounts in Angiosperms 875
Feulgen microdensitometry (Table 6).

TABLE 6. 2C DNA amounts for diploid and polyploidDactylis glomerata
Original ref. 2n2C DNA
amount (pg) Method
1 (Bennett, 1972) 14 9.8 Fe154 (Band, pers. comm., 1984) 14 8.7 Fe275 (Creber et al., 1994) 14 6.6 Fe314 (Horjales et al., 1995) 14 3.5 FC:DAPI117 (Schi®no and Winge, 1983) 28 12.4 Fe275 (Creber et al., 1994) 28 11.2 Fe371 (Greilhuber and Baranyi,
1999)28 8.3 Fe
371 (Greilhuber and Baranyi,1999)
28 8.2 FC:PI
314 (Horjales et al., 1995) 28 6.4 FC:DAPI314 (Horjales et al., 1995) 42 8.8 FC:DAPI
876 Bennett et al.ÐNuclear DNA
The reason(s) for this divergence is uncertain. Schi®noand Winge (1983) expressed reservations about thereliability of their measurements including those forD. glomerata (see footnote `o' in Bennett and Smith,1991) while Creber et al. (1994) claimed considerableintraspeci®c variation in C-values in this species estimatedby Feulgen microdensitometry. However, Creber et al. (loc.cit.) also reported that D. glomerata needed a considerablylonger hydrolysis time (62 min at 258C with 5 M HCl) thanthe standard species Hordeum vulgare (20 min in otherwisethe same conditions), an observation that Greilhuber andBaranyi (1999) could not reproduce. These observationssuggest that C-value estimates for D. glomerata taxa shouldbe treated with caution until the nature and extent of thevariation is determined.
(ad) The genus Prospero Salisb. was ®rst used to describea natural group of species formerly in the genus Scilla L.sharing the synapomorphy of a certain micropyle type notfound in other related taxa (Ebert, 1993). The speciesincluded in this genus were P. autumnalis (� Scillaautumnalis) and P. obtusifolia (� Scilla obtusifolia),although given the considerable morphological and chro-mosomal variation described in the genus, other specieshave since been described (e.g. see Ebert et al., 1996, Ref.321). Given the variation encountered and the taxonomicuncertainties surrounding the delimitation of the species inthe genus Prospero, Ebert et al. (loc. cit.) used the nameP. autumnalis s.l. to describe the material of P. autumnalisrather than P. autumnalis (L.) Speta, which they consideredto belong to the widely-distributed tetraploid which occursin Italy and parts of France.
Genome size data for 15 accessions of P. autumnalis s.l.with either 2n � 12 or 2n � 14 were reported. Signi®cantdi�erences in C-values between populations were found.Consequently only the lowest and highest DNA amountsfor each chromosome number are given in the Appendix.
(ae) Hopkins et al. (1996, Ref. 331) estimated nuclearDNA contents in 34 di�erent populations of switchgrass(Panicum virgatum) with ploidy levels of 4, 6 or 8x. In theAppendix only the largest and smallest DNA amounts are
given for each ploidy level. The mean 4C nuclear DNAcontents for veri®ed tetraploid and octoploid populationswere estimated to be 6.2 and 10.4 pg, respectively.
(af) In Ref. 332, Ayele et al. (1996) stated `To ourknowledge, the genomic size of Eragrostis tef has not beenreported'. They were the ®rst to use ¯ow cytometry for thispurpose, but they did not make the ®rst estimate for thisspecies. Their 4C nuclear DNA contents of 2.96±3.02 pgfor four cultivars are similar to the 4C value of 2.70 pggiven by Bennett and Smith (1976). Surprisingly, Ayele et al.(loc. cit.) seemed unaware of this earlier estimate, yet theycited Bennett and Smith (1976) for a di�erent reason whenlisting their DNA values for the Ethiopian cereal, tef, intheir Table 1.
(ag) The range of C-values (4C � 37.0±57.4 pg) given foreight species of Euphorbia by Vosa and Bassi (1991, Ref.333) di�er considerably (i.e. sometimes more than ten-fold)from two estimates of Euphorbia pulcherrima by Galbraithet al. (1983: 4C � 5.2 pg estimated by ¯ow cytometry usingmithromycin), and Bennett et al. (Ref. 373 in this paper:4C � 6.6 pg estimated by ¯ow cytometry using propidiumiodide). Vosa and Bassi (loc. cit.) did not estimate a C-valuefor E. pulcherrima nor did they comment on the largedi�erence between their values for Euphorbia taxa and thatof Galbraith et al. (1983). While up to nine-fold variation inC-values has been reported within a genus (e.g. Crepis;Jones and Brown, 1976) it is uncommon and so furtherwork is needed to con®rm that such large di�erences inC-values within the genus Euphorbia are real.
(ah) The range of C-values (4C � 18.4±27.8 pg) for sevenspecies of Cactaceae in the genusMammillaria given by Daset al. (1997, Ref. 334) is more than two-fold greater thanthree other estimates for Mammillaria species by Barlow(pers. comm., cited in Bennett and Smith, 1976;M. bocasana 4C � 8.2 pg and M. woodsii 4C � 6.2 pgestimated by Feulgen microdensitometry), and Palominoet al. (1999, Ref. 328 in this paper: M. san-angelensis4C � 6.4 pg estimated by ¯ow cytometry using propidiumiodide). In particular, the 4C estimate of M. bocasana givenby Das et al. (loc. cit.) of 19.5 pg was 2.4-fold greater thanthe value reported by Barlow (loc. cit.) for the same species(4C � 8.2 pg). The values in Ref. 334 also fall outside therange of C-values reported for eight other diploid species ofCactaceae (4C � 4.1±7.8 pg) given by Barlow (loc. cit.) andDe Rocher et al. (1990). The reason(s) for this discrepancyis unknown, thus the C-value estimates of Ref. 334 shouldbe viewed with caution until the question is resolved.
(ai) Ref. 336 (Baranyi and Greilhuber, 1999) estimatedthe C-values of 57 accessions or cultivars of 28 di�erentAllium species. Variation in DNA content of 1.08-fold orless was reported for all species except A. carinatum whereC-values for di�erent accessions varied by 1.10-fold. Theauthors suggested that a real di�erence in DNA amountexisted between diploid A. carinatum accessions. TheC-value variation reported for the 27 other species wasnot statistically signi®cant and Baranyi and Greilhuber (loc.cit.) proposed that the data `give an indication of thevariation in measurement values that is to be expectedbetween investigators working with the same material,technique and instrumentation at a given sample size'.
Amounts in Angiosperms
Consequently the mean DNA C-values are given in the

A
Appendix for all species except diploid A. carinatum wherethe highest and lowest values are listed.
(aj) Baranyi and Greilhuber (1999, Ref. 336) estimatedthe 4C DNA amount of Allium cepa var. viviparum to be57.5 pg. This estimate is very similar to the 4C value of59.8 pg for the F1 hybrid A. cepa � A. ®stulosum reportedby Evans et al. (1972). Both values di�er considerably fromother reported 4C values of A. cepa which range from 65.4±69.5 pg [listed in Bennett and Smith (1976) and Bennett andLeitch (1995, 1997)]. The similarity in DNA values betweenA. cepa var. viviparum and A. cepa � A. ®stulosum supportthe theory that the former is an ancient hybrid of the latter(van Raamsdonk and de Vries, 1992), and the considerabledi�erence in C-value between A. cepa var. viviparum andthe other A. cepa estimates suggest that this variety is moretaxonomically distinct from A. cepa than is currentlyrecognized by its nomenclature. Further work is neededto investigate this.
(ak) Valkonen (1994, Ref. 337) estimated the C-values ofthree species of Solanum from Section Etuberosa under twodi�erent temperature regimes [188C and 25/228C (day/night)]. He found that S. fernandezianum grew vigorouslyand produced ¯owers at 188C whereas growth was poor at25/228C. In contrast, S. brevidens and S. etuberosum grewwell at 25/228C but poorly at 188C with the plantsremaining stunted. These results were shown to re¯ect thedi�erent natural habitats of the species. DNAC-values wereestimated at each temperature. For S. brevidens andS. etuberosum, a small decrease in DNA amount wasreported at 188C compared with 25/228C. In contrast, DNAamount increased in S. fernandezianum grown at 188Ccompared with 25/228C. To re¯ect the di�erent temperaturerequirements of the three species the highest DNA amountsrecorded for S. brevidens and S. etuberosum grown at 25/228C are given in the Appendix whereas forS. fernandezianum the DNA amount for plants grown at188C is listed.
(al) In Ref. 343, Vogel et al. (1999) used the genomically-based nomenclature system of Dewey (1984) and Bark-worth and Dewey (1985). In these two papers, tables arepresented showing the genomically-based nomenclaturetogether with common synonyms and traditional nomen-clature. To check for synonyms in previously published listsof DNA C-values (i.e. Bennett and Smith, 1976, 1991;Bennett et al., 1982; Bennett and Leitch, 1995, 1997), aspecies name listed by Vogel et al. (loc. cit.) was located inthe genomically-based nomenclature list of Dewey (1984) orBarkworth and Dewey (1985) and then the commonsynonyms given were checked against previously publishedDNA lists. For example, Thinopyrum elongatum, listed byVogel et al. (loc. cit.), has the common synonym Agropyronelongatum (Dewey, 1984) which was listed by Bennett andSmith (1976). Synonyms could not be checked for 15species given in Vogel et al. (loc. cit.) because they were notlisted by Dewey (1984) or Barkworth and Dewey (1985).
(am) Lu et al. (1998, Ref. 345) reported DNA C-valuesfor two tetraploid and four octoploid populations ofswitchgrass (Panicum virgatum) which were cytologicallyanalysed. Since the DNA C-values given for each ploidy
Bennett et al.ÐNuclear DN
level di�ered by less than 10% and intraspeci®c variation
was not reported, only the mean DNA amount for the twoploidy levels is given in the Appendix. The mean 4C DNAamount for the two tetraploid populations of 6.2 pg agreedwell with values in Ref. 331 by Hopkins et al. (1996;4C � 4.3±6.6 pg, 20 populations analysed).
However, Lu et al. (1998) reported that their results forfour octoploid populations (mean 4C � 12.26 pg,range � 12.12±12.44 pg) were higher than those of Hop-kins et al. (loc. cit.; mean 4C � 10.20 pg, range 9.40±12.00 pg) who analysed 12 octoploid populations. Lu et al.suggested that technical di�erences accounted for thediscrepancy. For example, di�erent calibration standardswere used. Hopkins et al. used cat®sh (Ictalurus punctatus)blood cells and tomato (Lycopersicon esculentum), bothwith an assumed 4C value of 4.0 pg, whereas Lu et al. usedbarley (Hordeum vulgare `Stark') with an assumed 4C valueof 21.36 pg. Interestingly, Lu et al. (1998) also reported thatthe mean 4C DNA content of 100 plants from each of threedi�erent octoploid cultivars estimated by ¯ow cytometrybut not analysed cytogenetically, were 11.80, 11.84 and12.00 pg. These values do overlap with the data fromHopkins et al. (1996) but this was not noted by Lu et al.(1998).
(an) BraÈ utigam and BraÈ utigam (1996, Ref. 352) gaveDNA amounts for nine Hieracium species in arbitrary unitsrelative to H. lactucella that was used as an internalstandard. Following correspondence with the authors, theabsolute 4C DNA amount of H. lactucella was determinedas 3.65 pg using Gallus as a calibration standard with anassumed 2C DNA amount of 2.33 pg. It was thereforepossible to convert the relative DNA values for theremaining Hieracium taxa into absolute amounts bymultiplying the peak ratio value given in column 3 ofTable 2 in Ref. 352 by 3.65. The absolute DNA amountsare given in the Appendix. Although the relative DNAvalue forH. stoloni¯orum was given in Ref. 352, its absoluteDNA amount was omitted from the Appendix followingthe authors' request.
The DNA amounts for Hieracium species listed byBraÈ utigam and BraÈ utigam (loc. cit.) included two speciesmeasured previously (i) H. piloselloides, 4C � 4.3 pg,estimated by Bachmann, Price and Bierweiler and listed inBennett and Smith (1976), and (ii) H. pilosella,4C � 17.0 pg, estimated by Band and listed in Bennettand Smith (1991). These values di�er from those given inRef. 352 of 4C � 14.7 and 12.6 pg respectively but thediscrepancies were not noted so the reason(s) is unknown.
(ao) 4C DNA amounts for several Marantaceae taxagiven in Table 1 of Sharma and Mukhopadhyay (1984, Ref.355) in arbitrary units (a.u.) were converted to absoluteamounts using the conversion faction 1 pg � 12 a.u. Thisfactor was obtained as the mean ratio of the estimates forMaranta bicolor (0.1734 a.u.) and Stromanthe sanguinea(0.2254 a.u.) obtained by Sharma and Mukhopadhyay(1984) and by L. Hanson at RBG, Kew (4C � 2.09 pg and2.68 pg, respectively). Root-tips of Maranta bicolor andStromanthe sanguinea were taken from plants at RBG, Kewin 1999, and their 4C DNA amounts estimated by Feulgenmicrodensitometry as 2.09 pg and 2.68 pg, respectively,
Amounts in Angiosperms 877
using Vigna radiata `Berken' (4C � 2.12 pg) as a calibration

878 Bennett et al.ÐNuclear DNA Amounts in Angiosperms

Bennett et al.ÐNuclear DNA Amounts in Angiosperms 879
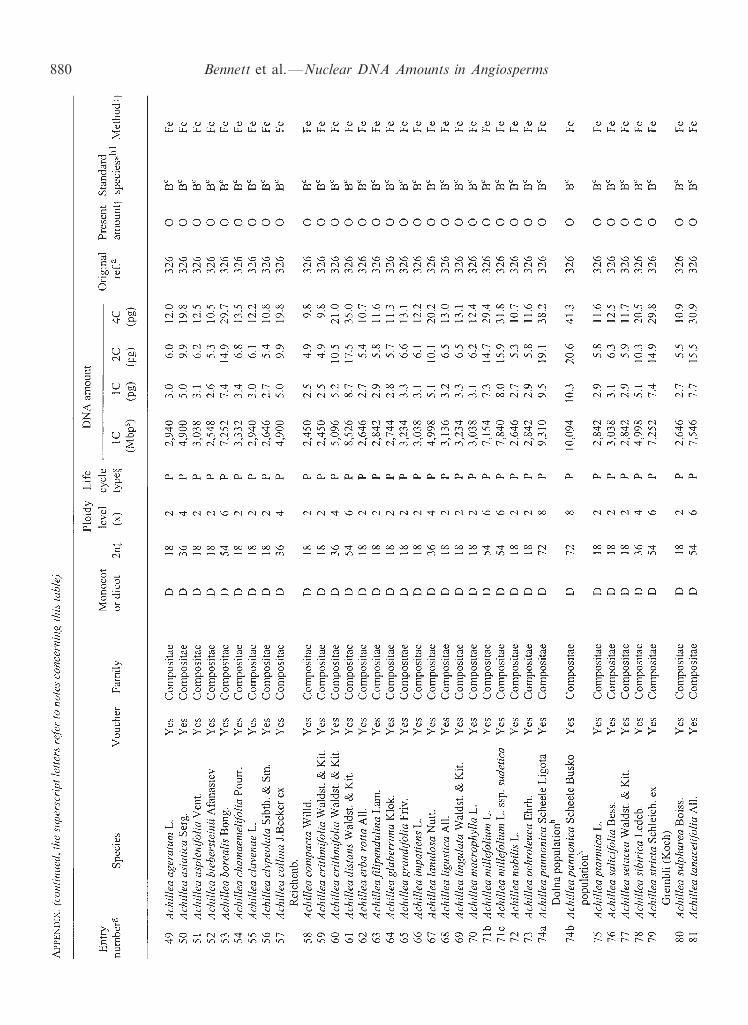
880 Bennett et al.ÐNuclear DNA Amounts in Angiosperms

Bennett et al.ÐNuclear DNA Amounts in Angiosperms 881

882 Bennett et al.ÐNuclear DNA Amounts in Angiosperms

Bennett et al.ÐNuclear DNA Amounts in Angiosperms 883

884 Bennett et al.ÐNuclear DNA Amounts in Angiosperms

Bennett et al.ÐNuclear DNA Amounts in Angiosperms 885

886 Bennett et al.ÐNuclear DNA Amounts in Angiosperms
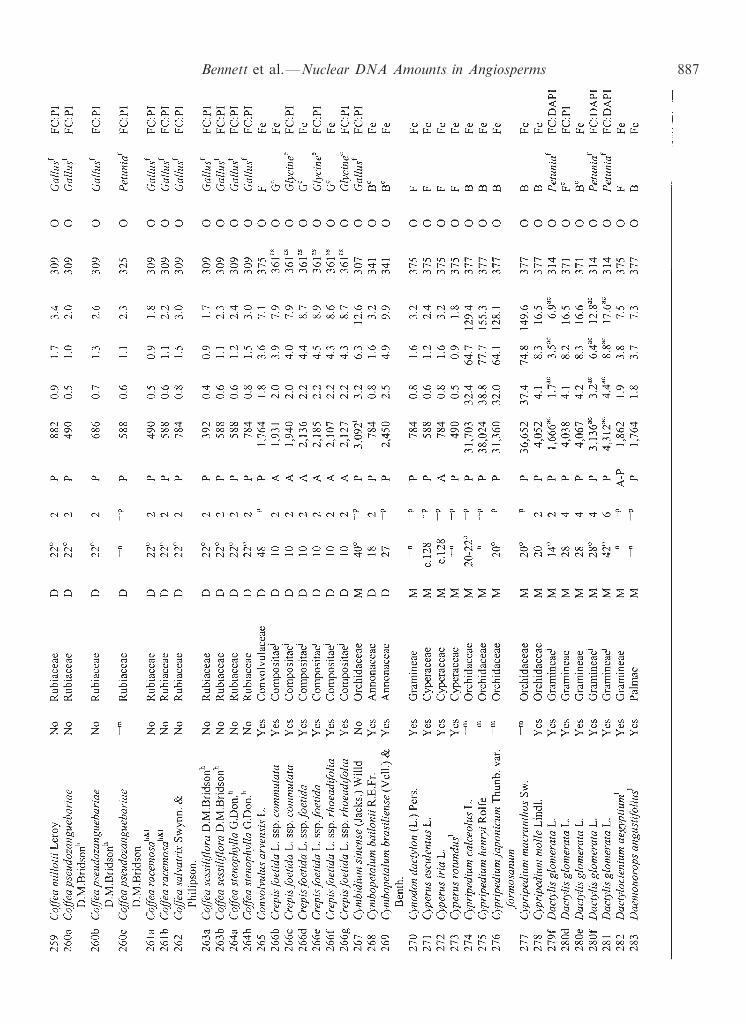
Bennett et al.ÐNuclear DNA Amounts in Angiosperms 887

888 Bennett et al.ÐNuclear DNA Amounts in Angiosperms

Bennett et al.ÐNuclear DNA Amounts in Angiosperms 889

890 Bennett et al.ÐNuclear DNA Amounts in Angiosperms

Bennett et al.ÐNuclear DNA Amounts in Angiosperms 891

892 Bennett et al.ÐNuclear DNA Amounts in Angiosperms

Bennett et al.ÐNuclear DNA Amounts in Angiosperms 893

894 Bennett et al.ÐNuclear DNA Amounts in Angiosperms

Bennett et al.ÐNuclear DNA Amounts in Angiosperms 895

896 Bennett et al.ÐNuclear DNA Amounts in Angiosperms

Bennett et al.ÐNuclear DNA Amounts in Angiosperms 897

898 Bennett et al.ÐNuclear DNA Amounts in Angiosperms

Bennett et al.ÐNuclear DNA Amounts in Angiosperms 899

900 Bennett et al.ÐNuclear DNA Amounts in Angiosperms

Bennett et al.ÐNuclear DNA Amounts in Angiosperms 901
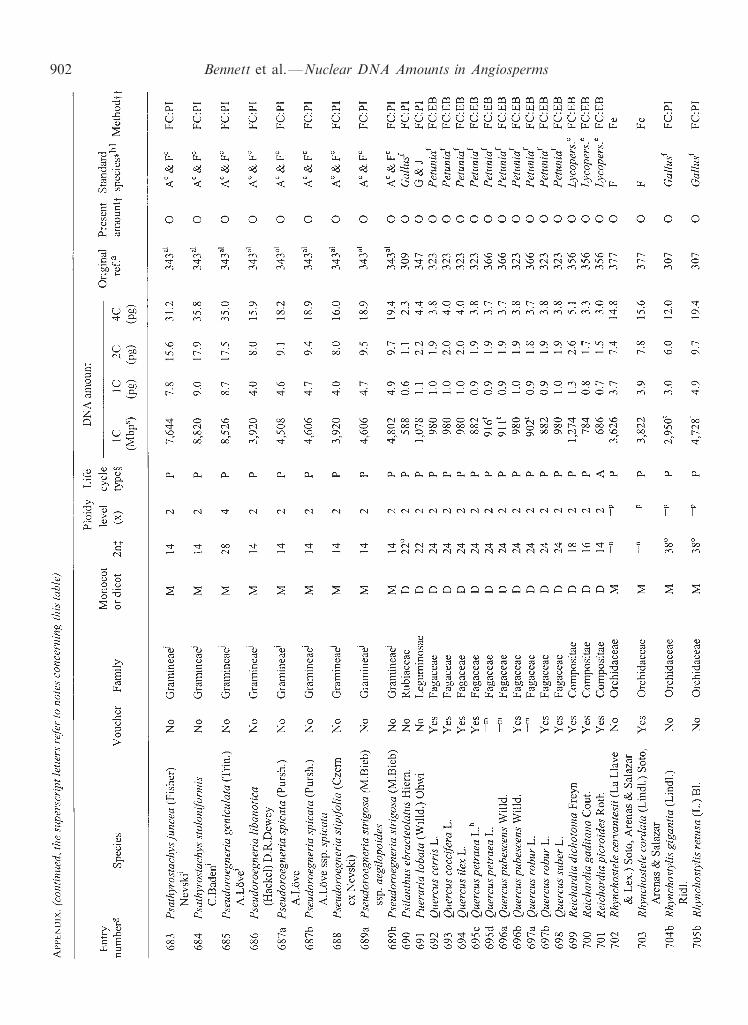
902 Bennett et al.ÐNuclear DNA Amounts in Angiosperms
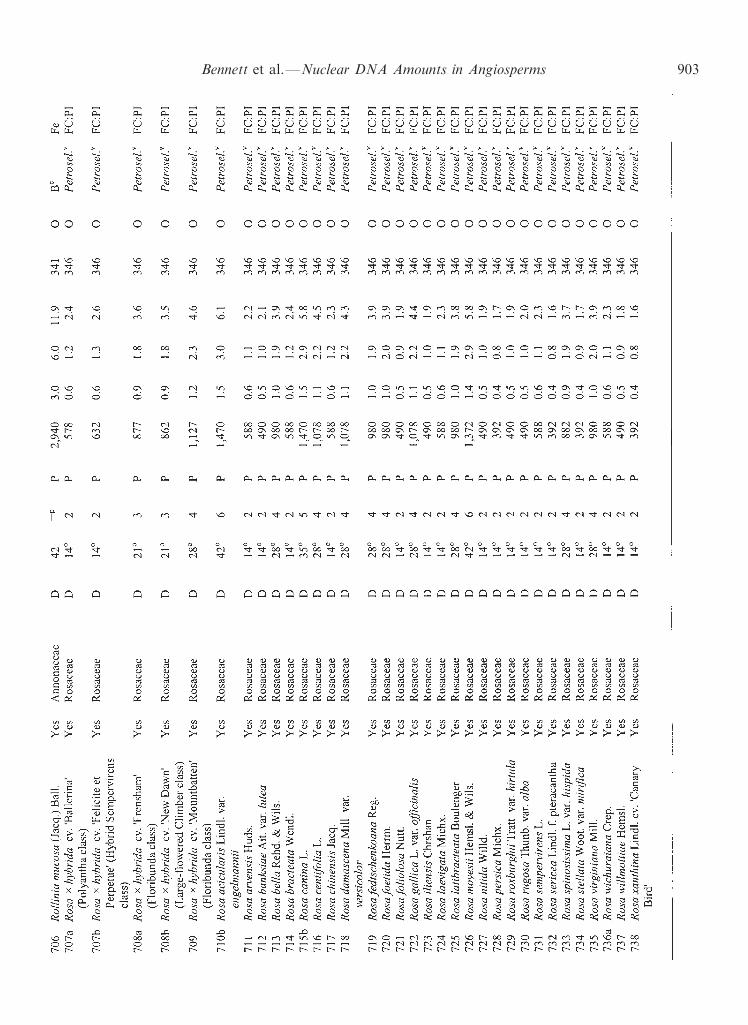
Bennett et al.ÐNuclear DNA Amounts in Angiosperms 903
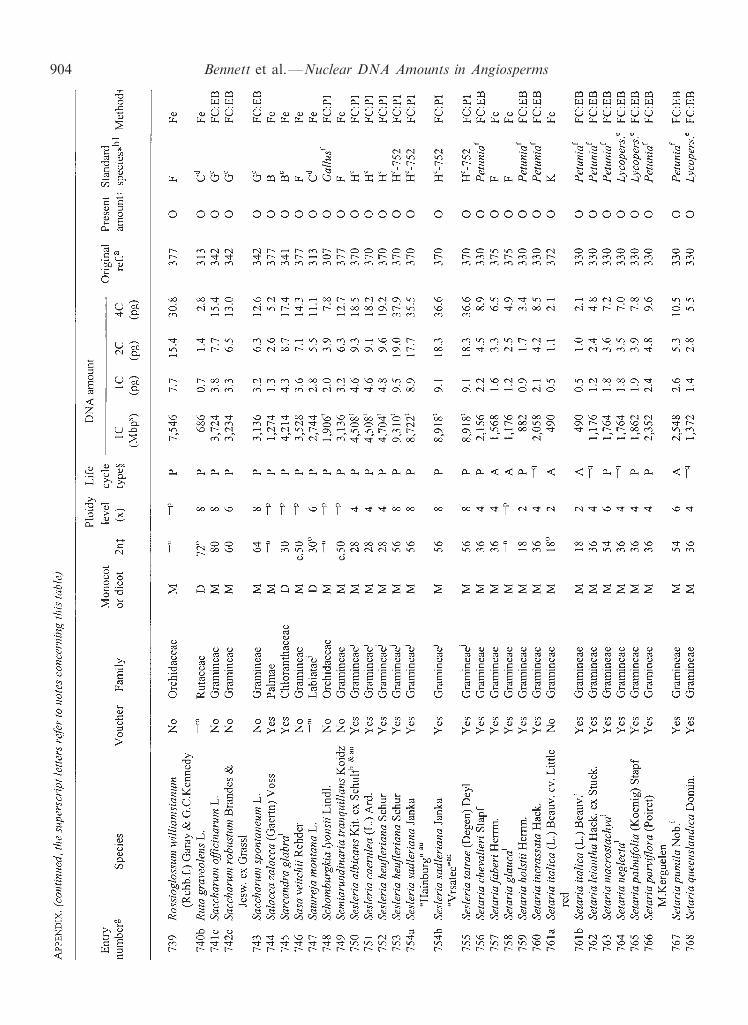
904 Bennett et al.ÐNuclear DNA Amounts in Angiosperms

Bennett et al.ÐNuclear DNA Amounts in Angiosperms 905

906 Bennett et al.ÐNuclear DNA Amounts in Angiosperms

considered to be rare events (Soltis and Soltis, 1999).
Galicia de Dactylis glomerata L. Hexaploide. Boletim da
A
standard. As the ratios for Maranta bicolor (2.09/0.1734 � 12.053) and Stromanthe sanguinea (2.68/0.2254 � 11.889) were both so similar, it is reasonable toassume that plants growing at RBG Kew had the sameploidy levels as those used by Sharma and Mukhopadhyay(loc. cit.).
(ap) 4C DNA amounts for 26 Carex species given inTable 1 of Nishikawa et al. (1984, Ref. 357) in arbitraryunits (a.u.) were converted to absolute units using theconversion factor 1 pg � 98.25 a.u. This factor wasobtained as the ratio of the estimates for Carex ciliatomar-ginata (225 a.u.) obtained by Nishikawa et al. (loc. cit.) andL. Hanson at RBG, Kew (4C � 2.29 pg). Fixed root-tips ofthe original material used by Nishikawa et al. (1984) werekindly provided by Prof. T. Hoshino (Okayama Universityof Science, Japan) in 1999, and its 4C DNA amount wasestimated as 2.29 pg by Feulgen microdensitometry usingVigna radiata `Berken' (4C � 2.12 pg) as a calibrationstandard.
Two species listed by Nishikawa et al. (loc. cit.) werereported to display aneuploidy (C. oxyandra, 2n � 18, 20,24, 26; and C. conica, 2n � 32, 36, 38) but no signi®cantdi�erences in DNA amount were found. Consequently,only the highest DNA amount for each species is given inthe Appendix. Nishikawa et al. noted `it seems that theseintraspeci®c aneuploids resulted from simple change ofchromosome number caused by fragmentation or fusion,but without de®ciency and/or duplication of chromosomesegment'. Nishikawa et al. (loc. cit.) also reported largeintraspecifc variation in DNA content in six species:C. tristachya (18%), C. capillacea (13%), C. brownii(15%), C. thunbergii (14%), C. paxii (17%) andC. nubigera (14%), however, only one DNA value waslisted for each of these species in Table 1 of their paper andthese are listed in the Appendix.
(aq) Six of the eight species of Citrus examined byOllitrault et al. (1994, Ref. 358) showed signi®cant variationin DNA amounts between four or ®ve cultivars of the samespecies (although this was not greater than 3%). Table 1 inRef. 358 gave the mean value for each species, and it is thisvalue that is listed in the Appendix.
(ar) Greilhuber and Obermayer (1998, Ref. 360) investi-gated genome size variation in eight accessions of Cajanuscajan using both ¯ow cytometry and Feulgen microdensi-tometry. They were however, unable to con®rm the 1.29-fold variation in genome size reported for this species byOhri et al. (1994). Only ¯ow cytometry was able to detectstatistically signi®cant but minor di�erences in genome sizebetween di�erent accessions, Feulgen microdensitometrywas apparently not sensitive enough. However, the authorsnoted that `. . . in ¯ow cytometry the preparation andconstitution of the material can result in minor systematicdeviations from the true value'. Thus the signi®cance of themarginal di�erences in genome size detected by ¯owcytometry remains to be determined.
(as) In Ref. 361, Dimitrova et al. (1999) estimated thegenome sizes of three subspecies of Crepis foetida (ssp.foetida, ssp. rhoeadifolia and ssp. commutata) using threetechniques: Feulgen microdensitometry, ¯ow cytometry
Bennett et al.ÐNuclear DN
and image analysis. The mean DNA C-values obtained
for each subspecies estimated by the ®rst two methods aregiven in the Appendix. The values for image analysis werefound to be somewhat lower. Dimitrova et al. (loc. cit.) feltthat this bias needed further investigation and so theseresults have been excluded from the Appendix.
(at) In Ref. 368 (Hultquist et al., 1997), the DNAC-values for 30 germplasm accessions of the switchgrassPanicum virgatum from midwestern U.S. prairies wereestimated. However, only the highest and lowest DNAamounts for the tetraploid and octoploid populations arelisted in the Appendix.
(au) In Ref. 370, Lysa k and DolezÏ el (1998) listed DNAamounts for ®ve central European Sesleria species. Whilethe mean DNA content of each species given in Table 2 oftheir paper is listed in the Appendix, the authors noted thatintraspeci®c variation in DNA content for S. albicans of1.84 % was statistically signi®cant. Thus the DNA amountof S. albicans given in the Appendix may not berepresentative of all populations of this species. The causeof the variation was not determined.
Lysa k and DolezÏ el (loc. cit.) also reported a statisticallysigni®cant di�erence (3.02%) in DNA amount for twopopulations of the octoploid S. sadleriana (`VrsÏ atec' and`Hainburg'). Both values were listed in Ref. 370 and aregiven in the Appendix. The possibility of two distinctorigins of the polyploid followed by separate evolution ofthe populations was suggested to account for theseintraspeci®c di�erences. Multiple origins of polyploidshave been documented in numerous taxa and are not now
Amounts in Angiosperms 907
Original references for DNA values
Named references in the above notes are given in`Literature cited'. Only numbered references of originalsources of species DNAvalues in the Appendix (column 13)are given in Key below.
307. Jones WE, Kuehnle AR, Arumuganathan K. 1998. Nuclear DNAcontent of 26 Orchid (Orchidaceae) genera with emphasis onDendrobium. Annals of Botany 82: 189±194.
308. Martel E, de Nay D, SÏ iljak-Yakovlev S, Brown S, Sarr A. 1997.Genome size variation and basic chromosome number in pearlmillet and fourteen related Pennisetum species. Journal ofHeredity 88: 139±143.
309. Cros J, Gavalda MC, Chabrillange N, Re calt C, Duperray C,Hamon S. 1994. Variations in the total nuclear DNA content inAfrican Co�ea species (Rubiaceae). Cafe Cacao 38: 3±10.
310. Cremonini R, Colonna N, Stefani A, Galasso I, Pignone D. 1994.Nuclear DNA content, chromatin organization and chromosomebanding in brown and yellow seeds of Dasypyrum villosum (L.) P.Candargy. Heredity 72: 365±373.
311. Lindsay GC, Hopping ME, O'Brien IEW. 1994. Detection ofprotoplast-derived DNA tetraploid Lisianthus (Eustoma grand-i¯orum) plants by leaf and ¯ower characteristics and by ¯owcytometry. Plant Cell, Tissue and Organ Culture 38: 53±55.
312. Li R, Liu C. 1996. DNA content of some taxa of Vicia sect.Vicilla in Northeast China. Cytologia 61: 225±228.
313. Ceccarelli M, Morosi L, Cionini PG. 1998. Chromocenterassociation in plant cell nuclei: determinants, functional signi®-cance, and evolutionary implications. Genome 41: 96±103.
314. Horjales M, Redondo N, Pe rez B, Brown S. 1995. Presencia en
Sociedade Broteriana (Ser. 2) 67: 223±230.

A
315. Morgan ER, Burge GK, Seelye JF, Grant JE, Hopping ME. 1995.Interspeci®c hybridisation between Limonium perigrinum Bergiusand Limonium purpuratum L. Euphytica 83: 215±224.
316. Morgan ER, Burge GK, Seelye JF, Hopping ME, Grant JE. 1998.Production of inter-speci®c hybrids between Limonium perezii(Stapf) Hubb. and Limonium sinuatum (L.) Mill. Euphytica 102:109±115.
317. Rudall PJ, Engleman EM, Hanson L, Chase MW. 1998.Embryology, cytology and systematics of Hemiphylacus, Aspar-agus and Anemarrhena (Asparagales). Plant Systematics andEvolution 211: 181±199.
318. Vekemans X, LefeÁ bvre C, Coulaud J, Blaise S, Gruber W, SÏ iljak-Yakovlev S, Brown SC. 1996. Variation in nuclear DNA contentat the species level in Armeria maritima. Hereditas 124: 237±242.
319. Nandini AV, Murray BG, O'Brien IEW, Hammett KRW. 1997.Intra- and interspeci®c variation in genome size in Lathyrus(Leguminosae). Botanical Journal of the Linnean Society 125:359±366.
320. Bukhari YM. 1997. Nuclear DNA amounts in Acacia andProsopis (Mimosaceae) and their evolutionary implications.Hereditas 126: 45±51.
321. Ebert I, Greilhuber J, Speta F. 1996. Chromosome banding andgenome size di�erentiation in Prospero (Hyacinthaceae): diploids.Plant Systematics and Evolution 203: 143±177.
322. Barral G, Poggio L, Giberti GC. 1995. Chromosome numbers andDNA content from Ilex argentina (Aquifoliaceae). Boletin de laSociedad Argentina de Botanica 30: 243±248.
323. ZoldosÏ V, PapesÏ D, Brown SC, Panaud O, SÏ iljak-Yakovlev S.1998. Genome size and base composition of seven Quercusspecies: inter- and intra-population variation. Genome 41:162±168.
324. Rai S, Das AB, Das P. 1997. Estimation of 4C DNA andkaryotype analysis in Ginger (Zingiber o�cinale Rosc.). Cytologia62: 133±141.
325. Barre P, Noirot M, Louarn J, Duperray C, Hamon S. 1996.Reliable ¯ow cytometric estimation of nuclear DNA content inco�ee trees. Cytometry 24: 32±38.
326. Dabrowska J. 1992. Chromosome number and DNA content intaxa of Achillea L. in relation to the distribution of the genus.Prace Botaniczne 49: 1±84.
327. Palomino G, Sousa SM. 2000. Variation of nuclear DNA contentin the bi¯orus species of Lonchocarpus (Leguminosae). Annals ofBotany 85: 69±76.
328. Palomino G, DolezÏ el J, Cid R, Brunner I, Me ndez I, Rubluo A.1999. Nuclear genome stability of Mammillaria san-angelensis(Cactaceae) regenerants induced by auxins in long-term in vitroculture. Plant Science 141: 191±200.
329. Campbell BD, Caradus JR, Hunt CI. 1999. Temperatureresponses and nuclear DNA amounts of seven white cloverpopulations which di�er in early spring growth rates. NewZealand Journal of Agricultural Research 42: 9±17.
330. Le Thierry d'Ennequin M, Panaud O, Brown S, SÏ iljak-Yakovlev S,Sarr A. 1998. First evaluation of nuclear DNA content in Setariagenus by ¯ow cytometry. Journal of Heredity 89: 556±559.
331. Hopkins AA, Taliaferro CM, Murphy CD, Christian D. 1996.Chromosome number and nuclear DNA content of severalswitchgrass populations. Crop Science 36: 1192±1195.
332. Ayele M, DolezÏ el J, van Duren M, Brunner H, Zapata-Arias FJ.1996. Flow cytometric analysis of nuclear genome of theEthiopian cereal Tef [Eragrostis tef (Zucc.) Trotter]. Genetica98: 211±215.
333. Vosa CG, Bassi P. 1991. Cromosome [sic.] studies in the SouthernAfrican ¯ora. The basic karyotype of eight species of succulentEuphorbia L. Caryologia 44: 27±33.
334. Das AB, Mohanty S, Das P. 1997. Meiotic behaviour and nuclearDNA variation in some species of Mammillaria (Cactaceae).Cytologia 62: 253±257.
335. D'Hont A, Paget-Goy A, Jenny C, Noyer JL, Baurens FC, LagodaPJL, Carreel F. 1999. Investigation of the complex genomestructure of cultivated banana (Musa spp.) by ¯ow cytometry,
908 Bennett et al.ÐNuclear DN
genomic DNA in situ hybridisation and repeated sequenceanalysis. In: May GD, ed. The International Symposium on the
Molecular and Cellular Biology of Banana. BTI Cornell University,Ithaca, New York, March 22±25 1999. p. 9.
336. Baranyi M, Greilhuber J. 1999.Genome size in Allium: in quest ofreproducible data. Annals of Botany 83: 687±695.
337. Valkonen JPT. 1994. Nuclear DNA content of the Solanum spp.in the series Etuberosa as determined by laser ¯ow cytometry.Annals of Applied Biology 125: 589±600.
338. Keskitalo M, Linde n A, Valkonen JPT. 1998. Genetic andmorphological diversity of Finnish tansy (Tanacetum vulgare L.,Asteraceae). Theoretical and Applied Genetics 96: 1141±1150.
339. Antonius K, Ahokas H. 1996. Flow cytometric determination ofpolyploidy level in spontaneous clones of strawberries. Hereditas124: 285.
340. Barakat A, Han DT, Benslimane A-A, Rode A, Bernardi G. 1999.The gene distribution in the genomes of pea, tomato and datepalm. FEBS Letters 463: 139±142.
341. Morawetz W, Samuel R. (pers. comm. 1998).342. D'Hont A. (pers. comm. 1999).343. Vogel KP, Arumuganathan K, Jensen KB. 1999. Nuclear DNA
content of perennial grasses of the Triticeae. Crop Science 39:661±667.
344. Hopping ME. 1994. Flow cytometric analysis of Actinidia species.New Zealand Journal of Botany 32: 85±93.
345. Lu K, Kaeppler SM, Vogel KP, Arumuganathan K, Lee DJ. 1998.Nuclear DNA content and chromosome numbers in switchgrass.Great Plains Research 8: 269±280.
346. Yokoya K, Roberts AV, Mottley J, Lewis R, Brandham PE. 2000.Nuclear DNA amounts in roses. Annals of Botany 85: 557±562.
347. Price HJ. (pers. comm. 1999).348. Grauke LC, Johnston S, Price HJ. (pers. comm. 1999).349. Wendel JF, Johnston S, Price HJ. (pers. comm. 1999).350. Krisai R, Greilhuber J. 1997. Cochlearia pyrenaica DC., das
LoÈ �elkraut, in OberoÈ sterreich (mit Anmerkungen zur Karyologieund zur GenomgroÈ sse). BeitraÈge zur Naturkunde OberoÈsterreichs5: 151±160.
351. Uozu S, Ikehashi H, Ohmido N, Ohtsubo H, Ohtsubo E, Fukui K.1997.Repetitive sequences: cause for variation in genome size andchromosome morphology in the genus Oryza. Plant MolecularBiology 35: 791±799.
352. BraÈ utigam S, BraÈ utigam E. 1996. Determination of the ploidylevel in the genusHieracium subgenus Pilosella (Hill) S.F.Gray by¯ow cytometric DNA analysis. Folia Geobotanica and Phytotax-onomica 31: 315±321.
353. Bottini MCJ, Greizerstein EJ, Premoli AC, Poggio L. 1998.Genome size and meiotic behavior of Berberis L. species fromPatagonia, Argentina. Cytogenetics and Cell Genetics 81: 125 andpers. comm.
354. Poggio L, Greizerstein EJ, Bottini MCJ, Guaglianone R. (pers.comm. 1999).
355. Sharma AK, Mukhopadhyay S. 1984. Feulgen microspectropho-tometric estimation of nuclear DNA of species and varieties ofthree di�erent genera of Marantaceae. Proceedings of the IndianAcademy of Science (Plant Science) 93: 337±347.
356. SÏ iljak-Yakovlev S, Cerbah M, Zoldos V, Godelle B. (pers. comm.1998).
357. Nishikawa K, Furuta Y, Ishitoba K. 1984. Chromosomal evolutionin genus Carex as viewed from nuclear DNA content, with specialreference to its aneuploidy. Japanese Journal of Genetics 59:465±472.
358. Ollitrault P, Dambier D, Luro F, Duperray C. 1994. Nucleargenome size variation in Citrus. Fruits 49: 390±393.
359. Sun M, Hu YZ, Chen H. (pers. comm. 1999).360. Greilhuber J, Obermayer R. 1998. Genome size variation in
Cajanus cajan (Fabaceae): a reconsideration. Plant Systematicsand Evolution 212: 135±141.
361. Dimitrova D, Ebert I, Greilhuber J, Kozhuharov S. 1999.Karyotype constancy and genome size variation in BulgarianCrepis foetida s.l. (Asteraceae). Plant Systematics and Evolution217: 245±257.
362. Jones WE, Kuehnle AR. 1998. Ploidy identi®cation using ¯ow
Amounts in Angiosperms
cytometry in tissues of Dendrobium species and cultivars.Lindleyana 13: 11±18.

A
363. Akpinar N, Yildiz B. 1999. Nuclear DNA contents of someendemic Hedysarum L. species. Turkish Journal of Botany 23:229±232.
364. Mukherjee S, Sharma AK. 1995. In situ nuclear DNA variation inAustralian species of Acacia. Cytobios 83: 59±64.
365. MartõÂ nez CP, Arumuganathan K, Kikuchi H, Earle ED. 1994.Nuclear DNA content of ten rice species as determined by ¯owcytometry. Japanese Journal of Genetics 69: 513±523.
366. Favre JM, Brown S. 1996. A ¯ow cytometric evaluation of thenuclear DNA content and GC percent in genomes of Europeanoak species. Annales des Sciences Forestieres 53: 915±917.
367. Keeler KH. 1992. Local polyploid variation in the native prairiegrass Andropogon gerardii. American Journal of Botany 79:1229±1232.
368. Hultquist SJ, Vogel KP, Lee DJ, Arumuganathan K, Kaeppler S.1997. DNA content and chloroplast DNA polymorphismsamong switchgrasses from remnant midwestern prairies. Crop
Bennett et al.ÐNuclear DN
Science 37: 595±598.
369. Obermayer R, SÂ wieÎcicki WK, Greilhuber J. 1999. Flow cytometricdetermination of genome size in some old world Lupinus species(Fabaceae). Plant Biology 1: 403±407.
370. Lysa k MA, DolezÏ el J. 1998. Estimation of nuclear DNA contentin Sesleria (Poaceae). Caryologia 52: 123±132.
371. Greilhuber J, Baranyi M. 1999. Feulgen densitometry: importanceof a stringent hydrolysis regime. Plant Biology 1: 538±540.
372. Bennett MD, Hanson L. (pers. comm. 1997).373. Bennett MD, Price HJ, Johnston S. (pers. comm. 1999).374. Mulry M, Hanson L. (pers. comm. 1999).375. Bennett MD, Leitch IJ, Hanson L. 1998. DNA amounts in two
samples of angiosperm weeds. Annals of Botany 82 (Supple-ment A): 121±134.
376. Houben A, Wanner G, Hanson L, Verlin D, Leach CR, TimmisJN. Cloning and characterisation of polymorphic heterochro-matic segments of Brachycome dichromosomatica. Chromosoma109: 206±213.
377. Hanson L, Leitch IJ, Bennett MD. 1999. Unpublished values
Amounts in Angiosperms 909
from the Jodrell Laboratory, Royal Botanic Gardens, Kew.
Copyright © 2022 FDOKUMEN