
Centrifuge modeling of one-step outflow tests for unsaturated ...

Ecological Engineering 26 (2006) 206–223
Phosphorus mass load and outflow concentration relationshipsin stormwater treatment areas for Everglades restoration
John Juston∗, Thomas A. DeBusk
DB Environmental, Inc., 365 Gus Hipp Blvd., Rockledge, FL 32955, USA
Received 21 January 2005; received in revised form 29 July 2005; accepted 8 September 2005
Abstract
Mass loading and outflow phosphorus (P) relationships were investigated for four stormwater treatment area (STA) wetlandsin south Florida. These systems, ranging in size from 350 to 2670 ha, were constructed by the South Florida Water ManagementDistrict (SFWMD) for Everglades restoration, and approaches currently are being investigated for optimizing their design andmanagement. We analyzed 2–7 years of P removal data from 10 independent STA process trains using system classificationsbased on dominant vegetation type, which was either emergent aquatic vegetation (EAV) or submerged aquatic vegetation (SAV),and prior land use, which was either recently farmed (RF) or historic wetland (HW). We found that a 1–2 year history of massloading rates (MLR) at or below∼1.3 g P/m2/year in STA process trains provided a high likelihood of achieving outflow total P(TP) concentrations less than∼30�g/L. Statistical analyses revealed that P removal performance of SAV and EAV-HW systemswas generally superior to that of EAV-RF systems. These performance differences were corroborated with data from seven othernon-STA Florida-based treatment wetlands. Furthermore, in the subset of SAV and continuously flooded EAV-HW data with PM esw ow P loads.D en 10 and2©
K odeling
1
dst
ro-eCon-andlandject
ject
0
LRs at or below∼2 g/m2/year, outflow P concentrations were consistently between 10 and 20�g/L, mass removal efficienciere consistently above 85%, and the wetlands demonstrated a substantial resilience to small-to-moderate pulsed inflespite 16 occurrences in these full-scale STA data of annual flow-weighted mean outflow P concentrations betwe0�g/L, no significant MLR–P relationships were identified for targeting specific P concentrations in this range.2005 Elsevier B.V. All rights reserved.
eywords: Treatment wetlands; Constructed wetlands; Stormwater; Phosphorus; P removal; Outflow concentration; Everglades; M
. Introduction
In 1994, the Everglades Forever Act mandated theesign and construction of six wetlands, known astormwater treatment areas (STAs), in south Florida forhe purpose of removing phosphorus (P) from upstream
∗ Corresponding author.
waters flowing into the downstream Everglades Ptection Area (Chimney and Goforth, 2001). The scopand scale of this project, known as the Evergladesstruction Project, is huge in terms of its size, costscientific challenges. To date, over 20,000 ha ofhave been allocated to the STA footprints with procosts exceeding US$ 700 million (Goforth, 2001). Theinterim performance goal for phase 1 of the pro
925-8574/$ – see front matter © 2005 Elsevier B.V. All rights reserved.doi:10.1016/j.ecoleng.2005.09.011

J. Juston, T.A. DeBusk / Ecological Engineering 26 (2006) 206–223 207
was an average outflow total P (TP) concentration of50�g/L from each STA. The long-term goal, whichwas initially scheduled to be achieved, by the end of2006, was unspecified at the project’s initiation (leav-ing it up to future research), but now appears will belikely at or near 10�g/L.
The South Florida Water Management District(SFWMD) is the government agency largely respon-sible for design, construction and maintenance of theSTAs (Goforth, 2001). The land area estimates for thephase 1 STA designs were based on steady state firstorder performance models developed byKadlec andKnight (1996) and Walker (1995)(Goforth, 2001).Walker’s model (1995), which essentially providedthe design basis for the STAs, was calibrated to peatand water column P data collected in Water Conser-vation Area 2A (WCA-2A). WCA-2A has a large(∼12,000 ha) and extensively studied eutrophicationgradient that has resulted from years of P-enrichedinflows. Walker’s premise was that this wetland’snatural response to P loading was the best availablebasis for sizing the STAs (Walker, 1995). In oneparticular design example, Walker estimated that afull-scale STA would need to be sized for a P loadingof ∼1.3 g/m2/year in order to achieve the 50�g/Lobjective. With a Bayesian statistical analysis usingthe same dataset,Qian (1997)suggested that Walker’ssizing estimates were too small and had a 75% chanceof system “overload”.
Since 1999, STA research has focused largely ont soa goal( erge steda atedf tivec et-l date,t omi-n ege-t AV)( tedp mu-n earm ons( ta u-n P)
that also may be pertinent to future STA optimiza-tion efforts. CP systems have produced very low out-flow P concentrations (10�g/L) at the mesocosm scale(DeBusk et al., 2004) and field-scale CP systemsare currently being deployed to investigate the util-ity of CP communities in full-scale wetlands (Goforth,2005). In related research, the internal hydraulicefficiency of STAs was also shown to have directimpact on P removal performance (Dierberg et al.,2005).
There are additional variables that may influencethe P removal performance of the STAs, but these vari-ables are intrinsic to the specific wetland sites andoperations and cannot be addressed with general designprinciples. Two potentially important “intrinsic” vari-ables are the antecedent conditions of the land (e.g.“recently farmed” versus not previously farmed), andthe fact that P-laden runoff feeds into the STAs in apulsed, rather than steady state fashion. These pulseloadings arise from rainfall events in the upstreamagricultural area, and from water releases from LakeOkeechobee.
A dynamic model for STAs (DMSTA) was formu-lated to provide a tool for assessing the influence ofmost of these variables on system performance (Kadlecand Walker, 2003). The first version of DMSTA wascalibrated and tested with data from over 70 wetlandsystems, most of which were mesocosm studies withsurface areas <1% of the STA footprints. Predictionresults from this model were featured prominently in apa
dS ears.T d arei As isa ntlyi ande ins,p nds.T hese1 owP n ism cordt tart-u erein,t t-upd
echnology development to optimize performances to meet the long-term outflow P concentrationGoforth, 2001; Newman and Lynch, 2001; Dierbt al., 2002). Results from this research have sugget least three attributes of STAs can be manipul
or potential performance improvements: vegetaommunities, internal hydraulic efficiencies and wand area (analogous to mass loading rates). Tohe STAs have been managed to promote two dant vegetative communities: emergent aquatic v
ation (EAV) and submerged aquatic vegetation (SGoforth, 2005). Research efforts have demonstraerformance differences among these plant comities. For example, native SAV communities appore efficient at P removal at low P concentrati
14–100�g/L) than EAV communities (Dierberg el., 2002). There is an additional vegetative commity type comprised of calcareous periphyton (C
reliminary design study for STA optimization (Burnsnd McDonnell, 2003).
At the time of this writing, four of the six planneTAs have been operational for between 5 and 10 yhe remaining two STAs have been completed, an
n the start-up phase. Further expansion of three STnticipated within the next decade. Each STA curre
n operation is comprised of two to three parallelssentially independent flow-through process traroviding a total of 10 independent treatment wetlaaken together, the performance records from t0 systems contain over 60 years of inflow–outflconcentration and flow data. If a 3-year deductioade from the beginning of each system’s data re
o eliminate possible performance artifacts from sp years, as was done in the analysis presented h
here still remain 39 years of combined, post-starata for analysis.

208 J. Juston, T.A. DeBusk / Ecological Engineering 26 (2006) 206–223
The purpose of the analysis presented in this paperis three-fold:
• To quantify STA performance in terms of mass load-ing and outflow TP relationships in order to compareperformance among STA systems and seven other(non-STA) P removal treatment wetlands in Florida.
• To examine the dynamic response of outflow TP inthe STAs to “pulsed” P mass loads.
• To examine the existing STA performance data forinformation useful to optimization efforts, specifi-cally relationships between outflow TP and vegeta-tion type and/or land area (mass loading rate).
2. Methods
2.1. Study sites and data sources
A map identifying the location of the STAs in rela-tion to significant features in the south Florida land-scape is provided inFig. 1. The four operational STAsthat were analyzed herein are STA-1W, STA-2, STA-5 and STA-6.Table 1summarizes the wetland size,dominant vegetation and previous land use for the 10process trains at these four sites.
General practice has typically characterized STAsby their vegetative communities as either EAV or SAVsystems (Goforth, 2005). However, the reference char-acteristics listed for these systems are, by nature, broada stinc-t nd
in STA-1W Cell 4 and STA-2 Cell 3 is generally com-prised of native species, such asNajas guadalupensis(southern naiad),Ceratophyllum demersum (coontail)andPotamogeton spp. (pondweed), whereas the SAVfound in STA-1W Cell 5b and STA-5 Cell 1b is mostlycomprised of the invasive exoticHydrilla verticillata.Furthermore, the EAV species found in STA-2 Cells1 and 2 are typicallyCladium jamaicense (sawgrass)andTypha spp. (cattail), while the EAV species foundin STA-5 Cell 2 are typicallyTypha spp., Ludwigia sp.(primrose willow), andPanicum sp. (panic grasses).Even though STA-6 Cell 5 is broadly classified as anEAV system (Goforth, 2005), a thriving CP communityhas been observed in the back third of that cell (unpub-lished data, 2004). For a more detailed discussion onthe physical characteristics and operational histories ofthe STAs, the reader is referred to the appropriate chap-ters in the annual Everglades Consolidated Reports(Chimney et al., 2000; Nungesser et al., 2001; Jorgeet al., 2002; Newman et al., 2003) as well as other per-tinent SFWMD documents (Goforth, 2005).
Throughout this document, we find it useful to add asecondary component to STA classifications based onthe antecedent land use as being either recently farmed(RF) or historic wetland (HW). This distinction essen-tially splits the EAV systems into two categories, asapproximately half the EAV systems in this study wereconstructed on previously farmed lands and the otherhalf on historic wetlands (Table 1). All SAV systemsin this study were constructed on previously farmedl cane,v
lorida id
nd general and tend to aggregate second order diions (Table 1). For instance, the dominant SAV fou
Fig. 1. Map of south F
ands. Crops farmed on these lands included sugaregetables, corn, sod and ornamentals (trees) (Goforth,
entifying STA locations.

J. Juston, T.A. DeBusk / Ecological Engineering 26 (2006) 206–223 209
Table 1Summary of STA process train physical and data characteristics
Process train Internalcells
Area(ha)
Vegetationtype
Prior landuse
Yearflooded
Start year foranalysisa
Datayears
P datatypeb
STA-1W east Cell 1 603 EAV RF 1993 1997 7 WCCell 3 415 EAV
STA-1W west Cell 2 380 EAV RF 1993 1997 7 WCCell 4 145 SAV
STA-1W north Cell 5a 227 EAV RF 1999 2002 2 BGCell 5b 928 SAV
STA-2 Cell 1 – 805 EAV HW 1999 2002 3 BGSTA-2 Cell 2 – 898 EAV HW 1999 2002 3 BGSTA-2 Cell 3 – 898 SAV RF 1999 2002 3 BG
STA-5 Cell 1 Cell 1a 338 EAV RF 1999 2002 3 WCCell 1b 493 SAV
STA-5 Cell 2 Cell 2a 338 EAV RF 1999 2002 3 WCCell 2b 493
STA-6 Cell 3 – 99 EAV HW 1997 2001 4 WCSTA-6 Cell 5 – 253 EAV-CP HW 1997 2001 4 WC
a All data analysis initiated in month of May for year shown.b WC, weekly composite sample; BG, biweekly grab sample.
2005). The HW systems were either remaining Ever-glades communities (as was the case at STA-2) orstormwater detention areas (as was the case at STA-6) (Goforth, 2005). Consequently, the three categoriesfor STA systems used throughout this manuscript areas follows:
• EAV-RF: EAV systems on recently farmed lands.• EAV-HW: EAV systems on historic wetland systems.• SAV systems on previously framed lands.
Table 1provides a summary of approximate flood-ing dates (initial introduction of water after construc-tion), start dates used for data analysis in this study,and the type of TP data that were available for eachSTA process train. For each system, we defined thefirst “usable” data as occurring in the month of May(near the beginning of south Florida’s wet season)approximately 3 years after each system’s flood date.In this way, we omit a large portion of performancedata that would likely have reflected non-sustainablestart-up processes (e.g. vegetation colonization) andprovide a common delineation for annual data reduc-tions. The last data year used for this analysis was May2004–April 2005. For the STA-1W west and north pro-cess trains, this last data year was omitted from analyses
due to dry down and intensive construction activities.The first year of “usable” data from STA-5 Cell 1 wasalso omitted due to intensive vegetation managementefforts in this cell. The resulting period of “usable”post-start-up data ranged from 2 to 7 years among the10 systems analyzed (Table 1).
Flow and water quality data used in this study werecollected by SFWMD personnel and are publicly avail-able on their online environmental database, DBHY-DRO (http://www.sfwmd.gov/org/ema/dbhydro/index.html). Data in DBHYDRO for STA flow and waterquality parameters typically initiate close to thestart-up date of flow-through operations in eachSTA process train. Flow data from DBHYDRO wastypically available as a daily average value for eachflow control structure into and out of each processtrain. Flow at the cell-separating levees in STA-1Wnorth and both cells in STA-5 were estimated as adistance-proportioned average of measured inflowsand outflows in those process trains. Data for TPconcentrations were available at all inflow and outflowcontrol structures of each treatment cell (often atonly one or two “representative” stations, if multiplestructures were present at inflows or outflows) as eitherweekly flow-weighted composite samples, weekly

210 J. Juston, T.A. DeBusk / Ecological Engineering 26 (2006) 206–223
Table 2Summary of seven Florida treatment wetlands used for performance comparisons with the STAs
System Description Surface area (ha) Data years System type Reference
Orlando Easterly WetlandCells 1–15
Constructed wetland forwastewater polishing
318 7 EAV-RF Black and Wise (2003)
Titusville Blue Heron Constructed wetland forwastewater polishing
106 6 EAV-RF Unpublished data (2004)
WCA-2A (1st 4 km ofeutrophicationgradient)
Natural wetland receivingagricultural runoff
4000 7 EAV-HW Walker (1995)
Boney Marsh Constructed wetland fortreatment of river water
49 8 EAV-HW Moustafa et al. (1996)
DB Environmental Replicated mesocosmexperiment at STA-1W
.0005 5 SAV Dierberg et al. (2002)
DB Environmental Replicated flow racewayexperiment at STA-1W
.0013 6 SAV-CP DeBusk et al. (2004)
DB Environmental Replicated mesocosmexperiment at STA-1W
.0002 10 SAV Unpublished data (2005)
time-averaged composite samples and/or biweeklygrab samples. We prioritized the weekly compositedata for performance calculations, but this was notavailable for all systems (Table 1).
Phosphorus removal data from seven other treat-ment wetlands within Florida were compared to theSTA data. Characteristics of these systems are sum-marized inTable 2. Three of these systems (OrlandoEasterly, WCA-2A and Boney Marsh) were investi-gated byKadlec (1994)prior to STA constructionto assess TP removal rate constants. Of these three,one was a constructed wetland for tertiary wastewa-ter treatment (Orlando Easterly), one was a historicfloodplain system converted to a constructed wetland(Boney Marsh) and the other a historic wetland withagricultural runoff inflows (WCA-2A). One other full-scale constructed wetland was assessed, which was fortertiary wastewater treatment (Titusville Blue Heron).The other three systems were mesocosm scale experi-ments related to STA optimization. Inflow, outflow andTP data for these systems were obtained either directlyfrom the operators or from online databases whenavailable.
2.2. Analysis method
Most of the analyses presented herein were con-ducted using either monthly or annual average val-ues for process train inflow and outflow parameters.Monthly average values for water inflows and out-fl ily
data from appropriate stations and averaging overmonthly durations. To calculate constituent loads andflow-weighted mean concentrations, weekly and/orbiweekly TP data were first expanded into daily timeseries. To accomplish this, values from composite TPdata were reflected back to the previous collection date,while values were interpolated between grab sampledates. Values for daily mass flow rates at STA processtrain inflow and outflow structures were calculated asfollows:
MRi = Qi × Ci
1000× A(1)
where MRi is the daily P mass flow rate (g/m2/day);Ci the daily estimate of TP concentration at inflow oroutflow control structure (�g/L); Qi the daily estimateof inflow or outflow (m3/day) andA is the wetlandsurface area (m2).
With this equation, daily mass loading rates (MLR)and mass export rates (MER) were estimated usinginflow and outflow data, respectively. Monthly orannual mean flows and mass rates were estimated bysumming daily values over the appropriate period (ndays). Flow-weighted mean concentrations were esti-mated as:
TPn =∑n
i Qi × Ci∑n
i Qi
(2)
whereTP is the flow-weighted mean TP concentration(
ows (m3/mo) were determined by combining da �g/L).
J. Juston, T.A. DeBusk / Ecological Engineering 26 (2006) 206–223 211
Mass removal efficiencies (MR%) were calculatedas:
MR% = (MLR − MER)
MLR × 100(3)
We also introduce a calculation for effective massremoval efficiency (EMR%), which adjusts the massremoval efficiency relative to the background wetlandP concentration, commonly known asC* (Kadlec andKnight, 1996). For calculation of EMR%, the effectivemass loading rate (EMLR) equation has the modifiedform:
EMLR = Qi × (Ci − C∗)
A(4)
In a similar fashion, the effective mass export rate(EMER) can also be defined. The EMR% is then cal-culated as:
EMR% = (EMLR − EMER)
EMLR × 100(5)
An adjustment forC* has become standard prac-tice for calculating wetland P removal rate constants,or K-values, under similar circumstances (Kadlec andKnight, 1996). Similarly, the EMR% provides animproved basis for comparing the P removal efficiencyof wetland systems when the outflow concentrationsapproach the lowest achievable values. For the pur-poses of this analysis, we assumed a separateC* foreach of the three STA classifications based on the low-e tflowP 3a ,r
hs offl h asc ula-t than3 lly,a 1WC 50)a omo visualc corda amed
oneS ro-
cess train), the flow data were adjusted beginning inOctober 2000 to exclude the fraction of inflows andthe total outflows that were diverted through a sec-ondary outflow structure that was added about halfwaydown the cell. Outflow P from this structure were typ-ically elevated and closely correlated to inflows andfield observations indicated preferential short-circuitflow paths towards this structure (unpublished data, DBEnvironmental, Inc.). This adjustment allowed for theP removal performance of this cell’s SAV communityto be more accurately evaluated without bias from theseunusual hydraulic effects.
2.3. Statistical analyses
Pooled STA performance data were plotted sepa-rately for the three system categories (EAV-RF, EAV-HW and SAV) as annual average outflow P versus2-year average MLR. Least squares regression analysesfit each data set to linear relationships after log trans-formation of theY-ordinate (outflow P). The slope ofeach linear regression was checked against zero usinga one-tailedt-test. We assumed the data were indepen-dent (i.e. that 2-year average MLRs adequately cap-tured the antecedent dependence of annual P on MLRand thus removed serial correlation in the data) andtested for homogeneity of variances in the regressionresiduals usingBartlett’s (1937)procedure. An analy-sis of variance (ANOVA) was constructed as outlinedin Walls (1986), and we used anF-test to ascertain ift weree ter-c se ceptv l ofP e-s
2
omm m-p hatc fera rion,d hent sa d for
st demonstrated annual flow-weighted mean ouconcentration in each. TheseC* values were 22, 1
nd 10�g/L for EAV-RF, SAV and EAV-HW systemsespectively.
Some datasets contained several missing montow and/or water quality data due to factors, suconstruction activities or adverse weather. For calcions of annual average values, up to but no more
months of missing data were allowed. Additionasmall amount of data was omitted from the STA-ell 5 outflow dataset (3 data points from over 2nd from the STA-5 inflow datasets (34 values frver 750). These data were screened based onriteria compared to the overall trend in the data rend comparison to different data collected on the say from the same and/or adjacent stations.
For the analysis of STA-1W Cell 4 as a stand-alAV cell (as opposed to part of the STA-1W west p
he slopes and intercepts of the three regressionsqual. Upon rejecting the null hypothesis for the inept values,Duncan’s (1955)multiple range test wamployed to establish differences among the interalues. All analyses employed a significance leve< 0.05 (95% probability level) to reject null hypothes.
.4. Pulse analysis
Inflow pulses into the STAs were extracted fronthly mass load and outflow TP histories for coarison on a common time scale. The definition of wonstitutes a “pulse” is arbitrary and would likely difmong researchers. We employed a screening criteefined as follows: pulse loads began in months w
he P mass load was at least 0.13 g/m2/mo and wat least two times greater than the average P loa

212 J. Juston, T.A. DeBusk / Ecological Engineering 26 (2006) 206–223
the previous 2 months. Additionally, pulse loads endedwhen the P mass load returned to antecedent levels.
2.5. Analysis limitations
The inflow–outflow, cross-sectional data analysispresented herein has several limitations that should beelucidated to provide context to our findings. First, theprocess trains are represented by variable operationalperiods ranging from 2 to 7 years and the quality ofTP data used for the analysis (weekly composites ver-sus biweekly grab samples) was not the same amongall systems (Table 1). Second, the calibration status ofreported SFWMD flow data for selected STAs repre-sents the “best available” at the time of this writing.Long-term data from most flow stations were likelyaccurate to within∼±15% (personal communicationSFWMD 2004). Third, our analytical approach didnot attempt to account for hydrologic and hydraulicdifferences between process trains, or changes in treat-ment area with changes in water depth. Variables,such as water depths, seepage flows and effectivehydraulic efficiencies may also be important variablesfor describing performance differences. Fourth, otherwater quality parameters, such as inflow P speciationand calcium concentrations (Dierberg et al., 2002) mayalso influence STA performance but are not accountedfor in this study. Finally, aside from missing data andthe selected data points that were screened, all availabledata from DBHYDRO were included in this analy-s uteo ataf n-a trolu weret
3. Results
3.1. Overview of STA operational conditions
A time history of monthly average inflow P loadsto STA-5 and STA-6 demonstrates the “pulsed” natureof STA inflows (Fig. 2). The “pulses” generally occurduring the Florida wet season (June–October), but alsooccur in response to dry season storm events and watermanagement activities (lake water releases) by theSFWMD. With the exception of the two treatment cellsin STA-6, all process trains were operated as continu-ously flooded systems in spite of the pulsed inflows.As indicated inFig. 2, STA-6 experiences periodicdry down (zero stage) events, followed by re-floodingpulses.
Table 3summarizes average inflow parameters tothe 10 process trains for the defined post-start-up dataperiods. This table delineates process trains into cate-gories of “well-performing” and “challenged” systemson the basis of long-term outflow TP concentrationshaving been below or above 30�g/L, respectively.This threshold is an approximate midpoint between thephase 1 STA performance goal (50�g/L) and the likelyphase 2 goal (10�g/L). The STA-1W west process trainhad parts of its history prescribed to both categories, asit has been subject to at least two distinct operationaland performance phases.
3.2. Outflow TP concentrations
ano esst ing”( edE ual
ading
is. While on the one hand this is a positive attribf this study, it also implies that performance d
rom months immediately following vegetation magement efforts (e.g. herbicide applications to conndesirable species) and/or construction activities
reated equally to other data in this analysis.
Fig. 2. Four-year P mass lo
Fig. 3 summarizes annual flow-weighted meutflow TP concentrations for the 10 STA proc
rains. For systems characterized as “well-performTable 3), which were typically moderately loadAV-HW and SAV-containing process trains, ann
histories for STA-5 and STA-6.

J. Juston, T.A. DeBusk / Ecological Engineering 26 (2006) 206–223 213
Table 3Average operating conditions for the post-start-up data in four operational STA process trains
Process train Type Data years HLR (cm/day) P in (�g/L) P out (�g/L) MLR (g/m2/year) MR%
Well-performingSTA-1W west 1997–1999 EAV-RF/SAV 2 3.7 73 15 1.0 85STA-2 Cell 1 EAV-HW 3 2.4 74 12 0.6 87STA-2 Cell 2 EAV-HW 3 4.3 90 28 1.4 71STA-2 Cell 3 SAV 3 5.0 82 15 1.5 83STA-6 Cell 3 EAV-HW 4 6.8 69 18 1.7 82STA-6 Cell 5 EAV-HW 4 3.1 70 17 0.8 82
ChallengedSTA-1W east EAV-RF 7 2.4 133 54 1.2 65STA-1W west 1999–2004 EAV-RF/SAV 5 4.9 139 87 2.5 64STA-1W north EAV-RF/SAV 2 6.0 165 77 3.6 49STA-5 Cell 1 EAV-RF/SAV 3 3.5 177 91 2.3 46STA-5 Cell 2 EAV-RF 3 2.4 234 133 2.1 55
outflow P concentrations ranged between 11 and38�g/L (Fig. 3). By contrast, the “challenged” systemsprovided annual outflow P concentrations between33 and 170�g/L and consisted of all EAV-RF sys-tems as well as the more highly loaded SAV systems(Table 3). There were 16 occurrences of annual flow-weighted mean outflow TP concentrations between 10and 20�g/L in this pooled set of 39 data years. Tenof these 16 occurrences were in EAV-HW systems andsix were in SAV systems. The lowest observed annualoutflow P concentration was 10�g/L in STA-2 Cell 1(an EAV-HW) for the period of May 2004–April 2005.
The monthly TP data from the well-performing STAsystems also demonstrated a remarkable consistencyin range.Fig. 4 depicts a frequency distribution ofall post-start-up monthly average outflow concentra-
tions (n = 209) from the six well-performing processtrains and the five challenged systems (n = 248). Ofthe 16 data points that comprise the “>24�g/L” cat-egory in the well-performing systems (Fig. 4a), nineof them occurred within 3 months after dry down/re-flood events in the STA-6 process trains and four ofthem occurred in STA-2 within 3 months of two hurri-canes (Frances and Jeanne) in September 2004. Whiledry down/re-flood cycles and the STA responses to hur-ricane events are not the prime focus of this manuscript,both topics will be discussed in later sections. If these13 data months connected to re-flood and hurricaneevents are omitted, the resulting distribution is a skewedbell curve with an arithmetic average of 15�g/L (95%confidence interval = 14–16�g/L). Furthermore, 176of 196 monthly flow-weighted mean outflow P concen-
tflow P
Fig. 3. Annual flow-weighted mean ou concentrations from 10 STA process trains.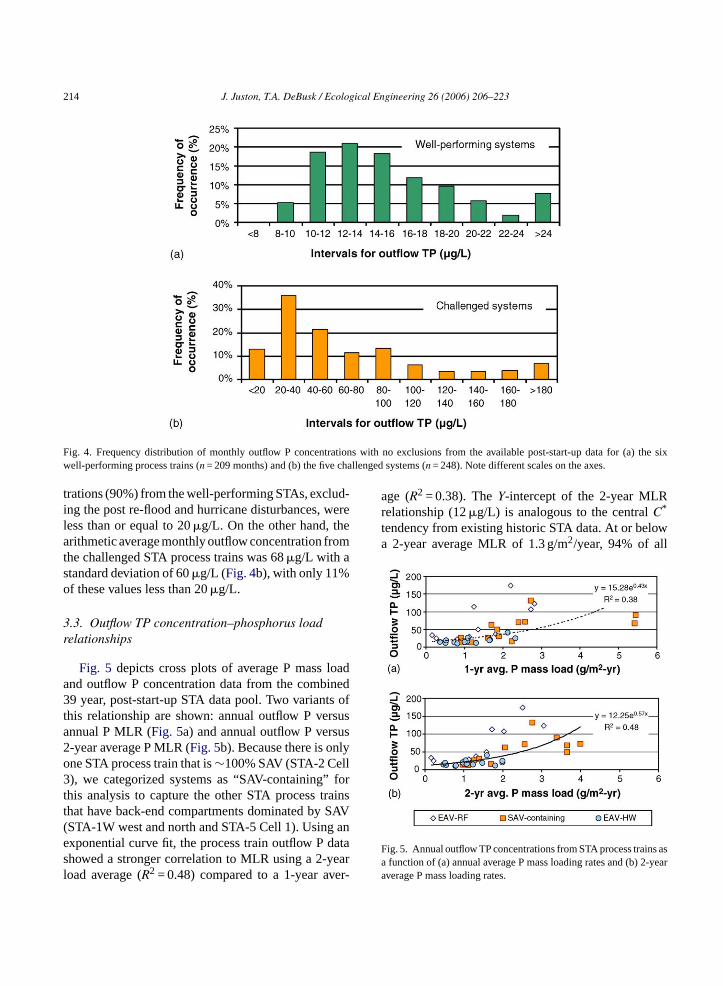
214 J. Juston, T.A. DeBusk / Ecological Engineering 26 (2006) 206–223
Fig. 4. Frequency distribution of monthly outflow P concentrations with no exclusions from the available post-start-up data for (a) the sixwell-performing process trains (n = 209 months) and (b) the five challenged systems (n = 248). Note different scales on the axes.
trations (90%) from the well-performing STAs, exclud-ing the post re-flood and hurricane disturbances, wereless than or equal to 20�g/L. On the other hand, thearithmetic average monthly outflow concentration fromthe challenged STA process trains was 68�g/L with astandard deviation of 60�g/L (Fig. 4b), with only 11%of these values less than 20�g/L.
3.3. Outflow TP concentration–phosphorus loadrelationships
Fig. 5 depicts cross plots of average P mass loadand outflow P concentration data from the combined39 year, post-start-up STA data pool. Two variants ofthis relationship are shown: annual outflow P versusannual P MLR (Fig. 5a) and annual outflow P versus2-year average P MLR (Fig. 5b). Because there is onlyone STA process train that is∼100% SAV (STA-2 Cell3), we categorized systems as “SAV-containing” forthis analysis to capture the other STA process trainsthat have back-end compartments dominated by SAV(STA-1W west and north and STA-5 Cell 1). Using anexponential curve fit, the process train outflow P datashowed a stronger correlation to MLR using a 2-yearload average (R2 = 0.48) compared to a 1-year aver-
age (R2 = 0.38). TheY-intercept of the 2-year MLRrelationship (12�g/L) is analogous to the centralC*
tendency from existing historic STA data. At or belowa 2-year average MLR of 1.3 g/m2/year, 94% of all
Fig. 5. Annual outflow TP concentrations from STA process trains asa function of (a) annual average P mass loading rates and (b) 2-yearaverage P mass loading rates.

J. Juston, T.A. DeBusk / Ecological Engineering 26 (2006) 206–223 215
annual outflow P concentrations (n = 18) were lessthan 30�g/L. If the process train dataset is limited tojust SAV-containing and EAV-HW systems, then 92%(n = 13) of systems with 2-year P loading histories ator below 1.3 g/m2/year achieved annual outflow P val-ues less than 20�g/L. For STA flow paths we thereforeadvocate a long-term MLR history of 1.3 g/m2/year asa guideline for achieving “well-performing” status.
The above analysis summarizes the historic perfor-mance of STA process trains. However, to gain greaterinsight into STA performance for future design andoptimization efforts, we performed a similar analysisfocused on the performance of specific cells within STA
process trains dominated by EAV-RF, EAV-HW andSAV systems. To this end, we separately analyzed theEAV front-end cells and SAV back-end cells of STA-1W west and north and STA-5 Cell 1. We excludeddata from STA-1W Cell 5a in this analysis because ofthe extremely poor condition of the EAV communityin this cell (unpublished data, DB Environmental).
Fig. 6shows separate outflow P versus 2-year aver-age P MLR relations for EAV-RF, SAV and EAV-HWsystems. Each data set was fit to an exponential rela-tionship. The relations are shown in terms of 2-yearaverage MLRs as opposed to annual MLRs since coef-ficient of determination (R2) were higher in EAV and
Ft
ig. 6. Annual average outflow TP vs. 2-year average P mass loadinrains and (c) EAV-HW systems.
g rate for (a) EAV-RF cells and process trains, (b) SAV cells and process

216 J. Juston, T.A. DeBusk / Ecological Engineering 26 (2006) 206–223
SAV data sets using 2-year average MLRs. However,the EAV-HW system data demonstrated a better fit toannual MLR compared to 2-year averages (R2 equal to0.43 compared to 0.16), but it is still shown using 2-yearaverage MLRs in the figure for consistency. Data fromseven other non-STA treatment wetlands (Table 2), alsocategorized as EAV-RF, SAV and EAV-HW systems,were compared to the STA performance data. While nostatistics were calculated with the non-STA data, theyprovide visual corroboration of the trends observed inthe STA data (Fig. 6) and suggest that like-systemswithin these categorizations performed similarly. It isparticularly interesting to note the EAV-HW systemsexhibit performance similar to the WCA-2A and BoneyMarsh wetlands (Fig. 6c), since data from WCA-2Aprovided an important basis for the phase 1 STA design(Walker, 1995).
Using only STA data, we tested the SAV, EAV-HW and EAV-RF data sets and regression relationshipsagainst one another for significant differences. TheY-ordinate (P concentration) was log transformed toyield linear regressions between MLR and ln(P). Theslopes of each transformed regression were checkedagainst zero (Walls, 1986). Single-tailedt-tests indi-cated a slope significantly greater than zero for EAV-RFand SAV data (P < 0.05), but not for the EAV-HWdata (P > 0.05). It should be noted that the slope ofthe regression for the transformed EAV-HW data wasnot significantly greater than zero against 2-year aver-age MLRs, but was significantly greater than zeroa ion-s y a
result of five transient outflow TP events correspondingto re-flooding in STA-6 after dry down (affecting fourdata years) and hurricane events in STA-2 Cell 2 (affect-ing one data year). These transient effects were dilutedin the relationships against 2-year average MLRs, butwere still prominent against annual averages. Whenthese disturbance-related data years were removed, theEAV-HW relationship with 1-year average MLR alsoshowed no significant slope.
An ANOVA F-test demonstrated that significant dif-ferences existed between theY-intercepts (C* values)of the three data sets. Duncan’s multiple range testindicated the observed differences were betweenC*
values for EAV-RF and SAV systems and for EAV-RF and EAV-HW systems. No significant differenceswere identified for the slopes of the three regressionsor between theC* (Y-intercept) of SAV and EAV-HWsystems.
To exemplify the challenge of designing STAs forachieving a specific outflow P criterion below 20�g/L,Fig. 7focuses on outflow P versus mass load relationsfor a subset of EAV and SAV data. These data repre-sent the best long-term performance intervals (close toor longer than 2-years) demonstrated for each systemand avoid intervals influenced by dry down/re-floodingand hurricane events. Note that the data intervals do notnecessarily overlap between different systems. Thesedata suggest a scatter of outflow TP values (all below17�g/L) with no significant relationship between MLRand TP for either system category (P > 0.05 for HW,n ont er-
perio .
gainst 1-year average MLRs. The significant relathip against 1-year EAV-HW data was principall
Fig. 7. Average outflow P vs. MLR for the best long-term
ot calculable for SAV). It is interesting to focushe performance of the two STA-6 cells. The av
ds of record for EAV-HW and moderately loaded SAV systems

J. Juston, T.A. DeBusk / Ecological Engineering 26 (2006) 206–223 217
Fig. 8. “Pulse” delineations in the three STA-2 treatment cells that were used to analyze typical P responses to pulsed inflows.
age outflow P concentration from STA-6 Cell 3 over a28 month period was virtually indistinguishable fromthat of STA-6 Cell 5 (both at 14�g/L) in spite of aprevalence of CP vegetation in the back half of Cell5 (unpublished data, DB Environmental) and, mostsignificantly, a nearly three-fold difference in mass Ploading.
Similar P–MLR relationships were investigated forannual SAV and HW data (as opposed to best long-termdata as discussed above). For this analysis, two of thethree re-flood-influenced data years from the two STA-6 cells were screened, since these data years showeda dramatic spiked P response upon re-flooding (dis-cussed in the next section). For all data years loaded ator below∼2.0 g/m2/year in the remaining data pools(n = 5 for SAV andn = 9 for EAV-HW), no significantrelationships (P > 0.05) were identified in the slopes ofP–MLR relationships using either 1 or 2-year averageMLRs, thus suggesting no evidence of association ofMLR with TP concentrations in this range.
3.4. Pulse loading analysis
Fig. 8depicts pulse delineations for the three STA-2cells based on monthly MLR data using our establishedcriteria for defining a “pulse”. Four pulses each wereidentified from the Cells 2 and 3 time series (#1–4 in
Fig. 8) and two were identified from the Cell 1 series(#3 and 4 inFig. 8). In a similar fashion, pulses weredefined from the other “well-performing” process traindatasets (Table 3). As was mentioned above, the well-performing systems generally consisted of moderatelyloaded SAV and EAV-HW systems. In total, 22 pulseswere identified from the six well-performing systems(Table 4). Six pulses from STA-6 Cells 3 and 5 wereassociated with re-flood events following dry down(zero stage) conditions, while the remaining 16 pulseswere associated with continuously flooded conditionsin the wetlands. The STA-6 re-flood pulses were ana-lyzed separately.
Fig. 9a depicts the 16 pulses associated with con-tinuously flooded STA flow paths (omitting the STA-6re-flood pulses) aligned and plotted on the same rela-tive time scale. The pulses were aligned such that theyall started on the same month, labeled month “1” on thex-axis (Fig. 9a). Two atypically large pulses occurredin STA-2 Cells 2 and 3 (one each) due to two hurricanesin September 2004. Excluding these two hurricane-related pulses, the “average pulse” from the remaining14 events exhibited an arithmetic mean peak of approx-imately 0.31 g/m2/mo (3.7 g/m2/year, expressed on anannual basis). The hurricane pulses in STA-2 were actu-ally among the highest monthly P mass loading ratesobserved in any of the STA process trains and were
Table 4Summary of “pulses” defined from STA process train loading histories
Pe s)
S 0.1S 0.30S 0.22S 0.30S 0.15S 0.22
# Pulses Re-flood pulses
TA-1W Cell 4 (1997–1999) 2 0TA-2, Cell 1 2 0TA-2, Cell 2 4 0TA-2, Cell 3 4 0TA-6, Cell 3 6 3TA-6, Cell 5 4 3
ak monthly loads (g P/m2/mo) Approximate duration (# month
8–0.22 2–0.31 2–0.86 1–3–0.88 1–4–0.84 1–4–0.42 1–4

218 J. Juston, T.A. DeBusk / Ecological Engineering 26 (2006) 206–223
Fig. 9. (a) Sixteen P mass load pulses from the well-performing STA process trains, aligned on the same relative time scale. (b) Outflow TPresponse from the same 16 pulses (data excludes responses associated with re-flooding in STA-6). (c) Outflow TP response in STA-6 followingsix pulses associated with re-flood events after dry down. Due to dry conditions, no water quality data were available for the time periodsimmediately prior to the re-flood pulses.
clearly anomalous for the well-performing systems thatwere generally managed for lower P loads (Fig. 9a).Pulses typically lasted between 2 and 3 months and onaverage represented an approximate four-fold increasein MLR compared to the MLR values of the previous3 months in these systems.
Fig. 9b shows outflow TP from the same 16pulses, aligned and plotted in the same fashion asthe inflow mass loads. The outflow P concentrations
from these well-performing STA process trains exhib-ited little or no response to inflowing mass loadpulses. In general, outflow P concentrations remainedbelow 20�g/L for beyond 4 months after pulse ini-tiation. Only three of these 16 pulses demonstrateda notable response, and for two of these the effectswere slight (24 and 26�g/L peak monthly). The EAV-dominated STA-2 Cell 2 demonstrated a substantialpulse response to the hurricane inflow loads (peak

J. Juston, T.A. DeBusk / Ecological Engineering 26 (2006) 206–223 219
Fig. 10. Annual effective mass removal efficiencies (EMR%) forEAV-RF, SAV and EAV-HW treatment cells.
monthlyP = 76�g/L). Interestingly, the adjacent SAV-dominated STA-2 Cell 3 demonstrated little response(peak monthlyP = 24�g/L) to the same event, in spiteof receiving a similar MLR pulse (Fig. 9b). Excludingthe two hurricane pulses, the arithmetic average peakoutflow P concentration from these 14 pulse eventswas 16�g/L (occurring in month “2”), approximately1�g/L greater than the average outflow P of the previ-ous 2 months.
The six pulses in STA-6 that were associated withdry down/re-flood events elicited a different responsefrom those of the continuously flooded STA flow paths.Fig. 9c shows a distinct but short-term spike in out-flow P common to these re-flooded systems. It wasanticipated during STA design that periodic dryingand flooding might induce release of P stored in thesediment or vegetation compartments, thereby elevat-ing outflow P concentrations (Newman and Pietro,2001; Walker, 1995). These data appear to confirm thishypothesis.
3.5. Mass removal efficiencies and comparisonwith other systems
Fig. 10 depicts the relationship between annualP mass loading and effective mass removal effi-ciency from the post-start-up STA data pool (Table 3)for EAV-RF, SAV and EAV-HW systems. SAV andEAV-HW systems maintained consistent and highE orb sd R%t ilarra
4. Discussion
We grouped the P removal performance of the10 STA process trains into two categories, well-performing and challenged systems (Fig. 3), andshowed that the well-performing STAs were comprisedof moderately loaded SAV-containing and EAV-HWsystems. In general, the well-performing STA processtrains exhibited three desirable attributes:
1. A strong tendency toward outflow P concentra-tions lower than approximately 20�g/L on both anannual (Fig. 5) and monthly (Fig. 4) basis whenloaded moderately and continuously flooded.
2. A consistent ability to “absorb” small-to-moderatepulsed P loads with virtually no impact on low andstable outflow TP concentrations (Fig. 9).
3. Consistent mass removal efficiencies on an annualbasis (Fig. 10).
To date, these well-performing systems have out-performed the original phase 1 performance expecta-tions for the STAs (Walker, 1995). Our analysis of STAperformance data demonstrates that 94% of STA pro-cess trains loaded at or below∼1.3 g/m2/year exhibitedannual outflow P concentrations less than∼30�g/L.A subset of STA data that consisted of SAV and con-tinuously flooded EAV-HW cells loaded at or below∼2 g/m2/year produced outflow P concentrations in therange of 10–20�g/L. Furthermore, most MLR–P rela-t sing2 flowP LRs.T his-t
;Q ica-t m,w asisf duei ast n thec ionsf ng-t ort e“ Fs
MR% (all values >85%) for annual MLRs atelow∼2 g/m2/year. Comparatively, EAV-RF systememonstrated an erratic and generally lower EM
hroughout the range of MLRs. We observed simelationships when the data are plotted with theX-axiss EMLR as opposed to MLR.
ions in this analysis were shown to be stronger u-year average MLRs as a predictor for annual out, as opposed to current-year annual average Mhis suggests the importance of longer-term P load
ories on recent outflow P concentrations.Earlier STA performance estimates (Walker, 1995
ian, 1997) were based on analysis of the eutrophion gradient in the “natural” WCA-2 wetland systehich seems to have provided a conservative b
or the constructed STA wetlands. This may ben part to improved hydraulic efficiency as wellargeted and managed vegetation communities ionstructed STAs. Indeed, outflow P concentratrom the well-performing STAs have approached loerm objectives within footprints originally sized fhe phase 1 target of 50�g/L. On the other hand, thchallenged” STAs, which consist of either EAV-Rystems or SAV systems loaded above∼2 g/m2/year,

220 J. Juston, T.A. DeBusk / Ecological Engineering 26 (2006) 206–223
have exhibited erratic and elevated outflow P concen-trations (Fig. 5), as well as generally reduced P removalefficiencies (Fig. 10).
Other studies of STA vegetation and P removalpotential have identified differences between EAV andSAV systems (DB Environmental Inc., 2002; Dierberget al., 2002; Kadlec and Walker, 2003), but the anal-ysis contained herein suggests a meaningful sub-categorization of EAV systems according to prior landuse. EAV systems developed on historic wetland sitesproduced significantly lower outflow P concentrations(Fig. 6) and had higher and more consistent P massremoval efficiencies (Fig. 10) than EAV systems con-structed on recently farmed soils. Further research intoidentifying biogeochemical characteristics of these twocommunities pertinent to wetland P cycling will beimportant for future STA optimization efforts.
Ultimately, it seems possible that the performancein EAV-RF systems over time will converge towardsthe EAV-HW systems. However, neither the processesnor the temporal trajectory of this “ageing” process areunderstood at this time. Clearly, these issues are alsoof importance to STA optimization and long-term per-formance and should be the subject of future research.
We have suggested two P mass load guidelinesfor the STAs in this manuscript, one (∼1.3 g/m2/year)based on all STA process train data and the other(∼2 g/m2/year) based on cell-by-cell data of SAV andcontinuously flooded HW systems. We recommend∼1.3 g/m2/year as a P loading guideline for STA pro-c mu-n ngot
rityt s atD ana if-f limitf urel nitys ugha andW thisr ndsaa sedi as a
conservative basis for STA design. Furthermore, theone gram rule is vague in its reference to achieving“low P effluent concentrations” and does not providea useful discussion of achieving outflow TP concen-trations any lower than∼40�g/L. By contrast, theanalysis of STA performance data presented hereinis specific to the challenges faced by the managersof these large south Florida treatment wetlands. Wecan state that the historic data suggest that long-termaverage P load of at or below∼1.3 g/m2/year is highlylikely to yield STA outflow TP concentrations less thanapproximately 30�g/L, irrespective of vegetation type.
The results of our analysis provide insights intothe limits of P removal in the STA systems.Kadlec(1999)suggested that outflow P concentrations showan “S” curve response to increasing P loadings. Here,we employed an exponential curve fit to the STA data(Fig. 6), which in principle corresponds to the risinglimb of this “S” response. Over a wide range of Ploads, the exponents in the exponential relationshipswere shown to be significantly greater than zero forEAV-RF and SAV systems, thus suggesting that a rela-tionship between MLR and P indeed exists in thesedata. However, when the data were screened for onlythose systems producing outflow P less than 20�g/L(SAV and continuously flooded EAV-HW data with Ploadings <∼2 g/m2/year), no significant relationshipswere identified in either the SAV or EAV-HW data fortargeting specific outflow P concentrations (Fig. 7).According to Kadlec’s S-curve model (1999), theser idei re1 w Pl ed1 Va en-d ere1 ew data.I nlyt riorl ual-i s bee ingai
edv rate
ess trains independent of specific vegetative comities, thus providing a high likelihood of achieviutflow P concentrations less than∼30�g/L (and less
han∼20�g/L for HW and SAV systems).Our mass loading guidelines bear some simila
o the “one gram rule” proposed by researcheruke University (Richardson and Qian, 1999; Qind Richardson, 1997), but there also are important d
erences. The one gram rule suggested an upperor P loading in wetland systems in order to insong-term storage of P, maintenance of commutructure, and low outflow P concentrations. Thronalysis of the North American Wetland DatabaseCA-2 data, these investigators suggested that
ule applied to both natural and constructed wetland inferred its relevance to STA design (Richardsonnd Qian, 1999). WCA-2 has already been discus
n the context of the analysis presented herein
egions of no influence between TP and MLR provnsight to the systems’C* characteristics. There we6 data years during which STAs achieved outflo
evels less than 20�g/L and one data year that achiev0�g/L (Fig. 3). The exponential curve fits to SAnd EAV-HW historic data indicated the central tencies forC* values in these respective systems w6 and 12�g/L (Fig. 6), but no significant differencas identified between these due to scatter in the
t is important to note that our analysis explored owo potential controlling variables (P loading and pand use). We recommend that other inflow water qty (e.g. calcium), soil and site-specific parameterxplored in future analyses in the hopes of identifystronger design basis for targeting specificP-values
n the 10–20�g/L range.Finally, the well-performing STA systems exhibit
irtually no dynamic response to small-to-mode

J. Juston, T.A. DeBusk / Ecological Engineering 26 (2006) 206–223 221
inflow pulses. Dynamic modeling has often been advo-cated for prediction of outflow concentrations frompulse-loaded wetland systems, both within the contextof Everglades restoration (Kadlec and Walker, 2003;HydroQual Inc., 1997; DB Environmental Inc., 2000)and for other treatment wetlands (Werner and Kadlec,2000; Wang and Mitsch, 2000). Dynamic models ofteninclude representation of compartmentalized storageof nutrients, inter-compartment fluxes (including nutri-ent removal and recycling), as well as hydraulic flowand mixing. Our analysis of STA performance datasuggests that the 1–2 year history of P loading tothe system may be, in and of itself, a master factorfor defining the expected range of outflow TP levels.The well-performing STA’s demonstrated an ability to“absorb” small-to-moderate P pulses with little or noeffect on outflow P concentrations. These data supporta conceptual model of a saturation type mechanismin the internal P storage compartments of wetlands,such that P inputs less than the saturation limit canbe almost entirely “absorbed” and stored, whereas Pinputs greater than this limit would saturate the systemand result in elevated outflow P concentrations (Loweand Keenan, 1997).
Our results suggest that future STA optimizationefforts could benefit from a dynamic model that specif-ically addresses this absorption-saturation response.Storage saturation was not an explicitly modeled pro-cess in any of the dynamic models mentioned above.Key issues in such a model would include not only thel andc veryt ms,s dsh
4
owh tiono edi 6)r caleS heseso ash ther ose
areas were managed for EAV-RF systems and 47% forSAV systems (Goforth, 2005). Two new STAs haverecently come online (STA 3/4 in 2003 and STA-1Ein 2004) with an additional 8740 ha of surface area,all of which had been recently farmed. Additionally,there are expansions of existing STAs being discussedthat could add many more thousands of hectares tothe overall STA footprints (Goforth, 2005), and mostof these lands would also be characterized as recentlyfarmed. Thus, as the net STA footprint expands,the EAV-HW performance data, which to date haveprovided 10 of the 16 occurrences of annual outflow Pbetween 10 and 20�g/L and the single lowest outflowP-value of 10�g/L, may represent only a smallfraction (perhaps 10–15%) of the combined STA area,as the large majority of the systems will have beenconstructed on previously farmed lands. Therefore,we recommend that the influence of EAV-HW systemdata be weighted accordingly in model calibrations,or perhaps utilized solely for performance predictionsof actual EAV-HW systems.
For the challenged systems, our suggested massloading guideline (∼1.3 g/m2/year) could serve as auseful starting place for improving performance beforetaking further optimization steps. Reductions in massloads to this level could be realized with various tech-niques, including shared flows and P loads with thenewly constructed STAs, better distribution of flowsand P loads within STAs, and/or construction of addi-tional STAs, if appropriate. Since annual outflow Pf cor-r tedt ver-l s andb tra-t
d atl -o thisP ld bep thatt thed heset fileso ntra-t agesa spe-c
oad-related transition between a well-performinghallenged system, but also the duration of the recoime (“de-saturation”) of already overloaded systeuch as STA-1W and STA-5, after high inflow loaave been curtailed.
.1. Implications for improving STA performance
The results of this study have implications for historic STA data is treated for design and optimizaf future STAs. Data from the four STAs analyz
n this study (STA-1W, STA-2, STA-5 and STA-epresent the best available information on full-sTA performance. The combined surface area of tystems is approximately 7300 ha (Goforth, 2005)f which approximately 28% of the land area wistoric wetlands and 72% recently farmed. Ofecently farmed fraction, approximately 53% of th
rom STA process trains have been shown to beelated with 2-year P MLR histories, it should be nohat more than 1 year may be required for these ooaded systems to respond to the decreased loadegin producing more desirable outflow concen
ions.For the existing process trains already operate
oading rates at or below 1.3 g/m2/year, we highly recmmend that they be managed to remain withinloading range. Additionally, assessments shou
erformed internal to these wetlands to confirmhis P loading range is indeed sustainable overecades-long operational period proposed for t
reatment wetlands. For example, longitudinal prof water column, vegetation and sediment P conce
ions could help determine whether internal P storre stable, or if they become saturated over time, eially near the inflow region of the flow path.

222 J. Juston, T.A. DeBusk / Ecological Engineering 26 (2006) 206–223
Finally, the historical data provides little evidencefor expectation of further reductions in outflow TP con-centrations from the well-performing STAs with opti-mization of P mass loading rates and/or manipulation ofvegetative communities. As of yet, there is no evidencein the historical STA data to suggest that these param-eters have adequate influence at mass loads at or below∼1.3 g P/m2/year to target and achieve a specificallydefined outflow criterion, whether that be 10, 15�g/L,or any other TP value in that range. Based on the supe-rior performance of EAV-HW versus EAV-RF systems,it may be that long time periods, perhaps decades, arerequired for the appropriate biogeochemical conditionsto develop that allow for ultra-low outflow TP valuesto be achieved.
4.2. Implications for other P removal wetlandsystems
The Everglades STAs are unique due to theirlarge size and low target outflow P concentrations(∼10�g/L). In fact, many other P removal treatmentwetlands have inflow P concentrations 1–2 orders ofmagnitude greater than the STAs. However, interest inprotecting critical freshwater marshes and lakes con-tinue to escalate worldwide, so the outflow P relationsdiscussed in this paper ultimately may have relevanceoutside the south Florida region. The comparison ofdata from seven other Florida wetland systems to theS usec pre-d tew-a
A
talP a-t ar-t pt,a ony-m acef asm ier-b rtso ridaW on-
sible for design, management and optimization of theSTAs.
References
Bartlett, M.S., 1937. Properties of sufficiency and statistical tests.Proc. R. Soc. Lond. Ser. A 160, 268–284.
Black, C.A., Wise, W.R., 2003. Evaluation of past and potential phos-phorus uptake at the Orlando Easterly Wetland. Ecol. Eng. 21(4–5), 277–290.
Burns and McDonnell, 2003. Final Report: Everglades ProtectionArea Tributary Basins, Conceptual Plan for Achieving Long-termWater Quality Goals. Prepared for South Florida Water Manage-ment District, West Palm Beach, FL.
Chimney, M.J., Nungesser, M., Newman, J., Pietro, K., Germain,G., Lynch, T., Goforth, G., Moustafa, M.Z., 2000. Chapter 6:Stormwater Treatment Areas – Status of Research and Monitor-ing to Optimize Effectiveness of Nutrient Removal and AnnualReport on Operational Compliance. Everglades ConsolidatedReport, South Florida Water Management District, West PalmBeach, FL.
Chimney, M.J., Goforth, G., 2001. Environmental impacts to theEverglades ecosystem: a historical perspective and restorationstrategies. Water Sci. Technol. 44 (11–12), 93–100.
DB Environmental Inc. (DBE), 2000. A Demonstration of the Sub-merged Aquatic Vegetation/Limerock Treatment System Tech-nology for Removing Phosphorus from Everglades AgriculturalDrainage Waters – Follow-on Study, STA-1W Tracer StudyReport. Report to the South Florida Water Management District,West Palm Beach, FL, April 19.
DB Environmental Inc., 2002. Submerged Aquatic Vegeta-tion/Limerock Treatment System Technology for RemovingPhosphorus from Everglades Agricultural Area Waters Follow-on Study – Final Report. Prepared for the South Florida Water
ron-
D ney,rus
yton-
D .J.,tmentoff:409–
D B.,pho-treat-
D s
G Ever-2.
G rac-ater
TA data (Fig. 6) suggests that antecedent landould also be an important factor for performanceictions in other treatment wetlands used for waster polishing or stormwater treatment.
cknowledgments
The Everglades Agricultural Area Environmenrotection District provided funding for this investig
ion. The authors wish to thank Dr. Ed Lowe for a picularly thought-provoking review of this manuscris well as the useful comments of a second anous reviewer. We also wish to thank Kevin Gr
or his useful reviews of multiple drafts, as welleaningful comments provided by Dr. Forrest Derg. Finally, we wish to acknowledge the effof the engineers and scientists at the South Floater Management District who are chiefly resp
Management District and the Florida Department of Envimental Protection, Contract No. C-E10660.
eBusk, T.A., Grace, K.A., Dierberg, F.E., Jackson, S.D., ChimM.J., Gu, B., 2004. An investigation of the limits of phosphoremoval in wetlands: a mesocosm study of a shallow periphdominated treatment system. Ecol. Eng. 23 (1), 1–14.
ierberg, F.E., DeBusk, T.A., Jackson, S.D., Chimney, MPietro, K., 2002. Submerged aquatic vegetation-based treawetlands for removing phosphorus from agricultural runresponse to hydraulic and nutrient loading. Water Res. 36, 11422.
ierberg, F.E., Juston, J.M., DeBusk, T.A., Pietro, K., Gu,2005. Relationships between hydraulic efficiency and phosrus removal in a submersed aquatic vegetation-dominatedment wetland. Ecol. Eng. 25 (1), 9–23.
uncan, D.B., 1955. Multiple range and multipleF tests. Biometric11, 1–42.
oforth, G., 2001. Surmounting the engineering challenges ofglades restoration. Water Sci. Technol. 44 (11–12), 295–30
oforth, G., 2005. Summary of STA Vegetation Management Ptices. Technical Report prepared for the South Florida WManagement District, West Palm Beach, FL.

J. Juston, T.A. DeBusk / Ecological Engineering 26 (2006) 206–223 223
HydroQual Inc., 1997. SFWMD Wetlands Model: Calibration ofthe Coupled Periphyton/Vegetation Module to the ENR. ProjectNumber: SFWD0106. Report prepared for South Florida WaterManagement District, West Palm Beach, FL.
Jorge, J., Newman, J.M., Chimney, M.J., Goforth, G., Bechtel, T.,Germain, G., Nungesser, M.K., Rumbold, D., Lopez, J., Fink,L., Gu, B., Bearzotti, R., Campbell, D., Combs, C., Pietro, K.,Iricanin, N., Meeker, R., 2002. Chapter 4: Stormwater Treat-ment Areas and Advanced Treatment Technologies. EvergladesConsolidated Report, South Florida Water Management District,West Palm Beach, FL.
Kadlec, R.H., 1994. Phosphorus uptake in Florida marshes. WaterSci. Technol. 30 (8), 225–234.
Kadlec, R.H., 1999. The limits of phosphorus removal in wetlands.Wetlands Ecol. Manage. 7, 165–175.
Kadlec, R.H., Knight, R.L., 1996. Treatment Wetlands. Lewis Pub-lishers, CRC Press, Boca Raton, FL.
Kadlec, R.H., Walker, W.W., 2003. Dynamic STA design model. In:Joint Conference on the Science and Restoration of the GreaterEverglades and Florida Bay Ecosystem, Palm Harbor, Florida,April.
Lowe, E.F., Keenan, L.W., 1997. Managing phosphorus-based, cul-tural eutrophication in wetlands: a conceptual approach. Ecol.Eng. 9, 109–118.
Moustafa, M.Z., Chimney, M.J., Fontaine, T.D., Shih, G., Davis,S., 1996. The response of a freshwater wetland to long-term“low level” nutrient loads – marsh efficiency. Ecol. Eng. 7, 15–33.
Newman, J.M., Lynch, T., 2001. The Everglades Nutrient RemovalProject test cells: STA optimization – status of the research at thenorth site. Water Sci. Technol. 44 (11–12), 117–122.
Newman, J.M., Goforth, G., Chimney, M.J., Jorge, J., Bechtel, T.,Germain, G., Nungesser, M.K., Pathak, C., Rumbold, D., Lopez,
J., Fink, L., Gu, B., Cayse, K., Bearzotti, R., Campbell, D.,Combs, C., Pietro, K., Iricanin, N., Meeker, R., West, G., Larson,N., 2003. Chapter 4: Stormwater Treatment Technologies. Ever-glades Consolidated Report, South Florida Water ManagementDistrict, West Palm Beach, FL.
Newman, S., Pietro, K., 2001. Phosphorus storage and release inresponse to flooding: implications for Everglades stormwatertreatment areas. Ecol. Eng. 18, 22–38.
Nungesser, M., Newman, J.M., Combs, C., Lynch, T., Chimney,M.J., Meeker, R., 2001. Chapter 6: Optimization Research for theStormwater Treatment Areas. Everglades Consolidated Report,South Florida Water Management District, West Palm Beach,FL.
Qian, S.S., 1997. An illustration of model structure identification. J.Am. Water Res. Assoc. 33 (4), 811–824.
Qian, S.S., Richardson, C.J., 1997. Estimating the long-term phos-phorus accretion rate in the Everglades: a Bayesian approachwith risk assessment. Water Resour. Res. 33 (7), 1681–1688.
Richardson, C.J., Qian, S.S., 1999. Long-term phosphorus assimila-tive capacity in freshwater wetlands: a new paradigm for sustain-ing ecosystem structure and function. Environ. Sci. Technol. 33(10), 1545–1551.
Walls, F.J., 1986. Statistical Data Analysis Handbook. McGraw-Hill,NY.
Wang, N., Mitsch, W.J., 2000. A detailed ecosystem model of phos-phorus dynamics in created riparian systems. Ecol. Model. 126,101–130.
Walker, W.W., 1995. Design basis for Everglades stormwater treat-ment areas. Water Resour. Bull. 31 (4), 671–685.
Werner, T.M., Kadlec, R.H., 2000. Stochastic simulation of partially-mixed, event-driven treatment wetlands. Ecol. Eng. 14, 253–267.
Copyright © 2022 FDOKUMEN