
identifying organisational and behavioural factors - Unisa ...

ORIGINAL PAPER
Phonotactic response of female crickets on the Kramer treadmill:methodology, sensory and behavioural implications
L. Verburgt Æ J. W. H. Ferguson Æ T. Weber
Received: 14 November 2006 / Revised: 25 October 2007 / Accepted: 10 November 2007 / Published online: 30 November 2007
� Springer-Verlag 2007
Abstract Since population-level variation in female
mating preferences can shape intraspecific communication
systems within the context of sexual selection it is essential
to quantify these preferences and their sources of variation.
We calculated individual female response functions for
four male calling song traits in the field cricket Gryllus
bimaculatus, by performing untethered phonotaxis mea-
surements on a spherical locomotor compensator (Kramer
treadmill). Firstly, we quantify the population-level sources
of phonotactic variation and correct for factors that
adversely affect this measurement. Secondly, we develop
methodology for the characterisation of individual female
phonotactic response functions suitable for population-
level analyses and demonstrate the applicability of our
method with respect to recent literature on Orthopteran
acoustic communication. Phonotaxis towards a preferred
stimulus on different occasions is highly repeatable, with
lower repeatabilities away from the most preferred signal
traits. For certain male signal traits, female preference and
selectivity are highly repeatable. Although phonotactic
response magnitude deteriorated with age, preference
functions of females remained the same during their life-
times. Finally, the limitations of measuring phonotaxis
using a spherical locomotor compensator are described and
discussed with respect to the estimation of the selectivity of
female response.
Keywords Female preference � Phonotaxis �Phonotactic asymmetry � Selectivity � Response function
Abbreviations
B and B0 Female preference
BatD Batschelet deviation
BW Bandwidth
C and C0 Female selectivity
CosV ‘‘Sound directed component’’
or ‘‘vector score’’
DC Duty cycle
FQ Frequency
min2 RRJ method applied excluding female
response to the two extreme frequency
values so that frequency range of test
was 4–6 kHz
R and R0 Response magnitude
r Relative vector length
RRJ Methodology described by Reinhold
et al. (2002)
SP Syllable period
SPL Sound pressure level
STD1 and STD2 Standard stimuli
k Spline smoothing parameter
Introduction
Female mating preferences have the potential to alter the
evolution of male traits. For understanding the mechanisms
of female preference within the context of sexual selection
(Ryan and Rand 1993; Ritchie 1996) it is essential to
describe variation in female response within populations
L. Verburgt (&) � J. W. H. Ferguson
Department of Zoology and Entomology,
University of Pretoria, Pretoria 0002, South Africa
e-mail: [email protected]
T. Weber
Max Planck Institute for Ornithology,
Postfach 1564, Seewiesen 82319, Germany
123
J Comp Physiol A (2008) 194:79–96
DOI 10.1007/s00359-007-0292-0

(Gerhardt and Huber 2002). Female preference is, how-
ever, difficult to quantify because females often do not
have graded and easily interpreted responses. In order to
understand the evolution of sexual selection by female
choice it is necessary to quantify the repeatability of female
preference, the shape of individual female preference, as
well as preference variation between females (Jennions and
Petrie 1997; Wagner 1998). Due to the amenability of
acoustic communication systems to experimentation (Ger-
hardt and Huber 2002) many studies investigating female
preference have focused on amphibians and insects. The
majority of these studies conducted experiments where
only a qualitative response was required, i.e. a yes/no
answer to the question: ‘‘Did the female track the sound?’’
(e.g. Doherty 1985a; Loher et al. 1992; Murphy and Ger-
hardt 2000; Grace and Shaw 2004; but see Wagner et al.
1995). This results in binomial preference data that are
often complex to interpret biologically (Kime et al. 1998;
Wagner 1998) and which provides less accurate informa-
tion about the strength of preference than a quantitative
measure of preference would (Murphy and Gerhardt 2000).
The phonotactic responses of certain insects, e.g. crickets,
appear to be sufficiently quantitative in order to charac-
terise female preference efficiently, evident from
intracellular recording of identified auditory neurons that
closely correspond to phonotactic response (Schildberger
et al. 1989). For example, this quantitative correspondence
between neuronal and phonotactic response mirrors the
steeper slope of the response function at faster syllable
periods compared with the gradual slope of the response
function at slower syllable periods. A large body of
information on animal communication has been generated
by phonotactic measurements on insects using locomotor
compensators, specifically the Kramer spherical treadmill
(Kramer 1976; Weber et al. 1981; Thorson et al. 1982).
Briefly, this equipment allows the free, untethered move-
ment of an insect towards a sound source, while remaining
at a fixed distance from that source, assuring constant
sound pressure level during the experiment.
Experiments attempting to quantify female preference
on locomotor compensators have used several measures of
phonotactic response, e.g. % time tracked (Thorson et al.
1982; Doherty 1985a), relative vector length (Loher et al.
1992), ‘‘vector score’’ (Wagner et al. 1995), relative dis-
tance run (Hedrick and Weber 1998), ‘‘net vector scores’’
(Gray and Cade 1999). These diverse methods impede
comparison between studies on female preference. To date,
no study on a locomotor compensator has investigated the
sources of variation affecting measures of phonotactic
precision, a crucial first step in developing a reliable
measure of phonotactic response. For example, although
several studies have suggested the occurrence of auditory
asymmetry (Boyan 1979; Schul et al. 1998; Schul 1998),
the relevance thereof to sound localization in insects has
only recently become topical (Faure and Hoy 2000; Bailey
and Yang 2002). Moreover, as far as we are aware, only a
single study has attempted to compensate for auditory
asymmetry (Schul 1998). Only once a reliable measure of
phonotactic response has been developed can individual
female preference be characterised quantitatively using
phonotactic response.
Recently, it has been shown that female field crickets
(Gryllus bimaculatus) make small steering movements
toward the individual syllables of the male call (Hedwig
and Poulet 2004; Hedwig and Poulet 2005; Poulet and
Hedwig 2005). However, since female crickets respond to
several properties of the song such as the syllable period,
chirp period, call frequency and frequency bandwidth
(Huber et al. 1989), additional neurological mechanisms
for pattern recognition must exist, functioning on a time-
scale of seconds and modulating sound localization
through simple reactive steering by increasing the gain of
auditory steering when a pattern is recognised (Poulet and
Hedwig 2005). Phonotactic response therefore quantifies
the overall directional precision with which a female tracks
a signal source. Her response function describes her pho-
notactic response across a range of different male signals
(Brooks and Endler 2001). Female preference (see Wagner
1998 for a discussion on the definition of female prefer-
ence) is then defined as the male signal (within the
response function) that elicits the greatest phonotactic
precision (see also Reinhold et al. 2002). The response
magnitude of a female is her degree of phonotactic preci-
sion at her preference. Female selectivity (synonymous to
female choosiness; Jennions and Petrie 1997; Gray and
Cade 1999; Brooks and Endler 2001; Reinhold et al. 2002)
is the degree to which female response decays with a
departure of a signal from her preference.
Commonly used methods for describing the shape of
female response functions can be inadequate to evaluate
within-and between-female variation in preferences
(Wagner 1998), as well as repeatability of response.
Repeatability (Falconer and Mackay 1996) provides a
measure of the consistency of a trait within an individual
and sets an upper limit to the heritability of this trait
(Boake 1989): it is crucial to our understanding of how
female response and male signals co-evolve in a popu-
lation (Kime et al. 1998; Wagner 1998; Widemo and
Saether 1999; Murphy and Gerhardt 2000). It is therefore
important to determine the repeatability of female pho-
notactic response as well as that of female response
functions. To date, this aspect of the cricket communi-
cation system has been neglected (but see Wagner et al.
1995), probably because the resolution of measurement
equipment has, until recently, been relatively course.
Appropriate methodology would represent an advance
80 J Comp Physiol A (2008) 194:79–96
123

towards a better understanding of the evolution of com-
munication systems.
Few studies have successfully described female
response functions at the level of the individual. This is
important since studies of female response at the popula-
tion level can mask individual variation in response (Kime
et al. 1998). Reinhold et al. (2002) proposed an approach
for describing individual female response functions using
non-linear regression. They measured the response calls of
female grasshoppers to artificial courtship signals varying
in a temporal characteristic and then estimated a Gaussian
function that best fitted the female response. In addition,
they separated female choice into female preference (B the
specific stimulus that elicits the greatest response), female
response rate (R the magnitude of response at the prefer-
ence value B) and female selectivity (C the parameter
determining the width of the Gaussian function). Their
methodology (hereafter RRJ-method) has not been applied
in other studies of female preference, nor has its applica-
bility been critically evaluated in other communication
systems. Some studies have used cubic splines (Schluter
1988) to describe female response functions at the popu-
lation level (Ritchie 1996; Brooks and Endler 2001; Ritchie
et al. 2001; Simmons et al. 2001). As far as we are aware,
the efficacy of this approach has to date not been evaluated
for describing the shape of an individual females’ response
function.
Female phonotactic response can be affected by factors
such as developmental environment (Grace and Shaw
2004), resource acquisition (Hunt et al. 2005) and age
(Prosser et al. 1997; Gray 1999; Reinhold et al. 2002;
Olvido and Wagner 2004). This could have important
implications for understanding sexual selection. Reinhold
et al. (2002) found that female age had no significant effect
on female preference or selectivity but did affect female
response magnitude significantly. Similarly, Olvido and
Wagner (2004) demonstrated an age-related decline in
female responsiveness to chirp duration in Allonemobius
socius. Gray (1999) argued that female age, fecundity,
reproductive investment and nutritional condition may
affect the acoustic preferences of female crickets (Acheta
domesticus) but found that only age significantly affected
female selectivity, older females being less selective.
Consequently, selection on mating behaviour at older ages
is thought to be weak. Studies on A. domesticus have
shown that juvenile hormone III levels affect the sensitivity
of auditory neurons (Stout et al. 1989a, b, 1991; Walikonis
et al. 1991; Henley et al. 1992), causing older females to
respond to a wider range of stimuli than young females.
Since these studies showed no common effect of age on
female response between species, it is necessary to quantify
the effect of age on phonotactic response and preference
for a particular species. In this paper, we calculate
individual female response functions for four male calling
song parameters in the chirping field cricket, Gryllus
bimaculatus, De Geer (Orthoptera: Gryllidae), using ‘‘no-
choice’’ sequential-stimulus phonotaxis experiments. The
specific aims of this study were:
• To develop methodology for the quantification and
statistical interpretation of individual female phonotac-
tic response functions, suitable for population-level
analyses of G. bimaculatus females;
• To quantify the effects of auditory asymmetry and
fatigue on phonotactic precision;
• To quantify the different levels of within-individual and
between-individual variation in phonotactic response
magnitude to an identical stimulus;
• To quantify the repeatability and the effect of age on
female phonotactic response and preference.
Materials and methods
Collection and captive care
We collected wild-living penultimate instar female field
crickets from seven locations across South Africa as well
as from seven captive colonies (F1) originating from these
wild-caught animals and allowed them to molt in captivity.
Since female G. bimaculatus do not exhibit phonotaxis
after being inseminated (Loher et al. 1992), we only used
virgin females. Individuals were kept in a climate-con-
trolled chamber (25 ± 1�C; 12:12 LD) in individual
containers (500 ml) and provided ad libitum food (high
protein cereal and fish flakes) and water (cotton-plugged
vial filled with water). Individuals were randomly selected
for each of the four experiments described below.
Measurement of female movement
We quantified female preference through untethered pho-
notactic response in total darkness at a temperature of
25 ± 1�C using a Kramer spherical treadmill (Kramer
1976) in an anechoic chamber ([2 kHz). We conducted
three experiments, each consisting of four trials. For each
trial, we presented a female with a series of stimuli by
manipulating a single call parameter (Table 1). Trials began
with one minute of silence allowing females to become
accustomed to the movement of the sphere. Each stimulus
thereafter was presented twice, played back alternately from
two different loudspeakers for a minute at a time respec-
tively. Speakers were situated at 210� (speaker 1) and 90�(speaker 2) respectively from a predefined zero point. This
J Comp Physiol A (2008) 194:79–96 81
123
forced females showing phonotaxis to switch direction
when a stimulus changed from one speaker to the other and
allowed for the quantification of within-individual variation
in phonotactic response to the same stimulus. Measurement
of phonotaxis only started when a female approached a
speaker with an accuracy of at least 30�. Stimuli followed
consecutively and were not separated by a silent pause (e.g.
Doherty 1985a). Female crickets continue phonotactic
response for some 300 ms after presentation of an attractive
stimulus (Poulet and Hedwig 2005). This is a time scale far
below that of our measurements during which each stimulus
was presented for 60 s. While performing phonotaxis, our
crickets reoriented themselves towards the active speaker
within 3 s (Fig. 1).
Acoustic stimuli used
Male G. bimaculatus produce a calling song by stridu-
lating their structurally modified tegmina. Each chirp
comprises three to five syllables, each resulting from the
closure of the tegmina. We generated synthetic acoustic
stimuli played back at a sound intensity (i.e. maximum of
the carrier envelope) of 70 dB SPL (measured at the
top-center of the treadmill; re. 2 9 10-5 Pa), which is
well above the thresholds of sound detection by both
high-frequency and low-frequency auditory neurons in the
prothoracic ganglia of G. bimaculatus for the frequency
range tested in our experiments (Schildberger et al. 1989).
All syllables had 2 ms linear rise-fall times. We designed
four trials where we manipulated either call frequency
(hereafter FQ), spectral bandwidth (hereafter BW), duty
cycle (hereafter DC) or syllable period (hereafter SP)
(Table 1). Pre-experimental trials as well as previous
experiments on G. bimaculatus (Doherty 1985b) revealed
a species-specific mean preference for stimuli conforming
to 5 kHz frequency, 43 ms syllable period, 50% duty
cycle, 4 syllables/chirp and 2 chirps/s (250 ms chirp
duration). We maintained this standard, which served as
the predicted preferred signal for this species [hereafter
referred to as the standard (STD1) stimulus] for each trial
(except for SP; see below) and only one acoustic property
(e.g. frequency) was manipulated. Three of the trials
(BW, DC and FQ) had an identical STD1 stimulus
(Table 1). Following Thorson et al. (1982) and Doherty
(1985a), we maintained a duty cycle of 50% (i.e. constant
sound energy intensity per chirp) while keeping the chirp
duration approximately constant across all SP’s tested
Table 1 Description of the four different phonotaxis trials that females crickets (G. bimaculatus) were exposed to
Trial # Stimuli Stimuli presented STD1 stimulus position
Bandwidth (BW) 7 0, 0.2, 0.4, 0.6, 0.8, 1.0, 1.2 kHz 1
Duty cycle (DC) 7 10, 30, 40, 50, 60, 70, 90% 4
Frequency (FQ) 9 3, 3.5, 4, 4.5, 5, 5.5, 6, 6.5, 7 kHz 5
Syllable period (SP) 10 23, 28, 35, 39, 43, 48, 53, 58, 67, 81 ms –
Each stimulus was played back for a duration of one minute per speaker from two different speakers situated at different locations (210� and 90�,
respectively). All trials except SP (see text) had two standard stimuli (STD1 and STD2) with the following specifications 5 kHz frequency, 43 ms
SP, 50% duty cycle, 4 syllables/chirp and 2 chirps/s. The STD2 stimulus was the final stimulus of a trial (not indicated in the table)
0
90
210
3601
23 28 35 39 43 48 53 58 67 81 43
2 3 4 5 6 7 8 9 10 11 12 13 14 15 16 17 18 19 20 21 22 23
Time (min)
Syllable Period (ms)
Cir
cula
r an
gle
(°)
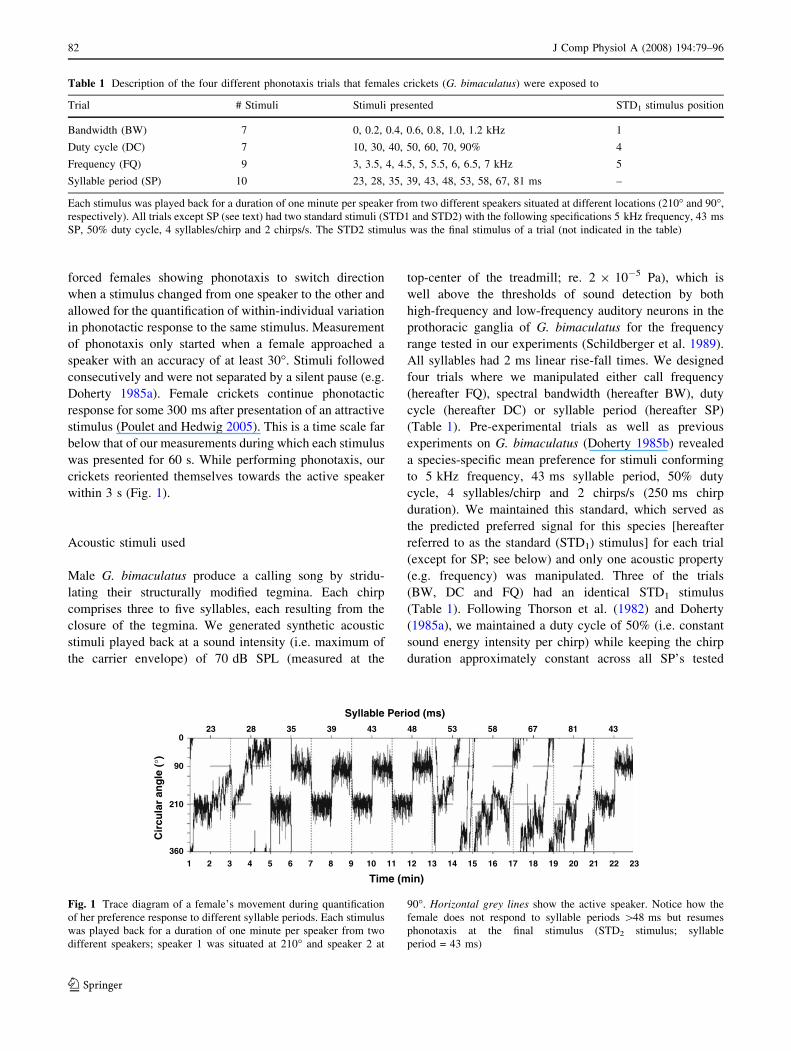
Fig. 1 Trace diagram of a female’s movement during quantification
of her preference response to different syllable periods. Each stimulus
was played back for a duration of one minute per speaker from two
different speakers; speaker 1 was situated at 210� and speaker 2 at
90�. Horizontal grey lines show the active speaker. Notice how the
female does not respond to syllable periods [48 ms but resumes
phonotaxis at the final stimulus (STD2 stimulus; syllable
period = 43 ms)
82 J Comp Physiol A (2008) 194:79–96
123
(23–81 ms; Table 1) by varying the number of syllables.
For the syllable period of 43 ms in the SP trial, stimulus
characteristics for STD1 were as follows: six syllables
with a chirp duration of 237 ms and an inter-chirp-inter-
val of 349 ms, identical to that of Thorson et al. (1982).
We repeated the standard stimulus (hereafter STD2) at the
end of each trial in order to quantify the magnitude of any
tiring effect and to determine whether the female was still
responsive to the acoustic stimuli.
Previous experiments (Doherty 1985b; Hedrick and
Weber 1998) and pilot trials revealed no effect of stimulus
order on female response and therefore we presented stimuli
in the same order for each trial (Table 1). Nevertheless, we
did investigate the effect of sequence order on female
preference by reversing the order of stimuli for the syllable
period trial, the trial with the longest duration [hereafter
SP(Rev)]. We randomised the order of the trials presented
to individual females. Before quantifying either phonotactic
response or preference we visually inspected a females’
phonotaxis by creating a trace diagram to indicate her
movements throughout the duration of a trial (Fig. 1).
Measuring phonotactic response
Although the Kramer treadmill has a movement resolution
of 0.25 mm, we sampled the mean female movement for
every 1.0 cm moved. Females generally ran [250 cm
min-1 which provided excellent resolution to quantify
phonotactic response for each stimulus presented. We
quantified phonotactic response for each stimulus (both
speakers individually) of every trial, using a measure of
phonotactic precision which relies on the calculation of a
relative vector length (e.g. Loher et al. 1992), where
relative vector length ðrÞ ¼ displacement/total distance run:
ð1Þ
Displacement represents the straight-line distance between
the females’ starting and end positions for a particular
stimulus whereas total distance run includes the
intervening meandering movements. We calculated the
angular variance of phonotactic response (hereafter
Batschelet deviation-BatD; Batschelet 1981), a measure
of dispersion for a circular distribution used in navigation
and orientation studies (e.g. Homing pigeons: Gagliardo
et al. 1999; Macaques: Ringach et al. 2002) as follows:
BatD ¼ffiffiffiffiffiffiffiffiffiffiffiffiffiffiffiffiffi
2ð1� rÞp
ð2Þ
Female crickets characteristically move with an angular
error of up to 60� towards a sound source and the more
precisely a female moves towards a sound source, the
lower the BatD. To demonstrate the effect of phonotactic
asymmetry on measures of phonotactic precision
incorporating a term for angular deviation from the sound
source we calculated the ‘‘sound directed component’’
(Schmitz 1985) or ‘‘vector score’’ (Wagner et al. 1995) for
the females of experiment 1, and the FQ trial. These two
measures are computationally identical (hereafter CosV):
CosV ¼ Cosða� SÞ � r ð3Þ
where a = the mean vector angle, S = angular direction of
the speaker and r = relative vector length (Eq. 1).
Different approaches for determining phonotactic
response function
Polynomial regression
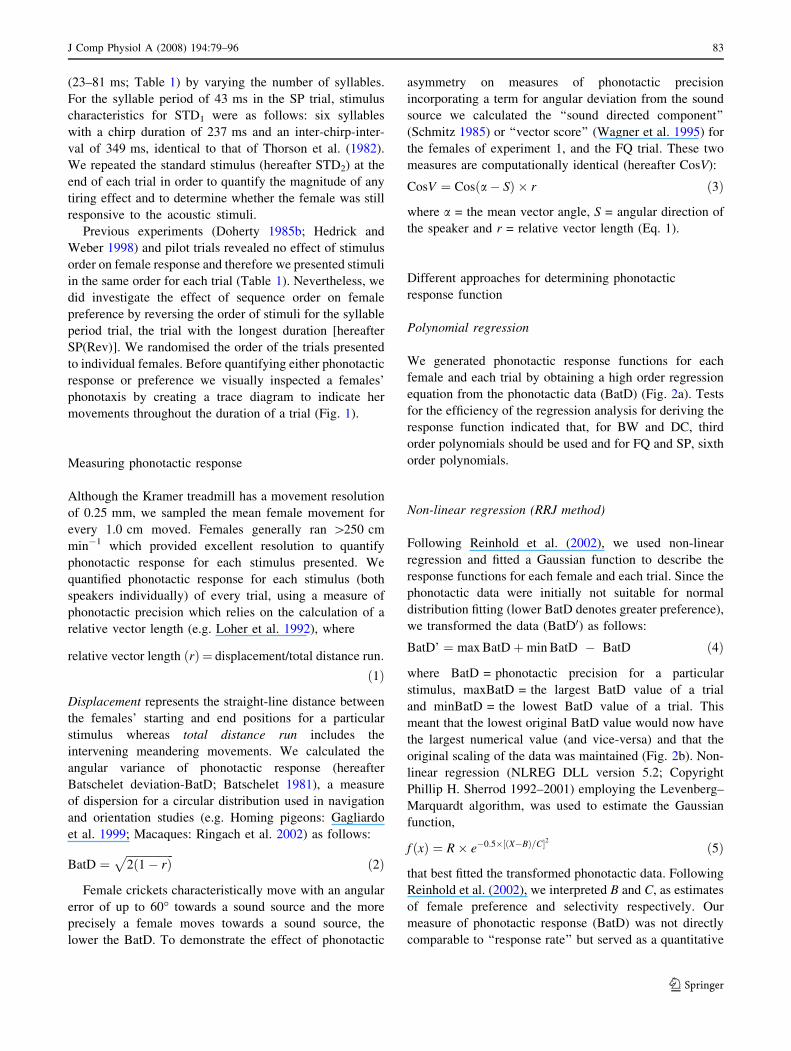
We generated phonotactic response functions for each
female and each trial by obtaining a high order regression
equation from the phonotactic data (BatD) (Fig. 2a). Tests
for the efficiency of the regression analysis for deriving the
response function indicated that, for BW and DC, third
order polynomials should be used and for FQ and SP, sixth
order polynomials.
Non-linear regression (RRJ method)
Following Reinhold et al. (2002), we used non-linear
regression and fitted a Gaussian function to describe the
response functions for each female and each trial. Since the
phonotactic data were initially not suitable for normal
distribution fitting (lower BatD denotes greater preference),
we transformed the data (BatD0) as follows:
BatD’ ¼ max BatDþmin BatD � BatD ð4Þ
where BatD = phonotactic precision for a particular
stimulus, maxBatD = the largest BatD value of a trial
and minBatD = the lowest BatD value of a trial. This
meant that the lowest original BatD value would now have
the largest numerical value (and vice-versa) and that the
original scaling of the data was maintained (Fig. 2b). Non-
linear regression (NLREG DLL version 5.2; Copyright
Phillip H. Sherrod 1992–2001) employing the Levenberg–
Marquardt algorithm, was used to estimate the Gaussian
function,
f ðxÞ ¼ R� e�0:5�½ðX�BÞ=C�2 ð5Þ
that best fitted the transformed phonotactic data. Following
Reinhold et al. (2002), we interpreted B and C, as estimates
of female preference and selectivity respectively. Our
measure of phonotactic response (BatD) was not directly
comparable to ‘‘response rate’’ but served as a quantitative
J Comp Physiol A (2008) 194:79–96 83
123
measure of female response magnitude (R), since females
were expected to have a small BatD when showing strong
phonotaxis towards their preferred stimulus. For the non-
linear regression the start value for R was always 90 while
B and C were respectively set as follows: BW 0.4, 0.3; DC
50, 20; FQ 4, 1.5; SP and SP(Rev): 43, 20. If we obtained a
value for B that was smaller than the starting value for the
trial (Table 1) we set B to the starting value of the trial and
recalculated the values for C and R (this happened four
times in the BW and once in the SP trial). We never
obtained a value for B that was greater than the largest
value for a trial.
Cubic spline method
We generated response functions for each female and
each trial by using cubic splines (Schluter 1988) with a
smoothing parameter (k) of -5 (Fig. 2a). Schluter (1988)
cautions against the use of extreme k values as it can
either cause the resulting curve to be too smooth (large k)
or the curve will simply fit each data point (small k). We
tested a large range of smoothing parameters and chose
the smoothing parameter that, across all four of the trials
(BW, DC, FQ and SP), minimised the general cross-val-
idation (GCV) score (Schluter 1988) and maximised
between-individual differences in preference. Two hun-
dred bootstrap replications allowed each response
function to be fitted with error estimates (±1 SE),
although these were always very small due to the rela-
tively small number of unique stimuli presented within a
trial (D. Schluter, personal communication). We did not
require the addition of a random error to break ties (e.g.
Ritchie 1996; Ritchie et al. 2001; Simmons et al. 2001) as
no female yielded identical phonotactic response (BatD)
for both speakers of a stimulus. The generation of a cubic
spline does not provide an equation of predictive value.
We therefore obtained a high order regression equation
(same order as for the polynomial regressions above)
from the predicted values (y) from the spline analysis and
used this equation to calculate B0, C0 and R0 (see below).
These equations fitted the y values extremely well (mean
r2 = 0.98 ± 0.03).
In order to compare the quantification of female
response from the polynomial regression and spline
methods with the RRJ-method, we required analogous
measures for estimating female preference (B), selectivity
(C) and response rate (R) (Reinhold et al. 2002). We
achieved this by taking female response magnitude (R0) as
the best phonotactic response (lowest BatD) during a trial;
female preference (B0) as the stimulus value (on the x-axis)
corresponding to R0, and female selectivity (C0) was taken
as the width of the regression equation at 10� BatD above
R0 (the lowest BatD; Fig. 2a).
Body size
After successfully completing an experiment, females were
killed and digital images of the pronotum were generated
with the Creative Laboratories VideoBlaster FS200 utility
program. Using this software, we measured the pronotum
length and width (resolution = 15.8 lm). The surface area
of the pronotum (mm2) was taken as a mass-independent
measure of body size.
We conducted the following four experiments:
)°( n
o itaiveD tele
hcstaB
010
20
30
40
50
60
70
80
Original dataRegression from original dataCubic Spline outputRegression from spline
B'=4.33
R'=24.4
R'=20.1
C'=0.99
Frequency (kHz)
)°( ]'D ta
B[ 'n
oitaiveD tele
hcstaB
00.0 3.0 3.5 4.0 4.5 5.0 5.5 6.0 6.5 7.0
10
20
30
40
50
60
70
80
Gaussian functionInverted phonotactic data
B=4.65
R=60.1
C=1.39
a
b
Fig. 2 Three methods used in this study to calculate female response
function for the field cricket, G. bimaculatus. Phonotactic response
(open circles) to two different speakers per stimulus tested are shown
for the frequency trial. a The polynomial regression generated from
the original data is presented as the solid grey line and the polynomial
regression generated from the y values (filled triangles), obtained
from cubic spline analysis, is presented as the solid black line. b A
Gaussian function (solid black line) was used to calculate preference
(B), response magnitude (R) and selectivity (C) from inverted
phonotactic response data (inverted open triangles) (RRJ-method;
Reinhold et al. 2002). Analogous measures of female preference to
those calculated from the Gaussian function (B0, R0, C0) were
calculated for the two polynomial regression equations a. Here, B0 and
C0 are shown for the equation generated from spline data only
84 J Comp Physiol A (2008) 194:79–96
123

Experiment 1: Phonotactic asymmetry, fatigue
and levels of variation in phonotactic experiments
Females of equal age (10 days post adult ecdysis) were
measured in groups of 20 with each individual (n = 130)
subjected to three trials (BW, DC and FQ) in random order
over a period of no longer than 2 days with a minimum of
10 h of rest between trials. This allowed, firstly, for the
quantification of female phonotactic asymmetry and its
effect on the calculation of phonotactic precision. Secondly,
we were able to quantify the effect of tiring on phonotactic
response since the duration between the STD1 and STD2
stimuli varied over a large range across the three trials (1–
19 min, Table 1). We quantified the following hierarchical
levels of variation in phonotactic response for these identical
stimuli (STD1 and STD2): between-female; within-female
between-trials; within-trials between-stimuli and within-
stimulus between-speaker. We performed a nested random-
effects ANOVA in order to quantify these different levels of
variation using the PROC NESTED procedure of the SAS
V8.02 statistics package (SAS Institute, Cary, NC, USA).
Experiment 2: Repeatability of phonotactic response
and response function
Four groups of females of equal age (10 days post adult
ecdysis) were selected, with each group subjected to either
BW, DC, FQ or SP twice. This meant that each female
within a group was subjected to two identical trials with at
least 10 h of rest between trials. This allowed firstly, for the
calculation of repeatability of phonotactic response to each
individual experimental stimulus. Repeatabilities of
phonotactic response for both the STD1 and STD2 stimuli
were calculated separately. Secondly, the repeatability (and
standard error; Becker 1984) of female preference (B and
B0), female selectivity (C and C0) and female response
magnitude (R and R0) was calculated using the three dif-
ferent methods described above (polynomial regression,
RRJ and cubic spline). A population level response function
for each of the four trials was generated for the females of
experiment 1 (n = 130) using the cubic spline method.
These functions, together with a number of response func-
tions for different individuals were graphed in order to
demonstrate the extent of between female differences within
the context of population level response characteristics.
Experiment 3: The effect of stimulus sequence on SP
preference
Females of equal age (10 days post adult ecdysis) were each
subjected to the SP trial (Table 1) and an additional SP trial
where we reversed the sequence of stimuli so that the syllable
period was varied from long to short (81–23 ms). This
experiment was similar in design to that of Doherty (1985b)
and allowed for the calculation of repeatability of preference
by comparing preference between the different trials. Low
repeatability of preference in this experiment when com-
pared to that of experiment 2 (above) would indicate an
effect of stimulus sequence on phonotactic response.
Experiment 4: The effect of age on phonotactic
response and preference
Females of equal age (10 days post adult ecdysis) were
each subjected to four trials (BW, DC, FQ and SP) pre-
sented in random order within two days, with at least 10 h
rest between trials. These females were subjected to the
four trials every 10 days until death, allowing for the
quantification of the effect of age on phonotactic response.
Results
Experiment 1a: Phonotactic asymmetry
Nearly all females had an angular offset, i.e. a constant
difference between the female’s direction of movement and
the true direction of the speaker. Figure 3 shows phonotaxis
for a female with an angular offset of approximately -30�.
Because phonotaxing females adjusts their movement
direction in order to receive a similar sound pressure level
(SPL) on both tympani over time (meandering about the
sound direction; Bailey and Thomson 1977; Thorson et al.
1982; Schmitz 1985), a female with an auditory deficiency
on her right side has an angular offset to the left (negative
offset in Figs. 4, 5). By moving the more functional tym-
panum away from the sound source (left tympanum of
female in Fig. 3), the net SPL on both tympani will be more
similar during phonotaxis. The magnitude of the angular
offset is determined by the degree of phonotactic asymmetry
and affects measures of phonotactic precision that incor-
porate a term for angular deviation from the sound source.
The CosV around the true speaker direction (0.86 ± 0.11)
was significantly smaller than the CosV around the female’s
perceived speaker direction (0.89 ± 0.09) (paired t test,
t259 = 6.05, P \ 0.001) and the former measure therefore
indicated poorer phonotactic precision.
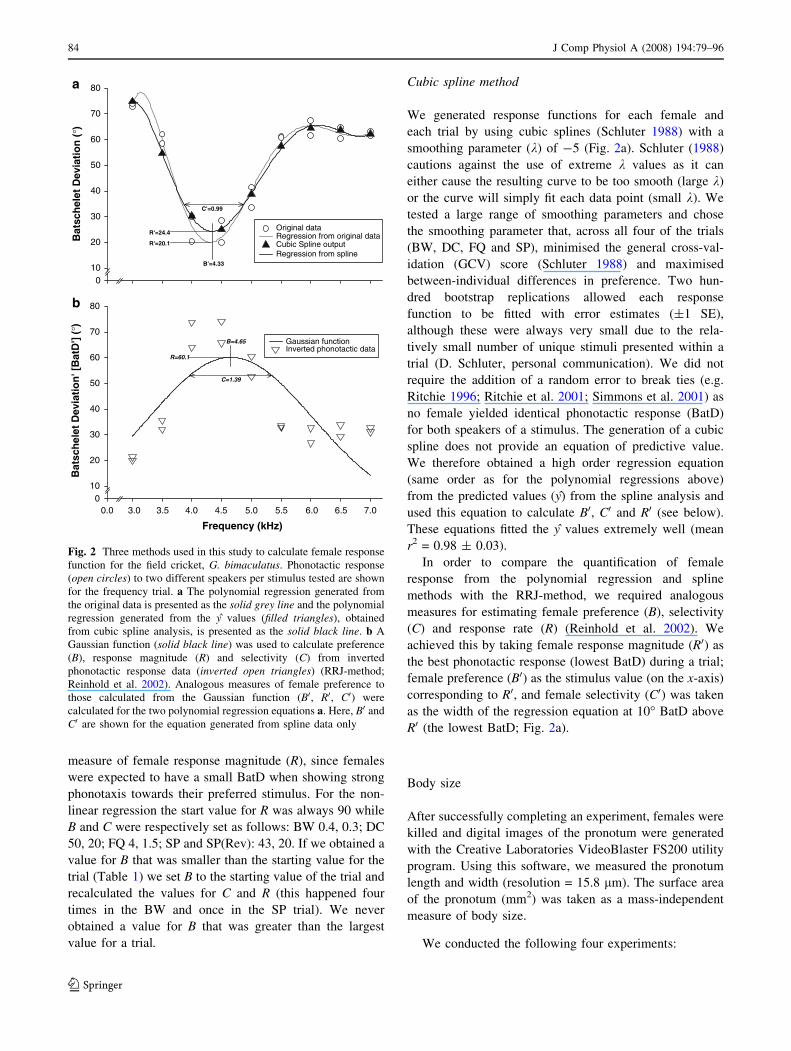
The magnitude and sign of a female’s angular offset
affect the time taken for a female to switch direction
between speakers. In Fig. 3, time taken to switch between
speakers differs as the female switches almost instantly
from speaker 1 (210�) to speaker 2 (90�) by following the
shortest angular difference between speakers. However,
J Comp Physiol A (2008) 194:79–96 85
123
when switching from speaker 2 to speaker 1 this female
took more time and the greater angular difference between
speakers was followed when switching from 4.5 to 5 kHz.
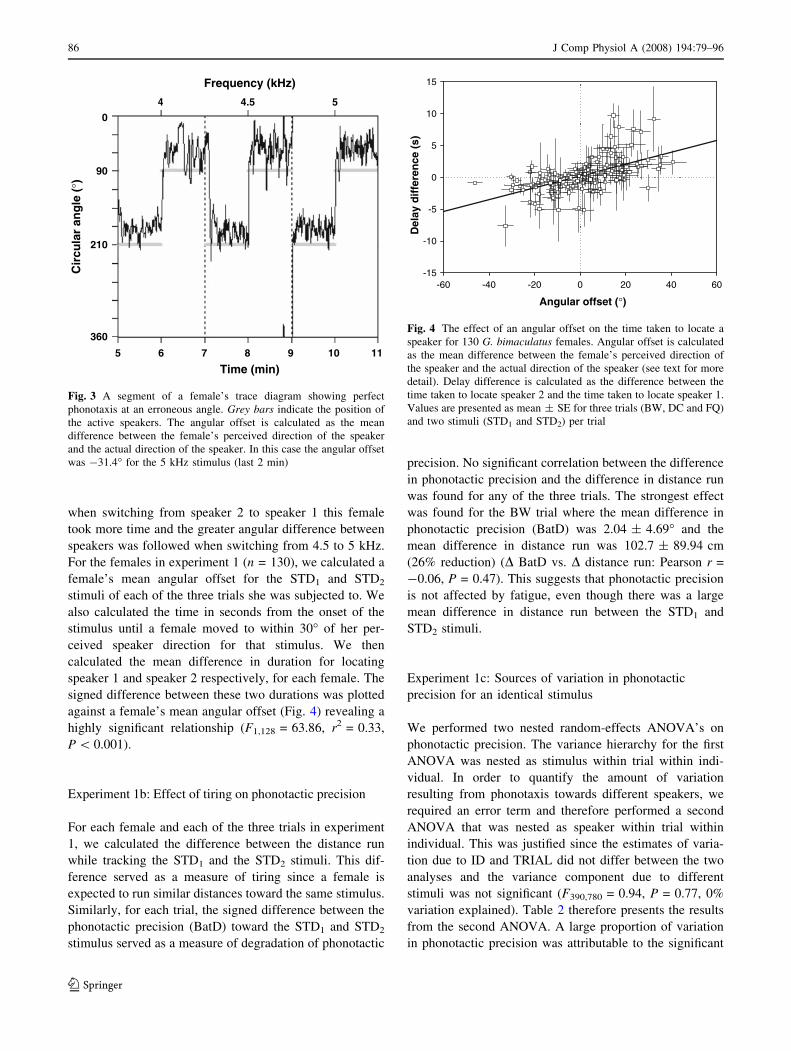
For the females in experiment 1 (n = 130), we calculated a
female’s mean angular offset for the STD1 and STD2
stimuli of each of the three trials she was subjected to. We
also calculated the time in seconds from the onset of the
stimulus until a female moved to within 30� of her per-
ceived speaker direction for that stimulus. We then
calculated the mean difference in duration for locating
speaker 1 and speaker 2 respectively, for each female. The
signed difference between these two durations was plotted
against a female’s mean angular offset (Fig. 4) revealing a
highly significant relationship (F1,128 = 63.86, r2 = 0.33,
P \ 0.001).
Experiment 1b: Effect of tiring on phonotactic precision
For each female and each of the three trials in experiment
1, we calculated the difference between the distance run
while tracking the STD1 and the STD2 stimuli. This dif-
ference served as a measure of tiring since a female is
expected to run similar distances toward the same stimulus.
Similarly, for each trial, the signed difference between the
phonotactic precision (BatD) toward the STD1 and STD2
stimulus served as a measure of degradation of phonotactic
precision. No significant correlation between the difference
in phonotactic precision and the difference in distance run
was found for any of the three trials. The strongest effect
was found for the BW trial where the mean difference in
phonotactic precision (BatD) was 2.04 ± 4.69� and the
mean difference in distance run was 102.7 ± 89.94 cm
(26% reduction) (D BatD vs. D distance run: Pearson r =
-0.06, P = 0.47). This suggests that phonotactic precision
is not affected by fatigue, even though there was a large
mean difference in distance run between the STD1 and
STD2 stimuli.
Experiment 1c: Sources of variation in phonotactic
precision for an identical stimulus
We performed two nested random-effects ANOVA’s on
phonotactic precision. The variance hierarchy for the first
ANOVA was nested as stimulus within trial within indi-
vidual. In order to quantify the amount of variation
resulting from phonotaxis towards different speakers, we
required an error term and therefore performed a second
ANOVA that was nested as speaker within trial within
individual. This was justified since the estimates of varia-
tion due to ID and TRIAL did not differ between the two
analyses and the variance component due to different
stimuli was not significant (F390,780 = 0.94, P = 0.77, 0%
variation explained). Table 2 therefore presents the results
from the second ANOVA. A large proportion of variation
in phonotactic precision was attributable to the significant
0
90
210
360
5 6 7 8 9 10 11
4 4.5 5
Cir
cula
r an
gle
(°)
Time (min)
Frequency (kHz)
Fig. 3 A segment of a female’s trace diagram showing perfect
phonotaxis at an erroneous angle. Grey bars indicate the position of
the active speakers. The angular offset is calculated as the mean
difference between the female’s perceived direction of the speaker
and the actual direction of the speaker. In this case the angular offset
was -31.4� for the 5 kHz stimulus (last 2 min)
Angular offset (°)
Del
ay d
iffe
ren
ce (
s)
-15-60 -40 -20 0 20 40 60
-10
-5
0
5
10
15
Fig. 4 The effect of an angular offset on the time taken to locate a
speaker for 130 G. bimaculatus females. Angular offset is calculated
as the mean difference between the female’s perceived direction of
the speaker and the actual direction of the speaker (see text for more
detail). Delay difference is calculated as the difference between the
time taken to locate speaker 2 and the time taken to locate speaker 1.
Values are presented as mean ± SE for three trials (BW, DC and FQ)
and two stimuli (STD1 and STD2) per trial
86 J Comp Physiol A (2008) 194:79–96
123

Duty Cycle (%)
0 10 20 30 40 50 60 70 80 900
20
30
40
50
60
70
Duty Cycle (%)
0 10 20 30 40 50 60 70 80 90
)°( n
oitaiveD tele
hcstaB
0
20
30
40
50
60
70
Bandwidth (kHz)
0.0 0.2 0.4 0.6 0.8 1.0 1.20
15
20
25
30
35
40
45
Bandwidth (kHz)
0.0 0.2 0.4 0.6 0.8 1.0 1.2
)°( n
oitaiveD tele
hcstaB
0
15
20
25
30
35
40
45
Frequency (kHz)
0.0 3.0 3.5 4.0 4.5 5.0 5.5 6.0 6.5 7.00
10
20
30
40
50
60
70
80
Frequency (kHz)
0.0 3.0 3.5 4.0 4.5 5.0 5.5 6.0 6.5 7.0
)°( n
oitaiveD tele
hc staB
010
20
30
40
50
60
70
80
Syllable Period (ms)
0 20 30 40 50 60 70 800
10
20
30
40
50
60
70
Syllable Period (ms)
0 20 30 40 50 60 70 80
) °( n
oita iv eD te le
hc staB
0
10
20
30
40
50
60
70
a b
c d
e f
g h
Fig. 5 Female response functions for four different calling song
parameters for the field cricket, G. bimaculatus. Population level
phonotactic response (mean Batschelet deviation ± SD) for 130
females (Experiment 1) is shown for the bandwidth (BW), duty cycle
(DC), frequency (FQ) and syllable period (SP) trials in the left figures.
The polynomial regression generated from the population y values,
obtained from cubic spline analysis is presented as the solid blackline. For each trial, figures on the right show the individual
phonotactic response of three different females demonstrating signif-
icant between-individual differences. Values are y values, obtained
from cubic spline analysis with the corresponding polynomial
regression. Symbol and line legends are the same for each trial where
each female’s individual response is represented with a square, circleor triangle symbol and her corresponding polynomial regression is
indicated respectively with a line that is solid, dashed or dotted
J Comp Physiol A (2008) 194:79–96 87
123

between-individual differences, suggesting that different
females have different innate abilities to track a sound
source well. A females’ mean phonotactic precision at the
STD1 stimulus was not affected by her body size
(F1,128 = 3.80, r2 = 0.02, P [ 0.05) or the absence of a
hind leg (n1 = 109; n2 = 21; t128 = 1.14, P = 0.39). The
proportion of variation in phonotactic precision due to the
different trials and the different stimuli (STD1 or STD2)
respectively, were non-significant (Table 2). A large and
highly significant proportion of variation in phonotactic
precision was due to between-speaker differences, reveal-
ing that females always tracked speaker 1 better than
speaker 2. However, the magnitude of this difference in
BatD was only 3.3� (Table 2).
Experiment 2a: Repeatability of phonotactic response
to a standard stimulus
The first four columns of Table 3 show the repeatability
estimates of phonotactic response for the STD1 and STD2
stimuli respectively for the females of experiment 2 that
were presented with two identical trials (either BW, DC or
FQ). The repeatabilities calculated are high and significant,
indicating that a females’ phonotactic response to a spe-
cific stimulus (near the predicted preference for this
species) is similar between trials. We pooled the phono-
tactic response data for the STD1 and STD2 stimuli
respectively across the three trials to estimate the repeat-
ability of phonotactic response for an identical stimulus,
independent of the trial. Repeatabilities of phonotactic
response calculated in this manner were both high and
significant (STD1 0.78 ± 0.7, P \ 0.001; STD2
0.72 ± 0.09, P \ 0.001).
Table 2 Hierarchical levels of variation in phonotactic response to
an identical (STD1) stimulus for 130 G. bimaculatus females
Source df Phonotactic accuracy (BatD)
ID 129,260 F = 4.50*** (22.4%)
Trial 260,390 F = 0.77 (0%)
BW 23.20 ± 5.84
DC 21.68 ± 5.25
FQ 22.25 ± 5.90
Speaker 390,780 F = 1.81*** (22.4%)
SP1 20.71 ± 5.22
SP2 24.04 ± 5.68
Nested random-effects ANOVA was performed with speaker nested
within trial, which was nested within ID. Percentage values in
brackets indicate the proportion of variation attributable to that
source. Mean ± SD of BatD are presented below the F values
*** P \ 0.001
Ta
ble
3R
epea
tab
ilit
yes
tim
ates
(±S
E)
of
ph
on
ota
ctic
resp
on
sein
G.
bim
acu
latu
s
Tri
aln
df
a)P
ho
no
tact
icp
reci
sio
n1
.P
oly
no
mia
lR
egre
ssio
n2
.N
on
-lin
ear
reg
ress
ion
3.
Cu
bic
spli
ne
ST
D1
ST
D2
B0
C0
R0
BC
RB0
C0
R0
BW
98.9
0.7
9±
0.1
3**
0.6
9±
0.1
8**
0.7
9±
0.1
39
**
0.8
4±
0.1
0***
0.9
5±
0.0
3***
0.7
0±
0.1
8*
0.0
1±
0.3
50.5
7±
0.2
4*
0.8
3±
0.1
1***
0.8
45
±0.1
0***
0.2
8±
0.3
3
DC
98.9
0.6
0±
0.2
3*
0.7
7±
0.1
4**
0.5
3±
0.2
59
*0.2
6±
0.3
30.8
0±
0.1
39
**
0.6
3±
0.2
1*
0.5
2±
0.2
60.1
0±
0.3
50.5
3±
0.2
5*
0.2
6±
0.3
30.4
6±
0.2
8
FQ
12
11,1
20.7
7±
0.1
2***
0.7
4±
0.1
4***
0.6
9±
0.1
6**
-0.1
1±
0.3
00.0
67
±0.3
00.4
7±
0.2
4*
0.6
4±
0.1
8*
0.5
3±
0.2
2*
0.7
2±
0.1
5**
-0.2
2±
0.2
90.3
0±
0.2
7
SP
87,8
––
0.7
5±
0.1
7**
0.6
7±
0.2
1*
0.7
6±
0.1
6**
0.3
9±
0.3
2-
0.1
4±
0.3
7–0.0
2±
0.3
80.7
5±
0.1
7**
0.6
7±
0.2
1*
-0.3
7±
0.3
3
SP
(Rev
)9
8,9
––
0.7
8±
0.1
4**
0.7
1±
0.1
8**
0.1
4±
0.3
50.3
2±
0.3
20.4
4±
0.2
90.2
9±
0.3
20.7
8±
0.1
4**
0.7
1±
0.1
8**
0.1
5±
0.3
5
aS
ign
ifica
nt
rep
eata
bil
ity
of
ph
on
ota
ctic
resp
on
se(P
ho
no
tact
icp
reci
sio
n;
Bat
D)
for
anid
enti
cal
stim
ulu
s(S
TD
1an
dS
TD
2,
see
tex
tfo
rd
etai
ls)
sho
ws
that
fem
ales
resp
on
dsi
mil
arly
toan
iden
tica
lst
imu
lus
on
dif
fere
nt
occ
asio
ns.
Rep
eata
bil
ity
of
fem
ale
resp
on
sefu
nct
ion
calc
ula
ted
usi
ng
thre
ed
iffe
ren
tm
eth
od
olo
gie
s(1
–3
).F
emal
ere
spo
nse
fun
ctio
nis
par
titi
on
edin
top
refe
ren
ce
(B),
sele
ctiv
ity
(C)
and
resp
on
sem
agn
itu
de
(R),
calc
ula
ted
fro
mth
en
on
-lin
ear
reg
ress
ion
(Rei
nh
old
etal
.2
00
2).
Fo
rb
oth
po
lyn
om
ial
reg
ress
ion
and
cub
icsp
lin
em
eth
od
sth
ean
alo
go
us
mea
sure
so
ffe
mal
ech
oic
ew
asca
lcu
late
dw
her
eB0
=p
refe
ren
ce,
R0
=B
atD
atth
ep
refe
ren
cean
dC0
=th
ew
idth
of
the
curv
eat
10
�ab
ov
em
inim
um
Bat
D(s
eeF
ig.
2a)
*P
\0
.05
**
P\
0.0
1
**
*P
\0
.00
1
88 J Comp Physiol A (2008) 194:79–96
123

Experiment 2b: Repeatability of response function
For experiments 2 and 3, the polynomial regression and the
spline methods yielded high and significant female pre-
ference (B0) repeatabilities which were very similar
(Table 3). Since the response functions for each trial were
unimodal, their shape could potentially be approximated by
the shape of a normal distribution (a prerequisite for the
RRJ-method). The repeatabilities calculated from polyno-
mial regression and the spline method were similar except
for the repeatability estimates of R0. Repeatability of
response magnitude (R0) was low due to lack of between-
individual variation, e.g. mean response magnitude derived
from the spline method for the FQ trial was 21.3 ± 2.9�(range = 17.3–26.3�; n = 12). For each trial in Table 3 the
R0 calculated using the spline method was significantly
greater (following a Bonferroni correction; Rice 1989) than
the R0 calculated from the polynomial regression (paired t
tests; smallest t = 3.33 for the BW trial; P \ 0.01 for all
trials). The RRJ-method did not yield comparable results
and does not appear to be suitable for this type of data as
the Gaussian function fitted to the phonotactic response
data explained significantly less of the variation than the
polynomial regression did (Table 4). The population level
splines (Fig. 5 a, c, e, g) indicate the different tuning curves
with respect to the four acoustic parameters that were
measured. The tuning curves for individuals (Fig. 5 b, d, f,
h) show three different types of response. The response
functions for different individual females showed large
degrees of variation and, in many cases, were not similar to
the population level response function.
Experiment 3: The effect of stimulus sequence on SP
preference
For the females subjected to the SP trial and the SP(Rev)
trial (reversed sequence of stimuli), SP preference (B0) and
selectivity (C0) was highly repeatable and was indeed
slightly greater than that calculated for the females of
experiment 2 (Table 3), suggesting that the sequence of SP
stimulus presentation has a negligible effect on female
response.
Experiment 4: The effect of age on phonotactic
precision and preference
Phonotactic precision
Each female was subjected to six standard stimuli at every
age category (STD1 and STD2 stimuli for BW, DC and FQ
trials, respectively), allowing us to quantify the effect of
age on phonotactic precision. We performed a repeated
measures ANOVA on the phonotactic precision (BatD) for
the STD1 and STD2 stimuli respectively for all females
surviving to 30 days of age (Table 5). We found no dif-
ference in phonotactic precision attributable to age, trial or
their interaction. We performed an additional repeated
measures ANOVA, this time with only two age classes
namely at 10 days old and the last set of measurements
performed before the female died (‘‘final age’’). This ‘‘final
age’’ ranged from 20 to 40 days of age, depending on the
individual female’s longevity. Table 5 shows that for this
comparison, a significant effect of age was found for both
the STD1 and STD2 stimulus, suggesting that females track
a particular stimulus consistently throughout their lives
until a few days before they die.
Table 4 Comparison between the r2 (mean ± SD) of the polynomial
regression and the non-linear regression (Gaussian function, RRJ-
method) indicating that for each trial the polynomial regression fitted
the data significantly better (paired t tests)
Trial df r2 t P
Polynomial Non-linear
BW 17 0.42 ± 0.23 0.36 ± 0.22 3.35 0.004
DC 17 0.78 ± 0.17 0.67 ± 0.18 5.18 \0.001
FQ 23 0.72 ± 0.16 0.45 ± 0.23 8.44 \0.001
SP 15 0.71 ± 0.18 0.43 ± 0.26 5.4 \0.001
SP(Rev) 17 0.68 ± 0.13 0.42 ± 0.26 5.29 \0.001
All comparisons remained significant following a Bonferroni
correction
Table 5 Effect of age on phonotactic response to an identical
stimulus
Comparison Source df F
STD1 STD2
Age 10, 20, 30 Age 2.14 2.92 1.75
Trial 2.14 2.03 3.27
Age 9 trial 4.28 1.92 1.28
Age 10-final Age 1.9 8.39* 5.96*
Trial 2.18 0.19 1.85
Age 9 Trial 2.18 0.69 0.79
Results of four repeated measures ANOVA conducted on the pho-
notactic precision (BatD) while tracking the STD1 or STD2 stimulus
of three trials (BW, DC, FQ). Females included in the analyses were
all females surviving to 30 days of age and all females between age
10 and final age (defined as the last trial completed successfully
before the female died). None of the results were significant for 10–
30 days of age suggesting no effect of age on phonotactic precision
toward a specific stimulus. The significant age effect of the age 10-
final tests suggest that a female looses phonotactic ability and/or
motivation a few days before she dies
* P \ 0.05
J Comp Physiol A (2008) 194:79–96 89
123
Preference
Using the spline methodology described above, we deter-
mined individual female preference (B0) for each trial
completed at each age class. We performed several repe-
ated measures ANOVAs in order to determine whether
preference changed at ages of 10, 20 and 30 days
(Table 6). Preference during a specific trial did not differ
between the age classes. Although with a much reduced
sample size, we repeated these exact analyses but addi-
tionally included the age class of 40 in order to determine if
these results were consistent across a greater age range.
Again, we found no effect of age. In order to determine if
preference changes and becomes unreliable just before a
female dies we performed paired t tests with two age
classes, 10 days old and the last set of measurements per-
formed before the female died. Preference did not differ
between these two age classes (Table 6).
Limitations of phonotactic experiments conducted
on the spherical treadmill
To determine whether female field crickets are consistent in
their response to stimuli outside of their preference range,
we calculated the absolute difference in phonotactic preci-
sion (BatD) between identical stimuli of the FQ trial that
was repeated by females of experiment 2. Duplicate trials
for each female meant that for each stimulus of a trial we
had a measure of the consistency of phonotactic precision,
which differed between stimuli within a trial (e.g. FQ trial
repeated measures ANOVA, F8,88 = 4.23, P \ 0.001). We
also calculated the repeatability of the phonotactic response
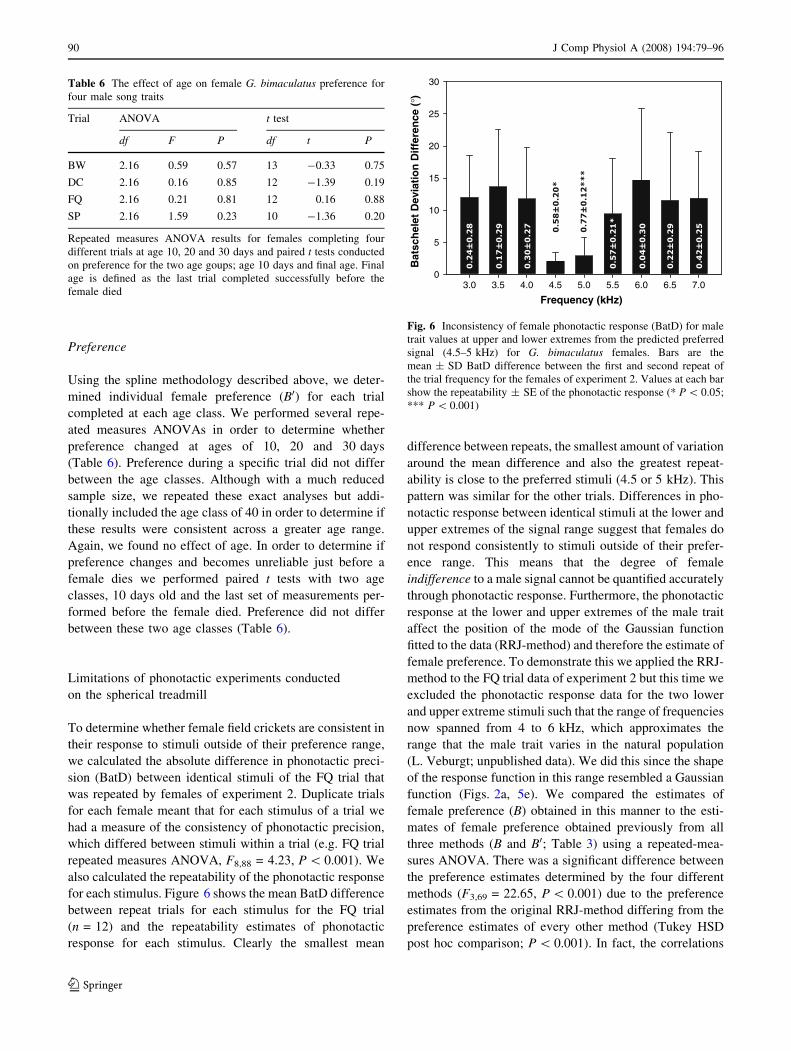
for each stimulus. Figure 6 shows the mean BatD difference
between repeat trials for each stimulus for the FQ trial
(n = 12) and the repeatability estimates of phonotactic
response for each stimulus. Clearly the smallest mean
difference between repeats, the smallest amount of variation
around the mean difference and also the greatest repeat-
ability is close to the preferred stimuli (4.5 or 5 kHz). This
pattern was similar for the other trials. Differences in pho-
notactic response between identical stimuli at the lower and
upper extremes of the signal range suggest that females do
not respond consistently to stimuli outside of their prefer-
ence range. This means that the degree of female
indifference to a male signal cannot be quantified accurately
through phonotactic response. Furthermore, the phonotactic
response at the lower and upper extremes of the male trait
affect the position of the mode of the Gaussian function
fitted to the data (RRJ-method) and therefore the estimate of
female preference. To demonstrate this we applied the RRJ-
method to the FQ trial data of experiment 2 but this time we
excluded the phonotactic response data for the two lower
and upper extreme stimuli such that the range of frequencies
now spanned from 4 to 6 kHz, which approximates the
range that the male trait varies in the natural population
(L. Veburgt; unpublished data). We did this since the shape
of the response function in this range resembled a Gaussian
function (Figs. 2a, 5e). We compared the estimates of
female preference (B) obtained in this manner to the esti-
mates of female preference obtained previously from all
three methods (B and B0; Table 3) using a repeated-mea-
sures ANOVA. There was a significant difference between
the preference estimates determined by the four different
methods (F3,69 = 22.65, P \ 0.001) due to the preference
estimates from the original RRJ-method differing from the
preference estimates of every other method (Tukey HSD
post hoc comparison; P \ 0.001). In fact, the correlations
Table 6 The effect of age on female G. bimaculatus preference for
four male song traits
Trial ANOVA t test
df F P df t P
BW 2.16 0.59 0.57 13 -0.33 0.75
DC 2.16 0.16 0.85 12 -1.39 0.19
FQ 2.16 0.21 0.81 12 0.16 0.88
SP 2.16 1.59 0.23 10 -1.36 0.20
Repeated measures ANOVA results for females completing four
different trials at age 10, 20 and 30 days and paired t tests conducted
on preference for the two age goups; age 10 days and final age. Final
age is defined as the last trial completed successfully before the
female diedFrequency (kHz)
3.0 3.5 4.0 4.5 5.0 5.5 6.0 6.5 7.0
)°( ecnereffi
D n
oitaiveD tele
hcstaB
0
5
10
15
20
25
30
Fig. 6 Inconsistency of female phonotactic response (BatD) for male
trait values at upper and lower extremes from the predicted preferred
signal (4.5–5 kHz) for G. bimaculatus females. Bars are the
mean ± SD BatD difference between the first and second repeat of
the trial frequency for the females of experiment 2. Values at each bar
show the repeatability ± SE of the phonotactic response (* P \ 0.05;
*** P \ 0.001)
90 J Comp Physiol A (2008) 194:79–96
123

between the preference estimates obtained from all methods
except the original RRJ-method were high and significant
(Table 7).
Discussion
Measuring phonotaxis in females with an angular offset
Previous studies on female crickets reported strong phono-
taxis but at an erroneous angle (e.g. Fig. 3) to the sound
source (Thorson et al. 1982; Doherty 1985a; Schul et al.
1998; Schul 1998), yet only a single study has attempted to
correct for this phenomenon (Schul 1998). Measures of
phonotactic response that include a term for angular devia-
tion from the sound source underestimate the performance
of a female with an asymmetrical auditory system. Our
results show that Batschelet deviation, a measure indepen-
dent of the angle of the mean vector, is an efficient tool for
population level analysis of phonotaxis, since we were not
interested in a females’ absolute ability to locate a speaker
but in her tracking precision of where she perceived the
speaker to be located. While this ensured that a female’s
angular offset would not affect the calculation of her
phonotactic response, a potential problem arises if a female
walks constantly in any random specific direction for the
entire duration of a stimulus, yielding low angular deviation
and falsely indicating accurate tracking. However, this
problem is a feature of any measure of phonotactic response
that does not include a term for angular deviation from the
sound source e.g. ‘‘relative vector length’’ (Eq. 1, Loher
et al. 1992) or ‘‘relative distance run’’ (Hedrick and Weber
1998) and is not restricted to our measure. Even relative
phonotaxis (PR; Schul 1998), which is one of the only
phonotaxis measures that controls for asymmetrical auditory
systems, can indicate good phonotaxis if a female walks in a
similar incorrect direction for both the control and the
test stimulus. However, after viewing female phonotactic
response for more than 10,000 stimuli, we could not identify
a single occurrence where a responsive female walked in an
incorrect direction and maintained that direction throughout
the presentation of a stimulus. Nevertheless, we recommend
that phonotactic response during trials are visualised (as in
Fig. 1) and screened for abnormal phonotactic behavior
before the quantification thereof.
Several females shown in Fig. 4 took up to 10 s longer
on average to locate one of the speakers due to their
angular offset. The significant effect of angular offset on
the time taken to switch between speakers (Fig. 4) affected
quantification of within-stimulus between-speaker varia-
tion in phonotaxis. Furthermore, calculation of phonotactic
response over the entire duration of the stimulus (1 min)
underestimates the phonotactic precision to one of the
speakers for a female with an angular offset. Since the
delay in orientation to a speaker is not the same for both
speakers, between-speaker differences in phonotaxis can
arise. We corrected for this problem by quantifying
phonotactic response (BatD) only after the female had
orientated to within 30� of her perceived speaker direction.
However, if a female did not orientate to within 30� of her
perceived speaker direction at all during a particular
stimulus then the BatD was calculated for the entire
duration of the stimulus (1 min). Variation in the magni-
tude of angular offset between repeated trials for the same
female could arise if tiny objects (e.g. dust) impair the
function of one of the tympani, causing auditory asym-
metry (e.g. horizontal error bars in Fig. 4) for one of the
trials. It is unlikely that such temporary auditory asym-
metry can be completely avoided and therefore, where
applicable, experiments should control for phonotactic
asymmetry to ensure accurate measurement of phonotaxis
(e.g. Schul 1998).
Finally, the distinction needs to be made between
auditory asymmetry and motor bias (turning bias to one
side), the former occurring when the tympanum and asso-
ciated neurons on one side function less effectively than on
the other and the latter occurring where individuals tend to
veer to a particular side irrespective of auditory input.
Motor bias may account for the asymmetrical phonotactic
behaviour observed during switches between speakers
where the angular pathway chosen is greater to one side.
However, Boyan (1979) found that 83% of Teleogryllus
commodus had inherent left/right asymmetric spiking
responses in the S and L auditory neurons indicating an
asymmetry before motor control commences. Temporary
auditory asymmetry caused by small particles on the
tympanum (discussed above) will result in variation in the
duration to locate a speaker (error bars in Fig. 4) because
the particles are not always present or their effect on
hearing is not constant. Motor bias should be more
repeatable between trials because it is hard-coded by the
Table 7 Correlation matrix (Pearson r) of female preference (B and
B0) estimates obtained from four different methodologies for the FQ
trial of experiment 2 (n = 12)
RRJ Spline Polynomial
min2 0.35 0.91*** 0.79***
RRJ 0.39 0.24
Spline 0.93***
RRJ refers to the non-linear regression (Reinhold et al. 2002) and
min2 refers to the application of the RRJ-method while excluding the
phonotactic response of the two upper and lower extreme frequencies
so that the preference estimates were derived from phonotactic
response data that spanned 4–6 kHz
*** P \ 0.001
J Comp Physiol A (2008) 194:79–96 91
123
CNS. The occurrence of an angular offset where females
tracked the speaker at an erroneous angle (Figs. 4, 5)
cannot be explained by motor bias alone. The typical
meandering about the speaker direction would occur across
the speaker direction but with greater translation angles to
one side if motor bias were solely responsible for the
behaviour. Although it is possible that motor bias could
override auditory asymmetry or cause similar phonotactic
observations, our methodology will control for either in
unison or acting in concert.
Constraints of the Kramer treadmill
A small but significant proportion of variation in BatD
attributable to between-speaker differences in phonotaxis
(Table 2) was brought about by the mechanical arrange-
ment of the experimental equipment, specifically the
position of the speakers relative to the two motors driving
the sphere and the acceleration of each motor. Motor A was
positioned at 45� and motor B at 135�. This arrangement
meant that when a female was moving towards speaker 1
(situated at 210�), motor A was mainly responsible to
compensate for the forward acceleration of the female and
motor B was mainly responsible for the angular correction
of the female’s course. However, when a female was
moving toward speaker 2, both motors were simulta-
neously responsible for forward acceleration compensation
and angular corrections. Since no two motors have iden-
tical acceleration, failure of one motor to accelerate equally
when a female moved directly toward 90� would result in a
small angular error towards the direction of the slower of
the two motors. Females would then have to correct for this
angular error and therefore the resulting BatD would be
greater for speaker 2 as is evident in Table 2 and visually in
the trace diagram of Figs. 1 and 4. When calculating
female response for a male trait however, the phonotactic
precision toward both speakers was used in the generation
of the response function (Fig. 2) and therefore conclusions
about female response are not affected by these small yet
significant differences.
Female indifference to a male signal cannot be quanti-
fied to the same level of accuracy as female preference.
Doherty (1985b) showed that the tracking scores (a mea-
sure of phonotactic response) calculated for G. bimaculatus
females in ‘‘no-choice’’ sequential experiments on syllable
period had minimal variability in the effective range (40–
45 ms) while stimuli with syllable periods at the margins of
the effective range (30–35 and 50–60 ms) yielded variable
scores within and between individuals. Also, Fig. 2 in Gray
and Cade (1999) shows increased standard deviations for
female net vector scores (their measure of phonotactic
response) to both the upper- and lower extreme values for
syllables per trill that G. integer females were exposed to.
Our findings on female indifference are therefore not new,
but the significance thereof have not been discussed to
date. For example, Gray and Cade (1999) report a lack of
heritable variation in female selectivity for syllables per
trill in G. integer but do not discuss the effect of unreliable
female response at the extreme male trait values on their
measure of female selectivity. Consequently, their inability
to detect heritable variation in female selectivity for pulses
per trill may be tentative.
Phonotaxis towards a standard stimulus
Females from experiment 1 did not show reduced phono-
tactic precision or become unresponsive after the
presentation of many stimuli (first nested ANOVA). We
could also not detect any effect of reduced phonotactic
precision due to fatigue per se. While this indicated reli-
ability of phonotactic response within a trial, the small
proportion of variation in phonotactic response to a stan-
dard stimulus between different trials (Table 2) showed
that females tracked this stimulus with similar precision,
irrespective of the stimulus setup of the trial. This was not
because all females tracked the stimulus with the same
accuracy since significant between-individual variation in
phonotactic precision was found (Table 2), which was
independent of body size or the absence of a hind leg.
Furthermore, individual phonotactic response to a standard
stimulus is highly repeatable between replicates of the
same trial (Table 3). Given the reliability of phonotactic
response in this species it is therefore valid to infer pref-
erence from phonotactic walking behaviour.
Methodology comparison
We do not believe the RRJ-method is appropriate for
estimating parameters of female response from our data
since the response function derived from this method
explained significantly less of the variation in BatD than
did the other methods (Table 4). The reason for this is
twofold. Firstly, imposing a Gaussian shape on the female
response function reduces the efficacy of that function to
explain the variation in the data, even if the distribution of
data deviates only slightly from the imposed shape. There
is no a priori reason to believe that our phonotactic data
should yield a response function that can be approximated
by the shape of a Gaussian curve. In fact, the shape of the
response function for frequency derived from the poly-
nomial regression and spline methods (Fig. 2a) remarkably
resemble the shape of auditory tuning curves derived from
auditory thresholds of low frequency neurons in the
92 J Comp Physiol A (2008) 194:79–96
123

prothoracic ganglia (AN1) which function as narrow band-
pass filters (Schildberger et al. 1989). Secondly, the stim-
ulus range over which we tested female response affects
the efficacy of the RRJ-method. The unreliable phonotactic
response at the extreme male trait values affects the posi-
tion of the maximum of the Gaussian function and
therefore the estimate of female preference for the RRJ-
method, whereas the estimates of female preference from
spline and polynomial regression methods are not greatly
affected as evident from their significant correlation
(Table 7). Since female phonotactic response is reliable
close to the predicted species preference for field crickets
and for some stimuli has a shape similar to that of an
inverted Gaussian function, the RRJ-method may be useful
if applied to data comprising phonotactic response to many
stimuli situated close to the predicted species preference
for that trait. For example, there is strong congruence
between the preference estimates for FQ derived from the
spline, polynomial regression and RRJ-method where we
excluded the phonotactic response data for the two lower
and upper extreme stimuli (min2; Table 7).
Female preference (B) derived from the RRJ-method
was unlikely to reflect true female preference of our
crickets (see discussion above), and therefore the estimates
of repeatability for B are not biologically relevant. Mea-
surements of response magnitude (R) at B are consequently
also problematic in the case of our data. This can be vis-
ualised by the poor correspondence between R and the raw
phonotactic response data (Fig. 2b). The two significant
repeatability estimates of R from the RRJ-method (BW and
FQ in Table 3) are therefore interpreted as spurious. Fur-
thermore, the single significant repeatability estimate for
FQ selectivity (C) derived from the RRJ-method is also
likely to be spurious since both the spline and polynomial
regression methods failed to detect repeatable selectivity
for FQ (Table 3). We therefore do not discuss repeatability
estimates derived from the RRJ-method.
Repeatability of response functions
Response magnitude (R0)
The phonotactic response magnitude (R0) at the peak
preference (B and B0) was not always repeatable (Table 3).
Due to high phonotactic precision by all females there was
little observable variation in R0 between females when they
were tracking the STD1 signal (low standard deviations in
Table 2). The smoothing effect of the spline further
reduced between-individual variation in R0 so that it was
not significant and hence repeatability was non-significant.
Conversely, the waviness of the polynomial regression (see
Schluter 1988) inflated between-individual variation in
several cases and yielded significant repeatabilities for
three of the trials. We do not believe that, for our phono-
tactic data, R0 is a reliable surrogate for the response rate
measured by Reinhold et al. (2002) who did not use
phonotactic data. Although variation in responsiveness can
mask variation in preference in some systems (Brooks and
Endler 2001), it is not likely to affect the calculation of
female preference here as we quantified preference from
phonotactic response data independently of the response
magnitude.
Female preference (B0)
For the repeatability of female preference (B0) (calculated
from the polynomial regression and spline methods for the
four male song traits; Table 3) there was strong congruence
between preference estimates derived from three different
methods (Table 7). For all of the trials, repeatability esti-
mates for B0 were significant, suggesting possible
quantitative genetic variation in preference for these male
traits (see Brooks and Endler 2001). The very broad pref-
erence for duty cycle decreased the between-individual
variation in preference and the repeatability is therefore
only marginally significant. However, the other estimates
of preference repeatability (BW, FQ and SP) are far greater
than the preference repeatabilities for number of pulses per
trill (0.50) and the inter-trill interval (0.59) reported for
G. integer by Wagner et al. (1995). The large degree of
between individual variation as reflected by the individual
response functions in Fig. 5 therefore reflects true and
repeatable sensory differences.
Female selectivity (C0)
There was almost no difference in the repeatability esti-
mates of C0 calculated from the polynomial regression and
the spline method (Table 3). The absence of repeatable
selectivity for DC arises since females responded well to
all duty cycles except the upper and lower extremes (10
and 90%). Consequently, almost no between-individual
variation in selectivity for duty cycle was detected and
therefore duty cycle is unlikely to be an important signal
trait for sexual selection in G. bimaculatus. Conversely,
females were highly selective for frequency and no
between-individual variation (and repeatability) in selec-
tivity could be detected. This does not rule out the
possibility of heritable variation in selectivity for this
species (see Brooks and Endler 2001). The significant
repeatability of selectivity for BW probably reflects a
combination of repeatable frequency preference and simi-
lar frequency selectivity between females, since frequency
J Comp Physiol A (2008) 194:79–96 93
123
preference is likely to determine bandwidth preference in
crickets (Simmons and Ritchie 1996). Females showed
significant repeatability of selectivity for the SP and
SP(Rev) trials (Table 3). Doherty (1985b), using similar
equipment to ours but a crude measure of phonotactic
response (% time tracked), showed that the syllable period
range tracked by G. bimaculatus females differed between
to and fro sequential trials. He did not calculate individual
response functions but used population-level data to arrive
at this conclusion. Our results using BatD show that SP
selectivity is repeatable, even if the sequence of stimuli is
reversed and further illustrate how population-level ana-
lyses can mask relevant individual variation in response
(Kime et al. 1998). To our knowledge, the only other
evidence for repeatability of female selectivity comes from
guppies (Brooks and Endler 2001) and grasshoppers
(Reinhold et al. 2002).
Effect of age on female preference
Female preference was not affected by age (Table 6).
Despite the significant degradation of phonotactic precision
just before a female dies (Table 5), her preference is still
measurable, similar to the findings of Gray (1999), Rein-
hold et al. (2002) and Olvido and Wagner (2004). The
findings of these authors together with those of this study
reveal no effect of age on female preference while
responsiveness appears to degrade with age. Although our
measure of phonotactic response is not directly comparable
to a measure of responsiveness, the decline in accurate
tracking ability is likely to reflect both neurological chan-
ges as well as changes in motivational level.
Shape of response functions in G. bimaculatus
Phonotactic response is a complex interaction between
environmental, neurological and behavioural components
and is therefore not easily quantified. The quantification of
the shape of female response is therefore not simple and
requires complex techniques such as cubic regressions
(Olvido and Wagner 2004), cubic splines (Ritchie 1996;
Brooks and Endler 2001; Ritchie et al. 2001; Simmons
et al. 2001) or non-linear regression (Reinhold et al. 2002).
Whenever possible, experiments to determine female
preference for a particular male trait should test an
abnormally wide range of stimuli, i.e. extreme trait values
that do not occur in the natural population on either side of
the trait distribution (e.g. Shaw and Herlihy 2000; Grace
and Shaw 2004). Female response functions based on such
tests will mostly be unimodal (except in the case of strong
directional selection) and therefore the shape of the
response function is relatively easy to approximate with a
high order polynomial equation or a nonlinear technique
such as the RRJ-method (Reinhold et al. 2002). However,
habituation or fatigue due to multiple testing may mask
variation in some response functions (Brooks and Endler
2001). A way to avoid this problem is to limit the number
of stimuli presented to a female by subjecting females to
stimuli differing at a relatively course-scale. Fine-scale
preference can then be estimated by interpolation using
mathematical tools. The applicability of these methods for
inferring fine-scale preference from course-scale experi-
ments is not limited to the field of bioacoustics.
Our experimental procedure to determine female pre-
ference has several advantages over other methods. Firstly,
the use of the Kramer treadmill has numerous advantages
over binomial choice tests in an arena, constant SPL of the
sound source being the most crucial. Also, the exact path of
the untethered female can be investigated after completion
of the experiment. Sequential presentation of stimuli has
many advantages over choice tests (Wagner 1998; Murphy
and Gerhardt 2000; Poulet and Hedwig 2005) although
carry-over effects may sometimes affect phonotactic
response (Doherty 1985b; Wagner 1998). However, the
high and significant preference (B0) and selectivity (C0)repeatability of the SP(Rev) trial, where we reversed the
sequence of stimuli (Table 3), suggests that, at least for
temporal stimuli, it is unlikely that the sequence of stimuli
affects the response of female G. bimaculatus.
Conclusion
Phonotactic response in G. bimaculatus varies between
individuals, is repeatable within individuals if the signal is
close to the predicted species preference, and is a reliable
measure for inferring individual preference at the popula-
tion level. We have developed methodology to quantify
female preference and selectivity from phonotactic
response that is independent of phonotactic asymmetry and
the effects of fatigue. The spline method for estimating
female preference may be directly applied to the study of
female preference in other taxa where a quantitative mea-
sure of female response is generated. We have shown that
female preference for certain male traits is highly repeat-
able and that although a females’ phonotactic precision
declines within a few days of death, it does not affect her
preference. Since we randomly selected females for our
experiments, the observed repeatable variation in female
preference may be due to either environmental effects
during development or heritable differences between
females. Low estimates of female preference repeatability
reported in the past may have been a result of the lack of
appropriate tools and methodology for quantifying female
94 J Comp Physiol A (2008) 194:79–96
123

preference accurately (Wagner 1998). The combination of
significant between-individual variation and the high
repeatability of female preference for BW, FQ and SP in
G. bimaculatus creates opportunities for new experiments
in the field of sexual selection.
Acknowledgments We thank H.U. Kleindienst and H. Bamberg for
their valuable assistance during our experimental phase at the Max
Planck Institute at Seewiesen. We also thank M. Ferreira and U.K.
Verburgt for their assistance throughout the duration of this project.
We are grateful to two anonymous reviewers. Their comments greatly
improved an earlier draft of this manuscript. LV and JWHF were
funded by the Deutsche Forschungsgemeinschaft (DFG) and the
National Research Foundation (South Africa, NRF). Our experiments
did not require approval by the Animal Use and Care Committee of
the University of Pretoria since we worked with invertebrates.
References
Bailey WJ, Thomson P (1977) Acoustic orientation in the cricket
Teleogryllus oceanicus (Le Guillou). J Exp Biol 67:61–75
Bailey WJ, Yang S (2002) Hearing asymmetry and auditory acuity in
the Australian bushcricket Requena verticalis (Listroscelidinae;
Tettigoniidae; Orthoptera). J Exp Biol 205:2935–2942
Batschelet E (1981) Circular statistics in biology. Academic,
New York
Becker WA (1984) Manual of quantitative genetics, 4th edn.
Academic, Pullman
Boake CRB (1989) Repeatability: its role in evolutionary studies of
mating behavior. Evol Ecol 3:173–182
Boyan GS (1979) Directional responses to sound in the central
nervous system of the cricket Teleogryllus commodus (Orthop-
tera: Gryllidae). I. Ascending interneurons. J Comp Physiol A
130:137–150
Brooks R, Endler JA (2001) Female guppies agree to differ:
phenotypic and genetic variation in mate-choice behavior and
the consequences for sexual selection. Evolution 55:1644–1655
Doherty JA (1985a) Trade-off phenomena in calling song recognition
and phonotaxis in the cricket, Gryllus bimaculatus (Orthoptera,
Gryllidae). J Comp Physiol A 156:787–801
Doherty JA (1985b) Phonotaxis in the cricket, Gryllus bimaculatusDe Geer: comparison of choice and no-choice paradigms.
J Comp Physiol A 157:279–289
Falconer DS, Mackay TFC (1996) Introduction to quantitative
genetics. Longman, Harton
Faure PA, Hoy RR (2000) Auditory symmetry analysis. J Exp Biol
203:3209–3223
Gagliardo A, Ioale P, Bingman VP (1999) Homing in pigeons: the
role of the hippocampal formation in the representation of
landmarks used for navigation. J Neurosci 19:311–315
Gerhardt HC, Huber F (2002) (ed) Acoustic communication in insects
and anurans: common problems and diverse solutions. The
University of Chicago Press, Chicago
Grace JL, Shaw KL (2004) Effects of developmental environment on
signal-preference coupling in a Hawaiian cricket. Evolution
58:1627–1633
Gray DA (1999) Intrinsic factors affecting female choice in house
crickets: time cost, female age, nutritional condition, body size,
and size-relative reproductive investment. J Insect Behav
12:691–700
Gray DA, Cade WH (1999) Quantitative genetics of sexual selection
in the field cricket, Gryllus integer. Evolution 53:848–854
Hedrick A, Weber T (1998) Variance in female response to the fine
structure of male song in the field cricket, Gryllus integer. Behav
Ecol 9:582–591
Hedwig B, Poulet JFA (2004) Complex auditory behaviour emerges
from simple reactive steering. Nature 430:781–785
Hedwig B, Poulet JFA (2005) Mechanisms underlying phonotactic
steering in the cricket Gryllus bimaculatus revealed with a fast
trackball system. J Exp Biol 208:915–927
Henley J, Greenwood J, Stout J, Atkins G (1992) Age-correlated
changes and juvenile hormone III. Regulation of the syllable
period specific responses of the L3 auditory interneurons in
the cricket, Acheta domesticus. J Comp Physiol A 170:
373–378
Huber F, Moore TE, Loher W (1989) Cricket behavior and
neurobiology. Cornell University Press, Ithaca
Hunt J, Brooks R, Jennions MD (2005) Female mate choice as a
condition-dependent life-history trait. Am Nat 166:79–92
Jennions MD, Petrie M (1997) Variation in mate choice and mating
preferences: a review of causes and consequences. Biol Rev
72:283–327
Kime NM, Rand AS, Kapfer M, Ryan MJ (1998) Consistency of
female choice in the tungara frog: a permissive preference for
complex characters. Anim Behav 55:641–649
Kramer E (1976) The orientation of walking honeybees in odour
fields with small concentration gradients. Physiol Entomol
1:27–37
Loher W, Weber T, Huber F (1992) The effect of mating on
phonotactic behavior in the cricket Gryllus bimaculatus (De
Geer). Physiol Entomol 18:57–66
Murphy CG, Gerhardt HC (2000) Mating preference functions of
individual female barking treefrogs, Hyla gratiosa, for two
properties of male advertisement calls. Evolution 54:660–669
Olvido AE, Wagner WE Jr (2004) Signal components, acoustic
preference functions and sexual selection in a cricket. Biol J
Linn Soc 83:461–472
Poulet JFA, Hedwig B (2005) Auditory orientation in crickets: pattern
recognition controls reactive steering. Proc Natl Acad Sci
102:15665–15669
Prosser M, Murray AM, Cade WH (1997) The influence of female age
on phonotaxis during single and multiple song presentations in
the field cricket Gryllus integer (Orthoptera: Gryllidae). J Insect
Behav 10:437–449
Reinhold K, Reinhold K, Jacoby KJ (2002) Dissecting the repeat-
ability of female choice in the grasshopper Chorthippusbiguttulus. Anim Behav 64:245–250
Rice WR (1989) Analysing tables of statistical tests. Evolution
43:223–225
Ringach DL, Shapley RM, Hawken MJ (2002) Orientation selectivity
in macaque V1: diversity and laminar dependence. J Neurosci
22:5639–5651
Ritchie MG (1996) The shape of female mating preferences. Proc
Natl Acad Sci 93:14628–14631
Ritchie MG, Saarikettu M, Livingstone S, Hoikkala A (2001)
Characterisation of female preference functions for Drosophilamontana courtship song and a test of the temperature coupling
hypothesis. Evolution 55:721–727
Ryan MJ, Rand AS (1993) Species recognition and sexual selection as
a unitary problem in animal communication. Evolution 47:647–
657
Schildberger K, Huber F, Wohlers DW (1989) Central auditory
pathway: neuronal correlates of phonotactic behavior. In: Huber
F, Moore TE, Loher W (eds) Cricket behavior and neurobiology.
Cornell University Press, Ithaca, pp 423–458
Schluter D (1988) Estimating the form of natural selection on a
quantitative trait. Evolution 42:849–861
J Comp Physiol A (2008) 194:79–96 95
123

Schul J (1998) Song recognition by temporal cues in a group of
closely related bushcricket species (genus Tettigonia). J Comp
Physiol A 183:401–410
Schul J, von Helversen D, Weber T (1998) Selective phonotaxis in
Tettigonia cantans and T viridissima in song recognition and
discrimination. J Comp Physiol A 182:687–694
Schmitz B (1985) Phonotaxis in Gryllus campestris L (Orthoptera,
Gryllidae). III. Intensity dependence of the behavioural perfor-
mance and relative importance of tympana and spiracles in
directional hearing. J Comp Physiol A 156:165–180
Shaw KL, Herlihy DP (2000) Acoustic preference functions and song
variability in the Hawaiian cricket Laupala cerasina. Proc R Soc
Lond B 267:577–584
Simmons L, Ritchie MG (1996) Symmetry in the songs of crickets.
Proc R Soc Lond B 263:1305–1311
Simmons LW, Zuk M, Rotenberry JT (2001) Geographic variation in
female preference functions and male songs of the field cricket
Teleogryllus oceanicus. Evolution 55:1386–1394
Stout J, Walikonis R, Atkins G (1989a) The influence of age and JHIII
levels on the sound processing characteristics of ascending
auditory neurons in female crickets (Acheta domesticus). In:
Erber J, Menzel R, Pfluger HJ, Todt D (eds) Neural mechanisms
of behavior. Thieme Medical, New York
Stout J, Walikonis R, Atkins G (1989b) The influence of age and
JHIII levels on the phonotactic response of female crickets
(Acheta domesticus). In: Erber J, Menzel R, Pfluger HJ, Todt D
(eds) Neural mechanisms of behavior. Thieme Medical, New
York
Stout J, Atkins G, Zacharias D (1991) Regulation of cricket
phonotaxis through hormonal control of the threshold of an
identified auditory neuron. J Comp Physiol A 169:765–772
Thorson J, Weber T, Huber F (1982) Auditory behavior of the cricket
II simplicity of calling-song recognition in Gryllus and anom-
alous phonotaxis at abnormal carrier frequencies. J Comp
Physiol A 146:361–378
Wagner WE Jr (1998) Measuring female mating preferences. Anim
Behav 55:1029–1042
Wagner WE Jr, Murray A, Cade WH (1995) Phenotypic variation in
the mating preferences of female field crickets, Gryllus integer.
Anim Behav 49:1269–1281
Walikonis R, Schoun D, Zacharias D, Henley J, Coburn P, Stout J
(1991) Attractiveness of the male Acheta domesticus calling
song to females. III. The relation of age-correlated changes in
syllable period recognition and phonotactic threshold to juvenile
hormone III biosynthesis. J Comp Physiol A 169:751–764
Weber T, Thorson J, Huber F (1981) Auditory behavior of the
cricket I dynamics of compensated walking and discrimination
paradigms on the Kramer treadmill. J Comp Physiol A
141:215–232
Widemo F, Saether SA (1999) Beauty is in the eye of the beholder:
causes and consequences of variation in mating preferences.
Trends Ecol Evol 14:26–31
96 J Comp Physiol A (2008) 194:79–96
123
Copyright © 2022 FDOKUMEN