A BEHAVIOURAL ANALYTIC APPROACH TO CONSUMER ...
410
A BEHAVIOURAL ANALYTIC APPROACH TO CONSUMER CHOICE AS FORAGING by Zurina Mohaidin A Thesis Submitted In Fulfilment of the Requirements for the Degree of Doctor of Philosophy of Cardiff University Marketing & Strategy Section Cardiff Business School, Cardiff University September 2011
-
Upload
khangminh22 -
Category
Documents
-
view
0 -
download
0
Transcript of A BEHAVIOURAL ANALYTIC APPROACH TO CONSUMER ...

A BEHAVIOURAL ANALYTIC APPROACH TO CONSUMER
CHOICE AS FORAGING
by
Zurina Mohaidin
A Thesis Submitted In Fulfilment of the Requirements for the Degree of Doctor of Philosophy of Cardiff University
Marketing & Strategy Section Cardiff Business School, Cardiff University
September 2011

UMI Number: U584562
All rights reserved
INFORMATION TO ALL USERS The quality of this reproduction is dependent upon the quality of the copy submitted.
In the unlikely event that the author did not send a com plete manuscript and there are missing pages, th ese will be noted. Also, if material had to be removed,
a note will indicate the deletion.
Dissertation Publishing
UMI U 584562Published by ProQuest LLC 2013. Copyright in the Dissertation held by the Author.
Microform Edition © ProQuest LLC.All rights reserved. This work is protected against
unauthorized copying under Title 17, United States Code.
ProQuest LLC 789 East Eisenhower Parkway
P.O. Box 1346 Ann Arbor, Ml 48106-1346

Ca r d if fU NIVERSITY
DECLA (RATION
This work has not previously been accepted in substance for any degree and is not concurrently submitted in candidature for any degree.
C a r d i f f
B u s i n e s s
S c h o o l
S ig n e d .....
D a te ..........
STATEMENT 1
(Zurina Mohaidin)
?oii
This thesis is being submitted in partial fulfillment of the requirements for the degree of Doctor of Philosophy
........................................... (Zurina Mohaidin)S ig n e d .........
'TV /|
STATEMENT 2
This thesis is the result of my own independent work/investigation, except where otherwise stated.Other sources are acknowledged by footnotes giving explicit references.
....................................... (Zurina Mohaidin)Signed ...
STATEMENT 3
I hereby give consent for my thesis, if accepted, to be available for photocopying and for inter- library loan, and for Jhe title and summary to be m ade available to outside organisations.
................................................(Zurina Mohaidin)S ig n ed .......
h [*>rII
ii

&c/ineut£edgmen£a
I would be very remiss if I did not thank the many people who helped survive thebirthing of this thesis:
I am so lucky to discover Professor Gordon Foxall and to have him as my supervisor is a bonus and the strong bone of this thesis. He has amazingly opened and then led me through the way to succeed. His understanding, faith and patience have relieved most of my deranged and confused state of mind to keep polishing this piece of work until it shines.
It is also wonderful to get to know and work with Dr Victoria Wells and Dr Mirella Yani-de Soriano. They have helped me a lot with their invaluable input, encouraging enthusiasm and unwavering faith in my work. It is very comforting to work with such dedicated supervisors like them.
Everyone at Room P26, Aberconway has been such lovely and caring friends and families to me. Thank you for the love, patience, friendship and humour. We have been together throughout the good and bad days for the past four years and will certainly continue this relationship for the rest of our lives.
My families in Malaysia have inspired and motivated me to complete this thesis. I am forever in debt to them for their concern and prayers are always with me. To my beloved late parents, if tears could build a stairway and heartache makes a lane, I would walk the path to heaven and bring you back again, to share this happiness.
My husband and four daughters have been incredibly long-suffering. I am ever so sorry that I had to drag them with me throughout this lonely and bitter journey, just to pursue this dream of mine. 1 wish I could give happiness in every single bit of their lives but there was only so much to be done that I often ignored their needs. Only few lucky people are lucky enough to have endless love and support, a shoulder to cry on and I am truly grateful to be one of the lucky ones. Thank you for still believing in me and for staying around me. This could not have happened without your everlasting love.
Lastly, I offer my thanks and regards to all of those who supported me in any respect during the completion of this thesis.

ABSTRACT
Human behaviour can be explained not only through experience and environments but also by incorporating evolutionary explanation. Consumer behaviour could not be understood accurately without infusing Darwinian evolutionary theory which has contributed in the knowledge of human nature. Evolutionary psychology revolves around the human's evolved mental and the impact on human's traits and behaviour where the influence of the environment to our genes would determine our individual behaviour and traits, resulting in variation among us. Foraging which is a part of behavioural ecology involves many sequences or repetitions of animals' activities and decision making which is useful to relate these patterns of activities to the decisions made in human consumption. The aim of this research is to investigate the similarities of human consumption and ecological behaviour by employing interpretative and comparative approach. It is hoped that by applying the evolutionary theory in explaining consumer choice, this study is able to contribute to the development of behavioural ecology in human consumption.
The theories and methodologies used by behavioural economists are utilized as the contexts are proven useful in analysing the consumer’s purchase behaviour to the economic variables that influence them. The analysis of the data is done aggregately for 200 consumers and individually for 20 consumers, who have purchased four product categories over a year. The results suggest that most of consumers show matching except for baked beans, signalling the substitutability of brands, and exhibit maximisation for all product categories, indicating that consumers maximise a combination of both the utilitarian and informational benefits.
This study concludes that the theories of evolutionary psychology, foraging, behavioural economics and behavioural perspective model can fit to the consumers’ buying behaviour implicating its usefulness in explaining the consumers' choice.
Keyword: Evolutionary psychology, foraging brand choices, behavioural economics, brand choice
Table of ContentsPage
Declaration ii
Acknowledgement iii
Abstract iv
Table o f Contents V
List o f Tables ix
List o f Figures xi
List o f Appendices xii
List o f Abbreviation xiii
Chapter 1: Introduction1.0 Introduction.........................................................................................................................................21.1 Background of the Study.................................................................................................................. 31.2 Theoretical Background.................................................................................................................... 71.4 Research Q uestions......................................................................................................................... 141.5 Research Objectives........................................................................................................................141.6 Research Methodology....................................................................................................................151.7 The structure of the th esis .............................................................................................................171.8 Summary............................................................................................................................................20
Chapter 2: Marketing Background: Consumer and Patterns of Brand and Store Choices
2.0 Introduction...................................................................................................................................... 222.1 Marketing and Consumer Behaviour............................................................................................ 222.2 Patterns of Brand Choice................................................................................................................ 272.3 Patterns of Store Choices............................................................................................................... 342.4 The Role of Price...............................................................................................................................37
Chapter 3: Theoretical Framework: Evolutionary Psychology and Foraging
3.0 Introduction.......................................................................................................................................4 33.1 Evolutionary Psychology................................................................................................................. 4 43.2 Inclusive Fitness and Reciprocal Altruism.....................................................................................493.3 The survival of hunter>gatherer.................................................................................................... 523.4 Language and the Human Brain.................................................................................................... 563.5 Foraging Analysis..............................................................................................................................61
3.5.1 Patch........................................................................................................................................... 653.5.2 Prey............................................................................................................................................. 693.5.3 Optimal Foraging......................................................................................................................713.5.4 Affluent Foraging...................................................................................................................... 75
3.6 Conceptual Fram ework...................................................................................................................773.7 Summary............................................................................................................................................ 81
Chapter 4: Theoretical Framework: Behavioural Economics and Behavioural Perspective Model
4.0 Introduction.......................................................................................................................................834.1.1 Rationality and optim isation.................................................................................................. 904.1.2 Bounded Rationality and M elioration...................................................................................934.1.3 Substitutability and M atching................................................................................................964.1.4 The Matching Law....................................................................................................................994.1.5 Schedules of Reinforcement................................................................................................. 107
4.2 Behavioural Perspective Model................................................................................................... 1104.3 Summary.......................................................................................................................................... 123
Chapter 5: Methodology
5.0 Introduction.....................................................................................................................................1255.1 Research Philosophy...................................................................................................................... 1265.2 Research Paradigm........................................................................................................................ 1285.3 Research Design..............................................................................................................................1315.4 Research Strategy...........................................................................................................................132
5.4.1 Deductive Research Approach..............................................................................................1325.5 Research M ethod ...........................................................................................................................133
5.5.1 Quantitative Research........................................................................................................... 1335.6 The Analysis.....................................................................................................................................I 34
5.6.1 Sample Description.................................................................................................................1345.6.2 Data Purification..................................................................................................................... 138
5.7 Validity and Reliability................................................................................................................... I 3 95.8 Measures and Analysis..................................................................................................................I 42
5.8.1 Denominator............................................................................................................................I 4 55.8.2 Individual Level of Analysis....................................................................................................I 4 65.8.3 Proportional vs. Ratio calculations...................................................................................... I 4 95.8.4 Matching Analysis................................................................................................................... I 52

5.8.5 Relative Demand Analysis.................................................................................................... 1565.8.6 Maximisation Analysis...........................................................................................................1595.8.7 Utilitarian and Informational Reinforcement.....................................................................161
5.8.7.1 Brands...............................................................................................................................1615.8.7.2 Stores................................................................................................................................165
5.9 Summary....................................................................................................................................... 167
Chapter 6: Statistical Analysis and Discussion
6.0 Introduction.................................................................................................................................... 1706.1 General Overview.......................................................................................................................... 1706.2 Brand Choice Patterns.................................................................................................................. 1736.3 Consumer's Choice from a Behavioural Economics Perspective............................................ 177
6.3.1 Matching Analysis.................................................................................................................. 1786.3.1.1 Baked Beans.....................................................................................................................1786.3.1.2 Fruit Juice......................................................................................................................... 1836.3.1.3 Yellow Fats.......................................................................................................................1886.3.1.4 Biscuits..............................................................................................................................192
6.3.2 Relative Demand Analysis.................................................................................................... 1976.3.2.1 Baked Beans.....................................................................................................................1986.3.2.2 Fruit Juice, Yellow Fats and Biscuits............................................................................ 204
6.3.3 Maximisation.......................................................................................................................... 2186.3.3.1 Baked Beans.................................................................................................................... 2196.3.3.2 Fruit Juice.........................................................................................................................2236.3.3.3 Yellow Fats.......................................................................................................................2276.3.3.4 Biscuits............................................................................................................................. 231
6.4 Previous Research.......................................................................................................................... 2366.4.1 Matching..................................................................................................................................2376.4.2 Relative Demand Analysis.................................................................................................... 2386.4.3 Maximisation.......................................................................................................................... 239
6.5 Patterns of Reinforcement...........................................................................................................2416 .6 Summary..........................................................................................................................................246
Chapter 7: Interpretation: Evolutionary Psychology and Foraging in Human Consumption
7.0 Introduction.................................................................................................................................... 25 37.1 Evolutionary Psychology in Human Consumption.................................................................... 2547.2 Food Preferences and Advertisements......................................................................................2567.3 Modern Shopping as in Gathering...............................................................................................2607.4 Reinforcement as an Evolutionary Process............................................................................... 2637.5 Foraging in Human Consumption................................................................................................2 6 97.6 Patch Definition............................................................................................................................. 27 2
7.6.1 Stores as Patch........................................................................................................................2 7 27.6.2 Brands as Patch.......................................................................................................................2 7 6
7.7 Patch Sampling and Patch Assessm ent......................................................................................2 7 7
7.8 Prey...................................................................................................................................................28 2
7.9 Currency........................................................................................................................................... 2837.10 C onstraint......................................................................................................................................2887.11 Maximising or M atching?........................................................................................................... 2937.12 Summary........................................................................................................................................ 296
Chapter 8: Summary and Conclusion
8.0 Introduction.....................................................................................................................................2998.1 Research Overview........................................................................................................................ 3008.2 Main Findings................................................................................................................................. 3018.3 Research Contribution...................................................................................................................3138.4 Limitations.......................................................................................................................................3168.5 Future Direction..............................................................................................................................3198 .6 Summary.......................................................................................................................................... 320
References 322
Appendixes 341
viii
117
121
130
137
145
165
167
172
174
175
175
176
177
179184
188
192
198
203
205
209
213
217
219
223227
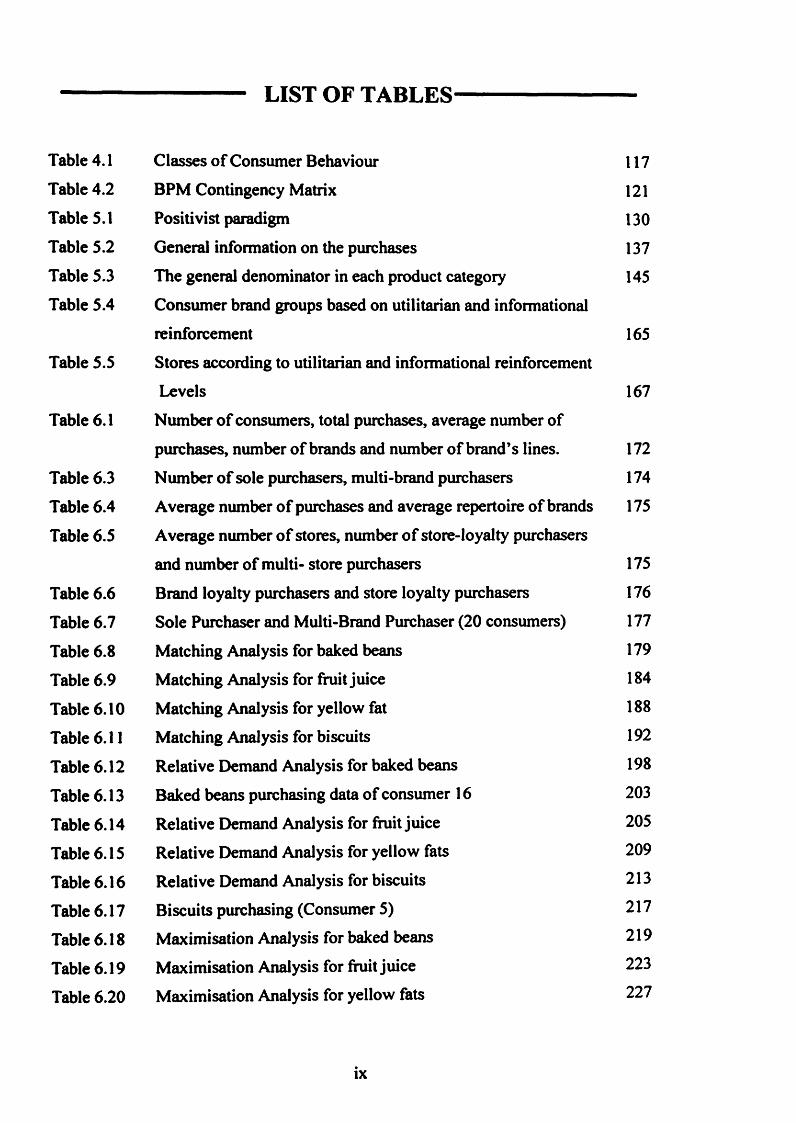
LIST OF TABLES
Classes of Consumer Behaviour
BPM Contingency Matrix
Positivist paradigm
General information on the purchases
The general denominator in each product category
Consumer brand groups based on utilitarian and informational
reinforcement
Stores according to utilitarian and informational reinforcement Levels
Number of consumers, total purchases, average number of
purchases, number of brands and number of brand’s lines.
Number of sole purchasers, multi-brand purchasers
Average number of purchases and average repertoire of brands
Average number of stores, number of store-loyalty purchasers
and number of multi- store purchasers
Brand loyalty purchasers and store loyalty purchasers
Sole Purchaser and Multi-Brand Purchaser (20 consumers)
Matching Analysis for baked beans
Matching Analysis for fruit juice
Matching Analysis for yellow fat
Matching Analysis for biscuits
Relative Demand Analysis for baked beans
Baked beans purchasing data of consumer 16
Relative Demand Analysis for fruit juice
Relative Demand Analysis for yellow fats
Relative Demand Analysis for biscuits
Biscuits purchasing (Consumer 5)
Maximisation Analysis for baked beans
Maximisation Analysis for fruit juice
Maximisation Analysis for yellow fats
ix

231
237
238
240244
245
245
246
257
262
266
268
279
280
281
284
286
288290
Maximisation Analysis for biscuits
Matching analysis results for baked beans, fruit juice,
yellow fats and biscuits (Aggregate analysis)
Relative demand analysis results for baked beans, fruit juice,
yellow fats and biscuits (Aggregate analysis)
Maximisation analysis results for baked beans, fruit juice,
yellow fats and biscuits (Aggregate analysis)
Reinforcement level and consumer group - Baked Beans
Reinforcement level and consumer group - Fruit Juice
Reinforcement level and consumer group - Yellow Fats
Reinforcement level and consumer group - Biscuits
Average packs of biscuits, yellow fats, fruit juice and
baked beans purchased by each respondent.
Consumer 17 - Purchasing history
Levels of utilitarian and informational reinforcement(biscuit)
for each respondent
Numbers of utilitarian and informational reinforcement for
baked beans, fruit juice, yellow fats and biscuits
Stores patronage for buying baked beans, fruit juice, yellow
fats and biscuits for Consumer 9
Percentage of sole buyers and multi brand purchasers for
baked beans, fruit juice, yellow fats and biscuits
Biscuits purchasing history of consumer 17
List of stores according to utilitarian and informational
reinforcementLevels of utilitarian and informational reinforcement for
baked beans, fruit juice, yellow fats and biscuits
Fruit juice purchasing history of Consumer 8
Biscuits purchasing history of Consumer 17
x

50
63
77
78
112
144
258
274
276
291
293
LIST OF FIGURES
Genetic relatedness among different types of relatives
The foraging hierarchy
Behavioural Perspective Model
Conceptual Framework
Behavioural Perspective Model framework
Steps in the analysis
Gel Monte orange juice packaging
Stores patronage for purchasing baked beans, fruit juice,
yellow fats and biscuits
Stores patronage according to age
Matching Analysis
Stores patronage according to social class
xi

LIST OF APPENDICES
Appendix A Appendix B Appendix C Appendix D
Utilitarian and informational level of baked beans Utilitarian and informational level of fruit juice Utilitarian and informational level of yellow fats Utilitarian and informational level of biscuits
342346355361
xii

LIST OF ABBREVIATION
BPM Behavioural Perspective ModelDRH Delay-reduction hypothesisFMCG Fast moving consumer goodsMVT Marginal value theoremMKQ Mean scores for knowledge and qualityUR Utilitarian reinforcementIR Informational reinforcement

CHAPTER ONE

■» CHAPTER ONE-*INTRODUCTION
1.0 Introduction
The present study intends to investigate and explore the similarities between
evolutionary psychology, specifically foraging; and humans' purchasing behaviour in
selecting brands and stores. The survival activities of hunter-gatherers during the
Pleistocene period and animals' foraging behaviour are applied to address humans'
consumption situations, as the pattern of activities which constitute consumption in
humans can be viewed as akin to foraging in non-human animals.
The theories and methodologies of behavioural economics and Behavioural Perspective
Model will be employed in this study, as these contexts have proven useful in analysing
consumers' purchasing behaviour and economic variables that influence them. This
study attempts to examine the decision mechanisms used by consumers in making
choices by applying individual analysis, as looking at the individualistic behaviour
allows the relationship between the individual subject and its environment to be
explored.
This chapter provides an introduction to this thesis. The background of the study,
research rationale, research objectives, research questions and research methodology
2

that underpin this thesis are explored and declared. The structure of this thesis is then
outlined.
1.1 Background of the Study
The study of consumer behaviour has been the focus of interest of many scholars over
the past decades. Consumer behaviour itself can be defined as the acquisition,
consumption and disposition of products, services, time and ideas by decision-making
units (Jacoby, 1976). It involves the study of how humans use scarce resources and the
science of behaviour. In psychology, the concept of the consumer refers to “the
recipient and user of services and goods” (Reber, 1995). The study of consumer
behaviour attempts not only to understand consumers9 needs but also to evaluate the
influences borne upon them in making decision. It helps to understand both the
psychological and environmental elements involved in customers’ choices between
available alternatives. It is essential to understand not only the psychology behind how
consumers think about, feel or react towards different alternatives, but also the
psychology underlying consumers can be influenced by the environment. Therefore, a
marketer needs to recognise consumers’ limitations in processing information, which
affects their decision making, and how they are motivated differently when making
decisions. Consumer behaviour needs to be understood not only through the cognitive
elements but also by understanding other external influences. Thus, it is beneficial to
elucidate consumer behaviour by applying insights from psychology to economic
3

models as they offer unique and intellectual tools to study the forces behind human
action, particularly when dealing with variety of choice.
Consumer behaviour is indeed the central topic in marketing. An in-depth
understanding of consumer behaviour should therefore underpin all marketing activities.
Foxall (2005) claims that the study of consumer behaviour, as a sub-discipline of
marketing, lacks a universally-accepted model. For decades, studies of consumer
behaviour have been developed in many different streams. The study of consumer
behaviour has been approached from different philosophical and contextual
perspectives, with psychology, sociology and philosophy being the main fields
(O’Shaughnessy, 1992). Studies conducted have mainly assumed that consumer
behaviour involves cognitive processes. Hence, it is said that consumers’ purchasing
behaviour is a function of internal attributes and influences. Emotions, feelings,
opinions, attitudes and beliefs are claimed to be some of the major forces in many
consumer choice models. Principles of behavioural analysis have been applied to
consumer behaviour but this work has also tended to lack theoretical coherence and has
focused largely on attempts to produce reflexive conditioning in consumers exposed to
advertising stimuli or to modify discrete consumer choices (Hantula et al., 2001a). The
fascination of consumer research lies in its capacity to open doors to the different
theories, principles, philosophies and viewpoints, thus helping us to understand and
eventually leam about the complexity of human behaviour, particularly in terms of
purchasing. This study adapts Darwinian insights of natural selection in analysing
consumer behaviour, as this offers a promising way in which to analyse and predict by
recognizing the mechanisms of the human mind.
4

The growing size of companies has led to less interaction between marketers and
consumers, which has in turn led to a lack of proximity between sellers and consumers.
Basic commodities such as food, for example, which are traded daily, are now been
purchased anonymously. Moreover, the fast-growth and widespread acceptance of
online shopping also creates the same wall, with minimal personal contact. In order for
a marketer to be alert to the changes in customers’ needs and tastes, research is needed
to provide an in-depth understanding of consumer behaviour. It is part of modem
marketing thought that a marketing orientation which takes into consideration this
concept will entail higher profitability for an organisation (Kohli and Jaworski, 1990).
Fast-moving consumer goods are everyday consumer products that are purchased at
lower prices and need to be replaced frequently. Their short shelf life span is a result of
their characteristics of non-durability and high consumer demand. The products are
usually highly competitive, with low consumer switching costs and less time is
normally spent by consumers in searching for product information or comparisons.
Manufacturers rely heavily on their branding strategies to attract consumers’ awareness
and satisfy consumers’ needs and preferences. A wide variety of promotional strategies
are used in competing with competitors. Price promotion is one of the most common
marketing tools used among manufacturers, as by providing the lowest price to the
consumers they can stimulate the consumers’ interest. Most consumers spend minimal
time and effort in determining brand choices (Hoyer, 1984). Brands of fast-moving
consumer goods are functionally similar and substitutable (Ehrenberg, 1972, Ehrenberg,
1988). As a result, consumers tend to switch brands for variety (Currim and Schneider,
5

1991). Previous studies on brand choices of fast-moving consumer goods, particularly
those by Ehrenberg and his colleagues, have shown that most individuals have a
tendency to purchase more than one brand within a product category. Most buyers
apparently practise multi-brand purchasing, selecting randomly from a small subset
(repertoire) of tried and tested brands (Ehrenberg, 1988). The consumer typically
exchanges one brand for another because the benefits gained from one are directly
substitutable with those provided by others within the repertoire (Foxall, 1999). These
studies have been replicated for some 30 food and drink products, 20 cleaning and
personal care products, gasoline, aviation fuel, automobiles, medicines and
pharmaceuticals prescriptions, television channels and shows, shopping trips, store
chains, individual stores and attitudes towards brands (Ehrenberg, 1972, Ehrenberg et
al., 1990, Ehrenberg and Scriven, 1999, Uncles et al., 1995, Goodhart et al., 1984). The
vast amount of data and reports from these studies led to the introduction of a
mathematical model, the Dirichlet Model (Ehrenberg et al., 2004, Goodhart et al., 1984)
comprising repeat buying and brand purchasing patterns. Nevertheless, this model has
been criticised, mainly for the reason that it neglects the underlying patterns and
motivations of consumers and their purchases (Popkowski Leszczyc et al., 2000).
Ehrenberg’s work failed to question the reasons why consumers explicitly behave in
such a way in choosing a brand. There is indeed a lack of supporting details on the
underlying causes or reasons for these consumer choices, and it is these which this study
intends to investigate.
6
It is well-known that academics and practitioners have different problems and
objectives in understanding consumer behaviour. Nevertheless, they share the same
interests in consumers; therefore they should collaborate with each other to fill in the
gaps in each area. Managers have a variety of consumers* data and inputs, where as
marketing researchers have theories and methodologies through which the consumers’
data and information can be tested and analysed appropriately. Collaboration between
academics and practitioners is useful in keeping marketing research both rigorous and
relevant (McAllister, 2006.).
1.2 Theoretical Background
Consumer behaviour has been studied within the social sciences which include
economics, psychology, anthropology and sociology, with countless methodologies and
theories. There has always been a gap between consumer research and evolutionary
theory. The explanatory power of evolutionary psychology comes from the fact that its
underlying ideas relate to the basic design of our brain and thus, can form the basis on
which fundamental explanations of behaviour can be developed (Tooby and Cosmides,
1990). Evolutionary psychology studies human nature by making predictions as to
human behaviour by identifying the mechanisms of the human mind mechanisms.
Darwinian insights and theory of the natural selection are applied, as these provide an
explanation for many aspects of life. Darwin recognised that humans are both biological
and cultural beings, as evidenced by the gene-culture co-evolution approach, which
explicitly recognises the importance of both factors in having shaped the phylogenetic
history of humans (Richerson and Boyd, 2005). Hence, human behaviour is the result of
7

both adaptations and adaptability. The behaviour of the individual organism is caused
by the structure of their adaptations and the input of their environment (Tooby and
Cosmides, 1992 ). Different cultures emerge from different contingencies of variation
and selection and differ in the extent to which they help their members solve their
problem, where those members who solve them are more likely to survive and with
them survive the practices of the culture (Skinner, 1990). Our genes have survived, in
some cases for millions of years; in a highly competitive world. The objective of a gene
is to leave copies of itself by leaving the maximum number of viable offspring in the
population. Hamilton (1964) introduced the inclusive fitness theory, according to which,
a gene is able to leave its copies not only by producing its own offspring, but also by
promoting the survival and reproduction of close and related relatives, as they share
some identical genes. Survival, mating, kin selection and reciprocity altruism are the
evolutionary systems or modules in human mind (Saad, 2007) which have been
evolving for millions of years. The survival activities of our past hunter-gatherer, for
instance, could bring valuable insights to and show similarities with modem human
consumption.
The foraging theory, which is a branch of behavioural ecology, studies the foraging
behaviour of animals in response to the scarcity of resources in the environment.
Among the most fundamental problems to be solved for organisms is to find, secure and
consume scarce resources. Foraging is not limited solely to decisions about prey items
per se but rather is a general-purpose set of rules and strategies for adapting to
environmental risk and uncertainty, yielding both prey items and information (Hantula,
2010). Foraging, like much other behaviour, basically comprises a series of choices.
8

Understanding the mechanism a forager utilises in making choices and relating it to
human consumption is fundamental to this research, as it could add more valuable
information to marketing knowledge. There is indeed a similarity between both the
foraging and economic theories. Foraging portrays animals as maximising fitness, while
economists believe that individuals maximise utility, suggesting that looking at animal
behaviour should produce parallel outcomes and new insights into the evolution or
mechanisms of economic behaviour (Shettleworth, 2010).
Hence, theories and principles of behavioural economics are utilised in this study, as
they explain more about brand choice, particularly related to the matching law which is
a common view in foraging study. Traditional economic theory assumes an individual is
an ‘economic man’; a rational individual who has knowledge of every aspects of his
environment, well-organised, with stable system of preferences, and good in
calculation, and that all of these criteria enable him to reach the highest point on his
preference scale (Simon, 1955). Economic Man is described as being rational in the
pursuit of his self-interest, implying that individuals behave so as to maximise utility
(Hermstein, 1990a). Criticisms have been levelled at this economic theory, however, as
humans are usually irrational and are limited by a number of constraints when it comes
to making decisions. Cognitive psychology was then brought in to refute these
arguments and created an interest in economic theory, as economic theory is related to
behavioural psychology and is a science of behaviour. Behavioural economics was
established on the basis of psychology and economics with the intent to investigate
actual human behaviour constrained by bounded rationality (Simon, 1987). It combines
the theory of economics with the content of operant psychology (Winkler and Burkhard,
9

1990) to investigate human limitations and complications. Behavioural economics
provides empirical techniques and findings in the pursuit of understanding and
predicting how consumers allocate the available economic resources for purchase and
consumption (Pratt 1972). Investigations into and laboratory experiments on how
animals distributed their behaviour in gaining reinforcers under different schedules of
reinforcement were carried out in the early 1970s using animals such as rats and pigeons
to interpret human economic behaviour, as non-human behaviour frequently
corresponds to human behaviour. The results show that the consumption behaviour of
laboratory animals corroborated by human behaviour of demand and explains the
principles of economic behaviour (Kagel, 1987, Kagel et al., 1980, Kagel et al., 1975 ,
Lea et al., 1987, McDowell 1988).Behavioural economics in marketing can also be
considered as the study of variables that might affect the consumer's behaviour in
allocating the available resources, such as money, in obtaining the desired commodities
under variable constraints.
The theory of behavioural economics and the application of its analyses to human
consumption in the actual market are supported by previous research of Foxall and
colleagues (Foxall and James, 2001, Foxall and James, 2003, Foxall and Schrezenmaier,
2003, Foxall et al., 2004, Oliveira-Castro et al., 2005, Oliveira-Castro et al., 2006,
Romero et al., 2006). Price, an obvious source of explanation in behavioural economics
(though one which is often overlooked in marketing studies that concentrate on brand
differentiation through advertising), has not been systematically related to brand choice
other than in the context of promotional campaigns which are short-lived tactical
exceptions to marketing strategies (Ehrenberg et al., 1994). Price differentials among
10
rival brands are usually assumed to be too small to influence the patterns of brand
choice. Behavioural economics examines and elucidates why consumers choose a
certain product/brand and what influences them to do so. It integrates insights from both
psychology and economic science based on human judgment and decision making
under circumstances of uncertainty. Hence, it makes important contributions to the
understanding of patterns of brand choice among the consumers.
The Behavioural Perspective Model (BPM), introduced by Foxall (1990), interprets
consumer behaviour as occurring at the intersection of the individual’s learning history and
the consumer setting, which signals utilitarian and informational consequences associated
with consumption-related responses (Oliveira-Castro et al., 2006). The consumer situation
is described in terms of its open and closed behaviour setting which facilitates or inhibits
consumer choice from the most open setting where consumers are free to choose, to the
most closed setting where consumers are greatly influenced and controlled by other
elements. Learning history plays an important role as the consequences gained from past
experiences influence consumers’ purchasing behaviour. Behaviour is explicable and
predictable in so far as it is under the control of a learning history that embodies the
rewarding and punishing consequences of past consumption in similar environments
(Foxall, 2000). A consumer, being in a precise setting while having obtained his/her own
particular learning history, can be assumed to be devising his/her own purchase decision
based on his/her past experience as a consumer, as well as on observation of other
consumers. Behaviour generates consequences and in a consumer behaviour context, the
Behavioural Perspective Model framework defines these consequences as utilitarian
11
reinforcement, informational reinforcement and aversive consequences (Foxall, 2001).
Each product brand has its own distinctive consequences. Utilitarian reinforcement can be
seen as the functional benefits of a product; informational reinforcement is related to the
satisfaction and social recognition derived from the ownership, whilst aversive
consequences are the constraints imposed by surrendering the money, which reduces the
chances of obtaining other products. The probability of purchase and consumption depends
on the relative weight of the reinforcing and aversive consequences that are signalled by the
elements in the consumer behaviour setting (Alhadeff, 1982). A product’s features, brands
and even price can be considered as the reinforcing and aversive stimuli and hence
marketers should make an effort and develop strategies to make them more acceptable to
consumers. Hence, the BPM model can be utilised by marketers in implementing the right
marketing strategies by closing the settings in order to increase the probability of
consumers’ purchasing, which can be done by modifying the physical and social
environment to ensure that escape behaviour is punished or reduced (Foxall, 1990).
1.3 Research Rationale
Darwinian insights and theories of evolution, particularly gene transformation, are
almost universally recognised and have been fruitfully accepted and applied in many
research disciplines. A theoretical interpretation of brand choice can be accurately
gained by drawing on the consumption literature generated by evolutionary
psychologists that links marketing to biological phenomena related to animals’
behaviour and that of our ancestors. Humans do not simply develop new behaviours for
12
every new situation but instead modify or extend existing behaviours to suit the new
situation; thus, our behaviours in modem shopping malls or stores should be based on
previously developed behaviours and skills (Kruger and Byker, 2009). Past research on
the shopping-as-foraging analogy in mobile technology use has been successfully
carried out by Hantula and his colleagues (Rajala and Hantula, 2000, Smith and
Hantula, 2003, Hantula et al., 2008). However, the experiments were conducted using a
simulated internet mall. Therefore, it is essential that a study be conducted in a more
naturalistic setting, such as grocery shopping, in order to understand consumers'
purchasing decisions. This is what this study intends to achieve through utilising the
consumer panel data.
Previous studies (Foxall and James, 2001, Foxall and James, 2003, Foxall and
Schrezenmaier, 2003, Oliveira-Castro et al., 2006, Romero et al., 2006) have been
fruitfully carried out through the lenses of behavioural economics and the Behavioural
Perspective Model. Suggestions have been made to further explore those results through
a larger sample over a period of one year. In addition, as each individual has different
influences throughout on their everyday consumption, it is a necessity to look at each
consumer's purchasing behaviour, which can be done by employing individual analysis.
This study was conducted over a period of a year, and employs a larger sample which
will be analysed individually. The results are anticipated to be more robust, and
promising comparisons can be made between individual analysis and aggregate
analysis.
13
Hence, this study intends to fill the above research gaps by providing substantial finding
on consumer buying behaviour. The combination of theories and methods of
evolutionary psychology, particularly foraging, behavioural economics and the
Behavioural Perspective model employed in this study, is able to elucidate in detail the
behaviour of consumers in making brand choices.
1.4 Research Questions
The research question is crucial in any research as it identifies and highlights issues
upon which the research should focus. This study is based on two research questions:
1. How is modem human consumption analogous to the foraging behaviour and
activities of animal and of our ancestors?
2. Is there any difference between individual and aggregate patterns of brand choice?
1.5 Research Objectives
1. To determine the similarities between human consumption and ecological behaviour.
2. To explore how far human consumption is analogous to the survival activities in
foraging of animals and of our ancestors.
3. To elucidate human behaviour by identifying the mechanisms of the human mind.
4. To contribute and present a potential explanation of consumer behaviour by applying
evolutionary psychology and foraging analogies.
14

5. To determine the robustness of behavioural economics approach by applying individual
analysis through a larger sample, over a period of one year, in naturalistic settings.
6. To provide a better understanding how consumers as individuals make brand choices by
drawing upon the theories of matching law, relative demand curve and maximisation.
1.6 Research Methodology
This thesis adopts comparative and interpretative methods by comparing and finding
similarities between human and non-human animal species, as well as our ancestors,
particularly in terms of allocating choices to scarce resources. It attempts to look at the
patch from both perspectives in order to obtain a comprehensible picture or overview of
foraging in the world of human consumption. Observation and interpretation will be
carried out to determine the similarities between the human consumption behaviour to
animal foraging, using the data on the panel’s purchasing history.
This study employs a quantitative approach in order to obtain measurable precision and
statistical research outputs. The positivist paradigm presumes that the objective truth in
the world can be quantified and explicated scientifically, and it is this which is adopted
in this research. The main concerns of the quantitative paradigm are that measurement is
reliable, valid, and generalisable in its clear prediction of cause and effect (Cassell and
Symon, 1994). Household panel data by AC Nielson; a leading provider of consumer
purchasing information is employed, as panel data is able to provide information on
consumers* changing patterns in purchasing. Most panel data come from the very
15

complicated process of everyday economic life (Hsiao, 2003). Consumer panel data is
utilised in this study to obtain a more vigorous result in terms of understanding
consumer choice patterns. Furthermore, researchers can view the communication
process as concrete and tangible and can analyze it without contacting actual people
involved in communication (Ting-Toomey, 1984). Aggregate data is often addressed as
the ‘representative agent’ assumption. Nevertheless, the predictions of aggregate
outcomes using aggregate data can be less accurate than the prediction based on micro
equations (Hsiao, 2003) as each individual has different influences on their everyday
consumption. An individual analysis is therefore employed in this thesis as ‘a detailed
analysis of the behaviour of each individual often provides valuable information for use
in designing further tests as well as in suggesting modifications to the theory’ (Battalio
et al., 1973a). Three analyses drawn from standard behavioural economics (matching,
maximisation and demand analysis) will be conducted to provide satisfactory findings
to determine whether consumers judge brands in a product category to be substitutable,
are sensitive to any price changes and maximise returns. The results of this study will
assist both marketing practitioners and academicians in understanding consumer
behaviour and in developing more effective marketing strategies.
16
1.7 The structure of the thesis
This thesis is organised into eight distinct chapters, which build incrementally to answer
the research objectives and questions that have been discussed earlier in this chapter.
Chapter One - Introduction
The main purpose of this chapter is to present the introduction and background to the
thesis. The objectives of this thesis, the research questions, research context and
background of the theoretical framework or literature are described and explained. The
structure of the thesis is also presented in order to give a clear and understandable
picture of the thesis as a whole.
Chapter Two Marketing and Consumer Buying Patterns
This chapter covers fundamental topics in marketing and consumer behaviour literature
such as the background of marketing, brand choice, store preference and the role and
effects of price in consumer choice decision making.
Chapter Three - Theoretical Framework: Evolutionary Psychology and Foraging
The theoretical framework is divided into two chapters (Chapter 3 and Chapter 4), as
the main theories in this study need to be explored in detail. A discussion of the
theoretical framework of this research is carried out by gathering information and
knowledge gained by academicians and experts particularly in the area of evolutionary
17
psychology (foraging), behavioural economics and Behavioural Perspective Model.
Chapter Three concentrates mainly on evolutionary psychology and foraging, as this
forms the main framework of this thesis. Foraging as an element of behavioural ecology
is explored to determine the extent to which it is analogous to the human consumption.
Chapter Four - Theoretical Framework: Behavioural Economics and Behavioural Perspective Mode!
This chapter discusses the other two main theories of this study which are behavioural
economics and the Behavioural Perspective Model. Behavioural economics is
introduced as it is a concept that is beneficial in understanding and examining human
behaviour. Its reliable economic analyses are utilised in this study and critical
exploration is made of several concepts and principles in behavioural economics. The
importance of the Behavioural Perspective Model is also covered in this chapter. The
theoretical foundations of this model in explaining consumer choice and situation are
explored in detail.
Chapter Five - Methodology
Chapter Five presents a detailed description of the research strategy and design which
were developed to address the research objectives and questions. In this chapter, the
research philosophy, research paradigm and research method are discussed thoroughly.
A description of the analysis, including sample and measures, is also presented. A
review of the three main analyses; matching analysis, relative demand analysis and
maximisation analysis adopted from behavioural economics is made in this chapter.
18

Chapter Six — Descriptive and Statistical Results and Discussion
The final findings and results of the analyses based on the behavioural economics
approach are elaborated in this chapter. It presents the quantitative results, in terms of
the multi-brand purchasing, matching analysis, relative demand analysis and
maximisation analysis. All the requisite graphs, tables and figures are included in this
chapter. A discussion of the results is also included in this chapter.
Chapter Seven — Interpretation and Discussion (Foraging in Human Consumption)
This chapter will discuss and interpret the results in terms of determining the similarities
between foraging and consumers’ buying behaviour. Definitions will be made of the
elements involved in the consumers’ purchasing behaviour through the application of
the most salient terms in evolutionary psychology and foraging. The chapter also
discusses the similarities between human consumption and the survival activities of our
ancestors and animals, where appropriate, by using the panel data.
Chapter Eight - Conclusion
This chapter concludes the research investigation by presenting the summary of the
whole research. It reports the contributions and limitations of this study, and offers
suggestions for future research.
19

1.8 Summary
This chapter presents the overall introduction to this thesis, including the issues
involved in and general elements of the research, as well as the structure of the thesis,
with a brief introduction to each subsequent chapter. It is hoped that by reading this
chapter, a basic understanding of what the research is about could be gained.
20

CHAPTER TWO
------------------ * CHAPTER 2 * ______________
MARKETING BACKGROUND: CONSUMER AND PATTERNS OF BRANDAND STORE CHOICES
2.0 Introduction
This chapter discusses literature from significant disciplines that can be considered as the
main foundation for the development of this thesis. Literature on marketing, patterns of
brand choices, store choices and the role of price are discussed at length as these factors are
vital in examining the consumer behaviour. In due course, the work of Ehrenberg is
introduced as his findings of patterns of consumer choice have gained considerable
attention from academicians and practitioners and have been useful in understanding
market patterns.
2.1 Marketing and Consumer Behaviour
The definition of marketing has been overshadowed by controversies which have been
waxing and waning for decades in the marketing literature in terms of obtaining an
accurate, clear and concise meaning of the basic nature of marketing. According to Kotler
(1999), marketing is a social and managerial process by which individuals and groups
obtain what they need and want through creating and exchanging products and value with
others. As McKenna (1991) notes, marketing is everything and everything is marketing.
22

Marketing can be seen as the performance of business activities that direct the flow of
goods and services from producer to consumers. Kotler and Levy (1969) suggest that the
concept of marketing be broadened to include non-business organisations as these
organisations such as schools and government departments have customers and perform
marketing activities. Luck (1969) however, insists that the meaning of marketing be limited
to those business processes and activities that ultimately result in a market transaction
involving an exchange of values between two parties.
The scope of marketing itself is unquestionably broad. It includes diverse areas such as
pricing, consumer behaviour, communication, sales management, retailing etc. Not only
can it be seen as the task of finding and stimulating buyers for the firm’s output (Kotler and
Levy, 1969), but the aim of marketing is also to satisfy the customers’ needs and wants
with the product or service and build a long-lasting relationship with them (Kotler and
Keller, 2006). Marketing is a combination of the marketing concept, marketing functions
and the operational implementation of these functions in the context of the concept
(Trustrum, 1989). Hence, it is vital for any company to plan and implement its marketing
strategies and functions by adopting appropriate marketing concepts. It is also necessary for
a company to ensure that its marketing function is carried out in the best interests of the
customers, emphasising customer orientation rather than product orientation. The
marketing mix, or the 4 Ps model, is the most commonly used and disseminated in
marketing. The traditional views of marketing are always built upon the assumption that
sales or profits are generated by the combination of the marketing mix or the 4Ps (product,
price, place (distribution) and promotion). This can be described as offering the right
product at the right price, available in the right place at the right time (Adcock et al., 2001).

Offering the right combination of these tools is believed to be able to improve the
marketing effectiveness, thus ensuring that the customers’ needs can be satisfied. The key
to a company’s survival, profitability and growth in a highly competitive marketplace is its
ability to identify and satisfy consumer needs, better and sooner than the competitors
(Schiffman and Kanuk, 2007).
Consumer behaviour is an active, growing field, but there is much dissension regarding its
conceptual bases (Foxall, 1997). Consumers are people who make purchases to satisfy their
needs. Understanding the behaviour of consumers is the cornerstone of the philosophy and
practice of marketing. The survival and growth of any firm require information and
knowledge about the consumers. Consumer behaviour is studied to elucidate in more detail
why people buy, to determine the right strategies to meet the consumers’ needs and to
create an effective approach to communicating with them. For those purposes, a company
should monitor the rapidly-changing needs of customers, determine the effect of the
changes, increase product innovation and implement competitive advantage strategies (Roy
and Lahiri, 2004). Hence, understanding consumers’ motivations and influences in
purchasing is essential for both marketing practitioners and scholars.
For decades, the influence of income has been emphasised as the major determinant of
purchase choices. However, currently, it is usual for consumer researchers to explain such
decision making in terms of a wide range of stimuli and response mechanisms (Foxall,
1980). Products and services are not purchased simply for their functional values but also
for the social and psychological meanings they convey. In other words, the stimuli received
24
by the consumers from the marketing mix elements influence their decision making. Often,
a consumer's purchasing behaviour could fulfil more than just one need and specific goals
are selected because they fulfil several needs (Schiffinan and Kanuk, 2007). Clothing, for
example is purchased not only as a basic necessity and personal protection but also because
of its significance in terms of status. Its material quality, colour and design reflect the
individual's image and personality. Therefore consumers’ perceptions are crucial to
marketers. Customers perceptions of products derive from marketing efforts such as brand
images and brand differentiation in addition to the physical characteristics of the product
may be the consumer's only guide to want satisfaction (Foxall, 1980).
We are living in a culture of consumption where we consume dozens of products and
services in our lives. Consumers are always looking for a product that can satisfy their
needs and wants. Consumer behaviour extends from the awareness of a want, through the
search and evaluation of possible means of satisfying it, and the act of purchase itself, to the
evolution of the purchased item in use, which directly impacts upon the probability of
repurchase (Foxall, 1997). Some consumers may have limited knowledge about the market;
leaving them with insufficient information about the price, brands available and so forth.
They may even be easily misinformed about the products and brands. The consumer is to
the manufacturer, the department stores and the advertising agencies, what the green frog is
to the physiologist (Watson, 1922). According to Watson, it is possible to predict consumer
behaviour because a person is an organic machine and it is no different controlling the
behaviour of people than it is controlling a machine. Hence, the goal of advertising is not
about simply providing information about specific products, but also about creating a
society of consumers and controlling their consumption through behavioural techniques to
condition emotional responses (DiClemente and Hantula, 2003). Watson(1922) emphasises
the need to study consumer reactions and behaviour to assist advertisers in refining their
strategies. He believes that behavioural techniques could be used to condition emotional
response which in turn would contribute to the control of consumption, as marketing goods
depends upon emotional conditioning and stimulation of desire (Hantula et al., 2001a). The
goal of advertising is not limited to providing information about given products and
services, but about creating a society of consumers and controlling their consumption
behaviour (Hantula et al., 2001a). The desire for a product originates not only through
advertisements but also through contact with another person. Many of the decisions made
in purchasing involve family members; some are even purchased on behalf of family
members. Over the past several decades, there has been a trend toward children playing a
more active role in what the family buys, as well as in the family decision making process
(SchifTman and Kanuk, 2007). Family needs and the necessity to satisfy these needs
influence the consumers’ decision making. The main goal of advertising and marketing is
to fttract and persuade the consumer to purchase the product.
Most basic elements of consumer behaviour are learned responses to the environment
(Foxall, 1980). In other words; most of consumer preferences are learned rather than
inherited. Consumers’ perceptions of products and services derive from marketing effort
such as brand images and brand differentiation in addition to the physical characteristics of
the product alone; further, it can be concluded that in some cases those product attributes
which are marketing-based may be the consumer’s only guide to want satisfaction (Foxall,
1980). Consumers learn and obtain information and knowledge about a product based on
personal or other people’s past experiences. Previous purchase experiences which relate to

both positive and negative reinforcements play an important role in influencing the
consumer’s buying decision. Consumers who have had a positive experience of a previous
purchase are naturally more likely to repeat purchase rather than those who experience
negative consequences, who would then tend to switch to other available brands.
Consumer behaviour has traditionally been analysed by focusing on the influence of
psychology or behavioural science. Nevertheless, its application has not been made
smoothly and effectively as too much reliance has been placed on psychology and
insufficient attention given to other disciplines, particularly sociology but also geography
and anthropology (Foxall, 1980). Additional information and analyses are required to
understand the complexity of consumers’ behaviour. Hence, this thesis attempts to study
the uniqueness of consumer behaviour by applying theories from the evolutionary
psychology and behavioural analysis disciplines.
2.2 Patterns of Brand Choice
The interpretation of complex human behaviour is the fundamental goal of behavioural
analysis. Consumers’ patterns of brand choice have been extensively investigated in
marketing, in particular for purchases of fast-moving consumer goods (Oliveira-Castro et
al., 2010). Although the significance of branding in consumer behaviour is realised by
marketing analysts, they still have an inadequate understanding of the consumer’s
behaviour and reaction towards the existing brands and choices that they have. Consumer
27
behaviour is shaped by marketing influences such as branding, advertising, promotions,
distribution strategies and social pressures (Penrose, 1959). These non-price variables play
a vital role in shaping buyers’ behaviour patterns in choosing from the available
alternatives. Branding is important to marketers as it assists in establishing a significant
presence and image for consumers, thus gaining customers’ loyalty. Generally, consumers
are always offered more than one brand and each of the various brands has its own
differences in consumers’ eyes. The effectiveness of branding has been a crucial tool for
most of the marketers in order to create a specific brand identity.
The work of Andrew Ehrenberg is largely known for his attempt to understand market
shares of brands and consumer brand buying behavior. His findings have created an
impulse in interpreting and analysing the actual sequence of brand purchasing patterns.
Ehrenberg (1988) points out that brand choices within a product category, such as the
selection of either the HeiiU or the Crosse and Blackwell brand from a range of baked
beans products on a supermarket shelf, follow well-documented patterns. Consumers’
habits and past experiences substantially determine their decision making (Ehrenberg et al.,
2004) and consumers tend to repurchase the same brand if they are satisfied with their
initial purchase of the brand (Woodside and Uncles, 2005). Sales of a brand are determined
by measures such as how many customers buy the brand, how often and how much they
also buy other brands (Ehrenberg et al., 2004). According to Ehrenberg (1988),
comparatively few purchasers of a product category are 100 % loyal to a particular brand.
Even 100% brand-loyal customers are not particularly heavy buyers of their preferred brand
(Foxall, 1999). Many consumers engage in multi-brand purchasing, seeking satisfaction
from a small repertoire of brands. In fact, these consumers are seen to purchase other
28

brands more often than the brand to which they are loyal. Consumers seem to limit their
purchases to a repertoire of brands rather than broadening their choices to the entire brand
set. These personal repertoires of brands differ from one consumer or household to the next
(Ehrenberg et al., 2004). The brands in a product category are usually substitutes; or in
other words, they are functionally interchangeable. Consumers typically move around from
one brand to another as the benefits gained from one are directly substitutable by the others
within the repertoire (Foxall, 1999). In fact, a new brand, in order to become accepted as a
member of the product category into which it is introduced, must incorporate the functional
attributes offered by existing members (Ehrenberg, 1991). It is claimed that consumers
select the lowest priced alternative, assuming that the set of brands are substitutable. Hence,
if the brands are not perfect substitutes, consumers will tend to purchase several brands in a
product category. These patterns have been found in more than 50 different products and
services by Ehrenberg and his collaborators since the 1950s (Uncles et al., 1995,
Ehrenberg, 1972, Ehrenberg et al., 1990, Ehrenberg and Scriven, 1999, Goodhart et al.,
1984). Purchases of different pack sizes and flavours and purchases from different retail
outlets have also been observed (Goodhart et al., 1984).
Ehrenberg et al (1994) have also investigated the after-effect of price promotion for fast-
moving consumer goods and established that price promotion does not affect the sales of
the product. ‘We interpret this as effectively a nil effect: there was little if any general after
effect on sales’ (Ehrenberg et al., 1994). According to the authors, sales promotions do not
really attract new buyers, as those who buy during a sales promotion are the ones that have
most likely tried the brand before. There is nothing special about price as a product attribute
(Scriven and Ehrenberg, 2003). Watkins (1986) describes price as a quantitative,
29
unambiguous and unidimensional competitive tool, while according to marketing theory,
consumers’ brand choices are often not the result of price influences (Schrezenmaier,
2005). Price can be used strategically, but this does not necessarily mean that establishing
the lowest price is always the best strategy (Levy et al., 2004).
Ehrenberg himself is well known for his formulations of theories on and observations of
buyer behaviour. A mathematical model, known as the Dirichlet Model (Goodhart et al.,
1984) has been developed. Its single statistical framework can be employed in
understanding the patterns of consumer behaviour particularly in selecting brand.
According to this model, each consumer has a tendency or probability to purchase a given
brand and this probability is believed to be stable over time; however, it differs across
heterogeneous consumers. Moreover, the performance of single brands can be predicted in
different situations such as market introduction or during and after sales promotions
(Ehrenberg et al., 1994). Estimations can be made of how often consumers buy, which
brands they buy and also of the size of the market, based on the two main inputs which are
the penetration rate (the percentage of consumers who buy an item or the product category
in a specific time period) and the average purchase frequency of buyers of the category or a
particular brand over the same time period (Schrezenmaier, 2005). However, the limited
inputs that are required by this model to obtain the findings have led to a remark that this
model is described as parsimonious and insufficient to obtain detailed predictions,
particularly of market patterns and buying behaviour. It fails to model short-term dynamic
changes and fluctuations (Sharot, 1984, Bloom, 1984, Phillips, 1984) and there is no
explanation for purchase motivations and no information about the dynamic process by
which consumers develop their behaviour (Bartholomew, 1984, Jeuland, 1984). Other
30
more comprehensive factors that are deemed important to traditional marketing research
such as marketing activities, nature of the brand, length of time period studied, consumer
attitudes and so forth are ignored (James, 2002). Therefore, it is claimed that this model is
descriptive, as it outlines how, rather than why, consumers behave.
Ehrenberg’s works have spanned several decades. The theory of his mathematical model
has been crucially criticised not only because of its parsimonious structure, but also as
inadequate attention is given to the underlying reasons for consumer’s purchase patterns. It
is argued that the steady state of the market assumed by the model is somewhat
unreasonable to be accepted in view of the current rapid changes of technology, inputs,
innovations and environmental changes. In fact, no information is given about the
motivations behind these purchasers and how the patterns are formed (James, 2002).
Various authors indicate that the model is static in its lay out and hence inadequate to
describe changes and market fluctuations (Bloom, 1984, Phillips, 1984, Sharot, 1984). The
findings from the countless replications of Ehrenberg and his collaborators are undoubtedly
useful and beneficial to the understanding of consumer purchasing patterns. Nevertheless,
more in-depth and detailed exploration is essential in order to discover the hidden reasons
and explanations for the brand-buying habits of consumers.
One of the apparent findings from Ehrenberg’s extensive research is that most consumers
perform multi-brand purchasing, choosing randomly from a repertoire of brands of a
product category. Purchasers of fast-moving consumer goods generally exhibit multi-brand
choice, selecting apparently randomly among a small subset or repertoire of tried and
31

trusted brands (Foxall and Schrezenmaier, 2003). These repertoires of brands are mostly
similar in function and substitutable. In reality, some consumers who are exclusive buyers
or purchasers of premium-priced brands, are insensitive to any price changes and can be
considered as maximising the informational reinforcement. Others are price-sensitive,
prefer the cheapest brands and can be regarded as maximising the utilitarian reinforcement.
The majority are the ones in between, who have preferences for both economy and
premium-priced brands, leading them to be categorised as multi brand purchasers (Foxall
and Schrezenmaier, 2003). While each product brand does attract some sole purchasers,
most of these buyers also engage in multi-brand purchasing. Sole purchasers are exclusive
purchasers of one brand or another; however each brand in the product category has its own
set of exclusive buyers (Foxall, 1999). Over time, it appears that these sole purchasers
become multi-brand purchasers, preferring more than a single brand. Multi-brand
purchasing is the norm to the extent that even the heaviest purchasers of a given brand buy
other brands within the category much more than they buy their favorite brand over the
course of say, a year (Foxall and Schrezenmaier, 2003). These multi-brand purchasers’
behaviour is in accordance with the prediction of matching theory, which states that
consumers will prefer a product which is offered on the most economical schedule.
Although they purchase several brands (a selected repertoire in the case of individuals, the
entire brand set aggregately), they also show a disproportionate preference for the highly-
differentiated brands (Foxall, 1999). In this case, the preference might be based on other
reinforcement variables such as a store offering only a limited range of brands or
consumers having their own preferences in terms of the colour and size of the product.
Consumers with this ‘repertoire buying’ habit could be said to show matching as they
choose among selected brands and may be responding to price differentials (Foxall, 1999).
32

Switching among the repertoire brands is in compliance with the principles of melioration
and matching.
Ehrenberg’s suggestion that price promotion does not affect the sales of a product is also
debatable as this could be due to the promoted brands not being within the consumer’s
repertoire list; therefore these brands are not tried even when they are offered at lower
prices (Foxall, 1999). Those who have the promoted brand in their repertoire list would
likely switch to it when it is offered at a discount. Brands with near-identical attributes
appear to be affected by even a small price differential (Foxall, 1999). Consumers tend to
buy the cheapest brand within their repertoire of brands and not the cheapest of all brands
available in the market, which indicates that not all brands are substitutes for others (Foxall
et al., 2004). This denotes that functional attributes or utilitarian reinforcement is not the
sole reason when purchasing a brand. Brands may have similar product attributes or
features but differ in terms of the informational reinforcement. The difference between
utilitarian and informational reinforcements offered by the brands is proposed by the
Behavioural Perspective Model (Foxall, 1990). According to this model, consumer choice
is shaped and influenced by the consumer situation, which is an intersection of the
consumer’s behaviour setting and learning history which relates to the possibility of
consequences. This model also proposes that consumer behaviour produces both utilitarian
and informational benefits, and these consequences influence the rate at which the
behaviour that has produced them is repeated (Oliveira-Castro et al., 2006). The pattern of
reinforcement, which is a combination of both the utilitarian and informational
reinforcement, influences consumers’ brand choices (Foxall and James, 2003, Foxall and
James, 2001). Consumers, of course, have different price responsiveness, particularly when
33
it is related to utilitarian and informational benefits (Foxall et al., 2004). The key factors
affecting a consumer’s choice are related to brand attributes via either the marketing mix or
the consumer’s purchase experience (Winer, 1986). Multi-brand buying trends among
consumers, evidently, require an explanation for consumers’ underlying choice decision
making mechanisms in order to obtain a broader understanding of the pattern of brand
purchasing. Hence, it is important for a marketer to know exactly the elements that
consumers maximise when purchasing as it is clear that different consumers have different
criteria for selecting a brand.
2.3 Patterns of Store Choices
Consumers face a retail environment in constant flux, where they continuously must decide
whether to stay loyal, try out new formats or use the complete system to obtain benefit from
discounts on specific days or for specific items (Popkowski Leszczyc et al., 2000).
Consumer store choice is the selection of one of the alternatives after information on
various alternatives has been evaluated by the consumer. Consumers perceive stores as
consisting of far more than just their physical attributes. Generally, a consumer, whether
selecting a brand or a store, would evaluate each alternative in terms of the utility or benefit
to be derived from selecting that alternative and then select the alternative which yields
maximum utility (Fotheringham, 1988). Repeat patronage may be caused by the
consumer’s preference for convenience, services, or simply because of the product and
brand ranges carried by the retailer. The competitive environment is determined not only by
the number of shopping alternatives but also by the cost of the search and the format of
competition (Hoch et al., 1995). Fotheringham (1988) explains that it is unlikely that a
34
consumer will have the ability or time to evaluate all the stores in the city. Thus, consumers
are more likely to make an initial choice of a cluster of stores and then select the store(s)
they prefer within that cluster.
In the grocery sector, customers tend to have different reasons for patronising convenience
stores and supermarkets. According to East et al (1994), proximity and convenient opening
times are the main attractions of the local shop while wide choice, good value and easy
parking are the attractions for supermarkets. Hence, many supermarkets have extended
their opening hours and even introduced small format stores to compete with local stores. A
shopping trip can be primary (buying groceries to last 1-2 weeks or more) or secondary
(filling an immediate need resulting from running out of something at home), while most
consumers tend to shop at a number of different stores (Hoch et al., 1995). According to
these authors, larger stores will tend to attract more primary shoppers, whereas smaller
stores will attract more secondary shoppers. Previous research by Ehrenberg and colleagues
has reported low store loyalty and significant store-switching for grocery store purchases
(Uncles et al., 1995, Kau and Ehrenberg, 1984). According to the authors, only a small
number of customers who are loyal to one store and the others practise multi-store
purchasing. In fact, store loyalty does exist, but is not strong or undivided because no one
store will generally satisfy all a customer’s needs. Kau and Ehrenberg (1984) explain that
each store differs in many ways - in number, size, location, ownership and styles, layout,
number and range of products, number and choice of competing brands, pricing policies,
purchasing strength and merchandising and promotional practices. In turn, consumers differ
in terms of lifestyle, habits, experience, price sensitivity, mobility and exposure to
advertisements and so forth. These differences contribute to the various sales levels or
35
market shares achieved by the stores. Although retail stores differ from each other and
compete for loyalty in their own ways, these strategies and tactics seem to have little effect
on customers’ loyalty towards stores (Kau and Ehrenberg, 1984). Consumers often
patronise not one but several different stores of a given type over a specific period
(Cunninghan, 1961) particularly for grocery shopping, as it is generally done as a routine
shop which includes one main weekly trip and one or more ‘quick’ trips. Dunn and
Wrigley (1984), in their research in Cardiff found that choices of shopping destinations
vary; 72% to 86% of the respondents bought the brand leaders of instant coffee, margarine
and baked beans at more than one supermarket during a 24-week period.
In recent years, retail competition has intensified, generally as a consequence of new
technologies, more sophisticated management practices and industry consolidation (Sirohi
et al., 1988). Facing today’s intensive competition in the grocery industry, developing,
maintaining and enhancing consumer loyalty are more important than ever for marketing
managers and striving towards this goal seems even more challenging where loyalty among
consumers is declining over time (Jensen, 2011). Retailers need to identify factors that
influence store preferences and switching behaviour of consumers in developing
appropriate strategies. The increased satisfaction of a customer will generate other benefits
such as the generation of positive word-of-mouth (Urbany et al., 1996). Knowing more
about store choices could assist marketers not only in understanding consumers’
preferences, but also in addressing the distribution problems.
36
2.4 The Role of Price
Price awareness and sensitivity among consumers have attracted the attention of numerous
scholars over the last few decades. Price is one of the costs that has to be dealt by
consumers when purchasing, as are time and emotional costs when purchasing. Kenesei and
Todd (2003) claim that price is a significant selection criterion for consumers. Price plays
an important role as it is the most noticeable cost that can be decided upon. Special price
discounts at the point of purchasing usually attract consumers* attention and lead them to
choose the least expensive brand particularly when comparisons of previous and new prices
are being displayed.
Consumers are assumed by many marketers to be influenced more by the quality and
reliability of a product or service rather than the price. Anderson and Simester (2003)
claim that shoppers in a grocery store do not notice the last digit of a price, therefore,
retailers are free to round the price up to the nearest nine. Research on in-store price recall
shows that relatively few shoppers can recall the price of a product purchased (Kenesei and
Todd, 2003). Consumers are said to purchase so habitually or routinely that they only
occasionally check the prices, assuming that there are no considerable changes in the price.
These consumers tend to develop loyalty to certain brands which then generates less price
sensitivity. Brand-loyal consumers tend to spend less time searching for items and less time
checking for prices and have some, albeit frequently inaccurate, knowledge of prices
(Kenesei and Todd, 2003). These authors also suggest that a significant number of shoppers
never look at price information and that only a relatively small number of shoppers are
willing to go to another store in order to capitalise on a promotion. Retailers have been
37

influenced and persuaded by the result of some American research results to decrease price-
cutting promotions, as most buyers are not really aware of the price reductions (Le
Boutillier et al., 1994). Similarly, Walter (1991) reports that the willingness to switch stores
because of promotions is significantly less than that to switch brands inside the store. In
addition, only between 54 to 60% of the shoppers look at the price tag at all (Dickson and
Sawyer, 1990). Uncles et al (1995) in his research, proposed that price promotion gives
rise to only temporary increases in sales by encouraging those who already buy that brand
rather that attracting new buyers to purchase the brand. An increase in sales may be the
result of consumers switching to the cheapest brand in their repertoire sets of brand and at
the same time piling their stocking up on it by buying in larger quantities to take advantage
of the price promotion.
The effect of price has often been overlooked by pacing greatest emphasis on other non
price elements in the marketing mix (Romero et al., 2006). Price has seldom been used in
explaining brand choice other than in promotional campaigns which generally constitute
tactical exceptions of marketing strategies (Ehrenberg et al., 1994). Scriven and Ehrenberg
(2003) claim that there is indeed nothing special about price as a product attribute. Price has
not been systematically related to brand purchasing partly because the small price
differentials by which competing brands are usually distinguished are often thought to be
too small to affect established patterns of brand choice (Foxall and James, 2001). On the
contrary, various researches have also found that price still holds an important position for
consumers when they make purchase decisions. Price-consciousness, particularly among
housewives, is not to be underestimated. Consumers establish a so-called reference price
for a brand or a product, which reflects his or her expectations shaped by previous pricing
38

levels of the brand (Lattin and Bucklin, 1989). The amount of attention paid to the price,
the memorability of characteristics of the price and the use of the price in making the
purchase decision affect both the encoding into memory and recall from memory of the
price information (Dickson and Sawyer, 1990). In other words, consumers have a tendency
to estimate their own prediction of the brand’s future price. Consumers have also shown the
ability to distinguish between attractive and unattractive prices to make good purchase
decisions (Vanhuele and Dreze, 2002).
Experiments carried out by Ehrenberg (1986) indicate that even a small difference in price
affects the demand for near-identical brands. Identification of the differing patterns of
matching, relative demand and maximisation for substitutes, non-substitutes and gross
complements by Foxall and his colleagues (Foxall, 1999, Foxall and Schrezenmaier, 2003,
Foxall et al., 2004, Oliveira-Castro et al., 2005, Foxall and James, 2001) indicates that even
relatively small differences in price are a significant variable in the determination of brand
and product choice for affluent consumers in marketing oriented economies (Foxall and
James, 2001). Consumers are becoming more price-conscious than has been presumed.
Although consumers are said to be frequently inaccurate in terms of price knowledge, they
have the ability to distinguish between attractive and unattractive prices when making a
purchase decision (Schrezenmaier, 2005). The signal of a special price at the point of
choice may trigger some shoppers to switch among sizes and brands (Dickson and Sawyer,
1990). In fact, in a survey of 1,397 UK grocery shoppers carried out by Evolution Insight
(June 2010), 75% claim that price is an important aspect in making any decision and price
is ranked as the top criteria in choosing a brand. As Rao (1984) points out, relatively little is
39

yet known at the consumer level about how price information is used in making brand
choice decisions.
2.5 Summary
Consumers are important elements in marketing; therefore it is necessary for a marketer to
focus on customer orientation rather than product orientation. Offering the right
combination of the marketing mix is held to be able to improve the marketing effectiveness,
and thus satisfy the customers’ needs. Branding is deemed to be an effective tool in
establishing trust and loyalty among the consumers. However, it has been found that many
consumers engage in multi-brand purchasing, seeking satisfaction from a small repertoire
of brands. In other words, these consumers can be seen as selecting brands based on both
the utilitarian and informational reinforcement. Consumers typically move from one brand
to another as the benefits gained are directly substitutable from the others within the
repertoire (Foxall, 1999). The same applies to store choice, as consumers perceive stores as
consisting of far more than just their physical attributes. Generally, a consumer, whether
selecting a brand or a store, will evaluate each alternative in terms of the utility or benefit to
be derived from selecting that alternative and then select the alternative which yields
maximum utility.
Marketers frequently appear to overlook the effect of price, placing greater emphasis on
other non-price elements in the marketing mix, while consumers are assumed by many
40

marketers to be influenced more by the quality and reliability of a product or service rather
than the price. Nevertheless, it has been found that even relatively small differences in
price are a significant variable in the determination of brand and product choice for affluent
consumers in marketing oriented economies (Foxall and James, 2001). Consumers are
becoming more price-conscious and are able to distinguish between attractive and
unattractive prices; hence, these prices may trigger some shoppers to switch among sizes
and brands.
41

CHAPTER THREE
--------------- -V C H A P T E R 3 ---------------THEORETICAL FRAMEWORK: EVOLUTIONARY PSYCHOLOGY AND
FORAGING
3.0 Introduction
In this chapter, literature on the principles and theories of evolutionary psychology is
reviewed. Evolutionary psychology applies notions from the modem synthesis to the
understanding of the evolution of the human brain and the complex set of brain modules
that regulate human behaviour (Kock, 2010). It revolves around humans’ mental
evolution and its impact on human traits and behaviour. Foraging activities, which are a
part of the behavioural ecology, involves many sequences or repetitions of activities and
decision making, which can be usefully related to the decisions made in human
consumption. Among the most fundamental problems to be solved for humans or any
other creature, are the problems of finding, securing and using resources; or in more
general terms, foraging (Hantula, 2010). Both Darwinian principles and foraging studies
can indeed be applied and benefit to the study of consumer behaviour, as they are able
to give a more in-depth understanding by integrating and bridging multiple behavioural
disciplines.
43

3.1 Evolutionary Psychology
‘Evolutionary psychology is the long-forestalled scientific attempt to assemble out o f the disjointed, fragmentary and mutually
contradictory human disciplines a single, logically integrated
research framework for the psychological, social and behavioural sciences- a framework that not only incorporates the evolutionary sciences on fu ll and equal basis, but that systematically works out all o f the revisions in existing belief and research practice that such a synthesis requires \
(Tooby and Cosmides, 2005)
The idea behind evolutionary psychology studies is to understand the human nature and
to make predictions about human's behaviour by recognising the mechanisms of the
human mind. In doing so, Darwinian insights and the theory of natural selection are
applied, as these provide an explanation for many aspects of life, although Darwin’s
ideas have aroused considerable controversy. His statement that human beings
descended from apes and his ‘blending’ theory of inheritance whereby an offspring is
said to be a mixture of the parents, have been objected to and argued against,
particularly by biologists and religious creationists (Buss, 1999). Nevertheless,
Darwin’s theory of evolution, particularly the gene transformation, is almost universally
recognised and accepted and has been fruitfully applied in many research disciplines.
Evolutionary theory views the development of biological and social systems as
occurring through a process of variation, selection and retention - occurring through a
44

slow process of small incremental improvements, rather than through a priori design
(Colarelli and Dettman, 2003). Darwin (1872) recognised that evolutionary thinking
could be applied to human behaviour where over the years of human history, natural
and sexual selection have shaped our biology. He recognised that humans are both
biological as well as cultural beings, as evidenced by the gene-culture co-evolution
approach, which explicitly recognises the importance of both factors in having shaped
the phylogenetic history of humans (Richerson and Boyd, 2005). Evolutionary
processes are adaptations to an organism's ecological situation, existing to guide
survivability and reproductive success where those individuals who succeed best may
be expected to produce the most viable offspring for the next generation and are thus the
most fit (Garcia and Saad, 2008). Therefore, it can be said that human behaviour is the
result of both adaptations and adaptability. The behaviour of individual organisms is
caused by the structure of their adaptations and the environmental input to them (Tooby
and Cosmides, 1992 ).
Cosmides and Tooby (1997) can be said to be responsible for initiating adaptationism in
the modem approach of evolutionary psychology. The authors present 5 principles to
define evolutionary psychology. First, the brain is a physical system and functions as a
computer therefore, our mind is designed to generate behaviour that is appropriate to the
environment. Secondly, the neural circuits in our minds were designed by natural
selection to solve our ancestors’ problems during evolutionary history. Thirdly, our
conscious thinking could mislead our decisions, therefore complex problems require us
45

to have complicated neural circuitry. Fourthly, different neural circuits are specialised in
solving different adaptive problems and finally, our mind is adapted to deal with
problems faced by our hunter-gatherer ancestors in the Pleistocene period.
Many attempts have been made to apply Darwinian thinking to analysing the human
behaviour. Skinner himself drew some interesting similarities between Darwinian’s
natural selection theory and his operant conditioning idea where he pointed out that as
well as natural selection being important for survival, operant conditioning is necessary
for one to learn and that operant conditioning is a second kind of selection by
consequences (Skinner, 1984). In his article on ‘Phylogeny’, Skinner tells us that
fishermen do not cast fishing nets just because of their intention or need to catch fish,
but that their net-casting behaviour has been reinforced and naturally selected and
evolved from the past, just as spiders spin their webs because of a biological trait that
they inherited from their ancestors (Skinner, 1953). Skinner(1984) in his article
entitled “Selection by consequences” stated that human behaviour is the result of three
types of variation and selection, which are reproduction, operant conditioning and
cultural evolution. According to Skinner (1984) the first selection, reproduction which
was led through natural selection, is responsible for the evolution of the organism’s
species and behaviour. The second kind of selection is operant conditioning ‘through
which variations in the behaviour of the individual are selected by features of the
environment’ where behaviour is reinforced by certain kinds of consequences (Skinner,
1990). Cultural evolution, which is the third kind of selection, is described by Skinner
as not a biological process but a kind of selection and variation to resemble the world in
which culture evolved through the evolution of social environment. Different cultures
46

emerge from different contingencies of variation and selection and differ in the extent to
which they help their members solve their problems, where those members who solve
them are more likely to survive and with them survive the practices of the culture
(Skinner, 1990). Acquired characteristics, behaviours and values are culturally selected
and retained through cultural evolution (Colarelli and Dettman, 2003). Humans
maintain a culture that accumulates information over time where valuable knowledge
that humans gain during their lifetime does not die with them and each new generation
can benefit from the experience and ideas of their ancestors (Lea and Newson, 2006).
Thus, human behaviour is the joint product of (i) the contingencies of survival
responsible for the natural selection of the species, (ii) the contingencies of
reinforcement responsible for the repertoires acquired by its members and (iii) the
special contingencies maintained by an evolved social environment (Skinner, 1984).
Skinner also points out that traits are usually transmitted from generation to generation;
however reinforced behaviour is transmitted only in the sense of remaining part of the
repertoire of the individual. The human species has been going through evolutionary
change where human traits and behaviour are adapted from the past and can be said to
be the result of natural selection. However, the species goes through another
evolutionary change under the control of operant conditioning, where behaviour is
shaped and moulded by its reinforcing consequences (Skinner, 1990). According to
Skinner, the process of natural selection where evolution occurs could take millions of
years; however, operant conditioning is a selection in progress as it occurs at a rate that
can be observed from time to time. Advice, rules, imitation, past experiences or even
religious belief could add reinforcement to human behaviour. Like water running
47
downhill, over generations organisms tend to flow into new functional designs better
organised for effective propagation in the environmental context in which they evolved
(Tooby and Cosmides, 1992 ). As Lea and Newson (2006) state, all organisms that are
alive today are the descendants of other organisms that thrived and reproduced in past
environments where these organisms were able to solve problems posed by the
environment in which they lived, but when the environment changed, different
characteristics were selected’ as individuals interact, communicate, exchange
information, knowledge and ideas and observe throughout their lives.
Richard Dawkins (1976), an evolutionary biologist, has contributed to creating a wide
understanding of how natural selection works through his well-known metaphor of the
‘selfish genes’. According to him, since genes need to survive for generations, it is
essentia] for them to adapt to the environment even if they need to ‘exploit’ and
‘deceive’ and those that are able to adapt to the changing environment successfully will
survive and pass on to the next generations, while those that failed would be obliterated
completely. The most important objective of a living being is survival and reproduction.
Our genes have survived, in some cases for millions of years in a highly competitive
world and a predominant quality to be expected in a successful gene is ruthless
selfishness where this gene selfishness will usually give rise to selfishness in individual
behaviour (Dawkins, 1976). Dawkin’s gene-centred view of evolution brought up the
suggestion of the selfless behaviour or altruism of two genetically-related individuals.
Altruistic behaviour has been noticeably shown by some animals such as birds giving
alarm calls to the others when seeing a predator, thus taking the risk of drawing the
predator’s attention to themselves. Human altruism is shown widely by the parents’ or
48

siblings* responsibility in taking care and helping each other whilst at the same time
fulfilling the purpose of life, which is survival and reproduction.
3.2 Inclusive Fitness and Reciprocal Altruism
Hamilton (1964) introduced his idea of inclusive fitness to expand on the earlier theory
of natural selection, specifically the Darwinian classical fitness (personal reproductive
success). The passing on of genes, he claimed, can be done not only by producing our
own offspring but also by supporting others in our family members to survive and
produce their own offspring. Our relatives are said to be carrying the same copies of
genes. Thus, inclusive fitness can be viewed as the sum of an individual’s own
reproductive success plus the effects the individual’s actions have on the reproductive
success of his or her genetic relatives (Buss, 1999). Hamilton’s (1964) theory of
inclusive fitness contributes answers to the questions that have been puzzling
evolutionary psychologists. Why would monkeys be seen giving alarm calls to warn
others of the presence of a predator even though the monkey is risking its own life by
risking being attacked by the predator? Why would a person risk his own life in saving
his brother from drowning in a river? Hamilton (1964) asserts that the answer to the
altruistic behaviour that can be found in both human and non-human species is gene-
transformation, which explains why one would sacrifice his own well-being for the
benefit of others.
49
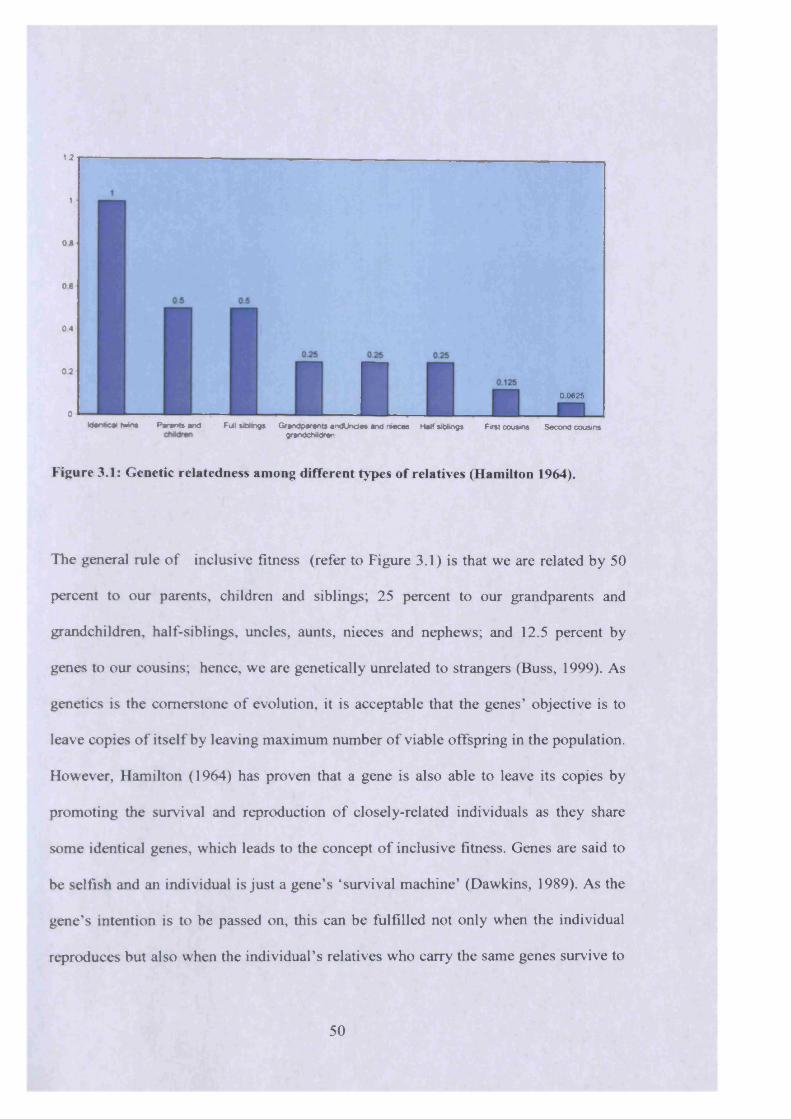
1.2
1
08
0 8
0 4
0-2
0
Figure 3.1: Genetic relatedness among different types of relatives (Hamilton 1964).
The general rule o f inclusive fitness (refer to Figure 3.1) is that we are related by 50
percent to our parents, children and siblings; 25 percent to our grandparents and
grandchildren, half-siblings, uncles, aunts, nieces and nephews; and 12.5 percent by
genes to our cousins; hence, we are genetically unrelated to strangers (Buss, 1999). As
genetics is the cornerstone o f evolution, it is acceptable that the genes’ objective is to
leave copies o f itself by leaving maximum number o f viable offspring in the population.
However, Hamilton (1964) has proven that a gene is also able to leave its copies by
promoting the survival and reproduction o f closely-related individuals as they share
some identical genes, which leads to the concept o f inclusive fitness. Genes are said to
be selfish and an individual is just a gene’s ‘survival machine’ (Dawkins, 1989). As the
gene’s intention is to be passed on, this can be fulfilled not only when the individual
reproduces but also when the individual’s relatives who carry the same genes survive to
5 0
n 0 0625
Idenecai leans Parents and Fiji sidings Grandparents andUncies and rseces Hart sidings First cousins Second cousinsgrandcftktren

reproduce. This concept explains how altruism is brought about in natural selection. As
relatives tend to share some genes inherited from the same ancestors, there is a great
possibility that the altruism genes stay in the individuals, which lead them to be helpful
and protective to each other and their offspring. Hence, natural selection is said to
favour altruism at the level of blood kin.
The idea that concern about the fate of others who are related or kindred is a key of the
inclusive fitness in neo-Darwinian theory (Hamilton, 1964). Fitness according to the
classic Darwinian Theory refers to the individual’s reproductive success (Bumstein et
al., 1994). Hamilton’s insight in his inclusive fitness notion is that the amount of
surviving and replicating genes would increase when the survival of the close family is
taken into consideration for reproduction. For a gene to receive positive selection it is
not necessarily enough that it should increase the fitness of its bearer above the average
if this tends to be done at the heavy expense of related individuals, because relatives, on
account of their common ancestry, tend to carry replicas of the same gene; and
conversely that a gene may receive (Hamilton, 1964).
Inclusive fitness might explain the altruistic behaviour among family members.
However, there are many examples of altruistic behaviour that involve individuals who
are not genetically related, which led to the reciprocal altruism idea of Hamilton’s
student, Robert Trivers in the late 1970s. He states that whenever the benefit of an
altruistic act to the recipient is greater than the cost to the actor, then as long the help is
reciprocated at some later date, both participants will gain (Workman and Reader,
51
2004). Blood donation is one of the obvious examples of self-sacrificing behaviour
towards non-relatives. The uniqueness of human species where unrelated individuals or
complete strangers cooperate and assist each other can also be related to the evolution of
culture. Humans can be seen sharing and owning information, skills, rules, values and
beliefs that are characteristics of the culture (Lea and Newson, 2006). This cooperation
is particularly relevant in trading where even in a competitive market, cooperation
between all parties (buyers, dealers, seller, distributor etc) is essential for trade.
Members of societies that participate in the global economy were among the most
cooperative (Henrich et al., 2004). Reciprocal altruism can be found in humans, but
does it exist in the animal kingdom? According to Trivers (1971), reciprocal altruism in
animal society exists based on the fact that the cost to the recipient should be lower than
the benefit to the actor; animals can recognise each other and these animals have a
reasonably long-life span which enables them to encounter individuals in the future so
as to have the possibility of reciprocation. However, it was argued that it is rare to find
altruistic behaviour among animals.
3.3 The survival of hunter-gatherer
The emergence of stone tools and ancestral methods of acquiring food grants
valuable insights into the hunting skills and activities of our ancestors. The traces
left, such as bones from large game animals found at ancestral campsites, can reveal
on how our ancestors solved the adaptive problem of securing food (Buss, 1999).
Meat has been the most important element in the human diet for million of years, as
52

it is very difficult to obtain all the necessary nutrients solely from a vegetarian diet.
Men’s larger size, upper-body strength and ability to throw projectiles accurately
over long distances make them well suited for hunting; while women, often
preoccupied by pregnancy and children were less well suited for hunting (Buss,
1999). Hunting was carried out periodically where men might hunt for three days
straight but then not hunt again for another two weeks (Halpem, 1980). A larger kill
would reduce the foraging time by providing meat for several days, wherein these
successful hunters would have more mating opportunities (Kruger and Byker,
2009).
Men, in pursuing risky hunting activities, would in fact benefit in several ways.
Hunting performance is assumed to be correlated with the hunter’s reproductive
success or inclusive fitness, as described by Smith (2004b). Good hunters are held
to have higher reproductive success; therefore, hunting can be seen as a form of
mating effort and status recognition. Gurven and von Rueden (2006) claim that
good hunters may also possess certain traits, such as intelligence and physical
vigour that are independently associated with both hunting ability and biological
fitness. These authors also show how important status is to the demonstration of
hunting prowess, where hunting leads to status and status leads to higher
reproductive success. The mating effort or status signalling model posits that extra
pair mating benefits accrue due to women choosing to mate with skilled hunters for
their good genes where better hunters usually have a greater number of total births
and of surviving children (Gurven and von Rueden, 2006). By gaining increased
53
sexual access to women, they increase their odds of fathering more children (Buss,
1999). Generally, better hunters produced a greater number of offspring.
Hunting itself can explain the fact that human males are unique in their heavy
parental investment, as meat, which is an economical and concentrated food
resource, is brought back to feed the young (Buss, 1999). Providing meat from
hunting to mate and offspring would also give them sufficient protein, lipids and
other important nutrients (Cordain et al., 2001) which have direct impacts on their
growth, immune function, health and survival (Larsen, 2003). Meat is shared among
hunters but is usually allocated with a bias towards family members and other
members of their group (Gurven, 2004). Nevertheless, the existence of reciprocal
altruism among these hunters can be clearly seen where meat may be exchanged for
other foods or assistance. In fact, sharing food would lead to more mating access
with more mates and allies and furthermore, the wives and children of these hunters
may receive attention and assistance from the others in the future.
Food consumption in the Pleistocene era may often have been related to spear-
wielding hunting activities; nevertheless the majority of the food was derived from
gathering carried out by females. Fruits, vegetables, nuts and tubers were collected
by frequent daily trips across generally familiar locations where these gatherers
would search for patches of food sources that had a higher proportions of ripe,
nutrition dense specimens (Kruger and Byker, 2009). In gathering, women would
visit a few patches where they might encounter and collect the ripe ones and leave
54

the others to be harvested some time later. These skills in vegetation foraging are
analogous to the modem consumer shopping where women will delay making a
purchase until the items they want is on sale.
Saad (2007) states that the evolutionary systems or modules in the human mind consist
of survival, mating, kin selection and reciprocity altruism. Survival can be defined as
the basic drive of a human being to stay alive through the reproductive age and compete
against others for basic resources such as food, water, shelter and protection from
predators; thus human mind should be prepared to respond quickly to unpleasant
situations that have the potential to threaten survival (Garcia and Saad, 2008). The
authors also suggest that mating is a complex process consisting of numerous evolved
responses to help direct mate choice and the subsequent production of viable offspring.
Human attraction consists of highly evolved mechanisms designed to identify
prospective suitors with superior genes with whom to have offspring (Buss, 2005).
Attractiveness, compatibility and having adequate resources are usually the criteria
sought in choosing mates.
Kin selection recognises that individuals can augment their inclusive fitness by
investing in and behaving altruistically toward their kin (Hamilton, 1964). This can be
clearly seen from the unconditional parental love and affection given to an individual’s
offspring. Love has evolved as an adaptation to guide mate choice as well as maintain
bi-parental investment for the successful rearing of viable offspring (Fisher, 1994,
Fisher, 1998). Reciprocal altruism, on the other hand, explains altruistic behaviour
55

directed towards non-kin (Trivers, 1971), that is, where an individual would normally
behave altruistically to others. Saad and Gill (2003) applied the Darwinian approach to
the gift-giving ritual and claimed that it is an important element in both inclusive fitness
and reciprocal altruism, where the allocation of one’s budget for buying gifts can be
well predicted by the genetic relatedness as well as reciprocal altruism for non-kin
members.
3.4 Language and the Human Brain
Monkeys and apes, which were acknowledged by Darwin as human beings’ closest
relatives tend to share many of the habits of human. These animals spend hours in close
physical contact, busily attending to each other’s needs in endless grooming sessions;
combing, picking, parting the hairs with the single-mindedness of a human mother
attending to her child’s hair as grooming to these animals brings pleasure, relaxation
feeling and creates trust between partners (Dunbar, 1996).
Dunbar (1996) states that the capture of the grooming motivational system correlates to
the evolution of relatively large groups and the invasion of a more terrestrial, open
habitat. Larger groups would generally assist each other by having larger habitats with
higher risk of predators. He states that living in a large group, however, leads to other
constraints as larger habitats and groups require one to travel further in order to have
sufficient food for the group members which makes them bum more energy. Thus, one
56
has to eat more to provide the energy, which in return requires one to travel further. In
fact, according to Dunbar (1996), there seems to be a relationship between brain size
and group size, as large groups need to be more sophisticated in maintaining the balance
between the many conflicting interests of the group members. As brains are needed for
survival by every species, some animals need larger brains to solve their more complex
problems of living. Fruit-eating animals like monkeys are claimed to need larger brains
than leaf-eating animals like sheep (Dunbar, 1996). He explains that this is because
fruits are very patchily distributed whilst leaves in contrast, are found in plenty, thus a
larger brain is needed for fruit-eating animals to move around searching for patches.
Humans exhibit a number of differences from animals, despite the similarities that we
share with other primates like apes, and most of these differences come from the large
brains that we have. Humans are known to have the largest brain size of any species as
we need larger brains to cope with our larger groups. Modem humans have brains about
nine times larger than we would expect for mammals of human body weight and about
six times larger than for a primate of human body size (Dunbar, 1996). Humans are
bom with brains less than one-third their final size with the rest of the brain
development continuing over the first year of life, whereas baby primates are bom only
when their brains have reached full size (Dunbar, 1996). This explains why humans
are helpless when they are bom and incapable of fending for themselves whilst a baby
animal is capable of getting up and walking within hours of its birth.
57

Dunbar explains that the initial increase in brain size about 2 million years ago seems to
correlate with a shift from a predominantly vegetation-based diet to a diet with a
significantly larger meat component in the hunter-gatherer period. Food obtained by
gathering such as fruits and vegetables might give them energy but the only source of
nutrient-rich food is meat. This explains the hunting activities of our ancestors, where a
male would willingly and bravely expose himself to the risk of being killed by predators
or wild and ferocious animals. The courage, stamina and skill of hunting provides
infallible proof of how good the genes are (Dunbar, 1996). Humans have undergone
some six million years of separate evolution where new traits and behaviours have been
added to accommodate the twists and turns of other aspects of evolutionary history
(Dunbar, 2004).
Dunbar (2004) asserts that during the course of primate evolution, the brain has
expanded forwards from back to front so that the bit that has increased out of all
proportions in modem humans is the frontal lobe, and it is the increased size of the
frontal lobes that is largely responsible for the much greater intelligence of the human
species. There is a correlation between social group size and the brain size, as larger
brain size is needed to manage the complex social world. The group size of humans is
about 150 (number of people humans know personally and have a meaningful
relationship with), where as chimpanzees live in communities with an average of 50 to
55. Thus their neocortex is smaller than that of humans.
58

Darwin’s great revolution in biology placed humans on the same scale as animals as
both share so many similarities. The only obvious difference is the language used.
Humans spend hours in grooming too, but more in talking and listening to each other.
The soothing and relaxing sense of pleasure from grooming act is what the humans
obtain from gossiping and talking about everyday social life (Dunbar, 1996). Just like
monkeys and apes building trust during grooming, humans establish trust and friends
through language; therefore language can be considered as a kind of vocal grooming.
All other species do communicate with each other but none can match the human
language. Human language enables us to do various things; coordinating many activities
of countless people in many different places. Language allows us to exchange
information and has the added advantage of allowing us to say a great deal about
ourselves, our likes and dislikes, the kind of person we are and to convey in numerous
subtle ways something about our reliability as an ally or friend (Dunbar, 1996). In fact,
hunting activities were co-ordinated by our ancestors based on the evolution of
language. In the fossil record, we see a sudden change in the style, quality and variety of
stone tools where the drawings of crude choppers and hand axes of the previous two
million years ago have changed to more delicate and more finely prepared tools which
hint at the development of language and social skills (Dunbar, 1996).
Monkeys are highly vocal animals and twitter away as they forage through the branches
in the forest, while baboons foraging through open woodlands keep up an intermittent
susurration of grunts, letting all the others in the group know their whereabouts
(Dunbar, 1996). Communication among these primates could be more complicated, as
animals need to identify different types of predators and preys by the sounds. Literally,
59

these sounds would have no meaning to humans but to these animals, each sound or
grunts has a different meaning. This situation, according to Dunbar(1996) is similar to
that of a person who knows only his native language and when he is confronted with
other different languages, hears only indistinguishable sounds he cannot understand the
meaning of, but once he has picked out a few words, he will eventually understand
some of the meaning. Language is in fact communication and it facilitates the bonding
of social members as by understanding a language, each sound produced by the
language has a meaning.
Conversation that interests and attracts humans is mainly conversation on social topics -
daily activities, families, work problems, other people, problems at home and so on. We
still engage in technical conversations but apparently, most of us tire rather quickly of
these topics (Dunbar, 2004). Conversation on social topics or ‘gossiping’ will normally
keep most humans happy and they can spend hours immersed in it. Humans’ much-
vaunted capacity for language seems to be mainly used for exchanging information on
social matters; we seem to be obsessed with gossiping about one another (Dunbar,
1996). Dunbar (2004) explains that this relates to the relationship between the neocortex
and group sizes in primates. He states that primates use grooming to bond their groups
and as the group size becomes bigger, more time is needed for them to spend on
grooming. As humans live in a larger group size, Dunbar claims that humans could not
engage in grooming as it is time- consuming and humans need more time to deal with
other activities such as finding food. Having language allows us to interact with or
‘groom’ several people and to keep track of what is going on around us. Grooming, for
humans, can be done at a distance by having conversation. Smiling and laughing, for
60
example, cause the brain to flood the body with endogenous opiates, just as grooming
among monkeys and apes stimulates the production of endorphins (Dunbar, 1996). This
explains why laughter is such an important component of conversation. Telling jokes
for instance, allows us to stimulate the opiate production of our grooming partner. Once
large brains and a language capacity had evolved as a way of bonding large groups, it
eventually led to the opening up of windows of opportunity in new directions such as
advertising.
3.5 Foraging Analysis
Foraging, which is a branch of behavioural ecology, brings interesting insights into
understanding the foragers* behaviour in response to the environment. Behavioural
ecology is a sub-discipline of biology that seeks to understand behaviour in an
ecological context, particularly how ecological forces, via natural selection, have shaped
behaviour (Stephens, 2008). In the behavioural ecology literature, foraging is a rubric
encapsulating a variety of the theoretical propositions and empirical models that address
common questions about decision rules for predators (Stephens and Krebs, 1986).
Nevertheless, foraging is not limited solely to decisions about prey items per se but
rather is a general-purpose set of rules and strategies for adapting to environmental risk
and uncertainty, yielding both prey items and information (Hantula, 2010). Theories of
foraging, which ideally have been generated by ecologists, have been analysed through
the frameworks of both anthropology and behavioural psychology. Studies on foraging
focus on the foraging behaviour of non- human animals, particularly surrounding their
61

habitats. More specifically, these studies emphasise not only on hunting for food, but
also the survival activities of animals.
The foraging behaviour of animals has sparked a great deal of interest in many
researchers in both the field and laboratory environments. Research in foraging cuts
across disciplines such as anthropology, biology, computer science, library science,
marketing and psychology (Hantula, 2010). The primary concern is mainly on how the
animals regulate their foraging behaviour based on the features and distribution of food
available. The foraging theory is a set of models that explore the strategic feeding and
consumption behaviour of animals (Stephens and Krebs, 1986) including a wide range
of behaviours from the search, identification, procurement and handling of prey to its
utilisation and digestion (Mellgren and Brown, 1987). The behaviour of organisms is
the means by which various types of scarce commodities are attained or used (Hursh,
1980, Hursh, 1984). Foraging, according to Snyderman (1987), can be divided into four
classes of decisions, with each option depending on the others made at the higher
levels (Figure 3.2). Habitat, which is the first selection, is seen as collection of patches,
and the choice of this is generally made once in a season or in a lifetime. A predator
needs to choose which patch to forage and how long to stay there; this decision is based
on the energy that the predator would gain and energy that would be spent in travelling
between the patches. Each patch has its own number and variety of prey types for
which a predator needs to have a strategy and within this strategy, a predator needs to
decide whether to capture or reject the prey.
62

Habitat Selection
Patch Selection
Prey
lection
Figure 3.2: The foraging hierarchy (Snyderman, 1987)
The process o f foraging involves many decisions that behavioural ecologists find useful
to think o f an interrelated hierarchy o f decisions (Stephens and Krebs, 1986). For many
animals, making the right decisions in foraging can make the difference between life
and death. Among the most fundamental problems to be solved for humans or any other
creature is the problem o f finding, securing and using resources; or in more general
terms, foraging (Hantula, 2010). Animals’ behaviour consists o f searching a patch for
prey, attacking and handling prey and travelling between patches (McCarthy et al.,
1994). This involves judgment not only on the patch assessment and patch exploitation,
but also the residence time. At the highest level o f the hierarchy, the animal needs to
identify the most appropriate place to forage. Patches can be seen by an animal as
consisting o f clumps o f food to be captured and utilised. As it moves through the
patches, it is then faced with prey choice decisions and it may accept or totally reject
some o f the prey selection. An animal foraging in the wild commonly searches for prey
that is not spread randomly throughout the environment; instead they occur in groups or
6 3

locations called patches (McCarthy et al., 1994). These foods are believed to be able to
provide the animals with the utmost fitness benefit, which is defined as the energy
intake. Ultimately, decisions such as how long should an animal as a forager should
stay in a patch and the amount of time required travelling to a new patch, need to be
made. Each patch may or may not contain any prey and if a patch does contain prey,
the search time to find the prey varies (Eliffe et al., 1999). Thus, animals need to
determine how long to stay and hunt in the patch and how to obtain the best out of it.
Foraging consists of many sequences and repetitions of activities from searching,
identification, encountering to eventually, the handling stage (Stephens and Krebs,
1986). The authors define searching as the time and energy devoted to finding patches
and prey items, and handling denotes the time and energy devoted to a prey item after it
has already been acquired or captured and before energy can be derived from it. In
handling stage, it should be noted that it is not guaranteed that a prey item will be
consumed as it may be abandoned or lost during this stage. A squirrel while cracking a
nut shell, might accidently drop and lose the nut. Foraging activities involve currency
and constraint. According to (Hantula, 2010), currency includes the assumption that all
foragers spend currency in the form of energy and time and that these are spent not only
on foraging but also on other activities such as grooming, nesting, avoiding predation
and mating. On the other hand, energy can be gained by consuming the prey; for
example, a carnivore would gain energy by consuming meat. Constraints, as claimed by
Hantula (2010), are generally conceptualised as interactions between the forager and its
environment; the forager’s phylogenetic endowments dictate their capabilities, while the
environment limits the availability of prey and information.
64

3.5.1 Patch
Organisms face an environment in which food is distributed in a patch manner (Pirolli,
2007). A bumblebee, for instance, has to make a decision on the flowers that it will take
nectar from. Some of the flowers are too complex and it may take time for the bee to get
its reward. It may have to learn how to obtain the nectar based on the shapes and colours
of the flowers. The same patches would be revisited the next day as long as the nectar
and pollen are still available. Patches normally contain limited resources and are usually
depleted by the foraging activities. A forager is believed to gain the most energy from a
patch at the beginning of foraging and eventually this energy will be depleted due to the
patch depression. Chamov et al (1976) defines patch depression as a decrease in the
instantaneous rate of energy gain within a patch and argue that patch depression might
also be caused by the evasive behaviour of prey.
Patch assessment is also a crucial point in foraging. Animal foraging consists of a
sequence of decision making and the decisions are made based on the information
possessed. It might be impossible to predict how much information an animal has. Yet,
the information needed can be obtained by its estimation and previous experience in the
particular patch. How animals assess foraging patch quality and determine how long to
remain in a patch before leaving has been of considerable interest in foraging theory
(Chamov, 1976, Cook and Hubbard, 1977). Many species o f ‘sit-and-wait’ predators
remain longer in patches where encounters with prey are more frequent (Zhang and
Sanderson, 1993). Information is gained by the animals from each of the foraging stages
65

related to the search time, prey density and handling cost, which then give a better
estimation of the prey and patch quality.
A patch could consist of visually indistinguishable patches that have either no prey or
some number of preys distributed at random, according to Lima (1984). To be efficient
and as optimal as possible in utilising the food in the environment, it is a necessity to
gather information about the habitat (Mellgren and Brown, 1988a). An optimal forager
is assumed to assess the quality of a patch prior to making any decision on staying in or
leaving the patch. A woodpecker for example, eats mainly insects or ants taken from
trees using its bill to hammer a hole into the wood. It would systematically search the
holes of a patch for food items and thus by manipulating the food distribution within the
patches, the bird could be made to experience differing rates of energy intake while
foraging (Lima, 1983).
Animals have to choose from the available options in order to utilise the most profitable
resource. Apart from that, they are also required to be updated on the value of the
available options as the relative value might change due to depletion and exploitation by
earlier foraging. Of course, different patches offer different rewards in terms of food
gain. Distinguishing better patches from poorer patches is essential to be able to make
the greatest foraging gain as possible. Sources of information in assessing patch quality
can be obtained from the pre-sampling and sampling information. Pre-sampling
information includes sensory cues, memory of patch location and quality from previous
patch sampling or information on the relative distribution of resources within patch
66
subtypes (Valone, 1991). For an animal to exploit most effectively a heterogeneous and
changing environment requires sampling behaviour and the development of
expectations about future encounters (Stephens and Krebs, 1986).
Uncertainty about foraging patch quality is one of the greatest problems foragers may
face in their decision making (Lima and Zollner, 1996). Although theoretical studies
have claimed that patches are chosen based on quality, there are indeed animals or
predators that may not choose the most profitable patches. The Marginal Value
Theorem predicts that the predator should leave the patch it is presently in when the
marginal capture rate in the patch drops to the average capture rate for the habitat
(Chamov, 1976). In behavioural ecology, the Marginal Value Theorem (MVT) is most
well known for its argument on patch departure. Chamov (1976) states that animals are
assumed to be exploiting resources in patches and would decide to leave the patch and
search for a new one. Travel time can be seen as a ground basis in leaving a patch.
Animals would normally stay longer if the travel time to another patches increased and
if the environment as a whole was becoming less profitable. Patch residence time
increases with increases in travel requirements (McCarthy et al., 1994). If the predator is
to maximise its net energy gain while foraging in a patchy environment, it should leave
any particular patch when its expected net gain from travelling decreases and start to
search in the next patch(Chamov, 1976). Nevertheless, the Marginal Value Theorem has
also been criticised as some animals are unable to calculate the exploitation rate of a
patch and might have a lack of knowledge and information of the patch distance.
67

In most models of patch exploitation, the decision variable is time spent in a particular
patch type or more simply patch residence time (Stephens and Krebs, 1986). The
question of how long a forager should stay in a patch has attracted widespread attention
from ecologists. The activities of foraging animals are categorised according to
temporal phases which assume that some time is allocated to searching for prey,
choosing from among several items and handling prey items before any energy benefit
may be derived (Stephens and Krebs, 1986). A forager might only pay a short visit and
‘skim the cream* in a patch while another forager would rather exploit every single inch
of the patch to extract the most out of it. Foragers stay in the patch forever if there are
no changes in terms of quality. However, as time goes by, patches do change and prey
depletion will then force the forager to start searching for another patch (Shettleworth,
2010). Staying at the same patches could also be an advantage for a forager as it saves
time by concentrating and exploiting the familiar patches rather than having to spend
more time searching for new ones. Nevertheless, overstaying at the same patch may
become a disadvantage as the forager loses other opportunities and the prey in the
present patch might be depleted.
An animal is assumed to have control over which patch it will choose and how long it
will stay in that patch. The predator encounters food items within a patch but spends
time in travelling between patches (Chamov, 1976). Each time a predator visits a patch,
the food intake rate in that particular patch decreases with the time spent. In other
words, the longer a predator stays in the patch carrying out its foraging activities, the
less the food there will be in that patch. In order to leave a resource-depressed patch at
the optimal time, a forager must in some way keep track of its intake rate in the current
68

patch and compare this to the state of the rest of the environment (Shettleworth, 2010).
Travel time between patches has also been an attraction for many researchers. Foragers
will extend their stay in a patch if the travel time to another patch is longer. One would
expect a forager’s patch-leaving behaviour to reflect a balance between the diminishing
returns of patch gain and the value of the forager’s options elsewhere (Stephens, 2008).
Usually, a longer travel time would influence the forager to spend more time and exploit
the current patch. In contrast, a shorter travel time would drive a forager to leave the
patch.
3SJ2 Prey
As a forager moves through the patches, it is faced with a decision whether to accept or
reject a prey; this is better known as prey selection. A forager is expected to accept the
prey while losing the chances of capturing other prey, or reject the available prey and
continue searching. The classical prey selection model according to Shettleworth (2010)
is that (i) a predator recognises prey types instantly, (ii) preys are included in the diet in
order of profitability, (iii) choice is all or nothing and (iv) acceptance of a prey type
depends on the abundance of higher-ranked types. A forager is assumed to be able to
identify prey types as each prey varies in terms of profitability. In some foraging
situations, predators learn that certain types of feeding opportunities are signalled by the
occurrence of environmental events (Rashotte et al., 1987). These signals such as the
colouration and smell of the prey can be detected by certain predators who will then
69
interpret the profitability of the prey. Foragers are assumed to consume the prey once
they are able to catch it. Krebs et al (1978) suggest that:
‘There are two simple types o f maximizing rules. On the one hand the
predator might attempt to maximize its rate o f food intake at every instant in
time by always foraging in the patch with the highest expected reward rate.
We refer to this strategy as Immediate maximizing” Alternatively, the
predator might attempt to maximize its intake over the total foraging time
and sacrifice short term gain in order to acquire more information
Prey just like patches, change in terms of profitability in this changing environment. A
predator can be assumed to recognise a prey type and has knowledge of the profitability
of a prey. Prey is categorised according to its profitability and obviously, when a
predator is faced with two prey options, it is expected to choose the one that can offer
the highest energy-intake rate. According to optimality theory, a food item should be
accepted if the benefit obtained from consuming it outweighs the opportunity cost of
searching for and ingesting a more profitable food item within the time entailed
(Stephens and Krebs, 1986). However, when there is a decrease in all food densities the
less favourable food will become progressively more acceptable (Lea et al., 1987).
The delay-reduction hypothesis (DRH) (Fantino, 1969, Fantino, 1977, Fantino, 1981)
states that if schedules of reinforcement are presented in a successive-choice procedure,
the more profitable schedule (shortest time interval) should always be accepted;
therefore a schedule should be accepted if there is an enhancement in waiting time to
70

reinforcement correlated with the onset of the stimulus (Fantino and Preston, 1989).
DRH explains choice behaviour acceptably thus, given some overall delay to food in
general, those stimuli that signal greater improvements with respect to waiting time to
food should serve as more effective conditioned reinforcers than those that signal lesser
improvements (Williams and Fantino, 1994). Time is an essential variable in foraging.
A predator would normally go for a prey that can be obtained in the shortest delay.
Prey availability is essential in foraging as a predator could not forage without a prey.
Availability is the relative and absolute abundance of potential food items and is made
up of the dimensions of relative detectabilities and relative exploitabilities (Moermond
et al., 1987). An animal's foraging behaviour often indicates optimisation, where the
one that is more profitable would be chosen from the others. Nevertheless, there is a
tendency that a predator would engage in prey misidentification. ‘If animals have
incomplete information they may aim for optimality, but be unable to achieve this
because of difficulties in discriminating reliably between prey types* (Rechten et al.,
1983). It is thought that animals should sample currently less preferred but potentially
profitable resources (James 2002).
3 i3 Optimal Foraging
The optimal foraging theory seeks to explain adaptations of organism structure and
behaviour to the environmental problems and constraints of foraging for food (Pirolli,
2007). It attempts to address puzzling findings that arose in ethological studies of food
71
seeking and prey selection among animals (Stephens and Krebs, 1986) such as why a
predator will accept a certain prey species but reject the same species in another patch.
It is not so much a theory but a point of view and therefore a way of gaining insight into
the behaviour of foraging organisms (Chamov, 1976). The author states that the optimal
foraging theory is based on the foraging activities assuming that foragers will always
maximise their energy intake while at the same time spending the least amount of time
possible. In other words, an optimal forager would have the knowledge to determine the
best maximisation of items as food. A key assumption is that animals (including
humans) should have well-designed food-seeking strategies because higher rates of
energy consumption should generally translate in higher reproductive success (Pirolli,
2007). Literally, a different patch would have different amounts and types of prey which
yield different amounts of net energy. Conceptually, the optimal forager is one that has
the best solution to the problem of maximising the rate of net energy returned per effort
expended, given the constraints of the environment in which it lives (Pirolli, 2007).
The optimal foraging theory has contributed vast amount of information and has proven
useful in understanding the animals' foraging behaviour. Hence, it is able to assist in
identifying the constraints of both the animal and the environment. The optimal
foraging theory has been tested and yielded successful results by researchers such as
Stephen and Krebs (1986), Pyke (1984), Schoener (1987) and also Gray (1987)
(Shettleworth, 2010). Stephen and Krebs (1986) state that the optimal models of
foraging are generally made up of three components:
72

1. Decision assumptions which determine the types of prey and the best time to
leave a patch.
2. Currency assumptions concerning the maximisation of energy gained in
foraging. Achieving more energy enables a forager to survive and spend more
time in non feeding activities such as fighting and mating.
3. Constraint assumptions which include factors that limit the relationship between
the decision and currency variables. Constraints itself refer to both intrinsic
(abilities or traits of the animals) and extrinsic (placed by the environment).
Currency is the vital element in any foraging model. Any foraging model must begin by
formal specification of the currency to be maximised (Winterhalder, 1981). Currency in
non-human animals is defined as the energy intake per unit time spent in foraging (E/T)
(James, 2002). Predators usually earn currency in the form of energy and spend
currency in terms of energy and time. The value of gaining energy or calories for
example, is important for them in pursuing their routine activities such as hunting,
fighting and mating. In addition, currency is also spent by predators in the form of
energy and time as both are spent not only on foraging but also on other activities such
as grooming, nesting, avoiding predation and mating (Hantula, 2010). Generally, all
organisms are faced with constraints that would limit their abilities to forage and in
order to succeed one has to work within these constraints. These constraints normally
involve the interactions between the forager and its environment as a forager’s traits
dictate its capabilities to forage but at the same time, the environment limits the
availability of prey (Hantula, 2010). For example, a forager may have all the abilities it
needs to obtain the necessary prey but if the prey or patch is far beyond the forager’s
73
reach, the prey is to be considered non-existent. Time horizons might also be a
constraint, as only a small number of animals can be expected to forage continuously.
Foraging may be interrupted by the arrival of rivals or predators; night may fall or the
forager may need to groom, drink or return to its nest (Shettleworth, 2010).
Hence, animals are assumed to recognise the available alternatives before making the
correct choice (signal detection). The signal could come not only from the prey but also
from the environment. It seems likely that in some foraging situations predators learn
that certain types of feeding opportunities are signalled by the occurrence of
environmental events (Rashotte et al., 1987). A bird, for example is aware of a
caterpillar (its prey) from the damaged leaves in a plant. A predator could also obtain
the necessary signal from its own colony, such as bees, which use signals through their
dance language. These signals can convey information that is crucial for foraging
survival. The use of foraging signals increases the efficiency of a predator in optimising
the profitability in a patch. Optimal foraging theory provides a quantitative approach to
predicting and evaluating responses of foraging behaviour, particularly as it involves
making a series of decisions (Chamov, 1976). Questions have arisen as to whether all
animals do act optimally to maximise their energy intake. The optimal foraging theory
attempts to predict the behaviour of animals whilst foraging. It is an extension of
Darwin’s theory of evolution which holds that an animal’s foraging behaviour
contributes to the next generation. In other words, it is based on the assumption that
animals engaging in foraging are assumed to have offspring that will forage the same
74
way. Therefore, the optimal foraging theory can be applied regardless of whether the
foraging behaviour is learned or innate (Pyke, 1984).
3.5.4 Affluent Foraging
Foraging exists not only among the animals but also existed among our ancestors in the
prehistoric life. Hunting, for example has been an important route of survival in hunter-
gatherer societies. The evidence of tools used by them million years ago indicates that
their foraging lives were led by hunting and gathering to obtain food. Archaeology
shows that foragers lived in semi-nomadic groups of 10-100 individuals, with highly
developed stone technology (spear throwers, bows and arrows, antler and bone blades)
that allowed them to hunt and butcher the largest animals successfully (Harris, 1977,
Smith, 1975). In fact, higher social status has been based on hunting abilities, which are
linked to higher biological fitness (Gurven and von Rueden, 2006).
Sahlins (1968) describes the quality of life in the Pleistocene age of foraging as the
original affluent society as all their wants and needs could be fulfilled simply by
gathering and hunting wild food resources. As their needs and wants were limited,
these people can be considered as ‘affluent’ foragers as their needs and wants could be
simply satisfied by hunting and gathering resources surrounding them. The basis of
Sahlins* argument is that hunter-gatherer societies are able to achieve affluence by
desiring little and meeting those needs/desires with what is available to them. In other
75
words, these humans* wants are finite and few, with technical means unchanging but on
the whole adequate (Sahlins, 1968). He also claims that as the hunters do not require
additional material possessions, and as they only satisfy their immediate needs with the
abundant resources, their amount of leisure time was increased. Primate studies of these
forager societies have shown that they worked less than early agriculturalists and maybe
less than we do today and they even knew how to conserve resources to avoid over
exploitation (Harris, 1977). Another characteristic of their lives is food sharing. Meat
obtained from hunting directly provisions families and is also distributed to other group
members, who may directly or indirectly pay back good hunters with meat, other food,
services or favours (Gurven and von Rueden, 2006). The sharing characteristic of these
hunters is also a sign of reciprocal altruism. The affluence of this foraging is believed to
be attributed to both the limitless resources and the low density of population. These
people controlled their population through various methods such as breast feeding to
disrupt the menstrual cycle, abortion or even child homicide (Marceau and Myers,
2006).
Almost ninety-nine percent of human history is based on a foraging economy;
nevertheless, the foraging societies have indeed undergone great changes (Sasaki,
1981). As the population grows and the environment faces more changes, the era
switched to an agriculture era. The agricultural era emerged independently
approximately 13,000 years ago (Smith, 1995) which formed a fundamental transition
from foraging to early agriculture. In this new period, those countries with high
populations and which were rich in resources were described as ‘affluent foraging
societies* such as west coast of North America and Japan. The switch to agriculture was
76
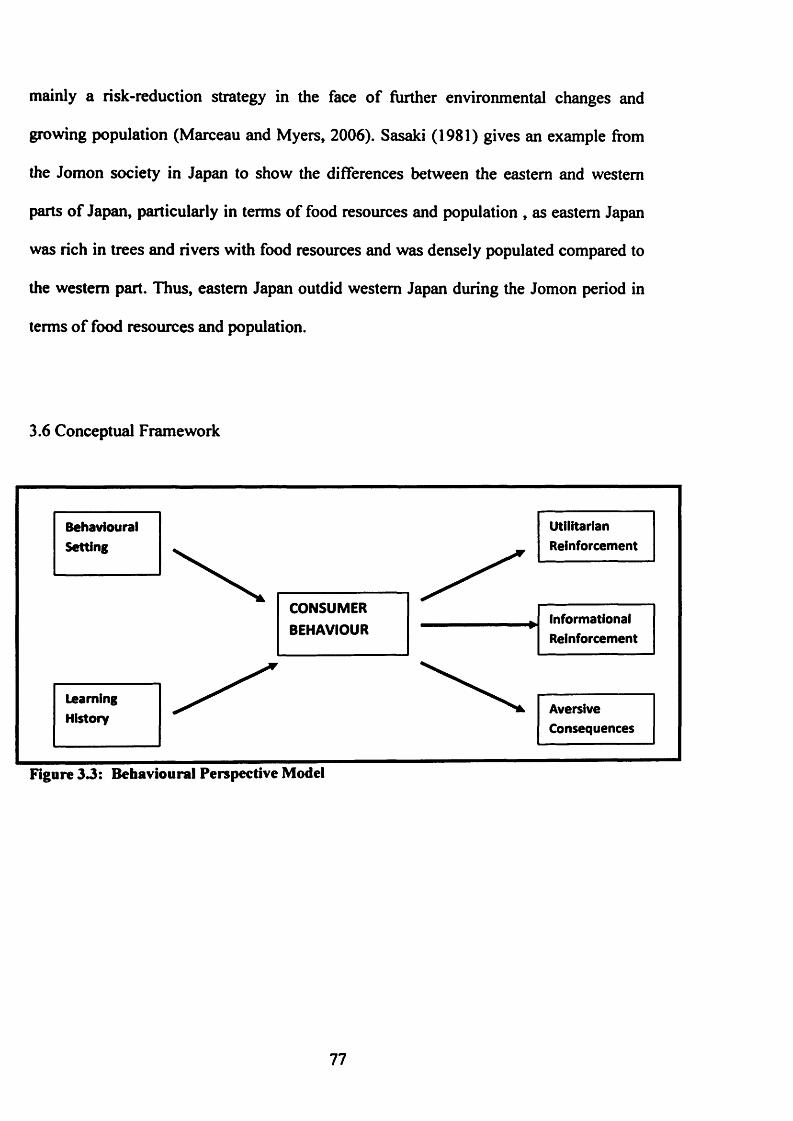
mainly a risk-reduction strategy in the face of further environmental changes and
growing population (Marceau and Myers, 2006). Sasaki (1981) gives an example from
the Jomon society in Japan to show the differences between the eastern and western
parts of Japan, particularly in terms of food resources and population , as eastern Japan
was rich in trees and rivers with food resources and was densely populated compared to
the western part. Thus, eastern Japan outdid western Japan during the Jomon period in
terms of food resources and population.
3.6 Conceptual Framework
UtilitarianReinforcement
BehaviouralSetting
CONSUMERBEHAVIOUR
InformationalReinforcement
LearningHistory Aversive
Consequences
Figure 33: Behavioural Perspective Model
77

Patches & Prey (Brand/Store) Survival
Inclusive Fitness
ConsumerBehaviour
StatusMatingInclusive Fitness
Natural Selection:
Genotype and Phenotype Price
Figure 3.4: Conceptual Framework
The elements of both the evolutionary psychology and foraging are placed in the
Behavioural Perspective Model framework (refer to Figure 3.3 and Figure 3.4). In this
framework, consumer behaviour can be seen as being influenced by the discriminative
stimuli that would elicit responses in human consumption, which are represented by
patch and prey as well as natural selection. In human consumption, patches can be seen
as either the supermarkets/grocery stores or the brands. Prey, on the other hand, can be
perceived as either the various brands (in the case of store as a patch) offered in the
stores or different reinforcement level (in the case of brand as a patch) which may be
attractive to different types of consumers. The patch and prey can be seen as similar to
the behavioural setting in the Behavioural Perspective Model. Consumers need to choose
the most suitable patch by selecting the most appropriate stores or brands that consist of
the best brands or different reinforcement levels that may suit their needs and
preferences.
78

In an evolutionary account of consumer behaviour, the learning history which
predisposes certain types of activity can be considered the equivalent of the genotype;
the pattern of behaviour resulting from this predisposition and the selecting
environment, the phenotype (Foxall, 1994). The relationship between both the genotype
and phenotype can be explained by the natural selection in evolutionary theory. The
genotype is a part of the evolutionary biology where the connections among the
organisms can be better understood by studying the gene transformation in the ancestor-
descendant relationship. Our genes have survived for millions of years and this entitles
us to expect certain qualities in our genes (Dawkins, 1989). The phenotype refers to any
observable traits or characteristics of an organism which are the result of the genes
inherited from ancestors and the influence of environmental factors. In other words,
genotype and phenotype theories elucidate how behaviour has been naturally selected
and evolved from the past, and thus reinforced through environmental and cultural
adaptations which then explain the biological traits that we inherit from our ancestors.
In the neo-Darwinian synthesis, a predisposing genotype represents the potential of an
organism to develop and behave, adapt and survive but, ultimately, it is the adaptation
of the phenotype to the environment that decides its biological fitness or capacity to
reproduce and, thereby, that of the genetic material to replicate (Dawkins, 1989).
Based on the aforementioned discriminative stimuli, consumers will then have different
responses in terms of the reinforcements. The survival element is related not only to the
individual's survival but also to the survival of the mate and offspring. Therefore, an
individual is usually trying his best to protect his partner and provides the necessary
resources for the mate’s and offspring’s survival. Buying necessary food, for example,
79

is a part of the survival aspect. Inclusive fitness, a concept which was introduced by
Hamilton (1964), demonstrates that an individual does not only produce his/her own
offspring but also supports others to produce equivalent offspring, which leads to the
existence of altruistic behaviour. Inclusive fitness can be clearly explained by the
unconditional parental love and affection given to an individual's offspring. Love has
evolved as an adaptation to guide mate choice as well as maintain bi-parental
investment for the successful rearing of viable offspring (Fisher, 1994, Fisher, 1998),
thus answering the question as to why consumers select premium-priced food brands.
Individuals are therefore influenced to be helpful and protective of relatives and
offspring, and in the case of grocery shopping, this can be seen when a consumer
chooses the most expensive and highly differentiated of food brands. Status display is
an important component in mating; with prestige as the most overt signal to attract a
mate. Therefore, inclusive fitness is also a part of requirement for status enhancement.
In human consumption, a consumer who is highly seeking status recognition can be
clearly seen in those involved in conspicuous consumption where the consumption of
branded and luxurious items is a part of displaying status symbols. This can be related
to the store or brand choices made by the consumers. For example, Marks and
Spencer’s store is patronised by consumers who value status symbols and prestige in
their purchasing. All of these elements can be seen as the positive reinforcement, while
the constraints in the human consumption are more related to the time and price. The
effects of price on consumer’s preferences and brand choices can be related to the travel
time in the foraging analogy. As animal foragers usually choose the shortest travel time
that could take them to the patch, consumers usually prefer to purchase the least
80

expensive brands. These events are relevant and significant to each other, which gives a
reliable framework of foraging in consumer choice.
3.7 Summary
Evolutionary psychology is a relatively new field of research focusing on evolved
mental traits and their impact on human behaviour as this field of inquiry builds on
concepts and ideas related to human evolution, primarily human evolution during the
period that goes from the emergence of the first hominids up to the present day (Kock,
2010). We are problem solvers, decision makers and hunter-gatherers as the basic
decision rules by which we live were shaped by natural selection (Hantula, 2010). It is
therefore reasonable to assume that this study can benefit from the insights from this
field as it introduces notions that are yet to be explored and can become one of the
pillars in elucidating the complex behaviour of consumers.
This chapter has reviewed the elements in evolutionary psychology such as natural
selection, adaptation of the human mind, inclusive fitness, reciprocal altruism and
language, as well as the definitions of patch, prey, currency and constraints and optimal
foraging in the studies of foraging. As foraging involves learning to obtain resources by
allocating the efforts most beneficially, it is hoped that the discussion in this chapter can
offer a potential explanation of consumer behaviour and provide new perspectives in
consumer psychology.
81

CHAPTER FOUR

C H A P T E R 4 *
THEORETICAL FRAMEWORK: BEHAVIOURAL ECONOMICS AND
BEHAVIOURAL PERSPECTIVE MODEL
4.0 Introduction
This chapter concentrates on the theoretical and literature review of behavioural economics
and the Behavioural Perspective Model, which are important and are adopted in this thesis.
The themes and literature on behavioural economics including the earlier development of
the field are discussed in this chapter. The application of the Behavioural Perspective
Model in this study is then explained specifically.
4.1 Behavioural Economics
‘Behavioural economics improves the realism o f the psychological assumptions underlying economic theory, promising to reunify
psychology and economics in the process. Reunification should lead to
better predictions about economic behaviour and better policy
prescriptions.' (Camerer, 1999)
83
Behavioural economics is defined as a commitment to empirical testing of the
neoclassical assumptions of human behaviour (Simon, 1987). It emerged as a sub
discipline of economics. The traditional classical and neo-classical economics rest on
assumptions that people have rational preferences and maximise utility based on full
and relevant information. Economics has not simply been the study of the allocation of
scarce resources but rather has been the study of the rational allocation of scarce
resources (Simon, 1983). Economics, according to Ely (1930), is the science which
treats of those social phenomena that are due to the wealth-gaining and wealth-using
activities of a man. It is well known for its analytic approach, where great emphasis is
placed on mathematical model and formulation. Individuals, according to economists,
are bound to behave in a way that could maximise their utility or self-interests. This
principle of optimisation can be seen as the main pillar of economic theory.
Optimisation is a central principle of not only physical science but also social science
(Bordley, 1983).
Earlier, the psychological approach was linked to classical economics where
explanations of human’s behaviour focused more on the perspectives of utility and
psychology. However, during the neo-classical economics era, the psychological
approach was neglected, which then led to unforeseen mistakes and errors. According to
Simon (1983), traditional economic theory assumes an individual as an ‘Economic
Man*; a rational individual who has knowledge of every aspect of his environment, is
well-organised with a stable system of preferences and good at calculation; all of these
criteria enable him to reach the highest point on his preference scale.
Humans are seen as behaving rationally in fulfilling their self-interest and will only
84

settle for the best. The Economic Man is described as being rational in the pursuit of
his self-interest, implying that individuals behave in order to maximise utility
(Herrnstein, 1990a). Rational behaviour itself is behaviour that maximises utility and
this utility can be equally substituted with pleasure or well being (Rachlin, 1980).
Criticisms have been made of this theory, as humans are believed to behave irrationally
when it comes to making decisions. They are limited by a number of constraints; thus
the economist’s view on rationality and optimisation are said to be misleading. Rachlin
et al (1976) argue that if basic axioms of demand theory like ‘more is better than less*
are not even consistently observed in animal behaviour studies, these principles are
likely to be even more inappropriate in the context of human behaviour. Sen (1987)
states that mainstream economic theory, subscribing to the maximisation of self-
interest, ignores people’s role as free agents in which they are not always maximising
their individual well-being. Economics has traditionally been concerned with what
decisions are made rather than how the decisions are made (Simon, 1982).
According to economists, a theory is a body of mathematical tools and theorems, whilst
to psychologists, a theory is a verbal construct that organises experimental regularity
(Camerer, 1999). Herbert Simon in the 1950s took a step in reunifying psychology and
economics. Cognitive psychology was then brought back to shed these arguments and
seated interests to the economic theory. Theories of bounded rationality were then
introduced by Simon (1957) as theories that incorporate constraints of the information-
85
processing capabilities of the individual. According to this theory, people do make
rational decisions but within certain limits and these limitations include time, money,
information, and so forth. Economic concepts are applicable and significant in
behavioural analysis. Similarly, the behavioural approach can be applied meaningfully
in economic studies. Thus, a combination of both concepts and theories employed could
lead to a greater understanding of the interaction between behaviour and the economic
variables and is held to be able to explain human behaviour, with promising findings
and outcomes.
Behavioural economics was established on the basis of psychology and economics with
the intent to investigate actual human behaviour constrained by their bounded
rationality (Simon, 1987). It combines the theory of economics with the content of
operant psychology (Winkler and Burkhard, 1990) in an attempt to explain the theory of
economics with psychologically and cognitively approach. It lies between the
disciplines of pure economics and psychology. The two principal objectives for
bringing psychology into economics are broadening the behavioural basis of economic
analysis and expanding the limits of applicability of economic theory (Aibanese, 1988).
Behavioural economics refers to the area of economic research concerned with
predicting and controlling human behaviour (Kagel and Winkler, 1972) and reveals
human limitations and complexities in its investigation and experiments. It promises
empirical techniques and findings in the pursuit of understanding and predicting how
consumers allocate the available economic resources for purchase and consumption
(Pratt 1972). Laboratory experiments have been widely accepted and employed by most
86

behavioural economists (e.g.Kagel and Battalio, 1980, Kagel et al., 1975 , Lea, 1978,
Battalio et al., 1981, Kagel et al., 1981) These studies have been used in interpreting
human economic behaviour as the strong similarities between non-human animals and
humans behaviour in consumption were revealed through these experiments. Rachlin
(1980) states that the behaviour of non-human animals conforms to empirical law of
economics or the law of demand. Nevertheless, these experimental techniques have
been criticised as being too artificial and easily manipulated. Lea (1981) argues that
artificial experimental techniques could cause excess formalism, with laboratory
settings being constructed as an over-simplified economy where animals as subjects can
be easily manipulated to behave following the researcher’s request. Furthermore, as an
animal’s behaviour is constrained by its ecological niche, the task and choice problems
in the experiment are designed to be compatible with the organisms’ biological
characteristics (e.g. lever pressing for rats and key pecking for pigeons).
Several tests, therefore, have also been conducted in an experimental economic system,
called token economies. Token economies are ‘simple, small, closed economic systems’
(Winkler, 1980). They are similar to laboratory environments in terms of the researchers’
degree of control of the variables. Token economies were used when a number of
respondents lived in a controlled economic environment for a specific period of time and
were given tokens for work performed which were in turn exchangeable for present and
future consumer goods (Battalio et al., 1974). These tokens were then used by them as a
symbol of money to exchange for purchasing goods. The system closely corresponds to the
economist’s concept of an economic system where tokens are money, token payments for
work performed are wages and the exchange rates in tokens for consumer goods are the
87

prices of these goods (Battalio et al., 1974). The advantages of this token economy system
are that the relative simplicity of economic structure, small size and routine maintenance of
controls in such environments facilitate the control and measurement of observational
errors in conducting such a test through the design of data collection procedures and allow
for the direct participation of the data users in the collection of primary observations
(Battalio et al., 1973b). This controlled environment also permits the manipulation of
variables to determine the basis of consumer behaviour (Kagel and Winkler, 1972). In fact,
token economies have been widely used for behaviour modifications, psychological
operations and drug abuse control (Kazdin and Bootzin, 1972, Winkler and Burkhard,
1990, Hursh, 1993). For example, Kazdin (1981) found that monetary incentives given as a
token reinforcement could reduce absenteeism, while Hursh(1993) states that the demand
of illicit drugs could be decreased if therapy drugs are given during a medication period.
Comments have been made on the fact that the experiments conducted in a token economic
system originally initiated as a therapeutic environment for psychiatric patients.
Nevertheless, the fact that token economies were originally developed by psychologists and
have been primarily used for the purpose of establishing therapeutic environments does not
change the logical structure of the answer to the question of the extent to which the
variables and relationships studied in token systems can be generalised to national
economies (Battalio et al., 1973b). Furthermore, the empirical relationships discovered in
therapeutic, controlled environments are quite similar across environments containing
radically different populations (Kazdin and Bootzin, 1972). These relationships do not
contradict the national economic system data. Furthermore, these controlled economic
environments have been successfully established specifically as research environments
designed to investigate socio-economic behaviour using volunteer subjects in the full
88

knowledge that they are participating in a research programme (Bigelow and Emurian,
1974). Hence, it has been proven that these environments can be used for the experimental
analysis of behaviour.
At the end of the 1970s, animals and human laboratory experiments were conducted by
behavioural economic researchers to observe economic variables such as price and sources
of reinforcement on the humans’ behaviour (Madden, 2000). In fact, several components of
economic theory such as downward sloping demand curves could predict non-human
animals’ behaviour accurately (Kagel and Battalio, 1980) as they explain and predict
behaviour measured by rates of both the response and reinforcement. Behavioural
economic concepts have proven to be advantageous in understanding the environmental
control of behaviour for a variety of commodities in closed systems and the factors that
control the allocation of behavioural resources among available reinforcers (Hursh, 2000).
It elucidates behaviour through differential reinforcement and provides a framework to
analyse behaviour (Berry and Kunkel, 1970, Foxall, 1999). It has been used successfully in
examining consumer brand choice in a natural setting (Foxall and James, 2003, Foxall and
Schrezenmaier, 2003, Foxall et al., 2004, Oliveira-Castro et al., 2005, Foxall et al., 2006,
Foxall and James, 2001), thus initiating this research, adopting the same approach.
89

4.1.1 Rationality and optimisation
Rational choice theory has long been a paradigm and central concern in economics. It is
used as a framework for understanding economic behaviour. Traditionally, economists
assume that human beings act and behave logically and rationally in order to maximise
their self interest. It posits that, like Economic Men, all humans use full and relevant
knowledge of their environment to maximise their subjective utility rationally for their
self-interest (Simon, 1955, Rachlin, 1980, Hermstein, 1988). Humans are capable of
making a rational decision and to behave accordingly based on the assumption that they
know exactly their preferences and what they are obtaining. Hence, individuals who act
in a non-optimising way are considered to be irrational.
The underlying theory of the traditional economy is rationality and optimisation.
Humans are capable of reasoning. After weighing up the costs and benefits of possible
alternative courses, people behave accordingly (Vaughan and Hermstein, 1987). The
rational man of economics is a maximiser, who will settle for nothing less than the best
(Simon, 1982). An individual is believed to always opt for the best alternative that
yields the utmost satisfaction (Coleman, 1973). According to Hermstein (1970) and
Rachlin et al (1981), all behaviours can be inferred as choice. Choices, according to
economists, are made with the objective of maximising utility or with the highest
immediate return. Optimisation or maximisation takes place when individuals allocate
their responses to the alternative which has the greatest overall return, irrespective of
90
which has the higher immediate return (Tunney and Shanks, 2002). ‘Homo
Economicus’ or Economic Man is presumed to be organised, and to have full
knowledge about his environment and skills in computing to reach the highest point on
his preference scale (Simon, 1955). An Economic Man is described as wholly free,
unsocialised, entirely self-interested, and not constrained by norms but only rationally
calculating to further his own self-interest (Coleman, 1986). Rational choice, according
to economists, is applicable to all human beings. As the term rationality is similar to
consistency, a rational man’s choices are consistent with one another (Sugden, 1991). In
other words, every decision made is determined by the individual’s preferences.
Rationality denotes a style of behaviour that is appropriate to the achievement of given
goals, within the limits imposed by given conditions and constraints (Simon, 1983). The
rational choice concept indicates that individuals make a choice by maximising utility.
Utility itself is really subjective, cannot be measured or observed and rationality is
hence, a mere interpretation of behaviour (Hermstein, 1990b, Lewin, 1996). Baum
(1981) described maximisation behaviour as an individual maximising his satisfaction
or happiness within specific constraints. It ignores the emotional aspect that contributes
to human behaviour, as humans are assumed to know exactly what they want with fixed
preferences. This rationality concept of neo-classical economic models is criticised for
being too unrealistic and inflexible. It is said to be strictly normative without any
explanation about the process (Staddon, 1980, Hinson and Lockhead, 1987).
Furthermore, in reality, humans daily economic behaviours are in fact irrational as they
fail to yield optimum returns, which Watson (1986) relates to impulsive purchasing
91

where consumers tend to change their choices and preferences instantly. The theory
lacks an understanding of consumer motivation. As Simon (1955) points out, people
might be rational but only in certain actions, and thus act irrationally and emotionally in
others. In fact, consumers who tend to change their preferences or engage in impulse
purchasing or compulsive purchasing could be categorised as irrational. In an analysis
of real human choice behaviour, the rationality assumption is at best unproven,
generally unhelpful and sometimes clearly false (Lea et al., 1987). In everyday life,
human choices are not always made by maximising their utilities (Rachlin et al., 1976).
The rationality theory is criticised as being too normative and explains the actual behaviour
poorly (Hermstein, 1990b). Humans are limited in acting rationally due to their limited
capabilities in processing information and solving complex problems, as humans always
intend to make rational decisions and are goal-oriented, but due to cognitive limitations,
they often fail to do so. Cognitive limitations impose limits on a decision maker's ability to
adjust to his or her environment. Rather than maximising or optimising, humans tend to
make satisficing choices in complex situations and are seen to opt for a satisfactory rather
than the best decision. It is therefore decided that a model is needed ‘to replace the global
rationality of economic man with a kind of rational behaviour that is compatible with the
access to information and the computational capacities that are actually possessed by
organisms, including man, in the kinds of environments in which such organisms exist’
(Simon, 1983). Maximisation, optimisation, rational and irrational are descriptions of
behaviour rather than descriptions of the mechanisms underlying behaviour as, behaviours
92

can be rational but not necessarily rational in the sense of being consciously-reasoned
through and vice versa (Lea et al., 1987).
4.1.2 Bounded Rationality and Melioration
Theories of rationality are limited in terms of the risk and uncertainty, incomplete
information about alternatives and complexity in the cost or function or other
environmental constraints (Simon, 1982). Simon (1955) developed ‘bounded rationality’
theory and highlighted the limited capabilities of human beings in making decisions and
solving problems. Theories of bounded rationality incorporate constraints on the
information-processing capacities of the actor (Simon, 1983). Humans are well-known to
have limited cognitive capabilities and therefore are often incompetent in processing
information and solving especially complex and difficult problems. Simon’s ideas of
bounded rationality and satisficing contribute to the understanding of consumer research.
Literally, limitations to rationality derive from factors such as risk and uncertainty,
incomplete information about the alternatives and also complexity in other cost and
environmental constraints (Simon, 1983). In making decisions, humans are faced with
constraints or limitations and these could be session constraints, time constraints, ratio
constraints, interval constraints and others which most of them are often environmental
constraints; imposed from outside and humans have no control over them (Rachlin et al.,
1981). Instead, humans should be acknowledged as to be engaged in satisficing rather than
optimising search behaviour. Satisficing itself is referred as a mode of decisions where
satisfaction is the objective rather than maximisation.
93
Since man is a developing animal, a learning animal and a social animal, it would be absurd
to assume that the preferences of any members of any household remain unchanged over
time and unaffected by their environment (Green and Rachlin, 1991). Hermstein (1990b)
introduced ‘melioration’ which is defined as the process in which a difference between
local rates of reinforcement leads to a continuous change in the distribution of behaviour in
the direction of an equality of local reinforcer rates (Davison and McCarthy, 1988).
According to the theory of melioration, organisms shift preference in favour of the
alternative that provides the highest return (Tunney and Shanks, 2002). Behaviour is likely
to be a random switching between alternatives. Humans make choices more on an ongoing
basis based on the reinforcement rates. In fact, the switching among all brands made by
most consumers is suggestive of both matching and melioration (Foxall, 1999). Tastes and
preferences of an individual change, although the individual may have complete
information. The individual will switch to other alternative when the current reward is no
longer the highest. In other words, melioration is a molecular mechanism that attempts to
describe behaviour moment by moment (Hermstein, 1997).
The principle of melioration can be described by the example of a student doing an
assignment or coursework with a deadline for submission. The student is expected to focus
and give full attention on the assignment given. Along the way, distractions come in
different forms such as watching television, going to a movie, dating, sleeping, etc. As long
as the student has the interest and motivation in the assignment, working on the assignment
would be the top priority and these distractions might be rejected. This situation may be
94

seen particularly when it is near to the deadline. However, at certain times, the student
might shift his/her attention to these distractions rather than concentrating on writing the
assignment, particularly when the level of motivation is low and the deadline is still a long
way off. The student might choose to see friends or watch movies instead with the intention
of paying attention to the assignment later on that day. The shift of attention of the student
is based on the reinforcement rates, which in this case would be having good grades,
pleasure or having fun. Melioration explains the human’s behaviour by recognising that the
best alternative will be chosen through changing preferences accordingly.
The local reinforcement rates are indeed the key variables in melioration (Hermstein,
1997). If one reinforcement is better than another, humans would tend to choose the first
one and continuously shift from one alternative to the other as long as it is better than the
other. The notion of melioration is simply a restatement of the principle of reinforcement
itself: other things equal, more reinforced responses occur more often than less reinforced
responses where a rise or a fall in the reinforcement of a response causes the rate of
occurrence of the response to change in the same direction (Hermstein, 1997). At any point,
an individual is believed to choose an alternative with the highest reinforcement rate.
Melioration is sometimes described as the behaviour mechanism underlying the matching
relation (Hermstein and Vaughan, 1980). In fact, melioration and matching can attain
suboptimalities in the case of distributed choice where one’s allocation of choices affects
the returns obtained from the alternatives (Hermstein, 1990a, Hermstein and Vaughan,
1980, Hermstein, 1990b). Therefore, melioration implies matching. It differs from
economic optimisation as optimisation involves maximising the total utility, which includes
the future utility. Melioration in contrast, is about choosing the highest reinforcement rate

at that particular time and future considerations are not included. It is a process in which a
difference between local rates of reinforcement lead to a continuous change in the
distribution of behaviour in the direction of an equality of local reinforcer rates (Davison
and McCarthy, 1988).
4.1J Substitutability and Matching
It has been shown by Ehrenberg (1988) that most consumers are multi-brand purchasers
and only comparatively few purchasers are 100% loyal to a certain brand. These multi-
brand purchasers are said to be searching for benefits which can be gained from other
substitutable brands that have almost similar physical features and formulation.
Substitutability in consumer and marketing terms is understood as occurring when two
different goods can be substituted for one another. As Rachlin(1989) states, the idea that the
value of a commodity is determined by its interdependency with other available goods lies
at the heart of the issue of substitutability. Consumers can easily switch their preference to
another product which they perceive as equal in terms of utility outcomes. Hence, in
economic analysis, two commodities, x and y are substitutes if a reduction in the price of x
leads to an increase in the quantity demanded of x and a decrease in the quantity demanded
of y (Foxall et al., 2010). The degree of substitutability between goods, or reinforcers, can
be affected by the extent to which they are qualitatively similar or dissimilar (Green and
Freed, 1993). Literally, goods or products are substitutable when both items are
qualitatively similar and share the same functions. However, there are qualitatively similar
items that are less substitutable or qualitatively dissimilar items that can be substitutable.
96

Most choices in real life are between tennis balls and oranges rather than Coca Cola and
Pepsi, i.e. between qualitatively similar yet functionally dissimilar goods rather than
qualitatively and functionally similar goods (Green and Freed, 1993).
The substitutability of commodities is influenced by the immediate availability of the
alternative reinforcer, as if one reinforcer is not immediately available, substitutability for
the second one would be lower (Green and Freed, 1993). Similarly, substitutability is also
affected by the open or closed economy (Hursh and Baumann, 1987). Closed economies
are described as situations where consumption is restricted to what is earned by a subject in
interaction with the schedule of reinforcement (Hursh, 1984). An example of a closed
economy can be clearly seen in a token economy where subjects are given tokens to be
used as currency to purchase certain items. In order to acquire these tokens, these subjects
are required to perform certain tasks and follow specific regulations. Conversely, in open
economies, subjects are given more freedom and will be given free food and other
reinforcers in between or after session; therefore they do not have to work harder once the
‘price’ goes up in the session itself (James, 2002). Hence, price elasticity is normally
higher in open economies than in closed economies, as subjects learn that they do not have
to strain themselves to earn more food during the sessions: the experimenter provides a
substitutable source of supply outside the session (Hursh and Baumann, 1987).
In the theory of consumer demand, indifference curves can serve to represent preferences;
thus, interest in indifference curve is secondary to interest in demand curves (MacCrimmon
97
and Toda, 1969). The substitutability of two commodities can be explained by the contour
of the indifference curve. According to the authors, the theory of indifference curve was
developed by Francis Ysidro Edgeworth, Vilfredo Pareto and others in the early years of
the 20th century and typically assumes that (1) indifference curves slope downward from
left to right (negative slope); (2) the curves do not intersect as consumers will always prefer
to have more of either good than less and finally; (3) the curves are convex, as when
consumers have less and less of one good, they require more of the other good to
compensate. If a consumer prefers two products equally, then the consumer is indifferent
about the two products and will get the same level of satisfaction or utility from either
product. An individual is said to have no preference for any points along the indifference
curve; hence the slope of this curve illustrates the substitutability of the products
(Schrezenmaier, 2005). The shapes of the indifference contours depend on the
substitutability between the traded commodities; the more substitutable the commodities
arc, the flatter the indifference contours will be, and the less substitutable the commodities
arc, the more bent the contours will be (Rachlin, 2003). If the curves are convex, this
indicates that consumers are willing to give up one good in exchange for more of the other
good. If the goods are perfectly substitutable, the curves will be parallel lines and if the
goods are perfect complements, then the indifference curves will be L- shaped. Therefore,
the contours for coffee and tea would be flat whereas the contours for coffee and apples
would be steeper or bent. In other words, the better substitutes the products are, the
straighter the indifference curve.
The possibility that matching analysis reveals the degree of substitutability,
complementarity and independence among economic commodities has a considerable
98

history in behavioural economics (Foxall et al., 2010). Rachlin (1982) states that the
matching law, an economic law, serves as a measure of preference and substitutability of
goods. Perfectly substitutable and complementary products are located at the end of this
continuum respectively, with independent products lying in the middle point between both
(Romero et al., 2006, Schrader and Green, 1990). As one good can substitute another,
customers can trade off one good for the other, particularly when the price for either one
increases. Coca-Cola, for example, can be substituted with Pepsi or other sodas for a thirsty
person. In contrast, complementary products are goods that have to be consumed with
another. For example, coffee and sugar are complementary products that need to be
consumed together. A reduction in the price of x leads to an increase in the quantity
demanded of both x and y for complementary commodities, whereas commodities are
independent if a change in the price of x has no effect on the quantity demanded of (Foxall
et al., 2010). In summary, the more functionally similar the goods, the more exchangeable
these goods could be.
4.1.4 The Matching Law
Rachlin et al (1981) state that all behaviour is choice behaviour; hence, the objective of
behavioural psychologist is to predict behaviour in making choices. Hermstein’s General
Matching Law (1970) predicts that organism will ‘match* their behaviour to the relative
returns from the environment, rather than maximise, or exclusively selecting the option
with the highest rate of return. In fact, this is a departure from the traditional economic
theories of consumption that equate maximisation assumptions with rationality
99

(DiClemente and Hantula, 2003). Matching is a relationship between a pattern of
behavioural choices among alternatives and the pattern of reward to which those choices
lead (Foxall, 1999). It is a theory of choice; therefore matching is also defined as the
tendency of individual organisms to allocate responses among alternatives in proportion to
the reinforcement obtained from each - is a well-documented phenomenon of both non
human and human responses in experimental contexts (Davison and McCarthy, 1988). In
other words, the matching law states that relative amount of behaviour, measured in terms
of rate of response or time spent, matches the relative rate of reinforcement on alternatives
(Pierce and Epling 1983).
Matching law is not a matter solely of understanding or predicting the actions or behaviours
of the subject solely, but the proportion of time spent in doing the actions or activities. We
know that in a park, a child is faced with choices of using a see-saw, swings, slides or even
monkey bars. Matching law is concerned not with which playground equipment a child
would choose, but more on the time spent by the child on each of the pieces of equipment.
If an interval of time may be divided into more than one alternative activity (that is, if
behaviour is free to vary), animals (non human and human alike) will allocate their
behaviour to the activities in exact proportion to the value derived from each (Hermstein,
1997). The rate of responding is similar or equal to the reinforcement rate; therefore,
matching is about equality. The matching law is able to explain and interpret even complex
behaviours. It has been utilised as a rule of human choice in a wide variety of settings
(McDowell 1988, Baum, 1975, Pierce and Epling 1983, Conger and Killeen, 1974,
Schroeder and Holland, 1969). It helps us to understand the reasons why a human being is
unable to resist temptation, and thus does not make a better choice of action which would
100
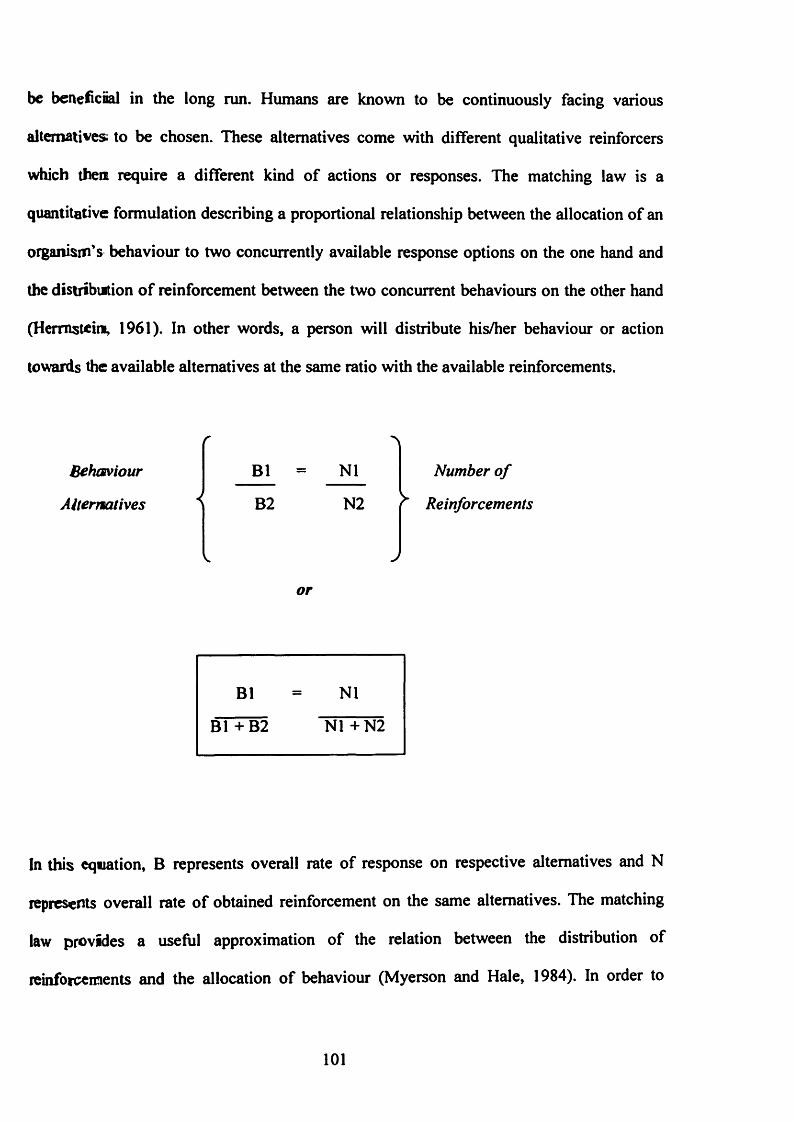
be beneficial in the long run. Humans are known to be continuously facing various
alternatives to be chosen. These alternatives come with different qualitative reinforcers
which them require a different kind of actions or responses. The matching law is a
quantitative formulation describing a proportional relationship between the allocation of an
organism’s behaviour to two concurrently available response options on the one hand and
the distribution of reinforcement between the two concurrent behaviours on the other hand
(Hermstein, 1961). In other words, a person will distribute his/her behaviour or action
towards the available alternatives at the same ratio with the available reinforcements.
Behaviour
Alternatives
■\
B1 = N1
B2 N2
Number o f
' Reinforcements
or
N1
N1 +N2B1 +B2
In this equation, B represents overall rate of response on respective alternatives and N
represents overall rate of obtained reinforcement on the same alternatives. The matching
law provides a useful approximation of the relation between the distribution of
reinforcements and the allocation of behaviour (Myerson and Hale, 1984). In order to
101

obtain accurate predictions from matching law, the estimation of the number of
reinforcements and how these reinforcements can be affected by changes in both the
response rate and amount/length of time must be determined.
Historically, the matching law has been experimented with in the laboratories using
animals. Animals such as pigeons and rats are given choices in pecking between key X and
key Y; each offers different amount of food pellets. The results indicated strong evidence
that these animals distribute their responses on both X and Y in proportion to the relative
rate of reinforcement according to the distribution of reinforcement as per the matching
law. The same outcome has also been demonstrated with humans. The matching law has
been confirmed with humans under a variety of circumstances (Pierce and Epling 1983).
For example, matching has been reported with humans pressing buttons for money in a
situation directly analogous to the typical animal experimental situation (Bradshaw et al.,
1976) with subjects engaged in vigilance tasks (Baum, 1975, Schroeder and Holland, 1969)
and with people conversing in small groups (Conger and Killeen, 1974). Nevertheless,
these experiments have been conducted under tightly-controlled experimental conditions.
Little attention has been given to its practical application. There are indeed attempts at
describing the naturally-occurring behaviour-environment interactions by applying this law.
For example, a study on severe behaviour problems to assess matching relations in the
natural environment (Martens and Houk, 1989) and evaluation of time allocation between
communication and problem behaviour in an individual with Down’s syndrome (Oliver et
al., 1999). The outcomes demonstrate that problem behaviour and communicative
behaviour do also correspond to the reinforcement distribution in the matching law.
102

Hermstein’s (1961) initial discovery was that when animals are presented with two
opportunities to respond (pecking key A or key B), each of which delivers either reward or
reinforcement(access to food hopper) on its own variable interval (VI) schedule, they
allocate their responses to A and B in proportion to the rates of reward available in A and
B. In other words,
Bx/ (Bx + By) = Rx/ (Rx + Ry)
(deVilliers and Hermstein, 1976)
Bx represents the response rate and Rx represents the reinforcement rates. When
graphically presented, the ratio of B on one axis and R on the other, a 45° diagonal line
from the origin displays matching (James, 2002).
This equation is referred to by Hermstein as matching, and presents a useful framework for
the analysis of consumer purchasing behaviour. Baum (1974) later proposed the matching
law as
Bx + By « b (Rx / Ry )s
103
where B is the response, R is the reinforcement, b represents bias and s represents
sensitivity (Baum, 1979). b or bias represents the intercept and it is considered to be absent
when the above equation is re-expressed in logarithmic form. Bias is the result of a
deficiency in experimental design rather than a shortcoming of the experimental subject; it
represents a failure to take account of all of the independent variables that influence
preference and declines as relevant independent variables are increasingly taken into
account (Baum, 1974). The value of b when it is deviated from unity shows a preference for
one alternative or choice from the others regardless of the rates of reinforcement where else
a value of b greater or less than one indicates that ‘preference is biased by some unknown,
but invariant, asymmetry between the alternatives’ (Baum, 1974) providing that the
reinforcement rates for each responses are equal. Principal sources of bias are undetected
response costs imposed in the case of one alternative but not the other(s), such as an
additional effort required to shift one lever in an experiment, and a qualitative difference
between reinforcers, such as an unanticipated additional value accorded to one reinforcer
but not to the rest (Baum, 1979, Pierce and Epling 1983, Davison and McCarthy, 1988). In
a marketing context, bias may result from the positioning of alternative brands within the
supermarket, the positioning and space allocated to different brands on the shelves given
over to the product category, the positioning of substitute and complementary products,
stock-outs and so forth (Foxall and Schrezenmaier, 2003).
The parameter s (slope) of Generalised Matching Law resembles the measure of
substitutability (Rachlin, 1980, Rachlin, 1982, Green and Freed, 1993, Foxall, 1999). The
104
slope of s = 1 denotes a perfect substitutability; therefore, when there is an increase in
product X’s price, we can see an increase in the demand for product Y. Matching is found
when both reinforcers are substitutes (Davison and McCarthy, 1988). In fact, matching
requires both perfect substitutability and the exclusive control of behaviour by the nominal
reinforcement frequencies (Heyman, 1996). Sensitivity is in fact, a measure of under
matching or over-matching. A deviation from perfect matching shows individuals favour
richer when s > 1 or individual favour poorer when s < 1 (Foxall et al., 2010). A subject is
said to be exhibiting under-matching when it disproportionately chooses the leaner
schedule of reinforcement where the s slope is less than one ( s < 1). This occurs when the
response rate is lower than the reinforcement rate. Fisher and Mazur (1997) state that the
most common explanation for under-matching is that subjects switch back and forth too
frequently because the apparatus may accidentally reinforce switching. Davison and
Jenkins (1985) claim that under-matching could occur when subjects fail to detect which of
the responses produce each reinforcer. On the other hand, the behaviour of a subject who
disproportionately chooses the richer schedule of reinforcement is then exhibiting
overmatching or s > 1. It occurs when the responses are greater than the reinforcement
proportion. Hence, the behaviour allocated is more than the reinforcement earned. Low
sensitivity to reinforcement schedules may arise because the subject is unable to
discriminate between the alternatives sufficiently well, particularly if there is no delay in
reinforcement when responses are allocated to a new choice (and are therefore, controlled
by a different schedule), and because rates of deprivation differ between the schedules
(Baum, 1974, Baum, 1979). Over-matching is sometimes observed when there is a
substantial penalty for switching between alternatives (Fisher and Mazur, 1997).
105

Anti Matching on the other hand, is the opposite of matching, whereby two items are
not substitutable with each other; in fact, they are independent from each other
(Schrezenmaier, 2005). An example is the case of wine and cola, where purchases for
each drink do not affect each other, shown by Foxall and James (2001). Hermstein
agreed that matching would not be expected with qualitatively different reinforcers or
with qualitatively different response requirements (Kagel et al., 1995).
As Williams (1988) stated, the generality of the matching relation has been confirmed
by a large number of different experiments and these studies have shown matching, at
least to a first approximation, with different species (pigeons, humans, monkeys, rats),
different responses (key pecking, lever pressing, eye movements, verbal responses) and
different reinforcers (food, brain stimulation, money, cocaine, verbal approval) where
apparently, the matching relation is a general law of choice. Nevertheless, it should be
noted that matching law should not only be used in experimentation. As Pierce and
Epling (1983) note, comparison of the supporting and discontinuing evidence suggests
that the matching law can be extended to an analysis of human behaviour (....) With a
more extensive analysis of stimulus control and reinforcement scheduling in choice
situations, it will be possible to assess the generality of the matching law in accounting
for diverse aspects of human behaviour. Moreover, it is reasonable to suppose that
lawful relationships between response rate and reinforcement rate or between time
allocation and reinforcement rate that are discovered in laboratory experiments also
hold in natural human environments (McDowell 1988). Foxall and his colleagues have
applied the matching law and have demonstrated its significance to their study of
consumer brand choice in a supermarket setting (Foxall and James, 2003, Foxall and
106

Schrezenmaier, 2003, Foxall et al., 2004, Foxall and James, 2001) which has initiated
this research.
4.1.5 Schedules of Reinforcement
Schedules of reinforcement provide a procedure for the experimental analysis of choice
behaviour (Pierce and Epling 1983). In operant conditioning, schedules of reinforcement
are a crucial element. Typically, reinforcement is designed to increase the probability of
repeat behaviour. The rate of responses is highly affected by the time and frequency
behaviour is reinforced. Schedules of reinforcement are divided into two types: continuous,
and intermittent or partial reinforcement. Continuous reinforcement is when the behaviour
is reinforced constantly. Continuous reinforcement is usually used at an early stage of an
operant conditioning experiment to familiarise the organism with the basic ground rules of
the experimentation. This reinforcement is usually provided promptly and consistently in
order to work. Conversely, intermittent or partial reinforcements are when behaviour is
reinforced only part of the time. There are four schedules of partial reinforcement:
1. Fixed-ratio schedules, where a response is reinforced after a specific number of
responses.
2. Variable-ratio schedules, where a response is reinforced after an unpredictable or
random number of responses.
107

3. Fixed- interval schedules, where a response is rewarded after a certain amount of
time has elapsed.
4. Variable-interval schedules, where a response is rewarded after an unpredictable or
random amount of time has elapsed.
A situation in which behaviour is free to alternate continuously between two or more
alternatives and in which consequences for choosing each alternative occur occasionally is
called a concurrent schedule of reinforcement (McDowell 1988). Concurrent schedules of
reinforcement to assess animal and human choices have been widely used in behavioral
psychology (Pedersen and Jensen, 2007). In operant conditioning, concurrent schedules of
reinforcement are used where the non-human or human subjects are able to give a response
to the simultaneously available reinforcement. A rat in an animal experimentation, for
example, is given two available options of key levers to be pressed. Experiments using
concurrent schedules are designed to elucidate how subjects allocate their choices among
the two or more simultaneously and continuously available reinforcement (Mazur, 1991).
Concurrent schedules are favoured by researchers as observation and evaluation can be
made as to how subjects allocate responses between two reinforcers and how a manipulated
response affects other concurrent responses. In fact, concurrent schedules can function as a
measure of an individual's preference for one reinforcer over another (Fisher and Mazur,
1997), as it is beneficial to be related to real- world human consumption as consumers are
always faced with various alternatives when purchasing. It is utilised particularly when the
subjects need to distribute their choices by switching back and forth between the options,
such as purchasing in a supermarket (Schrezenmaier, 2005). Much research on concurrent
variable-interval variable-ratio (VI-VR) schedules has measured time spent at a schedule
108

(for the interval schedule) and numbers of responses given (for the ratio schedule) at the
same time (Hermstein and Vaughan, 1980). These types of schedules are therefore perfect
for studying choice situations.
Hermstein’s discovery of matching law was through the study of non-human animals in the
laboratory experiment where the subjects were exposed to concurrent variable-interval (VI)
schedules of reinforcement. Pigeons as experimental subjects were required to peck buttons
with food as the rewards or the reinforcer. Each peck on the buttons was reinforced on VI
schedules of reinforcement. The pigeons allocated their pecks to the button in proportion to
the reinforcer (food) obtained. The VI schedules coordinates in a way that a reinforcer is
delivered immediately after a response. Under a variable-interval schedule, an interval time
must elapse since the last reinforcer was delivered and after the interval is over the next
response is reinforced (Hermstein, 1997).
Concurrent schedules of reinforcement to assess choices of animals and humans have been
widely used in behavioural psychology (Rachlin et al., 1976, Green and Rachlin, 1991).
The effectiveness of the matching law has been confirmed by applying concurrent
schedules of reinforcement which includes both variable interval (VI) and variable ratio
(VR) schedules (Schroeder and Holland, 1969, Conger and Killeen, 1974, deVilliers and
Hermstein, 1976, Pierce and Epling 1983). The concurrent variable-interval (cone VI VI)
schedule has been used most in Hermstein’s matching law, where these schedules, working
independently are important for the experimental measure of choice (Pierce and Epling
1983). Nevertheless, Hermstein and Vaughan (1980) suggested that concurrent variable-
109
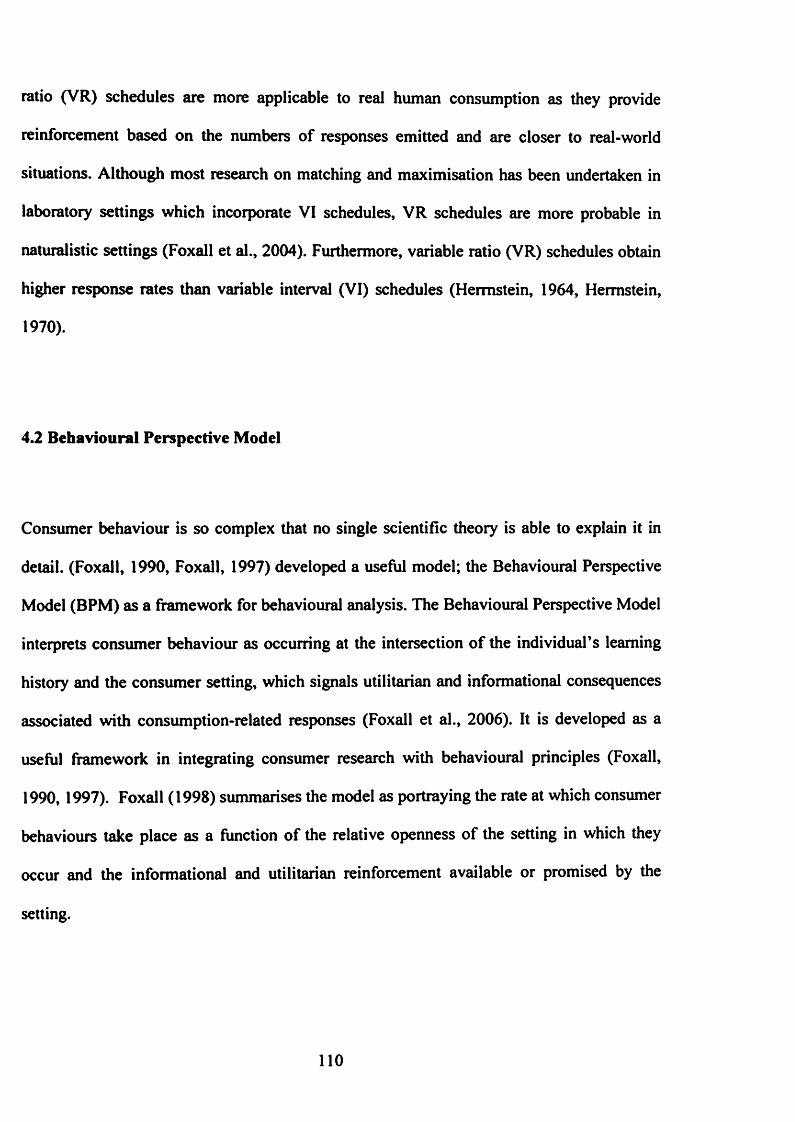
ratio (VR) schedules are more applicable to real human consumption as they provide
reinforcement based on the numbers of responses emitted and are closer to real-world
situations. Although most research on matching and maximisation has been undertaken in
laboratory settings which incorporate VI schedules, VR schedules are more probable in
naturalistic settings (Foxall et al., 2004). Furthermore, variable ratio (VR) schedules obtain
higher response rates than variable interval (VI) schedules (Hermstein, 1964, Hermstein,
1970).
4.2 Behavioural Perspective Model
Consumer behaviour is so complex that no single scientific theory is able to explain it in
detail. (Foxall, 1990, Foxall, 1997) developed a useful model; the Behavioural Perspective
Model (BPM) as a framework for behavioural analysis. The Behavioural Perspective Model
interprets consumer behaviour as occurring at the intersection of the individual’s learning
history and the consumer setting, which signals utilitarian and informational consequences
associated with consumption-related responses (Foxall et al., 2006). It is developed as a
useful framework in integrating consumer research with behavioural principles (Foxall,
1990, 1997). Foxall (1998) summarises the model as portraying the rate at which consumer
behaviours take place as a function of the relative openness of the setting in which they
occur and the informational and utilitarian reinforcement available or promised by the
setting.
110

The BPM adapts Skinner’s three-term contingency of the operant conditioning
paradigm by providing both environmental and situational perspectives to the analysis
of consumer’s purchasing behaviour or in other words, it is based on the interpretation
of environment-behaviour relationship. The behaviour itself as a dependant variable is
influenced by the learning history or past experience along with the setting and the
possible later consequences. It portrays the rate at which consumer behaviours take
place as a function of the relative openness of the setting in which they occur and the
informational and hedonic reinforcement available in or promised by the setting (Foxall,
1992).
I l l
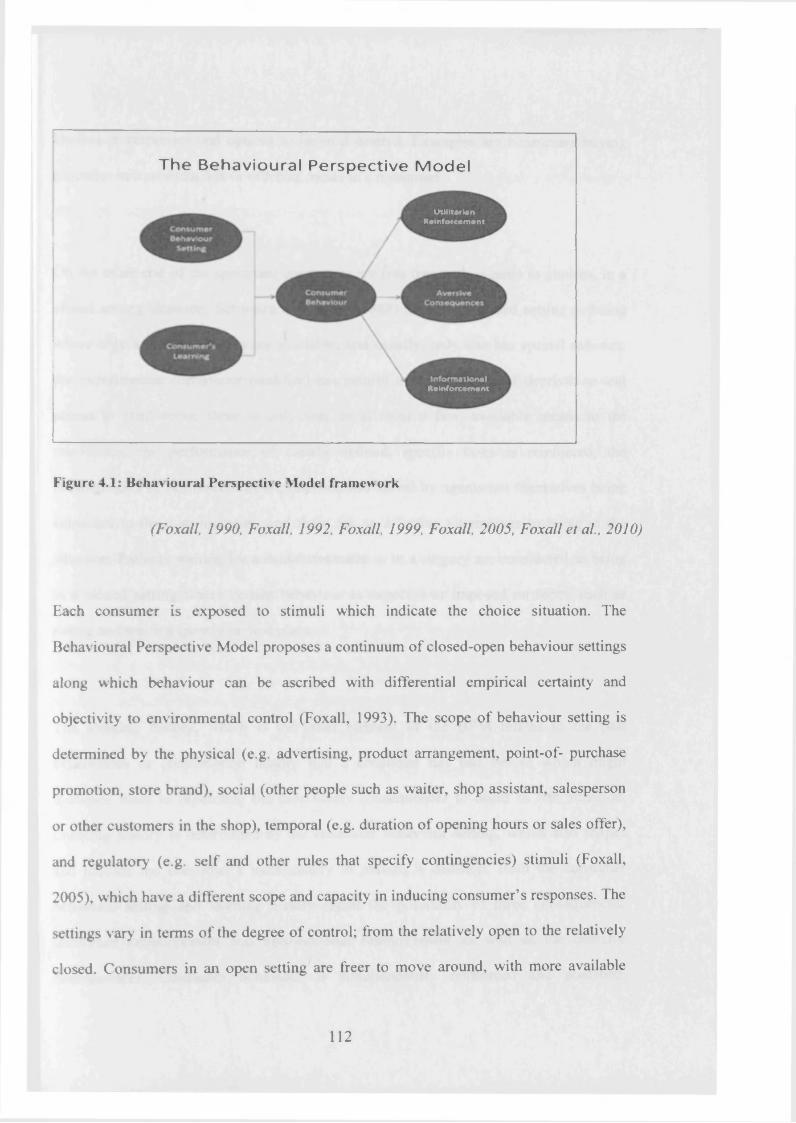
The Behavioural Perspective Model
UtilitarianR einforcem ent
Inform ationalReinforcem ent
Figure 4.1: Behavioural Perspective Model framework
(Foxall, 1990, Foxall, 1992, Foxall, 1999, Foxall, 2005, Foxall et al., 2010)
Each consumer is exposed to stimuli which indicate the choice situation. The
Behavioural Perspective Model proposes a continuum o f closed-open behaviour settings
along which behaviour can be ascribed with differential empirical certainty and
objectivity to environmental control (Foxall, 1993). The scope o f behaviour setting is
determined by the physical (e.g. advertising, product arrangement, point-of- purchase
promotion, store brand), social (other people such as waiter, shop assistant, salesperson
or other customers in the shop), temporal (e.g. duration o f opening hours or sales offer),
and regulatory (e.g. self and other rules that specify contingencies) stimuli (Foxall,
2005), which have a different scope and capacity in inducing consumer’s responses. The
settings vary in terms o f the degree o f control; from the relatively open to the relatively
closed. Consumers in an open setting are freer to move around, with more available
1 1 2

choices or responses and options to leave if desired. Examples are consumers buying
groceries in a supermarket or ordering meals in a restaurant.
On the other end of the spectrum, consumers are less free with regards to choices, in a
closed setting situation. Schwatrz and Lacey (1988) describe a closed setting as being
where only a few reinforcers are available, and usually, only one has special salience;
the experimenter (behaviour modifier) has control over conditions of deprivation and
access to reinforcers; there is only one, or at most a few, available means to the
reinforcers; the performance of clearly defined, specific tasks is reinforced, the
contingencies of reinforcement are imposed and varied by agents not themselves being
subjected to the contingencies; and there are no effective alternatives to being in the
situation. Patients waiting for a dental treatment or in a surgery are considered as being
in a closed setting where certain behaviour is expected or imposed on them, such as
sitting and waiting quietly in that place.
The learning history, which is the other element of the BPM relates to the past
experiences or consumption history that a consumer has had before which might
influence them in predicting the most likely consequences to occur in that situation.
Learning history is determined by the consumer behaviour setting, which also shapes
and moulds the consumer’s individuality in making a decision. Both the consumer
behaviour setting and learning history signal the possibility of three consequences;
utilitarian reinforcement and informational reinforcement as well as the aversive
consequences. Consumer behaviour is simultaneously reinforced and punished:
113

reinforced as it produces ownership and satisfaction but punished at the same time as it
involves surrendering money (Foxall, 1996). Reinforcement refers to the strengthening
of the act or response, whereas punishment suppresses the behaviour.
Utilitarian reinforcement is the functional and economic benefits of a product derived
by either purchasing, consuming or owning the product itself (Foxall et al., 2010). The
convenience of having a mobile phone for example, is that it allows one to be easily
contacted regardless of time and location. Informational reinforcement, in contrast, is
the symbolic meaning hidden in a product involving social status, self esteem and
satisfaction, often mediated from other’s responses. The benefit of having ‘the world at
the fingertips’ by owning a tablet computer like iPad could also resemble a prestige and
status symbol. The aversive consequences, on the other hand, play a role in reducing the
tendency of repeated further behaviour or obtaining other products. Surrendering more
money when buying an iPad, for instance, will deprive the purchaser of the chance of
purchasing other items at that particular time. Foxall (1999) states that all products and
services contain elements of utilitarian, informational and aversive consequences. As
the behavioural setting scope can vary from highly open and highly closed, the
reinforcement aspects in the BPM also can deviate from high to low for both
informational and utilitarian reinforcement.
The probability of purchase and consumption depends on the relative weight of the
reinforcing and aversive consequences that are signalled by the elements in the
consumer behaviour setting (Alhadeff, 1982). A product’s features, brands and even
114
price can be considered as the reinforcing and aversive stimuli and a marketer should be
putting more efforts and strategies into making them more acceptable to consumers.
Behaviour is explicable and predictable in so far as it is under the control of a learning
history that embodies the rewarding and punishing consequences of past consumption in
similar environments (Foxall, 1998). A consumer, being in a precise setting while
having obtained his/her own particular learning history, can be assumed to be devising
his/her own purchase decision based on his/her past experience as a consumer as well as
observation from other consumers.
Consumer behaviour can be defined into four classes based on the pattern of both the
reinforcements as well as the openness of the behavioural settings (Table 4.1).
Consumer behaviour classes may differ not only according to the pattern of hedonic and
informational reinforcement that maintains them but also in the extent to which the
settings in which they occur are relatively open (Foxall, 1993). Relatively open settings
are those in which behaviour is overwhelmingly under the control of positive
reinforcement and it is under these circumstances that people report a feeling of
freedom, a sense of being in personal control of their behaviour and in which their
approach behaviour is difficult to predict (Skinner, 1971). Grocery shopping in a
supermarket is an example of an open setting as the consumers are free to wander
around to choose from the various brands available. Relatively closed settings, on the
other hand, are those in which behaviour is generally under aversive control, in which
people report that external factors are responsible for their actions and in which their
escape and avoidance responses are more reliably predictable from a knowledge of the
circumstances in which they occur* (Foxall, 1996). In other words, in a closed setting,
115
marketers have the dominant control over what is being offered to the customers.
Making a transaction at the bank, for example, which requires a customer to queue and
wait is an example of a closed setting as the customer has to follow the rules imposed
by the bank in order to make the transaction.
Accomplishment - This refers to a behaviour pattern that can be found in a situation
where both the informational and utilitarian reinforcements are high. The acquisition
and conspicuous consumption of status symbols as well as the activities involved in
seeking excitement, satisfaction and personal fulfilment fall into this category (Foxall el
al., 2006).
Pleasure - This is consumption which consists of high level of utilitarian reinforcement
and low level of informational reinforcement. Pleasure is usually behaviour reinforced!
by entertainment (Foxall, 1996). Watching a favourite TV programme or taking
medicines to ease pain can be seen as having these levels of reinforcement.
Accumulation - A high level of informational reinforcement and low level of utilitariani
reinforcement can be seen in a setting which involves collecting and saving, such as the
accumulation of tokens or collecting and redeeming coupons or vouchers whetn
purchasing.
116

Maintenance — This applies more to routine purchasing or survival, where the behaviour
pattern can be seen with low levels of both the informational and utilitarian
reinforcements. Grocery shopping is the best example, where consumers are expected to
purchase food items as a daily or weekend routine.
Table 4.1: Classes of Consumer Behaviour
Classes of Consumer
Behaviour
High Utilitarian
Reinforcement
Low Utilitarian
Reinforcement
High Informational
Reinforcement
ACCOMPLISHMENT ACCUMULATION
Low Informational
Reinforcement
PLEASURE MAINTENANCE
Source: Foxall (1990, 1992, 1993,1999a, 1999b, 2005,2C>06, 2010)
The scope of behavioural setting ranges from the relatively open to the relatively closed
setting. Based on the levels of both informational and utilitarian reinforcement as well
as the scope of behavioural settings, eight contingency matrixes (Table 4.2) have been
developed (Foxall, 1990, Foxall, 1992, Foxall, 1993, Foxall, 1999, Foxall et al., 2006,
Foxall et al., 2010).
117
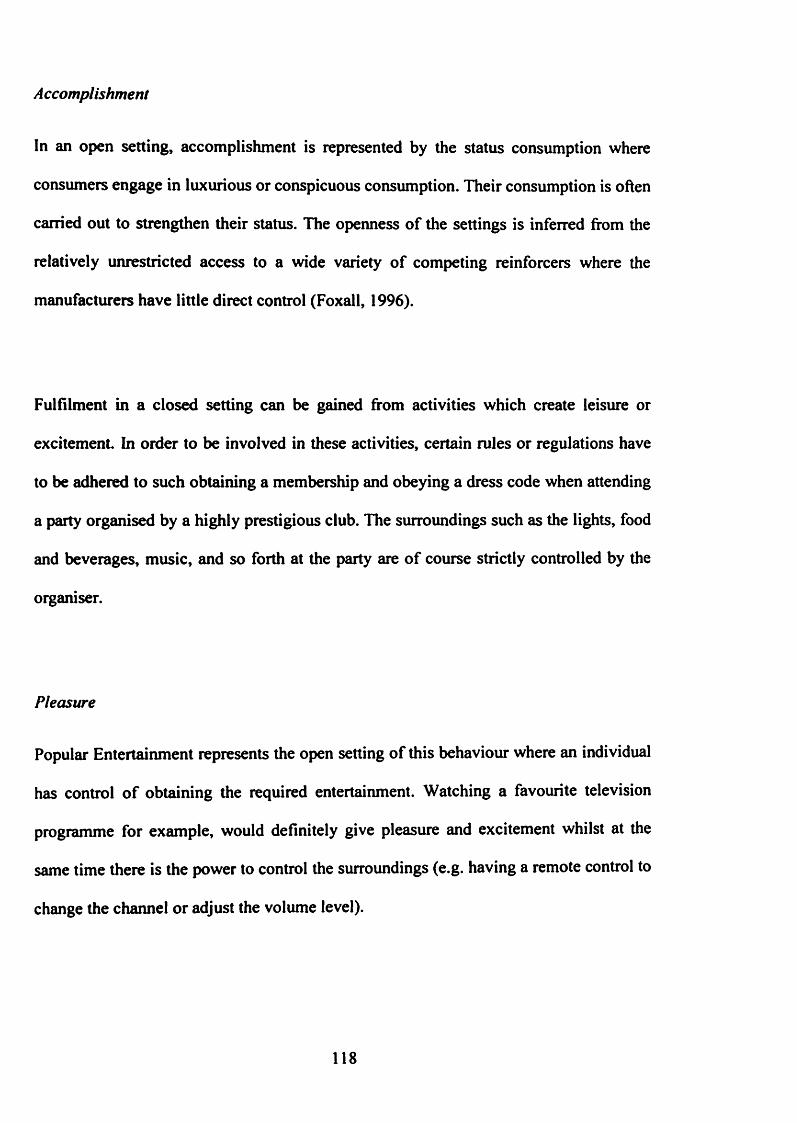
A ccomplishment
In an open setting, accomplishment is represented by the status consumption where
consumers engage in luxurious or conspicuous consumption. Their consumption is often
carried out to strengthen their status. The openness of the settings is inferred from the
relatively unrestricted access to a wide variety of competing reinforcers where the
manufacturers have little direct control (Foxall, 1996).
Fulfilment in a closed setting can be gained from activities which create leisure or
excitement. In order to be involved in these activities, certain rules or regulations have
to be adhered to such obtaining a membership and obeying a dress code when attending
a party organised by a highly prestigious club. The surroundings such as the lights, food
and beverages, music, and so forth at the party are of course strictly controlled by the
organiser.
Pleasure
Popular Entertainment represents the open setting of this behaviour where an individual
has control of obtaining the required entertainment. Watching a favourite television
programme for example, would definitely give pleasure and excitement whilst at the
same time there is the power to control the surroundings (e.g. having a remote control to
change the channel or adjust the volume level).
118
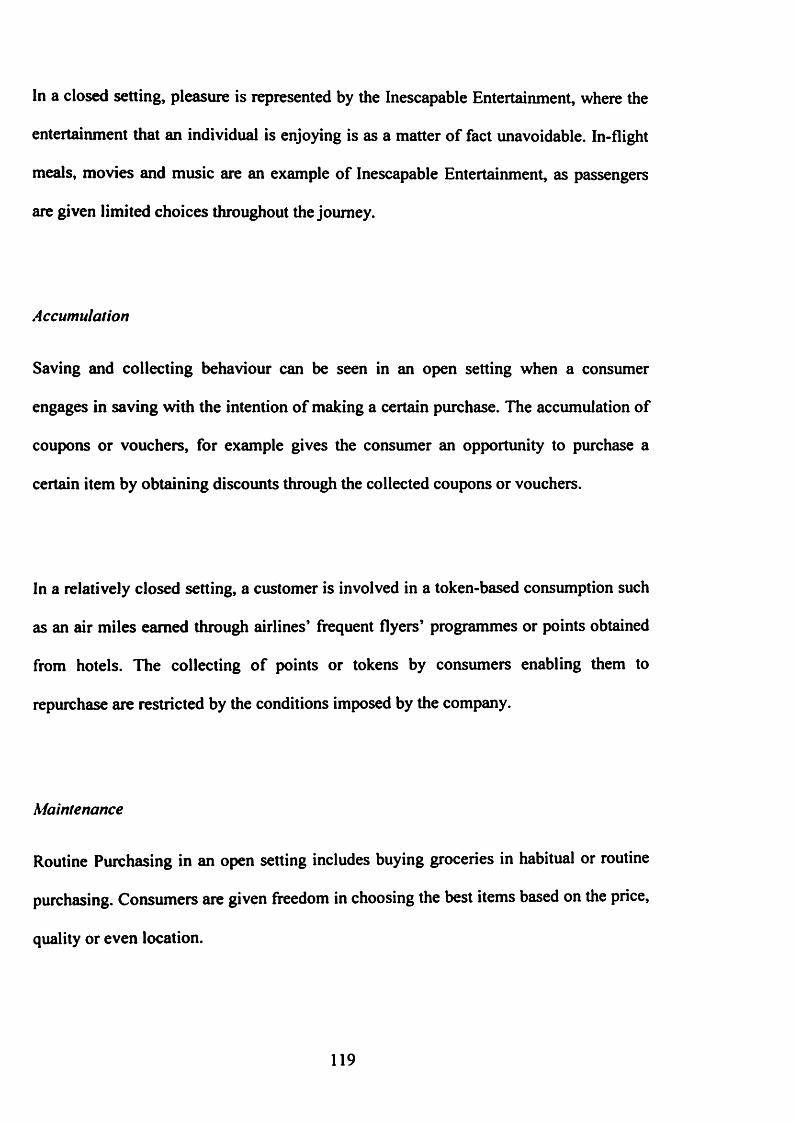
In a closed setting, pleasure is represented by the Inescapable Entertainment, where the
entertainment that an individual is enjoying is as a matter of fact unavoidable. In-flight
meals, movies and music are an example of Inescapable Entertainment, as passengers
are given limited choices throughout the journey.
Accumulation
Saving and collecting behaviour can be seen in an open setting when a consumer
engages in saving with the intention of making a certain purchase. The accumulation of
coupons or vouchers, for example gives the consumer an opportunity to purchase a
certain item by obtaining discounts through the collected coupons or vouchers.
In a relatively closed setting, a customer is involved in a token-based consumption such
as an air miles earned through airlines' frequent flyers’ programmes or points obtained
from hotels. The collecting of points or tokens by consumers enabling them to
repurchase are restricted by the conditions imposed by the company.
Maintenance
Routine Purchasing in an open setting includes buying groceries in habitual or routine
purchasing. Consumers are given freedom in choosing the best items based on the price,
quality or even location.
119

Maintenance behaviour in a closed setting exists in Mandatory Consumption where
consumers are obliged to consume as a response in order to avoid negative
reinforcement. Paying taxes or bills has to be done by every citizen in order to avoid
any punishment or unpleasantness from the government.
120
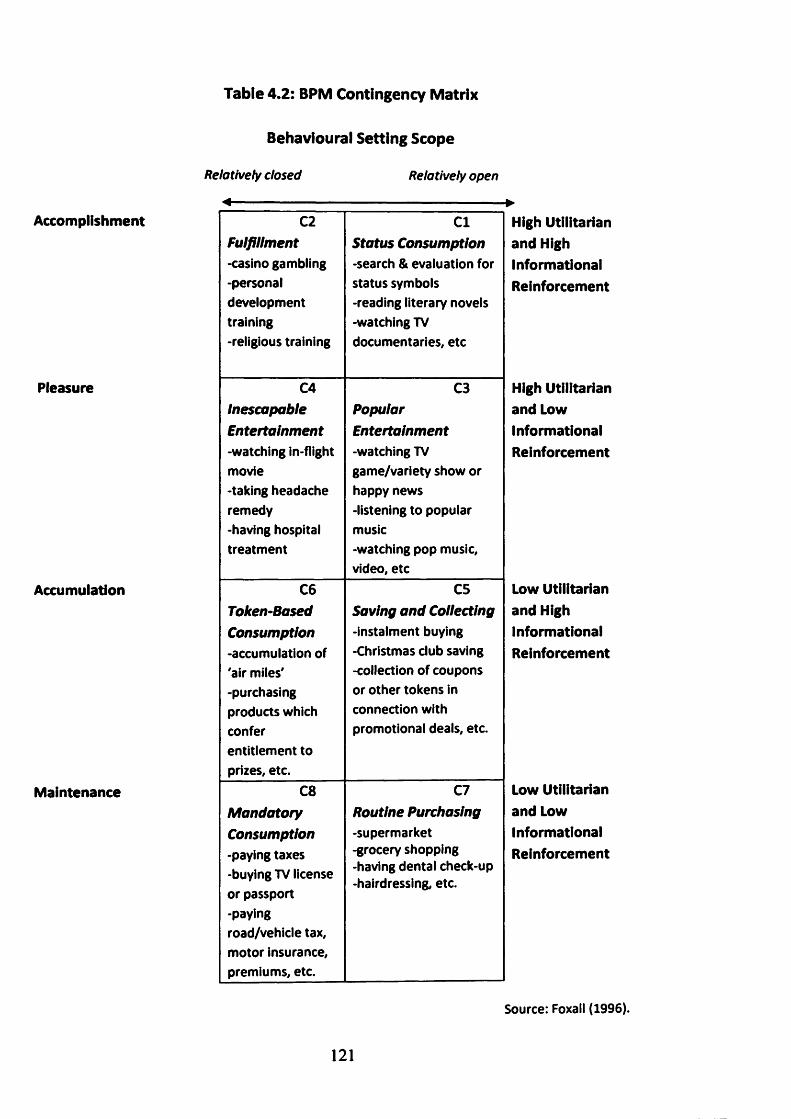
Table 4.2: BPM Contingency Matrix
Accomplishment
Pleasure
Accumulation
Maintenance
Behavioural Setting Scope
Relatively dosed Relatively open
M------------------------------------------------------------------------- ►
C2 Cl High UtilitarianFulfillment Status Consumption and High-casino gambling -search & evaluation for Informational-personal status symbols Reinforcementdevelopment -reading literary novelstraining -watching TV-religious training documentaries, etc
C4 C3 High UtilitarianInescapable Popular and LowEntertainment Entertainment Informational-watching in-flight -watching TV Reinforcementmovie game/variety show or-taking headache happy newsremedy -listening to popular-having hospital musictreatment -watching pop music,
video, etcC6 C5 Low Utilitarian
Token-Based Saving and Collecting and HighConsumption -instalment buying Informational-accumulation of -Christmas club saving Reinforcement'air miles' -collection of coupons-purchasing or other tokens inproducts which connection withconfer promotional deals, etc.entitlement toprizes, etc.
C8 C7 Low UtilitarianMandatory Routine Purchasing and LowConsumption -supermarket Informational-paying taxes -grocery shopping Reinforcement-buying TV license -having dental check-up
-hairdressing, etc.or passport-payingroad/vehicle tax,motor insurance,premiums, etc.
Source: Foxall (1996).
121

The Behavioural Perspective Model contextualizes pre-purchase, purchase and post
purchase responses by situating them at the intersection of the consumer and the
behaviour setting in which the consumer acts (Foxall, 1996). The BPM successfully
portrays consumers as utilising rules from various sources before purchasing. Marketing
elements such as the marketing mix can be elucidated behaviourally by understanding
the three-term contingency adapted by this model. Marketing activity relies on the two
main variables described in the BPM, which are the consumer behaviour setting and the
reinforcement (utilitarian and informational). Increasing the uniqueness and
attractiveness of the setting for example, would avoid the tendency of a consumer in
leaving without purchasing. The availability of both the reinforcement to the consumer
would of course attract and persuade them to acquire the product. In other words, the
understanding of consumer behaviour and the forces imposed behind the decision is
crucial to marketing management.
The BPM model can be utilised by marketers in implementing the right marketing
strategies by closing the settings in order to increase the probability of consumers’
purchasing which can be done by modifying the physical and social environment to
ensure that escape behaviour is punished or reduced (Foxall 1990). Banks and other
property companies for example, often conclude business in closed settings in an
attempt at more serious behaviour in transactions. Hence, any related agreements or
documents will normally be concluded in a separate room with the least possible
interruptions.
122
43 Summary
This chapter has provided an introduction to and discussion on behavioural economics
by explaining the historical development of the field and some of the important
elements, each of which is vital for this research. The aspects of the behavioural
perspective model are also outlined in this chapter, as it is a useful framework for
understanding consumer choice. There are indeed many areas of behavioural analysis
and economics that can be used to analyse consumer behaviour in making choices, and
both the behavioural economics and Behavioural Perspective Model are beneficial in
studying human behaviour, particularly to buying behaviour. This study adopts the
behavioural economics model, particularly in analysing the data quantitatively, whereas
the elements in Behavioural Perspective Model is valuable in determining the different
reinforcement levels which can be related to the evolutionary and foraging studies in
this research.
123

A
CHAPTER FIVE
124
^ CHAPTER 5^METHODOLOGY
S.O Introduction
This chapter presents the research strategy and methodology designed to address the
research objectives and questions. The purpose of this methodology chapter is to
elaborate on what grounds methods were deemed appropriate for investigating the
phenomenon the researcher is interested (Bell, 1999). The philosophical background is
explained along with the research strategy, validity and reliability issues.
The review of the epistemological issues will be discussed in this chapter. According to
Saunders et al (2003), research method refers to the tools and techniques used to obtain
and analyse data; tools include questionnaires, observations and interviews whereas
techniques consist of statistical and non-statistical analysis. Research methodology is a
way to solve research problem systematically by taking various steps which includes
surveys, case studies, experiments and analysis of information. Each methods has its
own strengths and weaknesses depending on the type of research question, the control
an investigator has over actual behavioural events and the focus on contemporary as
opposed to historical phenomena (Yin, 1994).
125

In order to investigate how well foraging, the Behavioural Perspective Model and
behavioural economics can explain the consumer buying decision, three analyses are
undertaken to determine whether brands in a product category are substitutable
(matching analysis), how sensitive consumers are towards price differentials (relative
demand analysis) and whether consumers do in fact maximise returns (maximisation
analysis). Consumer panel data is used in conducting the three analyses and is expected
to give more robust findings as it is data of consumers in real-world or actual
consumption situations.
5.1 Research Philosophy
It is vital for a researcher to determine the research paradigms and matters of ontology
and epistemology when conducting research. These aspects are important as they could
influence the way a research is undertaken from the design to the conclusions. Hatch
and Cunliffe (2006) state that different paradigms encourage researchers to study
phenomena in different ways and that different kinds of knowledge may be derived
through observing the same phenomena from different philosophical perspectives.
These aspects are part of choices that a researcher must consider as they are linked to
the research problem (Blaikie, 1993) and a lack of these aspects would result in
incompatible research methods and lack of coherence in the overall research structure.
126

The research philosophy helps to clarify the research design and provide guidance on
the research strategy, relating to the nature of knowledge and how the knowledge is
developed (Saunders et al., 2007). Ontology is the reality under study, epistemology is
the relationship between that reality and the researcher, and the methodology is the
technique employed by the researcher to investigate that reality (Healy and Perry,
2000).
Ontology can be classified as the study of conceptions of reality and is concerned with
the nature of reality (Saunders et al., 2007). Blaikie (1993) describes ontology as the
science or study of being to know about what exists, what it looks like, what units make
it up and how these units interact with each other. Ontology itself refers to discovering
the form and nature of reality and therefore what there is that can be known to the
researcher (Guba and Lincoln, 1994).
Closely paired with ontology, epistemology considers views about the most appropriate
ways of enquiring into the nature of the world (Easterby-Smith et al., 2008), what is
knowledge and what are the sources and limits of knowledge (Eriksson and Kovalainen,
2008). It is concerned about the relationship between knowledge and reality and is
involved with the nature and scope of knowledge (Hughes and Sharrock, 1997). Burell
and Morgan (1979) suggest that the relationship can be established by accepting that
knowledge can be viewed as being either objectively knowable or only subjectively
knowable. Epistemology is also described as the theory or science of the method or
grounds of knowledge; a set of claims or assumptions about the ways in which it is
127

possible to gain knowledge of reality, how what exists may be known, what can be
known and what criteria must be satisfied in order to be described as knowledge
(Blaikie, 1993). Hatch and Cunliffe (2006) summarise epistemology as knowing how
you can know, how knowledge is generated, what criteria discriminate good knowledge
from bad knowledge and how should be represented or described.
It is indeed important to understand the position of a researcher as his/her ontological
positions obviously would influence his/her epistemological selection. Denzin and
Lincoln (2003) describe a research paradigm as an interpretive framework, whilst Guba
and Lincoln(1994) portray it as a basic set of beliefs that guides action as it represents
the worldview that defines, for its holder, the nature of the world, the individual’s place
in it and the range of possible relationships to that world and its parts, as for example
cosmologies and theologies do.
52 Research Paradigm
The research paradigm is a basic framework used to guide a scientific investigation,
defined by its ontological, epistemological and methodological stances (Guba and
Lincoln, 1998). This study employs a positivist paradigm in investigating consumer
buying behaviour and price responsiveness. Positivism uses valid knowledge as a basis
for every predictions and hypotheses. It generally holds with objective analysis and
emphasises the use of quantifiable observations and statistical measurement of the data.
128

"Statistical manipulation includes data tests of reliability and validity that are used to
discern broad patterns of behaviour to test hypotheses’ (Ragin, 1994).
A positivist researcher considers ‘reality’ to be external to the individual, and therefore
focuses on manifest patterns of behaviour that form a structure of determinate
relationships between ontology, epistemology and methodology (Kolakowski, 1993).
Positivists use deductive reasoning to propose a theory. If the results and findings do not
fit well with the proposed theory, then a revision will be made to obtain a better
prediction. The key element of the methodology is the experiment; the attempt to
elucidate natural laws through direct manipulation and observation. Positivists assume
things can be studied as hard facts and the relationship between these facts can be
established as scientific law (Smith, 2004a).
A study is usually made quantitatively where discovery and verification of knowledge is
carried out through direct observations or measurement of phenomena. The data do not
change because they are being observed (Hughes and Sharrock, 1997). Predicting,
explaining and generalising the phenomena are the objectives of positivism paradigm.
Its ontological position is reality which can be observed and conceived. Positivists
believe that a single, objective reality exists independently of what individuals perceive
where the social world is seen as real, concrete with unchanging structure therefore,
precise, accurate measurements and observations of this world are possible (Hudson and
Ozanne, 1998).
129

The epistemological assumption for positivists is that they take a generalizing approach
to research; that is, they seek out general, abstract laws that ideally can be applied to an
infinitely large number o f phenomena, people, settings and times (Hudson and Ozanne,
1998). Knowledge that is accepted as valid is used as a basis for any predictions or
hypotheses to be tested or generated. The general elements and implications of
positivism according to Easterby-Smith (1997) are that research should be quantitative
if it is the basis for valid generalisations and laws, the choice o f what and how to study
should be determined by objectives rather than human beliefs and interests, the aim of
research is to identify the causal explanations and fundamental laws that could explain
the human behaviour, concepts should be operationalised so that facts can be measured
quantitatively, the role o f researcher is independent and problems could be understood
better if they are reduced to the simplest possible elements.
Positivist Paradigm
Basic Beliefs The world is external and objective
Observer is independent
Science is value free
Researcher should Focus on facts
Look for causality and fundamental laws
Reduce phenomenon to simplest elements
Formulate hypotheses and then test them
Preferred methods include
------------------------------------------------------------------
Operationalising concepts so that they can be
measured
Taking large sam ples
Table 5.1 :Positivist paradigm (Easterby-Smith et al., 1991)
1 3 0
53 Research Design
The research design can be considered as the structure or foundation of a research,
holding all the elements together in a research project. The way a researcher develops
the research design relies on whether the research question is descriptive or explanatory.
Obviously, a research needs a structure before data can be collected and analysed. A
good understanding of a research design assists in the development of a research
project. The types of research design are classified as exploratory, descriptive and
causal research (Churchill and Iacobucci, 2002). In this thesis, a descriptive research
design is employed in studying and explaining the consumer brand choice in the actual
shopping setting of fast-moving consumer goods (FMCG) consumption. Also known as
statistical research, descriptive research identifies the cause and effect of the event that
is happening. The main goal of this research is to describe the data to gain a better
understanding of the topic being examined. As stated by Churchill and Iacobucci
(2002), descriptive research relies on hypotheses to study the relationship between
variables or the frequency of a particular phenomenon with the intention of describing
the profiles of certain groups and offering some predictions.
131
5.4 Research Strategy
5.4.1 Deductive Research Approach
This research adopts a deductive research approach with regards to the positivist
paradigm. Hussey and Hussey (1997) defined deductive research as a study in which a
conceptual and theoretical structure is developed which is then tested by empirical
observation; thus particular instances are deducted from general influences. Also known
as ‘top-down’ approach, deductive reasoning works from the general and ends with
specific reasoning. It requires a researcher to proceed from the general theory to
specific, testable hypotheses. Once hypotheses have been developed, necessary data are
collected and later analysed in order to test the hypotheses. If the hypotheses are
supported, then it could be said that the initial general theory is indeed correct and
acceptable. It is used in studies where theory is tested by empirical observation.
Deductive research transforms theory into specific assumptions or hypotheses and
through selected research methods, data are collected and investigated to accept or
reject the theory. Based on the results, if the theory does not fit the facts appropriately,
then the theory has to be revised in pursuit of a better prediction of the reality (Saunders
etal., 2007)
132

5.5 Research Method
The research methods can be described, considered and classified at different levels, the
most basic of which is the philosophical level (Creswell et al., 2003). Basically,
research methods are techniques that researchers use when studying certain events. The
methodological distinctions most commonly used are between qualitative and
quantitative research, each with different underlying approaches and tools. These
techniques are employed in a way that is designed to increase the accuracy of the
results. In other words, research methods deal with the system of collecting the data,
facts and information needed so as to obtain reliable results. The researcher’s
experience, understanding of philosophy and personal beliefs may also have some
bearing on the method adopted (Denzin and Lincoln, 1994).
5.5.1 Quantitative Research
A quantitative research approach is used to understand behaviour by applying
mathematical and statistical measurement, and theories as well as the hypotheses related
to the phenomena. Quantitative analytical approaches also allow the reporting of
summary results in numerical terms to be given with a specified degree of confidence
(Abeyasekera et al., 2000). It involves gathering numerical data so as to examine them
in as unbiased a way as possible. The process of measurement is the heart of
133
quantitative research as it provides the fundamental connection between empirical
observation and mathematical expression of quantitative relationships.
Researchers who use logical positivism or quantitative research employ experimental
methods and quantitative measures to test hypothetical generalisations (Hoepfl, 1997),
and they also emphasise the measurement and analysis of causal relationships between
variables (Denzin and Lincoln, 1998). The aim of quantitative research is to construct
statistical models to elucidate what is being observed. Therefore, a researcher should
know the research objectives clearly and ensure that all aspects of the research are
carefully designed. The data collected are usually in the forms of numbers and statistics,
gathered through the use of precise measurements such as surveys and questionnaires.
Quantitative researchers generate hypotheses to be tested while obtaining facts and
causes of behaviour and statistical terminologies are usually used in expressing the
results.
5.6 The Analysis
5.6.1 Sample Description
Panel data is well known among social and science researchers for longitudinal data
analysis. It is a method of studying and surveying a group of people over a certain
period of time. Consumers’ information from the panel data is an effective way of
134

understanding the consumer’s buying pattern. Panel data is a diagnostic tool for
obtaining the needed information. Consumer panel data is a reliable and feasible data-
source for understanding consumer purchasing behaviour (Ehrenberg, 1972, Ehrenberg,
1988). The data are considered to be very precise and less susceptible to errors,
especially when based on barcode scanning procedures, than those obtained through
consumers' reports of their past behaviour in surveys (Churchill, 1999).
In order to study consumers’ brand choice, it is beneficial to be able to trace the
purchase history of individual consumers for a specific period of time. Therefore, panel
data is utilised not only as the panellists are representative of the population of UK
consumers, but because the data also consist of records of purchases made by the
households for the four products. Panel data is able to provide information on both the
items purchased in the panel and the sequence of purchases. If a respondent makes 10
purchases of baked beans in a year, the panel data shows not only the total purchases
and the brands bought, but whether a particular brand, accounting for example for 3 of
the 10 purchases, was bought consecutively and then abandoned, or combined with the
purchase of other brands.
Participants were taken from the AC Nielsen Homescan data which consists of 10,000
respondents randomly-selected from UK households representative of population. A
total of 1600 panellists who made purchases of four fast-moving consumer products;
baked beans, yellow fat, fruit juice and biscuits purchased within a year (17th July 2004
to 15th July 2005) is analysed in this thesis. Panel data were chosen as they are
135

advantageous for longitudinal studies; changes in the behaviour, in this case purchasing
behaviour, can be monitored well by the continuous measurements (Crouch and
Housden, 2003). The reliable consecutive consumer panel data is a feasible data-source
for understanding consumer purchasing behaviour (Ehrenberg, 1972, Ehrenberg, 1988).
AC Nielsen Homescan is the first consumer panel company in Europe to implement the
usage of home barcode scanners in collecting data from panellists. AC Nielsen has been
the primary supplier of integrated information on the European community for more
than 70 years. It is known for its effective market tracking and consumer diagnostic
tool, which gives beneficial insights about consumers’ buying attitudes and choices in
the marketplace. This enables retailers to have an understanding of their customers’
loyalty and buying patterns. The hand-held barcode scanner devices given to the
panellists maintain the reliability and consistency of the data.
The data was collected as follows: each respondent would scan their purchased items by
passing the handheld barcode scanner across the barcodes. The barcodes which were
printed on the items’ packages were scanned at each of the participants’ shopping trips.
The information gathered through the scanner was then transmitted electronically to AC
Nielsen’s mainframe computer for central processing. The four product categories that
are used in this research are baked beans, fruit juice, yellow fats and biscuits. The
information recorded for each respondent are: respondents’ ID number, age, social
class and working hours, product description, brand specification, store name, item’s
136

weight, package size, number o f units purchased, date purchased, price per item and
total amount spent.
An obvious advantage o f using panel data might be the data collection procedure which
does not require a thorough or painstaking effort in obtaining the data as compared to
the other mechanism such as surveys or interviews. The disadvantage is that
respondents might tend to forget to scan their purchases which can be seen from the
purchase history' o f ‘light buyers’ who have only one or two purchases recorded in the
data. The A.C Nielsen Company, however, guarantees that all the data are accurate and
reliable. Besides, the benefit o f using panel data is that the data are obtained
systematically from the company’s database whilst at the same time monitoring
consumer purchasing in a real market world.
Product No. of households Total number of
purchases
Mean number of
purchases
Baked Beans 1639 16203 10
Yellow Fat/Butter 1817 32468 18
Fruit Juice 1542 23339 15
Biscuits 1594 75847 48
Table 5.2: General information on the purchases
1 3 7

5.6.2 Data Purification
The panel data consists of 1600 panellists who have purchased at least one of the four
product categories which are baked beans, yellow fat, fruit juice and biscuits.
Proportional calculations for the three analyses - matching, relative demand and
maximisation, were carried out for each of the data. The initial idea of this research is to
analyse each of the 1600 panellists as the need for a larger sample of consumers has
been shown by previous researches (Foxall and James, 2003, Foxall and Schrezenmaier,
2003, Foxall et al., 2004, Oliveira-Castro et al., 2005, Oliveira-Castro et al., 2006,
Foxall and James, 2001). As such, the analysis was begun by analysing all 1600
panellists who have purchased baked beans products. However, when the same analysis
was carried out for the other product, it was recognised that not all the panellists bought
each of the four product categories. As this thesis attempts to study the pattern of
consumers’ buying behaviour across products, the data have to be sorted accordingly,
and only panellists who have purchased all the four product categories were chosen.
Therefore, 200 panellists were chosen randomly and calculations were made for the
descriptive analysis.
Ultimately, from the 200 panellists, another discrepancy was acknowledged, as some of
these panellists were found to be extremely ‘light’ buyers; with only one or two
purchases recorded within a year, which contributes to the lack of data points. Hence,
these ‘light’ buyers had to be rejected as this research attempts to employ an individual
analysis. It was then decided that only 20 panellists who had purchased all the four
138

products and made at least 5 purchases for each products would be selected and
analysed individually, whereas the 200 panellists were analysed aggregately by
applying the behavioural economics approach. The steps of analysing the data are
shown in Figure 5.2.
The products for each category vary in terms of weight and pack size. The basic units
are mostly in grams, kilos or litres. In order to obtain to desirable weight in order to be
able to obtain precise ratio calculation, each item is calculated in a basic unit of
comparison for each product category. For example, a pack of 6 X 415g of baked beans
stands for a six-can pack of baked beans that weigh 415gm each. Therefore, to make it
possible to add up the total amount bought for each panel, the weight for this pack is
calculated as 2490grams.
These data were then analysed using SPSS software version 16 for the regression
analysis and graph plotting. A regression model is beneficial in terms of explaining the
relationship between both the dependent and independent variables.
5.7 Validity and Reliability
Reliability and validity are tools o f an essentially positivist
epistemology.
(Watling, 1995)
139
Validity and reliability are the fundamental cornerstone of a research. Validity is to
ensure the research measures accurately or how trustworthy the research findings are
(Bryman, 2004, Saunders et al., 2007). The heart of a research is the point where facts
and information need to be collected, gathered and analysed in order to verify any
assumptions, theories or hypotheses. Validity is often defined by asking the question:
‘Are you measuring what you think you are measuring?’ (Kerlinger, 1979). Therefore, it
is important for any experiment or investigation to be valid in ensuring to obtain
accurate results and interpretations.
Joppe (2000) states that validity determines whether the research truly measures that
which it was intended to measure or how truthful the research results are. In other
words, does the research instrument allow you to hit "the bull’s eye" of your research
object? Researchers generally determine validity by asking a series of questions, and
will often look for the answers in the research of others. Purchases of panel households
constitute a sample from the population of all scanner-based purchases in a given
market (Gupta et al., 1996). This thesis employs consumer panel data which represents
the UK household population and consists of demographic information of the panellists
as well as information on the product characteristics. Panel data is useful in longitudinal
observation since the information is gained over a period of time for the same
individuals hence assuring the validity of this research.
140
Reliability on the other hand, is defined as the extent to which results are consistent
over time and an accurate representation of the total population under study is referred
to as reliability and if the results of a study can be reproduced under a similar
methodology, then the research instrument is considered to be reliable (Joppe, 2000). In
other words, reliability refers to the consistency and stability of the measurement each
time it is used with repeatable results. Previous research done by Foxall and colleagues
(Foxall and James, 2003, Foxall and Schrezenmaier, 2003, Foxall et al., 2004, Oliveira-
Castro et al., 2005, Romero et al., 2006, Foxall and James, 2001) used small samples
and applied the behavioural economics measurement. The reliability of the behavioural
economics approach in studying consumer choice in supermarkets is proven by the
similar results shown from the research. It is expected that this thesis would also give
the same consistent and reliable results. Moreover, AC Nielsen Homescan panel data is
well known for its reliable data for many years and has been used widely in marketing
research.
The reliability of this research could also be affected by the number of data investigated.
A number of 200 data are selected from the total of 1600, based on the four products
that they have purchased. The 200 data are analysed for each of the four product
categories (baked beans, yellow fat, butter and fruit juice), in determining the patterns of
brand choice among the panellists. The results are then compared to the pattern of
consumers’ buying behaviour as studied by Ehrenberg and his collaborators. As most of
the 200 panellists can be categorised as light buyers, buying less than 5 items for each
product categories, only 20 data (purchased all the four products and purchased at least
5 items for each product categories) are selected from the earlier sample and analysed
141

individually. The results are then compared with earlier studies done by Foxall and his
colleagues, to confirm that accurate measures and approach have been applied. This
represents a contribution to the reliability of the study.
In addition, evolutionary psychology has been fruitfully applied in consumer research
(Hantula, 2010, Hantula et al., 2008, Rajala and Hantula, 2000, Smith and Hantula,
2003), hence, this thesis is expected to gain beneficial insights and knowledge on
consumer behaviour by adopting the same theories and principles.
5.8 Measures and Analysis
The main analyses conducted are matching analysis, relative demand analysis and
maximisation analysis derived from behavioural economics approach. Each type of
analysis will be looked at and described. These three analyses are carried out by
applying regression techniques with both Excel and SPSS software (version 16).
Regression analysis is employed as it is a useful tool in explaining the linear
relationship between dependent and independent variables.
As shown in Figure 5.1, the panel data is sorted accordingly based on the panel ID using
Excel. The amount bought is calculated for each panellist by multiplying the weight and
quantity (pack) bought. Brand A is determined by selecting the most frequently
purchased or preferred brand by each panellist; thus, the remaining brands are
142

categorised as brand B. Matching, relative demand and maximisation analyses are
carried out using proportional calculations. The next step is splitting up the data bi
monthly in order to obtain adequate data points. Again, proportional calculations are
carried out for matching, relative demand and maximisation analyses based on the bi
monthly data. Finally, the data is then transformed into logarithms (except maximisation
analysis) using SPSS software, followed by regression analysis.
143

F igure 5.1: Steps in the Analysis
------------------ Stepi-------------------------Using Excel, sort the data according to Panel ID
IStep 2
Calculate the amount bought for each panel by multiplying the weight to number of pack bought
IStep 3
Determine the A brand - the most frequently bought brand
IStep 4
Proportional calculations for Matching, Relative Demand and Maximisation Analyses
TStep 5
Split up the data bi-monthly
IStep 6
Proportional calculations for Matching, Relative Demand and Maximisation Analyses
IStep 7
Using SPSS software, transform to logarithms
IStep 8
Regression Analysis
144

5.8.1 Denominator
Each product’s brands are packed in difTerently-sized packs and weight. The basic units
of the products in all the four categories are grams (baked beans, biscuits and yellow
fats) and litres (fruit juice). Heinz baked beans for example, come in tins o f 415gm
whereas Tesco baked beans come in tins o f 220gm. Similarly, Aldi Rio D’Oropure
orange juice comes in different cartons o f 1 litre and 0.7 litres.
It is necessary for all these brands to be compared equally in this study, particularly in
terms o f the average price per unit for each brand. Therefore, a basic unit o f comparison
is determined for each product category. A general denominator is adopted for all the
brands, as shown in table 5.4.
Product Category Basic Unit
Baked Beans 200 grams
Fruit Juice 1 litre or 1000 mis
Yellow Fats 250grams
Biscuits 200 grams
Table 53: The general denominator in each product category
145
Hence, a carton of 2000 mis of fruit juice equals 2 units of fruit juice. Similarly, a tin of
450 grams of baked beans is equal to 2 1/4 units of baked beans. In this case, for
convenience and to eliminate any confusion, the amount of a product is rounded up or
down to the nearest round number.
5.8.2 Individual Level of Analysis
The focus of the investigation in this thesis is on the individual level of analysis, to look
at individualistic behaviour, in accordance with the behavioural economics literature.
Traditionally, the study of individual subjects has been emphasised in most research in
behaviour analysis so as to be able to analyse the relationship between the individual
subject and its environment. An individual behaviour approach reduces variability
compared to studying groups and furthermore, behaviour is a biological function of an
organism, and a group is not an organism (Johnston and Pennypecker, 1993).
Analyses of consumer behaviour have generally been based on different types of data.
The importance of these data in obtaining empirical evidence is undeniable. The most
appealing feature of economic research into consumer behaviour is the close
relationship between theoretical specification and appropriate estimation technique and
this is most apparent when empirical analysis and testing takes place at the individual
level (Blundell, 1998). The most influential and convincing level of analysis is at the
146

individual consumer level. This is because analysis at individual level is able to avoid
any aggregation bias which can cause complex interactions between individual
characteristics and price effects (Blundell, 1998). Furthermore, analysis that is carried
out on an aggregate level shows the behaviour of a group as a whole but nothing about
the behaviour of individuals. There could be some differences between each individual
that need to be explored and investigated.
In addition, aggregate data might exclude many important aspects. Factors such as the
proportion of total expenditure associated with a particular family size or tenure groups
might change over time in a way that is probably correlated with real total expenditure
and relative price movements, making it difficult to identify the separate effects from
aggregate data (Blundell, 1998). In other words, it may cause difficulty in testing the
hypotheses accurately.
A detailed analysis of the behaviour of each individual often provides valuable
information for use in designing further tests as well as in suggesting modifications to
the theory (Battalio et al., 1973b). Many concepts in economics often use aggregate
data in testing hypotheses in consumer research. Aggregate data of household
consumption for example, are usually used in forecasting and predicting the consumer's
responses towards the price changes. However, the use of aggregate data is based on the
assumption that the economic relationship between the variables is homogeneous across
every individual, which can be a bias. Regression analysis would therefore provide
conclusions that might be less accurate.
147
Issues concerning analysis have become the interest of many researchers. Some believe
that a stronger relationship can be gained by using a higher level of analysis. Often
these researchers depend on aggregate data to obtain stronger and reliable correlations
compared to those at the individual level. Nevertheless, fallacies have been found in
applying the aggregate data (Hannan, 1971, James, 1982). In general terms, the fallacy
of the wrong level occurs when correlations at a more macro level are used to make
inferences about individuals, or vice versa (Ostroff, 1993). Robinson (1950) claimed
that a macro or aggregated correlation and an individual correlation cannot always be
equated. Assumptions should not be made that the relationship or correlation among the
variables at a level is similar to another level of analysis.
The A.C. Nielsen Homescan panel data produces numerous data on consumers'
behaviour in the marketplace, which allows a realistic and accurate analysis. The data
themselves come from the very complicated process of everyday economic life (Hsiao,
2003). Generally, each individual has different influences on their everyday
consumptions. Leaving out some of the factors or influences that are insignificant is
typical and usual. However, ignoring the individual or time-specific effects that exist
among cross-sectional or time-series units but are not captured by the included
explanatory variables can lead to parameter heterogeneity in the model specification
(Hsiao, 2003). Selection of the variables in studying the relationship is crucial and may
affect the result. Bias occurs if the effects of the neglected or omitted variables are
correlated with the included variables. Bias will also exist if the slopes and intercepts
vary through time, even if for a given time period they are identical for all individuals
(Hsiao, 2003). Aggregate data is often addressed as the ‘representative agent’
148
assumption. Nevertheless, the predictions of aggregate outcomes using aggregate data
can be less accurate than a prediction based on micro equations (Hsiao, 2003).
According to Kagel et al.(1995), most tests of consumer-demand theory have been
based on aggregate data, an approach that may lead to serious methodological problems,
considering that the theory is a theory about individual consumer behaviour.
Furthermore, utilising aggregate data is based on representative consumers, which
might not necessarily result in accurate empirical outcomes.
Consumer information from the panel data is an effective way of understanding
consumers’ buying patterns. Panel data is a diagnostic tool for obtaining the needed
information. It is regarded as more accurate than a respective cross-section or time-
series data and can enhance the empirical analyses (Churchill and Iacobucci, 2002,
Crouch and Housden, 2003, Gujarati, 2003). The data are considered to be very precise
and less susceptible to errors, particularly when based on barcode scanning procedures,
than those obtained through consumers' reports of their past behaviour in surveys
(Churchill, 1999).
5.83 Proportional vs. Ratio calculations
The Matching Law was first formulated by R. J. Hermstein in 1961 after he studied
pigeons on concurrent variable-interval schedules and later claimed that the birds’
response frequency was proportionate to the reinforcement frequency. Strict Matching
149

Law, according to Hemnstein(1961), shows that when all are in equilibrium, the relative
response rate matches the relative reinforcement rate, hence
Bx/B x+By = Rx/R x+Ry
where B is the behaviour allocated to alternatives x and y, and R is the reinforcer
contingent upon that behaviour (Foxall and Schrezenmaier, 2003).
Baum (1974,1979) proposed that the Matching Law formula which is traditionally
expressed in terms of proportions, could be re-expressed in ratio calculations, known as
Baum’s Generalised Matching Law, where
B y By = R /R y
This equation when stated in logarithmic expression is represented by;
log (B x/By) = s log (Rx/Ry) + log b
150
According to Foxall et al (2004), the parameter s is the slope of the linear log-log
formulation which is interpreted as a measure of sensitivity where it can also be used to
determine the level of substitutability. An s value of more than 1 (s >1) indicates over
matching, whereas an s value of less than 1 (s <1) indicates under-matching. The
parameter b obtained from the intercept of the linear log-log formulation is a measure of
biases responding between the alternatives where bias is absent when b equals unity.
Both equations are possible and acceptable. However in this study, Baum’s Generalised
Matching Law or ratio calculations could not be carried out as the data points are
limited to analysis for each individual subject. There are some points where using brand
B solely for the denominator in the calculation leads to error in the result, particularly
when only one product brand is purchased by the individual. Previous research by
Schrezenmaier (2005) has indicated the same problem in using ratio calculation for
individual analysis, as for many consumers, very few data points were available and
were not computable on ratio basis, thus making it impossible to conduct matching,
relative demand and maximisation analyses. Therefore, Hermstein’s proportional
calculation is utilised in this study for a more promising result. Since it is necessary to
use this measurement in individual analysis, a decision has also been made to use the
same measurement in aggregate analysis (200 data) to facilitate comparison.
Furthermore, proportional calculation has been fruitfully employed by James (2002)
which yielded reliable results. In addition, it has been noticed that both the proportional
and ratio calculation produce quite similar results which has been observed from about
50 matching analyses made on baked beans in this research. Observations are still valid
and would almost certainly receive confirmation from a larger sample over a larger
151

period of time or if employing a proportional analysis (Foxall and Schrezenmaier, 2003,
Foxall and James, 2001) which corroborates the earlier works which state that the two
methods produce similar results.
5.8.4 Matching Analysis
Matching analysis enables a researcher to determine the substitutability of brands within
a product category. Hermstein’s (1961) initial discovery was that when animals are
presented with two opportunities to respond (pecking key X or key Y), each of which
delivers reinforcers (food pellets) on its own variable interval (IV) schedule, they
allocate their responses to X and Y in proportion to the rates of reward available in X
and Y (Foxall and Schrezenmaier, 2003). In consumer research, the Matching Law is
defined as the proportion of pounds and pence (or dollars and cents and so forth) spent
for a commodity will match the proportion of reinforcers earned (i.e. purchases made as
a result of that spending) (Foxall, 1999).
As this research employs proportional calculations, the matching analysis in this thesis
therefore is expressed as the relative amount bought ratio of the frequently purchased
brand as a proportion of the relative amount paid ratio for the same brand. Hence, two
proportional calculations were used, which are the amount bought ratio and amount paid
ratio.
152
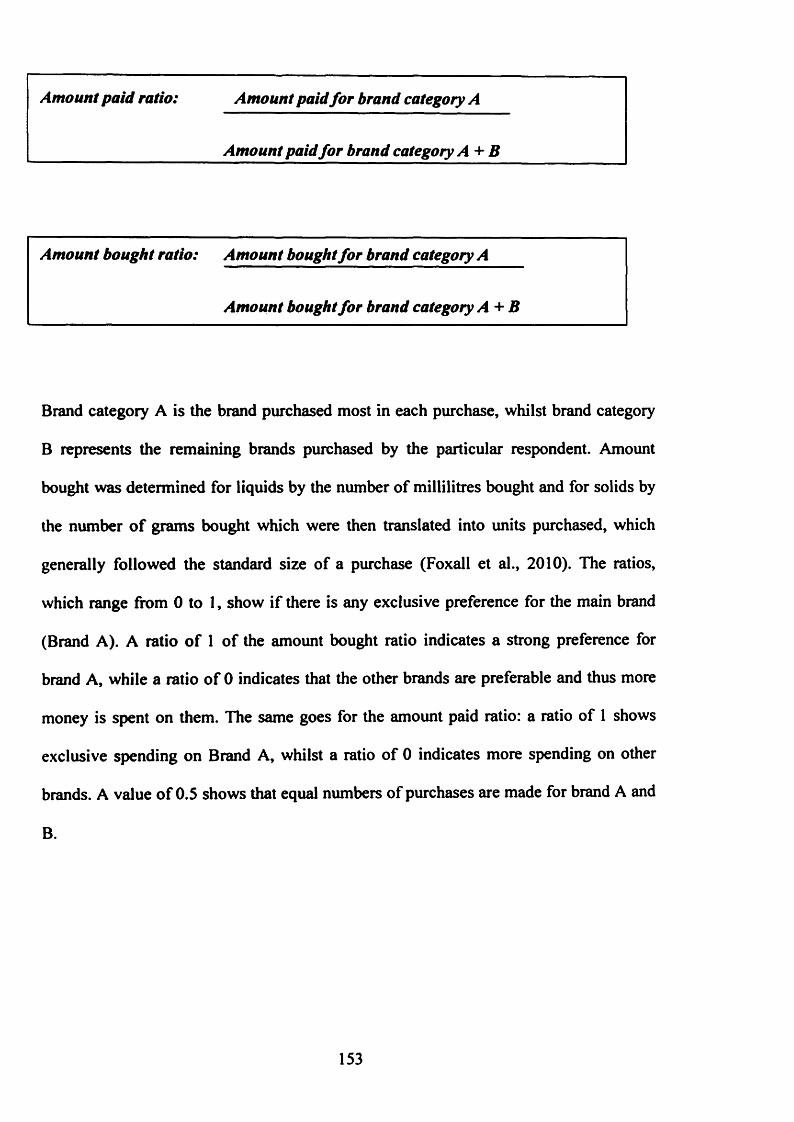
Amount paid ratio: Amount paid for brand category A
Amount paid for brand category A + B
Amount bought ratio: Amount bought for brand category A
Amount bought for brand category A + B
Brand category A is the brand purchased most in each purchase, whilst brand category
B represents the remaining brands purchased by the particular respondent. Amount
bought was determined for liquids by the number of millilitres bought and for solids by
the number of grams bought which were then translated into units purchased, which
generally followed the standard size of a purchase (Foxall et al., 2010). The ratios,
which range from 0 to 1, show if there is any exclusive preference for the main brand
(Brand A). A ratio of 1 of the amount bought ratio indicates a strong preference for
brand A, while a ratio of 0 indicates that the other brands are preferable and thus more
money is spent on them. The same goes for the amount paid ratio: a ratio of 1 shows
exclusive spending on Brand A, whilst a ratio of 0 indicates more spending on other
brands. A value of 0.5 shows that equal numbers of purchases are made for brand A and
B.
153

Matching Law according to Hermstein(1961) is;
Bx/(Bx + By) - Rx/(Rx + Ry)
where B is the behaviour allocated to alternatives x and y, and R represents the
reinforcers contingent upon that behavior (Foxall and Schrezenmaier, 2003).
Baum (1974) proposed the Generalized Matching law:
B x /B y - b (R x /R y )s
These ratios are then transformed into logarithms. Hence, the matching equation
becomes
log (B x/B y) =s log (Rx/Ry)+ log b
where s represents sensitivity and b represents bias.
154

As mentioned earlier, the slope s indicates the sensitivity, where a consumer who
chooses the cheapest product more often than the matching law predicts is said to be
over-matching (s>l) and a consumer who often does not choose the cheapest product is
said to be under-matching (s<l). According to Baum (1974, Baum, 1979), s values
between 0.90 and 1.10 can be considered as near perfect matching (refers as matching
in this study); s values over 1.10 of overmatching and s values between 0 and 0.90 of
under matching. Anti-matching (s<0) exists where the predictions of the Matching Law
are reversed, b represents the bias, and a b with greater or less than one indicates that
preference is biased by some unknown, but invariant, asymmetry between the
alternatives (Baum, 1974). Bias is a preference for one alternative rather than the others.
A source of bias could be a qualitative difference between reinforcers, such as an
unanticipated additional value granted to one reinforcer, but not to the other (Baum,
1979, Davison and McCarthy, 1988, Pierce and Epling 1983). It can also be a result of
positioning of the product itself or the positioning of other competitors.
It should be noted that logarithmic calculation is carried out in the analysis as
logarithmic transformations of experimental data in behaviour analysis are used
extensively as a standard procedure (Schrezenmaier, 2005); therefore, it is important to
adopt logarithms in this study. In economics, relationships between two quantities can
be either linear or non-linear. A linear relationship is when both quantities are
proportional, meaning that any amount of changes in a quantity would affect the same
amount of changes in the other quantity. This can be graphed as a straight line with a
constant slope. A non-linear relationship, on the other hand, is when there are a certain
amount of changes in a quantity which does not show the same amount of changes in
155

the other quantity. Linear models imposed on non-linear relationships will lead to error
(Silver, 1997); therefore, in order for the linear regression to be used, the data are
transformed into linear form by applying logarithms to the results of the ratios.
Logarithms are also able to reduce or squeeze wide-ranging values into smaller range.
Logarithms are used to transform the data into linearity and therefore make the data
amenable to the analyses (Slater and Ascroft, 1990). In addition, logarithmic
transformation has been used by most behavioural economists; therefore its use would
facilitate making comparisons with their findings and results.
5.8.5 Relative Demand Analysis
This analysis follows procedures of analysis carried out in behavioural economics
(Kagel et al 1980). Demand analysis and its curve are able to demonstrate the sensitivity
of demand to price. It can be summarised thus: the demand curve shows the relation
between price and quantity demanded, holding other things constant (Begg et al.,
1997). Demand analysis can assist researchers in finding out consumers’ price
sensitivity, as an increase in price would usually reduce the amount bought by
consumers.
According to Madden et al (2000), three predictions have been made by economic
theory. First, increasing the unit price of a reinforcer decreases consumption of that
reinforcer; second, “unit price determines consumption and response output regardless
156
of the specific values of the cost and benefits components of the ratio, and; third, when
choosing between two qualitatively identical reinforcers available at different unit
prices, behaviour will be exclusively allocated to the alternative with the lower unit
price.
The demand analysis in this study is referred as relative demand analysis as it is a study
of ‘relative’ demand analysis across the brands purchased, presenting the relative
amounts of brands A and B as a function of their relative prices (Schrezenmaier, 2005).
The availability of various brands in the open setting of grocery supermarket would
usually lead to price impacting on the consumer’s purchase decision making. Relative
demand analysis differs from the traditional economic demand analysis as the latter
usually relates simply to the quantity bought against price. Furthermore, relative
demand analysis has been used successfully in previous research (Foxall and James,
2003, Foxall and Schrezenmaier, 2003, Foxall et al., 2004, Oliveira-Castro et al., 2005,
Foxall and James, 2001).
Two ratios were used for the relative demand analysis, the amount bought ratio and the
average price ratio. Again, brand A represents the most purchased brand whereas brand
B represents the remaining brands. For average price ratio, a value of greater than 1
indicates that the average price of the most frequently bought (brand A) is higher than
the average price of the remaining brands (brand B), whereas a value of less than 1
indicates that the average price of brand A is less than the average price of the
remaining brands (brand B).
157
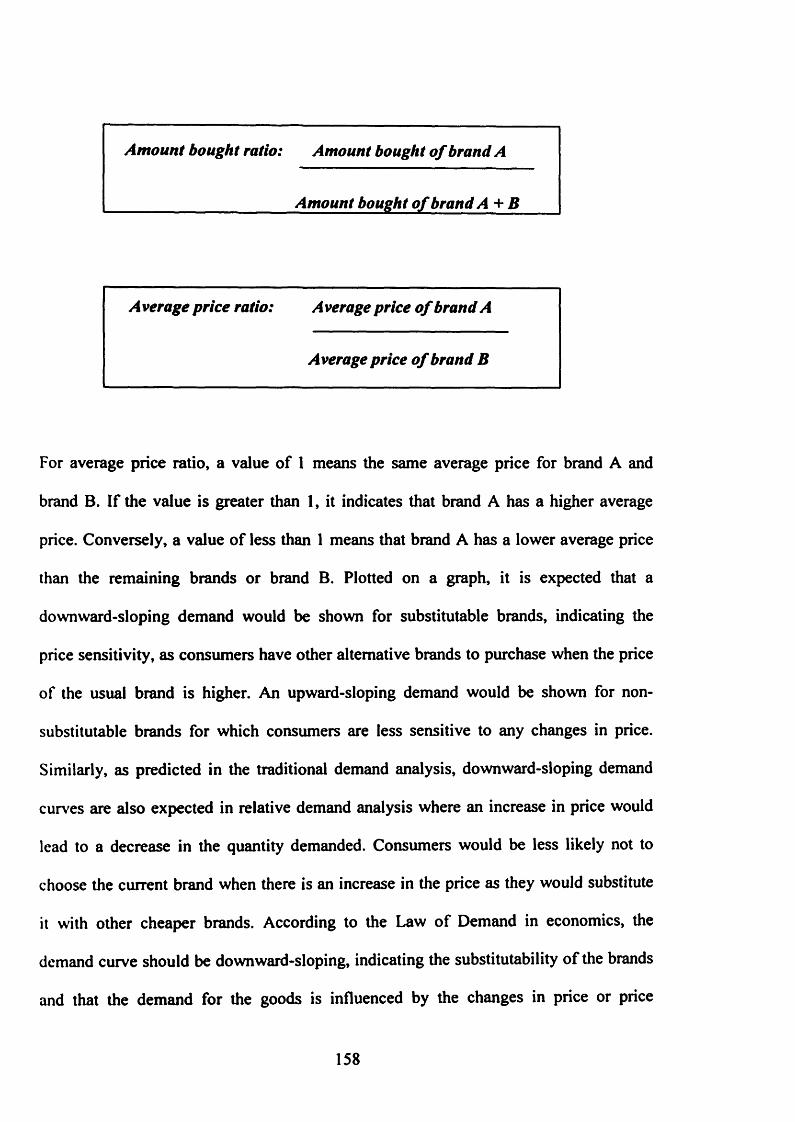
Amount bought ratio: Amount bought o f brand A
Amount bought o f brand A + B
Average price ratio: Average price o f brand A
Average price o f brand B
For average price ratio, a value of 1 means the same average price for brand A and
brand B. If the value is greater than 1, it indicates that brand A has a higher average
price. Conversely, a value of less than 1 means that brand A has a lower average price
than the remaining brands or brand B. Plotted on a graph, it is expected that a
downward-sloping demand would be shown for substitutable brands, indicating the
price sensitivity, as consumers have other alternative brands to purchase when the price
of the usual brand is higher. An upward-sloping demand would be shown for non-
substitutable brands for which consumers are less sensitive to any changes in price.
Similarly, as predicted in the traditional demand analysis, downward-sloping demand
curves are also expected in relative demand analysis where an increase in price would
lead to a decrease in the quantity demanded. Consumers would be less likely not to
choose the current brand when there is an increase in the price as they would substitute
it with other cheaper brands. According to the Law of Demand in economics, the
demand curve should be downward-sloping, indicating the substitutability of the brands
and that the demand for the goods is influenced by the changes in price or price
158
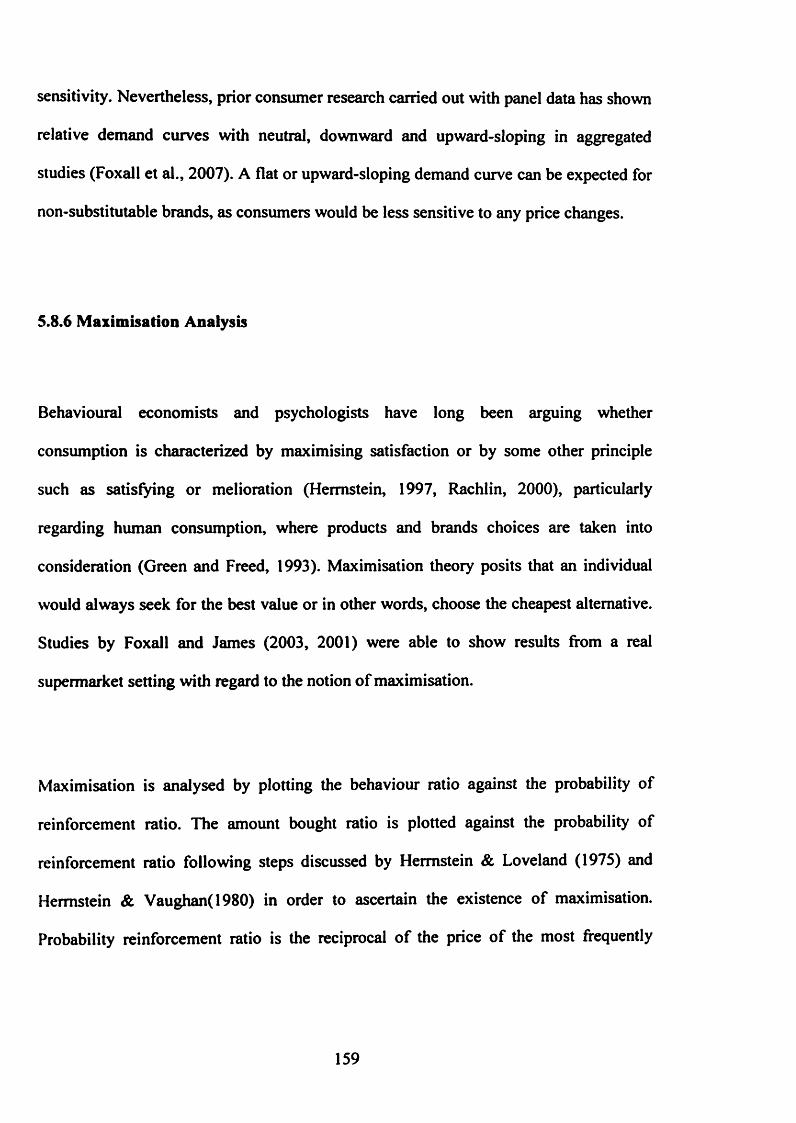
sensitivity. Nevertheless, prior consumer research carried out with panel data has shown
relative demand curves with neutral, downward and upward-sloping in aggregated
studies (Foxall et al., 2007). A flat or upward-sloping demand curve can be expected for
non-substitutable brands, as consumers would be less sensitive to any price changes.
5.8.6 Maximisation Analysis
Behavioural economists and psychologists have long been arguing whether
consumption is characterized by maximising satisfaction or by some other principle
such as satisfying or melioration (Hermstein, 1997, Rachlin, 2000), particularly
regarding human consumption, where products and brands choices are taken into
consideration (Green and Freed, 1993). Maximisation theory posits that an individual
would always seek for the best value or in other words, choose the cheapest alternative.
Studies by Foxall and James (2003, 2001) were able to show results from a real
supermarket setting with regard to the notion of maximisation.
Maximisation is analysed by plotting the behaviour ratio against the probability of
reinforcement ratio. The amount bought ratio is plotted against the probability of
reinforcement ratio following steps discussed by Hermstein & Loveland (1975) and
Hermstein & Vaughan(1980) in order to ascertain the existence of maximisation.
Probability reinforcement ratio is the reciprocal of the price of the most frequently
159
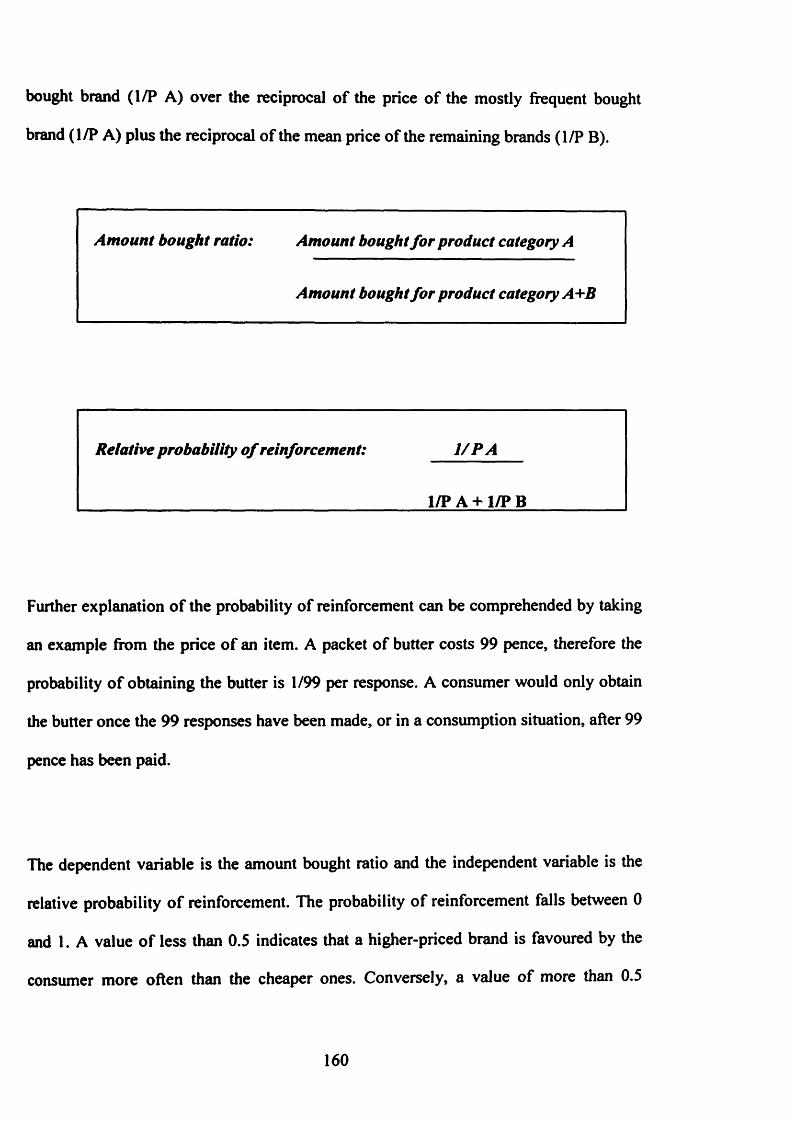
bought brand (l/P A) over the reciprocal of the price of the mostly frequent bought
brand (l/P A) plus the reciprocal of the mean price of the remaining brands (l/P B).
Amount bought ratio: Amount bought for product category A
Amount bought for product category A+B
Relative probability o f reinforcement: 1 / PA
l/P A + l/P B
Further explanation of the probability of reinforcement can be comprehended by taking
an example from the price of an item. A packet of butter costs 99 pence, therefore the
probability of obtaining the butter is 1/99 per response. A consumer would only obtain
the butter once the 99 responses have been made, or in a consumption situation, after 99
pence has been paid.
The dependent variable is the amount bought ratio and the independent variable is the
relative probability of reinforcement. The probability of reinforcement falls between 0
and 1. A value of less than 0.5 indicates that a higher-priced brand is favoured by the
consumer more often than the cheaper ones. Conversely, a value of more than 0.5
160

indicates that the consumer purchases the cheaper ones more often than the higher-
priced brands, which can be considered as maximising. These ratios can be represented
graphically by a step function.
5.8.7 Utilitarian and Informational Reinforcement
5.8.7.1 Brands
Brands in a product category have a combination of both the utilitarian and
informational reinforcements that serve as the discriminative stimuli. Discriminative
stimuli that signal utility and symbolism refer to the utilitarian and informational
reinforcements respectively (Foxall, 1990). Utilitarian reinforcement refers to the
functional and technical aspects of the product, whilst informational reinforcement
represents the symbolic meaning or social status in buying the products. The levels of
both the utilitarian and informational reinforcement are adapted from the previous work
of (Foxall and James, 2003, Foxall and Schrezenmaier, 2003, Foxall et al., 2004,
Oliveira-Castro et al., 2006, Foxall and James, 2001).
There are no general units in measuring the levels of both the informational and
utilitarian reinforcement. Hence a ranking system is applied wherein three informational
levels and two utilitarian levels are allotted to each product category. The utilitarian
reinforcement level, particularly for FMCG or supermarket food products, is identified
161

based on the attributes of the product brand. These attributes usually add value to the
product or its consumption and are mentioned on the package or brand names, which
justify an increase in price (Foxall et al., 2004). Additional attributes increase the level
of utilitarian reinforcement (e.g. Level 1 for plain baked beans but Level 2 for baked
beans with sausage). Usually, additional attributes to the product result in an increase in
price. Informational reinforcement, on the other hand, is related to the brand
differentiation where best or well-known brands are usually associated with prestige and
social status, which in turn conveyed by the price differentiation (Foxall et al., 2004).
Brand differentiation between, for example Tesco and Heinz, clearly implies the
different level of informational reinforcement not only in terms of the price but also in
terms of the quality, taste and packaging. The ranking of informational reinforcement is
based on the predominant difference that one can find between products, offered by
different brands that usually have almost identical formulations (Foxall, 1999).
Each brands are ranked according to two levels of utilitarian benefit and three levels of
informational benefit which these benefit levels were ranked based on the interpretation
that brands represent programmed reinforcement contingencies arranged by managers
and producers (Foxall et al., 2007). The informational level of each brand is analysed by
using a simple questionnaire, as used earlier by Foxall and colleagues. The
questionnaires were answered in October and November 2006. Respondents selected for
the questionnaires were those who had been living in UK for all or most of their lives.
Respondents were required to rate the brands by answering two questions:
162

• Is the brand well-known?
Answer: 0 -Not known at all
1 - Known a little
2 - Quite well-known
3 - Very well-known
• What is the level of quality of the brand?
Answer: 0- Unknown quality
1- Low quality
2- Medium quality
3- High quality
The same respondents were asked to answer questionnaires for each of the four
products; baked beans (23 respondents), fruit juice (22 respondents), yellow fat (22
respondents) and biscuits (33 respondents). More respondents were needed for biscuits
as there were a total of 315 brands for biscuits, whereas the total brands for baked
beans, fruit juice and yellow fat were 45, 99 and 89, respectively. Different pack sizes
and product formulations for each brand were considered as the same brand. However,
general brand names such as Asda or Tesco, which come with various brand names with
respect to their positioning were classified as different brand names.
163
Mean scores for knowledge and quality was calculated for each brand and respondent.
The average of these mean values was then computed for each brand across all
respondents, the value of which is known as MKQ. A reliability analysis of MKQ was
conducted by randomly assigning questionnaire respondents into two or three (in the
case of biscuits) groups of approximately equal sizes, and whole average MKQ given to
each brand were correlated across all brands, such as N ranging from 45 for baked beans
to 315 for biscuits (Oliveira-Castro et al., 2010).
In the marketing context of routinely-bought supermarket food products, higher levels
of utilitarian benefit can be identified by the addition of desirable attributes where they
are visibly declared on the package or are part of the product name, and ultimately
justify higher prices (Foxall et al., 2007). The utilitarian level of the products was
ranked by adopting the same procedure employed by previous studies (see Foxall et al.,
2004, Oliveira-Castro et al., 2005). There were two levels given to the brands based on
the formulation. A higher utilitarian level was given to those brands with added
qualities and attributes. Utilitarian levels were identified based on additional attributes
(e.g. plain baked beans vs. baked beans with sausages; plain vs. light product
formulations) and/or differentiated types of products (e.g. plain biscuits vs. cookies;
cornflakes vs. rice cereals) (Oliveira-Castro et al., 2005). Plain formulations of brands
were ranked 1 (low utilitarian level) while sophisticated formulations with more
attributes, such as baked beans with sausages, were ranked 2 (higher utilitarian level).
164

Consumers were later grouped into 6 groups based on the combination o f these
utilitarian and informational reinforcement levels o f the brands they predominantly
bought which are: Group 1 - Informational Level 1 and Utilitarian Level 1; Group 2 -
Informational Level 1 and Utilitarian Level 2; Group 3 - Informational Level 2 and
Utilitarian Level 1; Group 4 - Informational Level 2 and Utilitarian Level 2; Group 5 -
Informational Level 3 and Utilitarian Level 1 and Group 6- Informational Level 3 and
Utilitarian Level 2 (Table 5.4)
Utilitarian 1
Level 2
Table 5. 4: Consumer brand groups based on utilitarian and informational reinforcement
S.8.7.2 Stores
Stores are selected by consumers for various reasons, and similar to brands, stores too
have a combination o f utilitarian and informational reinforcements. This research adopts
the measurement o f reinforcement levels which was developed earlier by Wells (2009)
where the same methodologies were replicated from the measurement o f reinforcement
1 6 5
Informational Level
1 2 3
Group I Group 3 Group 5
Group 2 Group 4 Group 6

levels in brands. Similarly, there are also no general units in measuring the levels of
both the informational and utilitarian reinforcement for stores. Questionnaires were used
to assess retailer brands and their informational levels. The informational level of each
brand was analysed by using simple questionnaires distributed to a sample of 30
participants who were over 18 years old and had been exposed to British retail shopping
for several years. Respondents were required to rate the stores by answering two
questions:
• Is the retailer/supermarket brand well-known?
Answer: 0 -Not known at all
1 - Known a little
2 - Quite well-known
3 - Very well-known
• What is the level of quality of the retailer/supermarket brand?
Answer: 0- Unknown quality
1- Low quality
2- Medium quality
3- High quality
166

The mean score for knowledge and quality perceived by the consumers was calculated
for each store, better known as MKQ, which relates to the level of informational
reinforcement. Utilitarian reinforcement in the case of stores in this research is defined
as the convenience provided in terms of size of stores, product/brand availability,
parking space and so forth. Hence, based on the two factors, stores were categorised
into 3 categories (Table 5.6).
LottJR udLow lR p it and Med 1R High UR and High IR .
Jacksons Asda WalMart CoopCostCo Kwiksave AsdaLondis Farmfoods MorrisonsCostcutter Sainsbury’s Central TescoTesco Express Forecourt Savacentre Marks and Spencer Food
Lidl Sainsbury’s
Aldi Safeway Iceland Tesco Extra Somerfield
Waitrose
Table 5.5 : Stores according to utilitarian and informational reinforcement levels
5.9 Summary
This chapter focuses on the methodology used in this study. The chapter also shows
why this study adopts a positivism paradigm with a descriptive research design. The
analysis of the sample is discussed in detail and how this research was carried out
167

specifically. Issues on validity and reliability are also examined. The descriptive and
statistical findings will be presented in the next chapter.
168

CHAPTER SIX

* CHAPTER 6 * ---------
STATISTICAL ANALYSIS AND DISCUSSION
6.0 Introduction
This chapter presents both the findings and discussions of the analyses. The descriptive
statistics are given in terms of the number and average of purchases and brands as well
as stores. The patterns of consumer brand choice in this study are compared to the work
of Ehrenberg and his collaborators, particularly in relation to the patterns of multi
brand/stores and brand/store loyalty. Finally, the analyses which were made using the
behavioural economics approach are discussed according to the three types of analysis:
matching analysis, relative demand analysis and maximisation analysis, specifically
related to the brand-purchasing patterns.
6.1 General Overview
The A.C.Nielsen consumer panel data consists of data from around 10,000 households
in Great Britain. The data set used in this study includes information on the purchases of
four product categories, which are baked beans, fruit juice, yellow fats and biscuits over
52 weeks, from July 2004 to July 2005. Table 6.1 summarises the number of
households, the total purchases made for each of the product categories with the average
170
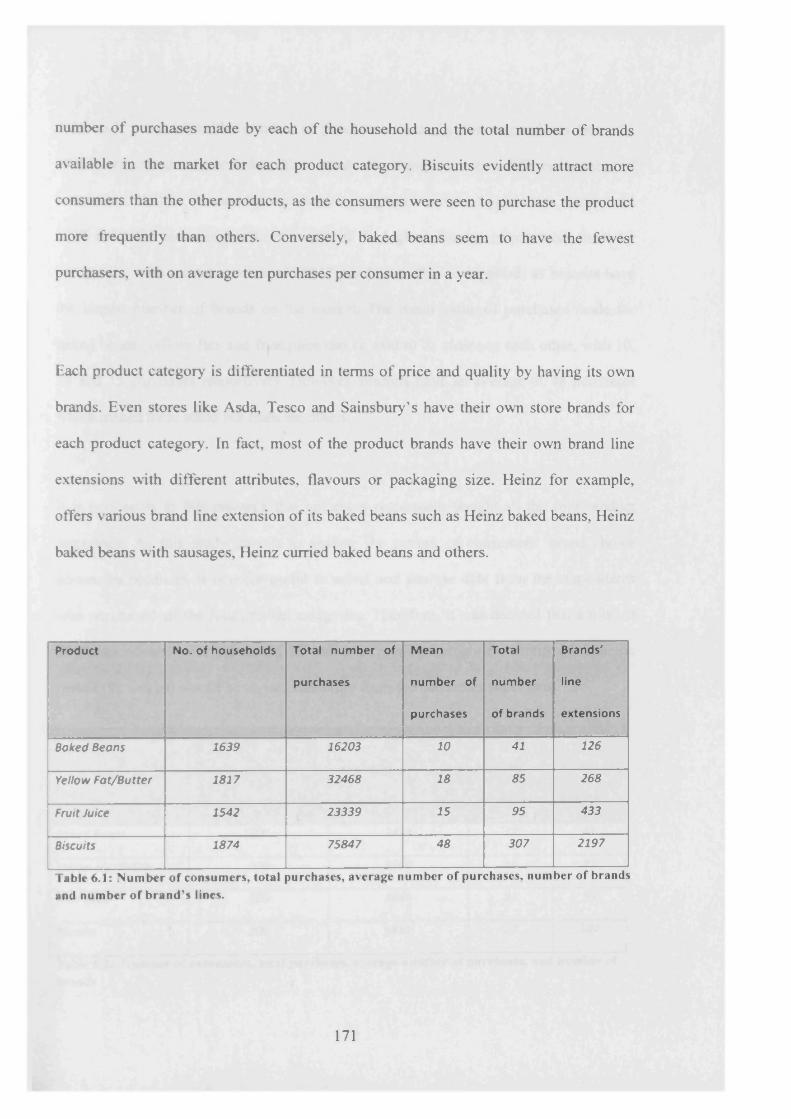
number o f purchases made by each o f the household and the total number of brands
available in the market for each product category. Biscuits evidently attract more
consumers than the other products, as the consumers were seen to purchase the product
more frequently than others. Conversely, baked beans seem to have the fewest
purchasers, with on average ten purchases per consumer in a year.
Each product category is differentiated in terms o f price and quality by having its own
brands. Even stores like Asda, Tesco and Sainsbury’s have their own store brands for
each product category. In fact, most o f the product brands have their own brand line
extensions with different attributes, flavours or packaging size. Heinz for example,
offers various brand line extension o f its baked beans such as Heinz baked beans, Heinz
baked beans with sausages, Heinz curried baked beans and others.
Product No. o f households Total number of
purchases
M ean
num ber of
purchases
Total
number
of brands
Brands'
line
extensions
Baked Beans 1639 16203 10 41 126
Yellow Fat/Butter 1817 32468 18 85 268
Fruit Juice 1542 23339 15 95 433
Biscuits 1874 75847 48 307 2197
Table 6.1: Number of consumers, total purchases, average number of purchases, number of brands and number of brand’s lines.
171

Table 6.1 summarises the number o f purchases made by the respondents from the
ACNielsen consumer panel data. Each product category attracts a different number of
consumers. Yellow fats and biscuits have the highest number o f purchasers with a total
1817 and 1874 accordingly. Biscuits rank as the highest number o f purchases made by
consumers, with a total number o f 75847 purchases. This is expected, as biscuits have
the largest number o f brands on the market. The mean value o f purchases made for
baked beans, yellow fats and fruit juice can be said to be closer to each other, with 10,
18 and 15 purchases respectively. However, biscuits have an average o f 48 purchases
which makes them stand out from the others.
It is noticeable in this research that not every respondent bought all the four product
categories. As this study intends to analyse the pattern o f consumers’ brand choice
across the products, it is more useful to select and analyse data from the respondents
who purchased all the four product categories. Therefore, it was decided that a total of
200 respondents, who purchased all the four product categories within the specific
period (52 weeks) would be chosen randomly from the consumer panel data.
Product No. of households Total num ber of
purchases
Mean
num ber of
purchases
Total
num ber of
brands
Baked Beans 200 2433 12 41
Yellow Fat/Butter 200 3500 18 85
Fruit Juice 200 4680 23 95
Biscuits 200 5482 27 307
Table 6.2: Number of consumers, total purchases, average number of purchases, and number of brands
1 7 2

Table 6.2 shows the summary of the 200 consumers’ data. Again, biscuits have the
highest total number of purchases made by the consumers. However, the average
number of purchases for all the four products are now closer. Hence, it can be assumed
that a consumer makes an average of 20 purchases for each product category.
6.2 Brand Choice Patterns
In this chapter, a comparison of the results achieved is made to the measurements and
findings from Ehrenberg’s literature, particularly in terms of explaining the underlying
reasons for the consumers’ brand choice pattern.
Based on the 200 samples, Table 6.3 exhibits the total number of both the sole
purchasers and multi-brand purchasers for all the four product categories. Multi-brand
purchasing, as expected and as stated by Ehrenberg and Uncles (1999), is found for all
the products. In fact, each of them attracts an average of 88.8% of multi-brand
purchasers, signifying that most consumers prefer to have variety in brands. The highest
percentage of consumers carrying out multi-brand purchasing is found for biscuits,
which might due to the very large variety of biscuits brands offered in the market. The
percentage of sole purchasers is less than 10% for fruit juice, yellow fats and biscuits.
This is in line with Ehrenberg and Uncle’s (1999) research stating that most consumers
practice multi-brand purchasing and only a small proportion of buyers (approximately
10%) are 100% loyal to any particular brand. These brands usually have near-identical
physical formulations and perform identical tasks, so consumers can typically exchange
173

one brand for another as the benefits gained from one are directly substitutable with
those provided by others within the repertoire (Foxall, 1999). However, for baked
beans, the percentage o f sole purchasers is 24% which is higher than the others. It is
tound that most o f the consumers tend to be loyal to a specific brand, which is Heinz;
preferring its various brand line extensions o f baked beans. Heinz baked beans brands
are well known from the attractively-designed label to its distinctive taste, and are used
in many recipes as well as for a snack.
No. of sole
purchasers
No. of multi-
brand
purchasers
No of sole
purchasers
(brand line
extensions)
No. of multi-brand
purchasers (brand
line extensions)
Baked Beans 48(24 %) 152 (76%) 41% 60%
Fruit Juice 2 0 (10 % ) 180 (90%) 25% 76%
Yellow Fats 16(8% ) 184 (92%) 10% 90%
Biscuits 6 (3%) 194 (97%) 6% 97%
Table 6.3: Number of sole purchasers, multi-brand purchasers
Table 6.4 displays the average number of purchases and average number of brands
bought by consumers. It can be seen that consumers make an average o f 20 purchases
and have an average o f about 4 different brands in their repertoire brand set. This is also
in line with Ehrenberg’s research stating that in average, consumer’s repertoires
comprise a few (three to five) brands which they buy habitually (Schrezenmaier, 2005).
174

Average number of purchases Average number of repertoire
brands
Baked Beans 12 2.2
Fruit Juice 18 3
Yellow Fats 23 4
Biscuits 27 7
Average 20 4
Table 6.4: Average number of purchases and average repertoire of brands
In the case o f store loyalty, a consumer can be seen as having an average o f about 3
stores when purchasing each o f the product categories. An average of about 76% of
consumers purchase in multi-stores, whereas an average o f 24% of consumers prefer to
purchase at the same store.
Average number of
stores
No. of store loyalty
purchasers
No. of multi-stores
purchasers
Baked Beans 2.2 74 (37%) 126(63%)
Fruit Juice 2.4 66 (33%) 134 (67%)
Yellow Fats 3.4 25(13%) 175 (87%)
Biscuits 3.7 27(14%) 173 (86%)
Tabic 6.5: Average number of stores, number of store-loyalty purchasers and number of multistore purchasers
Keng and Ehrenberg (1984) argued that store loyalty does exist but is not strong. The
results in this study agree with the statement, as the overall percentage of store loyalty is
only about 24% in average. However, one thing to be noted is that the percentage o f
store loyalty surpasses that o f brand loyalty, as shown in Table 6.6. One o f the
explanations for store loyalty is that consumers prefer to patronise a store that he/she
1 7 5
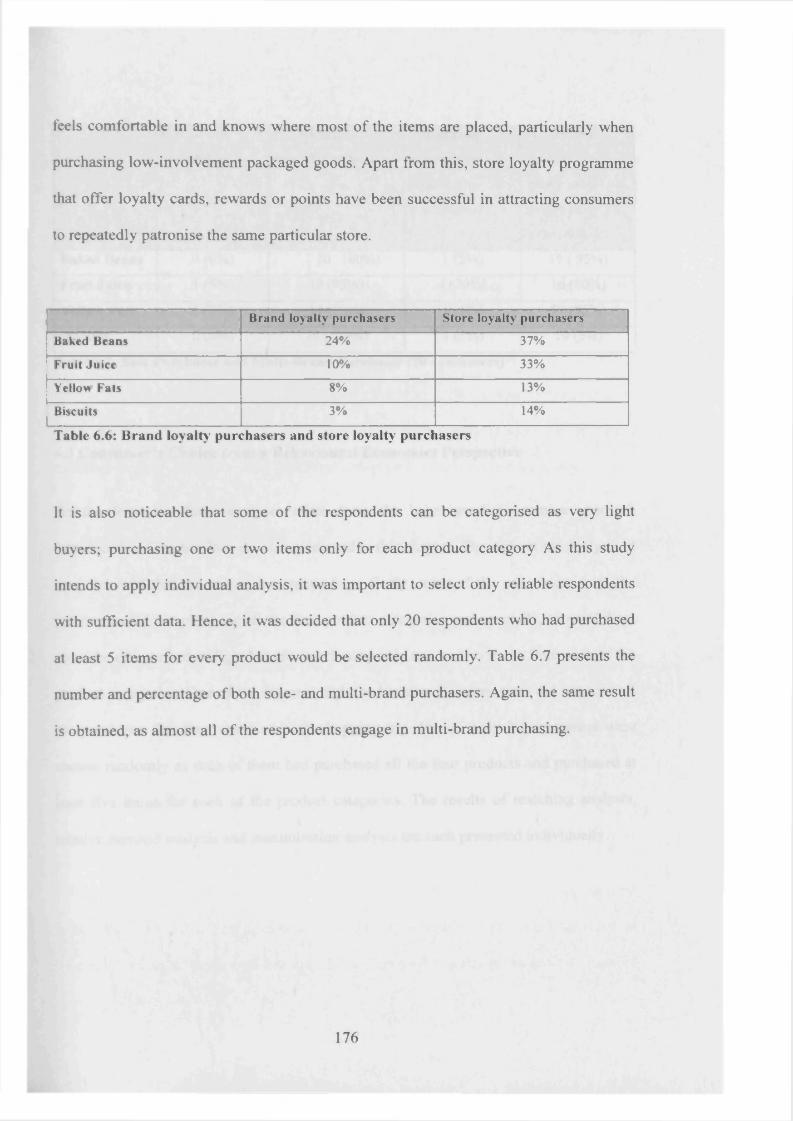
feels comfortable in and knows where most o f the items are placed, particularly when
purchasing low-involvement packaged goods. Apart from this, store loyalty programme
that offer loyalty cards, rewards or points have been successful in attracting consumers
to repeatedly patronise the same particular store.
Brand loyalty purchasers Store loyalty purchasers
Baked Beans 24% 37%Fruit Juice 10% 33%Yellon Fats 8% 13%Biscuits 3% 14%
Table 6.6: Brand loyalty purchasers and store loyalty purchasers
It is also noticeable that some o f the respondents can be categorised as very light
buyers; purchasing one or two items only for each product category As this study
intends to apply individual analysis, it was important to select only reliable respondents
with sufficient data. Hence, it was decided that only 20 respondents who had purchased
at least 5 items for every product would be selected randomly. Table 6.7 presents the
number and percentage o f both sole- and multi-brand purchasers. Again, the same result
is obtained, as almost all o f the respondents engage in multi-brand purchasing.
1 7 6

No. of sole
purchasers
No. of multi-
brand purchasers
No. of sole
purchasers
brand line
extensions)
No. of multi-
brand
purchasers
brand line
extensions)
Baked Beans 0 (0%) 20 100%) 1 (5%) 19(95%)
Fruit Juice 1 (5%) 19(95%) 4 (20%) 16(80%)
Yellow Fats 1 (5%) 19(95%) 1 (5%) 19(95%)
Biscuits 0 (0%) 20(100%) 1 (5%) 19(5%)
Table 6.7: Sole Purchaser and Multi-Brand Purchaser (20 consumers)
6.3 C onsum er’s Choice from a Behavioural Economics Perspective
Results from the three analyses taken from the behavioural economics approach
introduced in Chapter Four are also presented in this chapter. Throughout the analysis, it
was observed that the major constraints were firstly, most o f the consumers from the
panel data did not purchase all the four product categories and secondly, most o f them
could be categorised as light buyers, purchasing only one or two items from each of the
product categories. One o f the reasons might be because the consumers did not scan all
the purchases that they made on each shopping trip. Hence, only 20 consumers were
chosen randomly as each o f them had purchased all the four products and purchased at
least five items for each o f the product categories. The results o f matching analysis,
relative demand analysis and maximisation analysis are each presented individually.
1 7 7

63.1 Matching Analysis
Matching in consumer research is defined as the proportion of money spent matching
the reinforcers earned. As discussed in Chapter Five, matching analysis is carried out in
order to measure the substitutability of brands where the relationship between the
amount bought ratio and amount paid ratio is examined and plotted in a graph. Both the
sensitivity and bias are shown in the matching regression model and is represented by
the slope and intercept values. A slope that falls within 1.10 and 0.90 is considered as
matching; under-matching if the slope falls below 0.90, while a value of over 1.10 is
regarded as over-matching. Anti-matching conversely, is represented by a slope of less
than 0.
Tables 6.8, 6.9, 6.10 and 6.11 exhibit the results of matching analysis for baked beans,
fruit juice, yellow fats and biscuits. The values of the adjusted r square, Beta (s values in
Baum's equation) and the intercept (bias in Baum's equation) are summarised in the
tables.
63.1.1 Baked Beans
Overall, the adjusted R2 of the matching analysis for baked beans is strong, ranging
from 0.899 to 1. Matching is observed but only to a small extent. Under-matching is
apparent for baked beans, with a total of 50%. This might be due to the fact that most of
178

the consumers can be seen to choose Heinz as their preferred brand. In fact, a total o f 29
Heinz baked beans (including Heinz other baked beans brand line extensions)
purchases, which is the most highly differentiated and most expensive brand were made
by these consumers. Over-matching is also observed but to a lesser extent, signifying
the purchases made by the consumers that were based on the cheapest prices.
Panel No Adjusted RJ Beta Intercept(Constant)Consumer 1 1.000 0.856 0.000Consumer 2 0.937 0.828 0.149Consumer 3 0.980 0.731 0.005Consumer 4 1.000 0.666 0.000Consumer 5 0.964 1.292 0.013Consumer 6 1.000 1.032 0.000Consumer 7 1.000 0.535 0.000Consumer 8 0.995 1.509 -0.026Consumer 9 0.998 1.004 -0.004Consumer 10 1.000 0.452 0.000Consumer 11 0.934 1.197 -0.235Consumer 12 0.968 0.885 -0.003Consumer 13 0.899 0.802 -0.067Consumer 14 1.000 1.307 0.000Consumer 15 0.947 0.815 -0.021Consumer 16 0.798 0.674 -0.003Consumer 17 1.000 1.000 0.018Consumer 18 0.985 1.290 0.005Consumer 19 1.000 1.011 0.000Consumer 20 0.996 0.984 -0.004
Table 6.8: Matching Analysis for baked beans
1 7 9
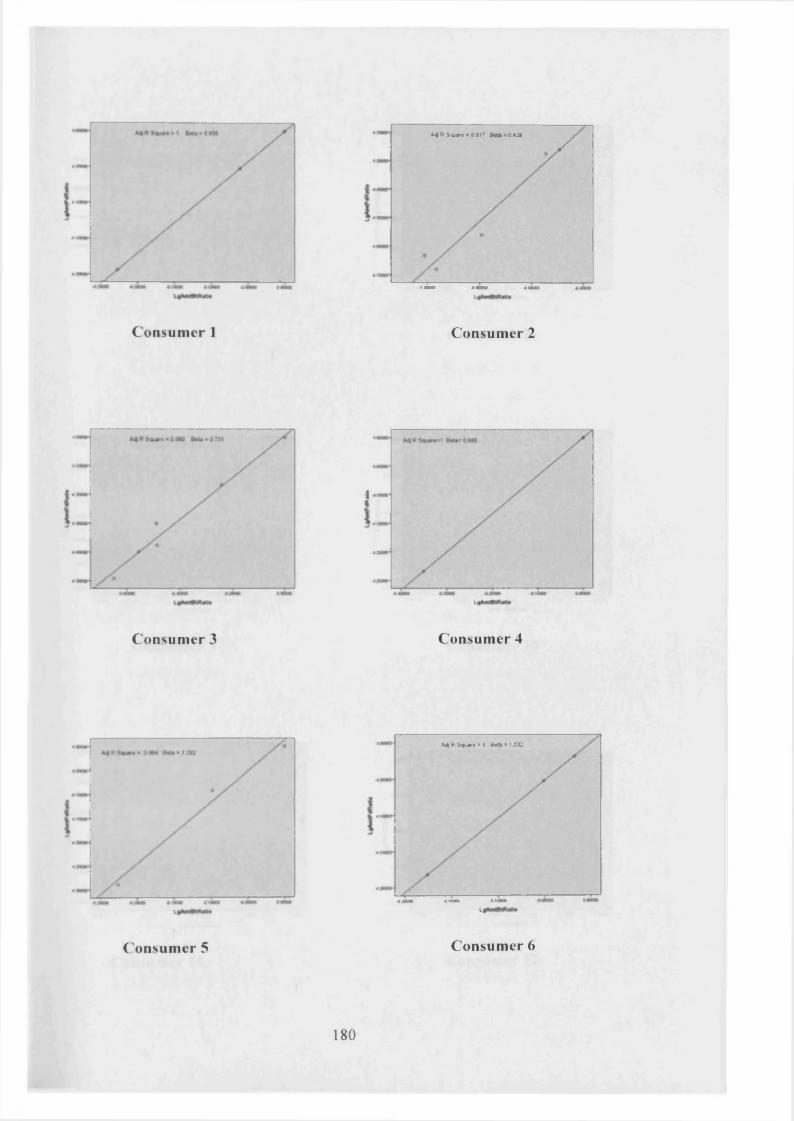
MRSwaroOM? o ta
M
Consumer 1 Consumer 2
Ii
L|
Consum er 3 Consumer 4
Lj
« 4 R S * a r t 't M > I SB
ti
C o n s u m e r 5 C o n su m er 6
180

u
C onsum er 7 Consumer 8
C onsum er 9
4 '
4 .
4:
Consumer 10
1 »*T
C o n s u m e r 11 C o n su m er 12
181
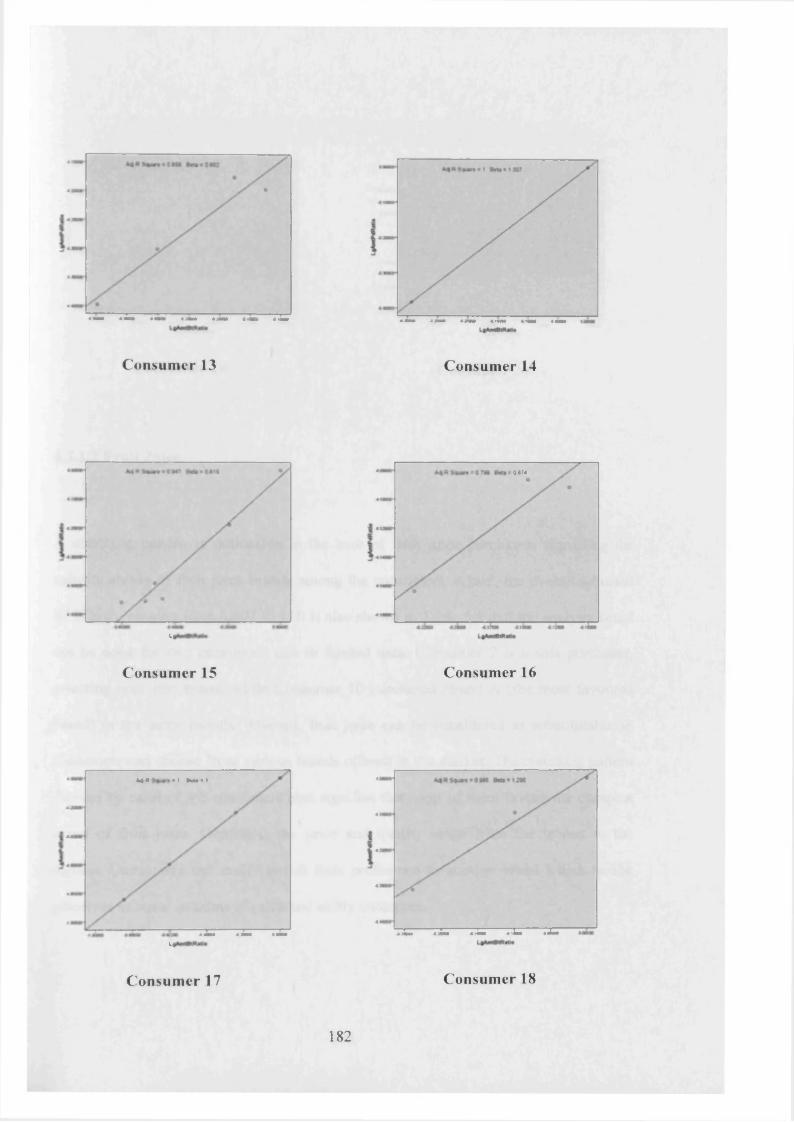
.'!■ ,<Lm .jJ
C onsum er 13
Li
Consum er 15
Consumer 14
0«M
Consumer 16
* 4 * • i mm* 1
Lf
C o n s u m e r 17 C o n su m er 18
182

M ' H o t - I M t w ' i m
C onsum er 19
u
Consumer 20
6.3.1.2 Fruit Juice
A matching pattern is noticeable in the case o f fruit juice purchases, signalling the
substitutability o f fruit juice brands among the consumers. Again, the overall adjusted
R2 is high, ranging from 0.807 to 1. It is also shown in Table 6.9 that the analysis could
not be done for two consumers due to limited data. Consumer 7 is a sole purchaser,
selecting only one brand, while Consumer 10 purchased Brand A (the most favoured
brand) in the same month. Overall, fruit juice can be considered as substitutable as
consumers can choose from various brands offered in the market. The matching pattern
showed by most o f the consumers also signifies that most o f them favour the cheapest
brand o f fruit juice. Generally, the price and quality range from the lowest to the
highest. Consumers can easily switch their preference to another brand which he/she
perceives as equal in terms o f price and utility outcomes.
1 8 3

Panel No Adjusted R2 Beta Intercept(Constant)Consumer 1 0.987 0.847 0.005Consumer 2 0.937 0.764 -0.078Consumer 3 0.878 1.854 0.005Consumer 4 1.000 1.471 0.000Consumer 5 0.839 0.914 -0.157Consumer 6 0.906 1.350 -0.079Consumer 7 - • -Consumer 8 0.928 1.183 0.058Consumer 9 0.997 0.959 -0.002Consumer 10 - - -Consumer 11 0.911 1.167 -0.055Consumer 12 0.954 1.031 -0.031Consumer 13 1.000 0.852 -0.024Consumer 14 1.000 1.065 0.000Consumer 15 0.959 0.915 -0.153Consumer 16 0.807 0.924 -0.162Consumer 17 1.000 0.894 -0.015Consumer 18 1.000 1.481 0.143Consumer 19 1.000 0.955 0.000Consumer 20 1.000 0.970 0.113
Table 6.9: Matching Analysis for fruit juice
0*4•« 7 i m o h t
Consum er 1 Consumer 2
1 8 4
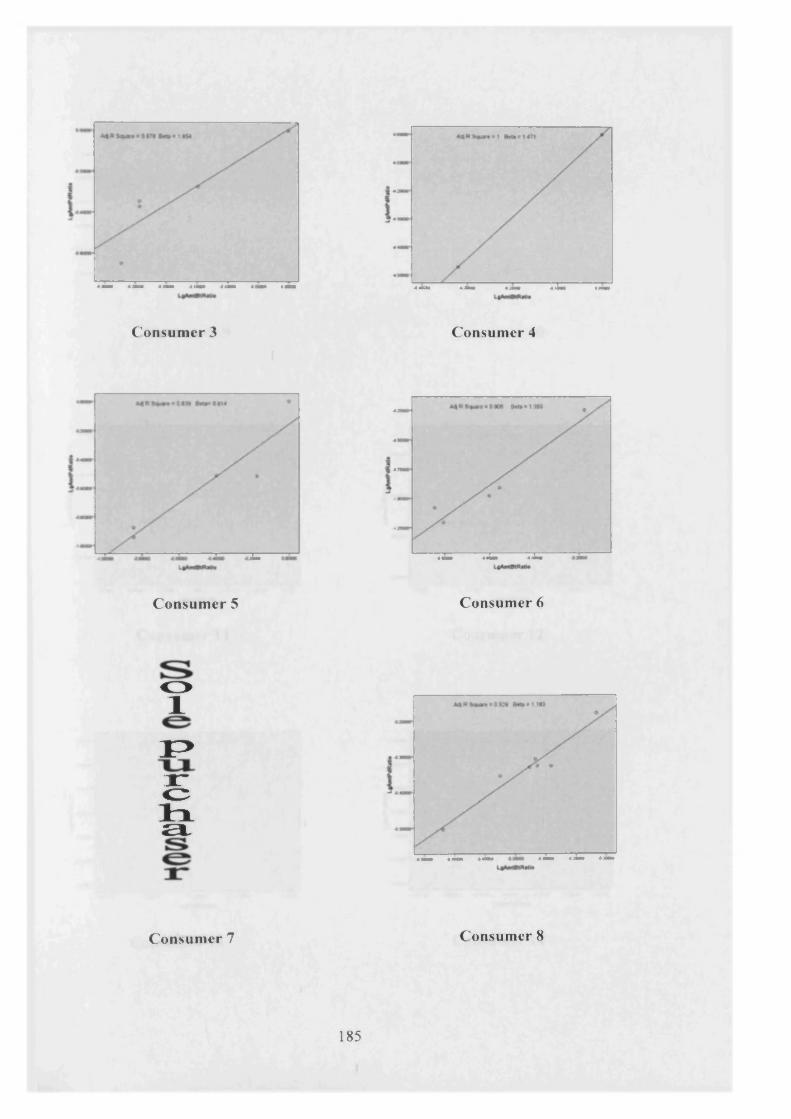
Consum er 3
rsr
Consum er 5
Ol
p
r~cha
C o n s u m e r 7
18 5
Consumer 4
TS 7C TS
Consumer 6
C o n su m er 8
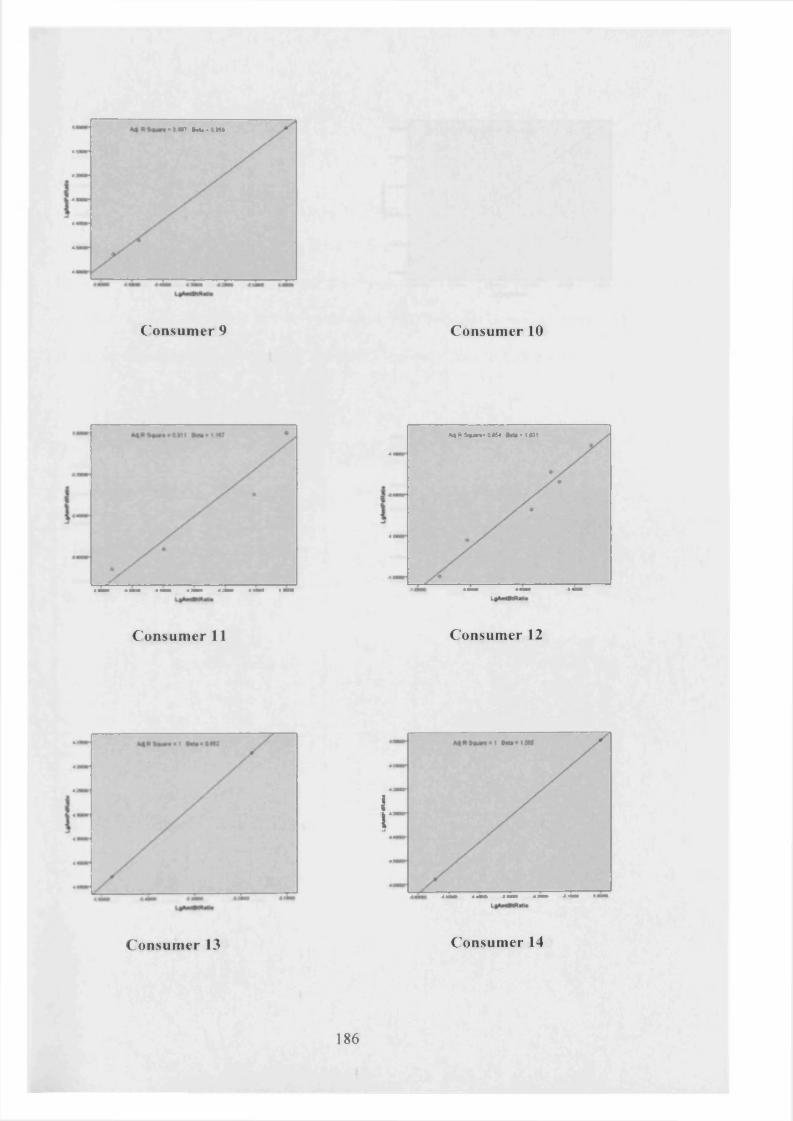
* a « r * M > i m
C onsum er 9 Consumer 10
C onsum er 11
M ******* OfrM • I Oil
44
44
Consumer 12
C o n s u m e r 13
J\
C o n su m er 14
1 8 6

a m f e u o n ;
C onsum er 15
MK5«i«iOI(n
Consumer 16
C onsum er 17 Consumer 18
L<
C o n s u m e r 19 C o n su m er 20
1 8 7
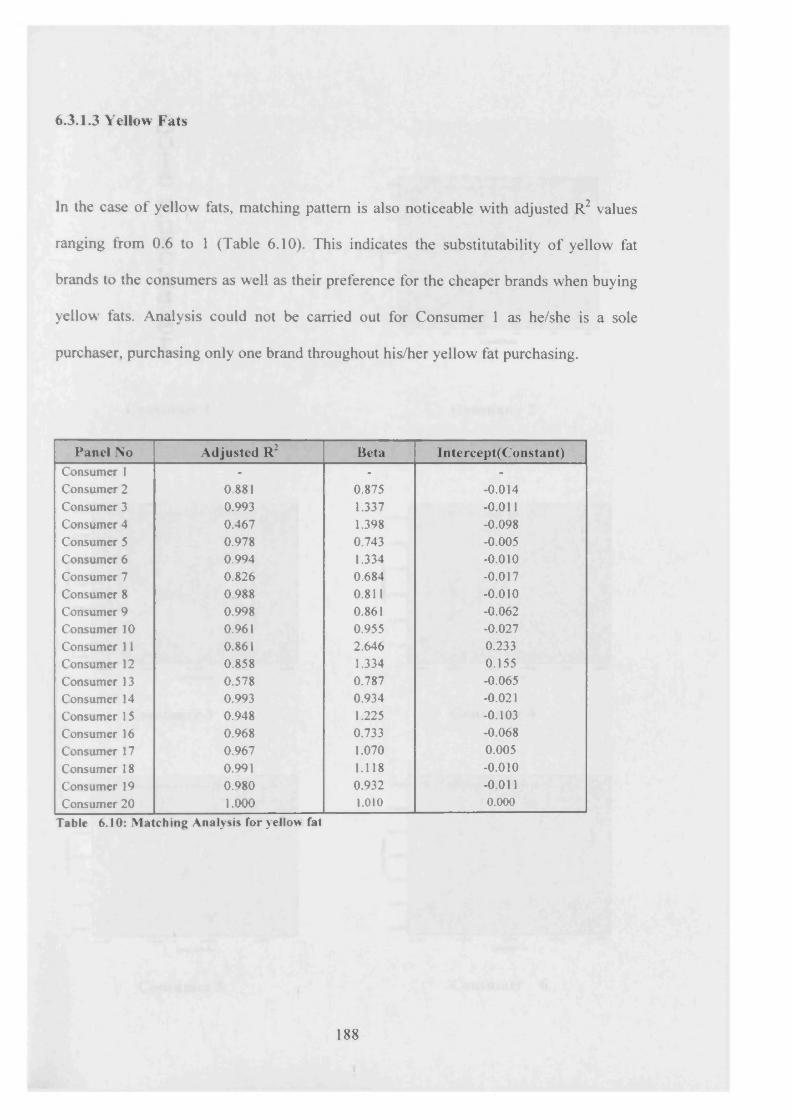
6.3.1.3 Yellow Fats
In the case o f yellow fats, matching pattern is also noticeable with adjusted R2 values
ranging from 0.6 to 1 (Table 6.10). This indicates the substitutability o f yellow fat
brands to the consumers as well as their preference for the cheaper brands when buying
yellow fats. Analysis could not be carried out for Consumer 1 as he/she is a sole
purchaser, purchasing only one brand throughout his/her yellow fat purchasing.
Panel No Adjusted R2 Beta Intercept(Constant)Consumer 1 - - -Consumer 2 0.881 0.875 -0.014Consumer 3 0.993 1.337 -0.011Consumer 4 0.467 1.398 -0.098Consumer 5 0.978 0.743 -0.005Consumer 6 0.994 1.334 -0.010Consumer 7 0.826 0.684 -0.017Consumer 8 0.988 0.811 -0.010Consumer 9 0.998 0.861 -0.062Consumer 10 0.961 0.955 -0.027Consumer 11 0.861 2.646 0.233Consumer 12 0.858 1.334 0.155Consumer 13 0.578 0.787 -0.065Consumer 14 0.993 0.934 -0.021Consumer 15 0.948 1.225 -0.103Consumer 16 0.968 0.733 -0.068Consumer 17 0.967 1.070 0.005Consumer 18 0.991 1.118 -0.010Consumer 19 0.980 0.932 -0.011Consumer 20 1.000 1.010 0.000
Tabic 6.10: iMatching Analysis for yellow fat
1 8 8

s01ePurchaser U
C onsum er 1 Consumer 2
M
C onsum er 3 Consumer 4
C o n s u m e r 5
il
u
C o n su m er 6
189

L|
Consum er 7
Consum er 9
•••■I
Consumer 8
Consumer 10
• M l
XT
Consum er 11 Consumer 12
1 9 0

C onsum er 13
LeAeeBdlW
Consumer 14
MNSqMn • SMt
C onsum er 15 Consumer 16
A 4 » S * < w * * e » l
M
C o n s u m e r 17 C o n su m er 18
191

UIWf'OM « 4 A S q u « * > < M l * lOtO
I\
t(
Consumer 19 Consumer 20
6.3.1.4 Biscuits
Panel No Adjusted R 2 Beta Intercept(Constant)! Consumer 1 0.537 1.481 0.442
Consumer 2 0.825 1.001 0.152Consumer 3 0.999 1.557 0.080Consumer 4 1.000 0.396 -0.336Consumer 5 0.976 0.903 0.052Consumer 6 0.970 1.294 -0.028
1 Consumer? 1.000 0.798 0.000I Consumer 8 0.960 1.033 -0.055! Consumer 9 0.517 1.147 0.296
Consumer 10 0.918 1.260 -0.057Consumer 11 0.692 1.127 0.211Consumer 12 0.984 0.951 -0.001Consumer 13 - - -Consumer 14 0.969 0.679 -0.109
1 Consumer 15 0.954 1.512 0.615Consumer 16 - - -Consumer 17 0.973 1.035 -0.253Consumer 18 0.785 0.993 0.028Consumer 19 0.993 1.625 0.337Consumer 20 1.000 1.041 0.022
Table 6.11: Matching Analysis for biscuits
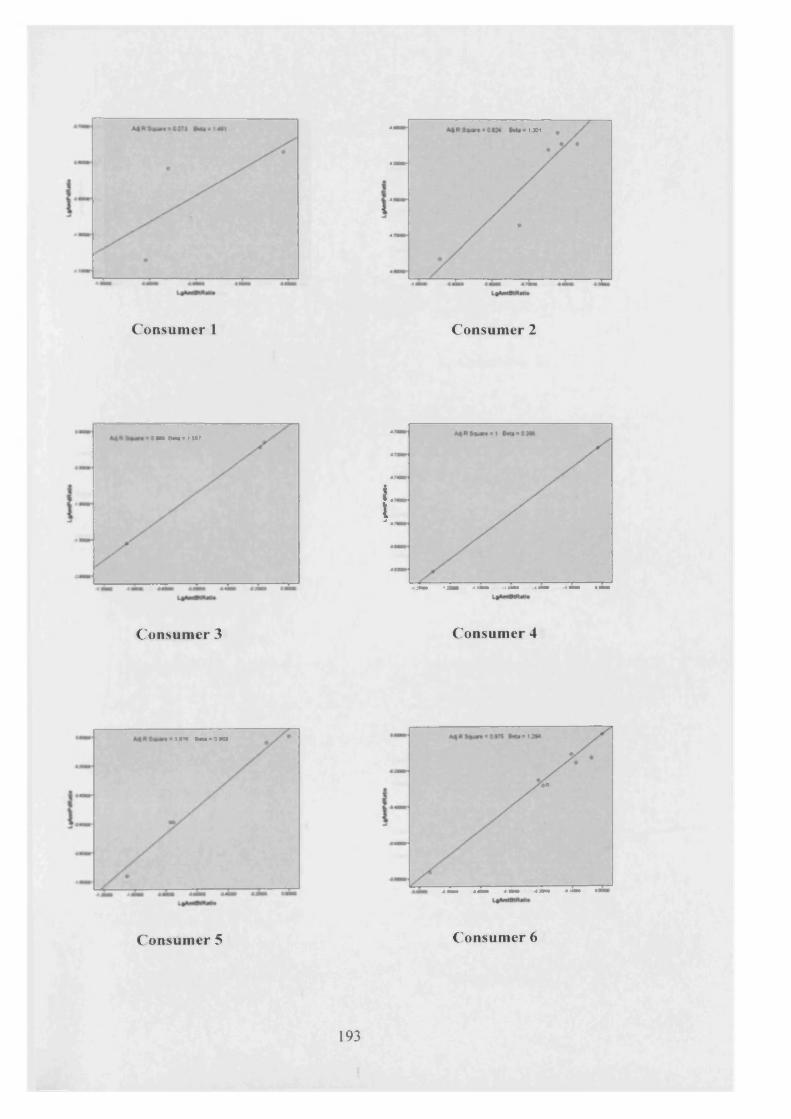
Consum er 1
tMBmnin
Consum er 3
loot
Consumer 2
j\
Consumer 4
>*M ta>3M
C o n s u m e r 5 C o n su m er 6
1 9 3
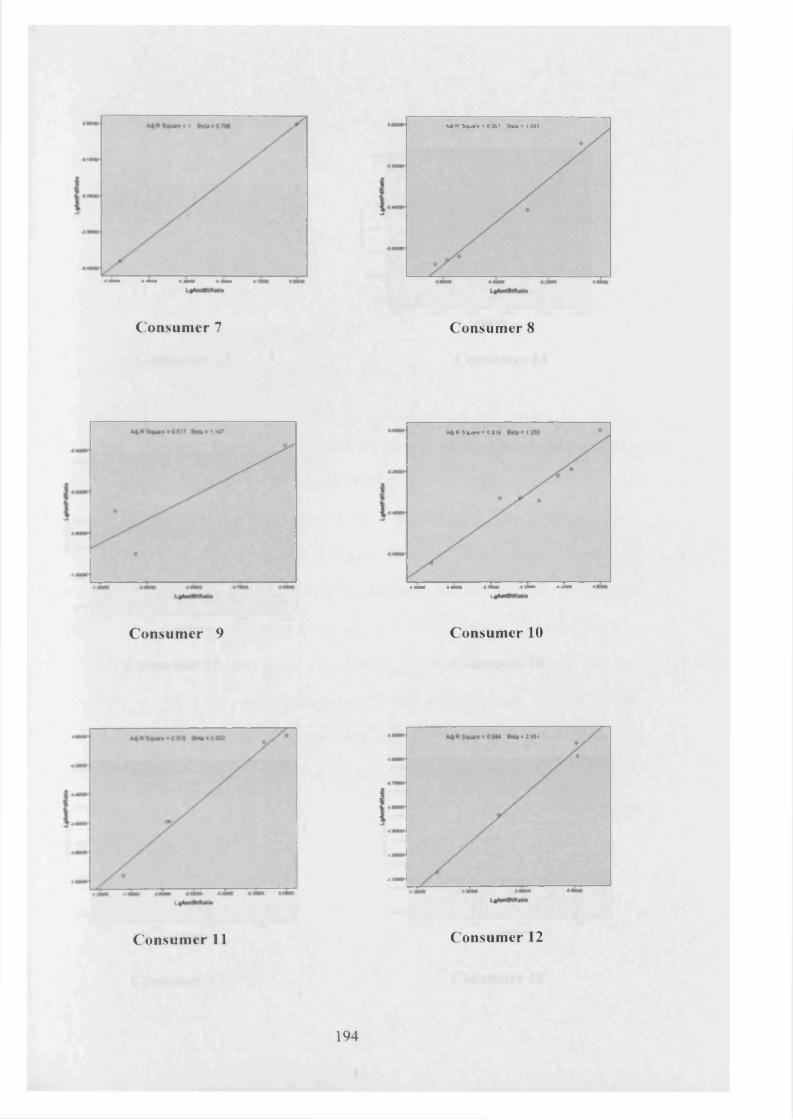
Consumer 7
Consumer 9
M R S « u r * < 0 M 7 E h u - i D I t
Consumer 8
* 4 R S jm r» • 0 I I I
M
Consumer 10
»0M1
Lt
C o n s u m e r 11 C o n su m e r 12
194

Consum er 13
brtaillll
Consum er 15
Consumer 14
Consumer 16
OMJ
L|
C o n s u m e r 17 C o n su m er 18
1 9 5

M
Consumer 19 Consumer 20
For biscuits, a matching pattern is evident for most o f the consumers (Table 6.11).
Consumers can be seen engaging in multi-brand purchasing, switching back and forth
from the various brands in their brand sets as most o f them prefer brands that are offered
at lower prices. This is not surprising as biscuits have the highest number o f brands in
the market among the four product categories. Hence, consumers are faced with a wide
range o f biscuit brands, which offer a diversity o f attributes, quality and prices that they
can choose from. Under-matching is also observed but only to a small extent. This can
be expected as even a price-conscious consumer would deviate once in a while; looking
for a better taste and quality o f biscuits as a consumer might be buying biscuits on
behalf o f other family members or for a certain occasion. Analysis could not be carried
out for Consumers 13 and 16 as these purchasers bought their preferred brand (Brand
A) in the same month.
1 9 6

6.3.2 Relative D em an d Analysis
Relative demand analysis, as explained in Chapter Five, measures the sensitivity o f
consumers towards changes in price. Based on the demand curve, this research attempts
to examine whether demand elasticity for each individual is consistent across products.
In this study, all elasticity coefficients are calculated using relative values o f price and
quantity where both relative values o f quantity and price are calculated by dividing each
quantity and price by the average quantity and average price accordingly. The relative
demand analysis will assist researchers in determining consumers’ price sensitivity as
an increase in price will usually reduce the amount bought by consumers. A downward-
sloping demand curve, which is represented by a negative value o f Beta, indicates that
increases in unit price reduce the quantity purchased o f a product. The value o f adjusted
R:, Beta and intercept are shown for all the product categories in Tables 6.12, 6.14, 6.15
and 6.16. It is also to be noted that a low value o f the adjusted r square can be seen for
all the products. This indicates a weak relationship between the relative price and
relative quantity demanded.
1 9 7
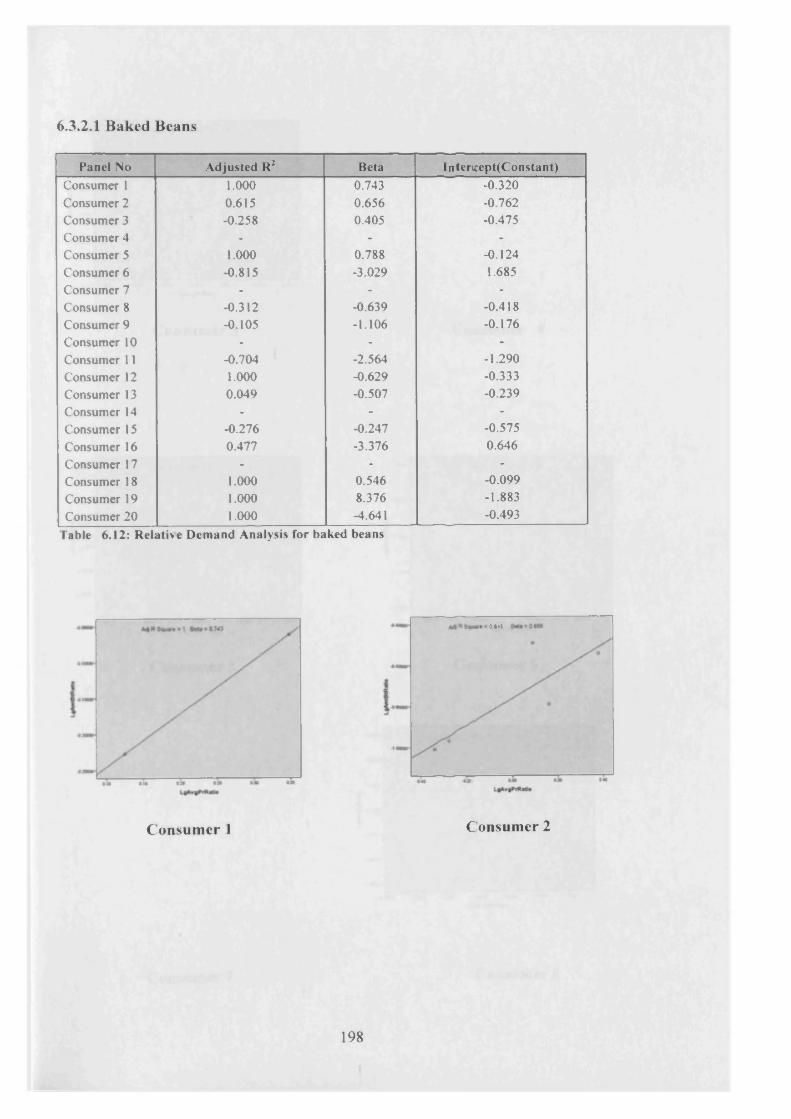
6.3.2.1 Baked Beans
Panel No Adjusted R1 Beta Intencept(Constant)Consumer 1 1.000 0.743 -0.320Consumer 2 0.615 0.656 -0.762Consumer 3 -0.258 0.405 -0.475Consumer 4 - - -Consumer 5 1.000 0.788 -0.124Consumer 6 -0.815 -3.029 1.685Consumer 7 - - -Consumer 8 -0.312 -0.639 -0.418Consumer 9 -0.105 -1.106 -0.176Consumer 10 - - -Consumer 11 -0.704 -2.564 -1.290Consumer 12 1.000 -0.629 -0.333Consumer 13 0.049 -0.507 -0.239Consumer 14 - - -Consumer 15 -0.276 -0.247 -0.575Consumer 16 0.477 -3.376 0.646Consumer 17 - - -Consumer 18 1.000 0.546 -0.099Consumer 19 1.000 8.376 -1.883Consumer 20 1.000 -4.641 -0.493
Table 6.12: Relative Demand Analysis for baked beans
OtlS
Consum er 1 Consumer 2
198
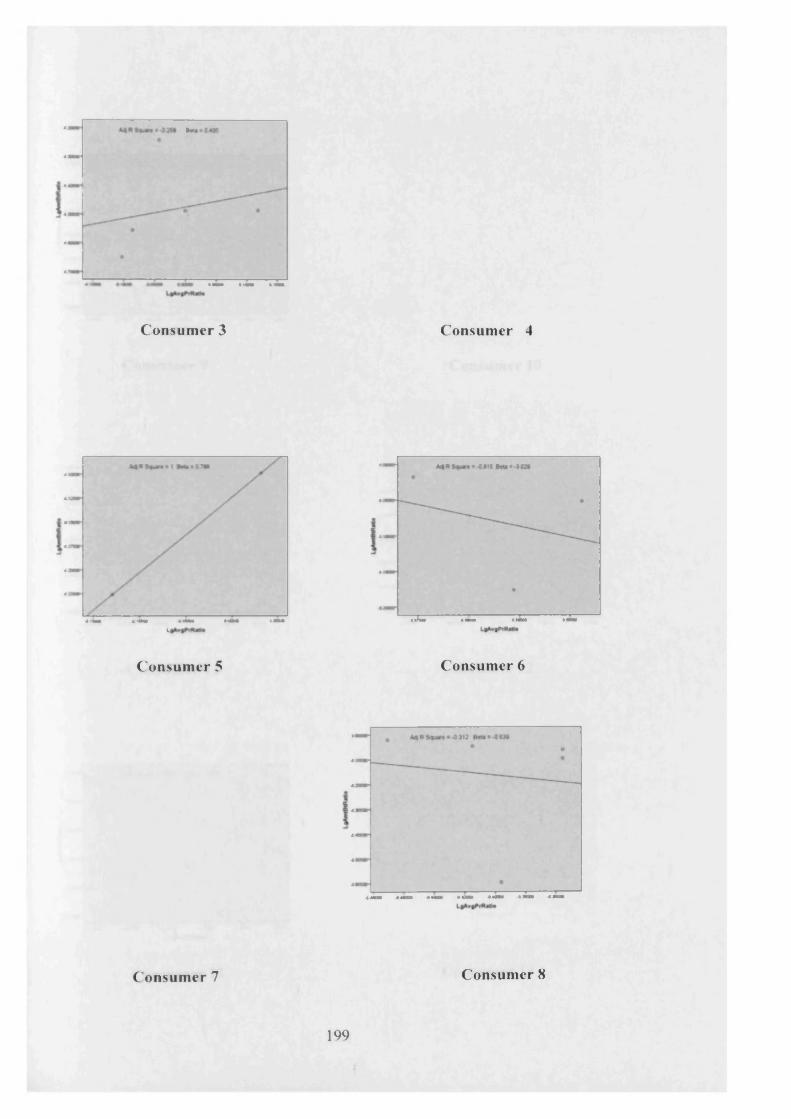
tot
•<
Consum er 3 Consumer 4
U
•<
Mi
M i
MI
Consum er 5 Consumer 6
C o n s u m e r 7 C o n su m er 8
199
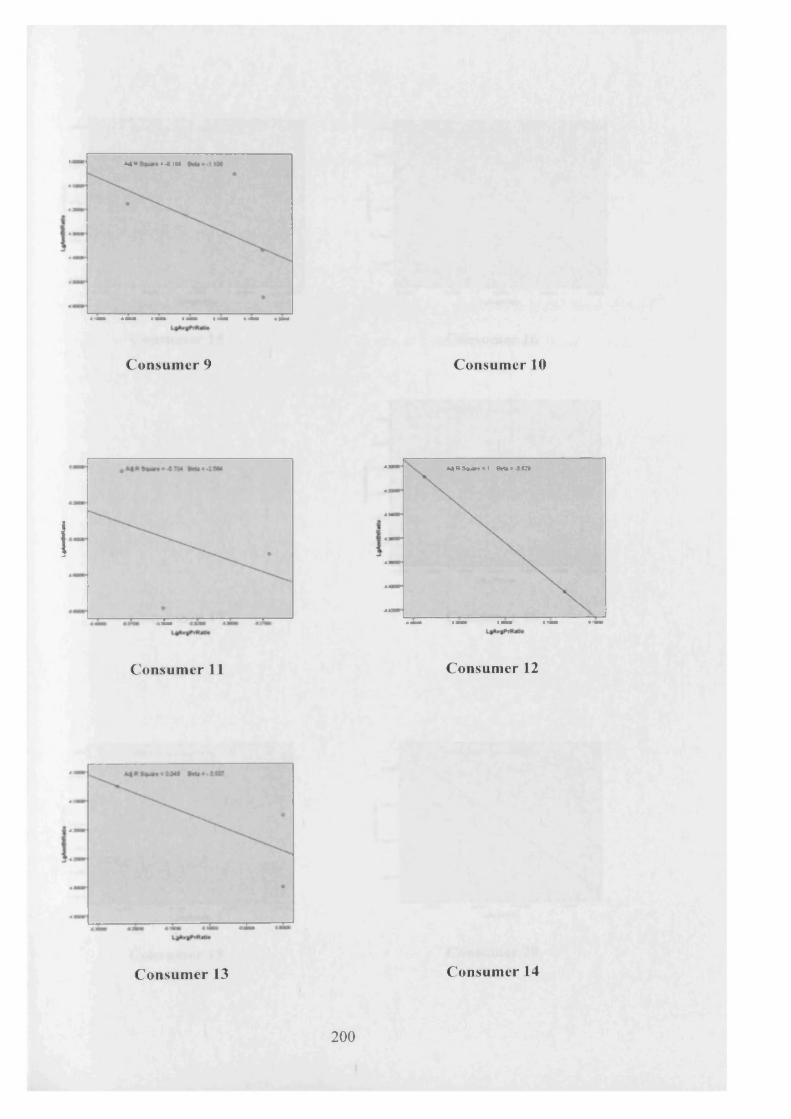
M * * -0 IC S
Consum er 9
I4«
rs=r
C onsum er 11
;c
C o n su m e r 13
Consumer 10
M |R S « n > l 9 * a M W
Consumer 12
C o n su m er 14
2 0 0
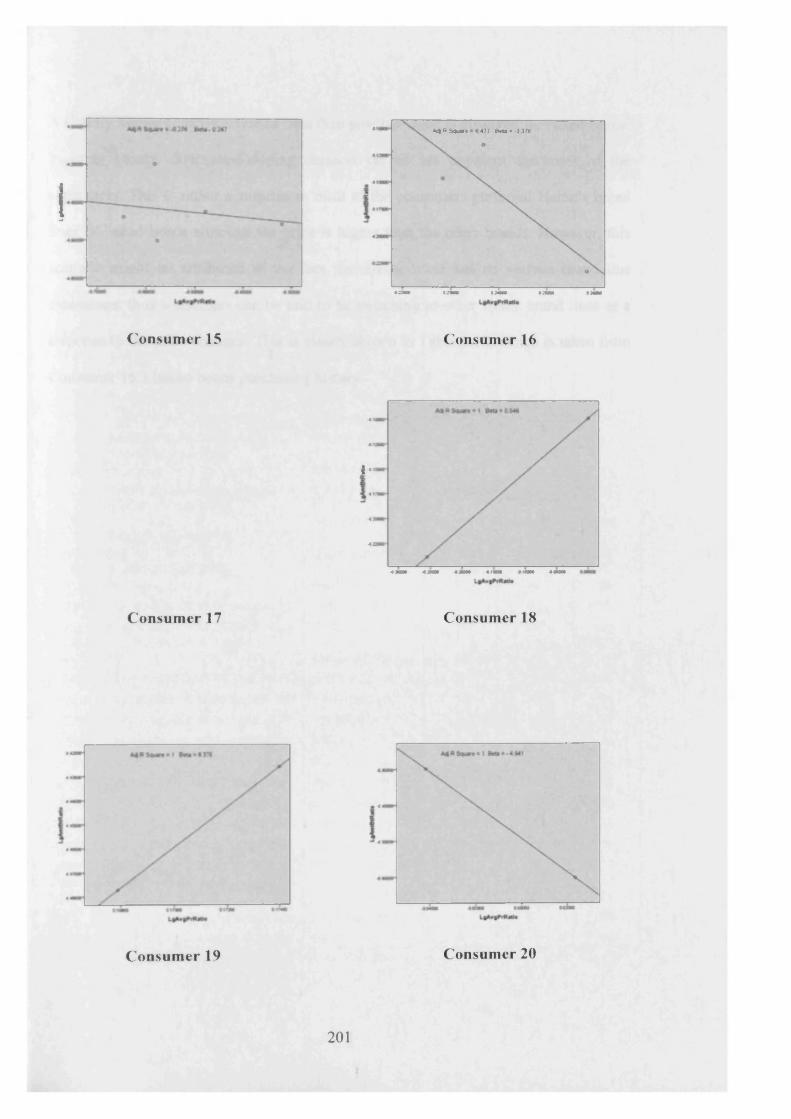
!M|R Square 047? B eta* .J370
C onsum er 15 Consumer 16
I
Consum er 17 Consumer 18
44
41
C o n s u m e r 19 C o n su m er 20
2 0 1

A slightly higher negative value o f Beta than positive value is observed for baked beans.
In other words, downward-sloping demand curves are apparent for most o f the
consumers. This iis rather a surprise as most o f the consumers preferred Heinz’s brand
lines o f baked beams although the price is higher than the other brands. However, this
scenario might be attributed to the fact that Heinz itself has its various brand line
extensions; thus consumers can be said to be switching to other Heinz brand lines as a
response to the price changes. This is clearly shown in Table 6.13, which is taken from
Consumer 16's baked beans purchasing history.
2 0 2

ITEM DESCRIPTION YYWW DESC PRICE
PER200gm
NOBOUGHT
TOTAL
SPEND
HEINZ BAKED BEANS WE 06-NOV-04 30 02 60HEINZ BAKED BEANS WE 16-APR-05 36 02 72HEINZ BAKED BEANS & CUMB SASAGE WE 29-JAN-05 46 01 46HEINZ BAKED BEANS IN TOM SCE WE 24-JUL-04 18 01 18HEINZ BAKED BEANS IN TOM SCE WE 3 1-JUL-04 18 01 18HEINZ BAKED BEANS IN TOM SCE WE I4-AUG-04 18 01 18HEINZ BAKED BEANS IN TOM SCE WE 02-OCT-04 18 01 18HEINZ BAKED BEANS IN TOM SCE WE 09-OCT-04 18 01 18HEINZ BAKED BEANS IN TOM SCE WE 04-DEC-04 18 01 18HEINZ BAKED BEANS IN TOM SCE WE 11-DEC-04 18 01 18
HEINZ BAKED BEANS IN TOM SCE WE 15-J AN-05 18 01 18
HEINZ BAKED BEANS IN TOM SCE WE 29-JAN-05 18 01 18
HEINZ BAKED BEANS IN TOM SCE HEINZ BAKED BEANS WITH
WE 26-MAR-05 21 01 21
SAUSAGES WE 14-AUG-04 42 01 42
HEINZ BAKED BEANS WITH SAUSAGES HEINZ BAKED BEANS WITH
WE 14-AUG-04 33 01 33
SAUSAGESHEINZ BAKED BEANS WITH
WE 21-AUG-04 33 01 33
SAUSAGESHEINZ BAKED BEANS WITH
WE 04-SEP-04 33 01 33
SAUSAGES WE 11-SEP-04 33 01 33
HEINZ BAKED BEANS WITH SAUSAGES WE 18-SEP-04 33 01 33
HEINZ BAKED BEANS WITH SAUSAGES HEINZ BAKED BEANS WITH
WE 25-SEP-04 33 02 66
SAUSAGES WE 06-NOV-O4 32 02 64
HEINZ BAKED BEANS WITH SAUSAGES WE 20-NOV-04 32 01 32
HEINZ BAKED BEANS WITH SAUSAGES WE 11-DEC-04 32 02 64
HEINZ BAKED BEANS WITH SAUSAGES WE 18-DEC-04 32 02 64
HEINZ BAKED BEANS WITH SAUSAGES WE 15-J AN-05 32 02 64
HEINZ BAKED BEANS WITH SAUSAGES WE 22-JAN-05 32 02 64
HEINZ BAKED BEANS WITH SAUSAGES WE 12-FEB-05 38 01 38
HEINZ BAKED BEANS WITH SAUSAGES WE 26-FEB-05 38 01 38
HEINZ BAKED BEANS WITH SAUSAGES WE 26-MAR-05 38 01 38
HEINZ BAKED BEANS WITH SAUSAGES WE 02-APR-05 38 02 76
HEINZ BAKED BEANS WITH SAUSAGES HEINZ BAKED BEANS WITH
WE 16-APR-05 38 01 38
SAUSAGES WE 16-APR-05 24 01 24
HEINZ BAKED BEANS WITH SAUSAGES WE 23-APR-05 38 01 38
HEINZ BAKED BEANS WITH SAUSAGES WE 23-APR-05 49 01 49
Table 6.13: Baked beans purchasing data of consumer 16
2 0 3
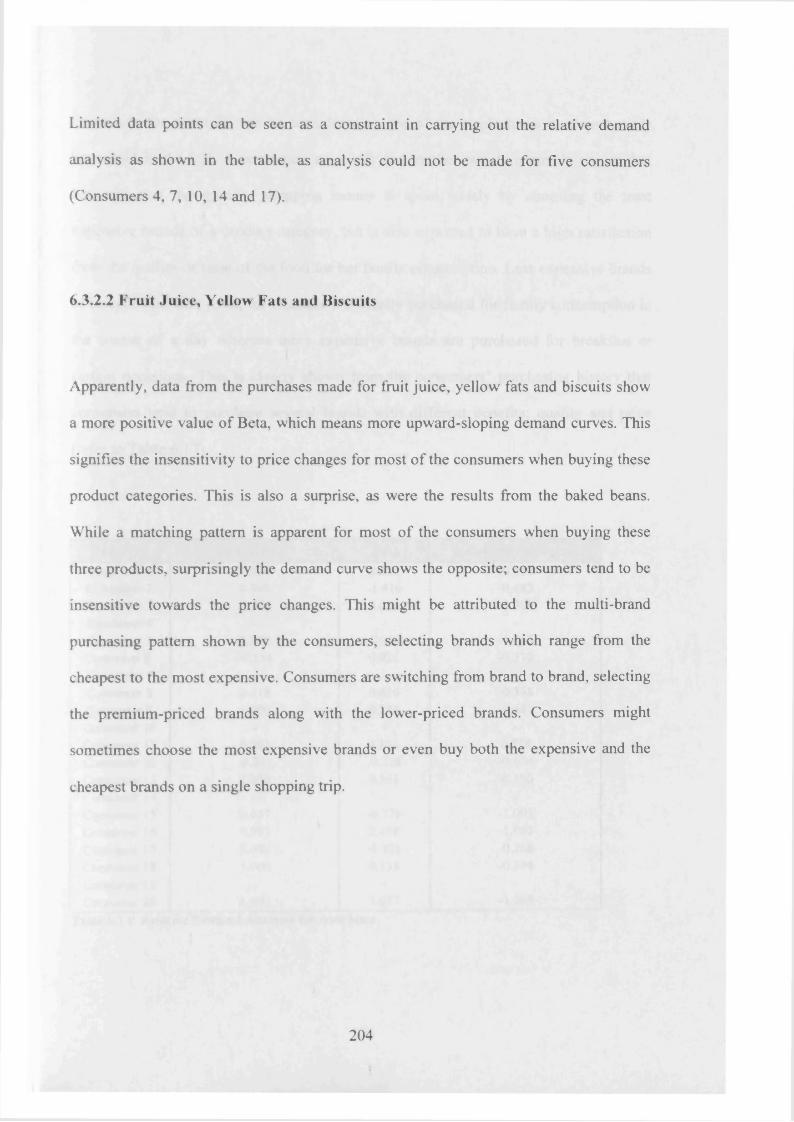
Limited data points can be seen as a constraint in carrying out the relative demand
analysis as shown in the table, as analysis could not be made for five consumers
(Consumers 4, 7, 10, 14 and 17).
6.3.2.2 Fruit Juice, Yellow Fats and Biscuits
Apparently, data from the purchases made for fruit juice, yellow fats and biscuits show
a more positive value o f Beta, which means more upward-sloping demand curves. This
signifies the insensitivity to price changes for most o f the consumers when buying these
product categories. This is also a surprise, as were the results from the baked beans.
While a matching pattern is apparent for most o f the consumers when buying these
three products, surprisingly the demand curve shows the opposite; consumers tend to be
insensitive towards the price changes. This might be attributed to the multi-brand
purchasing pattern shown by the consumers, selecting brands which range from the
cheapest to the most expensive. Consumers are switching from brand to brand, selecting
the premium-priced brands along with the lower-priced brands. Consumers might
sometimes choose the most expensive brands or even buy both the expensive and the
cheapest brands on a single shopping trip.
2 0 4
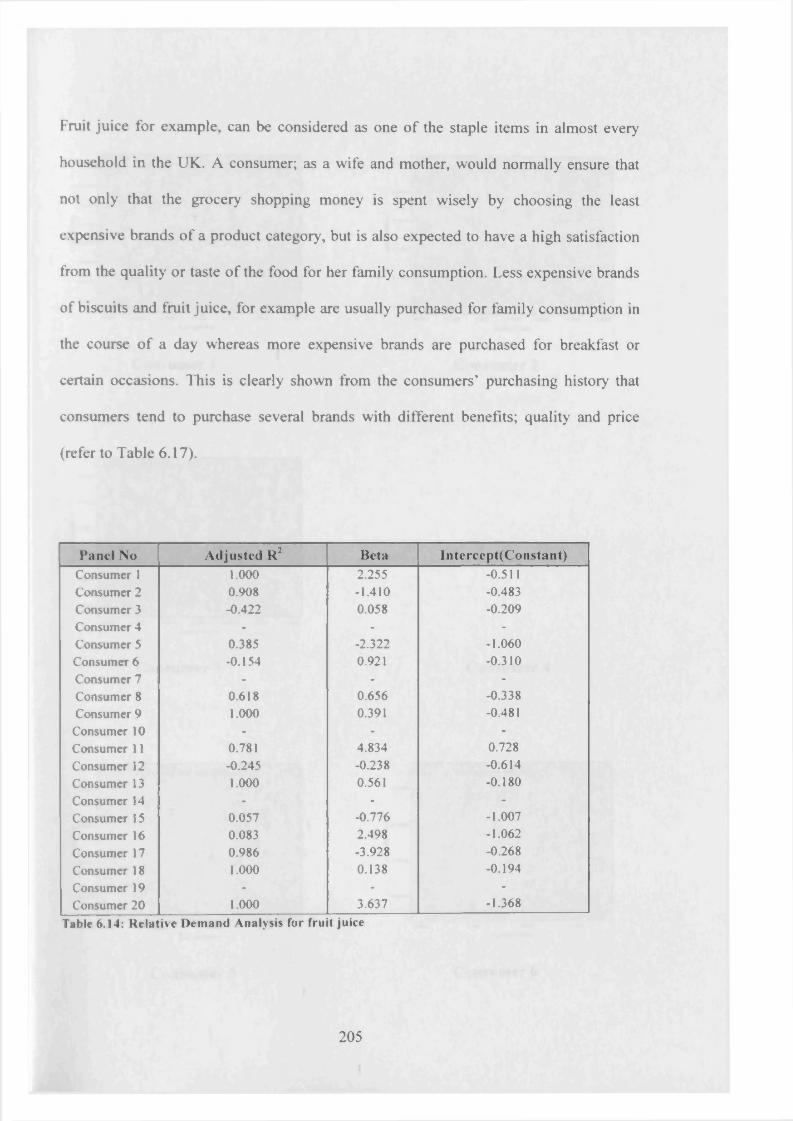
Fruit juice for example, can be considered as one o f the staple items in almost every
household in the UK. A consumer; as a wife and mother, would normally ensure that
not only that the grocery shopping money is spent wisely by choosing the least
expensive brands o f a product category, but is also expected to have a high satisfaction
from the quality or taste o f the food for her family consumption. Less expensive brands
of biscuits and fruit juice, for example are usually purchased for family consumption in
the course o f a day whereas more expensive brands are purchased for breakfast or
certain occasions. This is clearly shown from the consumers’ purchasing history that
consumers tend to purchase several brands with different benefits; quality and price
(refer to Table 6.17).
Panel No Adjusted R2 Beta Intercept(Constant)Consumer 1 1.000 2.255 -0.511Consumer 2 0.908 -1.410 -0.483Consumer 3 -0.422 0.058 -0.209Consumer 4 - - -Consumer 5 0.385 -2.322 -1.060Consumer 6 -0.154 0.921 -0.310Consumer 7 - - -Consumer 8 0.618 0.656 -0.338Consumer 9 1.000 0.391 -0.481Consumer 10 - - -Consumer 11 0.781 4.834 0.728Consumer 12 -0.245 -0.238 -0.614Consumer 13 1.000 0.561 -0.180Consumer 14 - - -Consumer 15 0.057 -0.776 -1.007Consumer 16 0.083 2.498 -1.062Consumer 17 0.986 -3.928 -0.268Consumer 18 1.000 0.138 -0.194Consumer 19 - - -Consumer 20 1.000 3.637 -1.368
Table 6.14: Relative Demand Analysis for fruit juice
2 0 5
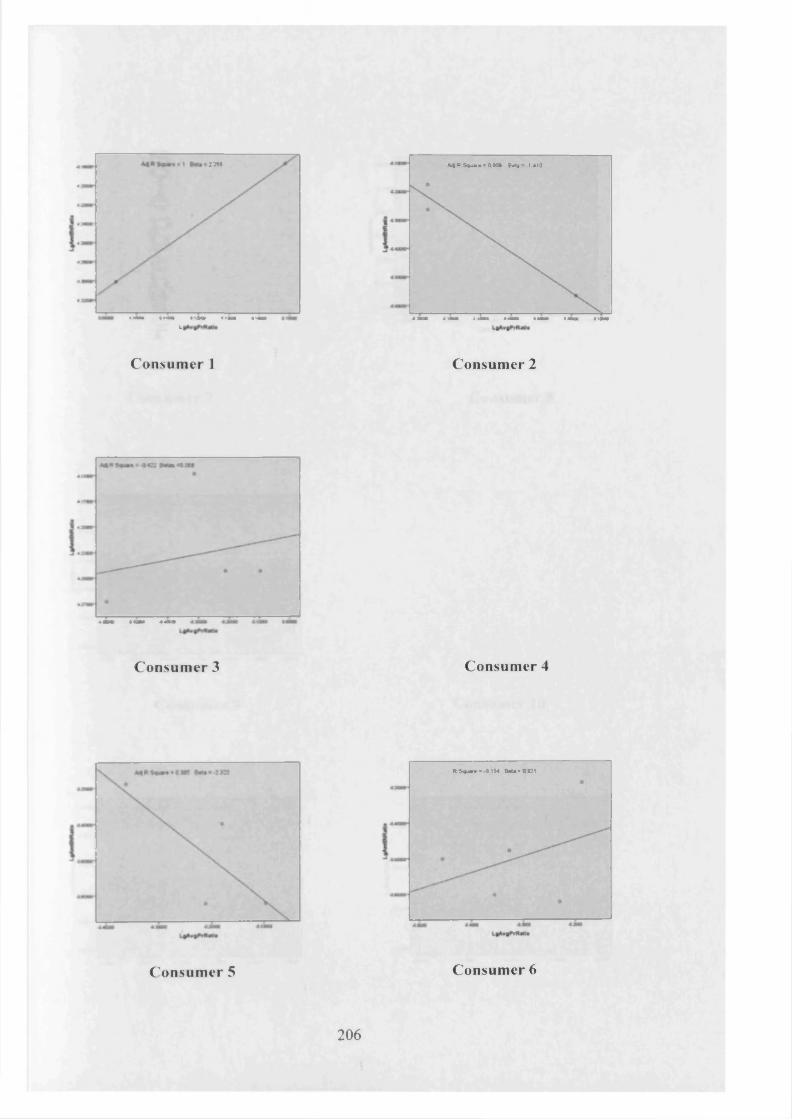
23U
U
Consumer 1
A* B S * » « s 3 90« B « ta --I 4I«
Consumer 2
Consum er 3 Consumer 4
« $ < * » » « O IM 8 « u * O I2 l
C o n s u m e r 5 C o n su m er 6
2 0 6
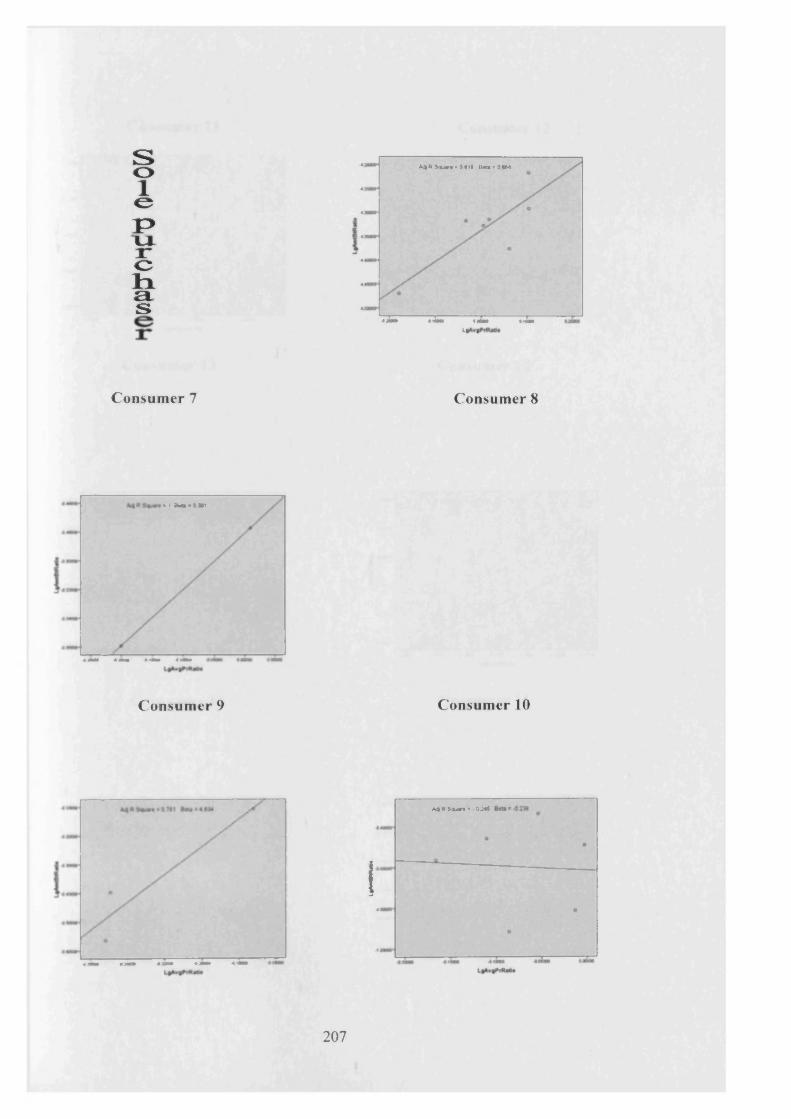
s01
&F>u irch ias
« 4 f t * * a r « > 0 a t l B«t» * D IM
U
Consum er 7 Consumer 8
*i »*>iat
C onsum er 9 Consumer 10
A4RS««*?. OXS
I41
2 0 7

Consumer 11 Consumer 12
Consumer 13 Consumer 14
M ** S o u r* * o on
Consumer 15 Consumer 16
OIM
2 0 8
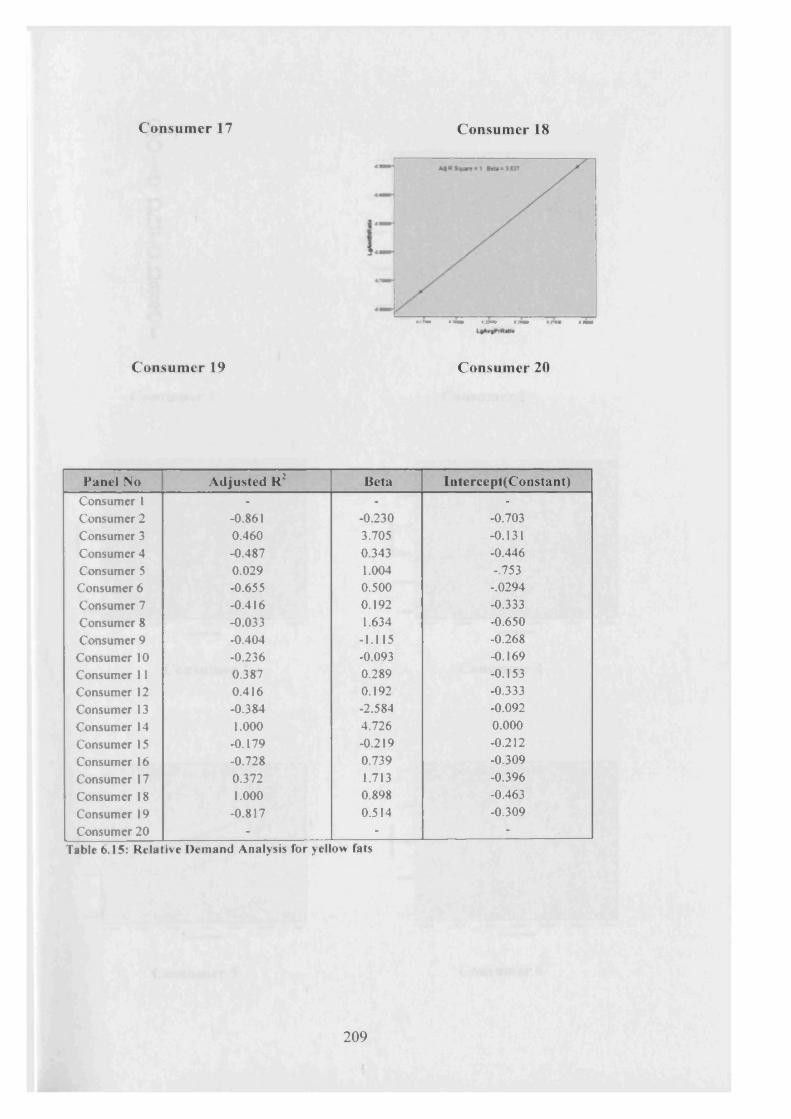
C onsum er 17 Consumer 18
Consum er 19
Panel No Adjusted R2 Beta Intercept(Constant)Consumer 1 - - -Consumer 2 -0.861 -0.230 -0.703Consumer 3 0.460 3.705 -0.131Consumer 4 -0.487 0.343 -0.446Consumer 5 0.029 1.004 -.753Consumer 6 -0.655 0.500 -.0294Consumer 7 -0.416 0.192 -0.333Consumer 8 -0.033 1.634 -0.650Consumer 9 -0.404 -1.115 -0.268Consumer 10 -0.236 -0.093 -0.169Consumer 11 0.387 0.289 -0.153Consumer 12 0.416 0.192 -0.333Consumer 13 -0.384 -2.584 -0.092Consumer 14 1.000 4.726 0.000Consumer 15 -0.179 -0.219 -0.212Consumer 16 -0.728 0.739 -0.309Consumer 17 0.372 1.713 -0.396Consumer 18 1.000 0.898 -0.463Consumer 19 -0.817 0.514 -0.309Consumer 20 - - -
Table 6.15: Relative Demand Analysis for yellow fats
Consumer 20
2 0 9
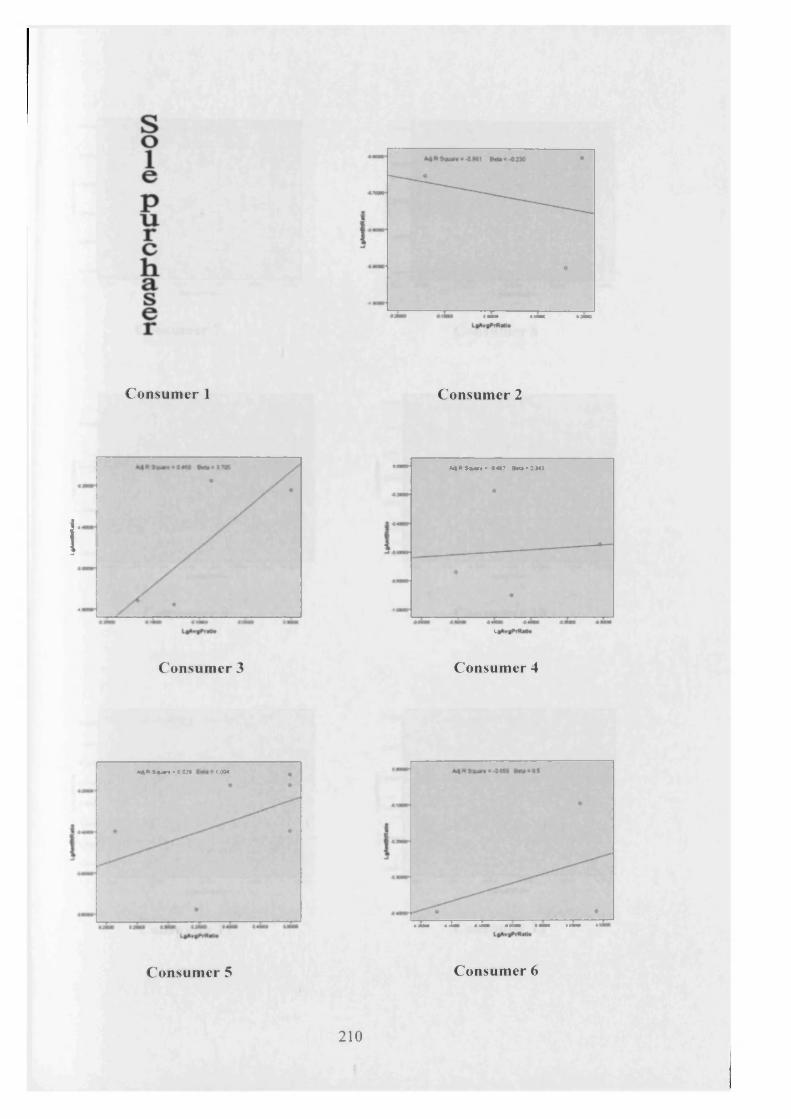
C onsum er 1 Consumer 2
fa
Consum er 3
A*R$«Mr«3-04t7 a*0‘9MJ
L(
Consumer 4
M«Sun>tUt 1004
4 M T S m T Z m *m m imam I M r
C o n su m e r 5 C o n su m er 6
2 1 0
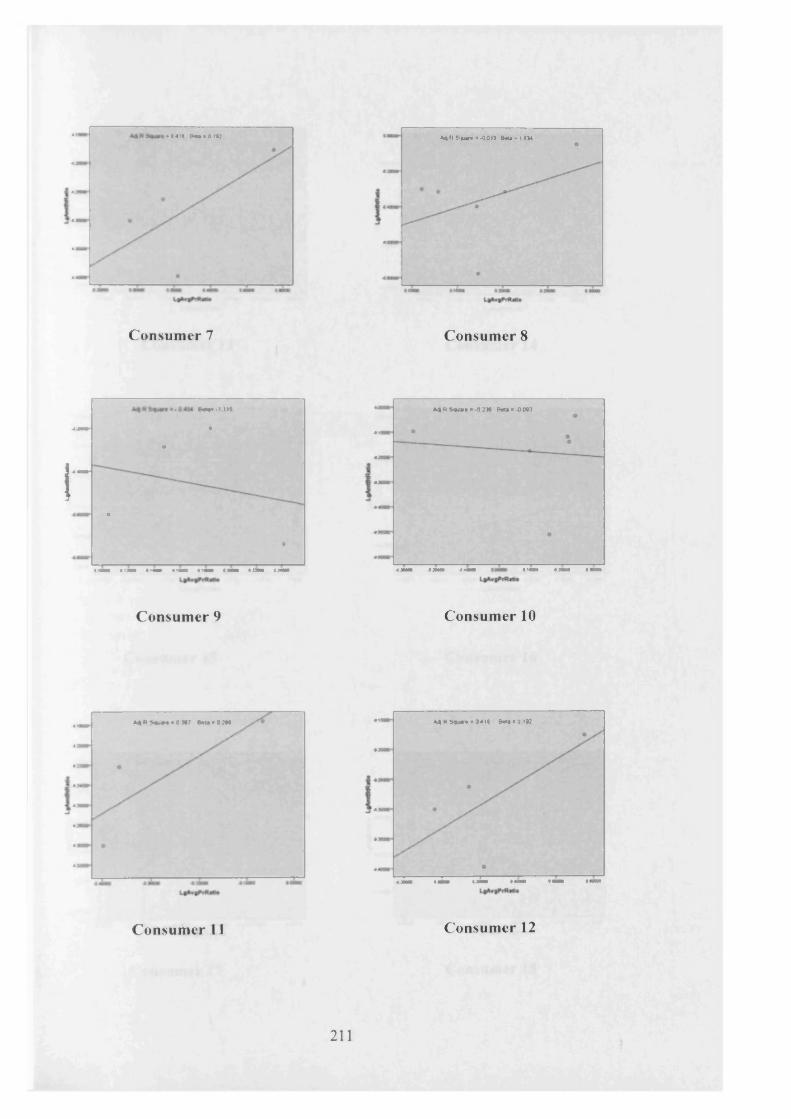
»•«>« Muoic *4 *» S<*»« * -0 OH fttt- 'liK
41
Consumer 7 Consumer 8
t a t s m i
— ••
r5•
•
Consumer 9
*4 K Soar* » a TJS B4t4>-00«
Consumer 10
* « > * » » < * • * 9 4 1 * B ^ i r f l l K*4 *» »**»• * 0 m htt'IIM
Consumer 11 Consumer 12
2 1 1

A4fc$*ar«>-01»4 &rtas.2S*
«i
Consum er 13 Consumer 14
H* » S * u » t * -0 TM B * U * l)7 3 S
Consum er 15 Consumer 16
• i m « 4 R S « jv * * I Bm 3 CM
C o n su m e r 17 C o n su m er 18
2 1 2

0 5 U
Consumer 19 Consumer 20
Panel No Adjusted R2 Beta Intercept(Constant)Consumer 1 -0.338 0.410 -0.848Consumer 2 -0.139 -0.608 -0.728Consumer 3 0.992 1.473 -0.153Consumer 4 1.000 -0.892 -1.274Consumer 5 0.968 1.401 -0.792Consumer 6 0.084 -0.808 -0.311Consumer 7 - - -Consumer 8 0.616 1.688 -0.167Consumer 9 -0.405 0.536 -1.011Consumer 10 -0.232 -0.321 -0.231Consumer 11 -0.873 0.517 -0.783Consumer 12 -0.500 -0.030 -0.805Consumer 13 - - -Consumer 14 0.635 -1.548 -0.530Consumer 15 0.228 1.095 -1.028Consumer 16 - - -Consumer 17 -0.216 0.765 -0.517Consumer 18 -0.462 0.141 -0.658Consumer 19 -0.003 0.870 -0.517Consumer 20 1.000 1.044 -0.699
Table 6.16: Relative Demand Analysis for biscuits
2 1 3

Biscuits
• mam' 8 « O * 0 4 t0 o
%
I -I M
4 M V
1 « «>«M < « ■ « M * CNHt
Consumer 1
**RS«uWt*-OI» B*j = -0 606---^ °
“ “ \
r • —i —
0
LfAvffPrftiOo
Consumer 2
• MC Bm*I4T1 1
41
Consumer 3 Consumer 4
M » sm > 8 M om
9 CM
C o n s u m e r 5 C o n su m er 6
2 1 4
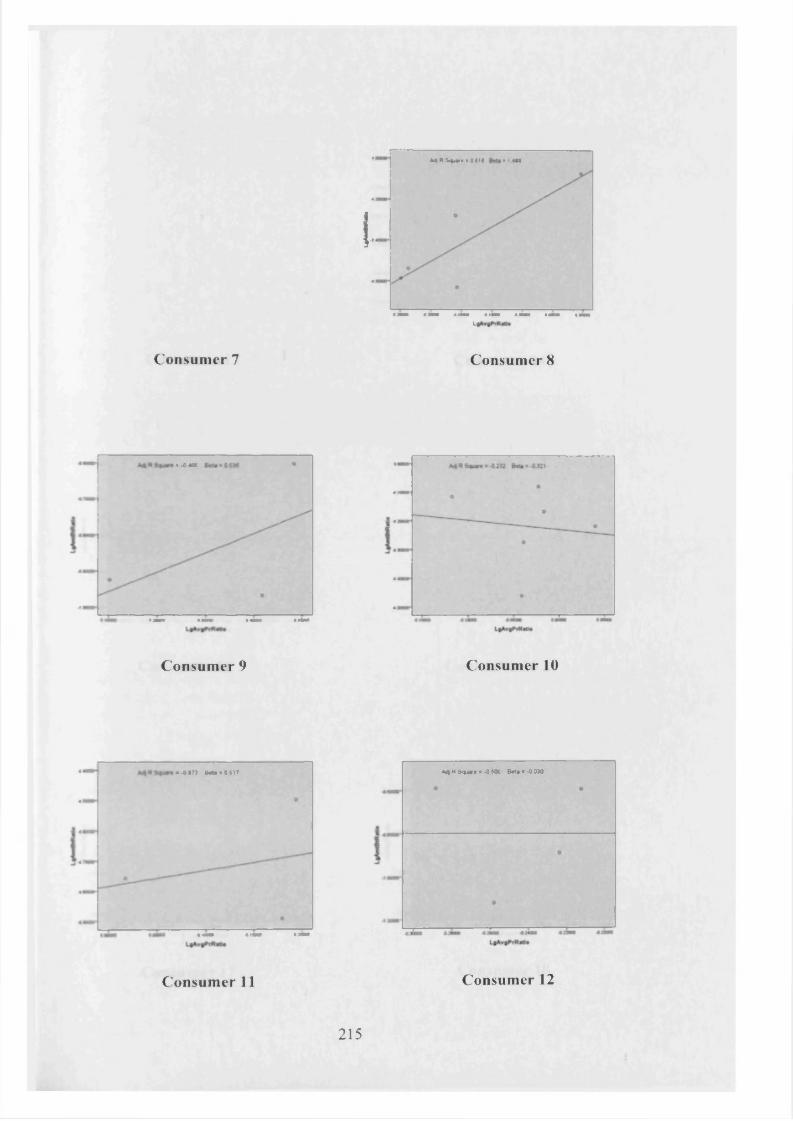
Consumer 7
>-««K
Consum er 9
•i AU|RS t*0«l« « t6M
4:
I .
41
M
Consumer 8
Consumer 10
■ -4IM M a« e ttr
C o n s u m e r 11
*4 R S*i»« * -0 500 B«U * -0 0J0
C o n su m er 12
2 1 5

Consum er 13
C onsum er 15
MOW#4
!
C o n s u m e r 17
* 4 R )W M > 0 f lS B«U>.1S4«
Consumer 14
Consumer 16
So>jr«* 0 4C: Ektj * 9 Ml
tmm- •
r!•
•
4 M I u i a t a n «aiua « ] i n «<«■ i m l+.+rmm li
Consumer 18
2 1 6

M *» • -o oo» B*>* * o>70
I
Consumer 19 Consumer 20
Biscuits Freq
Avg
price
ASDA BOURBON CREAMS 5 0.25ASDA SMARTPRICE GINGER NUTS 2 0.17AS KEYS CORNETS ROUND 1 1.99CORSINI AMARETTIMORBIDI 1 1.59DOR LA ITALIAN RATAFIAS 1.32FOXS BRANDY SNAPS 1 1.96HANS FREITAG DESIREE 1 0.50JACOBS LEMON PUFF 1 0.69LOACKER QUADRATINI WAFERS KAKO I 0.87MAS ST MICHAEL CURLS 1 1.60MARYLAND COOKIES CHOC CHIP 1 0.77MCVITIES BOASTERS CHOC A HAZELNUT 1.38ASDA SM ARTPRICE RICH TEA 1 0.25ASDA SM ARTPRICE DIGESTIVE I 0.20CORSINI CANTUCCINI BISCUITS ALMND 1.43FOXS GINGER SNAPS 1 0.46FOXS GINGER CRINKLE CRUNCH 1 0.39MAS ST MICHEAL DUTCH SHORTCAKE 1 1.33MCVITIES BOASTERS CHOC CHIP 1 1.27MCVITIES GOLD SYRUP CREAM 1 0.60MCVITIES GINGER NUTS 1 0.43MCVITIES RICH TEA 1 0.32
Table 6.17: Biscuits purchasing (Consumer 5)
2 1 7

6 33 Maximisation
As this research applies individual analysis, it is to be noted that the data points tend to
be scattered rather than clustered vertically, as shown by the aggregate analysis.
Nevertheless, the data points can still be clearly seen as to be either on the right or left
of the 0.5 mark to indicate whether the consumer maximises or vice versa. Most of the
consumers can be seen as maximising when purchasing all the four product categories,
indicating that the consumers choose the cheapest brand, which is consistent with the
behavioural economics approach pioneered by Hermstein and Loveland (1975). For
baked beans, however, since an under-matching pattern was found for most of the
consumers indicating that the premium-priced brand (Heinz) is preferred, it is obvious
that the consumers are not maximising the monetary value as they do not choose the
cheapest brands available. The maximisation pattern found for baked beans indicates
that consumers in reality do not maximise solely on monetary values. Instead, there are
other factors that are being maximised by the consumers such as the informational
reinforcement that is often offered through branding (taste, quality, satisfaction, etc). It
has been suggested by Foxall et al (2004) that consumers maximise some combination
of utilitarian and informational reinforcement; this is discussed in more detail in
• 2 / ybehavioural perspective model section in this chapter. The adjusted R ranges from
negative values to 1.
218
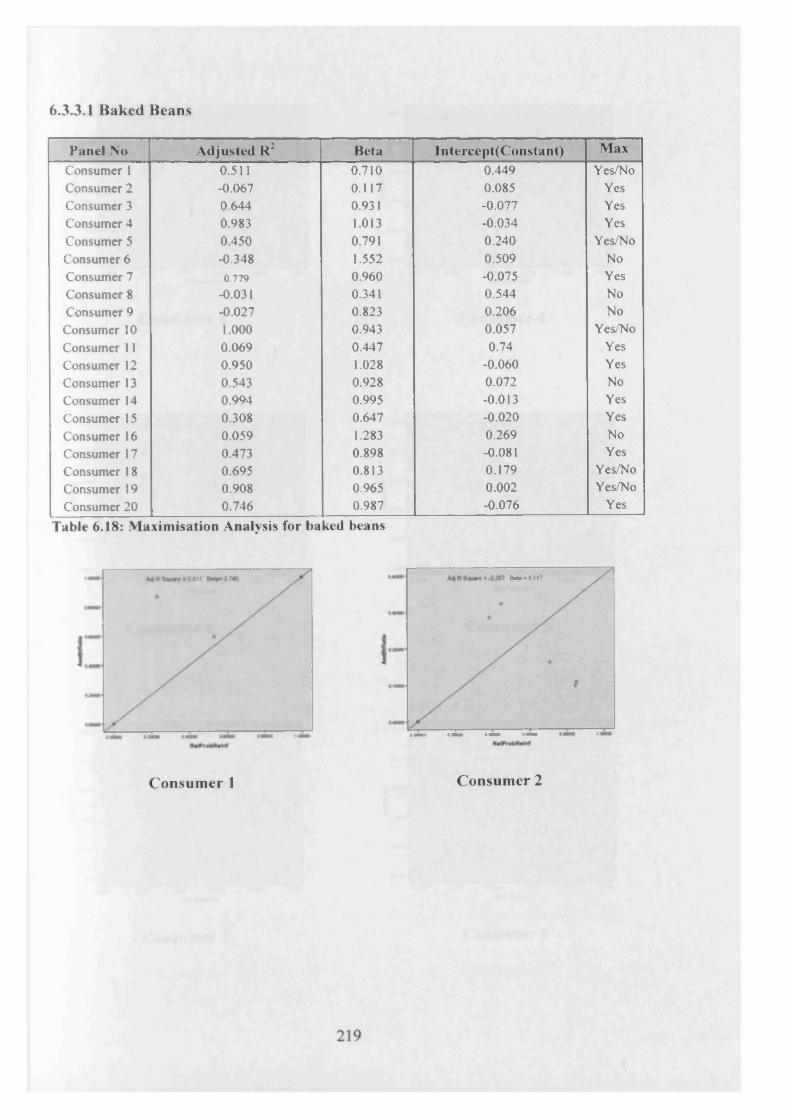
6.3.3.1 B aked Beans
Panel No Adjusted R2 Beta Intercept(Constant) Max
Consumer I 0.511 0.710 0.449 Yes/NoConsumer 2 -0.067 0.117 0.085 YesConsumer 3 0.644 0.931 -0.077 YesConsumer 4 0.983 1.013 -0.034 YesConsumer 5 0.450 0.791 0.240 Yes/NoConsumer 6 -0.348 1.552 0.509 NoConsumer 7 0.779 0.960 -0.075 YesConsumer 8 -0.031 0.341 0.544 NoConsumer 9 -0.027 0.823 0.206 NoConsumer 10 1.000 0.943 0.057 Yes/NoConsumer 11 0.069 0.447 0.74 YesConsumer 12 0.950 1.028 -0.060 YesConsumer 13 0.543 0.928 0.072 NoConsumer 14 0.994 0.995 -0.013 YesConsumer 15 0.308 0.647 -0.020 YesConsumer 16 0.059 1.283 0.269 NoConsumer 17 0.473 0.898 -0.081 YesConsumer 18 0.695 0.813 0.179 Yes/NoConsumer 19 0.908 0.965 0.002 Yes/NoConsumer 20 0.746 0.987 -0.076 Yes
Table 6.18: Maximisation Analysis for baked beans
&*»«<> 117
Consumer 1 Consumer 2
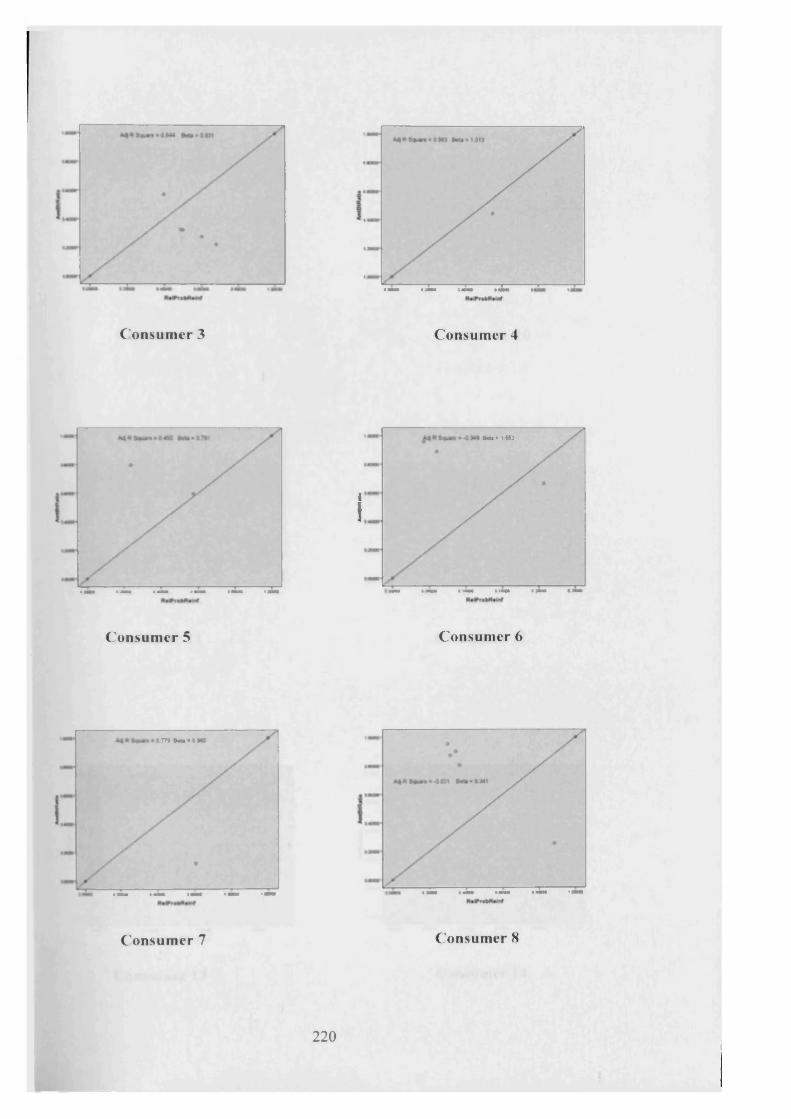
Consumer 3 Consumer 4
Consumer 5
B«U ■ I WJ
i1
7mm
Consumer 6
im »M>9M
C o n su m e r 7 C o n su m er 8
2 2 0

Consumer 9
0M1
Consumer 10
cm
Consumer 11
*4 * Squ** * 0 MO
Consumer 12
*4e »»<«•• oB<u<gns
C o n su m e r 13 C o n su m er 14
2 2 1
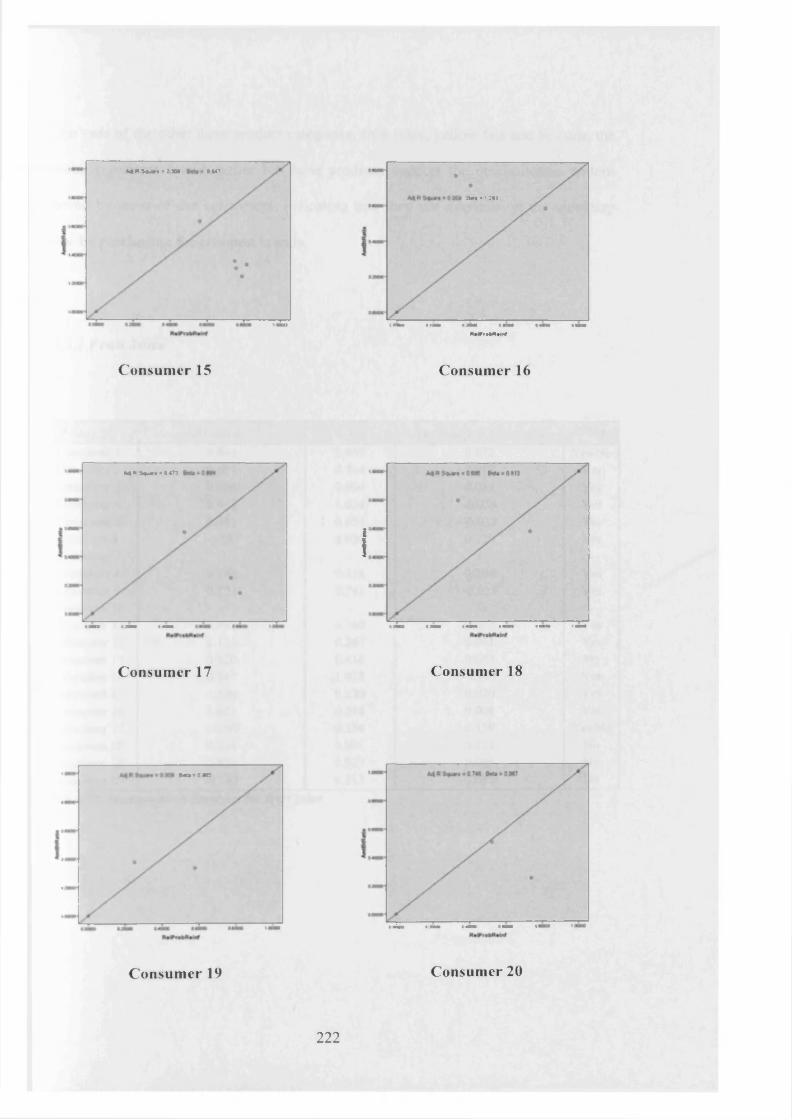
<4Rto«>0M 44*T
■=T
Consumer 15
9 « a > i3 t)
IU*t—**rl
Consumer 16
«4 * * •< * • » 447)
Consumer 17
1i
Consumer 18
Nl'CW
C o n su m er 19 C onsum er 20
2 2 2
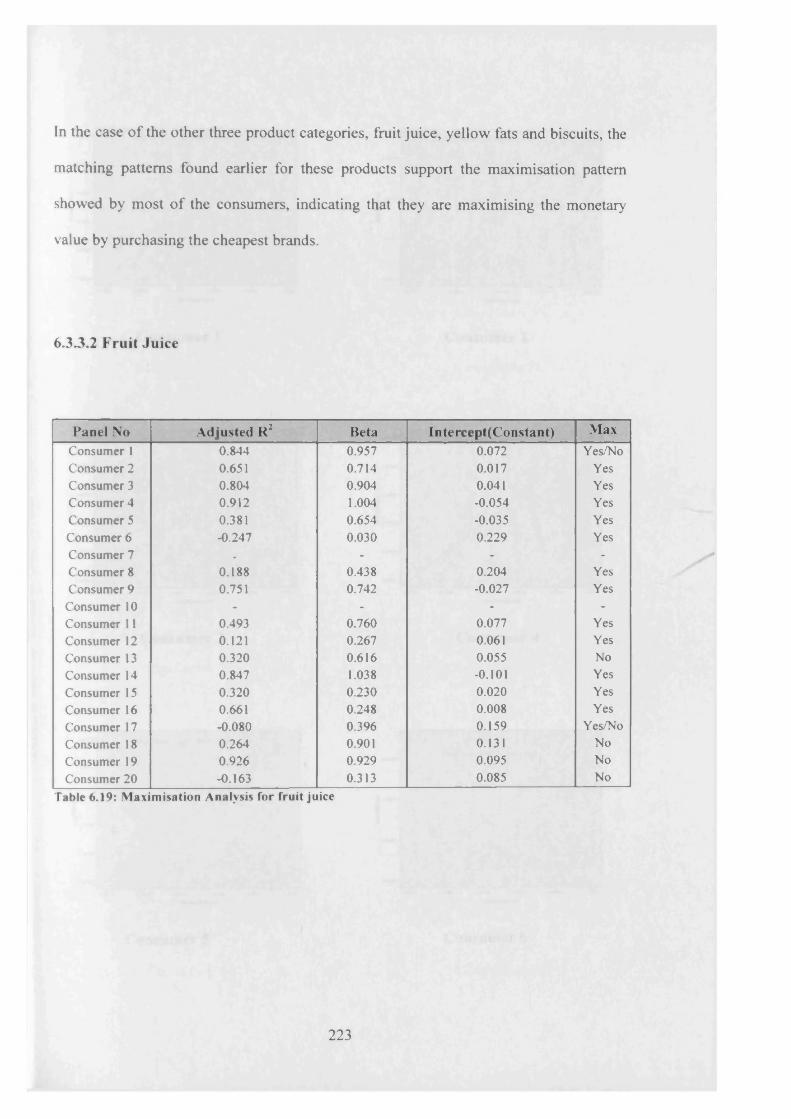
In the case o f the other three product categories, fruit juice, yellow fats and biscuits, the
matching patterns found earlier for these products support the maximisation pattern
showed by most o f the consumers, indicating that they are maximising the monetary
value by purchasing the cheapest brands.
6.33.2 Fruit Juice
Panel No Adjusted R : Beta Intercept(Constant) MaxConsumer 1 0.844 0.957 0.072 Yes/NoConsumer 2 0.651 0.714 0.017 YesConsumer 3 0.804 0.904 0.041 YesConsumer 4 0.912 1.004 -0.054 YesConsumer 5 0.381 0.654 -0.035 YesConsumer 6 -0.247 0.030 0.229 YesConsumer 7 . - - -Consumer 8 0.188 0.438 0.204 YesConsumer 9 0.751 0.742 -0.027 Yes
Consumer 10 - - - -Consumer 11 0.493 0.760 0.077 YesConsumer 12 0.121 0.267 0.061 YesConsumer 13 0.320 0.616 0.055 NoConsumer 14 0.847 1.038 -0.101 YesConsumer 15 0.320 0.230 0.020 YesConsumer 16 0.661 0.248 0.008 YesConsumer 17 -0.080 0.396 0.159 Yes/NoConsumer 18 0.264 0.901 0.131 NoConsumer 19 0.926 0.929 0.095 NoConsumer 20 -0.163 0.313 0.085 No
Table 6.19: Maximisation Analysis for fruit juice
2 2 3
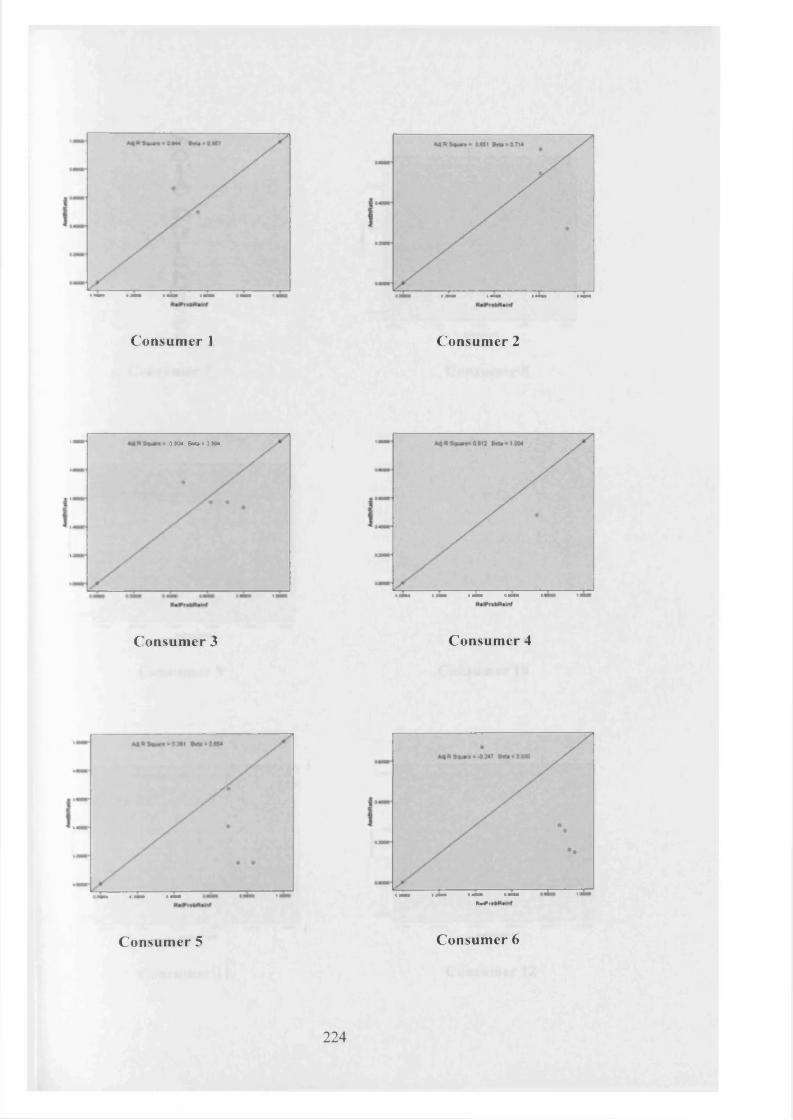
S ’
Consumer 1 Consumer 2
= 290* B n - l i M
Consumer 3 Consumer 4
C o n su m er 5
iu*r
C onsum er 6
2 2 4
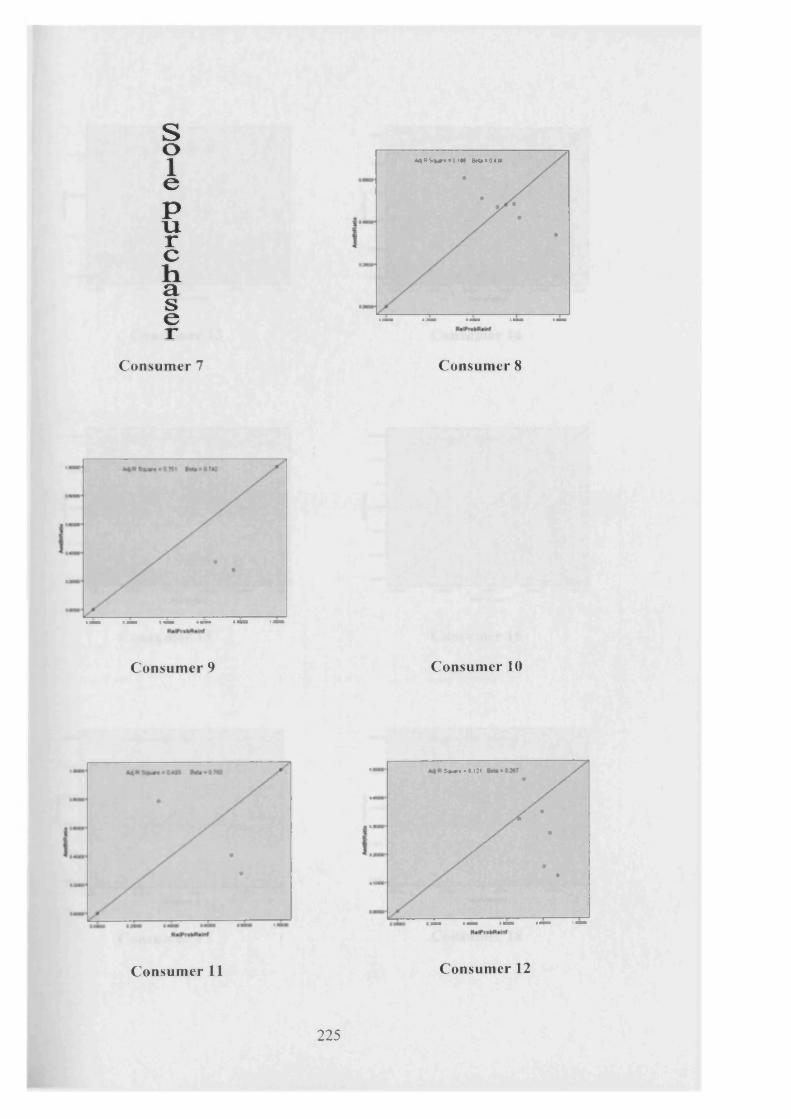
s01e Purchas er
* 4 R S « a rt< O I« l B«to*OOI
Consumer 7 Consumer 8
Consumer 9 Consumer 10
s«wr. • 0 i:i
C o n su m er 11 C onsum er 12
2 2 5

Consumer 13
M R Soar* * 0**7 I 03C
Consumer 14
Consumer 15
DM
Consumer 16
C o n su m er 17
MfiSnwoOMI
C onsum er 18
2 2 6

<4KSvn>4lU ■O-JtJ
Consumer 19 Consumer 20
6J.3 .3 Yellow Fats
Panel No Adjusted R2 Beta Intercept(Constant) Max
Consumer 1 - - - -Consumer 2 0.453 0.592 -0.046 YesConsumer 3 0.113 0.565 0.123 YesConsumer 4 0.095 0.268 0.056 YesConsumer 5 -0.184 -0.136 0.483 NoConsumer 6 0.648 0.812 0.036 YesConsumer 7 -0.190 0.233 0.398 NoConsumer 8 -0.194 0.088 0.383 NoConsumer 9 0.152 0.397 0.080 YesConsumer 10 0.078 0.474 0.447 NoConsumer 11 0.290 0.746 0.158 NoConsumer 12 -0.194 0.233 0.409 NoConsumer 13 0.274 0.439 0.063 YesConsumer 14 0.512 0.697 -0.006 YesConsumer 15 -0.132 0.192 0.457 YesConsumer 16 -0.208 0.292 0.153 Yes/NoConsumer 17 0.401 0.772 -0.045 YesConsumer 18 0.638 0.822 0.070 Yes/NoConsumer 19 0.458 0.694 0.279 NoConsumer 20 0.661 1.001 0.099 No
Table 6.20: Maximisation Analysis Tor yellow Tats
2 2 7

Yellow Fats
s01e
I PI XT~CIx a s e r
Consumer 1
* 4 * > S « * r« * 0 4 S ) B * U * 0 S «
Consumer 2
• 024*
Consumer 3 Consumer 4
mm
■ 0*12<4R4Mri>0M
C o n su m er 5 C on su m er 6
2 2 8

Consumer 7
Consumer 9
*a»S«**M--0 1W B*4»0M»
Consumer 8
*<» » - 0 O’* 0474
Consumer 10
MI»«4n<IM
C o n su m e r 11
M»sww>.3tto ewu*om
C o n su m er 12
2 2 9
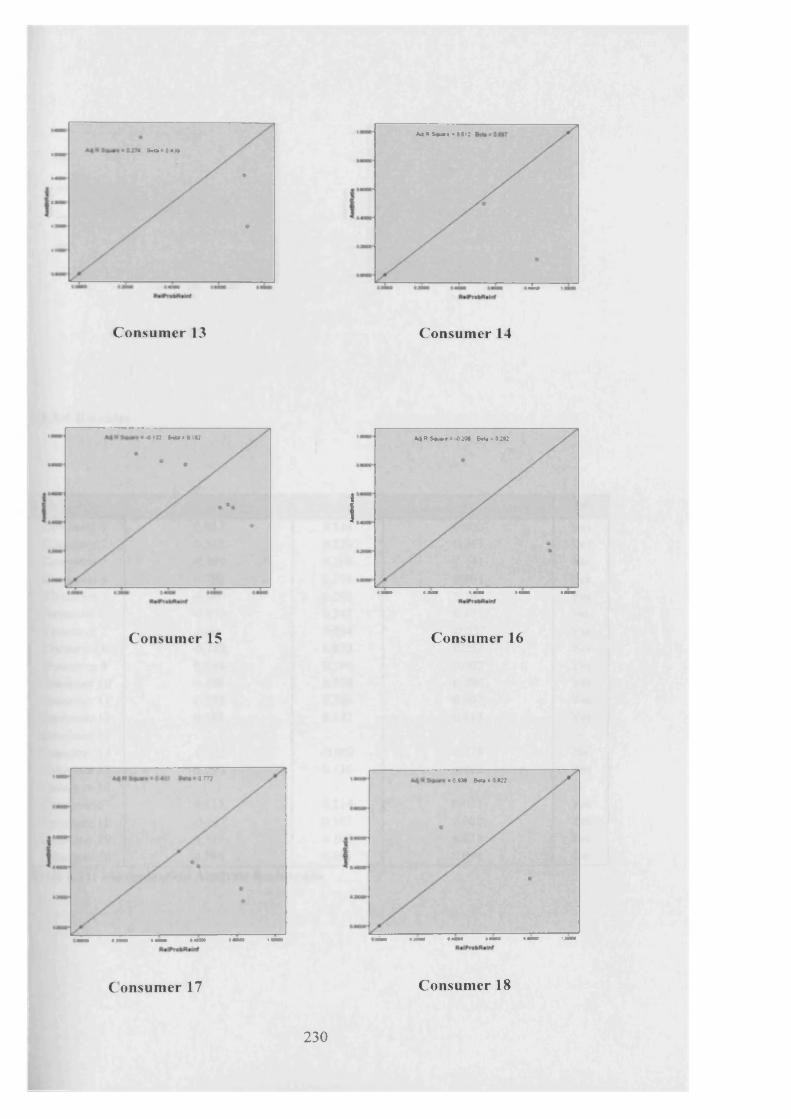
» r ta > 3 4 »
m « s»j»« *«st;
127
Consumer 13 Consumer 14
-4 tJC M > t l 8
Consumer 15
A4» 5 o u « t- 0 : « 6* 4 * 0 :® :
i1
Consumer 16
orrj »0«M B * a * 0 * »
C o n su m e r 17 C o n su m er 18
230

M«S*»«>04U hmtw i 001
Consumer 19 Consumer 20
6.3.3.4 Biscuits
Panel No Adjusted R2 Beta Intercept(Constant) Max
Consumer I 0.887 0.144 0.002 YesConsumer 2 0.375 0.229 0.041 YesConsumer 3 -0.090 0.268 0.141 NoConsumer 4 0.780 0.101 0.001 YesConsumer 5 -0.067 0.295 0.162 YesConsumer 6 -0.015 0.347 0.471 NoConsumer 7 0.901 0.934 -0.037 YesConsumer 8 -0.188 0.073 0.252 YesConsumer 9 0.544 0.190 0.007 Yes
Consumer 10 0.198 0.578 0.296 YesConsumer 11 0.593 0.260 0.007 YesConsumer 12 0.389 0.182 0.013 YesConsumer 13 - - - -Consumer 14 -0.333 -0.002 0.378 NoConsumer 15 0.290 0.136 0.022 YesConsumer 16 - - - -
Consumer 17 0.215 0.214 0.021 YesConsumer 18 -0.111 0.167 0.080 YesConsumer 19 0.351 0.198 0.019 Yes
Consumer 20 0.206 0.491 0.094 No
Table 6.21: Maximisation Analysis for biscuits
2 3 1

0M7
Consumer 1
*4 R - o3T5 e .u ‘ o : ^
Consumer 2
• y /•
— /
/%
— x
Consumer 3
s« « r« - o n o B«u * a 101
Consumer 4
• •
C o n su m er 5
A *R $«■ * * « -0 SIS e * b * 0 M T
3?R«*r»WUlnf
C onsum er 6
2 3 2

S*MT* <0901 f r r U * 0 » 4
Consumer 7
* * R $ 4 u a r» : -0 IM & tu - 3 0TJ
Consumer 8
Consumer 9
ii
1ST
Consumer 10
C o n su m er 11
M»$**•» 0W
ItrtPrvfcfUlftf
C onsum er 12
2 3 3

Consumer 13
OIM
Consumer 15
Consumer 14
Consumer 16
C o n su m er 17 C onsum er 18
2 3 4

Consumer 19 Consumer 20
The adjusted R2 value for the maximisation analysis carried out for all the product
categories ranges from negative values to 1. It is to be noted that this study adopts
proportional calculation (A /A + B) following Hermstein (1961), as opposed to Baum’s
(1974) ratio calculations (A / B ). Furthermore, the individual analysis that was carried
out in this study meant that there would be cases with very few data points. The
analyses, especially the maximisation analysis, show scattered data points in almost all
the graphs rather than a cluster o f data points located vertically either to the right or left
of the 0.5 mark, as was shown in earlier research by Foxall and colleagues (Foxall and
James, 2001, Foxall and James, 2003, Foxall and Schrezenmaier, 2003, Foxall et al.,
2004, Oliveira-Castro et al., 2005, Oliveira-Castro et al., 2006). There are even cases
where the same amount o f data points are located at both the right and left of the 0.5
mark, which were recorded as yes/no in the tables, indicating that the consumers’ price
sensitivity changes between the months.
2 3 5

6.4 Previous Research
It is necessary to understand that earlier research on consumers’ brand choice, applying
the behavioural economic approach was analysed aggregately. The earliest research was
carried out with a small group of 9 consumers who had purchased 16 products, and the
results showed ideal matching, some downward-sloping relative demand curves and a
tendency toward maximisation (Foxall and James, 2001, Foxall and James, 2003).
Consumers were found to be involved in multi-brand purchasing and purchased within
their repertoire set o f brands. Only some of the consumers were found to maximise and
to prefer the least expensive brands. Occasionally, these consumers tended to purchase
more expensive brands along with the cheaper ones on the same shopping trip.
The second study was carried out with a larger sample (80 consumers), purchasing 9
products (Foxall and Schrezenmaier, 2003). The results confirmed the earlier study
showing matching patterns and some downward-sloping demand and maximisation.
Again, multi-brand purchasing and selecting within a repertoire o f brands were found.
A third study was conducted with a large sample (1500 consumers), who bought 3
products (Foxall and James, 2006). Strong matching patterns were found for all the
products and upward-sloping demand curves for all these products, except fruit juice.
Therefore the demand curve for fruit juice did not support the earlier study (Foxall and
Schrezenmaier, 2003). The maximisation results supported the earlier studies where
consumers could be seen as maximising by selecting the cheapest brands. In this thesis,
aggregate analyses o f 200 data were also carried out to determine to what extent there
2 3 6
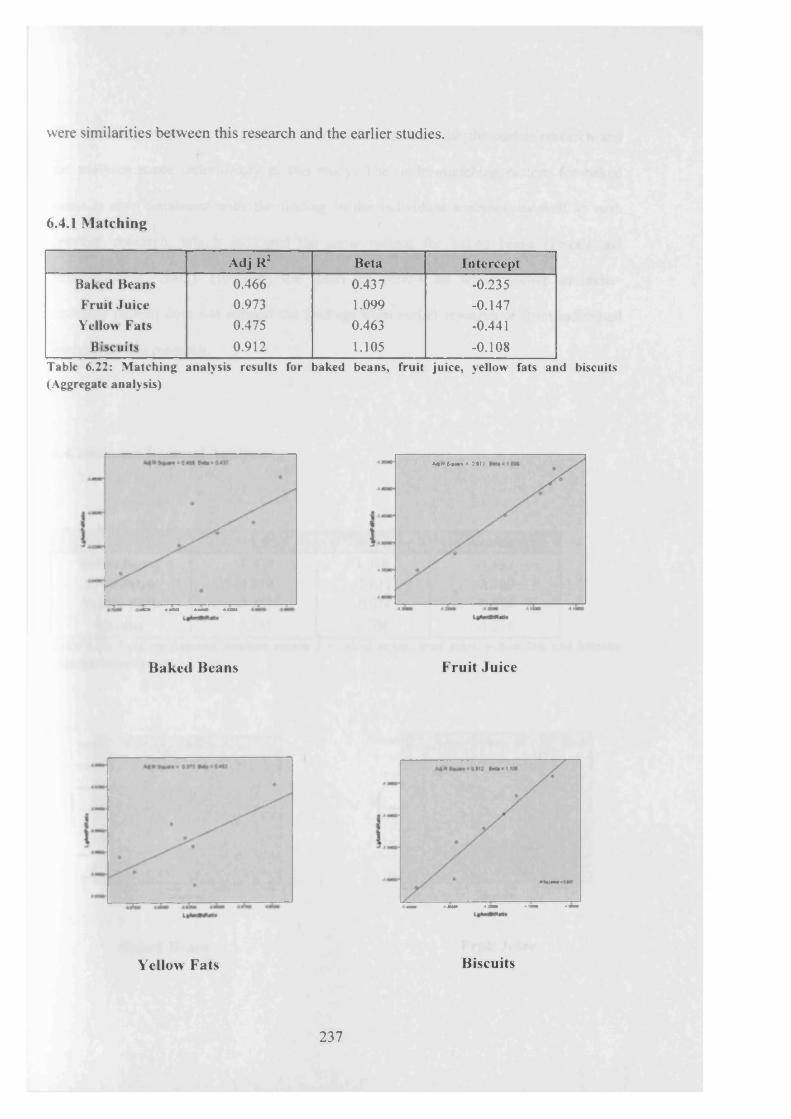
were similarities between this research and the earlier studies.
6.4.1 Matching
Adj R2 Beta InterceptBaked Beans 0.466 0.437 -0.235Fruit Juice 0.973 1.099 -0.147Yellow Fats 0.475 0.463 -0.441
Bikinis 0.912 1.105 -0.108Table 6.22: Matching analysis results for baked beans, fruit juice, yellow fats and biscuits (Aggregate analysis)
Baked Beans
Yellow Fats
MRS**** otn
•41
Fruit Juice
Biscuits
2 3 7

The matching pattern in fruit juice and biscuits is in line with the earlier research and
the analyses made individually in this study. The under-matching pattern for baked
beans is also consistent with the finding in the individual analyses, as well as with
previous research, which indicated the same pattern for baked beans (Foxall and
Schrezenmaier, 2003). However, the result for yellow fat which shows an under
matching pattern does not support the findings from earlier research or from individual
analyses in this research.
6.4.2 Relative Demand Analysis
Adj R2 Beta Intercept
Baked Beans 0.418 1.366 -1.142Fruit Juice -0.010 -2.635 -2.109Yellow Fats -0.195 -0.014 -0.928
Biscuits 0.243 1.706 -1.276Table 6.23: Relative demand analysis results for baked beans, fruit juice, yellow fats and biscuits ( Aggregate analysis)
««<• > m
Baked Beans Fruit Juice
2 3 8

>4
Yellow Fats Biscuits
The downward-sloping demand curve was only found for fruit juice and yellow fats,
indicating the price sensitivity o f the consumers when purchasing these two products.
The upw'ard-sloping demand curve for biscuits is a surprise, as the brands of this
product category were revealed to be substitutable in a matching analysis, as is the
downward-sloping demand curve for yellow fats, as under-matching is the pattern found
for this product. Nevertheless, the unexpected patterns o f relative demand curves and
low values o f both the adjusted R2 and Beta parameters signal a weak relationship
between the relative price and relative quantity demanded. Therefore, more clarification
and methods need to be found with regard to the price and quantity relationship.
6.4.3 Maximisation
As found in individual analysis, consumers are seen as maximising for all the four
product categories, which is consistent with the previous research done by Foxall and
colleagues (Foxall and James, 2001, Foxall and James, 2003, Foxall and Schrezenmaier,
2 3 9
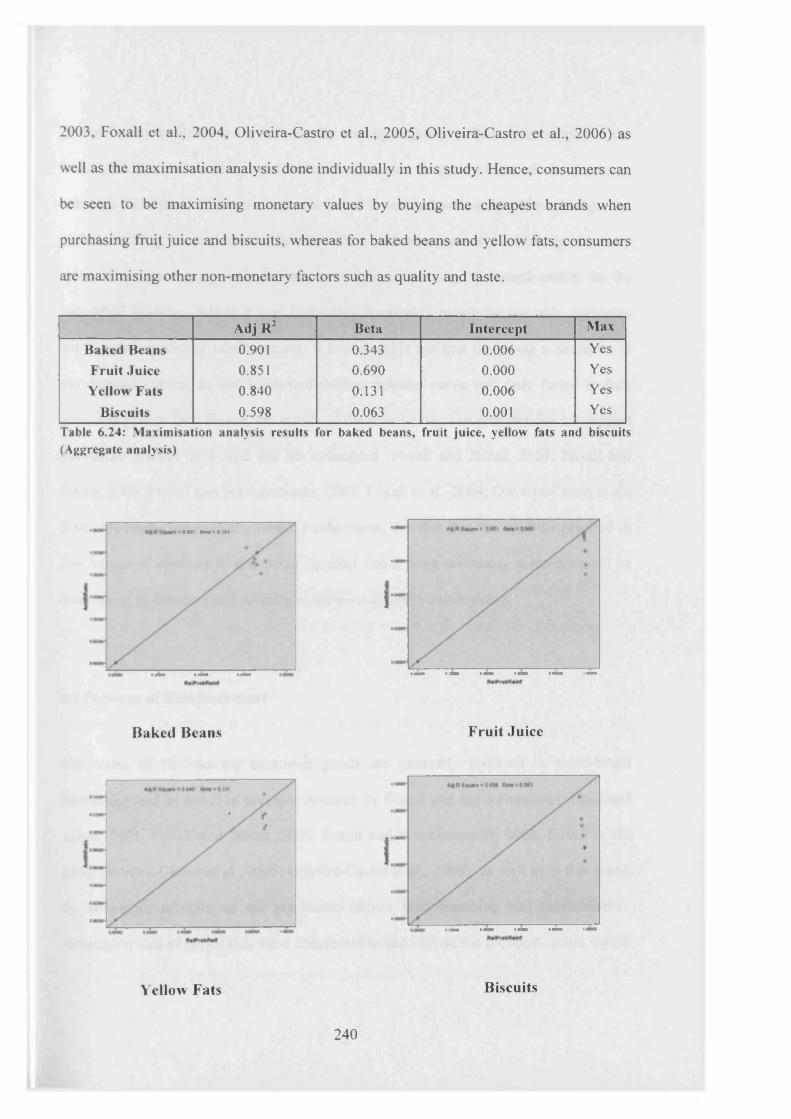
2003, Foxall et al., 2004, Oliveira-Castro et al., 2005, Oliveira-Castro et al., 2006) as
well as the maximisation analysis done individually in this study. Hence, consumers can
be seen to be maximising monetary values by buying the cheapest brands when
purchasing fruit juice and biscuits, whereas for baked beans and yellow fats, consumers
are maximising other non-monetary factors such as quality and taste.
Adj R2 Beta Intercept Max
Baked Beans 0.901 0.343 0.006 YesFruit Juice 0.851 0.690 0.000 YesYellow Fats 0.840 0.131 0.006 Yes
Biscuits 0.598 0.063 0.001 YesTable 6.24: Maximisation analysis results for baked beans, fruit juice, yellow fats and biscuits (Aggregate analysis)
•»«» tka-tM]
Baked Beans Fruit Juice
Yellow Fats Biscuits
2 4 0
In conclusion, analyses done individually and aggregately in this study supported the
earlier studies, as matching and maximisation was found in most of the products,
although there were different results for baked beans and yellow fats. Nevertheless, the
under-matching pattern and the fact that the consumers are not maximising monetary
value when purchasing baked beans and fruit juice were discussed earlier in the
individual analyses, where it was found that consumers maximise not only utilitarian
but also informational reinforcement. It is noticeable too that there was a deviation in
the demand curves, as the downward-sloping demand curve was only found in fruit
juice and yellow fats. Hence, the results of the relative demand analysis did not support
the earlier studies by Foxall and his colleagues (Foxall and James, 2001, Foxall and
James, 2003, Foxall and Schrezenmaier, 2003, Foxall et al., 2004, Oliveira-Castro et al.,
2005, Oliveira-Castro et al., 2006). Furthermore, the fact that the analysis resulted in
low values of adjusted R2 and Betas signifies that a more promising method should be
determined to interpret and investigate the price/quantity relationship.
6.5 Patterns of Reinforcement
Purchasers of fast-moving consumer goods are generally involved in multi-brand
purchasing and as found in previous research by Foxall and his colleagues (Foxall and
James, 2001, Foxall and James, 2003, Foxall and Schrezenmaier, 2003, Foxall et al.,
2004, Oliveira-Castro et al., 2005, Oliveira-Castro et al., 2006) as well as in this study,
the behaviour of most of the purchasers shows both matching and maximisation.
Although it was expected that these consumers would choose the cheapest option within
241

their consideration sets of brand, their behaviour of having a combination of brands
ranging from the cheapest to the most expensive is something that needs to be
investigated further. Although these brands are functionally equivalent, they are
certainly not entirely similar and these differences are the factors that have been focused
on by marketers through ‘branding*. Different consumers are of course expected to
search for different levels and combinations of levels of reinforcement.
The specific combination of utilitarian and informational reinforcement made available
by the purchase or consumption of a particular product is known as the ‘pattern of
reinforcement’ (Foxall, 2005). The pattern of reinforcement differs within a product
category; therefore it is beneficial to analyse it in this study, as it is the key to
understanding the real factors that consumers maximise. Brand choice is influenced by
both reinforcements - utilitarian, which comes from the functional benefit of a product,
and informational, which represents the satisfaction, prestige and status of consumption.
There are no specific units or analysis to measure reinforcement levels; therefore, this
study employs a forced ranking system in which three informational and two utilitarian
levels were given to the product as discussed in the methodology chapter (Chapter 5).
Tables 6.25, 6.26, 6.27 and 6.28 present the level of utilitarian and informational
reinforcements for each product category. Overall, a low level of utilitarian
reinforcement is found for most of the consumers purchasing all the four product
categories, with a total of 79% on average. Consumers are, in reality, expected to have a
low level of utilitarian reinforcement particularly when purchasing fast-moving
242

consumer goods such as food. Utilitarian reinforcement level is recognised as being
based on the product’s attributes; therefore, a low level of utilitarian reinforcement
refers to the plain formulation versions of the product. The four product categories are
consumed frequently in every household. Hence, it can be said that consumers purchase
these products for their functional attributes, which can be gained from any brand in the
market.
The informational reinforcement, on the contrary, signals the symbolic meaning hidden
in every brand that is sought by consumers for the sake of having the feeling of
satisfaction or prestige. This reinforcement can be associated to both the brand and price
differentiation. Highly-differentiated brands are normally more expensive and are
expected by the consumers to have higher level of informational reinforcement in terms
of the quality and taste. For baked beans, it is found that most of the consumers look for
brands with high and middle levels of informational reinforcement. This is attributed to
the fact that these purchasers prefer Heinz brand lines, which are well-known for their
quality and richness in taste and flavour. On the other hand, consumers, when buying
fruit juice and yellow fats, tend to prefer brands that have a middle or moderate level of
informational reinforcement. Hence, consumers can be said to look for brands of fruit
juice and yellow fats that could offer a better taste and quality, but at reasonable prices.
For biscuits, it can be seen that a low level of informational reinforcement was most
sought by consumers. This might be due to the hundreds of biscuit brands available in
the market which the consumers can choose from. Furthermore, the ingredients,
243

nutrition and taste are not highly important to most o f the consumers, as biscuits are just
an ordinary ‘sweet tooth’ snack or savoury, with only a low nutritional value.
PANEL ID BAKED BEANS CONSUMERGROUP
CONTINGENCYCATEGORYUR 1R
Consumer 1 HIGH HIGH 6 ACCOMPLISHMENTConsumer 2 HIGH HIGH 6 ACCOMPLISHMENTConsumer 3 LOW HIGH 5 ACCUMULATIONConsumer 4 HIGH HIGH 6 ACCOMPLISHMENTConsumer 5 LOW MIDDLE 3 MAINTENANCE-ACC UM U L ATION
Consumer 6 LOW HIGH 5 ACCUMULATIONConsumer 7 LOW HIGH 5 ACCUMULATIONConsumer 8 LOW LOW MAINTENANCEConsumer 9 LOW MIDDLE 3 MAINTENANCE-ACCUMULATION
Consumer 10 LOW HIGH 5 ACCUMULATIONConsumer 11 LOW MIDDLE 3 MAINTENANCE-ACCUMULATIONConsumer 12 LOW MIDDLE 3 MAINTENANCE-ACCUMULATIONConsumer 13 HIGH MIDDLE 4 PLEASURE-ACCOMPLISHMENTConsumer 14 LOW LOW MAINTENANCEConsumer 15 LOW HIGH 5 ACCUMULATIONConsumer 16 HIGH HIGH ACCOMPLISHMENTConsumer 17 LOW MIDDLE 3 MAINTENANCE-ACCUMULATIONConsumer 18 LOW MIDDLE 3 MAINTENANCE-ACCUMULATIONConsumer 19 LOW MIDDLE 3 MAINTENANCE-ACCUMULATIONConsumer 20 HIGH MIDDLE 4 PLEASURE-ACCOMPLISHMENTTable 6.25: Reinforcement level and consumer group - Baked Beans
2 4 4

PANEL ID FRUIT JUICE CONSUMER CONTINGENCYUR 1R GROUP CATEGORY
Consumer 1 HIGH LOW 2 PLEASUREConsumer 2 LOW MIDDLE 3 MAINTENANCE-ACCUMULATIONConsumer 3 LOW MIDDLE 3 MAINTENANCE-ACCUMULATIONConsumer 4 LOW LOW 1 MAINTENANCEConsumer 5 LOW MIDDLE 3 MAINTENANCE-ACCUMULATION
Consumer 6 LOW LOW 1 MAINTENANCEConsumer 7 LOW LOW 1 MAINTENANCEConsumer 8 LOW LOW 1 MAINTENANCEConsumer 9 LOW MIDDLE 3 MAINTENANCE- ACCUMULATION
Consumer 10 LOW MIDDLE 3 MAINTENANCE-ACCUMULATIONConsumer 11 LOW MIDDLE 3 MAINTENANCE-ACCUMULATIONConsumer 12 LOW MIDDLE 3 MAINTENANCE-ACCUMULATIONConsumer 13 LOW MIDDLE 3 MAINTENANCE-ACCUMULATIONConsumer 14 LOW MIDDLE 3 MAINTENANCE-ACCUMULATIONConsumer 15 LOW MIDDLE 3 MAINTENANCE-ACCUMULATIONConsumer 16 HIGH MIDDLE 4 PLEASURE-ACCOMPLISHMENTConsumer 17 LOW MIDDLE 3 MAINTENANCE-ACCUMULATIONConsumer 18 LOW LOW MAINTENANCEConsumer 19 LOW MIDDLE 3 MAINTENANCE-ACCUMULATIONConsumer 20 LOW MIDDLE 3 MAINTENANCE-ACCUMULATIONTable 6.26: Reinforcement level and consumer group - Fruit Juice
PANEL ID YELLOW FAT CONSGRP
CONTINGENCYCATEGORYUR IR
Consumer 1 HIGH HIGH 6 ACCOMPLISHMENTConsumer 2 LOW MIDDLE 3 MAINTENANCE-ACCUMULATIONConsumer 3 LOW LOW 1 MAINTENANCEConsumer 4 LOW MIDDLE 3 MAINTENANCE-ACCUMULATIONConsumer 5 HIGH MIDDLE 4 PLEASURE-ACCOMPLISHMENT
Consumer 6 LOW MIDDLE 3 MAINTENANCE-ACCUMULATIONConsumer 7 LOW MIDDLE 3 MAINTENANCE-ACCUMULATIONConsumer 8 LOW MIDDLE 3 MAINTENANCE-ACCUMULATIONConsumer 9 HIGH MIDDLE 4 PLEASURE-ACCOMPLISHMENT
Consumer 10 LOW MIDDLE 3 MAINTENANCE-ACCUMULATIONConsumer 11 HIGH LOW 2 PLEASUREConsumer 12 LOW MIDDLE 3 MAINTENANCE-ACCUMULATIONConsumer 13 LOW MIDDLE 3 MAINTENANCE-ACCUMULATIONConsumer 14 LOW LOW MAINTENANCEConsumer 15 LOW MIDDLE 3 MAINTENANCE-ACCUMULATION
Consumer 16 LOW HIGH 5 ACCUMULATIONConsumer 17 LOW LOW 1 MAINTENANCEConsumer 18 LOW LOW 1 MAINTENANCEConsumer 19 LOW LOW 1 MAINTENANCEConsumer 20 LOW LOW 1 MAINTENANCE
Table 6.27: Reinforcement level and consumer group - Yellow Fats
2 4 5
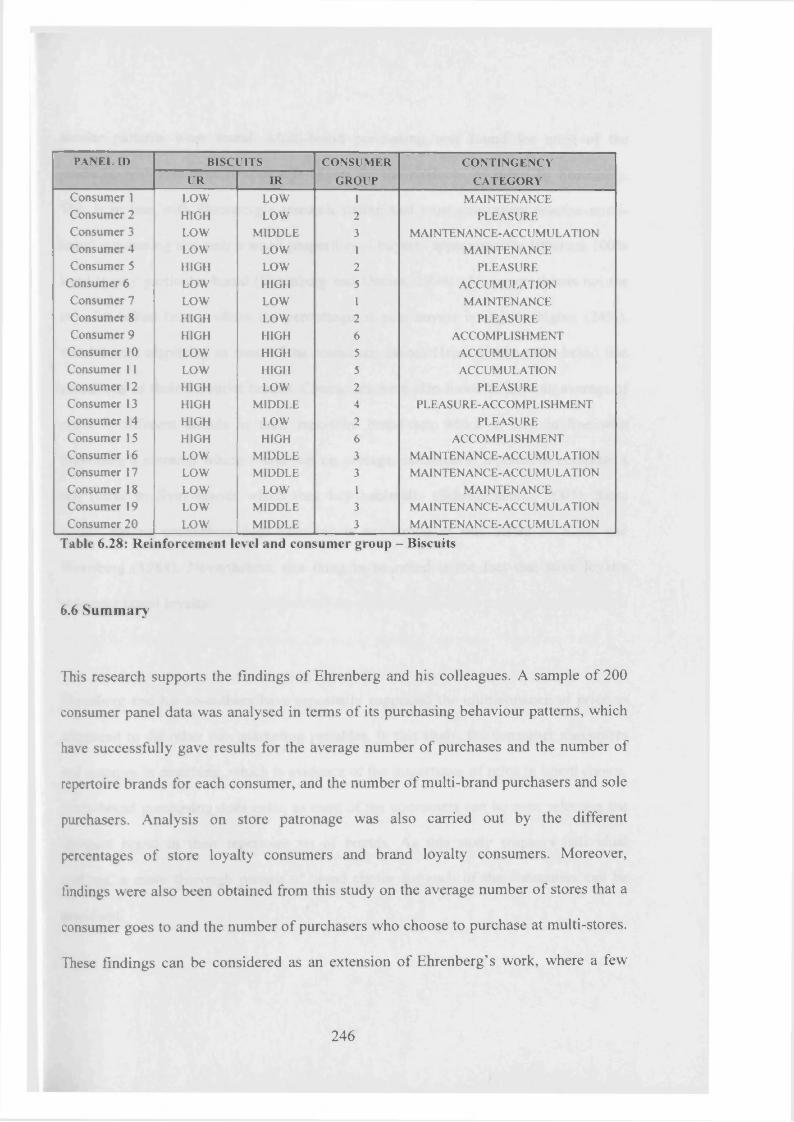
PANEL ID BISCUITS CON SUM ER
G RO UP
CO N TING ENCY
CA TEG O RYUR IRConsumer 1 LOW LOW 1 MAINTENANCEConsumer 2 HIGH LOW 2 PLEASUREConsumer 3 LOW MIDDLE 3 MAINTENANCE-ACCUMULATIONConsumer 4 LOW LOW MAINTENANCEConsumer 5 HIGH LOW 2 PLEASURE
Consumer 6 LOW HIGH 5 ACCUMULATIONConsumer 7 LOW LOW MAINTENANCEConsumer 8 HIGH LOW 2 PLEASUREConsumer 9 HIGH HIGH ACCOMPLISHMENT
Consumer 10 LOW HIGH 5 ACCUMULATIONConsumer 11 LOW HIGH 5 ACCUMULATIONConsumer 12 HIGH LOW 2 PLEASUREConsumer 13 HIGH MIDDLE 4 PLEASURE-ACCOMPLISHMENTConsumer 14 HIGH LOW PLEASUREConsumer 15 HIGH HIGH ACCOMPLISHMENTConsumer 16 LOW MIDDLE 3 MAINTENANCE-ACCUMULATIONConsumer 17 LOW MIDDLE 3 MAINTENANCE-ACCUMULATIONConsumer 18 LOW LOW MAINTENANCEConsumer 19 LOW MIDDLE 3 MAINTENANCE-ACCUMULATIONConsumer 20 LOW MIDDLE 3 MAINTENANCE-ACCUMULATION
Table 6.28: Reinforcement level and consumer group - Biscuits
6.6 Summary
This research supports the findings o f Ehrenberg and his colleagues. A sample of 200
consumer panel data was analysed in terms of its purchasing behaviour patterns, which
have successfully gave results for the average number of purchases and the number of
repertoire brands for each consumer, and the number o f multi-brand purchasers and sole
purchasers. Analysis on store patronage was also carried out by the different
percentages o f store loyalty consumers and brand loyalty consumers. Moreover,
findings were also been obtained from this study on the average number o f stores that a
consumer goes to and the number of purchasers who choose to purchase at multi-stores.
These findings can be considered as an extension o f Ehrenberg’s work, where a few
2 4 6
similar patterns were found. Multi-brand purchasing was found for most of the
products, with less than 10% of sole buyers for the products, as stated by Ehrenberg.
This is in line with Ehrenberg’s research stating that most consumers practise multi-
brand purchasing and only a small proportion of buyers (approximately 10%) are 100%
loyal to any particular brand (Ehrenberg and Uncles, 1999). However, this is not the
case for baked beans, where the percentage of sole buyers is slightly higher (24%),
which is not surprising as most of the consumers favour Heinz and its other brand line
extensions as their favourite brands. Consumers were also found to have an average of
about 4 different brands in their repertoire brand set, which is also in line with
Ehrenberg’s research which found that on average, consumers’ repertoires comprise a
few (three to five) brands which they buy habitually (Schrezenmaier, 2005). Store
loyalty among consumers does exist but is not strong as was stated by Keng and
Ehrenberg (1984). Nevertheless, one thing to be noted is the fact that store loyalty
surpasses brand loyalty.
Ehrenberg and his co-authors have repeatedly suggested the unimportance of price as
compared to the other mix marketing variables. In this study, the consumer maximises
and engages in matching, which is evidence of the importance of price in brand choice.
Multi-brand purchasing does exist, as most of the consumers can be seen selecting the
cheapest brand in their repertoire set of brands. As this study employs individual
analysis, a more thorough pattern of brand choice for each of the consumers can be
examined.
247
In terms of the analyses made based on the behavioural economics approach, 20
consumers who had purchased all the foi r product categories and at the same time could
be categorised as medium or heavy buyers, having a purchasing frequency of more than
5 for each product category, were chosen randomly. Matching was found in most of the
consumers purchasing fruit juice, yellow fats and biscuits, whereas under-matching was
found for baked beans. This can be attributed to the fact that consumers tend to prefer
Heinz baked beans, whilst for the other product categories, they engage in multi-brand
purchasing, indicating the substitutability of the brands and at the same time selecting
the cheapest from their repertoire brand sets. A downward-sloping demand curve was
found for most of the consumers purchasing baked beans, which is rather unexpected as
these consumers prefer the most expensive brand, which is Heinz, despite its high price.
Nevertheless, this exception occurred due to the combination of the consumers’
repertoire sets. The fact that most of them preferred Heinz brands shows that their
selections mostly consisted of premium-priced and highly-differentiated brands within
their consideration set and not from the whole product category. Therefore, there is a
possibility that these consumers still choose the least expensive brand within this
limited repertoire set, which then contributes to the downward sloping of the demand
curve. An upward-sloping demand curve was found for most of the consumers
purchasing fruit juice, yellow fats and biscuits, indicating their insensitivity to the price,
which is a deviation from what was anticipated from products that show a matching
pattern. The reason was that as consumers engaged in multi-brand purchasing or bought
more than one brand on a shopping trip, they often combined and added more expensive
brands to the cheapest ones, thus leading to the upward sloping of the demand curve.
248
Multi-brand purchasers, although they purchase several brands, also show a
disproportionate preference for the highly differentiated brands (Foxall, 1999).
Maximisation is shown by most of the consumers purchasing all the four product
categories. Obviously, they can be considered as maximising the monetary value by
selecting the cheapest brands, but at the same, these consumers are also maximising the
non-monetary values such as satisfaction, quality and taste. This is obvious for baked
beans, where the under-matching pattern indicates consumers’ preference for a
premium-priced brand of baked beans. Consumers can be said to be maximising not
only monetary value but also non-monetary value that is often offered through branding
such as package familiarity, advertisements, consumers’ past experience or other
elements of the marketing mix, which includes quality, availability and promotional
activities. Hence, consumers maximise both the utilitarian and informational
reinforcement, as suggested by Foxall et al (2004).
Generally, the focus of the investigation of this research is on individual analysis as
most of researches in behavioural economics that have been carried out over decades
have been on an aggregate level. Individual analysis is carried out as it is believed to be
able to give a clear picture of the behaviour of individuals, as each individual has
different influences on their everyday consumption. It is clear that there should be some
differences between each individual that need to be explored and investigated. Hence,
the individual analysis had to be calculated using proportional calculations as many data
points tend to be lost when using ratio calculations. For example, when only brand A
was purchased, the proportion analysis (A/(A+B)) would produce the result of 1,
249
whereas no result was obtained when using ratio analysis (A/B). However the analysis
and observation are still valid, as they have been used in previous research (Foxall and
James, 2001, Foxall and James, 2003, Foxall and Schrezenmaier, 2003) and generally
the analyses work well, particularly matching analysis with overall high adjusted R2 and
Betas, which signal that consumers do treat brands as substitutable. As for maximisation
analysis, the limited data points and analyses made individually for each of the
consumers resulted in data points scattered rather than clustered vertically. However,
the data points can be clearly seen lying either on the right or left of the 0.5 marks,
which assist in determining whether the consumer maximises or not.
The analysis on the patterns of reinforcement level shows that consumers choose their
set of brands based on the utilitarian and informational reinforcement levels that can be
found in a brand. Consumers tend to make their purchase decisions based on the
combination of both the functional and social benefits. As consumers are found to be
maximising both the functional and informational reinforcement, marketing
practitioners should then focus on these elements in understanding and adapting to the
consumers* needs. The relatively low and high utilitarian and informational
reinforcements can be related to the Behavioural Perspective Model, where these
elements, along with the behavioural setting and the previous learning history influence
have an effect on consumers’ purchasing behaviour.
Foxall (1990) states that consumer’s responses may produce three types of
consequences, which are utilitarian reinforcement, informational reinforcement and
250
aversive consequences. Utilitarian reinforcement refers to the functional outcomes
sought from a product, while infomlational reinforcement in contrast, refers to the
symbolic meaning of having the product. Aversive consequences, on the other hand,
refer to the money that has to be surrendered to have the product. These elements can be
interpreted as the programmed reinforcing and aversive events that are manipulated by
manufacturers, retailers and managers as to make the brands look more attractive, thus
influencing the consumers to purchase(01iveira-Castro et al., 2005). As stated by Foxall
(1992), one of the main tasks in marketing is to identify what events can function as
reinforcers (or aversive stimuli), to what extent, for what consumers, and under what
circumstances. Hence, behavioural economics can indeed make an important
contribution to understanding consumers’ patterns of brand choice.
251

CHAPTER SEVEN
252

CHAPTER 7*\
INTERPRETATION: EVOLUTIONARY PSYCHOLOGY AND FORAGING IN
HUMAN CONSUMPTION
7.0 Introduction
This research is carried out to test and advance the theory by obtaining some similarities
and insights from the comparisons between Darwinian’s theory and human’s behaviour
during food shopping. The aim is to discuss how ideas from evolutionary psychology
and foraging can be beneficially used in explaining human purchasing behaviour. As
mentioned in Chapter Three, humans and their behaviours are shaped just as much by
their innate biology as by their surrounding environments and life experiences, and that
incorporating evolutionary explanations into consumer research would further enhance
the understanding of consumer phenomenon (Camargo and Donahue, 2008). There are
indeed a number of research methods that are used by evolutionary psychologists in
evaluating the theories such as questionnaires, interviews or even experiments. This
study however, adopts comparative and interpretative methods by comparing and
finding similarities between humans and non-human animals species as well as our
ancestors, particularly in terms of allocating choices to the scarce resources. It attempts
to look at the patch from both perspectives in order to obtain a comprehensible picture
or overview of foraging in the world of human consumption. It is also important to note
that the idea of relating the similarities between foraging and human behaviour in
purchasing are solely based on the researcher’s perception of the panel data and on the
253
literature review discussed in Chapter Three. Different viewers might have different
perspectives; therefore there is no absdlute truth or falsehood on the facts that are being
discussed in this chapter.
7.1 Evolutionary Psychology in Human Consumption
The explanatory power of evolutionary psychology comes from the fact that its
underlying ideas relate to the basic design of our brain and thus can form the basis on
which fundamental explanations of behaviour can be developed (Tooby and Cosmides,
1990). Past researches which employed evolutionary psychology have been successfully
carried out in various areas such as mobile technology use (Hantula et al., 2008, Rajala
and Hantula, 2000, Smith and Hantula, 2003), computer-mediated communication
(Kock, 2004, Kock, 2005), virtual team leadership (DeRosa et al., 2004), electronic user
interface design (Hubona and Shirah, 2006), online mate selection (Stenstrom et al.,
2008) and information search and use behaviour (Spink and Cole, 2006) which reflects
the usefulness of the theory in explaining human behaviour.
Evolutionary psychology is an emerging paradigm that seeks to unify the fields of
evolutionary biology and cognitive psychology as applied to the human condition (Saad
and Gill, 2000). It represents an approach to neo-Darwinian thinking that may bring
further insights to consumer choice and expand on those suggested by behavioural
ecologists (Nicholson and Xiao, 2010). Human product choice is a complex process
254

which calls on multiple capacities of the mind (Lee et al., 2007).The things that people
want, purchase and consume are products of their evolved minds (Buss, 2004). The
rationale for human consumption can be explained by incorporating an evolutionary
explanation, as consumers’ decision making adapts not only to the environment but also
to the evolutionary senses. A great majority of our consumption choices are
manifestations of our innate human nature which have been shaped by a long
evolutionary process therefore, consumer behaviour cannot be accurately understood,
nor fully investigated without the necessary infusion of biological and Darwinian-based
phenomena that have shaped our human nature (Saad, 2007).
Consumers engage in numerous kinds of behaviours in making buying decisions and it
is difficult to understand these complex behaviours accurately. Products are purchased
for a variety of reasons. Some are needed to make us beautiful or attractive. Most are
consumed to satisfy our taste preferences. Others might be bought as gifts to strengthen
family or friendship ties. Biological heritage could also influence our buying behaviour
and so does the appeal in advertisements. In a sense, even if we ignore animals and
plants, consumer research encompasses almost all human activities, regarded from the
viewpoint of consummation, or in other words, our lives comprise one constant and
continual quest for consummation (Holbrook, 1987).
Darwinian principles can indeed be applied and benefit the study of consumer behaviour
as they are able to give a more in-depth understanding by integrating and bridging
multiple behavioural disciplines. Saad (2007) proposes that the four Darwinian modules
255

of reproduction, survival, kin selection and reciprocal altruism are able to explain the
human consumption patterns effectivefy and accurately. According to Saad (2007), the
reproductive module is perceived to be related to mating choices. The survival module
is related to individual's survival and the kin selection module is more on the survival of
one's genes in the following generation which leads to altruism towards closest families
or relatives. Finally, the reciprocal altruism module is related to cooperation among
non-kin which is necessary when living in a large society group.
7.2 Food Preferences and Advertisements
Why do most of us prefer foods that are sweet and have high fat contents such as those
found in Starbucks and Me Donald’s? Our food preferences can be related to the fat and
sugar content in meat and fruit which were crucial for the survival of our past ancestors.
People during the Pleistocene era, who lived as hunter-gatherers, consumed food that
was high in nutritional values. As discussed in Chapter Three, foods that are high in fat
and sugar such as meat and ripe fruits were essential for the nutrition and health of our
ancestors. Meat was the most efficient form of receiving calories and protein, while
foods that were sweet such as ripe fruit generally indicated high levels of nutrients
(Colarelli and Dettman, 2003). These food contents were believed to enable our
ancestors to survive and reproduce. In the modem era, humans still have the preference
for the same nutrition. The difference is of course, it is readily available for purchase
from the supermarket or grocery store. Sweets and fats are staples of the consumer food
market where expenditures on oils, fats, sugar, confectionary and soft drinks remain a
256

significant portion o f our total food expenditure (Colarelli and Dettman, 2003). The
food purchasing from the data in this research displays the respondents’ preferences for
fat and sugar contents. The craving for sugar for example, can be seen in table 7.1, as on
average, each respondent purchases an amount o f 56 packs o f fruit juice and 46 packs of
biscuits for their sugar content, whereas 38 packs o f yellow fats are purchased for their
fat and salt content. An average o f 37 cans o f baked beans or what used to be known as
* sugary-tasting brown beans once baked’ are purchased by each respondent as canned
beans in tomato sauce contain both fat and sugar. Although a different range of a
healthy option version of baked beans has been introduced, the preference for baked
beans is still in line with the preference for the fat and sugar nutrition o f our ancestors.
Even in the countries as yet untouched by fast food such as Me Donald’s and Starbucks,
the preference for foods that are high in such substances has been observed, lending
further support to the notion that our evolutionary heritage plays a crucial role in
determining what is reinforcing and to what extent; a not insignificant observation for
social marketers seeking to modify eating behaviour in pursuit o f public health goals
(Nicholson and Xiao, 2007). The strategies o f reducing the amount o f fat or sugar in
food are said to be ineffective as consumers do not like the taste o f low-fat foods and
finding sugar and fat substitute that taste like the real thing has proven elusive (Colarelli
and Dettman, 2003).
Biscuits Yellow Fats Fruit Juice Baked Beans
Packs bought 916 749 1123 730
Average 45.8 37.5 56.2 36.5
Table 7.1: Average packs of biscuits, yellow fats, fruit juice and baked beans purchased by each respondent.
2 5 7

Advertisements generally use our evolved preferences in creating awareness o f and
interest in the product. The pictures' on the packaging are often targeted to evoke
positive emotional responses. People have strong preferences for ancestral cues such as
‘water sources, oasis, flowers, ripe fruits, savannah, growth and leaf patterns of healthy
savannah trees, closed forest canopy, caves and mountains (Thornhill, 1998). The
packaging o f Del Monte orange juice seen in Figure 7.1 for instance, incorporates
visuals o f mouth-watering, fresh, sun-ripened oranges and droplets o f dew on the
leaves, which have successfully attracted consumers to purchase it by evoking their
evolved preferences for the sweet taste o f ripe fruits and natural sources o f ingredients.
A 250ml Mrvmg provides
One 250rrt Grass d Dal Monts Oran9* A*c« counts as ons of your daily portions of frurt and vsgstabtss as racam m andad by tha World Hssfth Organisation I also counts towards your hy^abon target of ) g lasses of V»d a day
Figure 7.1: Del M onte orange juice packaging
Products and packaging in the market are mostly designed to reflect our evolved human
nature. Saad (2007) points out that a majority o f advertisements focus on masculinity
and feminity in marketing products to consumers, which according to the evolutionary
framework, can be seen as identifying mating preferences. These can be clearly seen
2 5 8
from the slogans on most of the advertisements which represent the four Darwinian
modules; mating, survival, kin selection and reciprocal altruism. One of particular
evolutionary importance would be how a product influences one’s social status
(mating). Saad (2007) discusses how cosmetic companies always stress beauty in their
slogans. As beauty is deemed an important criteria in attracting a mate, L’Or6al for
example, came out with its well known slogan “Because I'm worth it” to represent the
judgement of mate value in the reproductive module where appearance is seen to be the
priority in mating preferences. Women are consistently concerned about clothing, body
consciousness, dieting, cosmetic surgery, and salon usage, which is consistent with
evolutionary predictions that concern for appearance is an innate disposition among
women to increase their perceived mate value in the eyes of men (Saad and Gill, 2000).
Feeding behaviour, including the recognition of safe foods that contain essential dietary
compounds as determined by evolved taste perception has been essential to human
survival (Boyd and Silk, 2006) which this can be shown in advertisement slogans such
as Twix’s “The longer-lasting snactf\ representing the survival modules in natural
selection, Kellogg’s “They're grrreatT for kin selection, whilst Nokia’s “Connecting
people” represents reciprocal altruism. As in this research, Tropicana fruit juice for
example, has been using its slogan “100% Pure and Natural” and Heinz Baked Beans
with its “Beans Means Heinz” slogan, which both map onto the survival and kin
selection modules. These slogans can be said to be targeted at parents, as they are
always trying to provide the best possible food in terms of quality and nutrition to their
family and are willing to spend more on these items. Parental investment refers to the
effort and resources devoted to an offspring that improves its chances of survival

(Colarelli and Dettman, 2003). The slogans are successful as they play directly into our
evolved strategies that have increased the survival and reproductive success of our
ancestors throughout our species’ evolutionary history (Saad, 2007) and are used
effectively in advertisements as they are effective in drawing attention, are long-lasting
in consumer’s mind and instil positive feelings towards the products or brands.
73 Modern Shopping as in Gathering
Kruger and Byker (2009) state that the hunter-gatherer society in the Pleistocene era is
often associated with spear-wielding hunting activities; however the majority of their
food consumption derived from gathering, as females made frequent daily trips
searching for fruits and vegetables across general familiar locations where they may
encounter a patch with not quite ripe food, in which case they would usually choose the
ripe ones and leave the others to be harvested sometime later. The authors explain that
these gathering skills and behaviours which are useful in vegetation foraging may also
resemble modem women who, while shopping, are willing to make frequent shopping
trips and engage in in-person examination of the quality, features and prices of items
they want to purchase. Price, for example, plays an important part in their decision
making, and many women are willing to wait and return to the same stores in order to
purchase the item they want when it is on sale. Women have been reported to enjoy
shopping activities more than men (Fischer and Arnold, 1990) and men usually return
260

home as quickly as possible after shopping. As reported by Dogu and Erkip (2000),
women see shopping as a chance for them»to have a break from the daily routine and as
a time when they can relax either alone or with friends and family.
The sex of the respondents from the AC Nielsen panel data is unknown and is not a part
of the information provided. Nevertheless, it can be concluded that the respondents are
mostly females, as grocery shopping is usually done by women. Table 7.1 shows the
frequency of shopping trips of Consumer 17 in buying yellow fats. Generally, this
consumer prefers to buy yellow fats, choosing store brands such as Asda and Tesco for
their lower prices. Asda Sunflower tub was observed as being the most purchased brand
of yellow fats. However, it was observed too that other brands such as Stork were also
bought by this consumer, even on the same shopping trip. As mentioned earlier, this
behaviour can be seen as analogous to the woman as a gatherer in the pre-historic
period. Consumers will purchase a certain brand when the price is considered
reasonable and affordable, just as a gatherer would visit the same patch to harvest the
fruits or vegetables when they were ripe or good enough to be harvested.
261

BRAND D ESC R IPT IO N«
W E IG H TDESC
STO R EDESC
YYVVWDESC TO TA L
SPEND
ASDASUNFLOWER *TUB* 500 GM ASDA 17-JUL-04 0.46ASDA GOOD FOR YOU LIGHTSUNFLOWER SPREAD 500 GM ASDA 31-JUL-04 0.46TESCOSUNFLOWER *TUB* 500 GM TESCO 14-AUG-04 0.46TESCO HEALTHY EAT1NGSUNFLOWER LOW FAT SPREAD 500 GM TESCO 21-AUG-04 0.46ASDASUNFLOWER *TUB* 500 GM ASDA 28-AUG-04 0.46ASDA GOOD FOR YOU LIGHTSUNFLOWER SPREAD 500 GM ASDA 11-SEP-04 0.46STORK SB* *TUB* 1000 GM ASDA 11-SEP-04 0.89ASDA GOOD FOR YOU LIGHTSUNFLOWER SPREAD 500 GM ASDA 02-OCT-04 0.46ASDA GOOD FOR YOU LIGHTSUNFLOWER SPREAD 500 GM ASDA 09-OCT-04 0.46ASDASUNFLOWER *TUB* 500 GM ASDA 23-OCT-04 0.46ASDASUNFLOWER *TUB* 500 GM ASDA 06-NOV-04 0.46ASDASUNFLOWER *TUB* 500 GM ASDA 13-NOV-04 0.47ASDASUNFLOWER *TUB* 500 GM ASDA 20-NOV-04 0.42ASDASUNFLOWER *TUB* 500 GM ASDA 11-DEC-04 0.47ASDASUNFLOWER *TUB* 500 GM ASDA 18-DEC-04 0.47ASDASUNFLOWER *TUB* 500 GM ASDA 25-DEC-04 0.46ASDASUNFLOWER *TUB* 500 GM ASDA 15-J AN-05 0.47TESCO HEALTHY LVNG OLV LTSPREAD 500 GM TESCO 22-J AN-05 0.97TESCO HEALTHY EATINGSUNFLOWER LOW FAT SPREAD 500 GM TESCO 12-FEB-05 0.47TESCO BUTTER ME UPSPREAD LIGHT 500 GM TESCO 26-FEB-05 0.72ASDASUNFLOWER *TUB* 500 GM ASDA I2-MAR-05 0.46TESCO HEALTHY EATINGSUNFLOWER LOW FAT SPREAD 500 GM TESCO 19-MAR-05 0.46ASDASUNFLOWER *TUB* 500 GM ASDA 02-APR-05 0.46STORK SB* *TUB* 500 GM ASDA 02-APR-05 0.45TESCO HEALTHY EATINGSUNFLOWER LOW FAT SPREAD 500 GM TESCO 09-APR-05 0.46STORK SB* *TUB* 500 GM TESCO 16-APR-05 0.45ASDASUNFLOWER *TUB* 500 GM ASDA 23-APR-05 0.46ASDASUNFLOWER *TUB* 500 GM ASDA 07-MAY-05 0.46ASDASUNFLOWER *TUB* 500 GM ASDA 21-MAY-05 0.46ASDASUNFLOWER *TUB* 500 GM ASDA I8-JUN-05 0.46ASDASUNFLOWER *TUB* 500 GM ASDA 09-JUL-05 0.46
Table 7.2: Consumer 17 - Purchasing history
2 6 2
7.4 Reinforcement as an Evolutionary Processt
The Behavioural Perspective Model (BPM), a useful framework in explaining consumer
choice, is an elaboration of Skinner’s three-term contingency, which is consistent with
neo-Darwinian theory. As discussed in Chapter Four, Foxall (1990), who introduced
this model, states that behaviour is usually conducted in such a way as to maximise the
reinforcement and minimise the punishment. According to Foxall (1990), consumer
behaviour is the outcome of the interaction of the environmental stimuli which are
setting, learning history and also the predicted possible outcomes or reinforcements
which is consistent with Skinner’s second kind of consequences; operant conditioning.
BPM is thus an elaboration of Skinner’s original three term contingency, all elements
of which may be potentially amenable to neo-Darwinian analysis (Nicholson and Xiao,
2010). Most of our purchasing is made by referring to both utilitarian and informational
reinforcement and the aversive consequences. The pleasure of having a Rolex watch for
example, is not only limited to the functional benefit of knowing the accurate time but
also the feeling of satisfaction when receiving compliments and admiration from family
and friends. The same goes for the pleasure of consuming Del Monte fruit juice or
Heinz baked beans, as consumers do not only have the aim of quenching their thirst or
assuaging their hunger, but also of having the satisfaction feeling of knowing that the
food consumed by themselves or by the family is the best in nutrition and taste. The
aversive consequence of having a highly-differentiated brand is of course the money
that is required to be spent on it.
263

The utilitarian reinforcement is clearly represented by the individual’s achievement of
survival and inclusive fitness. Foxall *(2007) indicates that this form of reinforcement
might be the less difficult and problematic to accomplish, particularly in purchasing
fast-moving consumer goods such as food, as it is routine purchasing. He states that the
rationale in an informational reinforcement is the notion of secondary reinforcement
through status accomplishment. This has been shown by our ancestors, where
competition among the males was common in mating. ‘The male who gained access to
the most fertile female was the one with the greatest potential for protecting his mate
and providing the resources necessary to ensure that both she and any resultant
offspring survived, reproduced and passed these “fit” genes on to a new generation’
(Nicholson and Xiao, 2010). In human consumption, a consumer seeking high
informational reinforcement can be clearly seen in those involved in conspicuous
consumption where the consumption of branded and luxurious items is a part of
displaying status symbols. A high price is often related to product quality; therefore,
owning an expensive product can signal prestige and status (Colarelli and Dettman,
2003). Conspicuous consumption or lavish spending on goods is said to be engaged in
by people who need to be happy or are trying to be different or better than others, which
is done from the need to attain and maintain one’s social status (Saad, 2007). These
assumptions however, fail to elucidate the underlying reasons of why these consumers
need to be happy or different from others in the first place and why gaining social status
is important not only in a certain culture but in almost every culture in this world. Saad
(2007) suggests that these manners are linked to the evolutionary theory in which our
behaviour may be or at least in part, affected by our evolved human nature and that
gaining status by spending on luxuries is similar to attracting mates in mating. Mate
264

selection and mating behaviours are part of the area of evolutionary psychology that is
useful to be applied to human consumption (Saad and Gill, 2000). In summary, both
utilitarian and informational reinforcement are consistent with the understanding of neo-
Darwinian insights, particularly related to the survival, inclusive fitness and status
attainment for mating by our ancestors
Foxall (1993) establishes four operant classes of consumer behaviour according to the
high-low level of both the utilitarian and informational reinforcements:
Maintenance Shopping - Low in both utilitarian and informational reinforcement
with routine or daily purchasing as an obvious example such as a weekly trip to
buy groceries.
Accumulation shopping — Low in utilitarian but high in informational
reinforcement. This can be associated with saving and collecting such as having
a ‘loyalty card’ or ‘vouchers/ coupons’.
Pleasure shopping - Low in informational but high in utilitarian reinforcement
such as buying and collecting clothes as a personal interest.
265
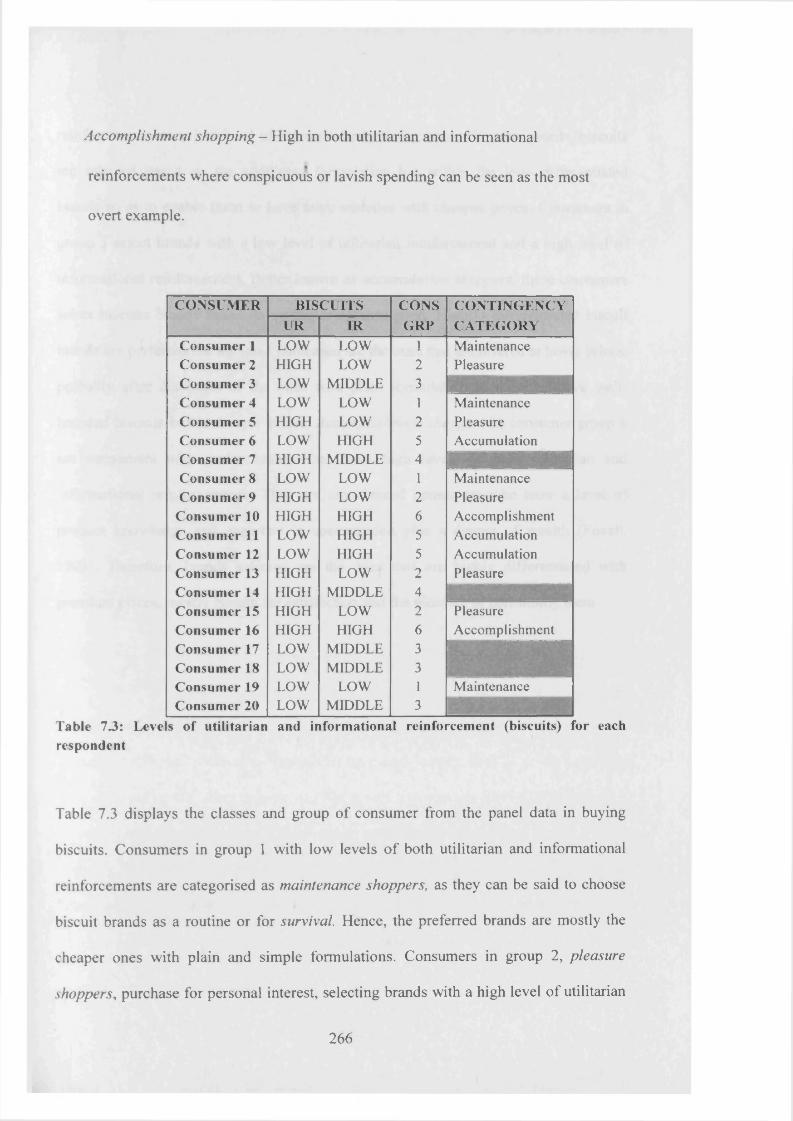
Accomplishment shopping - High in both utilitarian and informational
reinforcements where conspicuous or lavish spending can be seen as the most
overt example.
CONSUMER BISCUITS CONS CO NTIN G EN C YUR IR GRP CATEG O RY
Consumer 1 LOW LOW 1 MaintenanceConsumer 2 HIGH LOW 2 PleasureConsumer 3 LOW MIDDLE 3Consumer 4 LOW LOW 1 MaintenanceConsumer 5 HIGH LOW 2 PleasureConsumer 6 LOW HIGH 5 AccumulationConsumer 7 HIGH MIDDLE 4Consumer 8 LOW LOW 1 MaintenanceConsumer 9 HIGH LOW 2 Pleasure
Consumer 10 HIGH HIGH 6 AccomplishmentConsumer 11 LOW HIGH 5 AccumulationConsumer 12 LOW HIGH 5 AccumulationConsumer 13 HIGH LOW 2 PleasureConsumer 14 HIGH MIDDLE 4Consumer 15 HIGH LOW 2 PleasureConsumer 16 HIGH HIGH 6 AccomplishmentConsumer 17 LOW MIDDLE 3Consumer 18 LOW MIDDLE 3Consumer 19 LOW LOW 1 MaintenanceConsumer 20 LOW MIDDLE 3
Table 7J: Leve respondent
s of utilitarian and informational reinforcement (biscuits) for each
Table 7.3 displays the classes and group of consumer from the panel data in buying
biscuits. Consumers in group 1 with low levels o f both utilitarian and informational
reinforcements are categorised as maintenance shoppers, as they can be said to choose
biscuit brands as a routine or for survival. Hence, the preferred brands are mostly the
cheaper ones with plain and simple formulations. Consumers in group 2, pleasure
shoppers, purchase for personal interest, selecting brands with a high level o f utilitarian
2 6 6

reinforcement but a low level o f informational reinforcement. In other words, biscuits
are selected based on the additional formulation but within the low- differentiated
brands so as to enable them to have more varieties with cheaper prices. Consumers in
group 5 select brands with a low level o f utilitarian reinforcement and a high level of
informational reinforcement. Better known as accumulation shoppers, these consumers
select biscuits brands based on saving or accumulation. Highly- differentiated biscuit
brands are preferred but the most purchased are the ones that are offered at lower prices,
probably after discounts or the ones with plain formulation in order to have well-
branded biscuits but at cheaper prices. Accomplishment shoppers in consumer group 6
are consumers who prefer brands that have high levels o f both utilitarian and
informational reinforcements. They are experienced consumers who have a level of
product knowledge and expertise in consumption plus a degree o f wealth (Foxall,
1994). Therefore, brands selected are the ones that are highly differentiated with
premium prices, mostly bought for satisfaction and the pleasure o f consuming them.
2 6 7

CONSUMERUTILITARIAN INFORMATIONAL
HIGH LOW HIGH MID LOWConsumer 1 3 1 2 0 2Consumer 2 2 2 1 1 f 1Consumer 3 0 4 1 2 1Consumer 4 1 3 1 1 2Consumer 5 2 2 0 3 1Consumer 6 4 0 : 1 1Consumer 7 2 2 l 3 0Consumer 8 4 0 l 1 2Consumer 9 2 2 0 0 4Consumer 10 3 1 l 3 0Consumer 11 4 0 l 2 1Consumer 12 4 0 l 2 1Consumer 13 3 1 0 3 1Consumer 14 2 2 1 3 0Consumer 15 3 1 0 1 3Consumer 16 1 3 2 1 1Consumer 17 2 2 1 2 1Consumer 18 ■ ■ 0 0 3 1Consumer 19 4 0 0 2 2Consumer 20 4 0 0 HI 0
Table 7. 4: Numbers of utilitarian and informational reinforcement for baked beans, fruit juice, yellow fats and biscuits
Table 7.4 shows the combination o f utilitarian and informational reinforcement of each
consumer in purchasing the 4 product categories. Evidently, consumers seek different
levels o f both reinforcements for each product category. Consumer 20, for example,
only purchased all 4 product categories based on high levels of utilitarian and
informational reinforcements. Hence, this consumer can be seen as selecting product
brands based on the status accomplishment which, according to Saad (2007), is done by
people who need to be happy or are trying to be different or better than others ,which is
done from the need to attain and maintain one’s social status. On average, it can be said
that most o f the consumers prefer brands that are high in utilitarian reinforcement and
have a medium level o f informational reinforcement, which signals that consumers
2 6 8

favour brands that have variety in formulation but at the same time, looking for
reasonable and affordable prices.
7.5 Foraging in Human Consumption
Humans are biological creatures; primates that evolved over many millennia whose
adaptations were shaped and selected by environments long past (Hantula, 2003).
Environments change drastically and quickly, more so than the slow process of natural
selection. We may be surrounded by too many people and too much wealth, but the
scarcity of resources is a setback that has to be solved. Challenges in browsing,
acquiring, using and disposing of resources are important concerns. Of course the media
of obtaining these resources have changed from hunting patches and barter systems to
monetary systems and grocery stores, yet the challenges faced are still the same, with
similar basic behavioural approaches. All behaviours may be assumed as economic
activity since most human and non-human behaviours involve using scarce
commodities. The behaviour of organisms is the means by which various types of
scarce commodities are attained or used (Hursh, 1980, Hursh, 1984, Webley et al.,
2001). Marketing scholars and practitioners are always keen to know how consumers
make their decisions and how much information they need prior to making any
purchase. Foraging theory is believed to be able to offer a potential explanation of
consumer behaviour and provide new perspectives in consumer psychology.
269

Modem consumers as foragers still spend endless time in foraging, albeit in a different
settings of grocery stores, supermarkets, malls and internet sites (Kruger and Byker,
2009). We deal with problems almost every day and among the most important
problems is how to allocate our choices in terms of the scarce resources, or in other
words, foraging. Foraging is not constrained to our ancestral environments; it is the
naturally-selected way in which we manage any patchy and stochastic environment,
even today (Hantula, 2010). Just as our ancestors or animals once foraged in savannah,
we are now foraging in supermarkets, stores or even online. Modem humans still devote
considerable time and effort to foraging as a large portion of daily activity revolves
around finding and preparing food, although the foraging context is now more in
settings of malls, grocery stores and websites (Kruger and Byker, 2009).
Foraging behaviours are basically comprised of series of choices. Similarly, there are
obviously a great number of choices in human consumption. Humans are always
confronted with a dilemma in choosing products that will meet their needs, tastes and
preferences. Just like animals’ foraging behaviour, moving through the patches while
making decision whether to accept or reject the available prey choices, consumers can
be expected to wander in stores, deciding on the best brand choices by considering the
reinforcement levels, while at the same time judging the product’s quality and price.
Analysing human activity through the perspective of the evolutionary process has
become a trend in the social science. Foraging itself has been investigated by using a
wide variety of species, including humans. The scope of foraging on humans spans
subsistence food gathering (O'Connell and Hawkes, 1984), library sciences (Sandstrom,
1994), information seeking (Pirolli and Card, 1999), grocery shopping (Foxall and
270
James, 2003) and online shopping (Rajala and Hantula, 2000, Smith and Hantula,
2003). Analysing human consumption as a set of behaviour that is analogous to animal
foraging has been fruitfully carried out by researchers like Rajala and Hantula (2000).
Rajala and Hantula (2000) and DiClemente and Hantula (2003) concentrated on online
CD purchasing, using a laboratory study (computer simulation) where online music
stores were patches and CDs were prey. The data obtained fit the same hyperbolic
discounting function found in foraging studies across many species (Hantula, 2003).
The research is done as an extension to the research in consumer behaviour where the
study is based on the effects of price and delays in purchasing. The scenario is based on
the internet mall, as internet shopping is becoming popular among consumers. It applies
foraging theory and contributes to the research on the behavioural ecology of human
consumption. Nevertheless, although this study is based on realistic consumption
situations, the approach needs further discussion. The participants were asked to
purchase 400 CDs without using their own money or even having their own budget. The
participants* behaviour in the study, therefore, did not reflect consumer monetary
decision making since their actual own earned incomes were not involved at all. The
purchasing scenario was totally different than the naturalistic environment and it was
therefore artificial and unrealistic, thus requiring further work.
Animal foraging models traditionally involve facts on the chosen patch, the types of
prey the forager will consume, and the right time for foraging. Humans too, need to
choose among different grocery stores or supermarkets, select the best product that suits
their needs and preferences and pick out the best price that agrees with their budget.
These events are relevant and significant to each other which grant a reliable framework
271
for foraging in consumer choice. The idea of this research is to prove the similarity of
human consumption and ecological behaviour in terms of the patch, prey and currency
definition as well as the rules and consequences in making any decisions.
7.6 Patch Definition
Patch in animal foraging consists of clumps of food to be captured and utilised. In this
research, patch is defined as both the stores and brands. Stores can be seen as patches in
human consumption foraging consisting of different product categories, while brands
can be regarded as patches consisting of different levels of reinforcement.
7.6.1 Stores as Patch
In human consumption, patch can be seen as the supermarkets or grocery stores that
have various types of product brands. The obvious comparable analogy for human
consumers would be a physical area such as a shop or a shopping centre where
purchases are made (Hantula et al., 2001b). Consumers obviously need to be directed to
a location in order to obtain what they need to purchase. Grocery stores and
supermarkets are widely accepted as the best places for consumers to obtain their food
supply, as different kinds of food with different brand names are placed and sold. As
animals attend to various patches, consumers too can be seen as patronising various
stores and supermarkets which are located geographically and can be seen everywhere.
272

Reasons for choosing a place to shop include location (Huff, 1964, Cummins and
Macintyre, 1999, Rhee and Bell, 2002), household income and family size (Rhee and
Bell, 2002) and centre attractiveness (Fotheringham, 1988). James (2002) states that,
other researchers have also suggested different factors in determining store patronage
such as price, quality, selection, atmosphere, location, parking and salespeople
(Bearden, 1977); product-relevant factors (product quality, price, product
selection/assortment), market-relevant factors (convenience, service quality, store
image, store atmosphere, fast checkout) and personal factors (demographic variables,
store/store-type attitude) (Pan and Zinkhan, 2006); aesthetic, escape, exploration, flow,
epistemic gains and social/affiliation benefits (Bloch et al., 1994) as well as situational
(product, advertising and price) and individual (psychographic and past behaviour) store
choice criteria.
A consumer might choose a store based on the convenience, numbers and varieties of
product selection, location, quality and price of the offered products as well as both the
utilitarian and informational reinforcement in terms of the facilities provided such as
parking space, disabled facilities and so forth. Generally, a consumer would of course
prefer to visit the store within the shortest travelling time in order to save time so that
other important chores can also be done. However, consumers are also willing to travel
further to obtain the desired brands or to have wider range of brands especially when
there is a lot of promotion being offered. Figure 7.2 shows the distribution of store
patronage from the panel data in buying the 4 product categories. Apparently, the
highest patronage is found in large stores such as Asda and Tesco. Large stores are
favoured by most of the consumers as they provide ample parking space, a comfortable
273

atmosphere, particularly for those with family, and most importantly, consumers are
able to obtain a wider range o f brands with many promotion being offered.
■ Baked Beans■ FruN Juice□ Yellow Fat□ Biscuits
Figure 7.2: Stores patronage for purchasing baked beans, fruit juice, yellow fats and biscuits
Patronising large stores like Asda and Tesco allows consumers to stay in the store for
longer. The longer a consumer is in a store, the more chance there is that he or she will
explore the available brands, thus ensuring that a purchase is made eventually. In the
consumer realm, if we think of patches as analogous to separate, simultaneously
available shopping centres, the consumer would be more likely to choose the shopping
centre that would provide the largest amount o f shopping in the least amount of time
(DiClemente and Hantula, 2003). Apart from this, consumers can save time by
consuming in large stores, as they are able to purchase almost all that they need at the
same store without having to search in other places. In addition, stores like Tesco offers
2 7 4
loyalty programmes, which enables them to have more loyal consumers shopping at the
store by providing points which in return, will give the consumers discounts on certain
items. This will encourage continued patronage of the store in the future.
Figure 7.3 is based on the consumers’ ages. Consumers in the age range of 30 to 49
years old can be considered as being in a mature family group with young children and
teenagers. Thus, shopping at larger stores with affordable prices of the items sold and
convenience in terms of the atmosphere and space are criteria that are important for
them in selecting a ‘patch’. A larger patch in animal foraging can be expected to have
more available prey. Similarly, a larger store, as a patch, is assumed by consumers to
have various product categories and wider brands with a choice of price and quality.
Elderly consumers often purchase in smaller stores, close to their homes and may need
certain special services such as home delivery and disabled facilities (Pinson and
Jolibert, 1998). Therefore, it can be seen from Figure 7.3 that consumers aged 60 and
over favour purchasing in smaller stores such as Aldi, Iceland and Lidl for location
convenience, but in larger stores such as Asda for their facilities and special services.
275
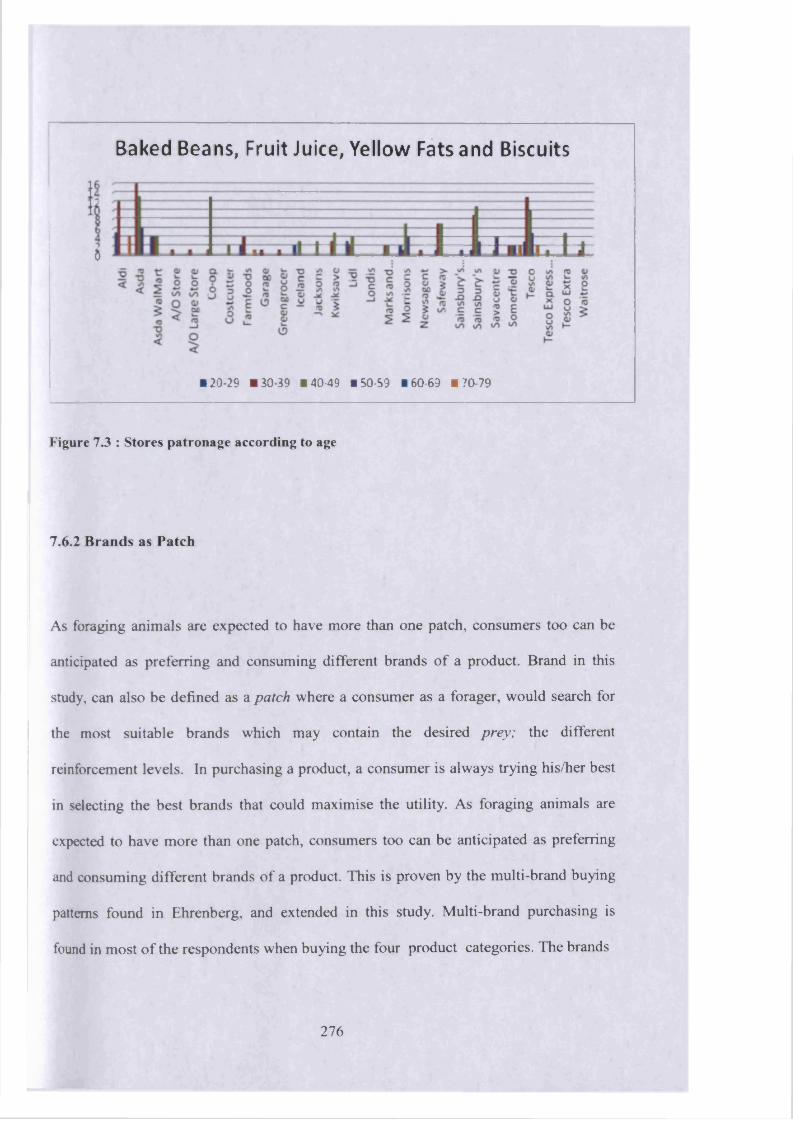
Baked Beans , Fruit Juice, Yellow Fats and Biscuits
&
■ 20-29 ■ 30-39 14049 150-59 160-69 170-79
Figure 7 3 : Stores patronage according to age
7.6.2 Brands as Patch
As foraging animals are expected to have more than one patch, consumers too can be
anticipated as preferring and consuming different brands of a product. Brand in this
study, can also be defined as a patch where a consumer as a forager, would search for
the most suitable brands which may contain the desired prey; the different
reinforcement levels. In purchasing a product, a consumer is always trying his/her best
in selecting the best brands that could maximise the utility. As foraging animals are
expected to have more than one patch, consumers too can be anticipated as preferring
and consuming different brands of a product. This is proven by the multi-brand buying
patterns found in Ehrenberg, and extended in this study. Multi-brand purchasing is
found in most o f the respondents when buying the four product categories. The brands
2 7 6

within a consumer’s consideration set usually range from the cheapest to the most
expensive and from plain to vary in ingredients or flavours. Brands can be accepted or
rejected by consumers based on the offered reinforcement levels.
7.7 Patch Sampling and Patch Assessment
Patch sampling and patch assessment are important in foraging. To be efficient and as
optimal as possible in utilising the food in the environment, it is a necessity to gather
information about the habitat (Mellgren and Brown, 1988b). A forager needs to
determine the most profitable patch to forage with the highest expected reward rate. It
needs to choose from the available options in order to utilise the most profitable
resource. The similarities of patch assessment to the study of human consumption
should also be noted.
In a changing environment, the patch or prey item that was best yesterday may not be
best today (Shettleworth, 2010). Animals usually try or sample other alternatives rather
than rely on the current patch. Sampling is the result of lack of information and
knowledge on both the patch and the prey as not every animal has sufficient knowledge
or information about them. Many authors suggest the best way a forager can keep track
of the alternatives is to sample other alternatives which currently are not the best, but
experience will also affect how they use the information available in a patch
(Shettleworth, 2010). The idea that a change of patches foraged will allow predators to
277

encounter a different range of prey has close parallels (Moermond et al., 1987).
Sampling of different products can also be caused by attending to different stores or
supermarkets which are located somewhere else, outside the normal shopping zone of a
consumer, or by trying new brands. Furthermore, by shopping at other stores and
supermarkets or purchasing other brands, consumers would obtain new information and
knowledge about the other available brands in the market as well as the different
reinforcement levels offered by each brand. This would result in a consumer sampling
new and different brands.
In animal foraging, a forager might only pay a short visit and ‘skim the cream’ in a
patch while other foragers would rather exploit every single inch of the patch to extract
the most out of it. This is signalled in human consumption where the consumer as a
forager will stay in the patch (store) or in other words, continue patronising the same
store in the future, if there are no changes in terms of number, price and quality of
products offered. Staying at the same patches could also be an advantage for a forager
as it saves time by concentrating and exploiting the familiar patches rather than having
to spend more time searching for new ones. However, as time goes by, patches do
change and prey depletion would then force the forager to start searching for another
patch (Shettleworth, 2010).
278
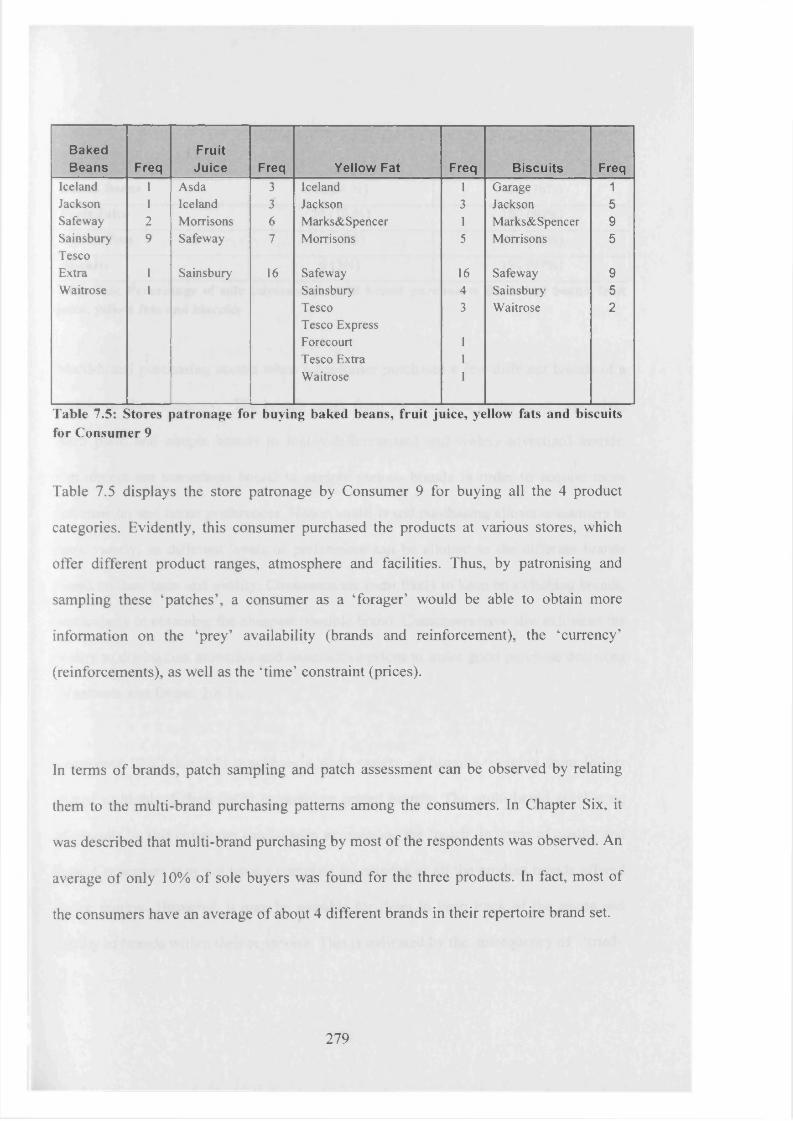
BakedBeans Freq
FruitJuice Freq Yellow Fat Freq Biscuits Freq
Iceland 1 Asda 3 Iceland 1 Garage 1Jackson 1 Iceland 3 Jackson 3 Jackson 5Safeway 2 Morrisons 6 Marks&Spencer 1 Marks&Spencer 9Sainsbury 9 Safeway 7 Morrisons 5 Morrisons 5TescoExtra 1 Sainsbury 16 Safeway 16 Safeway 9Waitrose 1 Sainsbury 4 Sainsbury 5
Tesco 3 Waitrose 2Tesco ExpressForecourt 1Tesco Extra 1Waitrose 1
Table 7.5: Stores patronage for buying baked beans, fruit juice, yellow fats and biscuits for Consumer 9
Table 7.5 displays the store patronage by Consumer 9 for buying all the 4 product
categories. Evidently, this consumer purchased the products at various stores, which
offer different product ranges, atmosphere and facilities. Thus, by patronising and
sampling these ‘patches’, a consumer as a ‘forager’ would be able to obtain more
information on the ‘prey’ availability (brands and reinforcement), the ‘currency’
(reinforcements), as well as the ‘time’ constraint (prices).
In terms of brands, patch sampling and patch assessment can be observed by relating
them to the multi-brand purchasing patterns among the consumers. In Chapter Six, it
was described that multi-brand purchasing by most o f the respondents was observed. An
average o f only 10% of sole buyers was found for the three products. In fact, most of
the consumers have an average of about 4 different brands in their repertoire brand set.
2 7 9
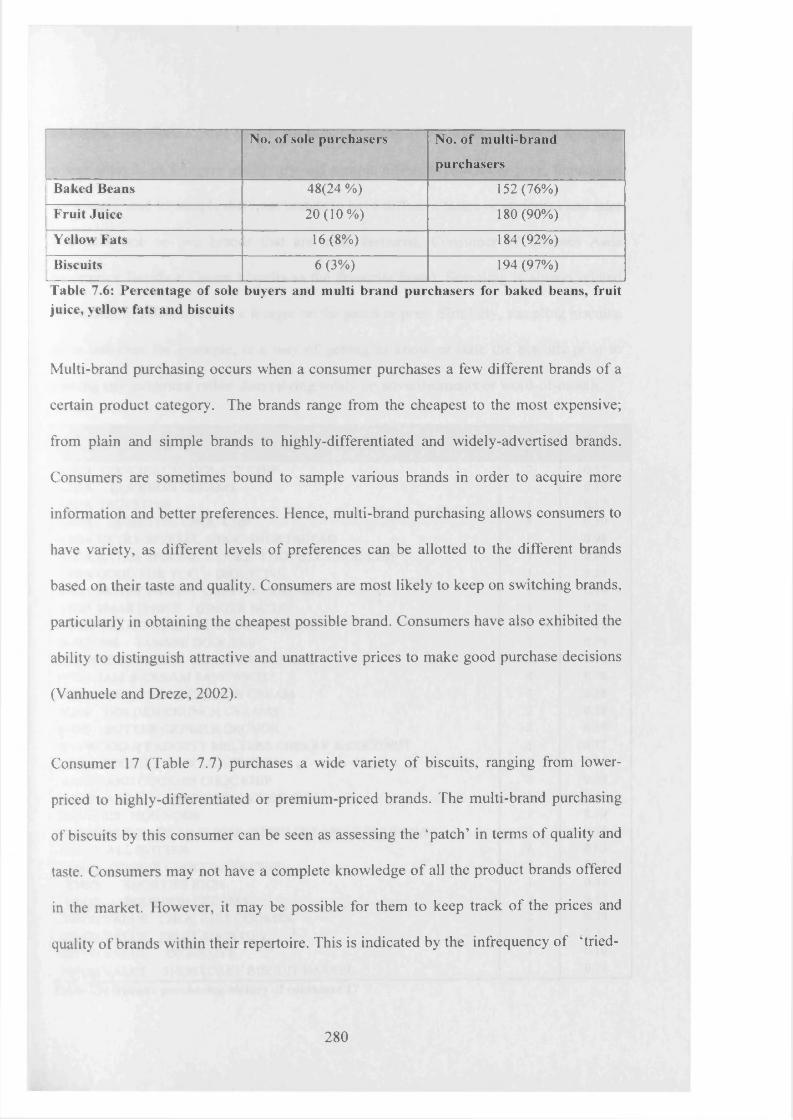
No. of sole purchasers No. of multi-brand
purchasers
Baked Beans 48(24 %) 152 (76%)
Fruit Juice 20(10% ) 180 (90%)
Yellow Fats 16(8%) 184 (92%)
Biscuits 6 (3%) 194 (97%)
Table 7.6: Percentage of sole buyers and multi brand purchasers for baked beans, fruit juice, yellow fats and biscuits
Multi-brand purchasing occurs when a consumer purchases a few different brands of a
certain product category. The brands range from the cheapest to the most expensive;
from plain and simple brands to highly-differentiated and widely-advertised brands.
Consumers are sometimes bound to sample various brands in order to acquire more
information and better preferences. Hence, multi-brand purchasing allows consumers to
have variety, as different levels o f preferences can be allotted to the different brands
based on their taste and quality. Consumers are most likely to keep on switching brands,
particularly in obtaining the cheapest possible brand. Consumers have also exhibited the
ability to distinguish attractive and unattractive prices to make good purchase decisions
(Vanhuele and Dreze, 2002).
Consumer 17 (Table 7.7) purchases a wide variety o f biscuits, ranging from lower-
priced to highly-differentiated or premium-priced brands. The multi-brand purchasing
of biscuits by this consumer can be seen as assessing the ‘patch’ in terms o f quality and
taste. Consumers may not have a complete knowledge o f all the product brands offered
in the market. However, it may be possible for them to keep track o f the prices and
quality o f brands within their repertoire. This is indicated by the infrequency of ‘tried-
2 8 0

and-tested’ purchases made by this consumer of some of the brands. Just as in foraging,
where animals as foragers usually try and sample different patches or prey, humans as
consumers tend to sample different brands to have different tastes or attributes and later
will have one or two brands that are most favoured. Consumer 17 chooses Asda
Smartprice Bourbon Cream biscuits as the favourite brand. Sampling is always related
to the lack o f information o f a forager on the patch or prey. Similarly, sampling biscuits,
as in this case for example, is a way o f getting to know or taste the biscuits prior to
making any judgment rather than relying solely on advertisements or word-of-mouth.
Biscuits FreqAvgprice
ASDA COOKIES CHOCOLATE CHIP 2 0.37ASDA BOURBON CREAMS 1 0.19ASDA DIGESTIVE 1 0.17ASDA DIGESTIVE CHOC CHIP 4 0.30ASDA EXTRA SPECIAL CHOC SHORTBREAD 1 0.98ASDA EXTRA SPECIAL COOKIES DOUBLE CHOC CHIP 1 0.98ASDA GOOD FOR YOU DIGESTIVE 1 0.23ASDA SMART PRICE CUSTARD CREAMS 1 0.14ASDA SMARTPRICE GINGER NUTS 1 0.25ASDA SMARTPRICE BOURBON CREAMS 8 0.18BURTONS JAMMIE DODGERS 3 0.79ELKES ESSENTIALS BOURBON CREAMS 3 0.34FOXS JAM & CREAM SANDWICH 4 0.78FOXS CHOC FUDGE CRUNCH CREAM 3 0.58FOXS GOLDEN CRUNCH CREAMS 2 0.58FOXS BUTTER CRINKLE CRUNCH 2 0.39HAYWOOD & PADGETT MELTERS CHERRY & COCONUT 1 0.17LYON COOKIES CHOCOLATE CHI 1 0.26MARYLAND COOKIES CHOC CHIP 1 0.39MARYLAND COOKIES DBLE CHOC CHIP 1 0.65MCVITIES HOBNOBS 1 0.39MCVITIES GO AHEAD SLICESCRISPY FRT APPLE/SULTANA 1 0.75TESCO ALL BUTTER 2 0.63TESCO COOKIE CHOCOLATE CHIP 3 0.37TESCO SHORTIES RICH 1 0.34TESCO BOURBON CREAMS 4 0.17TESCO VALUE CHOC CHIP COOKIES 2 0.28TESCO VALUE FRUIT SHORTIES 2 0.21TESCO VALUE DIGESTIVE 1 0.10TESCO VALUE SHORTCAKE BISCUIT BARREL 1 0.21
Table 7.7: Biscuits purchasing history o f consum er 17
2 8 1
7.8 Prey
Prey in human consumption can be perceived as different brands or different schedules
of reinforcement which may be attractive to consumers. There are indeed a range of
various brands in a product category that are placed in every supermarket and grocery
store. Products with different brands are placed on the most suitable shelves with
different prices and quality. A highly branded product is usually offered at a premium
price. A consumer may need more motives and drives to change to another brand if it
requires more extra money to be spent. If there is only a small price differential with an
increase in quality, a consumer without any hesitation would change to the other brand.
On the other hand, if the price differential is large and the increase in quality in another
brand is too small, a consumer would be reluctant to swap and would rather remain with
the same brand. A satisfied customer will be loyal to the same brand or choose within
his/her own repertoire of brands if the price and quality are within his/her expectation.
Certainly, every consumer has their own budgetary constraints and may prefer the ones
that are affordable to them.
Prey availability is an important factor in foraging. An animal clearly cannot forage
when there is no prey and similarly, a consumer is not able to purchase a product which
is not available (James, 2002). A loyal consumer would normally wait for the desired
brand to be sold in stores and be reluctant to purchase other brands. However, most
consumers can be expected to switch to another brand if the desired brand is not
available, for example is out of stock, or by changing to another store or supermarket
282

(James, 2002). The same applies when the desired brands do not offer the desired
reinforcement as usual. This situation may explain the underlying reasons for brand
switching, apart from other possible reasons such as changes in product quality, more
attractive offers from other competitors and boredom with the same brand.
Information can also be obtained by signal detection as not all foragers (consumers) are
able to have complete information on the prey (brands and the reinforcements). In some
foraging situations, predators leam that certain types of feeding opportunities are
signalled by the occurrence of environmental events (Rashotte et al., 1987). Different
group of animals rely on sensory signals which could come as various sorts of stimuli,
such as colours, smell, lights or even sounds. In human consumption, a consumer's
reliance on brand names/marks could act as signal that the consumer will rely on rather
than having perfect knowledge of every brand/product (James, 2002). Consumers are
able to recognise the quality of a product by just looking at the brand name and logo
based on their prior knowledge and experience or the learning history which can be
related to the Behavioural Perspective Model framework, which has been discussed in
Chapter Four.
7,9 Currency
As discussed in Chapter Three, currency in non-human animals is defined as the energy
intake per unit time spent in foraging (E/T) (James, 2002). The definition of currency in
283

human consumption may include attributes or other factors that are usually taken into
account when considering a brand or a product. Behaviours are always guided by the
pursuit o f pleasure, and these pleasures can be referred as currency. As animals usually
earn currency in the form o f energy intake in foraging, no definite definition for
currency in human consumption has been given specifically. Nevertheless, it can be
assumed that currency in human consumption may be defined in terms of attributes,
pleasure (Staddon, 1980), utilitarian and informational levels o f reinforcement (Foxall,
1990), sacrifice o f time (Hantula, 2010) or even status o f the consumed product or
service (Chao and Schor, 1998). Humans may have different aspects to be maximised
when purchasing or, put in terms of foraging theory, each consumer may have different
types o f currency (James, 2002). In this thesis, currency can refer to both the utilitarian
and informational reinforcement offered by both the stores and brands. Based on the
data, 23 stores were determined as have been visited by the 20 respondents (Table 7.8)
and these stores were categorised in terms of the level o f utilitarian and informational
reinforcement accordingly, as explained in Chapter Five.
Low UR and Low IR Med UR and Med IR High UR and High IRJacksons Asda WalMart CoopCostCo Kwiksave Asda
Londis Farmfoods MorrisonsCostcutter Sainsbury’s Central Tesco
Tesco Express Forecourt Savacentre Marks and Spencer Food
Lidl Sainsbury’sAldi Safeway Iceland Tesco Extra Somerfield
Waitrose
Table 7.8: List of stores according to utilitarian and informational reinforcement
2 8 4

Utilitarian reinforcement in the case of stores can be defined as the convenience
provided in terms of size of stores, products/brands availability, parking space and so
forth. Informational reinforcement, on the other hand, is the consumers’ knowledge of
stores and their perceptions of their quality. Marks and Spencer, for example, is
categorised as a store with high utilitarian and informational reinforcement. Its product
quality, friendly customer service, atmosphere and longer opening hours are some of the
criteria that are admired by consumers. Thus, consumers do not only purchase food for
their daily needs, but also for status consumption. Costcutter, on the other hand, is
evaluated as having a low level of both utilitarian and informational reinforcement as
not only are the stores small, but they have limited product varieties and parking space.
Brands are selected based on both the price (utilitarian) and quality (informational). The
combination of these reinforcements is demonstrated in Table 7.9. Consumers
apparently do seek different levels of both utilitarian and informational reinforcement
when purchasing each of the product categories.
285

Consumer BAKED BEANS FRUIT JUICE YELLOW FAT BISCUITSUR IR UR IR UR IR UR IR
Consumerl HIGH HIGH HIGH LOW HIGH HIGH LOW LOWConsumer2 HIGH HIGH LOW MIDDLE LOW MIDDLE HIGH LOWConsumer3 LOW HIGH LOW MIDDLE LOW LOW LOW MIDDLEConsumer4 HIGH HIGH LOW LOW LOW MIDDLE LOW LOWConsumer5 LOW MIDDLE LOW MIDDLE HIGH MIDDLE HIGH LOW( onsumerb LOW HIGH LOW LOW LOW MIDDLE LOW HIGHConsumer7 LOW HIGH LOW MIDDLE HIGH MIDDLE HIGH MIDDLEConsumers LOW HIGH LOW LOW LOW MIDDLE LOW LOWConsumer9 LOW LOW LOW LOW HIGH LOW HIGH LOW
ConsumerlO LOW MIDDLE LOW MIDDLE LOW MIDDLE HIGH HIGHConsumerl 1 LOW HIGH LOW MIDDLE LOW MIDDLE LOW HIGHConsumerl2 LOW MIDDLE LOW MIDDLE LOW LOW LOW HIGHConsumerl3 LOW MIDDLE LOW MIDDLE LOW MIDDLE HIGH LOWConsumerl4 HIGH MIDDLE LOW MIDDLE LOW HIGH HIGH MIDDLEConsumerlS LOW LOW LOW MIDDLE LOW LOW HIGH LOWConsumerl6 LOW HIGH LOW MIDDLE LOW LOW HIGH HIGHConsumer 17 HIGH HIGH HIGH MIDDLE LOW LOW LOW MIDDLEConsumerl8 LOW MIDDLE LOW MIDDLE LOW LOW LOW MIDDLEConsumerl9 LOW MIDDLE LOW LOW LOW MIDDLE LOW LOWConsumer20 LOW MIDDLE LOW MIDDLE LOW MIDDLE LOW MIDDLE
Table 7.9: Levels of utilitarian and informational reinforcement for baked beans, fruit juice, yellow fats and biscuits
Brands consist o f both the utilitarian and informational reinforcement, which are
perceived by the consumers according to the product features and attributes, as well as
the monetary value or price. Consumers are always seeking acceptable prices, which
represent the utilitarian reinforcement; and at the same time looking for the desired
quality and satisfaction that can be obtained through the informational reinforcements.
These reinforcements can be seen as the currency which is analogous to the currency in
foraging. Animals will, as a result o f evolutionary selection pressures, tend to harvest
food efficiently, so if we can work out in theory the decision rules which would
maximise the animal’s efficiency, these rules ought to predict how the predator makes
its choices (Krebs et al., 1978).While animals will always look for a prey that can yield
the highest and most profitable currency in terms of energy, consumers are always
2 8 6

seeking brands that can meet their wants and needs, which can be determined in terms
of price value, quality or social status.
Table 7.10 shows the summary of fruit juice purchases of Consumer 8, who has a wide
range of her own repertoire of brand set. Her preferred brands, however, mainly the
cheaper ones such as Aldi Del Rio D’Oro pure orange juice and Aldi Del Rio D’Oro
pure apple juice, are bought along with other highly differentiated, heavily advertised
and premium-priced brands, which is in line with Foxall (1998), who states that
consumers do maximise, although not solely on the utilitarian reinforcement but rather
on the combination of both the utilitarian and informational reinforcement. The multi-
brand purchasing habit of this consumer indicates the substitutability of brands within
his/her repertoire sets of brands. Consumers do maximise utility or inclusive fitness in
their purchasing behaviour (Saad and Gill, 2000). Purchasing for a family can be related
to the inclusive fitness in the evolutionary theory as humans are said to be altruists when
it comes to family. Furthermore, this kind of behaviour can be related to the kin
selection, where it is said that individuals can augment their inclusive fitness by
investing in and behaving altruistically toward their kin (Hamilton, 1964). This can be
clearly seen from the unconditional parental love and affection spent on the consumers’
offspring. Love has evolved as an adaptation to guide mate choice as well as to maintain
bi-parental investment for the successful rearing of viable offspring (Fisher, 1994) and
at the same time fulfilling the purpose of life which is survival and reproduction.
Another possible scenario is that this consumer might be purchasing the product not
only for the family but also for socialising with friends. In addition, buying premium-
priced biscuits for socialising with friends could be associated with status symbols,

which is reflected by the status attainment for mating through hunting in the hunter-
gatherer society.
Fruit Juice FreqAvgprice
ALDI DEL RIVO PINEAPPLE JUICE DRINK 1 2.2ALDI DEL RIVOAPPLE JUICE DRINK 3 0.76ALDI DEL RIVOPURE ORANGE JUICE FRESH 2 0.92ALDI RIO D’ORO PURE APPLE JUICE 39 0.45ALDI RIO D'OROPU RE ORANGE JUICE 38 0.36DEL MONTE*CARTON* APPLE JUICE 1 0.85DEL MONTEORANGE JUICE & BITS 1 0.89JAFFRESHAPPLE JUICE 1 0.5MORRISONS*CARTON* SPANISH ORANGE JUICE 1 0.7MORRISONS*X 4* APPLE JUICE 1 0.55MORRISONSAPPLE JUICE 1 0.45
Table 7.10: Fruit juice purchasing history of Consumer 8
7.10 Constraint
As discussed in Chapter Three, all organisms are faced with constraints that limit their
abilities to forage and in order to succeed, they have to work within these constraints.
The constraints normally involve the interactions between the forager and its
environment. Time is essential and is one o f the constraints in foraging. The influence
of delay on reinforcer value is evident in naturalistic environments where the
apportioning o f responses and time is an escapable aspect of choice (Fantino and Logan,
1979). Each o f a forager’s activities, from the searching to handling phases contributes
to the delay in reinforcement. An increase of time in each phase o f these foraging
activities would defer the value of the choice.
2 8 8
Delay time is seen to be a constraint in foraging as animals trade amount for time and
delayed rewards are discounted (DiClemente and Hantula, 2003). Organisms tend to
choose the shortest travel time for obtaining reinforcement. Any delay would cause
them to be less interested in the option. Similarly, consumers prefer less expensive
items, which is consistent with the travel time in foraging theory. The price of a
commodity may be viewed as a temporal constraint contributing to consumption
decisions and as a component of total delay to reinforcement (Smith and Hantula, 2003)
and pricing may be perceived as contributing to the total time associated with reinforcer
delivery in foraging alternatives (Fantino and Abarca, 1985). Delay discounting has
been studied by DiClemente and Hantula (2003) and Rajala and Hantula (2000) in their
laboratory of internet shopping to determine the applicability of the delay reduction
hypothesis to human consumption. Results conform to the DRH prediction that
increasing delay time in either the initial or terminal link will result in identical
decrements in the effectiveness of a conditioned reinforcer (Smith and Hantula, 2003).
Preference for the available options will be reduced as the delay increases, as organisms
will normally favour the shortest time for obtaining any reinforcement.
Travel time between patches is also among the variables that may affect the patch
assessment and residence. While animals choose the shortest travel time to obtain
reinforcement, similarly, consumers prefer less expensive items, which are consistent
with the travel time in the foraging theory. Price may be viewed as a temporal constraint
in human consumption, just as travel time is the constraint in foraging. Thus, consumers
tend to engage in multi-brand purchasing in order to obtain the best monetary value
among the brands. In fact, the matching analysis demonstrated that, particularly in
289
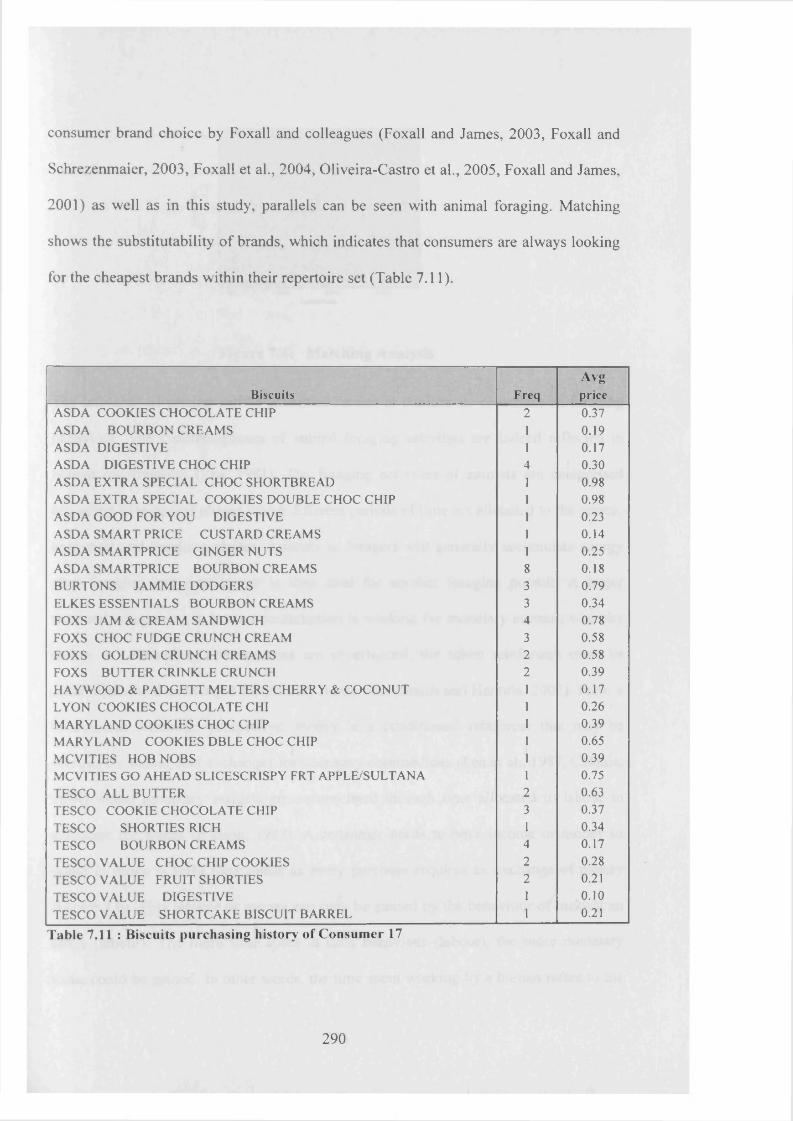
consumer brand choice by Foxall and colleagues (Foxall and James, 2003, Foxall and
Schrezenmaier, 2003, Foxall et al., 2004, Oliveira-Castro et al., 2005, Foxall and James,
2001) as well as in this study, parallels can be seen with animal foraging. Matching
shows the substitutability o f brands, which indicates that consumers are always looking
for the cheapest brands within their repertoire set (Table 7.11).
Biscuits FreqAvgprice
ASDA COOKIES CHOCOLATE CHIP 2 0.37ASDA BOURBON CREAMS 1 0.19ASDA DIGESTIVE 1 0.17ASDA DIGESTIVE CHOC CHIP 4 0.30ASDA EXTRA SPECIAL CHOC SHORTBREAD 1 0.98ASDA EXTRA SPECIAL COOKIES DOUBLE CHOC CHIP 1 0.98ASDA GOOD FOR YOU DIGESTIVE 1 0.23ASDA SMART PRICE CUSTARD CREAMS 1 0.14ASDA SMARTPRICE GINGER NUTS 1 0.25ASDA SMARTPRICE BOURBON CREAMS 8 0.18BURTONS JAMMIE DODGERS 3 0.79ELKES ESSENTIALS BOURBON CREAMS 3 0.34FOXS JAM & CREAM SANDWICH 4 0.78FOXS CHOC FUDGE CRUNCH CREAM 3 0.58FOXS GOLDEN CRUNCH CREAMS 2 0.58FOXS BUTTER CRINKLE CRUNCH 2 0.39HAYWOOD & PADGETT MELTERS CHERRY & COCONUT 1 0.17LYON COOKIES CHOCOLATE CHI 1 0.26MARYLAND COOKIES CHOC CHIP 1 0.39MARYLAND COOKIES DBLE CHOC CHIP 1 0.65MCVITIES HOBNOBS 1 0.39MCVITIES GO AHEAD SLICESCRISPY FRT APPLE/SULTANA 1 0.75TESCO ALL BUTTER 2 0.63TESCO COOKIE CHOCOLATE CHIP 3 0.37TESCO SHORTIES RICH 1 0.34TESCO BOURBON CREAMS 4 0.17TESCO VALUE CHOC CHIP COOKIES 2 0.28TESCO VALUE FRUIT SHORTIES 2 0.21TESCO VALUE DIGESTIVE 1 0.10TESCO VALUE SHORTCAKE BISCUIT BARREL 1 0.21
Table 7.11 : Biscuits purchasing history of Consumer 17
2 9 0

* mm
Figure 7.4: Matching Analysis
The influence o f pricing can be examined further to confirm its constraint on foraging
behaviour. The multiple phases o f animal foraging activities are indeed reflected in
human consumption (Lea, 1981). The foraging activities o f animals are categorised
according to temporal phases where different periods o f time are allocated to the search,
encounter and handling phases. Animals as foragers will generally accumulate energy
after foraging and this energy is then used for another foraging pursuit. A major
temporal component in human consumption is working for monetary accrual, whereby
before any rewarding consequences are experienced, the token reinforcers must be
accumulated and exchanged for primary reinforcers (Smith and Hantula, 2003). From a
behavioural economic perspective, money is a conditioned reinforcer that may be
accrued for subsequent exchanges for necessary commodities (Lea et al., 1987, Catania,
1994) where monetary budgets are accumulated through time allocated to labour in
exchange for wages (Allison, 1983). A consumer needs to have income or money to
spend in order to fulfil their needs as every purchase requires an exchange of money
(Figure 7.6). This income or money can only be gained by the behaviour of making an
effort (labour). The more time spent in such behaviour (labour), the more monetary
value could be gained. In other words, the time spent working by a human refers to the
2 9 1

handling phase in animals’ foraging, where behaviour and time are the organism’s basic
currency of exchange with the environment (Smith and Hantula, 2003). Different
periods of time and type of behaviour are used for food or commodities, which have
different delays and costs. Thus, the cost of a commodity may be regarded as a
component of the total foraging time associated with a particular commodity (Fantino
and Abarca, 1985). In other words, the time spent working for money is a phase of
foraging, analogous to the handling phase (Smith and Hantula, 2003).
Energy *Food Consumption Energy Work Income
Figure 7.5 shows the distribution of store patronage based on the social class of the
consumers. Consumers’ income does influence them in choosing the stores. Higher
income and professional consumers (social class AB) tend to go to smaller stores such
as Waitrose, Marks and Spencer and Sainsbury’s, while lower social class consumers
and those who are not working choose larger stores where there are more varieties and
promotions been offered. Consumers’ income is similar to the time constraint in
foraging, as each consumer has his/her own budget for purchasing certain amount of
product. On the other hand, income can also be related to the currency in animal
foraging. Generally, a predator would obviously choose the more valuable prey that
could offer the highest energy intake rate. A consumer’s income can be seen as the
currency generated by the food, where the food intake would generate sufficient energy
for the consumer to accomplish the job requirement which in turn would provide the
required income.
292
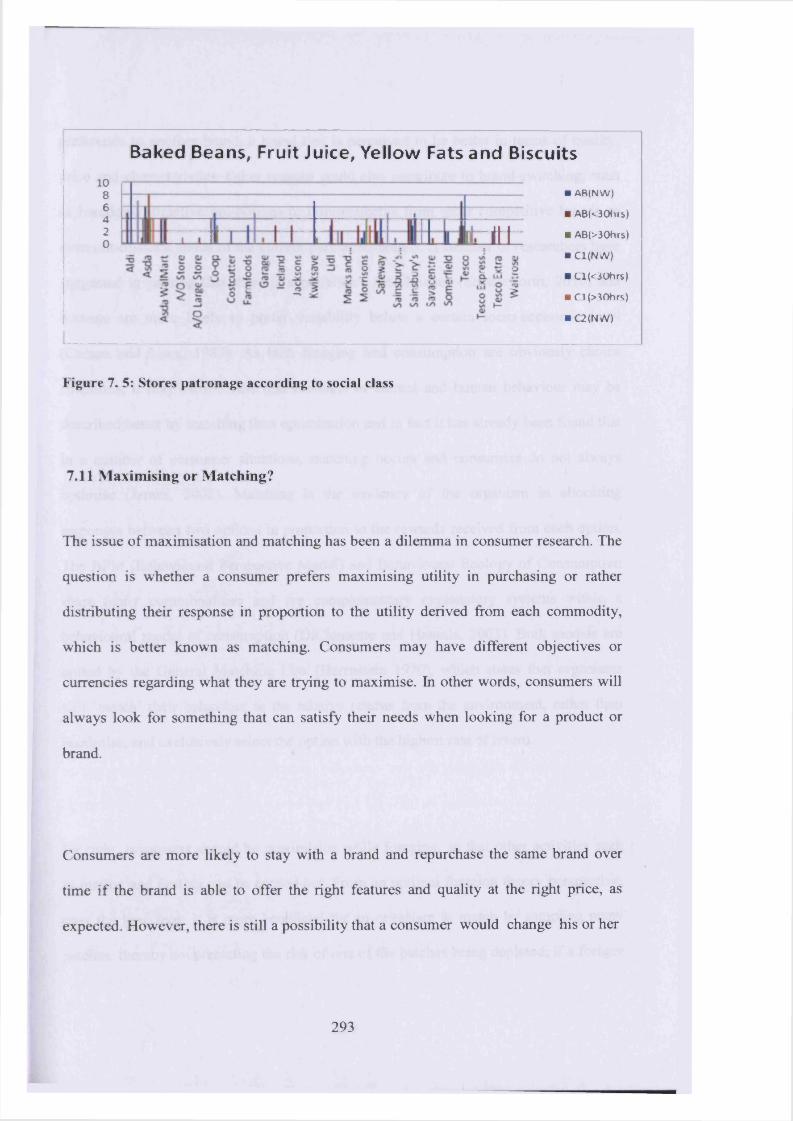
Baked Beans, Fruit Juice, Yellow Fats and Biscuits1086420 T t t ■ AB(>30hrs)
■ A B( NW)
■ AB(<30h»s)
■ Cl(NW)
■ Cl(<30hrs)
■ C1(>30hrs)
■ Q (N W )
Figure 7. 5: Stores patronage according to social class
7.11 M aximising or Matching?
The issue o f maximisation and matching has been a dilemma in consumer research. The
question is whether a consumer prefers maximising utility in purchasing or rather
distributing their response in proportion to the utility derived from each commodity,
which is better known as matching. Consumers may have different objectives or
currencies regarding what they are trying to maximise. In other words, consumers will
always look for something that can satisfy their needs when looking for a product or
brand.
Consumers are more likely to stay with a brand and repurchase the same brand over
time if the brand is able to offer the right features and quality at the right price, as
expected. However, there is still a possibility that a consumer would change his or her
2 9 3
preference to another brand, a brand that is perceived to be better in terms of quality,
price and characteristics. Other reasons could also contribute to brand-switching, such
as boredom, attractive promotions or improvements from other competitive brands or
even out-of-stock status of the current purchased brands. A number of researchers have
suggested in passing that there is a preference for variance (Shettleworth, 2010) and
humans are more likely to prefer variability below a certain socio-economic level
(Caraco and Lima, 1987). As both foraging and consumption are obviously choice
situations, it may be the case that accounts of animal and human behaviour may be
described better by matching than optimisation and in fact it has already been found that
in a number of consumer situations, matching occurs and consumers do not always
optimise (James, 2002). Matching is the tendency of the organism in allocating
responses between two options in proportion to the rewards received from each option.
The BPM (Behavioural Perspective Model) and Behavioural Ecology of Consumption
share many commonalities and are complementary explanatory systems within a
behavioural model of consumption (DiClemente and Hantula, 2003). Both models are
united by the General Matching Law (Hermstein 1970), which states that organisms
will ‘match’ their behaviour to the relative returns from the environment, rather than
maximise, and exclusively select the option with the highest rate of return.
By right, organisms should be maximising while foraging, so that other activities such
as mating and nesting can be carried out. From an optimal foraging theory perspective,
over the long term it is more beneficial for an organism to match by sampling many
patches, thereby counteracting the risk of one of the patches being depleted; if a forager
294

maximises all of its time and resources in one patch and that patch is depleted, the
forager may expire from lack of food (Rachlin et al., 1981). Animals nearly always
choose the alternative that maximises reinforcement from moment to moment
(Staddon, 1980). Psychologists have suggested that animals may use immediate
momentary maximisation where they would make the best choice at each decision,
rather than making the series of choices that is best in overall terms (Houston, 1987).
Such behaviour may be a rational response to both costs and varieties, which agrees
with the matching concept.
Matching indicates that animals are able to relate their response to the reinforcement
received. Therefore, animals are assumed to recognise the available alternatives before
making the correct choice. A prey is often detected by a predator through its
characteristics or features such as colour, smell and lights. Similarly, brand as a prey in
human consumption is able to provide signals to the consumers which can be seen as
discriminative stimuli in attracting the consumers to purchase. Quality, features and
price, for example, are among the characteristics that are important in brand
comparisons. Consumers’ purchasing decisions are related to the relative rates of
reinforcement earned where different responses are allocated for different rates of
reinforcement. Naturally, each brand has its own level of informational and utilitarian
reinforcement which influence consumers in making decision. Most consumers of any
brand buy other brands far more often than they buy their preferred brand (Foxall,
1999). Consumers tend to engage in multi-brand purchasing, having their own
repertoire of brands in their own mindset, which clearly shows that they are more likely
to engage in matching by selecting among brands according to their profitability.
295
Switching among brands that are either highly differentiated or less differentiated is
clearly an indication of melioration and matching. It may be better to describe human
consumption as matching, as consumers do not always optimise.
7.12 Summary
Consumption can be fully understood if consumers are recognised as biological
creatures that are shaped by both evolutionary factors and environmental influences and
experiences. Just as animals forage in savannahs and our ancestors survived as hunters
and gatherers, we are now foraging in grocery stores and online stores. Humans do not
simply develop new behaviours for every new situation but instead modify or extend
existing behaviours to suit the new situation; thus, the behaviours we exhibit when
purchasing in a shopping mall could be said to be an adaptation of our species’ ancestral
hunting and gathering skills (Kruger and Byker, 2009). Successful marketing seeks to
appeal to human nature; therefore, it is important for marketers to understand how the
consumer’s behaviour is related to evolutionary phenomena.
We engage in consumption in almost every part of our lives. Many of the consumption
patterns are related to our biological heritage. Food consumption is typically related to
our taste preference, which is an adaptation to the survival module in natural selection.
Even caloric scarcity and caloric uncertainty have led to the reason why fatty and sweet
foods are consumed (Nicholson and Xiao, 2007). In fact, during the approximately 1.2
296
million years that humans lived as hunter-gatherers, people evolved a preference for
foods with a nutritional value high in protein, carbohydrates and minerals (Colarelli and
Dettman, 2003). Hence, these evolved food preferences have an impact in the food
advertisements, where evolved preferences are highly employed in advertisements.
Coffee and alcohol consumption for example, have been found to strongly correlate
with ecological factors such as ambient temperature and hours of exposure to sunlight
(Nicholson and Xiao, 2007).Companies spend large sums of money on marketing,
particularly on advertising, but this can either result in consumers being attracted to buy
the product or just ignoring it. Psychological mechanisms have played an important role
in the development of preferences for many consumer products and marketing practices
(Burnham and Phelan, 2000).
The patch in foraging has been successfully defined in terms of stores and brands.
Currency and constraints in human consumption have also been linked to animal
foraging. As mentioned earlier, this thesis intends to determine the similarities between
the foraging in evolutionary psychology and the consumer’s behaviour in choosing
brands. The discussions are subjective, based on the researcher’s observations and
interpretations of the consumers’ purchasing histories. It is therefore important to note
that different observers might have different interpretations.
297

CHAPTER EIGHT

^ CHAPTER 8«»SUMMARY AND CONCLUSION
8.0 Introduction
This thesis has been built upon eight chapters that incrementally and dependently built
upon each other. Chapter One provides a general view of what to be expected from this
thesis. Chapter Two discusses a few important elements in marketing that are related to
this study such as the marketing and consumer, patterns of brand choice as well as the
roles of price. Chapters Three and Four present the theoretical framework in the form of
a review of literature on evolutionary psychology, foraging, behavioural economics and
Behavioural Perspective Model. The methodology of the thesis is presented in Chapter
Five, followed by the results and discussion in Chapter Six. In Chapter Seven,
comparison and interpretation based on the data are linked to the evolutionary
psychology and foraging theories. Chapter Eight, as the final chapter, concludes the
thesis. This final chapter provides an overview of this thesis, presents the various
contributions and implications for both business practitioners and academic researchers,
particularly those involved with consumer behaviour. The earlier chapters in this thesis
have outlined the background of the study and positioned the research within the
context of the academic literature which is supported by the major results and findings.
This final chapter discusses the conclusions of the study, elucidating its contribution
reflects upon its limitations and offers possible recommendations for future research.
299
8.1 Research Overview
‘Knowledge so conceived is not a series o f self-consistent theories that converge towards an ideal view; it is not a gradual approach to truth. It is rather an ever-increasing ocean o f mutually incompatible (and
perhaps even incommensurable) alternatives, each single theory, each fairy tale, each myth that is part o f the collection forcing the others into greater articulation and all o f them contributing, via this process o f competition, to the development o f our consciousness
(Feyerabend, 1975)
The fascination of consumer research lies in its capacity to open doors to different
theories, principles, philosophies and viewpoints, helping us to understand and
eventually learn about the complexity of human behaviour, particularly in purchasing.
The necessity of comprehending consumers’ behaviour is generated from the need to
predict their responses in making choices. Studies of consumer behaviour extend from
the awareness of a want, through the search and evaluation of possible means of
satisfying it and the act of purchase itself, to the evaluation of the purchased item in use,
which directly impacts upon the probability of repurchase (Alba et al., 1991).
Understanding consumer behaviour is imperative as it is the cornerstone of the
philosophy and practice of marketing that aims to inform, persuade or influence
consumers in decision making. Consumer behaviour has been studied from economic,
sociological and psychological perspectives, which all bring beneficial insights into
consumer behaviour. This research adapts Darwinian insights into natural selection as
300

this appears to bring a promising way in which behaviour can be analysed. Evolutionary
psychology revolves around humans’ evolved mentality and the impact on human traits
and behaviour and where the influence of the environment on our genes determines our
individual behaviour and traits, resulting in variations among us. The idea behind
evolutionary psychology studies is to understand human nature and to make predictions
about human behaviour by recognising the mechanisms of the human mind. In solving
different adaptive problems, our mind is adapted to deal with problems faced by our
hunter-gatherer ancestors. In addition, the pattern of consumption activities shown by
humans is akin to foraging in animals as humans browse, acquire and consume just like
other organisms (Rajala and Hantula, 2000). Foraging, which is a part of behavioural
ecology may provide new insights into consumer psychology and consumer behavioural
analysis. Humans, like animals, make their living by foraging (Lea and Newson, 2006).
Hence, the influences of Darwin, Dawkins, Hamilton, Skinner, Trivers and Watson
have shaped the direction of this research.
8.2 Main Findings
Research question one: How is modern human consumption analogous to the
foraging behaviour and activities o f animals and o f our ancestors?
The main objective of this study is to explore and discover how far the principles and
theories of evolutionary psychology and foraging are analogous to brand choice in
human consumption. As consumers are known to be engaged in numerous and complex
buying behaviours, the intention is more to discover to what extent animals’ and our
301

ancestors’ survival activities or foraging, are mirrored in modem human purchasing
behaviour. Humans as consumers in present-day society are bom with the brains and
behaviour of foragers. Thriving in a modem economy requires very different
behaviours but we manage as the human brain evolved to be flexible with the ability to
form cooperative networks with other humans and to maintain the shared body of
information, expertise and values which we call culture (Lea and Newson, 2006). The
authors conclude that evolutionary psychology is able to bring important insights to
social sciences based on its theory that human beings are product of genes and the genes
themselves are a product of evolution by natural selection. Humans are bom with gene
endowment, along with cultural inheritance, which combine to form their distinctive
preferences and abilities that allow them to survive (or not).
A comparative and interpretive method is used in this study, based on the panel data
from the ACNielsen Company and the literature reviewed in Chapter Three. A
discussion on similarities is presented in Chapter Seven, where definitions to the
elements of foraging in terms of modem human consumption have been made
successfully. Patch, for example, can be considered as a store or a brand. As animals
use more than one patch, the same pattern can be seen in human consumption where
consumers tend to be involved in both multi-brand and multi-store purchasing. Prey can
be seen as the brands as well as the reinforcement offered. The travel time in foraging is
similar to the price of a product or brand. Just as animals need to decide whether to
continue foraging at the same patch or travel to a new patch, which would impose a
time constraint to them, consumers can be seen to be influenced in choosing a brand by
the price differentiation. Currency or energy intake rate in foraging can be identified as
both the utilitarian and informational reinforcement where in purchasing a product or a
brand, consumers are found to be looking for satisfaction beyond the price and product
features. The fact that the theories of animals foraging can fit with consumers’ buying
behaviour implicates a possibility that some new theoretical frameworks for the
explanation of consumer choice can be derived, and thus, initiates this research. This
study has been able to examine the parallels between consumers’ purchasing behaviour
and the foraging activities of animals and of our past ancestors by looking at the
marketing mix, better known as the 4 P’s (price, product, place and promotion).
Products may appear to some consumers as attractive and good value, while to others
the same product may not be attractive and would be ignored. Human product choice is
a complex process which calls on multiple capacities of the mind (Lee et al., 2007). The
things that people want, purchase and consume are products of their evolved minds
(Buss, 2004). Just like animals foraging behaviour, moving through the patches while
making a decision whether to accept or reject the available prey choices, consumers can
be expected to wander in stores, deciding on the best product and brand choices.
Products are purchased for a variety of reasons and our biological heritage could
influence our buying behaviour. As such, marketers should design and tailor their
products to cater to these different needs and perceptions as best as possible.
In exploring the issue of products, this study provides evidence that the theories of
evolutionary psychology can be related to product and brand choice, as discussed in
more detail in Chapter Seven. Our preferences for fats and sugar, for example, which is
303

reflected by our consumption of fast food, confectionery, soft drinks and so forth,
despite their potentially adverse effects upon our health, can be related to the fat and
sugar contents that can be found in meat and fruits which were crucial to our ancestors’
diet in order for them to survive and reproduce. The craving for sugar and fat is shown
in this study, as it was found that on average, each respondent purchased 56 packs of
fruit juice and 46 packs of biscuits (sugar), while 38 packs of yellow fats were
purchased( fat and salt content) (Table 7.1). Obviously, the difference is that in modem
human consumption, these foods are readily available in supermarkets, grocery stores
and restaurants. Saad (2007) proposes that much of our product preferences can be
related to the Darwinian modules of reproduction, survival, kin selection and reciprocal
altruism. Baked beans and fruit juice, for instance, are generally purchased and
consumed for survival; to satisfy the needs of thirst and hunger, but from another
aspect, these are also purchased for kin selection, particularly when selecting premium-
priced brands. As parents are always trying to provide the best possible food in terms of
quality and nutrition for their families and are willing to spend more on these items,
advertisers will often target this evolved preference to induce their interest and positive
response.
Products and packaging in the market are mostly designed to evoke positive emotional
responses by reflecting our evolved human nature through their slogans, design and
pictures. Slogans are successful as they play directly into our evolved strategies that
have increased the survival and reproductive success of our ancestors throughout our
species’ evolutionary history (Saad, 2007) and are used effectively in advertisements as
304
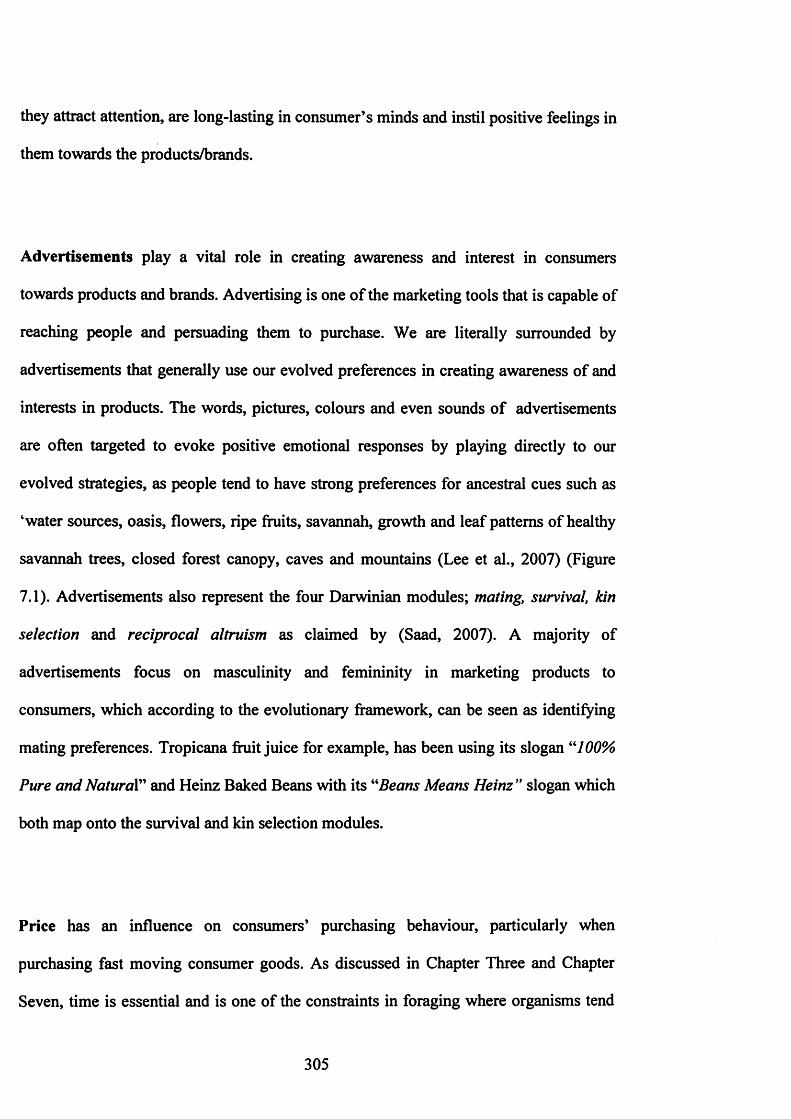
they attract attention, are long-lasting in consumer’s minds and instil positive feelings in
them towards the products/brands.
Advertisements play a vital role in creating awareness and interest in consumers
towards products and brands. Advertising is one of the marketing tools that is capable of
reaching people and persuading them to purchase. We are literally surrounded by
advertisements that generally use our evolved preferences in creating awareness of and
interests in products. The words, pictures, colours and even sounds of advertisements
are often targeted to evoke positive emotional responses by playing directly to our
evolved strategies, as people tend to have strong preferences for ancestral cues such as
‘water sources, oasis, flowers, ripe fruits, savannah, growth and leaf patterns of healthy
savannah trees, closed forest canopy, caves and mountains (Lee et al., 2007) (Figure
7.1). Advertisements also represent the four Darwinian modules; mating, survival, kin
selection and reciprocal altruism as claimed by (Saad, 2007). A majority of
advertisements focus on masculinity and femininity in marketing products to
consumers, which according to the evolutionary framework, can be seen as identifying
mating preferences. Tropicana fruit juice for example, has been using its slogan “100%
Pure and Natural” and Heinz Baked Beans with its “Beans Means Heinz” slogan which
both map onto the survival and kin selection modules.
Price has an influence on consumers’ purchasing behaviour, particularly when
purchasing fast moving consumer goods. As discussed in Chapter Three and Chapter
Seven, time is essential and is one of the constraints in foraging where organisms tend
305
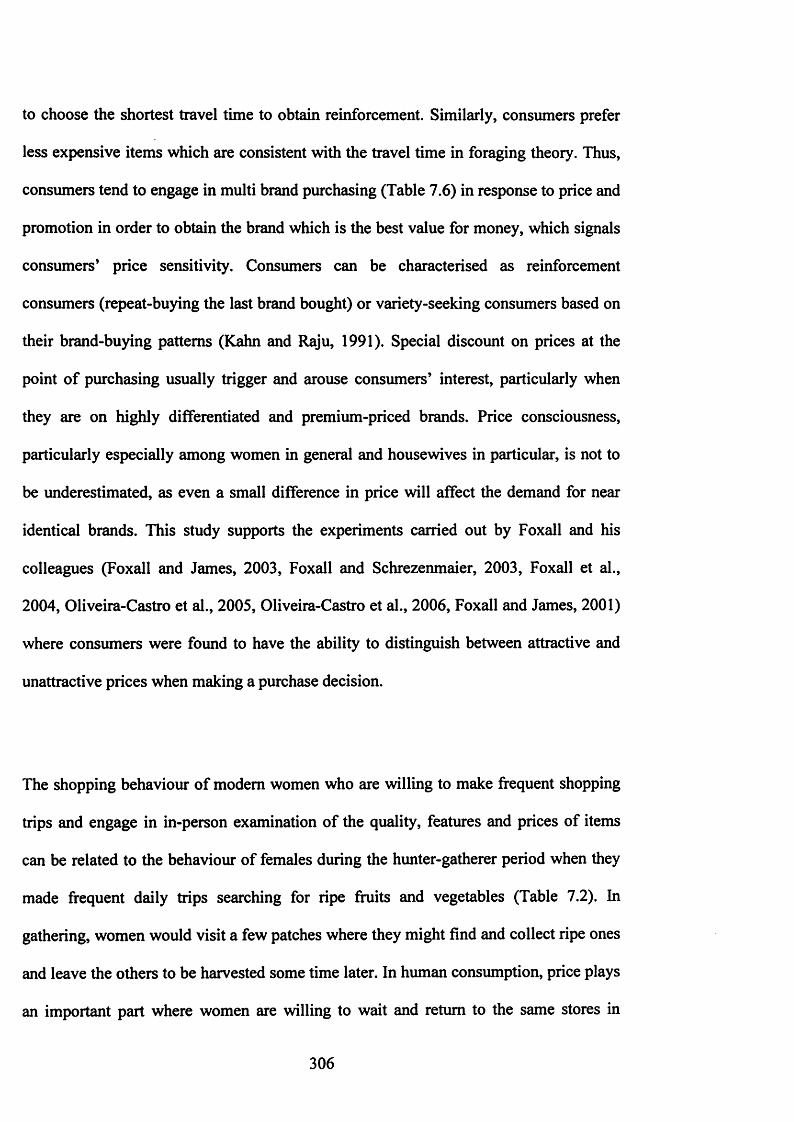
to choose the shortest travel time to obtain reinforcement. Similarly, consumers prefer
less expensive items which are consistent with the travel time in foraging theory. Thus,
consumers tend to engage in multi brand purchasing (Table 7.6) in response to price and
promotion in order to obtain the brand which is the best value for money, which signals
consumers’ price sensitivity. Consumers can be characterised as reinforcement
consumers (repeat-buying the last brand bought) or variety-seeking consumers based on
their brand-buying patterns (Kahn and Raju, 1991). Special discount on prices at the
point of purchasing usually trigger and arouse consumers’ interest, particularly when
they are on highly differentiated and premium-priced brands. Price consciousness,
particularly especially among women in general and housewives in particular, is not to
be underestimated, as even a small difference in price will affect the demand for near
identical brands. This study supports the experiments carried out by Foxall and his
colleagues (Foxall and James, 2003, Foxall and Schrezenmaier, 2003, Foxall et al.,
2004, Oliveira-Castro et al., 2005, Oliveira-Castro et al., 2006, Foxall and James, 2001)
where consumers were found to have the ability to distinguish between attractive and
unattractive prices when making a purchase decision.
The shopping behaviour of modem women who are willing to make frequent shopping
trips and engage in in-person examination of the quality, features and prices of items
can be related to the behaviour of females during the hunter-gatherer period when they
made frequent daily trips searching for ripe fruits and vegetables (Table 7.2). In
gathering, women would visit a few patches where they might find and collect ripe ones
and leave the others to be harvested some time later. In human consumption, price plays
an important part where women are willing to wait and return to the same stores in
306

order to purchase an item when it is on sale. Consumers will purchase a certain brand
when the price is considered reasonable and affordable, just as a gatherer would visit the
same patch to harvest fruits or vegetables when they were ripe or good enough to be
harvested.
With regard to place, this research is also able to explore store choice from a foraging
viewpoint. As discussed in Chapter Seven, a patch in terms of human consumption can
be taken as referring to a store, which highlights the importance of store management
and its strategies for the marketers in understanding the reasons behind consumers’
store choice. The fact that consumers patronise various stores and supermarkets to
purchase foods is akin to foragers attending several patches in order to catch their prey.
As discussed, consumers’ store choices can be influenced by various factors such as the
quality and selection of products, atmosphere, location, parking, convenience and even
the salespeople. In foraging, it is expected that a larger patch will have more available
prey. Similarly, a larger store as a patch is assumed by the consumers to have various
product categories and a wider selection of brands. Hence, most consumers prefer to
patronise larger stores like Asda and Tesco (Table7.2) as such stores offer a variety of
product categories and brands with a choice of price and quality, thus enabling
consumers to purchase almost all they need at the same store. As foraging animals are
expected to have more than one patch, consumers too can be seen patronising different
stores; this can be related to the patch sampling in foraging. Just as animals try or
sample alternatives rather than relying on their current patch, consumers can be seen
patronising different stores or supermarkets, as different stores offer different product
ranges, atmosphere and facilities. Loyalty programmes such as the Tesco Club Card for
307

example, are used by consumers to collect and redeem points, while extra facilities and
services such as coffee shops, parking spaces and services for senior citizens and
disabled people are provided by many stores to attract and retain customers.
The Behavioural Perspective Model and behavioural ecology of consumption share many
commonalities and are complementary explanatory systems within a behavioural model
of consumption (DiClemente and Hantula, 2003). The framework of the Behavioural
Perspective Model presents an alternative slant on consumer behaviour as it complements
current perspectives by drawing attention to the importance of behaviour-setting scope
and learning history as explicators of consumer choice and of utilitarian and
informational reinforcement as factors permitting clarification of the situational
interpretation of consumption (Foxall, 1997). Most of our purchasing is made by
referring to both utilitarian and informational reinforcement offered by the product
brands. Informational or symbolic reinforcement is involved with psychological, social or
intangible aspects of the products, whereas utilitarian reinforcement is more connected to
their functional attributes. The Behavioural Perspective Model portrays consumers as
utilising rules from various sources before purchasing. It helps us to understand the
reasons why a human being is unable to resist temptation, and thus does not make a better
choice of action. Humans are known to be continuously faced with various alternatives to
chose from, and these alternatives have different reinforcement levels.
This framework which has been successful in explaining consumer choice agrees with
the neo-Darwinian theory; an elaboration of Skinner’s three-term contingency. The
308
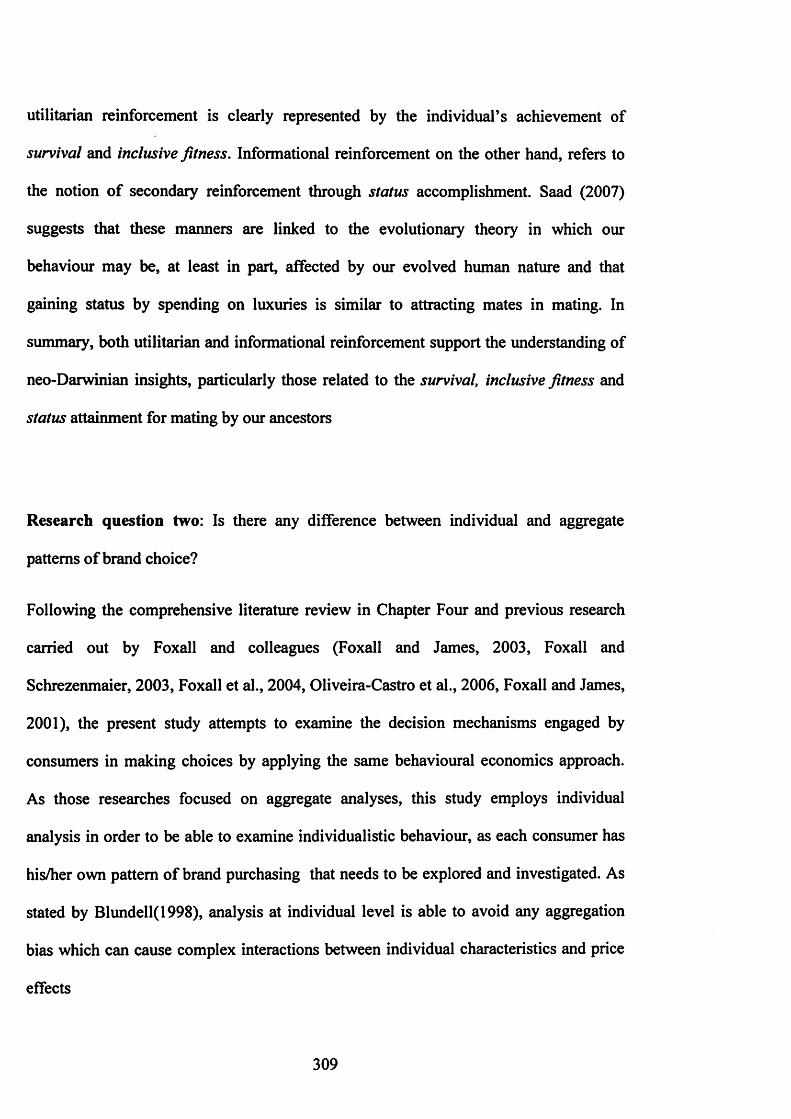
utilitarian reinforcement is clearly represented by the individual’s achievement of
survival and inclusive fitness. Informational reinforcement on the other hand, refers to
the notion of secondary reinforcement through status accomplishment. Saad (2007)
suggests that these manners are linked to the evolutionary theory in which our
behaviour may be, at least in part, affected by our evolved human nature and that
gaining status by spending on luxuries is similar to attracting mates in mating. In
summary, both utilitarian and informational reinforcement support the understanding of
neo-Darwinian insights, particularly those related to the survival, inclusive fitness and
status attainment for mating by our ancestors
Research question two: Is there any difference between individual and aggregate
patterns of brand choice?
Following the comprehensive literature review in Chapter Four and previous research
carried out by Foxall and colleagues (Foxall and James, 2003, Foxall and
Schrezenmaier, 2003, Foxall et al., 2004, Oliveira-Castro et al., 2006, Foxall and James,
2001), the present study attempts to examine the decision mechanisms engaged by
consumers in making choices by applying the same behavioural economics approach.
As those researches focused on aggregate analyses, this study employs individual
analysis in order to be able to examine individualistic behaviour, as each consumer has
his/her own pattern of brand purchasing that needs to be explored and investigated. As
stated by Blundell(1998), analysis at individual level is able to avoid any aggregation
bias which can cause complex interactions between individual characteristics and price
effects
309

With regard to the pattern of brand choice, it is essential to compare this study to the
work of Ehrenberg and colleagues, as their work is well-known in the field of
understanding consumers’ pattern of brand choice. Hence, Ehrenberg’s works on
consumers’ patterns of brand purchasing is compared with the finding of this study to
determine to what extent this research is in line with his work. As shown in Chapter Six,
most consumers are multi-brand purchasers and may even purchase several brands of
the same product on the same shopping trip (Table 6.3). Hence, it can be said that not
all consumers are 100% loyal to one single brand, as consumers seek different levels of
utilitarian and informational reinforcement from a brand. The percentage of sole
purchasers is less than 10%, which is in line with Ehrenberg’s findings; however, for
baked beans; the percentage of sole purchasers is 24% which is higher than the others.
This is due to the fact that consumers, when purchasing baked beans, are mostly loyal to
Heinz, preferring its taste and quality. Table 6.4 reveals the average size of consumers’
repertoires, where on average; each consumer has about 4 brands for each product
category; this result is also in line with Ehrenberg’s findings. Store loyalty, as claimed
by Keng et al(1984) does exist, but is not strong (Table 6.6). Hence, it can be said that
consumers do not only engage in multi-brand purchasing, but also in patronising multi-
brand stores.
Theories of matching law, the relative demand curve, maximisation analysis, and the
Behavioural Perspective Model are employed in the analysis based on the consumer
panel data. The matching law allows the substitutability of brands to be determined.
Price sensitivity is explained by the demand curve in the relative demand analysis whilst
maximising analysis allows us to understand the values that are maximised by
310
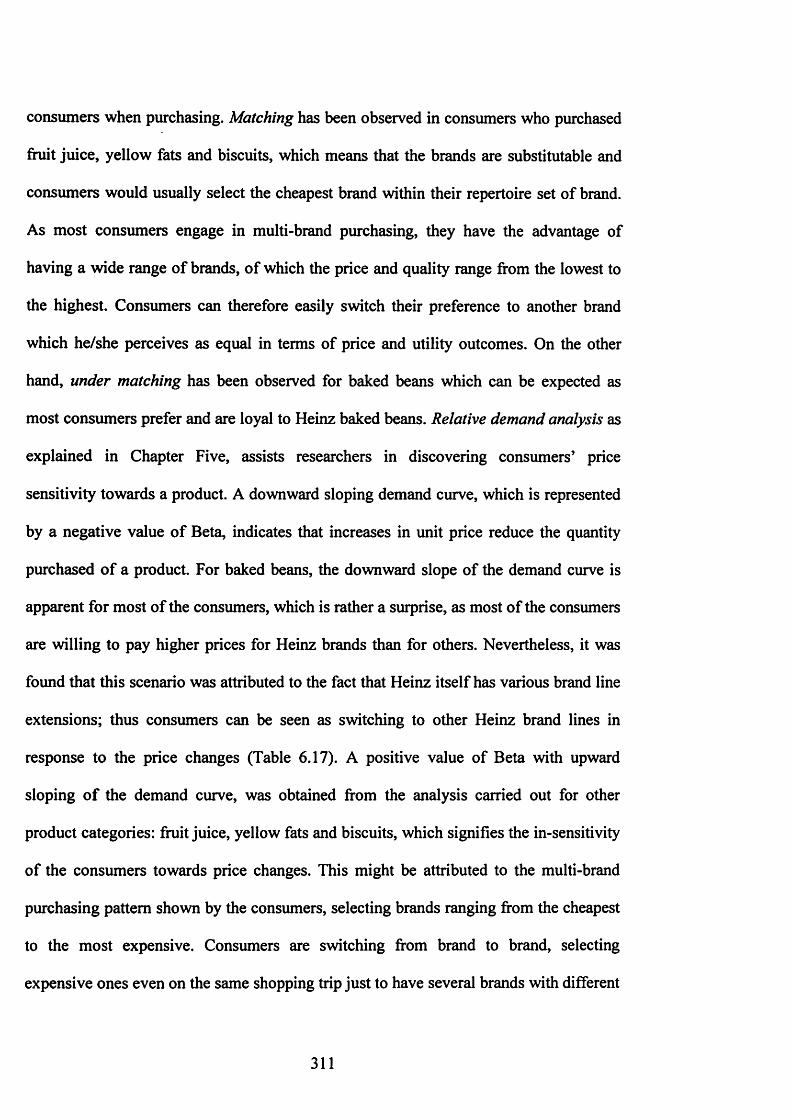
consumers when purchasing. Matching has been observed in consumers who purchased
fruit juice, yellow fats and biscuits, which means that the brands are substitutable and
consumers would usually select the cheapest brand within their repertoire set of brand.
As most consumers engage in multi-brand purchasing, they have the advantage of
having a wide range of brands, of which the price and quality range from the lowest to
the highest. Consumers can therefore easily switch their preference to another brand
which he/she perceives as equal in terms of price and utility outcomes. On the other
hand, under matching has been observed for baked beans which can be expected as
most consumers prefer and are loyal to Heinz baked beans. Relative demand analysis as
explained in Chapter Five, assists researchers in discovering consumers’ price
sensitivity towards a product. A downward sloping demand curve, which is represented
by a negative value of Beta, indicates that increases in unit price reduce the quantity
purchased of a product. For baked beans, the downward slope of the demand curve is
apparent for most of the consumers, which is rather a surprise, as most of the consumers
are willing to pay higher prices for Heinz brands than for others. Nevertheless, it was
found that this scenario was attributed to the fact that Heinz itself has various brand line
extensions; thus consumers can be seen as switching to other Heinz brand lines in
response to the price changes (Table 6.17). A positive value of Beta with upward
sloping of the demand curve, was obtained from the analysis carried out for other
product categories: fruit juice, yellow fats and biscuits, which signifies the in-sensitivity
of the consumers towards price changes. This might be attributed to the multi-brand
purchasing pattern shown by the consumers, selecting brands ranging from the cheapest
to the most expensive. Consumers are switching from brand to brand, selecting
expensive ones even on the same shopping trip just to have several brands with different
311
benefits in terms of quality and price (Table 6.21). Maximisation analysis, as discussed
in Chapter Five posits that an individual would always seek the best value or in other
words, choose the cheapest alternative. For maximisation, most of the consumers can be
seen as maximising when purchasing all four product categories.
From the empirical results it can be concluded that, overall: 1. Most of the consumers
are multi-brand purchasers. 2. Brands for fruit juice, yellow fats and biscuits are
substitutable and consumers tend to choose the cheapest brand. 3. Brands for baked
beans are not substitutable and consumers prefer to spend more on highly differentiated
brands such as Heinz. 4. Consumers do maximise in purchasing, not solely on the
utilitarian reinforcement but also on the informational reinforcement. The three analyses
display interesting consumer choice patterns; however, a better understanding can be
gained from the matching and maximisation analyses compared to relative demand
analysis. The low value of adjusted R and Beta signals the need for a better method to
examine the price-quantity relationship.
The dilemma of whether consumers are maximising or matching is also discussed in
Chapter Seven. Both foraging and consumption involve making choices; therefore both
animals and human behaviour may be described better by matching than maximising, as
organisms will ‘match’ their behaviour to the relative returns from the environment,
exclusively selecting the option with the highest rate of return. In foraging itself, it is
more beneficial for an animal to match by sampling many patches, thereby
counteracting the risk of one of the patches being depleted; if a forager maximises all of
312
its time and resources in one patch and that patch is depleted, the forager may expire
from lack of food (Rachlin et al., 1981). Animals nearly always choose the alternative
that maximises reinforcement from moment to moment (Hinson and Staddon, 1983). In
human consumption, a consumer would change his or her preference to another brand;
as consumers favour variety, particularly in terms of quality, price and characteristics.
This contributes to the fact that most consumers engage in multi-brand purchasing,
seeking different reinforcements from the selected brands as, literally, each brand has its
own level of informational and utilitarian reinforcement which influence consumers in
making decisions.
8.3 Research Contribution
The main contribution of this thesis is the evaluations that have been made on the
evolutionary psychology and foraging theories in relation to human consumption in the
real market. This research has illustrated the analogousness of human consumption and
animal foraging behaviour, suggesting that human consumption behaviour is adaptive,
while consumers’ behaviour in grocery shopping can be meaningfully framed and
analysed from the standpoint of evolutionary psychology and foraging. As mentioned
by Saad and Gill (2000), evolutionary psychology tries to emphasise the ultimate rather
than proximate explanations for human behaviour; hence, the emphasis is more on
explaining why a particular behaviour is manifested in the marketplace, rather than
emphasising what the behaviours manifested in the marketplace are. The success of this
research in comparing and finding similarities between the two areas with human
313

consumption as well as defining the patch represents a vital step in revealing the
consumer behaviour. Currency, for example, if it is well understood, would help
marketers, particularly, in determining and understanding the types and levels of
reinforcement involved in attracting consumers. Ideas, information and explanation
through the lens of evolutionary psychology would add more valuable knowledge to
consumer behaviour research. Modem consumers as foragers still spend endless time in
foraging, albeit in the different settings of grocery stores, supermarkets, malls and
internet sites (Kruger and Byker, 2009). Evolutionary psychology, with the influence of
genes and culture, can indeed shed light on consumers’ behaviour. Modem humans are
the products not just of biological evolution, but of a co-evolutionary process in which
genetic and cultural evolution interact (Lea and Newson, 2006). Thus, this study adds to
the literature by extending the knowledge of consumer behaviour from an evolutionary
psychology perspective.
This study has been also successful in extending the earlier research by Foxall and
colleagues (Foxall and James, 2003, Foxall and Schrezenmaier, 2003, Foxall et al.,
2004, Foxall and James, 2001), particularly by adapting the behavioural economics
approach to the study of consumer choice in the context of modem marketing systems.
Techniques that were developed earlier by behavioural economists are employed to
analyse the patterns of consumer choice, particularly those occurring in the real market
of supermarkets and grocery stores. Just as brand choices were generally marked by
ideal matching and maximisation in the previous studies, the same pattern was found for
most of the consumers in this study; purchasing fruit juice, yellow fats and biscuits. As
the previous analyses were done aggregately, the analyses in this research were carried
314

out individually in order to obtain more robust findings. It is believed that each
consumer might have discrepancies which need to be explored and investigated. Hence,
individual analysis in this research is predicted to be able to contribute more to
determining and understanding the underlying factors that motivate and control the
patterns of consumers’ brand and product choice. This study can be considered as an
extension of the earlier studies by contributing to the robustness and reliability of the
research.
The questions of how and what consumers maximise have long been an issue among the
researchers. It was thought by earlier researchers that monetary value was the only
element that a consumer maximises; searching for the cheapest available brand. This
study contributes to the knowledge by revealing that consumers maximise both the
monetary and non-monetary value, as consumers can be seen purchasing highly
differentiated or premium-priced brands along with the cheaper ones. Consumers do
sometimes buy the most expensive alternatives or purchase both cheaper and expensive
versions on the same shopping trip. There is no clear reason for these behaviours. Yet,
evaluating each of the consumers’ purchasing histories from the panel data allows us to
determine that consumers maximise by considering not only the utilitarian
reinforcement (price and features) but also the informational reinforcement such as
taste, quality and satisfaction. Both the product functionality and branding can be
further analysed in elucidating to what extent consumers can be said to maximise.
315

The Behavioural Perspective Model has been used in a variety of studies of consumer
behaviour, including brand and product choice. The usefulness of the Behavioural
Perspective Model in understanding consumer behaviour is extended by linking it to
foraging and evolutionary psychology. The discriminative stimuli and the learning
history which reflects the consequences in consumer’s purchasing decision are replaced
with the elements in foraging and evolutionary psychology in order to obtain a different
perspective of consumer behaviour study. For example, the utilitarian and informational
reinforcement in the Behavioural Perspective Model can be related to the survival,
status/mating and inclusive fitness factors in foraging. This study was successful in
relating the theories to the model, thus contributing to consumer behaviour knowledge.
8.4 Limitations
Despite this study’s contributions to knowledge, it is however pertinent to note that this
research has its limitations and constraints. Firstly, there is the issue of sole buyers. Sole
buyer or exclusive purchaser, refers to consumers who only purchase the same brand in
a product category or are 100% loyal to a single brand over the investigation period.
According to Ehrenberg (1988), the proportion of 100% brand loyal purchasers is low,
at about 10% of all buyers. As shown in Chapter Six (Table 6.3), on average, there are
about 10% of sole buyers for each product category. These sole purchasers could not be
examined and exhibit a limiting factor to the analyses as regression analysis could not
be carried out in SPSS and graphs could not be plotted due to the lack of data points.
316
Secondly, there is the question of whether to use ratios or proportions in the analysis, as
discussed in Chapter Five. This study employs proportion (Brand A / Brand A + Brand
B), which is in line with Hermstein’s (1961) original Matching Law. Baum (1974)
extended the Matching Law by introducing his Generalised Matching Law (Brand A/
Brand B). Earlier researchers (Foxall and Schrezenmaier, 2003, Foxall et al., 2004,
Oliveira-Castro et al., 2005) have applied the Generalised Matching Law, where ratios
are used rather than proportion. Schrezenmaier (2005) raised the issue of using ratios,
as many data points were lost by switching from proportions to ratios. As the data in
this study is analysed individually, using ratios is a constraint, particularly when
analysing sole purchasers or consumers who only purchased brand A (preferred brand)
in the same month. Therefore, proportion calculation is used in order to avoid an
insufficiency of data points. Furthermore, proportional calculations have been
successfully used earlier (James, 2002) and in this study, a comparison has been made
with a few data using both ratio and proportional calculations which yielded almost
similar results.
Thirdly, as the analysis was done individually in this thesis, the problem of limited data
points was found in carrying out the relative demand analysis. There are even cases
where purchases of Brand A or favourite brand were made in the same month; therefore
the relative demand analysis could not be done. The low values of the adjusted R and
Beta indicate a weak relationship between the relative price and relative quantity
demanded, thus signalling that a more precise method should be sought. Maximisation
analysis, on contrary, could be carried out for each consumer; however, the constraint
was the plotting of data points in the graph. In order to determine whether maximisation
317
is occurring, the amount bought ratio is plotted against the probability reinforcement.
Maximisation is presented graphically by a step function where consumers are said to
be maximising when the data points are mostly located to the right of the 0.5 mark. It
was sometimes a problem to determine whether the data points were more on the right
or left of the line. It was also difficult to assess exactly what was meant by the pattern of
data points, particularly when equal numbers of data points were located on each side of
the graphs. Furthermore the data points were scattered rather than vertically located.
Nevertheless, these patterns were only found for the individual analysis and not the
aggregate analysis in this study, indicating that greater attention and appropriate method
are needed in examining the maximisation pattern for individual consumers.
Finally, there are consumers who seldom purchased (or did not scan most of their
purchases) or light purchasers. It was not possible to carry out the earlier intention of
analysing more respondents from the consumer panel due to the fact that not all the
respondents could be used. The reasons for this are discussed in previous chapters
(Chapters Five and Six). Firstly, not all consumers purchased all the four product
categories and secondly, some of these respondents were very light buyers, purchasing
each product less than five times in a year. As this study needs to determine the pattern
of brand choice across products, only respondents who had purchased all the product
categories were selected. In order to avoid an insufficiency of data points, these
respondents were required to purchase at least five items in each of the product
categories.
318
8.5 Future Direction
There are indeed a number of directions that could be taken in future research indicated
in this study. The study of the 20 consumers purchasing four product categories is able
to provide a reliable significance of the theories used in this research as these data are
analysed individually. It is sensible to suggest that the same analysis could be done
using a larger sample in order to determine the possibility that the same patterns may
occur.
It would also be interesting to analyse goods other than fast-moving consumer goods in
order to identify any similarities or differences. This study can be extended with more
product categories or services and even to other countries. Different countries with
different cultures may reveal different scenarios of consumer buying patterns,
particularly in terms of their brand choice and price responsiveness.
The study on foraging was carried out in this research by observing the purchasing
history of consumers. It would be interesting if the same study could be done
quantitatively in order to have numerical results that could support the robustness of the
theories. Furthermore, as this research adopts comparative methods, other research
methods, such as cross-cultural research, could also be used. As stated by Workman and
Reader (2004), if a particular trait is supposed to be adaptive, then we might expect to
find it in all people irrespective of the particulars of their culture. However, this may not
319
be true, as evolved and adapted behaviours are shaped and influenced by the
environment and cultural forces. Therefore it would be interesting to find out more by
carrying out research in different countries with different cultures.
8.6 Summary
This chapter begins with a general overview of the whole thesis followed by discussions
on the contributions and limitations of this study relating to the consumers’ behaviour in
choosing brands. A few suggestions are also presented for the future research directions.
To understand the evolution of things, one must understand their history as well as the
environmental forces that have influenced them. Humans do not simply develop new
behaviours for every new situation, but instead modify or extend existing behaviours to
suit the new situation; thus, our behaviours in modem shopping malls or stores should
be based on previously developed behaviours and skills (Kruger and Byker, 2009).
Understanding how consumers make purchasing decisions by applying evolutionary
insights is beneficial to marketers and can assist them in designing product features,
packaging and advertising. Understanding consumption is vital, as many of us spend a
considerable amount of money and time in it. As human shopping behaviour resembles
animal foraging behaviour, academicians and practitioners should look for new and
innovative methods to learn this behaviour. As Buss (2005) states, we are Pleistocene-
era hunter-gatherers now living in environments that have changed much more
320

drastically and quickly than slow process of natural selection; strangers in a strange
land.
321
REFERENCES

ABEYASEKERA, S., LAWSON-MCDOWALL, J. & WILSON, I. M. 2000. Converting ranks to scores for an ad-hoc procedure to identify methods of communication available to farmers. [Online]. Available: http://w w w .reading.ac.uk/ssc [Accessed 26 July 2010].
ADCOCK, D., HALBORG, A. & ROSS, C. 2001. Marketing principles and practice, Essex, Prentice Hall.
ALBA, J., HUTCHINSON, W. & LYNCH, J. G. 1991. M emory and decision making. In: THOMAS, S. R. & KASSARJIAN, H.H. (eds.) Handbook of consumer research. Englewood Cliffs,New Jersey: Prentice Hall.
ALBAN ESE, P. J. 1988. Psychological foundations of economic behaviour, London, Praeger.
ALHADEFF, D. A. 1982. Microeconomics and human behaviour.toward a new synthesis of economics and psychology, Berkeley,California, University of California Press.
ALLISON, J. 1983. Behavioural economics, New York, Praeger.ANDERSON, E. T. & SIM ESTER, D. I. 2003. Mind your pricing cues. Harvard Business
Review, 81,97-103.BARTHOLOMEW, D. J. 1984. Discussion:the Dirichlet:a com prehensive model of buying
behaviour. The Journal of the Royal Statistical Society Series A (General), 147, 643-644.
BATTALIO, R. C., KAGEL, J. H., RACHLIN, H. & GREEN, L. 1981. Commodity-choicebehaviour with pigeons as subjects. Journal of Political Economy, 89,67-91.
BATTALIO, R. C., KAGEL, J. H., WINKLER, R. C., FISHER, E. B., BASMANN, R. L. &KRASNER, L. 1973a. A te s t of consum er dem and theory using observations of individual consum er purchases. Western Economic Journal, 9 ,411-428.
BATTALIO, R. C., KAGEL, J. H., WINKLER, R. C , FISHER, E. B., BASMANN, R. L. &KRASNER, L. 1973b. A te s t of consum er dem and theory using observations of individual consum er purchases. Economic Inquiry, 11,411-428.
BATTALIO, R. C., KAGEL, J. H., WINKLER, R. C., FISHER, E. B., BASMANN, R. L. &KRASNER, L. 1974. An experimental investigation of consum er behaviour in a controlled environm ent. Journal of Consumer Research, 52-60.
BAUM, W. M. 1974. On tw o types of deviation from the matching law:bias andunderm atching. Journal of the Experimental Analysis of Behaviour, 22, 231-242.
BAUM, W. M. 1975. Time allocation in human vigilance. Journal of the Experimental Analysis of Behaviour, 23,231-242.
BAUM, W. M. 1979. M atching,undermatching and overm atching in studies of choice. Journal of the Experimental Analysis of Behaviour, 32, 269-281.
BAUM, W. M. 1981. Maximization theory:som e empirical problems. Behavioural and Brain Sciences, 4,389-390.
BEARDEN, W. 0 . 1977. Determ inant attributes of store patronage:dow ntow n versus outlying shopping areas. Journal of Retailing, 53,15-22.
BEGG, D., FISCHER, S. & DORNBUSCH, R. 1997. Economics, London, McGraw-Hill Book Company Europe.
BELL, J. 1999. Doing your research project, Buckingham, Open University Press.BERRY, L. L. & KUNKEL, J. H. 1970. In pursuit of consum er theory. Decision Sciences, 1,
25-39.
323

BIGELOW, G. & EMURIAN, H. I. E. 1974. A program m ed environm ent for th eexperim ental analysis of individual and small group behaviour. In: MILES, C. G. (ed.) Experimentation in controlled environments and its implications for economic behaviour and social policy making. Toronto, Canada: Addiction Research Foundation.
BLAIKIE, N. 1993. Approaches to social enquiry, Cambridge, Polity Press.BLOCH, P. H., RIDGWAY, N. M. & DAWSON, S. A. 1994. The shopping mall as consum er
habitat. Journal of Retailing, 70, 23-42.BLOOM, D. 1984. Discussion:the Dirichletia com prehensive model of buying behaviour.
The Journal of the Royal Statistical Society Series A (General), 147, 647.BLUNDELL, R. 1998. Consumer behaviour: theory and empirical evidence - a survey.
The Economic Journal, 98,16-65.BORDLEY, R. F. 1983. A central principle of science:optimization. Behavioural Science,
28, 53-64.BOYD, R. & SILK, J. 2006. How humans evolved, New York, W. W. Norton & Company.BRADSHAW, C. M., SZABADI, E. & BEVAN, P. 1976. Behaviour of humans in variable-
interval schedules of reinforcem ent. Journal of the Experimental Analysis of Behaviour, 26,135-141.
BRYMAN, A. 2004. Social research methods, Oxford, Oxford University Press.BURNHAM, T. & PHELAN, J. 2000. Mean genes, Cambridge, Perseus.BURNSTEIN, E., CRANDALL, C., KITAYAMA, S. & 1994. Some neo-Darwinian decision
rules for altruism: weighing cues for inclusive fitness as a function of the biological im portance of th e decision. Journal of Personality and Social Psychology, 67,773-789.
BURRELL, G. & MORGAN, G. 1979. Sociological paradigms and organisational analysis, London, Heinemann Educational Books.
BUSS, D. M. 1999. Evolutionary psychology, Boston, Allyn and Bacon.BUSS, D. M. 2004. Evolutionary psychology:the new science of the mind,
Boston,M assachusets, Pearson.BUSS, D. M. 2005. The handbook of evolutionary psychology, Hoboken,New Jersey,
John Wiley and Sons,Inc.CAMARGO, M. & DONAHUE, K. L. 2008. Looking through th e evolutionary
lens:consum er behaviour and evolutionary psychology. Journal of Social, Evolutionary and Cultural Psychology, 2, 69-73.
CAMERER, C. 1999. Behavioural economics : reunifying psychology and economics. Proceedings of th e National Academy of Sciences, USA. 10575-10577.
CARACO, T. & LIMA, S. L. 1987. Survival, energy budgets and foraging risk. In:COMMONS, M. L., SHETTLEWORTH, S. J. & KACELNIK, A. C. (eds.) Quantitative analyses of behaviour vol 6:foraging. Plainfield,New Jersey: Lawrence Erlbaum Associates.
CASSELL, C. & SYMON, G. 1994. Qualitative research in work contexts. In: CASSELL, C. & SYMON, G. (eds.) Qualitative methods in organizational research.Thousand Oaks, California: SAGE Publications.
CATANIA, A. C. 1994. Learning, Upper Saddle River,New Jersey, Prentice Hall.CHAO, A. & SCHOR, J. 1998. Empirical te s t of status consumption. Journal of Economic
Psychology, 19,107-131.
324
CHARNOV, E. L. 1976. Optimal foragingithe Marginal Value Theorem. Theoretical Population Biology, 9 ,129-136.
CHARNOV, E. L., ORIANS, G. H. & HYATT, K. 1976. Ecological implications of resource depression. American Naturalist, 110,247-259.
CHURCHILL, G. A. 1999. Marketing research:methodological foundations, Fort W orth, Texas, The Dryden Press.
CHURCHILL, G. A. J. & IACOBUCCI, D. 2002. A paradigm for developing b e tte r m easures for split-half realiability coefficients. Journal of Marketing Research, 16, 64-73.
COLARELLI, S. M. & DETTMAN, J. R. 2003. Intuitive evolutionary perspectives in m arketing practices. Psychology and Marketing, 20,837-865.
COLEMAN, J. 1973. The mathematics of collective action, London, Heinemann.COLEMAN, J. S. 1986. Psychological structure and social structure in Economic Models
The Journal of Business, 59, S365-S369.CONGER, R. & KILLEEN, P. 1974. Use of concurrent operants in small group research.
Pacific Sociology Review, 17, 399-416.COOK, R. M. & HUBBARD, S. F. 1977. Adaptive searching strategies in insect parasites.
Journal of Animal Ecology, 46,115-125.CORDAIN, L., WATKINS, B. & MANN, N. 2001. Fatty acid composition and energy
density of foods available to African hominids:evolutionary implications for hum an brain developm ent. World Review of Nutrition and Dietics, 90,144-161.
COSMIDES, L. &TOOBY, J. 1997. Characterizing hum an psychological adaptations. In: BOCK, G. R. & CARDEW, G. (eds.) Chichester: Wiley.
CRESWELL, J. W., CLARK, V. L. P., GUTMANN, M. L. & HANSON, W. E. 2003. Advanced mixed m ethods research designs. In: TASHAKKORI, A. & TEDDLIE, C. (eds.) Handbook of mixed methods in social and behavioural research. Thousand Oaks,California: SAGE Publications.
CROUCH, S. & HOUSDEN, M. 2003. Marketing research for managers, Amsterdam, Butterworth-Heinem ann.
CUMMINS, S. & MACINTYRE, S. 1999. The location of food stores in urban areas: a case study in Glasgow. British Food Journal, 101,545 - 553.
CUNNINGHAN, R. M. 1961. Custom er loyalty to store and brand. Harvard Business Review, 37,127-137.
CURRIM, I. S. & SCHNEIDER, L. G. 1991. A taxonom y of consum er purchase strategies in a prom otion intensive environment. Marketing Science, 10,91-110.
DARWIN, C. 1872. The expression of emotions in man and animals, New York, Philosophical Library.
DAVISON, M. & JENKINS, P. E. 1985. Stimulus discriminality, contingency discriminality and schedule perform ance. Animal Learning and Behaviour, 13,77-84.
DAVISON, M. & MCCARTHY, D. 1988. The matching law:a research review, Hillsdale, New Jersey, Lawrence Erlbaum Associates
DAWKINS, R. 1976. The selfish gene, Oxford, Oxford University Press.DAWKINS, R. 1989. The selfish gene, Oxford, Oxford University Press.DENZIN, N., K. & LINCOLN, Y. S. 1994. Handbook of qualitative research, Thousand
Oaks,California, SAGE Publications.DENZIN, N. K. & LINCOLN, Y. S. 1998. Collecting and interpreting qualitative materials,
London, SAGE Publications.
325
DENZIN, N. K. & LINCOLN, Y. S. 2003. Collecting and interpreting qualitative materials, California, SAGE Publications.
DEROSA, D. M., HANTULA, D. A., KOCK, N. & DARCY, J. 2004. Trust and leadership in virtual team work: a media naturalness perspective. Human Resource Management, 43 ,219-232 .
DEVILLIERS, P. A. & HERRNSTEIN, R. J. 1976. Toward a law of response strength. Psychological Bulletin, 83,1131-1153.
DICKSON, P. R. & SAWYER, A. G. 1990. The price knowledge and search of superm arket shoppers. Journal of Marketing, 54,42-53.
DICLEMENTE, D. F. & HANTULA, D. A. 2003. Applied behavioural economics and consum er choice. Journal of Economic Psychology, 24,589-602.
DOGU, U. & ERKIP, F. 2000. Spatial factors affecting wayfinding and orientatiom a case study in a shopping mall .Environmental Behaviour, 32,731-755.
DUNBAR, R. 1996. Grooming,gossip and the evolution of language, London, Faber and Faber Limited.
DUNBAR, R. 2004. The human story:a new history of mankind's evolution, London, Faber and Faber Limited.
DUNN, R. & WRIGLEY, N. 1984. Store loyalty for grocery products: an empirical study. Area, 16,307-314.
EAST, R., LOMAX, W., WILLSON, G. & HARRIS, P. 1994. Decision making and habit in shopping tim es. European Journal of Marketing, 28, 56-71.
EASTERBY-SMITH, M. 1997. Disciplines of organizational learning:contributions and critiques. Human Relations, 50,1085-1116.
EASTERBY-SMITH, M., GOLDEN-BIDDLE, K. & LOCKE, K. 2008. Working with pluralism: determ ining quality in qualitative research. Organizational Research Methods, 11,419-429.
EASTERBY-SMITH, M., THORPE, R. & LOWE, A. 1991. Management research:an introduction, Beverly Hills,California, SAGE Publications.
EHRENBERG, A. S. C. 1972. Repeat buying:theory and application, Amsterdam, North Holland Publishing Company.
EHRENBERG, A. S. C. 1986. Pricing and brand differentiation. Singapore Marketing Review, 1 ,5-13.
EHRENBERG, A. S. C. 1988. Repeat buying:f acts,theory and applications, New York, Oxford University Press.
EHRENBERG, A. S. C. 1991. New brands and th e existing market. Journal of the Market Research Society, 33, 285-299.
EHRENBERG, A. S. C., GOODHART, G. J. & BARWISE, P. 1990. Double jeopardy revisited Journal of Marketing, 54,82-91.
EHRENBERG, A. S. C., HAMMOND, K. & GOODHART, G. J. 1994. The after-effects ofprice-related consum er promotions. Journal of Advertising Research, 34,11-21.
EHRENBERG, A. S. C. & SCRIVEN, J. 1999. Brand loyalty. In: EARL, P. E. & KEMP, S. (eds.) The elgar companion to consumer research and economic psychology. Cheltenham,Gloucestershire: Edward Elgar.
EHRENBERG, A. S. C. & UNCLES, M. 1999. Understanding Dirichlet-type markets. R&D Initiative Research Report.
326
EHRENBERG, A. S. C., UNCLES, M. D. & GOODHARDT, G. J. 2004. Understanding brand perform ance m easures: using Dirichiet benchmarks. Journal of Business Research, 57 1307-1325.
ELIFFE, D., B.M., J. & DAVISON, M. 1999. Leaving patches: effects of economy, deprivation and session duration. Journal of the Experimental Analysis of Behaviour, 72,373-383.
ERIKSSON, P. & KOVALAINEN, A. 2008. Qualitative methods in business research, London, SAGE Publication.
FANTINO, E. 1969. Choice and rate of reinforcem ent. Journal of the Experimental Analysis of Behaviour, 12,723-730.
FANTINO, E. 1977. Conditioned reinforcem entxhoice and information. In: HONIG, W.K. & STADDON, J. E. R. (eds.) Handbook of operant behaviour. Englewood Cliffs,New Jersey: Prentice Hall.
FANTINO, E. 1981. Contiguity,response strength and th e delay-reduction hypothesis.In: HARZEM, P. & ZEILER, M. D. (eds.) Advances in analysis of behaviour (Vol 2) predictability, correlation and contiguity. Chichester and New York: Wiley.
FANTINO, E. 8i ABARCA, N. 1985. Choice,optimal foraging and th e delay-reduction hypothesis. The Behavioural and Brain Sciences, 8 ,315-330.
FANTINO, E. & LOGAN, C. 1979. The experimental analysis of behaviour: a biological perspective, San Francisco, W.H. Freeman.
FANTINO, E. & PRESTON, R. A. 1989. The delay-reduction hypothesis:som e new tests. In: BOND, N. W. & SIDDLE, D. A. T. (eds.) Psychobiology:issuses and applications. North Holland, Amsterdam: Elsevier.
FEYERABEND, P. 1975. Against method, London, NLB.FISCHER, E. & ARNOLD, S. J. 1990. More than a labor o f love: gender roles and
Christmas gift shopping. Journal of Consumer Research,17,333-345.FISHER, H. E. 1994. Anatomy of love:the natural history of monogamy,adultery and
divorce, New York, Norton and Company.FISHER, H. E. 1998. Lust,attraction and attachm ent in mammalian reproduction.
Human Nature, 9, 23-52.FISHER, W. W. & MAZUR, J. E. 1997. Basic and applied research on choice responding.
Journal of Applied Behaviour Analysis, 30,387-410.FOTHERINGHAM, A. S. 1988. Consumer store choice and choice set definition.
Marketing Science, 7,299-310.FOXALL, G. & JAMES, V. K. 2006. Matching,maximization and consum er choice. Cardiff
University.FOXALL, G. R. 1980. Consumer behaviouna practical guide, Beckenham, Kent, Croom
Helm Ltd.FOXALL, G. R. 1990. Consumer psychology in behavioural perspective, London
Routledge.FOXALL, G. R. 1992. The Behavioural Perspective Model of purchase and
consum ption:from consum er theory to m arketing practice. Journal of the Academy of Marketing Science, 20,189-198.
FOXALL, G. R. 1993. Consumer behaviour as an evolutionary process. European Journal of Marketing, 27,46-57.
327

FOXALL, G. R. 1994. Consumer psychology and behaviour analysis. Journal of Economic Psychology, i 5 , 5-91.
FOXALL, G. R. 1996. Consumers in context:the BPM research program, London and New York, International Thomson.
FOXALL, G. R. 1997. Marketing psychoiogy:the paradigm in the wings, London, MacMillan.
FOXALL, G. R. 1998. Radical behaviorist in terpretatiom generating and evaluating an account o f consum er behaviour. The Behaviour Analyst, 21,321-354.
FOXALL, G. R. 1999. The substitutability of brands. Managerial and Decision Economics, 20, 241-57.
FOXALL, G. R. 2000. The contextual stance in consum er research. European Journal of Marketing, 34, 768-779.
FOXALL, G. R. 2001. Foundations of consum er behaviour analysis. Marketing Theory, 1, 165-199.
FOXALL, G. R. 2005. Understanding consumer choice, New York, Palgrave MacMillan.FOXALL, G. R. & JAMES, V. K. 2001. Behaviour analysis of consum er brand choice : a
preliminary analysis. European Journal of Behaviour Analysis,2, 209-220.FOXALL, G. R. & JAMES, V. K. 2003. The behavioral ecology of brand choice: how and
w hat do consum ers maximize? Psychology and Marketing, 20, 811-836.FOXALL, G. R., OLIVEIRA-CASTRO, J. M., JAMES, V. K. & SCHREZENMAIER, T. C. 2007.
Brand choice in behavioural perspective. In: FOXALL, G. R., OLIVEIRA-CASTRO, J. M., JAMES, V. K. & SCHREZENMAIER, T. C. (eds.) The behavioural economics of brand choice. Basingstoke,Hampshire: Palgrave Macmillan.
FOXALL, G. R., OLIVEIRA-CASTRO, J. M., JAMES, V. K., YANI-DE SORIANO, M. &SIGURDSSON, V. 2006. Consumer behaviour analysis and social m arketing:the case o f environm ental conservation. Behaviour and Social Issues, 15,101-124.
FOXALL, G. R., OLIVEIRA-CASTRO, J. M. & SCHREZENMAIER, T. C. 2004. The behavioural econom ics of consum er brand choice: pa tterns of reinforcem ent and utility maximization. Behavioural Processes, 66,235-260.
FOXALL, G. R. & SCHREZENMAIER, T. C. 2003. The behavioural economics of consum er brand choice: establishing a methodology. Journal of Economic Psychology 24, 675-695.
FOXALL, G. R., WELLS, V. K., CHANG, S. W. & OLIVEIRA-CASTRO, J. M.2010.Substitutability and independence:m atching analyses of brands and products. Journal of Organizational Behaviour Management, 30,145-160.
GARCIA, J. R. & SAAD, G. 2008. Evolutionary neuromarketing:darwinizing the neuroimaging paradigm for consum er behaviour. Journal of Consumer Behaviour, 7, 397-414.
GEILBRUMM, B. (eds.) European perspectives on consumer behaviour.Hemel Ham pstead: Hertfordshire: Prentice Hall.
GOODHART, G. J., EHRENBERG, A. S. C. & CHATFIELD, C. 1984. The Dirichlet:acom prehensive model of buying behaviour. Journal of the Royal Statistical Society Series, 147,621-643.
GRAY, R. D. 1987. Faith and foraging: a critique of th e paradigm argum ent from design. In: KAMIL, A. C., KREBS, J. R. & PULLIAM, H. R. (eds.) Foraging behaviour. New York: Plenum Press.
328

GREEN, L. & FREED, D. E. 1993. The substitutability of reinforcers. Journal of the Experimental Analysis of Behaviour, 60,141-158.
GREEN, L. & RACHLIN, H. 1991. Economic substitutability of electrical brainstim ulation,food and w ater. Journal of Experimental Analysis Behaviour, 55, 133-143.
GUBA, E. G. & LINCOLN, Y. S. 1994. Competing paradigms in qualitative research. In:DENZIN, N. L. & LINCOLN, Y. S. (eds.) Handbook of qualitative research. London: SAGE Publications.
GUBA, E. G. & LINCOLN, Y. S. 1998. Competing paradigms in qualitative research. In: DENZIN, N. K. & LINCOLN, Y. S. (eds.) The landscape of qualitative research: theories and issues. Thousand Oaks,CA,London: SAGE Publications.
GUJARATI, D. N. 2003. Basic econometrics, Boston, McGraw Hill.GUPTA, S., CHINTAGUNTA, P., KAUL, A. & WITTINK, D. R. 1996. Do household scanner
data provide representative inferences from brand choices: a comparison with s to re data. Journal of Marketing Research,33 ,383-398.
GURVEN, M. 2004. To give or to give not:an evolutionary ecology of human food transfers. Behavioural and Brain Sciences, 27,543-583.
GURVEN, M. & VON RUEDEN, C. 2006. Hunting, social status and biological fitness. Biodemography and Social Biology.
HALPERN, R. H. 1980. Guest editoriakevolutionary psychology and consumption. Psychology and Marketing, 20, 757-763.
HAMILTON, W. D. 1964. The genetical evolution o f social behaviour. Journal of Theoretical Biology, 7 ,1-16.
HANNAN, M. T. 1971. Aggregation and disaggregation in sociology,Lexington,M assachusett, Heath.
HANTULA, D. A. 2003. Guest editorial: evolutionary psychology and consumption. Psychology and Marketing, 20,757-763.
HANTULA, D. A. 2010. The behavioural ecology of human foraging in an onlineenvironm ent:of omnivores,informavores and hunter-gatheres. In: KOCK, N. (ed.) Evolutionary psychology and information systems research. New York: Springer.
HANTULA, D. A., DICLEMENTE, D. F. & RAJALA, A. K. 2001. Outside th e box : theanalysis of consum er behaviour. In: HAYES, L., AUSTIN, J., HOUMANFAR, R. & CLAYTON, M. (eds.) Organisational change. Nevada: Context Press.
HANTULA, D. A., DICLEMENTE, D. F. & SMITH, C. L. 2008. Online shopping as foraging: th e effects of increasing delays on purchasing and patch residence. IEEE Transactions on Professional Communication, 51,147-154.
HARRIS, M. 1977. Cannibals and kings, New York, Random House Inc.HATCH, M. J. & CUNLIFFE, A. 2006. Organization theory, Oxford, Oxford University
Press.HEALY, M. & PERRY, C. 2000. Comprehensive criteria to judge validity and reliability of
qualitative research within th e realism paradigm. Qualitative Market Research - An International Journal, 3,118-126.
329
HENRICH, J., BOYD, R., BOWLES, S., CAMERER, C., FEHR, E., GINTIS, H., MCELREATH, R., ALVARD, Mi, BARR, A., ENSMINGER, J., HENRICH, N. S., HILL, K., GILL-WHITE, F., GURVEN, M., MARLOWE, F. W., PATTON, J. Q. & TRACER, D. 2004. "Economic man" in cross-cultural perspective:economic experim ents in 15 small scale societies. In: HENRICH, J., BOYD, R., BOWLES, S., CAMERER, C., FEHR, E. & GINTIS, H. (eds.) Foundations of human sociality:ethnography and experiments in 15 small-scale societies. Oxford: Oxford University Press.
HERRNSTEIN, R. J. 1961. Relative and absolute strength of response as a function of frequency of reinforcem ent. Journal of the Experimental Analysis of Behaviour,4, 267-272.
HERRNSTEIN, R. J. 1964. A periodicity as a factor in choice. Journal of Experimental Analysis Behaviour, 7 ,179-182.
HERRNSTEIN, R. J. 1970. On th e law of effect. Journal of the Experimental Analysis of Behaviour, 13, 243-266.
HERRNSTEIN, R. J. 1988. A behavioural alternative to utility maximization. In: MAITAL,5. (ed.) Evolution and its influence. London: Oxford University Press.
HERRNSTEIN, R. J. 1990a. Rational choice theory:necessary but not sufficient. AmericanPsychologist, 45,356-367.
HERRNSTEIN, R. J. 1990b. Behaviour,reinforcement and utility. Psychological Science, 4, 217-224.
HERRNSTEIN, R. J. 1997. The matching iaw:papers in psychology and economics, Cambridge, Harvard University Press.
HERRNSTEIN, R. J. & LOVELAND, D. H. 1975. Maximising and matching on concurrent ratio schedules. Journal of the Experimental Analysis of Behaviour, 24,107-116.
HERRNSTEIN, R. J. & VAUGHAN, W. 1980. Melioration and behavioural allocation. In: STADDON, J. E. R. (ed.) Limits to actiomthe allocation of individual behaviour. New York: Academic Press.
HEYMAN, G. M. 1996. Elasticity of dem and for alcohol in hum ans and rats. In: GREEN,L. & .J.H., K. (eds.) Advances in behavioural economics vol 3. Norwood, New Jersey: Ablex.
HINSON, J. M. & LOCKHEAD, G. R. 1987. M om entary and global maximizing.Behavioural Processes, 14, 21-34.
HINSON, J. M. & STADDON, J. E. R. 1983. Matching, maximising, and hill-climbing.Journal of the Experimental Analysis of Behaviour, 40,321-331.
HOCH, S. J., KIM, B.-D., MONTGOMERY, A. L. & ROSSI, P. E. 1995. Determ inants of store-level price elasticity. Journal of Marketing Research, 32,17-29.
HOEPFL, M. C. 1997. Choosing qualitative research:a primer for technlogy educationreseorc/?ers.fOnline1.Available:http://scholar.lib.vt.edu/eioum als/JTE/v9nl/hoe pfl.html [Accessed November 11,2010].
HOLBROOK, M. B. 1987. W hat is consum er research? Journal of Consumer Research,14,128-132.
HOUSTON, A. 1.1987. The control of foraging. In: COMMONS, M. L., KACELNIK, A. &SHETTLEWORTH, S. J. (eds.) Quantitative analyses of behaviour vol 6: foraging. Hillsdale,New Jersey: Lawrence Erlbaum Associates,Inc.
HOYER, W., D. 1984. An examination of consum er decision making for a common repeat purchase product. Journal of Consumer Research, 11, 822-829.
330
HSIAO, C. 2003. Analysis of panel data, Cambridge, Cambridge University Press.HUBONA, G. S. & SHI RAH, G. W. 2006. The paleolithic stone age effect?Gender
differences performing specific com puter-generated spatial tasks. International Journal of Technology and Human Interaction, 2,24-46.
HUDSON, L. A. & OZANNE, J. L. 1998. Alternative ways of seeking knowledge in consum er research. Journal of Consumer Research, 14,508-521.
HUFF, D. L. 1964. Defining and estimating a trading area. Journal of Marketing, 28, 34- 38.
HUGHES, J. A. & SHARROCK, W. 1997. The philosophy of social research, London, Longman.
HURSH, S. R. 1980. Economic concepts for th e analysis of behaviour. Journal of the Experimental Analysis of Behaviour, 34,219-238.
HURSH, S. R. 1984. Behavioural economics. Journal of the Experimental Analysis of Behaviour, 42,435-452.
HURSH, S. R. 1993. Behavioural economics of druf self-administration:an introduction. Drug and alcohol dependence, 33,165-172.
HURSH, S. R. 2000. Behavioural economics concepts and m ethods for studying health behaviour. In: BICKEL, W. K. & VUCHINICH, R. E. (eds.) Reframing health behaviour change with behavioural economics. Mahwah, New Jersey: Lawrence Erlbaum Associates Inc.
HURSH, S. R. & BAUMANN, R. A. 1987. The behaviour analysis of dem and In: GREEN, L. & KAGEL, J. H. (eds.) Advances in behavioural economics.Norwood, New Jersey: Ablex Publishing Corporation.
HUSSEY, J. & HUSSEY, R. 1997. Business research:a practical guide for undergraduate and postgraduate students, Basingstoke, Palgrave.
JACOBY, J. 1976. Consumer psychology:an octennium . Annual Review of Psychology, 27, 331-358.
JAMES, L. R. 1982. Aggregation bias in estim ates o f perceptual agreem ent. Journal of Applied Psychology, 67,219-229.
JAMES, V. K. 2002. The relevance of behavioural economics to the analysis of consumer choice. Doctor of Philosophy PhD, Cardiff University.
JENSEN, J. M. 2011. Consumer loyalty on th e grocery product market:an empiricalapplication of Dick and Basu's framework. Journal of Consumer Marketing, 28, 333-343.
JEULAND, A. 1984. Discussion:the dirichletia com prehensive model of buyingbehaviour. The Journal of the Royal Statistical Society Series A (General), 147, 649-650.
JOHNSTON, J. M. & PENNYPECKER, H. S. 1993. Readings for strategies and tactics of behavioural research, Hillsdale,New Jersey, Lawrence Erlbaum.
JOPPE, M. 2000. The research process. Available:http://www.ryerson.ca/mjoppe/rp.htm [Accessed February 16,2011].
KAGEL, J. & BATTALIO, R. 1980. Token economy and animal models for th eexperim ental analysis of economic behaviour. In: KMENTA, J. & RAMSEY, J. B. (eds.) Evaluation of econometric models. New York: Academic Press.
331
KAGEL, J., BATTALIO, R., RACHLIN, H. & LEONARD, G. 1981. Demand curves for animal consumers! Quarterly Journal of Economics, 66,1-15.
KAGEL, J. H. 1987. Economics according to th e rats (and pigeons to o ) : w hat have we learned and w hat can we hope to learn? In: ROTH, A. E. (ed.) Laboratory experiments in economics:six points of view. Cambridge: Cambridge University Press.
KAGEL, J. H., BATTALIO, R. C. & GREEN, L. 1995. Economic choice theory:anexperimental analysis of animal behaviour, Cambridge, Cambridge University Press.
KAGEL, J. H., BATTALIO, R. C., GREEN, L. & RACHLIN, H. 1980. Consumer dem and theory applied to choice behaviour of rats. In: STADDON, J. E. R. (ed.) Limits to action: the allocation of individual behaviour. New York Academic Press.
KAGEL, J. H., BATTALIO, R. C., RACHLIN, H., BASMANN, R. L., GREEN, L. & KLEMM, W. R. 1975. Experimental studies of consum er dem and behaviour using laboratory animal. Economic Inquiry 8, 22-38.
KAGEL, J. H. & WINKLER, R. C. 1972. Behavioural economics: areas of cooperativeresearch betw een economics and applied behaviour analysis. Journal of Applied Behaviour Analysis, 5,335-342.
KAHN, B. E. & RAJU, J. S. A. 1991. Effects of price prom otions on variety-seeking and reinforcem ent behavior .Marketing Science, 10,316-337.
KAU, A. K. & EHRENBERG, A. S. C. 1984. Patterns of store choice. Journal of Marketing Research, 21,399-409.
KAZDIN, A. E. 1981. The token economy. In: DAVEY, G. (ed.) Applications of conditioning theory. London: M ethuen.
KAZDIN, A. E. & BOOTZIN, R. R. 1972. The token economy:an evaluative review. Journal of Applied Behavioural Analysis, 5 ,343 - 372.
KENESEI, Z. & TODD, S. 2003. The use of price in th e purchase decision. Journal of Empirical Generalisations in Marketing Science, 8 ,1-21.
KENG, K. A., EHRENBERG, A. S. C. & 1984. Patterns of store choice. Journal of Marketing Research, 21,399-409.
KERLINGER, F. N. 1979. Behavioural research.a conceptual approach, New York,Holt,Rinehart and Winston.
KOCK, N. 2004. The psychobiological m odektoward a new theory of com puter- m ediated communication based on darwinian evolution. Organizational Science, 15, 327-348.
KOCK, N. 2005. Media richness or media naturalness?The evolution of our biological communication apparatus and its influence on our behaviour tow ard e- communication tools. IEEE Transactions on Professional Communication, 48, 117-130.
KOCK, N. 2010. Evolutionary psychology and Information system s theorizing, in: KOCK, N. (ed.) Evolutionary psychology and information systems research:a new approach to studying the effects of modern technologies on human behaviour. New York: Springer.
KOHLI, A. K. & JAWORSKI, B. J. 1990. M arket orientation : th e construct, research propositions and managerial implications. Journal of Marketing, 54,1-18.
332
KOLAKOWSKI, L. 1993. An overall view of positivism. In: HAMMERSLEY, M. (ed.) Social research:philosophy,politics and practice. London: SAGE Publications.
KOTLER, P. 1999. Kotler on marketing: how to create, win, and dominate markets Chatham,Kent, Mackays of Chatham Pic.
KOTLER, P. & KELLER, K. L. 2006. Marketing management, Upple Saddle River,New Jersey, Prentice- Hall.
KOTLER, P. & LEVY, S. J. 1969. Broadening th e concept of marketing. Journal of Marketing, 33,10-15.
KREBS, J. R., KACELNIK, A. & TAYLOR, P. 1978. Test of optimal sampling by foraging tits. Nature, 275, 27-31.
KRUGER, D. & BYKER, D. 2009. Evolved foraging psychology underlies sex differences in shopping experiences and behaviours. Journal of Social, Evolutionary and Cultural Psychology, 3,1-15.
LARSEN, C. S. 2003. Animal source foods and hum an health during evolution. Journal of Nutrition, 133, 3893S -3897S.
LATTIN, J. M. & BUCKLIN, R. E. 1989. Reference effects of price and promotion on brand choice behaviour. Journal of Marketing Research, 26, 299-310.
LE BOUTILLIER, J., LE BOUTILLIER, S. & SCOTT, A. 1994. A replication and extension of th e Dickson and Sawyer price-awareness study. Marketing Letters, 5,31-42.
LEA, S. E. G. 1978. The psychology and economics of dem and. Psychological Bulletin,85, 441-466.
LEA, S. E. G. 1981. Animal experim ents in economic psychology. Journal of Economic Psychology, 1, 245-271.
LEA, S. E. G. & NEWSON, L. 2006. Prospects for an evolutionary economic psychology:buying and consumption as a te s t case. The Evolution of Consumption Workshop. Max-Planck-lnstitut fur Okonomik, Jena, Germany.
LEA, S. E. G., TARPY, R. M. & WEBLEY, P. T. 1987. The individual in the economy: a textbook of economic psychology.Cambridge, Cambridge University Press.
LEE, N., BRODERICK, A. & CHAMBERLAIN, I. 2007. W hat is 'neurom arketing? A discussion and agenda for future research. International Journal of Psychophysiology, 63,199-204.
LEVY, M., GREWAL, D., KOPALLE, P. L. & HESS, J. D. 2004. Emerging trends in retail pricing practice:implications for research. Journal of Retailing, 80, xiii-xxi.
LEWIN, S. B. 1996. Economics and psychologyilessons for our own day from th e early tw entie th century. Journal of Economic Literature, 34,1293-1323.
LIMA, S. L. 1983. Downy woodpecker foraging behaviour:foraging by expectation and energy intake rate. Oecologia, 58,232-237.
LIMA, S. L. 1984. Downy woodpecker foraging behaviour:efficient sampling in simple stochastic environm ents. Ecology, 65,166-174.
LIMA, S. L. & ZOLLNER, P. A. 1996. Towards a behavioural ecology of ecological landscapes. Trends in Ecology and Evolution, 11,131-135.
LUCK, D. J. 1969. Broadening th e concept of m arketing-too far. The Journal of Marketing, 33,53-55.
MACCRIMMON, K. R. &TODA, M. 1969. The experim ental determ ination of indifference curves The Review of Economic Studies 36,433-451.
333

MADDEN, G. J. 2000. A behavioural economics primer. In: BICKEL, W. K. & VUCHINICH, R. E. (eds.) Reframing health behaviour change with behavioural economics M ahwah, New Jersey: Lawrence Erlbaum Associates Inc.
MARCEAU, N. & MYERS, G. 2006. On th e early holocene: foraging to early agriculture. The Economic Journal, 116,751-772.
MARTENS, B. K. & HOUK, J. L. 1989. The application of Herrnstein's law of effect to disruptive and on-task behaviour of a retarded adolescent girl. Journal of Experimental Analysis Behaviour, 51,17-27.
MAZUR, J. E. 1991. Choice, in: IVERSEN, I. H. & LATTEL, K. A. (eds.) Experimental analysis of behaviour -part 1. Amsterdam: Elsevier Science Publishers.
MCALLISTER, L 2006. Introduction to th e marketing science institute special section on academ ic and practitioner collaborative research. Journal of Marketing Research, 43,515-517.
MCCARTHY, D., VOSS, P. & DAVISON, M. 1994. Leaving patches:effects of travelrequirem ents. Journal of Experimental Analysis of Behaviour, 62,185-200.
MCDOWELL, J. J. 1988. Matching theory in natural hum an environm ents. The Behaviour Analyst 11,95-109.
MCKENNA, R. 1991. Marketing is everything. Harvard Business Review, 69, 65-79.MELLGREN, R. L. & BROWN, S. W. 1987. Environmental constraints on optimal-foraging
behaviour. In: COMMONS, M. L., KACELNIK, A. & SHETTLEWORTH, S. J. (eds.) Quantitative analyses of behaviour vol vi foraging Hillsdale, New Jersey: Lawrence Erlbaum Associates.
MELLGREN, R. L. & BROWN, S. W.1988a. Discrimination learning in a foraging situation. Journal of Experimental Analysis Behaviour, 50,493-503.
MELLGREN, R. L. & BROWN, S. W. 1988b. Discrimination learning in a foraging situation Journal of the Experimental Analysis of Behaviour, 50 ,493-503.
MOERMOND, T. C., DENSLOW, J. S., LEVEY, D. J. & SANTANA, C. 1987. The influence of context on fruit selection by tropical birds. In: COMMONS, M. L., KACELNIK, A.& SHETTLEWORTH, S. J. (eds.) Quantitative analyses of behaviour vol 6: foraging. New Jersey: Lawrence Erlbaum Associates.
MYERSON, J. & HALE, S. 1984. Practical implications of th e matching law. Journal of Applied Behaviour Analysis, 17,367-380.
NICHOLSON, M. & XIAO, S. H. 2007. Darwin's ghost: evolutionary psycholoy consum er behaviour analysis. Durham University.
NICHOLSON, M. & XIAO, S. H. 2010. On th e evolutionary bases of consum erreinforcem ent. Journal of Organizational Behavior Management, 30,127-144.
O'CONNELL, J. F. & HAWKES, K. 1984. Food choice and foraging sites among the Alyawara. Journal of Anthropological Research, 40, 504-535.
O'SHAUGHNESSY, J. 1992. Explaining buyer behaviour: central concepts and philosophy of science issues, Oxford, Oxford University Press.
OLIVEIRA-CASTRO, J. M., FOXALL, G. R. & JAMES, V. K. 2010. Consumer brandchoice:money allocation as a function of brand reinforcing attributes. Journal of Organizational Behaviour Management, 30,161-175.
OLIVEIRA-CASTRO, J. M., FOXALL, G. R. & SCHREZENMAIER, T. C. 2005. Patterns of consum er response to retail price differentials. Service Industries Journal, 25, 309-327.
334

OLIVEIRA-CASTRO, J. M., FOXALL, G. R. & SCHREZENMAIER, T. C. 2006. Consumerbrand choice: individual and group analyses of dem and elasticity. Journal of the Experimental Analysis of Behaviour, 85,147-166.
OLIVER, C., HALL, S. & NIXON, J. 1999. A molecular to molar analysis of communicative and problem behaviour. Research in Developmental Disabilities, 20,197-213.
OSTROFF, C. 1993. Comparing correlations based on individual-level and aggregated data. Journal of Applied Psychology, 78,569-582.
PAN, Y. & ZINKHAN, G. W. 2006. Determ inants of retail patronage: a meta-analytica perspective. Journal of Retailing, 82,229-243.
PEDERSEN, L. J. & JENSEN, M. B. 2007. Concurrent schedules of reinforcem ent as am ethod to quantify th e relative attractiveness of tw o rooting materials. Applied Animal Behaviour Science, 107,147-151.
PENROSE, E. T. 1959. The theory of the growth of the firm, Oxford, Oxford University Press.
PHILLIPS, F. 1984. Discussion:the Dirichlet:a com prehensive model of buyingbehaviour. The Journal of the Royal Statistical Society Series A (General), 147, 650.
PIERCE, W. D. & EPLING, W. F. 1983. Choice, matching and hum an behaviour. The Behaviour Analyst, 6 ,57-76.
PINSON, C. & JOLIBERT, A. 1998. Consumer b eh av iou r: An overview of current approaches and issues. In: LAMBKIN, M., FOXALL, G., VAN RAAIJ, F. &
PIROLLI, P. 2007. Elementary foraging models. In: PETER, P. (ed.) Information Foraging Theory: Adaptive Interaction with Information. New York: Oxford University Press.
PIROLLI, P. & CARD, S. 1999. Information foraging. Psychological Review, 106,643-675.POPKOWSKI LESZCZYC, P. T. L., SINHA, A. & TIMMERMANS.H.J.P. 2000. Consumer store
choice dynamics: an analysis of th e com petitive m arket structure for grocery stores. Journal of Retailing, 76,323-345.
PRATT, R. W. 1972. Marketing applications o f behavioural economics. In: STRUMPEL,B., MORGAN, J. N. & ZAHN, E. (eds.) Human behaviour in economic affairs '.essays in honor of George Katona, with concluding comments by George Katona. Am sterdam : London Elseveir.
PYKE, G. H. 1984. Optimal foraging theory:a critical review. Annual Review of Ecology and Systematics, 15,523-575.
RACHLIN, H. 1980. Economics and behavioural psychology. In: STADDON, J. E. R. (ed.) Limits to action:the allocation of individual behaviour. New York: Academic Press.
RACHLIN, H. 1989. Judgement,decision and choice:a cognitive/behavioural synthesis, New York, WHFreeman and Company.
RACHLIN, H. 2000. The science of self-control, Cam bridge,M assachusett, Harvard University Press.
RACHLIN, H. 2003. Economic concepts in th e behavioural study of addiction In:VUCHINICH, R. E. & HEATHER, N. (eds.) Choice,behavioural economics and addiction. Oxford: Elsevier.
RACHLIN, H., BATTALIO, R., KAGEL, J. & GREEN, L. 1981. Maximization theory in behavioural psychology. The Behavioural and Brain Sciences, 4, 371-417.
335

RACHLIN, H., GREEN, L., KAGEL, J. H. & BATTALIO, R. C. 1976. Economic dem and theory and psychological studies of choice. In: BOWER, G. (ed.) The psychology of learning and motivation. New York: Academic Press.
RACHLIN, H. C. 1982. Economics of the matching law. In: COMMONS, M. L.,HERRNSTEIN, R. J. & RACHLIN, H. (eds.) Quantitative analysis of behaviour vol 2:matching and maximizing accounts. Cambridge,M assachusetts: Ballinger.
RAG IN, C. 1994. Constructing social research:the unity and diversity of method, Thousand Oaks,California, Pine Forge Press.
RAJALA, A. K. & HANTULA, D. A. 2000. Towards a behavioral ecology of consumption: delay-reduction effects on foraging in a simulated Internet mall. Managerial and Decisions Economics, 21,145-158.
RAO, V. 1984. Pricing research in m arketing:the s ta te of th e art. Journal of Business,57, 539-560.
RASHOTTE, M. E., O'CONNELL, J. M. & DJURIC, V. J. 1987. M echanisms of signal- controlled foraging behaviour. In: COMMONS, M. L., KACELNIK, A. & SHETTLEWORTH, S. J. (eds.) Quantitative analyses of behaviour vol 6:foraging. Hillsdale,New Jersey: Erlbaum.
REBER, A. S. 1995. The Penguin Dictionary of Psychology, London, Penguin Books.RECHTEN, C., AVERY, M. & STEVENS, A. 1983. Optimal prey selection:why do great tits
show partial preferences? Animal Behaviour, 31,576-584.RHEE, H. & BELL, D. R. 2002. The inner-store mobility of superm arket shoppers. Journal
of Retailing, 78,225-237.RICHERSON, P. J. & BOYD, R. 2005. Not by genes alone: how culture transformed
human evolution, Chicago, University of Chicago Press.ROBINSON, W. S. 1950. Ecological correlations and the behaviour of individuals.
American Sociological Review, 15,351-357.ROMERO, S., FOXALL, G. R., SCHREZNMAIER, T. C , OLIVEIRA-CASTRO, J. M. & JAMES, V.
K. 2006. Deviations from matching in consum er choice. European Journal of Behaviour Analysis, 7 ,15-40.
ROY, D. & LAHIRI, I. 2004. Some tests for suitability of brand switching model.European journal of Marketing, 38,534-536.
SAAD, G. 2007. The evolutionary bases of consumption, M ahwah,New Jersey, Lawrence Erlbaum associates.
SAAD, G. & GILL, T. 2000. Applications of evolutionary psychology in marketing. Psychology and Marketing, 17,1005-1034.
SAAD, G. & GILL, T. 2003. An evolutionary psychology perspective on gift giving among young adults. Psychology and Marketing, 20 ,765-784 .
SAHLINS, M. 1968. Man the hunter, Chicago, Aldine.SANDSTROM, P. E. 1994. An optimal foraging approach to information seeking and use
The Library Quarterly,64,414-449SASAKI, K. 1981. From affluent foraging to agriculture in Japan. Senri Ethnological
Studies, 9 ,13-18.SAUNDERS, M., LEWIS, P. & THORNHILL, A. 2003. Research methods for business
students, England, Prentice Hall.SAUNDERS, M., LEWIS, P. & THORNHILL, A. 2007. Research methods for business
students, Harlow Financial Times Prentice Hall.
336
SCHIFFMAN, L. G. & KANUK, L. L. 2007. Consumer behaviour New Jersey, Prentice HallSCHOENER, T. W. 1987. A brief history of optimal foraging ecology. In: KAMIL, A. C.,
KREBS, J. R. & PULLIAM, H. R. (eds.) Foraging behaviour. New York: Plenum Press.
SCHRADER, S. M. & GREEN, L. 1990. The economics of leisure in psychological studies of choice. In: GREEN, L. & KAGEL, J. (eds.) Advances in behavioural economics vol 2. Norwood,New Jersey: Ablex Publishing Corporation.
SCHREZENMAIER, T. C. 2005. A methodological exploration of the relevance of behavioural economics to the study of consumer brand choice. Doctor of Philosophy PhD, Cardiff University.
SCHROEDER, S. R. & HOLLAND, J. G. 1969. Reinforcement of eye m ovem ent withconcurrent schedules. Journal of the Experimental Analysis of Behaviour, 12, 897-903.
SCHWARTZ, B. & LACEY, H. 1988. W hat applied studies of human operant conditioning tell us about hum ans and about operant conditioning. In: DAVEY, G. & CULLEN, C. (eds.) Human operant conditioning and behaviour modification. Chichester: John Wiley and Sons Ltd.
SCRIVEN, J. & EHRENBERG, A. S. C. 2003. How consum ers choose prices over time. Marketing Learning, 13,46.
SEN, A. 1987. On ethics and economics, Oxford, Basil Blackwell.SHAROT, T. 1984. Discussion:the Dirichlet:a com prehensive model of buying
behaviour. The Journal of the Royai Statistical Society Series A (General), 147, 646-647.
SHETTLEWORTH, S. J. 2010. Cognition, evolution, and behavior, USA, Oxford University Press.
SILVER, M. S. 1997. Business Statistics, London, McGraw-Hill.SIMON, H., A. 1955. A behavioural model of rational choice. Quarterly Journal of
Economics, 59,99-118.SIMON, H. A. 1957. Models of man: social and rational, Oxford, Wiley.SIMON, H. A. 1982. Models of bounded rationality vol 2 : behavioural economics and
business organization, M assachusetts, MIT Press.SIMON, H. A. 1983. Theories of bounded rationality. In: H.A, S. (ed.) Models of bounded
rationality M assachusetts.: MIT Press Cambridge.SIMON, H. A. 1987. Behavioural economics. In: EATWELL, J., MILGATE, M. & NEWMAN,
P. (eds.) The new palgrave: a dictionary of economics. London: Macmillan.SIROHI, N., MCLAUGHLIN, E. W. & WITTINK, D. R. 1988. A model of consum er
perceptions and store loyalty intentions for a superm arket retailer. Journal of Retailing, 74, 223-245.
SKINNER, B. F. 1953. Science and human behaviour, London, Macmillan.SKINNER, B. F. 1971. Beyond freedom and dignity, Indiana, Hackett Publishing
Company.SKINNER, B. F. 1984. The phylogeny and ontogeny of behaviour. The Behavioural and
Brain Sciences, 7, 669-711.SKINNER, B. F. 1990. Can psychology be a science of mind? American Psychologist, 45,
1206-1210.
337
SLATER, R. & ASCROFT, P. 1990. Quantitative techniques in a business context, London, Chapman and Hall.
SMITH, B. D. 1995. The emergence of agriculture, New York, Scientific American Library.
SMITH, C. L. & HANTULA, D. A. 2003. Pricing effects on foraging in a simulated Internet shopping mall. Journal of Economic Psychology, 24,653-674.
SMITH, D. 2004a. The uses and abuses of positivism. In: MAIR, G. (ed.) What matters in probation. Devon: Willan Publishing.
SMITH, E. A. 2004b. Why do good hunters have higher reproductive success? Human Nature, 15,343-364.
SMITH, V. L. 1975. The primitive hunter culture,pleistocene extinction and th e rise of agriculture. Journal of Political Economy, 83,727-755.
SNYDERMAN, M. 1987. Prey selection and self control. In: COMMONS, M. L. (ed.)Quantitative analyses of behaviour vol v. the effect of delay and of intervening events on reinforcement value. Hillside,New Jersey: Lawrence Erlbaum Associates.
SPINK, A. & COLE, C. 2006. Human information behavior: Integrating diverse approaches and information use. Journal of the American Society for Information Science and Technology, 57, 25-35.
STADDON, J. E. R. 1980. Optimality analyses of operan t behaviour and their relation to optim al foraging. In: STADDON, J. E. R. (ed.) Limits to action:the allocation of individual behaviour. New York: Academic Press.
STENSTROM, E., STENSTROM, P., SAAD, G. & CHEIKHROUHOU, S. 2008. Online hunting and gathering:an evolutionary perspective on sex differences in website preferences and navigation. IEEE Transactions on Professional Communication, 51,155-168.
STEPHENS, D. W. 2008. Decision ecology:foraging and th e ecology of animal decision making. Cognitive,Affective and Behavioural Neuroscience, 8 ,475-484.
STEPHENS, D. W. & KREBS, J. R. 1986. Foraging theory, Princeton, Princeton University Press.
SUGDEN, R. 1991. Rational choce:a survey of contributions from economics and philosophy. The Economic Journal, 101,751-785.
SUNDERMAN, M. 1987. Prey selection and self control. In: COMMONS, M. L. (ed.)Quantitative analyses of behaviour vol v : the effect of delay and of intervening events on reinforcement value. Hillside,New Jersey: Lawrence Erlbaum Associates.
THORNHILL, R. 1998. Darwinian aesthetics. In: CRAWFORD, C. & KREBS, D. L. (eds.)Handbook of evolutionary psychology: ideas, issues and applications. Mahwah, New Jersey Lawrence Erlbaum.
TING-TOOMEY, S. 1984. Qualitative research: an overview. In: GUDYKUNST, W. B. & KIM, Y. Y. (eds.) Methods for intercultural communication research. Beverly Hills, California: SAGE Publications.
TOOBY, J. & COSMIDES, L. 1990. The past explains th e present: em otional adaptations and th e structure of ancestral environm ents. Ethology and Sociobiology, 11, 375-424.
338

TOOBY, J. & COSMIDES, L. 1992 The psychological foundations of culture. In:BARKOW, J. H., COSMIDES, L. & TOOBY, J. (eds.) The Adapted Mind.New York:Oxford University Press.
TOOBY, J. & COSMIDES, L. 2005. Evolutionary psychologyxonceptual foundations. In: BUSS, D. M. (ed.) Handbook of evolutionary psychology. New Jersey: John Wiley and Sons,Inc.
TRIVERS, R. L. 1971. The evolution of reciprocal altruism.The Quarterly Review of Biology,46,35-57.
TRUSTRUM, L. B. 1989. M arketing concept: concept and function. European Journal of Marketing, 23,48-56.
TUNNEY, R. J. & SHANKS, D. R. 2002. A re-exam ination of melioration and rational choice. Journal of Behavioural Decision Making, 15, 291-311.
UNCLES, M., EHRENBERG, A. S. C. & HAMMOND, K. 1995. Patterns of buyerbehaviour:regularities,m odels and extensions. Marketing Science, 14,71-78.
URBANY, J. E., DICKSON, P. R. & KALAPURAKAL, R. 1996. Price search in th e retail grocery m arket. The Journal of Marketing, 60,91-104.
VALONE, T. J. 1991. Bayesian and prescient assessm ent:foraging with pre-harvest inform ation. Animal Behaviour, 41,569-577.
VANHUELE, M. & DREZE, X. 2002. Measuring th e price knowledge shoppers bring to th e store. Journal of Marketing, 66, 72-85.
VAUGHAN, W. & HERRNSTEIN, R. J. 1987. Stability, melioration and natural selection. In: GREEN, L. & KAGEL, J. H. (eds.) Advances in Behavioural Economics vol.l. Norwood, New Jersey: Ablex.
WALTERS, R. 1991. Assessing th e impact of retail price prom otions on productsubstitution, com plem entary purchase and inter-store sales displacement. Journal of Marketing, 55,17-28.
WATKINS, T. 1986. The Economics of the brand, London, Me Graw-Hill.WATLING, R. Practical media work in education p ractices, problem s and strategies.
Issues in image-based research:British Educational Research Association Conference, 1995. Lancaster University.
WATSON, J. B. 1922. The ideal executive. Address presented to the graduating class of young executives,R.H.Macy Co.Typescript contained in the John Broadus Watson Papers.Manuscript Division,Library of Congress, Washington DC,20 April 1922.
WATSON, M. W. 1986. Univariate detrending m ethods with stochastic trends. Journal of Monetary Economics, 18,49-75.
WEBLEY, P. T., BURGOYNE, C. B., LEA, S. E. G. & YOUNG, B. M. 2001. The economic psychology of everyday life, Philadelphia, Taylor and Francis.
WELLS, V. K. 2009. MKQscores for retail stores and types. Cardiff University.WILLIAMS, B. A. 1988. Reinforcement,choice and response strength. In: ATKINSON, R.
C., HERRNSTEIN, R. J., LINDZEY, G. & LUCE, R. D. (eds.) Steven's handbook of experimental psychology vol 2. New York: Wiley.
WILLIAMS, W. A. & FANTINO, E. 1994. Delay reduction and optimal foraging:variable ratio search in a foraging analogue. Journal of the Experimental Analysis of Behaviour, 61,465-477.
339

WINER, R. S. 1986. A reference price model of brand choice for frequently purchased products. Journal of Consumer Research, 13, 250-256.
WINKLER, R. C. 1980. Behavioural economics, token econom ies and applied behaviour analysis. In: STADDON, J. E. R. (ed.) Limits to action:the allocation of individual behaviour. New York: Academic Press.
WINKLER, R. C. & BURKHARD, B. 1990. A system s approach to behaviour modification. In: GREEN, L. & KAGEL, J. H. (eds.) Advances in behavioural economics volume II. Norwood: Ablex Publishing Corporation.
WINTERHALDER, B. 1981. Hunter-gatherer foraging strategies, Chicago, University of Chicago Press.
WOODSIDE, A. G. & UNCLES, M. D. 2005. How behavioural primacy interacts withshort-term marketing tactics to influence subsequent long term brand choice. Journal of Advertising Research, 45, 229-240.
WORKMAN, L. & READER, W. 2004. Evolutionary psychoiogy.an introduction, Cambridge, Cambridge University Press.
YIN, R. K. 1994. Case study research, London, SAGE Publication.ZHANG, Z.-Q. & SANDERSON, J. P. 1993. Spatial scale o f aggregation in th ree acarine
p reda to r species with different degrees of polyphagy.Oeco/ogf/a, 96, 24-31.
340

APPENDICES
APPENDIX A
342

Utilitarian and Informational Levels of Baked Beans
Brands UtilitarianLevel
MKQ InformationalLevel
ALDI CORALE BAKED BEANS & SAUSAGES 2 0.0870 1ALDI CORALE BAKED BEANS# 1 1 0.0870 1ALDI MACEYS BAKED BEANS & SAUSAGES 1 0.0870 1ARGYLL SAFEWAY BAKED BEANS 1 0.0870 1ASDA BAKED BEANS 1 1.4570 2ASDA BAKED BEANS & JUMBO SSGS*PMP* 2 1.4570 2ASDA BAKED BEANS & SAUSAGE BIG SAVER* 2 1.4570 2ASDA BAKED BEANS & SAUSAGES*PMP* 2 1.4570 2ASDA BAKED BEANS BAKED 1 1.4570 2ASDA BAKED BEANS IN TOMATO SCE 2 1.4570 2ASDA BAKED BEANS*X 4* 1 1.4570 2ASDA HEALTHY CHOICE BAKED BEANS 2 1.4570 2ASDA SMARTPRICE BAKED BEANS & SAUSAGES 2 1.0650 2ASDA SMARTPRICE BAKED BEANS# 1 1 1.0650 2BEST IN BAKED BEANS*PMP 26P* 1 0.0650 1Breakfast 1 0.0650 1BUDGEN BAKED BEANS# 1 1 0.3040 1C & B BAKED BEANS & SAUSAGES 2 0.3040 1C & B BAKED BEANS#2 1 0.3040 1C & B BAKED BEANS*X 4* # 1 1 0.3040 1C & B HUNGERBREAKS ALL DAY BREAKFAST 2 0.3040 1C & B HUNGERBREAKS BEANS & NUGGETS 2 0.3040 1C & B HUNGERBREAKS BIG BRUNCH 2 0.3040 1C & B HUNGERBREAKS BIG MEXI CAN BEAN MEAL 2 0.3040 1C & B HUNGERBREAKS BOMBAY BALTI# 1 2 0.3040 1C & B HUNGERBREAKS BREAKFAST OMELETTE 2 0.3040 1C & B HUNGERBREAKS FULL MONTY 2 0.3040 1C & B HUNGERBREAKS SAUSAGE BEANS & WEDGES 2 0.3040 1C & B HUNGERBREAKS SAUSG BEANS & WEDGES 2 0.3040 1C & B HUNGERBREAKS THE BIG BBQ 2 0.3040 1C & B HUNGERBREAKS THE FULL MONTY*PMP* 2 0.3040 1C & B HUNGERBREAKS THE WORKS 0.3040 1C & B WAISTLINE HEALTHY BAKED BEANS 2 0.3040 1California 1 0.0220 1CO-OP BAKED BEANS 1 1.0650 2CO-OP BAKED BEANS & JUMBO SSGES 2 1.0650 2CO-OP BAKED BEANS & SAUSAGES 2 1.0650 2CO-OP BAKED BEANS*X4* *HI CONE* 2 1.0650 2CO-OP EVERYDAY BAKED BEANS 1 0.5220 1CO-OP ORGANIC BAKED BEANS 2 0.5220 1CO-OP REDUCED SALT/SUGAR BAKED BEANS 2 0.5220 1COSTCUTTER BAKED BEANS IN TOMATO SCE 1 0.4350 1GATEWAY GRP SOMERFIELDBKED BEANS & SAUSAGE 2 0.4350 1Cross & Blackwell 1 1.5430 2HEINZ BAKED BEANS 1 2.9570 3HEINZ BAKED BEANS & CHKN NUGGTS 2 2.9570 3HEINZ BAKED BEANS & CUMB SASAGE 2 2.9570 3HEINZ BAKED BEANS BARBECUE 2 2.9570 3HEINZ BAKED BEANS CURRIED 2 2.9570 3HEINZ BAKED BEANS IN TMT SAUCE*X3* 1 2.9570 3HEINZ BAKED BEANS IN TOM SCE 1 2.9570 3HEINZ BAKED BEANS WITH SAUSAGES 2 2.9570 3HEINZ BAKED BEANS WITH VEG SAUS 2 2.9570 3HEINZ BAKED BEANS# 1 1 2.9570 3HEINZ CHEESY BEANS*C* 2 2.9570 3HEINZ LONDON GRILL 2 2.9570 3
343

HEINZ BAKED BEAN JALFREZI MEAN BEANZ 2 2.9570 3HEINZ BAKED BEAN MEXICAN MEAN BEANZ 2 2.9570 3HEINZ BAKED BEAN TIKKA MEAN BEANZ 2 2.9570 3HEINZ BAKED BEAN MEALS SWEET CHILLI 2 2.9570 3HEINZ ORGANIC BAKED BEANS 2 2.9570 3HEINZ WEIGHTWATCHERS BAKED BEANS 2 2.0650 3H P BAKED BEANS 1 2.2610 3HP BAKED BEANS & SAUSAGES*PMP* 2 2.2610 3H P BAKED BEANS#! 1 2.2610 3H P BOB THE BUILDER BAKED BEANS 1 2.2610 3H P HEALTHY CHOICE BAKED BEANS 2 3OMLETTE CHIPS & BEAN * 2.2610H P SCOOBY DOO BAKED BEANS & SAUSAGES 2 2.2610 3ICELAND VALUE BAKED BEANSM 1 0.8910 1J SAINSBURY BAKED BEANS 1 1.7390 2J SAINSBURY BAKED BEANS & SAUSAGES 2 1.7390 2J SAINSBURY BAKED BEANS CURRIED 2 1.7390 2J SAINSBURY BAKED BEANS ORGANIC 2 1.7390 2J SAINSBURY LOW PRICE BAKED BEANS 2 1.7390 2J SAINSBURY MEATFREE BAKED BEANS & SAUSAGES 2 1.7390 2J SAINSBURY RDCD SALT/SGRBAKED BEANS 2 1.7390 2KWIKSAVE BAKED BEANS*X 4* 1 0.7170 1KWIKSAVE SIMPLY BAKED BEANS & SAUSAGES 2 0.3910 1KWIKSAVE SIMPLY BAKED BEANS IN TOMATO SC 1 0.3910 1LIDL SUNNY GLADE BAKED BEANS IN TOM SCE# 1 1 0.1960 1LIDL SUNNY GLADE BAKED BEANS WITH PRK SSG 2 0.1960 1LONDIS BAKED BEANS 1 0.2610 1M&S ST MICHAEL BAKED BEANS 1 1.4780 2MATTHEWS ALL DAY BREAKFAST 1 0.0000 1MORRISONS ALL DAY BREAKFAST 1 0.5870 1MORRISONS BAKED BEANS & JUMBO SSGS# 1 2 0.5870 1MORRISONS BAKED BEANS & PORK SSGS(X4) # 1 2 0.5870 1MORRISONS BAKED BEANS IN RCH TMT SC 2 0.5870 1MORRISONS BAKED BEANS IN TOM SAUCE 1 0.5870 1MORRISONS BAKED BEANS# 1 1 0.5870 1MORRISONS BEANS & 8 SSGS IN TMT SCE 2 0.5870 1MORRISONS BEANS & 8 VEG SSGS TMT SC 2 0.5870 1MORRISONS BEANS & SAUSAGES IN TMT S 2 0.5870 1MORRISONS CURRIED BEANS 2 0.5870 1MORRISONS MIXED BEANS IN TOMATO SCE 2 0.5870 1MORRISONS BETTABUY BAKED BEANS 1 0.8910 1NETTO BAKED BEANS & SAUSAGES 0.3910 1NETTO LA CAMPAGNA BAKED BEANS# 1 1 0.3910 1NETTO REDUCED SALT BAKED BEANS 0.3910 1NISA HERITAGE BAKED BEANS 1 0.3260 1OLD COUNTRY BAKED BEANS 1 0.0000 1PRINCES BAKED BEANS 1 0.3480 1PRINCES BAKED BEANS I 0.1520 1RODGERS BOMBAY BEANS 1 0.0000 1Safeway 1 1.0000 2Safeway Savers 1 0.5430 1SOMERFIELD BAKED BEANS 1 0.9130 1SOMERFIELD BAKED BEANS & PORK SSGS 0.9130 1SOMERFIELD BAKED BEANS#! 1 0.9130 1SOMERFIELD M.SENSE BAKED BEANS TMTO SCE 1 0.9130 1SPAR BAKED BEANS*PMP* # 1 1 0.8700 1TESCO BAKED BEANS 1 1.8910 2TESCO BAKED BEANS & SAUSAGES 2 1.8910 2TESCO BAKED BEANS & VEG SASGS 2 1.8910 2TESCO BAKED BEANS IN TOM SAUCE 1 1.8910 2TESCO MEXICAN CHILLI BEANS 2 1.8910 2
344

TESCO HEALTHY EATING BAKED BEANS 2 1.3700 2TESCO VALUE BAKED BEANS 1 1.3700 2TESCO VALUE BAKED BEANS & SAUSAGES 2 1.3700 2WAITROSE BAKED BEANS 1 1.4130 2WAITROSE BAKED BEANS ORGANIC 2 1.4130 2WAITROSE PERF. BAL. BAKED BEANS IN TOM SAUCE 2 1.4130 2WAITROSE REDUCED SGR/SLT BAKED BEANS 2 1.4130 2WESTLER BAKED BEANS & SAUSAGES 2 0.0430 1WHOLE EARTH ORGANIC BAKED BEANS# 1 2 0.2390 1
345

APPENDIX B
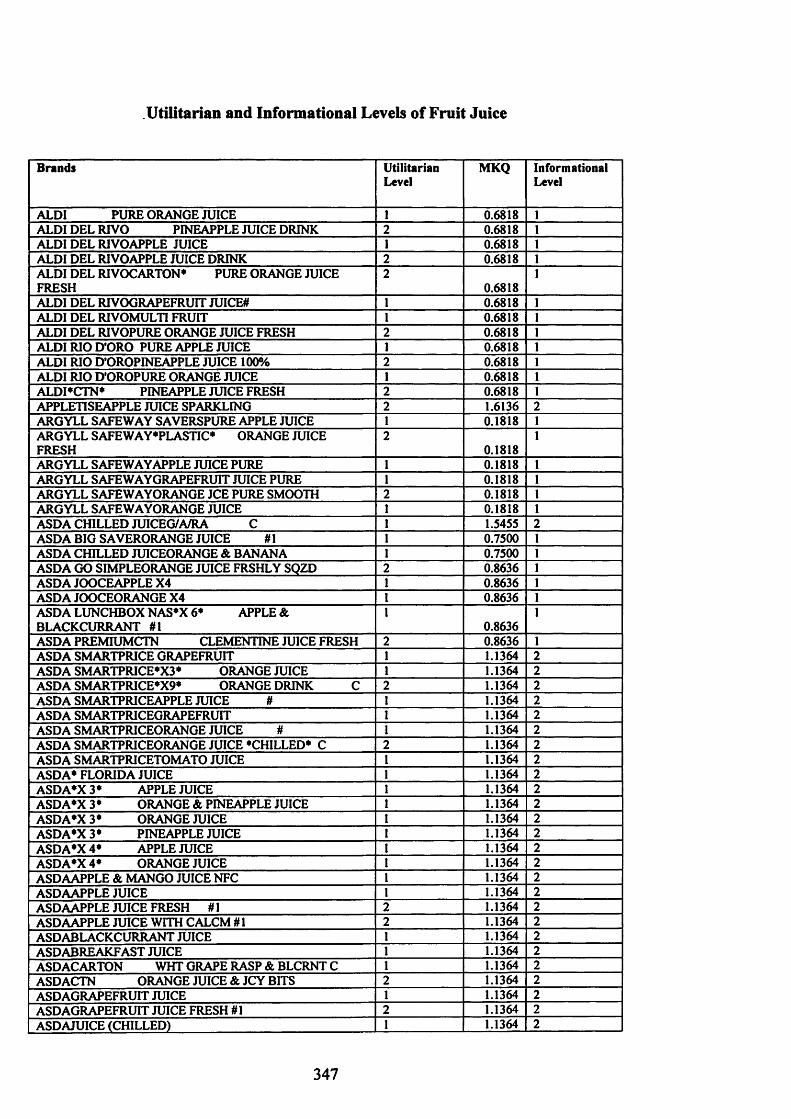
Utilitarian and Informational Levels of Fruit Juice
Brands UtilitarianLevel
MKQ InformationalLevel
ALDI PURE ORANGE JUICE 1 0.6818 1ALDI DEL RIVO PINEAPPLE JUICE DRINK 2 0.6818 1ALDI DEL RIVOAPPLE JUICE 1 0.6818 1ALDI DEL RIVOAPPLE JUICE DRINK 2 0.6818 1ALDI DEL RIVOCARTON* PURE ORANGE JUICE FRESH
20.6818
1
ALDI DEL RIVOGRAPEFRUIT JUICE# 1 0.6818 1ALDI DEL RIVOMULTI FRUIT 1 0.6818 1ALDI DEL RIVOPURE ORANGE JUICE FRESH 2 0.6818 1ALDI RIO D'ORO PURE APPLE JUICE 1 0.6818 1ALDI RIO D'OROPINEAPPLE JUICE 100% 2 0.6818 1ALDI RIO D’OROPURE ORANGE JUICE 1 0.6818 1ALDI*CTN* PINEAPPLE JUICE FRESH 2 0.6818 1APPLETISEAPPLE JUICE SPARKLING 2 1.6136 2ARGYLL SAFEWAY SAVERSPURE APPLE JUICE 1 0.1818 1ARGYLL SAFEWAY*PLASTIC* ORANGE JUICE FRESH
20.1818
1
ARGYLL SAFEWAYAPPLE JUICE PURE 1 0.1818 1ARGYLL SAFEWAY GRAPEFRUIT JUICE PURE 1 0.1818 1ARGYLL SAFEWAYORANGE JCE PURE SMOOTH 2 0.1818 1ARGYLL SAFEWAYORANGE JUICE 1 0.1818 1ASDA CHILLED JUICEG/A/RA C 1 1.5455 2ASDA BIG SAVERORANGE JUICE # 1 1 0.7500 1ASDA CHILLED JUICEORANGE & BANANA 1 0.7500 1ASDA GO SIMPLEORANGE JUICE FRSHLY SQZD 2 0.8636 1ASDA JOOCEAPPLE X4 1 0.8636 1ASDA JOOCEORANGE X4 1 0.8636 1ASDA LUNCHBOX NAS*X 6* APPLE & BLACKCURRANT #1
10.8636
1
ASDA PREMIUMCTN CLEMENTINE JUICE FRESH 2 0.8636 1ASDA SMARTPRICE GRAPEFRUIT 1 1.1364 2ASDA SMARTPRICE*X3* ORANGE JUICE 1 1.1364 2ASDA SMARTPRICE*X9* ORANGE DRINK C 2 1.1364 2ASDA SMARTPRICEAPPLE JUICE # 1 1.1364 2ASDA SMARTPRICEGRAPEFRUIT 1 1.1364 2ASDA SMARTPRICEORANGE JUICE # 1 1.1364 2ASDA SMARTPRICEORANGE JUICE *CHILLED* C 2 1.1364 2ASDA SMARTPRICETOMATO JUICE 1 1.1364 2ASDA* FLORIDA JUICE 1 1.1364 2ASDA*X 3* APPLE JUICE 1 1.1364 2ASDA*X 3* ORANGE & PINEAPPLE JUICE 1 1.1364 2ASDA*X 3* ORANGE JUICE 1 1.1364 2ASDA*X 3* PINEAPPLE JUICE 1 1.1364 2ASDA*X 4* APPLE JUICE 1 1.1364 2ASDA*X 4* ORANGE JUICE 1 1.1364 2ASDAAPPLE & MANGO JUICE NFC 1 1.1364 2ASDAAPPLE JUICE 1 1.1364 2ASDAAPPLE JUICE FRESH # 1 2 1.1364 2ASDAAPPLE JUICE WITH CALCM #1 2 1.1364 2ASDABLACKCURRANT JUICE 1 1.1364 2ASDABREAKFAST JUICE 1 1.1364 2ASDACARTON WHT GRAPE RASP & BLCRNT C 1 1.1364 2ASDACTN ORANGE JUICE & JCY BITS 2 1.1364 2ASDAGRAPEFRUIT JUICE 1 1.1364 2ASDAGRAPEFRUIT JUICE FRESH #1 2 1.1364 2ASDAJUICE (CHILLED) 1 1.1364 2
347
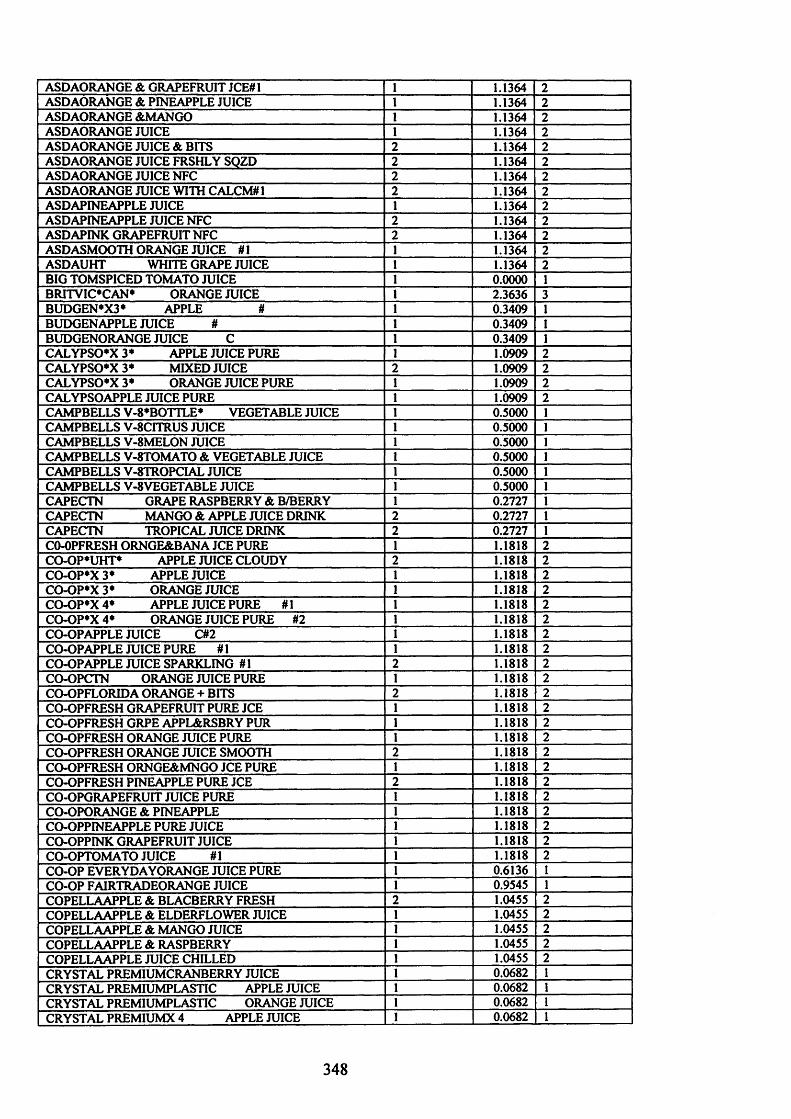
ASDAORANGE & GRAPEFRUIT JCE#1 1 1.1364 2ASDAORANGE & PINEAPPLE JUICE 1 1.1364 2ASDAORANGE &MANGO 1 1.1364 2ASDAORANGE JUICE 1 1.1364 2ASDAORANGE JUICE & BITS 2 1.1364 2ASDAORANGE JUICE FRSHLY SQZD 2 1.1364 2ASDAORANGE JUICE NFC 2 1.1364 2ASDAORANGE JUICE WITH CALCM#1 2 1.1364 2ASDAPINEAPPLE JUICE 1 1.1364 2ASDAPINEAPPLE JUICE NFC 2 1.1364 2ASDAPINK GRAPEFRUIT NFC 2 1.1364 2ASDASMOOTH ORANGE JUICE #1 1 1.1364 2ASDAUHT WHITE GRAPE JUICE 1 1.1364 2BIG TOMSPICED TOMATO JUICE 1 0.0000 1BRITVIC*CAN* ORANGE JUICE 1 2.3636 3BUDGEN*X3* APPLE # 1 0.3409 1BUDGENAPPLE JUICE # 1 0.3409 1BUDGENORANGE JUICE C 1 0.3409 1CALYPSO*X 3* APPLE JUICE PURE 1 1.0909 2CALYPSO*X 3* MIXED JUICE 1.0909 2CALYPSO*X 3* ORANGE JUICE PURE 1 1.0909 2CALYPSOAPPLE JUICE PURE 1 1.0909 2CAMPBELLS V-8*BOTTLE* VEGETABLE JUICE 1 0.5000 1CAMPBELLS V-8CITRUS JUICE 1 0.5000 1CAMPBELLS V-8MELON JUICE 1 0.5000 1CAMPBELLS V-8TOMATO & VEGETABLE JUICE 1 0.5000 1CAMPBELLS V-8TROPCIAL JUICE 1 0.5000 1CAMPBELLS V-8VEGETABLE JUICE 1 0.5000 1CAPECTN GRAPE RASPBERRY & B/BERRY 1 0.2727 1CAPECTN MANGO & APPLE JUICE DRINK 0.2727 1CAPECTN TROPICAL JUICE DRINK 0.2727 1CO-OPFRESH ORNGE&BANA JCE PURE 1 1.1818 2CO-OP*UHT* APPLE JUICE CLOUDY 1.1818 2CO-OP*X 3* APPLE JUICE 1 1.1818 2CO-OP*X 3* ORANGE JUICE 1 1.1818 2CO-OP*X 4* APPLE JUICE PURE # 1 1 1.1818 2CO-OP*X 4* ORANGE JUICE PURE #2 1 1.1818 2CO-OPAPPLE JUICE C#2 1 1.1818 2CO-OPAPPLE JUICE PURE # 1 1 1.1818 2CO-OPAPPLE JUICE SPARKLING #1 1.1818 2CO-OPCTN ORANGE JUICE PURE 1 1.1818 2CO-OPFLORIDA ORANGE + BITS 1.1818 2CO-OPFRESH GRAPEFRUIT PURE JCE 1 1.1818 2CO-OPFRESH GRPE APPL&RSBRY PUR 1 1.1818 2CO-OPFRESH ORANGE JUICE PURE 1 1.1818 2CO-OPFRESH ORANGE JUICE SMOOTH 1.1818 2CO-OPFRESH ORNGE&MNGO JCE PURE 1 1.1818 2CO-OPFRESH PINEAPPLE PURE JCE 1.1818 2CO-OPGRAPEFRUIT JUICE PURE 1 1.1818 2CO-OPORANGE & PINEAPPLE 1 1.1818 2CO-OPPINEAPPLE PURE JUICE 1 1.1818 2CO-OPPINK GRAPEFRUIT JUICE 1 1.1818 2CO-OPTOMATO JUICE #1 1 1.1818 2CO-OP EVERYDAYORANGE JUICE PURE 1 0.6136 1CO-OP FAIRTRADEORANGE JUICE 1 0.9545 1COPELLAAPPLE & BLACBERRY FRESH 1.0455 2COPELLAAPPLE & ELDERFLOWER JUICE 1 1.0455 2COPELLAAPPLE & MANGO JUICE 1 1.0455 2COPELLAAPPLE & RASPBERRY 1 1.0455 2COPELLAAPPLE JUICE CHILLED 1 1.0455 2CRYSTAL PREMIUMCRANBERRY JUICE 1 0.0682 1CRYSTAL PREMIUMPLASTIC APPLE JUICE 1 0.0682 1CRYSTAL PREMIUMPLASTIC ORANGE JUICE 1 0.0682 1CRYSTAL PREMIUMX 4 APPLE JUICE 1 0.0682 1
348

CRYSTALX 4 ORANGE JUICE SPORTS CAP 1 0.0682 1DEL MONTE PURE*CARTON* GRAPEFRUIT JUICE 1 2.5455 3DEL MONTE PURE*CARTON* PINEAPPLE JUICE 1 2.5455 3DEL MONTE*CARTON* APPLE JUICE 1 2.5455 3DEL MONTE*CARTON* ORANGE JUICE # 1 2.5455 3DEL MONTE*CARTON* TOMATO JUICE 1 2.5455 3DEL MONTE*CARTON* TROPICAL SMOOTH 2 2.5455 3DEL MONTE*SPIN TOP CTN* BREAKFAST JUICE 1 2.5455 3DEL MONTE*X 3* APPLE JUICE 1 2.5455 3DEL MONTE*X 3* ORANGE JUICE & BITS # 2 2.5455 3DEL MONTE*X 3* *CARTON* ORANGE JUICE 1 2.5455 3DEL MONTE*X 4* *CARTON* ORANGE JCE *FROM CONC*(C)
22.5455
3
DEL MONTE*X 6* VARIETY PACK 1 2.5455 3DEL MONTEAPPLE & MANGO JUICE 1 2.5455 3DEL MONTEGRAPE APPLE & BLBRRY JCE 1 2.5455 3DEL MONTEORANGE & PINEAPPLE JUICE 1 2.5455 3DEL MONTEORANGE JUICE & BITS 2 2.5455 3DEL MONTEORANGE/APPLE/PASSION FRT 1 2.5455 3DEL MONTEPINK GRAPEFRUIT & BITS 2 2.5455 3DEL MONTES SPECIAL EDITION 2 2.5455 3EDEN*BOTTLE* ORGANIC CARROT JUICE # 1 0.0909 1F/NATURE ORGANICAPPLE JUICE PURE 1 0.0000 1FLORIDA'S NATURALCTN ORANGE WITH BITS FRESH
20.0000
1
FRT N ORG*X 3* ORANGE 1 0.0000 1FRUIT PASSIONBREAKFAST JUICE C 1 0.0455 1FRUIT PASSIONORANGE 1 0.0455 1FRUIT PASSIONTROPICAL C 1 0.0455 1GATEWAY GROUPS SOMERFIEL*X 3 * APPLE JUICE 1 0.0455 1GATEWAY GROUPS SOMERFIEL*X 4* ORANGE JUICE
10.0455
1
GATEWAY GROUPS SOMERFIELD GRAPEFRUIT JUICE 1 0.0455 1GATEWAY GROUPS SOMERFIELD PINEAPPLE JUICE 1 0.0455 1GATEWAY GROUPS SOMERFIELD TOMATO JUICE 1 0.0455 1GATEWAY GROUPS SOMERFIELORANGE JUICE FRESH SOZD
20.0455
1
GROVE FRESH*CTN* APPLE JUICE ORGANIC 2 0.0000 1GROVE FRESH*CTN* ORANGE JUICE ORGANIC # 2 0.0000 1GROVE FRESHAPPLE & CRNBRY JCE ORGNC 2 0.0000 1HUCKLEBERRY FINN SMOOTHICTN MANGO 2 0.0000 1HUCKLEBERRY FINN SMOOTHICTN PEACH & P/FRUIT
20.0000
1
HUCKLEBERRY FINN SMOOTHICTN RASPBERRY & CRANBERRY
20.0000
1
ICELAND TROPICAL JUICE CHILLED #1 1 0.7955 1ICELAND3 FOR 2 ORANGE JUICE CHILLED 1 0.7955 1ICELAND3 FOR 2 ORANGE & GRAPEFRUIT CHLLD 1 0.7955 1ICELAND3 FOR 2 PURE APPLE JUICE CHILLED 1 0.7955 1ICELANDAPPLE & RASPBERRY JUICE 1 0.7955 1ICELANDAPPLE JUICE 1 0.7955 1ICELANDAPPLE JUICE CHILLED # 1 1 0.7955 1ICELANDORANGE & GRAPEFUIT # 1 0.7955 1ICELANDORANGE JUICE #1 1 0.7955 1ICELANDORANGE JUICE CHILLED 1 0.7955 1ICELANDORANGE JUICE X4 1 0.7955 1ICELANDTROPICAL JUICE #2 1 0.7955 1ICELANDTROPICAL JUICE CHILLED 1 0.7955 1Innocent 1 1.5909 2J SAINSBURY BASICS*X 9* ORANGE JUICE 1 1.1364 2J SAINSBURY BASICSAPPLE JUICE 1 1.1364 2J SAINSBURY BASICSGRAPEFRUIT JUICE 1 1.1364 2J SAINSBURY BASICSTOMATO JUICE 1 1.1364 2J SAINSBURY LOW PRICEAPPLE JUICE UHT 1 1.0455 2
349

J SAINSBURY LOW PRICEORANGE JUICE 1 2J SAINSBURY ORGANICAPPLE JUICE PURE UHT FC 1 2.0277 3J SAINSBURY ORGANICORANGE JUICE PURE LNGLFE 1 2.0277 3J SAINSBURY ORGANICORANGE JUICE PURE LNGLFE I 2.0277 3J SAINSBURY ORGANICX 3 APPLE JUICE 1 2.0277 3J SAINSBURY ORGANICX 3 ORANGE TROPICAL JUICE
12.0277
3
J SAINSBURY PREMIUMFLORIDA ORANGE JUICE/BITS 2 2.0277 3J SAINSBURY T T DBREAKFAST JUICE FRSH SO 2 1.8864 2J SAINSBURY T T DLASTIC ORANGE JCE FRSHLY SOZD#l
21.8864
2
J SAINSBURY T T DORANGE FRSH SQZD SMTH JC 2 1.8864 2J SAINSBURY TTD*BOTTLE* ORANGE JUICE FRSHLY SQZD
21.8864
2
J SAINSBURY TTD*PLASTIC* ORNG/RSP JCE FRSHLY SQ
21.8864
2
J SAINSBURY TTD*PLASTIC* FR SQ*GRAPEFRUIT 2 1.8864 2J SAINSBURY TTDENGLISH APPLE JUICE 1 1.8864 2J SAINSBURY TTDJAFFA ORANGE JUICE 1 1.8864 2J SAINSBURY TTDORANGE & LYCHEE 1 1.8864 2J SAINSBURY TTDORANGE JCE FRSHLY SQZD 2 1.8864 2J SAINSBURY TTDPLASTIC ORANGE JCE FRSHLY SQZD#
21.8864
2
J SAINSBURY TTDRASPBERRY & BOYSENBERRY 1 1.8864 2J SAINSBURY TTDUHT RUBY GRAPEFRUIT JUICE 1 1.8864 2J SAINSBURY*CTN* ORANGE JUICE FRESH 1 1.8864 2J SAINSBURY *CTN* *NFC* ENGLISH APPLE JCE C 1 1.8864 2J SAINSBURY*X 3* ORANGE JUICE 1 1.8864 2J SAINSBURY*X 4* APPLE JUICE #2 1 1.8864 2J SAINSBURY*X 4* PINEAPPLE JUICE 1 1.8864 2J SAINSBURY APPLE & MANGO JUICE 1 1.8864 2J SAINSBURY APPLE & RASPBERRY JUICE 1 1.8864 2J SAINSBURY APPLE JUICE 1 1.8864 2J SAINSBURY APPLE JUICE PURE 1 1.8864 2J SAINSBURYCRANBERRY DRINK 1 1.8864 2J SAINSBURYCTN APPLE & MANGO 1 1.8864 2J SAINSBURYCTN APPLE JUICE PURE# 1 1 1.8864 2J SAINSBURYCTN TROPICAL JUICE 1 1.8864 2J SAINSBURYCTN FRESH ORANGE JUICE SMOOTH STYLE
21.8864
2
J SAINSBURYENGLISH APPLE JUICE 1 1.8864 2J SAINSBURYFLORIDA PINK GRPFRT F/SQD 2 1.8864 2J SAINSBURYFLORIDA PNK G/FRT PR/BITS 2 1.8864 2J SAINSBURYGRAPEFRUIT JUICE # 1 1 1.8864 2J SAINSBURYGRAPEFRUIT JUICE FRESH 2 1.8864 2J SAINSBURYOJ JUICE SQUEEZED 2 1.8864 2J SAINSBURYOJ JUICE SQUEEZED BITS 2 1.8864 2J SAINSBURYOJ SMOOTH SQUEEZED 2 1.8864 2J SAINSBURYORANGE & P/APPLE PURE#1 1 1.8864 2J SAINSBURYORANGE JUICE + BITS 2 1.8864 2J SAINSBURYORANGE JUICE PURE 1 1.8864 2J SAINSBURYORANGE JUICE SMOOTH 2 1.8864 2J SAINSBURYPINEAPPLE JUICE 1 1.8864 2J SAINSBURYPINEAPPLE JUICE FRESH 2 1.8864 2J SAINSBURYPURE BREAKFAST JUICE 1 1.8864 2J SAINSBURYPURE FRSH SQEESDPINEAPPLE JUICE 2 1.8864 2J SAINSBURYRED GRAPE JUICE 1 1.8864 2J SAINSBURYRED GRAPE JUICE SPRKLNG#1 2 1.8864 2J SAINSBURYTOMATO JUICE 1 1.8864 2J SAINSBURYUHT ORANGE JUICE PURE 1 1.8864 2J SAINSBURYWHITE GRAPE JUICE 1 1.8864 2J SAINSBURYX 3 PINEAPPLE JUICE 1 1.8864 2J SAINSBURYX 3 PURE APPLE JUICE 1 1.8864 2J SAINSBURYX 3 VARIETY JUICE 1 1.8864 2
350

J SAINSBURYX 6 ORANGE JUICE 1 1.8864 2JAF FRESH*CARTON* ORANGE JUICE PURE 1 0.3182 1JAFFA GOLDPURE APPLE JUICE FRESH 2 0.7045 1JAFFA GOLDPURE ORANGE JUICE FRESH 2 0.7045 1JAFFRESHAPPLE JUICE 1 0.7045 1JP FAIRTRADEAPPLE JUICE 1 0.0909 1JUSPLASTIC ORANGE JUICE #1 1 0.2955 1JUST JUICE*CARTON* ORANGE JUICE UNSWEETENED
20.6364
1
KWIK SAVEORANGE JUICE WITH BITS 2 0.6591 1KWIK SAVESMOOTH ORANGE JUICE 1 0.6591 1KW1KSAVEPINEAPPLE JUICE 1 0.6591 1LIBBYS HEALTHY STARTORANGE & PASSIONFRUIT 1 0.8409 1LIBBYS ORGANIC*X 3* ORANGE JUICE 1 0.8409 1LIBBYS*JAR* TOMATO JUICE #1 1 0.8409 1LIBBYSAPPLE JUICE ORGANIC # 2 0.8409 1LIBBYSORANGE JUICE ORGANIC 2 0.8409 1LIDL SOLE VITA*X 4* *CTN* APPLE JUICE 1 0.7727 1LIDL SOLE VITA*X 5* *CTN* ORANGE JUICE # 1 1 0.7727 1LIDL SOLE VITACARTON MIXED FRUIT # 1 0.7727 1LIDL SOLE VITACARTON ORANGE JUICE UHT 1 0.7727 1LIDL SOLE VITACARTON PEACH & BANANA 1 0.7727 1LIDL SOLE VITACARTON PINEAPPLE JUICE # 1 1 0.7727 1LIDL SOLE VITACTN RED GRAPE JUICE 1 0.7727 1LIDL SOLE VITAGRAPEFRUIT JUICE #2 1 0.7727 1LIDL SOLE VITAORANGE JUICE PURE 1 0.7727 1LIDL SOLE VITAORANGE LEMON & CARROT PMP 1 0.7727 1LIDL SOLE VITAORANGE NECTAR 2 0.7727 1LIDL SOLE VITAPEACH NECTAR 2 0.7727 1LIDL SOLE VITAPEAR NECTAR 2 0.7727 1LIDL VITAFIT*CARTON* * ACE VITAMIN 1 0.7727 1LIDL VITAFIT*TETRA* TOMATO JUICE 1 0.7727 1LIDL VITAFITAPPLE JUICE 1 0.7727 1LIDL VITAVIT*CTN* TOMATO JUICE 1 0.7727 1LIDL VITAVIT*CTN* VEGETABLE JUICE 1 0.7727 1LIDL VITAVITORANGE JUICE CONCENTRATED 2 0.7727 1LIDLCARTON ORANGE JUICE COMB 2 0.7727 1LIDLMANDARIN JUICE FRSHLY SQZ 2 0.7727 1LIDLPINEAPPLE JUICE 1 0.7727 1LIDLPRESSED CLOUDY APPLE 2 0.7727 1Lifestyle 1 0.0909 1M&S ST MICHAEL ENG PRESSAPPLE C 2 1.9545 2M&S ST MICHAEL*CARTON* EXOTIC 1 PINEAPPLE/HNT LIME
21.9545
2
M&S ST MICHAEL*PMP* FLORIDA SQZD ORANGE JUICE
21.9545
2
M&S ST MICHAELAPPL STRWBY & LYCHEE JC 1 1.9545 2M&S ST MICHAELAPPLE & MANGO JCE UNSW*C* 2 1.9545 2M&S ST MICHAELCLEMENTINE JC FRSH SQZD 2 1.9545 2M&S ST MICHAELCOXS APPLE JUICE 1 1.9545 2M&S ST MICHAELCTN ORGANIC APPLE JUICE 2 1.9545 2M&S ST MICHAELENG APP JC FRS PRS UNS*C* 2 1.9545 2M&S ST MICHAELGRAPEFRUIT & RASP FRSH SQ 2 1.9545 2M&S ST MICHAELGRP APRCT & MNG JCE 1 1.9545 2M&S ST MICHAELMANGO & APPLE JCE ENG PRS 2 1.9545 2M&S ST MICHAELORANGE JCE 100% PURE 1 1.9545 2M&S ST MICHAELORANGE JCE SMOOTH FLORIDA 2 1.9545 2M&S ST MICHAELORANGE JUICE FLORIDA 1 1.9545 2M&S ST MICHAELORANGE JUICE FRESH SQZD 2 1.9545 2M&S ST MICHAELORANGE JUICE SWEET & SMTH 2 1.9545 2M&S ST MICHAELORGANIC ORANGE JUICE 1 1.9545 2M&S ST MICHAELORNGE & R/BRRY FRSH SQZD 2 1.9545 2M&S ST MICHAELP/APPLE PAS/FRUIT & PEACH 1 1.9545 2M&S ST MICHAELSWEET GRAPE 1 1.9545 2
351

MINUTE MAID*BOTTLE* SMOOTH STYLE ORNG JCE 2 1.2727 2MORRISONS ORGANICORANGE JUICE # 1 2 1.1591 2MORRISONS*BOTTLE* PURE PINEAPPLE JUICE C 1 1.1591 2MORRISONS*CARTON* FLORIDA ORANGE SMOOTH 2 1.1591 2MORRISONS*CARTON* FLORIDA ORANGE WITH BITS
21.1591
2
MORRISONS*CARTON* FLORIDA PINK GRAPEFRUIT 1 1.1591 2MORRISONS*CARTON* PURE PINEAPPLE JUICE 1 1.1591 2MORRISONS*CARTON* SPANISH ORANGE JUICE #1 1 1.1591 2MORRISONS*X 3* APPLE JUICE PR # 1 1.1591 2MORRISONS*X 3* ORANGE JUICE PURE #1 1 1.1591 2MORRISONS*X 3* PINEAPPLE JUICE PURE 1 1.1591 2MORRISONS*X 3* VARIETY 1 1.1591 2MORRISONS*X 3* INCL 1 EXTORANGE JUICE PURE 1 1.1591 2MORRISONS*X 4* APPLE JUICE 1 1.1591 2MORRISONS*X 4* ORANGE JUICE 1 1.1591 2MORRISONSAPPLE & MANGO JUICE 1 1.1591 2MORRISONSAPPLE JUICE 1 1.1591 2MORRISONSAPPLE JUICE PURE #2 1 1.1591 2MORRISONSAPPLE JUICE PURE #2 1 1.1591 2MORRISONSCRTN ♦PMP 119P* ORANGE JUICE PURE 1 1.1591 2MORRISONSENGLISH APPLE JUICE 1 1.1591 2MORRISONSGRAPEFRUIT JUICE PURE # 1 1.1591 2MORRISONSICE PURE ORANGE JU 1 LITRE * PLASTIC * 1 1.1591 2MORRISONSINCL 100% FREE SPANSH ORNG JC WTH JCYBT
21.1591
2
MORRISONSORANGE FRESHLY SQUEEZED 2 1.1591 2MORRISONSORANGE JUICE 1 1.1591 2MORRISONSORANGE JUICE PMP 119P 1 1.1591 2MORRISONSORANGE JUICE PURE 1 1.1591 2MORRISONSORNG & PNPPL PURE JCE 1 1.1591 2MORRISONSPEACH & MANDARIN JUICE 1 1.1591 2MORRISONSPINEAPPLE+HINT OF LIME 1 1.1591 2MORRISONSPINK GRAPEFRUIT PURE JC 1 1.1591 2MORRISONSPLASTIC GRAPEFRUIT JUICE PURE 1 1.1591 2MORRISONSPLSTC BTTL PURE ORANGE JCE FRSHLY SQ
21.1591
2
MORRISONSPR ORNG & GRPFRT W/BTS 2 1.1591 2MORRISONSPRESSED CLOUDY APPLE 2 1.1591 2MORRISONSPURE ORANGE JUICE SMOOTH# 2 1.1591 2MORRISONSPURE ORANGE JUICE SMTH #1 2 1.1591 2MORRISONSPURE ORANGE JUICE W/BTS# 2 1.1591 2MORRISONSRED GRAPE JUICE 1 1.1591 2MORRISONSSMOOTH SPANISH ORANG JC#1 1 1.1591 2MORRISONSSO SPANISH ORNG WTH BTS#1 1.1591 2MORRISONSTOMATO JUICE 1 1 1.1591 2MORRISONSWHITE GRAPE JUICE 1 1.1591 2MORRISONS BETTABUYORANGE JUICE PMP 1 0.7273 1NETTO SUNGROVEPURE ORANGE JUICE *CTN* 1 0.4091 1Next 1 0.0227 1NISA TODAYORANGE JUICE #2 1 0.3864 1PETE & JOHNNYS FROOOTIEORANGE 2 0.2045 1PETE & JOHNNYS SMOOTHIEC MONSTER APL/GRP/BLKC
20.2045
1
PJ'S SMOOOTHIE*+100% FREE* STRAWBERRY BANANA
20.8636
1
PJ’S SMOOOTHIEAPPLE & BLACKCURRANT 2 0.8636 1PJ’S SMOOOTHIEMANGO/ORANGE 2 0.8636 1PJ’S SMOOOTHIESTRAWBERRY/BANANA 0.8636 1PJ’S SUPER SMOOTHIE+30% EXTRA ENERGY BOOST ORNGE/MANGO
20.8636
1
PJ’S SUPER SMOOOTHIEDAILY DTX MDRN BAN DR FRT 2 0.8636 1PJ’S SUPER SMOOOTHIEENERGY BOOST ORANGE/MANGO
20.8636
1
352
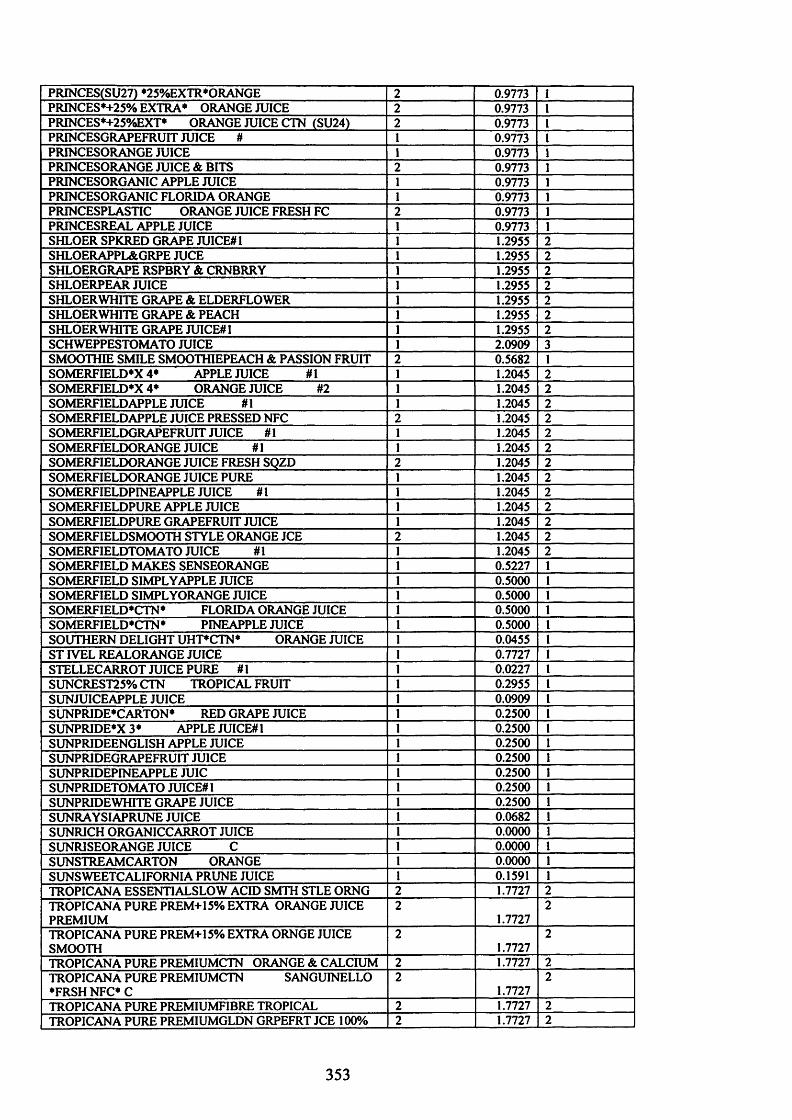
PRINCES(SU27) *25%EXTR*ORANGE 2 0.9773 IPRINCES*+25% EXTRA* ORANGE JUICE 2 0.9773 1PRINCES*+25%EXT* ORANGE JUICE CTN1SU24) 2 0.9773 1PRINCESGRAPEFRUIT JUICE # 1 0.9773 1PRINCESORANGE JUICE 1 0.9773 1PRINCESORANGE JUICE & BITS 0.9773 1PRINCESORGANIC APPLE JUICE 1 0.9773 1PRINCESORGANIC FLORIDA ORANGE 1 0.9773 1PRINCESPLASTIC ORANGE JUICE FRESH FC 0.9773 1PRINCESREAL APPLE JUICE 1 0.9773 1SHLOER SPKRED GRAPE JUICE# 1 1 1.2955 2SHLOERAPPL&GRPE JUCE 1 1.2955 2SHLOERGRAPE RSPBRY & CRNBRRY 1 1.2955 2SHLOERPEAR JUICE 1 1.2955 2SHLOER WHITE GRAPE & ELDERFLOWER 1 1.2955 2SHLOER WHITE GRAPE & PEACH 1 1.2955 2SHLOERWHITE GRAPE JUICE# 1 1 1.2955 2SCHWEPPESTOMATO JUICE 1 2.0909 3SMOOTHIE SMILE SMOOTHIEPEACH & PASSION FRUIT 0.5682 1SOMERFIELD*X 4* APPLE JUICE #1 1 1.2045 2SOMERFIELD*X 4* ORANGE JUICE #2 1 1.2045 2SOMERFIELDAPPLE JUICE #1 1 1.2045 2SOMERFIELD APPLE JUICE PRESSED NFC 1.2045 2SOMERFIELDGRAPEFRUIT JUICE # 1 1 1.2045 2SOMERFIELDORANGE JUICE # 1 1 1.2045 2SOMERFIELDORANGE JUICE FRESH SQZD 1.2045 2SOMERFIELDORANGE JUICE PURE 1 1.2045 2SOMERFIELDPINEAPPLE JUICE # 1 1 1.2045 2SOMERFIELDPURE APPLE JUICE 1 1.2045 2SOMERFIELDPURE GRAPEFRUIT JUICE 1 1.2045 2SOMERFIELDSMOOTH STYLE ORANGE JCE 1.2045 2SOMERFIELDTOMATO JUICE #1 1 1.2045 2SOMERFIELD MAKES SENSEORANGE 1 0.5227 1SOMERFIELD SIMPLYAPPLE JUICE 1 0.5000 1SOMERFIELD SIMPLYORANGE JUICE 1 0.5000 1SOMERFIELD*CTN* FLORIDA ORANGE JUICE 1 0.5000 1SOMERFIELD*CTN * PINEAPPLE JUICE 1 0.5000 1SOUTHERN DELIGHT UHT*CTN* ORANGE JUICE 1 0.0455 1ST IVEL REALORANGE JUICE I 0.7727 1STELLECARROT JUICE PURE # 1 1 0.0227 1SUNCREST25% CTN TROPICAL FRUIT 1 0.2955 1SUNJUICEAPPLE JUICE 1 0.0909 1SUNPRIDE*CARTON* RED GRAPE JUICE 1 0.2500 1SUNPRIDE*X 3 * APPLE JUICE# 1 1 0.2500 1SUNPRIDEENGLISH APPLE JUICE 1 0.2500 1SUNPRIDEGRAPEFRUIT JUICE 1 0.2500 1SUNPRIDEPINEAPPLE JUIC 1 0.2500 1SUNPRIDETOMATO JUICE# 1 1 0.2500 1SUNPRIDEWHITE GRAPE JUICE 1 0.2500 1SUNRAYSIAPRUNE JUICE 1 0.0682 1SUNRICH ORGANICCARROT JUICE 1 0.0000 1SUNRISEORANGE JUICE C I 0.0000 1SUNSTREAMCARTON ORANGE 1 0.0000 1SUNSWEETCALIFORNIA PRUNE JUICE 1 0.1591 1TROPICANA ESSENTIALSLOW ACID SMTH STLE ORNG 2 1.7727 2TROPICANA PURE PREM+15% EXTRA ORANGE JUICE PREMIUM
21.7727
2
TROPICANA PURE PREM+15% EXTRA ORNGE JUICE SMOOTH
21.7727
2
TROPICANA PURE PREMIUMCTN ORANGE & CALCIUM 2 1.7727 2TROPICANA PURE PREMIUMCTN SANGUINELLO ♦FRSH NFC* C
21.7727
2
TROPICANA PURE PREMIUMFIBRE TROPICAL 2 1.7727 2TROPICANA PURE PREMIUMGLDN GRPEFRT JCE 100% 2 1.7727 2
353

SQTROPICANA PURE PREMIUMMULTIVITAMIN TROPICAL 2 1.7727 2TROPICANA PURE PREMIUMORANGE 1 1.7727 2TROPICANA PURE PREMIUMORANGE JCE 100% SMOOTH
21.7727
2
TROPICANA PURE PREMIUMORANGE JCE 100% SQZD 2 1.7727 2TROPICANA PURE PREMIUMORANGE JCE SMTH 100% SQZD
21.7727
2
TROPICANA PURE PREMIUMORANGE JUICE FRESH # 2 1.7727 2TROPICANA PURE PREMIUMORANGE# 1 1.7727 2TROPICANA PURE PREMIUMPINK GRAPEFRUIT 1 1.7727 2TROPICANA PURE PREMIUMPLASTIC MULTIVITAMIN TROPICAL
21.7727
2
TROPICANA PURE PREMIUMRUBY BREAKFAST ORANGEJCE
11.7727
2
TROPICANA PURE PREMIUMSMOOTH ORANGE 2 1.7727 2TROPICANA TROPICALTETRA TROPICAL PASSION 1 0.5682 1TROPICANA TROPICALTETRA TROPICAL ZEST 1 0.5682 1TROPICANA TROPICSPLASTIC TROPICAL 1 0.5682 1TROPICANA TROPICSTETRA TROPICAL # 1 0.5682 1TROPICANA TROPICSTROPICAL 1 0.5682 1TROPICANAGOLDEN GRAPEFRUIT JUICE 1 2.1136 3TROPICANASEASONAL FRUITS JUICE 1 2.1136 3TESCO VALUEORANGE JUICE *CARTON* 1 1.4091 2WELCHSFRESH PURPLE GRAPE JUICE C 1 0.3182 1WESERGOLDAPPLE JUICE 1 0.3182 1
354

APPENDIX C
355

Utilitarian and Informational Levels of Yellow Fats
Brands UtilitarianLevel
MKQ InformationalLevel
ALDI BEAUTIFULLY BUTTRFLYBUTTERMILK SPREAD 1 0.7050 1ALDI GREEN VALEBLENDED BUTTER 1 0.7050 1ALDI GREEN VALEPREMIUM ENGLISH BUTTER 1 0.7050 1ALDI GREEN VALESLIGHTLY SALTED 1 0.7050 1ALDI GREENVALE BLENDEDBUTTER 1 0.7050 1ALDI GREENVALE BLENDEDBUTTER BLENDED VEG 01 1 0.7050 1ALDI NORPAK SPREAD ABLEBUTTER 2 0.7050 IALDI SUMMERLITE OLIVE GLDVEGETABLE FAT SPREAD
20.7050
1
ALDI SUMMERLITESUNFLOWER LOW FAT SPREAD 1ANCHOR SPREADABLE* 2 2.7950 3ANCHOR SPREADABLE*+20% EXTRA* * 2 2.7950 3ANCHOR SPREADABLELIGHTER 2 2.7950 3ANCHOR*X 2* * *+FR BUTTER DISH* 1 2.7950 3ANCHOR*X 3* *PINK* 1 2.7950 3ANCHOR*X 100* * *PORTIONS* 1 2.7950 3ANCHORHALF FAT #3 1 2.7950 3ANCHORS ALTED *C* 1 2.7950 3ARGENTO OLIVE OIL SPREAD 2 0.0450 1ARGYLL S/W DONT FLTR BTRBUTTERMILK SPREAD 2 0.0450 1ASDA BEST FOR BAKING* *PACKET* 2 0.5230 1ASDA BEST FOR BAKINGSOFT 2 0.5230 1ASDA GFY PUREGOLDSPREAD 1 0.5230 1ASDA GOOD FOR YOU LIGHTSUNFLOWER SPREAD 1 0.5230 1ASDA GOOD FOR YOUOLIVE GOLD LIGHT 0.5230 1ASDA GOOD FR Y BTTR LGHTHALF FAT 1 0.5230 1ASDA SMART PRICE* 1 0.8180 1ASDA SMARTPRICERED FAT SPREAD# 1 1 0.8180 1ASDA SOFT* *TUB* 1 0.8180 1ASDA YOU’D BUTTER BELIEVE 1 0.8180 1ASDAOLIVE SPREAD 1 0.8180 1ASDAORGANIC BUTTER 0.8180 1ASDAPURE CREAMERY 0.8180 1ASDASUNFLOWER *TUB* 1 0.8180 1ASDASUNFLOWER BUTTERY 1 0.8180 1BENECOL LIGHT32% FAT FREE SPREAD 1 1.2500 2BENECOL LIGHTSPREAD #1 1 1.2500 2BENECOLOLIVE OIL SPREAD 1.2500 2BERIOOLIVE OIL SPREAD 0.6820 1BERTOLLIREDUCED FAT SPREAD # 1 1 1.3180 2BESTWAYM • *PMP 79P* 1 0.3640 1BUDGENSUNFLOWER 1 0.2050 1CARAPELLIOLIVE SPREAD 0.0910 1CLOVER SPREAD# 1 1 1.8410 2CLOVER*+20% EXTRA* STANDARD 1 1.8410 2CLOVERREDUCED SALT #2 1 1.8410 2CLOVERSTANDARD 1 1.8410 2CO-OP BUTTERY* 1 1.2500 2CO-OP EVERYDAY SFT SPREAD* # I 0.6360 1CO-OP GOODLIFESUNFLOWER *TUB* 1 0.6360 1CO-OP OLIVE GOLDLOW FAT SPREAD 1 0.6360 1CO-OP SILVER SOFT* *TUB* 1 0.6360 1CO-OP SPREADABLE* #1 2 0.6360 1CO-OPCREAMERY BUTTER 2 0.6360 1
356
i

CO-OPDANISH SLIGHTLY SALTED 1 0.6360 1CO-OPSOFT SPREAD 1 0.6360 1CO-OPSUNFLOWER SPREAD 1 0.6360 1COUNTRY GOLDSPREAD 1 1.2270 2COUNTRY LIFE ORGANICENGLISH 1.5230 2COUNTRY LIFE SPREADABLESLIGHTLY SALTED 1.5230 2COUNTRY LIFEENGLISH 1 1.5230 2COUNTRY LIFEENGLISH UNSALTED 1 1.5230 2COUNTRY LIFESPREADABLE 1.5230 2DAIRY CREST VALLEYBUTTER # 1 1 0.9770 1DAIRYGATE DEVONDAIRY BUTTER 1 0.4320 1DANE CHURN* 1 0.0910 1DELAMEREGOATS BUTTER 1 0.0000 1DRAKEMIRESCOTTISH BUTTER 1 0.0000 1DROMONA COUNTRY GOLD* I 0.0000 1DUCHYORIGINAL BUTTER 1 0.4320 1FARMFOODS*FRZN* CHOICE SPREAD MARGARINE 1 0.5450 1FLORA BUTTERYSUNFLOWER *TUB* 1 2.1360 3FLORA DIETSPREAD 1 2.1360 3FLORA EXTRA LIGHTLOW FAT SPREAD 1 2.1360 3FLORA EXTRA LIGHTLW FT SPRD *+FREE PDMTR* 1 2.1360 3FLORA NO SALTSUNFLOWER 1 2.1360 3FLORA PRO-ACTTVOLIVE SPREAD 2.1360 3FLORA PRO-ACTTV SUNFLOWER 1 2.1360 3FLORA REDUCED SALT 1 2.1360 3FLORA REDUCED SALTSUNFLOWER# 1 1 2.1360 3FLORAORIGINAL 1 2.1360 3FLORAORIGINAL *+LIGHT 250 GM* 1 2.1360 3FLORASUNFLOWER ♦+ FLR LGT 250* 1 2.1360 3FLORASUNFLOWER *PMP 49P* 1 2.1360 3FLORASUNFLOWER *TUB*#1 1 2.1360 3FRESH FIELDS WHAT NOT BTR* 1 0.2950 1FRESH FIELDS WHAT NOT BTR* *PMP 99P* 1 0.2950 1FRESHFIELDS SOFTSPREAD 1 0.2950 IFRESHFIELDS SOFTSUNFLOWER SPREAD 1 0.2950 1FRESHFIELDSSUNFLOWER SPREAD LIGHT 1 0.2950 1GOLD CUPSUNFLOWER SPREAD 1 0.0910 1GOLD TOPJERSEY & GUERNSY BUTTER 1 0.2050 1GOLDEN CHURN* #1 1 0.9320 1HAPPY SHOPPER SOFTPLASTIC TUB # I 1 0.5230 1HEINZ WAV OLIVITEREDUCED FAT SPREAD 1 1.0680 2HOLLYBUSHSLIGHTLY SALTED 1 0.1360 1HORLICKS FARMHOUSEBUTTER 1 0.4550 1I CANT BLVE ITS NOT BTTRSPREAD 1 1.8410 2ICELAND VALUESALTED BUTTER 1 0.8410 1J SAINSBURY BGTY OLIVEEXTRA LIGHT SPREAD 1 1.6140 2J SAINSBURY BGTYSUNFLOWER LIGHT 1 1.6140 2J SAINSBURY BUTTERLICIOUS* I 1.6140 2J SAINSBURY BUTTERLICIOUSVEGETABLE FAT SPREAD *S*
11.6140
2
J SAINSBURY FREE FROMDAIRY FREE I 1.6140 2J SAINSBURY LOW PRC SOFTREDUCED FAT SPREAD 1 1.0450 2J SAINSBURY OLIVEREDUCED FAT SPREAD 1 1.0450 2J SAINSBURY SOFT* *TUB* 1 1.0450 2J SAINSBURY SPREADABLE* 2 1.0450 2J SAINSBURY SPREADABLEORGANIC 2 1.0450 2J SAINSBURY SPREAD ABLESLIGHTLY SALTED 2 1.0450 2J SAINSBURY TTD D’ISIGNY* 2 1.0450 2J SAINSBURY TTD ALPINE 1 1.0450 2J SAINSBURY TTDNORMANDY UNSALTED J SAINSBURY* *PACKET*
11.0450
2
J SAINSBURYCREAMY *C* 2 1.0450 2J SAINSBURYENGLISH SLIGHTY SALTED 1 1.0450 2J SAINSBURYENGLISH UNSALTED 1 1.0450 2
357

J SAINSBURYORGANIC SLIGHTLY SALTED 2 1.0450 2J SAINSBURYORGANIC UNSALTED 1.0450 2J SAINSBURYSUNFLOWER *TUB* 1 1.0450 2J SAINSBURYTOM & BAS SD BUTTER 1 1.0450 2J SAINSURYOLIVE ORGANIC SPREAD #1 1.0450 2KERRY*X 4* GARLIC 1 0.5450 1KERRYBLENDDAIRY SPREAD 1 0.5450 1KERRYGOLD SPREAD ABLEIRISH BUTTER 1.5680 2KERRYGOLDSLIGHTLY SALTED I 1.5680 2KERRYMAIDDAIRY SPREAD *PMP 99P* 1 0.4090 1KWIK SAVESALTED 1 0.7730 1KWIK SAVEUNSALTED 1 0.7730 1KWUCSAVESUNFLOWER SPREAD 1 0.7730 IKWIK SAVE SIMPLYBUTTERY SPREAD 1 0.4770 1KWIKSAVE SIMPLYBLENDED I 0.4770 1KWIKSAVE SIMPLYSOFT MARGARINE 1 0.4770 1KWIKSAVE SIMPLYSOFT SPREAD 1 0.4770 1L/FARM LUXURYJERSEY BUTTER 1 0.0680 1LATT MONT 1 0.0000 1LIDL EASILY BETTERVEGETABLE FAT SPREAD 1 0.6360 1LIDL GOLDEN SUNSUNFLOWER LOW FAT SPREAD 1 0.6360 1LIDL GOLDEN SUNSUNFLOWER SPREAD #2 1 0.6360 1LIDL HEUSO SPREADABLEBUTTER 0.6360 1LIDL MILBONABUTTER 1 0.6360 1LIDLOLIVE GOLD SPREAD 0.6360 1LIFESTYLE BUTTERY FARM* *PMP* I 0.0910 1LURPAK*+20% EXTRA* LIGHTER SPREADABLE 2.5910 3LURPAKCRUSHED GARLIC 1 2.5910 3LURPAKLIGHTER SPREADABLE 2.5910 3LURPAKSLGHLY SLTED DNISH BUTTER 1 2.5910 3LURPAKSLIGHTLY SALTED 1 2.5910 3LURPAKSPREADABLE L/SLTD *+20%* 1 2.5910 3LURPAKSPREADABLE LIGHTLY SALTED 1 2.5910 3LURPAKSPREADABLE SLIGHTLY SLTD 1 2.5910 3LURPAKUNSALTED 1 2.5910 3M&S ST MICHAELA TOUCH OF BUTTER 1 1.7270 2M&S ST MICHAELCORNISH BUTTER SALTED 1 1.7270 2M&S ST MICHAELDANISH SLIGHTLY SALTED 1 1.7270 2M&S ST MICHAELEASIER SPREADING 2 1.7270 2M&S ST MICHAELEASIER SPREADING UN SLTD 2 1.7270 2M&S ST MICHAELENGLISH SALTED CREAMERY 2 1.7270 2M&S ST MICHAELHALF FAT SALTED SP BUTTER 1 1.7270 2M&S ST MICHAELLOW FAT SPREAD BUTTER 1 1.7270 2M&S ST MICHAELOLIVE GOLD SPREAD *C* 1 1.7270 2M&S ST MICHAELSPREADABLE SLIGHTLY SLTD 1.7270 2M&S ST MICHAELSUNFLOWER 1 1.7270 2M&S ST MICHAELSUNFLOWER LOW FAT SPREAD 1 1.7270 2MARYLAND FARMHOUSEBUTTER 1 • 0.1360 1MORRISONS BETTA BUYSALTED 1 0.9090 1MORRISONS BETTER BY FAR# 1 CREAM/VEGETABLE OIL SPRD
10.9090
1
MORRISONS BETTER FOR YOUSUNFLOWER LIGHT #1
10.9090
1
MORRISONS BETTERBUYLOW FAT SPREAD 1 0.9090 1MORRISONS MORNING GOLDLOW FAT SPREAD # 1 1 0.9090 1MORRISONS REDUCED FATSPREAD DANISH STYLE #2 1 0.9090 1MORRISONS SOFT SPREADVEGTABLE FAT SPREAD 1 0.9090 1MORRISONSBAKING MARGARINE 0.9090 1MORRISONSENGLISH #1 1 0.9090 1MORRISONSOLIVE REDUCED FAT SPREAD 1 0.9090 1MORRISONSORGANIC 0.9090 1MORRISONSSCOTTISH 1 0.9090 1MORRISONSSOFT SPREAD 1 0.9090 1MORRISONSSPREAD DANISH STYLE #1 1 0.9090 1
358

MORRJSONSSUNFLOWER #1 1 0.9090 1MORRISONSSUNFLOWER SPREAD 1 0.9090 1NETTOEVERYDAY SOFT SPREAD 1 0.5000 1N1SA HERITAGE* 1 0.4090 1NORPAKSPREADABLE 0.2950 1OLIVIOREDUCED FAT SPREAD #2 1 1.9090 2PRESIDENT SOFTERUNSALTED 1 1.1590 2PRESIDENTLIGHT BUTTER 1 1.1590 2PRESIDENTS ALTED 1 1.1590 2PRESIDENT UNSALTED # 1 1 1.1590 2PURAOLIVE OIL SPREAD 1 0.2270 1PURE I 0.0000 1PUREORGANIC REDUCED FAT SPRD I 0.0680 1PURESOYA 0.0000 1PURES UNFLOWER *TUB* 1 0.0000 1RACHELSORGANIC BUTTER UNSALTED 0.3860 1ROWAN GLEN EASY SPREAD* 1 0.0000 1ROWAN GLENHALF FAT BUTTER 1 0.0000 1ROWSONS SIMPLY BETTER SPD 1 0.0000 1SAFEWAY 1 1.0450 2SLIMMERS GOLDLOW FAT SPREAD 1 0.1140 1SOMERFIELD BUTTERY GOLDSPREAD 1 0.9550 1SOMERFIELD OLIVE GOLDREDUCED FAT SPREAD 1 0.9550 1SOMERFIELD S/SOFTSUNFLOWER #1 1 0.9550 1SOMERFIELD SO GOODWEST COUNTRY 1 0.9550 1SOMERFIELD SPREADABLELACTIC 0.9550 1SOMERFIELDENGLISH SALTED 1 0.9550 1SOMERFIELDSOFT MARGARINE 1 0.9550 1SOMERFIELDSUNFLOWER *TUB* 1 0.9550 1SOMERFIELDUN SALTED 1 0.9550 1SPAR SOFT* *TUB* #1 1 0.9320 1SPARDAIRY 1 0.9320 1ST HELENS GOATSLIGHTLY SALTED 1 0.1360 1ST IVEL GOLD LIGHTLOW FAT SPREAD *TUB* 1 1.7050 2ST IVEL GOLD LOWEST EX LTVERY LOW FAT SPREAD 1 1.7050 2ST IVEL GOLD* 1 1.7050 2ST IVEL SHIRGARWELSH *PAT* 1 1.7050 2ST IVEL UTR BTR SCNDVN ST* 1 1.7050 2ST IVEL UTTERLY BUTTERLY* 1 1.7050 2ST IVELCORNISH *PATS* 1 1.7050 2ST IVELENGLISH UNSALTED BUTTER 1 1.7050 2ST IVELMOONRAKER 1 1.7050 2ST IVELSOMERSET *ROLL* 1 1.7050 2STORK SB* *TUB* 1 1.4550 2STORK* ‘PACKET* 1 1.4550 2SUMMER COUNTY SOFT* *TUB* 1 0.2730 1TESCO BUTTER ME UPSPREAD 1 1.5680 2TESCO BUTTER ME UPSPREAD LIGHT 1 1.5680 2TESCO BAKING* ‘PACKET* 0.6820 1TESCO FINESTBRITTANY 1 1.3860 2TESCO FINESTCHANNEL ISLAND I 1.3860 2TESCO FINESTCORNISH 1 1.3860 2TESCO FINESTNORMANDY 1 1.3860 2TESCO HEALTHY EATINGSUNFLOWER LOW FAT SPREAD
11.3860
2
TESCO HEALTHY EATNG LW SNSPREAD 1 1.3860 2TESCO HEALTHY LIVINGLIGHTLY SALTED SPREADABLE
11.3860
2
TESCO HEALTHY LVNG OLV LTSPREAD 1.3860 2TESCO OLIVE GOLDREDUCED FAT SPREAD 1 1.3860 2TESCO SOFT* 1 1.3860 2TESCO SPREADABLE* 1.3860 2TESCO VALUE* 1 0.8860 1TESCO VALUESOFT SPREAD 1 0.8860 1
359

TESCO VALUESUNFLOWER SPREAD 1 0.8860 1TESCOCREAMERY BUTTER 2 0.8860 1TESCOENGL1SH CREAMERY 2 0.8860 1TESCOORGANIC BUTTE 2 0.8860 1TESCOSLIGHTLY SALTED 1 0.8860 1TESCOSOFT SPREAD 1 0.8860 1TESCOSUNFLOWER ♦TUB* 1 0.8860 1TESCOWELSH 1 0.8860 1TOMOR KOSHER* *PACKET* 1 0.8860 1TOMOR 1 0.0450 1UTTERLY BUTTERLY* 1 2.0680 3VELVET GOLD REDUCED FAT SPREAD 1 0.2730 1VILLAGE CROSS* 1 0.0000 1VITALITE*PMP 78P* SUNFLOWER 1 1.4550 2VITALITESUNFLO WER 1 1.4550 2WAITROSE SPREADSUNFLOWER #1 1 1.2950 2WAITROSEDAIRY 1 1.2950 2WAITROSEDAIRY SALTED 1 1.2950 2WAITROSEENGLISH# 1 1 1.2950 2WAITROSELIGHTLY SALTED 1 1.2950 2WAITROSEOLIVE SPREAD 1.2950 2WHEELBARROWSALTED 1 0.1590 1WHEELBARROWUNSALTED 1 0.1590 1WILLOW* 1 0.5680 1WYKE FARMHOUSE* 1 0.2500 1YEO VALLEY ORGANIC SPRDBL* 2 0.8410 1YEO VALLEY ORGANIC* 2 0.8410 1YORKSHIRE* 1 0.2730 1
360

APPENDIX D
361

Utilitarian and Informational Levels of Biscuits
Brands UtilitarianLevel
MKQ InformationalLevel
ABBEY RICE CAKES 1 0.288 1ACE MILK CHOCOLATE 2 0.242 1ADAMS MALTED MILK 1 0.091 1ADAMS MALTED MILK CHOC 2 0.091 1AFTER EIGHT BISCUITS 2 2.697AINS MINT/C 1 0.015 1AINS STEM GINGER 1 0.015 1AINSLEY HARRIOTT CARAMEL DELIGHT BARS 2 0.758 1AINSLEY HARRIOTT CHOCOLATE HEAVEN BARS 2 0.758 1AINSLEY HARRIOTT WAFERS CARAMEL 2 0.758 1ALDIAMERETTIMORBIDI BISCUITS I 1.227 1ALDI BELMONT BERRY CAKES 2 1.227 1ALDI BELMONT BIG BITE TEACAKES 2 1.227 1ALDI BELMONT BOURBON CREAMS 2 1.227 1ALDI BELMONT CARAMEL COAST BARS 2 1.227 1ALDI BELMONT CHOC BISC ASSORT 1 1.227 1ALDI BELMONT CHOCOLATE CHIP COOKIES 2 1.227 1ALDI BELMONT CHOCOLATE WAFERS 2 1.227 1ALDI BELMONT CUSTARD CREAM/BOURBON CRM 2 1.227 1ALDI BELMONT CUSTARD CREAMS 2 1.227 1ALDI BELMONT DIGESTIVE 1 1.227 1ALDI BELMONT DIGESTIVE MILK CHOC 2 1.227 1ALDI BELMONT DIGESTIVE PLAIN CHOC 2 1.227 1ALDI BELMONT GINGER SNAPS 1 1.227 1ALDI BELMONT JAFFA CAKES 2 1.227 1ALDI BELMONT JAMMY DEVILS 2 1.227 1ALDI BELMONT JAMMY RINGS 2 1.227 1ALDI BELMONT MINI JAFFA CAKES 2 1.227 1ALDI BELMONT OATIES GOLDEN BISCUITS 1 1.227 1ALDI BELMONT SHORTCAKE FRUIT BISCUITS 2 1.227 1ALDI BELMONT STAX WAFERS 1 1.227 1ALDI BELMONT TOFFYOOZE MILK CHOC BISC 2 1.227 1ALDI BELMONT WACKO CARAMEL BARS 2 1.227 1ALDI BELMONT WACKO THICK CHOC BARS 2 1.227 1ALDI BIG BITE TEACAKES 2 1.227 1ALDI CASABLANCA ASSORTMENT IN A BOX 1 1.227 1ALDI CHOCEUR CAPPUCINO 2 1.227 1ALDI CHOCEUR CHOCOLATE & BISCUIT 2 1.227 1ALDI DAIRYFINE BRKTM STKS MILK CHOC STKS W MLKY FLG 2 1.227 1ALDI DANISH BUTTER COOKIES 1 1.227 1ALDI FIG ROLLS 2 1.227 1ALDI JIVE CARAMEL SHORTCAKE BARS 2 1.227 1ALDI LAMBERTZ PETITS SOLEILS FEINSTE LEBKUCHEN 1 1.227 1ALDI MACWRIGHT HI BAKE WATER BISCUITS 1 1.227 1ALDI MEZZO MILK CHOC CTD BUTTER BISCUITS 2 1.227 1ALDI MINI COOKIES TOFFEE PPCRN 1 1.227 1ALDI PARKWOOD ALL BUTTER SHORTBREAD FINGER 1 1.227 1ALDI PARKWOOD ALMOND SHORTBREAD 1 1.227 1ALDI PARKWOOD CONTINENTAL BISC ASSRTMNT 1 1.227 1ALDI PARKWOOD ICECREAM WAFER CONES 1 1.227 1ALDI PARKWOOD LUXURY ASSORTMENT 1 1.227 1ALDI PARKWOOD MINI CHOC CHIP COOKIES 2 1.227 1ALDI PARKWOOD MINT BISCUIT CREAMS 2 1.227 1ALDI PAR WOOD TEMPTATIONS COOKIES CHOC CHNK/HZLNT 1 1.227 1ALDI PARWOOD TEMPTATION COOKIES STEM GINGER 1 1.227 1ALDI RICH TEA 1 1.227 1ALDI SHANNON CHOC WAFERS +HAZELNUT FIL 2 1.227 1ALDI SHORTBREAD LUXURY 1 1.227 1ALDI SNACKRITE ASSORTED 1 1.227 1
362
ALDI SNACKRITE CHEESE BISCUITS 1 1.227 1ALDI SNACKRITE CHEESE MINI THINS 1 1.227 1ALDI SNACKRITE CREAM CRACKERS 1 1.227 1ALDI SNACKRITE SEA SALT & CRCKD BLACK PEPPER 1 1.227 1ALDI SNACKRITE SNACKERS 1 1.227 1ALDI SNACKRITE TANGULARS 1 1.227 1ALDI SNACKRITE TEMP PUFF PASTRY CHEESE TWISTS 1 1.227 1ALDI STONEMILL COOKIES AMERICAN OATMEAL & SLTNA 1 1.227 1ALDI TANDEM CHUNKY CHOC CVRD WFR FINGER 2 1.227 1ALDI TANDEM MILK CHOC WAFER BARS 2 1.227 1ALDI TEMP HLF CTD TRIPLE CH COOKIES 2 1.227 1ALDI THE BISC COLL COOKIES APPLE PIE 1 1.227 1ALDI WAVER CHOCOLATE BISC BAR 2 1.227 1ALICE MCPHERSON LXRY PTTCT TLS 1 0.106 1ALLINSON CRISPBREAD ORGANIC 1 0.545 1AMARETTI AUTHENTIC PAOLO LAZZARONI FIGLI 1 1.182 1AMARETTI BONOMI MACAROONS 1 1.182 1AMARETTI VIRGINIA 1 1.182 1AMARETTI VIRGINIA ‘SOFT TIN’ 1 1.182 1AMARETTI VIRGINIA CRUNCHY SILVER TIN 1 1.182 1AMARETTI VIRGINIA SOFT COCOA 1 1.182 1AMARETTI VIRGINIA TRADITIONAL 1 1.182 1AMERICAN COCONUT COOKIES 1 NV NVAMOY COOKIES FORTUNE 1 0.742 1ANDUTRA COCKTAIL SNACK 1 0.000 1ANNAS GINGER THINS 1 0.000 1ARDEN BOUVARD PETIT FOURS CHOC BISC 2 0.152 1ARDEN TWI STIES HAZELNUT & COCOA CREME 2 0.152 1ARGYLL SAFEWAY ALMOND 1 1.273 1ARGYLL SAFEWAY BEST CHP FRUIT&NUT COOKIES 2 1.273 1ARGYLL SAFEWAY BEST CHOC CREAM HEART 2 1.273 1ARGYLL SAFEWAY BEST MINT ‘VIRTUOSO’ 2 1.273 1ARGYLL SAFEWAY BEST SHORTBREAD FINGER A/B 1 1.273 1ARGYLL SAFEWAY BEST SHORTBREAD SLCTN ALL BUTTER 1 1.273 1ARGYLL SAFEWAY BEST TRIPLE CHOC COOKIES 1 1.273 1ARGYLL SAFEWAY BOURBON CREAMS 2 1.273 1ARGYLL SAFEWAY CHEESE SAVOURIES 1 1.273 1ARGYLL SAFEWAY CHEESE THINS 1 1.273 1ARGYLL SAFEWAY CHOC CHIP COOKIES 2 1.273 1ARGYLL SAFEWAY COCONUT RINGS 1 1.273 1ARGYLL SAFEWAY CREAM CRACKERS 1 1.273 1ARGYLL SAFEWAY DIGESTIVE 1 1.273 1ARGYLL SAFEWAY DIGESTIVE MILK CHOC 2 1.273 1ARGYLL SAFEWAY DIGESTIVE PLAIN CHOC 2 1.273 1ARGYLL SAFEWAY DOUBLE CHOC CHIP COOKIES 2 1.273 1ARGYLL SAFEWAY GARIBALDI 2 1.273 1ARGYLL SAFEWAY GINGER NUTS 1 1.273 1ARGYLL SAFEWAY H/C DIGESTIVE REDUCED FAT 2 1.273 1ARGYLL SAFEWAY JAFFA CAKES MINI 2 1.273 1ARGYLL SAFEWAY KIDS BANANA MILKSHAKE CREAMS 2 1.273 1ARGYLL SAFEWAYKIDS NUM.CRUNCHERS COCOA BS 2 1.273 1ARGYLL SAFEWAY MALTED MILK 1 1.273 1ARGYLL SAFEWAY MALTED MILK MLK CHOC 2 1.273 1ARGYLL SAFEWAY MILK CHOC FINGERS 2 1.273 1ARGYLL SAFEWAY MORNING COFFEE 1 1.273 1ARGYLL SAFEWAY ORGANIC SHRTBREAD FINGERS 1 1.273 1ARGYLL SAFEWAY PLAIN CHOC WAFER FINGERS 2 1.273 1ARGYLL SAFEWAY POPPY/SESAME THINS 1 1.273 1ARGYLL SAFEWAY RICH TEA FINGERS 1 1.273 1ARGYLL SAFEWAY SHRTBREAD CHOCOLATE CHIP 2 1.273 1ARGYLL SAFEWAY SANDWICH MILK CHOC MINT 2 1.273 1ARGYLL SAFEWAY SANDWICH MILK CHOCOLATE 2 1.273 1ARGYLL SAFEWAY SANDWICH MILK CHOC ORANGE 2 1.273 1ARGYLL SAFEWAY SAVERS CUSTARD CREAM 2 1.273 1
363

ARGYLL SAFEWAY SAVERS DIGESTIVES MILK CHOC 2 1.273 1ARGYLL SAFEWAY JAFFA CAKES 2 1.273 1ARGYLL SAFEWAY VARIETY CREAMS 2 1.273 1ARGYLL SAFEWAY SHRTBREAD FINGERS 1 1.273 1ARGYLL SAFEWAY SHORTCAKE 1 1.273 1ARGYLL SAFEWAY SHRTBREAD LIGHT & CRUMBLY 1 1.273 1ARGYLL SAFEWAY TAKE TWO MINT 2 1.273 1ARGYLL SAFEWAY TRAD SHRTBREAD ROUNDS 1 1.273 1ARGYLL SAFEWAY TWISTS CHEESE 1 1.273 1ARGYLL SAFEWAY WHT FR CAKES RASPBERRY 1 1.273 1ARNOTTS MILK PLUS BISCUITS 1 0.424 1ARNOTTS SHAPES PIZZA 1 0.424 1ARNOTTS TIM TAM CHEWY CARAMEL 2 0.424 1ARNOTTS TIM TAM CHEWY CHOC FUDGE 2 0.424 1ARNOTTS TIM TAM ORIGINAL 2 0.424 1ASDA S+S 1 2.030 2ASDA ALL BUTTER 1 2.030 2ASDA ASSORTMENT 1 2.030 2ASDA BISCUITS FOR CHEESE 1 2.030 2ASDA BLACK BERRY CHOC BAR 2 2.030 2ASDA BLACKPEPPER TWISTS 1 2.030 2ASDA BOURBON CREAM 2 2.030 2ASDA BRANDY SNAP BASKETS 1 2.030 2ASDA BUTTER FINGERS 1 2.030 2ASDA BUTTER PUFFS 1 2.030 2ASDA CARAMEL BAR 2 2.030 2ASDA CARAMEL WAFER 2 2.030 2ASDA CHEESE & CHIVES BITES 1 2.030 2ASDA CHEESE SAVOURIES 1 2.030 2ASDA CHEESE THINS 1 2.030 2ASDA CHEESE TWISTS 1 2.030 2ASDA CHOC ASSORTMENT 2 2.030 2ASDA CHOC BRANDY SNAPS 2 2.030 2ASDA CHOC FINGER 2 2.030 2ASDA CHOC ORANGE BISCUITS 2 2.030 2ASDA CHOC SHORTBREAD 1 2.030 2ASDA CHOCOLATE ASSORTMENT 2 2.030 2ASDA COCONUT RINGS 1 2.030 2ASDA CONTINENTAL SELECTION 1 2.030 2ASDA COOKIES ASSORTMENT 1 2.030 2ASDA COOKIES CHOCOLATE CHIP 2 2.030 2ASDA MILK CHOCOLATE CHIP 2 2.030 2ASDA CORNETS 1 2.030 2ASDA CRACKER SELECTION 1 2.030 2ASDA CREAM CRACKERS 1 2.030 2ASDA CREAMS 2 2.030 2ASDA CRISPBREAD 1 2.030 2ASDA CRUMBLE CREAMS 2 2.030 2ASDA CUSTARD CREAMS 2 2.030 2ASDA DIGESTIVE 1 2.030 2ASDA DIGESTIVE CHOC CHIP 2 2.030 2ASDADIGESTIVE CHOC 2 2.030 2ASDA DIGESTIVES MILK CHOCOLATE 2 2.030 2ASDA DIGESTIVE PLAIN CHOCOLATE 2 2.030 2ASDA ES COOKING CARROT COOKIES 1 2.030 2ASDA ES COOKIES CHOC CHIP 2 2.030 2ASDA ES COOKIES CHOCOLATE & NUTS 1 2.030 2ASDA ES COOKIES FRUIT AND NUTS 1 2.030 2ASDA ES COOKIES MIXED 1 2.030 2ASDA EX SPE FLORENTINES BELGIA 2 1.360 1ASDA EXTRA SPECIAL BISC FOR CHEESE 1 1.364 1ASDA EXTRA SPECIAL CHEESE WAFERS 1 1.364 1ASDA EXTRA SPECIAL CHIVE CRACKERS ONION 1 1.364 1ASDA EXTRA SPECIAL CHOC SHORTBREAD 1 1.364 1
364

ASDA EXTRA SPECIAL COOKIES DOUBLE CHOC CHIP 2 1.364 1ASDA EXTRA SPECIAL SHORTBREAD 1 1.364 1ASDA EXTRA SPECIAL SHORTBREAD MIXED 1 1.364 1ASDA EXTRA SPECIAL THINS ALMONDS 1 1.364 1ASDA EXTRA SPECIALTHINS CHOCOLATE 1 1.364 1ASDA FIG ROLLS 2 2.030 2ASDA FRUIT & SPICE SHORTBREAD 1 2.030 2ASDA SHORTCAKE BISCUITS 2 2.030 2ASDA GARIBALDI 2 2.030 2ASDA GINGER NUTS 1 2.030 2ASDA GOOD FOR YOU CUSTARD CREAMS 2 1.333 1ASDA GOOD FOR YOU DIGESTIVE 1 1.333 1ASDA GOOD FOR YOU RICE CRACKERS LEMONGRASS CORIANDER & SALSA
1 1.333 1
ASDA GOOD FOR YOU RICE CRACKERS VANILLA & CARAMEL 1 1.333 1ASDA GOOD FOR YOU RICE NIBBLES 1 1.333 1ASDA GOOD FOR YOU RICE SNACKS CHILLI TUBE 1 1.333 1ASDA GOOD FOR YOU RICE SNACKS MESQUITE TUBE 1 1.333 1ASDA GOOD FOR YOU SAVOURY BISCUIT CRACKER 1 1.333 1ASDA GOOD FOR YOU SNACK STICKS 1 1.333 1ASDA HONEY BEAR HONEY 1 2.030 2ASDA JAFFA BAR 2 2.030 2ASDA JAFFA CAKES 2 2.030 2ASDA LOW FAT DIGESTIVE CHOCOLATE 2 2.030 2ASDA MALTED MILK 1 2.030 2ASDA MALTED MILK WITH MILK CHOCOLATE 2 2.030 2ASDA MIGHTY CARAMEL 2 2.030 2ASDA MINI CHEESE TWISTS 1 2.030 2ASDA MINI JAFFA CAKES 2 2.030 2ASDA MORNING COFFEE 1 2.030 2ASDA NICE 1 2.030 2ASDA NOVELTRY TREES 1 2.030 2ASDA OAT 1 2.030 2ASDA ORANGE LOGS 2 2.030 2ASDA PARKIN GINGER 1 2.030 2ASDA PARTY MIC S/CRM 1 2.030 2ASDA PUFFIN CHOCOLATE 2 2.030 2ASDA PUFFIN MILK CHOCOLATE 2 2.030 2ASDA PUFFIN MINT 2 2.030 2ASDA PUFFIN ORANGE 2 2.030 2ASDA PUFFIN ORANGE MILK CHOCOLATE 2 2.030 2ASDA PUFFIN PEANUT CARAMEL 2 2.030 2ASDA PUFFIN TOFFEE 2 2.030 2ASDA RICE BITES BACON 1 2.030 2ASDA RICE BITES CHEES & ONION 1 2.030 2ASDA RICE BITES SALT & VINEGAR 1 2.030 2ASDA RICE NIBBLES ASSORTED 1 2.030 2ASDA RICH TEA 1 2.030 2ASDA RICH TEA FINGERS 1 2.030 2ASDA RICH TEA MILK CHOCOLATE 2.030 2ASDA SHORTBREAD FINGERS ALL BUTTER 1 2.030 2ASDA SOVOURY SELECTION 1 2.030 2ASDA SOVOURY SELECTION CHEESE 1 2.030 2ASDA SHORTBREAD 1 2.030 2ASDA SHORTBREAD ASSORTMENT 1 2.030 2ASDA SHORTBREAD FINGERS 1 2.030 2ASDA SHORTBREAD LEMON 1 2.030 2ASDA SHORTBREAD PETTICOAT TAIL 1 2.030 2ASDA SHORTCAKE 1 2.030 2ASDA SHORTIES RICH 1 2.030 2ASDA SHREWBURY LEMON 1 2.030 2ASDA SMART PRICE CUSTARD CREAM 2 1.260 1ASDA SMARTPRICE BOURBON CREAMS 2 1.258 1ASDA SMARTPRICE CHOC CARAMEL WAFER 2 1.258 1
365

ASDA SMARTPRICE COOKIES CHOC CHIP 2 1.258 1ASDA SMARTPRICE DIGESTIVE 1 1.258 1ASDA SMARTPRICE DIGESTIVE CHOC 2 1.258 1ASDA SMARTPRICE GINGER NUTS 1 1.258 1ASDA SMARTPRICE JAFFA CAKES 2 1.258 1ASDA SMARTPRICE MILK CHOC DIGESTIVE BAR 2 1.258 1ASDA SMARTPRICE NICE 1 1.258 1ASDA SMARTPRICE RICH TEA 1 1.258 1ASDA SMARTPRICE SANDWICH MILK CHOCOLATE 2 1.258 1ASDA SMARTPRICE SHORTIES FRUIT 2 1.258 1ASDA SMARTPRICE VARIETY PACK 1 1.258 1ASDA SMARTPRICE WAFER CHOCOLATE 2 1.258 1ASDA SWEET ASSORTMENT 1 2.030 2ASDA TAKE A BREAK MILK CHOC WAFER 2 2.030 2ASDA TAKE A BREAK SANDWICH MINT 2 2.030 2ASDA TAKE A BREAK SANDWICH ORANGE 2 2.030 2ASDATIKKA CRACKERS 1 2.030 2ASDA TRIPLE CHOC BARS 2 2.030 2ASDA WAFER CHOCOLATE 2 2.030 2ASDA WATER BISCUITS 1 2.030 2ASHBOURNE CHCCIE BEARS 1 0.015 1ASHBOURNE OAT & RAISIN ORGANIC 1 0.015 1ASKEYS CORNETS CUP 1 0.152 1ASKEYS CORNETS PARTY 1 0.152 1ASKEYS CORNETS ROUND 1 0.152 1ASKEYS ICE CREAM WAFERS 1 0.152 1ASSORTED BISCUITS 1 NV NVAUNTIES WHEELIES MINI SANDWICH COOKIES VRS 2 0.061 1AWT ORGANIC GINGER CRUNCHES 1 0.030 1BAHLSEN AFRIKA 2 0.424 1BAHLSEN CHOCO LEIBNIZ MEK 2 0.424 1BAHLSEN CHOCO LEIBNIZ PLAIN 2 0.424 1BAHLSEN FIRST CLASS ONHE GLCHN 2 0.424 1BAHLSEN FIRST CLASS PLN OHNE GLCHN 2 0.424 1BAHLSEN HIT 2 0.424 1BAHLSEN LE CAFE JAFFA CAKES 2 0.424 1BAHLSEN LEBKUCHEN 2 0.424 1BAHLSEN MESSINO CHOC ORANGE 2 0.424 1BAHLSENMESSINO ORANGE FRUIT 2 0.424 1BAHLSEN ORANGE LEIBNIZ 2 0.424 1BAHLSEN PICKUP 2 0.424 1BAHLSEN SNACK HITS 2 0.424 1BAHLSEN ZOO ORIGINAL 2 0.424 1BAKER BENNETTS PEANUT COOKIES 1 0.360 1BAKERS TENNIS BISCUIT COCONUT 1 0.364 1BALLERINA HZLNT CRM FLLD COOKIES 1 NV NVBALO WAFER HAZELNUT 1 0.030 1BARGAIN BUYS BROKEN BISCUITS 1 0.227 1BART SIMPSON MINI DOUGHNUT COOKIES 1 0.439 1BAY TREE MUSTARD & PEPPER BISCUITS 1 0.015 1BBB BANG ON THE DOOR MINI ICED BISCUITS 1 0.212 1BBB ISNEY PRINCESS STRAWBERRY HEARTS 2 0.212 1BBB WINNIE THE POOH CHOC CHIP MINI BISCUITS 2 0.212 1BBB WTP BISCUITS WINNIE 1 0.212 1BBB WTP RUMBLY TUMBLIES CHOC CHIP MINI BISC 2 0.212 1BBB WTP RUMBLY TUMBLIES MINI BISCUITS 1 0.212 1BELIN LU TUILES AMANDES 1 0.167 1BEST BUY BOURBON CREAMS 2 0.409 1BEST BUY FRUIT SHORTIES 2 0.409 1BEST BUY GINGER FINGERS 1 0.409 1BEST IN DIGESTIVE BISCUITS 1 0.152 1BINGO MILK CHOC BISCUITS 2 0.379 1BIONA ORGANIC COOKIES 1 0.061 1BISC & BOUNTY 2 0.333 1
366

BISC & M &MS 2 0.333 1BISC & MARS 2 0.333 1BISC MILKY WAY 2 0.333 1BISC & MIX 2 0.333 1BISC & SNICKERS 2 0.333 1BISC & TWIX 2 0.333 1BISC &TWIX/M&MS 2 0.333 1BISCA BUTTER COOKIES XMAS SELECT 1 0.106 1BISCA DANISH COOKIES 1 0.106 1BISCA MARIE 1 0.106 1BISCA TOFFEE COOKIES 1 0.106 1BISCOTTO CHOC MINT WAFER STICK 1 0.273 1BISCOTTO WAFER CAPPUCINO 1 0.273 1BISCOTTO WAFER STICKS 1 0.273 1BISCUIT BARREL 1 0.303 1BISCUIT BOX 1 NV NVBISTEFANI SAOIARDI LADY FINGERS 1 0.00 1BLUE DRAGON COOKIES FORTUNE 1 0.530 1BLUE LABEL POLISH SESAME SNAPS 1 0.606 1BLUE RIBAND WAFER MILK CHOC 1.652BOBBYS DANISH BISCUITS 1 0.227 1BOBBYS JAFFA CAKES 0.227 1BOBBYS WAFER 1 0.227 1BOLANDS FIG ROLLS 0.212 1BOLANDS KIMBERLEY 1 0.212 1BOLANDS MIKADO MALLOWS JAM 0.212 1BOLERO WAFER CHOCOLATE 1 0.258 1BON BON BUDDIES BUBBLEGUM BISCUITS 1 0.091 1BON BON BUDDIES MINI STRAWBERRY ICED BSCS 1 0.091 1BON BON BUDDIES NODDY COOKIES 1 0.091 1BONBON BUDDIES PRINCESS BISCUITS ICED 1 0.091 1BON BON BUDDIES PRINCESS DRM CHOC & STRAWBERRY 1 0.091 1BONBON BUDDIES SCOOBY DOO TOFF & DBLE CHOC CHIP COOKIES 0.091 1BONNE MAMAN G ALETTES 1 0.424 1BOOTS NO ADDED SUGAR COCONUT COOKIE 1 1.545BORDER BISCUIT SELECTION 1 0.030 1BORDER BISCUITS CHERRY SHORTCAKE 2 0.030 1BORDER BISCUITS CROFTERS CRUNCH 1 0.030 1BORDER CHOC GINGER TIN 2 0.030 1BORDER CROFTERS MILK CHOCOLATE 2 0.030 1BORDER GINGER DARK CHOCOLATE 2 0.030 1BORDER LUXURY COOKIES BUTTERSCOTCH 1 0.030 1BORDER LUXURY SELECTION 1 0.030 1BORDER PETTICOAT TAILS 1 0.030 1BORDER SCOTTISH BISCUIT SEL 1 0.030 1BORDER VIENNESE CHOCOLATE WHIRLS 0.030 1BOULEVARD CHEESE NUGGETS 1 0.167 1BOULEVARD CHEESE STRAWS 1 0.167 1BOULEVARD CHEESE TWIRLS 1 0.167 1BRADFORD TEACAKES 2 0.045 1BREAKAWAY 2 2.000 2BREAKAWAY DIGESTIVE MILK CHOCOLATE 2 2.000 2BREAKAWAY MILK CHOCOLATE 2 2.000 2BRINK DUTCH SPRITS 1 0.000 1BRINK SANDWICH 2 0.000 1BRINKS RICE CAKES SEASALT 1 0.000 1BROKEN BISCUIT ASSORTMENT 1 NV NVBROKEN BISCUITS 1 NV NVBUDGEN CUSTARD CREAM 2 0.379 1BUDGEN DIGESTIVE 1 0.379 1BUDGEN DIGESTIVE PLAIN CHOCOLATE 2 0.379 1BUDGEN SHORTCAKE 1 0.379 1BUDGEN SHORTIES 2 0.379 1BUITEMAN CRUMBLES CHEDDAR 1 0.000 1
367

BUITEMAN GARLIC & HERB 1 0.000 1BUITEMAN MINI BAGTTS GRUYERE CHEESE 1 0.000 1BUITEMAN SALSA BAGUETTES 1 0.000 1BURTONS CALADONIAN SHORTBREAD FINGERS 1 1.258 1BURTONS COCONUT DELIGHTS 1 1.258 1BURTONS CUSTARD CREAM 2 1.258 1BURTON DIGESTIVE 1 1.258 1BURTONS EXTRA TOFFYPOPS 2 1.258 1BURTONS FAVOURITES ASSORTMENT TIN 1 1.258 1BURTONS GIANT CHOC CHIP & HAZELNUT 2 1.258 1BURTONS GOLD MEDAL CHOC CHIP SHORTBREAD 2 1.258 1BURTONS HOMEBLEST DIGESTIVE MILK CHOCOLATE 2 1.258 1BURTONS HOMEBLEST DIGESTIVE PLAIN CHOC 2 1.258 1BURTONS JAFFA CAKES 2 1.258 1BURTONS JAM DODGERS VANILLA/THRIL 2 1.258 1BURTONS JAM TEACAKES 2 1.258 1BURTONS JAMMIE DODGERS 2 1.258 1BURTONS JAMMIE DODGERS VIMTO 2 1.258 1BURTONS LUNCH BOX MINI JAMIE DODGERS 2 1.258 1BURTONSMIGHTY CHOCALATE HOOPS 1 1.258 1BURTONS MINI JAMMIE DODGERS 2 1.258 1BURTONS ROYAL EDINBURGH PETTICOAT TAILS 1 1.258 1BURTONS ROYAL EDINBURGH SHORTBREAD 1 1.258 1BURTONS ROYAL EDINBURGH SHORTBREAD ASST 1 1.258 1BURTONS ROYAL EDINBURGH SHRTBRD FINGERS 1 1.258 1BURTONS SHORTBREAD 1 1.258 1BURTONS TOFFYPOPS CHOCOLATE 2 1.258 1BURTONS TRIM RICH TEA 1 1.258 1BUTTERFLY COOKIES 1 0.000 1CADBURY 2 2.818 3CADBURY ANIMALS 2 2.818 3CADBURY ANIMALS BISCUIT BITES 2 2.818 3CADBURY BISCUIT BARREL 2 2.818 3CADBURY BISCUIT TIN 2 2.818 3CADBURY BOURNVILLE BISCUITS 2 2.818 3CADBURY BUNNY RABBITS 2 2.818 3CADBURY CARAMEL FINGERS 2 2.818 3CADBURY CARTON 2 2.818 3CADBURY CHOCOLATE FINGERS 2 2.818 3CADBURY CHOCOLATE SELECTION 2 2.818 3CADBURY CHOCOLATE 2 2.818 3CADBURY CHOCOLATE ASSORTMENT 2 2.818 3CADBURY CHOCOLATE RINGS 2 2.818 3CADBURY CHOCOLATE SHORTCAKE 2 2.818 3CADBURY CHOCOTEAS 2 2.818 3CADBURY COOKIES CHOC CHUNKS 1 2.818 3CADBURY COOKIES CHOCOLATE CHIP 2 2.818 3CADBURY COOKIESDOUBLE CHOC CHIP 2 2.818 3CADBURY COOKIES FRUITS & NUT 2 2.818 3CADBURY COOKIES LUX DBL CHOC CHIP 2 2.818 3CADBURY COOKIES LUX MILK CHOC 2 2.818 3CADBURY DAIRY MILK WAFER 2 2.818 3CADBURY DIGESTIVE FRUIT & OAT 2 2.818 3CADBURY DIGESTIVE CHOCOLATE 2 2.818 3CADBURY DIGESTIVE FRUIT 2 2.818 3CADBURY DIGESTIVE MILK CHOCOLATE 2 2.818 3CADBURY EXTRA CRUNCHY CHOC FINGERS 2 2.818 3CADBURY FESTIVE BOX 2 2.818 3CADBURY FINGERS 2 2.818 3CADBURY FINGERS MINI 2 2.818 3CADBURY GIANT CARAMEL FINGERS 2 2.818 3CADBURY GIANT CHOCOLATE FINGERS 2 2.818 3CADBURY MILK CHOC FINGERS 2 2.818 3CADBURY GIFT BAG 2 2.818 3
368

CADBURY HIGHLIGHTS CARAMEL MALLOW 2 2.818 3CADBURY HIGHLIGHTS ORANGE MALLOW 2 2.818 3CADBURY HIGHLIGHTS ORANGE WAFER 2 2.818 3CADBURY HIGHLIGHTS WAFER PEACH 2 2.818 3CADBURY HIGHLIGHTS WAFER RASPBERRY 2 2.818 3CADBURY JESTIVES CHOC CHIP 2 2.818 3CADBURY MIGHTY MINIS CHOCAHOOPS HLF COATED 2 2.818 3CADBURY MIGHTY MINIS ORANGE SEGMENTS 2 2.818 3CADBURY MILK CHOC FINGERS 2 2.818 3CADBURY MILK CHOC SELECTION 2 2.818 3CADBURY MILK CHOC FINGERS 2 2.818 3CADBURY PLAIN CHOCOLATE FINGERS 2 2.818 3CADBURY PLATINUM SELECTION 2 2.818 3CADBURY RICH TEA MILK CHOCOLATE 2 2.818 3CADBURY SANDWICH MILK 2 2.818 3CADBURY SELECTION 2 2.818 3CADBURY SHORTIES 2 2.818 3CADBURY SIGNATURE 2 2.818 3CADBURY SIGNATURE ORANGE 2 2.818 3CADBURY SIGNATURE ORANGE SEGMENTS 2 2.818 3CADBURY SIGNATURE RASPBERRY 2 2.818 3CADBURY SNACKS MINI FINGERS 2 2.818 3CADBURY SNACKS MINI MILK FINGERS 2 2.818 3CADBURY SNACKS SHRTCAKE MILK CHOC 2 2.818 3CADBURY SNACKS WAFER MILK CHOC 2 2.818 3CADBURY WHITE CHOC FINGERS 2 2.818 3CAFE KRANZEL SHORTCAKE 1 0.197 1CAFE MINI CHOCOLATE COOKIES 1 NV NVCAFE SOCIETY BRANDY SNAPS BASKETS 1 0.152 1CAFE SOCIETY CAFE CURLS 1 0.152 1CAFE SOCIETY POMPADOUR FAN WAFERS 1 0.152 1CAFE SOCIETY PROMENADE WAFFLE BASKETS 1 0.152 1CAFE SOCIETY ST LOUIS WAFFLE CONES I 0.152 1CAFE SOCIETY TUILE SHELLS 1 0.152 1CAFE SOCIETY VIENNA CURLS 1 0.152 1CAMPBELLS SCOTTISH SHORTBREAD 1 0.788 1CAMPBELLS SHORTBREAD BOXES 1 0.178 1CARAMEL DIGESTIVE NV NVCARBOLITE WAFER CHOCOLATE 1 0.000 1CARBOLITE WAFERS BELGIAN CHOCOLATE 1 0.000 1CAROUSEL ICE CREAM CONES 1 0.470 1CAROUSEL NOUGAT WAFERS 1 0.470 1CAROUSEL OYSTER DELIGHTS 1 0.470 1CAROUSEL PREMIUM CHOC ICE CREAM CONES 1 0.470 1CAROUSEL WAFER FAN STYLE 1 0.470 1CAROUSEL WAFERS 1 0.470 1CAROUSEL WAFFLE BASKETS 1 0.470 1CAROUSEL WAFFLE CORNETS 1 0.470 1CARRS CONTINENTAL SELECTION 1 1.333 1CARRS DELI PESTO 1 1.333 1CARRS DELI ROSEMARY & FLAKED SALT 1 1.333 1CARRS SAVOURY SELECTION 1 1.333 1CARRS TABLE WATER BISCUITS LARGE 1 1.333 1CARRS TABLE WATER BISCUITS SMALL 1 1.333 1CARRS TABLE WATER BSC BLCK PPR 1 1.333 1CAXTON MILK CHOC WAFER FINGER 0.106 1CAXTON PINK N WHITE JAMMIES 0.106 1CAXTON WAFERS MALLOW PINK & WHITE 1 0.106 1CAXTON WAFERS PINK 1 0.106 1CAXTON WAFERS PLAIN CHOC FINGERS 0.106 1CHEDDARS CHEDDARS 1 1.939CHEESE STRAWS ‘PLSTC TRY’ 1 1.091 1CHEESELETS 1 0.561 1CHOCOLATE BISCUIT ASSORTED 2 NV NV
369

CINNAMON STARS 1 NV NVCLASSIC 2 1.061 1CLASSIC CRACKER BOX 1 1.061 1CLEARSPRING DOUBLE SESAME CAKE 1 0.076 1CLEARSPRING GARLIC RICE CAKES 1 0.076 1CLUB 2 2.167 2CLUB FRUIT 2 2.167 2CLUB MILK CHOCOLATE 2 2.167 2CLUB MINT 2 2.167 2CLUB ORANGE 2 2.167 2COCONUT BISCUITS 1 NV NVCOOKIES ASSORTMENT 1 NV NVCOOKIES CHOC & ALMOND 1 NV NVCOOKIES CHOC CHIP NV NVCOOKIES CHOCOLATE STRIPED 1 NV NVCOOKIES RAINBOW 1 NV NVCOOP CARTON SWEET ASSORTED 1 1.561 2COOP ALL BUTTER 1 1.561 2COOP ASSORTED BISCUITS 1 1.561 2COOP BOURBON CREAMS 2 1.561 2COOP BREAK SANDWICH CHOCOLATE 2 1.561 2COOP BREAK SANDWICH MINT CHOCOLATE 2 1.561 2COOP BREAK SANDWICH ORANGE 2 1.561 2COOP CHEESE SANDWICH 1 1.561 2COOP CHEESE SAVOURIES 1 1.561 2COOP CHEESE THINS 1 1.561 2COOP CHEESE TWISTS 1 1.561 2COOP CHOCCOLATE FINGERS 2 1.561 2COOP CHOCOLATE SHRTBREAD SELECTION 1 1.561 2COOP COCONUT RINGS 1 1.561 2COOP COOKIES CHOC & CHOC CHIP 2 1.561 2COOP COOKIES CHOC CHIP 2 1.561 2COOP COOKIES CHOC CHIP & HAZELNUT 2 1.561 2COOP COOKIES DANISH BUTTER 1 1.561 2COOP COOKIES MINI CHOCOLATE CHIP 2 1.561 2COOP COUNTRY CRUNCH 1 1.561 2COOP CREAM CRACKERS 1 1.561 2COOP CRISP BAKE PLAIN 1 1.561 2COOP CUSTARD CREAM 2 1.561 2COOP DIGESTIVE WHEATMEAL 1 1.561 2COOP DOUBLE BREAK BARS MILK CHOCOLATE 2 1.561 2COOP DOUBLE BREAK BARS PLAIN CHOCOLATE 2 1.561 2COOP DOUBLE BREAK MILK CHOCOLATE 2 1.561 2COOP EVERYDAY COOKIES CHOC CHIP 2 0.894 1COOP EVERYDAY CREAMS 2 0.894 1COOP EVERYDAY DIGESTIVE MILK CHOCOLATE 2 0.894 1COOP FAIRTRADE CHOC CHIP SHORTBREAD 2 1.561 2COOP FIG ROLLS 2 1.561 2COOP FRUIT SHORTCAKE 2 1.561 2COOP GARIBALDI 2 1.561 2COOP GINGER COOKIES 1 1.561 2COOP GINGER NUTS 1 1.561 2COOP HIGH BAKE WATER BISCUITS 1 1.561 2COOP JAFFA CAKES 2 1.561 2COOP JAFFA CAKES MINI 2 1.561 2COOP JAFFA CAKES ORANGE 2 1.561 2COOP JAM SANDWICH CREAMS 2 1.561 2COOP LINCOLN 1 1.561 2COOP LUXURY CHOCOLATE BISCUITS 1 1.561 2COOP M CH CHRISTMAS TREE BISCUITS 2 1.561 2COOP MALTED MILK 1 1.561 2COOP MALTED MILK WITH MILK CHOCOLATE 2 1.561 2COOP MORNING COFFEE 1 1.561 2COOP NICE 1 1.561 2
370
COOP PETTICOAT TALS 1 1.561 2COOP PREMIUM CHOC CHUNK & HAZELNUT 1 1.561 2COOP PREMIUM COOKIES CHOCOLATE & ORANGE 1 1.561 2COOP PREMIUM DOUBLE CHOCOLATE COOKIES 1 1.561 2COOP RICH TEA 1 1.561 2COOP RICH TEA MILK CHOCOLATE 2 1.561 2COOP ROUND LEMON PUFFS 2 1.561 2COOP SHORTBREAD FINGERS 1 1.561 2COOP SHORTBREAD ROUNDS 1 1.561 2COOP SAVOURY BISCUITS MINI 1 1.561 2COOP SHORTBREAD ASSORTMENT 1 1.561 2COOP SHORTBREAD P/COAT TAILS 1 1.561 2COOP SHORTBREAD PETIT FOURS 1 1.561 2COOP SHORTBREAD PLAIN CHOCOLATE GINGERS 1 1.561 2COOP SHORTBREAD SHAPES 1 1.561 2COOP SHORTBREAD STEM GINGER 1 1.561 2COOP SHORTCAKE 1 1.561 2COOP WHEATMEAL MILK CHOCOLATE 2 1.561 2COOP WHEATMEAL PLAIN CHOCOLATE 2 1.561 2CORSINI AMARETTI MORBIDI 1 0.091 1CORSINICANTUCCINI BISCUITS ALMOND 1 0.091 1COST CUTTER DIGESTIVE 1 0.606 1COST CUTTER DIGESTIVE MILK CHOCOLATE 2 0.606 1COST CUTTER DIGESTIVE PLAIN CHOCOLATE 2 0.606 1COST CUTTER GINGER NUTS 1 0.606 1COST CUTTER RICH TEA 1 0.606 1CRAWFORDS SHORTCAKE 1 1.550 2CRAWFORDS BOURBON CREAMS 2 1.545 2CRAWFORDS COCONUT RINGS 1 1.545 2CRAWFORDS CUSTARD CREAMS 2 1.545 2CRAWFORDS DIGESTIVE 1 1.545 2CRAWFORDS FRUIT SHORTCAKE 2 1.545 2CRAWFORDS MALTED MILK 1 1.545 2CRAWFORDS MARIE 1 1.545 2CRAWFORDS MORNING COFFEE 1 1.545 2CRAWFORDS PENNYWISE BORBON CREAMS 2 1.545 2CRAWFORDS PENNYWISE CUSTARD CREAMS 2 1.545 2CRAWFORDS PENNYWISE FIG ROLLS 2 1.545 2CRAWFORDS PENNYWISE GARIBALDI 2 1.545 2CRAWFORDS PENNYWISE JAM RINGS 2 1.545 2CRAWFORDS PENNYWISE TRAD MORNING COFFEE 1 1.545 2CRAWFORDS PENNYWISE WAFERS PINK 1 1.545 2CRAWFORDS RICH TEA 1 1.545 2CRAWFORDS ROVERS ASSORTED 1 1.545 2CRAWFORDS ROVERS ASSORTED BISCUITS 1 1.545 2CRAWFORDS SHORTCAKE 1 1.545 2CRAWFORDS SHORTIES 1 1.545 2CRAWFORDS THIN ARROWROOT 1 1.545 2CRAWFORDS TRADITIONAL NICE FINGERS 1 1.545 2CRAWFORDS 1 1.545 2CRAWFORDS TRADITIONAL SHORTCAKE 1 1.545 2CRREATIONS DELUXE 1 0.515 1CRINKLE CRUNCH SUMMER BERRY 0.455 1CRISPBREAD ORG RICE 1 NV NVCROUSTADES MINI 1 0.061 1DANESITA BUTTER COOKIES BUTTER 1 0.000 1DANESITA CREAMY KISS CHOCOLATE 2 0.000 1DANISH COOKIES CHOC CHIP & BUTTER 2 0.591 1DANISH WATERMILL DANISH BUTTER 2 0.591 1DB CHOCOLATE COOKIES 1 0.591 1DE CHAMPAGNE SAVOURY TWIST CHEESE 1 0.121 1DE CHAMPAGNE TWISTS ONION/CHIVE 1 0.000 1DE KROES CHEESE BISCUITS SQUARES 1 0.000 1DE KROES LEMON & CORIANDER BISCUITS 1 0.121 1
371

DE KROES MINI CHEESE STRAWS 1 0.121 1DE KROES PALMIER CHEESE BISCUITS 1 0.121 1DE KROES SALT & BLACK PEPPER BISCUITS 1 0.121 1DEAN ALL BUTTER SHORTBREAD RNDS 1 0.121 1DEAN PETTICOAT TAILS ALL BUTTER 1 0.121 1DEAN PETTICOAT TAILS SHORTBREAD 1 0.121 1DEAN SHORTBREAD FINGERS HOME RECIPE 1 0.121 1DEAN SHORTBREAD 1 0.121 1DEAN SHORTBREAD ASSORTED BOX 1 0.121 1DEAN SHORTBREAD BUTTER ROUNDS 1 0.121 1DELACRE CIGARETTES RUSSES 1 0.121 1DELSER GRANELLE CLASSIC 1 0.121 1DEVON BUTTERE BISCUITS CHERRY CHOCLETS 1 0.121 1DEVON LEMON CREAMS I 0.121 1DIAMOND BROKEN BISCUITS 1 0.121 1DIETRY SPECIALS GLUTEN FREE SAVOURY BISCUITS 1 0.121 1DIETRY SPECIALS GLUTEN FREE SNACKERS 1 0.121 1DIGESTIVE BARS NV NVDIGESTIVE BISCUITS 1 NV NVDIGESTIVE MILK CHOCOLATE NV NVDORIA AMARETTI 1 0.000 1DORIA DORIANO CRACKER ITALIAN 1 0.000 1DORIA ITALIAN RATAFIAS 1 0.000 1DOVES FARM ORGANIC DIGESTIVE 1 0.076 1DOVES FARM TASTY BARS 0.076 1DOVES LEMON COOKIES 1 0.076 IDOVES ORGANIC GLUTEN FREE NUT COOKIES 1 0.076 1DOVES ORGANIC RAISIN & HONEY 1 0.076 1DR KARG ORGANIC CRISPBREAD CHEESE & PUMPKIN 1 0.015 1DR KARG ORGANIC CRISPBREAD CLASSIC 1 0.015 1DR KARG ORGANIC CRISPBREAD ROASTED ONIONS 1 0.015 1DRIFTER 22 1.439 1DRIFTER CHOC N CHEW 1 1.439 1DS DIETARY SPECIALS CHOC ORANGE WAFERS 1 0.030 1DS DIETARY SPECIALS CHOCOLATE WAFERS 1 0.030 1DS WAFERS VANILLA 1 0.030 1DUCHESS CHOCOLATE MINI MACAROONS 2 0.136 1DUCHY ORGANIC BISC CHOC BUTTERSCOTCH 2 0.561 1DUCHY ORGANIC GINGR BISCUIT 2 0.561 1DUCHY ORGANIC ORANGE BISCUIT 1 0.561 1DUCHY ORIGINAL CHEESE NIBBLES 1 0.561 1DUCHY ORIGINAL LEMON BISCUITS 1 0.561 1DUCHY ORIGINAL OATEN ORGANIC 1 0.561 1DUCHY ORIGINAL ORGANIC 0.561 1DUCHY ORIGINAL ORGANIC CHOCOLATE SELECTION 1 0.561 1DUCHY ORIGINAL HIGHLAND SHORTBREAD 1 0.561 1DUCHY CRISPBAKES 1 0.000 1EARL GREYS LEMON LADIES I 0.621 1EASTER BISCUITS 2 0.106 1ECHO 2 0.8333 1ECHO HONEYCOMBE 2 0.8333 1ECHO MINT 2 0.8333 1ECHO PINK CHOCOLATE 2 0.8333 1ECHO WHITE CHOCOLATE 2 0.8333 1ELKES BART SIMPSON BAR 1 0.152 1ELKES BIG VALUE 1 0.152 1ELKES BISCUIT BARREL 1 0.152 1ELKES BISCUIT SELECTION 2 0.152 1ELKES BOURBON CREAMS 2 0.152 1ELKES CHOC DIGESTIVE BARS 2 0.152 1ELKES COW BISCUITS CHILDREN 1 0.152 1ELKES CUSTARD CREAMS 2 0.152 1ELKES DIGESTIVE 1 0.152 1ELKES ENGLAND SHIELD TIN 1 0.152 1
372

ELKES ESSENTIALS BOURBON CREAMS 2 0.152 1ELKES ESSENTIALS CUSTARD CREAMS 2 0.152 1ELKES FAMILY SELECTION 1 0.152 1ELKES GINGERS 1 0.152 1ELKES HOMER SIMPSON BARS 2 0.152 1ELKES ORANGE CREAMS 2 0.152 1ELKES SHORTIES 1 0.152 1ELKES SIMPSON EAT MY SHIRTS 2 0.152 1ELKES SIMPSON TIN HOMER 1 0.152 1ELKES YO CHOCO BAR 2 0.152 1ELKES SIMPSONS BART SHAPED BITES 1 0.152 1ELKES SIMPSONS DONUT COOKIES 1 0.512 1ELKES SIMPSONS STASH TIN 1 0.512 1ELKES VARIETY 2 0.512 1ELKES VARIET CREAMS 2 0.512 1ELLERT CHOC CHUNK COOKIES 1 0.000 1ELLERT CNTNNTL BISCUIT COLLECTION 1 0.000 1ELLERT CRACKERS SEA SALT 1 0.000 1ELLERT SWISS BISCUIT COLLECTION 1 0.000 1ENDULGE CARAMEL WAFER CRISP 2 0.000 1ENDULGE CHOCOLATE WAFER CRISPS 2 0.000 1ENDULGE MINT WAFER CRISP 2 0.000 1EUROSHOPPER SHORTIES 1 0.045 1EXCELSIOR JAMAICAN CRACKERS 1 0.121 1FA ENGLAND BAR 0.121 1FAIR TRADE BRAZIL NUT COOKIES I 1.561FAMILY CHOICE CUSTARD CREAMS 0.879 1FARMHOUSE 1 0.121 1FARMHOUSE COTTAGE CRUNCH 1 0.121 1FARMHOUSE CURRANT SHREWSBURY 0.121 1FARMHOUSE FLIPS 1 0.121 1FARMHOUSE MELTING MOMENTS 1 0.121 1FARMHOUSE PRIORY CRUMBLE 1 0.121 1FARMHOUSE SHORTBREAD 1 0.121 1FARMHOUSE SHORTBREAD HOMEY & OAT 1 0.121 1FARMHOUSE SHORTBRREAD RINGS 1 0.121 1FINN CRISP CRISPBREAD MULTIGRAIN 1 0.045 1FINN CRISP CRISPBREAD ORGANIC 1 0.045 1FINN CRISP CRISPBREAD ORIGINAL RYE 1 0.045 1FINN CRISP GRAIN CEREAL CAKES 1 0.045 1FINN CRISP HARVEST RYE CRISPBREAD 1 0.045 1FINN CRISP HARVST WHEAT CRISPBRD WHEAT & POPPY 1 0.045 1FLATBREAD EVERYTHING 1 0.015 1FLORAL TRADITIONAL BUTTER COOKIES 1 0.076 1FORTTS BATH OLIVER 1 0.000 1FOSTERS BUTTER SHORTIES 1 0.167 1FOSTERS CLOTTED CREAM SHRTBREAD 1 0.167 1FOSTERS GINGER SPICE COOKIES 1 0.167 1FOSTERS PLOUGH HORSE BISCUIT BOX 1 0.167 1FOSTERS SHORTBREAD MINI CLOTTED CREAM 1 0.167 1FOXS BISCUIT & HERB 1 2.379 3FOXS BRANDY SNAPS 1 2.379 3FOXSBRANDY SNAPS ALL BUTTER 1 2.379 3FOXS BUTTER CRINKLE CRUNCH 1 2.379 3FOXS CARAMEL CRUNCH CREAMS 2.379 3FOXS CARTON LUXURY ASSORTED 1 2.379 3FOXS CARTON SPECIALTY ASSORTMENT 1 2.379 3FOXS CHOC CHIP CRUNCH CREAM 2.379 3FOXS CHOC FUDGE CRUNCH CREAM 2.379 3FOXS CHOCOLATE CREATIONS 1 2.379 3FOXS CLASSIC 2.379 3FOXS CLASSIC CREAMS 2.379 3FOXS COW BISCUITS 1 2.379 3FOXS CREAM & CRUNCH 2 2.379 3
373
FOXS CREATIONS CARAMEL 2 2.379 3FOXS CREATIONS CHOCOLATE 2 2.379 3FOXS CREATIONS CHOCOLATE RINGS 2 2.379 3FOXS CREATIONS FRUIT & NUT 2 2.379 3FOXS CREATIONS FUDGE 2 2.379 3FOXS CREATIONS JAFFA 2 2.379 3FOXS CREATIONS LUX HAZELNUT CRUNCH 2 2.379 3FOXS CREATIONS MARBLE 2 2.379 3FOXS CREATIONS MILLIONAIRES 2 2.379 3FOXS CREATIONS RASPBERRY 2 2.379 3FOXS CREATIONS STICKT TOFFEE PUD BISCUITS 2 2.379 3FOXS CREATIONS TANGY JAFFA 2 2.379 3FOXS CREATIONS THE COLLECTION 2 2.379 3FOXS CRINKLE CRUNCH 1 2.379 3FOXS CRUNCH CREAMS 2 2.379 3FOXS ENGLAND SHIRTS 1 2.379 3FOXS FAVOURITE BISCUITS SELECTION 1 2.379 3FOXS FAVOURITE 1 2.379 3FOXS FAVOURITE CARTON 1 2.379 3FOXS FAVOURITE COOKIE CHOCOLATE CHIP 2 2.379 3FOXS FAVOURITE MALTED MILK CREAMS 2 2.379 3FOXS FAVOURITE NICE CREAMS 2 2.379 3FOXS FAVOURITE SELECTION 1 2.379 3FOXS GINGER CRINKLE 1 2.379 3FOXS GINGER CRINKLE CRUNCH 1 2.379 3FOXS GINGER CRUNCH CREAMS 2 2.379 3FOXS GINGER SNAPS 1 2.379 3FOXS GINGERNUTS 1 2.379 3FOXS GOLDEN CRUNCH CREAMS 2 2.379 3FOXS JAMS & CREAM SANDWICH 2 2.379 3FOXS NICE CREAMS 2 2.379 3FOXS OATEN BUTTER CRINKLE CRUNCH 1 2.379 3FOXS OFFICIALLY LOW FAT CHERRY BAKEWELL 1 2.379 3FOXS OFFICIALLY LOW FAT APPLE & RASPBERRY 2 2.379 3FOXS OFFICIALLY LOW FAT APRICOT 2 2.379 3FOXS OFFICIALLY LOW FAT COOKIES APPLE CRUMBLE 1 2.379 3FOXS OFFICIALLY LOW FAT VERY BERRY 2 2.379 3FOXS ORIGINAL THICK TEA 1 2.379 3FOXS PARTY RINGS 1 2.379 3FOXS PREMIER RICH TEA 1 2.379 3FOXS PUDSEY BEAR 1 2.379 3FOXS RICH TEA FINGER CREAMS 2 2.379 3FOXS RICH TEA FINGER CREAMS 2 2.379 3FOXS ROCKY 2 2.379 3FOXS ROCKY COOKIES 1 2.379 3FOXS ROCKY TOFFEE CRUNCH 2 2.379 3FOXS SPECIALTY ASSORTED TIN 1 2.379 3FOXS SPORTS 1 2.379 3FOXS SUMMER BERRY 1 2.379 3FOXS SUMMER BERRY CRINKLE CRUNCH 1 2.379 3FOXS TASTY NICE BISCUITS 1 2.379 3FOXS TEA AT 3 SUNNY BISCUITS 2 2.379 3FOXS TRIPLE 2 2.379 3FOXS VIENNESE CHOC SANDWICH 2 2.379 3FOXS VIENNESE TEMPTATIONS i 2.379 3FOXS WHOLEMEAL BRAN i 2.379 3FRANKS COOKIES i 0.091 1FUDGES BISCUITS FOR CHEESE i 0.273 1FUDGES CHEDDAR WAFERS i 0.273 1FUDGES CHEESE STRAWS i 0.273 1FUDGES FLORENTINES 2 0.273 1FUDGES MARMITE 1 0.273 1FULLERS TEACAKES 2 0.303 1FURNISS SHORTBREAD CLOTTED CREAM 1 0.076 1
374

G.G SCANDINAVIAN CRISPBREAD BRAN 1 0.000 1GO AHEAD CHILLI CRACKERS 1 1.379 1GO AHEAD SOUR RICE CRACKERS 1 1.379 1GARDEN WAFERS VARIETY 1 0.091 1GATEWAY GROUPS SOMERFIELD ASSORTED BISCUITS 1 0.409 1GATEWAY GROUPS SOMERFIELD BISCUITS FOR CHEESE 1 0.409 1GATEW AY GROUPS SOMERFIELD BOURBON CREAMS 2 0.409 1GATEWAY GROUPS SOMERFIELD CHEESE SAVOURIES 1 0.409 1GATEWAY GROUPS SOMERFIELD CREAM CRACKERS 1 0.409 1GATEWAY GROUPS SOMERFIELD CUSTARD CREAMS 2 0.409 1GATEWAY GROUPS SOMERFIELD DIGESTIVE 1 0.409 1GATEWAY GROUPS SOMERFIELD DIGESTIVE MILK CHOC 2 0.409 1GATE GATEWAY GROUPS SOMERFIELD GINGER CRUNCH 1 0.409 1GATEWAY GROUPS SOMERFIELD MALTED MILK 1 0.409 1GATEWAY GROUPS SOMERFIELD MORNING COFFEE 1 0.409 1GATEWAY GROUPS SOMERFIELD RICH TEA FINGERS 1 0.409 1GATEWAY GROUPS SOMERFIELD SHORTBREAD FINGERS BUTTER 1 0.409 1GATEWAY GROUPS SOMERFIELD SHORTIES 1 0.409 1GATEWAY GROUPS SOMERFIELD STEM GINGER COOKIES 1 0.409 1GATEWAY GROUPS SOMERFIELD WATER BISCUITS 1 0.409 1GCV BTR BISCUIT WAFER CRISP LW CRB 1 0.000 1GILLE CHOCOLATE ORANGE CRISPS 2 0.000 1GILLE DOUBLE CHOCOLATE CRISPS 2 0.000 1GILLE SWEDISH COOKIE SELECTION 1 0.000 1GIOTTO HAZELNUT 1 0.136 1GLEN STEWART PETTICOAT TAILS 1 0.000 1GLEN STEWART SHORTBREAD 1 0.000 1GLUTAFIN DIGESTIVE 1 0.000 1GLUTANO BREAK BARS 2 0.000 1GLUTANO CRISPBREAD 1 0.000 1GLUTANO GLT MZ CRACKERS 1 0.000 1GLUTANO GLUTEN FREE CHOCOLATE FILLED WAFERS 1 0.000 1GLUTEN FREE COCONUT & RASPBERRY COOKIES 1 0.000 1GLUTEN FREE APRICOT BISCUITS 2 0.000 1GLUTEN FREE CHOC CHIP & COCONUT COOKIES 2 0.000 1GLUTEN FREE COCONUT COOKIES 1 0.000 1GO AHEAD CARAMEL CRISP 2 1.379 1GO AHEAD CARAMEL CRUNCH 2 1.379 1GO AHEAD CRINKLIN CHEDDARS MIXED 1 1.379 1GO AHEAD CRINKLIN CHEDDARS ORIGINAL 1 1.379 1GO AHEAD ORANGE CRUNCH 2 1.379 1GO AHEAD SALT & VINEGAR RICE CRACKERS 1 1.379 1GOLD BARS 2 0.894 1GOLD BARS CARAMEL 2 0.894 1GOTEBORG JAM & CREAM BISCUITS 2 0.015 1GOURMET SUPER SESAME THINS 1 0.030 1GRAY DUNN MILK CHOCOLATE DIGESTIVES 2 0.091 1GREEN & BLACKS GINGER BISCUITS 1 1.606 2GREEN & BLACKS ORGANIC BUTTER BISC DARK CHOC 2 1.606 2GREEN OLIVE BISCUITS 1 NV NVGRIESSON CAFE MUSICA ASSORTED 1 0.000 1GVT GARDEN WAFERS 1 NV NVH 0 L ASSORTED BISCUITS I 0.091 1H 0 L DUNKABLE BISCUITS 1 0.091 1HANS FREITAG DESIREE 1 0.015 1HANS FREITAG ROSSINIS WAFERS 1 0.015 1HANS FREITAG WAFERS LEMON 1 0.015 1HAPPER SHOPPER RICH TEA 1 0.864 1HAPPY SHOPPER BOURBON CREAMS 2 0.864 1HAPPY SHOPPER COCONUT RINGS I 0.864 1HAPPY SHOPPER CUSTARD CREAMS 2 0.864 1HAPPY SHOPPER DIGESTIVE 1 0.864 1HAPPY SHOPPER FIG ROLLS 2 0.864 1HAPPY SHOPPER FRUIT SHORTCAKE 2 0.864 1
375
HAPPY SHOPPER GARIBALDI 2 0.864 1HAPPY SHOPPER GINGER NUTS 1 0.864 1HAPPY SHOPPER JAFFA CAKES 2 0.864 1HAPPY SHOPPER NICE 1 0.864 1HAPPY SHOPPER RICH TEA 1 0.864 1HAPPY SHOPPER RICH TEA FINGERS 1 0.864 1HARLEQUIN BISCUIT 1 0.242 1HAUST BISCUITS CHEESY BITES 1 0.000 1HAWKWOOD MULTIGRAIN CAKES 1 0.000 1HAYWOOD & PADGETT MELTERS CHERRY & COCONUT I 0.000 1HEINZ CARB CHECK CHOCOLATE CHIP COOKIES 1 1.576 2HEINZ CARB CHECK SULTANA COOKIES 1 1.576 2HEINZ WEIGHTWATCHERS COOKIES REAL CHOC CHIP 1.576 2HEINZ WEIGHTWATCHERS COOKIES SULTANA & CINNAMON 1 1.576 2HELLEY CHOCOLATE WAFERS 0.000 1HELLEMA COOKIES CHOCOLATE PEANUT I 0.000 1HELLEMA COOKIES PEANUT 1 0.000 1HENRY LAMBERTZ CRISPY BTS SEED PEANUT & RAISIN 1 0.000 1HIGHLAND KITCHEN SHORTBREAD 1 0.576 1HIGHLAND KITCHEN SHORTBREAD FINGERS 1 0.576 1HIGHLAND KITCHEN SHORTBREAD FINGERS CELLO 1 0.576 1HIGHLAND SHORTBREAD ASSORTED 1 0.576 1HILLS BOURBON CREAMS 2 0.000 1HILLS CHOCOLATE CREAMS 2 0.000 1HILLS COCONUT CREAMS 2 0.000 1HILLS CREANS SELECTION 2 0.000 1HILLS CUSTARD CREAMS 2 0.000 1HILLS DIGESTIVE CREAMS 2 0.000 1HILLS FRUIT SHORTIES 2 0.000 1HILLS GINGER FINGERS 1 0.000 1HILLS NICE ROUNDS 1 0.000 1HILLS ORANGE CREAM 2 0.000 1HILLS SHORTIES 1 0.000 1HILLS STRAWBERRY CREAMS 2 0.000 1HILLS VARIETY CREAMS 2 0.000 1HOB NOB BARS CHOCOLATE CHUNK 2 2.424HOMEBLEST MILK CHOCOLATE 2 0.076 1HORIZON FRUIT SHORTCAKE 2 0.061 1HOUSE OF LANCASTER BROKEN BISCUITS 1 0.091 1HOUSE OF LANCASTER LUXURY CHOC BISCUITS 2 0.091 1HOVIS CRACKERS 1 2.015HOVIS DIGESTIVE 1 2.015HURSTWOOD ASSORTMENT S/VAL 1 0.061 1HURSTWOODS CHOCOLATE 2 0.061 1ICELAND CUSTARD CREAMS 2 1.379 1ICELAND SHORTIES 1 1.379 1ICELAND VALUE COOKIES 1 1.379 1ICELAND VALUE DIGESTIVE 1 1.379 1ICELAND WAFERS PINK 1 1.379 1J SAINSBURY ABERNETHY 1 2.061 2J SAINSBURY AFTER DINNER COLLECTION 2 2.061 2J SAINSBURY ALL BUTTER 1 2.061 2J SAINSBURY ALL BUTTER FRUIT 2 2.061 2J SAINSBURY ALMOND THINS 1 2.061 2J SAINSBURY ASSORTED BISCUITS TIN 1 2.061 2J SAINSBURY ASSORTED SWEETS 1 2.061 2J SAINSBURY B G T Y CHOCOLATE CHIP 2 1.640 2J SAINSBURY B P C MILK CHOCOLATE CRISPY BAR 2 2.061 2J SAINSBURY BASIC DIGESTIVE 1 1.290 1J SAINSBURY BASIC VARIETY 1 1.290 1J SAINSBURY BASICS CHOC DIGESTIVE 2 1.290 1J SAINSBURY BASICS COOKIES 1 1.290 1J SAINSBURY BASICS RICH TEA 1 1.290 1J SAINSBURY BASICS WAFERS CARAMEL 2 1.290 1
376
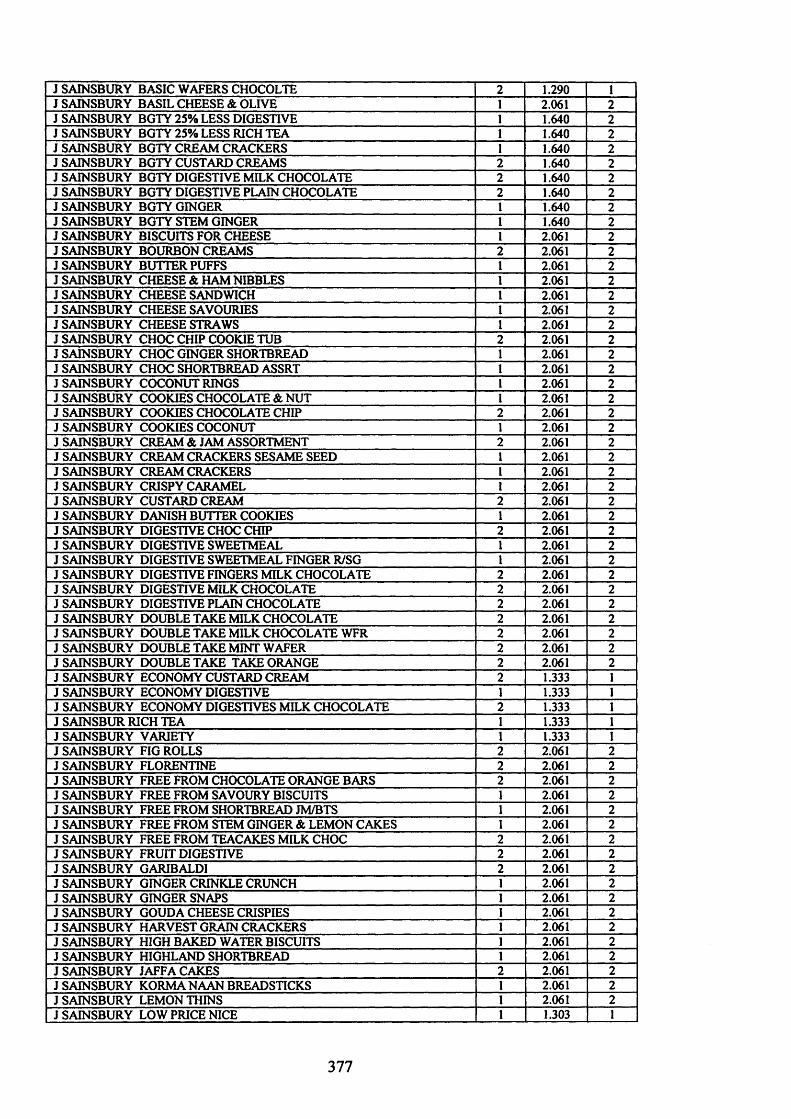
J SAINSBURY BASIC WAFERS CHOCOLTE 2 1.290 1J SAINSBURY BASIL CHEESE & OLIVE 1 2.061 2J SAINSBURY BGTY 25% LESS DIGESTIVE 1 1.640 2J SAINSBURY BGTY 25% LESS RICH TEA 1 1.640 2J SAINSBURY BGTY CREAM CRACKERS 1 1.640 2J SAINSBURY BGTY CUSTARD CREAMS 2 1.640 2J SAINSBURY BGTY DIGESTIVE MILK CHOCOLATE 2 1.640 2J SAINSBURY BGTY DIGESTIVE PLAIN CHOCOLATE 2 1.640 2J SAINSBURY BGTY GINGER 1 1.640 2J SAINSBURY BGTY STEM GINGER 1 1.640 2J SAINSBURY BISCUITS FOR CHEESE 1 2.061 2J SAINSBURY BOURBON CREAMS 2.061 2J SAINSBURY BUTTER PUFFS 1 2.061 2J SAINSBURY CHEESE & HAM NIBBLES 1 2.061 2J SAINSBURY CHEESE SANDWICH 1 2.061 2J SAINSBURY CHEESE SAVOURIES 1 2.061 2J SAINSBURY CHEESE STRAWS 1 2.061 2J SAINSBURY CHOC CHIP COOKIE TUB 2.061 2J SAINSBURY CHOC GINGER SHORTBREAD 1 2.061 2J SAINSBURY CHOC SHORTBREAD ASSRT 1 2.061 2J SAINSBURY COCONUT RINGS 1 2.061 2J SAINSBURY COOKIES CHOCOLATE & NUT 1 2.061 2J SAINSBURY COOKIES CHOCOLATE CHIP 2.061 2J SAINSBURY COOKIES COCONUT 1 2.061 2J SAINSBURY CREAM & JAM ASSORTMENT 2.061 2J SAINSBURY CREAM CRACKERS SESAME SEED 1 2.061 2J SAINSBURY CREAM CRACKERS 1 2.061 2J SAINSBURY CRISPY CARAMEL 1 2.061 2J SAINSBURY CUSTARD CREAM 2.061 2J SAINSBURY DANISH BUTTER COOKIES 1 2.061 2J SAINSBURY DIGESTIVE CHOC CHIP 2.061 2J SAINSBURY DIGESTIVE SWEETMEAL 1 2.061 2J SAINSBURY DIGESTIVE SWEETMEAL FINGER R/SG 1 2.061 2J SAINSBURY DIGESTIVE FINGERS MILK CHOCOLATE 2 2.061 2J SAINSBURY DIGESTIVE MILK CHOCOLATE 2 2.061 2J SAINSBURY DIGESTIVE PLAIN CHOCOLATE 2 2.061 2J SAINSBURY DOUBLE TAKE MILK CHOCOLATE 2 2.061 2J SAINSBURY DOUBLE TAKE MILK CHOCOLATE WFR 2 2.061 2J SAINSBURY DOUBLE TAKE MINT WAFER 2 2.061 2J SAINSBURY DOUBLE TAKE TAKE ORANGE 2 2.061 2J SAINSBURY ECONOMY CUSTARD CREAM 2 1.333 1J SAINSBURY ECONOMY DIGESTIVE 1 1.333 1J SAINSBURY ECONOMY DIGESTIVES MILK CHOCOLATE 2 1.333 1J SAIN SB UR RICH TEA 1 1.333 1J SAINSBURY VARIETY 1 1.333 1J SAINSBURY FIG ROLLS 2 2.061 2J SAINSBURY FLORENTINE 2 2.061 2J SAINSBURY FREE FROM CHOCOLATE ORANGE BARS 2 2.061 2J SAINSBURY FREE FROM SAVOURY BISCUITS 1 2.061 2J SAINSBURY FREE FROM SHORTBREAD JM/BTS 1 2.061 2J SAINSBURY FREE FROM STEM GINGER & LEMON CAKES 1 2.061 2J SAINSBURY FREE FROM TEACAKES MILK CHOC 2 2.061 2J SAINSBURY FRUIT DIGESTIVE 2 2.061 2J SAINSBURY GARIBALDI 2 2.061 2J SAINSBURY GINGER CRINKLE CRUNCH 1 2.061 2J SAINSBURY GINGER SNAPS 1 2.061 2J SAINSBURY GOUDA CHEESE CRISPIES 1 2.061 2J SAINSBURY HARVEST GRAIN CRACKERS 1 2.061 2J SAINSBURY HIGH BAKED WATER BISCUITS 1 2.061 2J SAINSBURY HIGHLAND SHORTBREAD 1 2.061 2J SAINSBURY JAFFA CAKES 2.061 2J SAINSBURY KORMA NAAN BREADSTICKS 1 2.061 2J SAINSBURY LEMON THINS 1 2.061 2J SAINSBURY LOW PRICE NICE 1 1.303 1
377

J SAINSBURY LOW PRICE SHORTCAKE 1 1.303 1J SAINSBURY LOW PRICE WAFERS MILK CHOCOLATE 1 1.303 1J SAINSBURY LUXURY CHOCOLATE ASSORTMENT 2 2.061 2J SAINSBURY LUXURYSHRTBRD ASSORTMENT 1 2.061 2J SAINSBURY MALTED MILK 1 2.061 2J SAINSBURY MALTED MILK WITH CHOCOLATE 2 2.061 2J SAINSBURY MILK CHOC WAFERS 2 2.061 2J SAINSBURY MORNING COFFEE 1 2.061 2J SAINSBURY NICE 1 2.061 2J SAINSBURY NICE CREAMS 2 2.061 2J SAINSBURY OCCASIONS CHEESE SHORTBREAD 1 2.061 2J SAINSBURY ORGANIC MILK CHOC TRUFFLE BISC 2 2.061 2J SAINSBURY ORGANIC OATFLAKES & HON COOKIES 1 2.061 2J SAINSB SHRTBREAD FINGERSURY ORGANIC 1 2.061 2J SAINSBURY PETITS FOURS CHOCOLATE 2 2.061 2J SAINSBURY POLAR MINT 2 2.061 2J SAINSBURY POLAR ORANGE 2 2.061 2J SAINSBURY POPPY & SESAME 1 2.061 2J SAINSBURY PREMIUM CREAMS 1.652 2J SAINSBURY PREMIUM CRMS CHOCOLATE & CREAM 1.652 2J SAINSBURY REDUCED FAT DIGESTIVE PLAIN CHOC 1 1.652 2J SAINSBURY RICH TEA 2.061 2J SAINSBURY RICH TEA FINGERS 1 2.061 2J SAINSBURY RICH TEA MILK CHOCOLATE 1 2.061 2J SAINSBURY RUSTICS 2.061 2J SAINSBURY SHRTBRD ALL BTT HIGHLAND P/TL 1 2.061 2J SAINSBURY SHRTBRD PTTCTTLS ALL BTT 1 2.061 2J SAINSBURY SHRTBRD ROUND ASSORTED 1 2.061 2J SAINSBURY SHRTBRD ROUNDS CHOC CHIP 1 2.061 2J SAINSBURY SANDWICH CREAM 2.061 2J SAINSBURY SAVOURY SWIRLS WITH CHEESE 2.061 2J SAINSBURY SHORTBREAD 1 2.061 2J SAINSBURY SHORTBREAD 2000 1 2.061 2J SAINSBURY SHORTBREAD ANIMAL 1 2.061 2J SAINSBURY SHORTBREAD FINGERS 1 2.061 2J SAINSBURY SHORTCAKE 1 2.061 2J SAINSBURY SHORTCAKE JAM 1 2.061 2J SAINSBURY SHORTIES 1 2.061 2J SAINSBURY T T D CRACKERS SALT 1 1.890 2J SAINSBURY T T D BLUEBERRY & CLTD CREAM 1 1.890 2J SAINSBURY T T D CHOC CHUNK & HAZELNUT 1 1.890 2J SAINSBURY T T D COOKIES COCONUT 1 1.890 2J SAINSBURY T T D COOKIES SULTANA 1 1.890 2J SAINSBURY T T D G/MARNIER SHORTBREAD 1 1.890 2J SAINSBURY T T D HIGHLAND SHORTBREAD 1 1.890 2J SAINSBURY T T D HIGHLAND SHORTBREAD RNDS 1 1.890 2J SAINSBURY T T D LEMON BUTTER 1 1.890 2J SAINSBURY T T D OATFLAKE & CRANBERRY 1 1.890 2J SAINSBURY T T D PARMESAN CHEESE BISCUITS 1 1.890 2J SAINSBURY T T D PLAIN CHOC GINGER 1 1.890 2J SAINSBURY T T D RASP & WHITE CHOC COOKIE 1 1.890 2J SAINSBURY T T D SHORTBREAD BUTTERY 1 1.890 2J SAINSBURY T T D SHORTBREAD FARMHOUSE 1 1.890 2J SAINSBURY T T D SHORTBREAD FINGERS 1 1.890 2J SAINSBURY T T D ST CLEMENT SHORTBREAD 1 1.890 2J SAINSBURY T T D STEM GINGER 1 1.890 2J SAINSBURY TRIPLE PACK 1 2.061 2J SAINSBURY T T D BISCUITS FOR CHEESE 1 1.890 2J SAINSBURY T T D CAPPUCINO CHOCARE 1 1.890 2J SAINSBURY T T D COOKIES CHOCOLATE 1 1.890 2J SAINSBURY T T D COOKIES QUADRUPLE CHOC 1 1.890 2J SAINSBURY T T D COOKIES STRAWBERRY & CREAM 1 1.890 2J SAINSBURY T T D DEMARARA SHORTBREAD 1 1.890 2J SAINSBURY T T D MINI CHOCOLATE SHORTCAKE 1 1.890 2
378

J SAINSBURY T T D XMAS COOKIES 1 1.890 2J SAINSBURY TWISTS CHIVE & ONION 1 2.061 2J SAINSBURY WAFERS PINK 1 2.061 2J SAINSBURY DUTCH CRSPBK 1 2.061 2JACOBITES BBQ 1 0.515 1JACOBITES PIZZA 1 0.515 1JACOBITES TANDOORI 1 0.515 1JACOBS TUC BARBEQUE 1 2.424 3JACOBS TUC ORIGINAL 1 2.424 3JACOBS BISCUITS FOR CHEESE 1 2.424 3JACOBS CHEDDARS 1 2.424 3JACOBS CHOC COOKIES & CREAM 2.424 3JACOBS CHOCOLATE GEMS 1 2.424 3JACOBS CHOICE GRAIN 1 2.424 3JACOBS COCONUT CREAMS 2.424 3JACOBS CORNISH WAFERS 1 2.424 3JACOBS CREAM CRACKERS 1 2.424 3JACOBS ESSENTIALS RYE & OATS I 2.424 3JACOBS ESSENTIALS RYE & SESAME SEEDS 1 2.424 3JACOBS ESSENTIALS SESAME & ROSEMARY 1 2.424 3JACOBS ESSENTIALS THYME 1 2.424 3JACOBS FAMILY CIRCLE 1 2.424 3JACOBS FAMILY CIRCLE TUB 1 2.424 3JACOBS FIG ROLLS 2 2.424 3JACOBS FRUIT ROLLS APPLE & CINNAMON 2 2.424 3JACOBS FRUIT ROLLS RHUBARB & CUSTARD 2 2.424 3JACOBS GEMS BUCKET 1 2.424 3JACOBS HAPPY FACES 2 2.424 3JACOBS HERITAGE 1 2.424 3JACOBS HIGH BAKED WATER BISCUITS 1 2.424 3JACOBS ICED GEMS 1 2.424 3JACOBS ICED GEMS MULTI I 2.424 3JACOBS JAFFA CAKES 2 2.424 3JACOBS JAM & CREAM BISCUITS 2 2.424 3JACOBS LEMON PUFFS 2 2.424 3JACOBS LOW FAT FIG ROLLS 2 2.424 3JACOBS MEDITERRANEO HERB & SPICE 1 2.424 3JACOBS MEDITERRANEO OLIVE OIL & OREGANO 1 2.424 3JACOBS MEDITERRANEO ORIGINAL 1 2.424 3JACOBS MEDITERRANEO SELECTION 1 2.424 3JACOBS MIKADO MILK CHOCOLATE 2 2.424 3JACOBS PETITS COEURS 2 2.424 3JACOBS PIMS CAKES RASPBERRY 2 2.424 3JACOBS POLO CHOCOLATE 2 2.424 3JACOBS RASPBERRY MALLOWS 2 2.424 3JACOBS SCARY FACES BLCKCURRANT/RASPBRRY CRM 2 2.424 3JACOBS SECRET CLUB CARAMEL BOOGIE BARS 2 2.424 3JACOBS SECRET CLUB MILK CHOC BOOGIE BARS 2 2.424 3JACOBS TEA TIME ASSORTED 1 2.424 3JACOBS TEMPTATIONS ASSORTED 1 2.424 3JACOBS THAI BITES CHIANG MAI CHICKEN 1 2.424 3JACOBS THAI BITES FUSIONS THAI RED CURRY & CORIANDER 1 2.424 3JACOBS THAI BITES FUSIONS THAI RSTD CHLL &SOUR CREAM 1 2.424 3JACOBS THAI BITES FUSIONS THAI SESAME & PRAWN 1 2.424 3JACOBS THAI BITES MILD CHILLI 1 2.424 3JACOBS THAI BITES MILD THAI 1 2.424 3JACOBS THAI BITES MILD THAI AMOY SWET CHILLI SC 1 2.424 3JACOBS THAI BITES ORIENTAL SPICE 1 2.424 3JACOBS THAI BITES SEAWEED 1 2.424 3JACOBS THAI BITES SWEET HERB 1 2.424 3JACOBS TUC MINI SESAME 1 2.424 3JACOBS TUC SANDWICH I 2.424 3JACOBS TUC SAV SANDWICH 1 2.424 3JACOBS TWIN PACK HAPPY FACES 2 2.424 3
379

JAFFA CAKES 2 2.545 3JAFFA DELIGHTS JAFFA CAKES 2 2.545 3JAFFA MIS-SHAPES 2 NV NVJAMBO FRUIT 2 0.136 1JEERA BISCUITS .AKHANIA 1 0.000 1JULES DESTROOPER ALMOND THINS 1 0.000 1JULES DESTROOPER BUTTER CRUMBLE 1 0.000 1K/CHOICE CHOC BISCUITS 1 0.120 1KALLO FRUIT BISCUIT 0.182 1KALLO GLTN/FR RICE CAKE THK SLCE CARAMEL 1 0.182 1KALLO HERBS 1 0.182 1KALLO HIGH FIBRE OAT & RICE CAKES 1 0.182 1KALLO LOW FAT GLTN/FR RICE CAKE APPLE & CINNAMON 1 0.182 1KALLO ORGANIC CORN CAKES SALTED 1 0.182 1KALLO ORGANIC CRISPBREAD WHOLEMEAL RYE 1 0.182 1KALLO ORGANIC ROSEMARY CRACKERS 1 0.182 1KALLO RICE CAKE BAR 1 0.182 1KALLO RICE CAKES APPLE & CINNAMON 1 0.182 1KALLO RICE CAKES CARAMEL 1 0.182 1KALLO RICE CAKES CHOCOLATE 1 0.182 1KALLO RICE CAKES HONEY 1 0.182 1KALLO RICE CAKES MILK CHOCOLATE 1 0.182 1KALLO RICE CAKES SAVOURY 1 0.182 1KALLO RICE CAKES SESAME UNSALTED 1 0.182 1KALLO RICE CAKES SESAME UNSALTED 1 0.182 1KALLO RICE CAKES THICK SALTED 1 0.182 1KALLO RICE CAKES THICK LOW FAT 1 0.182 1KALLO RICE CAKES THIN SALTED 1 0.182 1KALLO RICE CAKES THIN UNSALTED 1 0.182 1KALLO RICE CAKES UNSALTED 1 0.182 1KALLO SAVOURY & CHEESE 1 0.182 1KALLO SNACK SIZE RICE CAKES CRACKED PEPPER 1 0.182 1KALLO SNACK SIZE RICE CAKES LIGHTLY SALTED 1 0.182 1KALLO SNACK SIZE RICE CAKES NO ADDED SALT 1 0.182 1KALLO SO CRISPY BBQ 1 0.182 1KALLO SO CRISPY CHEDDAR 1 0.182 1KALLO SO CRISPY SALT & VINEGAR 1 0.182 1KALLO YEAST EXTRACT RICE CAKES 1 0.182 1KASHMIR ASSORTED BISCUITS 1 0.000 1KASHMIR COCONUT BISCUITS 1 0.000 1KEEPERS CHOICE LUXURY CHOCOLATE 1 0.121 1KELLOGS SPECIAL K L T BTS ASSORTED 1 1.864 2KELLOGS SPECIAL K L T BTS CHEESE 1 1.864 2KELLOGS SPECIAL K L T BTS SUNDRIED TOMATO & BASIL 1 1.864 2KELLOGS SPECIAL K L T BTS TIKKA 1 1.864 2KHARI BISCUITS MAKHANIA 1 0.000 1KHATAI BISCUITS 1 0.000 1KINDER BUENO M/CHOC WAFER MILK/HAZELNUT FL 2 1.470 1KINDER COUNTRY CHOCOLATE 2 1.470 1KINDER HAPPY HIPPO CHOCOLATE SNACK BAR 2 1.470 1KIT KAT 4 FINGER MILK CHOCOLATE 2 2.712 3KIT KAT CHUNKY 2 2.712 3KIT KAT CHUNKY MINIS WAFER MILK CHOCOLATE 2 2.712 3KIT KAT CHUNKY ORANGE MILK CHOCOLATE 2 2.712 3KIT KAT CHUNKY WAFER MILK CHOCOLATE 2 2.712 3KIT KAT CHUNKY WHITE 2 2.712 3KIT KAT EDITIONS GOLDEN CARAMEL 2 2.712 3KIT KAT EDITIONS PASSION FRUIT & MANGO 2 2.712 3KIT KAT EDITIONS RED BERRY 2 2.712 3KIT KAT EDITIONS SEVILLE ORANGE 2 2.712 3KIT KAT LOW CARBS WAFER MILK CHOCOLATE 2 2.712 3KIT KAT MINIS WAFER MILK CH BLOOD ORANGE 2 2.712 3KIT KAT WAFERS MILK CHOCOLATE 2 2.712 3KIT KAT ORANGE 2 2.712 3
380
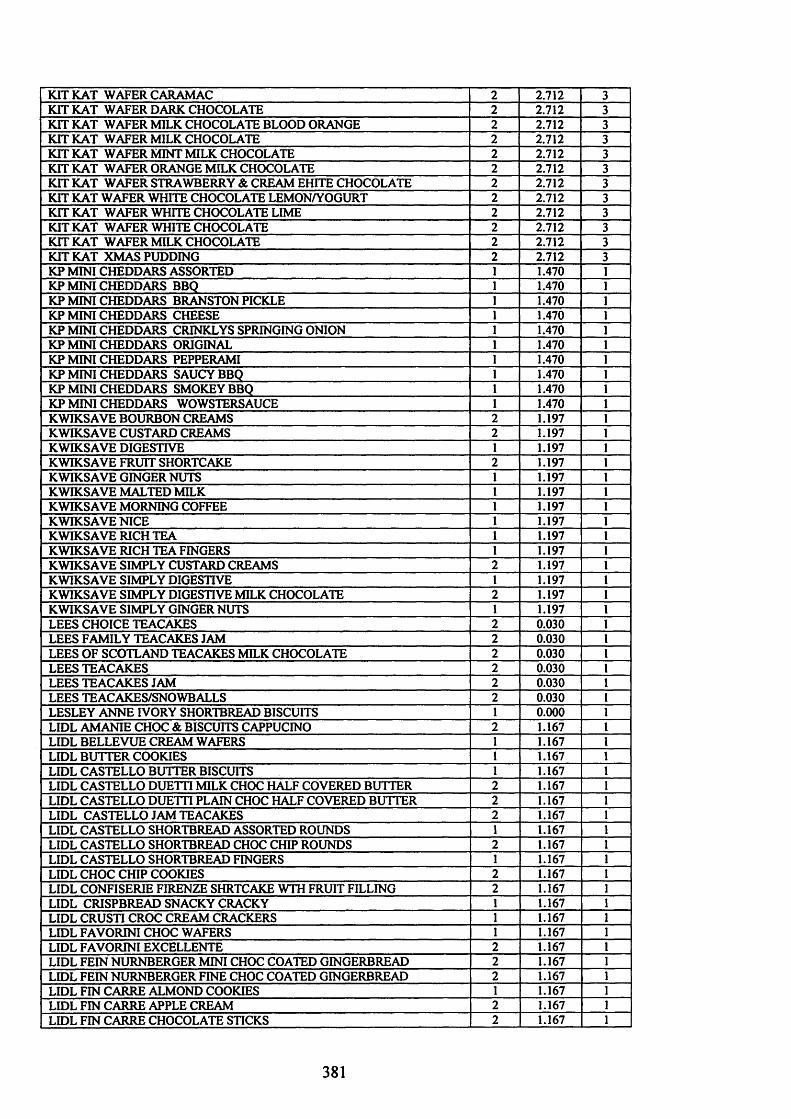
KIT KAT WAFER CARAMAC 2 2.712 3KIT KAT WAFER DARK CHOCOLATE 2 2.712 3KIT KAT WAFER MILK CHOCOLATE BLOOD ORANGE 2 2.712 3KIT KAT WAFER MILK CHOCOLATE 2 2.712 3KIT KAT WAFER MINT MILK CHOCOLATE 2 2.712 3KIT KAT WAFER ORANGE MILK CHOCOLATE 2 2.712 3KIT KAT WAFER STRAWBERRY & CREAM EHITE CHOCOLATE 2 2.712 3KIT KAT WAFER WHITE CHOCOLATE LEMON/YOGURT 2 2.712 3KIT KAT WAFER WHITE CHOCOLATE LIME 2 2.712 3KIT KAT WAFER WHITE CHOCOLATE 2 2.712 3KIT KAT WAFER MILK CHOCOLATE 2 2.712 3KIT KAT XMAS PUDDING 2 2.712 3KP MINI CHEDDARS ASSORTED 1 1.470 1KP MINI CHEDDARS BBQ 1 1.470 1KP MINI CHEDDARS BRANSTON PICKLE 1 1.470 1KP MINI CHEDDARS CHEESE 1 1.470 1KP MINI CHEDDARS CRINKLYS SPRINGING ONION 1 1.470 1KP MINI CHEDDARS ORIGINAL 1 1.470 1KP MINI CHEDDARS PEPPERAMI 1 1.470 1KP MINI CHEDDARS SAUCY BBQ 1 1.470 1KP MINI CHEDDARS SMOKEY BBQ 1 1.470 1KP MINI CHEDDARS WOWSTERSAUCE 1 1.470 1KWIKSAVE BOURBON CREAMS 2 1.197 1KWIKSAVE CUSTARD CREAMS 2 1.197 1KWIKSAVE DIGESTIVE 1 1.197 1KWIKSAVE FRUIT SHORTCAKE 2 1.197 1KWIKSAVE GINGER NUTS 1 1.197 1KWIKSAVE MALTED MILK 1 1.197 1KWIKSAVE MORNING COFFEE 1 1.197 1KWIKSAVE NICE 1 1.197 1KWIKSAVE RICH TEA 1 1.197 1KWIKSAVE RICH TEA FINGERS 1 1.197 1KWIKSAVE SIMPLY CUSTARD CREAMS 2 1.197 1KWIKSAVE SIMPLY DIGESTIVE 1 1.197 1KWIKSAVE SIMPLY DIGESTIVE MILK CHOCOLATE 2 1.197 1KWIKSAVE SIMPLY GINGER NUTS 1 1.197 1LEES CHOICE TEACAKES 2 0.030 1LEES FAMILY TEACAKES JAM 2 0.030 1LEES OF SCOTLAND TEACAKES MILK CHOCOLATE 2 0.030 1LEES TEACAKES 2 0.030 1LEES TEACAKES JAM 2 0.030 1LEES TEACAKES/SNOWBALLS 2 0.030 1LESLEY ANNE IVORY SHORTBREAD BISCUITS 1 0.000 1LIDL AMANIE CHOC & BISCUITS CAPPUCINO 2 1.167 1LIDL BELLEVUE CREAM WAFERS 1 1.167 1LIDL BUTTER COOKIES 1 1.167 1LIDL CASTELLO BUTTER BISCUITS 1 1.167 1LIDL CASTELLO DUETTI MILK CHOC HALF COVERED BUTTER 2 1.167 1LIDL CASTELLO DUETTI PLAIN CHOC HALF COVERED BUTTER 2 1.167 1LIDL CASTELLO JAM TEACAKES 2 1.167 1LIDL CASTELLO SHORTBREAD ASSORTED ROUNDS 1 1.167 1LIDL CASTELLO SHORTBREAD CHOC CHIP ROUNDS 2 1.167 1LIDL CASTELLO SHORTBREAD FINGERS 1 1.167 1LIDL CHOC CHIP COOKIES 2 1.167 1LIDL CONFISERIE FIRENZE SHRTCAKE WTH FRUIT FILLING 2 1.167 1LIDL CRISPBREAD SNACKY CRACKY 1 1.167 1LIDL CRUSTI CROC CREAM CRACKERS 1 1.167 1LIDL FAVORINI CHOC WAFERS 1 1.167 1LIDL FAVORINI EXCELLENTE 2 1.167 1LIDL FEIN NURNBERGER MINI CHOC COATED GINGERBREAD 2 1.167 1LIDL FEIN NURNBERGER FINE CHOC COATED GINGERBREAD 2 1.167 1LIDL FIN CARRE ALMOND COOKIES 1 1.167 1LIDL FIN CARRE APPLE CREAM 2 1.167 1LIDL FIN CARRE CHOCOLATE STICKS 2 1.167 1
381
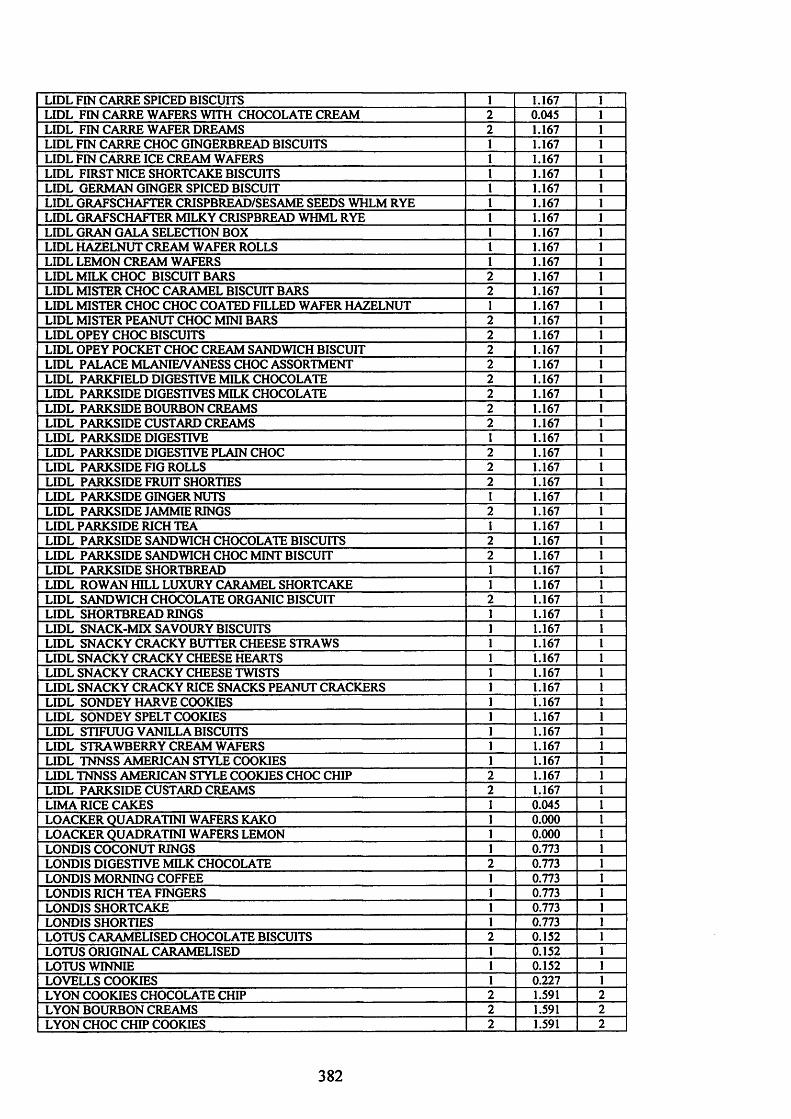
LIDL FIN CARRE SPICED BISCUITS 1 1.167 1LIDL FIN CARRE WAFERS WITH CHOCOLATE CREAM 2 0.045 1LIDL FIN CARRE WAFER DREAMS 2 1.167 1LIDL FIN CARRE CHOC GINGERBREAD BISCUITS 1 1.167 1LIDL FIN CARRE ICE CREAM WAFERS 1 1.167 1LIDL FIRST NICE SHORTCAKE BISCUITS 1 1.167 1LIDL GERMAN GINGER SPICED BISCUIT 1 1.167 1LIDL GRAFSCHAFTER CRISPBREAD/SESAME SEEDS WHLM RYE 1 1.167 1LIDL GRAFSCHAFTER MILKY CRISPBREAD WHML RYE 1 1.167 1LIDL GRAN GALA SELECTION BOX 1 1.167 1LIDL HAZELNUT CREAM WAFER ROLLS 1 1.167 1LIDL LEMON CREAM WAFERS 1 1.167 1LIDL MILK CHOC BISCUIT BARS 2 1.167 1LIDL MISTER CHOC CARAMEL BISCUIT BARS 2 1.167 1LIDL MISTER CHOC CHOC COATED FILLED WAFER HAZELNUT 1 1.167 1LIDL MISTER PEANUT CHOC MINI BARS 2 1.167 1LIDL OPEY CHOC BISCUITS 2 1.167 1LIDL OPEY POCKET CHOC CREAM SANDWICH BISCUIT 2 1.167 1LIDL PALACE MLANIE/VANESS CHOC ASSORTMENT 2 1.167 1LIDL PARKFIELD DIGESTIVE MILK CHOCOLATE 2 1.167 1LIDL PARKSIDE DIGESTIVES MILK CHOCOLATE 2 1.167 1LIDL PARKSIDE BOURBON CREAMS 2 1.167 1LIDL PARKSIDE CUSTARD CREAMS 2 1.167 1LIDL PARKSIDE DIGESTIVE 1 1.167 1LIDL PARKSIDE DIGESTIVE PLAIN CHOC 2 1.167 1LIDL PARKSIDE FIG ROLLS 2 1.167 1LIDL PARKSIDE FRUIT SHORTIES 2 1.167 1LIDL PARKSIDE GINGER NUTS 1 1.167 1LIDL PARKSIDE JAMMIE RINGS 1.167 1LIDL PARKSIDE RICH TEA 1 1.167 1LIDL PARKSIDE SANDWICH CHOCOLATE BISCUITS 1.167 1LIDL PARKSIDE SANDWICH CHOC MINT BISCUIT 1.167 1LIDL PARKSIDE SHORTBREAD 1 1.167 1LIDL ROWAN HILL LUXURY CARAMEL SHORTCAKE 1 1.167 1LIDL SANDWICH CHOCOLATE ORGANIC BISCUIT 1.167 1LIDL SHORTBREAD RINGS 1 1.167 1LIDL SNACK-MIX SAVOURY BISCUITS 1 1.167 1LIDL SNACKY CRACKY BUTTER CHEESE STRAWS 1 1.167 1LIDL SNACKY CRACKY CHEESE HEARTS 1 1.167 1LIDL SNACKY CRACKY CHEESE TWISTS 1 1.167 1LIDL SNACKY CRACKY RICE SNACKS PEANUT CRACKERS 1 1.167 1LIDL SONDEY HARVE COOKIES 1 1.167 1LIDL SONDEY SPELT COOKIES 1 1.167 1LIDL STIFUUG VANILLA BISCUITS 1 1.167 1LIDL STRAWBERRY CREAM WAFERS 1 1.167 1LIDL TNNSS AMERICAN STYLE COOKIES 1 1.167 1LIDL TNNSS AMERICAN STYLE COOKIES CHOC CHIP 1.167 1LIDL PARKSIDE CUSTARD CREAMS 1.167 1LIMA RICE CAKES 1 0.045 1LOACKER OUADRATINI WAFERS KAKO 1 0.000 1LOACKER OUADRATINI WAFERS LEMON 1 0.000 1LONDIS COCONUT RINGS 1 0.773 1LONDIS DIGESTIVE MILK CHOCOLATE 0.773 1LONDIS MORNING COFFEE 1 0.773 1LONDIS RICH TEA FINGERS 1 0.773 1LONDIS SHORTCAKE 1 0.773 1LONDIS SHORTIES 1 0.773 1LOTUS CARAMELISED CHOCOLATE BISCUITS 0.152 1LOTUS ORIGINAL CARAMELISED 1 0.152 1LOTUS WINNIE 1 0.152 1LOVELLS COOKIES 1 0.227 1LYON COOKIES CHOCOLATE CHIP 2 1.591 2LYON BOURBON CREAMS 2 1.591 2LYON CHOC CHIP COOKIES 2 1.591 2
382
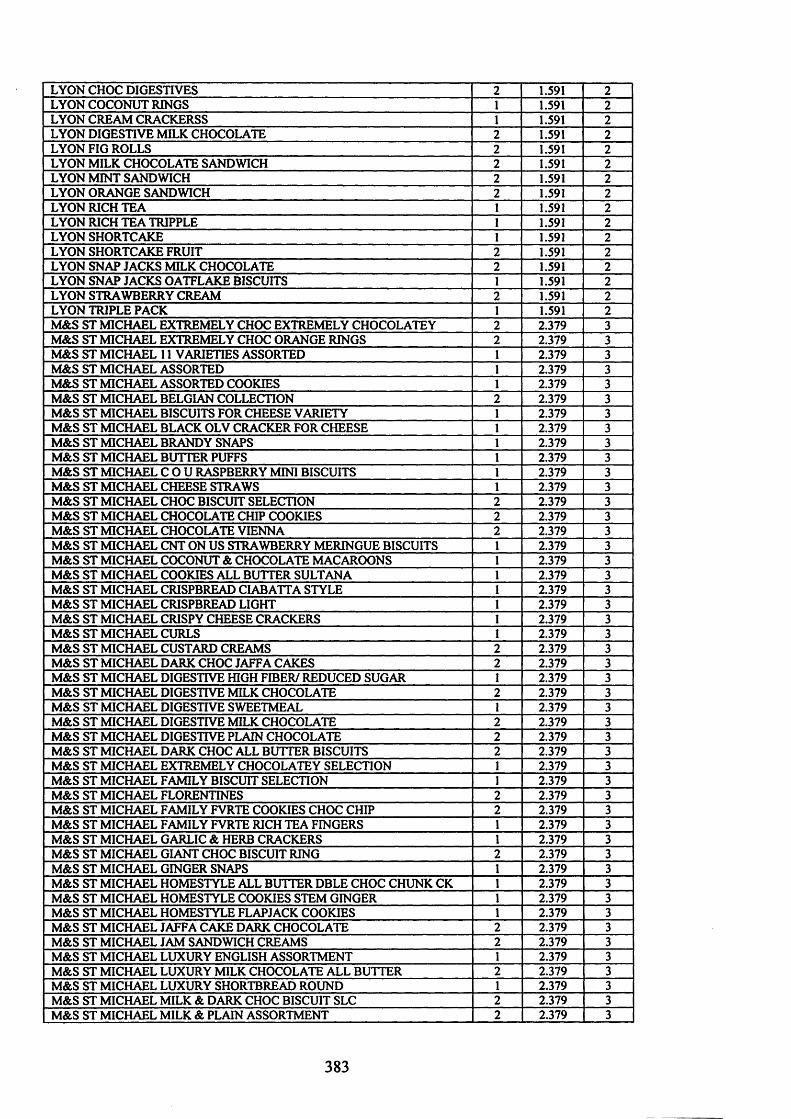
LYON CHOC DIGESTIVES 2 1.591 2LYON COCONUT RINGS 1 1.591 2LYON CREAM CRACKERSS 1 1.591 2LYON DIGESTIVE MILK CHOCOLATE 2 1.591 2LYON FIG ROLLS 2 1.591 2LYON MILK CHOCOLATE SANDWICH 2 1.591 2LYON MINT SANDWICH 2 1.591 2LYON ORANGE SANDWICH 2 1.591 2LYON RICH TEA 1 1.591 2LYON RICH TEA TRIPPLE 1 1.591 2LYON SHORTCAKE 1 1.591 2LYON SHORTCAKE FRUIT 2 1.591 2LYON SNAP JACKS MILK CHOCOLATE 2 1.591 2LYON SNAP JACKS OATFLAKE BISCUITS 1 1.591 2LYON STRAWBERRY CREAM 2 1.591 2LYON TRIPLE PACK 1 1.591 2M&S ST MICHAEL EXTREMELY CHOC EXTREMELY CHOCOLATEY 2 2.379 3M&S ST MICHAEL EXTREMELY CHOC ORANGE RINGS 2 2.379 3M&S ST MICHAEL 11 VARIETIES ASSORTED 1 2.379 3M&S ST MICHAEL ASSORTED 1 2.379 3M&S ST MICHAEL ASSORTED COOKIES 1 2.379 3M&S ST MICHAEL BELGIAN COLLECTION 2 2.379 3M&S ST MICHAEL BISCUITS FOR CHEESE VARIETY 1 2.379 3M&S ST MICHAEL BLACK OLV CRACKER FOR CHEESE 1 2.379 3M&S ST MICHAEL BRANDY SNAPS 1 2.379 3M&S ST MICHAEL BUTTER PUFFS 1 2.379 3M&S ST MICHAEL C 0 U RASPBERRY MINI BISCUITS 1 2.379 3M&S ST MICHAEL CHEESE STRAWS 1 2.379 3M&S ST MICHAEL CHOC BISCUIT SELECTION 2 2.379 3M&S ST MICHAEL CHOCOLATE CHIP COOKIES 2 2.379 3M&S ST MICHAEL CHOCOLATE VIENNA 2 2.379 3M&S ST MICHAEL CNT ON US STRAWBERRY MERINGUE BISCUITS 1 2.379 3M&S ST MICHAEL COCONUT & CHOCOLATE MACAROONS 1 2.379 3M&S ST MICHAEL COOKIES ALL BUTTER SULTANA 1 2.379 3M&S ST MICHAEL CRISPBREAD CIABATTA STYLE 1 2.379 3M&S ST MICHAEL CRISPBREAD LIGHT 1 2.379 3M&S ST MICHAEL CRISPY CHEESE CRACKERS I 2.379 3M&S ST MICHAEL CURLS 1 2.379 3M&S ST MICHAEL CUSTARD CREAMS 2 2.379 3M&S ST MICHAEL DARK CHOC JAFFA CAKES 2 2.379 3M&S ST MICHAEL DIGESTIVE HIGH FIBER/ REDUCED SUGAR I 2.379 3M&S ST MICHAEL DIGESTIVE MILK CHOCOLATE 2 2.379 3M&S ST MICHAEL DIGESTIVE SWEETMEAL 1 2.379 3M&S ST MICHAEL DIGESTIVE MILK CHOCOLATE 2 2.379 3M&S ST MICHAEL DIGESTIVE PLAIN CHOCOLATE 2 2.379 3M&S ST MICHAEL DARK CHOC ALL BUTTER BISCUITS 2 2.379 3M&S ST MICHAEL EXTREMELY CHOCOLATEY SELECTION 1 2.379 3M&S ST MICHAEL FAMILY BISCUIT SELECTION 1 2.379 3M&S ST MICHAEL FLORENTINES 2 2.379 3M&S ST MICHAEL FAMILY FVRTE COOKIES CHOC CHIP 2 2.379 3M&S ST MICHAEL FAMILY FVRTE RICH TEA FINGERS 1 2.379 3M&S ST MICHAEL GARLIC & HERB CRACKERS 1 2.379 3M&S ST MICHAEL GIANT CHOC BISCUIT RING 2 2.379 3M&S ST MICHAEL GINGER SNAPS 1 2.379 3M&S ST MICHAEL HOMESTYLE ALL BUTTER DBLE CHOC CHUNK CK 1 2.379 3M&S ST MICHAEL HOMESTYLE COOKIES STEM GINGER 1 2.379 3M&S ST MICHAEL HOMESTYLE FLAPJACK COOKIES 1 2.379 3M&S ST MICHAEL JAFFA CAKE DARK CHOCOLATE 2 2.379 3M&S ST MICHAEL JAM SANDWICH CREAMS 2 2.379 3M&S ST MICHAEL LUXURY ENGLISH ASSORTMENT 1 2.379 3M&S ST MICHAEL LUXURY MILK CHOCOLATE ALL BUTTER 2 2.379 3M&S ST MICHAEL LUXURY SHORTBREAD ROUND 1 2.379 3M&S ST MICHAEL MILK & DARK CHOC BISCUIT SLC 2 2.379 3M&S ST MICHAEL MILK & PLAIN ASSORTMENT 2 2.379 3
383

M&S ST MICHAEL MILK CHOC COVERED JFF VNNS 2 2.379 3M&S ST MICHAEL MILK CHOCOLATE FINGERS 2 2.379 3M&S ST MICHAEL MILK/DARK/WHITE SELECTION 2 2.379 3M&S ST MICHAEL PETIT FOURS CHOCOLATE 1 2.379 3M&S ST MICHAEL PIPED SHORTCAKE CHOC 2 2.379 3M&S ST MICHAEL PLAIN CHOCOLATE GINGER 2 2.379 3M&S ST MICHAEL QUALITY 12 VARIETIES ASSORTED 1 2.379 3M&S ST MICHAEL RED FAT COOKIES SULTANA ALL BUTTER 1 2.379 3M&S ST MICHAEL RED FAT DIGESTIVE 1 2.379 3M&S ST MICHAEL RED FAT DIGESTIVE MILK CHOCOLATE 2 2.379 3M&S ST MICHAEL RED FAT RICH TEA 1 2.379 3M&S ST MICHAEL RICH TEA 1 2.379 3M&S ST MICHAEL RICH TEA CREAMS 2 2.379 3M&S ST MICHAEL SCOTTISH A/BUTTER PETTICOAT TLS 1 2.379 3M&S ST MICHAEL SCOTTISH SHORTBREAD ASSORTED A/B 1 2.379 3M&S ST MICHAEL SCOTTISH SHORTBREAD FINGER AA/B 1 2.379 3M&S ST MICHAEL SCOTTISH SHORTBREAD ASSORTED 1 2.379 3M&S ST MICHAEL SHORTBREAD ALL BUTTER SELECTION 1 2.379 3M&S ST MICHAEL SNACKTIME ASSORTMENT 1 2.379 3M&S ST MICHAEL SPRING ONION CRACKERS 1 2.379 3M&S ST MICHAEL TEACAKES MILK CHOCOLATE 2 2.379 3M&S ST MICHAEL TOFFEE VIENNESE BISCUITS 1 2.379 3M&S ST MICHAEL VIENNESE CREAMS RASPBERRY 2 2.379 3M&S ST MICHAEL VIENNESE MILK CHOCOLATE SWIRLS 2 2.379 3M&S ST MICHAEL VIENNESE BISCUIT SELECTION 1 2.379 3M&S ST MICHAEL VIENNESE CREAMS STRAWBERRY 2 2.379 3M&S ST MICHAEL VIENNOIS ALL BUTTER 1 2.379 3M&S ST MICHAEL VIENNOIS SANDWICH MILK CHOCOLATE 2 2.379 3M&S ST MICHAEL WHEATEN CRACKERS 1 2.379 3M&S ST MICHAEL WHITE CHOCOLATE SHORTCAKE 2 2.379 3M&S ST MICHAEL XMAS TEACAKES M/CHCMRMLL 2 2.379 3M&S ST MICHAEL DUTCH SHORTCAKE 1 2.379 3M&S ST MICHAEL COUNT ON US CHERRY BAKE WELL COOKIES 1 2.379 3MACAROONS CHOCOLATE 2 0.970 1MACFARLANE GINGER NUTS 1 0.394 1MACNICOLS SHORTBREAD FINGERS 1 0.000 1MACNICOLS SHORTBREAD ROUNDS 1 0.000 1MAGISNAX COOKIES TIN 1 0.000 1MAMMOET ANIMAL FASTTVAL COOKIES WITH COCOA 1 0.000 1MAMMOET COOKIES COOKIES CHOCOLATE 1 0.000 1MANNER WAFER CHERRY 1 0.000 1MANNER WAFER HAZELNUT 1 0.000 1MANNER WAFER VANILLA 1 0.000 1MARCANTONIO ICE CREAM CONES 1 0.000 1MARCANTONIO LITTLE BEAR WAFER CUPS 1 0.000 1MARCANTONIO LITTLE BEAR WAFERS 1 0.000 1MARCANTONIO TEDDY TOP CONES 1 0.000 1MARCANTONIO WAFFLE BASKETS 1 0.000 1MARYLAND COOKIE BAR CHOCOLATE CHIP 2 1.606 2MARYLAND COOKIE BARS 2 1.606 2MARYLAND COOKIE GIANT 1 1.606 2MARYLAND COOKIES 1 1.606 2MARYLAND COOKIE CHOC CHIP 2 1.606 2MARYLAND COOKIE CHOC CHIP &CHOC 2 1.606 2MARYLAND COOKIE CHOC CHIP & HAZELNUT 2 1.606 2MARYLAND COOKIE CHOC CHIP & COCONUT 2 1.606 2MARYLAND COOKIE CHOC NUT 1 1.606 2MARYLAND COOKIE DOUBLE CHOC CHIP 2 1.606 2MARYLAND COOKIE MIN CHOC CHIP 2 1.606 2MARYLAND COOKIE VALUE PACK 1 1.606 2MARYLAND REDUCED FAT COOKIES 1 1.606 2MARYLAND STRAWBERRY & WHITE CHOCOLATE CAKES 1 1.606 2MARYLAND TRIPLE CHOCOLATE COOKIES 1 1.606 2MARYLAND VARIETY COOKIE BARS 2 1.606 2
384

MCVITIES BAKED TO PERFECTION ASSORTMENT 1 2.667 3MCVTTIES BISCUITS FOR CHEESE 1 2.667 3MCVITIES BLACK TREACLE CREAMS 2 2.667 3MCVITIES BOASTERS CHOCOLATE & HAZELNUT 1 2.667 3MCVITIES BOASTERS CHOC CHIP 2 2.667 3MCVITIES BUTTER PUFFS 1 2.667 3MCVITIES CAFE NOIR 1 2.667 3MCVITIES CARAMEL DIGESTIVES 2 2.667 3MCVITIES CARRS CHEESE MELTS 1 2.667 3MCVITIES CARRS MELTS 1 2.667 3MCVITIES CHOCOLATE CHUNKS 1 2.667 3MCVITIES COOKIES CHOCOLATE CHIP 2 2.667 3MCVITIES COOKIES CHOCOLATE CHIP N CHUNK 2 2.667 3MCVITIES COOKIES HAZELNUT CHOC CHIP NCHK 2 2.667 3MCVITIES COOKIES MINI 1 2.667 3MCVITIES COOKIES WHITE CHOCOLATE & RASPBERRY 1 2.667 3MCVITIES CRAWFORDS MILK CHOC DIGESTIVE 2 2.667 3MCVITIES PLAIN CHOCOLATE DIGESTIVE 2 2.667 3MCVITIES DIGESTIVE 1 2.667 3MCVITIES DIGESTIVE CHOC CHUNK BAR 2 2.667 3MCVITIES DIGESTIVE LIGHT 1 2.667 3MCVITIES DIGESTIVE MILK CHOCOLATE 2 2.667 3MCVITIES DIGESTIVE PLAIN CHOCOLATE 2 2.667 3MCVITIES DIGESTIVE MINI MILK CHOCOLATE 2 2.667 3MCVITIES FRUIT SHORTCAKE 2 2.667 3MCVITIES GINGER NUTS 1 2.667 3MCVITIES GINGER SNAPS 1 2.667 3MCVITIES GO AHEAD APPLE & RAISIN COOKIES 1 2.667 3MCVITIES GO AHEAD APPLE BAKES 2 2.667 3MCVITIES GO AHEAD CRANBERRY & ORANGE COOKIES I 2.667 3MCVITIES GO AHEAD FIG ROLLS 2 2.667 3MCVITIES GO AHEAD LEMON SMOOTH BAKE 2 2.667 3MCVITIES GO AHEAD RASPBERRY SMOOTHIE 2 2.667 3MCVITIES GO AHEAD SLICES 2 2.667 3MCVITIES GO AHEAD SLICES APPLE & SULTANA 2 2.667 3MCVITIES GO AHEAD SLICES CRISPY FOREST FRUIT 2 2.667 3MCVITIES GO AHEAD SLICES FRUIT APPLE/SULTANA 2 2.667 3MCVITIES GO AHEAD SLICES FRUIT ORANGE/SULTANA 2 2.667 3MCVITIES GO AHEAD ORANGE & SULTANA FRUIT SLICES 2 2.667 3MCVITIES GO AHEAD STRAWBERRY MALLOWS 2 2.667 3MCVITIES GOLD SYRUP CREAM 2 2.667 3MCVITIES GYPSY CREAMS 2 2.667 3MCVITIES HOB NOBS 1 2.667 3MCVITIES HOB NOBS CARAMEL & HAZELNUT 1 2.667 3MCVITIES HOB NOBS CHOCOLATE 2 2.667 3MCVITIES HOB NOBS CHOC CHUNK 1 2.667 3MCVITIES HOB NOBS MILK CHOCOLATE 2 2.667 3MCVITIES PLAIN CHOCOLATE 2 2.667 3MCVITIES HOMEWHEAT 2 2.667 3MCVITIES HOMEWHEAT CHOC 2 2.667 3MCVITIES HOMEWHEAT MILK CHOCOLATE 2 2.667 3MCVITIES HOMEWHEAT PLAIN CHOCOLATE 2 2.667 3MCVITIES JAFFA CAKES 2 2.667 3MCVITIES JAFFA CAKES BERRY BLAST 2 2.667 3MCVITIES JAFFA CAKES MINI 2 2.667 3MCVITIES JAFFA CAKES SNACKPACK 2 2.667 3MCVITIES KRACKAWHEAT 1 2.667 3MCVITIES LEMON & GINGER 1 2.667 3MCVITIES LIGHT MILK CHOCOLATE DIGESTIVES 2 2.667 3MCVITIES LIGHT RICH TEA 1 2.667 3MCVITIES LINCOLN 1 2.667 3MCVITIES MILK CHOC & CARAMEL DIGESTIVES 2 2.667 3MCVITIES MILK CHOC DIGESTIVES 2 2.667 3MCVITIES MINI CHEDDARS 1 2.667 3
385

MCVITIES MINI CHEDDARS CHEESE 1 2.667 3MCVITIES MINI CHEDDARS VARIETY 1 2.667 3MCVITIES MINI CHOC DIGESTIVE 2 2.667 3MCVITIES MINI GARLIC BAGUETTES 1 2.667 3MCVITIES ORANGE MILK CHOC DIGESTIVES 2 2.667 3MCVITIES PLAIN CHOC & CARAMEL DIGESTIVES 2 2.667 3MCVITIES PLAIN CHOCOLATE DIGESTIVES 2 2.667 3MCVITIES RICH TEA 1 2.667 3MCVITIES SHORTBREAD ALL BUTTER 1 2.667 3MCVITIES SPECIAL TRIPLE 1 2.667 3MCVITIES SPECIAL TRIPLE DIG/HOB NOB/ RICH TEA 1 2.667 3MCVITIES TUC CRACKERS 1 2.667 3MCVITIES TWINPACK RICH TEA/HOB NOB 1 2.667 3MCVITIES VICTORIA 1 2.667 3MCVITIES VICTORIA ASSORTED 1 2.667 3MCVITIES VICTORIA SELECTION 1 2.667 3MERBA AMERICAN CHOC CHIP COOKIES 2 0.000 1MERBA CHOC CHIP COOKIES 2 0.000 1MERBA CHOC CHUNK COOKIE BAG 1 0.000 1MERBA COOKIES APPLE PIE 1 0.000 1MERBA COOKIES BROWNIE 1 0.000 1MERBA COOKIES CHOC CHIP 2 0.000 1MERBA COOKIES CHOCOLATE 1 0.000 1MERBA COOKIES RAINBOW 1 0.000 1MICA JAFFA CAKES 2 0.061 1MILKY BAR BISCUITS 2 2.076 2MILKY WAY CRISPY ROLLS 2 2.106 2MILLERS DAMSEL ORGANIC LEMON 1 0.152 1MILLERS DAMSEL ORGANIC GINGER BISCUITS 1 0.152 1MILLERS DAMSEL WHEAT WAFERS 1 0.152 1MINI CHEDDARS CRINKLYS CHEESE & ONION 1 2.121 2MINI CHEDDARS CRINKLYS VARIETY 1 2.121 2MINI COOKIES 1 NV NVMINI CREAMS 2 NV NVMINI RIO CHEESE 1 NV NVMONTANA CHOCOLATE 2 0.530 1MONTANA COOKIES CHOC CHIP ORANGE & PLN 1 0.530 1MONTANA COOKIES CHOCOLATE CHIP 2 0.530 1MONTANA TRIPLE CHOCOLATE 2 0.530 1MONTANA TRIPLE CHOCOLATE/ORANGE/CARAMEL 2 0.530 1MONTANA VARIETY 2 0.530 1MORRISONS BETTABUY BOURBON CREAMS 2 1.015 1MORRISONS BETTABUY CHOCOLATE TEACAKES 2 1.015 1MORRISONS BETTABUY CUSTARD CREAMS 2 1.015 1MORRISONS BETTABUY DIGESTIVE 1 1.015 1MORRISONS BETTABUY DIGESTIVE MILK CHOCOLATE 2 1.015 1MORRISONS BETTABUY DIGESTIVE PLAIN CHOCOLATE 2 1.015 1MORRISONS BETTABUY RICH TEA 1 1.015 1MORRISONS BETTABUY VARIETY PACK 1 1.015 1MORRISONS BETTER BUY JAFFA CAKES 2 1.015 1MORRISONS BETTER FOR YOU DIGESTIVE MILK CHOCOLATE 2 1.106 1MORRISONS BISCUITS FOR CHS 10 VRT 1 1.273 1MORRISONS BOURBON CREAMS 2 1.273 1MORRISONS BREAK DARK CHOCOLATE 2 1.273 1MORRISONS BREAK MILK CHOCOLATE 2 1.273 1MORRISONS BREAK MILK CHOCOLATE MINT WAFERS 2 1.273 1MORRISONS BREAK MILK CHOCOLATE ORANGE WAFERS 2 1.273 1MORRISONS BREAK MILK CHOCOLATE WAFER 2 1.273 1MORRISONS BREAK MINT CHOCOLATE 2 1.273 1MORRISONS BREAK ORANGE MILK CHOCOLATE 2 1.273 1MORRISONS BREAK PLAIN CHOCOLATE WAFERS 2 1.273 1MORRISONS CARAMEL MILK HOCOLATE WAFERS 2 1.273 1MORRISONS CHEESE BITES 1 1.273 1MORRISONS CHEESE SAVOURIES 1 1.273 1
386

MORRISONS CHEESE THINS 1 1.273 1MORRISONS CHOCOLATE TEACAKES JAM 2 1.273 1MORRISONS CHOCOLATE & COOKIES & CREAM 1 1.273 1MORRISONS COCONUT RINGS 1 1.273 1MORRISONS COOKIES HEAVEN CHOCOLATE CHUNK & RAISIN 1 1.273 1MORRISONS COOKIE HEAVEN 1 1.273 1MORRISONS COOKIES CHOC & HAZELNUT 1 1.273 1MORRISONS COOKIES CHOC CHIP 2 1.273 1MORRISONS COOKIES CHOC CHIP & NUT 2 1.273 1MORRISONS COOKIES DOUBLE CHOC CHIP 2 1.273 1MORRISONS CREAM CRACKERS 1 1.273 1MORRISONS CRISPBREAD DARK RYE 1 1.273 1MORRISONS CRISPBREAD ORIGINAL 1 1.273 1MORRISONS CRISPBREAD WHEAT POPPY SD 1 1.273 1MORRISONS CUSTARD CREAMS 2 1.273 1MORRISONS DIGESTIVE 1 1.273 1MORRISONS DIGESTIVE FINGERS 1 1.273 1MORRISONS DIGESTIVE MILK CHOCOLATE 2 1.273 1MORRISONS DIGESTIVE PLAIN CHOCOLATE 2 1.273 1MORRISONS FARMERS BOY CUSTARD CREAMS 2 1.273 1MORRISONS FIG ROLLS 2 1.273 1MORRISONS GARIBALDI 2 1.273 1MORRISONS GARLAND MILK CHOCOLATE WAFER 2 1.273 1MORRISONS GINGER NUTS 1 1.273 1MORRISONS JAFFA CAKES 2 1.273 1MORRISONS LUXURY ASSORTED BISCUITS 1 1.273 1MORRISONS MALTED MILK 1 1.273 1MORRISONS MALTED MILK CHOCOLTE 2 1.273 1MORRISONS MILK CHOCOLATE MINI FINGERS 2 1.273 1MORRISONS MINI JAFFA CAKES 2 1.273 1MORRISONS MILK CHOCOLATE DIGESTIVE FINGERS 2 1.273 1MORRISONS NICE 1 1.273 1MORRISONS OATIES 1 1.273 1MORRISONS POPPY & SESAME THINS 1 1.273 1MORRISONS RICH TEA 1 1.273 1MORRISONS RICH TEA FINGER BISCUITS 1 1.273 1MORRISONS RICH TEA MILK CHOCOLATE 2 1.273 1MORRISONS SHORTBREAD ASSORTMENT 1 1.273 1MORRISONS SHORTBREAD CHOC CHIP 2 1.273 1MORRISONS SHORTBREAD FINGERS 1 1.273 1MORRISONS SHORTBREAD LUX ASSORTMENT 1 1.273 1MORRISONS SHORTCAKE 1 1.273 1MORRISONS SHORTCAKE FRUIT 2 1.273 1MORRISONS SHORTIES 1 1.273 1MORRISONS SKIPPER SANDWICH MILK CHOCOLATE 2 1.273 1MORRISONS SKIPPER SANDWICH MILK CHOCOLATE MINT 2 1.273 1MORRISONS SKIPPER SANDWICH MILK CHOCOLATE ORANGE 2 1.273 1MORRISONS SWEET ASSORTMENT 1 1.273 1MORRISONS VARIETY SANDWICH BARS 2 1.273 1MORRISONS WAFERS CHOCOLATE 1 1.273 1MORRISONS WAFERS PUNK BOGOF 1 1.273 1MORRISONS WATER BISCUITS 1 1.273 1MORRISONS WHEAT CRISPBREAD 1 1.273 1MORRISONS WHOLEMEAL OATIES 1 1.273 1MULTI GRAIN RICE CAKES 1 0.621 1MY FAVOURITES CHOCOLATE CHIP COOKIES 2 0.061 1NABISCO OREO COOKIES 1 0.788 1NAENGSINHOLD CREAM CRACKERS 1 0.000 1NAIRNS BERRY 2 0.530 1NAIRNS FRUIT & SPICE 2 0.530 1NAIRNS GINGER BISCUIT 1 0.530 1NAIRNS ORGANIC WHOLEMEAL CRACKERS 1 0.530 1NAIRNS SAVOURY BISCUIT SELECTION 1 0.530 1NESTLE SMARTIES BISCUIT 2 2.288 2
387

NETTO BOURBON CREAMS 2 0.067 1NETTO BUTTER COOKIES 1 0.067 1NETTO CHESTERTON JAFFA CAKES 2 0.067 1NETTO CHESTERTON ORANGE SANDWICH 2 0.067 1NETTO CHESTERTON DIGESTIVE 1 0.067 1NETTO CHESTERTON GINGERNUTS 1 0.067 1NETTO CHESTERTON JAFFA CAKES 0.067 1NETTO CHOCOLATE CHIP COOKIES 0.067 1NETTO CREAM CRACKERS 1 0.067 1NETTO MALTED MILK 1 0.067 1NETTO NICE 1 0.067 1NETTO OATRIDGE CUSTARD CREAMS 0.067 1NETTO RICH TEA 1 0.067 1NEWBURY CORN SLIMS ORGANIC 1 0.167 1NICE N RICE CAKES LIGHT SALTED 1 0.030 1NISA BOURBON CREAMS 0.545 1NISA COCONUT RINGS 1 0.545 1NISA CUSTARD CREAMS 0.545 1NISA DIGESTIVE 1 0.545 1NISA DIGESTIVE PLAIN CHOC 0.545 1NISA GINGER NUTS 1 0.545 1NISA HERITAGE CREAM CRACKERS 1 0.545 1NISA HERITAGE CUSTARD CREAMS 0.545 1NISA HERITAGE DIGESTIVE MILK CHOCOLATE 0.545 1NISA HERITAGE RICH TEA 1 0.545 1NISA HERITAGE SHORTBREAD 1 0.545 1NISA HERITAGE WHEAT BISCUITS 1 0.545 1NIASA HIGHLAND SHORTIES RICH 1 0.545 1NISA SHORTBREAD ALL BUTTER 1 0.545 1NISA SHORTCAKE OBLONG 1 0.545 1NISA TODAY SHORTCAKE 1 0.545 1OFFICIALLY LOW FAT COOKIE BR TOFFEE APPLE 1 0.061 1OFFICIALLY LOW FAT MINIS APPLE & RASPBERRY COOKIES 1 0.061 1ORGRAN CORN CRISPBREAD 1 0.106 1ORGRAN ORGANIC RICE CAKES UNSALTED 1 0.106 1ORGRAN ORGANIC RICE THINS UNSALTED 1 0.106 1ORGRAN SALSA CORN CRISPBREAD 1 0.106 1ORVILLE REDENBACHERS CARAMEL 1 0.015 1OR VITA MINI CRACKERS SALTED OWLS 1 0.061 1PADDINGTON COOKIES DANISH CHOC CHIP 0.045 1PAN CANTUCCINI ALMOND 1 0.091 1PATERSON BUTTERY SHORTBREAD SLICES 1 0.076 1PATERSON CARTON PETTICOAT SLICES 1 0.076 1PATERSON SHORTBREAD MINI CREAM FINGERS 1 0.076 1PATERSON SHORTBREAD & BISCUIT ASSORTED 1 0.076 1PATERSON SHORTBREAD FINGERS 1 0.076 1PATERSON OAT CRACKERS MIXED HERB & BLACK PEPPER 1 0.076 1PEEK FREANS BOURBON CREAM 0.758 1PENFOLD ASSORTED WAFERS 1 0.000 1PENFOLD SHORTBREAD FINGERS 1 0.000 1PENFOLD SHORTBREAD COOKIES 1 0.000 1PENFOLD SNAP JACKS 1 0.000 1PENGUIN 0.758 1PENGUIN CHUKKA MILK 1 0.000 1PENGUIN CHUKKA WHITE 1 0.000 1PENGUIN CHUKKA WHITE CHOCOLATE 1 0.000 1PENGUIN FLIPPER DIPPERS 1 0.000 1PENGUIN INCLUDING 4 FREE MILK 2 2.318 3PENGUIN MILK 2 2.318 3PENGUIN MINT 2 2.318 3PENGUIN MINT SANDWICH 2 2.318 3PENGUIN ORANGE 2 2.318 3PENGUIN SPLATZ VANILLA 2 2.318 3PENGUIN SPLATS VANILLA MINI 2 2.318 3
388

PENGUIN VARIETY 2 2.318 3PEPPERIDGE FARM OATMEAL RAISIN BIG COOKIES I 0.439 1PISTACHIO BISCUITS 1 NV NVPOP PAN SPRING ONION/CHIVE CRACKERS 1 0.091 1PRINCESS 1 0.182 1QUAKER SEASONS CARIBBEAN CHICKEN 1 1.924 2QUAKER SEASONS CHEESE ONION & CHIVES 1 1.924 2QUAKER SEASONS HONEY ROAST HAM 1 1.924 2QUAKER SEASONS SALT & CRACKED BLACK PEPPER 1 1.924 2QUEENS BUTTER COOKIES 1 0.000 1QUEENS DANISH BUTTER COOKIES 1 0.000 1QUEENS LUXURY DANISH COOKIES 1 0.000 1QUIACKBURY COOKIE SELECTION 1 0.000 1RAKUSEN CRACKERS FAT FREE 1 0.348 1RAKUSEN CRACKERS HERB & ONION 1 0.348 1REAL FOODS CORN THINS MULTIGRAIN 1 0.136 1REAL FOODS ORIGINAL CORN THINS 1 0.136 1REDONDO WAFERS CHOCOLATE 1 0.000 1REDONDA WAFERS CAPPUCINO 1 0.000 1REGAL CUSTARD CREAMS 0.015 1RIB N SAUCY 1 0.000 1RIO FIESTA TRAY 1 0.045 1RIPENSA FRUIT TIN 1 2.015 2RITZ 1 2.015 2RITZ CHEESE 1 2.015 2RITZ CHEESE SANDWICH 1 2.015 2RITZ ORIGINAL 2 0.394 1RIVA MILK CHOCOLATE 2 0.394 1RIVA VELVET ORANGE 2 0.000 1RIVINGTON MONTANA CARAMEL CRISP BARS 2 0.000 1RIVINGTON MONTANA CHOC BAR VARIETY 1 0.000 1RIVINGTON PINK PANTHER WAFERS VANILLA 2 0.000 1RIVINGTON PINK PANTHER JAMMY WHEELS 1 0.000 1RIVINGTON WAFERS CARAMEL 1 0.000 1RIVINGTON WAFERS PINK PANTHER WAFER 1 0.000 1RIZZLES RICE CAKES CARAMEL 1 0.000 1RIZZLES RICE CAKES SPICY 1 0.000 1ROCHELLE SAVOURY BISCUITS SALTED 2 1.288 1ROCKY 2 1.288 1ROCKY CARAMEL 2 1.288 1ROCKY CHOCOLATE 2 1.288 1ROCKY FUNKAFUDGE PENCIL CASE 2 1.288 1ROCKY FUNKY FUDGE 2 1.288 1ROCKY MILK CHOCOLATE 2 1.288 1ROCKY ROUNDS CARAMEL BAGS 2 1.288 1ROCKY ROUNDS CHOCOLATE BAGS 2 1.288 1ROCKY RUBBLE 2 1.288 1ROCKY TOFFEE 2 1.288 1ROKA CHEESE CRISPIES 1 0.030 1ROLO BISCUITS 2 1.545ROMANY CREAMS 2 0.121 1ROYAL EDINBURGH FINGER 1 0.515 1ROYAL EDINBURGH SHORTBREAD LUXURY 1 0.515 1ROYAL EDINBURGH TIN SHORTBREAD 1 0.515 1RYVITA CRACKERBREAD 1 2.091 2RYVITA CRACKERBREAD 1 2.091 2RYVITA CRACKERBREAD 1 2.091 2RYVITA CRISPBRREAD CURRANT CRUNCH 1 2.091 2RYVITA CRISPBRREAD DARK RYE 1 2.091 2RYVITA CRISPBRREAD ORIGINAL 1 2.091 2RYVITA CRISPBRREAD SESAME SEEDS 1 2.091 2RYVITA MINIS CREAM & CHIVE 1 2.091 2RYVITA MINIS GARLIC & HERB 1 2.091 2RYVITA MINIS MATURE CHEDDAR & ONION 1 2.091 2
389
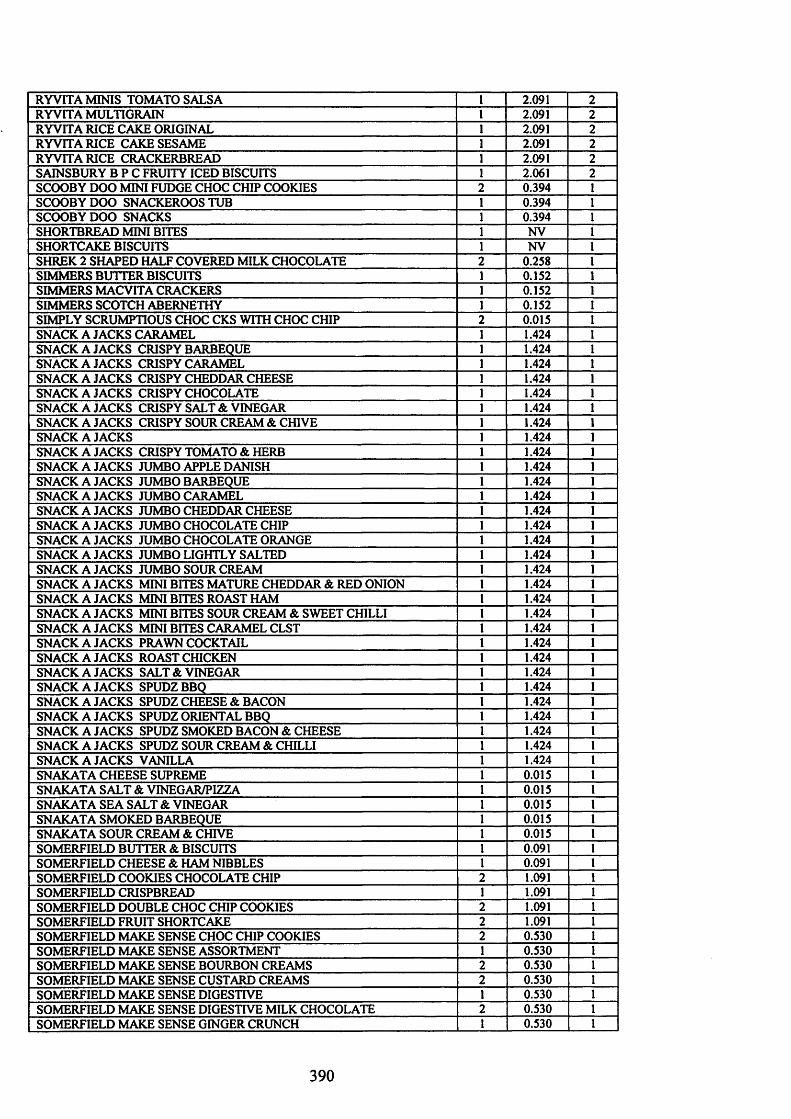
RYVITA MINIS TOMATO SALSA 1 2.091 2RYVITA MULTIGRAIN 1 2.091 2RYVITA RICE CAKE ORIGINAL 1 2.091 2RYVITA RICE CAKE SESAME 1 2.091 2RYVITA RICE CRACKERBREAD 1 2.091 2SAINSBURY B P C FRUITY ICED BISCUITS 1 2.061 2SCOOBY DOO MINI FUDGE CHOC CHIP COOKIES 0.394 1SCOOBYDOO SNACKEROOS TUB 1 0.394 1SCOOBY DOO SNACKS 1 0.394 1SHORTBREAD MINI BITES 1 NV 1SHORTCAKE BISCUITS 1 NV 1SHREK 2 SHAPED HALF COVERED MILK CHOCOLATE 0.258 1SIMMERS BUTTER BISCUITS 1 0.152 1SIMMERS MACVITA CRACKERS 1 0.152 1SIMMERS SCOTCH ABERNETHY 1 0.152 1SIMPLY SCRUMPTIOUS CHOC CKS WITH CHOC CHIP 0.015 1SNACK A JACKS CARAMEL 1 1.424 1SNACK A JACKS CRISPY BARBEQUE 1 1.424 1SNACK A JACKS CRISPY CARAMEL 1 1.424 1SNACK A JACKS CRISPY CHEDDAR CHEESE 1 1.424 1SNACK A JACKS CRISPY CHOCOLATE 1 1.424 1SNACK A JACKS CRISPY SALT & VINEGAR 1 1.424 1SNACK A JACKS CRISPY SOUR CREAM & CHIVE 1 1.424 1SNACK A JACKS 1 1.424 1SNACK A JACKS CRISPY TOMATO & HERB 1 1.424 1SNACK A JACKS JUMBO APPLE DANISH 1 1.424 1SNACK A JACKS JUMBO BARBEQUE 1 1.424 1SNACK A JACKS JUMBO CARAMEL 1 1.424 1SNACK A JACKS JUMBO CHEDDAR CHEESE 1 1.424 1SNACK A JACKS JUMBO CHOCOLATE CHIP 1 1.424 1SNACK A JACKS JUMBO CHOCOLATE ORANGE 1 1.424 1SNACK A JACKS JUMBO LIGHTLY SALTED 1 1.424 1SNACK A JACKS JUMBO SOUR CREAM 1 1.424 1SNACK A JACKS MINI BITES MATURE CHEDDAR & RED ONION 1 1.424 1SNACK A JACKS MINI BITES ROAST HAM 1 1.424 1SNACK A JACKS MINI BITES SOUR CREAM & SWEET CHILLI 1 1.424 1SNACK A JACKS MINI BITES CARAMEL CLST 1 1.424 1SNACK A JACKS PRAWN COCKTAIL 1 1.424 1SNACK A JACKS ROAST CHICKEN 1 1.424 1SNACK A JACKS SALT & VINEGAR 1 1.424 1SNACK A JACKS SPUDZBBQ 1 1.424 1SNACK A JACKS SPUDZ CHEESE & BACON 1 1.424 1SNACK A JACKS SPUDZ ORIENTAL BBQ 1 1.424 1SNACK A JACKS SPUDZ SMOKED BACON & CHEESE 1 1.424 1SNACK A JACKS SPUDZ SOUR CREAM & CHILLI 1 1.424 1SNACK A JACKS VANILLA 1 1.424 1SNAKATA CHEESE SUPREME 1 0.015 1SNAKATA SALT & VINEGAR/PIZZA 1 0.015 1SNAKATA SEA SALT & VINEGAR 1 0.015 1SNAKATA SMOKED BARBEQUE 1 0.015 1SNAKATA SOUR CREAM & CHIVE 1 0.015 1SOMERFIELD BUTTER & BISCUITS 1 0.091 1SOMERFIELD CHEESE & HAM NIBBLES 1 0.091 1SOMERFIELD COOKIES CHOCOLATE CHIP 2 1.091 1SOMERFIELD CRISPBREAD 1 1.091 1SOMERFIELD DOUBLE CHOC CHIP COOKIES 2 1.091 1SOMERFIELD FRUIT SHORTCAKE 2 1.091 1SOMERFIELD MAKE SENSE CHOC CHIP COOKIES 2 0.530 1SOMERFIELD MAKE SENSE ASSORTMENT 1 0.530 1SOMERFIELD MAKE SENSE BOURBON CREAMS 2 0.530 1SOMERFIELD MAKE SENSE CUSTARD CREAMS 2 0.530 1SOMERFIELD MAKE SENSE DIGESTIVE 1 0.530 1SOMERFIELD MAKE SENSE DIGESTIVE MILK CHOCOLATE 2 0.530 1SOMERFIELD MAKE SENSE GINGER CRUNCH I 0.530 1
390

SOMERFIELD NICE 1 0.530 1SOMERFIELD ORGANIC CRISPBREAD 1 1.091 1SOMERFIELD PETTICOAT TAILS 1 1.091 1SOMERFIELD REDUCED FAT CUSTARD CREAMS 1.091 1SOMERFIELD REDUCED FAT DIGESTIVE 1 1.091 1SOMERFIELD REDUCED FAT RICH TEA 1 1.091 1SOMERFIELD SGORTBREAD ASSORTMENT 1 1.091 1SOMERFIELD SHORTBREAD FINGERS 1 1.091 1SOMERFIELD SHORTCAKE 1 1.091 1SOMERFIELD SIMPLY BOURBON CREAMS 1.091 1SOMERFIELD SIMPLY WHEAT BISCUITS 1 1.091 1SOMERFIELD SO GOOD COOKIES CHOCOLATE 1 1.091 1SOMERFIELD SO GOOD COOKIES CHOCOLATE ORANGE 1 1.091 1SOMERFIELD SO GOOD COOKIES GINGER 1 1.091 1SOMERFIELD SO GOOD COOKIES HAZELNUT 1 1.091 1SOMERFIELD SO GOOD LUXURY CHOCOLATE CARTON 1 1.091 1SOMERFIELD SO GOOD SHORTBREAD SCOTTISH 1 1.091 1SOMERFIELD WAFER BREAK FULLY COATED 2 1.091 1SOMERFIELD WAFER BREAK PLAIN CHOCOLATE 2 1.091 1SOMERFIELD WAFERS CHOCOLATE ASSORTED 2 1.091 1SOMERFIELD SO GOOD SHORTBREAD FINGERS 1 1.091 1SOMERFIELD RICH TEA 1 NV NVSPAR BOURBON CREAMS 2 1.318 1SPAR CREAM CRACKERS 1 1.318 1SPAR CUSTARD CREAMS 2 1.318 1SPAR DIGESTIVE 1 1.318 1SPAR FIG ROLLS 2 1.318 1SPAR FRUIT SHORTCAKE 2 1.318 1SPAR MORNING COFFEE 1 1.318 1SPAR RICH TEA 1 1.318 1SPAR RICH TEA FINGERS 1 1.318 1SPONGEBOB MINI SQUAREISH JAFFA CAKES 2 0.379 1SPREEBACK HRLEKIN COCKTAIL SNACKS 1 0.000 1SUN VALLEY HEXA BITES CHEESY 1 0.727 1SUN VALLEY OCCASIONS SPICY SALSA MIX 1 0.727 1SUNRISE ORGANIC 100% FAT FREE CRACKERS 1 0.167 1SUNRISE RICE CRACKERS MINI PLAIN 1 0.167 1SUNRISE RICE CRACKERS MINI SEAWEED 1 0.167 1SUNRISE RICE CRACKERS MINI SPICY 1 0.167 1SWISS DELICE BRASILIA 1 0.152 1SWISS DELICE CHOCOLATE WAFER 1 0.152 1DELICE JAPONAIS 1 0.152 1
T/PINK FORTUNE COOKIES 1 0.045 1TAXI CARAMEL WAFER MILK CHOCOLATE 2 1.212 1TAXI CARAMEL WAFER MILK CHOCOLATE 2 1.212 1TAXI WAFER MILK CHOCOLATE 2 1.212 1TAYLORS YORKSHIRE TEA BISCUITS 1 0.197 1TESCO TIN DANISH COOKIES 1 2.121 2TESCO 25% LOWER FAT DIGESTIVE MILK CHOCOLATE 2 2.121 2TESCO ALL BUTTER 1 2.121 2TESCO ASSORTMENT COOKI/CHOCOLATE/CREAM 2 2.121 2TESCO BISCUITS FOR CHEESE 1 2.121 2TESCO BOURBON CREAMS 2 2.121 2TESCO BREAK 2 WAFER MILK CHOCOLATE 2 2.121 2TESCO BREAK 2 WAFER PLAIN CHOCOLATE 2 2.121 2TESCO CHEESE BISCUIT SELECTION 1 2.121 2TESCO CHEESE SAVOURIES 1 2.121 2TESCO CHEESE SPIRALS 1 2.121 2TESCO CHEESE STICKS 1 2.121 2TESCO CHEESE TWISTS 1 2.121 2TESCO CHOCOLATE BUNNY RABBIT BISCUITS 2 2.121 2TESCO COOKIES CHOC CHIP ORGANIC 2 2.121 2TESCO COOKIES CHOCOLATE CHIP 2 2.121 2TESCO CREAM CRACKERS 1 2.121 2
391

TESCO CREAM CRACKERS LOW FAT 1 2.121 2TESCO CRUNCHY CARAMEL BISCUIT 2 2.121 2TESCO CUSTARD CREAMS 2 2.121 2TESCO DANISH COOKIES CHOC CHIP & BUTTER 2 2.121 2TESCO DIGESTIVE 1 2.121 2TESCO DIGESTIVE MILK CHOCOLATE 2 2.121 2TESCO DIGESTIVE PLAIN CHOCOLATE 2 2.121 2TESCO DOUBLE CHOC CHIP COOKIES 2 2.121 2TESCO FAIR TRADE DOUBLE CHOC CHIP COOKIES 2 2.121 2TESCO FINEST ALL BUTTER CHEESE PALMIERS 1 2.106 2TESCO FINEST ALL BUTTER PESTO PALMIERS 1 2.106 2TESCO FINEST ALMOND THINS 1 2.106 2TESCO FINEST APPLE & CINNAMON THINS 1 2.106 2TESCO FINEST ASSORTED CRACKERS FR CHS 1 2.106 2TESCO FINEST BELGIAN BISCUIT ASSORTMENT 1 2.106 2TESCO FINEST BELGIAN CHOCOLATE BUTTER THINS 2 2.106 2TESCO FINEST BRAZIL COOKIES FULLY COATED 2 2.106 2TESCO FINEST CHEESE STRAWS 1 2.106 2TESCO FINEST CHOCOLATE FLORENTINES 2 2.106 2TESCO FINEST CHOCOLATE SELECTION 2 2.106 2TESCO FINEST COOKIES SOFT CRANBERRY/ORANGE 1 2.106 2TESCO FINEST COOKIES SOFT DOUBLE CHOCOLATE WALNUT 1 2.106 2TESCO FINEST COOKIES STEM GINGERS 1 2.106 2TESCO FINEST DOUBLE CHOC PETIT FOURS 1 2.106 2TESCO FINEST DOUBLE CREAM PETIT FOURS 1 2.106 2TESCO FINEST FLORENTINE SELECTION 1 2.106 2TESCO FINEST H/CTD ALL BUTTER LEMON BISCUIT 2 2.106 2TESCO FINEST H/CTD PLAIN CHOCOLATE GINGER COOKIES 2 2.106 2TESCO FINEST KING CRACKERS 1 2.106 2TESCO FINEST MEDITERRANEAN MINI TWIST SELECTION 1 2.106 2TESCO FINEST PETITS FOURS I 2.106 2TESCO FINEST RICH CHOCOLATE CUPS 2 2.106 2TESCO FINEST SHORTBREAD FINGERS 1 2.106 2TESCO FINEST SAVOURY BISCUIT SELECTION 1 2.106 2TESCO FINEST SAVOURY TWISTS BSL&BLOLV 1 2.106 2TESCO FINEST SAVOURY TWISTS CHS/PPY SEED 1 2.106 2TESCO FINEST SCOTTISH SHORTBREAD ASSORTMENT 1 2.106 2TESCO FINEST SHORTBREAD PETIT FOURS 1 2.106 2TESCO FINEST SHORTBREAD TIN 1 2.106 2TESCO FINEST SWISS JAPONAIS BISCUIT 2 2.106 2TESCO FINEST SWISS TRUFFINO BISCUIT 2 2.106 2TESCO FINEST TRIPLE CHOC COOKIE(H/C) 2 2.106 2TESCO FINEST WATER CRACKER SELECTION 1 2.106 2TESCO FREE FROM CHEESE CRACKERS 1 2.121 2TESCO FREE FROM COOKIES COCONUT 1 2.121 2TESCO FREE FROM GINGER COOKIES 1 2.121 2TESCO FREE FROM MILK CHOCOLATE COOKIES I 2.121 2TESCO FREE FROM RICE CAKES APPLE & CINNAMON 1 2.121 2TESCO FREE FROM SHORTBREAD TOFFEE FUDGE 1 2.121 2TESCO FRUIT BAKE ORGANIC 2 2.121 2TESCO FRUIT SHORTCAKE 2 2.121 2TESCO GARIBALDI 2 2.121 2TESCO GINGER NUTS 1 2.121 2TESCO HIGH BAKED WATER BISCUITS 1 2.121 2TESCO JAFFA CAKES 2 2.121 2TESCO JAFFA CAKES MINI 2 2.121 2TESCO LOW FAT CUSTARD CREAMS 2 2.121 2TESCO LOW SUGAR SHORTBREAD ROUNDS 1 2.121 2TESCO MALTED MILK 1 2.121 2TESCO MALTED MILK CHOCOLATE 2 2.121 2TESCO MALTED MILK CHOCOLATE COVERED 2 2.121 2TESCO NICE 1 2.121 2TESCO ORGANIC DIGESTIVE 1 2.121 2TESCO ORGANIC GINGER CRUNCH 1 2.121 2
392
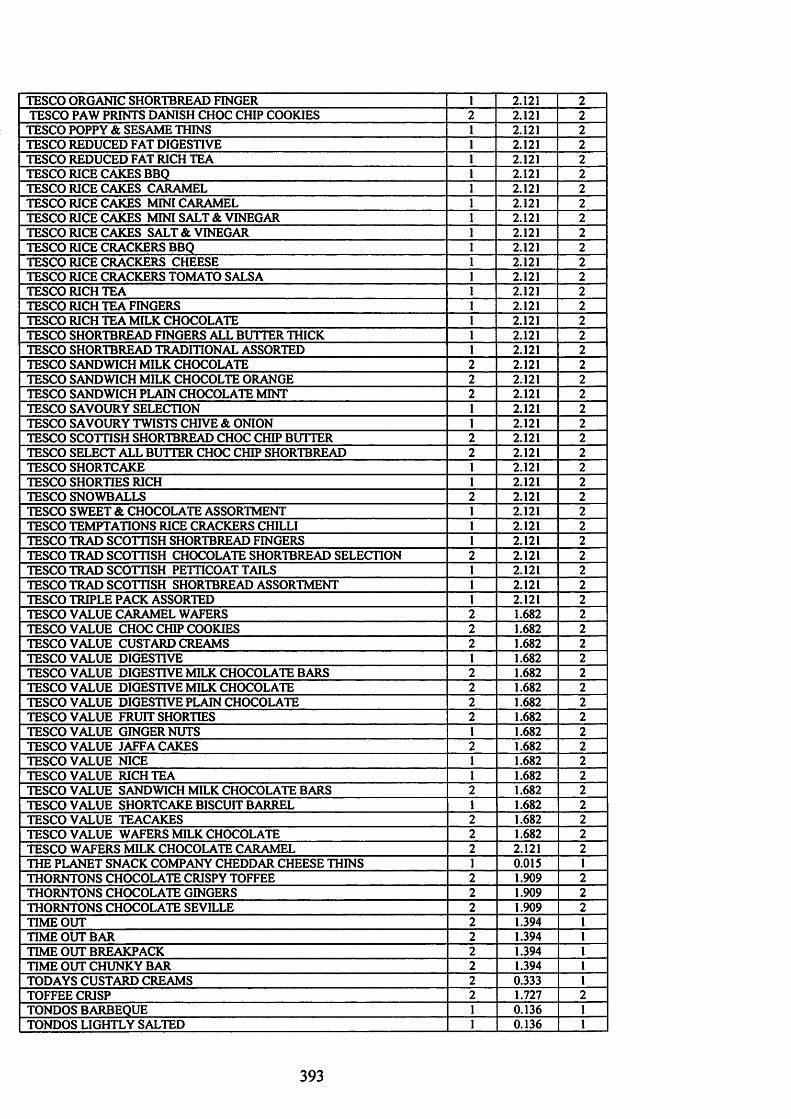
TESCO ORGANIC SHORTBREAD FINGER 1 2.121 2TESCO PAW PRINTS DANISH CHOC CHIP COOKIES 2 2.121 2TESCO POPPY & SESAME THINS 1 2.121 2TESCO REDUCED FAT DIGESTIVE 1 2.121 2TESCO REDUCED FAT RICH TEA 1 2.121 2TESCO RICE CAKES BBQ 1 2.121 2TESCO RICE CAKES CARAMEL 1 2.121 2TESCO RICE CAKES MINI CARAMEL 1 2.121 2TESCO RICE CAKES MINI SALT & VINEGAR 1 2.121 2TESCO RICE CAKES SALT & VINEGAR 1 2.121 2TESCO RICE CRACKERS BBQ 1 2.121 2TESCO RICE CRACKERS CHEESE 1 2.121 2TESCO RICE CRACKERS TOMATO SALSA 1 2.121 2TESCO RICH TEA 1 2.121 2TESCO RICH TEA FINGERS 1 2.121 2TESCO RICH TEA MILK CHOCOLATE 1 2.121 2TESCO SHORTBREAD FINGERS ALL BUTTER THICK 1 2.121 2TESCO SHORTBREAD TRADITIONAL ASSORTED 1 2.121 2TESCO SANDWICH MILK CHOCOLATE 2 2.121 2TESCO SANDWICH MILK CHOCOLTE ORANGE 2 2.121 2TESCO SANDWICH PLAIN CHOCOLATE MINT 2 2.121 2TESCO SAVOURY SELECTION 1 2.121 2TESCO SAVOURY TWISTS CHIVE & ONION 1 2.121 2TESCO SCOTTISH SHORTBREAD CHOC CHIP BUTTER 2 2.121 2TESCO SELECT ALL BUTTER CHOC CHIP SHORTBREAD 2 2.121 2TESCO SHORTCAKE 1 2.121 2TESCO SHORTIES RICH 1 2.121 2TESCO SNOWBALLS 2 2.121 2TESCO SWEET & CHOCOLATE ASSORTMENT 1 2.121 2TESCO TEMPTATIONS RICE CRACKERS CHILLI 1 2.121 2TESCO TRAD SCOTTISH SHORTBREAD FINGERS 1 2.121 2TESCO TRAD SCOTTISH CHOCOLATE SHORTBREAD SELECTION 2 2.121 2TESCO TRAD SCOTTISH PETTICOAT TAILS 1 2.121 2TESCO TRAD SCOTTISH SHORTBREAD ASSORTMENT 1 2.121 2TESCO TRIPLE PACK ASSORTED 1 2.121 2TESCO VALUE CARAMEL WAFERS 2 1.682 2TESCO VALUE CHOC CHIP COOKIES 2 1.682 2TESCO VALUE CUSTARD CREAMS 2 1.682 2TESCO VALUE DIGESTIVE 1 1.682 2TESCO VALUE DIGESTIVE MILK CHOCOLATE BARS 2 1.682 2TESCO VALUE DIGESTIVE MILK CHOCOLATE 2 1.682 2TESCO VALUE DIGESTIVE PLAIN CHOCOLATE 2 1.682 2TESCO VALUE FRUIT SHORTIES 2 1.682 2TESCO VALUE GINGER NUTS 1 1.682 2TESCO VALUE JAFFA CAKES 2 1.682 2TESCO VALUE NICE 1 1.682 2TESCO VALUE RICH TEA 1 1.682 2TESCO VALUE SANDWICH MILK CHOCOLATE BARS 2 1.682 2TESCO VALUE SHORTCAKE BISCUIT BARREL 1 1.682 2TESCO VALUE TEACAKES 2 1.682 2TESCO VALUE WAFERS MILK CHOCOLATE 2 1.682 2TESCO WAFERS MILK CHOCOLATE CARAMEL 2 2.121 2THE PLANET SNACK COMPANY CHEDDAR CHEESE THINS 1 0.015 1THORNTONS CHOCOLATE CRISPY TOFFEE 2 1.909 2THORNTONS CHOCOLATE GINGERS 2 1.909 2THORNTONS CHOCOLATE SEVILLE 2 1.909 2TIMEOUT 2 1.394 1TIME OUT BAR 2 1.394 1TIME OUT BREAKPACK 2 1.394 1TIME OUT CHUNKY BAR 2 1.394 1TODAYS CUSTARD CREAMS 2 0.333 1TOFFEE CRISP 2 1.727TONDOS BARBEQUE 1 0.136 1TONDOS LIGHTLY SALTED 1 0.136 1
393
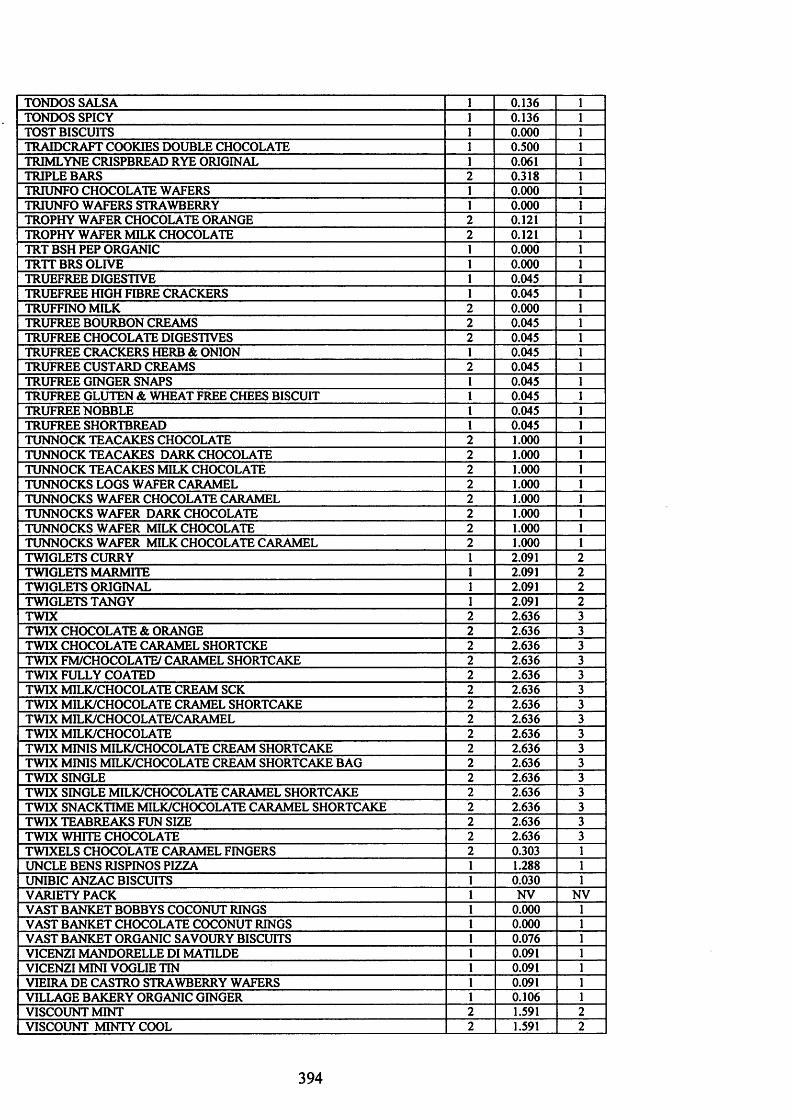
TONDOS SALSA 1 0.136 1TONDOS SPICY 1 0.136 1TOST BISCUITS 1 0.000 1TRAIDCRAFT COOKIES DOUBLE CHOCOLATE 1 0.500 1TRIMLYNE CRISPBREAD RYE ORIGINAL 1 0.061 1TRIPLE BARS 2 0.318 1TRIUNFO CHOCOLATE WAFERS 1 0.000 1TRIUNFO WAFERS STRAWBERRY 1 0.000 1TROPHY WAFER CHOCOLATE ORANGE 2 0.121 1TROPHY WAFER MILK CHOCOLATE 2 0.121 1TRT BSH PEP ORGANIC 1 0.000 1TRTTBRS OLIVE 1 0.000 1TRUEFREE DIGESTIVE 1 0.045 1TRUEFREE HIGH FIBRE CRACKERS 1 0.045 1TRUFFINO MILK 2 0.000 1TRUFREE BOURBON CREAMS 2 0.045 1TRUFREE CHOCOLATE DIGESTIVES 2 0.045 1TRUFREE CRACKERS HERB & ONION 1 0.045 1TRUFREE CUSTARD CREAMS 2 0.045 1TRUFREE GINGER SNAPS 1 0.045 1TRUFREE GLUTEN & WHEAT FREE CHEES BISCUIT 1 0.045 1TRUFREE NOBBLE 1 0.045 1TRUFREE SHORTBREAD 1 0.045 1TUNNOCK TEACAKES CHOCOLATE 2 1.000 1TUNNOCK TEACAKES DARK CHOCOLATE 2 1.000 1TUNNOCK TEACAKES MILK CHOCOLATE 2 1.000 1TUNNOCKS LOGS WAFER CARAMEL 2 1.000 1TUNNOCKS WAFER CHOCOLATE CARAMEL 2 1.000 1TUNNOCKS WAFER DARK CHOCOLATE 2 1.000 1TUNNOCKS WAFER MILK CHOCOLATE 2 1.000 1TUNNOCKS WAFER MILK CHOCOLATE CARAMEL 2 1.000 1TWIGLETS CURRY 1 2.091 2TWIGLETS MARMITE 1 2.091 2TWIGLETS ORIGINAL 1 2.091 2TWIGLETS TANGY 1 2.091 2TWIX 2 2.636 3TWIX CHOCOLATE & ORANGE 2 2.636 3TWIX CHOCOLATE CARAMEL SHORTCKE 2 2.636 3TWIX FM/CHOCOLATE/ CARAMEL SHORTCAKE 2 2.636 3TWIX FULLY COATED 2 2.636 3TWIX MILK/CHOCOLATE CREAM SCK 2 2.636 3TWIX MILK/CHOCOLATE CRAMEL SHORTCAKE 2 2.636 3TWIX MILK/CHOCOLATE/CARAMEL 2 2.636 3TWIX MILK/CHOCOLATE 2 2.636 3TWIX MINIS MILK/CHOCOLATE CREAM SHORTCAKE 2 2.636 3TWIX MINIS MILK/CHOCOLATE CREAM SHORTCAKE BAG 2 2.636 3TWIX SINGLE 2 2.636 3TWIX SINGLE MILK/CHOCOLATE CARAMEL SHORTCAKE 2 2.636 3TWIX SNACKTIME MILK/CHOCOLATE CARAMEL SHORTCAKE 2 2.636 3TWIX TEABREAKS FUN SIZE 2 2.636 3TWIX WHITE CHOCOLATE 2 2.636 3TWIXELS CHOCOLATE CARAMEL FINGERS 2 0.303 1UNCLE BENS RISPINOS PIZZA 1 1.288 1UNIBIC ANZAC BISCUITS 1 0.030 1VARIETY PACK 1 NV NVVAST BANKET BOBBYS COCONUT RINGS 1 0.000 1VAST BANKET CHOCOLATE COCONUT RINGS 1 0.000 1VAST BANKET ORGANIC SAVOURY BISCUITS 1 0.076 1VICENZIMANDORELLE DIMATILDE 1 0.091 1VICENZI MINI VOGLIE TIN 1 0.091 1VIEIRA DE CASTRO STRAWBERRY WAFERS 1 0.091 1VILLAGE BAKERY ORGANIC GINGER 1 0.106 1VISCOUNT MINT 2 1.591 2VISCOUNT MINTY COOL 2 1.591 2
394

VISCOUNT ORANGE 2 1.591 2VISCOUNT PRALINE 2 1.591 2WAFER BISCUIT 1 NV NVWAFER HAZELNUT 1 NV NVWAFER ORANGE 1 NV NVWAFER CHOCOLATE SANDWICH 1 NV NVWAGON WHEELS 2 1.848 2WAGON WHEELS CHOCOLATE 2 1.848 2WAGON WHEELS JAMMIE 2 1.848 2WAGON WHEELS MARSHMALLOW BISCUIT 2 1.848 2WAGON WHEELS ORIGINAL 2 1.848 2WAGON WHEELS VARIETY 2 1.848 2WAITROSE ALL BUTTER 1 1.697 2WAITROSE ALMOND 1 1.697 2WAITROSE BISCUITS FOR CHEESE 1 1.697 2WAITROSE BOURBON 1 1.697 2WAITROSE BOURBON CREAMS 1 1.697 2WAITROSE BREAK TIME MILK CHOCOLATE 1 1.697 2WAITROSE BREAK TIME WAFER PLAIN CHOCOLATE 1 1.697 2WAITROSE BUTTER MILK CHOCOLATE 1 1.697 2WAITROSE BUTTER PLAIN CHOCOLATE 1 1.697 2WAITROSE CELEREY SEED BISCUIT 1 1.697 2WAITROSE CHEESE SANDWICH 1 1.697 2WAITROSE CHEESE SAVOURIES 1 1.697 2WAITROSE CHEESE THINS 1 1.697 2WAITROSECHOC CHIP & GINGER 1.697 2WAITROSE COOKIES CHOCOLATE CHUNK 1 1.697 2WAITROSE COOKIES STEM GINGER 1 1.697 2WAITROSE CREAM CRACKERS 1 1.697 2WAITROSE CUSTARD CREAMS 1.697 2WAITROSE DIGESTIVE 1 1.697 2WAITROSE DIGESTIVE REDUCED FAT 1 1.697 2WAITROSE DIGESTIVE MILK CHOCOLATE 2 1.697 2WAITROSE DIGESTIVE PLAIN CHOCOLATE 2 1.697 2WAITROSE GARIBALDI 2 1.697 2WAITROSE HIGH BAKED WATER BISCUIT 1 1.697 2WAITROSE HIGHLAND SHORTIES RICH 1 1.697 2WAITROSE JAM SANDWICH CREAMS 1.697 2WAITROSE LOW FAT RICH TEA 1 1.697 2WAITROSE MALTED MILK 1 1.697 2WAITROSE MALTED MILK CHOCOLATE 1.697 2WAITROSE MINI TWISTS CRUSHED CHILLI 1 1.697 2WAITROSE NICE 1 1.697 2WAITROSE ORGANIC SHORTCAKE 1 1.697 2WAITROSE PETITS FOURS 1.697 2WAITROSE POPPY SEED THINS 1 1.697 2WAITROSE PRF BL ORIGINAL LOW SALTED RICE CAKES 1 1.697 2WAITROSE PRF BL ORIGINAL NO SALT RICE CAKES 1 1.697 2WAITROSE RED FAT COOKIES STEM GINGER 1 1.697 2WAITROSE RICH TEA 1 1.697 2WAITROSE RICH TEA FINGERS 1 1.697 2WAITROSE SHGORTBREAD CHO CHIP 1.697 2WAITROSE SHORTBREAD PETTICOAT TAILS 1 1.697 2WAITROSE SCOTTISH SHORTBREAD SELECTION 1 1.697 2WAITROSE SESAME BISCUITS 1 1.697 2WAITROSE SHORTBREAD CHOCOLATE SELECTIONS 1 1.697 2WAITROSE SHORTBREAD FINGERS 1 1.697 2WAITROSE SHORTBREAD STEM GINGER 1 1.697 2WAITROSE SHORTCAKE 1 1.697 2WAITROSE SHORTBREAD FINGERS BUTTER CRUMBLY 1 1.697 2WAITROSE TRAYBAKE CARAMEL SHORTCAKE 1 1.697 2WAITROSE TWISTS GRUYERE CHEESE 1 1.697 2WAITROSE TWISTS RED PEPPER & TOMATO 1 1.697 2WALKERS CARTON SHORTBREAD 1 1.697 2
395
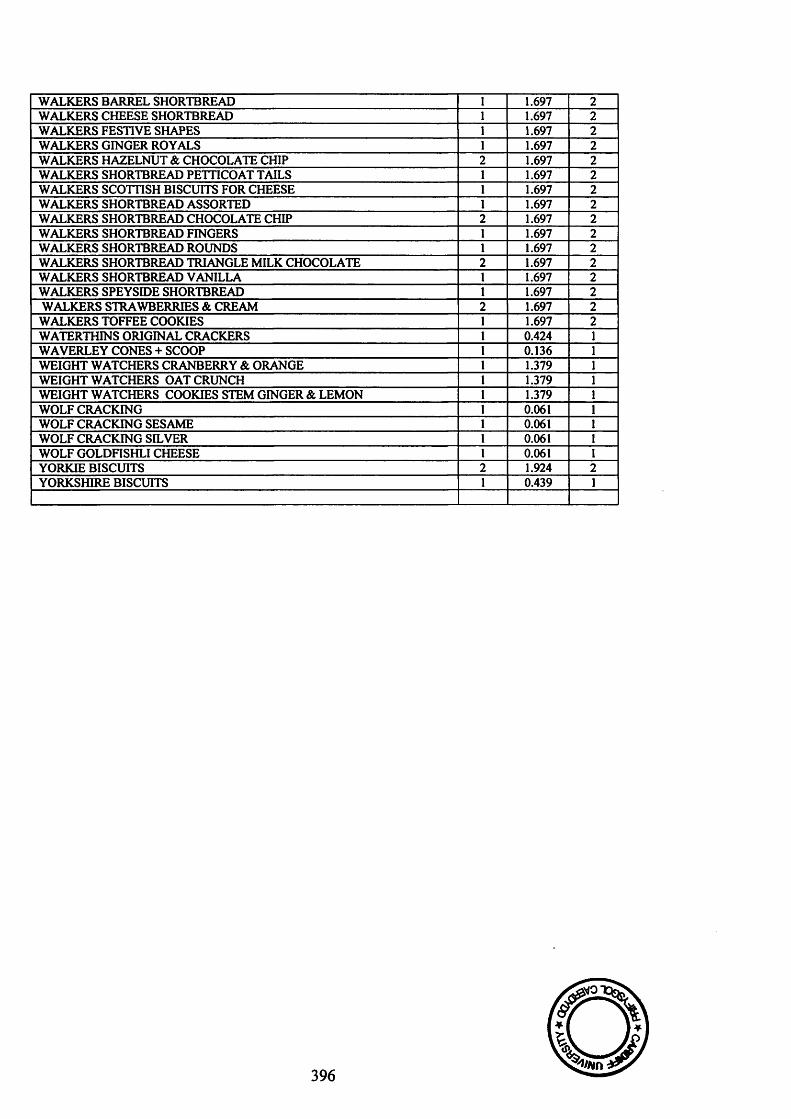
WALKERS BARREL SHORTBREAD 1 1.697 2WALKERS CHEESE SHORTBREAD 1 1.697 2WALKERS FESTIVE SHAPES 1 1.697 2WALKERS GINGER ROYALS 1 1.697 2WALKERS HAZELNUT & CHOCOLATE CHIP 1.697 2WALKERS SHORTBREAD PETTICOAT TAILS 1 1.697 2WALKERS SCOTTISH BISCUITS FOR CHEESE 1 1.697 2WALKERS SHORTBREAD ASSORTED 1 1.697 2WALKERS SHORTBREAD CHOCOLATE CHIP 1.697 2WALKERS SHORTBREAD FINGERS 1 1.697 2WALKERS SHORTBREAD ROUNDS 1 1.697 2WALKERS SHORTBREAD TRIANGLE MILK CHOCOLATE 1.697 2WALKERS SHORTBREAD VANILLA 1 1.697 2WALKERS SPEYSIDE SHORTBREAD 1 1.697 2WALKERS STRAWBERRIES & CREAM 1.697 2WALKERS TOFFEE COOKIES 1 1.697 2WATERTHINS ORIGINAL CRACKERS 1 0.424 1WAVERLEY CONES + SCOOP 1 0.136 1WEIGHT WATCHERS CRANBERRY & ORANGE 1 1.379 1WEIGHT WATCHERS OAT CRUNCH 1 1.379 1WEIGHT WATCHERS COOKIES STEM GINGER & LEMON 1 1.379 1WOLF CRACKING 1 0.061 1WOLF CRACKING SESAME 1 0.061 1WOLF CRACKING SILVER 1 0.061 1WOLF GOLDFISHLI CHEESE 1 0.061 1YORKIE BISCUITS 2 1.924 2YORKSHIRE BISCUITS 1 0.439 1
396