Brief review: Neuromuscular monitoring: an update for the clinician
Upload
independentCategory
view
0download
0
2401
Physiological Measurement
An electromyographic-based test for estimating neuromuscular fatigue during incremental treadmill running
Clayton L Camic1,4,5, Attila J Kovacs1, Evan A Enquist2, Trisha A VanDusseldorp3, Ethan C Hill1, Austin M Calantoni1 and Allison J Yemm1
1 Human Performance Laboratory, Exercise and Sport Science, University of Wisconsin-La Crosse, La Crosse, Wisconsin 54601, USA2 Department of Kinesiology, University of Alabama, Tuscaloosa, Alabama 35487, USA3 Department of Health, Exercise, and Sport Sciences, University of New Mexico, Albuquerque, New Mexico 87131, USA
E-mail: [email protected]
Received 16 April 2014, revised 28 August 2014Accepted for publication 29 August 2014Published 12 November 2014
AbstractThe purposes of the present study were two fold: (1) to determine if the model used for estimating the physical working capacity at the fatigue threshold (PWCFT) from electromyographic (EMG) amplitude data during incremental cycle ergometry could be applied to treadmill running to derive a new neuromuscular fatigue threshold for running, and (2) to compare the running velocities associated with the PWCFT, ventilatory threshold (VT), and respiratory compensation point (RCP). Fifteen college-aged subjects (21.5 ± 1.3 y, 68.7 ± 10.5 kg, 175.9 ± 6.7 cm) performed an incremental treadmill test to exhaustion with bipolar surface EMG signals recorded from the vastus lateralis. There were significant (p < 0.05) mean differences in running velocities between the VT (11.3 ± 1.3 km h−1) and PWCFT (14.0 ± 2.3 km h−1), VT and RCP (14.0 ± 1.8 km h−1), but not the PWCFT and RCP. The findings of the present study indicated that the PWCFT model could be applied to a single continuous, incremental treadmill test to estimate the maximal running velocity that can be maintained prior to the onset of neuromuscular fatigue. In addition, these findings suggested that the PWCFT, like the RCP, may be used to differentiate the heavy from severe domains of exercise intensity.
C L Camic et al
Printed in the UK
2401
Pmea
© 2014 Institute of Physics and engineering in medicine
2014
35
Physiol. meas.
Pmea
0967-3334
10.1088/0967-3334/35/12/2401
Papers
2401
2413
Physiological measurement
Institute of Physics and Engineering in Medicine
IOP
4 Author to whom any correspondence should be addressed.5 Correspondence address: Exercise and Sport Science, 142 Mitchell Hall, University of Wisconsin-La Crosse, La Crosse, WI 54601, USA.
0967-3334/14/122401+13$33.00 © 2014 Institute of Physics and Engineering in Medicine Printed in the UK
Physiol. Meas. 35 (2014) 2401–2413 doi:10.1088/0967-3334/35/12/2401
C L Camic et al
2402
Physiol. Meas. 35 (2014) 2401
Keywords: PWCFT, EMG, VT, respiratory compensation, exercise intensity domains
(Some figures may appear in colour only in the online journal)
1. Introduction
Fatigue has been described as an acute reduction in the ability to produce force that leads to impaired exercise performance, even if the force can be temporarily maintained (Enoka and Stuart 1992). Based on the physiological responses that cause or accompany this impairment, a number of fatigue thresholds have been developed to demarcate fatiguing from non-fatigu-ing work and other practical applications (deVries et al 1982, Gaesser and Poole 1996, Camic et al 2010a). For example, fatigue thresholds derived from ventilatory responses reflect, in part, exercise-induced changes in metabolism and are commonly used to differentiate the exercise-intensity domains (i.e. moderate, heavy, and severe). In particular, the ventilatory threshold (VT) is characterized by disproportionate increases in carbon dioxide production (V· CO2) relative to oxygen consumption (V· O2) (Beaver et al 1986) and identifies the bound-ary between the moderate and heavy domains of exercise intensity (Gaesser and Poole 1996). The respiratory compensation point (RCP), however, is defined as the breakpoint in the min-ute ventilation (V· E) versus V· CO2 relationship (Beaver et al 1986) and marks the boundary between the heavy and severe exercise-intensity domains (Gaesser and Poole 1996). These domains are typically described by changes in V· O2 and blood lactate during continuous, con-stant power output exercise (Gaesser and Poole 1996). Specifically, during continuous exercise within the moderate exercise-intensity domain, V· O2 reaches a steady state and blood lactate levels remain near resting values (Gaesser and Poole 1996, Bergstrom et al 2013). Within the heavy exercise-intensity domain, continuous exercise leads to significant increases in V· O2 and blood lactate concentrations that do not reach a steady state prior to 10–20 min (Gaesser and Poole 1996, Bergstrom et al 2013). For exercise within the severe domain, however, V· O2 and lactate fail to stabilize and V· O2 is driven to its maximal value (Gaesser and Poole 1996). Therefore, as boundary markers of these domains, the VT and RCP serve as useful indicators of fatigue-related changes in physiology that can lead to impaired performance and the ces-sation of exercise.
Previous investigations have also utilized electromyographic (EMG) techniques to identify the exercise intensity associated with the onset of neuromuscular fatigue during various types of exercise (deVries et al 1982, 1987, 1990, Hendrix et al 2009, Camic et al 2010a). For exam-ple, the electromyographic fatigue threshold (EMGFT) test proposed by deVries et al (1982) estimates the exercise intensity (i.e. power output) associated with the onset of neuromuscular fatigue from four discontinuous rides on a cycle ergometer at different workloads. In particu-lar, the EMGFT test involves determination of the slope coefficients for the EMG amplitude versus time relationships from the four rides at different power outputs. These power outputs are then plotted as a function of the slope coefficients and the y intercept is defined as the EMGFT. The physical working capacity at the fatigue threshold (PWCFT) test, however, is determined by EMG amplitude fatigue curves during a single continuous, incremental test on a cycle ergometer (deVries et al 1990). Based on increases in EMG amplitude (i.e. root mean square, rms), the PWCFT provides information related to fatigue-induced increases in motor unit recruitment, firing rate and synchronization. Specifically, the PWCFT is determined by recording, quantifying and plotting EMG amplitude values across time during each 2 min stage of an incremental test to exhaustion. The PWCFT is then defined as the average of the highest power output that results in a non-significant slope coefficient for the EMG amplitude
C L Camic et al
2403
Physiol. Meas. 35 (2014) 2401
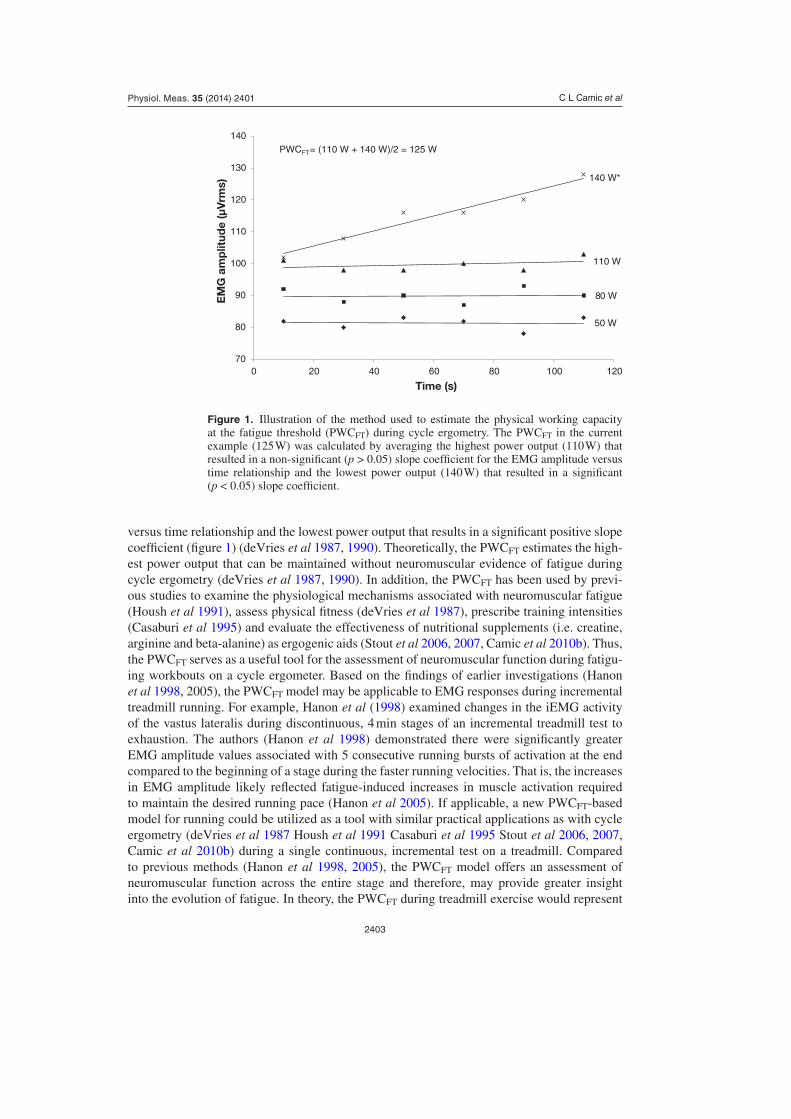
versus time relationship and the lowest power output that results in a significant positive slope coefficient (figure 1) (deVries et al 1987, 1990). Theoretically, the PWCFT estimates the high-est power output that can be maintained without neuromuscular evidence of fatigue during cycle ergometry (deVries et al 1987, 1990). In addition, the PWCFT has been used by previ-ous studies to examine the physiological mechanisms associated with neuromuscular fatigue (Housh et al 1991), assess physical fitness (deVries et al 1987), prescribe training intensities (Casaburi et al 1995) and evaluate the effectiveness of nutritional supplements (i.e. creatine, arginine and beta-alanine) as ergogenic aids (Stout et al 2006, 2007, Camic et al 2010b). Thus, the PWCFT serves as a useful tool for the assessment of neuromuscular function during fatigu-ing workbouts on a cycle ergometer. Based on the findings of earlier investigations (Hanon et al 1998, 2005), the PWCFT model may be applicable to EMG responses during incremental treadmill running. For example, Hanon et al (1998) examined changes in the iEMG activity of the vastus lateralis during discontinuous, 4 min stages of an incremental treadmill test to exhaustion. The authors (Hanon et al 1998) demonstrated there were significantly greater EMG amplitude values associated with 5 consecutive running bursts of activation at the end compared to the beginning of a stage during the faster running velocities. That is, the increases in EMG amplitude likely reflected fatigue-induced increases in muscle activation required to maintain the desired running pace (Hanon et al 2005). If applicable, a new PWCFT-based model for running could be utilized as a tool with similar practical applications as with cycle ergometry (deVries et al 1987 Housh et al 1991 Casaburi et al 1995 Stout et al 2006, 2007, Camic et al 2010b) during a single continuous, incremental test on a treadmill. Compared to previous methods (Hanon et al 1998, 2005), the PWCFT model offers an assessment of neuromuscular function across the entire stage and therefore, may provide greater insight into the evolution of fatigue. In theory, the PWCFT during treadmill exercise would represent
Figure 1. Illustration of the method used to estimate the physical working capacity at the fatigue threshold (PWCFT) during cycle ergometry. The PWCFT in the current example (125 W) was calculated by averaging the highest power output (110 W) that resulted in a non-significant (p > 0.05) slope coefficient for the EMG amplitude versus time relationship and the lowest power output (140 W) that resulted in a significant (p < 0.05) slope coefficient.
70
80
90
100
110
120
130
140
0 20 40 60 80 100 120
EM
G a
mp
litud
e (µ
Vrm
s)
Time (s)
50 W
140 W*
110 W
80 W
PWCFT= (110 W + 140 W)/2 = 125 W
C L Camic et al
2404
Physiol. Meas. 35 (2014) 2401
the maximal running velocity that could be sustained for an extended period of time with-out fatigue-induced increases in the muscle activation. Therefore, the purposes of the present study were twofold: (1) to determine if the model used for estimating the PWCFT from EMG amplitude data during incremental cycle ergometry could be applied to treadmill running to derive a new neuromuscular fatigue threshold for running and (2) to compare the running velocities associated with the PWCFT, VT and RCP.
2. Methods
2.1. Subjects
Fifteen college-aged males (mean age ± SD = 21.8 ± 1.3 y, body mass = 75.0 ± 7.9 kg, height = 179.7 ± 5.1 cm, n = 9) and females (21.0 ± 1.3 y, 59.4 ± 5.8 kg, 170.1 ± 4.3 cm, n = 6) volunteered to participate in this investigation. According to the American College of Sports Medicine (Thompson et al 2010), the subjects were defined as recreationally-trained (6.5 ± 3.7 aerobic training hours per week, 43.1 ± 35.7 running kilometers per week, 2.9 ± 2.3 resistance training hours per week) and had no known cardiovascular, pulmonary, metabolic, muscular and/or coronary heart disease, or regularly used prescription medication. Each subject visited the laboratory on two occasions (separated by at least 48 h) and was instructed to: 1) maintain normal dietary and sleep patterns during the course of the study and 2) avoid exercise for 48 h, caffeine and alcohol for 24 h and food intake for 3 h prior to each visit. The study was approved by the University Institutional Review Board for Human Subjects and all subjects completed a health history questionnaire and signed a written informed consent prior to testing.
2.2. Incremental treadmill tests
The first laboratory visit was structured as an orientation session to familiarize the subjects with the testing procedures (i.e. measurement of gas exchange and EMG while running on a tread-mill). This orientation required that each subject perform an incremental test on a treadmill (Fitnex Fitness Equipment, Inc, Dallas, TX) that began at 4.8 km h−1 and increased 1.6 km h−1 every 2 min. Following the 12.9 km h−1 stage, the grade was increased 2.5% every 2 min until the subject achieved approximately 90% of their age-predicted maximal heart rate. During the second laboratory visit, each subject performed an incremental test to exhaustion for the deter-mination of PWCFT, VT, RCP and V·O2peak. This incremental treadmill test involved a standard warm-up of walking at 4.8–6.4 km h−1 for 4 min. Immediately following the warm-up, the test began at 9.7 km h−1 and increased 1.6 km h−1 every 2 min until volitional fatigue. The grade remained constant at 1.0% during the incremental test to exhaustion and was selected to repre-sent the energy cost that is typically experienced by running outdoors (Jones and Doust 1996).
2.3. Determination of V· O2peak
All subjects wore a nose clip and breathed through a two-way valve (2700, Hans Rudolph, Kansas City, MO) during the incremental tests. Expired gas samples were collected and ana-lyzed using a calibrated (AEI Moxus) metabolic cart (AEI Technologies, Inc, Pittsburgh, PA) with O2, CO2 and ventilatory parameters expressed as 30 s averages. Each subject was also fitted with a Polar Heart Watch system (Polar Electro Inc, Lake Success, NY) to monitor heart rate throughout the test. V· O2peak was defined as the highest V· O2 value in the last 30 s of the exercise test that met at least two of the following three criteria (Day et al 2003): (1) 90% of age-predicted maximum heart rate, (2) respiratory exchange ratio > 1.1 and (3) a plateau of
C L Camic et al
2405
Physiol. Meas. 35 (2014) 2401
oxygen uptake (less than 150 mL min−1 in V· O2 over the last 30 s of the test). The test-retest reliability for V· O2peak testing from our laboratory indicated the intraclass correlation coef-ficient (ICC) was R = 0.95 and the standard error of measurement (Harvill 1991) (SEm) = 97 mL min−1, with no significant (p < 0.05) mean difference between test and re-test values.
2.4. Determination of VT and RCP
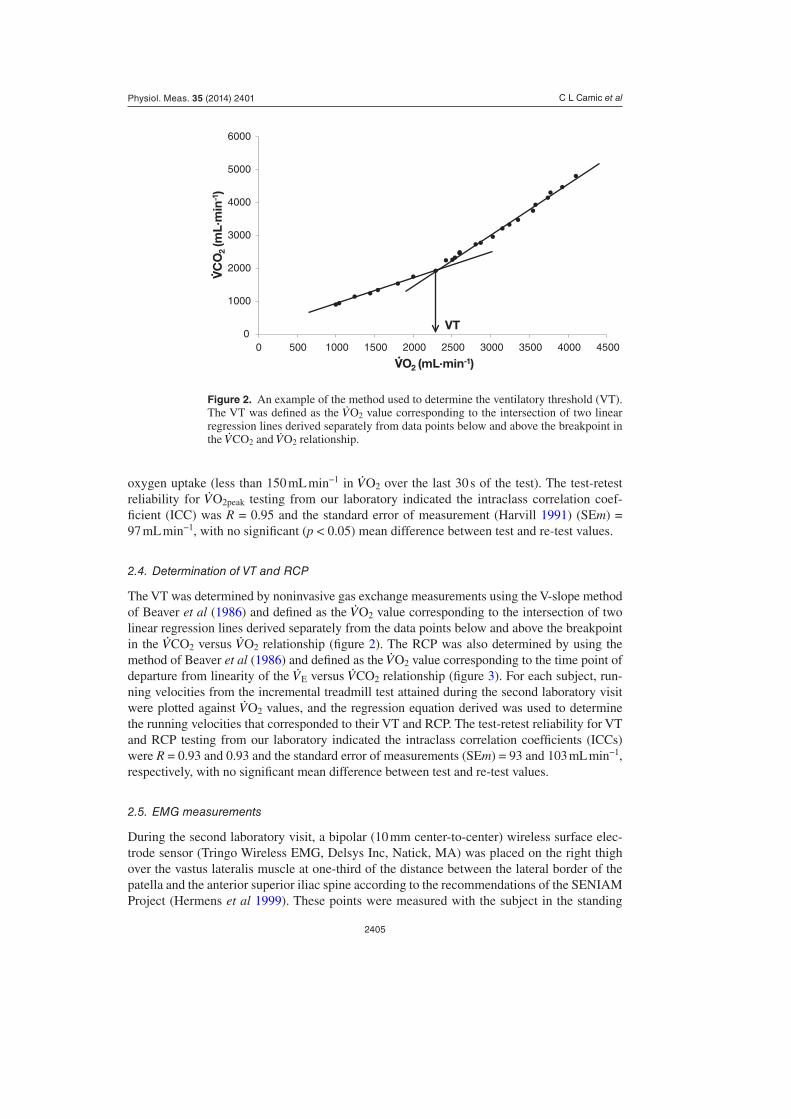
The VT was determined by noninvasive gas exchange measurements using the V-slope method of Beaver et al (1986) and defined as the V·O2 value corresponding to the intersection of two linear regression lines derived separately from the data points below and above the breakpoint in the V·CO2 versus V·O2 relationship (figure 2). The RCP was also determined by using the method of Beaver et al (1986) and defined as the V·O2 value corresponding to the time point of departure from linearity of the V· E versus V·CO2 relationship (figure 3). For each subject, run-ning velocities from the incremental treadmill test attained during the second laboratory visit were plotted against V·O2 values, and the regression equation derived was used to determine the running velocities that corresponded to their VT and RCP. The test-retest reliability for VT and RCP testing from our laboratory indicated the intraclass correlation coefficients (ICCs) were R = 0.93 and 0.93 and the standard error of measurements (SEm) = 93 and 103 mL min−1, respectively, with no significant mean difference between test and re-test values.
2.5. EMG measurements
During the second laboratory visit, a bipolar (10 mm center-to-center) wireless surface elec-trode sensor (Tringo Wireless EMG, Delsys Inc, Natick, MA) was placed on the right thigh over the vastus lateralis muscle at one-third of the distance between the lateral border of the patella and the anterior superior iliac spine according to the recommendations of the SENIAM Project (Hermens et al 1999). These points were measured with the subject in the standing
Figure 2. An example of the method used to determine the ventilatory threshold (VT). The VT was defined as the V·O2 value corresponding to the intersection of two linear regression lines derived separately from data points below and above the breakpoint in the V·CO2 and V·O2 relationship.
0
1000
2000
3000
4000
5000
6000
0 500 1000 1500 2000 2500 3000 3500 4000 4500
VC
O2
(mL·
min
-1)
VO2 (mL·min-1)·
·
VT

C L Camic et al
2406
Physiol. Meas. 35 (2014) 2401
position and the dominant leg fully extended. In addition, the electrode-placement site was located 5 cm lateral to the reference line (i.e. between the lateral border of the patella to the anterior superior iliac spine) so that the wireless electrode sensor would lie over the vastus lateralis muscle (Malek et al 2006). A standard goniometer (Smith and Nephew Rolyan, Inc, Menomonee Falls, WI) was used to orient the electrodes at a 20° angle to the reference line to approximate the pennation angle of the vastus lateralis (Camic et al 2011). Prior to elec-trode placement, the skin at the electrode site was shaved, carefully abraded with gauze, and cleaned with alcohol. The EMG signals were amplified (gain: × 1000) (Tringo Wireless EMG, Delsys Inc, Natick, MA, bandwidth = 20–450 Hz), sampled at 2000 Hz, recorded continuously throughout the incremental test and stored in a personal computer (Latitude E6540, Dell, Inc, Round Rock, TX) for subsequent analyses.
2.6. Determination of PWCFT
The PWCFT values were determined using the model of deVries et al (1987). During each two minute stage of the incremental treadmill test, six, 10 s EMG samples were selected from the signal (10–20, 30–40, 50–60, 70–80, 90–100, 110–120 s). The EMG amplitude (microvolts root mean square, µ Vrms) values were calculated for each of the 10 s epochs (MATLAB, Mathworks) and separately plotted across time for each stage (i.e. running velocity) of the test (figure 4). The PWCFT was determined by averaging the highest running velocity that resulted in a non-significant (p > 0.05, single-tailed t-test) slope coefficient for the EMG amplitude ver-sus time relationship, with the lowest running velocity that resulted in a significant (p < 0.05) positive slope coefficient (figure 4).
2.7. Signal processing
All signal processing was performed using custom programs, which were written with MATLAB programming software (version 8.2, Mathworks, Natick, MA). The EMG signals were digitally bandpass filtered (fourth-order Butterworth) at 20–450 Hz.
Figure 3. An example of the method used to determine the respiratory compensation point (RCP). The RCP was defined as the V·O2 value corresponding to the time point of departure from linearity of the minute ventilation (V· E) and V·CO2 relationship.
0
20
40
60
80
100
120
140
0 1000 2000 3000 4000 5000 6000
V E(L
·min
-1)
VCO2 (mL·min-1)·
·RCP

C L Camic et al
2407
Physiol. Meas. 35 (2014) 2401
2.8. Statistical analyses
Mean ± SD values were calculated for PWCFT, VT, RCP and V· O2peak. The relationships for EMG amplitude versus time for each subject and running velocity were examined using linear regression (SPSS software program, Chicago, IL). A one-way repeated-measures ANOVA was also used to determine whether there were significant mean differences in running veloci-ties among the PWCFT, VT, and RCP. Follow-up post hoc analyses included paired t-tests with Bonferroni correction (0.05/3 = 0.0167). A zero-order correlation matrix was used to determine the relationships among PWCFT, VT and RCP. An alpha of p < 0.05 was consid-ered statistically significant for the one-way repeated-measures ANOVA and all zero-order correlations.
3. Results
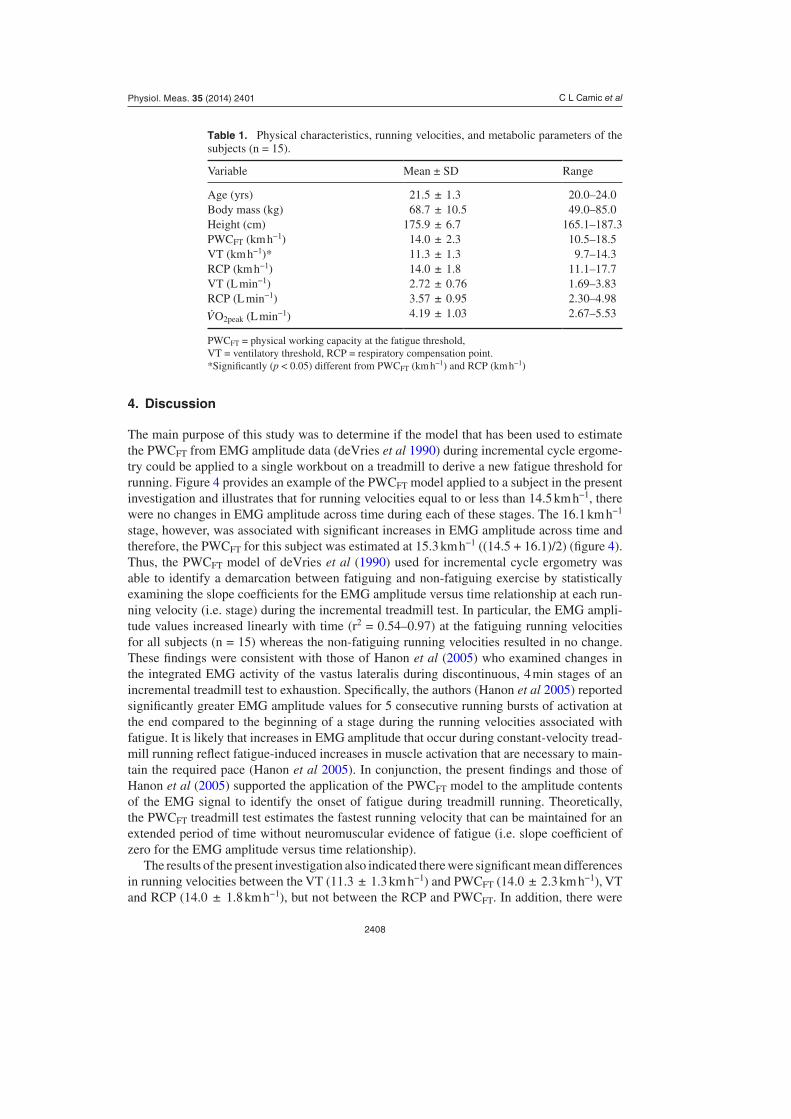
Table 1 provides mean, SD and range values for the physical characteristics, running veloci-ties and metabolic parameters of the subjects. The results of the one-way repeated-measures ANOVA and post hoc analyses indicated there were significant mean differences in running velocities between the VT (11.3 ± 1.3 km h−1) and PWCFT (14.0 ± 2.3 km h−1) and between the VT and RCP (14.0 ± 1.8 km h−1). There were no significant differences, however, between the running velocities associated with the PWCFT and RCP. In addition, there were significant zero-order correlations for PWCFT versus VT (r = 0.70), PWCFT versus RCP (r = 0.70), and VT versus RCP (r = 0.91).
Figure 4. Example of the method used to estimate the physical working capacity at the fatigue threshold (PWCFT) during treadmill running. The PWCFT in the cur-rent example (15.3 km h−1) was calculated by averaging the fastest running velocity (14.5 km h−1) that resulted in a non-significant (p > 0.05) slope coefficient for the EMG amplitude versus time relationship and the slowest running velocity (16.1 km h−1) that resulted in a significant (p < 0.05) slope coefficient. *Slope significantly (p < 0.05) greater than zero.
50
70
90
110
130
150
170
190
0 20 40 60 80 100 120
EM
G a
mp
litud
e (µ
Vrm
s)
Time (s)
17.7*
16.1*
14.5
12.9
11.3
9.7
PWCFT= (14.5 + 16.1)/2 = 15.3 km·h-1
km·h-1
C L Camic et al
2408
Physiol. Meas. 35 (2014) 2401
4. Discussion
The main purpose of this study was to determine if the model that has been used to estimate the PWCFT from EMG amplitude data (deVries et al 1990) during incremental cycle ergome-try could be applied to a single workbout on a treadmill to derive a new fatigue threshold for running. Figure 4 provides an example of the PWCFT model applied to a subject in the present investigation and illustrates that for running velocities equal to or less than 14.5 km h−1, there were no changes in EMG amplitude across time during each of these stages. The 16.1 km h−1 stage, however, was associated with significant increases in EMG amplitude across time and therefore, the PWCFT for this subject was estimated at 15.3 km h−1 ((14.5 + 16.1)/2) (figure 4). Thus, the PWCFT model of deVries et al (1990) used for incremental cycle ergometry was able to identify a demarcation between fatiguing and non-fatiguing exercise by statistically examining the slope coefficients for the EMG amplitude versus time relationship at each run-ning velocity (i.e. stage) during the incremental treadmill test. In particular, the EMG ampli-tude values increased linearly with time (r2 = 0.54–0.97) at the fatiguing running velocities for all subjects (n = 15) whereas the non-fatiguing running velocities resulted in no change. These findings were consistent with those of Hanon et al (2005) who examined changes in the integrated EMG activity of the vastus lateralis during discontinuous, 4 min stages of an incremental treadmill test to exhaustion. Specifically, the authors (Hanon et al 2005) reported significantly greater EMG amplitude values for 5 consecutive running bursts of activation at the end compared to the beginning of a stage during the running velocities associated with fatigue. It is likely that increases in EMG amplitude that occur during constant-velocity tread-mill running reflect fatigue-induced increases in muscle activation that are necessary to main-tain the required pace (Hanon et al 2005). In conjunction, the present findings and those of Hanon et al (2005) supported the application of the PWCFT model to the amplitude contents of the EMG signal to identify the onset of fatigue during treadmill running. Theoretically, the PWCFT treadmill test estimates the fastest running velocity that can be maintained for an extended period of time without neuromuscular evidence of fatigue (i.e. slope coefficient of zero for the EMG amplitude versus time relationship).
The results of the present investigation also indicated there were significant mean differences in running velocities between the VT (11.3 ± 1.3 km h−1) and PWCFT (14.0 ± 2.3 km h−1), VT and RCP (14.0 ± 1.8 km h−1), but not between the RCP and PWCFT. In addition, there were
Table 1. Physical characteristics, running velocities, and metabolic parameters of the subjects (n = 15).
Variable Mean ± SD Range
Age (yrs) 21.5 ± 1.3 20.0–24.0Body mass (kg) 68.7 ± 10.5 49.0–85.0Height (cm) 175.9 ± 6.7 165.1–187.3PWCFT (km h−1) 14.0 ± 2.3 10.5–18.5VT (km h−1)* 11.3 ± 1.3 9.7–14.3RCP (km h−1) 14.0 ± 1.8 11.1–17.7VT (L min−1) 2.72 ± 0.76 1.69–3.83RCP (L min−1) 3.57 ± 0.95 2.30–4.98
V·O2peak (L min−1) 4.19 ± 1.03 2.67–5.53
PWCFT = physical working capacity at the fatigue threshold, VT = ventilatory threshold, RCP = respiratory compensation point.*Significantly (p < 0.05) different from PWCFT (km h−1) and RCP (km h−1)
C L Camic et al
2409
Physiol. Meas. 35 (2014) 2401
significant correlations for the VT versus PWCFT (r = 0.70), VT versus RCP (r = 0.91), and RCP versus PWCFT (r = 0.70). These findings were consistent with an earlier study of Hanon et al (1998) that examined the time course among the onset of neuromuscular fatigue identi-fied through increases in EMG amplitude (iEMG threshold) and ventilatory-based fatigue thresholds during incremental treadmill running. Specifically, the authors (Hanon et al 1998) reported significant mean differences in running velocities between the VT (14 km h−1) and iEMG threshold (16 km h−1), VT and RCP (16 km h−1), but not between the RCP and iEMG threshold. Thus, the results of the current study and those of Hanon et al (1998) indicated that the onset of neuromuscular fatigue identified through EMG amplitude occurred at the same running velocity as the RCP, not the VT. Collectively, these findings may provide insight into the physiological mechanisms that underlie the determination of these fatigue thresholds as well as the practical applications of the PWCFT. For example, the VT is defined as the exercise intensity associated with the first breakpoint in the V· CO2 versus V· O2 relationship (Beaver et al 1986) and occurred at approximately 64.5 ± 4.7 % V· O2max in the current sam-ple of aerobically-trained individuals. Although the complex factors responsible for the VT are not fully understood and remain controversial (Hagberg et al 1982), it has been associ-ated with the increased ventilatory drive in response to lactic acidosis. That is, the additional ‘non-metabolic’ carbon dioxide produced from the buffering of hydrogen ions by bicarbonate further stimulates the peripheral chemoreceptors that mediate ventilation (Bergstrom et al 2013). It has also been widely proposed (Lindstrom et al 1970, Maclaren et al 1989, Stout et al 2006, Camic et al 2010a) that the accumulation of intracellular lactate, hydrogen ions, and/or subsequent decrease in pH is responsible for increases in EMG amplitude that occur with fatigue. In particular, lactic acidosis has been linked to the inhibition of key enzymes in energy metabolism (i.e. phosphorylase, phosphofructokinase), Ca++ release from the sarco-plasmic reticulum, cross-bridge formation and Ca++ binding capacity with troponin (Maclaren et al 1989, Westerblad et al 2002). Therefore, the impairments in contractile function related to lactate or hydrogen ions may necessitate the recruitment of additional motor units (Gaesser and Poole 1996), thereby increasing the amplitude contents of the EMG signal and genera-tion of the PWCFT (Stout et al 2006). Based on the difference in running velocities associated with the VT (11.3 ± 1.3 km h−1) and PWCFT (14.0 ± 2.3 km h−1) in the present investigation, however, it is unlikely that these fatigue thresholds share a common mediator (i.e. lactic aci-dosis). This suggestion is further supported by the findings of Hanon et al (1998) that demon-strated the lactate threshold (14 km h−1) coincided with the VT (14 km h−1), but not the iEMG threshold (16 km h−1). In addition, deVries et al (1987) found that the PWCFT (254 ± 74 W) during cycle ergometry occurred at a significantly greater power output than the onset of blood lactate (181 ± 33 W). It has also been established (Housh et al 1991) that manipulation of blood pH through the ingestion of ammonium chloride (257 ± 26 W) and sodium bicarbonate (256 ± 22 W) had no effect on the onset of neuromuscular fatigue as identified by the PWCFT.
Recent studies (McKenna et al 2006, Clausen 2011) have shown that factors other than lactic acid, hydrogen ions or decreased pH may influence the amplitude contents of the EMG signal responsible for the PWCFT. For example, it has been demonstrated (Renaud and Light 1992, McKenna et al 2006, Shushakov et al 2007, Clausen 2011,) that skeletal muscle contrac-tions often invoke a pronounced increased in extracellular [K+] that contributes to the devel-opment of fatigue. Specifically, the accumulation of extracellular K+ leads to depolarization of voltage-gated Na+ channels and a progressive loss of membrane excitability that impairs contractile function and force production (Clausen 2013). It has been reported (Bouclin et al 1995) that the critical [K+] value, or concentration that results in impaired contractility and abrupt decreases in force, is approximately 8–9 mM. Renaud and Light (1992), however, found that increases in extracellular [K+] prior to reaching this critical level of 8–9 mM may
C L Camic et al
2410
Physiol. Meas. 35 (2014) 2401
actually potentiate the development of force through activation of Na+-K+-ATPase. According to Shushakov et al (2007), the activation of Na+-K+-ATPase would likely ‘…counteract the depolarizing effect of the extracellular potassium elevation.’ (p 712). Therefore, it is possible that contraction-induced hyperkalemia up to the critical threshold may promote increased levels of muscle activation through additional motor unit recruitment to maintain the desired force, power or velocity. In fact, Shushakov et al (2007) demonstrated that EMG amplitude increased linearly (r = 0.87) with changes in venous K+ during dynamic, fatiguing exercise. In this manner, hyperkalemia may lead to increases in EMG amplitude associated with fatigue and therefore the PWCFT. Moreover, the findings of de Paoli et al (2007) illustrated that physi-ological factors occurring with exercise (i.e. increased lactate, epinephrine, temperature and decreased intracellular pH) increase the critical [K+] value from 8–9 mM to approximately 10–12 mM, thereby providing a protective effect on muscle excitability. Thus, it is plausible that the onset of lactic acidosis and associated changes in the VT occurred prior to extracellu-lar K+ levels reaching the critical threshold that altered membrane excitability, muscle activa-tion, EMG amplitude and the PWCFT. Future studies should further examine the relationships among metabolic byproducts/ions of muscular contraction and fatigue-induced changes in the EMG signal during incremental treadmill running.
The RCP is defined as the exercise intensity associated with the first breakpoint in the V· E versus V· CO2 relationship (Beaver et al 1986) and occurred at 84.9 ± 3.8 % V· O2max in the present sample. It has been suggested (Darabi et al 2009) that the physiological mechanism responsible for the disproportionate increase in V· E relative to V· CO2 is related to changes in extracellular and circulatory levels of K+ that stimulate central and peripheral chemoreceptors (Paterson et al 1990, Darabi et al 2009). For example, Paterson et al (1990) has shown that arterial [K+], [lactate] and V· E exhibit parallel increases during incremental cycle ergometry. Upon exhaustion, however, arterial [K+] and V· E immediately decreased in a similar manner, whereas [lactate] continued to rise and remain elevated. In addition, Paterson and Nye (1988) illustrated that the infusion of physiological levels of K+ in the anaesthetized cat stimulated increases in V· E and this effect can be eliminated with peripheral chemoreceptor denervation (Band et al 1985). These findings have led authors (Paterson and Nye 1988, Paterson et al 1990 Darabi et al 2009) to conclude that hyperkalemia, not lactic acidosis, is a major media-tor of ventilation during heavy to severe exercise. It has also been demonstrated (Darabi et al 2009) that changes in venous K+ levels with incremental cycle ergometry exhibit a breakpoint that coincides with the exercise intensity of the RCP, but not the lactate threshold. Therefore, it is possible that the PWCFT (14.0 ± 2.3 km h−1) and RCP (14.0 ± 1.8 km h−1) manifested at the same running velocity and were significantly correlated (r = 0.70) as the result of hyper-kalemia being the underlying mechanism responsible for these fatigue thresholds. In fact, the role of K+ (Kaufman and Rybicki 1987) has been identified in the potential link between the peripheral feedback of exercising muscles and factors that contribute to changes in V· E, V· CO2 and V· O2 with fatigue (Amann et al 2011). In particular, receptors on the terminal ends of thinly-myelinated (group III) and unmyelinated (group IV) muscle afferents can be acti-vated by contraction-induced mechanical and biochemical stimuli such as K+ (Kaufman and Rybicki 1987) and lactate (Rotto and Kaufman 1988). This sensory information is communi-cated via the lumbar dorsal horn of the spinal cord to various locations in the central nervous system including the motor cortex (Martin et al 2008) and has been shown to be significantly involved in the cardioventilatory reflex responses through increased sympathetic activity (i.e. increased V· E, V· CO2, V
· O2 and heart rate) (Amann et al 2011). Thus, the fatigue-sensitive group III and IV afferents provide an explanation for how increases in muscle activation, extracel-lular K+ and EMG amplitude (i.e. PWCFT) that occur with peripheral fatigue appear to directly influence fatigue reflected through ventilatory parameters (i.e. RCP).
C L Camic et al
2411
Physiol. Meas. 35 (2014) 2401
The domains of exercise intensity have been described by V· O2 and lactate responses dur-ing continuous exercise at constant power outputs or running velocities (Gaesser and Poole 1996). In addition, the boundaries of these exercise intensity domains have been identified by fatigue thresholds including the lactate threshold, maximal lactate steady state, VT, RCP, critical power and EMGFT that are based on various parameters including blood, ventilation, power outputs and EMG (Camic et al 2010a). For example, the lactate threshold, VT, GET and EMGFT have been used to demarcate the moderate from heavy domains of exercise inten-sity, whereas the RCP, critical power and maximal lactate steady state demarcate the heavy from severe (de Vries et al 1987, Gaesser and Poole 1996). In the present investigation, there was no significant mean difference between the running velocities associated with the PWCFT and RCP and they were significantly correlated. Therefore, the current findings suggested that the PWCFT, like the RCP, (1) may be used to identify the boundary between the heavy and severe domains of exercise intensity and thus, (2) represents the maximal exercise intensity that can be maintained that still results in V· O2 and lactate ultimately reaching a steady state.
5. Conclusion
In summary, the findings of the present investigation indicated that the PWCFT model of deVries et al (1990) for incremental cycle ergometry could be applied to a single workbout on a treadmill to derive a new fatigue threshold for running. The present model was based on the innovative work of Hanon et al (1998, 2005) which illustrated that fatigue could be identified through increases in EMG amplitude during discontinuous, incremental treadmill running. In the current study, the identification of neuromuscular fatigue through the PWCFT occurred at the same running velocity as the RCP, but at a faster running velocity than the VT. It is possible that these findings were attributed to different metabolic byproducts and ions of muscular contraction that independently influence these fatigue thresholds. Thus, the fatigue-induced increases in EMG amplitude (PWCFT) and ventilation with the RCP may have been due to changes in extracellular [K+] that affected ventilation and muscle activation, whereas the decreases in pH associated with lactic acidosis likely influenced the dissociation between V· CO2 and V· O2 responsible for the VT. Furthermore, the non-significant mean differ-ence between the PWCFT and RCP indicated that the manifestations of neuromuscular fatigue reflected by the amplitude contents of the EMG signal may be used to demarcate the heavy from severe exercise intensity domains during treadmill running.
References
Amann M, Blain G M, Proctor L T, Sebranek J J, Pegelow D F and Dempsey J A 2011 Implications of group III and IV muscle afferents for high-intensity endurance exercise performance in humans J. Physiol. 589 5299–309
Band D M, Linton R A, Kent R and Kurer F L 1985 The effect of peripheral chemodenervation on the ventilatory response to potassium Respir. Physiol. 60 217–25
Beaver W L, Wasserman K and Whipp B J 1986 A new method for detecting anaerobic threshold by gas exchange J. Appl. Physiol. 60 2020–7
Bergstrom H C, Housh T J, Cochrane KC, Jenkins N D, Lewis R W, Traylor D A, Zuniga J M, Schmidt R J, Johnson G O and Cramer J T 2013 An examination of neuromuscular and metabolic fatigue thresholds Physiol. Meas. 34 1253–67
Bouclin R, Charbonneau E and Renaud J M 1995 Na+ and K+ effect on contractility of frog sartorius muscle: implication for the mechanism of fatigue Am. J. Physiol. 268 C1528–36

C L Camic et al
2412
Physiol. Meas. 35 (2014) 2401
Camic C L, Housh T J, Hendrix C R, Zuniga J M, Bergstrom H C, Schmidt R J and Johnson G O 2011 The influence of the muscle fiber pennation angle and innervation zone on the identification of neuromuscular fatigue during cycle ergometry J. Electromyogr. Kinesiol. 21 33–40
Camic C L, Housh T J, Johnson G O, Hendrix C R, Zuniga J M, Mielke M and Schmidt R J 2010a An EMG frequency-based test for estimating the neuromuscular fatigue threshold during cycle ergometry Eur. J. Appl. Physiol. 108 337–45
Camic C L, Housh T J, Zuniga J M, Hendrix C R, Mielke M, Johnson G O and Schmidt R J 2010b Effects of arginine-based supplements on the physical working capacity at the fatigue threshold J. Strength Cond. Res. 24 1306–12
Casaburi R, Storer T W, Sullivan C S and Wasserman K 1995 Evaluation of blood lactate elevation as an intensity criterion for exercise training Med. Sci. Sports Exerc. 27 852–62
Clausen T 2011 In isolated skeletal muscle, excitation may increase extracellular K+ 10-fold, how can contractility be maintained? Exp. Physiol. 96 356–68
Clausen T 2013 Excitation-induced exchange of Na+, K+ and Cl− in rat EDL muscle in vitro and in vivo: physiology and pathophysiology. J. Gen. Physiol. 141 179–92
Darabi S, Dehghan M H, Refahi S and Kiani E 2009 Ventilation, potassium and lactate during incremental exercise in men athletes Res. J. Biol. Sci. 4 427–9
Day J R, Rossiter H B, Coats E M, Skasick A and Whipp B J 2003 The maximally attainable Vo2 during exercise in humans: the peak versus maximum issue J. Appl. Physiol. 95 1901–7
de Paoli F V, Overgaard K, Pedersen T H and Nielsen O B 2007 Additive protective effects of the addition of lactic acid and adrenaline on excitability and force in isolated rat skeletal muscle depressed by elevated extracellular K+ J. Physiol. 581 829–39
deVries H A, Housh T J, Johnson G O, Evans S A, Tharp G D, Housh D J and Hughes R A 1990 Factors affecting the estimation of physical working capacity at the fatigue threshold Ergonomics 33 25–33
deVries H A, Moritani T, Nagata A and Magnussen K 1982 The relation between critical power and neuromuscular fatigue as estimated from electromyographic data Ergonomics 25 783–91
deVries H A, Tichy M W, Housh T J, Smyth K D, Tichy A M and Housh D J 1987 A method for estimating physical working capacity at the fatigue threshold Ergonomics 30 1195–204
Enoka R M and Stuart D G 1992 Neurobiology of muscle fatigue J. Appl. Physiol. 72 1631–48Gaesser G A and Poole D C 1996 The slow component of oxygen uptake kinetics in humans Exerc. Sport
Sci. Rev. 24 35–71Hagberg J M, Coyle E F, Carroll J E, Miller J M, Martin W H and Brooke M H 1982 Exercise
hyperventilation in patients with McArdle’s disease J. Appl. Physiol. 52 991–4Hanon C, Thépaut-Mathieu C, Hausswirth C and Le Chevalier J M 1998 Electromyogram as an indicator
of neuromuscular fatigue during incremental exercise Eur. J. Appl. Physiol. 78 315–23Hanon C, Thépaut-Mathieu C and Vandewalle H 2005 Determination of muscular fatigue in elite runners
Eur. J. Appl. Physiol. 94 118–25Harvill L M 1991 An NCME instructional module on standard error of measurement Instruct. Top. Educ.
Meas. 10 33–41Hendrix C R, Housh T J, Johnson G O, Mielke M, Camic C L, Zuniga J M and Schmidt R J 2009 A new
EMG frequency-based fatigue threshold test J. Neurosci. Methods 181 45–51Hermens H J, Freriks B, Merletti R, Stegeman D, Blok J, Rau G, Disselhorst-Klug C and Hägg G M
1999 SENIAM European recommendations for surface electromyography: results of the SENIAM project (Enschede, Roessingh Research and Development)
Housh T J, deVries H A, Johnson G O, Evans S A and McDowell S 1991 The effect of ammonium chloride and sodium bicarbonate ingestion on the physical working capacity at the fatigue threshold Eur. J. Appl. Physiol. 62 189–92
Jones A M and Doust J H 1996 A 1% treadmill grade most accurately reflects the energetic cost of outdoor running J. Sport Sci. 14 321–7
Kaufman M P and Rybicki K J 1987 Discharge properties of group III and IV muscle afferents their responses to mechanical and metabolic stimuli Circ. Res. 61 I60–5
Lindstrom L, Magnusson R and Petersén I 1970 Muscular fatigue and action potential conduction velocity changes studied with frequency analysis of EMG signals Electromyography 10 341–56
Maclaren D P, Gibson H, Parry-Billings M and Edwards R H 1989 A review of metabolic and physiological factors in fatigue Exerc. Sport Sci. Rev. 17 29–66
Malek M, Coburn J W, Weir J P, Beck T W and Housh T J 2006 The effects of innervation zone on electromyographic amplitude and mean power frequency during incremental cycle ergometry J. Neurosci. Methods 155 126–33
C L Camic et al
2413
Physiol. Meas. 35 (2014) 2401
Martin P G, Weerakkody N, Gandevia S C and Taylor J L 2008 Group III and IV muscle afferents differentially affect the motor cortex and motoneurones in humans J. Physiol. 586 1277–89
McKenna M J, Medved I, Goodman C, Brown M J, Bjorksten A R, Murphy K T, Petersen A C, Sostaric S and Gong X 2006 N-acetylcysteine attenuates the decline in muscle Na+, K+-pump activity and delays fatigue during prolonged exercise in humans J. Physiol. 576 279–88
Paterson D J, Friedland J S, Bascom D A, Clement I D, Cunningham D A, Painter R and Robbins P A 1990 Changes in arterial K+ and ventilation during exercise in normal subjects and subjects with McArdle’s syndrome J. Physiol. 429 339–48
Paterson D J and Nye P C 1988 The effect of beta adrenergic blockade on the carotid body response to hyperkalaemia in the cat Respir. Physiol. 74 229–37
Renaud J M and Light P 1992 Effects of K+ on the twitch and tetanic contraction in the sartorius muscle of the frog, rana pipiens implication for fatigue in vivo Can. J. Physiol. Pharmacol. 70 1236–46
Rotto D M and Kaufman M P 1988 Effect of metabolic products of muscular contraction on discharge of group III and IV afferents J. Appl. Physiol. 64 2306–13
Shushakov V, Stubbe C, Peuckert A, Endeward V and Maassen N 2007 The relationships between plasma potassium, muscle excitability and fatigue during voluntary exercise in humans Exp. Physiol. 92 705–15
Stout J R, Cramer J T, Zoeller R F, Torok D, Costa P, Hoffman J R and Harris R C 2006 Effects of β-alanine supplementation on the onset of neuromuscular fatigue and ventilatory threshold in women Amino Acids 32 381–6
Stout J R, Graves S B, Cramer J T, Goldstein E R, Costa E R, Smith A E and Walter A A 2007 Effects of creatine supplementation on the onset of neuromuscular fatigue threshold and muscle strength in elderly men and women (64–86 y) J. Nutr. Health Aging 11 459–64
Thompson W R, Gordon N F and Pescatello L S 2010 American College of Sports Medicine Guidelines for Exercise Testing and Prescription 8th edn (Philadelphia, PA: Lippincott Williams and Wilkins) pp 84–7
Westerblad H, Allen D G and Lännergren J 2002 Muscle fatigue: lactic acid or inorganic phosphate the major cause? News Physiol. Sci. 17 17–21
Copyright © 2022 FDOKUMEN