Pharmacokinetic and Pharmacodynamic Comparison of Once Daily Efavirenz (400mg Versus 600mg) in...
42
Pharmacokinetic and Pharmacodynamic Comparison of Once Daily Efavirenz (400mg Versus 600mg) in Treatment-Naïve HIV-Infected Patients: Results of the ENCORE1 Study Laura Dickinson 1 , Janaki Amin 2 , Laura Else 1 , Marta Boffito 3 , Deirdre Egan 1 , Andrew Owen 1 , Saye Khoo 1 , David Back 1 , Catherine Orrell 4 , Amanda Clarke 5 , Marcelo Losso 6 , Praphan Phanuphak 5 , Dianne Carey 2 , David A Cooper 2 , Sean Emery 2 , Rebekah Puls, on behalf of the ENCORE1 study group 1 Department of Molecular & Clinical Pharmacology, University of Liverpool, Liverpool, UK; 2 The Kirby Institute, UNSW Australia, Sydney, Australia; 3 Chelsea & Westminster Foundation Trust, London, UK; 4 Desmond Tutu HIV Foundation, Cape Town, South Africa; 5 HIV-NAT Thai Red Cross AIDS Research Center, Bangkok, Thailand; 6 Hospital Ramos Mejía, Buenos Aires, Argentina Correspondence: Laura Dickinson, Department of Molecular & Clinical Pharmacology, University of Liverpool, Pharmacology Research Laboratories, Block H, First Floor, 70 Pembroke Place, Liverpool, L69 3GF, UK Telephone: +44 (0) 151 794 5553, Fax: +44 (0) 151 794 5656 [email protected] Running Title: Efavirenz PK/PD 400 and 600mg in HIV patients Word Count: 3925 References: 42 Tables: 4 Figures: 3 Keywords: efavirenz; dose reduction; pharmacokinetics; pharmacodynamics This article has been accepted for publication and undergone full peer review but has not been through the copyediting, typesetting, pagination and proofreading process which may lead to differences between this version and the Version of Record. Please cite this article as an ‘Accepted Article’, doi: 10.1002/cpt.156 This article is protected by copyright. All rights reserved.
-
Upload
independent -
Category
Documents
-
view
0 -
download
0
Transcript of Pharmacokinetic and Pharmacodynamic Comparison of Once Daily Efavirenz (400mg Versus 600mg) in...

Pharmacokinetic and Pharmacodynamic Comparison of Once Daily Efavirenz (400mg
Versus 600mg) in Treatment-Naïve HIV-Infected Patients: Results of the ENCORE1 Study
Laura Dickinson1, Janaki Amin2, Laura Else1, Marta Boffito3, Deirdre Egan1, Andrew Owen1,
Saye Khoo1, David Back1, Catherine Orrell4, Amanda Clarke5, Marcelo Losso6, Praphan
Phanuphak5, Dianne Carey2, David A Cooper2, Sean Emery2, Rebekah Puls,
on behalf of the ENCORE1 study group
1 Department of Molecular & Clinical Pharmacology, University of Liverpool, Liverpool, UK; 2
The Kirby Institute, UNSW Australia, Sydney, Australia; 3 Chelsea & Westminster Foundation
Trust, London, UK; 4 Desmond Tutu HIV Foundation, Cape Town, South Africa; 5 HIV-NAT
Thai Red Cross AIDS Research Center, Bangkok, Thailand; 6 Hospital Ramos Mejía, Buenos
Aires, Argentina
Correspondence: Laura Dickinson, Department of Molecular & Clinical Pharmacology,
University of Liverpool, Pharmacology Research Laboratories, Block H, First Floor, 70 Pembroke Place, Liverpool, L69 3GF, UK Telephone: +44 (0) 151 794 5553, Fax: +44 (0) 151 794 5656 [email protected]
Running Title: Efavirenz PK/PD 400 and 600mg in HIV patients
Word Count: 3925
References: 42
Tables: 4
Figures: 3
Keywords: efavirenz; dose reduction; pharmacokinetics; pharmacodynamics
This article has been accepted for publication and undergone full peer review but has not beenthrough the copyediting, typesetting, pagination and proofreading process which may lead todifferences between this version and the Version of Record. Please cite this article as an‘Accepted Article’, doi: 10.1002/cpt.156
This article is protected by copyright. All rights reserved.

2
Abstract
Daily efavirenz 400mg (EFV400) was virologically non-inferior to 600mg (EFV600) at 48
weeks in treatment-naïve patients. We evaluated EFV400 and EFV600 pharmacokinetics
(NONMEM v. 7.2), assessing patient demographics and genetic polymorphisms (CYP2B6,
CYP2A6, CYP3A4, NR1I3) as covariates and explored relationships with efficacy [plasma HIV-
RNA (pVL) <200 copies/mL] and safety outcomes at 48 weeks in 606 randomised ENCORE1
patients (female=32%, African=37%, Asian=33%; EFV400=311, EFV600=295). CYP2B6
516G>T/983T>C/CYP2A6*9B/*17 and weight were associated with efavirenz CL/F. Exposure
was significantly lower for EFV400 [GMR (90% CI): 0.73 (0.68-0.78)] but 97% (EFV400) and
98% (EFV600) of evaluable pVL was <200copies/mL at 48 weeks (p=0.802). Four of 20
patients with mid-dose concentrations <1.0mg/L had pVL≥200copies/mL (EFV400=1;
EFV600=3). Efavirenz exposure was similar between those with and without efavirenz-related
side-effects [GMR (90% CI: 0.95 (0.88-1.02)]. HIV suppression was comparable between doses
despite significantly lower EFV400 exposure. Comprehensive evaluation of efavirenz
pharmacokinetics/pharmacodynamics revealed important limitations in the accepted threshold
concentration.
This article is protected by copyright. All rights reserved.

3
Introduction
Approximately 10 million people receive antiretrovirals, although there is disproportionate
global access to treatment.1 Current funds are unlikely to cover planned scale-up of treatment to
15 million by 2015.2 Exploration of strategies to lower drug costs may help attain this goal.
Daily therapy including efavirenz (600mg) with tenofovir (300mg) and emtricitabine (200mg) or
lamivudine (300mg) is recommended as first-line treatment for HIV-infected individuals aged ≥3
years.3 Historical data suggest similar efficacy of lower efavirenz doses4 and ENCORE1, a
multi-centre, double-bind, placebo-controlled trial comparing reduced dose (400mg once daily;
EFV400) with standard dose efavirenz (600mg once daily; EFV600) in treatment-naïve, HIV-
infected adults showed that EFV400 was non-inferior to EFV600 at 48 weeks [plasma HIV-RNA
(pVL) <200copies/mL: 94% vs. 92%, respectively; modified intent-to-treat (ITT)].5 Based on 12
million receiving recommended first-line treatment, a reduction to 400mg efavirenz would save
$16 per person in direct drug costs ($192 million worldwide per year).6
Various demographic and genetic factors impact efavirenz disposition.7-10
Plasma efavirenz
concentrations were associated with HIV suppression and toxicity when dosed 600mg once
daily.11-13 ENCORE1 provided an opportunity to examine such factors in a geographically and
genetically diverse group of patients and to explore relationships between efficacy and safety
outcomes with reduced dose efavirenz. We aimed to determine pharmacokinetic (PK) parameters
of EFV400 and EFV600 and investigate the impact of patient characteristics and genetics by
population PK modelling. Additionally, efavirenz PK/pharmacodynamic (PD) relationships in
patients enrolled in ENCORE1 at 48 weeks were assessed.
This article is protected by copyright. All rights reserved.

4
Results
Patients and sampling
Of 630 patients included in the ENCORE1 ITT,5 concentrations (n=1543) were available from
619 individuals (Figure 1). In total, 3% (n=52) of samples were excluded [no recorded time post-
dose, time post-dose >30 hours, concentration below assay lower limit of quantification (LLQ)
or combination thereof]. Overall, 1491 samples [median (range) 2 (1-9) per patient; 1-3
occasions per patient] from 606 patients randomised to EFV400 (n=311, 51%) or EFV600
(n=295, 49%) were included. Forty-six patients also participated in the intensive PK sub-study
(EFV400, n=28; EFV600, n=18) (Figure 1).
During the study, eight patients (n=7 included in the model) commenced rifampicin- containing
tuberculosis (TB) therapy and switched to open label efavirenz throughout this phase. Four
patients received rifampicin at weeks 4 or 12 (random sampling); two in EFV400 (one received
600mg both weeks; one received 800mg at week 12) and two in EFV600 (one received 800mg
both weeks; one remained at 600mg). Sensitivity analyses compared model- derived population
parameters with and without patients on rifampicin; there were no differences in estimates and
patients were retained in the analysis. Patient demographics and clinical characteristics are
shown (Table 1).
Genotyping
Blood samples for genotyping were available for 595 patients, 21 of who were not included in
the model (see Methods). Of 606 patients with PK data, 32 did not have a genotyping sample
(Figure 1). Amplification failed in one, two and four patients for CYP2B6 15582C>T and
This article is protected by copyright. All rights reserved.

5
CYP3A4*22, CYP2A6*17 and CYP2A6*9B, respectively. PK and genetics were available for
n=574 for CYP2B6 516G>T, CYP2B6 983T>C, NR1I3 540C>T and NR1I3 1089T>C, n=573 for
CYP2B6 15582C>T and CYP3A4*22 and n=572 and n=570 for CYP2A6*17 and CYP2A6*9B,
respectively (Figure 1). Genotype frequencies are summarised (Table 1); all were in Hardy-
Weinberg equilibrium and this was also confirmed when stratified by ethnicity.
PK Modelling
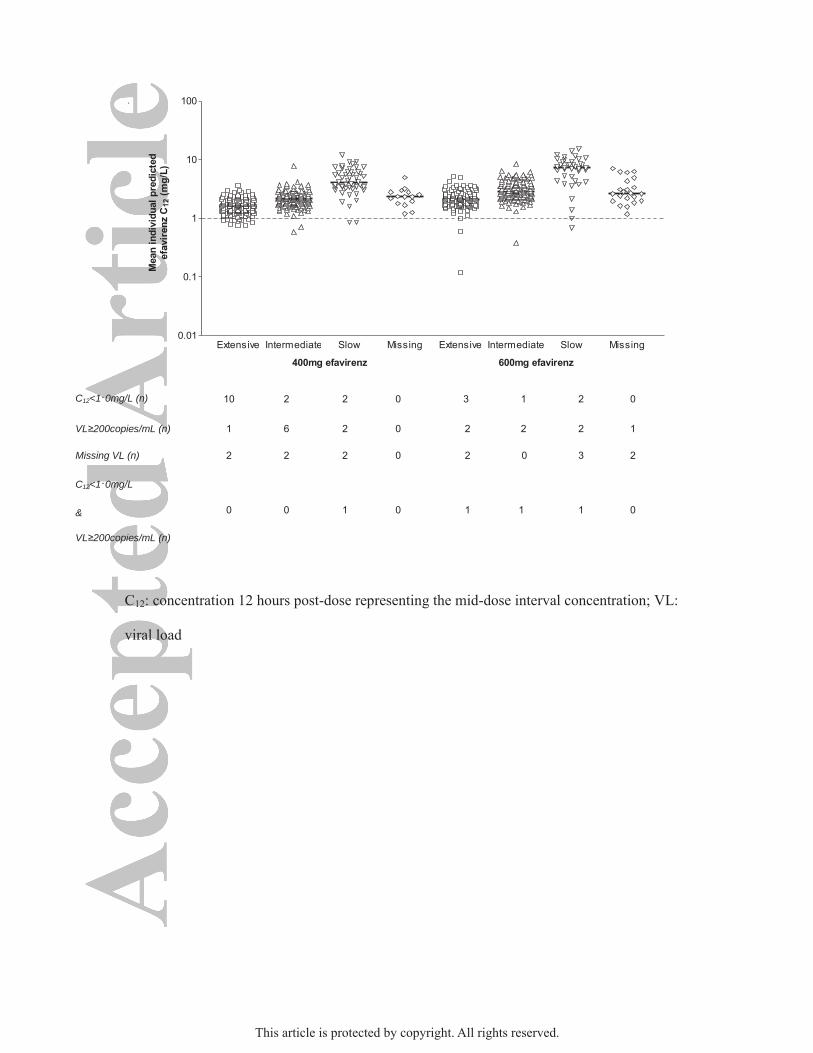
Efavirenz plasma concentrations over time are shown (Figure 2). A one-compartment model
with first-order absorption best described the data, parameterised by apparent oral clearance
(CL/F), apparent volume of distribution (V/F) and absorption rate constant (ka). Given the lack
of absorption phase samples, ka was fixed to a literature value (0.6h-1).14 Interindividual (IIV) and
interoccasion variability (IOV) were estimated on CL/F and residual error described by a
proportional model.
Following univariate analysis, CYP2B6 516G>T, CYP2B6 983T>C and CYP2B6 15582C>T
genotype were significantly associated with CL/F (Supplementary Table 1). Weight and fat free
mass (FFM) on CL/F and V/F produced a significant drop in objective function value (OFV);
however the change was greater for weight (∆OFV -67.7 vs. -44.0). Ethnicity (Asian and African
separately vs. Caucasian and Hispanic combined; CL/F decreased by approximately 5% in
Hispanics compared to Caucasians and combining in the model did not affect OFV) and sex on
CL/F were also significant. Neither NR1I3 nor CYP3A4*22 SNPs improved model fit
(Supplementary Table 1).
This article is protected by copyright. All rights reserved.

6
For multivariate analysis, inclusion of weight and CYP2B6 983T>C with CYP2B6 516G>T on
CL/F was significant, but addition of ethnicity was not. Addition of CYP2A6*9B/CYP2A6*17
composite genotype consisting of wild-type (CC/CC) and carriers for either SNP or both (CC/CT
or TT, CA or AA/CC, CA or AA/CT or TT; combined as such due to lower numbers for the
variants) to CYP2B6 516G>T/983C>T composite genotype (GG/TT, GG/TC or CC, GT/TT,
GT/TC or CC, TT/TT) produced a greater change in OFV than addition of CYP2B6 15582C>T,
so was added into the model first. Addition of CYP2B6 15582C>T and sex did not improve the
fit. Following backwards elimination CYP2B6 516G>T/983T>C/CYP2A6*9B/*17 on CL/F and
weight on CL/F and V/F were retained. For the composite genotype, those wild-type for both
CYP2B6 single nucleotide polymorphisms (SNP) with combinations of CYP2A6*9B/*17 were
used as the reference genotype due to no change in CL/F between groups and given that the
impact of CYP2A6 is more prominent in those without fully functional CYP2B614
(GG/TT/CC/CC, GG/TT/CC/CT or TT, GG/TT/CA or AA/CC, GG/TT/CA or AA/CT or TT);
this did not significantly affect estimates. Overall there were 16 genotype groups (Supplementary
Table 1). IIV CL/F was decreased 15% by the addition of covariates, with the reduction largely
from inclusion of CYP2B6 516G>T (↓9.5%) and CYP2B6 983T>C (↓3.5%). Grouping patients
as extensive, intermediate or slow metabolisers (see Methods) after the final model was obtained
or as a final step of the modelling process did not influence the individual parameter estimates.
Final model parameters and diagnostic plots are shown (Supplementary Table 2 and
Supplementary Figure 1, respectively). Compared to reference genotypes (11.9L/h), efavirenz
CL/F decreased by 4.5%-82% depending on genotype group with typical population CL/F
between 2.2 and 11.4L/h for an individual weighing 70kg (Supplementary Table 2).
This article is protected by copyright. All rights reserved.

7
Based on 1000 simulated patients (51% EFV400) with the same distribution of bodyweights and
CYP2B6/CYP2A6 genotypes as the original dataset and three sampling occasions per patient,
90% of observed concentrations were within the prediction interval. Stratified for dose, 90% and
91% of concentrations were within the prediction interval for EFV400 and EFV600,
respectively, indicative of an adequate model (Supplementary Figure 2).
Secondary PK parameters
Efavirenz area under the concentration-time curve over 24 hours (AUC0-24), maximum
concentration (Cmax), trough concentration 24 hours post-dose (C24) and concentration 12 hours
post-dose representing the mid-dose interval concentration (C12) were significantly lower for
EFV400 (Table 2). PK parameters are summarised, stratified by dose and metaboliser status
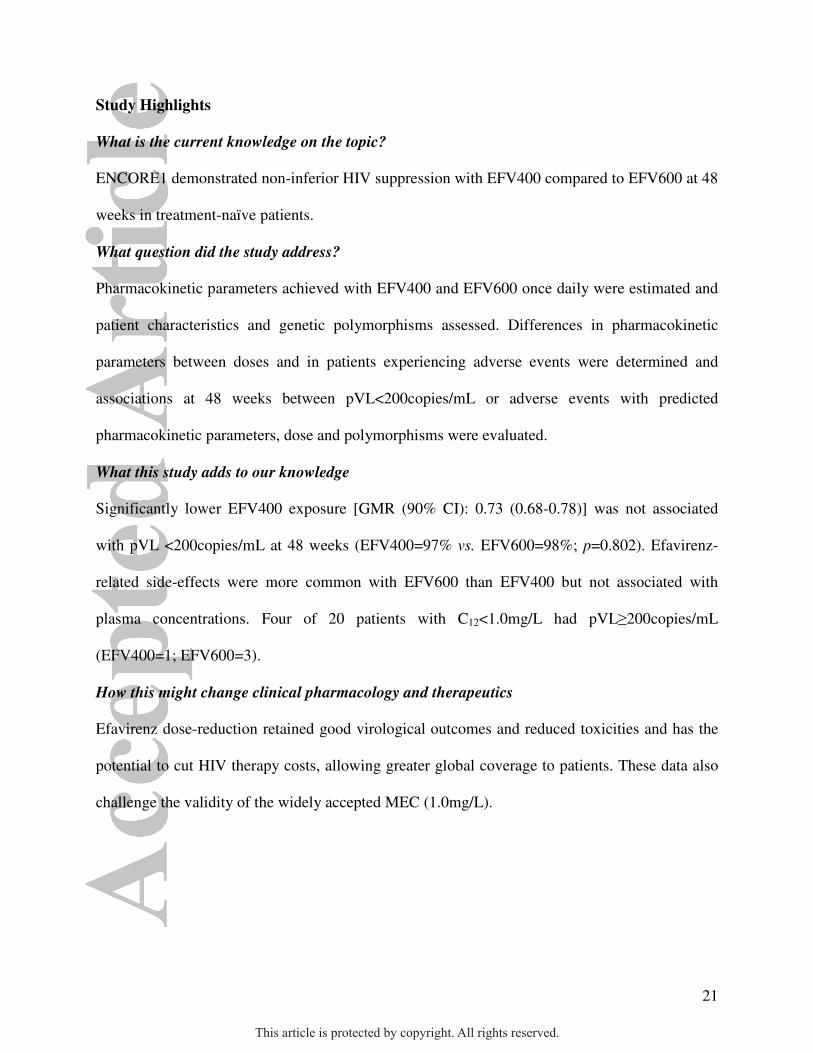
(extensive, intermediate and slow; Table 3). Proportion of patients with C12 below the
recommended minimum effective concentration (MEC) of 1·0mg/L12 for each group was similar
between doses (p=0.09, 1.00, 1.00, respectively; Fisher’s Exact test), moreover the number of
patients with C12<MEC was low (n=20). There was overlap in concentrations between groups
but generally followed the trend of slow>intermediate>extensive (Figure 3).
PK-PD Analysis
At screening, 231 patients had pVL>100,000copies/mL and 375 had pVL≤100,000copies/mL. At
48 weeks, 2% (n=13) were missing and 577/593 patients (97%; 97% EFV400, 98% EFV600)
had pVL<200copies/mL and 3% (n=16) had pVL≥200copies/mL.
This article is protected by copyright. All rights reserved.

8
Following univariate analysis, no categorical variables (dose, composite genotype, individual
SNPs, screening pVL strata) were found to have significant relationships with
pVL<200copies/mL at 48 weeks (Supplementary Table 3). Following univariate logistic
regression of PK parameters, mean individual predicted efavirenz logCL/F [odds ratio (OR)
(95% CI): 0.037 (0.005-0.303), p=0.002], logAUC0-24 [OR (95% CI): 17.56 (1.61-192.95),
p=0.019], logC24 [OR (95% CI): 7.53 (2.04-27.75), p=0.002] and logC12 [OR (95% CI): 21.01
(2.94-150.11), p=0.002] were associated with pVL<200copies/mL at 48 weeks, although
confidence intervals (CI) were generally wide.
Proportions of patients with pVL≥200copies/mL at 48 weeks stratified by metaboliser status was
similar between doses (p=0.604, 0.172, 1.00, respectively; Fisher’s Exact test, Table 3; Figure 3).
Of 14 and six patients with C12<MEC for EFV400 and EFV600, one and three had
pVL≥200copies/mL at 48 weeks, respectively (Figure 3). Composite CYP2B6
516G>T/983T>C/CYP2A6*9B/*17 genotype was TT/TT/CC/CC (slow), GG/TT/CC/CC
(extensive), GT/TT/CC/CC (intermediate) and GG/TC or CC/CA or AA/CC (slow), respectively
for these four patients. The ranges of C12 stratified by metaboliser status of the nine (EFV400)
and seven patients (EFV600) with pVL≥200copies/mL at 48 weeks (n=16 total) were - EFV400:
1.31mg/L (extensive, n=1), 1.45-2.90mg/L (intermediate, n=6), 0.85mg/L and 2.99mg/L (slow,
n=2); EFV600: 0.12mg/L and 1.60mg/L (extensive, n=2), 0.37mg/L and 3.02mg/L (intermediate,
n=2), 0.68mg/L and 8.15mg/L (slow, n=2) and 6.24mg/L (missing, n=1).
Treatment discontinuation and adverse events
This article is protected by copyright. All rights reserved.
9
Overall, 42/606 (7%) discontinued therapy during the 48 weeks [median (range) 15 weeks (0.1-
49)]. Seven percent had severe adverse events and 65% and 48% experienced efavirenz-related
and CNS adverse events, respectively. Significantly more patients administered EFV600 had
efavirenz-related (70% vs. 61%; p=0.017) and CNS events (52% vs. 44%; p=0.042), compared to
EFV400 (Pearson’s Chi-Square).
Predicted PK parameters were not significantly different between those who did and did not
discontinue efavirenz or had adverse events (Table 4). After adjusting for age, sex and dose and
stratifying by country, those with CYP2B6 516TT and CYP2A6*9B heterozygote or homozygous
variant allele (CA or AA) were at increased risk of discontinuation [HR (95% CI): 2.81 (1.12-
7.06); p=0.028 and 2.14 (1.05-4.35); p=0.035, respectively]. EFV600 was independently
associated with 24% increased risk of efavirenz-related side-effects when adjusted for age and
sex and stratified by country [HR (95% CI): 1.24 (1.01-1.53); p=0.039].
This article is protected by copyright. All rights reserved.

10
Discussion
Daily efavirenz dose was not associated with virological response at 48 weeks despite
significantly lower exposure with EFV400. Predicted C12 was <1.0mg/L (suggested MEC12) in
5% (n=14) and 2% (n=6) for EFV400 and EFV600, respectively following 4-12 weeks of
therapy. Of these patients, only one EFV400 and three EFV600 patients had detectable pVL at
48 weeks. Moreover, patients randomised to EFV400 experienced significantly fewer efavirenz-
related adverse events.
Impact of CYP2B6 516G>T and 983T>C on efavirenz PK have been well documented in
different populations8-10, 13, 15 and replicated in ENCORE1. CYP2A6 polymorphisms including
CYP2A6*9B and/or *17 carriers8, 16 have been associated with higher efavirenz concentrations,
particularly in those with impaired CYP2B6 function. Composite CYP2B6
516G>T/983T>C/CYP2A6*9B/*17 genotype and bodyweight were significantly associated with
efavirenz CL/F in ENCORE1. The model described the data well and parameters were within
reported ranges.9, 14, 15 Addition of covariates reduced CL/F variability by 15%. The patient
population was diverse and although 58% of variability remained unexplained (37% and 21%;
IIV and IOV, respectively), it could be attributed to covariates not captured in the study e.g.,
unidentified host genetic factors and potentially variable adherence.
Lower efavirenz concentrations have been associated with NR1I3 540C>T and NR1I3 1089T>C
carriers (TT, CC, respectively).7, 17, 18 Relationships between NRII3 540C>T or 1089T>C and
CL/F was not confirmed in ENCORE1 patients.
This article is protected by copyright. All rights reserved.

11
Impact of CYP2B6 15582C>T SNP on efavirenz C24 in combination with CYP2B6 516G>T and
983T>C was recently described.19 Patients wild-type for all three SNPs (CYP2B6
15582CC/516GG/983TT) had the lowest median efavirenz C24, potentially placing them at risk
of virological failure. Despite CYP2B6 15582C>T not meeting statistical criteria to remain in the
ENCORE1 population PK model, post-hoc analysis was performed to estimate each patient’s C24
based on CYP2B6 15582C>T/516G>T/983T>C composite genotype as previously described.19
Patients wild-type for all three SNPs had the lowest model-predicted median C24 and
concentrations were lower for EFV400. No patients with this genotype had pVL≥200copies/mL
at 48 weeks (Supplementary Figure 3). Given the small number of patients with
pVL≥200copies/mL, interpretation of this observation is limited.
Dose was not associated with pVL<200copies/mL at 48 weeks, despite lower concentrations
with EFV400. No relationships between genetic polymorphisms and viral suppression were
observed. Patients were at higher risk of suppressing virus in association with increasing AUC0-
24, C24 and C12 although CIs were generally wide. Due to low numbers of detectable viral loads at
48 weeks, the models should be interpreted with caution.
A therapeutic range (1.0-4.0mg/L) proposed in 2001 by Marzolini et al (n=130 HIV-infected
patients of unreported ethnicity) was adopted for efavirenz threshold concentrations. Seventy- six
percent suppressed virus below 400copies/mL; of those who failed therapy, 50% had a mid-dose
interval concentration <1.0mg/L.12 Efavirenz cut-offs have not been re-evaluated in a large,
randomised, controlled trial, particularly in combination with more active therapies such as
tenofovir and emtricitabine. ENCORE1 data strongly indicate that this putative MEC does not
This article is protected by copyright. All rights reserved.

12
represent the efficacy cut-off for current efavirenz-based regimens. Indeed, of 16 patients with
pVL≥200copies/mL at 48 weeks (nine vs. seven for EFV400 and EFV600, respectively) only
one and three individuals had predicted C12<1.0mg/L. Furthermore, Ugandan patients (n=99)
receiving efavirenz with zidovudine/lamivudine also experienced a low number of failures (n=6;
pVL≥40copies/mL) that were not associated with plasma exposure.20
Limited failures in ENCORE1 meant robust reassessment of the 1.0mg/L cut-off was not
feasible; however these data question the validity of this MEC. Self-reported adherence was
recorded at weeks 4 and 48 and although the impact of adherence on clinical outcome cannot be
assessed, patients with detectable viral load at 48 weeks (n=16) reported taking all or most of
their medications (except therapy discontinuations) including four patients with C12<1.0mg/L.
Efavirenz therapy is associated with early neuropsychiatric adverse events in over half of
patients21, 22 that generally subside with time. Although relationships between CNS toxicity and
efavirenz plasma concentrations have been observed,11, 12, 23, 24 no association was seen in
ENCORE1. Despite this, the incidence of efavirenz-related and CNS adverse events was lower
with EFV400. Furthermore, EFV600 was associated with higher risk of efavirenz-related adverse
effects. Efavirenz and its 8-hydroxy (8OH) metabolite produced damage in rat neuronal cultures
in vitro, with 8OH-efavirenz exhibiting toxicity 10-fold higher than the parent drug.25 Although
translating in vitro observations to clinical settings is difficult, these data suggest that patients
with higher 8OH-efavirenz CNS concentrations (e.g. extensive metabolisers) could be more
susceptible to CNS toxicities.21 Alternatively, those without fully functional CYP2B6 could be at
lower risk. In ENCORE1, CYP2B6 983T>C carriers (TC or CC) had 33% lower risk of CNS
This article is protected by copyright. All rights reserved.

13
side-effects compared to wild-type (TT), suggesting lower 8OH-efavirenz formation and
CYP2B6 15582CT/TT had a higher risk (53%) (Supplementary Table 4).
Another ENCORE1 sub-study (n=28) found concentrations of efavirenz and its metabolites were
slightly lower in plasma and CSF for EFV400 and exposure within the two compartments were
correlated and associated with CYP2B6 516G>T genotype.26 Conversely, no relationships were
observed between dose, plasma efavirenz or 8OH-efavirenz or genotype with CSF 8OH-
efavirenz. Although the CSF sub-study was small and exploratory, a potential connection was
noted between CSF 8OH-efavirenz and patient-reported CNS symptoms by questionnaire26 and
most individuals achieved CSF 8OH-efavirenz concentrations greater than those responsible for
neuronal damage in rat cultures.25, 26 ENCORE1 contributes significantly to our understanding of
efavirenz-induced toxicity although mechanisms remain to be fully elucidated.
Efavirenz discontinuation in ENCORE1 occurred at a rate consistent with previous reports.27-29
Possession of CYP2B6 516G>T homozygous variant (TT) and CYP2A6*9B heterozygous or
homozygous variant alleles (CA or AA) but not dose were associated with higher risk of
discontinuation. The relationship observed with CYP2B6 516TT agrees with Wyen et al who
evaluated risk factors for early discontinuation (<3 months).29 Increased risk was also reported in
patients with NR1I3 540CC; this was not seen in ENCORE1. EFV400 discontinuation was not
associated with genotypes when analysed separately (Supplementary Table 5).
Pharmacogenetic testing has been suggested to aid efavirenz dose optimisation.30, 31 Genetic risk
scores were used to predict early efavirenz discontinuation; individuals scoring 6 (CYP2B6
This article is protected by copyright. All rights reserved.

14
homozygous loss of function and loss of function in an accessory metabolic pathway of CYP2A6
or CYP3A4) had a higher risk of discontinuation compared to those with lower scores.32
Although statistically significant and partially confirmed in ENCORE1, the number of patients
scoring 6 was small (13/272)32 thus questioning the feasibility of translating this approach into a
cost-effective, population-wide clinical tool, particularly in resource-limited settings. Data
presented here indicate that pharmacogenetic analysis of known alleles is no more useful at
predicting outcome, such as efficacy or discontinuation, for the efavirenz doses assessed (400mg
and 600mg).
The antitubercular agent rifampicin is a cytochrome P450 enzyme inducer, markedly lowering
concentrations of some antiretrovirals, potentially jeopardising virological success.33 Co-
administration with efavirenz has generated conflicting data and a systematic review reported a
time-dependent interaction between rifampicin and efavirenz,34 with efavirenz concentrations
decreased in individuals receiving single dose or ≤8 days of therapy, while PK parameters
increased in those established on efavirenz.34 Furthermore, the STRIDE study observed good
virological control in co-infected patients on and off TB-therapy including rifampicin.35 Further
PK-PD studies of efavirenz and rifampicin in co-infected populations are warranted.
Current WHO guidelines recommend efavirenz as first-line treatment during pregnancy3, 36; PK-
PD data of efavirenz during pregnancy and post-partum are sparse. A recent review concluded
that pregnancy had little clinical impact on efavirenz PK, with good rates of viral suppression
achieved in mothers at delivery.37 However, others observed higher efavirenz CL/F and lower
AUC0-24 and Cmin during pregnancy compared to post-partum.38 When stratified by CYP2B6
This article is protected by copyright. All rights reserved.

15
516G>T, PK changes were markedly greater in wild-type patients (516GG). Impact on clinical
outcome requires investigation.38 Speculatively, these findings together with ENCORE1
outcomes suggest scope for dose reduction to 400mg in HIV/TB co-infected and potentially
pregnant patients. Transition to new recommendations would require careful prospective
monitoring.
Although plasma efavirenz concentrations were reduced with EFV400 compared to EFV600,
virus suppression was similar. Fewer adverse events with the reduced dose may improve quality
of life. Genetic polymorphisms were associated with treatment discontinuation but the biological
importance is uncertain. Furthermore, genetic testing is unlikely to be widely implemented,
particularly in resource-limited settings and would be no more useful for EFV400 than EFV600.
Antiretroviral costs pose a barrier to rollout of treatment to meet WHO targets. Reducing
efavirenz dose to 400mg could provide an economically viable solution, cutting costs and
expanding access whilst maintaining good efficacy and reducing adverse events.
This article is protected by copyright. All rights reserved.

16
Methods
Patients
ENCORE1 has been described.5 Briefly, HIV-infected individuals ≥16 years with
pVL≥1,000copies/mL and CD4 cell counts between 50-500cells/mm3 without pre-existing CDC
AIDS-defining illnesses or active opportunistic infections and no prior exposure to antiretrovirals
were eligible to participate in this randomised, double-blind, placebo- controlled trial. Patients
were recruited from 13 countries (38 sites) across Africa, Asia, South America, Europe and
Oceania; ethical and regulatory approval and written informed consent were obtained.5 Patients
were randomised to receive daily EFV400 or EFV600 in combination with
tenofovir/emtricitabine (Truvada®, 300/200mg once daily). After randomisation, patients
requiring treatment with rifampicin for TB were switched to open- label efavirenz 600mg (or
800mg) once daily, then returned to randomised efavirenz on completion of rifampicin.
Random, single blood samples were drawn from all patients at weeks 4 and 12 (between 8-16
hours post-dose). Intensive sampling was also undertaken in a sub-group (from Argentina, South
Africa, Thailand, United Kingdom) between weeks 4 and 8 at pre-dose (0 hour), 2, 4, 8, 12, 16
and 24 hours post-dose. Plasma efavirenz concentrations were determined by a fully validated
HPLC-MS/MS method with LLQ and upper limit of quantification (ULQ) of 0.025 and
l0.0mg/L, respectively.39
Genotyping
Total genomic DNA was extracted from patient blood using the QI Amp DNA mini kit (Qiagen,
West Sussex, UK) according to manufacturer’s instructions. Samples were quantified and
This article is protected by copyright. All rights reserved.

17
normalised to 20ng/µl. Genotyping for SNPs previously associated with efavirenz PK [CYP2B6
516 G>T (rs3745274)8, 9, 13, 15, CYP2B6 983 T>C (rs28399499)10, CYP2B6 15582C>T
(rs4803419)19, CYP2A6*9B (rs8192726)8, CYP2A6*17 (rs28399454)8, CYP3A4*22
(rs35599367)40, NR1I3 (CAR) 540C>T (rs2307424)7 and NR1I3 1089T>C (rs3003596)18] was
performed using real-time PCR allelic discrimination assays (C_7817765_60, C_60732328_20,
C_7817764_10, C_29560333_20, C_34816076_20, C_59013445_10, C_25746794_20 and
C_16194070_10, respectively; Applied Biosystems, Foster City, CA, USA) as previously
described.17, 40
PK Modelling
Nonlinear mixed effects modelling (NONMEM v. 7.2, ICON Development Solutions, Ellicott
City, MD, USA) was applied to the data41 with initial parameter estimates taken from the
literature.9, 14, 42
Covariates including age, weight, FFM, body mass index (BMI), sex, ethnicity, concomitant
rifampicin and CYP2B6 516G>T, CYP2B6 983T>C, CYP2B6 15582C>T, CYP2A6*9B,
CYP2A6*17, CYP3A4*22, NR1I3 540C>T and NR1I3 1089T>C genotypes on efavirenz CL/F
were explored. Covariates were initially assessed (univariate), with the exception of CYP2A6*9B
and CYP2A6*17, which were tested in combination with CYP2B6 SNPs due to more prominent
effects observed in those without fully functional CYP2B6.14
Model fit was assessed by statistical and graphical methods. Decreased minimal OFV by at least
3.84 units was required to accept a model with one extra parameter (p=0.05, χ2 distribution,
This article is protected by copyright. All rights reserved.

18
1d.f.). Once significant covariates were included a backwards elimination process was performed
and biologically plausible covariates producing an increase in OFV of at least 10.83 units
(p=0.001, χ2 distribution, 1d.f.) were retained.
Model evaluation was performed by simulation and visual predictive check. Using model
estimates a 90% prediction interval (P5-P95) was generated from 1000 simulated patients with
the same distribution of doses and significant covariates as the original dataset; observed data
were superimposed. Inclusion of ≥90% of data points within the prediction interval indicated an
adequate model.
Secondary PK parameters
Along with model-defined parameters, secondary PK parameters were estimated for each patient
at each sampling occasion using the final model: AUC0-24, Cmax, C24 and C12. If patients had
more than one sampling occasion, the mean of individual predicted PK parameters were
determined and carried forward into analyses outlined below.
Differences between doses for efavirenz AUC0-24, Cmax, C24 and C12, were evaluated by
geometric mean ratios (GMR) and 90% CI using log-transformed data then expressed as linear
values. Differences were considered significant if the 90% CI did not include 1.
Genotypes were distributed into three groups based on change in efavirenz CL/F and
CYP2B6/CYP2A6 alleles:
i) extensive metabolisers:homozygous wild-type for CYP2B6 SNPs with combinations of
This article is protected by copyright. All rights reserved.

19
CYP2A6 alleles (GG/TT/CC/CC, GG/TT/CC/CT or TT, GG/TT/CA or AA/CC,
GG/TT/CA or AA/CT or TT)
ii) intermediate metabolisers:homozygous wild-type CYP2B6 516G>T and combinations
of CYP2A6 alleles with heterozygous or homozygous variant CYP2B6 983T>C or
heterozygous variant CYP2B6 516G>T with CYP2B6 983T>C homozygous wild-type
and combinations of CYP2A6 alleles (GG/TC or CC/CC/CC, GT/TT/CC/CC,
GT/TT/CC/CT or TT, GT/TT/CA or AA/CC, GT/TT/CA or AA/CT)
iii) slow metabolisers:heterozygous variant CYP2B6 516G>T with heterozygous or
homozygous variant CYP2B6 983T>C, or homozygous variant CYP2B6 516G>T with
homozygous wild-type CYP2B6 983T>C with combinations of CYP2A6 alleles
(GG/TC or CC/CC/CT or TT, GG/TC or CC/CA or AA/CC, GG/TC or CC/CA or
AA/CT, GT/TC or CC/CC/CC, GT/TC or CC/CC/CT or TT, GT/TC or CC/CA or
AA/CC, TT/TT/CC/CC, TT/TT/CC/CT or TT, TT/TT/CA or AA/CC, TT/TT/CA or
AA/CT).
Proportions of patients with C12 below the recommended MEC of 1.0mg/L12 were determined for
each group.
PK-PD Analysis
The primary PD endpoint was proportion of patients with pVL<200copies/mL at 48 weeks by
randomised dose. Patients without a recorded viral load were excluded. Logistic regression was
performed to assess associations between pVL<200copies/mL at 48 weeks and mean individual
predicted logCL/F, logAUC0-24, logCmax, logC24, and logC12. Univariate analyses (Fisher’s exact
test or Pearson’s Chi-Square, as appropriate) were carried out for dose, SNPs and screening
This article is protected by copyright. All rights reserved.

20
pVL≤/>100,000copies/mL.
Treatment discontinuation and adverse events
Discontinuation was defined as interruption in efavirenz >30 days. Efavirenz-related adverse
events and CNS-related side-effects (including abnormal dreams, anxiety, cerebellar disorder and
ataxia, dizziness, headache and migraine, impaired concentration, insomnia, seizure and
somnolence) were categorised as those defined in the Sustiva® Prescribing Information.27
Comparison of PK parameters between those who did or did not stop therapy and experience
adverse events was performed by GMR (90% CI). Differences in proportions of each endpoint
by efavirenz dose were assessed by Fisher’s exact test or Pearson’s Chi-Square. Evaluation of
relationships between efavirenz discontinuation and adverse events with dose and SNPs was
performed by Cox regression adjusted a priori for potential confounders (age, sex). Post-hoc
exploratory analysis of the crude association of PK parameters and CNS-related side-effects (as a
subset of adverse events) was undertaken using logistic regression.
Statistical analyses were performed using SPSS (v. 21, IBM, New York, USA).
This article is protected by copyright. All rights reserved.
21
Study Highlights
What is the current knowledge on the topic?
ENCORE1 demonstrated non-inferior HIV suppression with EFV400 compared to EFV600 at 48
weeks in treatment-naïve patients.
What question did the study address?
Pharmacokinetic parameters achieved with EFV400 and EFV600 once daily were estimated and
patient characteristics and genetic polymorphisms assessed. Differences in pharmacokinetic
parameters between doses and in patients experiencing adverse events were determined and
associations at 48 weeks between pVL<200copies/mL or adverse events with predicted
pharmacokinetic parameters, dose and polymorphisms were evaluated.
What this study adds to our knowledge
Significantly lower EFV400 exposure [GMR (90% CI): 0.73 (0.68-0.78)] was not associated
with pVL <200copies/mL at 48 weeks (EFV400=97% vs. EFV600=98%; p=0.802). Efavirenz-
related side-effects were more common with EFV600 than EFV400 but not associated with
plasma concentrations. Four of 20 patients with C12<1.0mg/L had pVL≥200copies/mL
(EFV400=1; EFV600=3).
How this might change clinical pharmacology and therapeutics
Efavirenz dose-reduction retained good virological outcomes and reduced toxicities and has the
potential to cut HIV therapy costs, allowing greater global coverage to patients. These data also
challenge the validity of the widely accepted MEC (1.0mg/L).
This article is protected by copyright. All rights reserved.

22
Acknowledgements
We wish to thank all those who volunteered to participate in this study.
Funding
ENCORE1 sub-studies were funded through a project grant from the Australian Government
National Health and Medical Research Council (NHMRC), APP1048402. The Kirby Institute is
funded in part by the Australian Government Department of Health and Ageing. Gilead Sciences
Inc. donated Truvada™ and Mylan Inc. provided Efamat™ and donated matched placebo.
All authors had full access to study data and agreed to submit for publication. The corresponding
author had final responsibility for the decision to submit for publication. No medical writers
were used and no agency made any payments for writing. Neither the funding agency nor
pharmaceutical companies supporting the trial played any role in collection, analysis,
interpretation or reporting of these data.
Conflict of interest statements
LD is supported by Pre-DiCT-TB
DB, SK, AO and LE have received research grants and/or travel bursaries from Merck, Bristol
Myers and Squibb, GlaxoSmithKline, Pfizer, Abbott, ViiV, Boehringer Ingelheim and Janssen
Pharmaceuticals
MB has received travel and research grants from and has been an adviser for Janssen, Roche,
Pfizer, ViiV, Bristol-Myers Squibb, Merck Sharp & Dohme and Gilead
RP, JA, DE, AC, DC and PP report no conflict of interest.
This article is protected by copyright. All rights reserved.

23
CO has received a travel bursary from Tibotec (2013) and an honorarium from Abbott (2011).
ML has received research grant support from Abbott, Merck Research Laboratories and Pfizer.
DAC has received honoraria and research grant support from Gilead Sciences, Merck Research
Laboratories and Bristol-Myers Squibb.
SE has received research grant support from Abbvie, Gilead Sciences, Merck Research
Laboratories, Pfizer and ViiV Healthcare.
Author Contributions
L.D. wrote the manuscript; M.B., D.C., D.A.C., S.E., and R.P. designed the research; L.D., J.A.,
L.E., M.B., D.E., A.O., S.K., D.B., C.O., A.C., M.L., P.P., D.C., and D.A.C. performed the
research; L.D. analyzed the data.
Protocol Steering Committee
Janaki Amin, Stephen Becker, Waldo Belloso, Marta Boffito, David Cooper, Brenda Crabtree-
Ramirez, Chris Duncombe, Sean Emery, Sharne Foulkes, Andrew Hill, Heiko Jessen, Suresh
Kumar, Man Po Lee, Marcelo Losso, Chidi Nwizu, Praphan Phanuphak, David Ripin, Tim Read,
Jim Rooney, Kim Schaffer, Eduardo Shahar, Alan Winston, Marcelo Wolff, Barnaby Young.
Project Team
Cecilia Abela, Maria Arriaga, Janaki Amin, Waldo Belloso, Mark Boyd, Dianne Carey, Amanda
Clarke, David Cooper, Kymme Courtney-Vega, Carlo Dazo, Marina Delfino, Anna Donaldson,
Sean Emery, Natalie Espinosa, Tanya Johannesen, Peeraporn Kaew-on, Enmoore Lin, Marcelo
Losso, Alejandra Moricz, Jessica Taylor, Praphan Phanupak, Rebekah Puls, Kanitta Pussadee,
This article is protected by copyright. All rights reserved.

24
Parinya Sutheerasak, Louise Tomkins, Sasiwimol Ubolyam
Site Investigators – main study
Waldo Belloso, Raja Iskandar Shah bin Raja Azwa, Emiliano Bissio, Liliana Calanni, Arnaldo
Casiro, Ploenchan Chetchotisakd, Jorge Contarelli, David Cooper, Brenda Crabtree- Ramirez,
Nicholas Doong, Julian Elliott, Sharne Foulkes, Brian Gazzard, Mark Kelly, Suresh Kumar, Man
Po Lee, Marcelo Losso, Norma del Carmen Luna, Sergio Lupo, Oscar Garcia Messina, Lerato
Mohapi, Richard Moore, David Nolan, Chidi Nwizu, Catherine Orrell, Carlos Perez, Sarah Pett,
Praphan Phanuphak, Jürgen Rockstroh, Eduardo Shahar, Khuanchai Supparatpinyo, Don Smith,
Jaime Andrade Villanueva, Emanuel Vlahakis, Alan Winston, Marcelo Wolff, Barnaby Young
Site Investigators and staff – Intensive PK study
Chelsea & Westminster Hospital, London – Akil Jackson, Marta Boffito, Serge Federle, Brian
Gazzard, Sophie Scott
Hospital Ramos Mejia, Buenos Aires - Patricia Burgoa, Juan Ebenrstejin, Mariana Kundro,
Marcelo Losso
Desmond Tutu HIV Centre, Cape Town - Christie Heiberg, Richard Kaplan, Catherine Orrell,
Maureen Rattley
HIV-NAT AIDS Research Centre, Bangkok - Amanda Clarke, Kanitta Pussadee, Praphan
Phanuphak
Central Laboratory
Alex Carrera, Philip Cunningham, Bertha Fsadni, Tony Kelleher, Melanie Lograsso, Kate
This article is protected by copyright. All rights reserved.

25
Merlin, Ansari Shaik, Julie Yeung
Liverpool University Laboratory
Alieu Amara, Deirdre Egan, Laura Else
This article is protected by copyright. All rights reserved.

26
References
1 World Health Organisation. Global update on HIV treatment 2013: results, impact and
opportunities. Available at:
http://wwwwhoint/hiv/data/global_treatment_report_presentation_2013pdf, (2013), (last
accessed 10/09/2014).
2 World Health Organisation. Key facts on global HIVepidemic and progress in 2010.
Available at: http://wwwwhoint/hiv/pub/progress_report2011/global_facts/en/indexhtml,
(2011), (last accessed 09/09/2014).
3 World Health Organisation. Consolidated guidelines on the use of antiretroviral drugs for
treating and preventing HIV infection. Recommendations for a public health approach. June
2013. Available at:
http://appswhoint/iris/bitstream/10665/85321/1/9789241505727_engpdf?ua=1, (2013), (last
accessed 09/09/2014).
4 Haas, D.W. et al. A phase II, double-bliind, placebo-controlled, dose ranging study to assess
the antiretroviral activity and safety of efavirenz in combination with open-label zidovudine
with lamivudine at 36 weeks [DMP 266-005]. In: The XII International AIDS Conference,
Geneva, Switzerland Abstract 22334 (1998).
5 Puls, R. et al. Efficacy of 400 mg efavirenz versus standard 600 mg dose in HIV- infected,
antiretroviral-naive adults (ENCORE1): a randomised, double-blind, placebo- controlled,
non-inferiority trial. Lancet 383, 1474-82 (2014).
6 Hill, A. Optimizing HIV treatment. Curr Opin HIV AIDS 8, 34-40 (2013).
7 Cortes, C.P., Siccardi, M., Chaikan, A., Owen, A., Zhang, G. & la Porte, C.J. Correlates of
efavirenz exposure in Chilean patients affected with human immunodeficiency virus reveals
This article is protected by copyright. All rights reserved.

27
a novel association with a polymorphism in the constitutive androstane receptor. Ther Drug
Monit 35, 78-83 (2013).
8 Kwara, A., Lartey, M., Sagoe, K.W., Rzek, N.L. & Court, M.H. CYP2B6 (c.516G-->T) and
CYP2A6 (*9B and/or *17) polymorphisms are independent predictors of efavirenz plasma
concentrations in HIV-infected patients. Br J Clin Pharmacol 67, 427-36 (2009).
9 Mukonzo, J.K. et al. A novel polymorphism in ABCB1 gene, CYP2B6*6 and sex predict
single-dose efavirenz population pharmacokinetics in Ugandans. Br J Clin Pharmacol 68,
690-9 (2009).
10 Wyen, C. et al. Impact of CYP2B6 983T>C polymorphism on non-nucleoside reverse
transcriptase inhibitor plasma concentrations in HIV-infected patients. J Antimicrob
Chemother 61, 914-8 (2008).
11 Gutierrez, F. et al. Prediction of neuropsychiatric adverse events associated with long- term
efavirenz therapy, using plasma drug level monitoring. Clin Infect Dis 41, 1648-53 (2005).
12 Marzolini, C., Telenti, A., Decosterd, L.A., Greub, G., Biollaz, J. & Buclin, T. Efavirenz
plasma levels can predict treatment failure and central nervous system side effects in HIV-1-
infected patients. AIDS 15, 71-5 (2001).
13 Rotger, M. et al. Influence of CYP2B6 polymorphism on plasma and intracellular
concentrations and toxicity of efavirenz and nevirapine in HIV-infected patients.
Pharmacogenet Genomics 15, 1-5 (2005).
14 Arab-Alameddine, M. et al. Pharmacogenetics-based population pharmacokinetic analysis
of efavirenz in HIV-1-infected individuals. Clin Pharmacol Ther 85, 485-94 (2009).
15 Nyakutira, C. et al. High prevalence of the CYP2B6 516G-->T(*6) variant and effect on the
population pharmacokinetics of efavirenz in HIV/AIDS outpatients in Zimbabwe. Eur J Clin
This article is protected by copyright. All rights reserved.

28
Pharmacol 64, 357-65 (2008).
16 di Iulio, J. et al. In vivo analysis of efavirenz metabolism in individuals with impaired
CYP2A6 function. Pharmacogenet Genomics 19, 300-9 (2009).
17 Olagunju, A. et al. CYP2B6 516G>T (rs3745274) and smoking status are associated with
efavirenz plasma concentration in a Serbian cohort of HIV patients. Ther Drug Monit 36,
734-8 (2014).
18 Swart, M., Whitehorn, H., Ren, Y., Smith, P., Ramesar, R.S. & Dandara, C. PXR and CAR
single nucleotide polymorphisms influence plasma efavirenz levels in South African
HIV/AIDS patients. BMC Med Genet 13, 112 (2012).
19 Holzinger, E.R. et al. Genome-wide association study of plasma efavirenz pharmacokinetics
in AIDS Clinical Trials Group protocols implicates several CYP2B6 variants.
Pharmacogenet Genomics 22, 858-67 (2012).
20 Mukonzo, J.K. et al. Pharmacogenetic-based efavirenz dose modification: suggestions for an
African population and the different CYP2B6 genotypes. PloS One 9, e86919 (2014).
21 Decloedt, E.H. & Maartens, G. Neuronal toxicity of efavirenz: a systematic review. Expert
Opin Drug Saf 12, 841-6 (2013).
22 Kenedi, C.A. & Goforth, H.W. A systematic review of the psychiatric side-effects of
efavirenz. AIDS Behav 15, 1803-18 (2011).
23 Clifford, D.B. et al. Impact of efavirenz on neuropsychological performance and symptoms
in HIV-infected individuals. Ann Intern Med 143, 714-21 (2005).
24 Siccardi, M. et al. Pharmacokinetic and pharmacodynamic analysis of efavirenz dose
reduction using an in vitro-in vivo extrapolation model. Clin Pharmacol Ther 92, 494- 502
(2012).
This article is protected by copyright. All rights reserved.

29
25 Tovar-y-Romo, L.B. et al. Dendritic spine injury induced by the 8-hydroxy metabolite of
efavirenz. J Pharmacol Exp Ther 343, 696-703 (2012).
26 Winston, A. et al. Cerebrospinal-fluid exposure of efavirenz and its major metabolites when
dosed at 400 and 600 mg once daily; a randomised controlled trial. Clin Infect Dis DOI:
10.1093/cid/ciu976, (2014).
27 Bristol-Myers Squibb Company. Sustiva (efavirenz) capsules and tablets for oral use:
Highlights of Prescribing Information. Available at:
http://packageinsertsbmscom/pi/pi_sustivapdf, (2014), (last accessed 19/08/2014).
28 Gallant, J.E. et al. Tenofovir DF, emtricitabine, and efavirenz vs. zidovudine, lamivudine,
and efavirenz for HIV. New Engl J Med 354, 251-60 (2006).
29 Wyen, C. et al. Cytochrome P450 2B6 (CYP2B6) and constitutive androstane receptor
(CAR) polymorphisms are associated with early discontinuation of efavirenz-containing
regimens. J Antimicrob Chemother 66, 2092-8 (2011).
30 Gatanaga, H. et al. Successful efavirenz dose reduction in HIV type 1-infected individuals
with cytochrome P450 2B6 *6 and *26. Clin Infect Dis 45, 1230-7 (2007).
31 Sukasem, C. & Sungkanuparph, S. Would a CYP2B6 test help HIV patients being treated
with efavirenz? Pharmacogenomics 14, 999-1001 (2013).
32 Lubomirov, R. et al. Association of pharmacogenetic markers with premature
discontinuation of first-line anti-HIV therapy: an observational cohort study. J Infect Dis
203, 246-57 (2011).
33 Regazzi, M., Carvalho, A.C., Villani, P. & Matteelli, A. Treatment optimization in patients
co-infected with HIV and Mycobacterium tuberculosis infections: focus on drug- drug
interactions with rifamycins. Clin Pharmacokinet 53, 489-507 (2014).
This article is protected by copyright. All rights reserved.

30
34 Hill, A., Khoo, S. & Back, D. The induction effect of rifampicin on efavirenz is time-
dependent: systematic review of 12 drug interaction studies. In: International Workshop on
HIV Clinical Pharmacology, Washington DC, USA Abstract P29, (2014).
35 Luetkemeyer, A.F. et al. Relationship between weight, efavirenz exposure, and virologic
suppression in HIV-infected patients on rifampin-based tuberculosis treatment in the AIDS
Clinical Trials Group A5221 STRIDE Study. Clin Infect Dis 57, 586-93 (2013).
36 World Health Organisation. Technical update on treatment optimization. Use of efavirenz
during pregnancy: a public health perspective. June 2012. Available at:
http://appswhoint/iris/bitstream/10665/70920/1/9789241503792_engpdf?ua=1, (2012), (last
accessed 09/09/2014).
37 Hill, A., Ford, N., Boffito, M., Pozniak, A. & Cressey, T.R. Does pregnancy affect the
pharmacokinetics of efavirenz? AIDS 28, 1542-3 (2014).
38 Olagunju, A. et al. Pharmacogenetics of pregnancy-induced changes in efavirenz
pharmacokinetics. Clin Pharmacol Ther 97, 298-306 (2014).
39 Amara, A.B., Tjia, J., Dutton, J., Else, L.J., Back, D.J. & Khoo, S. Development and
validation of a HPLC-MS/MS assay to quantify the antiretroviral (ARV) drug, efavirenz and
its major metabolites in plasma. In: British Mass Spectrometry Society Meeting, Cardiff, UK
Abstract BMS S11-1240, (2011).
40 Olagunju, A. et al. CYP3A4*22 (c.522-191 C>T; rs35599367) is associated with lopinavir
pharmacokinetics in HIV-positive adults. Pharmacogenet Genomics 24, 459- 63 (2014).
41 Beal, S. & Sheiner, L.B. NONMEM Users Guide. ICON Development Soluntions, Ellicott
City, Maryland, USA, (1989-1998).
42 Kappelhoff, B.S. et al. Population pharmacokinetics of efavirenz in an unselected cohort of
This article is protected by copyright. All rights reserved.

31
HIV-1-infected individuals. Clin Pharmacokinet 44, 849-61 (2005).
This article is protected by copyright. All rights reserved.

32
Figure Legends
Figure 1. Flow diagram summarising (a) the data included in the population PK model and (b)
genetic data available for analysis.
Figure 2. Efavirenz concentrations on a log-linear scale following 400mg once daily (grey),
600mg once daily (white) and 800mg once daily (black) dosing (n=1491 concentrations; n=606
patients). Black lines connect the points of the full pharmacokinetic profiles of those patients
with intensive sampling included in the pharmacokinetic substudy (n=46 patients)
Figure 3. Mean individual predicted efavirenz concentrations at 12 hours post-dose (C12) on a
log scale stratified for metaboliser status (extensive, intermediate, slow) and dose (400mg and
600mg once daily; n=295 and n=273, respectively). The black dashed line illustrates the
recommended minimum effective concentration for efavirenz (MEC) of 1.0mg/L. Each point
represents an individual patient and the solid black line the median concentrations. Numbers of
patients with C12 below the MEC or with detectable or missing viral load at 48 weeks are shown.
This article is protected by copyright. All rights reserved.

Table 1 Clinical characteristics and demographics of patients included in the model (n=606).
Parameter Median (range)*
Female [n (%)] 191 (32)
Age (years) 35 (18-69)
Weight (kg) 65 (39-148)
Height (m) 1.68 (1.44-1.90)
BMI (kg/ m2) 23 (15-50)
FFM (kg) 87 (41-206)
CrCL (ml/min) 113 (54-264)
CD4+ T cell count (cells/ mm3) 270 (40-679)
HIV-RNA at week 0 (copies/mL) 56803 (162-10000000)
HIV-RNA <200 copies/mL at 48 weeks† [n (%)] 577 (97)
Randomised dose [n (%)]
400mg efavirenz once daily 311 (51)
600mg efavirenz once daily 295 (49)
Ethnicity [n (%)]
Aboriginal and Torres Strait Islander (ATSI) 1 (0.2)
African 226 (37)
Asian 201 (33)
Caucasian 76 (13)
Hispanic 102 (17)
CYP2B6 516G>T¥ [n (%)]
GG 253 (44)
GT 262 (46)
This article is protected by copyright. All rights reserved.

TT 59 (10)
CYP2B6 983T>C¥ [n (%)]
TT 535 (93)
TC 36 (6.0)
CC 3 (0.5)
CYP2B6 15582C>T§ [n (%)]
CC 320 (56)
CT 222 (39)
TT 31 (5.0)
CYP2A6 *9B# [n (%)]
CC 466 (82)
CA 90 (16)
AA 14 (3.0)
CYP2A6 *17¶ [n (%)]
CC 514 (90)
CT 55 (10)
TT 3 (0.5)
CYP3A4 *22§ [n (%)]
GG 545 (95)
GA 28 (5.0)
AA 0 (0.0)
NR1I3 540C>T¥ [n (%)]
CC 285 (50)
CT 205 (36)
TT 84 (15)
This article is protected by copyright. All rights reserved.

NR1I3 1089T>C¥ [n (%)]
TT 153 (27)
TC 277 (48)
CC 144 (25)
BMI: body mass index; FFM: fat free mass; CrCL: creatinine clearance
* unless stated otherwise
† n=593 available viral load measurements at week 48 (13/606 missing)
¥ n=574; § n=573; # n=570; ¶ n=572
This article is protected by copyright. All rights reserved.

Table 2 Geometric mean (90% CI) of mean individual predicted PK parameters for 400mg
and 600mg efavirenz. Differences in parameters were assessed by geometric mean ratios
(GMR) and 90% CI (n=605).
Parameter 400mg EFV 600mg EFV GMR (90% CI)*
AUC0-24 (mg.h/ L) 49.2 (47.0-51.5) 67.2 (63.8-70.9) 0.73 (0.68-0.78)
Cmax (mg/L) 2.52 (2.42-2.62) 3.66 (3.51-3.81) 0.69 (0.65-0.73)
C24 (mg/L) 1.40 (1.32-1.49) 1.82 (1.68-1.97) 0.77 (0.70-0.85)
C12 (mg/L) 2.10 (2.01-2.20) 2.85 (2.70-3.0) 0.74 (0.69-0.79)
* efavirenz 400mg/efavirenz 600mg
EFV: efavirenz; CI: confidence interval; AUC0-24: area under the concentration-time curve
over 24 hour interval; Cmax: maximum concentration; C24: trough concentration, 24 hours
post-dose; C12: concentration 12 hours post-dose representing the mid-dose interval
This article is protected by copyright. All rights reserved.

Table 3 Mean individual predicted PK parameters stratified by dose and composite CYP2B6 516G>T/983T>C/CYP2A6*9B/*17 genotype
(defined as extensive, intermediate, slow) predicted by the final model (n=568 patients)*. Data presented as median (range).
Efavirenz 400mg once daily Efavirenz 600mg once daily
Extensive
(n=119)
Intermediate
(n=128)
Slow
(n=48)
Extensive
(n=107)
Intermediate
(n=127)
Slow
(n=39)
CL/F (L/h)
CV (%)
10.7 (4.69-25.6)
33
8.05 (2.14-27.3)
37
4.12 (1.45-45.9)
124
12.4 (5.11-69.7)
55
8.93 (2.98-65.4)
62
3.55 (1.69-58.2)
155
AUC0-24 (mg.h/L)
CV (%)
37.6 (17.6-85.4)
32
49.9 (14.8-187)
37
97.5(20.7-285)
49
49.2 (8.61-117)
34
67.6 (12.4-202)
38
171 (19.2-359)
47
Tmax (h)
CV (%)
3.98 (3.35-4.22)
3.5
4.08 (3.28-4.32)
3.4
4.27 (3.11-4.39)
5.1
3.93 (2.23-4.23)
6.3
4.04 (2.64-4.32)
4.4
4.27 (2.74-4.38)
7.1
Cmax (mg/L)
CV (%)
1.97 (0.95-4.14)
28
2.51 (1.10-8.34)
32
4.38 (1.38-12.2)
45
2.80 (1.53-5.79)
27
3.71 (1.69-9.03)
32
7.80 (1.75-15.6)
42
C24 (mg/L)
CV (%)
0.970 (0.305-2.79)
44
1.46 (0.169-7.00)
48
3.54 (0.341-11.3)
56
1.28 (0.00247-3.94)
47
1.94 (0.0789-7.55)
51
6.24 (0.243-14.1)
52
C12 (mg/L)
CV (%)
1.60 (0.734-3.65)
32
2.14 (0.579-7.89)
37
4.13 (0.845-12.0)
49
2.11 (0.119-5.02)
35
2.90 (0.377-8.52)
38
7.25 (0.684-15.09)
47
This article is protected by copyright. All rights reserved.

Half-life (h)
CV (%)
17.5 (7.71-37.0)
31
22.8 (6.09-69.1)
36
48.0 (8.78-152)
49
15.9 (2.13-40.4)
34
20.5 (3.70-68.6)
39
49.4 (4.92-125)
46
C12<1.0mg/L [n (%)] 10 (8.4) 2 (1.6) 2 (4.2) 3 (2.8) 1 (0.79) 2 (5.1)
VL>200copies/mL [n (%)]† 1 (0.85) 6 (4.8) 2 (4.3) 2 (1.9) 2 (1.6) 2 (5.6)
* 37/605 with missing composite genotype (n=15 400mg EFV; n=22 600mg EFV)
† 555/568 patients with a viral load at 48 weeks (n=13 missing)
CL/F: apparent oral clearance; AUC0-24: area under the curve over the 24 hour dosing interval; Tmax: time of maximum concentration; Cmax:
maximum concentration; C24: trough concentration, 24 hours post-dose; C12: concentration 12 hours post-dose representing the mid-dose
interval; CV: co-efficient of variation; VL: viral load
This article is protected by copyright. All rights reserved.

Table 4 Differences in mean individual predicted PK parameters for toxicity end-points, assessed by calculation of geometric mean ratios
(GMR) and 90% CI (n=606).
GMR (90% CI)*
Parameter Discontinuation Efavirenz-related adverse event Serious adverse event CNS adverse event
AUC0-24 0.90 (0.78-1.04) 0.95 (0.88-1.02) 0.97 (0.84-1.12) 0.97 (0.90-1.05)
Cmax 0.88 (0.78-1.00) 0.93 (0.87-1.00) 0.99 (0.87-1.12) 0.96 (0.90-1.02)
C24 0.94 (0.77-1.14) 0.96 (0.87-1.07) 0.93 (0.76-1.14) 1.00 (0.90-1.10)
C12 0.90 (0.78-1.05) 0.95 (0.88-1.03) 0.96 (0.83-1.12) 0.98 (0.91-1.05)
* did not have the event/had the event
CI: confidence interval; AUC0-24: area under the concentration-time curve over 24 hour interval; Cmax: maximum concentration; C24: trough
concentration, 24 hours post-dose; C12: concentration 12 hours post-dose representing the mid-dose interval
This article is protected by copyright. All rights reserved.

EFV: efavirenz; PK: pharmacokinetics; WK: week; LLQ: lower limit of quantification; ITT: intent to treat!
(a) (b)
This article is protected by copyright. All rights reserved.

0.01
0.1
1
10
100
0 5 10 15 20 25 30
Efav
irenz
(mg/
L)
Time (h)
This article is protected by copyright. All rights reserved.
C12<1·0mg/L (n) 10 2 2 0 3 1 2 0
VL≥200copies/mL (n) 1 6 2 0 2 2 2 1
Missing VL (n) 2 2 2 0 2 0 3 2
C12<1·0mg/L
&
VL≥200copies/mL (n)
0 0 1 0 1 1 1 0
C12: concentration 12 hours post-dose representing the mid-dose interval concentration; VL:
viral load
Extensive Intermediate Slow Missing Extensive Intermediate Slow Missing0.01
0.1
1
10
100·
400mg efavirenz 600mg efavirenz
Mea
n in
divi
dual
pre
dict
edef
avire
nz C
12 (m
g/L)
This article is protected by copyright. All rights reserved.