Naïve definitions of action and inaction: The continuum, spread, and valence of behaviors
ORIGINAL ARTICLE
Mitochondrial Dysfunction, Persistent Oxidative Damage,and Catalase Inhibition in Immune Cells of Naıve andTreated Crohn’s Disease
Bel�en Beltr�an, MD, PhD,*,† Pilar Nos, MD, PhD,*,† Francisco Dası, PhD,‡ Marisa Iborra, MD,§
Guillermo Bastida, MD,*,† Marcial Martınez, PhD,k Jos�e-Enrique O’Connor, PhD,¶
Guillermo S�aez, MD, PhD,** In�es Moret, PhD,‡ and Julio Ponce, MD, PhD*,†
Background: Oxidative stress is considered a potential etiologi-
cal factor for Crohn’s disease (CD). We characterized the reactive
oxygen species (ROS) generated in immune peripheral cells of
CD patients, as well as their antioxidant enzyme status and the
presence of oxidative damage. In addition, mitochondrial function
(DWm) was analyzed to detect the possible origin of ROS.
Methods: Cells were obtained from patients at the onset of dis-
ease, prior to any treatment. Experiments were repeated when
patients were in clinical remission. A set of experiments was car-
ried out in a group of CD patients in persistent morphological
remission. Controls were healthy volunteers who were not receiv-
ing any treatment at the time. The generation of superoxide,
hydrogen peroxide (H2O2) and nitric oxide, DWm, superoxide dis-
mutase (SOD) and catalase (CAT) activities, and concentrations
of malondyaldehyde (MDA) and 8-oxo-deoxyguanosine (8-oxo-
dG) were measured.
Results: SOD activity and H2O2 production were significantly
higher during active CD but returned to control levels in remis-
sion. DWm was inhibited during active CD and, although it
returned to control levels, its recovery took longer than clinical
remission. CAT activity was permanently inhibited during CD, in-
dependent of the disease activity. MDA and 8-oxo-dG were per-
manently elevated.
Conclusions: Oxidative stress during active CD depends on
H2O2 production. The inhibition of DWm suggests that this organ-
elle is a source of ROS. CAT is permanently inhibited in CD, the
biological significance of which is under study. The persistent
oxidative damage detected may have implications for the evolu-
tion of the disease.
(Inflamm Bowel Dis 2010;16:76–86)
Key Words: Crohn’s disease, oxidative stress, mitochondria,Catalase, antioxidant enzymes
T he cause of Crohn’s disease (CD) remains unclear.1
The specific pathways leading to mucosa damage are
not completely understood. The role of oxidative stress as
a potential etiological and/or triggering factor for inflam-
matory bowel disease (IBD) has been the subject of
increasing interest.2,3 The activated immune cells that reach
the mucosa in IBD release a number of reactive oxygen
species (ROS) that are potentially detrimental, especially
when the antioxidant defenses are overwhelmed and oxida-
tive stress is established.4 In fact, evidence of epithelial
cell injury secondary to ROS has been detected in the mu-
cosa of IBD patients.5,6 However, excessive levels of oxi-
dized molecules in IBD are not only detected in the mu-
cosa but in a variety of organic systems (plasma, serum,
saliva, exhaled air).7,8 Similarly, the expression of antioxi-
dants in IBD patients has been analyzed by several
reports7–10 that have detected an imbalance in antioxidant
concentration, thus confirming the presence of oxidative
stress in the vital organs of IBD patients. Furthermore, the
capacity of the peripheral immune cells of IBD patients to
produce ROS is known to be altered, and this alteration is
thought to imply an altered immune response that occurs
before the cells reach the intestinal mucosa.11,12
Received for publication April 6, 2009; Accepted May 14, 2009.
From the *Department of Gastroenterology, Hospital Universitari La Fe,
Valencia, †Centro de Investigacion Biomedica en Red de Enfermedades
Hepaticas y Digestivas (CIBEREHD), ‡Fundacion Investigacion Hospital
Clınico Universitario de Valencia, §Fundacion Investigacion Hospital La Fe,
Hospital Universitari La Fe, kFlow Cytometry Unit, Service of Clinical
Analysis, Hospital Universitari La Fe, Valencia, ¶Laboratory of Cytomics,
Mix Unit CIPF-UVEG, Centro de Investigacion Prıncipe Felipe, Valencia,
**Department of Biochemistry and Molecular Biology, Faculty of Medicine,
General University Hospital of Valencia, Valencia, Spain.
Reprints: Bel�en Beltr�an, MD, PhD, Department of Gastroenterology,
Hospital Universitari La Fe, Avda Campanar 21, 46009 Valencia, Spain
(e-mail: [email protected]).
Supported by public funding from the Fondo de Investigaciones
Sanitarias (Instituto de Salud Carlos III) with grants: CP05/0272, FIS
IP05/017, FIS IP06/0730. CIBEREHD (Centro de investigacion biomedica
en red sobre Hepatologıa y Gastroenterologia) is also funded by the
Instituto de Salud Carlos III.
Copyright VC 2009 Crohn’s & Colitis Foundation of America, Inc.
DOI 10.1002/ibd.21027
Published online 27 July 2009 in Wiley InterScience (www.interscience.
wiley.com).
Inflamm Bowel Dis � Volume 16, Number 1, January 201076
The presence of ROS in IBD has been measured
indirectly according to levels of oxidatively damaged mole-
cules. Little work has been carried out to characterize the
ROS directly implicated in damage.13 Similarly, the possi-
ble sources of ROS in IBD have received little attention.
Mitochondria are key organelles considered an important
source of ROS after dysfunction or inhibition of their respi-
ratory chain. Mitochondria, through production of these
ROS, have been implicated in the regulation of autoim-
munity, apoptosis, and autophagy.14 The status of mito-
chondrial function has never been characterized in IBD,
although recent reports refer to morphological changes in
the mitochondria of the ileal enterocites of patients with
IBD.15 Furthermore, a possible role of the mitochondria in
the pathogenesis of IBD has been reported in a clinical
case.16 Finally, many studies have measured either ROS4,8
or antioxidant capacities9–11 in order to evaluate the oxida-
tive stress in IBD. However, it is important to measure
both ROS levels and the antioxidant status of the cell in
order to avoid the biased conclusions based on the consid-
eration of only 1 side of the balance.3
The purpose of the present study was to characterize
the ROS species that are generated in immune peripheral
cells in patients with CD (active and inactive), as well as
the enzyme-dependent antioxidant status of the cells and
the establishment of oxidative damage. Furthermore, we
analyzed the mitochondrial function of immune cells in
order to study their possible implication in the generation
of ROS. We performed the experiments in cells from
patients at the onset of disease, prior to initiating treatment,
in order to avoid the bias that medication could exert with
respect to ROS generation. We studied the active and inac-
tive status of CD in the same patient with the aim of char-
acterizing how the production of ROS and oxidative dam-
age varies with activity. Knowing the oxidative status of
peripheral immune cells will help to understand their func-
tionality to deal with inflammation when they reach the gut
mucosa.
MATERIALS AND METHODS
Patients and ControlsTwenty-five consecutive CD patients at onset of dis-
ease (diagnosed according to Lennard-Jones criteria17) and
yet to begin any specific medication were included in the
study. Patients with doubtful diagnoses, those suffering
from another disease, and those taking any form of medica-
tion were excluded from the study. Patients were classified
according to Montreal Criteria18 and disease activity was
scored with the Harvey–Bradshaw index.19 The experi-
ments were carried out at the onset of disease (active
patients), and were repeated when clinical remission was
achieved (defined as a disease activity index less than or
equal to 4) (remission patients). A total of 19 patients were
analyzed in remission. It was not possible to repeat the
experiments in 6 patients for various reasons. The control
group consisted of 25 healthy volunteers who were not tak-
ing any medication at the time.
A set of experiments was carried out in a group of
patients diagnosed with CD over the 5 previous years and
who were in persistent clinical remission (Harvey <4 for
more than 6 months) and had no morphological lesions
(n ¼ 20) (inactive patients). Mucosal healing was evaluated
by colonoscopy or capsulendoscopy according to disease
localization.
All the subjects gave their written informed consent.
On the day of recruitment for the study a complete hemato-
logical and biochemistry blood analysis, including acute
phase reactants, was performed. Only those subjects with a
completely normal blood test result were included as con-
trols. The study was approved by the Ethical Committee of
the Hospital Universitari La Fe and complied with the Dec-
laration of Helsinki.
Chemicals and InstrumentsConjugated antibodies CD4.PE/CY5, CD3.FITC, and
CD3.ECD were from Immunotech (Marseille, France). His-
topaque 1007, dimethylsulfoxide (DMSO), t-butylhydroper-
oxide (TBH), N-[2-hydroxyethyl]piperazine-N0-[2-ethane-
sulfonic acid] (HEPES) buffer, 20,70dichlorofluorescein
diacetate (DCFH), dihydroethidium (HE), plumbagin (PB),
and Carbonyl cyanide 4-(trifluoromethoxy) phenylthydra-
zone (FCCP), and diethylthiocarbamate (DETC) were
obtained from Sigma-Aldrich (St. Louis, MO). RPMI 1640
culture medium, L-glutamine, penicillin-streptomycin, and
fetal bovine serum were from Gibco (Grand Island, NY).
Tetramethylrhodamine methyl ester perchlorate (TMRM)
was purchased from Fluka (Buchs, Switzerland). 3-
Amino,4-aminomethyl-2070-difluorofluorescein (DAF2-DA)
was from Calbiochem (La Jolla, CA). Bioxytech Catalase-
520 and Bioxytech SOD-525 were from OxysResearch
(Foster City, CA).
Isolation of Peripheral LeukocytesAnticoagulated blood (K3-EDTA) was obtained from
patients and healthy volunteers after 12 hours fasting. Leu-
kocytes were isolated by the Histopaque 1077 gravity tech-
nique. This consisted of layering 3 mL whole blood over 8
mL of Histopaque 1077 (Sigma-Aldrich) in a 15-mL plastic
tube. After 45–60 minutes of gravity sedimentation at room
temperature, the white cell-rich plasma (upper layer) was
removed for the experiment. White cells were diluted 1:0.5
v/v with RPMI 1640 culture medium (Gibco) supplemented
with 10% fetal bovine serum, penicillin (100 U/mL), and
streptomycin (1009 lg/mL) and 1� glutamine, and were
Inflamm Bowel Dis � Volume 16, Number 1, January 2010 Mitochondria and Oxidative Status in CD
77

incubated at 37�C until the experiment was carried out.
After counting the cells, leukocytes were adjusted to a
concentration of 500,000 cells/mL with RPMI.
Cytometric MeasurementsCytometric assays were carried out in an EPICS-XL-
MCL flow cytometer (Beckman-Coulter, Fullerton, CA).
System II software (Beckman-Coulter) was used for data
acquisition. Results are expressed as mean fluorescence in-
tensity in arbitrary units. Leukocytes were gated for lym-
phocytes, monocytes, or granulocytes according to their
morphology and leukocyte lineage markers using fluoro-
chrome-labeled monoclonal antibodies. Thus, CD3-FITC,
or CD3-ECD and CD4-PC5 staining together with forward
scatter and side scatter signals defined the criteria to gate
out other cells and debris. Accordingly, T-helper lympho-
cytes were identified as CD3þ/CD4þ cells, monocytes as
CD3�/CD4þ cells and granulocytes were identified exclu-
sively by their morphology.
O22, H2O2, and NO Production Assessment
Our assay consisted of taking an aliquot of cells (150
lL) and incubating them in darkness for 10 minutes at
37�C with CD3 (CD3-FITC, 5 lL) and CD4 (CD4-PC5,
5 lL) markers for the protocol of O2� production assess-
ment and with CD3 (CD3-ECD, 5 lL) and CD4 (anti-
CD4-PC5, 5 lL) markers for the protocols of H2O2 and
NO detection. Once the cells were stained, 850 lL of
HEPES was added and the sample was run in the cytome-
ter to achieve the blank values of each immune cell
population.
O2� assay was based on dyhydroethidium (HE) oxi-
dation.20 When oxidized, HE exhibits red fluorescence
(absorption/emission: 518/605 nm). HE was added at a
final concentration of 5 lM, incubated for 1 hour, and the
fluorescence generated measured by flow cytometry. Once
the basal production of O2� had been achieved, a 2.5 mM
dose of PB, a superoxide generator,21 was added to the
sample in order to induce a peak of O2�.
The assay to detect H2O2 was based on DCFH oxida-
tion. This probe has low basal fluorescence but, when oxi-
dized by H2O2 in the presence of peroxidase, it is con-
verted to 2070-dichlorofluorescein (DCF) with a high
fluorescent component at 520 nm.22 DCFH was added at a
final concentration of 20 lM, incubated for 1 hour, and the
fluorescence generated measured by flow cytometry. Once
basal production of H2O2 had been achieved, a 10 mM
dose of t-butyl-hydroperoxyde (TBH), a hydrogen peroxide
generator, was added to the sample in order to induce a
peak of H2O2.
The production of NO was assayed using the fluores-
cent probe 4,5-diaminofluorescein diacetate (DAF-2/DA),
as described elsewhere.23 DAF-2/DA was added at a final
concentration of 5 lM, incubated for 1 hour, and the green
fluorescence generated measured by flow cytometry.
Mitochondrial Membrane Potential (DWm)DWm was assessed using the cationic-lipophilic tetra-
methylrodhodamine methyl ester (TMRM), an indicator
dye that accumulates inside the mitochondria in proportion
to their membrane potential. At low concentrations,
TMRM does not suppress cell respiration.24 The method
consisted of incubating an aliquot of cells (100 lL) in
darkness at 37�C for 5 minutes with CD3 (CD3-FITC, 10
lL) and CD4 (CD4-PC5, 5 lL) markers. Once the cells
were stained, 2 aliquots of 50 lL were diluted with HEPES
to 1 mL. TMRM, at a final concentration of 500 nM, was
added to 1 of the tubes and incubated for 1 hour. DWm
was then measured using previously designed acquisition
protocols. The remaining tube was used as blank and its
value was subtracted from the values achieved in the tube
containing TMRM.
Enzyme AssaysThe activity of enzymes involved in ROS metabo-
lism, superoxide dismutase (SOD) and catalase (CAT), in
cell lysates were determined. Protein concentrations were
determined by Bradford’s method.25
Quantification of Total SOD ActivitySOD activity was measured using the Bioxytech
SOD-525 kit (OxisResearch, Beverly Hills, CA; Cat. No.
21010), according to the manufacturer’s instructions.
Quantification of Catalase ActivityCatalase activity was measured using the Bioxytech
Catalase-520 kit (OxisResearch; Cat. No. 21042) according
to the manufacturer’s instructions.
Oxidative Damage Assessment
Malondialdehyde (MDA) AssayPlasma MDA was analyzed by high-performance liq-
uid chromatography (HPLC) according to the modified pro-
cedure described by Wong et al.26 In short, this method
consists of hydrolizing plasma lipoperoxides by boiling
them in dilute phosphoric acid. MDA, 1 of the hydrolysis
products, reacts with thiobarbituric acid (TBA) to form
MDA(TBA)2 adducts. The protein-free extract is fractioned
by HPLC on a column of octadecyl silica gel in order to
separate the MDA-TBA adduct from interfering chromo-
gens. The MDA-TBA adduct is eluted from the column
with methanol/phosphate buffer and quantified spectropho-
tometrically at 532 nm.
8-Oxo-deoxy-guanosine (8-oxo-dG) AssayThe DNA hydrolysates were dissolved in HPLC-
grade water and filtered through a 0.2 lm syringe filter
Inflamm Bowel Dis � Volume 16, Number 1, January 2010Beltr�an et al
78
before applying the samples to a Waters ODS HPLC col-
umn (2.5 � 0.46 i.d.; 5 l particle size). The amount of 8-
oxo-dG and dG in the DNA digest was measured by elec-
trochemical and UV absorbance detection, respectively, in
the elution conditions previously described.27 Standard
samples of dG and 8-oxo-dG were analyzed to ensure they
had separated and to allow identification of those derived
from cell DNA.
Statistical AnalysisSPSS Statistic pack 12.0 for Windows (Chicago, IL)
was used for statistical analysis. Statistical comparisons
were performed using the Mann–Whitney nonparametric
test. Results are expressed in the tables and figures as
mean � standard error mean (SEM) or mean � standard
deviation (SD). Pearson correlations were run where appro-
priate. P < 0.05 was considered statistically significant.
RESULTSThe study population consisted of a total of 25 CD
patients at the onset of disease and in remission (n ¼ 19),
25 healthy subjects, and 20 inactive patients. Their demo-
graphic and clinical data are registered in Table 1.
O2� Production
The basal concentration of O2� did not differ signifi-
cantly between control subjects and CD patients in any of
the 3 cell types analyzed (lymphocytes, monocytes, and
granulocytes (Fig. 1, Table 2). Similarly, remission patients
and inactive patients did not differ in their O2� concentra-
tions from controls and active patients (not shown). When
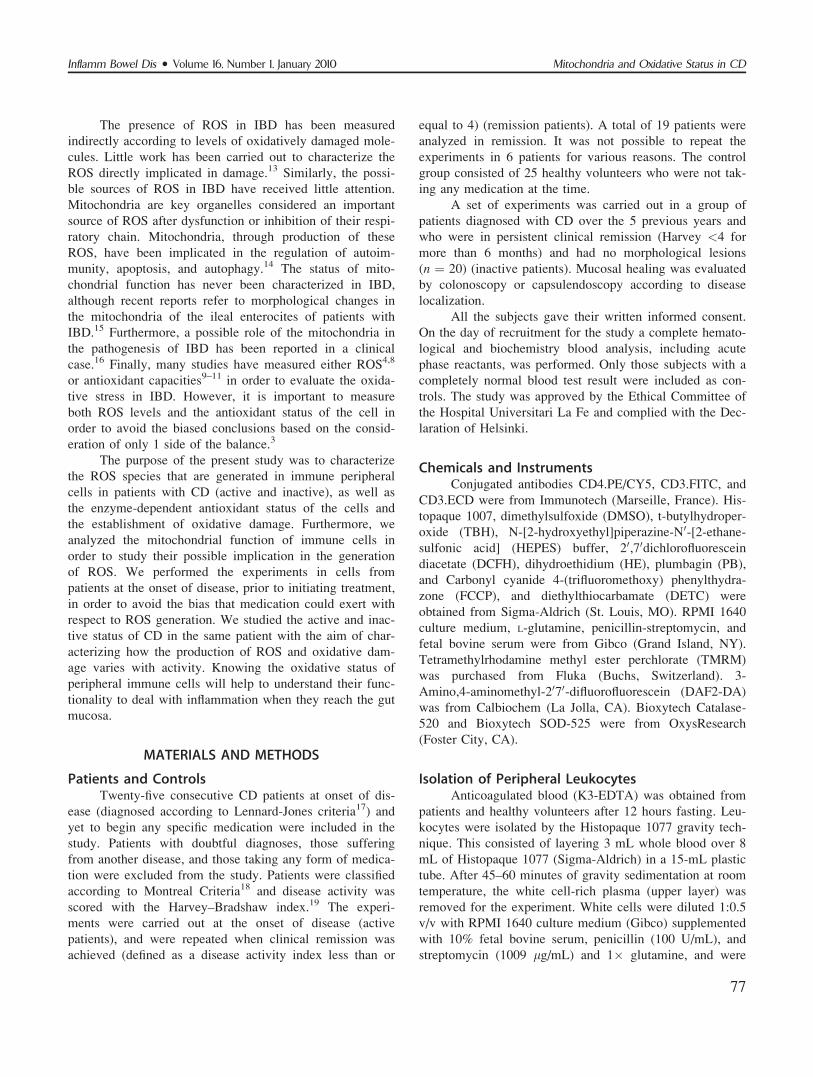
TABLE 1. Demographic and Disease Characteristics of Controls and CD Patients at Onset (Active Patients) and AfterAchieving Remission (Remission Patients)
Control (n¼25) Onset of CD (n¼25) Remission (n¼19) Inactive CD (n¼20)
Age (mean � SD) 32.3 � 12.5 34.42 � 10.73 34.9 � 8 32.5 � 9.6
Gender (M/F) 12 / 13 11 / 14 10 / 9 12/8
Harvey Index (mean � SD) — 8.72 � 2.22 1� 1.2 0.65 � 1.2
CRP (mean � SD) 1.26 � 1.01 77.6 � 73 6.2 � 6.6 3.3 � 3
Fibrinogen (mean � SD) 262 � 71 503 � 132 336.5 � 56.8 317 � 82
ESR (mean � SD) 12.2 � 7 52.1 � 27.8 24 � 12 17.6 � 18
S / nS / eS 14 / 8 / 3 13 / 10 / 2 10 / 8 / 1 10 / 8 / 2
Localization of disease(Montreal Classification)
A
A1: — 0 0 3
A2: — 19 15 12
A3: — 6 4 5
L
L1: — 9 6 9
L2: — 8 7 5
L3: — 7 5 5
L4: — 1 1 1
B
B1: — 17 14 12
B2: — 7 4 3
B3: — 1 1 5
p
Yes: — 10 6 6
No: — 15 13 14
Time until remission(months) (mean � SD)
8.7 � 7
Years since CD wasdiagnosed (mean � SD)
8.35 � 2.7
CRP, C-reactive protein; ESR, erythrocyte sedimentation rate; S/nS/eS, smokers, nonsmokers, exsmokers.
Inflamm Bowel Dis � Volume 16, Number 1, January 2010 Mitochondria and Oxidative Status in CD
79
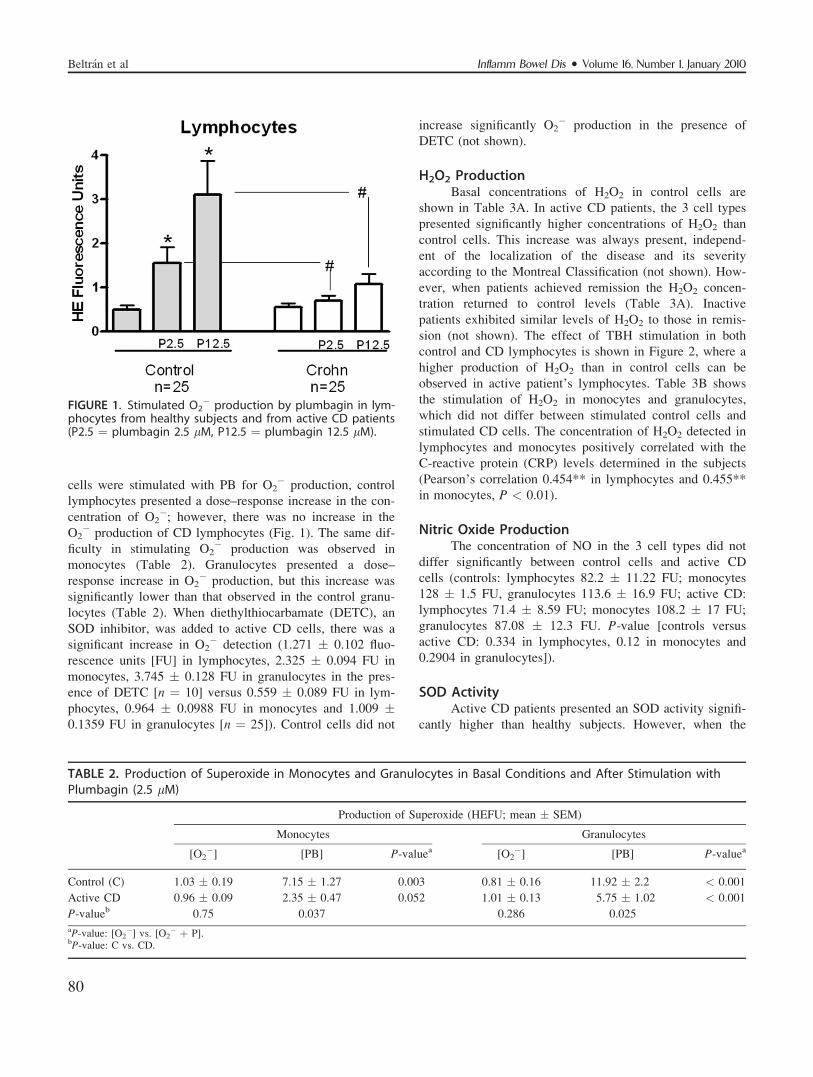
cells were stimulated with PB for O2� production, control
lymphocytes presented a dose–response increase in the con-
centration of O2�; however, there was no increase in the
O2� production of CD lymphocytes (Fig. 1). The same dif-
ficulty in stimulating O2� production was observed in
monocytes (Table 2). Granulocytes presented a dose–
response increase in O2� production, but this increase was
significantly lower than that observed in the control granu-
locytes (Table 2). When diethylthiocarbamate (DETC), an
SOD inhibitor, was added to active CD cells, there was a
significant increase in O2� detection (1.271 � 0.102 fluo-
rescence units [FU] in lymphocytes, 2.325 � 0.094 FU in
monocytes, 3.745 � 0.128 FU in granulocytes in the pres-
ence of DETC [n ¼ 10] versus 0.559 � 0.089 FU in lym-
phocytes, 0.964 � 0.0988 FU in monocytes and 1.009 �0.1359 FU in granulocytes [n ¼ 25]). Control cells did not
increase significantly O2� production in the presence of
DETC (not shown).
H2O2 ProductionBasal concentrations of H2O2 in control cells are
shown in Table 3A. In active CD patients, the 3 cell types
presented significantly higher concentrations of H2O2 than
control cells. This increase was always present, independ-
ent of the localization of the disease and its severity
according to the Montreal Classification (not shown). How-
ever, when patients achieved remission the H2O2 concen-
tration returned to control levels (Table 3A). Inactive
patients exhibited similar levels of H2O2 to those in remis-
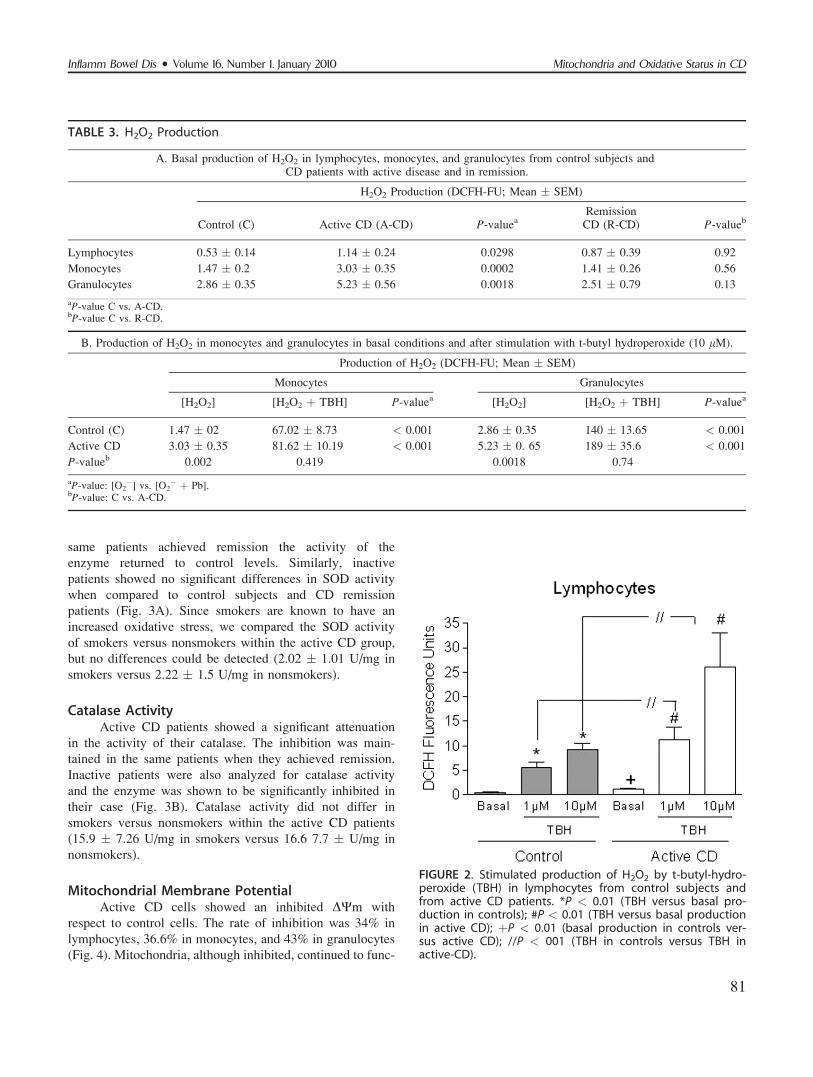
sion (not shown). The effect of TBH stimulation in both
control and CD lymphocytes is shown in Figure 2, where a
higher production of H2O2 than in control cells can be
observed in active patient’s lymphocytes. Table 3B shows
the stimulation of H2O2 in monocytes and granulocytes,
which did not differ between stimulated control cells and
stimulated CD cells. The concentration of H2O2 detected in
lymphocytes and monocytes positively correlated with the
C-reactive protein (CRP) levels determined in the subjects
(Pearson’s correlation 0.454** in lymphocytes and 0.455**
in monocytes, P < 0.01).
Nitric Oxide ProductionThe concentration of NO in the 3 cell types did not
differ significantly between control cells and active CD
cells (controls: lymphocytes 82.2 � 11.22 FU; monocytes
128 � 1.5 FU, granulocytes 113.6 � 16.9 FU; active CD:
lymphocytes 71.4 � 8.59 FU; monocytes 108.2 � 17 FU;
granulocytes 87.08 � 12.3 FU. P-value [controls versus
active CD: 0.334 in lymphocytes, 0.12 in monocytes and
0.2904 in granulocytes]).
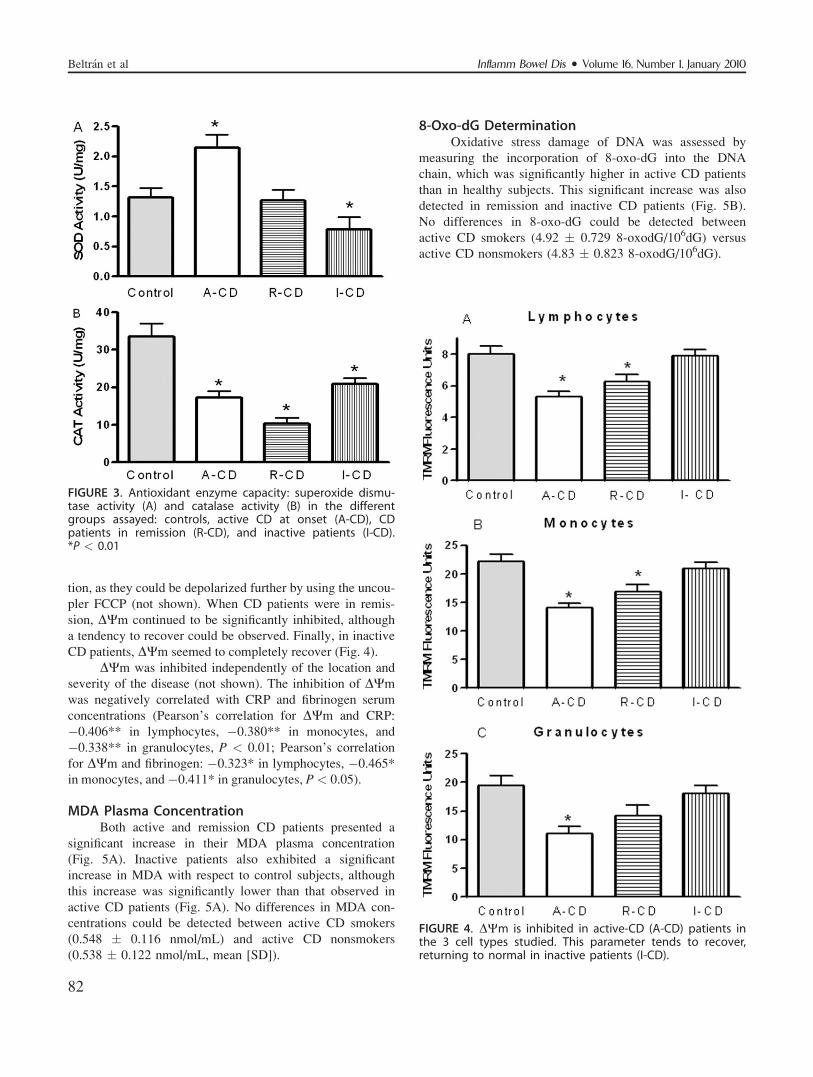
SOD ActivityActive CD patients presented an SOD activity signifi-
cantly higher than healthy subjects. However, when the
FIGURE 1. Stimulated O2� production by plumbagin in lym-
phocytes from healthy subjects and from active CD patients(P2.5 ¼ plumbagin 2.5 lM, P12.5 ¼ plumbagin 12.5 lM).
TABLE 2. Production of Superoxide in Monocytes and Granulocytes in Basal Conditions and After Stimulation withPlumbagin (2.5 lM)
Production of Superoxide (HEFU; mean � SEM)
Monocytes Granulocytes
[O2�] [PB] P-valuea [O2
�] [PB] P-valuea
Control (C) 1.03 � 0.19 7.15 � 1.27 0.003 0.81 � 0.16 11.92 � 2.2 < 0.001
Active CD 0.96 � 0.09 2.35 � 0.47 0.052 1.01 � 0.13 5.75 � 1.02 < 0.001
P-valueb 0.75 0.037 0.286 0.025
aP-value: [O2�] vs. [O2
� þ P].bP-value: C vs. CD.
Inflamm Bowel Dis � Volume 16, Number 1, January 2010Beltr�an et al
80
same patients achieved remission the activity of the
enzyme returned to control levels. Similarly, inactive
patients showed no significant differences in SOD activity
when compared to control subjects and CD remission
patients (Fig. 3A). Since smokers are known to have an
increased oxidative stress, we compared the SOD activity
of smokers versus nonsmokers within the active CD group,
but no differences could be detected (2.02 � 1.01 U/mg in
smokers versus 2.22 � 1.5 U/mg in nonsmokers).
Catalase ActivityActive CD patients showed a significant attenuation
in the activity of their catalase. The inhibition was main-
tained in the same patients when they achieved remission.
Inactive patients were also analyzed for catalase activity
and the enzyme was shown to be significantly inhibited in
their case (Fig. 3B). Catalase activity did not differ in
smokers versus nonsmokers within the active CD patients
(15.9 � 7.26 U/mg in smokers versus 16.6 7.7 � U/mg in
nonsmokers).
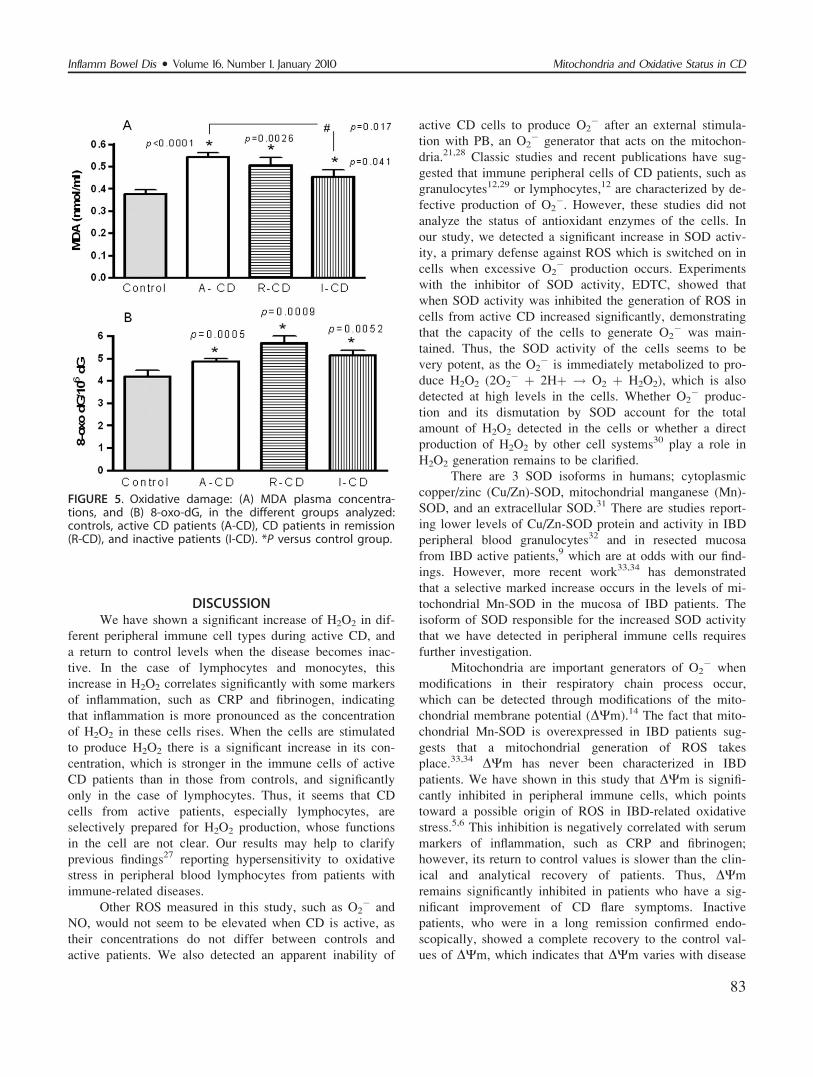
Mitochondrial Membrane PotentialActive CD cells showed an inhibited DWm with
respect to control cells. The rate of inhibition was 34% in
lymphocytes, 36.6% in monocytes, and 43% in granulocytes
(Fig. 4). Mitochondria, although inhibited, continued to func-
TABLE 3. H2O2 Production
A. Basal production of H2O2 in lymphocytes, monocytes, and granulocytes from control subjects andCD patients with active disease and in remission.
H2O2 Production (DCFH-FU; Mean � SEM)
Control (C) Active CD (A-CD) P-valueaRemission
CD (R-CD) P-valueb
Lymphocytes 0.53 � 0.14 1.14 � 0.24 0.0298 0.87 � 0.39 0.92
Monocytes 1.47 � 0.2 3.03 � 0.35 0.0002 1.41 � 0.26 0.56
Granulocytes 2.86 � 0.35 5.23 � 0.56 0.0018 2.51 � 0.79 0.13
aP-value C vs. A-CD.bP-value C vs. R-CD.
B. Production of H2O2 in monocytes and granulocytes in basal conditions and after stimulation with t-butyl hydroperoxide (10 lM).
Production of H2O2 (DCFH-FU; Mean � SEM)
Monocytes Granulocytes
[H2O2] [H2O2 þ TBH] P-valuea [H2O2] [H2O2 þ TBH] P-valuea
Control (C) 1.47 � 02 67.02 � 8.73 < 0.001 2.86 � 0.35 140 � 13.65 < 0.001
Active CD 3.03 � 0.35 81.62 � 10.19 < 0.001 5.23 � 0. 65 189 � 35.6 < 0.001
P-valueb 0.002 0.419 0.0018 0.74
aP-value: [O2�] vs. [O2
� þ Pb].bP-value: C vs. A-CD.
FIGURE 2. Stimulated production of H2O2 by t-butyl-hydro-peroxide (TBH) in lymphocytes from control subjects andfrom active CD patients. *P < 0.01 (TBH versus basal pro-duction in controls); #P < 0.01 (TBH versus basal productionin active CD); þP < 0.01 (basal production in controls ver-sus active CD); //P < 001 (TBH in controls versus TBH inactive-CD).
Inflamm Bowel Dis � Volume 16, Number 1, January 2010 Mitochondria and Oxidative Status in CD
81
tion, as they could be depolarized further by using the uncou-
pler FCCP (not shown). When CD patients were in remis-
sion, DWm continued to be significantly inhibited, although
a tendency to recover could be observed. Finally, in inactive
CD patients, DWm seemed to completely recover (Fig. 4).
DWm was inhibited independently of the location and
severity of the disease (not shown). The inhibition of DWm
was negatively correlated with CRP and fibrinogen serum
concentrations (Pearson’s correlation for DWm and CRP:
�0.406** in lymphocytes, �0.380** in monocytes, and
�0.338** in granulocytes, P < 0.01; Pearson’s correlation
for DWm and fibrinogen: �0.323* in lymphocytes, �0.465*
in monocytes, and �0.411* in granulocytes, P< 0.05).
MDA Plasma ConcentrationBoth active and remission CD patients presented a
significant increase in their MDA plasma concentration
(Fig. 5A). Inactive patients also exhibited a significant
increase in MDA with respect to control subjects, although
this increase was significantly lower than that observed in
active CD patients (Fig. 5A). No differences in MDA con-
centrations could be detected between active CD smokers
(0.548 � 0.116 nmol/mL) and active CD nonsmokers
(0.538 � 0.122 nmol/mL, mean [SD]).
8-Oxo-dG DeterminationOxidative stress damage of DNA was assessed by
measuring the incorporation of 8-oxo-dG into the DNA
chain, which was significantly higher in active CD patients
than in healthy subjects. This significant increase was also
detected in remission and inactive CD patients (Fig. 5B).
No differences in 8-oxo-dG could be detected between
active CD smokers (4.92 � 0.729 8-oxodG/106dG) versus
active CD nonsmokers (4.83 � 0.823 8-oxodG/106dG).
FIGURE 3. Antioxidant enzyme capacity: superoxide dismu-tase activity (A) and catalase activity (B) in the differentgroups assayed: controls, active CD at onset (A-CD), CDpatients in remission (R-CD), and inactive patients (I-CD).*P < 0.01
FIGURE 4. DWm is inhibited in active-CD (A-CD) patients inthe 3 cell types studied. This parameter tends to recover,returning to normal in inactive patients (I-CD).
Inflamm Bowel Dis � Volume 16, Number 1, January 2010Beltr�an et al
82
DISCUSSIONWe have shown a significant increase of H2O2 in dif-
ferent peripheral immune cell types during active CD, and
a return to control levels when the disease becomes inac-
tive. In the case of lymphocytes and monocytes, this
increase in H2O2 correlates significantly with some markers
of inflammation, such as CRP and fibrinogen, indicating
that inflammation is more pronounced as the concentration
of H2O2 in these cells rises. When the cells are stimulated
to produce H2O2 there is a significant increase in its con-
centration, which is stronger in the immune cells of active
CD patients than in those from controls, and significantly
only in the case of lymphocytes. Thus, it seems that CD
cells from active patients, especially lymphocytes, are
selectively prepared for H2O2 production, whose functions
in the cell are not clear. Our results may help to clarify
previous findings27 reporting hypersensitivity to oxidative
stress in peripheral blood lymphocytes from patients with
immune-related diseases.
Other ROS measured in this study, such as O2� and
NO, would not seem to be elevated when CD is active, as
their concentrations do not differ between controls and
active patients. We also detected an apparent inability of
active CD cells to produce O2� after an external stimula-
tion with PB, an O2� generator that acts on the mitochon-
dria.21,28 Classic studies and recent publications have sug-
gested that immune peripheral cells of CD patients, such as
granulocytes12,29 or lymphocytes,12 are characterized by de-
fective production of O2�. However, these studies did not
analyze the status of antioxidant enzymes of the cells. In
our study, we detected a significant increase in SOD activ-
ity, a primary defense against ROS which is switched on in
cells when excessive O2� production occurs. Experiments
with the inhibitor of SOD activity, EDTC, showed that
when SOD activity was inhibited the generation of ROS in
cells from active CD increased significantly, demonstrating
that the capacity of the cells to generate O2� was main-
tained. Thus, the SOD activity of the cells seems to be
very potent, as the O2� is immediately metabolized to pro-
duce H2O2 (2O2� þ 2Hþ ! O2 þ H2O2), which is also
detected at high levels in the cells. Whether O2� produc-
tion and its dismutation by SOD account for the total
amount of H2O2 detected in the cells or whether a direct
production of H2O2 by other cell systems30 play a role in
H2O2 generation remains to be clarified.
There are 3 SOD isoforms in humans; cytoplasmic
copper/zinc (Cu/Zn)-SOD, mitochondrial manganese (Mn)-
SOD, and an extracellular SOD.31 There are studies report-
ing lower levels of Cu/Zn-SOD protein and activity in IBD
peripheral blood granulocytes32 and in resected mucosa
from IBD active patients,9 which are at odds with our find-
ings. However, more recent work33,34 has demonstrated
that a selective marked increase occurs in the levels of mi-
tochondrial Mn-SOD in the mucosa of IBD patients. The
isoform of SOD responsible for the increased SOD activity
that we have detected in peripheral immune cells requires
further investigation.
Mitochondria are important generators of O2� when
modifications in their respiratory chain process occur,
which can be detected through modifications of the mito-
chondrial membrane potential (DWm).14 The fact that mito-
chondrial Mn-SOD is overexpressed in IBD patients sug-
gests that a mitochondrial generation of ROS takes
place.33,34 DWm has never been characterized in IBD
patients. We have shown in this study that DWm is signifi-
cantly inhibited in peripheral immune cells, which points
toward a possible origin of ROS in IBD-related oxidative
stress.5,6 This inhibition is negatively correlated with serum
markers of inflammation, such as CRP and fibrinogen;
however, its return to control values is slower than the clin-
ical and analytical recovery of patients. Thus, DWm
remains significantly inhibited in patients who have a sig-
nificant improvement of CD flare symptoms. Inactive
patients, who were in a long remission confirmed endo-
scopically, showed a complete recovery to the control val-
ues of DWm, which indicates that DWm varies with disease
FIGURE 5. Oxidative damage: (A) MDA plasma concentra-tions, and (B) 8-oxo-dG, in the different groups analyzed:controls, active CD patients (A-CD), CD patients in remission(R-CD), and inactive patients (I-CD). *P versus control group.
Inflamm Bowel Dis � Volume 16, Number 1, January 2010 Mitochondria and Oxidative Status in CD
83
activity, although a delay in its recovery with respect to
clinical and analytical improvement is detected.
NO is a molecule considerably implicated in inflam-
matory processes.35 Increased NO production,36 higher lev-
els of NO metabolites, and increased NOS enzyme expres-
sion6,37 are thought to occur in the gastrointestinal mucosa,
i.e., at the site of inflammation. Only one study38 has
attempted to characterize whether NO plays a role in the
oxidative stress detected in peripheral immune cells. The
authors reported an increased expression of the NOS
enzyme in the circulating monocytes of patients with active
IBD. However, no direct measurement of NO has been per-
formed in peripheral immune cells until now. Having done
this for the first time, we encountered no differences in NO
synthesis. Thus, it appears very unlikely that NO and its
metabolites contribute to the oxidative stress detected in
peripheral immune cells.
NO has been reported to act on complex IV of the
mitochondrial respiratory chain and to regulate its activ-
ity.39 Given that we detected an inhibition of DWm, it was
logical to assess NO expression, as its increase could
explain the inhibition detected. However, the results sug-
gest that this is not the case.
The presence of ROS and its consequences in IBD
have usually been measured indirectly by assessing levels
of oxidatively damaged molecules.7,8 We attempted to
evaluate, for the first time, which radicals are directly
implicated in oxidative stress in IBD. We found that H2O2
was significantly elevated, indicating that its antioxidant
enzyme capacity was overwhelmed and that its production
caused, at least in part, the oxidative stress. H2O2 can be
metabolized by 2 different enzymes: glutathione peroxidase
(GPx) and catalase. Different studies have demonstrated
that GPx is increased in both the colon biopsies7 and
plasma10 of active CD patients, and is considered to be a
defense mechanism against oxidative stress. We decided to
measure catalase activity in the peripheral immune cells of
CD patients, which has never been done previously. We
observed that catalase activity was equally (and signifi-
cantly) inhibited in the active CD patients group, the remis-
sion patients group, and the inactive patients group. Thus,
catalase activity would seem to be permanently inhibited in
CD patients, independently of the level of the disease’s
activity.
Persistent catalase inhibition was an unexpected
result of this study, although some reports have previously
hypothesized that the primary role of catalase in multicellu-
lar organisms is not to protect cells against H2O2 but to
regulate apoptosis by controlling cellular levels of H2O2.40
Also contrary to expectation, it has been reported that apo-
ptosis-resistant cells present diminished catalase expression
and activity.41 Our findings, together with the above-men-
tioned evidence in the literature, lead us think that, when
we measure ROS and antioxidant capacities of the cell, we
are not only assessing oxidative stress but also the regula-
tory processes of the cell, which have never been properly
characterized. In fact, there is accumulating evidence that
ROS play a role in the signal transduction pathways
involved in growth, differentiation, cell death, and inflam-
matory processes.42 Similarly, the role of antioxidant
enzymes is now interpreted in the context of the fine tuning
of ROS levels in the redox regulation of cell cycle and
of programmed cell death.43 Alterations in apoptosis
capacity and immune responses have been repeatedly
reported in immune cells implicated in IBD.1,44 Therefore,
the persistent inhibition of catalase and increased H2O2 we
observed may be implicated in oxidative stress damage,
which we have also detected (see below). However, we
believe that these data should also be interpreted as repre-
senting regulatory events of important cell functioning
processes. In this context, further analysis of the possible
implications of H2O2 production and/or persistent catalase
inhibition in the regulation of apoptosis and functioning of
the immune cells is currently being conducted in our
laboratory.
We also measured oxidative stress damage in CD
patients. MDA was found to be significantly increased dur-
ing both active and inactive CD, although the latter group
showed a significantly lower increase than the former. The
level of 8-OHdG was revealed to be permanently elevated
in CD patients, independent of the activity of the disease.
Smokers have been reported to exhibit increased oxidative
stress damage,45 which could affect the data; however,
when analyzing the oxidative stress in active CD patients,
no differences could be detected in MDA or 8-OHdG con-
centrations between smokers and nonsmokers. Thus, even
when H2O2 production recovered to normal levels in inac-
tive patients, oxidative damage continued to be detected in
the immune cells of CD patients. Other ROS species not
measured in our study could be implicated in the perpetua-
tion of oxidative damage in CD patients. Based on our
results, we cannot offer a reasonable explanation for this
permanent oxidative stress damage in CD, nor can we con-
firm whether it is part of the pathogenics of the disease or
a consequence of it. However, our results are consistent
with previous studies that have also detected persistent oxi-
dative damage8,44 or a persistent GPx increase in CD
patients.7,43 Some reports have failed to give much impor-
tance to the fact that their results showed persistent oxida-
tive damage; however, others,46 as we do now, have called
for the attention of clinicians, as persistent oxidative DNA
damage may have implications in the initiation and pro-
gression of cancer. In this way, the persistent oxidative
damage detected in IBD could be related to the increased
risk of cancer reported among these patients,47 and may
help to explain the difficulties in changing the natural
Inflamm Bowel Dis � Volume 16, Number 1, January 2010Beltr�an et al
84
history of the disease, in spite of the availability of new
therapeutic drugs.
In conclusion, we have assessed, for the first time, the
ROS directly implicated in the oxidative damage that occurs
in IBD, showing that levels of H2O2 are elevated in immune
cells when the disease is active. We demonstrate that the
DWm of immune cells is significantly inhibited in active IBD
and correlates with markers of inflammation. This inhibition
suggests a mitochondrial source of ROS. Antioxidant enzyme
capacity is enhanced in IBD, although the CAT enzyme does
not seem to participate in this defense mechanism and
remains permanently inhibited, the cause and biological sig-
nificance of which remains unclear. Similarly, persistent oxi-
dative damage is detected in CD patients, which may have
implications in the evolution of the disease. Whether the
events reported here merely constitute damage associated
with the disease or whether they are characteristic of and fun-
damental to the pathogenesis of the disease deserves further
investigation. We hypothesize that ROS, mitochondria, and
CAT participate in the regulatory processes that determine
apoptosis and immune cell capacities, which urges us to con-
tinue exploring the pathogenesis of IBD.
REFERENCES1. Xavier RJ, Podolsky DK. Unravelling the pathogenesis of inflamma-
tory bowel disease. Nature. 2007;448:427–434.2. Kruidenier L, Verspaget HW. Oxidative stress as a pathogenic factor
in inflammatory bowel disease—radicals or ridiculous? Aliment Phar-macol Ther. 2002;16:1997–2015.
3. Rezaie A, Parker RD, Abdollahi M. Oxidative stress and pathogenesisin inflammatory bowel disease: an epiphenomenon or the cause?Digest Dis Sci. 2007;52:2015–2021.
4. Grisham MB. Oxidants and free radicals in inflammatory bowel dis-ease. Lancet. 1994;344:859–861.
5. Lih-Brody L, Powell SR, Collier KP, et al. Increased oxidative stressand decreased antioxidant defences in mucosa of inflammatory boweldisease. Dig Dis Sci. 1996;41:2078–2086.
6. Kruidenier L, Kuiper I, Lamers CB, et al. Intestinal oxidative damagein inflammatory bowel disease: semi-quantification, localization, andassociation with mucosal antioxidants. J Pathol. 2003;201:28–36.
7. Tuzun A, Erdil A, Volkan I, et al. Oxidative stress and antioxidantcapacity in patients with inflammatory bowel disease. Clin Biochem.2002;35:569–572.
8. Rezaie A, Eshghtork A, Zamani M, et al. Alterations in salivary anti-oxidants, nitric oxide and transforming growth factor-beta 1 in relationto disease activity in Crohn’s disease patients. Ann N Y Acad Sci.2006;1091:110–122.
9. Mulder TPJ, Verspaget HW, Janssens AR, et al. Decrease in two in-testinal cooper/zinc containing proteins with antioxidant function ininflammatory bowel disease. Gut. 1991;32:1146–1150.
10. Kruidenier L, Kuiper I, Dujin W, et al. Imbalanced secondary mucosalantioxidant response in inflammatory bowel disease. J Pathol. 2003;201:17–27
11. Curnutte JT, Whittes DM, Babior BM. Defective superoxide produc-tion by granulocytes from patients with chronic granulomatous dis-ease. N Engl J Med. 1974;290:593–597.
12. Kitahora T, Suzuki K., Asakura H, et al. Active oxygen species gener-ated by monocytes and polymorphonuclear cells in Crohn’s disease.Digest Dis Sci. 1988;33:951–955.
13. Keshavarzian A, Banan A, Farhadi A, et al. Increases in free radicalsand cytoskeletal protein oxidation and nitration in the colon
of patients with inflammatory bowel disease. Gut. 2003;52:720–728.
14. Kakkar P, Singh BK. Mitochondria: a hub of redox activities and cel-lular distress control. Mol Cell Biochem. 2007;305:235–253.
15. Soderholm JD, Olaison G, Peterson KH, et al. Augmented increase intight junction permeability by luminal stimuli in the non-inflamed il-eum of Crohn’s disease. Gut. 2002;50:307–313.
16. Restivo ML, Srivastava MD, Schafer IA, et al. Mitochondrial dysfunc-tion in a patient with Crohn’s disease. Possible role in pathogenesis. JPediatr Gastroenterol Nutr. 2004;38:534–538.
17. Lennard-Jones JE. Classification of inflammatory bowel disease. ScandJ Gastroenterol Suppl. 1989;170:2–6.
18. Silverberg MS, Satsangi J, Ahmad T, et al. Toward an integrated clinical,molecular and serological classification of inflammatory bowel disease:report of a Working Party of the 2005 Montreal World Congress of Gas-troenterology. Can J Gastroenterol. 2005;19(suppl A):5–36
19. Harvey RF, Bradshaw JM. Measuring Crohn’s disease activity. Lan-cet. 1980;24:1134–1135.
20. Chappell JB, Hansford RG. In: Subcellular components: preparationand fractionation. Birnie GD, ed. London: Butterworths.
21. Hassan H, Fridovich I. Intracellular production of superoxide radicaland of hydrogen peroxide by redox active compounds. Arch BiochemBiophys. 1979;196:385–395.
22. Lebel CP, Ischiropoulos H, Bondy SC. Evaluation of the probe2’,7’dichlorofluorescein as an indicator of reactive oxygen species for-mation and oxidative stress. Chem Res Toxicol. 1992;5:227–231.
23. Kojima H, Nakatsubo N, Kikuchi K, et al. Detection and imaging ofnitric oxide with novel fluorescent indicators: diaminofluoresceins.Anal Chem. 1998;70:2446–2453.
24. Scaduto RS, Grotyohann LW. Measurement of mitochondrial mem-brane potential using fluorescent rhodamine derivates. Biophys J.1999;76:469–477.
25. Bradford MM. A rapid and sensitive method for the quantitation ofmicrogram quantities of protein utilising the principle of protein-dyebinding. Anal Biochem. 1976;72:248–254.
26. Wong SHY, Knight JA, Hopfer SM, et al. Lipoperoxides in plasma asmeasures by liquid-chromatographic separation of malondialdehyde-thiobarbituric acid adduct. Clin Chem. 1987;33:214–220.
27. Bashir S, Gilmour H, Denman MA, et al. Oxidative DNA damage andcellular sensitivity to oxidative stress in human autoimmune diseases.Ann Rheum Dis. 1993;52:659–666.
28. Wang CC, Chiang YM, Sung SC, et al. Plumbagin induces cell cyclearrest and apoptosis through reactive oxygen species/c-Jun N-terminalkinase pathways in human melanoma A375.S2 cells. Cancer Lett.2008;259:82–98.
29. Biagioni C, Favilli F, Catarzi S, et al. Redox state and O2- production inneutrophils of Crohn’s disease patients. Exp Biol Med. 2006;231:186–195.
30. Chance B, Sies H, Boveris A. Hydroperoxide metabolism in mamma-lian organs. Physiol Rev. 1979;59:527–605.
31. Zelko IN, Mariani TJ, Folz RJ. Superoxide dismutase multigener fam-ily: a comparison of the CU-Zn-SOD (SOD1), Mn-SOD (SOD2), andEC-SOD (SOD3) gene structures, evolution and expression. FreeRadic Biol Med. 2002;33:337–349.
32. Verspaget HW, Pena AS, Weterman IT, et al. Diminished neutrophilfunction in Crohn’s disease and ulcerative colitis identified bydecreased oxidative metabolism and low superoxide dismutase con-tent. Gut. 1988;29:223–228.
33. Barbosa DS, Cecchini R, El Kadri MZ, et al. Decreased oxidativestress in patients with ulcerative colitis supplemented with fish oilomega-3 fatty acids. Nutrition. 2003;19:837–842.
34. Kruidenier L, Kuiper I, van Dujin W, et al. Differential mucosalexpression of three superoxide dismutase isoforms in inflammatorybowel disease. J Pathol. 2003;201:7–16.
35. Dugas B, Debre P, Moncada S. Nitric oxide: a vital poison inside theimmune and inflammatory network. Res Immunol. 1995;146:664–670.
36. Rachmilewitz D. Increased colonic nitric oxide level in active IBD.Scand J Gastroenterol. 2008;43:638.
37. Kolios G, Valatas V, Ward SG. Nitric oxide in inflammatory boweldisease: a universal messenger in an unsolved puzzle. Immunology.2004;113:427–437.
Inflamm Bowel Dis � Volume 16, Number 1, January 2010 Mitochondria and Oxidative Status in CD
85
38. Dijkstra G, Zandvoort AJ, Kobold AC. et al. Increased expression ofinducible nitric oxide synthase in circulating monocytes from patientswith active inflammatory bowel disease. Scand J Gastroenterol. 2002;37:546–554.
39. Brown GC, Cooper JM. Nanomolar concentrations of nitric oxidereversibly inhibit synaptosomal respiration by competing with oxygenat cytochrome oxidase. FEBS Lett. 1994;356:295–298.
40. Nenoi M, Ichimura S, Mita K, et al. Regulation of the catalase genepromoter by Sp1, CCAAT-recognizing factors and a WT1/Egr-relatedfactor in hydrogen peroxide-resistant HP100 cells. Cancer Res. 2001;61:5885–5894.
41. Bai J, Cederbaum AI. Overexpression of catalase in the mitochondrial orcytosolic compartment increases sensitivity of HepG2 cells to tumor necro-sis factor-alpha-induced apoptosis. J Biol Chem. 2000;275:19241–19249.
42. Herrlich B, Bohmer FD. Redox regulation of signal transduction inmammalian cells. Biochem Pharmacol. 2000;59:35–41.
43. Kahl R, Kampkotter A, Watjen W, et al. Antioxidant enzymes and ap-optosis. Drug Metab Rev. 2004;36:747–762.
44. Boirivant M, Marini M, Felice G, et al. Lamina propria T cells in Crohn’sdisease and other gastrointestinal inflammation show defective CD2-path-way-induced apoptosis. Gastroenterology. 1999;116:557– 565.
45. Yanbaeba DG, Dentener MA, Creutzberg EC, et al. Systemic effectsof smoking. Chest. 2007;131:1557–1566.
46. Dincer Y, Erzin Y, Himmetoglu S, et al. Oxidative DNA damage andantioxidant activity in patients with inflammatory bowel disease. DigDis Sci. 2007;52:1636–1641.
47. Xie J, Itzkowitz SH. Cancer in inflammatory bowel disease. World JGastroenterol. 2008;14:378–389.
Inflamm Bowel Dis � Volume 16, Number 1, January 2010Beltr�an et al
86
Copyright © 2022 FDOKUMEN


![[Data on rilpivirine in treatment-naïve patients. Lessons from ECHO, THRIVE and STaR]](https://static.fdokumen.com/doc/165x107/63332a3f9d8fc1106803ac51/data-on-rilpivirine-in-treatment-naive-patients-lessons-from-echo-thrive-and.jpg)