Social ties and their relevance to churn in mobile telecom networks
University of Science and Technology
Faculty of Computer Science and Information Technology
Postgraduate Studies
Master of Information Systems Batch (4)
Thesis submitted in Partial Fulfillment of the Requirements for the Degree of Master of Information Systems
Implementation of Naïve Bayes algorithm for building churn prediction model for telecommunication company
Prepared By:
Lina Ahmed Mohammed Nour Ali
Supervised By:
Dr. Atif Ali
December 2014

I
م اي ( يك ل و ع ل ت م ي سوال منك م ر ا فيك ن سل ا ار م ا م م ك م ل ع ي و ة م ك الح و اب ت الكـ م ك م ل ع ي و م يك ك ز ي ا و ن ات ك
) )151( ون م ل ع وا ت ون ك ت م ل
صدق اهللا العظيم
151 سورة البقرة االية

II
Dedication
Having this opportunity of presenting this humble work, we
would like to dedicate it
To our parents …
To our brothers and sisters …
To our great teaching staff …
To all our friends …
III
Abstract
In telecommunication companies churn means customers’ decision to
move from one service provider to another. The competition environment
in telecom companies' makes their aim is to maintains their customers
who are likelihood to leave and earns their satisfaction, so to avoid the
problem of churn they need churn predictive models. Data mining
techniques can be used to build churn prediction model for
telecommunication companies to identify churner and non-churner
customers because it can extract the predictive information from large
databases. In this study the churn prediction model was built which is
contains of four steps, the used dataset contains of Customer behavior
data and some demographics data, and it has 9 attributes for each
customer and there is 300 instances, the model was implemented by
Naïve bayes algorithm using WEKA 3.7 software and the result which
obtained that we have 147 customers correctly predicted as non-churner
from 159 which is (92.5%) and 139 customers correctly predicted as
churner from 141 which is (98.5%) with high accuracy which was 95.3%.

IV
المستخلص
باالنتقال من مقدم خدمة الى مقدم العمیل في شركات االتصال فقدان العمالء یعني قرار
المحافظة على ھو الشركات ھدف ھذه جعلت في شركات االتصال بیئة المنافسة ان .خدمة اخر
مشكلة فقدان العمالء فإن من و للتخلص المتوقع ان یغادروا الشركة و اكتساب رضائھم ، العمالء
یمكن التنقیب عن البیانات ان عملیة .فقدان العمالءه الشركات تحتاج الى نماذج تنبؤ لھذ
لشركات االتصال لتعریف العمالء الذین قد نموذج التنبء بفقدان العمالء بناءاستخدامھا في
نموذج التنبؤ بفقدان العمالء النھا یمكن ان تفید كثیرا في الذین لن یغادروا یغادرون الشركة و
نموذج تم بناء ھذه الدراسة في. باستخالص المعلومات التنبوئیة من قواعد البیانات الكبیرة تقوم
توي علىتحالبیانات المستخدمة، مجموعة ، حتوي على اربع خطواتالذي إفقدان العمالء بتنبؤ
صفات 9 على تحتوي انھا كما شخصیة ،البیانات ال بعض في الشركة سلوك العمالء بیانات عن
بإستخدام Naïve Bayes، تم تطبیق النموذج بخوارزمیة ال سجل 300 ھالكل من لكل عمیل
عمیل تم 159من 147 و النتائج التي تم الحصول علیھا ھو انھ یوجد WEKAبرنامج
تنبؤ صحیحة عبارة عن تصنیفھم تصنیف صحیح كعمالء لن تفقدھم الشركة و التي تمثل نسبة
عمیل تم تصنیفھم تصنیف صحیح كعمالء قد تفقدھم الشركة و التي 141من 139و % 92.5
. %95.3 عالیة عبارة عنوذلك بكفاءة % 98.5 صحیحة عبارة عن نسبة تنبؤتمثل
V
Contents
Content Page No
االیة
I
Dedication
II
Abstract
III
المستخلص
IV
Contents
V
List of Figures
VIII
List of Tables
IX
Chapter One Overview
1.1 Introduction
1
1.2 Research problem 1
1.3 Research objective 1
1.4 Research methodology 2
1.5 Research structure 3
Chapter Two Literature Riverview
2.1 Introduction 4
2.2 Churn
4
2.2.1 Customer churn
4
2.2.1.1 Voluntary churner 4
VI
2.2.1.2 Involuntary 4
2.3 Data mining 5
2.3.1 Unsupervised models 6
2.3.2 Supervised / Predictive Models 6
2.4 Data Mining Applications 6
2.5 Data Mining Techniques 7
2.5.1 Estimation 7
2.5.2 Regression Analysis 7
2.5.3 Clustering 8
2.5.4 Association 8
2.5.5 Visualization 8
2.5.6 Classification & Prediction 8
2.5.6.1 Building the Classifier or Model 9
2.5.6.2 Using classifier for classification 9
3.5.6.3 Classification Techniques 9
2.6 Related works 13
Chapter Three Methodology
3.1 Predictive Models 14
3.2 Research scenario 14
3.4 The Proposed model 14
3.4.1 Identify Problem domain 15
3.4.2 Data selection 16
VII
3.4.3 Data preparation 18
3.4.4 Data mining technique (Classification, Naïve Bayes algorithm)
20
Chapter Four Implementation
4.2 Model implementation tool 21
4.3 Results 24
Chapter Five Conclusion & Recommendation
5.1 Conclusion 25
5.2 Recommendation 26
References 27
VIII
List of Figures Figure
Page No
Fig 1.1 Research Methodology
2
Fig 1.2 Research structure
3
Fig 3.1 Proposed model 15
Fig 3.2 The data before modified 18
Fig 3.3 Total_all_M field after modified 19
Fig 3.4 Churn field after modified 19
Fig 4.1 Preprocessing in WEKA 21
Fig 4.2 data mining technique and algorithm 22
Fig 4.3 Algorithm's implementation 23

IX
List of Tables
Table Page No
Tab 3.1 Attributes table 17
Tab 4.1 Results table 24

Chapter One
Overview
1
1.1 Introduction:
Churn is a term used in many companies which is mean loss of customers of the
company for many rezones one of them the dissatisfaction of customer.
In telecommunication companies churn term refers to customer's decision to
leave the current service provider and move to other service provider, it can be
easily happen especially for prepaid customers because they have not any contract
same as to postpaid customers.
Churn occurs easily because of the strong and breeding competition
environment in services which are providing especially in telecommunication
sector, also churn can be happen for another rezones for examples customer's
dissatisfaction with services and high cost of these services which can be in another
service provider with best quality and lower cost. So churn become a concern issue
in telecom sector because retaining of existing customer is costly than acquiring
new one.
To identify churner and non-churner customers and understand the rezones of
this churn to reduce it, these companies can build churn prediction model which can
help them in churn churner issue to build this model they can use Data mining (DM)
this can be useful because DM can extracting a predictive information from large
databases, it's have many techniques which can for example Decision Tree (DT),
Support vector machine (SVM), Naïve Bayes… ect.
1.2 Research problem:
Churn is big issue for telecommunication companies so they need a churn
prediction model to help them to identify churner and non-churner customers.
1.3 Research objective:
The objective of this research is to build a churn prediction model which can
identify churner customers and non-churner customers and implementing this model
by using Naïve bayes algorithm.
2
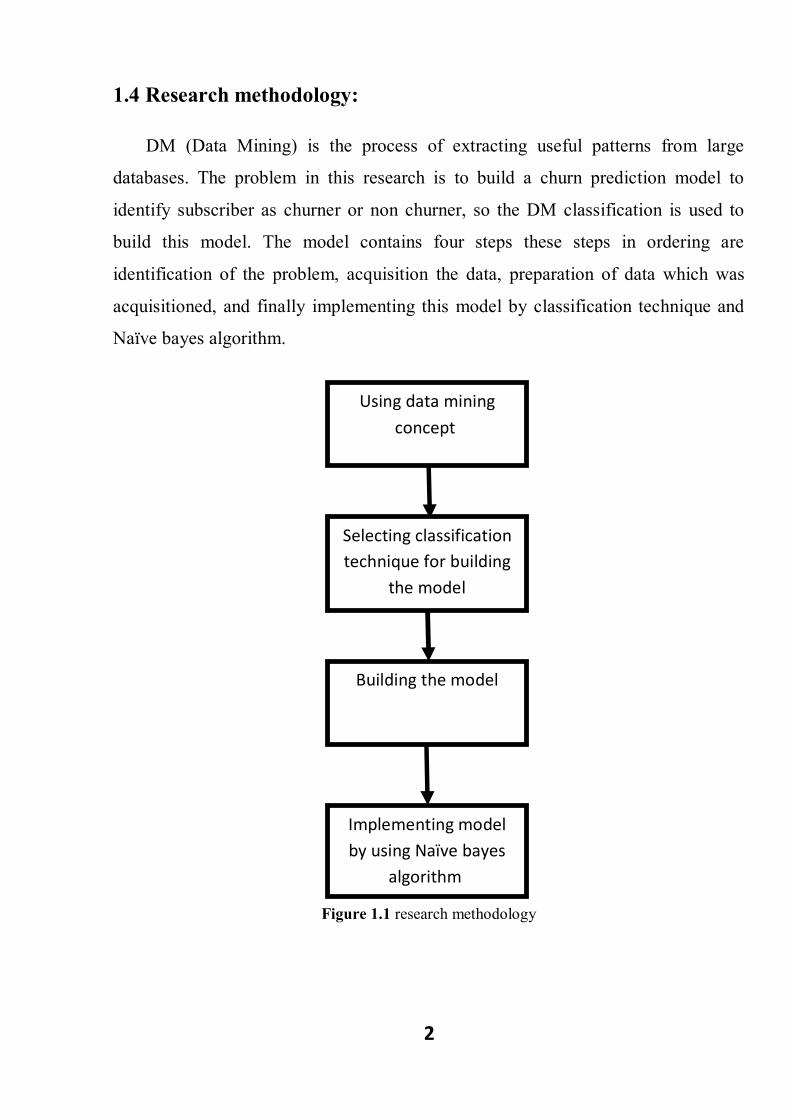
1.4 Research methodology:
DM (Data Mining) is the process of extracting useful patterns from large
databases. The problem in this research is to build a churn prediction model to
identify subscriber as churner or non churner, so the DM classification is used to
build this model. The model contains four steps these steps in ordering are
identification of the problem, acquisition the data, preparation of data which was
acquisitioned, and finally implementing this model by classification technique and
Naïve bayes algorithm.
Figure 1.1 research methodology
Using data mining concept
Selecting classification technique for building
the model
Building the model
Implementing model by using Naïve bayes
algorithm
3
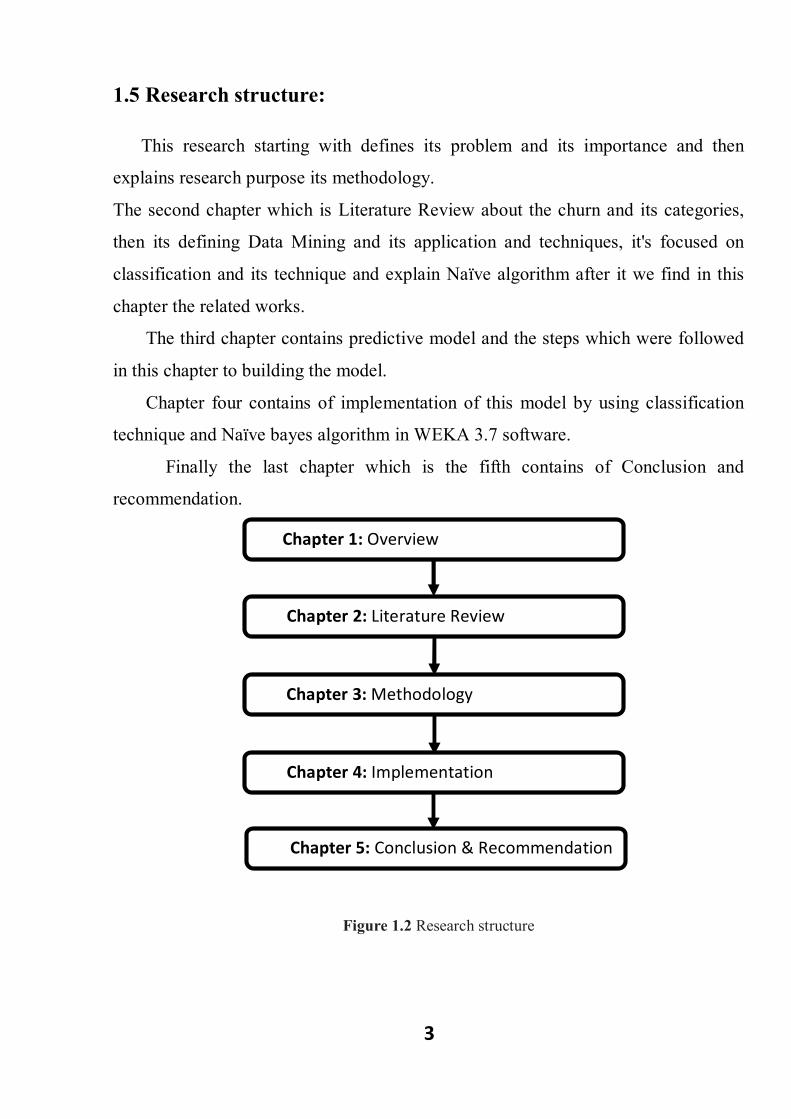
1.5 Research structure:
This research starting with defines its problem and its importance and then
explains research purpose its methodology.
The second chapter which is Literature Review about the churn and its categories,
then its defining Data Mining and its application and techniques, it's focused on
classification and its technique and explain Naïve algorithm after it we find in this
chapter the related works.
The third chapter contains predictive model and the steps which were followed
in this chapter to building the model.
Chapter four contains of implementation of this model by using classification
technique and Naïve bayes algorithm in WEKA 3.7 software.
Finally the last chapter which is the fifth contains of Conclusion and
recommendation.
Figure 1.2 Research structure
Chapter 1: Overview
Chapter 2: Literature Review
Chapter 3: Methodology
Chapter 4: Implementation
Chapter 5: Conclusion & Recommendation

Chapter Two
Literature Review
4
2.1 Introduction Data mining is used in churn analysis to predict the churner customers when
churn is excepted to happen. In telecommunication companies when predicting the
customers who are likely to be churned, they can reduce churn rate by offering new
services or packages for customers to stay, also they can reduce the cost of services.
To predict the churner customers classification technique could be used which is
one of data mining techniques, by using classification technique the customers will
classifying into churner customers and non-churner customers.
2.2 Churn In today's competitive world in telecommunication companies, customer churn
is concern issue that for the retaining existing customers is higher cost than
acquiring new customers, so the company predict the customers who are with high
probability to churn and understand the reasons of this churn and try to solve it.
2.2.1 Customer Churn:
Should indicate when a customer has permanently stopped using his sim-card as
early as possible [1]. There are two main categories of churners which are:
2.2.1.1 Voluntary churner:
Voluntary churner is more difficult to determine; it occurs when a customer
makes a decision to terminate his/her service with the provider. When people think
about Telco churn it is usually the voluntary kind that comes to mind [2].
2.2.1.2 Involuntary:
These are the customers that Telco decides to remove from subscribers list.
Therefore’ this category includes people that are churned for fraud, non-payment
and customers who don’t use the phone [2]; it can be sub-divided into two main
categories:
5
1- Incidental churn:
Its indicate when something happened in customers lives. For example: change
in location churn, etc.
2- Deliberate churn:
It's happens for reasons of technology (customers wanting newer or better
technology), economics (price sensitivity), service quality factors, social or
psychological factors, and convenience reasons, and this churn is the problem that
most churn management solutions try to solve [2].
2.3 Data mining
Data mining is one of advanced type of analytical tools at this time
available; these tools can include statistical models, mathematical algorithms,
and machine learning methods (algorithms that increase their performance
automatically during experience, such as neural networks or decision trees) but
data analysis system that does not deal with large amounts of data [3].
Data mining become one of the most common areas of interest that can be
used in multiple disciplines. Disciplines such as telecommunication, banking,
health, education and Commercial markets commonly use data mining to gain
new customers, fight disease, reduce costs and increase benefits [4].
Data mining refers to discovering or “mining” knowledge from large
amounts of data known as Knowledge Discovery from Data (KDD) or is an
essential step in the process of knowledge discovery. The knowledge that
discovered from KDD process can be used for decisions support, knowledge
management and help query processing. Many terms may give the same or a
slight difference meaning of data mining, such as knowledge extraction,
knowledge mining from data, data/pattern analysis, data dredging and data
archaeology.
6
Data mining models consist of a set of rules, equations, or complex ‘‘transfer
functions’’ that can be used to identify useful data patterns, understand, and predict
behaviors. [5]
They can be grouped into two main classes according to their goal, as follows:
1- Supervised / Predictive Models.
2- Unsupervised Models.
2.3.1 UNSUPERVISED MODELS:
In unsupervised or undirected models there is no output field, just inputs.
The Pattern recognition is undirected; it is not guided by a specific target attribute.
The goal of such models is to uncover data patterns in the set of input fields. [5]
Unsupervised models include:
1. Cluster models.
2. Association and sequence models.
2.3.2 Supervised / Predictive Models:
In supervised, or predictive, directed, or targeted modeling, the goal is to predict
an event or estimate the values of a continuous numeric attribute. In these models
there are input fields or attributes and an output or target field. Input fields are also
called predictors because they are used by the model to identify a prediction
function for the output field.
We can think of predictors as the X part of the function and the target field as the Y
part the outcome, the model uses the input fields which are analyzed with respect to
their effect on the target field, pattern recognition is supervised by the target field,
relationships are established between input and output fields. An input–output
mapping ‘‘function’’ is generated by the model, which associates predictors with the
output and permits the prediction of the output values, given the values of the input
fields [5].
7
2.4 Data Mining Applications:
Data mining can implement on many applications such as:
1- Data mining for Financial Data Analysis
2- Data mining for Telecommunication Industries
3- Data mining for Retail Industries
4- Data mining for Healthcare and Biomedical Researches
5- Data mining in Science and Engineering
2.5 Data Mining Techniques:
The most popular data mining techniques are:
1- Estimation
2- Clustering
3- Association
4- Visualization
5- Regression analysis
6- Classification and prediction
2.5.1 Estimation:
These models are similar to classification models but with one major difference.
They are used to predict the value of a continuous field based on the observed
values of the input attributes [5].
2.5.2 Regression Analysis:
Regression analysis is a statistical tool for the investigation of relationships
between variables. Usually, the investigator seeks to ascertain the causal effect of
one variable upon another the effect of a price increase upon demand, for example,
8
or the effect of changes in the money supply upon the inflation rate. To explore such
issues, the investigator assembles data on the underlying variables of interest and
employs regression to estimate the quantitative effect of the causal variables upon
the variable that they influence. The investigator also typically assesses the
“statistical significance” of the estimated relationships, that is, the degree of
confidence that the true relationship is close to the estimated relationship [6].
2.5.3 Clustering:
Clustering is the method by which similar type of records are grouped together.
Usually, clustering is done to give the end user a high-level view of what is going on
in the database. Clustering is useful for coming up with a birds-eye view of the
business [7].
2.5.4 Association:
It is a popular method for discovering interesting relations between variables in
large databases. Introduced association rules for discovering regularities between
products in large scale transaction data recorded by point-of-sale (POS) systems in
supermarkets [7].
2.5.5 Visualization:
Visualization refers to the presentation so that users can view complex patterns.
The main goal of data visualization is to communicate information clearly and
effectively through graphical means. It is used with other data mining models to
provide a better and clearer understanding of the discovered patterns or relationships
[7].
2.5.6 Classification & Prediction
Classification and prediction are two forms of data analysis that can be used to
extract models describing important data classes or to predict future data trends. It
aims at building a model to predict future customer behaviors through classifying
databases records into a number of predefined classes based on certain criteria.
Classification predicts categorical (unordered) labels, prediction models continuous
9
valued functions. Basic techniques for data classification are decision tree classifier,
Bayesian classifier, Bayesian belief networks, rule- based classifiers, and support
vector machines. Methods for prediction include linear regression, non-linear
regression, etc [7].
Classification models are tested by comparing the predicted values to known
target values in a set of test data. The historical data for a classification project is
typically divided into two data sets: one for building the model; the other for testing
the model [8]. So Data Classification process includes the two steps:
1-Building the Classifier or Model
2-Using Classifier for Classification
2.5.6.1 BUILDING the Classifier or Model
All the classification models are built in 4 steps:
1-The first step is identifying a set of subjects with a known behavior. All the inputs
are known, as well as the target classes.
2-The second step is data preparation – it includes data cleaning, feature selections,
data transformation
3-The third step is training the model. This process uses about 80% of all the
subjects identified in the first step to identify the relationships between the inputs
and the target data. The techniques for finding these relationships depend on the
classification algorithm used.
4-The fourth step is testing the model. This step uses the remaining 20% of subjects
to test the relationships identified in the previous step. This is where the accuracy of
the model is checked.
2.5.6.2 USING CLASSIFIER FOR CLASSIFICATION
In this step the classifier is used for classification. Here the test data is used to
estimate the accuracy of classification rules. The classification rules can be applied
to the new data tuples if the accuracy is considered acceptable.
10
3.5.6.3 Classification Techniques:
The following modeling techniques are included in the class of classification
models:
1- Logistic regression:
This is a powerful and well-established statistical technique that estimates the
probabilities of the target categories. It is analogous to simple linear regression but
for categorical outcomes. It uses the generalized linear model and calculates
regression coefficients that represent the effect of predictors on the probabilities of
the categories of the target field [9].
2- Support vector machine (SVM):
SVM is a classification algorithm that can model highly nonlinear, complex data
patterns and avoid over fitting, that is, the situation in which a model memorizes
patterns only relevant to the specific cases analyzed [9].
3- Neural networks:
Neural networks are powerful machine learning algorithms that use complex,
nonlinear mapping functions for estimation and classification. They consist of
neurons organized in layers. The input layer contains the predictors or input
neurons. The output layer includes the target field. These models estimate weights
that connect predictors (input layer) to the output. Models with more complex
topologies may also include intermediate, hidden layers, and neurons. The training
procedure is an iterative process. Input records, with known outcomes, are presented
to the network and model prediction is evaluated with respect to the observed results
[9].
4- Bayesian networks:
Bayesian models are probability models that can be used in classification
problems to estimate the likelihood of occurrences. They are graphical models that
11
provide a visual representation of the attribute relationships, ensuring transparency,
and an explanation of the model’s rationale.
5- Decision Tree:
Decision trees are the most commonly used tool for predictions and
classification of future events. The development of such trees is done in two major
steps: building and pruning. During the first phase the data set is partitioned
recursively until most of the records in each partition contain identical value. The
second phase then removes some branches which contain noisy data (those with the
largest estimated error rate) [10].
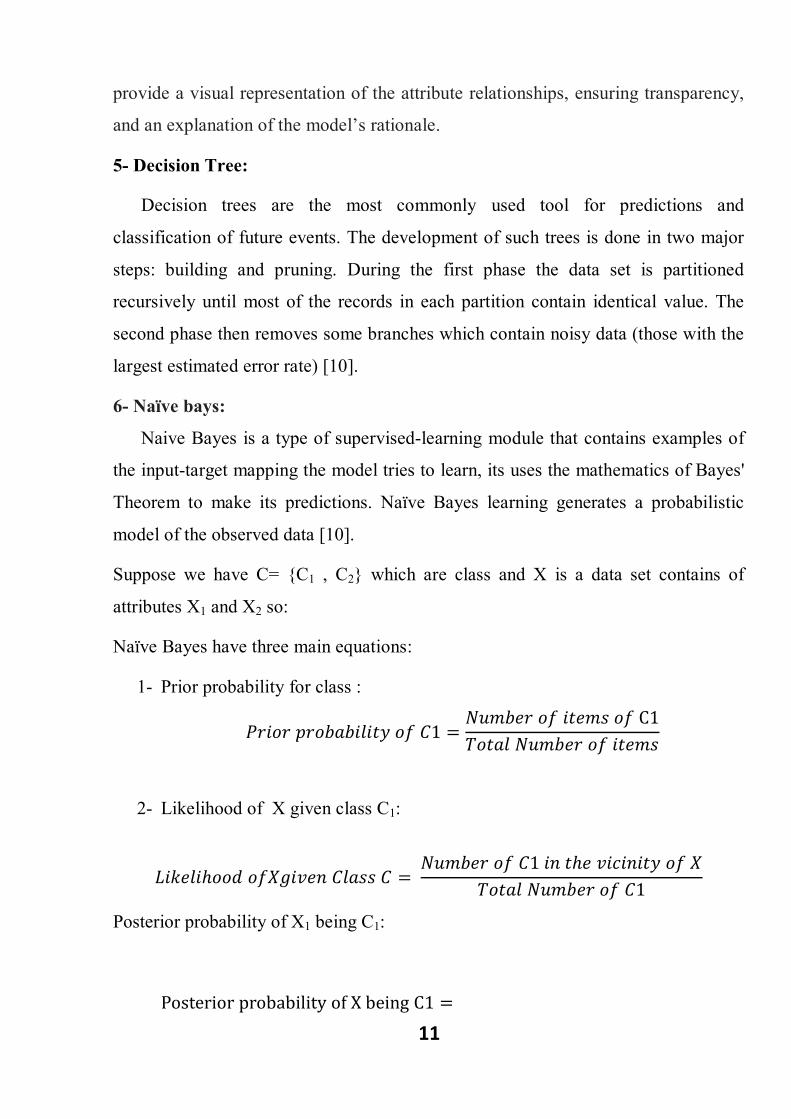
6- Naïve bays:
Naive Bayes is a type of supervised-learning module that contains examples of
the input-target mapping the model tries to learn, its uses the mathematics of Bayes'
Theorem to make its predictions. Naïve Bayes learning generates a probabilistic
model of the observed data [10].
Suppose we have C= {C1 , C2} which are class and X is a data set contains of
attributes X1 and X2 so:
Naïve Bayes have three main equations:
1- Prior probability for class :
푃푟푖표푟푝푟표푏푎푏푖푙푖푡푦표푓퐶1 =푁푢푚푏푒푟표푓푖푡푒푚푠표푓C1푇표푡푎푙푁푢푚푏푒푟표푓푖푡푒푚푠
2- Likelihood of X given class C1:
퐿푖푘푒푙푖ℎ표표푑표푓푋푔푖푣푒푛퐶푙푎푠푠퐶 = 푁푢푚푏푒푟표푓퐶1푖푛푡ℎ푒푣푖푐푖푛푖푡푦표푓푋
푇표푡푎푙푁푢푚푏푒푟표푓퐶1
Posterior probability of X1 being C1:
PosteriorprobabilityofXbeingC1 =
12
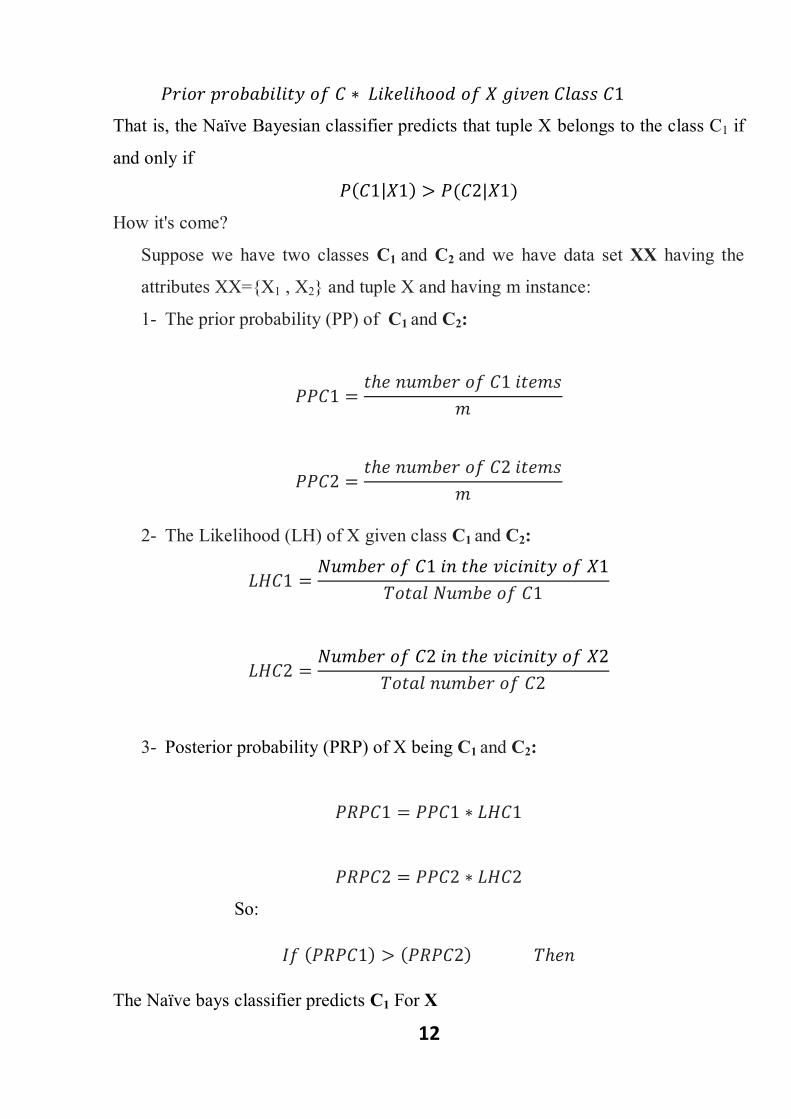
푃푟푖표푟푝푟표푏푎푏푖푙푖푡푦표푓퐶 ∗ 퐿푖푘푒푙푖ℎ표표푑표푓푋푔푖푣푒푛퐶푙푎푠푠퐶1
That is, the Naïve Bayesian classifier predicts that tuple X belongs to the class C1 if
and only if
푃(퐶1|푋1) > 푃(퐶2|푋1)
How it's come?
Suppose we have two classes C1 and C2 and we have data set XX having the
attributes XX={X1 , X2} and tuple X and having m instance:
1- The prior probability (PP) of C1 and C2:
푃푃퐶1 =푡ℎ푒푛푢푚푏푒푟표푓퐶1푖푡푒푚푠
푚
푃푃퐶2 =푡ℎ푒푛푢푚푏푒푟표푓퐶2푖푡푒푚푠
푚
2- The Likelihood (LH) of X given class C1 and C2:
퐿퐻퐶1 =푁푢푚푏푒푟표푓퐶1푖푛푡ℎ푒푣푖푐푖푛푖푡푦표푓푋1
푇표푡푎푙푁푢푚푏푒표푓퐶1
퐿퐻퐶2 =푁푢푚푏푒푟표푓퐶2푖푛푡ℎ푒푣푖푐푖푛푖푡푦표푓푋2
푇표푡푎푙푛푢푚푏푒푟표푓퐶2
3- Posterior probability (PRP) of X being C1 and C2:
푃푅푃퐶1 = 푃푃퐶1 ∗ 퐿퐻퐶1
푃푅푃퐶2 = 푃푃퐶2 ∗ 퐿퐻퐶2
So:
퐼푓(푃푅푃퐶1) > (푃푅푃퐶2)푇ℎ푒푛
The Naïve bays classifier predicts C1 For X

13
2.6 Related works:
Shyam V.Nath [11] study developed a model with data set that contains of 2000
customers by using Naive Bayes classifier the model was used to predict the future
churn for the wireless customers when it tested it showed with 68% accuracy.
In Emilía Huong Xuan Nguyen [12] study churn identified in postpaid and
prepaid sectors by implementing C4.5 decision tree, alternating decision tree, Naïve
Bayes and logistic regression, all postpaid classifiers achieve above 60% overall
accuracy on a testing set of 30 thousand instances and prepaid classifiers achieve
above 70% overall accuracy on a testing set of 40 thousand instances.

Chapter Three
Methodology
14
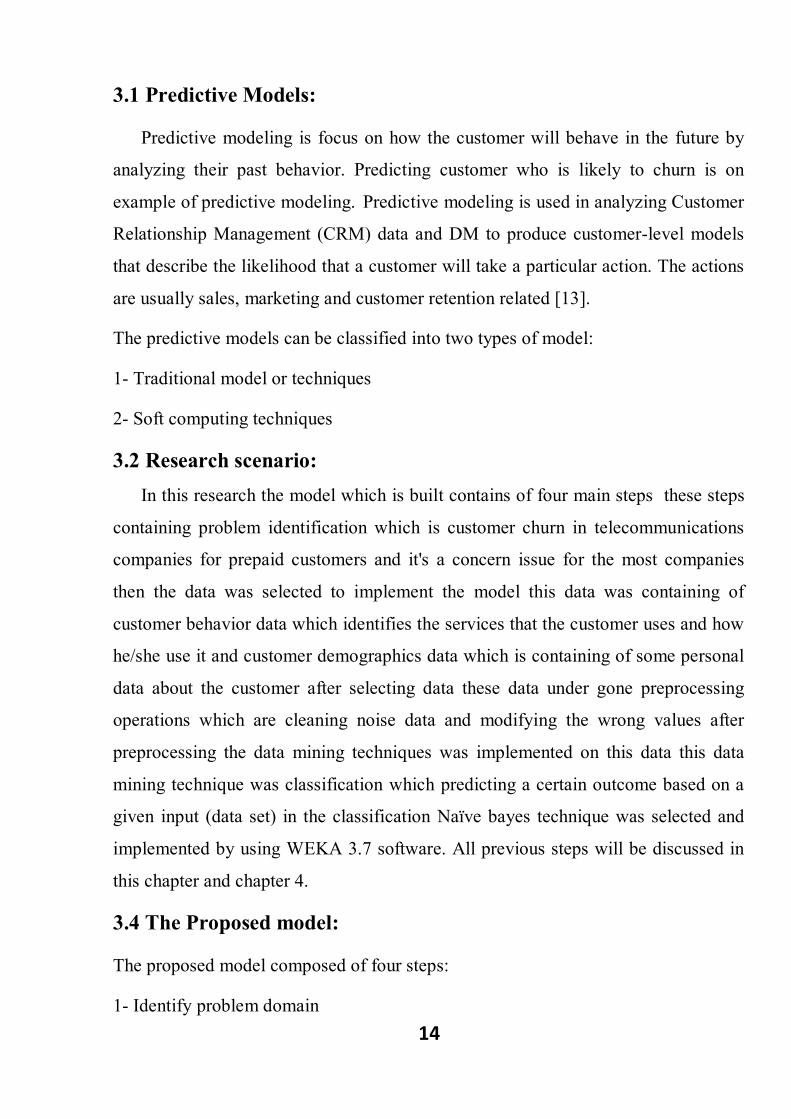
3.1 Predictive Models:
Predictive modeling is focus on how the customer will behave in the future by
analyzing their past behavior. Predicting customer who is likely to churn is on
example of predictive modeling. Predictive modeling is used in analyzing Customer
Relationship Management (CRM) data and DM to produce customer-level models
that describe the likelihood that a customer will take a particular action. The actions
are usually sales, marketing and customer retention related [13].
The predictive models can be classified into two types of model:
1- Traditional model or techniques
2- Soft computing techniques
3.2 Research scenario: In this research the model which is built contains of four main steps these steps
containing problem identification which is customer churn in telecommunications
companies for prepaid customers and it's a concern issue for the most companies
then the data was selected to implement the model this data was containing of
customer behavior data which identifies the services that the customer uses and how
he/she use it and customer demographics data which is containing of some personal
data about the customer after selecting data these data under gone preprocessing
operations which are cleaning noise data and modifying the wrong values after
preprocessing the data mining techniques was implemented on this data this data
mining technique was classification which predicting a certain outcome based on a
given input (data set) in the classification Naïve bayes technique was selected and
implemented by using WEKA 3.7 software. All previous steps will be discussed in
this chapter and chapter 4.
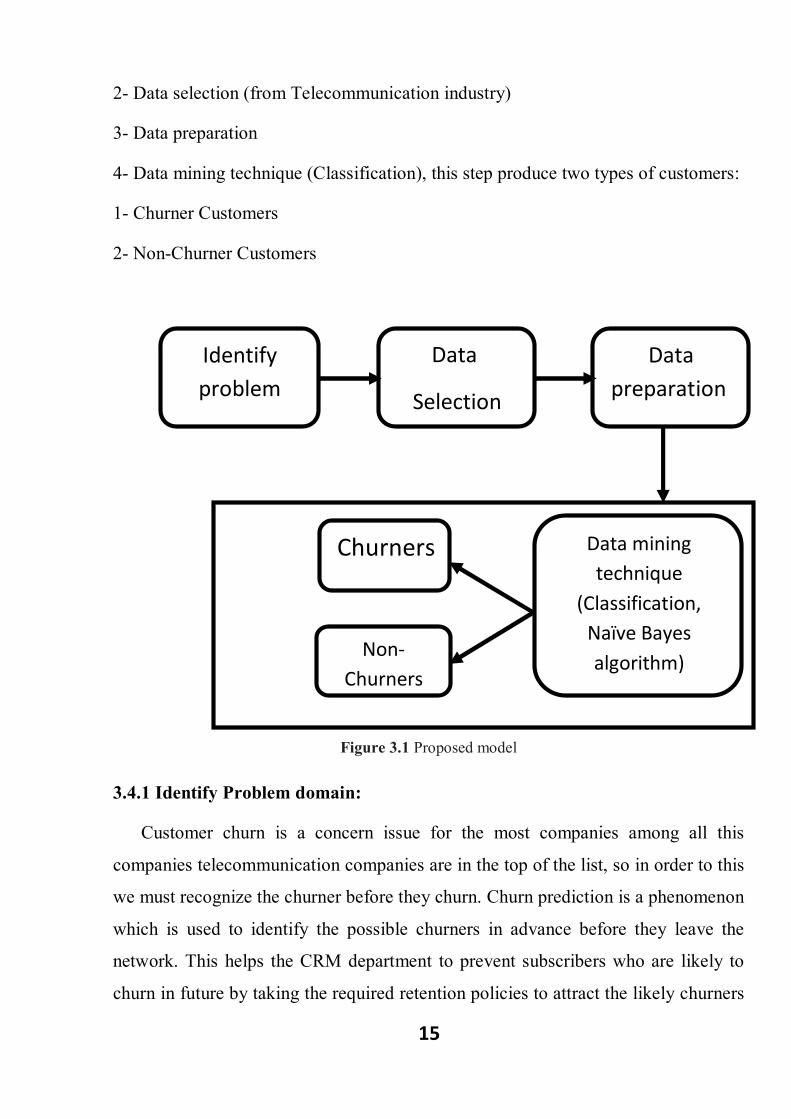
3.4 The Proposed model:
The proposed model composed of four steps:
1- Identify problem domain
15
2- Data selection (from Telecommunication industry)
3- Data preparation
4- Data mining technique (Classification), this step produce two types of customers:
1- Churner Customers
2- Non-Churner Customers
Figure 3.1 Proposed model
3.4.1 Identify Problem domain:
Customer churn is a concern issue for the most companies among all this
companies telecommunication companies are in the top of the list, so in order to this
we must recognize the churner before they churn. Churn prediction is a phenomenon
which is used to identify the possible churners in advance before they leave the
network. This helps the CRM department to prevent subscribers who are likely to
churn in future by taking the required retention policies to attract the likely churners
Identify problem
Data
Selection
Data preparation
Data mining technique
(Classification, Naïve Bayes algorithm)
Churners
Non-Churners
16
and to retain them. Thereby, the potential loss of the company could be avoided.
This research utilizes data mining techniques to identify the churners.
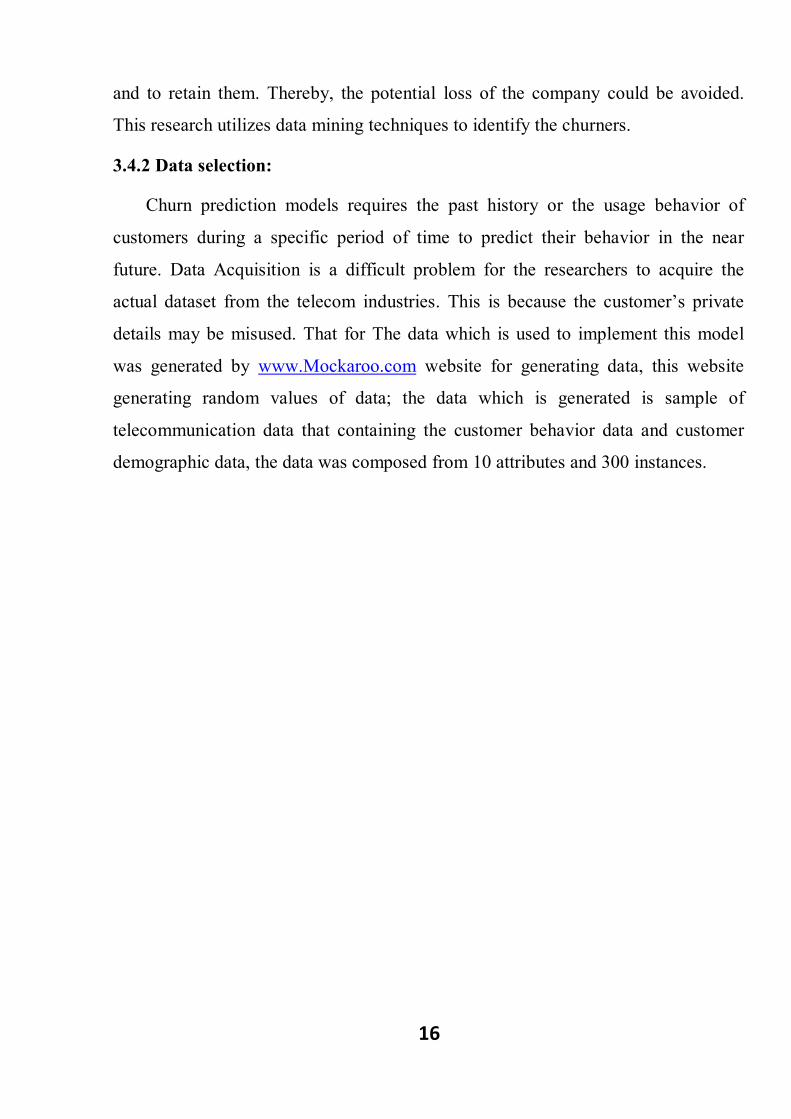
3.4.2 Data selection:
Churn prediction models requires the past history or the usage behavior of
customers during a specific period of time to predict their behavior in the near
future. Data Acquisition is a difficult problem for the researchers to acquire the
actual dataset from the telecom industries. This is because the customer’s private
details may be misused. That for The data which is used to implement this model
was generated by www.Mockaroo.com website for generating data, this website
generating random values of data; the data which is generated is sample of
telecommunication data that containing the customer behavior data and customer
demographic data, the data was composed from 10 attributes and 300 instances.
17
Table 3.1 Attributes table
Attribute description Attribute type Attribute
Customer's phone number Numeric Phone
Customer's Name Nominal (text) Name
Customer's gender (Male / Female) Nominal (text) Gender
Mean of all in Minutes which is
customer receive
Numeric M_in_M
Mean of all out Minutes which is
customer make
Numeric M_out_M
Total of all Minutes (in and out)
Total_in_out = M_in_M + M_out_M
Numeric Total_all_M
Means of all customer's SMS which
is sent or received
Numeric M_SMS
Associated services rather than calls
or SMSs (Yes / No)
Nominal Asso_ser
Label class Nominal Churn
18
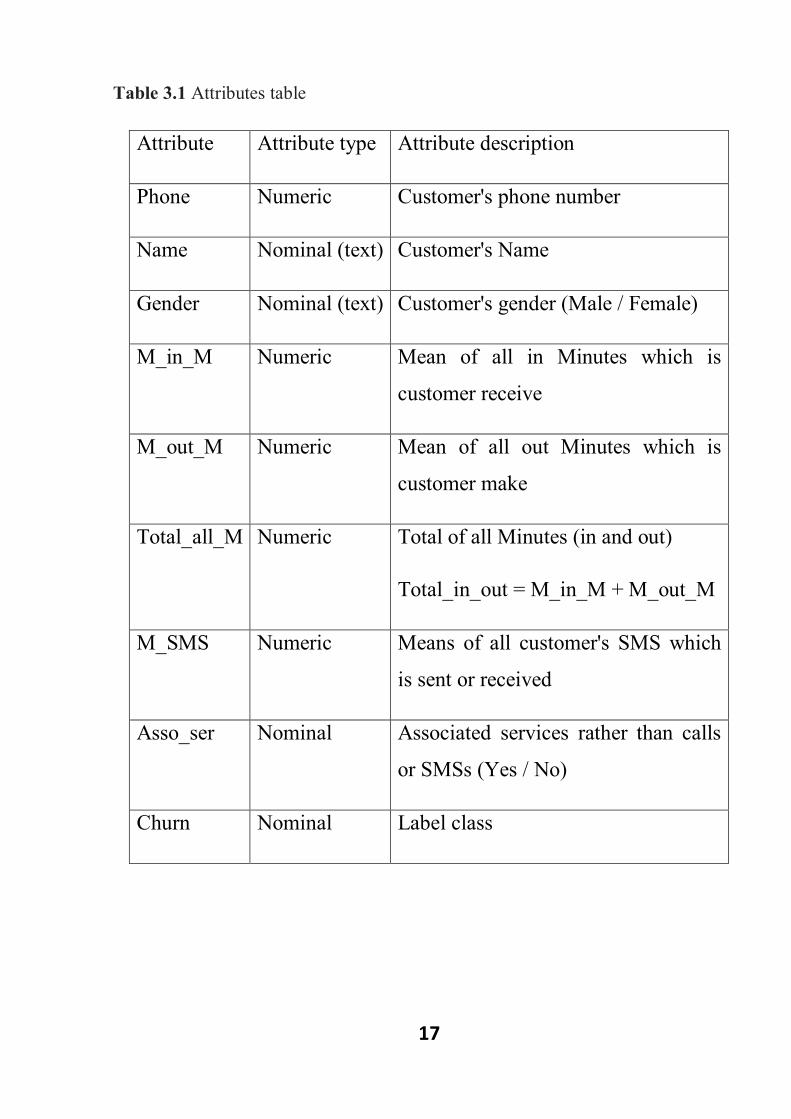
3.4.3 Data preparation:
Because of random values generation of data's values, the data was containing
many wrong values, so in this step these wrong values was corrected by changing
these wrong values, these wrong values was very obvious in value of Total_in_out
attribute which is dependent on summation of No_in_m and No_out_m, the values
of this attribute was corrected by using Excel formulas.
Figure 3.2 The data before modified
19
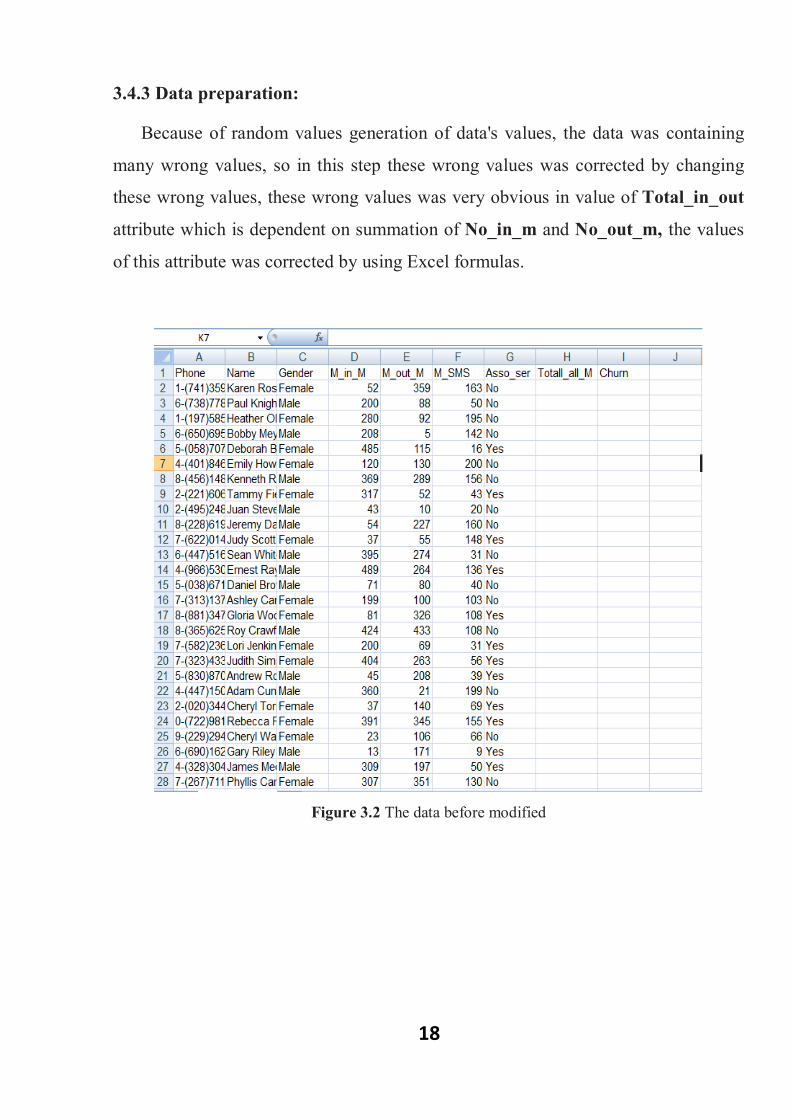
The formula of Total_in_out was:= 푆푈푀(퐷2: 퐸2)
Figure 3.3 Total_all_M field after modified
The formula of Churn was:
= 퐼퐹(퐻2 ≥ 300; non_churn; churn)
Figure 3.4 Churn field after modified

20
3.4.4 Data mining technique (Classification, Naïve Bayes algorithm):
In this step the model was implemented by using Naïve bayes algorithm in
classification. Naïve bayes algorithm was implemented to predicts wither the
customer will churn or not. Naïve bayes is a simple probabilistic classifier which is
simple and easy to understand, its deal with any number of features or classes, and
it's strong so if there are a few noises in data it doesn't affects on the results,
depending on the nature of the probability of Naive Bayes classifier it can be trained
efficiently in supervised learning.

Chapter Four
Implementation
21
4.1 Model implementation tool:
The model in this research was implemented by using WEKA 3.7 software
which is one of the data mining and machine learning tools its an open source
software under GNU General Public license, this tool developed by WEKA team, its
contain of inbuilt algorithms for data mining and machine learning, this tool is
easily to use for peoples who are haven't much knowledge about data Mining
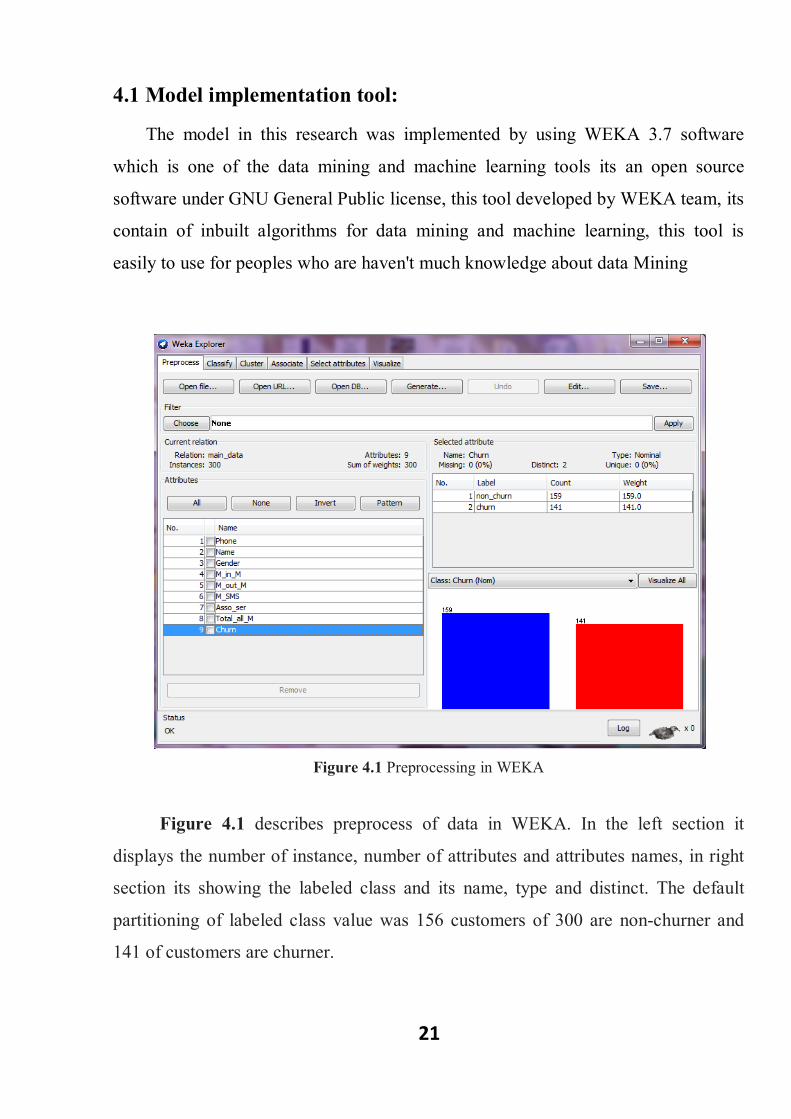
Figure 4.1 Preprocessing in WEKA
Figure 4.1 describes preprocess of data in WEKA. In the left section it
displays the number of instance, number of attributes and attributes names, in right
section its showing the labeled class and its name, type and distinct. The default
partitioning of labeled class value was 156 customers of 300 are non-churner and
141 of customers are churner.
22
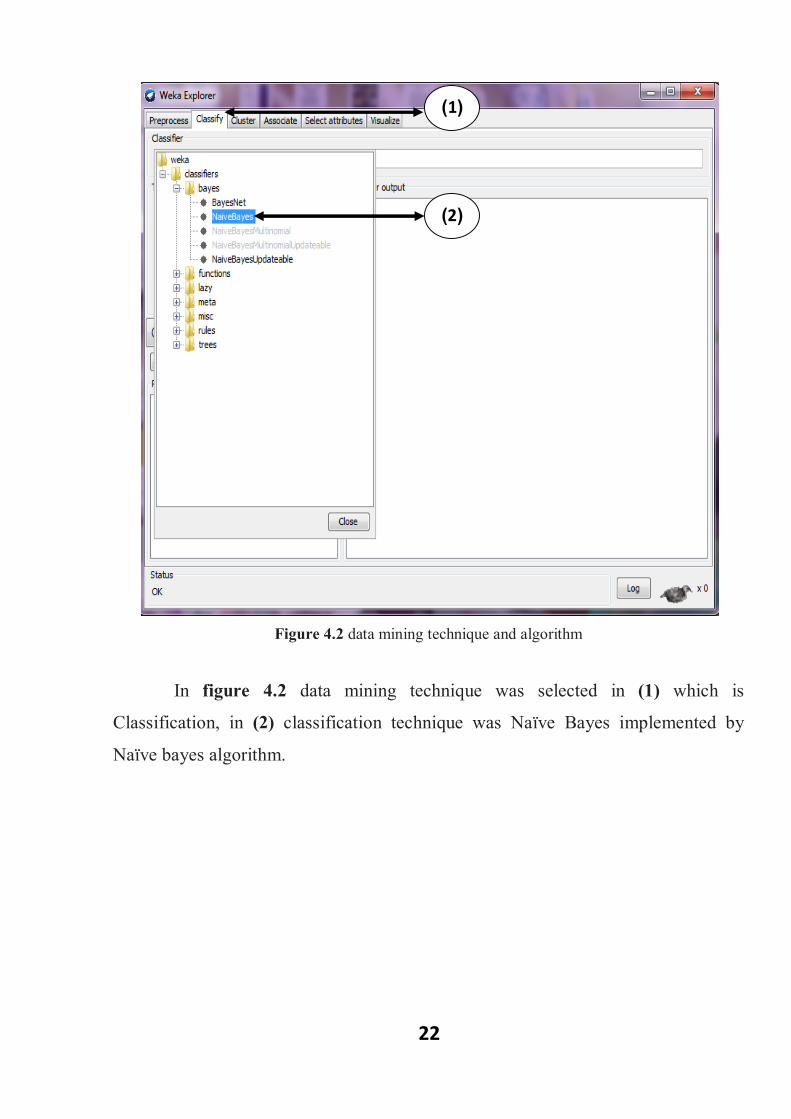
Figure 4.2 data mining technique and algorithm
In figure 4.2 data mining technique was selected in (1) which is
Classification, in (2) classification technique was Naïve Bayes implemented by
Naïve bayes algorithm.
)1(
)2(
23
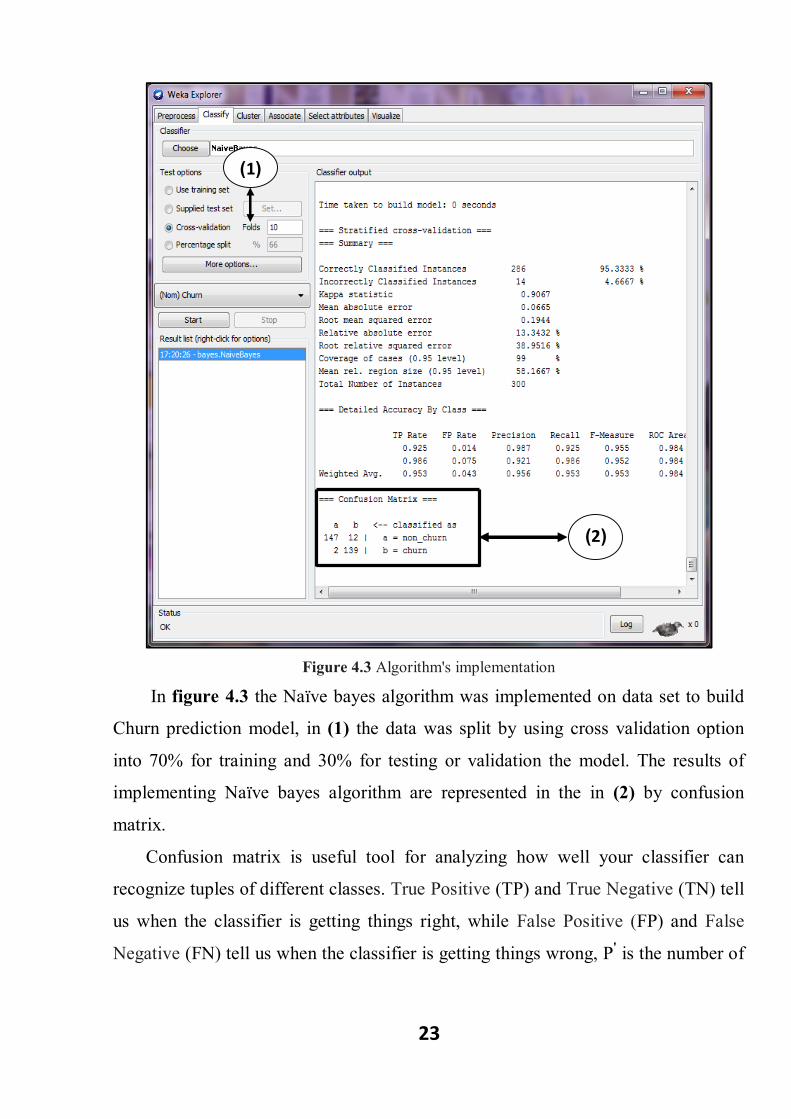
Figure 4.3 Algorithm's implementation
In figure 4.3 the Naïve bayes algorithm was implemented on data set to build
Churn prediction model, in (1) the data was split by using cross validation option
into 70% for training and 30% for testing or validation the model. The results of
implementing Naïve bayes algorithm are represented in the in (2) by confusion
matrix.
Confusion matrix is useful tool for analyzing how well your classifier can
recognize tuples of different classes. True Positive (TP) and True Negative (TN) tell
us when the classifier is getting things right, while False Positive (FP) and False
Negative (FN) tell us when the classifier is getting things wrong, P' is the number of
)1(
)2(
24
tuples that were labeled as positive (TP+FP) and N' is the number of tuples that
were labeled as negative (TN+FN) [7].
4.2 Results:
Table 4.1 Result
Classes Non-churn Churn Total
Non-churn 147 12 159
Churn 2 139 141
Total 149 151 300
From previous table which is describes confusion matrix there are two classes which
are Non-churn and Churn, so:
True Positive (TP) instance that classified correctly as Non-churn = 147
True Negative (TN) instance that classified correctly as Churn = 139
False Positive (FP) instance that classified incorrectly as Non-churn = 2
False Negative (FN) instance that classified incorrectly as Churn = 12
The number of tuples labeled as positive P' = TP + FP = 149
The number of tuples labeled as negative N' = TN + FN = 151
So from prediction we have 147 correctly predicted as Non-churner customer from
159 which is (92.5%) and 139 correctly predicted as Churner customer from 141
which is (98.5%).
퐴푐푐푢푟푎푐푦표푓푐푙푎푠푠푖푓푖푒푟 = 푇푃 + 푇푁
푇표푡푎푙푛푢푚푏푒푟표푓푖푛푠푡푎푛푐푒

25
So:
The accuracy of Naïve bayes classifier in given test = = 95.3%
which is a high accuracy.

Chapter Five
Conclusion
& Recommendations
26
5.1 Conclusion:
Customer churn is a big issue in telecom companies especially for prepaid
subscribers because it happen easily under light of strong competition in this
business area, so these companies need to build a churn prediction model t identify
churner and non-churner customer and avoid this churn.
In this study the churn prediction model was built, this model contains of four
steps which in ordering are: identify problem which is the churn problem in telecom
companies, data selection in this step the data which is selected was generated from
www.Mokaro.com website, data preparation, implementation of Naïve bayes
algorithm in the model by using WEKA 3.7 software.
The model was built by treading its four steps and using the data which
selected and Naïve bayes algorithm to implement it the result was there is from 147
customers correctly predicted as Non-churner customer from 159 which is (92.5%)
and 139 customers correctly predicted as Churner customer from 141 which is
(98.5%) with 95.3% of accuracy.
27
5.2 Recommendation:
In this study the model was implemented by using Naïve bayes algorithm, in
the future it could implemented by using another algorithm for example
Support Victor Machine (SVM) algorithm which has higher accuracy by
comparing it with another algorithms which was implemented at many
another application, so if SVM implemented for churn prediction model it
may results higher accuracy than Naïve Bayes algorithm.
This study stops at identifying churner and non-churner customers, so the
future researches can develop by adding a new step to the model to evaluate
the churners by categorizing them into three categories which are (high ,
medium , low) by using clustering technique and implementing one of its
algorithm

28
References [1] L.J.S.M. ALBERTS, 2006. Churn prediction in the mobile telecommunications industry
[2] ESSAM SHAABAN, Y. H., AYMAN KHEDER, MONA NASER 2012. A proposed churn
prediction model. International journal of engineering 2.
[3] H. Newton, Newton’s Telecom Dictionary, CMP Books, http://www.cmpbooks.com
[4] U. Fayyad, G. Piatetsky-Shapiro, P. Smyth (1996), Knowledge discovery and data mining:
Towards a unifying framework. In: Proceedings of the 2nd ACM international conference on
knowledge discovery and data mining (KDD), Portland, OR, pp 82–88
[5] KONSTANTINOS TSIPTSIS, A. C. 2009. Data mining techniques in CRM: Inside customer
segmentation. A John Wiley and Sons, Ltd., Publication.
[6] Alan O.SYKES, A. An introduction to regression analysis. The Inaugural Coase Lecture.
[7] MD.RASHID FAROOQI, K. R. 2011. A comprehensive study of CRM through data mining
techniques. Proceedings of the National Conference.
[8] PREETI KUMARI, K. R. 2014. Selection of significant features using decision tree classifiers.
Journal of engineering research and applications, 4.
[9] BALAJI 2013. Segmentation of customers for prediction analysis using supervised and
unsupervised data mining techniques, Vels University.
[10] LAZAROV, V. churn prediction. Marius Capota Technische Universität München
[11] SHYAM V.NATH, R.S.B. Customer churn analysis in the wireless industry: A data mining
approach
[12] NGUYEN, E. H. X. 2011. Customers churn prediction for the Icelandic Mobile Telephony
Market, University of Iceland.

29
[13] A. AZEVEDO, An Architecture for an effective usage of data mining in Business
Intelligence
[14] www.Mockaroo.com
Copyright © 2022 FDOKUMEN


![[Data on rilpivirine in treatment-naïve patients. Lessons from ECHO, THRIVE and STaR]](https://static.fdokumen.com/doc/165x107/63332a3f9d8fc1106803ac51/data-on-rilpivirine-in-treatment-naive-patients-lessons-from-echo-thrive-and.jpg)