Multimodal Magnetic Resonance Imaging Study of Treatment-Naïve Adults with...
13
Multimodal Magnetic Resonance Imaging Study of Treatment-Naı ¨ve Adults with Attention-Deficit/ Hyperactivity Disorder Tiffany M. Chaim 1,2,3 *, Tianhao Zhang 4 , Marcus V. Zanetti 1,2 , Maria Aparecida da Silva 3 , Ma ´ rio R. Louza ˜ 3 , Jimit Doshi 4 , Mauricio H. Serpa 1,2 , Fabio L. S. Duran 1,2 , Sheila C. Caetano 1,2 , Christos Davatzikos 4 , Geraldo F. Busatto 1,2 1 Laboratory of Psychiatric Neuroimaging, Department and Institute of Psychiatry, Faculty of Medicine, University of Sa ˜o Paulo, Sao Paulo, Sao Paulo, Brazil, 2 Center for Interdisciplinary Research on Applied Neurosciences, University of Sa ˜o Paulo, Sao Paulo, Sa ˜ o Paulo, Brazil, 3 Program for Attention Deficit Hyperactivity Disorder, Department and Institute of Psychiatry, Faculty of Medicine, University of Sa ˜ o Paulo, Sao Paulo, Sao Paulo, Brazil, 4 Section of Biomedical Image Analysis, Department of Radiology, University of Pennsylvania, Philadelphia, Pennsylvania, Unites States of America Abstract Background: Attention-Deficit/Hiperactivity Disorder (ADHD) is a prevalent disorder, but its neuroanatomical circuitry is still relatively understudied, especially in the adult population. The few morphometric magnetic resonance imaging (MRI) and diffusion tensor imaging (DTI) studies available to date have found heterogeneous results. This may be at least partly attributable to some well-known technical limitations of the conventional voxel-based methods usually employed to analyze such neuroimaging data. Moreover, there is a great paucity of imaging studies of adult ADHD to date that have excluded patients with history of use of stimulant medication. Methods: A newly validated method named optimally-discriminative voxel-based analysis (ODVBA) was applied to multimodal (structural and DTI) MRI data acquired from 22 treatment-naı ¨ve ADHD adults and 19 age- and gender-matched healthy controls (HC). Results: Regarding DTI data, we found higher fractional anisotropy in ADHD relative to HC encompassing the white matter (WM) of the bilateral superior frontal gyrus, right middle frontal left gyrus, left postcentral gyrus, bilateral cingulate gyrus, bilateral middle temporal gyrus and right superior temporal gyrus; reductions in trace (a measure of diffusivity) in ADHD relative to HC were also found in fronto-striatal-parieto-occipital circuits, including the right superior frontal gyrus and bilateral middle frontal gyrus, right precentral gyrus, left middle occipital gyrus and bilateral cingulate gyrus, as well as the left body and right splenium of the corpus callosum, right superior corona radiata, and right superior longitudinal and fronto-occipital fasciculi. Volumetric abnormalities in ADHD subjects were found only at a trend level of significance, including reduced gray matter (GM) in the right angular gyrus, and increased GM in the right supplementary motor area and superior frontal gyrus. Conclusions: Our results suggest that adult ADHD is associated with neuroanatomical abnormalities mainly affecting the WM microstructure in fronto-parieto-temporal circuits that have been implicated in cognitive, emotional and visuomotor processes. Citation: Chaim TM, Zhang T, Zanetti MV, da Silva MA, Louza ˜ MR, et al. (2014) Multimodal Magnetic Resonance Imaging Study of Treatment-Naı ¨ve Adults with Attention-Deficit/Hyperactivity Disorder. PLoS ONE 9(10): e110199. doi:10.1371/journal.pone.0110199 Editor: Juan Zhou, Duke-NUS Graduate Medical School, Singapore Received July 26, 2013; Accepted September 18, 2014; Published October 13, 2014 Copyright: ß 2014 Chaim et al. This is an open-access article distributed under the terms of the Creative Commons Attribution License, which permits unrestricted use, distribution, and reproduction in any medium, provided the original author and source are credited. Funding: The present investigation was supported by a 2010 NARSAD Independent Investigator Award (NARSAD: The Brain and Behavior Research Fund) awarded to Geraldo F. Busatto. Geraldo F. Busatto is also partially funded by CNPq-Brazil. The funders had no role in study design, data collection and analysis, decision to publish, or preparation of the manuscript. Competing Interests: The authors have declared that no competing interests exist. * Email: [email protected] Introduction Attention-deficit and hyperactivity disorder (ADHD) is a frequent and underdiagnosed mental disorder in the general adult population, with a reported prevalence of up to 5.8% in this age range [1–4]. The neuroanatomical circuitry underlying adult ADHD is still relatively understudied. Only a few brain morphometric investi- gations using magnetic resonance imaging (MRI) have evaluated adult ADHD subjects to date, most of which enrolling patients under pharmacological treatment with stimulant agents. These MRI studies have suggested the presence of gray matter (GM) volume abnormalities in prefrontal-striatal-parietal networks [6– 8], known to have a central role in attentional processing and executive functioning in general [8]. Other brain regions have also been variably found to present volume abnormalities in adult ADHD patients, including the anterior cingulate cortex, occipital PLOS ONE | www.plosone.org 1 October 2014 | Volume 9 | Issue 10 | e110199
Transcript of Multimodal Magnetic Resonance Imaging Study of Treatment-Naïve Adults with...

Multimodal Magnetic Resonance Imaging Study ofTreatment-Naıve Adults with Attention-Deficit/Hyperactivity DisorderTiffany M. Chaim1,2,3*, Tianhao Zhang4, Marcus V. Zanetti1,2, Maria Aparecida da Silva3, Mario R. Louza3,
Jimit Doshi4, Mauricio H. Serpa1,2, Fabio L. S. Duran1,2, Sheila C. Caetano1,2, Christos Davatzikos4,
Geraldo F. Busatto1,2
1 Laboratory of Psychiatric Neuroimaging, Department and Institute of Psychiatry, Faculty of Medicine, University of Sao Paulo, Sao Paulo, Sao Paulo, Brazil, 2Center for
Interdisciplinary Research on Applied Neurosciences, University of Sao Paulo, Sao Paulo, Sao Paulo, Brazil, 3 Program for Attention Deficit Hyperactivity Disorder,
Department and Institute of Psychiatry, Faculty of Medicine, University of Sao Paulo, Sao Paulo, Sao Paulo, Brazil, 4 Section of Biomedical Image Analysis, Department of
Radiology, University of Pennsylvania, Philadelphia, Pennsylvania, Unites States of America
Abstract
Background: Attention-Deficit/Hiperactivity Disorder (ADHD) is a prevalent disorder, but its neuroanatomical circuitry is stillrelatively understudied, especially in the adult population. The few morphometric magnetic resonance imaging (MRI) anddiffusion tensor imaging (DTI) studies available to date have found heterogeneous results. This may be at least partlyattributable to some well-known technical limitations of the conventional voxel-based methods usually employed toanalyze such neuroimaging data. Moreover, there is a great paucity of imaging studies of adult ADHD to date that haveexcluded patients with history of use of stimulant medication.
Methods: A newly validated method named optimally-discriminative voxel-based analysis (ODVBA) was applied tomultimodal (structural and DTI) MRI data acquired from 22 treatment-naıve ADHD adults and 19 age- and gender-matchedhealthy controls (HC).
Results: Regarding DTI data, we found higher fractional anisotropy in ADHD relative to HC encompassing the white matter(WM) of the bilateral superior frontal gyrus, right middle frontal left gyrus, left postcentral gyrus, bilateral cingulate gyrus,bilateral middle temporal gyrus and right superior temporal gyrus; reductions in trace (a measure of diffusivity) in ADHDrelative to HC were also found in fronto-striatal-parieto-occipital circuits, including the right superior frontal gyrus andbilateral middle frontal gyrus, right precentral gyrus, left middle occipital gyrus and bilateral cingulate gyrus, as well as theleft body and right splenium of the corpus callosum, right superior corona radiata, and right superior longitudinal andfronto-occipital fasciculi. Volumetric abnormalities in ADHD subjects were found only at a trend level of significance,including reduced gray matter (GM) in the right angular gyrus, and increased GM in the right supplementary motor area andsuperior frontal gyrus.
Conclusions: Our results suggest that adult ADHD is associated with neuroanatomical abnormalities mainly affecting theWM microstructure in fronto-parieto-temporal circuits that have been implicated in cognitive, emotional and visuomotorprocesses.
Citation: Chaim TM, Zhang T, Zanetti MV, da Silva MA, Louza MR, et al. (2014) Multimodal Magnetic Resonance Imaging Study of Treatment-Naıve Adults withAttention-Deficit/Hyperactivity Disorder. PLoS ONE 9(10): e110199. doi:10.1371/journal.pone.0110199
Editor: Juan Zhou, Duke-NUS Graduate Medical School, Singapore
Received July 26, 2013; Accepted September 18, 2014; Published October 13, 2014
Copyright: � 2014 Chaim et al. This is an open-access article distributed under the terms of the Creative Commons Attribution License, which permitsunrestricted use, distribution, and reproduction in any medium, provided the original author and source are credited.
Funding: The present investigation was supported by a 2010 NARSAD Independent Investigator Award (NARSAD: The Brain and Behavior Research Fund)awarded to Geraldo F. Busatto. Geraldo F. Busatto is also partially funded by CNPq-Brazil. The funders had no role in study design, data collection and analysis,decision to publish, or preparation of the manuscript.
Competing Interests: The authors have declared that no competing interests exist.
* Email: [email protected]
Introduction
Attention-deficit and hyperactivity disorder (ADHD) is a
frequent and underdiagnosed mental disorder in the general adult
population, with a reported prevalence of up to 5.8% in this age
range [1–4].
The neuroanatomical circuitry underlying adult ADHD is still
relatively understudied. Only a few brain morphometric investi-
gations using magnetic resonance imaging (MRI) have evaluated
adult ADHD subjects to date, most of which enrolling patients
under pharmacological treatment with stimulant agents. These
MRI studies have suggested the presence of gray matter (GM)
volume abnormalities in prefrontal-striatal-parietal networks [6–
8], known to have a central role in attentional processing and
executive functioning in general [8]. Other brain regions have also
been variably found to present volume abnormalities in adult
ADHD patients, including the anterior cingulate cortex, occipital
PLOS ONE | www.plosone.org 1 October 2014 | Volume 9 | Issue 10 | e110199

cortex and thalamus [8,11,12]. Using diffusion tensor imaging
(DTI), MRI studies may also help to unravel the nature of WM
microstructural pathological features underlying ADHD in adults,
allowing the combined measurement of different indices of white
matter microstructural integrity, namely: fractional anisotropy
(FA), which provides information on axonal integrity and
homogeneity of fiber orientations [13,14]; and measures of
diffusivity, which reflect deficits in cellular density, myelin
breakdown or changes in extracellular volumes [13,15,16]. The
few available DTI studies of adult ADHD subjects to date have
reported alterations in tracts that interconnect the above GM
regions and which are known to be important for attention and
decision making processes, such as the superior longitudinal
fasciculus [5,9,10].
Thus although not yet numerous, the above MRI studies have
provided preliminary evidence that the neuropathology underlying
ADHD in adults may involve abnormalities both of GM and WM
tracts. However, there has been a great paucity of studies
evaluating treatment-naıve adult ADHD subjects to date
[17,18], and no MRI study of such population has acquired both
morphometric and DTI data from the same individuals at the
same point in time.
Because widely distributed brain networks may be implicated in
ADHD, voxel-based methods that systematically search for
abnormalities across the entire brain may be more suitable for
analyzing data in MRI studies of ADHD, rather than region of
interest (ROI)-based methods that are unavoidably restricted to a
few selected portions of the brain. However, significant findings
have varied considerably across the few MRI studies of ADHD to
date that used voxelwise methods, particularly in regard to their
specific brain location [7,19,20]. Such discrepancies might be, at
least in part, attributed to some well-known technical limitations of
conventional voxel-based image analysis approaches. For instance,
voxel-based morphometry (VBM) methods include a step of image
blurring by Gaussian smoothing, in order to account for
registration errors and to conform the imaging data to a normal
distribution, which is important to validate the assumptions of the
statistical parametric mapping approach usually employed in
VBM studies [21]. This is conventionally performed in a
homogeneous fashion across the whole brain, without accounting
for either the wide differences in shape and size of separate brain
portions or inter-subject variations; such uniform smoothing
methods may increase the risk of both false positive and false
negative results [22]. Moreover, the size of the Gaussian kernel is
chosen in each study in a somewhat ad hoc way, even though it
significantly affects the detected group differences. Finally, and
most importantly, conventional VBM methods employ a ‘‘mass
univariate’’ statistical approach, considering each voxel individu-
ally in its separate brain compartment without weighting possible
inter-relationships with neighboring voxels and voxels from other
brain tissues [23]. For example, in a situation where a specific
disorder under study is associated with an enlargement of a given
brain area (such as the temporal horn of the lateral ventricle), the
VBM analysis may misinterpret such abnormality as a volumetric
reduction of a neighboring region (such as the hippocampus). This
statistical approach substantially reduces sensitivity to detect group
differences and can also produce mislocalization of regions of
significant brain tissue density or volumetric changes.
A recently developed voxelwise image analysis methodology,
known as optimally-discriminative voxel-based analysis (ODVBA),
attempts to minimize the above technical limitations. The
ODVBA approach employs a spatially adaptive smoothing
filtering and a high-dimensional multivariate local discriminative
analysis technique in order to achieve improved sensitivity and
accuracy to detect regional brain abnormalities [22]. This
methodology has been validated in a recently published study by
two of the authors (T.Z and C.D) [24]. In this study, the ODVBA
was evaluated using datasets of previously published investigations
in schizophrenia and minor cognitive impairment (MCI) in
comparison to other established methods, including: the conven-
tional VBM method (Gaussian smoothing plus general linear
model – GLM); extant spatially adaptive smoothing methods; and
cluster enhancing methods. The experimental results indicated
that ODVBA was considerably more sensitive in detecting group
differences, demonstrating the highest significance in group
differences within the identified voxels. In terms of the spatial
extent of detected areas of group differences, agreement of
anatomical boundaries and classification, the ODVBA performed
better than the other tested voxel-based methods and competi-
tively with the cluster enhancing methods [24]. The findings
obtained with the ODBVA approach in those clinical samples
were consistent with the previous literature, including widespread
GM losses both in schizophrenia and MCI involving several
cortical and limbic regions, as well as a greater degree of GM
losses in MCI patients who later converted to Alzheimers disease
compared to non-converters [24].
In the present MRI study, we employed the ODBVA approach
to compare treatment-naıve adults with ADHD and age and
gender-matched healthy controls (HC). Given the relevance of
assessing both localized morphological abnormalities and micro-
structural changes in large-scale brain networks associated with
ADHD [5,25,26], we adopted a multi-modal MRI approach,
applying the same voxelwise routines to compare both GM and
WM volumes and DTI indices (FA and Trace – TR, an index of
diffusivity) between groups. Such combined approach aimed to
ascertain whether there are similarities or differences in the
topography and severity of GM/WM volumetric versus micro-
structural WM abnormalities in never-medicated adult ADHD
patients. This integrative mapping of morphological and micro-
structural abnormalities in such population may provide further
insights into the neural underpinnings of the clinical manifestations
of ADHD in adulthood, including its cognitive and behavioral
problems. Also, by combining two DTI indices (FA and TR), we
wished to improve understanding about the mechanisms under-
lying the microstructural WM abnormalities in never-medicated
adult ADHD patients. Based on findings from the previous MRI
literature cited above [5–9], we hypothesized the presence of
widespread volumetric abnormalities in the adult ADHD group
relative to healthy controls, mainly affecting prefrontal, striatal and
parietal regions, as well as microstructural WM abnormalities as
assessed with DTI in the tracts which interconnect such brain
network, including the caudate nucleus, superior corona radiata,
superior longitudinal fasciculus and the cingulum bundle.
Methods and Materials
ParticipantsTwenty-two treatment-naive patients with ADHD aged 18–50
years were consecutively evaluated at the outpatient ADHD clinic
of the Institute of Psychiatry, University of Sao Paulo, Brazil.
Subjects were interviewed with the Structured Clinical Interview
(SCID) for the DSM-IV [27], and the Schedule for Affective
Disorders and Schizophrenia for school-age children-present and
lifetime version (K-SADS-PL) [28] Adapted Module (version 6.0)
in order to confirm the diagnosis of ADHD and also to access
potential axis I comorbidities. For the assessment of symptom
severity, we used the Adult ADHD Self-Report Scale (ASRS-18)
[29].
Multimodal MR Study of Treatment-Naıve ADHD Adults
PLOS ONE | www.plosone.org 2 October 2014 | Volume 9 | Issue 10 | e110199
Healthy volunteers matched for age and gender with ADHD
patients were recruited through advertisement in the local
community and constituted our HC group. All subjects in the
HC group also underwent clinical interviewing, including the
SCID and the K-SADS-PL screening, in order to exclude
psychiatric disorders and previous use of psychopharmacological
agents.
In addition to the clinical instruments mentioned above, both
patients and HC were screened for substance use with the Alcohol
Use Disorders Identification Test (AUDIT) [30] and the South
Westminster Questionnaire [31]. Diagnostic criteria for substance
abuse or dependence were assessed using the SCID [32].
Handedness was assessed using the Edinburgh inventory [33].
Moreover, a general medical history, including information about
cerebrovascular risk factors, and data on the use of psychotropic
and general medications, was obtained through interviews with
patients and/or their family.
Exclusion criteria for both groups were: substance abuse or
dependence (current and lifetime); the presence of medical
conditions or neurological disorders which could affect the central
nervous system; history of mental retardation as assessed by
clinical interviews with the patients and a close relative if
necessary; past history of head trauma with loss of consciousness;
and contraindications for MRI scanning.
This study was approved by our local ethics committee:
‘‘Comissao de Etica para Analise de Projetos de Pesquisa’’ –
CAPPesq from the board of the University o Sao Paulo Medical
School, and ‘‘Comissao Nacional de Etica em Pesquisa – Conep’’.
After complete description of the study to the subjects, written
informed consent was obtained.
Image acquisitionAll subjects (ADHD patients and HC) underwent MRI scanning
using a 1.5T Siemens Espree system (Siemens, Erlagen, Germany).
Morphological data was acquired using a T1-weighted magne-
tization-prepared rapid gradient echo sequence (MPRAGE) using
the following parameters: TR = 2,400 ms, TE = 3.65 ms,
NEX = 1, field of view (FOV) = 240 mm, flip angle = 8o, ma-
trix = 1926192 pixels, slice thickness = 1.2 mm (no gap between
slices), voxel size = 1.361.3612 mm, resulting in 160 slices
covering the whole brain.
The DTI sequence was acquired using cardiac gating, a 12-
channel head coil and parallel imaging. DTI was based on an
echo-planar image (EPI) acquisition and consisted of one image
without diffusion gradient (b = 0 s/mm2) plus diffusion-weighted
images (DWI) acquired along 64 non-colinear directions
(b = 1,000 s/mm2) using the following parameters:
TR = 8,000 ms, TE = 110 ms, NEX = 2, FOV = 240 mm, ma-
trix = 1206120 pixels, slice thickness = 2.7 mm (no gap between
slices), voxel size = 2.062.062.7 mm, resulting in 50 slices
covering the whole brain.
The two sequences were acquired in up to 25 minutes. The
imaging protocol also included a T2-weighted turbo spin-echo
transaxial sequence (24 slices, slice thickness = 5 mm, 1 mm gap)
and a fluid attenuated inversion recovery (FLAIR) transaxial
sequence (24 slices, slice thickness = 5 mm, 1 mm gap). Individual
image inspection of the datasets of each subject was performed
visually by an expert neuroradiologist aiming to identify silent
gross brain lesions and artifacts that could interfere with image
processing and analysis.
Processing and analysis of neuroimaging dataThe T1-weighted images were pre-processed by correcting for
signal inhomogeneities followed by skull-stripping and cerebellum
removal. The MNI_N3 Software Package [34], available in:
http://www.bic.mni.mcgill.ca/software/N3/, was used for cor-
recting for signal inhomogeneities. Then, the skull-stripping and
cerebellum removal were performed using a novel automated
method known as Multi-Atlas Skull-Stripping (MASS version 1.0)
[35], This method has been validated on three different public
data sets and has been shown to achieve a higher accuracy than
other state-of-the-art brain extraction methods [35]. It uses a set of
selected atlases that are built from the actual dataset under study,
based on a classification process that identifies a subgroup of
images that best represent the neuroanatomical variations within
the sample. Finally, each resulting image was subsequently
inspected for imperfections in the skull-stripping and cerebellum
removal process (cortical erosions or extra-cerebral tissue remains,
for example) and corrections were eventually made manually using
the Rordens MRIcro 6/2013 program, available in: http://www.
mccauslandcenter.sc.edu/mricro/mricron/index.html. As the seg-
mentation algorithms used to extract the GM and WM have been
shown to be inaccurate in the cerebellum, due to reduced contrast,
our group routinely performs the cerebellum removal. Moreover,
the removal of the cerebellum improves our ability to accurately
segment GM/WM throughout the brain.
The images were subsequently segmented into their 3 principal
brain tissues (GM, WM, and cerebrospinal fluid space) through an
automated, iterative algorithm for energy minimization called
Multiplicative Intrinsic Component Optimization (MICO) [36],
available in http://www.rad.upenn.edu/sbia/software/request.
php?software=mico. The skull-stripped and cerebellum-removed
images were then spatially registered to the single-subject brain
template of Montreal Neurological Institute (MNI) through a
robust method for elastic registration called Deformable Registra-
tion via Attribute Matching and Mutual-Saliency weighting
(DRAMMS version 1.1.0) [37], available in http://www.rad.
upenn.edu/sbia/software/dramms/download.html. The defor-
mation field resulting from this spatial registration was then
applied to the segmented images in order to generate mass-
preserved volumetric maps, named Regional Analysis of Volumes
Examined in Normalized Space (RAVENS) maps of the GM,
WM, and cerebrospinal fluid compartments [38]. In RAVENS
maps, the tissue density reflects the amount of tissue present in
each subject’s image at a given location, after mapping to the
standardized template space. For example, a region of decreased
density indicates a reduced volume in this structure. Lastly, the
RAVENS maps were corrected for the total brain volume (given
by the sum of all voxels of brain tissue and cerebrospinal fluid
space).
The diffusion tensor images were reconstructed from the DWI
data using multivariate linear fitting [39]. Spatial normalization of
all the tensor images was then carried out via an elastic registration
method known as FNIRT [40], against a standard DTI template
known as the EVE [41]. For the brain DTI registration we used
the FMRIB’s nonlinear image registration tool, which is part of the
FMRIB Software Library (FSL 4.1.5) [40], available in http://fsl.
fmrib.ox.ac.uk/fsl/fslwiki/FslInstallation. Following the spatial
normalization, Fractional Anisotropy (FA) and Trace (TR) images
were derived for each subject. While FA provides a measure of
diffusion directional anisotropy, TR affords indices of diffusivity,
similarly to other commonly employed DTI measures such as
mean diffusivity (MD) [42]. TR measures mean diffusivity by
adding the Eigen values of the tensor. Thus, it provides a
rotationally invariant index of the overall amount of diffusivity
within each image voxel [42]. Whereas the TR index provides an
estimate of the displacement of water molecules in a medium,
measure of FA reflect the degree of water diffusion directionality
Multimodal MR Study of Treatment-Naıve ADHD Adults
PLOS ONE | www.plosone.org 3 October 2014 | Volume 9 | Issue 10 | e110199

and, thus, are sensitive to the degree of myelination, density and
organization of WM tracts, all of which may reflect maturational
processes [22,42,43]. One final point to consider is that although
the FA and TR indices are thought to reflect micro-structural brain
abnormalities, the relatively large voxel size of the DTI acquisition
(2.0*2.0*2.7 mm) implies that FA differences between groups may
not always indicate a micro-structural change.
Statistical analyses were performed voxel-by-voxel using the
Optimally-Discriminative Voxel-Based Analysis (ODVBA 2.0)
Software Package [22], in-house program in SBIA, UPenn, on
four different measures: 1) RAVENS maps of GM; 2) RAVENS
maps of WM; 3) FA; and 4) TR. ODVBA is a new optimally-
discriminative framework for determining the adaptive smoothing
kernel and examining group differences. The main premise of
ODVBA is that it using a machine learning paradigm to effectively
apply a form of matched filtering, to optimally detect a group
difference. The framework of ODVBA mainly contains three
phases: regional nonnegative discriminative projection, determin-
ing each voxel’s statistic, and permutation tests. At first, regional
discriminative analysis, restricted by appropriate nonnegativity
constraints, is applied to a spatial neighborhood around each
voxel, aiming to find the coefficients that best highlight the
difference between two groups in that neighborhood. Secondly,
since each voxel belongs to a large number of such neighborhoods,
each centered on one of its neighboring voxels, the group
difference at each voxel is determined by a composition of
contributions from all neighborhoods to which it participates.
Finally, the statistical significances (p values) are obtained by using
permutation tests [44]. In this paper, the number of permutations
is 2,000.
For the detection of differences in morphometry, anisotropy and
diffusivity measures between adult ADHD and HC, we used a
strict statistical threshold of p,0.05 with false-discovering rate
(FDR) correction for multiple comparisons. Findings that were
significant only at an uncorrected threshold of p,0.001 are
reported as trends. The significance maps are partitioned and
analyzed according to 1) the automated anatomical labeling (AAL)
atlas [45] for GM analysis, and 2) the JHU-MNI-ss atlas (or EVE
atlas) [46], for WM, FA, and TR analysis. On each anatomical
region, we calculated the cluster size and the t statistic (based on
the means of the detected area per region).
In addition to the above described between-group comparisons,
we conducted a voxel-based search for significant linear correla-
tions between the severity of symptoms as assessed by the ASRS-
18 within the ADHD group and each of the four maps (GM, WM,
FA and TR), in a regression analysis using the general linear
model (GLM) [47].
Results
Demographic and Clinical DataTable 1 summarizes the clinical and demographic characteris-
tics of ADHD patients and HC. All ADHD patients had a history
of clinically relevant symptoms starting before the age of 7 years,
as assessed with the K-SADS-PL.
As mentioned above, both groups were matched for age and
gender, and all participants had no current of past history of
substance use disorders. ADHD patients and HC did not differ
with regard to years of education and handedness.
From the 22 patients with ADHD, 10 had the combined
subtype whereas 12 presented the inattentive subtype of the
disorder. Also, 7 out of the 22 ADHD patients fulfilled criteria for
comorbid axis I disorders: 4 for bipolar disorder, 2 for major
depressive disorder and 1 for anxiety disorder NOS.
Multimodal Image AnalysisSignificant group differences (at the corrected p,0.05 level)
and/or trends (p,0.001 uncorrected) were detected in four
comparisons between ADHD patients and HC: 1) GM of ADHD
, GM of HC; 2) GM of ADHD . GM of HC; 3) FA of ADHD .
FA of HC; 4) TR of ADHD , TR of HC. These differences are
detailed in the sub-items below.
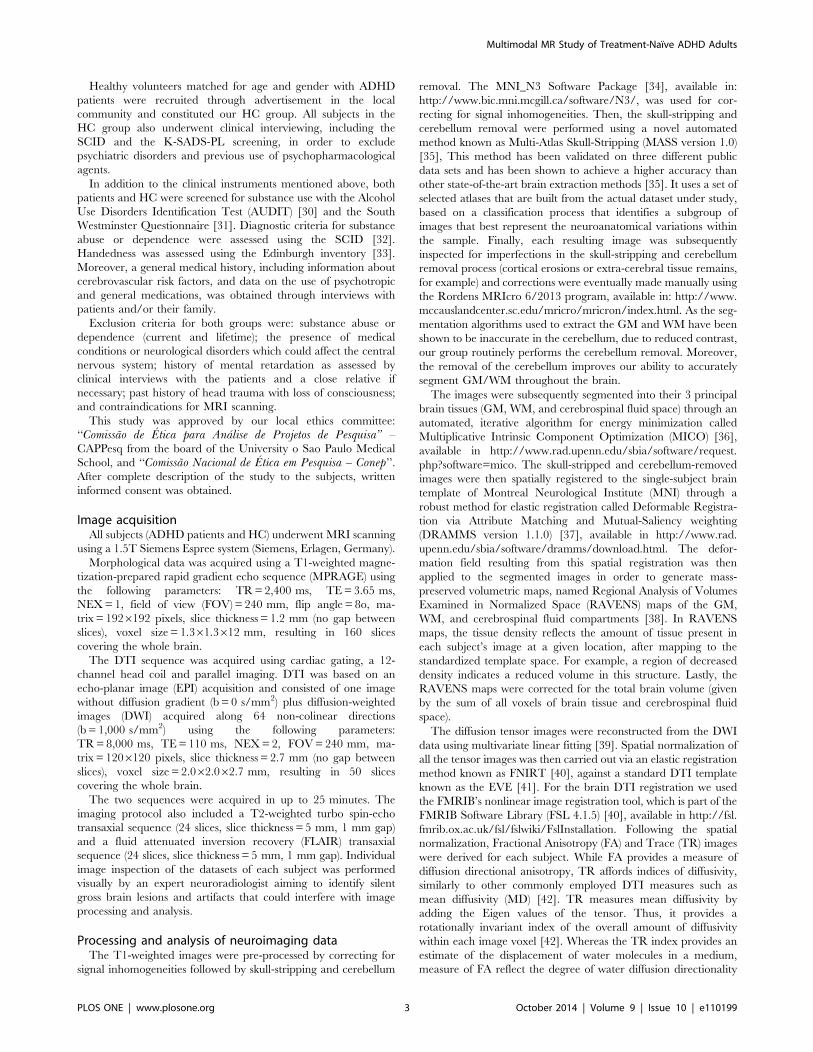
GM of ADHD , GM of HCThere were foci of lower GM values in ADHD patients
compared to HC, but these were significant only at the trend level
of p,0.001, uncorrected for multiple comparisons. These foci
were located mainly in the parietal cortex (right angular gyrus), as
presented in Table 2. Figure 1 shows the representative slices in
the sagittal view.
GM of ADHD . GM of HCThere were also foci of higher GM values in ADHD patients
compared to HC that achieved trend levels of statistical
significance (p,0.001, uncorrected). These foci of increased GM
values in the ADHD group were detected mainly in the right
supplementary motor area right superior frontal gyrus. (Table 2,
Figure 1).
FA of ADHD . FA of HCSeveral areas of significantly increased FA values in the ADHD
sample compared with HC were detected at the strict threshold of
p,0.05 (corrected for multiple comparisons), in WM underlying
the bilateral superior frontal gyrus, right middle frontal gyrus,
bilateral cingulate gyrus, bilateral middle temporal gyrus and left
postcentral gyrus (Table 3, Figure 2). There were additional foci of
increased FA values in ADHD patients that were significant at the
trend level of p,0.001 (uncorrected), located in WM regions
underlying the right superior temporal gyrus and right precentral
gyrus, as well as the left posterior thalamic radiation, left inferior
longitudinal/left inferior fronto-occipital fasciculi (sagital stratum),
left body of the corpus callosum, and left superior corona radiata
(Table 3).
TR of ADHD , TR of HCSeveral areas of significantly lower TR values in ADHD subjects
compared with HC were seen at the corrected p,0.05 level. These
were detected in WM regions underlying the right superior frontal
gyrus, bilateral middle frontal gyrus, right precentral gyrus, left
middle occipital gyrus and bilateral cingulate gyrus, as well as the
bilateral body and right splenium of the corpus callosum, right
superior corona radiata, right superior longitudinal fasciculus,
right superior fronto-occipital fasciculus, and right caudate nucleus
(Table 4, Figure 3). There were additional foci of lower TR values
in ADHD patients that were significant at the trend level of p,
0.001 (uncorrected), located in WM regions underlying the right
angular gyrus as well as the bilateral thalamus and left genu of the
corpus callosum (Table 4).
Other group comparisonsThere were no statistically significant differences (or trends)
between groups when we compared: 1) WM of ADHD , WM of
HC; 2) WM of ADHD . WM of HC; 3) FA of ADHD , FA of
HC; and 4) TR of ADHD . TR of HC.
Multimodal MR Study of Treatment-Naıve ADHD Adults
PLOS ONE | www.plosone.org 4 October 2014 | Volume 9 | Issue 10 | e110199

Comparisons between ADHD patients with nocomorbidities (n = 15) versus HC (n = 19)
None of the findings reported in the above comparisons
retained statistical significance after correction for multiple
comparisons (p,0.05). However, the following results remained
as trends (p,0.001, uncorrected) (see Tables 2, 3 and 4): 1) GM of
ADHD . GM of HC: right supplementary motor area; 2) FA of
ADHD . FA of HC: WM underlying the right superior frontal
gyrus, right cingulate gyrus, and left postcentral gyrus; and 3) TR
of ADHD , TR of HC: right splenium of the corpus callosum and
WM underlying the right cingulate gyrus.
Correlations between ADHD symptom severity and brainimaging measures
The investigation of correlations between ASRS-18 scores
within the ADHD group and brain imaging measures revealed no
significant results at p,0.05 (corrected for multiple comparisons).
Discussion
This MRI study investigated brain morphometric and DTI
differences between adults with ADHD and age- and gender-
matched healthy subjects. In contrast with the vast majority of
imaging studies of adult ADHD patients conducted to date, we
were able to investigate a group of adult ADHD subjects who had
never been exposed to treatment. Samples of treatment-naıve
adults with ADHD provide information of critical relevance on
brain abnormalities which are genuine to the disease and cannot
be attributed to medication effects [26,62–64]. In addition, we
employed ODVBA, a newly-validated image analysis methodol-
ogy aimed at increasing: sensitivity to detect group differences; and
accuracy in the localization of brain regions of significant
volumetric and WM integrity changes [22]. By evaluating
concurrently brain morphology and WM connectivity in the same
sample of adult, treatment-naıve ADHD patients, we were able to
detect macro- and micro-structural changes in a whole-brain
fashion, thus potentially affording a more thorough understanding
of the network of anatomical abnormalities underlying the clinical
manifestations of ADHD [5,48].
GM Volume AbnormalitiesThe present results suggest that adult ADHD is associated with
subtle GM volume abnormalities affecting fronto-parietal net-
works, since there was a statistical trend towards GM reductions in
the right angular gyri in our ADHD sample compared to controls,
as well as GM volume increases in the right superior frontal gyrus,
and right supplementary motor area. These cortical areas are
interconnected and participate critically in a number of cognitive
processes of relevance to ADHD such as attention, executive
functioning and visuomotor coordination [49,50]. Dysfunction in
this circuitry has been linked to behavioral symptoms that are
prominent in ADHD, such as altered response inhibition and
difficulties with waiting situations [51].
Regions of GM reduction affecting the parietal cortex in adults
with ADHD were also found by Makris et al. (2007), who observed
a decrease in thickness in the inferior parietal lobule of the right
hemisphere [52]. Also, a recent study evaluating a cohort of adults
with childhood-onset ADHD found reduced cortical thickness in
similar parietal areas, known as the dorsal attentional network [8].
The angular gyrus lies in the caudal inferior portion of the parietal
lobe and brings to the prefrontal cortex visual and linguistic
information [53]. Likewise, the prefrontal cortex via bidirectional
connections sends to the posterior parietal region information for
the adjustment of the focus of attention in different parts of the
space [5]. The angular gyrus, frequently associated with semantic
aspects of language processing [53], has also been implicated in
impulsive personality traits [54].
ADHD in children is known to be linked to a retarded cortical
maturation relative to normal development [55–57]. In children
with ADHD, both a delay in attaining peak cortical thickness
throughout most of the brain [56] and a slower rate of cortical
thinning affecting mainly prefrontal regions, including the
premotor area [57], have been observed relative to normal
controls. Thus, the trend towards increased GM in frontal regions
observed in the adults with ADHD here might be a residue of to
abnormal neurodevelopmental processes that occur since child-
hood [58].
Despite the improved sensitivity of the ODBVA methodology
employed herein [24], we found modest GM deficits in adult
ADHD subjects relative to controls. The subtlety of our findings of
volumetric changes are consistent with the results of previous
morphometric MRI studies evaluating GM differences between
treatment naıve adult ADHD and HC samples of comparable size
to ours, which have reported circumscribed GM deficits in ADHD
samples when using strict statistical thresholds with correction for
multiple comparisons [59,60,61]. It should also be noted that the
vast majority of previous imaging studies in ADHD have been
conducted with medicated patients. The use of stimulant
medication may be associated with changes in regional brain
volumes and/or cortical thickness affecting the anterior cingulate
cortex, dorsolateral frontal cortex, parieto-occipital region and
striatum [26,62–64].
Table 1. Demographic and clinical characteristics of subjects with ADHD and HC.
Variables ADHD (n=22) HC (n=19) Statistical test
Mean age, years (SD) 28.8 (4.9) 28.7 (5.4) -
Gender, no. of males (%) 14 (63.6%) 12 (63.1%) -
Years of Education (mean; SD) 13.8 (2.5) 12.3 (3.8) F = 0.98, P= 0.33, df = 39
Handedness, number of right-handed (%) 20 (90.9%) 18 (94.7%) x2 = 0.220, df = 1, p = 0.639
Mean ASRS-18 Score (SD)
Part A: Inattentive Symptoms 30.8 (2.8) - -
Part B: Hyperactive/Impulsive Symptoms 25.9 (5.5) - -
ADHD: Attention-Deficit/Hyperactivity Disorder; HC: Healthy Controls; SD: Standard Deviation; ASRS-18: Adult ADHD Self-Report Scale.doi:10.1371/journal.pone.0110199.t001
Multimodal MR Study of Treatment-Naıve ADHD Adults
PLOS ONE | www.plosone.org 5 October 2014 | Volume 9 | Issue 10 | e110199
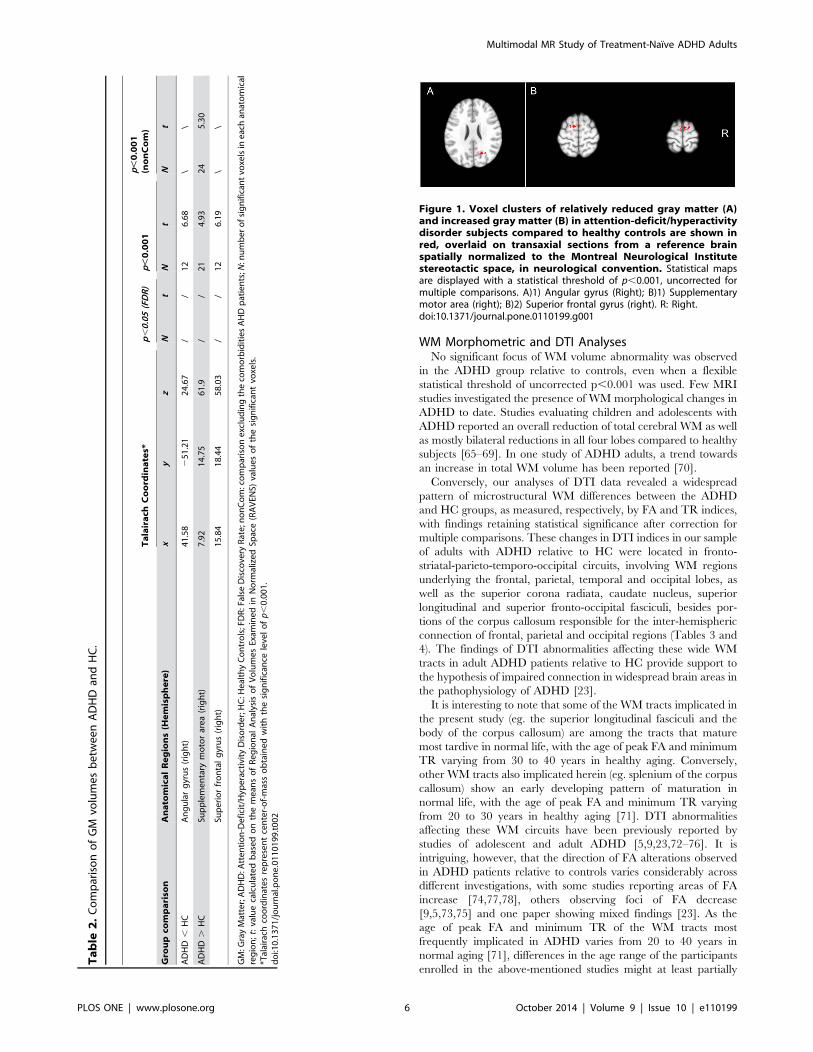
WM Morphometric and DTI AnalysesNo significant focus of WM volume abnormality was observed
in the ADHD group relative to controls, even when a flexible
statistical threshold of uncorrected p,0.001 was used. Few MRI
studies investigated the presence of WM morphological changes in
ADHD to date. Studies evaluating children and adolescents with
ADHD reported an overall reduction of total cerebral WM as well
as mostly bilateral reductions in all four lobes compared to healthy
subjects [65–69]. In one study of ADHD adults, a trend towards
an increase in total WM volume has been reported [70].
Conversely, our analyses of DTI data revealed a widespread
pattern of microstructural WM differences between the ADHD
and HC groups, as measured, respectively, by FA and TR indices,
with findings retaining statistical significance after correction for
multiple comparisons. These changes in DTI indices in our sample
of adults with ADHD relative to HC were located in fronto-
striatal-parieto-temporo-occipital circuits, involving WM regions
underlying the frontal, parietal, temporal and occipital lobes, as
well as the superior corona radiata, caudate nucleus, superior
longitudinal and superior fronto-occipital fasciculi, besides por-
tions of the corpus callosum responsible for the inter-hemispheric
connection of frontal, parietal and occipital regions (Tables 3 and
4). The findings of DTI abnormalities affecting these wide WM
tracts in adult ADHD patients relative to HC provide support to
the hypothesis of impaired connection in widespread brain areas in
the pathophysiology of ADHD [23].
It is interesting to note that some of the WM tracts implicated in
the present study (eg. the superior longitudinal fasciculi and the
body of the corpus callosum) are among the tracts that mature
most tardive in normal life, with the age of peak FA and minimum
TR varying from 30 to 40 years in healthy aging. Conversely,
other WM tracts also implicated herein (eg. splenium of the corpus
callosum) show an early developing pattern of maturation in
normal life, with the age of peak FA and minimum TR varying
from 20 to 30 years in healthy aging [71]. DTI abnormalities
affecting these WM circuits have been previously reported by
studies of adolescent and adult ADHD [5,9,23,72–76]. It is
intriguing, however, that the direction of FA alterations observed
in ADHD patients relative to controls varies considerably across
different investigations, with some studies reporting areas of FA
increase [74,77,78], others observing foci of FA decrease
[9,5,73,75] and one paper showing mixed findings [23]. As the
age of peak FA and minimum TR of the WM tracts most
frequently implicated in ADHD varies from 20 to 40 years in
normal aging [71], differences in the age range of the participants
enrolled in the above-mentioned studies might at least partially
Table
2.
Co
mp
aris
on
of
GM
volu
me
sb
etw
ee
nA
DH
Dan
dH
C.
Talairach
Coord
inates*
p,0.05(FDR)
p,0.001
p,0.001
(nonCom)
Gro
upco
mpariso
nAnato
micalRegions(H
emisphere)
xy
zN
tN
tN
t
AD
HD
,H
CA
ng
ula
rg
yru
s(r
igh
t)4
1.5
82
51
.21
24
.67
//
12
6.6
8\
\
AD
HD
.H
CSu
pp
lem
en
tary
mo
tor
are
a(r
igh
t)7
.92
14
.75
61
.9/
/2
14
.93
24
5.3
0
Sup
eri
or
fro
nta
lg
yru
s(r
igh
t)1
5.8
41
8.4
45
8.0
3/
/1
26
.19
\\
GM
:Gra
yM
atte
r;A
DH
D:A
tte
nti
on
-De
fici
t/H
ype
ract
ivit
yD
iso
rde
r;H
C:H
eal
thy
Co
ntr
ols
;FD
R:F
alse
Dis
cove
ryR
ate
;no
nC
om
:co
mp
aris
on
exc
lud
ing
the
com
orb
idit
ies
AH
Dp
atie
nts
;N:n
um
be
ro
fsi
gn
ific
ant
voxe
lsin
eac
han
ato
mic
alre
gio
n;t:
valu
eca
lcu
late
db
ase
do
nth
em
ean
so
fR
eg
ion
alA
nal
ysis
of
Vo
lum
es
Exam
ine
din
No
rmal
ize
dSp
ace
(RA
VEN
S)va
lue
so
fth
esi
gn
ific
ant
voxe
ls.
*Tal
aira
chco
ord
inat
es
rep
rese
nt
cen
ter-
of-
mas
so
bta
ine
dw
ith
the
sig
nif
ican
cele
vel
ofp,
0.0
01
.d
oi:1
0.1
37
1/j
ou
rnal
.po
ne
.01
10
19
9.t
00
2
Figure 1. Voxel clusters of relatively reduced gray matter (A)and increased gray matter (B) in attention-deficit/hyperactivitydisorder subjects compared to healthy controls are shown inred, overlaid on transaxial sections from a reference brainspatially normalized to the Montreal Neurological Institutestereotactic space, in neurological convention. Statistical mapsare displayed with a statistical threshold of p,0.001, uncorrected formultiple comparisons. A)1) Angular gyrus (Right); B)1) Supplementarymotor area (right); B)2) Superior frontal gyrus (right). R: Right.doi:10.1371/journal.pone.0110199.g001
Multimodal MR Study of Treatment-Naıve ADHD Adults
PLOS ONE | www.plosone.org 6 October 2014 | Volume 9 | Issue 10 | e110199

Table
3.
Stat
isti
cso
bta
ine
dfr
om
the
anal
ysis
of
FAo
nA
DH
D.
HC
.
Talairach
Coord
inates*
p,0.05(FDR)
p,0.001
p,0.001nonCom
Anato
micalRegions(H
emisphere)
xy
zN
tN
tN
t
Sup
eri
or
fro
nta
lg
yru
s(r
igh
t)1
1.8
85
9.0
41
5.4
64
06
.93
85
9.3
24
73
16
.49
Sup
eri
or
fro
nta
lg
yru
s(l
eft
)2
7.9
25
8.4
94
.44
28
5.9
76
58
.16
77
Cin
gu
late
gyr
us
(rig
ht)
11
.88
24
8.3
54
2.9
52
26
.38
50
7.1
73
12
86
.04
Cin
gu
late
gyr
us
(le
ft)
23
.96
21
9.3
83
9.6
52
15
.61
35
6.3
22
2\
\
Mid
dle
tem
po
ral
gyr
us
(rig
ht)
59
.42
31
1.5
51
85
.25
33
5.0
41
8\
\
Po
stce
ntr
alg
yru
s(l
eft
)2
33
.66
23
3.9
65
8.8
11
53
.67
31
4.6
79
81
01
4.4
9
Mid
dle
fro
nta
lg
yru
s(r
igh
t)2
7.7
25
7.8
43
0.2
61
63
.94
31
5.0
64
\\
Mid
dle
tem
po
ral
gyr
us
(le
ft)
24
1.5
82
36
.44
9.1
91
95
.44
27
5.9
27
1\
\
Sup
eri
or
coro
na
rad
iata
(le
ft)
22
1.7
82
2.0
33
6.9
4\
\4
83
.90
58
\\
Bo
dy
of
corp
us
callo
sum
(le
ft)
21
3.8
62
7.7
53
9.0
7\
\1
84
.87
08
\\
Sup
eri
or
tem
po
ral
gyr
us
(rig
ht)
47
.52
23
8.0
11
6.6
4\
\1
73
.08
03
\\
Pre
cen
tral
gyr
us
(rig
ht)
25
.74
27
.11
51
.94
\\
15
8.5
40
4\
\
Po
ste
rio
rth
alam
icra
dia
tio
n(l
eft
)2
31
.68
26
0.8
92
5.1
5\
\1
45
.88
36
\\
Infe
rio
rlo
ng
itu
din
alan
dIn
feri
or
fro
nto
-occ
ipit
alfa
scic
uli
(Sag
ital
stra
tum
)(l
eft
)2
39
.62
34
.69
5.4
2\
\1
14
.75
7\
\
FA:F
ract
ion
alA
nis
otr
op
y;A
DH
D:
Att
en
tio
n-D
efi
cit/
Hyp
era
ctiv
ity
Dis
ord
er;
HC
:He
alth
yC
on
tro
ls;
FDR
:Fa
lse
Dis
cove
ryR
ate
;n
on
Co
m:c
om
par
iso
ne
xclu
din
gth
eco
mo
rbid
itie
sA
HD
pat
ien
ts;N
:nu
mb
er
of
sig
nif
ican
tvo
xels
ine
ach
anat
om
ical
reg
ion
;t:
valu
eca
lcu
late
db
ase
do
nth
em
ean
so
ffr
acti
on
alan
iso
tro
py
(FA
)va
lue
so
fth
esi
gn
ific
ant
voxe
ls;
WM
:w
hit
em
atte
r.*T
alai
rach
coo
rdin
ate
sre
pre
sen
tce
nte
r-o
f-m
ass
ob
tain
ed
wit
hth
esi
gn
ific
ance
leve
lo
fp,
0.0
01
do
i:10
.13
71
/jo
urn
al.p
on
e.0
11
01
99
.t0
03
Multimodal MR Study of Treatment-Naıve ADHD Adults
PLOS ONE | www.plosone.org 7 October 2014 | Volume 9 | Issue 10 | e110199

account for their discrepant results. One other potential source of
heterogeneity in the literature about ADHD is the wide variation
observed in the methodology employed for the analysis of DTI
data. Also, it is conceivable that WM tracts interconnecting the
anterior cingulate cortex, dorsolateral frontal cortex, parieto-
occipital region and striatum would suffer influence from chronic
medication usage and, thus, be a major source of bias in DTI
studies of ADHD. To our knowledge, no study to date has
evaluated the impact of stimulant medication use on DTI indices.
Although findings of increased FA [17,79] and reduced
diffusivity [79] have been previously reported in ADHD samples
including adult patients, our study is the first to report increased
FA and reduced TR (with results corrected for multiple
comparisons) in adult treatment-naıve patients with ADHD. The
FA and TR findings observed in our sample of ADHD adults
might suggest that, although a delay in the maturation of WM
circuits is observed in the brain development of adolescents with
ADHD [80], higher FA and lower TR indices are achieved in
adulthood in subjects with persistent ADHD symptoms.
Higher values of FA are typically interpreted as reflecting more
highly organized fibers oriented in the same direction [81–83],
and this might be taken as indicative of healthier white matter
[16]. However, recent DTI studies of brain disorders such as
Williams syndrome, Alzheimers disease and bipolar disorder have
suggested that higher FA values may be actually indicative of WM
pathology [84–88]. Findings of increased FA in such previous
MRI studies have been speculated to indicate less neuronal
branching and/or abnormally increased density of WM fibers
oriented in the same direction [84–88]. In brain areas with
significant crossing and branching of neuronal fibers, FA values
might be relatively lower due to diffusion in multiple directions. In
contrast, areas with less fiber crossing/branching could reduce the
magnitude of diffusion in secondary and tertiary directions,
leading to relatively greater FA values [89]. According to such
reasoning, one possible explanation for our findings is that our
pattern of higher FA in adult, treatment-naıve ADHD patients
could be due to an aberrant reduction in fiber branching in brain
regions where that pattern should be present [74,78], or to an
abnormally increased density of fibers in the same orientation.
In regard to the decrement in TR, this measure reflects the rate
of water diffusion through the WM, which was reduced in our
adult ADHD patients. Besides the hypothesis of abnormally
increased fiber density raised above, findings of decreased TR in
brain diseases have been previously suggested to reflect processes
of atypical myelination [90,91]. While a reduction in fiber
branching would result in higher TR, increased density of fibers
and an atypical higher degree of myelination would decrease TR
indices. Overall, we thus suggest that the combination of increased
FA and decreased TR in fronto-striatal-parietal- temporo-occipital
circuits of treatment-naıve adults with ADHD, as shown by our
DTI analyses, may indicate that an abnormal increased density of
WM fibers oriented in the same direction, less neuronal
branching, and/or a higher degree of abnormal myelination in
these WM tracts, contribute to the continuing clinical manifesta-
tions of ADHD into adulthood. Neuropathological studies
investigating WM histopathological changes in the brains of adult
ADHD patients would be important to confirm such potential
explanations. However, postmortem investigations of such kind
have not been carried out to date. Finally, it should be noted that
the size of the clusters of increased FA and reduced TR in our
study were relatively small, and there are previous studies in
modestly-sized samples of ADHD patients that reported findings
in the opposite direction (reduced FA and increased diffusivity)
[5,9,18,25,26,72,73]. Therefore, caution must be exercized in the
interpretation of our DTI results and replication of these findings
in larger samples is clearly warranted.
Figure 2. Voxel clusters of relatively increased fractional anisotropy in attention-deficit/hyperactivity disorder subjects comparedto healthy controls are shown in red, overlaid on transaxial sections from a reference brain spatially normalized to the MontrealNeurological Institute stereotactic space, in neurological convention. Statistical maps are displayed with a statistical threshold of p,0.05,corrected for multiple comparisons (false-discovery rate). 1) Middle temporal gyrus white matter (WM) (right); 2) Middle temporal gyrus WM (left); 3)Superior frontal gyrus WM (right); 4) Middle frontal gyrus (right); 5) Cingulate gyrus (right); 6) Superior frontal gyrus (left); 7) Cingulate gyrus (left); 8)Postcentral gyrus (left). R: right.doi:10.1371/journal.pone.0110199.g002
Multimodal MR Study of Treatment-Naıve ADHD Adults
PLOS ONE | www.plosone.org 8 October 2014 | Volume 9 | Issue 10 | e110199

Table
4.
Stat
isti
cso
bta
ine
dfr
om
the
anal
ysis
of
TR
on
AD
HD,
HC
.
Talairach
Coord
inates*
p,0.05(FDR)
p,0.001
p,0.001nonCom
Anato
micalRegions(H
emisphere)
x*y*
z*N
tN
tN
t
Sup
eri
or
fro
nta
lg
yru
sW
M(r
igh
t)2
5.7
43
3.1
14
0.7
12
54
.71
17
62
5.1
36
1\
\
Mid
dle
fro
nta
lg
yru
sW
M(r
igh
t)2
7.7
22
7.2
13
9.1
61
65
.19
47
55
6.1
77
\\
Pre
cen
tral
gyr
us
WM
(rig
ht)
37
.62
3.9
73
7.0
42
65
.28
73
55
6.0
63
3\
\
Sple
niu
mo
fco
rpu
sca
llosu
mW
M(r
igh
t)9
.93
3.4
92
9.3
12
94
.68
34
54
4.9
27
92
35
.17
69
Cin
gu
late
gyr
us
WM
(rig
ht)
3.9
61
3.6
63
7.5
22
74
.23
16
53
4.4
11
71
13
.71
64
Cau
dat
eN
ucl
eu
s(r
igh
t)1
7.8
27
.12
5.4
32
73
.05
45
44
2.9
97
2\
\
Bo
dy
of
corp
us
callo
sum
(rig
ht)
3.9
69
.87
35
.49
21
5.5
16
94
24
.97
58
\\
Cin
gu
late
gyr
us
WM
(le
ft)
7.9
28
.11
45
.65
23
5.4
83
95
.52
51
\\
Mid
dle
fro
nta
lg
yru
sW
M(l
eft
)2
7.7
25
5.2
61
7.4
92
07
.57
13
98
.86
48
\\
Sup
eri
or
lon
git
ud
inal
fasc
icu
lus
(rig
ht)
35
.64
9.7
83
7.3
32
66
.31
92
35
7.0
11
8\
\
Bo
dy
of
corp
us
callo
sum
(le
ft)
5.9
45
.62
34
.72
12
5.3
90
73
25
.25
89
\\
Sup
eri
or
coro
na
rad
iata
(rig
ht)
23
.76
9.2
22
9.0
11
77
.15
91
28
6.1
38
6\
\
Mid
dle
occ
ipit
alg
yru
sW
M(l
eft
)1
7.8
21
04
.53
7.0
71
53
.74
11
24
3.7
59
8\
\
Sup
eri
or
fro
nto
-occ
ipit
alfa
scic
ulu
s(r
igh
t)1
9.8
3.4
29
.31
15
3.7
71
16
3.7
66
8\
\
Th
alam
us
(rig
ht)
3.9
69
.13
11
.51
\\
18
4.2
02
5\
\
An
gu
lar
gyr
us
WM
(rig
ht)
45
.54
65
.74
5.6
6\
\1
66
.26
77
\\
Th
alam
us
(le
ft)
1.9
81
4.8
51
3.6
3\
\1
53
.01
99
\\
Ge
nu
of
corp
us
callo
sum
(le
ft)
5.9
42
6.1
17
.11
\\
14
5.1
06
1\
\
TR
:Tra
ce;A
DH
D:A
tte
nti
on
-De
fici
t/H
ype
ract
ivit
yD
iso
rde
r;H
C:H
eal
thy
Co
ntr
ol;
FDR
:Fal
seD
isco
very
Rat
e;n
on
Co
m:c
om
par
iso
ne
xclu
din
gth
eco
mo
rbid
itie
sA
HD
pat
ien
ts;N
:nu
mb
er
of
sig
nif
ican
tvo
xels
ine
ach
anat
om
ical
reg
ion
;t:
valu
eca
lcu
late
db
ase
do
nth
em
ean
so
ftr
ace
(TR
)va
lue
so
fth
esi
gn
ific
ant
voxe
ls;
WM
:w
hit
em
atte
r.*T
alai
rach
coo
rdin
ate
sre
pre
sen
tce
nte
r-o
f-m
ass
ob
tain
ed
wit
hth
esi
gn
ific
ance
leve
lo
fp,
0.0
01
.d
oi:1
0.1
37
1/j
ou
rnal
.po
ne
.01
10
19
9.t
00
4
Multimodal MR Study of Treatment-Naıve ADHD Adults
PLOS ONE | www.plosone.org 9 October 2014 | Volume 9 | Issue 10 | e110199

Integration of findings of gray matter and white matterabnormalities in ADHD patients
Part of the WM tracts in which we found the greater degree of
FA and/or TR differences between ADHD patients and HC are
known to interconnect the brain regions where we also detected
trend GM volume changes in the ADHD group, namely the
fronto-striatal-parieto-temporo-occipital networks. Therefore, tak-
ing together the different GM and WM measurements evaluated
in the present study, the findings obtained suggest that the
persistence of ADHD symptoms into adulthood relates to:
circumscribed GM volume abnormalities, subtler than those
detected in children and adolescent with ADHD and which are
thought to reflect delayed maturation processes [56,57]; and
widespread microstructural alterations in the WM tracts connect-
ing these and other GM regions.
We used exactly the same image processing pipelines and
statistical inference approach to the analysis of both morphometric
and DTI data obtained from the same individuals in a single MRI
scanning session. This allowed us to demonstrate that microstruc-
tural WM differences from HC are more widespread and
significant than macroscopic GM or WM volumetric changes in
never-medicated adult ADHD patients. To the best of our
knowledge, such prominence of WM microstructural changes in
treatment-naıve ADHD adults has not been reported previously in
studies combining DTI and brain volumetric measurements. This
pattern of results is consistent with the notion that ADHD-related
impairments in cortico-subcortical circuits may originate from
alterations in microstructural connectivity [76]. If replicated in
subsequent studies, our findings could indicate that microstruc-
tural WM abnormalities represent a key neuroanatomical feature
underlying the persistence of ADHD symptoms into adulthood.
We did not find any significant results in our correlation analysis
between brain imaging measures and the severity of ADHD
symptoms. This may relate to an increased risk of type II statistical
errors, due to the relatively small size of the ADHD sample. Also,
the inclusion of ADHD patients with comorbidities may have
increased the clinical heterogeneity of our ADHD sample.
However, comorbid psychiatric disorders are very frequent in
ADHD [92]; a pure never-medicated ADHD group is very
difficult to recruit and would not have been representative of the
overall adult ADHD population that usually demands clinical
management [93]. We attempted to investigate GM and WM
abnormalities in the subgroup with ‘‘pure’’ ADHD features
compared to HC, but the results were considerably less significant
in comparison to the findings of the analyses for the overall ADHD
sample. This may have occurred due to loss of statistical power,
given the significant proportion of individuals presenting with
comorbid psychiatric conditions in the present study (n = 7).
However, one alternative explanation of potential clinical
relevance is that the presence of comorbidities is related to an
accentuation of the brain abnormalities in never-medicated adult
ADHD subjects; this would be consistent with the notion that the
presence of comorbid diagnoses is associated with greater ADHD
severity [94–96]. MRI studies with larger ADHD samples
including both subjects with ‘‘pure’’ ADHD and ADHD with
comorbidities are needed in order to extend the preliminary
findings reported herein.
Finally, two additional methodological limitations should be
acknowledged. First, regarding to the protocol used for the
acquisition of DTI data, we acquired only one reference ‘‘B0’’
(non-diffusion) image. Although this is a standard strategy
[17,18,72,73,77,86], it has been recently advised that 1/8th to
1/10th of images during DTI acquisitions should be B0 scans, as
this provides greater accuracy in the estimation of tensors and FA
values [97–99]. Also, we chose to report only TR values rather
than adding traditionally used diffusivity indices such as radial
diffusivity (RD) and axial diffusivity (AD). Although all diffusion
Figure 3. Voxel clusters of relatively decreased Trace in attention-deficit/hyperactivity disorder subjects compared to healthycontrols (HC) are shown in red, overlaid on transaxial sections from a reference brain spatially normalized to the MontrealNeurological Institute stereotactic space, in neurological convention. Statistical maps are displayed with a statistical threshold of p,0.05,corrected for multiple comparisons (false-discovery rate). 1) Middle occipital gyrus white matter (WM) (left); 2) Caudate nucleus (right); 3) Splenium ofcorpus callosum (right); 4) Superior fronto-occipital fasciculus (right); 5) Body of the corpus callosum WM (left); 6) Superior corona radiata (right); 7)Superior longitudinal fasciculus (right); 8) Body of the corpus callosum (right); 9) Cingulate gyrus WM (right); 10) Precentral gyrus WM (right); 11)Middle frontal gyrus WM (left); 12) Superior frontal gyrus WM (right); 13) Middle frontal gyrus WM (right); 14) Cingulate gyrus WM (left). R: right.doi:10.1371/journal.pone.0110199.g003
Multimodal MR Study of Treatment-Naıve ADHD Adults
PLOS ONE | www.plosone.org 10 October 2014 | Volume 9 | Issue 10 | e110199

parameters are overall sensitive to tissue properties such as
myelination, axonal orientation and axonal density, no DTI
measure can be taken as more specific to a given property [13,43].
Recent studies using synthetic models of crossing fibers have
shown that pathological changes to the WM microstructure may
result in unpredictable changes to AD and RD measurements,
unrelated to the underlying original tissue organization, thus
suggesting that such diffusivity indices may not always be reliable
[100].
In conclusion, the use of the newly-validated ODVBA image
analysis methodology in the present multimodal MRI study
revealed the presence of widespread microstructural WM changes
in tracts connecting distributed cortical regions in treatment-naıve
ADHD adults, as well as subtle regional brain volume abnormal-
ities confined to the GM compartment. Further application of
such study design in larger samples is warranted to confirm these
preliminary findings and to further investigate how they relate to
specific ADHD symptom dimensions, associated neuropsycholog-
ical deficits, treatment response patterns and other aspects of
clinical outcome.
Acknowledgments
The present investigation was supported by a 2010 NARSAD Independent
Investigator Award (NARSAD: The Brain and Behavior Research Fund)
awarded to Geraldo F. Busatto. Geraldo F. Busatto is also partially funded
by CNPq-Brazil. Marcus V. Zanetti is funded by FAPESP, Brazil (no.
2013/03905-4).
Author Contributions
Conceived and designed the experiments: TMC TZ MVZ MAS JD CD
GFB. Performed the experiments: TMC MVZ MAS MHS. Analyzed the
data: TMC TZ MVZ MAS JD MHS FLSD SCC CD GFB. Contributed
reagents/materials/analysis tools: TMC TZ MVZ MAS JD MHS FLSD
SCC CD GFB. Wrote the paper: TMC TZ MVZ MAS MRL JD MHS
FLSD SCC CD GFB.
References
1. Polanczyk G, Rohde LA (2007) Epidemiology of attention-deficit/hyperactivity
disorder across the lifespan. Curr Opin Psychiatry 20: 386–92.
2. Simon V, Czobor P, Balint S, Meszaros A, Bitter I (2009) Prevalence and
correlates of adult attention-deficit hyperactivity disorder: meta-analysis.
Br J Psychiatry 194: 204–11.
3. Polanczyk G, Laranjeira R, Zaleski M, Pinsky I, Caetano R, et al. (2010) ADHD
in a representative sample of the Brazilian population: estimated prevalence and
comparative adequacy of criteria between adolescents and adults according to
the item response theory. Int J Methods Psychiatr Res 19: 177–84.
4. de Zwaan M, Gruss B, Muller A, Graap H, Martin A, et al. (2012) The
estimated prevalence and correlates of adult ADHD in a German community
sample. Eur Arch Psychiatry Clin Neurosci 262: 79–86.
5. Makris N, Buka SL, Biederman J, Papadimitriou GM, Hodge SM, et al. (2008)
Attention and executive systems abnormalities in adults with childhood ADHD:
A DT-MRI study of connections. Cereb Cortex 18: 1210–20.
6. Almeida Montes LG, Ricardo-Garcell J, Barajas De La Torre LB, Prado
Alcantara H, Martınez Garcıa RB, et al. (2010) Clinical correlations of gray
matter reductions in the caudate nucleus of adults with attention deficit
hyperactivity disorder. J Psychiatry Neurosci 35: 238–46.
7. Seidman LJ, Biederman J, Liang L, Valera EM, Monuteaux MC, et al. (2011)
Gray matter alterations in adults with attention-deficit/hyperactivity disorder
identified by voxel based morphometry. Biol Psychiatry 69: 857–66.
8. Proal E, Reiss PT, Klein RG, Mannuzza S, Gotimer K, et al. (2011) Brain gray
matter deficits at 33-year follow-up in adults with attention-deficit/hyperactivity
disorder established in childhood. Arch Gen Psychiatry 68: 1122–34.
9. Cortese S, Imperati D, Zhou J, Proal E, Klein RG, et al. (2013) White Matter
Alterations at 33-Year Follow-Up in Adults with Childhood Attention-Deficit/
Hyperactivity Disorder. Biol Psychiatry 74: 591–8.
10. Casey BJ, Epstein JN, Buhle J, Liston C, Davidson MC, et al. (2007)
Frontostriatal connectivity and its role in cognitive control in parent-child dyads
with ADHD. Am J Psychiatry 164: 1729–36.
11. Amico F, Stauber J, Koutsouleris N, Frodl T (2011) Anterior cingulate cortex
gray matter abnormalities in adults with attention deficit hyperactivity disorder:
a voxel-based morphometry study. Psychiatry Res 191: 31–5.
12. Ahrendts J, Rusch N, Wilke M, Philipsen A, Eickhoff SB, et al. (2011) Visual
cortex abnormalities in adults with ADHD: a structural MRI study.
World J Biol Psychiatry 12: 260–70.
13. Alexander AL, Lee JE, Lazar M, Field AS (2007) Diffusion tensor imaging of the
brain. Neurotherapeutics 4: 316–29.
14. Assaf Y1, Pasternak O (2008) Diffusion tensor imaging (DTI)-based white matter
mapping in brain research: a review. J Mol Neurosci 34: 51–61.
15. Tievsky AL, Ptak T, Farkas J (1999) Investigation of apparent diffusion
coefficient and diffusion tensor anisotropy in acute and chronic multiple sclerosis
lesions. AJNR Am J Neuroradiol 20: 1491–1499.
16. Beaulieu (2002) The basis of anisotropic water diffusion in the nervous system - a
technical review. NMR Biomed 15: 435–55.
17. Konrad A, Dielentheis TF, El Masri D, Bayerl M, Fehr C, et al. (2010)
Disturbed structural connectivity is related to inattention and impulsivity in adult
attention deficit hyperactivity disorder. Eur J Neurosci 31: 912–9.
18. Konrad A1, Dielentheis TF, El Masri D, Dellani PR, Stoeter P, et al. (2012)
White matter abnormalities and their impact on attentional performance in
adult attention-deficit/hyperactivity disorder. Eur Arch Psychiatry Clin
Neurosci 262: 351–60.
19. Depue BE, Burgess GC, Bidwell LC, Willcutt EG, Banich MT (2010) Behavioral
performance predicts grey matter reductions in the right inferior frontal gyrus in
young adults with combined type ADHD. Psychiatry Res 182: 231–7.
20. Frodl T, Skokauskas N (2012) Meta-analysis of structural MRI studies in
children and adults with attention deficit hyperactivity disorder indicates
treatment effects. Acta Psychiatr Scand 125: 114–26.
21. Ashburner J (2009) Computational anatomy with the SPM software. Magn
Reson Imaging 27: 1163–74.
22. Zhang T, Davatzikos C (2011) ODVBA: optimally-discriminative voxel-based
analysis. IEEE Trans Med Imaging 30: 1441–54.
23. Davatzikos C (2004) Why voxel-based morphometric analysis should be used
with great caution when characterizing group differences. Neuroimage 23: 17–
20.
24. Zhang T, Davatzikos C (2013) Optimally-Discriminative Voxel-Based Mor-
phometry significantly increases the ability to detect group differences in
schizophrenia, mild cognitive impairment, and Alzheimer’s disease. Neuroimage
79: 94–110.
25. Cao Q, Sun L, Gong G, Lv Y, Shuai L, et al. (2010) The macrostructural and
microstructural abnormalities of corpus callosum in children with attention
deficit/hyperactivity disorder: a combined morphometric and diffusion tensor
MRI study. Brain Res 1310: 172–80.
26. Dramsdahl M, Westerhausen R, Haavaik J, Hugdal K, Plessen KJ (2012) Adults
with attention-deficit/hyperactivity disorder - a diffusion-tensor imaging study of
the corpus callosum. Psychiatry Res 201: 168–73.
27. American Psychiatric Association (1994) Diagnostic and Statistical Manual ofMental Disorders, 4th ed. Washington, DC: American Psychiatric Press.
28. Kaufman J, Birmaher B, Brent DA, Rao U, Flynn C, et al. (1997) K-Schedule
for Affective Disorders and Schizophrenia for School-Age Children-Present and
Lifetime Version (K-SADS-PL): initial reliability and validity data. J Am Acad
Child Adolesc Psychiatry 36: 980–8.
29. Adler LA, Spencer T, Faraone SV, Kessler RC, Howes MJ, et al. (2006) Validity
of pilot Adult ADHD Self- Report Scale (ASRS) to Rate Adult ADHD
symptoms. Ann Clin Psychiatry 18: 145–8.
30. Saunders JB, Aasland OG, Babor TF, de la Fuente JR, Grant M (1993)
Development of the Alcohol Use Disorders Identification Test (AUDIT): WHO
Collaborative Project on Early Detection of Persons with Harmful Alcohol
Consumption – II. Addiction 88: 791–804.
31. Menezes PR, Johnson S, Thornicroft G, Marshall J, Prosser D, et al. (1996)
Drug and alcohol problems among individuals with severe mental illness in south
London. Br J Psychiatry 168: 612–9.
32. First MB, Spitzer RL, Gibbon M, Williams JBW (1995) Structured Clinical
Interview for DSM-IV Axis I Disorders, Patient Edition (SCID-I/P). New York,
NY: Biometrics Research, New York State Psychiatry Institute.
33. Oldfield RC (1971) The assessment and analysis of handedness: the Edinburgh
inventory. Neuropsychologia 9: 97–113.
34. Sled JG, Zijdenbos AP, Evans AC (1998) A nonparametric method for
automatic correction of intensity nonuniformity in MRI data. IEEE Trans Med
Imaging 17: 87–97,
35. Doshi J, Erus G, Ou Y, Gaonkar B, Davatzikos C (2013) Multi-Atlas Skull-
Stripping, MASS. Acad Radiol, in press.
36. Li C, Gatenby C, Wang L, Gore JC (2009) A robust parametric method for bias
field estimation and segmentation of MR images. Proc IEEE Comput Soc Conf
Comput Vis Pattern Recognitpp. 218–223.
37. Ou Y, Sotiras A, Paragios N, Davatzikos C (2011) DRAMMS: Deformable
registration via attribute matching and mutual-saliency weighting. Med Image
Anal 15: 622–639.
38. Davatzikos C, Genc A, Xu D, Resnick SM (2001) Voxel-Based Morphometry
Using the RAVENS Maps: Methods and Validation Using Simulated
Longitudinal Atrophy. NeuroImage 14: 1361–1369.
Multimodal MR Study of Treatment-Naıve ADHD Adults
PLOS ONE | www.plosone.org 11 October 2014 | Volume 9 | Issue 10 | e110199

39. Pierpaoli C, Basser P (1996) Toward a quantitative assessment of diffusionanisotropy. Magn ResonMed 36: 893–906.
40. Andersson J, Jenkinson M, Smith S (2007) Non-linear registration, aka spatial
normalization. FMRIB Analysis Group of the University of Oxford. FMRIBtechnical report TR07JA1. Available: http://http://www.fmrib.ox.ac.uk/
analysis/techrep/. Accessed 05 November 2013.
41. Wakana S, Jiang H, Nagae-Poetcher L, van Zijl PCM, Mori S (2004) Fiber tract-based atlas of human white matter anatomy. Radiology 230: 77–87.
42. Jones DK (2008) Studying connections in the living human brain with diffusion
MRI. Cortex 44: 936–52.
43. Jones DK, Knosche TR, Turner R (2013) White matter integrity, fiber count,
and other fallacies: the do’s and don’ts of diffusion MRI. Neuroimage 73: 239–
54.
44. Nichols TE, Holmes AP (2002) Nonparametric permutation tests for functional
neuroimaging: a primer with examples. Hum Brain Mapp 15: 1–25.
45. Tzourio-Mazoyer N, Landeau B, Papathanassiou D, Crivello F, Etard O, et al.(2002) Automated anatomical labeling of activations in GLM using a
macroscopic anatomical parcellation of the MNI MRI single-subject brain.
NeuroImage 15: 273–289.
46. Oishi K, Faria A, Jiang H, Li X, Akhter K, et al. (2009) Atlas-based whole brain
white matter analysis using large deformation diffeomorphic metric mapping:application to normal elderly and Alzheimer’s disease participants. Neuroimage
46: 486–499.
47. Friston KJ, Holmes AP, Worsley KJ, Poline JP, Frith CD, et al. (1994) Statisticalparametric maps in functional imaging: a general linear approach. Human brain
mapping 2: 189–210.
48. Konrad K, Eickhoff SB (2010) Is the ADHD brain wired differently? A reviewon structural and functional connectivity in attention deficit hyperactivity
disorder. Hum Brain Mapp 31: 904–16.
49. Rubia K, Smith A (2004) The neural correlates of cognitive time management: areview. ActaNeurobiolExp 64: 329–340.
50. Mahone EM, Croceti D, Ranta ME, Gaddis A, Catalo M, et al. (2011) A
Preliminary Neuroimaging Study of Preschool Children with ADHD. ClinNeuropsych 25: 1009–1028.
51. Krain AL, Castellanos FX (2006) Brain development and ADHD. Clin Psychol
Rev 26: 433–444.
52. Makris N, Biederman J, Valera EM, Bush G, Kaiser J, et al. (2007) Cortical
thinning of the attention and executive function networks in adults with
attention-deficit/hyperactivity disorder. Cerb Cortex 17: 1364–75.
53. Caspers S, Schleicher A, Bacha-Trams M, Palomero-Gallagher N, Amunts K, et
al. (2013) Organization of the Human Inferior Parietal Lobule Based onReceptor Architectonics. Cereb Cortex 23: 615–28.
54. Siever LJ, Buchsbaum MS, New AS, Spiegel-Cohen J, Wei T, et al. (1999) d,1-
fenfluramine response in impulsive personality disorder assessed with [18F]fluor-odeoxyglucose positron emission tomography. Neuropsychopharmacology 20:
413–23.
55. Giedd JN, Blumenthal J, Jeffries NO, Castellanos FX, Liu H, et al. (1999) Braindevelopment during childhood and adolescence: a longitudinal MRI study. Nat
Neurosci 2: 861–3.
56. Shaw P, Eckstrand K, Sharp W, Blumenthal J, Lerch JP, et al. (2007) Attention-deficit/hyperactivity disorder is characterized by a delay in cortical maturation.
Proc Natl Acad Sci USA 104: 19649–54.
57. Shaw P, Gilliam M, Liverpool M, Weddle C, Malek M, et al. (2011) Corticaldevelopment in typically developing children with symptoms of hyperactivity
and impulsivity: support for a dimensional view of attention deficit hyperactivitydisorder. Am J Psychiatry 168: 143–51.
58. Duerden EG, Tannock R, Dockstader C (2012) Altered cortical morphology in
sensorimotor processing regions in adolescents and adults with attention-deficit/hyperactivity disorder. Brain Res 1445: 82–91.
59. Makris N, Seidman LJ, Valera EM, Biederman J, Monuteaux MC, et al. (2010)
Anterior cingulate volumetric alterations in treatment-naıve adults with ADHD:a pilot study. J Atten Disord 13: 407–13.
60. Frodl T, Skokauskas N (2012) Meta-analysis of structural MRI studies in
children and adults with attention deficit hyperactivity disorder indicatestreatment effects. Acta Psychiatr Scand 125: 114–26.
61. Makris N, Liang L, Biederman J, Valera EM, Brown AB, et al. (2013) Toward
Defining the Neural Substrates of ADHD: A Controlled Structural MRI Studyin Medication-Naive Adults. J Atten Disord Available: http://jad.sagepub.com/
content/early/2013/10/25/1087054713506041. Accessed 15 June 2014.
62. Semrud-Clikeman M, Pliszka SR, Lancaster J, Liotti M (2006) Volumetric MRIdifferences in treatment-naıve vs chronically treated children with ADHD.
Neurology 67: 1023–7.
63. Shaw P, Sharp WS, Morrison M, Eckstrand K, Greenstein DK, et al. (2009)Psychostimulant treatment and the developing cortex in attention deficit
hyperactivity disorder. Am J Psychiatry 166: 58–63.
64. Hoekzema E, Carmona S, Ramos-Quiroga JA, Canals C, Moreno A, et al.
(2012) Stimulant drugs trigger transient volumetric changes in the human
ventral striatum. Brain Struct Funct 219: 23–34.
65. Filipek PA, Semrud-Clikeman M, Steingard RJ, Renshaw PF, Kennedy DN, et
al. (1997) Volumetric MRI analysis comparing subjects having attention-deficit
hyperactivity disorder with normal controls. Neurology 48: 589–601.
66. Castellanos FX, Lee PP, Sharp W, Jeffries NO, Greenstein DK, et al. (2002)
Developmental trajectories of brain volume abnormalities in children and
adolescents with attention-deficit/hyperactivity disorder. JAMA 288: 1740–8.
67. Mostofsky SH, Cooper KL, Kates WR, Denckla MB, Kaufmann WE (2002)
Smaller prefrontal and premotor volumes in boys with attention-deficit/
hyperactivity disorder. Biol Psychiatry 52: 785–94.
68. Kates WR, Frederikse M, Mostofsky SH, Folley BS, Cooper K, et al. (2002)
MRI parcellation of the frontal lobe in boys with attention deficit hyperactivity
disorder or Tourette syndrome. Psychiatry Res 116: 63–81.
69. McAlonan GM, Cheung V, Cheung C, Chua SE, Murphy DG, et al. (2007)
Mapping brain structure in attention deficit-hyperactivity disorder: a voxel-
based MRI study of regional grey and white matter volume. Psychiatry Res 154:
171–80.
70. Seidman LJ, Valera EM, Makris N, Monuteaux MC, Boriel DL, et al. (2006)
Dorsolateral prefrontal and anterior cingulate cortex volumetric abnormalities in
adults with attention-deficit/hyperactivity disorder identified by magnetic
resonance imaging. Biol Psychiatry 60: 1071–80.
71. Lebel C, Gee M, Camicioli R, Wieler M, Martin W, et al. (2012) Diffusion
tensor imaging of white matter tract evolution over the lifespan. Neuroimage 60:
340–52.
72. Hamilton LS, Levitt JG, O’Neill J, Alger JR, Luders E, et al. (2008) Reduced
white matter integrity in attention-deficit hyperactivity disorder. Neuroreport 19:
1705–8.
73. Pavuluri MN, Yang S, Kamineni K, Passarotti AM, Srinivasan G, et al. (2009)
Diffusion tensor imaging study of white matter fiber tracts in pediatric bipolar
disorder and attention-deficit/hyperactivity disorder. Biol Psychiatry 65: 586–
93.
74. Silk TJ, Vance A, Rinehart N, Bradshaw JL, Cunnington R (2009) White-matter
abnormalities in attention deficit hyperactivity disorder: a diffusion tensor
imaging study. Hum Brain Mapp 30: 2757–65.
75. Chuang TC, Wu MT, Huang SP, Weng MJ, Yang P (2013) Diffusion tensor
imaging study of white matter fiber tracts in adolescent attention-deficit/
hyperactivity disorder. Psychiatry Res 211: 186–7.
76. van Ewijk H, Heslenfeld DJ, Zwiers MP, Buitelaar JK, Oosterlaan J. (2012)
Diffusion tensor imaging in attention deficit/hyperactivity disorder: a systematic
review and meta-analysis. Neurosci Biobehav Rev 36: 1093–106.
77. Davenport ND, Karatekin C, White T, Lim KO (2010) Differential fractional
anisotropy abnormalities in adolescents with ADHD or schizophrenia.
Psychiatry Res 181: 193–8.
78. Tamm L, Barnea-Goraly N, Reiss AL (2012) Diffusion tensor imaging reveals
white matter abnormalities in Attention-Deficit/Hyperactivity Disorder. Psy-
chiatry Res 202: 150–4.
79. van Ewijk H, Heslenfeld DJ, Zwiers MP, Faraone SV, Luman M, et al. (2014)
Different mechanisms of white matter abnormalities in attention-deficit/
hyperactivity disorder: a diffusion tensor imaging study. J Am Acad Child
Adolesc Psychiatry 53: 790–9.
80. Arnsten AF, Rubia K (2012) Neurobiological circuits regulating attention,
cognitive control, motivation, and emotion: disruptions in neurodevelopmental
psychiatric disorders. J Am Acad Child Adolesc Psychiatry 51: 356–67.
81. Basser PJ, Mattiello J, LeBihan D (1994) MR diffusion tensor spectroscopy and
imaging. Biophysical Journal 66: 259–267.
82. Basser PJ, Pierpaoli C (1996) Microstructural and physiological features of tissues
elucidated by quantitative-diffusion-tensor MRI. Journal of Magnetic Resonan-
ce B 111: 209–219.
83. Werring DJ, Toosy AT, Clark CA, Parker GJ, Barker GJ, et al. (2000) Diffusion
tensor imaging can detect and quantify corticospinal tract degeneration after
stroke. Journal of Neurology, Neurosurgery, and Psychiatry 69 269–272.
84. Hoeft F, Barnea-Goraly N, Haas BW, Golarai G, Ng D, et al. (2007) More is not
always better: increased fractional anisotropy of superior longitudinal fasciculus
associated with poor visuospatial abilities in Williams syndrome. Journal of
Neuroscience 27: 11960–11965.
85. Yurgelun-Todd DA, Silveri MM, Gruber SA, Rohan ML, Pimentel PJ (2007)
White matter abnormalities observed in bipolar disorder: a diffusion tensor
imaging study. Bipolar Disord 9: 504–12.
86. Versace A, Almeida JR, Hassel S, Walsh ND, Novelli M, et al. (2008) Elevated
Left and Reduced Right Orbitomedial Prefrontal Fractional Anisotropy in
Adults With Bipolar Disorder Revealed by Tract-Based Spatial Statistics. Arch
Gen Psychiatry 65: 1041–52.
87. Heng S, Song AW, Sim K (2010) White matter abnormalities in bipolar
disorder: insights from diffusion tensor imaging studies. J Neural Transm 117:
639–54.
88. Teipel SJ, Grothe MJ, Filippi M, Fellgiebel A, Dyrba M, et al. (2014) Fractional
Anisotropy Changes in Alzheimer’s Disease Depend on the Underlying Fiber
Tract Architecture: A Multiparametric DTI Study using Joint Independent
Component Analysis. J Alzheimers Dis 41: 69–83.
89. Suzuki Y, Matsuzawa H, Kwee IL, Nakada T (2003) Absolute eigenvalue
diffusion tensor analysis for human brain maturation. NMR in Biomedicine, 16
257–260.
90. Phillips MD, McGraw P, Lowe MJ, Mathews VP, Hainline BE (2001).
Diffusion- weighted imaging of white matter abnormalities in patient with
phenylketonuria, Am. J. Neuroradiol., 22 1583–1586.
91. White DA, Connor LT, Nardos B, Shimony JS, Archer R, et al. (2010) Age-
related decline in the microstructural integrity of white matter in children with
early- and continuously-treated PKU: a DTI study of the corpus callosum. Mol
Genet Metab. 99 Suppl 1: S41–6.
Multimodal MR Study of Treatment-Naıve ADHD Adults
PLOS ONE | www.plosone.org 12 October 2014 | Volume 9 | Issue 10 | e110199

92. Elia J, Ambrosini P, Berrettini W (2008) ADHD characteristics: I. Concurrent
co-morbidity patterns in children & adolescents. Child Adolesc Psychiatry Ment
Health 2: 15.
93. Kobel M, Bechtel N, Specht K, Klarhofer M, Weber P, et al. (2010) Structural
and functional imaging approaches in attention deficit/hyperactivity disorder:
does the temporal lobe play a key role? Psychiatry Res 183: 230–6.
94. Marin A, Scott D, Groll DL (2013) Bipolar disorder comorbid with attention-
deficit/hyperactivity disorder in adult inpatients with acute relapse. Prim Care
Companion CNS Disord 15.
95. Onnink AM, Zwiers MP, Hoogman M, Mostert JC, Kan CC, et al. (2014) Brain
alterations in adult ADHD: effects of gender, treatment and comorbid
depression. Eur Neuropsychopharmacol 24: 397–409.
96. Di Trani M, Di Roma F, Elda A, Daniela L, Pasquale P, et al. (2014) Comorbid
Depressive Disorders in ADHD: The Role of ADHD Severity, Subtypes andFamilial Psychiatric Disorders. Psychiatry Investig 11: 137–42.
97. Rodern C (2013) Advanced DTI processing. Avaliable: http://www.
mccauslandcenter.sc.edu/CRNL/tools/advanced-dti. Accessed 22 September2014.
98. Nir TM, Jahanshad N, Villalon-Reina JE, Toga AW, Jack CR, et al. (2013)Effectiveness of regional DTI measures in distinguishing Alzheimer’s disease,
MCI, and normal aging. Neuroimage Clin 3: 180–95.
99. Lim JS, Park YH, Jang JW, Park SY, Kim S (2014) Differential White MatterConnectivity in Early Mild Cognitive Impairment According to CSF
Biomarkers. PLoS One 9: e91400.100. Wheeler-Kingshott ACM, Cercignani M (2009) About ‘‘Axial’’ and ‘‘Radial’’
Diffusivities. Magnetic Resonance in Medicine 61: 1255–1260.
Multimodal MR Study of Treatment-Naıve ADHD Adults
PLOS ONE | www.plosone.org 13 October 2014 | Volume 9 | Issue 10 | e110199