Effect of Rifampicin and CYP2B6 Genotype on Long-Term Efavirenz Autoinduction and Plasma Exposure in...
8
406 VOLUME 90 NUMBER 3 | SEPTEMBER 2011 | www.nature.com/cpt ARTICLES nature publishing group Tuberculosis (TB) is a devastating opportunistic infection in patients with human immunodeficiency virus (HIV). It is asso- ciated with greater immunodeficiency and consequent high mortality if both diseases are not cotreated within 6 months of diagnosis. 1–3 Early initiation of HIV/TB cotreatment, preferably within the first 8 weeks of TB treatment, has been recommended in all patients with dual infections, irrespective of CD4 cell count. 4 However, the pharmacodynamic and pharmacokinetic interactions among drugs recommended for HIV/TB cotherapy pose a challenge. Rifampicin (RIF) and efavirenz (EFV) are the backbones of TB and HIV therapies, respectively, as recommended in recent treatment guidelines. 4,5 Both drugs are hepatotoxic 6 and there- fore dose and time to initiate therapy are critical when consid- ering HIV/TB cotreatment. RIF and EFV induce CYP450 2B6 and 3A4/A5, the isoenzymes involved in EFV metabolism. 7–9 All enzymes involved in EFV disposition are polymorphic, with their isoforms differing in metabolic capacities. RIF also induces CYP450 2A6, another polymorphic enzyme that has recently been shown to form an alternative pathway for EFV elimination among slow metabolizers of CYP2B6. 10 ese polymorphisms result in large interindividual differences in EFV plasma levels among HIV patients taking similar EFV doses. 11–13 López-Cortés et al. reported that RIF decreases EFV plasma area under the curve by 26% when EFV is added aſter 7 days of RIF therapy. 14 e coadministration of RIF and EFV has been reported to increase interindividual variability in plasma EFV levels, 15 implying that the variant isoforms differ in levels of induction. is difference in enzyme inducibility has been reviewed by Tang et al. 16 We recently reported that CYP2B6 is characterized by prolonged EFV autoinduction and that the extent varies between the different CYP2B6 genotype groups. 17 1 Division of Clinical Pharmacology, Department of Laboratory Medicine, Karolinska University Hospital-Huddinge, Karolinska Institute, Stockholm, Sweden; 2 Unit of Pharmacology and Therapeutics, School of Pharmacy, Muhimbili University of Health and Allied Sciences, Dar es Salaam, Tanzania; 3 Department of Internal Medicine, Muhimbili National Hospital, Dar es Salaam, Tanzania; 4 Department of Infectious Diseases, Karolinska University Hospital at Södersjukhuset, Karolinska Institutet, Stockholm, Sweden; 5 Department of Clinical Pharmacology, School of Medicine, Muhimbili University of Health and Allied Sciences, Dar es Salaam, Tanzania; 6 Department of Clinical Pharmacology and Pharmacoepidemiology, University of Heidelberg, Heidelberg, Germany; 7 Department of Internal Medicine, Muhimbili University of Health and Allied Sciences, Dar es Salaam, Tanzania. Correspondence: E Aklillu ([email protected]) Received 10 March 2011; accepted 2 May 2011; advance online publication 3 August 2011. doi:10.1038/clpt.2011.129 Effect of Rifampicin and CYP2B6 Genotype on Long-Term Efavirenz Autoinduction and Plasma Exposure in HIV Patients With or Without Tuberculosis E Ngaimisi 1,2 , S Mugusi 3,4 , O Minzi 2 , P Sasi 5 , K-D Riedel 6 , A Suda 1 , N Ueda 1 , M Janabi 3 , F Mugusi 7 , WE Haefeli 6 , L Bertilsson 1 , J Burhenne 6 and E Aklillu 1 We performed a prospective comparative study to examine, from a pharmacogenetics perspective, the effect of rifampicin (RIF) on long-term efavirenz (EFV) autoinduction and kinetics. In a study population of patients with HIV receiving EFV with RIF (arm 2, n = 54) or without RIF (arm 1, n = 128 controls), intraindividual and interindividual plasma EFV and 8-hydroxyefavirenz levels were compared at weeks 4 and 16 of EFV therapy. In arm 2, RIF was initiated 4 weeks before starting EFV. In controls (arm 1), the plasma EFV was significantly lower whereas 8-hydroxyefavirenz was higher at week 16 as compared to week 4. By contrast, there were no significant differences in plasma EFV and 8-hydroxyefavirenz concentrations over time in arm 2. At week 4, the plasma EFV concentration was significantly lower in arm 2 as compared to arm 1, but no significant differences were observed by week 16. When stratified by CYP2B6 genotype, significant differences were observed only with respect to CYP2B6*1/*1 genotypes. Ours is the first report of the CYP2B6 genotype- dependent effect of RIF on long-term EFV autoinduction.
Transcript of Effect of Rifampicin and CYP2B6 Genotype on Long-Term Efavirenz Autoinduction and Plasma Exposure in...
406 VOLUME 90 NUMBER 3 | sEptEMBER 2011 | www.nature.com/cpt
articles nature publishing group
Tuberculosis (TB) is a devastating opportunistic infection in patients with human immunodeficiency virus (HIV). It is asso-ciated with greater immunodeficiency and consequent high mortality if both diseases are not cotreated within 6 months of diagnosis.1–3 Early initiation of HIV/TB cotreatment, preferably within the first 8 weeks of TB treatment, has been recommended in all patients with dual infections, irrespective of CD4 cell count.4 However, the pharmacodynamic and pharmacokinetic interactions among drugs recommended for HIV/TB cotherapy pose a challenge.
Rifampicin (RIF) and efavirenz (EFV) are the backbones of TB and HIV therapies, respectively, as recommended in recent treatment guidelines.4,5 Both drugs are hepatotoxic6 and there-fore dose and time to initiate therapy are critical when consid-ering HIV/TB cotreatment. RIF and EFV induce CYP450 2B6 and 3A4/A5, the isoenzymes involved in EFV metabolism.7–9
All enzymes involved in EFV disposition are polymorphic, with their isoforms differing in metabolic capacities. RIF also induces CYP450 2A6, another polymorphic enzyme that has recently been shown to form an alternative pathway for EFV elimination among slow metabolizers of CYP2B6.10 These polymorphisms result in large interindividual differences in EFV plasma levels among HIV patients taking similar EFV doses.11–13
López-Cortés et al. reported that RIF decreases EFV plasma area under the curve by 26% when EFV is added after 7 days of RIF therapy.14 The coadministration of RIF and EFV has been reported to increase interindividual variability in plasma EFV levels,15 implying that the variant isoforms differ in levels of induction. This difference in enzyme inducibility has been reviewed by Tang et al.16 We recently reported that CYP2B6 is characterized by prolonged EFV autoinduction and that the extent varies between the different CYP2B6 genotype groups.17
1Division of Clinical pharmacology, Department of Laboratory Medicine, Karolinska University Hospital-Huddinge, Karolinska Institute, stockholm, sweden; 2Unit of pharmacology and therapeutics, school of pharmacy, Muhimbili University of Health and Allied sciences, Dar es salaam, tanzania; 3Department of Internal Medicine, Muhimbili National Hospital, Dar es salaam, tanzania; 4Department of Infectious Diseases, Karolinska University Hospital at södersjukhuset, Karolinska Institutet, stockholm, sweden; 5Department of Clinical pharmacology, school of Medicine, Muhimbili University of Health and Allied sciences, Dar es salaam, tanzania; 6Department of Clinical pharmacology and pharmacoepidemiology, University of Heidelberg, Heidelberg, Germany; 7Department of Internal Medicine, Muhimbili University of Health and Allied sciences, Dar es salaam, tanzania. Correspondence: E Aklillu ([email protected])
Received 10 March 2011; accepted 2 May 2011; advance online publication 3 August 2011. doi:10.1038/clpt.2011.129
Effect of Rifampicin and CYP2B6 Genotype on Long-term Efavirenz Autoinduction and plasma Exposure in HIV patients With or Without tuberculosisE Ngaimisi1,2, S Mugusi3,4, O Minzi2, P Sasi5, K-D Riedel6, A Suda1, N Ueda1, M Janabi3, F Mugusi7, WE Haefeli6, L Bertilsson1, J Burhenne6 and E Aklillu1
We performed a prospective comparative study to examine, from a pharmacogenetics perspective, the effect of rifampicin (RIF) on long-term efavirenz (EFV) autoinduction and kinetics. In a study population of patients with HIV receiving EFV with RIF (arm 2, n = 54) or without RIF (arm 1, n = 128 controls), intraindividual and interindividual plasma EFV and 8-hydroxyefavirenz levels were compared at weeks 4 and 16 of EFV therapy. In arm 2, RIF was initiated 4 weeks before starting EFV. In controls (arm 1), the plasma EFV was significantly lower whereas 8-hydroxyefavirenz was higher at week 16 as compared to week 4. By contrast, there were no significant differences in plasma EFV and 8-hydroxyefavirenz concentrations over time in arm 2. At week 4, the plasma EFV concentration was significantly lower in arm 2 as compared to arm 1, but no significant differences were observed by week 16. When stratified by CYP2B6 genotype, significant differences were observed only with respect to CYP2B6*1/*1 genotypes. Ours is the first report of the CYP2B6 genotype-dependent effect of RIF on long-term EFV autoinduction.
ClInICAl pHARmACOlOgy & THERApEuTICs | VOLUME 90 NUMBER 3 | sEptEMBER 2011 407
articles
EFV mid-dose plasma levels <1 µg/ml have been associated with 50% treatment failure, whereas levels in a range of 1–4 µg/ml have been associated with good suppression of the viral load without EFV central nervous system toxicity.18 Given that the threshold for resistant mutation (K103N mutation) against non-nucleoside reverse-transcriptase inhibitors is very low,19 subtherapeutic EFV plasma levels may lead to the emergence of resistant HIV strains during RIF/EFV cotherapy.
The induction of CYP2B6 and 3A4/5 enzymes by EFV and RIF occurs preferentially through activation of human con-stitutive androstane nuclear receptor (hCAR) and human pregnane X receptor (hPXR), respectively.7,20,21 Similarly, RIF induction of CYP2A6 is through hPXR. A cytoplasm reserve of these receptors exists, and, in the presence of an inducer, part of this reserve is activated and translocated to the nucleus, where it binds to DNA response elements in promoter regions of CYP2B6, 3A4/5 or 2A6 genes and activates their transcrip-tion. Enzyme induction is dependent on duration of therapy and concentration of the inducer. The greater the concentration and affinity of an inducer/ligand for the nuclear receptor, the
more of the receptor reserve is activated and translocated to the nucleus.7 We therefore hypothesized that hPXR and hCAR act synergistically and that RIF and EFV cotreatment would deeply decrease EFV plasma levels, especially in extensive metaboliz-ers of CYP2B6.
The effect of prolonged EFV autoinduction (in both the presence and absence of RIF) on the extent of interindividual variation in EFV plasma exposure over time, as well as the impli-cations of CYP2B6 genetic variation, has not been investigated before. Therefore, we performed a comparative prospective study to examine the effect of EFV autoinduction on its own disposition over time, in both the presence and absence of RIF, and to determine the effect of genotype on RIF–EFV interac-tion. The results indicated that maximum enzyme induction took place during the first 4 weeks prior to RIF administration and that initiation of EFV therapy thereafter has no significant effect on long-term plasma EFV exposure, regardless of CYP2B6 genotype. In the absence of RIF treatment, EFV autoinduction continues beyond 4 weeks of therapy and the extent of plasma EFV exposure is dependent on CYP2B6 genotype.
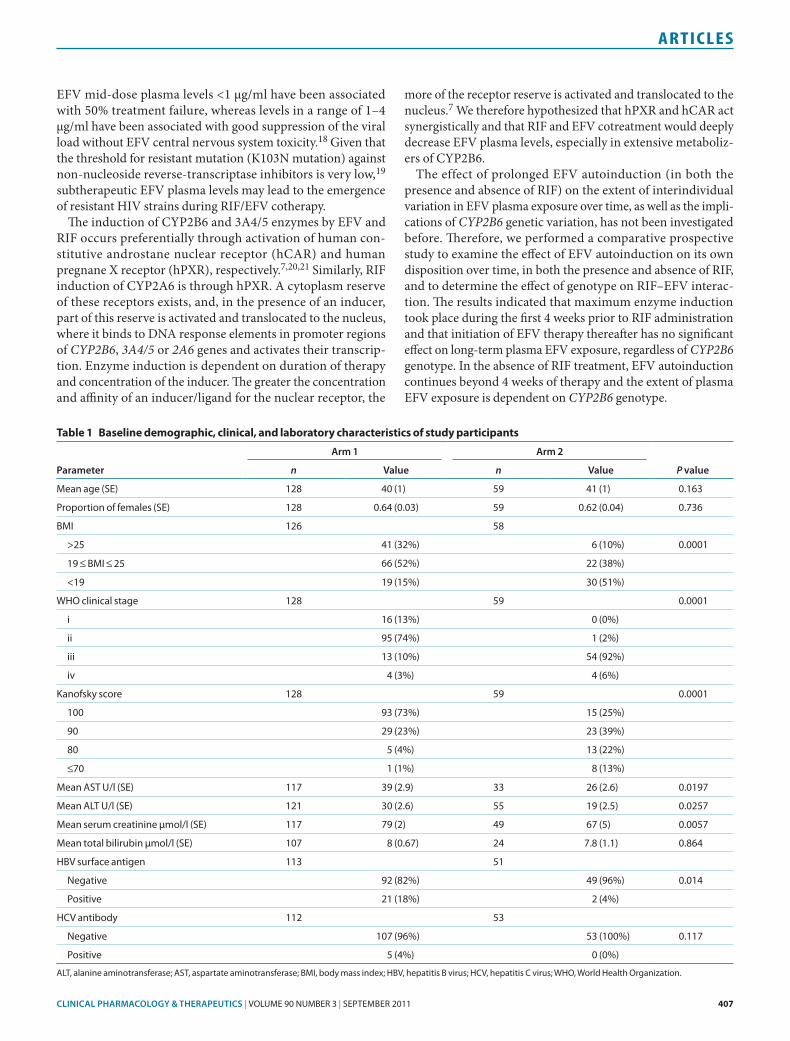
Table 1 Baseline demographic, clinical, and laboratory characteristics of study participants
parameter
Arm 1 Arm 2
P valuen Value n Value
Mean age (sE) 128 40 (1) 59 41 (1) 0.163
proportion of females (sE) 128 0.64 (0.03) 59 0.62 (0.04) 0.736
BMI 126 58
>25 41 (32%) 6 (10%) 0.0001
19 ≤ BMI ≤ 25 66 (52%) 22 (38%)
<19 19 (15%) 30 (51%)
WHO clinical stage 128 59 0.0001
i 16 (13%) 0 (0%)
ii 95 (74%) 1 (2%)
iii 13 (10%) 54 (92%)
iv 4 (3%) 4 (6%)
Kanofsky score 128 59 0.0001
100 93 (73%) 15 (25%)
90 29 (23%) 23 (39%)
80 5 (4%) 13 (22%)
≤70 1 (1%) 8 (13%)
Mean Ast U/l (sE) 117 39 (2.9) 33 26 (2.6) 0.0197
Mean ALt U/l (sE) 121 30 (2.6) 55 19 (2.5) 0.0257
Mean serum creatinine µmol/l (sE) 117 79 (2) 49 67 (5) 0.0057
Mean total bilirubin µmol/l (sE) 107 8 (0.67) 24 7.8 (1.1) 0.864
HBV surface antigen 113 51
Negative 92 (82%) 49 (96%) 0.014
positive 21 (18%) 2 (4%)
HCV antibody 112 53
Negative 107 (96%) 53 (100%) 0.117
positive 5 (4%) 0 (0%)
ALt, alanine aminotransferase; Ast, aspartate aminotransferase; BMI, body mass index; HBV, hepatitis B virus; HCV, hepatitis C virus; WHO, World Health Organization.
408 VOLUME 90 NUMBER 3 | sEptEMBER 2011 | www.nature.com/cpt
articles
ResulTsThe baseline characteristics of the study patients are presented in Table 1. In summary, there were significant differences in many baseline characteristics of patients in arm 2 as compared with those in arm 1.
CYP3A5, 2B6, and ABCB1 genetic variationsThe observed genotype frequencies for CYP3A5, 2B6, and ABCB1 are shown in Table 2. The genotype frequencies were in Hardy–Weinberg equilibrium. There were no significant differences between arms 1 and 2 with respect to observed genotype frequencies. Haplotype analysis indicated no linkage between CYP3A5 single-nucleotide polymorphisms (3A5*3, *6, and *7); therefore, subjects were grouped on the basis of the number of functional CYP3A5 alleles (CYP3A5*1) for statistical analysis.
Changes in eFV and 8-hydroxyefavirenz plasma levels and metabolic ratio over timeCYP2B6 genotype significantly influenced log-transformed plasma EFV concentrations regardless of RIF coadministration or duration of therapy. Analysis of variance (ANOVA) indicated significant effects of CYP2B6 genotype in arm 1 (week 4, P < 0.0001, and week 16, P < 0.0001) and in arm 2 (week 4, P < 0.00001, and week 16, P < 0.0002).
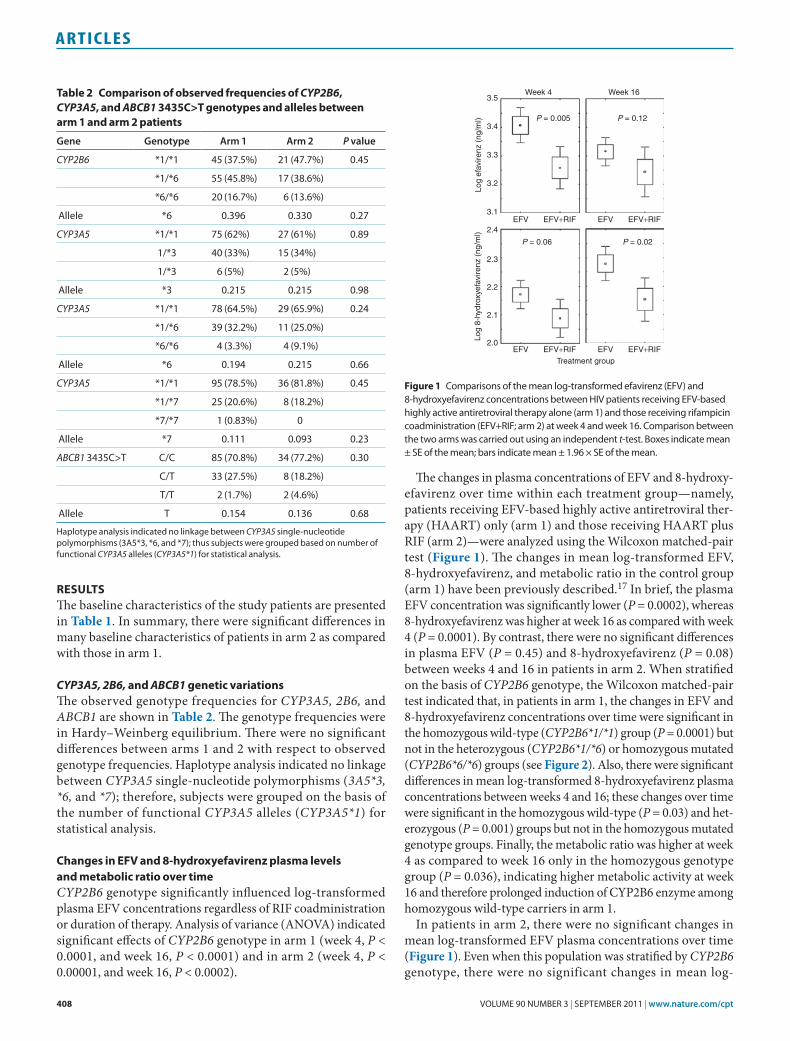
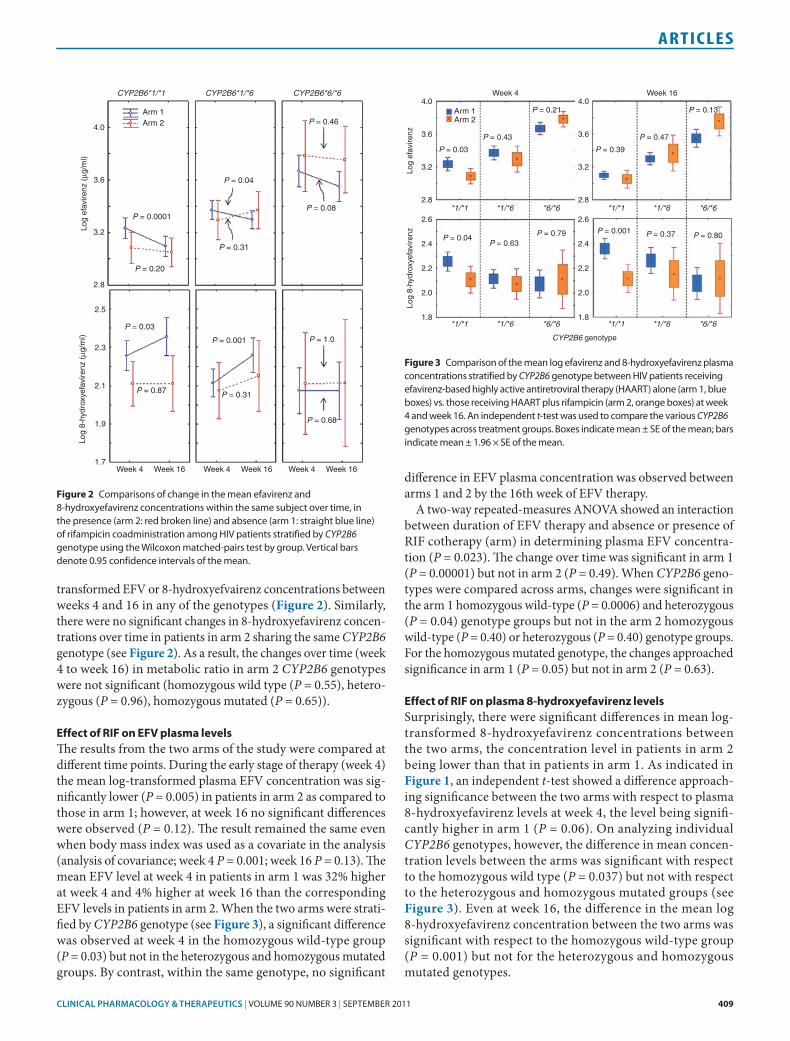
The changes in plasma concentrations of EFV and 8-hydroxy-efavirenz over time within each treatment group—namely, patients receiving EFV-based highly active antiretroviral ther-apy (HAART) only (arm 1) and those receiving HAART plus RIF (arm 2)—were analyzed using the Wilcoxon matched-pair test (Figure 1). The changes in mean log-transformed EFV, 8-hydroxyefavirenz, and metabolic ratio in the control group (arm 1) have been previously described.17 In brief, the plasma EFV concentration was significantly lower (P = 0.0002), whereas 8-hydroxyefavirenz was higher at week 16 as compared with week 4 (P = 0.0001). By contrast, there were no significant differences in plasma EFV (P = 0.45) and 8-hydroxyefavirenz (P = 0.08) between weeks 4 and 16 in patients in arm 2. When stratified on the basis of CYP2B6 genotype, the Wilcoxon matched-pair test indicated that, in patients in arm 1, the changes in EFV and 8-hydroxyefavirenz concentrations over time were significant in the homozygous wild-type (CYP2B6*1/*1) group (P = 0.0001) but not in the heterozygous (CYP2B6*1/*6) or homozygous mutated (CYP2B6*6/*6) groups (see Figure 2). Also, there were significant differences in mean log-transformed 8-hydroxyefavirenz plasma concentrations between weeks 4 and 16; these changes over time were significant in the homozygous wild-type (P = 0.03) and het-erozygous (P = 0.001) groups but not in the homozygous mutated genotype groups. Finally, the metabolic ratio was higher at week 4 as compared to week 16 only in the homozygous genotype group (P = 0.036), indicating higher metabolic activity at week 16 and therefore prolonged induction of CYP2B6 enzyme among homozygous wild-type carriers in arm 1.
In patients in arm 2, there were no significant changes in mean log-transformed EFV plasma concentrations over time (Figure 1). Even when this population was stratified by CYP2B6 genotype, there were no significant changes in mean log-
Week 4 Week 16
P = 0.005 P = 0.12
P = 0.06 P = 0.02
3.5
3.4
3.3
3.2
Log
efav
irenz
(ng
/ml)
3.1EFV EFV+RIF EFV EFV+RIF
2.0
2.1
2.2
Log
8-hy
drox
yefa
vire
nz (
ng/m
l)
2.3
2.4
EFV EFV+RIF EFVTreatment group
EFV+RIF
Figure 1 Comparisons of the mean log-transformed efavirenz (EFV) and 8-hydroxyefavirenz concentrations between HIV patients receiving EFV-based highly active antiretroviral therapy alone (arm 1) and those receiving rifampicin coadministration (EFV+RIF; arm 2) at week 4 and week 16. Comparison between the two arms was carried out using an independent t-test. Boxes indicate mean ± sE of the mean; bars indicate mean ± 1.96 × sE of the mean.
Table 2 Comparison of observed frequencies of CYP2B6, CYP3A5, and ABCB1 3435C>T genotypes and alleles between arm 1 and arm 2 patients
gene genotype Arm 1 Arm 2 P value
CYP2B6 *1/*1 45 (37.5%) 21 (47.7%) 0.45
*1/*6 55 (45.8%) 17 (38.6%)
*6/*6 20 (16.7%) 6 (13.6%)
Allele *6 0.396 0.330 0.27
CYP3A5 *1/*1 75 (62%) 27 (61%) 0.89
1/*3 40 (33%) 15 (34%)
1/*3 6 (5%) 2 (5%)
Allele *3 0.215 0.215 0.98
CYP3A5 *1/*1 78 (64.5%) 29 (65.9%) 0.24
*1/*6 39 (32.2%) 11 (25.0%)
*6/*6 4 (3.3%) 4 (9.1%)
Allele *6 0.194 0.215 0.66
CYP3A5 *1/*1 95 (78.5%) 36 (81.8%) 0.45
*1/*7 25 (20.6%) 8 (18.2%)
*7/*7 1 (0.83%) 0
Allele *7 0.111 0.093 0.23
ABCB1 3435C>t C/C 85 (70.8%) 34 (77.2%) 0.30
C/t 33 (27.5%) 8 (18.2%)
t/t 2 (1.7%) 2 (4.6%)
Allele t 0.154 0.136 0.68
Haplotype analysis indicated no linkage between CYP3A5 single-nucleotide polymorphisms (3A5*3, *6, and *7); thus subjects were grouped based on number of functional CYP3A5 alleles (CYP3A5*1) for statistical analysis.
ClInICAl pHARmACOlOgy & THERApEuTICs | VOLUME 90 NUMBER 3 | sEptEMBER 2011 409
articles
transformed EFV or 8-hydroxyefvairenz concentrations between weeks 4 and 16 in any of the genotypes (Figure 2). Similarly, there were no significant changes in 8-hydroxyefavirenz concen-trations over time in patients in arm 2 sharing the same CYP2B6 genotype (see Figure 2). As a result, the changes over time (week 4 to week 16) in metabolic ratio in arm 2 CYP2B6 genotypes were not significant (homozygous wild type (P = 0.55), hetero-zygous (P = 0.96), homozygous mutated (P = 0.65)).
effect of RIF on eFV plasma levelsThe results from the two arms of the study were compared at different time points. During the early stage of therapy (week 4) the mean log-transformed plasma EFV concentration was sig-nificantly lower (P = 0.005) in patients in arm 2 as compared to those in arm 1; however, at week 16 no significant differences were observed (P = 0.12). The result remained the same even when body mass index was used as a covariate in the analysis (analysis of covariance; week 4 P = 0.001; week 16 P = 0.13). The mean EFV level at week 4 in patients in arm 1 was 32% higher at week 4 and 4% higher at week 16 than the corresponding EFV levels in patients in arm 2. When the two arms were strati-fied by CYP2B6 genotype (see Figure 3), a significant difference was observed at week 4 in the homozygous wild-type group (P = 0.03) but not in the heterozygous and homozygous mutated groups. By contrast, within the same genotype, no significant
difference in EFV plasma concentration was observed between arms 1 and 2 by the 16th week of EFV therapy.
A two-way repeated-measures ANOVA showed an interaction between duration of EFV therapy and absence or presence of RIF cotherapy (arm) in determining plasma EFV concentra-tion (P = 0.023). The change over time was significant in arm 1 (P = 0.00001) but not in arm 2 (P = 0.49). When CYP2B6 geno-types were compared across arms, changes were significant in the arm 1 homozygous wild-type (P = 0.0006) and heterozygous (P = 0.04) genotype groups but not in the arm 2 homozygous wild-type (P = 0.40) or heterozygous (P = 0.40) genotype groups. For the homozygous mutated genotype, the changes approached significance in arm 1 (P = 0.05) but not in arm 2 (P = 0.63).
effect of RIF on plasma 8-hydroxyefavirenz levelsSurprisingly, there were significant differences in mean log-transformed 8-hydroxyefavirenz concentrations between the two arms, the concentration level in patients in arm 2 being lower than that in patients in arm 1. As indicated in Figure 1, an independent t-test showed a difference approach-ing significance between the two arms with respect to plasma 8-hydroxy efavirenz levels at week 4, the level being signifi-cantly higher in arm 1 (P = 0.06). On analyzing individual CYP2B6 genotypes, however, the difference in mean concen-tration levels between the arms was significant with respect to the homozygous wild type (P = 0.037) but not with respect to the heterozygous and homozygous mutated groups (see Figure 3). Even at week 16, the difference in the mean log 8-hydroxyefavirenz concentration between the two arms was significant with respect to the homozygous wild-type group (P = 0.001) but not for the heterozygous and homozygous mutated genotypes.
CYP2B6*1/*1
4.0
3.6
Log
efav
irenz
(µg
/ml)
3.2
2.8
2.5
2.3
2.1
Log
8-hy
drox
yefa
vire
nz (
µg/m
l)
1.9
1.7Week 4 Week 16 Week 4 Week 16 Week 4 Week 16
Arm 1Arm 2
P = 0.0001
P = 0.20
P = 0.31
P = 0.04
P = 0.46
P = 0.08
P = 1.0
P = 0.68
P = 0.31
P = 0.001
P = 0.03
P = 0.87
CYP2B6*1/*6 CYP2B6*6/*6
Figure 2 Comparisons of change in the mean efavirenz and 8-hydroxyefavirenz concentrations within the same subject over time, in the presence (arm 2: red broken line) and absence (arm 1: straight blue line) of rifampicin coadministration among HIV patients stratified by CYP2B6 genotype using the Wilcoxon matched-pairs test by group. Vertical bars denote 0.95 confidence intervals of the mean.
Week 4
Arm 1Arm 2
4.0
3.6
3.2
P = 0.03
P = 0.04P = 0.63
P = 0.79
P = 0.43
P = 0.21
2.8*1/*1 *1/*6 *6/*6
*1/*1 *1/*6 *6/*6
Log
efav
irenz
1.8
2.0
2.2
2.4
2.6
Log
8-hy
drox
yefa
vire
nz
Week 164.0
3.6
3.2
P = 0.39
P = 0.001 P = 0.37 P = 0.80
P = 0.47
P = 0.13
2.8*1/*1 *1/*6 *6/*6
*1/*1 *1/*6 *6/*61.8
CYP2B6 genotype
2.0
2.2
2.4
2.6
Figure 3 Comparison of the mean log efavirenz and 8-hydroxyefavirenz plasma concentrations stratified by CYP2B6 genotype between HIV patients receiving efavirenz-based highly active antiretroviral therapy (HAARt) alone (arm 1, blue boxes) vs. those receiving HAARt plus rifampicin (arm 2, orange boxes) at week 4 and week 16. An independent t-test was used to compare the various CYP2B6 genotypes across treatment groups. Boxes indicate mean ± sE of the mean; bars indicate mean ± 1.96 × sE of the mean.
410 VOLUME 90 NUMBER 3 | sEptEMBER 2011 | www.nature.com/cpt
articles
When genotypes were compared across the arms using two-way repeated-measures ANOVA, the changes in EFV kinetics were significant in arm 1 (homozygous wild type P = 0.04; het-erozygous P = 0.001) but not in arm 2 (homozygous wild type P = 0.95; heterozygous P = 0.29).
The effect of RIF coadministration on long-term EFV kinetics was not significantly influenced by the number of functional CYP3A5*1 alleles or by ABCB1 3435C>T genotypes.
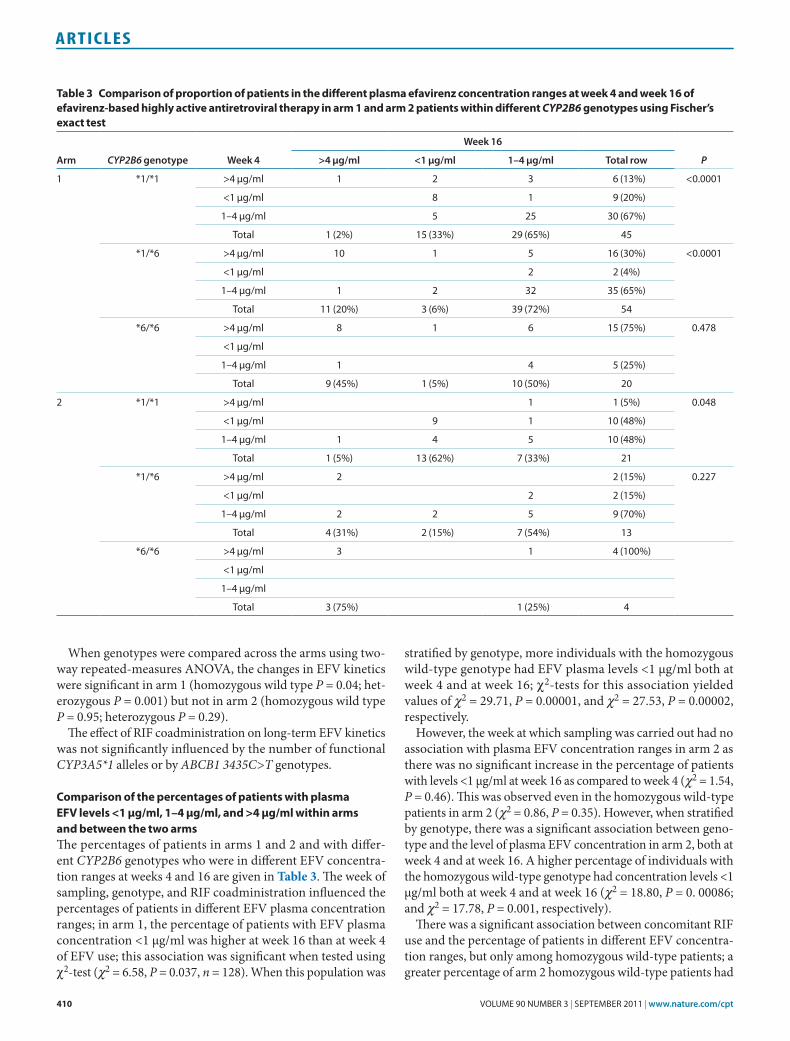
Comparison of the percentages of patients with plasma eFV levels <1 µg/ml, 1–4 µg/ml, and >4 µg/ml within arms and between the two armsThe percentages of patients in arms 1 and 2 and with differ-ent CYP2B6 genotypes who were in different EFV concentra-tion ranges at weeks 4 and 16 are given in Table 3. The week of sampling, genotype, and RIF coadministration influenced the percentages of patients in different EFV plasma concentration ranges; in arm 1, the percentage of patients with EFV plasma concentration <1 µg/ml was higher at week 16 than at week 4 of EFV use; this association was significant when tested using χ2-test (χ2 = 6.58, P = 0.037, n = 128). When this population was
stratified by genotype, more individuals with the homozygous wild-type genotype had EFV plasma levels <1 µg/ml both at week 4 and at week 16; χ2-tests for this association yielded values of χ2 = 29.71, P = 0.00001, and χ2 = 27.53, P = 0.00002, respectively.
However, the week at which sampling was carried out had no association with plasma EFV concentration ranges in arm 2 as there was no significant increase in the percentage of patients with levels <1 µg/ml at week 16 as compared to week 4 (χ2 = 1.54, P = 0.46). This was observed even in the homozygous wild-type patients in arm 2 (χ2 = 0.86, P = 0.35). However, when stratified by genotype, there was a significant association between geno-type and the level of plasma EFV concentration in arm 2, both at week 4 and at week 16. A higher percentage of individuals with the homozygous wild-type genotype had concentration levels <1 µg/ml both at week 4 and at week 16 (χ2 = 18.80, P = 0. 00086; and χ2 = 17.78, P = 0.001, respectively).
There was a significant association between concomitant RIF use and the percentage of patients in different EFV concentra-tion ranges, but only among homozygous wild-type patients; a greater percentage of arm 2 homozygous wild-type patients had
Table 3 Comparison of proportion of patients in the different plasma efavirenz concentration ranges at week 4 and week 16 of efavirenz-based highly active antiretroviral therapy in arm 1 and arm 2 patients within different CYP2B6 genotypes using Fischer’s exact test
Arm CYP2B6 genotype Week 4
Week 16
P>4 µg/ml <1 µg/ml 1–4 µg/ml Total row
1 *1/*1 >4 µg/ml 1 2 3 6 (13%) <0.0001
<1 µg/ml 8 1 9 (20%)
1–4 µg/ml 5 25 30 (67%)
total 1 (2%) 15 (33%) 29 (65%) 45
*1/*6 >4 µg/ml 10 1 5 16 (30%) <0.0001
<1 µg/ml 2 2 (4%)
1–4 µg/ml 1 2 32 35 (65%)
total 11 (20%) 3 (6%) 39 (72%) 54
*6/*6 >4 µg/ml 8 1 6 15 (75%) 0.478
<1 µg/ml
1–4 µg/ml 1 4 5 (25%)
total 9 (45%) 1 (5%) 10 (50%) 20
2 *1/*1 >4 µg/ml 1 1 (5%) 0.048
<1 µg/ml 9 1 10 (48%)
1–4 µg/ml 1 4 5 10 (48%)
total 1 (5%) 13 (62%) 7 (33%) 21
*1/*6 >4 µg/ml 2 2 (15%) 0.227
<1 µg/ml 2 2 (15%)
1–4 µg/ml 2 2 5 9 (70%)
total 4 (31%) 2 (15%) 7 (54%) 13
*6/*6 >4 µg/ml 3 1 4 (100%)
<1 µg/ml
1–4 µg/ml
total 3 (75%) 1 (25%) 4
ClInICAl pHARmACOlOgy & THERApEuTICs | VOLUME 90 NUMBER 3 | sEptEMBER 2011 411
articles
concentration levels <1 µg/ml as compared to the corresponding group of patients in arm 1. The χ2-test for this association was significant (χ2 = 6.26, P = 0.04). No associations were observed between RIF use and EFV concentrations in the heterozygous and homozygous mutated groups (χ2 = 2.32, P = 0.30 and χ2 = 1.35, P = 0.24, respectively).
DIsCussIonOur results indicate that EFV-metabolizing enzymes are induced to the maximum extent during the first 8 weeks of RIF use (4 weeks of RIF alone and 4 weeks of RIF plus EFV) and that fur-ther EFV therapy does not induce the enzymes to any greater extent. In our previous study we were able to show that EFV exhibited prolonged autoinduction among Tanzanian patients on EFV-based HAART alone.17 The current study shows that, with respect to enzyme induction, during HIV/TB cotreatment, EFV has no significant additive or synergistic effect over and above ongoing RIF therapy. The duration of therapy influences long-term EFV autoinduction in the absence of RIF; however, in the presence of RIF coadministration, maximal induction occurs during the early stage of therapy, and therefore there is no prolonged enzyme induction to affect EFV kinetics over time.
Through coordinated cross-talk, hCAR and hPXR control the induction of CYP2B6 expression by recognizing and binding to the phenobarbital-responsive enhancer module (PBREM) and the xenobiotic-responsive enhancer module (XREM) located in the CYP2B6 promoter region.22,23 Cross-talk between hCAR and hPXR explains our finding of the absence of synergistic enzyme induction by initiation of EFV in the presence of ongo-ing RIF therapy. RIF efficaciously induces both CYP3A4/5 and CYP2B6 through hPXR,7 whereas EFV preferentially activates CYP2B6 and minimally CYP3A4 through hCAR. Both hPXR and hCAR activate transcription of CYP2B6 through binding to the DNA response elements PBREM andXREM.24,25 The nuclear receptors hPXR and hCAR compete for available DNA response elements.26 Therefore, in the presence of enough RIF-activated hPXR—which binds to all available PBREM/XREM—EFV activation of hCAR 4 weeks after RIF therapy may have no added effect.
The extent of induction by RIF alone, and by RIF plus EFV during the first 8 weeks in arm 2, was greater than in the 4 weeks of EFV autoinduction in arm 1. But by week 16 of EFV therapy, the enzyme induction and plasma EFV levels in arm 2 became comparable to those of EFV autoinduction in arm 1. This implies that RIF (at the administered dose and given the high affinity of liganded hPXR for DNA response elements) may have the capacity to mobilize all DNA response elements for induction of CYP2B6 (PBREM and XREM) and 3A4 (PXRE and XREM) in a shorter period of time as compared to EFV. This is consistent with the fact that EFV activation of hCAR leads to preferential induction of CYP2B6 relative to 3A4 whereas RIF activation of hPXR leads to efficacious induction of CYP2B6, 2A6, and 3A4.7,10,26
In the absence of RIF (arm 1), both duration of EFV therapy and CYP2B6 genotype play significant roles in determining the extent of enzyme induction. This is indicated by the observation
of significantly higher plasma 8-hydroxyefavirenz levels and lower plasma EFV levels in carriers of the CYP2B6*1 allele at week 16 as compared to week 4, without any significant change in levels in carriers of CYP2B6*6/*6 (Figure 2). However, where there has been prior RIF therapy (arm 2), maximum enzyme induction is achieved in individuals with the CYP2B6*1/*1 genotype by week 4 of RIF therapy; thereafter, neither the ini-tiation of concomitant EFV therapy nor the duration of such therapy has any significant effect, as seen in the absence of any significant change in EFV levels between weeks 4 and 16 of EFV therapy. Plasma EFV levels at week 4 of EFV therapy were sig-nificantly different between arms 1 and 2 only in individuals with the CYP2B6*1/*1 genotype (Figure 3). However, at week 16 of EFV therapy there were no significant differences in EFV levels regardless of CYP2B6 genotype. This indicates that in the absence of RIF coadministration, the duration of EFV therapy is important in determining the extent of induction, particularly in carriers of the CYP2B6*1 allele, in a gene- and dose-dependent manner. Therefore, in arm 1, the extent of EFV autoinduction increases with time to reach a level comparable to that attained by RIF induction (Figure 1).
Interestingly, a CYP2B6 genotype-dependent effect of RIF on plasma EFV concentration over time was observed (Figure 3). In line with the induction effect of RIF, the mean plasma EFV level remained lower in arm 2 than in arm 1 patients, particularly in those with the CYP2B6*1/*1 genotype, both at week 4 and at week 16. By contrast, among patients with the CYP2B6*6/*6 genotype, EFV concentrations were higher over time in patients receiving EFV with RIF (arm 2) than in those receiving no RIF (arm 1). Similar paradoxical elevations in EFV concentrations have been reported in patients with the CYP2B6 516TT geno-type receiving concomitant RIF therapy as compared with those with the same genotype who were not receiving RIF therapy.27 The molecular mechanism through which RIF coadministra-tion results in elevated plasma EFV concentrations in patients with the slow metabolizer genotype (CYP2B6*6/*6) remains to be investigated.
The CYP2B6 genotype-dependent effect of RIF was observed with respect not only to plasma EFV levels but also to the metabolite (8-hydroxyefavirenz). In the context of concomitant therapy with two inducers (RIF and EFV), one might expect to observe higher metabolite concentrations in patients in arm 2 than in those in arm 1. However, contrary to the expected induc-tion effect of RIF, the concentration of 8-hydroxyefavirenz in patients receiving both RIF and EFV (arm 2) was lower than in those receiving EFV alone (arm 1) (Figure 1), and this differ-ence was significant in patients with the CYP2B6*1/*1 genotype (Figure 3). This may indicate that secondary metabolism of EFV is also affected by RIF induction and that 8-hydroxyefavirenz is cleared more rapidly in patients on RIF and EFV cotreatment than in patients on EFV-based HAART alone. In vivo, 8-hydroxy-efavirenz is rapidly glucuronidated by UGT2B7 or sulfated.28 Metabolism of 8-hydroxyefavirenz by UGT2B7 is considered a more dominant pathway than dihydroxylation by CYP2B6.9 A recent study indicated that 8-hydroxyefavirenz exists prima-rily as a conjugate in plasma and urine samples.29 Both UGT2B7
412 VOLUME 90 NUMBER 3 | sEptEMBER 2011 | www.nature.com/cpt
articles
and CYP2B6, which catalyze secondary metabolism of EFV, are induced by RIF.30–33 UGT2B7 substrates compete for the active site, resulting in competitive inhibition when more than one substrate is present.34 It has been reported that UGT2B7 N-glucuronidation of EFV becomes important in individuals with the CYP2B6*6/*6 genotype, in whom there is little produc-tion of 8-hydroxyefavirenz.32,35 This implies that, in individu-als with functional CYP2B6, in whom competitive quantities of 8-hydroxyefavirenz are produced, EFV N-glucuronidation is not an important pathway. Induction of UGT2B7 and CYP2B6 by RIF in these individuals leads to a competitive extensive elimi-nation of 8-hydroxyefavirenz produced by CYP2B6-catalyzed 8-hydroxylation of EFV. Therefore, induction of UGT2B7 by RIF leads to enhanced elimination of 8-hydroxyefavirenz, particu-larly in subjects with a functional CYP2B6 enzyme. An alterna-tive explanation for the observation may be that isoniazid, which is coadministered with RIF in the standard anti-TB regimen, may inhibit the additional 8-hydroxylation of EFV catalyzed by CYP2A6 in patients in arm 2, whereas that effect is absent in arm 1. Isoniazid is an inhibitor of CYP2A6 and CYP3A4 activ-ity in vitro.36 Both CYP2A6 and CYP3A4 are involved in the 8-hydroxylation of EFV, although their contributions are minor compared to that of CYP2B6.9
Given the EFV therapeutic range proposed by Marzolin et al.,18 our results indicate that CYP2B6 genotype is an important factor in determining the percentage of patients with subtherapeutic EFV concentrations in each arm of the study. Generally, there is a greater RIF induction effect in individuals with the CYP2B6*1/*1 genotype. As a result, a larger percentage of individuals with this genotype had EFV concentrations <1 µg/ml both at week 4 and at week 16. Therefore, this group of patients may be more prone to treatment failure, especially during HIV/TB cotreatment.
In summary, we report a CYP2B6 genotype-dependent effect of RIF on long-term EFV autoinduction and disposition. Both CYP2B6 genotype and duration of therapy influence long-term EFV autoinduction in the absence of RIF. However, in the pres-ence of RIF, CYP2B6 genotype, but not duration of EFV therapy, is important. The effect of RIF on EFV kinetics is apparent dur-ing the early stages of therapy but has no significant effect in the long term. Enzyme induction is present to a pronounced extent mainly in patients with the CYP2B6*1/*1 genotype, causing sub-therapeutic EFV plasma concentrations. Whenever possible, we recommend genotyping or therapeutic drug monitoring in HIV clinics, not only to identify poor metabolizers at early stages of therapy (poor metabolizers are at risk for central nervous sys-tem toxicity due to high EFV plasma concentrations) but also to identify extensive metabolizers, who may be at risk of treatment failure on long-term therapy because of pronounced induction.
MeThoDsstudy design and patient population. This was a treatment, nonrand-omized, open-label, active-control, parallel-assignment, population pharmacokinetic and pharmacogenetic study. The study was part of a multicenter clinical trial (ATMR-2009040001261177) funded by the European and Developing Countries Clinical Trial partnership. The trial’s focus was on optimization of HIV/TB cotreatment in Africa, and the study patients were prospectively recruited and followed up at
three HIV clinics in Dar es Salaam, Tanzania. The study protocol was approved by the Muhimbili University of Health and Allied Sciences and Karolinska Institutet ethical review committees. Study participants were provided with written and oral study information before they gave their consent to participate in the study.
A total of 128 adult HIV patients (both men and women) without TB (arm 1) were used as controls to compare the effect of RIF cotherapy on long-term EFV exposure and kinetics.17 A total of 54 patients with HIV and TB coinfection (arm 2) were recruited into the study. Inclusion crite-ria included CD4 count <200 cells/µl, naivety to HIV and TB treatment, normal liver and renal function tests, and negative urine pregnancy test in the women. Patients in arm 1 who met the inclusion criteria were ini-tiated on HAART immediately, and patients in arm 2 were initiated on anti-TB drugs that included RIF, isoniazid, pyrazinamide, and ethambutol (600 mg/300 mg/1,600 mg/1,100 mg, respectively, for patients weighing ≥ 50 kg and 450 mg/225 mg/1,200 mg/825 mg, respectively, for patients weighing <50 kg) immediately after TB diagnosis, with HAART being initiated 4 weeks later. Patients in both arms received HAART consisting of EFV 600 mg and zidovudine 300 mg or stavudine 30 mg and lamivudine 150 mg. The HAART medicines were self-administered by patients, and EFV levels were measured in the evening (1800–2000 h); the other antiret-roviral medications were taken every 12 h. Anti-TB drugs were adminis-tered under close supervision in the first 2 months, and patients continued self-medication thereafter to complete the final 4-month regimen. At week 4 and week 16 after EFV initiation, blood samples were collected at 16 h after EFV dosing and centrifuged; 2 ml of plasma was aliquoted and stored at −80 °C for quantification of EFV and its metabolite.
Quantification of plasma eFV and 8-hydroxyefavirenz concentrations. The determination of the concentrations of EFV and its metabolite (8-hydroxy-efavirenz) was performed in the Department of Clinical Pharmacology and Pharmacoepidemiology, University of Heidelberg, Germany. The concentrations were determined using liquid chromatography–tandem mass spectrometry as described previously,37 with some modifications.17 The lower limits of quantification in plasma were 10.0 ng/ml for EFV and 0.4 ng/ml for 8-hydroxyefavirenz. The calibration range for EFV was 10–10,000 ng/ml and for 8-hydroxyefavirenz it was 0.4–400 ng/ml. Linear regression with 1/x weighting resulted in correlation coefficients of r2 > 0.99. Accuracy and precision (within-batch and batch-to-batch) were always within 100 ± 15% and 15%, respectively. The assays were validated according to the recommendations of the US Food and Drug Administration guideline “Bioanalytical Methods Validation”.38
Genotyping analysis. Blood samples were collected for genotyping from 122 patients in arm 1 of the study and 44 patients in arm 2. Genomic DNA was isolated from peripheral blood leukocytes using a QIAamp DNA Maxi Kit (QIAGEN, Hilden, Germany). The subjects were genotyped for CYP2B6*6, CYP3A5*3, CYP3A5*6, CYP3A5*7, and ABCB1 3435C>T. Allelic discrimination reactions were performed using TaqMan (Applied Biosystems, Foster City, CA) genotyping assays (C___7586657_20 for ABCB1 3435C>T, C__29560333_20 for CYPB6 516G>T (CYP2B6*6), C__26201809_30 for CYP3A5 6986A>G (CYP3A5*3), C__30203950_10 for CYP3A5 14690G>A (CYP3A5*6), and C__32287188_10 for CYP3A5 g.27131_27132insT (CYP3A5*7)) on ABI 7500 FAST (Applied Biosystems). The final volume for each reaction was 10 μl, consisting of 2× TaqMan Universal PCR Master Mix (Applied Biosystems), 20× drug metabolizing genotype assay mix, and 10 ng genomic DNA. The PCR profile consisted of an initial step at 50 °C for 2 min and 50 cycles with 95 °C for 10 min and 92 °C for 15 s.
statistics. Student’s t-test and z-test were used to compare the continuous and categorical baseline characteristics between arms 1 and 2. Plasma EFV and 8-hydroxyefavirenz levels and the EFV/8-hydroxyefavirenz ratio were log-transformed to normalize their distribution for statistical analysis. The log distributions were then confirmed to be normally distributed by means of the Kolmogorov–Smirnov test. One-way ANOVA was used to test for any significant difference in mean log-transformed plasma EFV and
ClInICAl pHARmACOlOgy & THERApEuTICs | VOLUME 90 NUMBER 3 | sEptEMBER 2011 413
articles
8-hydroxyefavirenz concentrations between the different genotype groups in arms 1 and 2 and between the values at week 4 and week 16 of EFV treatment. Two-way repeated-measures ANOVA was used to examine the changes in mean log-transformed EFV and 8-hydroxyefavirenz concentra-tions between weeks 4 and 16 in the different CYP2B6 genotype groups across as well as within the two arms of the study. The reduction in plasma EFV concentration attributable to the presence of RIF was calculated as the percentage difference in mean plasma EFV levels at week 4 after EFV initiation in arms 1 and 2. A χ2-test was used to compare the numbers of patients with plasma EFV levels <1 µg/ml, 1–4 µg/ml, and >4 µg/ml. Univariate and multivariate logistic regression methods were used to assess risk factors associated with plasma levels <1 µg/ml or >4 µg/ml. Plasma EFV and 8-hydroxyefavirenz concentrations and EFV/8-hydroxyefavirenz ratios at the two sampling time points (weeks 4 and 16) in each arm were compared using two-way repeated-measures ANOVA.
ACknowleDGMenTsthis study was funded by European and Developing Countries Clinical trial partnership grant 2005.32030.001 and sIDA/sAREC grants HIV 2006-031 and sWE 2007-270 and the swedish Research Council, Medicine (3902). We thank all the patients and research assistants for their cooperation.
ConFlICT oF InTeResTthe authors declared no conflict of interest.
© 2011 American society for Clinical pharmacology and therapeutics
1. Lawn, s.D., Myer, L., Bekker, L.G. & Wood, R. Burden of tuberculosis in an antiretroviral treatment programme in sub-saharan Africa: impact on treatment outcomes and implications for tuberculosis control. AIDS 20, 1605–1612 (2006).
2. Cain, K.p. et al. Causes of death in HIV-infected persons who have tuberculosis, thailand. Emerging Infect. Dis. 15, 258–264 (2009).
3. Manosuthi, W., Chottanapand, s., thongyen, s., Chaovavanich, A. & sungkanuparph, s. survival rate and risk factors of mortality among HIV/tuberculosis-coinfected patients with and without antiretroviral therapy. J. Acquir. Immune Defic. Syndr. 43, 42–46 (2006).
4. World Health Organization. treatment of tuberculosis: Guidelines, 4th edn <http://whqlibdoc.who.int/publications/2010/9789241547833_eng.pdf> (2009).
5. pozniak, A.L. et al. British HIV Association Guidelines for the Treatment of TB/HIV Co-infection 2009 1 (British HIV Association (BHIVA), London, 2009).
6. Hoffmann, C.J. et al. Hepatotoxicity in an African antiretroviral therapy cohort: the effect of tuberculosis and hepatitis B. AIDS 21, 1301–1308 (2007).
7. Faucette, s.R. et al. Relative activation of human pregnane X receptor versus constitutive androstane receptor defines distinct classes of CYp2B6 and CYp3A4 inducers. J. Pharmacol. Exp. Ther. 320, 72–80 (2007).
8. Ward, B.A., Gorski, J.C., Jones, D.R., Hall, s.D., Flockhart, D.A. & Desta, Z. the cytochrome p450 2B6 (CYp2B6) is the main catalyst of efavirenz primary and secondary metabolism: implication for HIV/AIDs therapy and utility of efavirenz as a substrate marker of CYp2B6 catalytic activity. J. Pharmacol. Exp. Ther. 306, 287–300 (2003).
9. Ogburn, E.t., Jones, D.R., Masters, A.R., Xu, C., Guo, Y. & Desta, Z. Efavirenz primary and secondary metabolism in vitro and in vivo: identification of novel metabolic pathways and cytochrome p450 2A6 as the principal catalyst of efavirenz 7-hydroxylation. Drug Metab. Dispos. 38, 1218–1229 (2010).
10. Itoh, M. et al. Induction of human CYp2A6 is mediated by the pregnane X receptor with peroxisome proliferator-activated receptor-gamma coactivator 1alpha. J. Pharmacol. Exp. Ther. 319, 693–702 (2006).
11. Cabrera, s.E. et al. Influence of the cytochrome p450 2B6 genotype on population pharmacokinetics of efavirenz in human immunodeficiency virus patients. Antimicrob. Agents Chemother. 53, 2791–2798 (2009).
12. Mukonzo, J.K. et al. A novel polymorphism in ABCB1 gene, CYp2B6*6 and sex predict single-dose efavirenz population pharmacokinetics in Ugandans. Br. J. Clin. Pharmacol. 68, 690–699 (2009).
13. Arab-Alameddine, M. et al.; swiss HIV Cohort study. pharmacogenetics-based population pharmacokinetic analysis of efavirenz in HIV-1-infected individuals. Clin. Pharmacol. Ther. 85, 485–494 (2009).
14. López-Cortés, L.F. et al. pharmacokinetic interactions between efavirenz and rifampicin in HIV-infected patients with tuberculosis. Clin. Pharmacokinet. 41, 681–690 (2002).
15. Matteelli, A. et al. Multiple-dose pharmacokinetics of efavirenz with and without the use of rifampicin in HIV-positive patients. Curr. HIV Res. 5, 349–353 (2007).
16. tang, C., Lin, J.H. & Lu, A.Y. Metabolism-based drug-drug interactions: what determines individual variability in cytochrome p450 induction? Drug Metab. Dispos. 33, 603–613 (2005).
17. Ngaimisi, E. et al. Long-term efavirenz autoinduction and its effect on plasma exposure in HIV patients. Clin. Pharmacol. Ther. 88, 676–684 (2010).
18. Marzolini, C., telenti, A., Decosterd, L.A., Greub, G., Biollaz, J. & Buclin, t. Efavirenz plasma levels can predict treatment failure and central nervous system side effects in HIV-1-infected patients. AIDS 15, 71–75 (2001).
19. Bacheler, L.t. et al. Human immunodeficiency virus type 1 mutations selected in patients failing efavirenz combination therapy. Antimicrob. Agents Chemother. 44, 2475–2484 (2000).
20. Faucette, s.R. et al. Regulation of CYp2B6 in primary human hepatocytes by prototypical inducers. Drug Metab. Dispos. 32, 348–358 (2004).
21. Wang, H., Faucette, s., Moore, R., sueyoshi, t., Negishi, M. & LeCluyse, E. Human constitutive androstane receptor mediates induction of CYp2B6 gene expression by phenytoin. J. Biol. Chem. 279, 29295–29301 (2004).
22. sueyoshi, t., Kawamoto, t., Zelko, I., Honkakoski, p. & Negishi, M. the repressed nuclear receptor CAR responds to phenobarbital in activating the human CYp2B6 gene. J. Biol. Chem. 274, 6043–6046 (1999).
23. Wang, H. et al. A novel distal enhancer module regulated by pregnane X receptor/constitutive androstane receptor is essential for the maximal induction of CYp2B6 gene expression. J. Biol. Chem. 278, 14146–14152 (2003).
24. Xie, W. et al. Reciprocal activation of xenobiotic response genes by nuclear receptors sXR/pXR and CAR. Genes Dev. 14, 3014–3023 (2000).
25. Desai, p.B. et al. Induction of cytochrome p450 3A4 in primary human hepatocytes and activation of the human pregnane X receptor by tamoxifen and 4-hydroxytamoxifen. Drug Metab. Dispos. 30, 608–612 (2002).
26. Faucette, s.R., sueyoshi, t., smith, C.M., Negishi, M., Lecluyse, E.L. & Wang, H. Differential regulation of hepatic CYp2B6 and CYp3A4 genes by constitutive androstane receptor but not pregnane X receptor. J. Pharmacol. Exp. Ther. 317, 1200–1209 (2006).
27. Kwara, A., Lartey, M., sagoe, K.W. & Court, M.H. paradoxically elevated efavirenz concentrations in HIV/tuberculosis-coinfected patients with CYp2B6 516tt genotype on rifampin-containing antituberculous therapy. AIDS 25, 388–390 (2011).
28. Mutlib, A.E. et al. Identification and characterization of efavirenz metabolites by liquid chromatography/mass spectrometry and high field NMR: species differences in the metabolism of efavirenz. Drug Metab. Dispos. 27, 1319–1333 (1999).
29. Cho, D.Y., Ogburn, E.t., Jones, D. & Desta, Z. Contribution of N-glucuronidation to efavirenz elimination in vivo in the basal and rifampin-induced metabolism of efavirenz. Antimicrob. Agents Chemother. 55, 1504–1509 (2011).
30. soars, M.G., petullo, D.M., Eckstein, J.A., Kasper, s.C. & Wrighton, s.A. An assessment of udp-glucuronosyltransferase induction using primary human hepatocytes. Drug Metab. Dispos. 32, 140–148 (2004).
31. Chen, J. & Raymond, K. Roles of rifampicin in drug-drug interactions: underlying molecular mechanisms involving the nuclear pregnane X receptor. Ann. Clin. Microbiol. Antimicrob. 5, 3 (2006).
32. Kwara, A., Lartey, M., sagoe, K.W., Kenu, E. & Court, M.H. CYp2B6, CYp2A6 and UGt2B7 genetic polymorphisms are predictors of efavirenz mid-dose concentration in HIV-infected patients. AIDS 23, 2101–2106 (2009).
33. Gallicano, K.D. et al. Induction of zidovudine glucuronidation and amination pathways by rifampicin in HIV-infected patients. Br. J. Clin. Pharmacol. 48, 168–179 (1999).
34. Bélanger, A.s., Caron, p., Harvey, M., Zimmerman, p.A., Mehlotra, R.K. & Guillemette, C. Glucuronidation of the antiretroviral drug efavirenz by UGt2B7 and an in vitro investigation of drug-drug interaction with zidovudine. Drug Metab. Dispos. 37, 1793–1796 (2009).
35. di Iulio, J. et al.; swiss HIV Cohort study. In vivo analysis of efavirenz metabolism in individuals with impaired CYp2A6 function. Pharmacogenet. Genomics 19, 300–309 (2009).
36. Wen, X., Wang, J.s., Neuvonen, p.J. & Backman, J.t. Isoniazid is a mechanism-based inhibitor of cytochrome p450 1A2, 2A6, 2C19 and 3A4 isoforms in human liver microsomes. Eur. J. Clin. Pharmacol. 57, 799–804 (2002).
37. Burhenne, J. et al. No evidence for induction of ABC transporters in peripheral blood mononuclear cells in humans after 14 days of efavirenz treatment. Antimicrob. Agents Chemother. 54, 4185–4191 (2010).
38. Us Food and Drug Administration. Guidance for Industry, Bioanalytical Method Validation <http://www.fda.gov/downloads/Drugs/GuidanceComplianceRegulatoryInformation/Guidances/ucm070107.pdf> (2001).