Identification and characterization of potent CYP2B6 inhibitors in Woohwangcheongsimwon suspension,...
7
This article was downloaded by:[Centers for Disease Control and Prevention] On: 6 December 2007 Access Details: [subscription number 770377425] Publisher: Taylor & Francis Informa Ltd Registered in England and Wales Registered Number: 1072954 Registered office: Mortimer House, 37-41 Mortimer Street, London W1T 3JH, UK Journal of Occupational and Environmental Hygiene Publication details, including instructions for authors and subscription information: http://www.informaworld.com/smpp/title~content=t713657996 Case Study Lawrence F. Mazzuckelli; Mark M. Methner a ; M. Eileen Birch a ; Douglas E. Evans a ; Bon-Ki Ku a ; Keith Crouch a ; Mark D. Hoover b a National Institute for Occupational Safety and Health, Cincinnati, Ohio b National Institute for Occupational Safety and Health, Morgantown, West Virginia First Published on: 22 October 2007 To cite this Article: Mazzuckelli, Lawrence F., Methner, Mark M., Birch, M. Eileen, Evans, Douglas E., Ku, Bon-Ki, Crouch, Keith and Hoover, Mark D. (2007) 'Case Study', Journal of Occupational and Environmental Hygiene, 4:12, D125 - D130 To link to this article: DOI: 10.1080/15459620701683871 URL: http://dx.doi.org/10.1080/15459620701683871 PLEASE SCROLL DOWN FOR ARTICLE Full terms and conditions of use: http://www.informaworld.com/terms-and-conditions-of-access.pdf This article maybe used for research, teaching and private study purposes. Any substantial or systematic reproduction, re-distribution, re-selling, loan or sub-licensing, systematic supply or distribution in any form to anyone is expressly forbidden. The publisher does not give any warranty express or implied or make any representation that the contents will be complete or accurate or up to date. The accuracy of any instructions, formulae and drug doses should be independently verified with primary sources. The publisher shall not be liable for any loss, actions, claims, proceedings, demand or costs or damages whatsoever or howsoever caused arising directly or indirectly in connection with or arising out of the use of this material.
-
Upload
independent -
Category
Documents
-
view
1 -
download
0
Transcript of Identification and characterization of potent CYP2B6 inhibitors in Woohwangcheongsimwon suspension,...
This article was downloaded by:[Centers for Disease Control and Prevention]On: 6 December 2007Access Details: [subscription number 770377425]Publisher: Taylor & FrancisInforma Ltd Registered in England and Wales Registered Number: 1072954Registered office: Mortimer House, 37-41 Mortimer Street, London W1T 3JH, UK
Journal of Occupational andEnvironmental HygienePublication details, including instructions for authors and subscription information:http://www.informaworld.com/smpp/title~content=t713657996
Case StudyLawrence F. Mazzuckelli; Mark M. Methner a; M. Eileen Birch a; Douglas E. Evansa; Bon-Ki Ku a; Keith Crouch a; Mark D. Hoover ba National Institute for Occupational Safety and Health, Cincinnati, Ohiob National Institute for Occupational Safety and Health, Morgantown, West Virginia
First Published on: 22 October 2007To cite this Article: Mazzuckelli, Lawrence F., Methner, Mark M., Birch, M. Eileen,Evans, Douglas E., Ku, Bon-Ki, Crouch, Keith and Hoover, Mark D. (2007) 'CaseStudy', Journal of Occupational and Environmental Hygiene, 4:12, D125 - D130To link to this article: DOI: 10.1080/15459620701683871URL: http://dx.doi.org/10.1080/15459620701683871
PLEASE SCROLL DOWN FOR ARTICLE
Full terms and conditions of use: http://www.informaworld.com/terms-and-conditions-of-access.pdf
This article maybe used for research, teaching and private study purposes. Any substantial or systematic reproduction,re-distribution, re-selling, loan or sub-licensing, systematic supply or distribution in any form to anyone is expresslyforbidden.
The publisher does not give any warranty express or implied or make any representation that the contents will becomplete or accurate or up to date. The accuracy of any instructions, formulae and drug doses should beindependently verified with primary sources. The publisher shall not be liable for any loss, actions, claims, proceedings,demand or costs or damages whatsoever or howsoever caused arising directly or indirectly in connection with orarising out of the use of this material.
Dow
nloa
ded
By:
[Cen
ters
for D
isea
se C
ontro
l and
Pre
vent
ion]
At:
15:5
8 6
Dec
embe
r 200
7
Journal of Occupational and Environmental Hygiene, 4: D125–D130ISSN: 1545-9624 print / 1545-9632 onlineDOI: 10.1080/15459620701683871
Case StudyIdentification and Characterizationof Potential Sources of Worker Exposureto Carbon Nanofibers During PolymerComposite Laboratory Operations
Column EditorLawrence F. Mazzuckelli
Reported byMark M. Methner,1
M. Eileen Birch,1
Douglas E. Evans,1
Bon-Ki Ku,1
Keith Crouch,1
and Mark D. Hoover2
1National Institute forOccupational Safety and Health,Cincinnati, Ohio2National Institute forOccupational Safety and Health,Morgantown, West Virginia
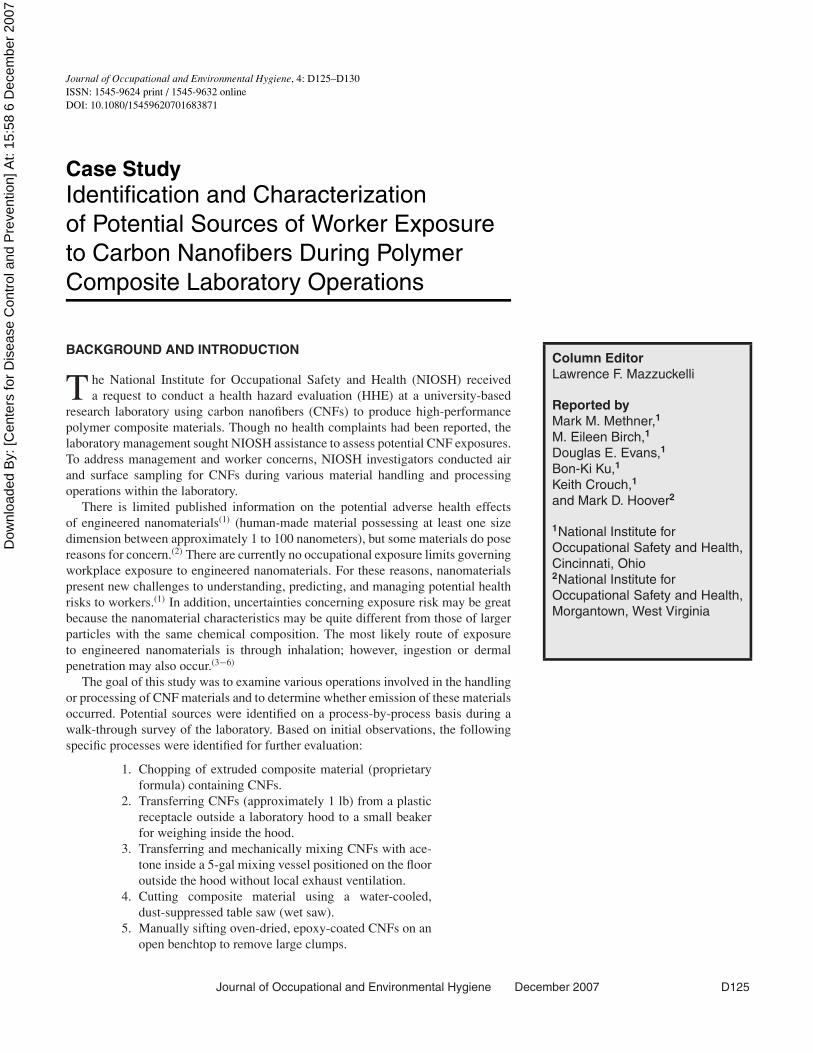
BACKGROUND AND INTRODUCTION
T he National Institute for Occupational Safety and Health (NIOSH) receiveda request to conduct a health hazard evaluation (HHE) at a university-based
research laboratory using carbon nanofibers (CNFs) to produce high-performancepolymer composite materials. Though no health complaints had been reported, thelaboratory management sought NIOSH assistance to assess potential CNF exposures.To address management and worker concerns, NIOSH investigators conducted airand surface sampling for CNFs during various material handling and processingoperations within the laboratory.
There is limited published information on the potential adverse health effectsof engineered nanomaterials(1) (human-made material possessing at least one sizedimension between approximately 1 to 100 nanometers), but some materials do posereasons for concern.(2) There are currently no occupational exposure limits governingworkplace exposure to engineered nanomaterials. For these reasons, nanomaterialspresent new challenges to understanding, predicting, and managing potential healthrisks to workers.(1) In addition, uncertainties concerning exposure risk may be greatbecause the nanomaterial characteristics may be quite different from those of largerparticles with the same chemical composition. The most likely route of exposureto engineered nanomaterials is through inhalation; however, ingestion or dermalpenetration may also occur.(3−6)
The goal of this study was to examine various operations involved in the handlingor processing of CNF materials and to determine whether emission of these materialsoccurred. Potential sources were identified on a process-by-process basis during awalk-through survey of the laboratory. Based on initial observations, the followingspecific processes were identified for further evaluation:
1. Chopping of extruded composite material (proprietaryformula) containing CNFs.
2. Transferring CNFs (approximately 1 lb) from a plasticreceptacle outside a laboratory hood to a small beakerfor weighing inside the hood.
3. Transferring and mechanically mixing CNFs with ace-tone inside a 5-gal mixing vessel positioned on the flooroutside the hood without local exhaust ventilation.
4. Cutting composite material using a water-cooled,dust-suppressed table saw (wet saw).
5. Manually sifting oven-dried, epoxy-coated CNFs on anopen benchtop to remove large clumps.
Journal of Occupational and Environmental Hygiene December 2007 D125
Dow
nloa
ded
By:
[Cen
ters
for D
isea
se C
ontro
l and
Pre
vent
ion]
At:
15:5
8 6
Dec
embe
r 200
7
On a subsequent visit, various real-time aerosol instrumentswere assembled on mobile sampling carts and used to collecttime-synchronized particle data during each process. Filter-based air and surface samples for laboratory analyses also werecollected. The following equipment and methods were used inthis investigation.
Filter-Based Samples. Filter-based air and surface sam-ples were collected near various processes and in adjacentoffice locations to evaluate potential migration of carbonaceousnanomaterials within the facility. Samples were collected onquartz-fiber filters (Pallflex 2500 QAT-UP, Pallflex Inc., Put-nam, Conn.) and analyzed by NIOSH Manual of AnalyticalMethods (NMAM) method 5040, based on a thermal-opticalanalysis technique for carbon.(7) NIOSH 5040 was evaluatedfor measurement of diesel particulate matter (DPM), but it hasapplication to other carbonaceous materials. Routine applica-tion requires an even filter deposit because only a portion ofthe filter is analyzed (i.e., it must be representative of the entiredeposit). CNFs collected in this study, and in another survey,were unevenly deposited on the filter. To address this issue, theentire filter was analyzed.
Inhalable Dust. Process-specific and worker breathing zonesamples of inhalable dust (e.g., particles capable of entering thenose or mouth) were collected with the SKC Button AerosolSampler (SKC Inc., Eighty Four, Pa.) operated at 4 L/min. Sur-face samples were collected by a modified vacuum samplingmethod (ASTM D 7144-05a).(8) Surface particulate matter wasvacuumed directly into an open-faced 25-mm, plastic filtercassette incorporating plastic bristles around its periphery andoperated at 20 L/min. This configuration improved dust col-lection and provided a more even dust distribution on the filter.
Real-Time Instrumentation. Real-time aerosol instrumentswere used to monitor temporal changes in particle number,PM10 mass, and active surface area concentrations, and sizedistribution by number at various locations and processes.Instruments included: a condensation particle counter (CPC,model 3007; TSI Inc. Shoreview, Minn.); an aerosol photome-
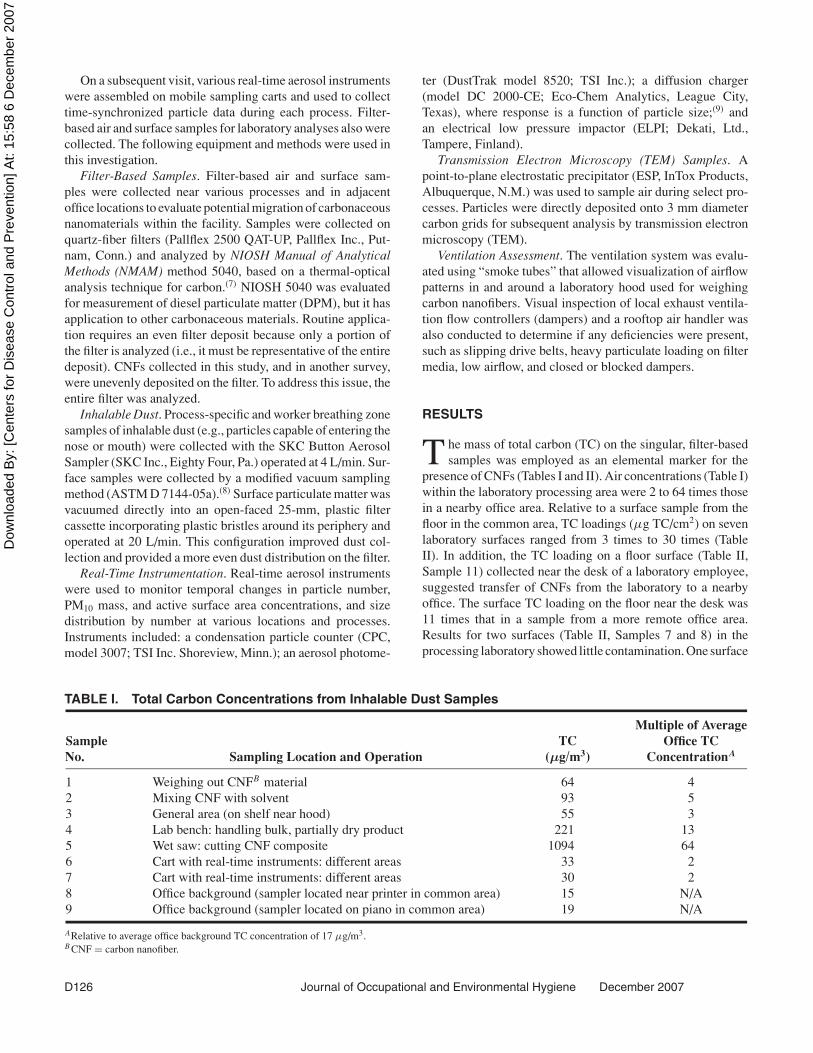
TABLE I. Total Carbon Concentrations from Inhalable Dust Samples
SampleNo. Sampling Location and Operation
TC(µg/m3)
Multiple of AverageOffice TC
ConcentrationA
1 Weighing out CNFB material 64 42 Mixing CNF with solvent 93 53 General area (on shelf near hood) 55 34 Lab bench: handling bulk, partially dry product 221 135 Wet saw: cutting CNF composite 1094 646 Cart with real-time instruments: different areas 33 27 Cart with real-time instruments: different areas 30 28 Office background (sampler located near printer in common area) 15 N/A9 Office background (sampler located on piano in common area) 19 N/A
ARelative to average office background TC concentration of 17 µg/m3.B CNF = carbon nanofiber.
ter (DustTrak model 8520; TSI Inc.); a diffusion charger(model DC 2000-CE; Eco-Chem Analytics, League City,Texas), where response is a function of particle size;(9) andan electrical low pressure impactor (ELPI; Dekati, Ltd.,Tampere, Finland).
Transmission Electron Microscopy (TEM) Samples. Apoint-to-plane electrostatic precipitator (ESP, InTox Products,Albuquerque, N.M.) was used to sample air during select pro-cesses. Particles were directly deposited onto 3 mm diametercarbon grids for subsequent analysis by transmission electronmicroscopy (TEM).
Ventilation Assessment. The ventilation system was evalu-ated using “smoke tubes” that allowed visualization of airflowpatterns in and around a laboratory hood used for weighingcarbon nanofibers. Visual inspection of local exhaust ventila-tion flow controllers (dampers) and a rooftop air handler wasalso conducted to determine if any deficiencies were present,such as slipping drive belts, heavy particulate loading on filtermedia, low airflow, and closed or blocked dampers.
RESULTS
T he mass of total carbon (TC) on the singular, filter-basedsamples was employed as an elemental marker for the
presence of CNFs (Tables I and II). Air concentrations (Table I)within the laboratory processing area were 2 to 64 times thosein a nearby office area. Relative to a surface sample from thefloor in the common area, TC loadings (µg TC/cm2) on sevenlaboratory surfaces ranged from 3 times to 30 times (TableII). In addition, the TC loading on a floor surface (Table II,Sample 11) collected near the desk of a laboratory employee,suggested transfer of CNFs from the laboratory to a nearbyoffice. The surface TC loading on the floor near the desk was11 times that in a sample from a more remote office area.Results for two surfaces (Table II, Samples 7 and 8) in theprocessing laboratory showed little contamination. One surface
D126 Journal of Occupational and Environmental Hygiene December 2007
Dow
nloa
ded
By:
[Cen
ters
for D
isea
se C
ontro
l and
Pre
vent
ion]
At:
15:5
8 6
Dec
embe
r 200
7
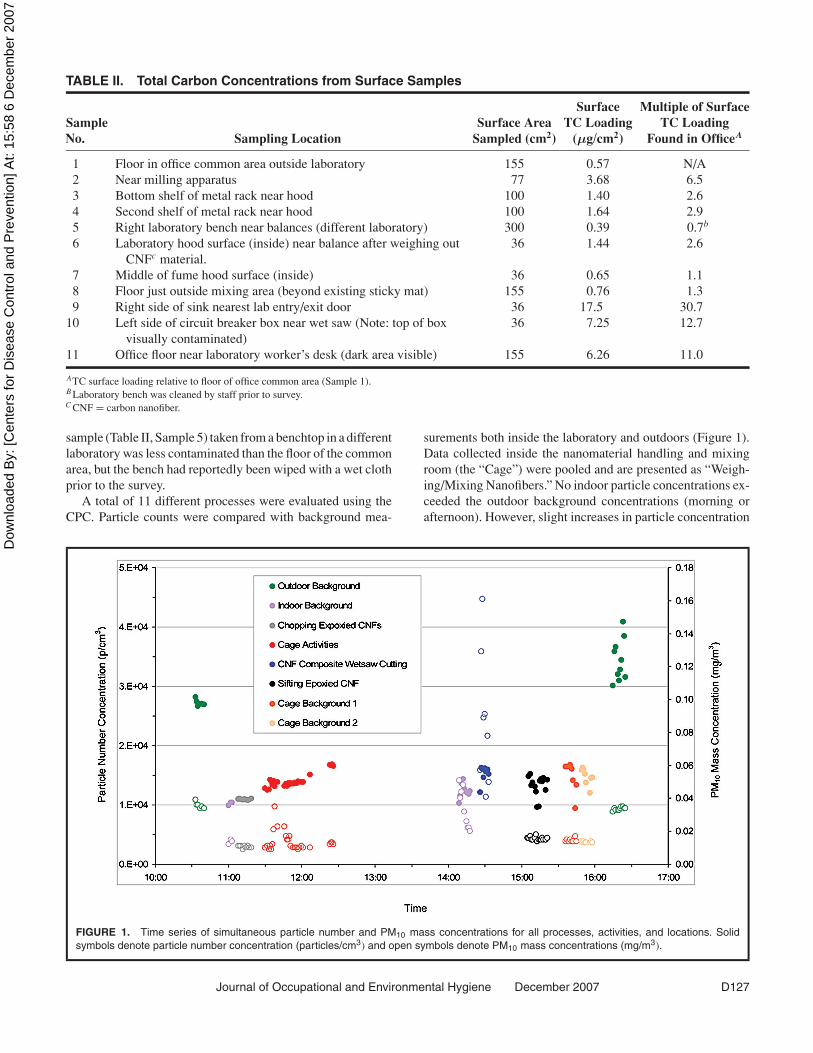
TABLE II. Total Carbon Concentrations from Surface Samples
SampleNo. Sampling Location
Surface AreaSampled (cm2)
SurfaceTC Loading
(µg/cm2)
Multiple of SurfaceTC Loading
Found in OfficeA
1 Floor in office common area outside laboratory 155 0.57 N/A2 Near milling apparatus 77 3.68 6.53 Bottom shelf of metal rack near hood 100 1.40 2.64 Second shelf of metal rack near hood 100 1.64 2.95 Right laboratory bench near balances (different laboratory) 300 0.39 0.7b
6 Laboratory hood surface (inside) near balance after weighing outCNFc material.
36 1.44 2.6
7 Middle of fume hood surface (inside) 36 0.65 1.18 Floor just outside mixing area (beyond existing sticky mat) 155 0.76 1.39 Right side of sink nearest lab entry/exit door 36 17.5 30.7
10 Left side of circuit breaker box near wet saw (Note: top of boxvisually contaminated)
36 7.25 12.7
11 Office floor near laboratory worker’s desk (dark area visible) 155 6.26 11.0
ATC surface loading relative to floor of office common area (Sample 1).B Laboratory bench was cleaned by staff prior to survey.C CNF = carbon nanofiber.
sample (Table II, Sample 5) taken from a benchtop in a differentlaboratory was less contaminated than the floor of the commonarea, but the bench had reportedly been wiped with a wet clothprior to the survey.
A total of 11 different processes were evaluated using theCPC. Particle counts were compared with background mea-
FIGURE 1. Time series of simultaneous particle number and PM10 mass concentrations for all processes, activities, and locations. Solidsymbols denote particle number concentration (particles/cm3) and open symbols denote PM10 mass concentrations (mg/m3).
surements both inside the laboratory and outdoors (Figure 1).Data collected inside the nanomaterial handling and mixingroom (the “Cage”) were pooled and are presented as “Weigh-ing/Mixing Nanofibers.” No indoor particle concentrations ex-ceeded the outdoor background concentrations (morning orafternoon). However, slight increases in particle concentration
Journal of Occupational and Environmental Hygiene December 2007 D127
Dow
nloa
ded
By:
[Cen
ters
for D
isea
se C
ontro
l and
Pre
vent
ion]
At:
15:5
8 6
Dec
embe
r 200
7
relative to laboratory background were noted for weighing andmixing of CNFs as well as for wet-saw cutting of compositematerial. All surface area (diffusion charger) data collectedfor the 11 processes showed no discernable increases abovebackground.
Relative PM10 particle mass concentrations for the 11 pro-cesses evaluated and the data collected using the CPC revealedsimilar trends (Figure 1). When cutting composite materialwith the wet saw, the relative particle mass concentration wasapproximately three times greater than the laboratory back-ground concentration, while small, repeated increases wereobserved during the weighing and mixing of carbon nanofibers.
Particle size distributions by number (obtained with theELPI) indicated that the dominant particle sizes appeared tobe in the 30 to 200 nm range. Particles observed in this sizerange were most likely due to the intrusion of outdoor airrather than indoor activities. Particle size modes present in
the indoor background measurements appeared very similarto those outdoors but at lower concentration. Furthermore,regardless of process, indoor particle number concentrationsin this size range were lower than background levels measuredoutdoors and similar to CPC measurements. Particles havinga diameter of about 400 nm or greater were found in greaternumber during wet-saw cutting, while the number of particleshaving a diameter of about 500 nm or greater were elevatedduring the weighing and mixing of CNFs.
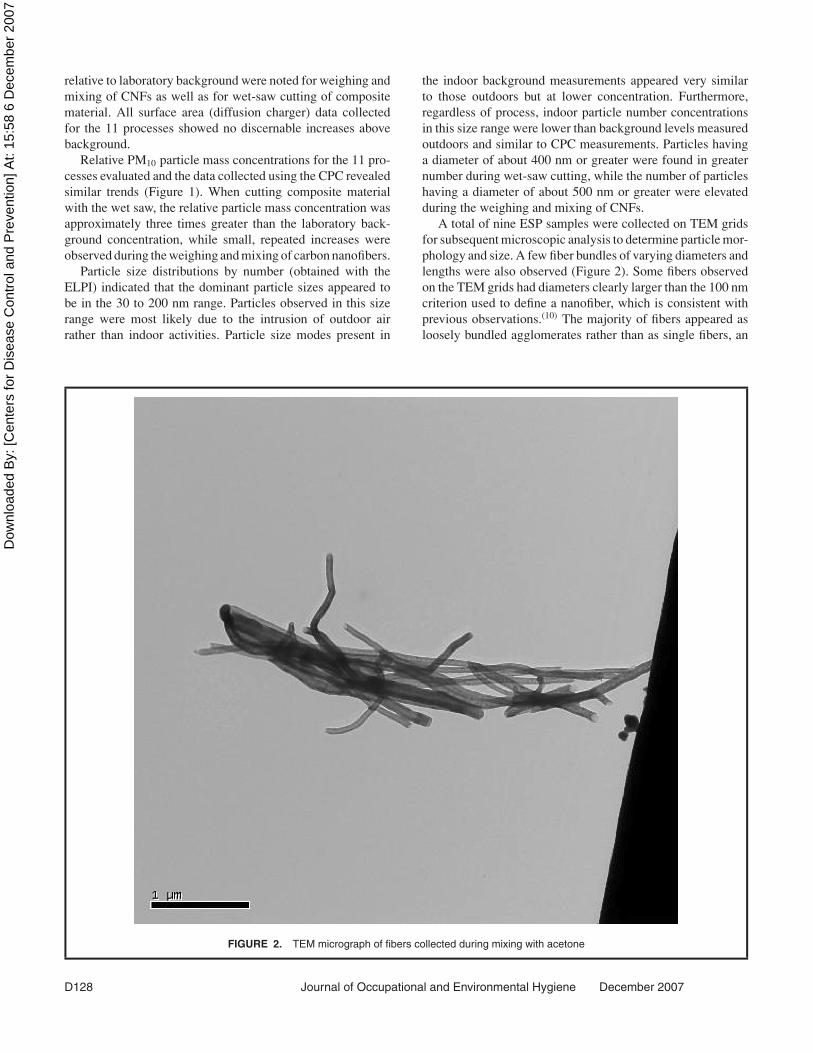
A total of nine ESP samples were collected on TEM gridsfor subsequent microscopic analysis to determine particle mor-phology and size. A few fiber bundles of varying diameters andlengths were also observed (Figure 2). Some fibers observedon the TEM grids had diameters clearly larger than the 100 nmcriterion used to define a nanofiber, which is consistent withprevious observations.(10) The majority of fibers appeared asloosely bundled agglomerates rather than as single fibers, an
FIGURE 2. TEM micrograph of fibers collected during mixing with acetone
D128 Journal of Occupational and Environmental Hygiene December 2007
Dow
nloa
ded
By:
[Cen
ters
for D
isea
se C
ontro
l and
Pre
vent
ion]
At:
15:5
8 6
Dec
embe
r 200
7
observation that is in general agreement with real-time aerosolinstrument data.
Ventilation AssessmentThe single-pass ventilation system used in the laboratory
had a dedicated exhaust fan (4000 ft3/min [113 m3/min]) with ahigh-efficiency particulate air (HEPA) filter located on the roofof the two-story building. Smoke tube analysis of the airflowpatterns in and in front of the laboratory hood indicated that thehood appeared to be functioning adequately and, therefore, wasbelieved to capture fugitive emissions from handling carbonnanofibers within the hood. Of course, the hood would not haveprevented exposure to any emissions from manual scooping ofmaterial prior to weighing, since that procedure was conductedoutside the hood.
The wet-sawing process produced a visible plume emanat-ing from the saw blade and had no dedicated exhaust ventila-tion. Increases in both particle number and mass concentrationsabove background were observed in the general vicinity duringcutting. The TC result (Table I, Sample 5) for a filter samplecollected in this area was 64 times background.
Personal Protective Equipment (PPE)PPE routinely used by laboratory employees consisted of
disposable Tyvek laboratory coats, safety glasses, latex gloves,and a 3M model 7501 elastomeric, half-mask respiratorequipped with an organic vapor cartridge and a P100 filter.Workers reported that they are medically monitored and fittested in accordance with guidelines set forth in the Occupa-tional Safety and Health Administration respiratory protectionstandard.
DISCUSSION
A critical issue when characterizing source emissions andpotential exposure using particle number concentration is
specificity. Nanoparticles are ubiquitous in many workplaces,originating from sources such as combustion,(11) vehicleemissions,(12) and infiltration of outside air. Direct-readinginstruments, as used in this evaluation, are generally insensitiveto particle source or composition, making it difficult to differ-entiate between exogenous and process-related nanoparticles.
However, short-term elevations in concentrations above thebackground that coincided with a particular action, process, ortask may generally be ascribed to those actions or processes.Fortunately, potential confounders such as forklifts, gas burn-ers, and other combustion sources were not present during thissurvey.
Real-time monitoring identified no particular process as asubstantial source of airborne CNF emissions in this laboratory.However, two processes: (1) weighing/mixing CNFs in anunventilated area within the cage, and (2) wet-saw cutting of acomposite material did elevate airborne particle concentrations(number and mass) relative to background concentrations. Ad-ditionally, TC results for air and surface samples indicated thatsome CNF material is being released, and it appears to be
migrating from the laboratory to a nearby office. Transport byfootwear is a likely explanation for the office floor contamina-tion because a dark, localized deposit was visible on the floor.
CONCLUSIONS
B ecause this study was designed to determine the mag-nitude of CNF emissions during various handling pro-
cesses, it is not appropriate to make a determination regardingpersonal exposures. The mobile sampling carts used were, forthe most part, within a few feet of any potential source of CNFemission. Therefore, all data collected provide information ongeneral area concentrations and are not to be construed asrepresentative breathing zone concentrations.
In addition, there are no accepted occupational exposurecriteria specific to engineered nanomaterials with which tocompare the findings of this survey. Despite the limitationsimposed on this survey by these factors, it can be concludedthat the potential for release of engineered nanomaterials doesexist during various processes. First, transferring of CNFsprior to weighing and mixing with solvent resulted in a slightincrease in the airborne concentration (number and mass) ofparticle sizes greater than approximately 500 nm (as indi-cated by the ELPI), suggesting some release of aggregatednanofiber material. Second, operation of the wet saw resultedin a subtle increase in the airborne number concentration ofparticles larger than 400 nm (as indicated by ELPI), alongwith a corresponding increases in both the mass concentrationmeasured by the aerosol photometer and TC concentration.
RECOMMENDATIONS
U ntil further information on the possible health risks andextent of occupational exposure to nanomaterials be-
comes available, the following recommendations should beimplemented:
1. Educate workers in the proper handling of nanomaterials(e.g., cleaning work areas with a HEPA-filtered vacuumcleaner, use wet wiping to clean up spilled material,prohibiting the consumption of food or beverages inworkplaces where nanoscale materials are handled, andproviding handwashing facilities and facilities for show-ering and changing clothes.
2. Use engineering controls such as source enclosure (i.e.,isolating the generation source from the worker) andHEPA-filtered local exhaust ventilation to capture air-borne nanomaterials (http://www.cdc.gov/niosh/topics/nanotech/safenano/control.html), specifically duringlarge-scale mixing and wet sawing.
3. “Sticky mats” should be placed on the floor at each lab-oratory exit/entry door and changed on a regular basis.
4. Use disposable laboratory coats during all laboratoryprocesses and remove them when exiting the labora-tory. These coats can be reworn on returning, providedthe coats are not heavily soiled, at which time they
Journal of Occupational and Environmental Hygiene December 2007 D129
Dow
nloa
ded
By:
[Cen
ters
for D
isea
se C
ontro
l and
Pre
vent
ion]
At:
15:5
8 6
Dec
embe
r 200
7
should be discarded and replaced with new garments.Although no guidelines are currently available for theprevention of dermal exposure to nanomaterials, someclothing standards incorporate testing with nanometer-sized particles and therefore provide some indication ofthe effectiveness of protective clothing with regard tonanoparticles.
5. Latex gloves should be replaced with gloves made ofnitrile rubber to reduce the possibility of a worker de-veloping a latex allergy.
Since there are no specific exposure limits for airborne engi-neered nanomaterials, the decision to use respiratory protectionshould be based on toxicity information, exposure measure-ment data, and the frequency and likelihood of the worker’sexposure. Preliminary evidence suggests that NIOSH-certifiedN95 filtering face-piece respirators will be adequate for pro-tecting workers from nanoscale material inhalation.
REFERENCES
1. Maynard, A.M., and E.D. Kuempel: Airborne nanostructured particlesand occupational health. J. Nanoparticle Res. 7(6):587–614 (2005).
2. Shvedova, A.A., E.R. Kisin, R. Mercer, et al.: Unusual inflammatoryand fibrogenic pulmonary responses to single-walled carbon nanotubes inmice.Am. J. Physiol. Lung Cell Mol. Physiol. 289:L698–L708 (2005).
3. Daigle, C.C., D.C. Chalupa, F.R. Gibb, et al.: Ultrafine particledeposition in humans during rest and exercise. Inhal. Toxicol. 15(6):539–552 (2003).
4. Tinkle, S., J. Antonini, B. Rich, et al.: Skin as a route of exposureand sensitization in chronic beryllium disease. Environ. Health Perspect.111(9):1202–1208 (2003).
5. Aitken, R.J., K.S. Creely, and C.L. Tran: Nanoparticles: An Occupa-tional Hygiene Review (HSE Research Report 274). Bootle, Merseyside,England: UK Health & Safety Executive, 2004.
6. Brown, J.S., K.L. Zeman, and W.D. Bennett: Ultrafine particle deposi-tion and clearance in the healthy and obstructed lung. Am. J. Respir. Crit.Care Med. 166:1240–1247 (2002).
7. National Institute for Occupational Safety and Health (NIOSH):Method 5040. In NIOSH Manual of Analytical Methods (NMAM), 4th ed.P.C. Schlecht and P.F. O’Connor (eds.). Cincinnati, Ohio: U.S. Departmentof Health and Human Services, Public Health Service, Centers for DiseaseControl and Prevention, DHHS (NIOSH) Pub. 94–113, August 1994.
8. ASTM International: Standard Practice for Collection of Surface Dustby Micro-Vacuum Sampling for Subsequent Metals Determination (ASTMMethod D7144-05a). [Standard] New York: ASTM International, 2003.
9. Ku, B.K., and A.D. Maynard: Comparing aerosol surface-area measure-ments of monodisperse ultrafine silver agglomerates by mobility analysis,transmission electron microscopy and diffusion charging. J. Aerosol Sci.36:1108–1124 (2005).
10. Ku, B.K., M.S. Emery, A.D. Maynard, M.R. Stolzenburg, and P.H.McMurray: In situ structure characterization of airborne carbon nanofi-bres by a tandem mobility-mass analysis. Nanotechnology 17:3613–3621(2006).
11. Peters, T.M., W.A. Heitbrink, D.E. Evans, T.J. Slavin, and A.D.Maynard: The mapping of fine and ultrafine particle concentrations in anengine machining and assembly facility. Ann. Occup. Hyg. 50(3):249–257(2006).
12. Kuhlbusch, T.J., S. Neumann, and H. Fissan: Number size distribution,mass concentration, and particle composition of PM1, PM2.5, and PM10in bag filling areas of carbon black production. J. Occup. Environ. Hyg.1:660–671 (2004).
D130 Journal of Occupational and Environmental Hygiene December 2007