Pharmacokinetics of ethanol after oral administration in the fasting state
Upload
independentCategory
view
1download
0
PHARMACOKINETICS AND DISPOSITION
Population pharmacokinetics of nevirapinein combination with rifampicin-based shortcourse chemotherapy in HIV- and tuberculosis-infectedSouth African patients
Doaa Elsherbiny & Karen Cohen & Britt Jansson &
Peter Smith & Helen McIlleron & Ulrika S. H. Simonsson
Received: 1 August 2007 /Accepted: 26 February 2008 / Published online: 27 August 2008# Springer-Verlag 2008
AbstractObjective The aim was to develop a model to describe thepopulation pharmacokinetics of nevirapine in South Africanhuman immunodeficiency virus (HIV)-infected patientswho were taking nevirapine-based antiretroviral therapyconcomitantly or in the absence of rifampicin-basedtuberculosis therapy.Methods Patients were divided into two groups: (1) patientsreceiving nevirapine-containing antiretroviral regimen(200 mg twice daily) and continuation phase rifampicin-containing tuberculosis therapy (n=27) in whom bloodsamples were obtained before and not less than 14 daysafter they completed tuberculosis therapy; (2) patients with-out tuberculosis who were receiving a nevirapine-containingantiretroviral regimen for at least 3 weeks (n=26). Thepopulation pharmacokinetics of nevirapine was describedusing nonlinear mixed effects modelling with NONMEMsoftware. Based on the developed model, plasma concen-tration profiles after 300, 400 and 500 mg of nevirapinetwice daily were simulated.
Results Concomitant administration of rifampicin increasednevirapine oral clearance (CL/F) by 37.4% and reduced theabsorption rate constant (ka) by almost sixfold. Rifampicinreduced the nevirapine average minimum concentration by39%. Simulated doses of 300 mg twice daily elevatednevirapine concentrations above subtherapeutic levels inmost patients, with minimum exposure above the recom-mended maximum concentration. The area under the concen-tration–time curve of 12-hydroxynevirapine was not differentin the presence of rifampicin. 2-, 3- and 8-Hydroxynevirapinewere not detectable (LLOQ=0.025 mg/L).Conclusion The developed model adequately describesnevirapine population pharmacokinetics in a South Africanpopulation when taken with/and in the absence of rifampi-cin treatment. The simulations suggest that an increaseddose of 300 mg twice daily would achieve adequate nevi-rapine concentrations in most patients during rifampicin-containing treatment for tuberculosis.
Keywords HIV. Pharmacokinetics . Nevirapine .
Rifampicin . Tuberculosis
Introduction
Human immunodeficiency virus (HIV) infection has lead toa global increase in the incidence of tuberculosis (TB).Almost one third of African patients with TB develop thedisease as a result of HIV infection, and TB is the maincause of death in African patients with HIV/acquiredimmune deficiency syndrome (AIDS). The majority ofpatients with HIV-associated TB are in sub-Saharan Africa,with about 2 million South Africans coinfected with TB/HIV
Eur J Clin Pharmacol (2009) 65:71–80DOI 10.1007/s00228-008-0481-y
D. Elsherbiny : B. Jansson :U. S. H. Simonsson (*)Division of Pharmacokinetics and Drug Therapy,Department of Pharmaceutical Biosciences, Uppsala University,P.O. Box 591 BMC, 751 24 Uppsala, Swedene-mail: [email protected]
D. Elsherbinye-mail: [email protected]
K. Cohen : P. Smith :H. McIlleronDivision of Clinical Pharmacology, Department of Medicine,University of Cape Town,Cape Town, South Africa
peer
-004
7791
8, v
ersi
on 1
- 30
Apr
201
0Author manuscript, published in "European Journal of Clinical Pharmacology 65, 1 (2008) 71-80"
DOI : 10.1007/s00228-008-0481-y
[1, 2]. In South Africa, a regimen consisting of twonucleoside reverse transcriptase inhibitors (NRTIs) and onenon-nucleoside reverse transcriptase inhibitor, either efavir-enz or nevirapine, is first line antiretroviral therapy, as isrecommended for resource-limited settings by the WorldHealth Organization (WHO). Nevirapine is a component ofinexpensive generic fixed-dose antiretroviral combinationsgiven twice daily; these combinations are used extensively inthe developing world. The treatment of TB with arifampicin-based regimen is standard practice in SouthAfrica. The regimen consists of a 2-month intensive phasewith rifampicin, isoniazid, pyrazinamide and ethambutol,followed by a 4-month continuation phase with rifampicinand isoniazid. Ethambutol is included in the continuationphase in those patients who have had a previous episode ofTB. Nevirapine is both metabolized by and inducescytochrome P450 (CYP) isoenzymes 3A4 and 2B6 [3].The plasma concentrations of nevirapine initially decreaseafter the start of therapy due to auto-induction, reaching asteady state during the second week of treatment [3, 4].Rifampicin is a potent inducer of CYP3A4 and increases theexpression of CYP2B6 [5, 6]. It therefore enhances drugmetabolism, leading to a risk of obtaining sub-therapeuticconcentrations of nevirapine and the selection of resistantviral strains due to persistent viral replication [7]. Viralresistance to nevirapine results from a single mutation on thereverse transcriptase gene [8]. The mutation is observed after4 weeks of monotherapy and may occur in just 2 weeks ifviral replication is not well controlled in the presence ofnevirapine [4]. Several reports on the effect of rifampicin onnevirapine pharmacokinetics have been published [4, 9–14].However, to our knowledge this is the first modelling reporton the effect of rifampicin on nevirapine pharmacokinetics inSouth African patients.
The in vitro metabolism of nevirapine by human hepaticmicrosomal preparations results in four metabolites—2-, 3-, 8-, and 12-hydroxynevirapine—with 2- and 12-hydroxynevirapine being the major metabolites produced.The pharmacokinetics of nevirapine in eight healthy malevolunteers receiving oral nevirapine 200 mg daily for 2 weeksinitially, then 200 mg twice daily for another 2 weeks,followed by a single oral dose of 50 mg containing 100 μCi of[14C]nevirapine has been reported. The major metabolites inplasma were 2-, 3- and 12-hydroxynevirapine glucuronidefollowed by 12-hydroxynevirapine and then 3-hydroxyne-virapine [15]. The nevirapine-induced skin rash in rats ishypothesized to be caused by a reactive metabolite of 12-hydroxynevirapine [16].
The aim of this study was to develop a model to describethe pharmacokinetics of nevirapine and its metabolites inSouth African HIV-infected patients on nevirapine-basedantiretroviral therapy during the continuation phase of arifampicin-based short-course chemotherapy.
Methods
The data were obtained from a cross-sectional study whichincluded intensive and sparse sampling in a total of 53patients.
Study design
Twenty-seven HIV-infected patients with a minimum age of18 years were enrolled during the continuation phase ofstandard TB treatment. They were established on anantiretroviral regimen consisting of 200 mg nevirapine[11-cyclopropyl-5,11-dihydro-4-methyl-6H-dipyrido (3,2-b:2″, 3″-e) [1, 4] diazepin-6-one; Viramune (BoehringerIngelheim, Ingelheim am Rhein, Germany) or Aspen(Durban, South Africa) generic] given orally twice dailyand two NRTIs, stavudine or zidovudine, together withlamivudine. Patients with Karnofsky scores (quantifiespatients’ general well-being, with 100 being perfect healthand 0 indicating death) below 70, known severe renal,hepatic or gastrointestinal disease, including malabsorptionor severe diarrhoea, or those receiving other medication thatmight have (on the basis of a known interaction, or strongtheoretical basis) affected nevirapine, rifampicin or isonia-zid plasma concentrations were excluded. The patients wereasked if they were taking over the counter drugs, naturalproducts, traditional medicine or any other drug apart fromthe drugs involved in this study. They all responded with anegative answer. The patients were receiving standard,recommended weight-based doses of rifampicin and isoni-azid. They were enrolled and admitted for pharmacokineticblood sampling. A minimum of 14 days after TB treatmentwas completed, the patients were re-admitted for pharma-cokinetic blood sampling.
Twenty-six HIV-positive patients who did not have TBwere enrolled as a control group using the same inclusionand exclusion criteria. The patients were on an antiretro-viral regimen consisting of two NRTIs and nevirapine(200 mg orally twice daily) for at least 3 weeks.
Seventeen TB/HIV-coinfected patients and eight controlsunderwent intensive pharmacokinetic sampling. Bloodsamples were taken just before drug administration and atapproximately the following time points 0.5, 1, 1.5, 2, 4, 6,10, 12, 12.25, 12.75, 14, 22 and 24 h after drugadministration. Sparse sampling was used for the remainderof the patients in both groups: two blood samples, aminimum of 1 h apart, were obtained on each samplingoccasion. Venous blood was collected in 4-mL LiH Pst Gelplastic vacuum tubes, stored on ice until sample collectionat that time point was complete for all patients, thenimmediately centrifuged for 10 min at 3000 rpm. The bloodfor the intensive samples taken after 12 h and for the sparsesamples was not immediately centrifuged or stored on ice
72 Eur J Clin Pharmacol (2009) 65:71–80
peer
-004
7791
8, v
ersi
on 1
- 30
Apr
201
0
before centrifugation. Plasma was transferred to labelled1.2-mL microcentrifuge tubes, which were stored at-80°Cuntil analysis.
Standardized meals were given during admissions forblood sampling. Adherence during the week prior toadmission was assessed by means of a questionnaire.Patient covariates, such as gender, age, weight, alanineaminotransferase, albumin, total bilirubin, haemoglobin,WHO HIV disease stage and concomitant medications,were recorded (Table 1). For patients coinfected with TB/HIV, covariates were recorded on both pharmacokineticsampling occasions.
The study was conducted according to the guidelines ofthe Helsinki declaration of 2000, and the protocol andinformed consent documents were approved by the Re-search Ethics Committee of the University of Cape Town,South Africa before patients were enrolled in the study.
A noncompartmental analysis of part of this study,including intensively sampled TB/HIV-coinfected patients(up to 12 h after nevirapine administration), has beenreported earlier [17].
Drug quantification
The method used to measure plasma concentrations ofnevirapine and its metabolites 2-, 3-, 8-and 12-hydroxyne-virapine was developed based on a previously publishedmethod [18].
Nevirapine plasma concentrations were measured usinga liquid chromatography–mass spectrometry method. Liq-uid chromatography was performed on a Waters Alliance(model 2690; Milford, MA) high-performance liquidchromatography (HPLC) system and a Hypersil Gold C18column (20×2.1 mm ; Thermo Fisher Scientific, Waltham,MA). The mobile phase consisted of 50% acetonitrile in4 mM ammonium acetate, 0.1% trifluoroacetic acid. Theflow rate was 0.3 mL/min. For detection, a Waters/Micro-mass ZMD single quadrupole mass spectrometer was usedin positive ionization mode. The detection of nevirapinewas at 276.2 m/z and that of neostigmine (internal standard)at 223.2 m/z. A 20-μL volume of sample or the control wasprecipitated with 50 μL acetonitrile containing 1 mg/Lneostigmine. After vortexing for 30 s and centrifuging for5 min at 750 g, a 2-μL volume of the supernatant wasinjected. The standard curve was linear in the range 0.2–20 mg/L, and the lower limit of quantification (LLOQ) was0.2 mg/L. In each run, three quality control samples of 0.8,3 and 9 mg/L were included.
Plasma concentrations of the nevirapine metabolites, 2-,3-, 8-and 12-hydroxynevirapine, were determined by standem mass spectrometry method. The system consisted ofan Applied Biosystems (Foster City, CA) API 3200 linearion trap. Liquid chromatography was performed using anAgilent 1200 series HPLC instrument and a Gemini C18column (particle size 3 μm, 2.0×50 mm ; Phenomonex,Torrence CA). The mobile phase contained ammoniumformate (5 mM) and acetonitrile in the ratio of 15:85. Theflow rate was set to 0.3 mL/min. The selected reactionmonitoring transitions of [M + H]+ precursor ions to productions were m/z 283.2–214.1 for 3-hydroxynevirpine, m/z283.2–160.9 for 2-hydroxynevirapine, m/z 283.2–265.2 for12-hydroxynevirapine, m/z 283.2–242.3 for 8-hydroxynevir-apine and m/z 276.3–162.3 for physostigmine (internalstandard). A 100-μL volume of plasma was precipitatedwith 300 μL acetonitrile containing 0.5 μg/mL of theinternal standard. After mixing for 10 s and centrifugationfor 5 min at 750 g, 10 μL of the supernatant was diluted with1000 μL of the mobile phase. The injected volume was5 μL. The standard curves were linear in the range 0.025–5 mg/L, with a regression coefficient greater than 0.999 for
Table 1 Characteristics of South African patient population
Characteristics Numberof patients
Median(range)
Total number of patients (male/female) 53 (12/40)TB/HIV-coinfected patientsIntensive 17Sparse 10
HIV-infected patients without tuberculosisIntensive 8Sparse 18Continuous covariatesAge (years) 51 34.6 (21.1–58.4)Weight (kg) 52 67.6 (42.5–105)Albumin (g/L) 25 41.0 (24.0–60.0)Alanine aminotransferase (U/L) 25 25.0 (10.0–127)Total bilirubin (μmol/mL) 25 5.00 (2.00–17.0)Haemoglobin (g/dl) 25 12.4 (6.00–17.1)
Categorical covariates (TB/HIV patients during TB treatment/TB/HIV patients after TB treatment/HIV patients)WHO disease stage2 0/0/23 13/8/154 14/14/9
Concomitant medicationsStavudine 16/13/7Zidovudine 0/2/1Lamivudine 16/14/8Cotrimoxazole 13/10/4Vitamin B complex 5/3/2Multivitamins 3/0/1Pyridoxine 5/1/0Warfarin 2/0/0Ethambutol 5/0/1
TB, Tuberculosis; HIV, human immunodeficiency virus
Eur J Clin Pharmacol (2009) 65:71–80 73
peer
-004
7791
8, v
ersi
on 1
- 30
Apr
201
0
all compounds. In each run, three quality control samples of0.12, 0.9 and 4.5 ug/ml were included. The LLOQ was0.025 mg/L.
For nevirapine and its metabolites; the inter-and intra-day precision was less than 12% across the range ofquantification and less than 10% for the control samples.Accuracy ranged from 89 to 115%. Samples showed noloss of stability of either nevirapine or its metabolites whenstored at either −20 or −80°C for a period of 12 months. Atroom temperature, nevirapine in whole blood was stable forup to 1 week, and the metabolites in spiked plasma werestable for up to 24 h while12-hydroxynevirapine in wholeblood was stable up to 24 h.
Data analysis
Population pharmacokinetics of nevirapine were describedusing nonlinear mixed effects modelling within NONMEMversion VI (GloboMax, Hanover, MD) [19]. The typicalpopulation pharmacokinetic parameters and interindividualand residual variabilities were estimated by the first-orderconditional estimation method with interaction.
One-and two-compartment models with linear elimina-tion and first-order absorption were fitted to the data.Elimination was assumed to take place from the centralplasma compartment.
An exponential error model was used to describeinterindividual variability (IIV) to avoid negative individualparameter estimates:
Pi ¼ Ppop � exp ηið Þ ð1Þ
where Pi is the individual parameter, Ppop is the parameterfor a typical individual and ηi is the IIV that describes thedifference between the typical predicted value and theindividual estimate. The variable ηi was normally distrib-uted with mean 0 and variance ω2. The difference betweenpredicted and observed concentrations was expressed asresidual variability. The different error models that wereinvestigated were additive, proportional and slope–interceptmodels. Uncertainty in the parameter estimate wasexpressed as relative standard error (RSE), expressed asthe ratio of the estimated standard error (SE) of theparameter relative to its value.
The potential covariate relationships of the recordedcovariates were tested. Covariates were then tested in themodel by stepwise addition using an objective functionvalue (OFV) change of >10.83 ( p<0.001) as the cut-off forinclusion, followed by stepwise deletion using an OFVchange of >12.12 ( p<0.0001) to retain the effect on theselected parameters. Only two individuals had WHOdisease stage 2; this category was therefore merged withWHO stage 3, the most common category. In addition,
when a concomitant medication was taken by only oneindividual, it was excluded from the covariate analysis.
Model selection was based on the OFV, which is minustwice the log likelihood of the data. A drop in the OFV of6.63 between two nested models corresponding to p<0.01was regarded as being statistically significant. Other modelselection criteria were graphical analysis using XPOSE ver.3.104 and ver. 4 [20], standard error of parameter estimatesobtained from the output of the NONMEM software andscientific plausibility.
Model validation was done by bootstrap resampling[21]. Parameter estimates were re-estimated for each of the1000 bootstrap samples. The median and 95% confidenceintervals were also compared with the NONMEM estimatesfrom the final model. Model validation was also done bysimulations and a predictive check, where the final modeland parameter estimates were used to simulate 1000 datasets based on the original design. Observed concentrationswere compared to the simulated median and 95% nonpara-metric prediction intervals.
Nevirapine plasma concentrations after twice-daily dosesof 300, 400 and 500 mg, respectively, were simulated inintensively sampled TB/HIV-coinfected patients duringrifampicin-containing TB treatment based on the individualpharmacokinetic parameters from the final model.
The area under the plasma concentration–time curvewithin a dosing interval (AUC) of the nevirapine metabo-lites were calculated with linear trapezoids for ascendingintensive data and log trapezoids for descending intensivedata. The AUCs were calculated separately for concen-trations following the morning dose (AUC-day) andfollowing the night dose (AUC-night). The paired t test(S-PLUS ver. 6.2 for Windows; Insightful, Seattle, WA) wasused for comparing AUC-day for TB/HIV patients duringTB treatment to AUC-day for the same patients after TBtreatment. The comparison for AUC-night was carried outin the same manner. A p value of <0.05 was considered tobe statistically significant.
Results
Nevirapine population pharmacokinetics in TB/HIV- andHIV-infected s ( characteristics provided in Table 1) wasbest described by a one-compartment model with first-orderabsorption and elimination. Concomitant administration ofrifampicin increased nevirapine oral clearance (CL/F) by37.4% and reduced the absorption rate constant (ka) byalmost sixfold. In order to describe the circadian rhythmici-ty in the observed concentration–time data, a covariate forday or night was used. Day was defined as the timebetween sunrise and sunset, while night was the timebetween sunset and sunrise. The study was conducted over
74 Eur J Clin Pharmacol (2009) 65:71–80
peer
-004
7791
8, v
ersi
on 1
- 30
Apr
201
0
a range of 11 months where sunrise ranged between 5.29 a.m.and 7.52 a.m., and sunset sunrise ranged between 5.48 p.m.and 7.41 p.m. The shortest day was 9 h 56 min long, whilethe longest day was 14 h 9 min long. Circadian rhythm in thedifferent parameters was tested and found to be significantfor oral clearance (CL/F) and absorption rate constant (ka).Circadian rhythm was also tested by different coding of dayand night where day was defined as the time between 8 a.m. and 10 p.m. while night was the time between 10 p.m.and 8 a.m. This latter approach to coding resulted in higherOFV compared to the sunrise/sunset approach; consequent-ly, the sunset/sunrise approach was adopted. Nevirapine kaat night was coded as the sum of the elimination rateconstant (k) and an additional estimate to avoid flip-flop.The need for an absorption lag time was also tested anddetermined to be need only at night; it was therefore fixedto zero during the day. The estimates and the RSE aresummarized in Table 2. The CL/F increased by 1.56% withevery 1-year increase in age relative to the populationmedian age of 34.6 years. In addition, the CL/F increasedby 2.84% with every 1 g/L increase in albumin relative tothe population median albumin of 41 g/L. Concomitantadministration of the vitamin B complex was significant forCL/F as well. The volume of distribution (V/F) increasedby 1.42% with every 1 kg increase in weight relative to thepopulation median weight of 67.6 kg (Table 2). The
precision in IIV for CL/F at night in the HIV s group waslow. However, we decided that it needed to be included inthe final model due to a significant drop in OFV and, mostimportantly, an improvement in the visual predictive checkplot, which indicated that the parameter helped to explainvariability in the data.
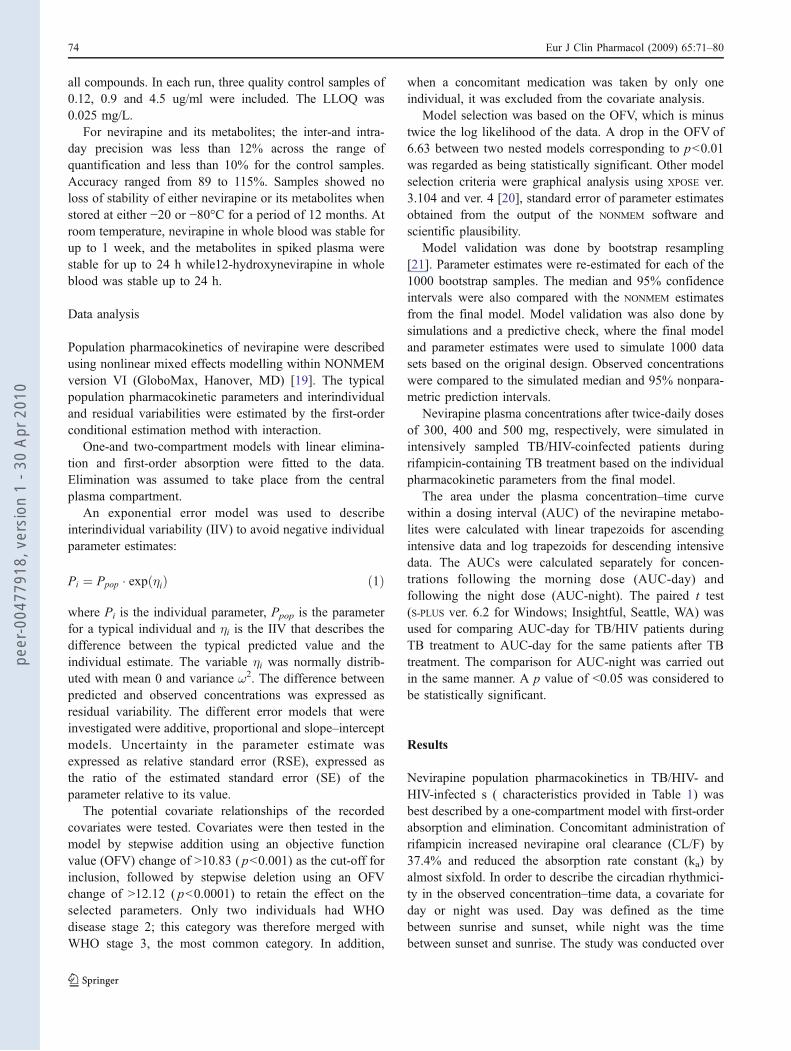
The results of the bootstrap validation are represented inTable 2. Figure 1 shows visual predictive check plotsobtained from the simulation of 1000 data sets based on thefinal model. The percentage of the observed concentrationsabove the simulated median and the percentage of theobserved concentrations below the simulated median was(57:43), (51:49) and (47:53) in TB/HIV-infected patientsduring TB treatment, after TB treatment and in HIV-infected patients, respectively. This indicates that therewas a good agreement between the medians of thesimulated and observed concentrations based on the finalmodel. The percentage of observed concentrations outsidethe simulated 90% prediction interval was 9, 5 and 5% inTB/HIV-infected patients during TB treatment, after TBtreatment and in HIV-infected patients, respectively. Mostof the discrepancy was in the higher concentration rangewhere the simulations from the model resulted in somewhathigher concentrations compared to the observed, indicatingthat the model is overpredicting variability. Figure 2 showsthe individual predicted nevirapine concentrations versus
Table 2 Parameter estimates from the final pharmacokinetic nevirapine model
Parameter NONMEM results Bootstrap results
Mean RSE Median 95% CI
CL/F day (L/h) 2.76 0.057 2.73 2.49–3.02CL/F night (L/h) 3.78 0.11 3.71 3.07–4.29Increase in CL/F with rifampicin (%) 37.4 0.26 42.2 26.5–59.5V/F (l) 137 0.072 134 117–153ka day (h-1) 3.57 0.61 3.01 2.01–32.2ka night (h
-1) k+0.24 0.39 k+0.201 k+(0.084–0.355)ka day with rifampicin (h-1) 0.613 0.42 0.618 0.357–1.13ka night with rifampicin (h-1) k+0.813 0.55 k+0.629 k+(0. 215–1.70)Absorption lag time at night (h) 0.73 0.0016 0.636 0.344–0.731Effect of age on CL/F (θCL/F, AGE) 0.0156 0.67 0.0202 0.00718–0.0274Effect of albumin on CL/F (θCL/F, ALB) 0.0284 0.18 0.0291 0.0172–0.0397Effect of Vitamin B complex on CL/F (θCL/F, BCOM) 0.118 0.93 0.109 -0.0525–0.322Effect of body weight on V/F (θV/F, WT) 0.0142 0.3 0.0133 0.00753–0.0196IIV in CL/F (TB/HIV group without rifampicin) and in CL/F day (HIV group) 0.307 0.27 0.291 0.203–0.362IIV in CL/F (TB/HIV group with rifampicin) 0.314 0.24 0.289 0.217–0.351IIV in CL/F night (HIV group) 0.14 2.3 0.172 0.031–0.491IIV in ka day 0.71 0.85 0.625 0.179–1.14IIV in ka night (TB/HIV group) 2.0 0.53 1.62 0.656–2.56IIV in ka night (HIV group) 1.2 0.53 1.25 0.953–1.60Proportional residual variability 0.128 0.095 0.126 0.112–0.146
RSE, Relative standard error; CI, confidence interval; CL/F, oral clearance; V/F, volume of distribution; ka, absorption rate constant; k, elimination rateconstant that is equal to the oral clearance divided by the volume of distribution; IIV, interindividual variability. CL=Fð Þpop¼ CL=Fð Þ: 1þ θCL=F;AGE�
��
AGE � 34:6ð Þ�g: 1þ θCL=ALB � ALB� 41:0ð Þ� �� � � 1þ θCL=F;BCOM� �� �g V=Fð Þpop¼ V=Fð Þ � 1þ θV=F;WT � WT � 67:6ð Þ� �� �
Eur J Clin Pharmacol (2009) 65:71–80 75
peer
-004
7791
8, v
ersi
on 1
- 30
Apr
201
0
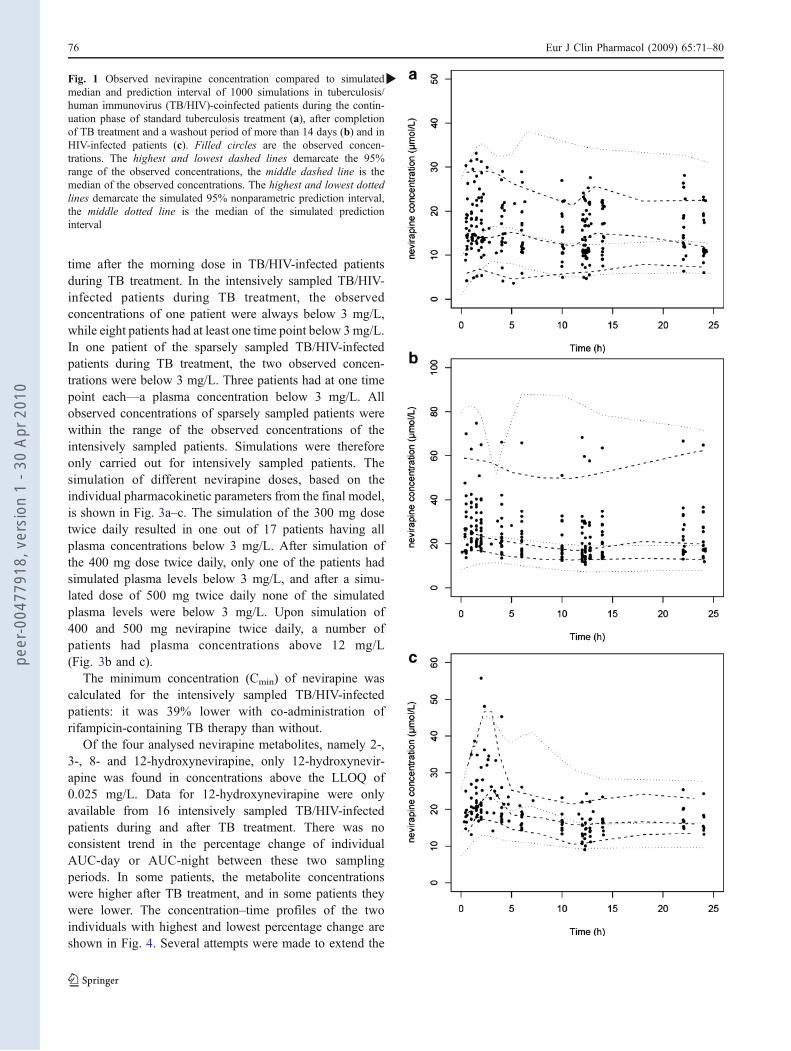
time after the morning dose in TB/HIV-infected patientsduring TB treatment. In the intensively sampled TB/HIV-infected patients during TB treatment, the observedconcentrations of one patient were always below 3 mg/L,while eight patients had at least one time point below 3mg/L.In one patient of the sparsely sampled TB/HIV-infectedpatients during TB treatment, the two observed concen-trations were below 3 mg/L. Three patients had at one timepoint each—a plasma concentration below 3 mg/L. Allobserved concentrations of sparsely sampled patients werewithin the range of the observed concentrations of theintensively sampled patients. Simulations were thereforeonly carried out for intensively sampled patients. Thesimulation of different nevirapine doses, based on theindividual pharmacokinetic parameters from the final model,is shown in Fig. 3a–c. The simulation of the 300 mg dosetwice daily resulted in one out of 17 patients having allplasma concentrations below 3 mg/L. After simulation ofthe 400 mg dose twice daily, only one of the patients hadsimulated plasma levels below 3 mg/L, and after a simu-lated dose of 500 mg twice daily none of the simulatedplasma levels were below 3 mg/L. Upon simulation of400 and 500 mg nevirapine twice daily, a number ofpatients had plasma concentrations above 12 mg/L(Fig. 3b and c).
The minimum concentration (Cmin) of nevirapine wascalculated for the intensively sampled TB/HIV-infectedpatients: it was 39% lower with co-administration ofrifampicin-containing TB therapy than without.
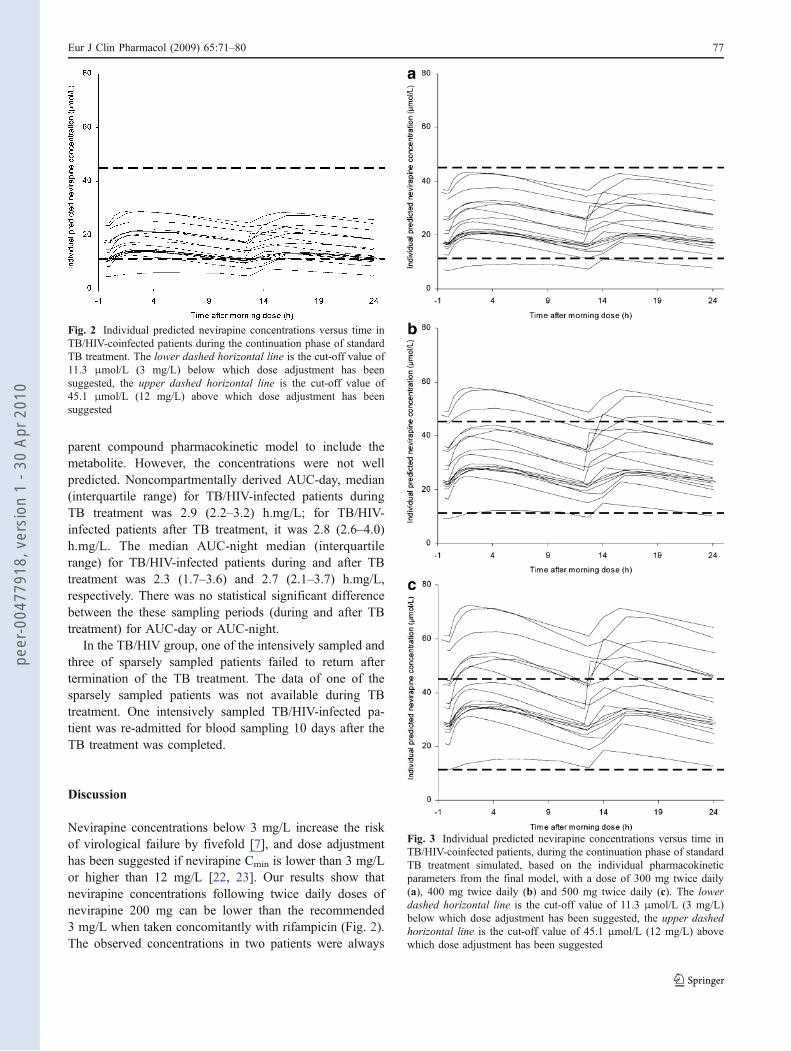
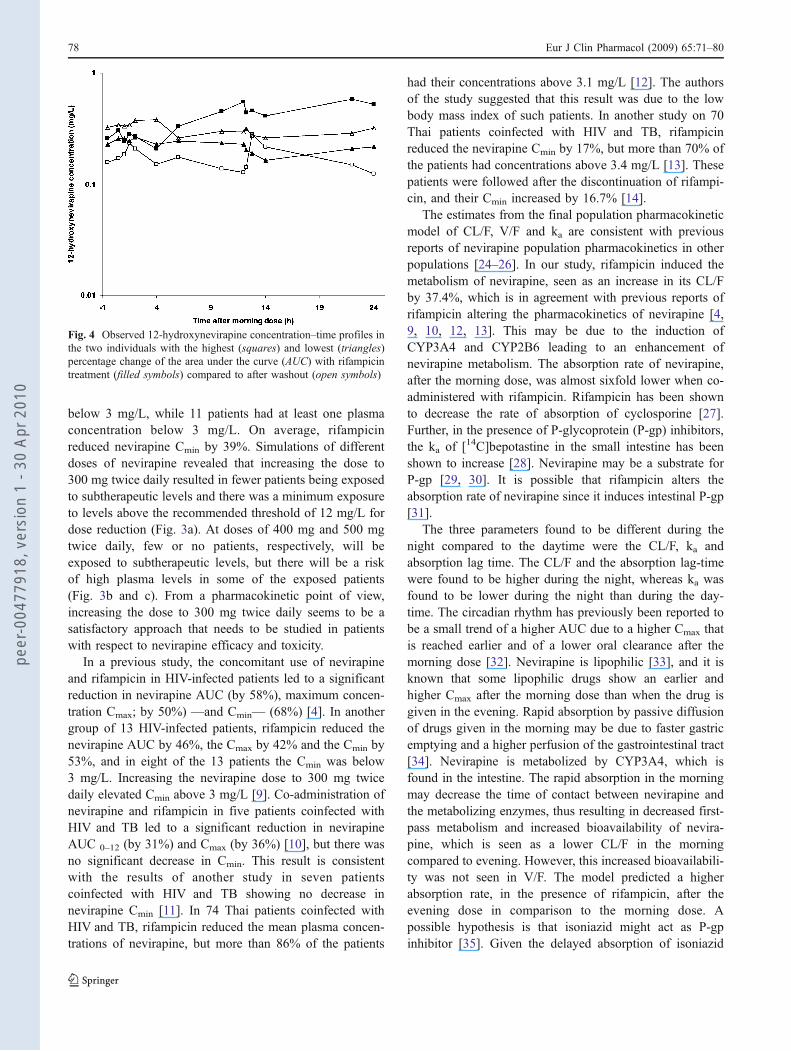
Of the four analysed nevirapine metabolites, namely 2-,3-, 8- and 12-hydroxynevirapine, only 12-hydroxynevir-apine was found in concentrations above the LLOQ of0.025 mg/L. Data for 12-hydroxynevirapine were onlyavailable from 16 intensively sampled TB/HIV-infectedpatients during and after TB treatment. There was noconsistent trend in the percentage change of individualAUC-day or AUC-night between these two samplingperiods. In some patients, the metabolite concentrationswere higher after TB treatment, and in some patients theywere lower. The concentration–time profiles of the twoindividuals with highest and lowest percentage change areshown in Fig. 4. Several attempts were made to extend the
Fig. 1 Observed nevirapine concentration compared to simulatedmedian and prediction interval of 1000 simulations in tuberculosis/human immunovirus (TB/HIV)-coinfected patients during the contin-uation phase of standard tuberculosis treatment (a), after completionof TB treatment and a washout period of more than 14 days (b) and inHIV-infected patients (c). Filled circles are the observed concen-trations. The highest and lowest dashed lines demarcate the 95%range of the observed concentrations, the middle dashed line is themedian of the observed concentrations. The highest and lowest dottedlines demarcate the simulated 95% nonparametric prediction interval,the middle dotted line is the median of the simulated predictioninterval
b
76 Eur J Clin Pharmacol (2009) 65:71–80
peer
-004
7791
8, v
ersi
on 1
- 30
Apr
201
0
parent compound pharmacokinetic model to include themetabolite. However, the concentrations were not wellpredicted. Noncompartmentally derived AUC-day, median(interquartile range) for TB/HIV-infected patients duringTB treatment was 2.9 (2.2–3.2) h.mg/L; for TB/HIV-infected patients after TB treatment, it was 2.8 (2.6–4.0)h.mg/L. The median AUC-night median (interquartilerange) for TB/HIV-infected patients during and after TBtreatment was 2.3 (1.7–3.6) and 2.7 (2.1–3.7) h.mg/L,respectively. There was no statistical significant differencebetween the these sampling periods (during and after TBtreatment) for AUC-day or AUC-night.
In the TB/HIV group, one of the intensively sampled andthree of sparsely sampled patients failed to return aftertermination of the TB treatment. The data of one of thesparsely sampled patients was not available during TBtreatment. One intensively sampled TB/HIV-infected pa-tient was re-admitted for blood sampling 10 days after theTB treatment was completed.
Discussion
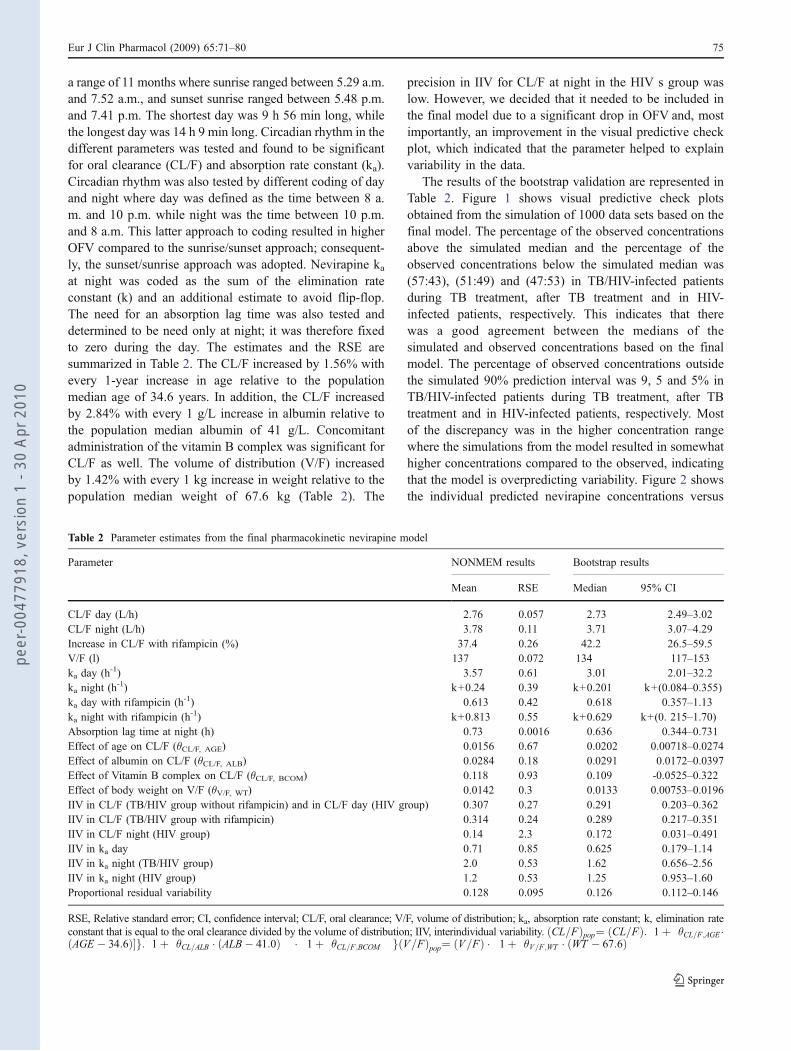
Nevirapine concentrations below 3 mg/L increase the riskof virological failure by fivefold [7], and dose adjustmenthas been suggested if nevirapine Cmin is lower than 3 mg/Lor higher than 12 mg/L [22, 23]. Our results show thatnevirapine concentrations following twice daily doses ofnevirapine 200 mg can be lower than the recommended3 mg/L when taken concomitantly with rifampicin (Fig. 2).The observed concentrations in two patients were always
Fig. 2 Individual predicted nevirapine concentrations versus time inTB/HIV-coinfected patients during the continuation phase of standardTB treatment. The lower dashed horizontal line is the cut-off value of11.3 μmol/L (3 mg/L) below which dose adjustment has beensuggested, the upper dashed horizontal line is the cut-off value of45.1 μmol/L (12 mg/L) above which dose adjustment has beensuggested
Fig. 3 Individual predicted nevirapine concentrations versus time inTB/HIV-coinfected patients, during the continuation phase of standardTB treatment simulated, based on the individual pharmacokineticparameters from the final model, with a dose of 300 mg twice daily(a), 400 mg twice daily (b) and 500 mg twice daily (c). The lowerdashed horizontal line is the cut-off value of 11.3 μmol/L (3 mg/L)below which dose adjustment has been suggested, the upper dashedhorizontal line is the cut-off value of 45.1 μmol/L (12 mg/L) abovewhich dose adjustment has been suggested
Eur J Clin Pharmacol (2009) 65:71–80 77
peer
-004
7791
8, v
ersi
on 1
- 30
Apr
201
0
below 3 mg/L, while 11 patients had at least one plasmaconcentration below 3 mg/L. On average, rifampicinreduced nevirapine Cmin by 39%. Simulations of differentdoses of nevirapine revealed that increasing the dose to300 mg twice daily resulted in fewer patients being exposedto subtherapeutic levels and there was a minimum exposureto levels above the recommended threshold of 12 mg/L fordose reduction (Fig. 3a). At doses of 400 mg and 500 mgtwice daily, few or no patients, respectively, will beexposed to subtherapeutic levels, but there will be a riskof high plasma levels in some of the exposed patients(Fig. 3b and c). From a pharmacokinetic point of view,increasing the dose to 300 mg twice daily seems to be asatisfactory approach that needs to be studied in patientswith respect to nevirapine efficacy and toxicity.
In a previous study, the concomitant use of nevirapineand rifampicin in HIV-infected patients led to a significantreduction in nevirapine AUC (by 58%), maximum concen-tration Cmax; by 50%) —and Cmin— (68%) [4]. In anothergroup of 13 HIV-infected patients, rifampicin reduced thenevirapine AUC by 46%, the Cmax by 42% and the Cmin by53%, and in eight of the 13 patients the Cmin was below3 mg/L. Increasing the nevirapine dose to 300 mg twicedaily elevated Cmin above 3 mg/L [9]. Co-administration ofnevirapine and rifampicin in five patients coinfected withHIV and TB led to a significant reduction in nevirapineAUC 0–12 (by 31%) and Cmax (by 36%) [10], but there wasno significant decrease in Cmin. This result is consistentwith the results of another study in seven patientscoinfected with HIV and TB showing no decrease innevirapine Cmin [11]. In 74 Thai patients coinfected withHIV and TB, rifampicin reduced the mean plasma concen-trations of nevirapine, but more than 86% of the patients
had their concentrations above 3.1 mg/L [12]. The authorsof the study suggested that this result was due to the lowbody mass index of such patients. In another study on 70Thai patients coinfected with HIV and TB, rifampicinreduced the nevirapine Cmin by 17%, but more than 70% ofthe patients had concentrations above 3.4 mg/L [13]. Thesepatients were followed after the discontinuation of rifampi-cin, and their Cmin increased by 16.7% [14].
The estimates from the final population pharmacokineticmodel of CL/F, V/F and ka are consistent with previousreports of nevirapine population pharmacokinetics in otherpopulations [24–26]. In our study, rifampicin induced themetabolism of nevirapine, seen as an increase in its CL/Fby 37.4%, which is in agreement with previous reports ofrifampicin altering the pharmacokinetics of nevirapine [4,9, 10, 12, 13]. This may be due to the induction ofCYP3A4 and CYP2B6 leading to an enhancement ofnevirapine metabolism. The absorption rate of nevirapine,after the morning dose, was almost sixfold lower when co-administered with rifampicin. Rifampicin has been shownto decrease the rate of absorption of cyclosporine [27].Further, in the presence of P-glycoprotein (P-gp) inhibitors,the ka of [14C]bepotastine in the small intestine has beenshown to increase [28]. Nevirapine may be a substrate forP-gp [29, 30]. It is possible that rifampicin alters theabsorption rate of nevirapine since it induces intestinal P-gp[31].
The three parameters found to be different during thenight compared to the daytime were the CL/F, ka andabsorption lag time. The CL/F and the absorption lag-timewere found to be higher during the night, whereas ka wasfound to be lower during the night than during the day-time. The circadian rhythm has previously been reported tobe a small trend of a higher AUC due to a higher Cmax thatis reached earlier and of a lower oral clearance after themorning dose [32]. Nevirapine is lipophilic [33], and it isknown that some lipophilic drugs show an earlier andhigher Cmax after the morning dose than when the drug isgiven in the evening. Rapid absorption by passive diffusionof drugs given in the morning may be due to faster gastricemptying and a higher perfusion of the gastrointestinal tract[34]. Nevirapine is metabolized by CYP3A4, which isfound in the intestine. The rapid absorption in the morningmay decrease the time of contact between nevirapine andthe metabolizing enzymes, thus resulting in decreased first-pass metabolism and increased bioavailability of nevira-pine, which is seen as a lower CL/F in the morningcompared to evening. However, this increased bioavailabili-ty was not seen in V/F. The model predicted a higherabsorption rate, in the presence of rifampicin, after theevening dose in comparison to the morning dose. Apossible hypothesis is that isoniazid might act as P-gpinhibitor [35]. Given the delayed absorption of isoniazid
Fig. 4 Observed 12-hydroxynevirapine concentration–time profiles inthe two individuals with the highest (squares) and lowest (triangles)percentage change of the area under the curve (AUC) with rifampicintreatment (filled symbols) compared to after washout (open symbols)
78 Eur J Clin Pharmacol (2009) 65:71–80
peer
-004
7791
8, v
ersi
on 1
- 30
Apr
201
0
[36], isoniazid could increase nevirapine absorption since itwas given once daily with the morning dose of nevirapineand not at night.
Enterohepatic recycling of nevirapine has been shown inrats [37] and is suggested to be present in humans due tothe presence of a second peak concentration following theadministration of oral and intravenous single doses [32, 38,39]. In this study, a second peak concentration was seen insome patients, but not in others who may have eaten attimes different from the sampling times. Therefore ,theimplementation of an enterohepatic recycling model wasjudged not to be possible.
In the final model, albumin was found to be a predictorof variability in CL/F, where CL/F increased by 2.84% withevery 1 g/L increase in albumin relative to the populationmedian albumin of 41 g/L. Human immunodeficiencyvirus-infected patients suffer from altered metabolism,specific disturbances in protein turnover and weight loss[40]. Consequently, weight and albumin level seem toreflect metabolic disturbances, and a positive correlationbetween albumin and weight has been found in HIV-infected patients [41]. An increase in clearance with weighthas been reported [25, 42], but the inclusion of weight inthe model did not explain variability in CL/F, neither as theonly covariate for CL/F or in combination with othercovariates. Weight was therefore not included in the finalmodel as a predictor of variability in CL/F. A lack ofrelationship between weight and nevirapine pharmacoki-netics has also been seen in other studies [13, 24, 26, 43].Age was also found to be a predictor of variability in CL/F,where CL/F increased by 1.56% with every 1-year increasein age relative to the population median age of 34.6 years.
The biotransformation rate of 12-hydroxynevirapine isbest correlated with CYP3A4 although other enzymes areinvolved, including CYP2D6 and CYP2C9 at clinicallyrelevant nevirapine concentrations [44]. There was nodifference in the AUC values of 12-hydroxynevirapinewith or without rifampicin treatment. This may beattributed to the different expression of enzymatic activityamong patients. Since 12-hydroxynevirapine is metabolizedby several enzymes, net enzymatic activity in each patientand, therefore, the effect of rifampicin on the CYP3A4formation pathway of 12-hydroxynevirapine might explainthe lack of trend.
In conclusion, the model presented here adequatelydescribed the population pharmacokinetics of nevirapinein South African HIV-infected patients in the absence andpresence of TB infection and concomitant administration ofrifampicin. Concomitant administration of nevirapine andrifampicin enhances the oral clearance of nevirapine andslows down its absorption, resulting in potentially sub-therapeutic levels in some patients. Increasing the dose ofnevirapine to 300 mg twice daily seems to elevate low
concentrations to a value above the clinical threshold of3 mg/mL, with minimum exposure levels above 12 mg/L.
Acknowledgements Funding for the study was received fromMédecins Sans Frontières, South Africa and the South AfricanNational Department of Health, Research programme for the opera-tional plan for comprehensive HIV and AIDS care, treatment andmanagement for South Africa.
The study was performed in compliance with South African laws.The authors would like to thank Dr. Justin Wilkins for his help withformatting the visual predictive check plots.
References
1. Sharma SK, Mohan A, Kadhiravan T (2005) HIV-TB coinfection:epidemiology, diagnosis & management. Indian J Med Res 121(4):550–567
2. Corbett EL, Watt CJ, Walker N, Maher D, Williams BG,Raviglione MC, Dye C (2003) The growing burden of tubercu-losis: global trends and interactions with the HIV epidemic. ArchIntern Med 163(9):1009–1021
3. Lamson M, MacGregor T, Riska P, Erickson D, Maxfield P,Rowland L, Gigliotti M, Robinson P, Azzam S, Keirns J (1999)Nevirapine induces both CYP3A4 and CYP2B6 metabolic path-ways. Clin Pharmacol Ther 65(2):137
4. Milinkovic A, Martinez E (2004) Nevirapine in the treatment ofHIV. Expert Rev Anti Infect Ther 2(3):367–373
5. Goodwin B, Moore LB, Stoltz CM, McKee DD, Kliewer SA(2001) Regulation of the human CYP2B6 gene by the nuclearpregnane X receptor. Mol Pharmacol 60(3):427–431
6. Rae JM, Johnson MD, Lippman ME, Flockhart DA (2001)Rifampin is a selective, pleiotropic inducer of drug metabolismgenes in human hepatocytes: studies with cDNA and oligonucleo-tide expression arrays. J Pharmacol Exp Ther 299(3):849–857
7. de Vries-Sluijs TE, Dieleman JP, Arts D, Huitema AD, BeijnenJH, Schutten M, van der Ende ME (2003) Low nevirapine plasmaconcentrations predict virological failure in an unselected HIV-1-infected population. Clin Pharmacokinet 42(6):599–605
8. de Jong MD, Vella S, Carr A, Boucher CA, Imrie A, French M,Hoy J, Sorice S, Pauluzzi S, Chiodo F, Weverling GJ, van der EndeME, Frissen PJ, Weigel HM, Kauffmann RH, Lange JM, Yoon R,Moroni M, Hoenderdos E, Leitz G, Cooper DA, Hall D, Reiss P(1997) High-dose nevirapine in previously untreated human immu-nodeficiency virus type 1-infected persons does not result in sustainedsuppression of viral replication. J Infect Dis 175(4):966–970
9. Ramachandran G, Hemanthkumar AK, Rajasekaran S,Padmapriyadarsini C, Narendran G, Sukumar B, SathishnarayanS, Raja K, Kumaraswami V, Swaminathan S (2006) Increasingnevirapine dose can overcome reduced bioavailability due torifampicin coadministration. J Acquir Immune Defic Syndr 42(1):36–41
10. Ribera E, Pou L, Lopez RM, Crespo M, Falco V, Ocana I, Ruiz I,Pahissa A (2001) Pharmacokinetic interaction between nevirapineand rifampicin in HIV-infected patients with tuberculosis. J AcquirImmune Defic Syndr 28(5):450–453
11. Dean GL, Back DJ, de Ruiter A (1999) Effect of tuberculosistherapy on nevirapine trough plasma concentrations. AIDS 13(17):2489–2490
12. Autar RS, Wit FW, Sankote J, Mahanontharit A, Anekthananon T,Mootsikapun P, Sujaikaew K, Cooper DA, Lange JM, PhanuphakP, Ruxrungtham K, Burger DM (2005) Nevirapine plasmaconcentrations and concomitant use of rifampin in patients
Eur J Clin Pharmacol (2009) 65:71–80 79
peer
-004
7791
8, v
ersi
on 1
- 30
Apr
201
0
coinfected with HIV-1 and tuberculosis. Antivir Ther 10(8):937–943
13. Manosuthi W, Sungkanuparph S, Thakkinstian A, Rattanasiri S,Chaovavanich A, Prasithsirikul W, Likanonsakul S, RuxrungthamK (2006) Plasma nevirapine levels and 24-week efficacy in HIV-infected patients receiving nevirapine-based highly active antire-troviral therapy with or without rifampicin. Clin Infect Dis 43(2):253–255
14. Manosuthi W, Ruxrungtham K, Likanonsakul S, Prasithsirikul W,Inthong Y, Phoorisri T, Sungkanuparph S (2007) Nevirapinelevels after discontinuation of rifampicin therapy and 60-weekefficacy of nevirapine-based antiretroviral therapy in HIV-infectedpatients with tuberculosis. Clin Infect Dis 44(1):141–144
15. Riska P, Lamson M, MacGregor T, Sabo J, Hattox S, Pav J,Keirns J (1999) Disposition and biotransformation of theantiretroviral drug nevirapine in humans. Drug Metab Dispos 27(8):895–901
16. Uetrecht J (2005) Role of drug metabolism for breaking toleranceand the localization of drug hypersensitivity. Toxicology 209(2):113–118
17. Cohen K, van Cutsem G, Boulle A, McIlleron H, Goemaere E,Smith PJ, Maartens G (2008) Effect of rifampicin-based anti-tubercular therapy on nevirapine plasma concentrations in SouthAfrican adults with HIV-associated tuberculosis. J AntimicrobChemother 61(2):389–393
18. Chi J, Jayewardene AL, Stone JA, Aweeka FT (2003) An LC-MS-MS method for the determination of nevirapine, a non-nucleosidereverse transcriptase inhibitor, in human plasma. J Pharm BiomedAnal 31(5):953–959
19. Beal SL, Sheiner LS (1994) NONMEM user’s guide. NONMEM ProjectGroup, University of California at San Fransisco, San Fransisco
20. Jonsson EN, Karlsson MO (1999) XPOSE- and S-PLUS-basedpopulation pharmacokinetic/pharmacodynamic model building aidfor NONMEM. Comput Methods Programs Biomed 58(1):51–64
21. Ette EI (1997) Stability and performance of a populationpharmacokinetic model. J Clin Pharmacol 37(6):486–495
22. HIVPharmcology (2006) Optimising TDM in HIV clinical care.Virology Education BV, Utrecht, the Netherlands. http://hivpharmacology.production.tdclighthouse.com/content.cfm?lang=1&id=573&id2=639&ch=4&cid=639. Accessed 05 Nov 2007
23. Kappelhoff BS, Crommentuyn KM, de Maat MM, Mulder JW,Huitema AD, Beijnen JH (2004) Practical guidelines to interpretplasma concentrations of antiretroviral drugs. Clin Pharmacokinet43(13):845–853
24. Sabo JP, Lamson MJ, Leitz G, Yong CL, MacGregor TR (2000)Pharmacokinetics of nevirapine and lamivudine in patients withHIV-1 infection. AAPS PharmSci 2(1):E1
25. de Maat MM, Huitema AD, Mulder JW, Meenhorst PL, van GorpEC, Beijnen JH (2002) Population pharmacokinetics of nevirapinein an unselected cohort of HIV-1-infected individuals. Br J ClinPharmacol 54(4):378–385
26. Zhou XJ, Sheiner LB, D’Aquila RT, Hughes MD, Hirsch MS,Fischl MA, Johnson VA, Myers M, Sommadossi JP (1999)Population pharmacokinetics of nevirapine, zidovudine, anddidanosine in human immunodeficiency virus-infected patients.The National Institute of Allergy and Infectious Diseases AIDSClinical Trials Group Protocol 241 Investigators. AntimicrobAgents Chemother 43(1):121–128
27. Benet LZ, Izumi T, Zhang Y, Silverman JA, Wacher VJ (1999)Intestinal MDR transport proteins and P-450 enzymes as barriersto oral drug delivery. J Control Release 62(1–2):25–31
28. Ohashi R, Kamikozawa Y, Sugiura M, Fukuda H, Yabuuchi H,Tamai I (2006) Effect of P-glycoprotein on intestinal absorption
and brain penetration of antiallergic agent bepotastine besilate.Drug Metab Dispos 34(5):793–799
29. Almond LM, Edirisinghe D, Dalton M, Bonington A, Back DJ,Khoo SH (2005) Intracellular and plasma pharmacokinetics ofnevirapine in human immunodeficiency virus-infected individuals.Clin Pharmacol Ther 78(2):132–142
30. Haas DW, Bartlett JA, Andersen JW, Sanne I, Wilkinson GR,Hinkle J, Rousseau F, Ingram CD, Shaw A, Lederman MM, KimRB (2006) Pharmacogenetics of nevirapine-associated hepatotoxi-city: an Adult AIDS Clinical Trials Group collaboration. ClinInfect Dis 43(6):783–786
31. Sun J, He ZG, Cheng G, Wang SJ, Hao XH, Zou MJ (2004)Multidrug resistance P-glycoprotein: crucial significance in drugdisposition and interaction. Med Sci Monit 10(1):RA5–RA14
32. van Heeswijk RP, Veldkamp AI, Mulder JW, Meenhorst PL, WitFW, Lange JM, Danner SA, Foudraine NA, Kwakkelstein MO,Reiss P, Beijnen JH, Hoetelmans RM (2000) The steady-statepharmacokinetics of nevirapine during once daily and twice dailydosing in HIV-1-infected individuals. AIDS 14(8):F77–82
33. Glynn SL, Yazdanian M (1998) In vitro blood-brain barrierpermeability of nevirapine compared to other HIV antiretroviralagents. J Pharm Sci 87(3):306–310
34. Lemmer B (1999) Chronopharmacokinetics: implications for drugtreatment. J Pharm Pharmacol 51(8):887–890
35. Zhou S, Chan E, Lim LY, Boelsterli UA, Li SC, Wang J, Zhang Q,Huang M, Xu A (2004) Therapeutic drugs that behave asmechanism-based inhibitors of cytochrome P450 3A4. Curr DrugMetab 5(5):415–442
36. Wilkins JJ, Langdon G, McIlleron H, Pillai G, Smith PJ,Simonsson USH (2005) Challenges in modelling the pharmaco-kinetics of isoniazid in South African tuberculosis patients (abstr769). Available at http://www.page-meeting.org/?abstract=769]
37. Norris SH, Silverstein HH, St. George RL, Johnstone JN (1992)Nevirapine, an HIV-1 reverse transcriptase inhibitor: absorption,distribution and execretion in rats. Pharm Res 9:S263
38. Cheeseman SH, Hattox SE, McLaughlin MM, Koup RA,Andrews C, Bova CA, Pav JW, Roy T, Sullivan JL, Keirns JJ(1993) Pharmacokinetics of nevirapine: initial single-rising-dosestudy in humans. Antimicrob Agents Chemother 37(2):178–182
39. Lamson MJ, Sabo JP, MacGregor TR, Pav JW, Rowland L, HawiA, Cappola M, Robinson P (1999) Single dose pharmacokineticsand bioavailability of nevirapine in healthy volunteers. BiopharmDrug Dispos 20(6):285–291
40. Salomon J, de Truchis P, Melchior JC (2002) Body compositionand nutritional parameters in HIV and AIDS patients. Clin ChemLab Med 40(12):1329–1333
41. Olawumi HO, Olatunji PO (2006) The value of serum albumin inpretreatment assessment and monitoring of therapy in HIV/AIDSpatients. HIV Med 7(6):351–355
42. von Hentig N, Carlebach A, Gute P, Knecht G, Klauke S,Rohrbacher M, Stocker H, Kurowski M, Harder S, Staszewski S,Haberl A (2006) A comparison of the steady-state pharmacoki-netics of nevirapine in men, nonpregnant women and women inlate pregnancy. Br J Clin Pharmacol 62(5):552–559
43. Dailly E, Billaud E, Reliquet V, Breurec S, Perre P, Leautez S,Jolliet P, Bourin M, Raffi F (2004) No relationship between highnevirapine plasma concentration and hepatotoxicity in HIV-1-infected patients naive of antiretroviral treatment or switched fromprotease inhibitors. Eur J Clin Pharmacol 60(5):343–348
44. Erickson DA, Mather G, Trager WF, Levy RH, Keirns JJ (1999)Characterization of the in vitro biotransformation of the HIV-1reverse transcriptase inhibitor nevirapine by human hepaticcytochromes P-450. Drug Metab Dispos 27(12):1488–1495
80 Eur J Clin Pharmacol (2009) 65:71–80
peer
-004
7791
8, v
ersi
on 1
- 30
Apr
201
0
Copyright © 2022 FDOKUMEN