
Persistent Effect Test and Internal Microscopic Monitoring for ...
14
micromachines Article Persistent Effect Test and Internal Microscopic Monitoring for PEM Water Electrolyzer Chi-Yuan Lee 1, *, Chia-Hung Chen 2 , Guo-Bin Jung 1 , Yu-Xiang Zheng 1 and Yi-Cheng Liu 1 Citation: Lee, C.-Y.; Chen, C.-H.; Jung, G.-B.; Zheng, Y.-X.; Liu, Y.-C. Persistent Effect Test and Internal Microscopic Monitoring for PEM Water Electrolyzer. Micromachines 2021, 12, 494. https://doi.org/ 10.3390/mi12050494 Academic Editors: Cheng-Hsin Chuang and Yi Chiu Received: 31 March 2021 Accepted: 21 April 2021 Published: 27 April 2021 Publisher’s Note: MDPI stays neutral with regard to jurisdictional claims in published maps and institutional affil- iations. Copyright: © 2021 by the authors. Licensee MDPI, Basel, Switzerland. This article is an open access article distributed under the terms and conditions of the Creative Commons Attribution (CC BY) license (https:// creativecommons.org/licenses/by/ 4.0/). 1 Yuan Ze Fuel Cell Center, Department of Mechanical Engineering, Yuan Ze University, Taoyuan 32003, Taiwan; [email protected] (G.-B.J.); [email protected] (Y.-X.Z.); [email protected] (Y.-C.L.) 2 HOMYTECH Global Co., Ltd., Taoyuan 33464, Taiwan; [email protected] * Correspondence: [email protected] Abstract: As the environmental considerations rise all over the world and under the drive of renewable energy policy, the society of hydrogen energy will come out gradually in the future. The proton exchange membrane water electrolyzer (PEMWE) is a very good hydrogen generator, characterized by low cost, high efficiency and zero emission of greenhouse gases. In this study, the micro temperature, humidity, flow, pressure, voltage, and current sensors were successfully integrated on a 50 μm thick Polyimide (PI) substrate by using micro-electro-mechanical systems (MEMS) technology. After the optimal design and process optimization of the flexible 6-in-1 microsensor, it was embedded in the PEMWE for a 500-h persistent effect test and internal real-time microscopic monitoring. Keywords: PEM water electrolysis cell stack; accelerated aging; flexible integrated microsensor; microscopic diagnosis 1. Introduction In recent years, various countries have been paying attention to the issue of environ- mental protection, relieving climate change is the main challenge to the energy policies of the developed countries. At the present stage, human civilization severely depends on fossil energy, which releases greenhouse gases and other pollutants, it is the major factor in global warming [1,2]. During 1971~2020, fossil fuel was in the majority of the fuels for electricity generation. In 2019, the low-carbon electricity exceeded coal, but the IEA (International Energy Agency) still emphasized that low-carbon energy should be expanded greatly [3]. In 2008, the world went through an economic tsunami while the oil price rose high (Hirscher, 2009), maintaining and expanding prosperous civilization need a considerable energy supply, depending on a few oil-exporting countries will bring enormous risks to human economy. According to the current consumption levels, fossil fuel will remain at a high price. The present fossil fuel reserves can supply petroleum for at most 40 years, natural gas for 60 years, and coal for 156 years [4]. Shortages will come soon if the consumption is not reduced [2–8]. The shale oil regarded as the petroleum substitute may result in water pollution, high mining cost, high technical difficulty, and high energy consumption problems [9]. Using renewable natural energy resource flow to power the society, separating from the exhausting energy reserves is the current target of the energy circle in the established policy scenario of sustainable development [7]. Taiwan has listed green energy technology as one of the “5 + 2” industrial innovation programs, the photovoltaic and wind power generations are the most critical development projects, aiming to make renewable energy account for 20% of power generation in 2025. For wind power generation, the Ministry of Economic Affairs has formulated a “4-Year Promotion Plan for Wind Power Generation”, planning to push the foundation of wind Micromachines 2021, 12, 494. https://doi.org/10.3390/mi12050494 https://www.mdpi.com/journal/micromachines
-
Upload
khangminh22 -
Category
Documents
-
view
1 -
download
0
Transcript of Persistent Effect Test and Internal Microscopic Monitoring for ...
micromachines
Article
Persistent Effect Test and Internal Microscopic Monitoring forPEM Water Electrolyzer
Chi-Yuan Lee 1,*, Chia-Hung Chen 2, Guo-Bin Jung 1, Yu-Xiang Zheng 1 and Yi-Cheng Liu 1
Citation: Lee, C.-Y.; Chen, C.-H.;
Jung, G.-B.; Zheng, Y.-X.; Liu, Y.-C.
Persistent Effect Test and Internal
Microscopic Monitoring for PEM
Water Electrolyzer. Micromachines
2021, 12, 494. https://doi.org/
10.3390/mi12050494
Academic Editors:
Cheng-Hsin Chuang and Yi Chiu
Received: 31 March 2021
Accepted: 21 April 2021
Published: 27 April 2021
Publisher’s Note: MDPI stays neutral
with regard to jurisdictional claims in
published maps and institutional affil-
iations.
Copyright: © 2021 by the authors.
Licensee MDPI, Basel, Switzerland.
This article is an open access article
distributed under the terms and
conditions of the Creative Commons
Attribution (CC BY) license (https://
creativecommons.org/licenses/by/
4.0/).
1 Yuan Ze Fuel Cell Center, Department of Mechanical Engineering, Yuan Ze University,Taoyuan 32003, Taiwan; [email protected] (G.-B.J.); [email protected] (Y.-X.Z.);[email protected] (Y.-C.L.)
2 HOMYTECH Global Co., Ltd., Taoyuan 33464, Taiwan; [email protected]* Correspondence: [email protected]
Abstract: As the environmental considerations rise all over the world and under the drive ofrenewable energy policy, the society of hydrogen energy will come out gradually in the future.The proton exchange membrane water electrolyzer (PEMWE) is a very good hydrogen generator,characterized by low cost, high efficiency and zero emission of greenhouse gases. In this study, themicro temperature, humidity, flow, pressure, voltage, and current sensors were successfully integratedon a 50 µm thick Polyimide (PI) substrate by using micro-electro-mechanical systems (MEMS)technology. After the optimal design and process optimization of the flexible 6-in-1 microsensor, itwas embedded in the PEMWE for a 500-h persistent effect test and internal real-time microscopicmonitoring.
Keywords: PEM water electrolysis cell stack; accelerated aging; flexible integrated microsensor;microscopic diagnosis
1. Introduction
In recent years, various countries have been paying attention to the issue of environ-mental protection, relieving climate change is the main challenge to the energy policiesof the developed countries. At the present stage, human civilization severely dependson fossil energy, which releases greenhouse gases and other pollutants, it is the majorfactor in global warming [1,2]. During 1971~2020, fossil fuel was in the majority of thefuels for electricity generation. In 2019, the low-carbon electricity exceeded coal, but theIEA (International Energy Agency) still emphasized that low-carbon energy should beexpanded greatly [3].
In 2008, the world went through an economic tsunami while the oil price rose high(Hirscher, 2009), maintaining and expanding prosperous civilization need a considerableenergy supply, depending on a few oil-exporting countries will bring enormous risks tohuman economy. According to the current consumption levels, fossil fuel will remainat a high price. The present fossil fuel reserves can supply petroleum for at most 40years, natural gas for 60 years, and coal for 156 years [4]. Shortages will come soon ifthe consumption is not reduced [2–8]. The shale oil regarded as the petroleum substitutemay result in water pollution, high mining cost, high technical difficulty, and high energyconsumption problems [9]. Using renewable natural energy resource flow to power thesociety, separating from the exhausting energy reserves is the current target of the energycircle in the established policy scenario of sustainable development [7].
Taiwan has listed green energy technology as one of the “5 + 2” industrial innovationprograms, the photovoltaic and wind power generations are the most critical developmentprojects, aiming to make renewable energy account for 20% of power generation in 2025.For wind power generation, the Ministry of Economic Affairs has formulated a “4-YearPromotion Plan for Wind Power Generation”, planning to push the foundation of wind
Micromachines 2021, 12, 494. https://doi.org/10.3390/mi12050494 https://www.mdpi.com/journal/micromachines

Micromachines 2021, 12, 494 2 of 14
power generation and promote energy diversification and autonomous supply of electric-ity [10]. However, solar energy or wind energy has a fatal problem, i.e., unstable powersupply. Therefore, energy storage devices will play a leading part. The lithium batteryextensively used in current energy storage devices has several problems. The lithium usedin the lithium battery is a scarce resource, a high consumption has a high cost, it is unsuit-able for large energy storage devices. The leakage of electrolyte may induce combustion,even explosion. Hydrogen energy is one of the optimal energy storage systems of greenenergy [11]. The proton exchange membrane (PEM) water electrolysis cell stack has manyadvantages, such as less corrosivity, it can be operated at a lower voltage, higher currentdensity and higher temperature and pressure, so as to increase efficiency (80–90%). Inresponse to these policies and trends, this research intends to develop a microsensor forreal-time wireless monitoring of PEMWE. After improving the flow channel of PEMWE,the performance of PEMWE will be increased, which can be used in homes, street lights,streets, etc. Solar power storage systems and even hydrogen exchange stations for hy-drogen energy transportation vehicles of PEM fuel cells are rushing to attack Taiwan’shydrogen energy market.
Müller et al. [12] studied different temperatures (60 C, 70 C, 80 C, 90 C) anddrag coefficients (1.0, 1.5, 2.0, 2.5) and the transmission relationship between Nafionmembrane thickness and water spreading. Fujimura et al. [13] studied the influence ofsurface wettability on hydrogen evolution reaction (HER) activity and efficiency. Saccardoet al. [14] attached different cations to the Nafion117-MEA (Membrane Electrode Assembly)membrane material surface, the experiment proved that humidity could influence the per-formance of MEA membrane material. Möckl et al. [15] built an internal heat transfer modelof PEMWE to perform experiments on heat transfer and flow control. The experimentsproved that flow control could effectively control the temperature difference betweenthe flow channel inlet and outlet in a specific range, preventing the MEA overheatingfailure. Ferrero et al. [16] studied the performance difference in PEM water electrolyzerwith different water flows, and found that high pressure resulted in higher performance,and low pressure resulted in lower performance. Grigoriev et al. [17] operated the PEMWEat a constant temperature of 85 C and different pressures, and found that the energyconsumption of water electrolysis could be reduced effectively by increasing pressureappropriately. Chakik et al. [18] tried different voltage conditions to find out the optimalconditions for producing hydrogen. Trinke et al. [19] tested the influence of the currentdensity on the oxygen flux in the cathode outlet with and without Pt catalyst. Sartoryet al. [20] operated a water electrolyzer in different working conditions, the result showedthat the higher the temperature was, the higher was the hydrogen production efficiency.
Responding to these policy trends and the bottleneck of internal diagnosis of PEMWE,this study uses MEMS technology to integrate micro voltage, current, temperature, humid-ity, flow, and pressure sensors on a 50 µm thick PI substrate, after the optimal design andprocess optimization of flexible 6-in-1 microsensor, it is embedded in the PEMWE for 500-hreal-time microscopic monitoring of internal persistent effect.
2. Sensing Principle of Flexible 6-in-1 Microsensor2.1. Micro Temperature Sensor
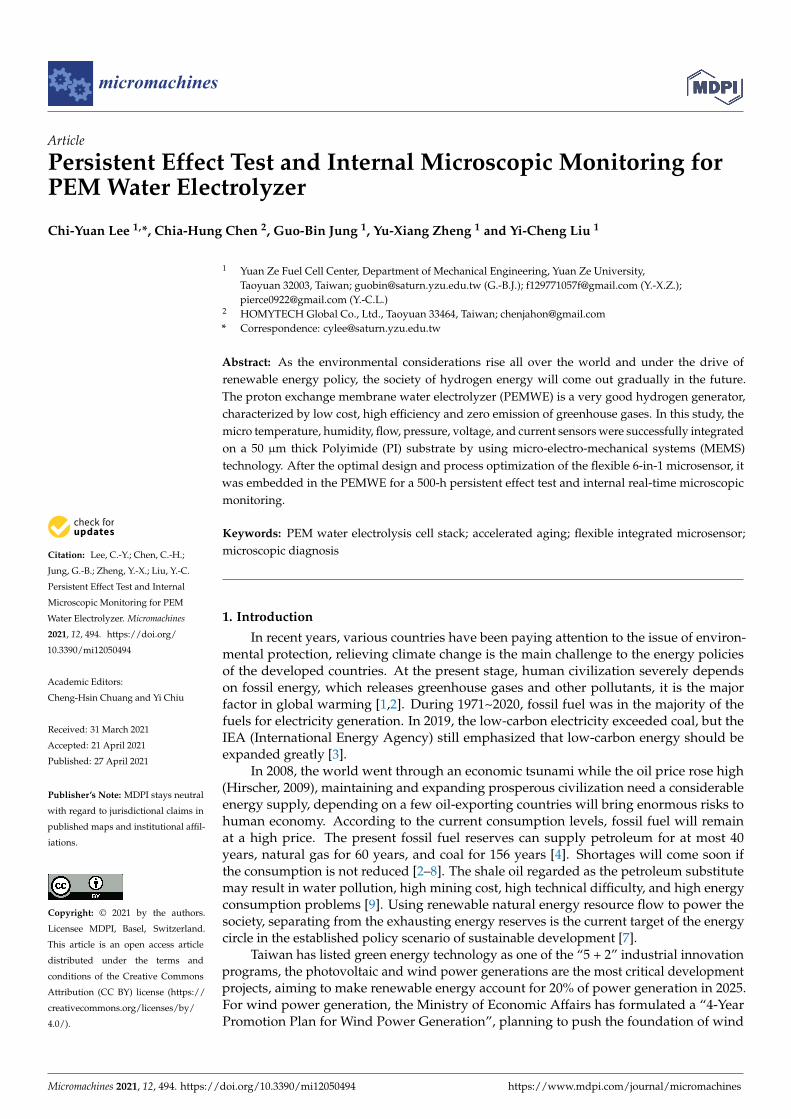
This study uses the resistive temperature sensing principle. In a certain temperaturerange, the resistance of metal changes due to temperature change. The sensor structureis shown in Figure 1. The Au is used as temperature-sensitive resistor material for stablechemical properties, simple process, and high linearity. The relation can be reduced toEquation (1).
Rt ≈ R0 (1 + α × ∆T) (1)
where Rt is the resistance (Ω) at t C; R0 is the resistance (Ω) at 0 C; α is the TCR (%/C);∆T is the temperature difference (C) [21].
Micromachines 2021, 12, 494 3 of 14
Micromachines 2021, 12, x FOR PEER REVIEW 3 of 24
where Rt is the resistance (Ω) at t °C; R0 is the resistance (Ω) at 0 °C; α is the TCR (%/°C); ΔT is the temperature difference (°C) [21].
Figure 1. Schematic diagram of resistive micro temperature sensor.
Figure 1. Schematic diagram of resistive micro temperature sensor.
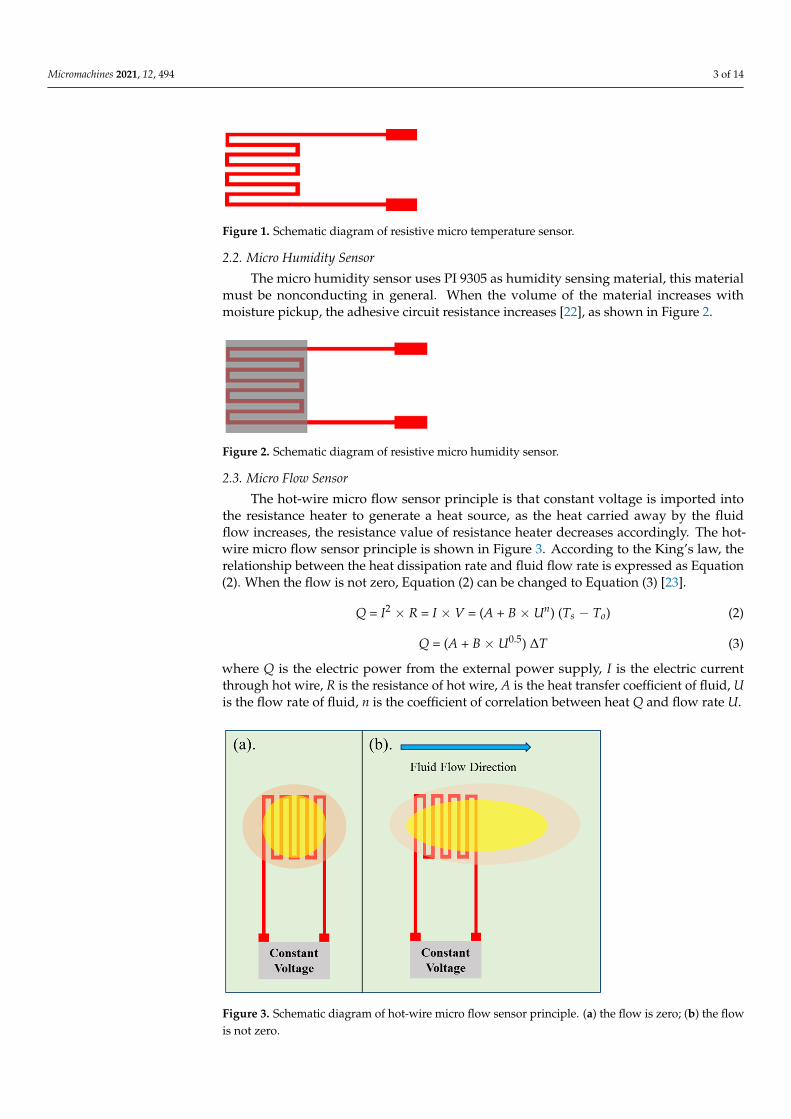
2.2. Micro Humidity Sensor
The micro humidity sensor uses PI 9305 as humidity sensing material, this materialmust be nonconducting in general. When the volume of the material increases withmoisture pickup, the adhesive circuit resistance increases [22], as shown in Figure 2.
Micromachines 2021, 12, x FOR PEER REVIEW 4 of 24
2.2. Micro Humidity Sensor The micro humidity sensor uses PI 9305 as humidity sensing material, this material
must be nonconducting in general. When the volume of the material increases with moisture pickup, the adhesive circuit resistance increases [22], as shown in Figure 2.
Figure 2. Schematic diagram of resistive micro humidity sensor.
Figure 2. Schematic diagram of resistive micro humidity sensor.
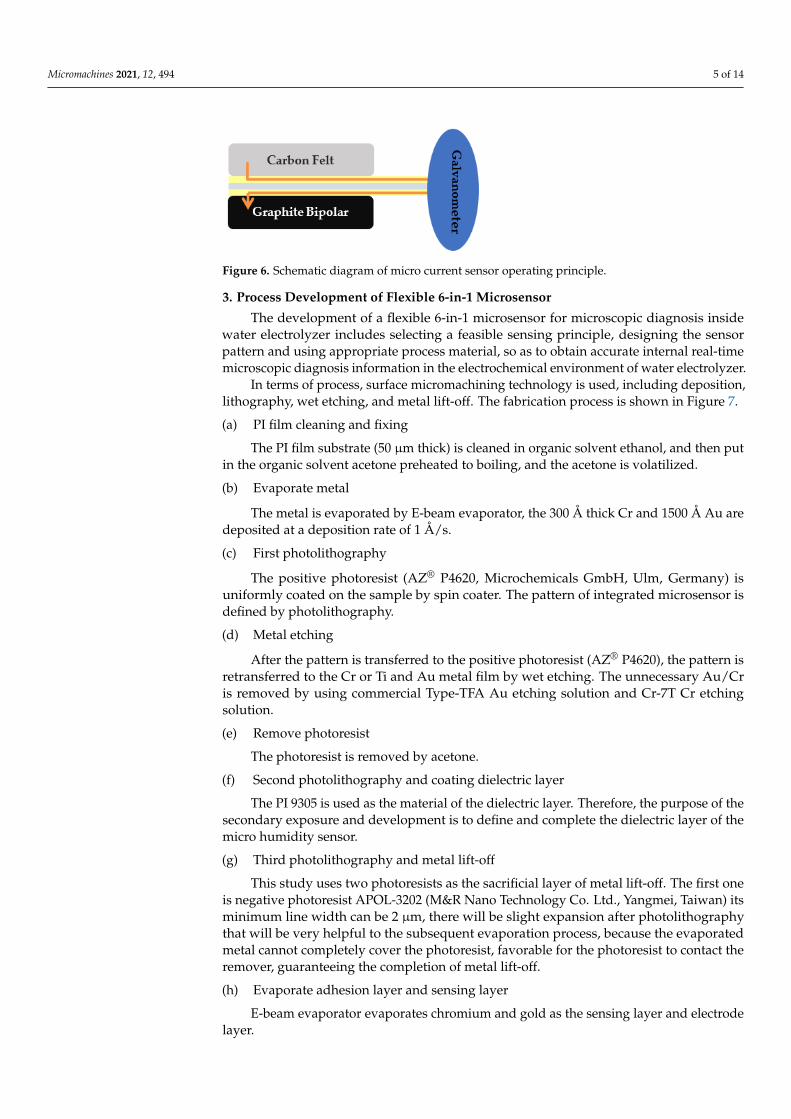
2.3. Micro Flow Sensor
The hot-wire micro flow sensor principle is that constant voltage is imported intothe resistance heater to generate a heat source, as the heat carried away by the fluidflow increases, the resistance value of resistance heater decreases accordingly. The hot-wire micro flow sensor principle is shown in Figure 3. According to the King’s law, therelationship between the heat dissipation rate and fluid flow rate is expressed as Equation(2). When the flow is not zero, Equation (2) can be changed to Equation (3) [23].
Q = I2 × R = I × V = (A + B × Un) (Ts − To) (2)
Q = (A + B × U0.5) ∆T (3)
where Q is the electric power from the external power supply, I is the electric currentthrough hot wire, R is the resistance of hot wire, A is the heat transfer coefficient of fluid, Uis the flow rate of fluid, n is the coefficient of correlation between heat Q and flow rate U.
Micromachines 2021, 12, x FOR PEER REVIEW 5 of 24
2.3. Micro Flow Sensor The hot-wire micro flow sensor principle is that constant voltage is imported into
the resistance heater to generate a heat source, as the heat carried away by the fluid flow increases, the resistance value of resistance heater decreases accordingly. The hot-wire micro flow sensor principle is shown in Figure 3. According to the King’s law, the rela-tionship between the heat dissipation rate and fluid flow rate is expressed as Equation (2). When the flow is not zero, Equation (2) can be changed to Equation (3) [23].
Q = I2× R = I × V = (A + B × Un) (Ts − To) (2)
Q = (A + B × U0.5) ΔT (3)
where Q is the electric power from the external power supply, I is the electric current through hot wire, R is the resistance of hot wire, A is the heat transfer coefficient of fluid, U is the flow rate of fluid, n is the coefficient of correlation between heat Q and flow rate U.
Figure 3. Schematic diagram of hot-wire micro flow sensor principle. (a) the flow is zero; (b) the flow is not zero.
Figure 3. Schematic diagram of hot-wire micro flow sensor principle. (a) the flow is zero; (b) the flowis not zero.

Micromachines 2021, 12, 494 4 of 14
2.4. Micro Pressure Sensor
The general capacitive pressure sensor is two parallel interlayered electrodes, sand-wiching a nonconducting dielectric layer to form a sandwich structure. The computingequation for the capacitance value between two parallel electrodes is Equation (4) [23].
∆C = εrε0A
∆d(4)
where ε0 is the constant 8.854 × 10⁻¹² (F/m), εr is the dielectric constant of material, Ais the projection overlapping area of two parallel electrodes, ∆d is the rate of change indistance between two electrodes.
The commercially available pressure sensor is a hollow structure, when it receivespressure, the thin film deformation is nonlinear, leading to poor sensor linearity andsensitivity. To solve the aforesaid problem, this study uses Fujifilm Durimide® PI 9305(FUJIFILM Electronic Materials Taiwan Co., Ltd., Hsin-Chu, Taiwan) with a high dielectricconstant and small E-modulus as a dielectric layer. When the solid dielectric layer ispressed, the stress and deformation are averaged, relatively matching linear Equation (4),the schematic diagram of a micro pressure sensor is shown in Figure 4.
Micromachines 2021, 12, x FOR PEER REVIEW 6 of 24
2.4. Micro Pressure Sensor The general capacitive pressure sensor is two parallel interlayered electrodes,
sandwiching a nonconducting dielectric layer to form a sandwich structure. The compu-ting equation for the capacitance value between two parallel electrodes is Equation (4) [23].
0rACd
ε εΔ =Δ
(4)
where ε0 is the constant 8.854 × 10⁻¹² (F/m), εr is the dielectric constant of material, A is the projection overlapping area of two parallel electrodes, Δd is the rate of change in distance between two electrodes.
The commercially available pressure sensor is a hollow structure, when it receives pressure, the thin film deformation is nonlinear, leading to poor sensor linearity and sensitivity. To solve the aforesaid problem, this study uses Fujifilm Durimide® PI 9305 (FUJIFILM Electronic Materials Taiwan Co., Ltd., Hsin-Chu, Taiwan) with a high dielec-tric constant and small E-modulus as a dielectric layer. When the solid dielectric layer is pressed, the stress and deformation are averaged, relatively matching linear Equation (4), the schematic diagram of a micro pressure sensor is shown in Figure 4.
Figure 4. Schematic diagram of micro pressure sensor.
Figure 4. Schematic diagram of micro pressure sensor.
2.5. Micro Voltage Sensor
This study uses a microminiaturized metal probe as a micro voltage sensor. Thesensing area of a micro voltage sensor and the link circuit board at the tail end of the sensorare exposed, the other part is insulated by the insulating layer of PI 9320, so as to detect thevoltage in local region [23], as shown in Figure 5.
Micromachines 2021, 12, x FOR PEER REVIEW 7 of 24
2.5. Micro Voltage Sensor This study uses a microminiaturized metal probe as a micro voltage sensor. The
sensing area of a micro voltage sensor and the link circuit board at the tail end of the sensor are exposed, the other part is insulated by the insulating layer of PI 9320, so as to detect the voltage in local region [23], as shown in Figure 5.
Figure 5. Schematic diagram of micro voltage sensor.
Figure 5. Schematic diagram of micro voltage sensor.
2.6. Micro Current Sensor
The same as the micro voltage sensor principle, this study uses a microminiaturizedmetal probe as micro current sensor, only detecting the current in local region [22], asshown in Figure 6.
Micromachines 2021, 12, 494 5 of 14
Micromachines 2021, 12, x FOR PEER REVIEW 8 of 24
2.6. Micro Current Sensor The same as the micro voltage sensor principle, this study uses a microminiaturized
metal probe as micro current sensor, only detecting the current in local region [22], as shown in Figure 6.
Figure 6. Schematic diagram of micro current sensor operating principle.
Figure 6. Schematic diagram of micro current sensor operating principle.
3. Process Development of Flexible 6-in-1 Microsensor
The development of a flexible 6-in-1 microsensor for microscopic diagnosis insidewater electrolyzer includes selecting a feasible sensing principle, designing the sensorpattern and using appropriate process material, so as to obtain accurate internal real-timemicroscopic diagnosis information in the electrochemical environment of water electrolyzer.
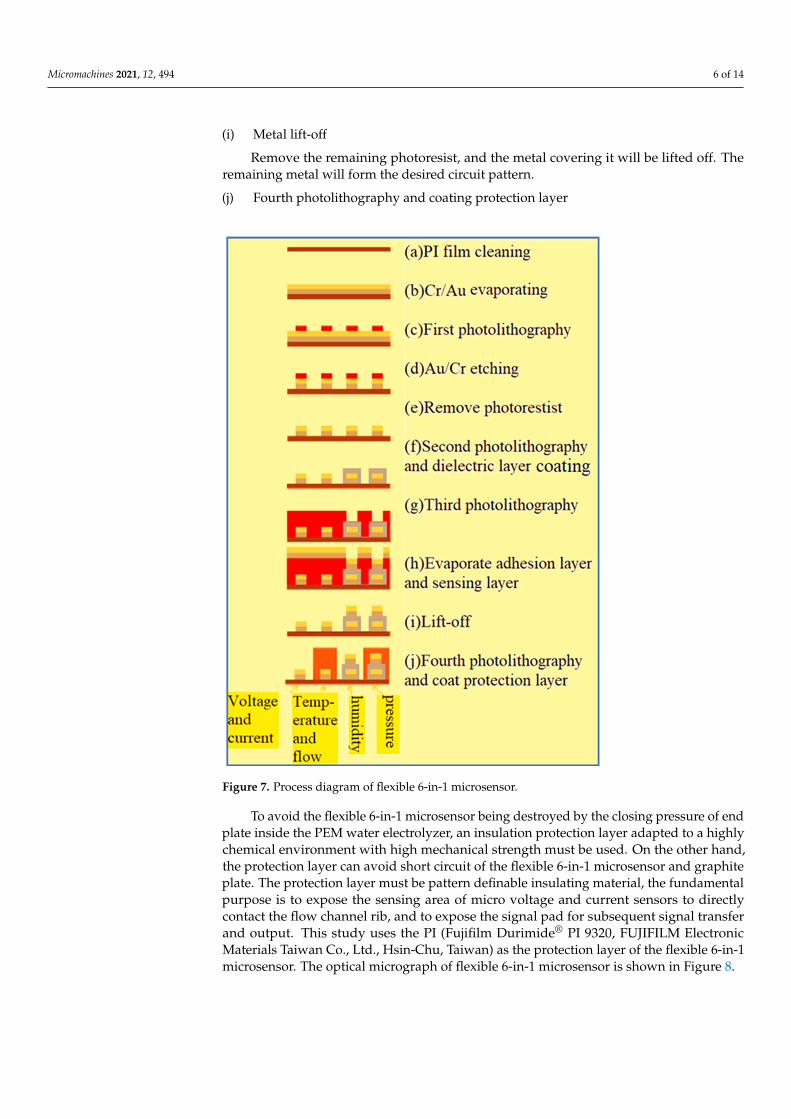
In terms of process, surface micromachining technology is used, including deposition,lithography, wet etching, and metal lift-off. The fabrication process is shown in Figure 7.
(a) PI film cleaning and fixing
The PI film substrate (50 µm thick) is cleaned in organic solvent ethanol, and then putin the organic solvent acetone preheated to boiling, and the acetone is volatilized.
(b) Evaporate metal
The metal is evaporated by E-beam evaporator, the 300 Å thick Cr and 1500 Å Au aredeposited at a deposition rate of 1 Å/s.
(c) First photolithography
The positive photoresist (AZ® P4620, Microchemicals GmbH, Ulm, Germany) isuniformly coated on the sample by spin coater. The pattern of integrated microsensor isdefined by photolithography.
(d) Metal etching
After the pattern is transferred to the positive photoresist (AZ® P4620), the pattern isretransferred to the Cr or Ti and Au metal film by wet etching. The unnecessary Au/Cris removed by using commercial Type-TFA Au etching solution and Cr-7T Cr etchingsolution.
(e) Remove photoresist
The photoresist is removed by acetone.
(f) Second photolithography and coating dielectric layer
The PI 9305 is used as the material of the dielectric layer. Therefore, the purpose of thesecondary exposure and development is to define and complete the dielectric layer of themicro humidity sensor.
(g) Third photolithography and metal lift-off
This study uses two photoresists as the sacrificial layer of metal lift-off. The first oneis negative photoresist APOL-3202 (M&R Nano Technology Co. Ltd., Yangmei, Taiwan) itsminimum line width can be 2 µm, there will be slight expansion after photolithographythat will be very helpful to the subsequent evaporation process, because the evaporatedmetal cannot completely cover the photoresist, favorable for the photoresist to contact theremover, guaranteeing the completion of metal lift-off.
(h) Evaporate adhesion layer and sensing layer
E-beam evaporator evaporates chromium and gold as the sensing layer and electrodelayer.
Micromachines 2021, 12, 494 6 of 14
(i) Metal lift-off
Remove the remaining photoresist, and the metal covering it will be lifted off. Theremaining metal will form the desired circuit pattern.
(j) Fourth photolithography and coating protection layerMicromachines 2021, 12, x FOR PEER REVIEW 10 of 24
Figure 7. Process diagram of flexible 6-in-1 microsensor.
To avoid the flexible 6-in-1 microsensor being destroyed by the closing pressure of end plate inside the PEM water electrolyzer, an insulation protection layer adapted to a highly chemical environment with high mechanical strength must be used. On the other hand, the protection layer can avoid short circuit of the flexible 6-in-1 microsensor and graphite plate. The protection layer must be pattern definable insulating material, the fundamental purpose is to expose the sensing area of micro voltage and current sensors to directly contact the flow channel rib, and to expose the signal pad for subsequent sig-nal transfer and output. This study uses the PI (Fujifilm Durimide® PI 9320, FUJIFILM Electronic Materials Taiwan Co., Ltd., Hsin-Chu, Taiwan) as the protection layer of the flexible 6-in-1 microsensor. The optical micrograph of flexible 6-in-1 microsensor is shown in Figure 8.
Figure 7. Process diagram of flexible 6-in-1 microsensor.
To avoid the flexible 6-in-1 microsensor being destroyed by the closing pressure of endplate inside the PEM water electrolyzer, an insulation protection layer adapted to a highlychemical environment with high mechanical strength must be used. On the other hand,the protection layer can avoid short circuit of the flexible 6-in-1 microsensor and graphiteplate. The protection layer must be pattern definable insulating material, the fundamentalpurpose is to expose the sensing area of micro voltage and current sensors to directlycontact the flow channel rib, and to expose the signal pad for subsequent signal transferand output. This study uses the PI (Fujifilm Durimide® PI 9320, FUJIFILM ElectronicMaterials Taiwan Co., Ltd., Hsin-Chu, Taiwan) as the protection layer of the flexible 6-in-1microsensor. The optical micrograph of flexible 6-in-1 microsensor is shown in Figure 8.
Micromachines 2021, 12, 494 7 of 14Micromachines 2021, 12, x FOR PEER REVIEW 11 of 24
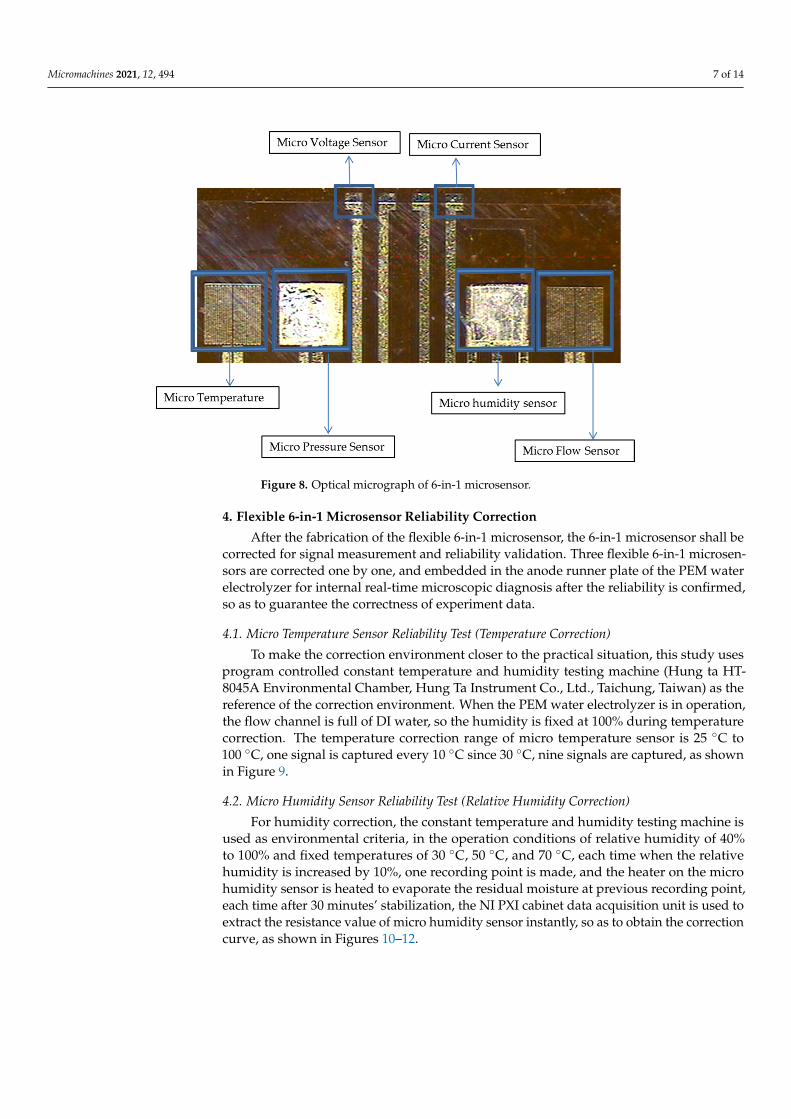
Figure 8. Optical micrograph of 6-in-1 microsensor.
4. Flexible 6-in-1 Microsensor Reliability Correction After the fabrication of the flexible 6-in-1 microsensor, the 6-in-1 microsensor shall
be corrected for signal measurement and reliability validation. Three flexible 6-in-1 mi-crosensors are corrected one by one, and embedded in the anode runner plate of the PEM water electrolyzer for internal real-time microscopic diagnosis after the reliability is confirmed, so as to guarantee the correctness of experiment data.
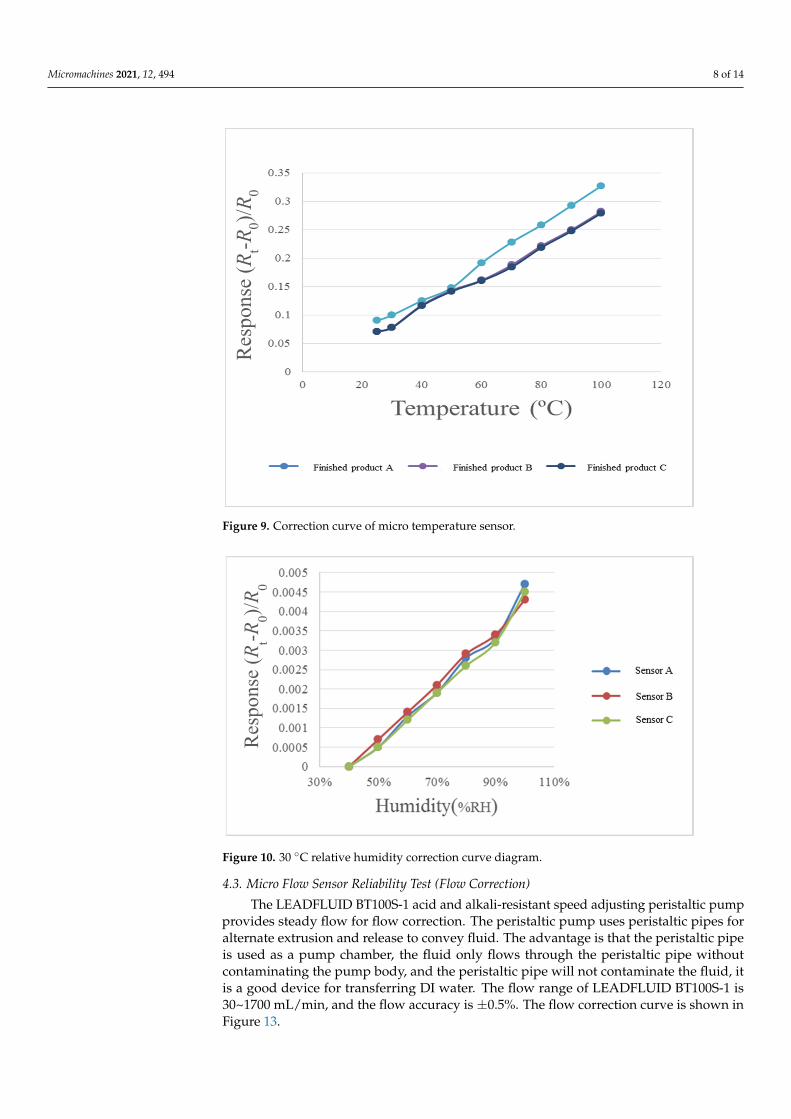
4.1. Micro Temperature Sensor Reliability Test (Temperature Correction) To make the correction environment closer to the practical situation, this study uses
program controlled constant temperature and humidity testing machine (Hung ta HT-8045A Environmental Chamber, Hung Ta Instrument Co., Ltd., Taichung, Taiwan) as the reference of the correction environment. When the PEM water electrolyzer is in operation, the flow channel is full of DI water, so the humidity is fixed at 100% during temperature correction. The temperature correction range of micro temperature sensor is 25 °C to 100 °C, one signal is captured every 10 °C since 30 °C, nine signals are captured, as shown in Figure 9.
Figure 8. Optical micrograph of 6-in-1 microsensor.
4. Flexible 6-in-1 Microsensor Reliability Correction
After the fabrication of the flexible 6-in-1 microsensor, the 6-in-1 microsensor shall becorrected for signal measurement and reliability validation. Three flexible 6-in-1 microsen-sors are corrected one by one, and embedded in the anode runner plate of the PEM waterelectrolyzer for internal real-time microscopic diagnosis after the reliability is confirmed,so as to guarantee the correctness of experiment data.
4.1. Micro Temperature Sensor Reliability Test (Temperature Correction)
To make the correction environment closer to the practical situation, this study usesprogram controlled constant temperature and humidity testing machine (Hung ta HT-8045A Environmental Chamber, Hung Ta Instrument Co., Ltd., Taichung, Taiwan) as thereference of the correction environment. When the PEM water electrolyzer is in operation,the flow channel is full of DI water, so the humidity is fixed at 100% during temperaturecorrection. The temperature correction range of micro temperature sensor is 25 C to100 C, one signal is captured every 10 C since 30 C, nine signals are captured, as shownin Figure 9.
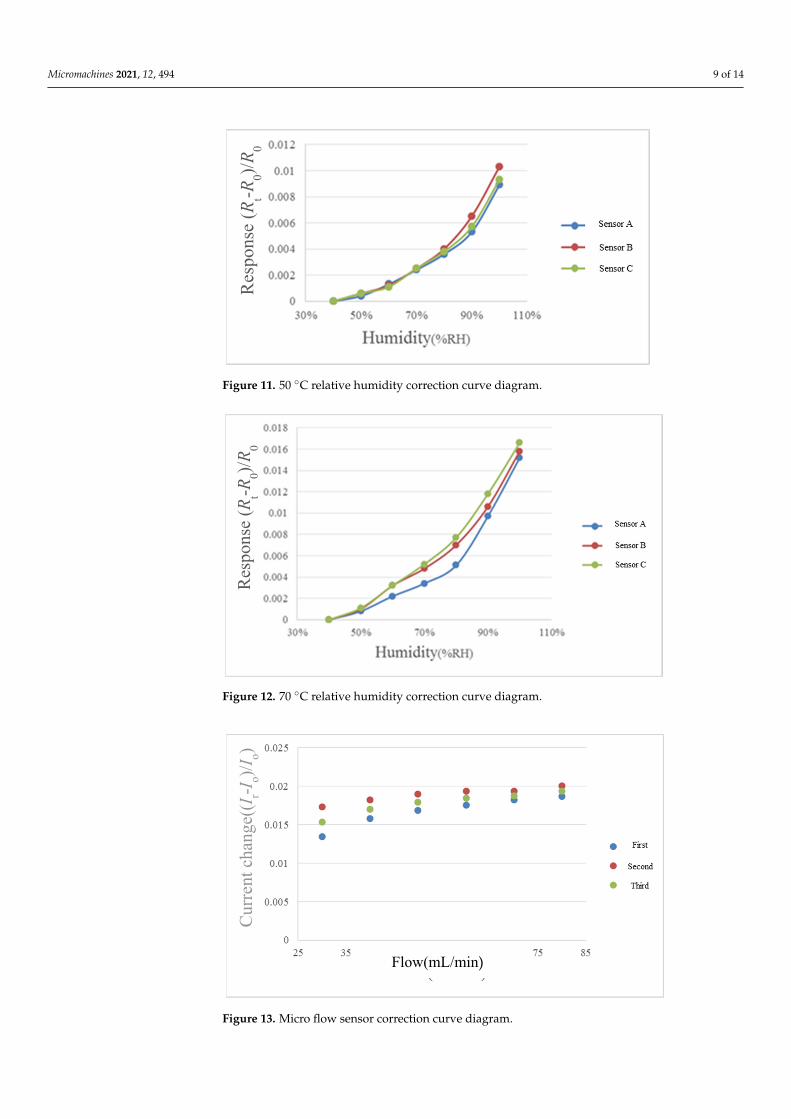
4.2. Micro Humidity Sensor Reliability Test (Relative Humidity Correction)
For humidity correction, the constant temperature and humidity testing machine isused as environmental criteria, in the operation conditions of relative humidity of 40%to 100% and fixed temperatures of 30 C, 50 C, and 70 C, each time when the relativehumidity is increased by 10%, one recording point is made, and the heater on the microhumidity sensor is heated to evaporate the residual moisture at previous recording point,each time after 30 minutes’ stabilization, the NI PXI cabinet data acquisition unit is used toextract the resistance value of micro humidity sensor instantly, so as to obtain the correctioncurve, as shown in Figures 10–12.
Micromachines 2021, 12, 494 8 of 14Micromachines 2021, 12, x FOR PEER REVIEW 12 of 24
Figure 9. Correction curve of micro temperature sensor.
Resp
onse
(Rt-R
0)/R 0
Figure 9. Correction curve of micro temperature sensor.
Micromachines 2021, 12, x FOR PEER REVIEW 13 of 24
4.2. Micro Humidity Sensor Reliability Test (Relative Humidity Correction) For humidity correction, the constant temperature and humidity testing machine is
used as environmental criteria, in the operation conditions of relative humidity of 40% to 100% and fixed temperatures of 30 °C, 50 °C, and 70 °C, each time when the relative humidity is increased by 10%, one recording point is made, and the heater on the micro humidity sensor is heated to evaporate the residual moisture at previous recording point, each time after 30 minutes’ stabilization, the NI PXI cabinet data acquisition unit is used to extract the resistance value of micro humidity sensor instantly, so as to obtain the correction curve, as shown in Figures 10–12.
Figure 10. 30 °C relative humidity correction curve diagram.
Resp
onse
(Rt-R
0)/R0
Figure 10. 30 C relative humidity correction curve diagram.
4.3. Micro Flow Sensor Reliability Test (Flow Correction)
The LEADFLUID BT100S-1 acid and alkali-resistant speed adjusting peristaltic pumpprovides steady flow for flow correction. The peristaltic pump uses peristaltic pipes foralternate extrusion and release to convey fluid. The advantage is that the peristaltic pipeis used as a pump chamber, the fluid only flows through the peristaltic pipe withoutcontaminating the pump body, and the peristaltic pipe will not contaminate the fluid, itis a good device for transferring DI water. The flow range of LEADFLUID BT100S-1 is30~1700 mL/min, and the flow accuracy is ±0.5%. The flow correction curve is shown inFigure 13.
Micromachines 2021, 12, 494 9 of 14
Micromachines 2021, 12, x FOR PEER REVIEW 14 of 24
Figure 11. 50 °C relative humidity correction curve diagram.
Resp
onse
(Rt-R
0)/R0
Resp
onse
(Rt-R
0)/R0
Figure 11. 50 C relative humidity correction curve diagram.
Micromachines 2021, 12, x FOR PEER REVIEW 9 of 14
Figure 11. 50 °C relative humidity correction curve diagram.
Figure 12. 70 °C relative humidity correction curve diagram.
4.3. Micro Flow Sensor Reliability Test (Flow Correction) The LEADFLUID BT100S-1 acid and alkali-resistant speed adjusting peristaltic
pump provides steady flow for flow correction. The peristaltic pump uses peristaltic pipes for alternate extrusion and release to convey fluid. The advantage is that the peri-staltic pipe is used as a pump chamber, the fluid only flows through the peristaltic pipe without contaminating the pump body, and the peristaltic pipe will not contaminate the fluid, it is a good device for transferring DI water. The flow range of LEADFLUID BT100S-1 is 30~1700 mL/min, and the flow accuracy is ±0.5%. The flow correction curve is shown in Figure 13.
Resp
onse
(Rt-R
0)/R0
Resp
onse
(Rt-R
0)/R0
Figure 12. 70 C relative humidity correction curve diagram.
Micromachines 2021, 12, x FOR PEER REVIEW 16 of 24
4.3. Micro Flow Sensor Reliability Test (Flow Correction) The LEADFLUID BT100S-1 acid and alkali-resistant speed adjusting peristaltic
pump provides steady flow for flow correction. The peristaltic pump uses peristaltic pipes for alternate extrusion and release to convey fluid. The advantage is that the peri-staltic pipe is used as a pump chamber, the fluid only flows through the peristaltic pipe without contaminating the pump body, and the peristaltic pipe will not contaminate the fluid, it is a good device for transferring DI water. The flow range of LEADFLUID BT100S-1 is 30~1700 mL/min, and the flow accuracy is ±0.5%. The flow correction curve is shown in Figure 13.
Figure 13. Micro flow sensor correction curve diagram.
Flow(mL/min)
Curre
nt c
hang
e((I r
-I o)/I
o)
Figure 13. Micro flow sensor correction curve diagram.

Micromachines 2021, 12, 494 10 of 14
4.4. Micro Pressure Sensor Reliability Test (Pressure Correction)
The rate of change in capacitance of the developed micro pressure sensor is too low, sothe rate of change in the capacitance value cannot be measured. In order to know the localpressure change inside the water electrolyzer, the Force Sensitive Resistor 0.2 inch pressuresensor of Interlink Electronics is embedded in the water electrolyzer. As the commercialsensor has a thickness, the water electrolyzer has slight leakage. The commercial pressuresensor correction curve is shown in Figure 14.
Micromachines 2021, 12, x FOR PEER REVIEW 17 of 24
4.4. Micro Pressure Sensor Reliability Test (Pressure Correction) The rate of change in capacitance of the developed micro pressure sensor is too low,
so the rate of change in the capacitance value cannot be measured. In order to know the local pressure change inside the water electrolyzer, the Force Sensitive Resistor 0.2 inch pressure sensor of Interlink Electronics is embedded in the water electrolyzer. As the commercial sensor has a thickness, the water electrolyzer has slight leakage. The com-mercial pressure sensor correction curve is shown in Figure 14.
Figure 14. Micro pressure sensor correction curve diagram.
5. Persistent Effect Test and Internal Microscopic Diagnosis for PEM Water Electro-lyzer
This section will introduce the PEM water electrolyzer developed in cooperation with HOMY Technology, the model is EL9-9EM, including the structure of the PEM wa-ter electrolyzer, the selection of materials, and the design of the flow field. In addition, coupled with the collector plate designed in this study, refer to the assembly procedures of related technologies to complete the assembly of the PEM water electrolyzer. The schematic diagram is shown in Figure 15.
y = 3 × 10⁸x-1.909
y = 2 × 10⁸x-1.872
y = 3 × 10⁸x-1.912
0.00
10,000.00
20,000.00
30,000.00
40,000.00
50,000.00
60,000.00
70,000.00
0 100 200 300 400 500 600
Resis
tanc
e(Ω
)
Apply extra pressure(mg)
第一次
第二次
第三次
Power (第一
次)Power (第二
次)Power (第三
次)
Figure 14. Micro pressure sensor correction curve diagram.
5. Persistent Effect Test and Internal Microscopic Diagnosis for PEMWater Electrolyzer
This section will introduce the PEM water electrolyzer developed in cooperationwith HOMY Technology, the model is EL9-9EM, including the structure of the PEM waterelectrolyzer, the selection of materials, and the design of the flow field. In addition, coupledwith the collector plate designed in this study, refer to the assembly procedures of relatedtechnologies to complete the assembly of the PEM water electrolyzer. The schematicdiagram is shown in Figure 15.
Micromachines 2021, 12, x FOR PEER REVIEW 18 of 24
Figure 15. Exploded view of parts of proton exchange membrane (PEM) water electrolyzer.
Figure 15. Exploded view of parts of proton exchange membrane (PEM) water electrolyzer.
Micromachines 2021, 12, 494 11 of 14
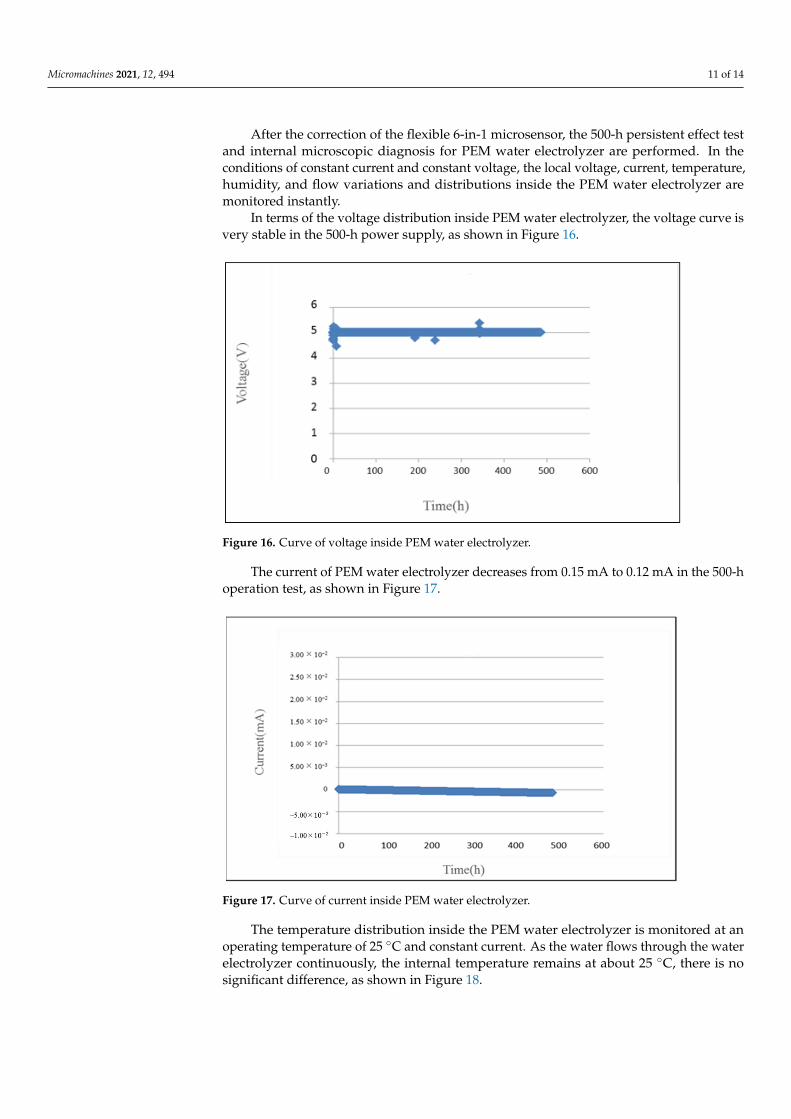
After the correction of the flexible 6-in-1 microsensor, the 500-h persistent effect testand internal microscopic diagnosis for PEM water electrolyzer are performed. In theconditions of constant current and constant voltage, the local voltage, current, temperature,humidity, and flow variations and distributions inside the PEM water electrolyzer aremonitored instantly.
In terms of the voltage distribution inside PEM water electrolyzer, the voltage curve isvery stable in the 500-h power supply, as shown in Figure 16.
Micromachines 2021, 12, x FOR PEER REVIEW 19 of 24
After the correction of the flexible 6-in-1 microsensor, the 500-h persistent effect test and internal microscopic diagnosis for PEM water electrolyzer are performed. In the conditions of constant current and constant voltage, the local voltage, current, tempera-ture, humidity, and flow variations and distributions inside the PEM water electrolyzer are monitored instantly.
In terms of the voltage distribution inside PEM water electrolyzer, the voltage curve is very stable in the 500-h power supply, as shown in Figure 16.
Figure 16. Curve of voltage inside PEM water electrolyzer.
Figure 16. Curve of voltage inside PEM water electrolyzer.
The current of PEM water electrolyzer decreases from 0.15 mA to 0.12 mA in the 500-hoperation test, as shown in Figure 17.
Micromachines 2021, 12, x FOR PEER REVIEW 20 of 24
The current of PEM water electrolyzer decreases from 0.15 mA to 0.12 mA in the 500-h operation test, as shown in Figure 17.
The temperature distribution inside the PEM water electrolyzer is monitored at an operating temperature of 25 °C and constant current. As the water flows through the water electrolyzer continuously, the internal temperature remains at about 25 °C, there is no significant difference, as shown in Figure 18.
Figure 17. Curve of current inside PEM water electrolyzer.
Figure 17. Curve of current inside PEM water electrolyzer.
The temperature distribution inside the PEM water electrolyzer is monitored at anoperating temperature of 25 C and constant current. As the water flows through the waterelectrolyzer continuously, the internal temperature remains at about 25 C, there is nosignificant difference, as shown in Figure 18.
Micromachines 2021, 12, 494 12 of 14
Micromachines 2021, 12, x FOR PEER REVIEW 21 of 24
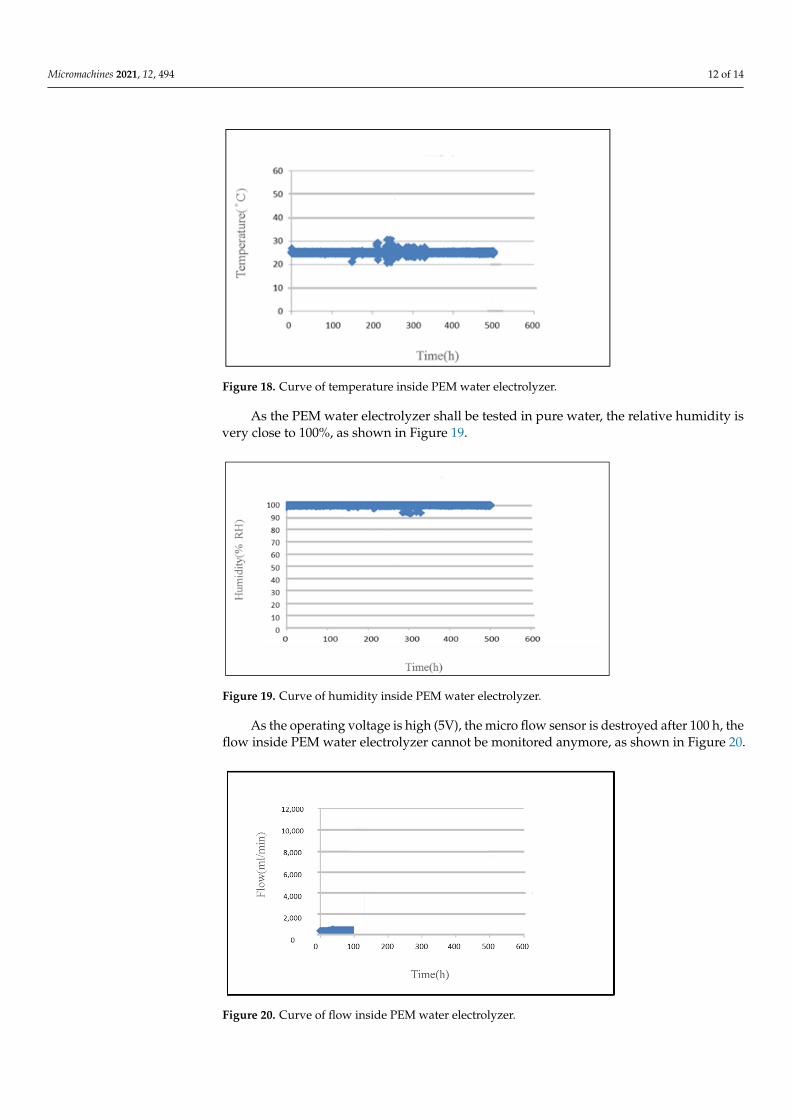
Figure 18. Curve of temperature inside PEM water electrolyzer.
Figure 18. Curve of temperature inside PEM water electrolyzer.
As the PEM water electrolyzer shall be tested in pure water, the relative humidity isvery close to 100%, as shown in Figure 19.
Micromachines 2021, 12, x FOR PEER REVIEW 22 of 24
As the PEM water electrolyzer shall be tested in pure water, the relative humidity is very close to 100%, as shown in Figure 19.
Figure 19. Curve of humidity inside PEM water electrolyzer.
Figure 19. Curve of humidity inside PEM water electrolyzer.
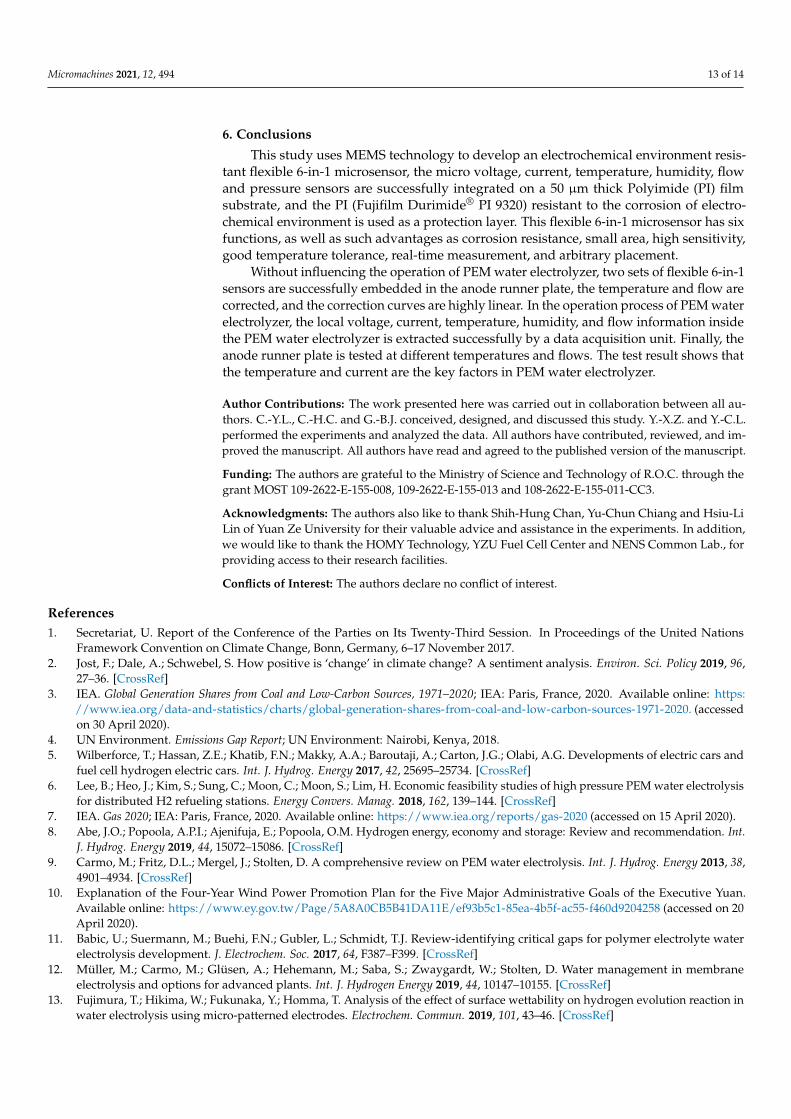
As the operating voltage is high (5V), the micro flow sensor is destroyed after 100 h, theflow inside PEM water electrolyzer cannot be monitored anymore, as shown in Figure 20.
Micromachines 2021, 12, x FOR PEER REVIEW 23 of 24
As the operating voltage is high (5V), the micro flow sensor is destroyed after 100 h, the flow inside PEM water electrolyzer cannot be monitored anymore, as shown in Fig-ure 20.
Figure 20. Curve of flow inside PEM water electrolyzer.
6. Conclusions This study uses MEMS technology to develop an electrochemical environment re-
sistant flexible 6-in-1 microsensor, the micro voltage, current, temperature, humidity, flow and pressure sensors are successfully integrated on a 50 μm thick Polyimide (PI) film substrate, and the PI (Fujifilm Durimide® PI 9320) resistant to the corrosion of elec-trochemical environment is used as a protection layer. This flexible 6-in-1 microsensor has six functions, as well as such advantages as corrosion resistance, small area, high sensitivity, good temperature tolerance, real-time measurement, and arbitrary place-ment.
Without influencing the operation of PEM water electrolyzer, two sets of flexible 6-in-1 sensors are successfully embedded in the anode runner plate, the temperature and flow are corrected, and the correction curves are highly linear. In the operation process of PEM water electrolyzer, the local voltage, current, temperature, humidity, and flow information inside the PEM water electrolyzer is extracted successfully by a data acqui-sition unit. Finally, the anode runner plate is tested at different temperatures and flows. The test result shows that the temperature and current are the key factors in PEM water electrolyzer.
Author Contributions: The work presented here was carried out in collaboration between all au-thors. C.-Y.L., C.-H.C. and G.-B.J. conceived, designed, and discussed this study. Y.-X.Z. and Y.-C.L. performed the experiments and analyzed the data. All authors have contributed, reviewed, and improved the manuscript. All authors have read and agreed to the published version of the manuscript.
Funding: The authors are grateful to the Ministry of Science and Technology of R.O.C. through the grant MOST 109-2622-E-155-008, 109-2622-E-155-013 and 108-2622-E-155-011-CC3.
Acknowledgments: The authors also like to thank Shih-Hung Chan, Yu-Chun Chiang and Hsiu-Li Lin of Yuan Ze University for their valuable advice and assistance in the experiments. In addition, we would like to thank the HOMY Technology, YZU Fuel Cell Center and NENS Common Lab., for providing access to their research facilities.
Conflicts of Interest: The authors declare no conflict of interest.
References
Figure 20. Curve of flow inside PEM water electrolyzer.
Micromachines 2021, 12, 494 13 of 14
6. Conclusions
This study uses MEMS technology to develop an electrochemical environment resis-tant flexible 6-in-1 microsensor, the micro voltage, current, temperature, humidity, flowand pressure sensors are successfully integrated on a 50 µm thick Polyimide (PI) filmsubstrate, and the PI (Fujifilm Durimide® PI 9320) resistant to the corrosion of electro-chemical environment is used as a protection layer. This flexible 6-in-1 microsensor has sixfunctions, as well as such advantages as corrosion resistance, small area, high sensitivity,good temperature tolerance, real-time measurement, and arbitrary placement.
Without influencing the operation of PEM water electrolyzer, two sets of flexible 6-in-1sensors are successfully embedded in the anode runner plate, the temperature and flow arecorrected, and the correction curves are highly linear. In the operation process of PEM waterelectrolyzer, the local voltage, current, temperature, humidity, and flow information insidethe PEM water electrolyzer is extracted successfully by a data acquisition unit. Finally, theanode runner plate is tested at different temperatures and flows. The test result shows thatthe temperature and current are the key factors in PEM water electrolyzer.
Author Contributions: The work presented here was carried out in collaboration between all au-thors. C.-Y.L., C.-H.C. and G.-B.J. conceived, designed, and discussed this study. Y.-X.Z. and Y.-C.L.performed the experiments and analyzed the data. All authors have contributed, reviewed, and im-proved the manuscript. All authors have read and agreed to the published version of the manuscript.
Funding: The authors are grateful to the Ministry of Science and Technology of R.O.C. through thegrant MOST 109-2622-E-155-008, 109-2622-E-155-013 and 108-2622-E-155-011-CC3.
Acknowledgments: The authors also like to thank Shih-Hung Chan, Yu-Chun Chiang and Hsiu-LiLin of Yuan Ze University for their valuable advice and assistance in the experiments. In addition,we would like to thank the HOMY Technology, YZU Fuel Cell Center and NENS Common Lab., forproviding access to their research facilities.
Conflicts of Interest: The authors declare no conflict of interest.
References1. Secretariat, U. Report of the Conference of the Parties on Its Twenty-Third Session. In Proceedings of the United Nations
Framework Convention on Climate Change, Bonn, Germany, 6–17 November 2017.2. Jost, F.; Dale, A.; Schwebel, S. How positive is ‘change’ in climate change? A sentiment analysis. Environ. Sci. Policy 2019, 96,
27–36. [CrossRef]3. IEA. Global Generation Shares from Coal and Low-Carbon Sources, 1971–2020; IEA: Paris, France, 2020. Available online: https:
//www.iea.org/data-and-statistics/charts/global-generation-shares-from-coal-and-low-carbon-sources-1971-2020. (accessedon 30 April 2020).
4. UN Environment. Emissions Gap Report; UN Environment: Nairobi, Kenya, 2018.5. Wilberforce, T.; Hassan, Z.E.; Khatib, F.N.; Makky, A.A.; Baroutaji, A.; Carton, J.G.; Olabi, A.G. Developments of electric cars and
fuel cell hydrogen electric cars. Int. J. Hydrog. Energy 2017, 42, 25695–25734. [CrossRef]6. Lee, B.; Heo, J.; Kim, S.; Sung, C.; Moon, C.; Moon, S.; Lim, H. Economic feasibility studies of high pressure PEM water electrolysis
for distributed H2 refueling stations. Energy Convers. Manag. 2018, 162, 139–144. [CrossRef]7. IEA. Gas 2020; IEA: Paris, France, 2020. Available online: https://www.iea.org/reports/gas-2020 (accessed on 15 April 2020).8. Abe, J.O.; Popoola, A.P.I.; Ajenifuja, E.; Popoola, O.M. Hydrogen energy, economy and storage: Review and recommendation. Int.
J. Hydrog. Energy 2019, 44, 15072–15086. [CrossRef]9. Carmo, M.; Fritz, D.L.; Mergel, J.; Stolten, D. A comprehensive review on PEM water electrolysis. Int. J. Hydrog. Energy 2013, 38,
4901–4934. [CrossRef]10. Explanation of the Four-Year Wind Power Promotion Plan for the Five Major Administrative Goals of the Executive Yuan.
Available online: https://www.ey.gov.tw/Page/5A8A0CB5B41DA11E/ef93b5c1-85ea-4b5f-ac55-f460d9204258 (accessed on 20April 2020).
11. Babic, U.; Suermann, M.; Buehi, F.N.; Gubler, L.; Schmidt, T.J. Review-identifying critical gaps for polymer electrolyte waterelectrolysis development. J. Electrochem. Soc. 2017, 64, F387–F399. [CrossRef]
12. Müller, M.; Carmo, M.; Glüsen, A.; Hehemann, M.; Saba, S.; Zwaygardt, W.; Stolten, D. Water management in membraneelectrolysis and options for advanced plants. Int. J. Hydrogen Energy 2019, 44, 10147–10155. [CrossRef]
13. Fujimura, T.; Hikima, W.; Fukunaka, Y.; Homma, T. Analysis of the effect of surface wettability on hydrogen evolution reaction inwater electrolysis using micro-patterned electrodes. Electrochem. Commun. 2019, 101, 43–46. [CrossRef]

Micromachines 2021, 12, 494 14 of 14
14. Saccardo, M.C.; Zuqello, A.G.; Tozzi, K.A.; Goncalves, R.; Hirano, L.A.; Scuracchio, C.H. Counter-ion and humidity effects onelectromechanical properties of Nafion/Pt composites. Mater. Chem. Phys. 2020, 244, 122674–122682. [CrossRef]
15. Möckl, M.; Bernt, M.; Schröter, J.; Jossen, A. Proton exchange membrane water electrolysis at high current densities: Investigationof thermal limitations. Int. J. Hydrogen Energy 2020, 45, 1417–1428. [CrossRef]
16. Ferrero, D.; Santarelli, M. Investigation of a novel concept for hydrogen production by PEM water electrolysis integrated withmulti-junction solar cells. Energy Convers. Manag. 2017, 148, 16–29. [CrossRef]
17. Grigoriev, S.A.; Fateev, V.N.; Bessarabov, D.G.; Millet, P. Current status, research trends, and challenges in water electrolysisscience and technology. Int. J. Hydrogen Energy 2020, 45, 26036–26058. [CrossRef]
18. Chakik, F.E.; Kaddami, M.; Mikou, M. Effect of operating parameters on hydrogen production by electrolysis of water. Int. J.Hydrogen Energy 2017, 42, 25550–25557. [CrossRef]
19. Trinke, P.; Bensmann, B.; Rauschenbach, R.H. Experimental evidence of increasing oxygen crossover with increasing currentdensity during PEM water electrolysis. Electrochem. Commun. 2017, 82, 98–102. [CrossRef]
20. Sartory, M.; Ogris, E.W.; Salman, P.; Fellinger, T.; Justl, M.; Trattner, A.; Klell, M. Theoretical and experimental analysis of anasymmetric high pressure PEM water electrolyser up to 155 bar. Int. J. Hydrogen Energy 2017, 42, 30493–30508. [CrossRef]
21. Lee, C.Y.; Chiang, Y.C.; Weng, F.B.; Li, S.C.; Wu, P.H.; Yueh, H.I. Flexible micro temperature, voltage and current sensors for localreal-time microscopic diagnosis inside high temperature proton exchange membrane fuel cell stack. Renew. Energy 2017, 108,126–131. [CrossRef]
22. Lee, C.Y.; Lee, S.J.; Chen, C.H.; Hsu, S.Y.; Chien, Y.H.; Lee, T.J. Flexible 4-in-1 microsensor for in-situ diagnosis of electricmotorcycle fuel cell range extender. Sens. Actuators A 2020, 315, 112319–112328. [CrossRef]
23. Lee, C.Y.; Hsieh, C.L.; Chen, C.H.; Huang, Y.P.; Jiang, C.A.; Wu, P.C. A flexible 5-in-1 microsensor for internal microscopicdiagnosis of vanadium redox flow battery charging process. Sensors 2019, 19, 1030. [CrossRef] [PubMed]


![Microscopic and macroscopic creativity [Comment]](https://static.fdokumen.com/doc/165x107/63222cba63847156ac067f99/microscopic-and-macroscopic-creativity-comment.jpg)


