Performance patterns for students with disabilities in grade 4 mathematics education in...
29
ISSUES & ANSWERS U.S. Department of Education Performance patterns for students with disabilities in grade 4 mathematics education in Massachusetts REL 2008–No. 051 At Education Development Center, Inc.
Transcript of Performance patterns for students with disabilities in grade 4 mathematics education in...

I S S U E S & A N S W E R S
U . S . D e p a r t m e n t o f E d u c a t i o n
Performance patterns for students with disabilities in grade 4 mathematics education in Massachusetts
R E L 2 0 0 8 – N o . 0 5 1
At Education Development Center, Inc.
Performance patterns for students with disabilities in grade 4 mathematics
education in Massachusetts
August 2008
Prepared by
Stacy Ehrlich Education Development Center, Inc.
Katie Buckley Education Development Center, Inc.
Emily Midouhas Education Development Center, Inc.
Amy Brodesky Education Development Center, Inc.
I S S U E S&ANSWERS R E L 2 0 0 8 – N o . 0 5 1
U . S . D e p a r t m e n t o f E d u c a t i o n
At Education Development Center, Inc.
Issues & Answers is an ongoing series of reports from short-term Fast Response Projects conducted by the regional educa-tional laboratories on current education issues of importance at local, state, and regional levels. Fast Response Project topics change to reflect new issues, as identified through lab outreach and requests for assistance from policymakers and educa-tors at state and local levels and from communities, businesses, parents, families, and youth. All Issues & Answers reports meet Institute of Education Sciences standards for scientifically valid research.
August 2008
This report was prepared for the Institute of Education Sciences (IES) under Contract ED-06-CO-0025 by Regional Educa-tional Laboratory Northeast and Islands administered by Education Development Center, Inc. The content of the publica-tion does not necessarily reflect the views or policies of IES or the U.S. Department of Education nor does mention of trade names, commercial products, or organizations imply endorsement by the U.S. Government.
This report is in the public domain. While permission to reprint this publication is not necessary, it should be cited as:
Ehrlich, S., Buckley, K., Midouhas, E., and Brodesky, A. (2008). Performance patterns for students with disabilities in grade 4 mathematics education in Massachusetts (Issues & Answers Report, REL 2008–No. 051). Washington, DC: U.S. Department of Education, Institute of Education Sciences, National Center for Education Evaluation and Regional Assistance, Regional Educational Laboratory Northeast and Islands. Retrieved from http://ies.ed.gov/ncee/edlabs.
This report is available on the regional educational laboratory web site at http://ies.ed.gov/ncee/edlabs.
WA
OR
ID
MT
NV
CA
UT
AZ
WY
ND
SD
NE
KSCO
NM
TX
OK
CO
AR
LA
MS AL GA
SC
NC
VAWV
KY
TN
PA
NY
FL
AK
MN
WI
IA
IL IN
MI
OH
VT
NH
ME
CT RI
MA
MO
VI
PRAt Education Development
Center, Inc.

Summary
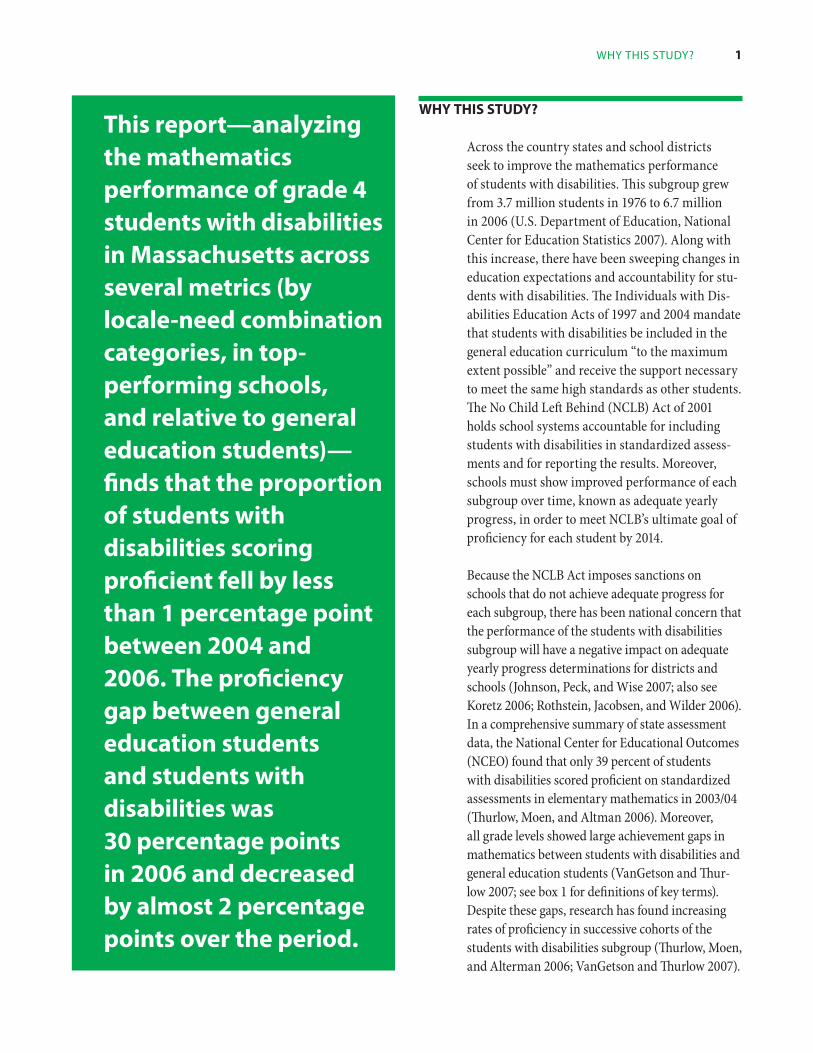
This report—analyzing the mathemat-ics performance of grade 4 students with disabilities in Massachusetts across several metrics (by locale-need combination categories, in top-performing schools, and relative to general education students)—finds that the proportion of students with disabilities scoring proficient fell by less than 1 percentage point between 2004 and 2006. The proficiency gap between general education students and students with disabilities was 30 percentage points in 2006 and de-creased by almost 2 percentage points over the period.
Across the country states and school districts need to improve the mathematics performance of students with disabilities. Not only has this population of students increased since the 1970s, but there have also been changes in ed-ucation expectations and accountability under the requirements of the Individuals with Dis-abilities Education Acts of 1997 and 2004 and the No Child Left Behind (NCLB) Act of 2001. NCLB, in particular, has cast light on the gen-erally low mathematics performance of many students with disabilities and on the achieve-ment gaps between this subgroup and general education students. Performance trends in the
Northeast and Islands Region mirror those of the country.
To clarify this complex issue, this report presents descriptive and inferential analyses of mathematics achievement patterns for grade 4 students with disabilities and general educa-tion students in Massachusetts. Three research questions are examined:
What is the mathematics performance of 1. public school grade 4 students with dis-abilities in Massachusetts?
How has the performance of grade 4 stu-2. dents with disabilities and grade 4 general education students changed over time?
What is the gap in proficiency percent-3. ages between grade 4 general educa-tion students and grade 4 students with disabilities?
The report finds that in 2006, 15.3 percent of grade 4 students with disabilities reached pro-ficiency on the Massachusetts Comprehensive Assessment System exam. The performance of students with disabilities differed across the locale-need combination categories. The high-est percentage of students scoring proficient attended rural low-need schools. In schools
Performance patterns for students with disabilities in grade 4 mathematics education in Massachusetts
REL 2008–No. 051
iv Summary
where the percentage of students with disabili-ties scoring proficient was in the top 10 percent of all schools, 47 percent of students with dis-abilities reached proficiency, compared with only 12.7 percent in other schools. The schools at the top of the distribution included schools from each locale and from each need level.
From 2004 to 2006 the proportion of students with disabilities scoring proficient decreased from 15.7 percent to 15.3 percent. The propor-tion of proficient general education students fell from 48.6 percent to 46.4 percent. Within locale-need combination categories, the profi-ciency improvement was highest for students in rural low-need schools (a 1 percentage point gain). Across the state 43.7 percent of schools exhibited improved proficiency from 2004 to 2006.
The proficiency gap between general education students and students with disabilities was 30 percentage points in 2006, a 2 percentage point decrease from 2004. That change reflected decreases in proficiency among both groups, with general education students falling more.
The gap shrank in suburban low- and medium-need schools and in rural low- and medium-need schools. But the gap widened in high-need schools across all locales and in urban schools across all need categories. At the school level, the proficiency gap narrowed from 2004 to 2006 (without a decrease in performance among general education students) in 12.7 percent of schools with appropriate data.
In addressing the research questions, this report illustrates the analyses that state and district leaders can conduct with publicly reported data, along with the ways the find-ings can be interpreted. The limitations of the analyses come from examining cross-sectional data on the proportion of students scoring pro-ficient rather than longitudinal data on actual student scores, and from lacking information on the types and severity of disabilities. The findings and limitations are important as states move forward in analyzing subgroup performance and proficiency gap data and in making data-driven decisions.
August 2008
Table of conTenTS v
TAble of conTenTs
Why this study? 1Research questions 4An overview of the findings 4
What is the mathematics performance of grade 4 students with disabilities? 6Performance of students with disabilities 6Schools in the top 10 percent of the distribution of school-level performance for students with disabilities 6
How has the performance of grade 4 students with disabilities and grade 4 general education students changed over time? 8
Student performance over time 8Performance of schools over time 8
What is the gap in proficiency percentages between grade 4 general education students and grade 4 students with disabilities? 9
The proficiency gap between students with disabilities and general education students 9Schools in which the proficiency gap narrowed 11
Conclusion 11Considerations in interpreting results 12Areas for further inquiry 13Potential policy implications of the findings 13
Appendix A Data sources and methods 15
Notes 20
References 21
Boxes
1 Key terms used in the report 2
2 The school locale-need combination categories 3
3 Data sources, limitations, and analysis 5
Figures
1 Percentage of grade 4 students with disabilities performing at each proficiency level in Massachusetts, 2006 6
2 Percentage of grade 4 students with disabilities scoring proficient, by locale-need category, 2006 6
3 Percentage of students with disabilities scoring proficient in schools in the top 10 percent of the distribution and in remaining schools, 2006 7
4 Percentage of Massachusetts grade 4 general education students and students with disabilities scoring proficient, 2004 to 2006 8
5 Comparison of the percentage of grade 4 general education students and students with disabilities scoring proficient, across Massachusetts and by locale-need categories, 2006 10

vi
6 Change in the percentage point difference of grade 4 general education students and students with disabilities scoring proficient, across the state and by locale-need category, 2004–06 10
7 Number of schools that narrowed the proficiency gap between the percentage of grade 4 general education students scoring proficient and the percentage of students with disabilities scoring proficient, 2004–06 11
Tables
1 Number, percentage, and average proficiency for students with disabilities in schools in the top 10 percent of the school-level performance distribution among students with disabilities, 2006 7
2 Percentage point change in students with disabilities and general education students scoring proficient between 2004 and 2006, by locale-need category 8
3 Schools with improving performance for students with disabilities, by locale-need category 9
A1 Number of schools included and excluded in dataset 17
A2 Schools with excluded proficiency data on students with disabilities (percent) 17
A3 Number of grade 4 students in sample, by locale and need level, 2006 17
A4 Schools in each locale-need category, 2006 17
A5 Average percentages of students with disabilities, students eligible for free or reduced-price lunch, and limited English proficiency students, by school need level, 2006 18
Why ThiS STudy? 1
This report—analyzing the mathematics performance of grade 4 students with disabilities in Massachusetts across several metrics (by locale-need combination categories, in top-performing schools, and relative to general education students)—finds that the proportion of students with disabilities scoring proficient fell by less than 1 percentage point between 2004 and 2006. The proficiency gap between general education students and students with disabilities was 30 percentage points in 2006 and decreased by almost 2 percentage points over the period.
Why This sTudy?
Across the country states and school districts seek to improve the mathematics performance of students with disabilities. This subgroup grew from 3.7 million students in 1976 to 6.7 million in 2006 (U.S. Department of Education, National Center for Education Statistics 2007). Along with this increase, there have been sweeping changes in education expectations and accountability for stu-dents with disabilities. The Individuals with Dis-abilities Education Acts of 1997 and 2004 mandate that students with disabilities be included in the general education curriculum “to the maximum extent possible” and receive the support necessary to meet the same high standards as other students. The No Child Left Behind (NCLB) Act of 2001 holds school systems accountable for including students with disabilities in standardized assess-ments and for reporting the results. Moreover, schools must show improved performance of each subgroup over time, known as adequate yearly progress, in order to meet NCLB’s ultimate goal of proficiency for each student by 2014.
Because the NCLB Act imposes sanctions on schools that do not achieve adequate progress for each subgroup, there has been national concern that the performance of the students with disabilities subgroup will have a negative impact on adequate yearly progress determinations for districts and schools (Johnson, Peck, and Wise 2007; also see Koretz 2006; Rothstein, Jacobsen, and Wilder 2006). In a comprehensive summary of state assessment data, the National Center for Educational Outcomes (NCEO) found that only 39 percent of students with disabilities scored proficient on standardized assessments in elementary mathematics in 2003/04 (Thurlow, Moen, and Altman 2006). Moreover, all grade levels showed large achievement gaps in mathematics between students with disabilities and general education students (VanGetson and Thur-low 2007; see box 1 for definitions of key terms). Despite these gaps, research has found increasing rates of proficiency in successive cohorts of the students with disabilities subgroup (Thurlow, Moen, and Alterman 2006; VanGetson and Thurlow 2007).
2 Performance PaTTernS for STudenTS WiTh diSabiliTieS in grade 4 maThemaTicS in maSSachuSeTTS
To add to the emerging research base on the performance trends of students with disabilities, this report examines mathematics performance patterns for grade 4 students with disabilities in the Commonwealth of Massachusetts for school years 2003/04 to 2005/06 (referred to in the report by the second semester dates, 2004, 2005, and 2006), as well as the proficiency gap between them and general education students over the same period. Although the mathemat-ics achievement of students with disabilities is an issue across all schools, this report focuses on elementary schools because those years are critical to building foundations in mathematics. The analyses center on grade 4 because it was the only elementary grade tested in mathematics in Massachusetts before 2006.
States need to increase proficiency rates among their students with disabilities subgroup and decrease the number of schools that fail to make adequate yearly progress because of this subgroup. To do this, states and districts must understand the performance trends of this subgroup, particularly the variation in performance across similar groups of schools (for example, similar levels of need) and student performance in schools at the top of the school-level distribution. It is also important to gain a clearer picture of how students with disabili-ties have performed over time relative to general education students, in order to understand the potential for students with disabilities to achieve similar rates of proficiency as general education students in the coming years and to close the profi-ciency gap between them (Blackorby et al. 2007).
box 1
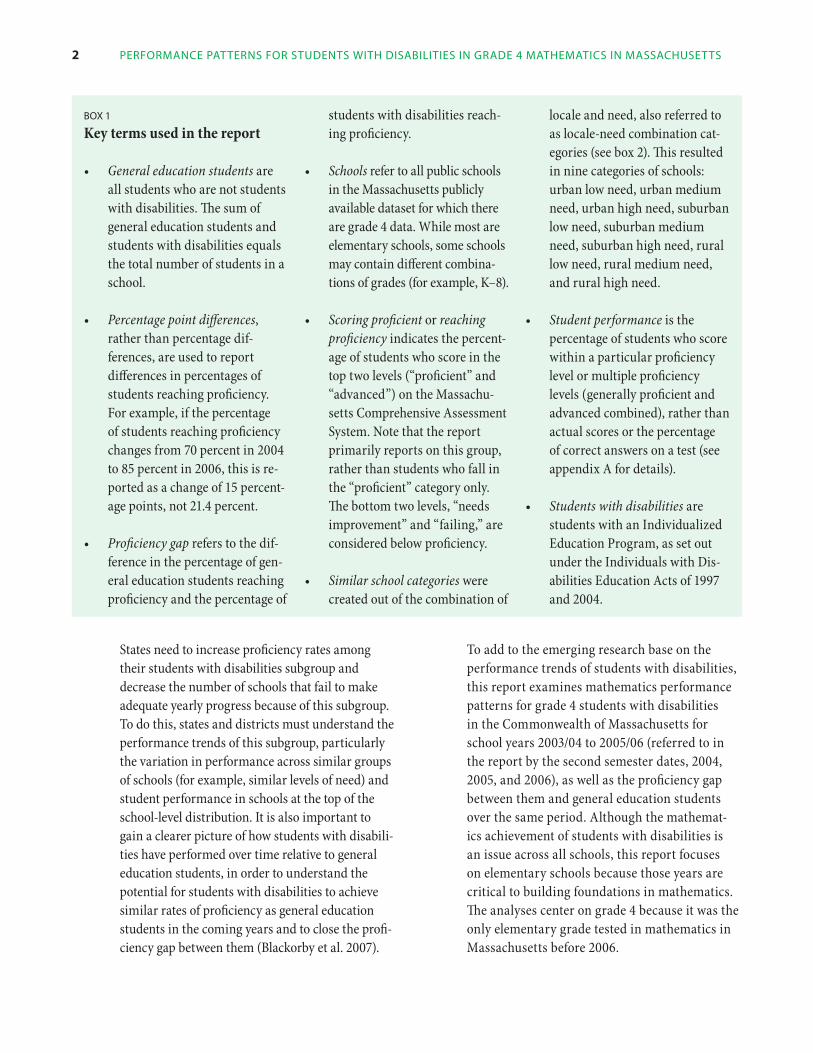
Key terms used in the report
General education students• are all students who are not students with disabilities. The sum of general education students and students with disabilities equals the total number of students in a school.
Percentage point differences• , rather than percentage dif-ferences, are used to report differences in percentages of students reaching proficiency. For example, if the percentage of students reaching proficiency changes from 70 percent in 2004 to 85 percent in 2006, this is re-ported as a change of 15 percent-age points, not 21.4 percent.
Proficiency gap• refers to the dif-ference in the percentage of gen-eral education students reaching proficiency and the percentage of
students with disabilities reach-ing proficiency.
Schools• refer to all public schools in the Massachusetts publicly available dataset for which there are grade 4 data. While most are elementary schools, some schools may contain different combina-tions of grades (for example, K–8).
Scoring proficient • or reaching proficiency indicates the percent-age of students who score in the top two levels (“proficient” and “advanced”) on the Massachu-setts Comprehensive Assessment System. Note that the report primarily reports on this group, rather than students who fall in the “proficient” category only. The bottom two levels, “needs improvement” and “failing,” are considered below proficiency.
Similar school categories • were created out of the combination of
locale and need, also referred to as locale-need combination cat-egories (see box 2). This resulted in nine categories of schools: urban low need, urban medium need, urban high need, suburban low need, suburban medium need, suburban high need, rural low need, rural medium need, and rural high need.
Student performance• is the percentage of students who score within a particular proficiency level or multiple proficiency levels (generally proficient and advanced combined), rather than actual scores or the percentage of correct answers on a test (see appendix A for details).
Students with disabilities• are students with an Individualized Education Program, as set out under the Individuals with Dis-abilities Education Acts of 1997 and 2004.

Why ThiS STudy? 3
This report seeks to provide a more nuanced examination of performance patterns among stu-dents with disabilities by examining performance within similar schools, using schools’ locale-need combination categories (see box 2). These catego-rizations are important in analyzing a state as large and diverse as Massachusetts. Examining
student performance across schools with similar characteristics can enhance states’ understand-ing of their student data, particularly by allowing states to understand what schools with certain constraints (such as high-need student popula-tions) are capable of (Johnson, Peck, and Wise 2007).
box 2
The school locale-need combination categories
School locale-need combination. This index uses school locale and school student-population need level to cre-ate combination categories.
School locale• was determined using the 2005/06 school locale codes from the U.S. Depart-ment of Education, National Center for Education Statistics (2006): large city, mid-size city, urban fringe of a large city, urban fringe of a mid-size city, rural inside core based statisti-cal areas (CBSA), rural outside CBSA, small town, and large town. These eight categories are then grouped into three: urban (large or mid-size city), subur-ban (urban fringe of a large or mid-size city), and rural (rural inside or outside CBSA or small or large town).1 In a very small percentage of cases (less than 1 percent), the National Center for Education Statistics does not provide a locale for a school. In these cases knowledge of the school’s location, the locale data of other schools in the same district, and information on a school’s web site were used to determine a locale code.
School need• was determined by using a calculation employed by the New York City Department of Education (2007) to categorize a school’s need based on disadvan-taged subgroups.2 This measure assigns a weighted average to the percentages of students with disabilities, students eligible for free or reduced-price lunch, and limited English proficiency students. The formula is:
(0.45 * the percentage of students with disabilities) + (0.45 * the percentage
of students eligible for free or reduced-price lunch) + (0.10 * the percentage of limited English proficiency students)
This formula is used to calculate a weighted need average for each school in the dataset and, after sort-ing the schools by their weighted average, to divide the schools into thirds and assign a category of need—low, medium, or high—to each school.3 For each year the third of schools with the lowest weighted average is categorized as low need, the third with the highest weighted average as high need, and the middle third as medium need (see table A5 in appendix A for breakdown of sub-group population by low-, medium-, and high-need categories in 2006). A school could have the same weighted average for all three years but fall
into different need levels each year because of a change in the overall distribution from year to year.
The school locale-need index com-bines locale and need into nine categories: urban low need,4 urban medium need, urban high need, sub-urban low need, suburban medium need, suburban high need, rural low need, rural medium need, and rural high need. Table A4 in appendix A shows the number of schools by locale-need category. Within catego-ries schools are similarly situated. The analysis presents tabulations of the performance data of these similarly situated schools and allows comparisons of schools facing dif-ferent conditions across locale-need categories
NotesThis grouping was based on the 1. recommendation of National Center for Education Statistics staff (personal communication, June 14, 2006). New York City’s formula was used 2. because Massachusetts does not have a formula in its publicly available data that measures school need.Because there was no obvious point of 3. division in the distribution of weighted need averages, need was divided into three groups to match the division of locales.There were no urban low need schools 4. with data on students with disabilities for 2006.

4 Performance PaTTernS for STudenTS WiTh diSabiliTieS in grade 4 maThemaTicS in maSSachuSeTTS
Research questions
This report examines three research questions:
What is the mathematics performance of 1. public school grade 4 students with disabili-ties in Massachusetts? To explore the nuances in the performance of students with disabili-ties, this question is addressed by describing their 2006 performance across locale-need categories (see box 2) and by examining the top 10 percent of the 2006 distribution of school-level performance among students with disabilities.
How has the performance of grade 4 stu-2. dents with disabilities and grade 4 general education students changed over time? This question is answered by looking at student performance from 2004 to 2006 and by deter-mining the number of schools that exhibited improved performance of students with dis-abilities over the period.
What is the gap in proficiency between grade 3. 4 general education students and grade 4 students with disabilities? This question is addressed by examining whether the gap in proficiency rates between the two subgroups from 2004 to 2006 diminished over time.
Results are also presented by the number of schools that reduced the size of their gap as a result of improvement in proficiency rates among students with disabilities.
Answers to these questions will help policymakers and educa-tors understand the current and changing status of the mathemat-ics performance of students with disabilities in Massachusetts, both independently and against the performance of general education students. By using only publicly available data, the report illus-trates the kinds of analyses that
can be performed with these datasets to explore the performance of the students with disabilities subgroup, as well as the limitations of using these datasets. The results have particular implications in light of the demands of the NCLB Act and ad-equate yearly progress requirements.
An overview of the findings
In 2006, 15.3 percent of grade 4 students with dis-abilities reached proficiency on the Massachusetts Comprehensive Assessment System (MCAS) math-ematics exam. The performance of students with disabilities differed across the locale-need combina-tion categories. The highest percentage of students scoring proficient appeared in rural low-need schools. In schools where the percentage of students with disabilities scoring proficient fell into the top 10 percent, 47 percent of students with disabilities scored proficient, compared with only 12.7 percent in other schools. Schools from each locale and from each need level were included in this group.
From 2004 to 2006 the proportion of students with disabilities scoring proficient fell from 15.7 per-cent to 15.3 percent, or 0.4 percentage point. The proportion of general education students scoring proficient fell from 48.6 percent to 46.4 percent, or 2.2 percentage points. Within similar school categories the improvement in proficiency was highest for students in rural low-need schools (an increase of 1 percentage point). Across the state 43.7 percent of schools improved their perfor-mance from 2004 to 2006.
The proficiency gap between general education students and students with disabilities was 30 per-centage points in 2006, a 2 percentage point de-crease from 2004. The change was due to a smaller share of students scoring proficient among both groups, with general education students declining more. The gap between students with disabilities and general education students narrowed in sub-urban low- and medium-need schools and rural low- and medium-need schools. But it widened in high-need schools across all locales and in urban schools across all need categories. At the school
Answers to the three
research questions
addressed in this report
will help policymakers
and educators
understand the current
and changing status
of the mathematics
performance of students
with disabilities
in Massachusetts,
both independently
and against the
performance of general
education students
Why ThiS STudy? 5
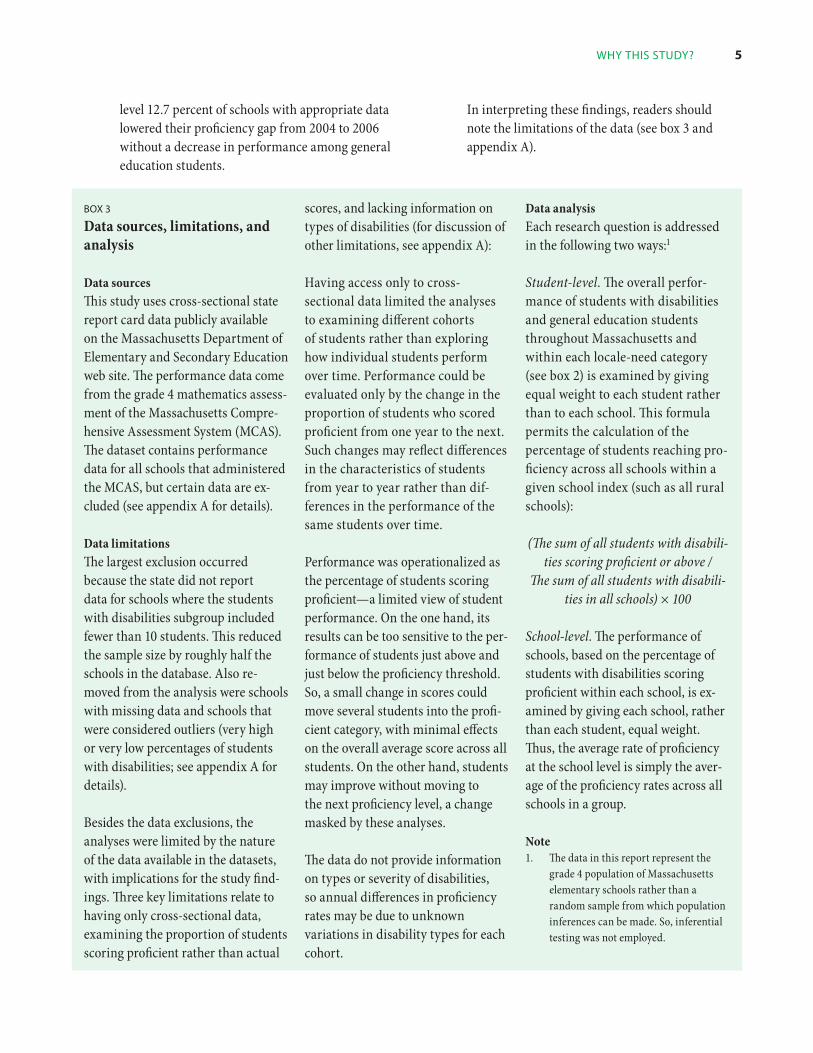
level 12.7 percent of schools with appropriate data lowered their proficiency gap from 2004 to 2006 without a decrease in performance among general education students.
In interpreting these findings, readers should note the limitations of the data (see box 3 and appendix A).
box 3
Data sources, limitations, and analysis
Data sources This study uses cross-sectional state report card data publicly available on the Massachusetts Department of Elementary and Secondary Education web site. The performance data come from the grade 4 mathematics assess-ment of the Massachusetts Compre-hensive Assessment System (MCAS). The dataset contains performance data for all schools that administered the MCAS, but certain data are ex-cluded (see appendix A for details).
Data limitationsThe largest exclusion occurred because the state did not report data for schools where the students with disabilities subgroup included fewer than 10 students. This reduced the sample size by roughly half the schools in the database. Also re-moved from the analysis were schools with missing data and schools that were considered outliers (very high or very low percentages of students with disabilities; see appendix A for details).
Besides the data exclusions, the analyses were limited by the nature of the data available in the datasets, with implications for the study find-ings. Three key limitations relate to having only cross-sectional data, examining the proportion of students scoring proficient rather than actual
scores, and lacking information on types of disabilities (for discussion of other limitations, see appendix A):
Having access only to cross- sectional data limited the analyses to examining different cohorts of students rather than exploring how individual students perform over time. Performance could be evaluated only by the change in the proportion of students who scored proficient from one year to the next. Such changes may reflect differences in the characteristics of students from year to year rather than dif-ferences in the performance of the same students over time.
Performance was operationalized as the percentage of students scoring proficient—a limited view of student performance. On the one hand, its results can be too sensitive to the per-formance of students just above and just below the proficiency threshold. So, a small change in scores could move several students into the profi-cient category, with minimal effects on the overall average score across all students. On the other hand, students may improve without moving to the next proficiency level, a change masked by these analyses.
The data do not provide information on types or severity of disabilities, so annual differences in proficiency rates may be due to unknown variations in disability types for each cohort.
Data analysisEach research question is addressed in the following two ways:1
Student-level. The overall perfor-mance of students with disabilities and general education students throughout Massachusetts and within each locale-need category (see box 2) is examined by giving equal weight to each student rather than to each school. This formula permits the calculation of the percentage of students reaching pro-ficiency across all schools within a given school index (such as all rural schools):
(The sum of all students with disabili-ties scoring proficient or above /
The sum of all students with disabili-ties in all schools) × 100
School-level. The performance of schools, based on the percentage of students with disabilities scoring proficient within each school, is ex-amined by giving each school, rather than each student, equal weight. Thus, the average rate of proficiency at the school level is simply the aver-age of the proficiency rates across all schools in a group.
NoteThe data in this report represent the 1. grade 4 population of Massachusetts elementary schools rather than a random sample from which population inferences can be made. So, inferential testing was not employed.

6 Performance PaTTernS for STudenTS WiTh diSabiliTieS in grade 4 maThemaTicS in maSSachuSeTTS
WhAT is The MATheMATics PerforMAnce of grAde 4 sTudenTs WiTh disAbiliTies?
Addressing the first research question, this sec-tion describes the percentage of grade 4 students with disabilities meeting proficiency overall and within each similar school category in 2006 in Massachusetts. It then describes the performance of the schools in which students with disabilities performed in the top 10 percent of the distribution across all Massachusetts schools.
Performance of students with disabilities
In 2006, 15.3 percent of grade 4 students with disabilities reached proficiency on the MCAS exam (figure 1). This included 11.6 percent of students with disabilities scoring at the proficient level and 3.7 percent scoring at the advanced level. The remaining 84.7 percent scored below proficiency (warning and needs improvement).
There were differences in the performance of stu-dents with disabilities across locale-need combi-nation categories. As need decreases within each
locale, the performance of students with disabili-ties increases (figure 2). Also evident is that in the medium- and high-need levels, proficiency rates were lower for students with disabilities in urban schools (11.5 percent and 6.4 percent, respec-tively) than in suburban schools (17.1 percent and 11.8 percent) and rural schools (15.7 percent and 10.6 percent).
Schools in the top 10 percent of the distribution of school-level performance for students with disabilities
In schools where the percentage of students with disabilities scoring proficient fell into the top 10 percent of the school-level distribution, 47 per-cent of students with disabilities reached profi-ciency, compared with only 12.7 percent in other schools (figure 3).
Of the schools at the top of the distribution, 75.0 percent were suburban, 19.2 percent were rural, and only 5.8 percent were urban (table 1). More than half the schools (51.9 percent) were low need. All three locale categories and all three need categories were represented in the
0
10
20
30
40
50
60
AdvancedProficientNeedsimprovement
Warning
Percent
3.7%
11.6%
46.6%
38.0%
Below proficient 84.7%
Proficient 15.3%
figure 1
Percentage of grade 4 students with disabilities performing at each proficiency level in Massachusetts, 2006
Source: Authors’ analysis based on data from Massachusetts Depart-ment of Elementary and Secondary Education (2006b).
0
5
10
15
20
25
HighMediumLowHighMediumLowHighMediumLowa
Percent
RuralSuburbanUrban
10.6%
15.7%
22.6%
11.8%
17.1%
21.0%
6.4%
11.5%
figure 2
Percentage of grade 4 students with disabilities scoring proficient, by locale-need category, 2006
a. No performance data reported because all schools in the category contained fewer than 10 students with disabilities (see appendix A).
Source: Authors’ analysis based on data from Massachusetts Depart-ment of Elementary and Secondary Education (2006b).

WhaT iS The maThemaTicS Performance of grade 4 STudenTS WiTh diSabiliTieS? 7
top 10 percent of the school-level performance distribution in 2006, but none was both rural and high need.
Although on average urban schools performed worse than any other locale, a few schools per-formed in the top 10 percent of the distribution, with 51.3 percent of their students with disabili-ties scoring proficient (see table 1). This rate was higher than the average in suburban schools at the top of the distribution (47.3 percent) and in rural schools (44.7 percent). Similarly, high-need schools at the top of the distribution (with only four schools represented) had an average profi-ciency rate of 50.8 percent, slightly higher than the 48.2 percent proficiency in low-need schools and the 44.8 percent proficiency in medium-need schools. These relatively high proficiency rates across all locale and need categories show the potential of all schools.
Table 1
number, percentage, and average proficiency for students with disabilities in schools in the top 10 percent of the school-level performance distribution among students with disabilities, 2006
category low need medium need high need Total
urban
number — 1 2 3
Percent — 1.9 3.9 5.8
Percent proficient — 37.0 58.5 51.3
Suburban
number 19 18 2 39
Percent 36.5 34.6 3.9 75.0
Percent proficient 50.3 44.7 43.0 47.3
rural
number 8 2 0 10
Percent 15.4 3.9 0.0 19.2
Percent proficient 43.4 50.0 0.0 44.7
Total, by need
number 27 21 4 52
Percent 51.9 40.4 7.7 100.0
Percent proficient 48.2 44.8 50.8 47.0
— is no performance data reported because all schools in the category contained fewer than 10 students with disabilities (see appendix A).
Note: Percent is calculated as a share of the total number of schools in the top 10 percent of the distribution (52 schools).
Source: Authors’ analysis based on data from Massachusetts Department of Elementary and Secondary Education (2006b).
0
10
20
30
40
50
60
Remaining schoolsTop 10 percent
Percent
12.7%
47.0%
figure 3
Percentage of students with disabilities scoring proficient in schools in the top 10 percent of the distribution and in remaining schools, 2006
Source: Authors’ analysis based on data from Massachusetts Depart-ment of Elementary and Secondary Education (2006b).
8 Performance PaTTernS for STudenTS WiTh diSabiliTieS in grade 4 maThemaTicS in maSSachuSeTTS
hoW hAs The PerforMAnce of grAde 4 sTudenTs WiTh disAbiliTies And grAde 4 generAl educATion sTudenTs chAnged over TiMe?
This section describes the change in the perfor-mance of students with disabilities and that of general education students from 2004 to 2006. It also describes the number of schools that im-proved performance among their students with disabilities from 2004 to 2006 and their average proficiency increase.
Student performance over time
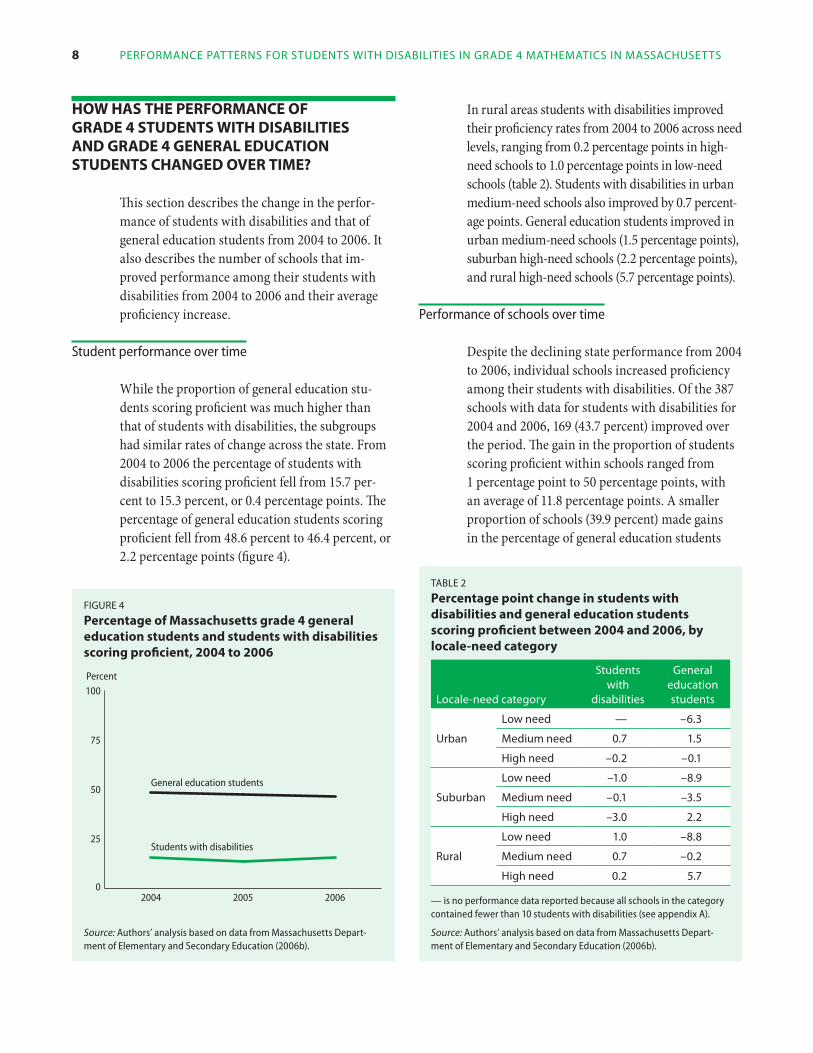
While the proportion of general education stu-dents scoring proficient was much higher than that of students with disabilities, the subgroups had similar rates of change across the state. From 2004 to 2006 the percentage of students with disabilities scoring proficient fell from 15.7 per-cent to 15.3 percent, or 0.4 percentage points. The percentage of general education students scoring proficient fell from 48.6 percent to 46.4 percent, or 2.2 percentage points (figure 4).
In rural areas students with disabilities improved their proficiency rates from 2004 to 2006 across need levels, ranging from 0.2 percentage points in high-need schools to 1.0 percentage points in low-need schools (table 2). Students with disabilities in urban medium-need schools also improved by 0.7 percent-age points. General education students improved in urban medium-need schools (1.5 percentage points), suburban high-need schools (2.2 percentage points), and rural high-need schools (5.7 percentage points).
Performance of schools over time
Despite the declining state performance from 2004 to 2006, individual schools increased proficiency among their students with disabilities. Of the 387 schools with data for students with disabilities for 2004 and 2006, 169 (43.7 percent) improved over the period. The gain in the proportion of students scoring proficient within schools ranged from 1 percentage point to 50 percentage points, with an average of 11.8 percentage points. A smaller proportion of schools (39.9 percent) made gains in the percentage of general education students
Table 2
Percentage point change in students with disabilities and general education students scoring proficient between 2004 and 2006, by locale-need category
locale-need category
Students with
disabilities
general education students
urban
low need — –6.3
medium need 0.7 1.5
high need –0.2 –0.1
Suburban
low need –1.0 –8.9
medium need –0.1 –3.5
high need –3.0 2.2
rural
low need 1.0 –8.8
medium need 0.7 –0.2
high need 0.2 5.7
— is no performance data reported because all schools in the category contained fewer than 10 students with disabilities (see appendix A).
Source: Authors’ analysis based on data from Massachusetts Depart-ment of Elementary and Secondary Education (2006b).
0
25
50
75
100
200620052004
Percent
General education students
Students with disabilities
figure 4
Percentage of Massachusetts grade 4 general education students and students with disabilities scoring proficient, 2004 to 2006
Source: Authors’ analysis based on data from Massachusetts Depart-ment of Elementary and Secondary Education (2006b).
WhaT iS The gaP in Proficiency beTWeen general educaTion STudenTS and STudenTS WiTh diSabiliTieS? 9
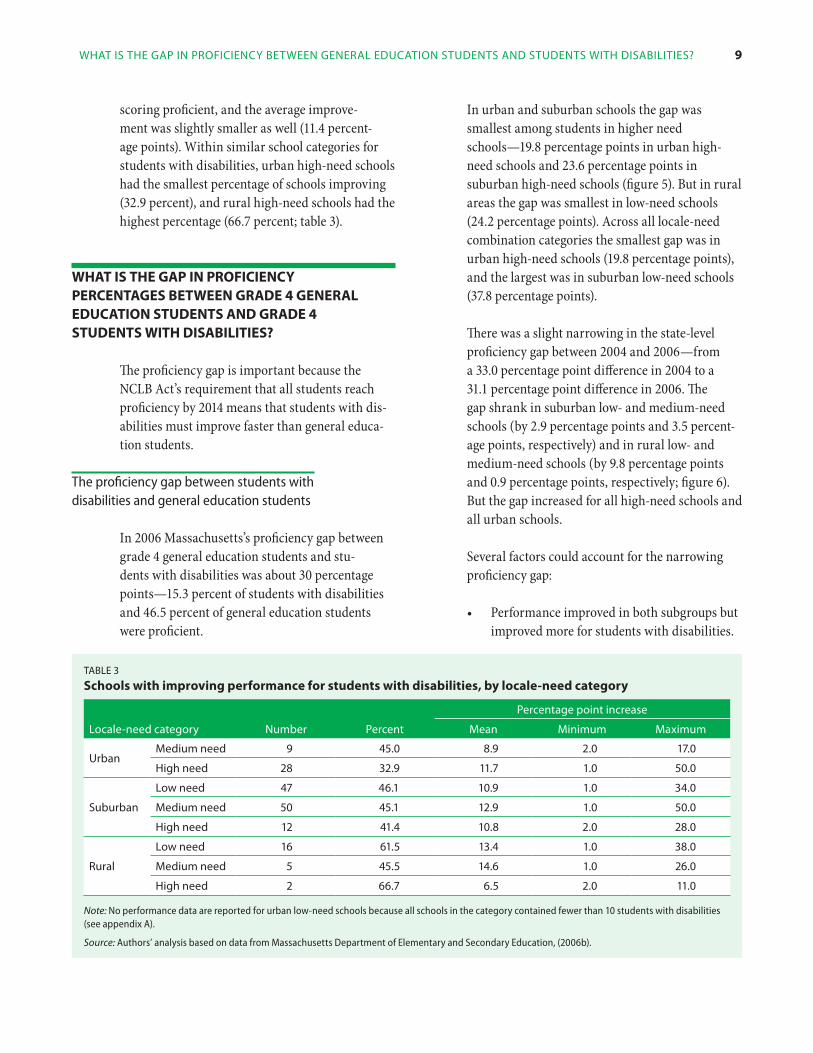
scoring proficient, and the average improve-ment was slightly smaller as well (11.4 percent-age points). Within similar school categories for students with disabilities, urban high-need schools had the smallest percentage of schools improving (32.9 percent), and rural high-need schools had the highest percentage (66.7 percent; table 3).
WhAT is The gAP in Proficiency PercenTAges beTWeen grAde 4 generAl educATion sTudenTs And grAde 4 sTudenTs WiTh disAbiliTies?
The proficiency gap is important because the NCLB Act’s requirement that all students reach proficiency by 2014 means that students with dis-abilities must improve faster than general educa-tion students.
The proficiency gap between students with disabilities and general education students
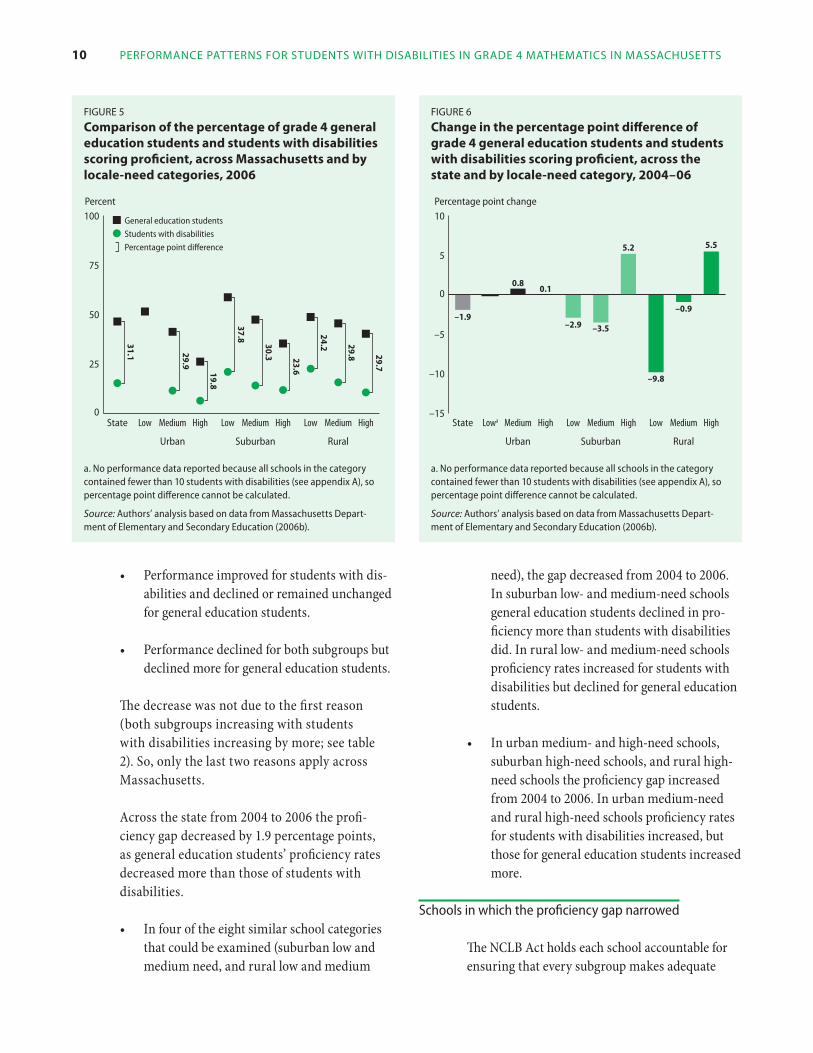
In 2006 Massachusetts’s proficiency gap between grade 4 general education students and stu-dents with disabilities was about 30 percentage points—15.3 percent of students with disabilities and 46.5 percent of general education students were proficient.
In urban and suburban schools the gap was smallest among students in higher need schools—19.8 percentage points in urban high-need schools and 23.6 percentage points in suburban high-need schools (figure 5). But in rural areas the gap was smallest in low-need schools (24.2 percentage points). Across all locale-need combination categories the smallest gap was in urban high-need schools (19.8 percentage points), and the largest was in suburban low-need schools (37.8 percentage points).
There was a slight narrowing in the state-level proficiency gap between 2004 and 2006—from a 33.0 percentage point difference in 2004 to a 31.1 percentage point difference in 2006. The gap shrank in suburban low- and medium-need schools (by 2.9 percentage points and 3.5 percent-age points, respectively) and in rural low- and medium-need schools (by 9.8 percentage points and 0.9 percentage points, respectively; figure 6). But the gap increased for all high-need schools and all urban schools.
Several factors could account for the narrowing proficiency gap:
Performance improved in both subgroups but •improved more for students with disabilities.
Table 3
schools with improving performance for students with disabilities, by locale-need category
locale-need category number Percent
Percentage point increase
mean minimum maximum
urbanmedium need 9 45.0 8.9 2.0 17.0
high need 28 32.9 11.7 1.0 50.0
Suburban
low need 47 46.1 10.9 1.0 34.0
medium need 50 45.1 12.9 1.0 50.0
high need 12 41.4 10.8 2.0 28.0
rural
low need 16 61.5 13.4 1.0 38.0
medium need 5 45.5 14.6 1.0 26.0
high need 2 66.7 6.5 2.0 11.0
Note: No performance data are reported for urban low-need schools because all schools in the category contained fewer than 10 students with disabilities (see appendix A).
Source: Authors’ analysis based on data from Massachusetts Department of Elementary and Secondary Education, (2006b).
10 Performance Patterns for students with disabilities in grade 4 mathematics in massachusetts
Performance improved for students with dis-•abilities and declined or remained unchanged for general education students.
Performance declined for both subgroups but •declined more for general education students.
The decrease was not due to the first reason (both subgroups increasing with students with disabilities increasing by more; see table 2). So, only the last two reasons apply across Massachusetts.
Across the state from 2004 to 2006 the profi-ciency gap decreased by 1.9 percentage points, as general education students’ proficiency rates decreased more than those of students with disabilities.
In four of the eight similar school categories •that could be examined (suburban low and medium need, and rural low and medium
need), the gap decreased from 2004 to 2006. In suburban low- and medium-need schools general education students declined in pro-ficiency more than students with disabilities did. In rural low- and medium-need schools proficiency rates increased for students with disabilities but declined for general education students.
In urban medium- and high-need schools, •suburban high-need schools, and rural high-need schools the proficiency gap increased from 2004 to 2006. In urban medium-need and rural high-need schools proficiency rates for students with disabilities increased, but those for general education students increased more.
Schools in which the proficiency gap narrowed
The NCLB Act holds each school accountable for ensuring that every subgroup makes adequate
Percent
0
25
50
75
100
HighMediumLowHighMediumLowHighMediumLowState
29.9
19.8
37.8
30.3 23.6
24.2 29.8 29.7
31.1
RuralSuburbanUrban
General education students
Students with disabilities
Percentage point difference
figure 5
Comparison of the percentage of grade 4 general education students and students with disabilities scoring proficient, across Massachusetts and by locale-need categories, 2006
a. No performance data reported because all schools in the category contained fewer than 10 students with disabilities (see appendix A), so percentage point difference cannot be calculated.
Source: Authors’ analysis based on data from Massachusetts Depart-ment of Elementary and Secondary Education (2006b).
–15
–10
–5
0
5
10
HighMediumLowHighMediumLowHighMediumLowaState
Percentage point change
RuralSuburbanUrban
5.5
–0.9
–9.8
5.2
–3.5–2.9
0.10.8
–1.9
figure 6
Change in the percentage point difference of grade 4 general education students and students with disabilities scoring proficient, across the state and by locale-need category, 2004–06
a. No performance data reported because all schools in the category contained fewer than 10 students with disabilities (see appendix A), so percentage point difference cannot be calculated.
Source: Authors’ analysis based on data from Massachusetts Depart-ment of Elementary and Secondary Education (2006b).
concluSion 11
yearly progress. This section examines data on a school-by-school basis from 2004 to 2006. In the previous analysis, which examined the proficiency gaps within similar categories of schools—com-bining proficient students from all schools within a need level, locale, or both—data were pooled from schools that increased their proficiency gap and schools that decreased it. By contrast, the analysis in this section looks only at schools in which the proficiency gap decreased and excludes all schools with declining performance by general education students.
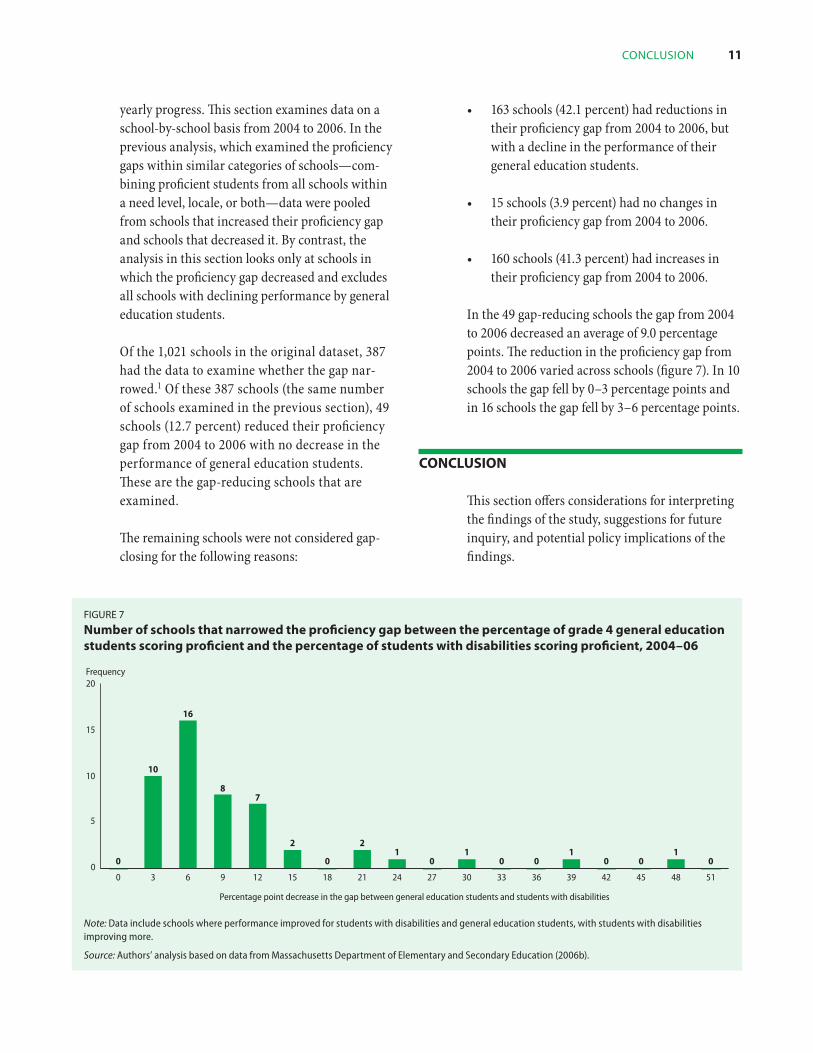
Of the 1,021 schools in the original dataset, 387 had the data to examine whether the gap nar-rowed.1 Of these 387 schools (the same number of schools examined in the previous section), 49 schools (12.7 percent) reduced their proficiency gap from 2004 to 2006 with no decrease in the performance of general education students. These are the gap-reducing schools that are examined.
The remaining schools were not considered gap-closing for the following reasons:
163 schools (42.1 percent) had reductions in •their proficiency gap from 2004 to 2006, but with a decline in the performance of their general education students.
15 schools (3.9 percent) had no changes in •their proficiency gap from 2004 to 2006.
160 schools (41.3 percent) had increases in •their proficiency gap from 2004 to 2006.
In the 49 gap-reducing schools the gap from 2004 to 2006 decreased an average of 9.0 percentage points. The reduction in the proficiency gap from 2004 to 2006 varied across schools (figure 7). In 10 schools the gap fell by 0–3 percentage points and in 16 schools the gap fell by 3–6 percentage points.
conclusion
This section offers considerations for interpreting the findings of the study, suggestions for future inquiry, and potential policy implications of the findings.
0
5
10
15
20
51484542393633302724211815129630
Frequency
01
001
001
01
2
0
2
78
16
10
0
Percentage point decrease in the gap between general education students and students with disabilities
figure 7
number of schools that narrowed the proficiency gap between the percentage of grade 4 general education students scoring proficient and the percentage of students with disabilities scoring proficient, 2004–06
Note: Data include schools where performance improved for students with disabilities and general education students, with students with disabilities improving more.
Source: Authors’ analysis based on data from Massachusetts Department of Elementary and Secondary Education (2006b).

12 Performance PaTTernS for STudenTS WiTh diSabiliTieS in grade 4 maThemaTicS in maSSachuSeTTS
Considerations in interpreting results
Although this report adds to the growing litera-ture on the performance of students with dis-abilities (see, for instance, Thurlow, Moen, and Altman 2006; VanGetson and Thurlow 2007), data limitations affect the interpretation of the findings (for more details, see appendix A).
Several factors that can provide greater insight into the patterns of student performance, such as student characteristics and accommodation policies (as noted by McLaughlin 2006), were unaccounted for. Some of these factors can be assessed only through student-level data, which are not typically available publicly. For instance, performance may be affected by multiple subgroup status (for example, a student with a disability who is also eligible for free or reduced-price lunch), which may have a higher occurrence in certain locales and need levels, but is not indicated in the
dataset. Additionally, publicly available datasets typically contain cross-sectional data, so each year’s data come from a new cohort of students. Thus, a change in performance from one year to the next does not mean that a group of students improved or worsened over that period. It could simply reflect changes in the composition of students.
A school’s performance for the students with disabilities sub-group may also vary dramatically from year to year because of differ-
ences in the types and severities of the disabilities among cohorts of students, an effect that can be magnified by the small size of this subgroup. Dis-tricts may also vary in how they classify students with disabilities. For example, an urban district may give the classification of “specific learning disability” to students with more severe disabili-ties than does a suburban district. The available dataset does not permit comparing the composi-tion of the students with disabilities subgroup
across locale and need categories—another limita-tion on interpreting the findings.
An added consideration is the way performance was measured. Performance was presented in the publicly available dataset as the percentage of students scoring proficient or above in each school, rather than as an average test score. So, in this re-port signs of improvement over time were limited to increases in the percentage of students reach-ing proficiency. But students often improve their scores without moving to the next proficiency level, particularly in the students with disabilities subgroup, where many students are in the needs improvement category. Such improvements are masked in the available data. So, lack of improve-ment in the percentage of students with dis-abilities reaching proficiency does not mean that student scores did not improve. The average score of all students in the needs improvement category could have increased but not enough to reach the proficient category.
Nearly half the schools in Massachusetts were not included in the analyses because of missing, removed, or excluded data—particularly because Massachusetts does not allow schools to report data for subgroups with fewer than 10 students. Students in excluded schools may not have per-formed the same as their counterparts included in the analyses. This limitation is particularly relevant for rural schools, where the highest pro-portion of schools had data excluded data because of small subgroups. An even larger proportion of schools was omitted from the analyses of trends over time because of the requirement that a school have data for general education students and stu-dents with disabilities in both 2004 and 2006.
Last, the performance of students with disabili-ties in Massachusetts may partly reflect the high standards and difficulty of the MCAS (Cronin et al. 2007; U.S. Department of Education 2007b). Massachusetts is one of only two states (of 33) whose proficiency cutoff point is higher than that of the National Assessment of Educational Progress (NAEP) for grade 4 math. So, students
lack of improvement
in the percentage of
students with disabilities
reaching proficiency
does not mean that
student scores did not
improve. The average
score of all students in
the needs improvement
category could have
increased but not
enough to reach the
proficient category

concluSion 13
must perform better on the MCAS than on the NAEP to reach proficiency. These high stan-dards and difficulty of the MCAS are important in interpreting the report’s findings, both for performance at a single point in time and for the improvement rates of the students with disabili-ties subgroup.
Areas for further inquiry
The findings and the limitations of the analyses suggest several areas for future research. One con-cern is whether the same students with disabilities improved from year to year and how individual performance may vary over time by disability type and severity. While school-level performance data cannot be used to examine these trends, student-level performance data could be collected on the same cohort of students with disabilities across several years. By using student-level data, future research might also examine whether students in multiple subgroups are less likely to make ad-equate yearly progress.
To address how to help students with disabilities improve their education attainment, research could examine the practices and policies of schools and districts where students with dis-abilities display high achievement—especially in schools with high-need student populations. To help explain how proficiency rates change from year to year, a closer look may also be warranted for the policies and practices that Massachusetts applies to all its students. In 2006, for example, Massachusetts began implementing the Expanded Learning Time initiative, a pilot program that “enables schools to significantly expand the hours and days in their school schedules to create integrated learning experiences for all students that are responsive to students’ needs and the higher expectations set by state and federal laws” (Massachusetts Department of Elementary and Secondary Education 2006a). It seems plausible that such programs could improve mathematics performance for both students with disabilities and general education students—useful knowl-edge for other states.
Massachusetts standards are difficult compared with those of other states and the NAEP (Cronin et al. 2007; U.S. Department of Education 2007b). This raises a question for future research. Do states with more stringent standards than the NAEP dif-fer from states with less stringent standards in the performance and improvement of students with disabilities? This research could provide context for interpreting performance patterns in Mas-sachusetts and other states with high standards, highlighting for federal policymakers the implica-tions of having similar expectations across states with varying proficiency cutoffs on state tests.
Potential policy implications of the findings
The report can help policymakers and education leaders understand the performance of students with disabilities—and make informed, data-driven decisions about policy and practice.
First, the report’s finding of large variations across different locale and need categories underpins the value of comparing schools with others in the same category, rather than with the state aver-age. Examining the performance of students in schools that are similar to one another—as done here using locale and need categories and by looking at schools with high performance in these categories—realizes the suggestion made in a pre-vious report regarding the examination of perfor-mance among similar school groupings (Johnson, Peck, and Wise 2007).
Second, the findings raise questions about the long-term chances of states reaching adequate yearly progress targets and about the adequacy of today’s assessments. Although nearly half of Massachusetts schools improved their propor-tion of students with disabilities scoring proficient or above, far fewer reduced their proficiency gap without performance
The report’s finding
of large variations
across different locale
and need categories
underpins the value
of comparing schools
with others in the same
category, rather than
with the state average

14 Performance PaTTernS for STudenTS WiTh diSabiliTieS in grade 4 maThemaTicS in maSSachuSeTTS
faltering among general education students. Reaching the goal of complete proficiency by 2014 can occur only if both subgroups improve and the proficiency gap closes.
Third, Massachusetts’s “world class” expectations for student learning, evident in the difficulty of the MCAS, may help explain the state’s strong perfor-mance on the NAEP. On the 2007 NAEP grade 4 mathematics test Massachusetts students with disabilities had the highest average scaled score (238) and proficiency rates (33 percent) across all states (Lee, Grigg, and Dixon 2007). But these high expectations may also help explain the low profi-ciency rates of students with disabilities. Massa-chusetts is commended for its high standards and NAEP performance, but these standards penalize the state for adequate yearly progress determi-nations—its schools face the same sanctions as schools in states with lower proficiency standards.
Most important, this report may be useful to education leaders and policymakers in other states
and nationally. The questions asked and the results obtained were confined by the cross-sectional na-ture of the data—the same type of data states must use for calculating adequate yearly progress under the NCLB Act. Education leaders need to know how to explore and analyze cross-sectional data to understand the types of questions that such data can reliably answer. And they need to understand the limitations of results that can be derived with such data.
Education leaders and policymakers should con-sider ways to better illuminate the performance of students with disabilities. Growth models, for instance, which evaluate school effectiveness by measuring individual student learning over time, require longitudinal performance and back-ground data on each student. A benefit of such models is their avoidance of variations due to changes in the composition of the students being studied—a chief limitation of current analyses (Gong, Perie, and Dunn 2006; Goldschmidt et al. 2005).

aPPendix a 15
APPendix A dATA sources And MeThods
This appendix discusses Massachusetts publicly available datasets and the limitations of the dataset.
Massachusetts’ publicly available datasets
The No Child Left Behind (NCLB) Act requires each state to make disaggregated student per-formance data publicly available. These data are cross-sectional, consisting of information on different cohorts of students over time in a given grade. Cross-sectional data are often employed by states and districts to analyze student perfor-mance over time, and federal, state, and district decisions are made based on analyses of publicly available datasets. Thus, it is important to know what types of questions can be answered using cross-sectional data, as well as the limitations on interpreting results and analyzing such data.
This study describes the performance of students with disabilities and general education students on the Massachusetts Comprehensive Assess-ment System (MCAS) mathematics test, using cross-sectional data made publicly available by the Massachusetts Department of Elementary and Secondary Education. The dataset used to analyze the mathematics performance of students with disabilities was created from the publicly available data on the Massachusetts Department of Elemen-tary and Secondary Education web site (http://profiles.doe.mass.edu). The web site contains population and performance data for all schools that administered the MCAS, as well as additional school indicators. The following variables were used in the analyses:
School name.•
Number of students participating in the •MCAS (overall and by subgroup).
Percentage of students participating in the •MCAS (overall and by subgroup).
Percentage of students that performed at each •level of proficiency (overall and by subgroup):
Warning.•Needs improvement.•Proficient.•Advanced.•
Massachusetts has been administering the MCAS mathematics test to students in grade 4 since 1997. The test for grades 3 and 5 were introduced in 2006 to meet NCLB requirements. The grade 4 mathematics test is administered each year in May and consists of two sessions, each designed to take 60 minutes (though all MCAS tests are untimed). The mathematics tests consist of three types of questions: open response, short answer, and mul-tiple choice. These tests measure student progress against the academic standards of the Massachu-setts Curriculum Frameworks. The MCAS reports students’ results by using four performance levels: advanced, proficient, needs improvement, and warning.
While the Massachusetts Department of Elemen-tary and Secondary Education web site provides extensive MCAS performance data on students with disabilities starting with the 2000/01 school year, recent changes in reporting make it inac-curate to compare data on students with dis-abilities across all six years (2000/01–2005/06). In 2006 the MCAS students with disabilities category was redefined according to the federal definition used for adequate yearly progress. Prior to 2006 the MCAS students with disabilities category included students with both Individu-alized Education Programs and 504s, whereas the adequate yearly progress definition does not include students with 504s.2 In addition, in 2006 the Department of Elementary and Secondary Education made changes in 2006 to the way data were reported for absent students and for students who had not attended school since October. The 2004 and 2005 datasets were revised to follow the 2006 rules and policies. Datasets for earlier years (1998–2003), however, were not revised at the time of this analysis and thus are not included in this report.
16 Performance PaTTernS for STudenTS WiTh diSabiliTieS in grade 4 maThemaTicS in maSSachuSeTTS
This report focuses on performance data for three school years: 2003/04, 2004/05, and 2005/06, which are referred to by their second semester years (2004, 2005, and 2006). Data for 2006 are examined for snapshots of the perfor-mance of students with disabilities or of stu-dents at schools where students with disabilities performed in the top 10 percent of the perfor-mance distribution. Data from 2004 to 2006 are examined for describing changes over time. And data from 2004 and 2006 are examined for categorizing schools as improving or reducing proficiency gaps.
Excluded data
Unreported, missing, or removed data are de-scribed below.
Unreported data. To protect the privacy of indi-vidual students, Massachusetts State does not publicly report the performance data for students in subgroups that contain fewer than 10 students (in a given school in grade 4). Thus, those schools were excluded from the analyses of MCAS perfor-mance for that subgroup. About half the schools did not have reported data for the students with disabilities subgroup, and a very small number of schools (about 20) did not have reported data for the general education subgroup.
Missing data. Data appeared to be missing from the publicly available datasets when the Depart-ment of Elementary and Secondary Education reported neither the number of students in a sub-group at a school nor the performance data. Since it was not known whether these data failed to be reported or whether these schools did not exist in previous years, all such cases were considered as missing data. In addition, there were 1,189 elemen-tary schools in Massachusetts in 2006, but only 1,021 schools with grade 4 data reported in the publicly available dataset for 2006. Again, it was not known whether data for these schools were not reported or whether these schools did not have a grade 4.
Removed data. To accurately represent the per-formance of most students with disabilities in Massachusetts elementary schools, outlier schools were dropped from the analyses. Outliers were defined as schools with student populations in this subgroup that were more than two standard devia-tions higher or lower than the mean of the data:
> (μ + 2*SD) or < (μ – 2*SD).
Because schools with very low percentages of students with disabilities (with N-sizes less than 10) were already removed from the dataset, outlier data were removed for schools whose students with disabilities subgroup constituted high proportions of the student population (table A1). It was assumed that these very high percent-ages characterized schools that teach primarily students with disabilities and that it would be misleading to compare their population and per-formance data with most of the state’s elementary schools. Outliers accounted for just 1–2 percent of the dataset (10–14 schools).
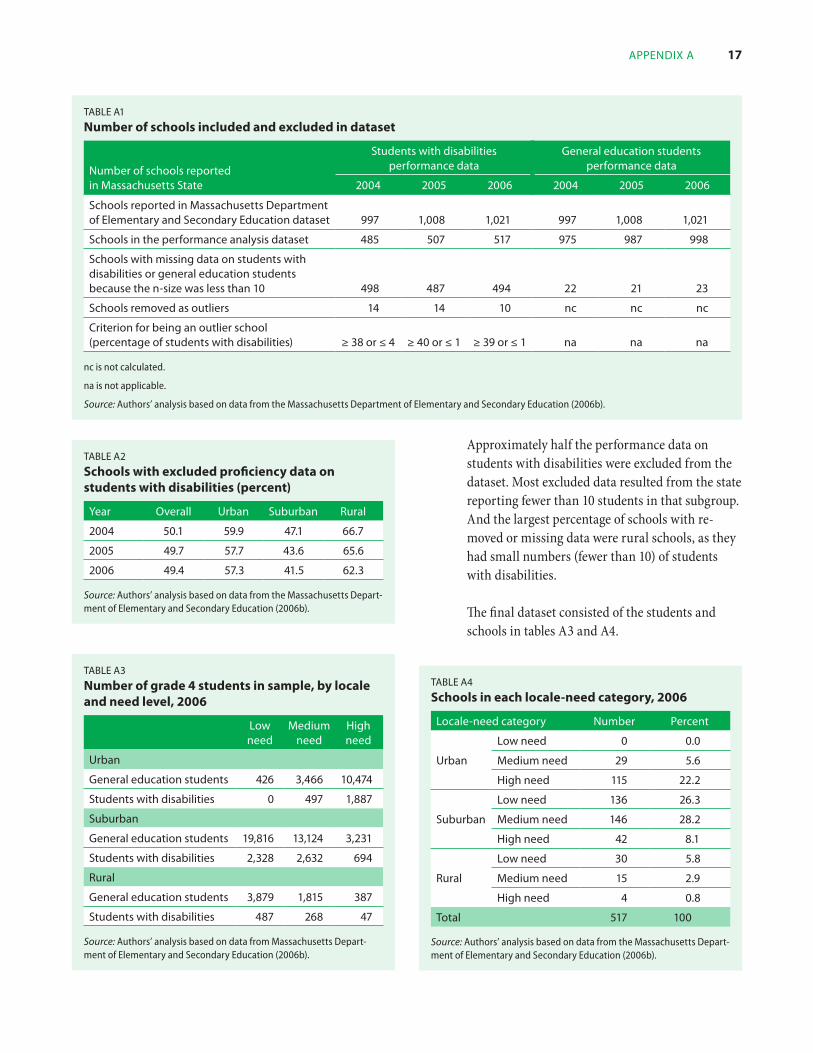
Summary. Because of missing and unreported data and removal of outlier data, the perfor-mance dataset used to calculate all proficiency information includes a smaller number of schools with students with disabilities data than the number of schools in the population data-set. Table A1 shows the number of schools in the complete dataset and the number of schools with excluded data on students with disabilities of general education students. The number of schools with missing data in 2004 and 2005 is represented by the difference between the num-ber of reported schools in those years and the number reported in 2006.
Table A2 shows the percentage of schools that removed data on students with disabilities (either because of unreported or removed outlier data) within each locale. For example, in all rural schools reported in 2006, 62.3 percent (the highest percentage out of all the locales) were not included in the dataset.
aPPendix a 17
Approximately half the performance data on students with disabilities were excluded from the dataset. Most excluded data resulted from the state reporting fewer than 10 students in that subgroup. And the largest percentage of schools with re-moved or missing data were rural schools, as they had small numbers (fewer than 10) of students with disabilities.
The final dataset consisted of the students and schools in tables A3 and A4.
Table a1
number of schools included and excluded in dataset
number of schools reported in massachusetts State
Students with disabilities performance data
general education students performance data
2004 2005 2006 2004 2005 2006
Schools reported in massachusetts department of elementary and Secondary education dataset 997 1,008 1,021 997 1,008 1,021
Schools in the performance analysis dataset 485 507 517 975 987 998
Schools with missing data on students with disabilities or general education students because the n-size was less than 10 498 487 494 22 21 23
Schools removed as outliers 14 14 10 nc nc nc
criterion for being an outlier school (percentage of students with disabilities) ≥ 38 or ≤ 4 ≥ 40 or ≤ 1 ≥ 39 or ≤ 1 na na na
nc is not calculated.
na is not applicable.
Source: Authors’ analysis based on data from the Massachusetts Department of Elementary and Secondary Education (2006b).
Table a2
schools with excluded proficiency data on students with disabilities (percent)
year overall urban Suburban rural
2004 50.1 59.9 47.1 66.7
2005 49.7 57.7 43.6 65.6
2006 49.4 57.3 41.5 62.3
Source: Authors’ analysis based on data from the Massachusetts Depart-ment of Elementary and Secondary Education (2006b).
Table a3
number of grade 4 students in sample, by locale and need level, 2006
low need
medium need
high need
urban
general education students 426 3,466 10,474
Students with disabilities 0 497 1,887
Suburban
general education students 19,816 13,124 3,231
Students with disabilities 2,328 2,632 694
rural
general education students 3,879 1,815 387
Students with disabilities 487 268 47
Source: Authors’ analysis based on data from Massachusetts Depart-ment of Elementary and Secondary Education (2006b).
Table a4
schools in each locale-need category, 2006
locale-need category number Percent
urban
low need 0 0.0
medium need 29 5.6
high need 115 22.2
Suburban
low need 136 26.3
medium need 146 28.2
high need 42 8.1
rural
low need 30 5.8
medium need 15 2.9
high need 4 0.8
Total 517 100
Source: Authors’ analysis based on data from the Massachusetts Depart-ment of Elementary and Secondary Education (2006b).
18 Performance PaTTernS for STudenTS WiTh diSabiliTieS in grade 4 maThemaTicS in maSSachuSeTTS
Data limitations
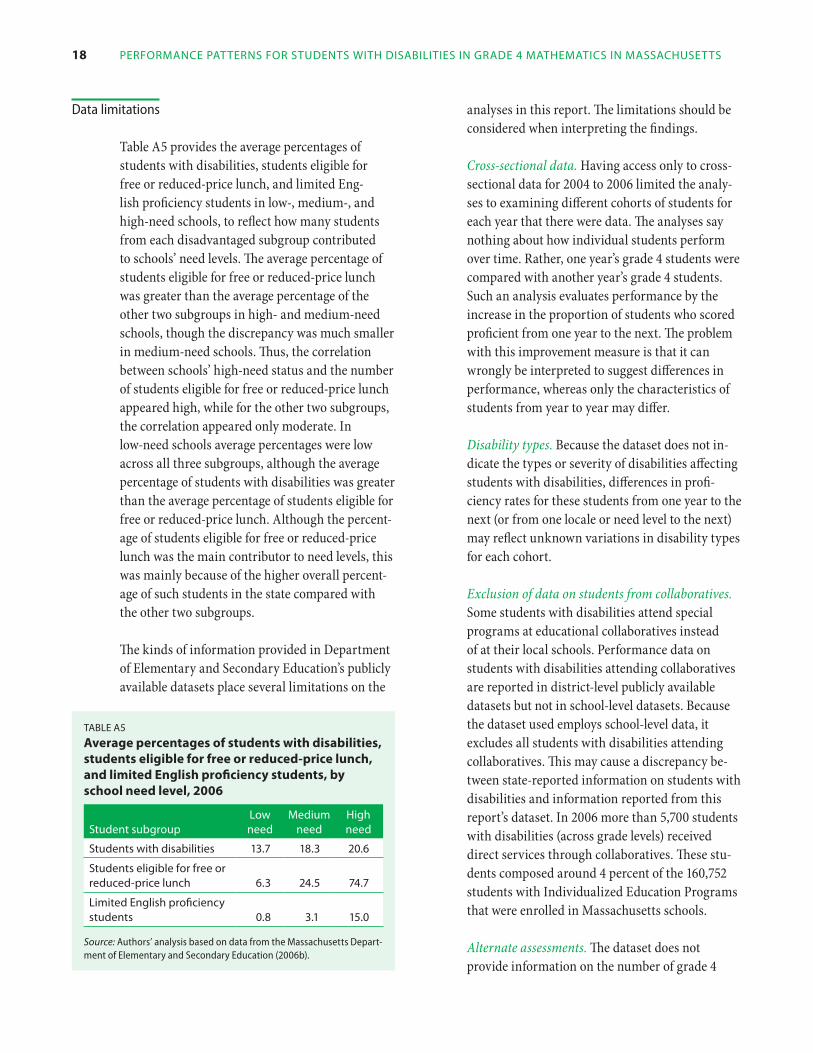
Table A5 provides the average percentages of students with disabilities, students eligible for free or reduced-price lunch, and limited Eng-lish proficiency students in low-, medium-, and high-need schools, to reflect how many students from each disadvantaged subgroup contributed to schools’ need levels. The average percentage of students eligible for free or reduced-price lunch was greater than the average percentage of the other two subgroups in high- and medium-need schools, though the discrepancy was much smaller in medium-need schools. Thus, the correlation between schools’ high-need status and the number of students eligible for free or reduced-price lunch appeared high, while for the other two subgroups, the correlation appeared only moderate. In low-need schools average percentages were low across all three subgroups, although the average percentage of students with disabilities was greater than the average percentage of students eligible for free or reduced-price lunch. Although the percent-age of students eligible for free or reduced-price lunch was the main contributor to need levels, this was mainly because of the higher overall percent-age of such students in the state compared with the other two subgroups.
The kinds of information provided in Department of Elementary and Secondary Education’s publicly available datasets place several limitations on the
analyses in this report. The limitations should be considered when interpreting the findings.
Cross-sectional data. Having access only to cross-sectional data for 2004 to 2006 limited the analy-ses to examining different cohorts of students for each year that there were data. The analyses say nothing about how individual students perform over time. Rather, one year’s grade 4 students were compared with another year’s grade 4 students. Such an analysis evaluates performance by the increase in the proportion of students who scored proficient from one year to the next. The problem with this improvement measure is that it can wrongly be interpreted to suggest differences in performance, whereas only the characteristics of students from year to year may differ.
Disability types. Because the dataset does not in-dicate the types or severity of disabilities affecting students with disabilities, differences in profi-ciency rates for these students from one year to the next (or from one locale or need level to the next) may reflect unknown variations in disability types for each cohort.
Exclusion of data on students from collaboratives. Some students with disabilities attend special programs at educational collaboratives instead of at their local schools. Performance data on students with disabilities attending collaboratives are reported in district-level publicly available datasets but not in school-level datasets. Because the dataset used employs school-level data, it excludes all students with disabilities attending collaboratives. This may cause a discrepancy be-tween state-reported information on students with disabilities and information reported from this report’s dataset. In 2006 more than 5,700 students with disabilities (across grade levels) received direct services through collaboratives. These stu-dents composed around 4 percent of the 160,752 students with Individualized Education Programs that were enrolled in Massachusetts schools.
Alternate assessments. The dataset does not provide information on the number of grade 4
Table a5
Average percentages of students with disabilities, students eligible for free or reduced-price lunch, and limited english proficiency students, by school need level, 2006
Student subgrouplow need
medium need
high need
Students with disabilities 13.7 18.3 20.6
Students eligible for free or reduced-price lunch 6.3 24.5 74.7
limited english proficiency students 0.8 3.1 15.0
Source: Authors’ analysis based on data from the Massachusetts Depart-ment of Elementary and Secondary Education (2006b).

aPPendix a 19
students with disabilities in each school who took the MCAS-Alternate Assessment. So, it is not pos-sible to determine the impact of schools’ participa-tion rates for the MCAS-Alternate Assessment on the performance of their students with disabilities. The impact is likely to be small, however, because NCLB regulations limit the number of students in each local education agency that can be counted as proficient using alternate achievement stan-dards to 1 percent of the local education agency’s enrollment in each testing grade. In Massachusetts overall only 8.7 percent of grade 4 students with disabilities (1,753) took the MCAS-Alternative As-sessment in 2006.
Overlap of student subgroups. Although the students with disabilities and general education students categories are mutually exclusive (and together account for 100 percent of the grade 4 student population in each reported school), either category could overlap with students eligible for free or reduced-price lunch or limited English pro-ficiency students. The school-level dataset does not provide information on whether students fall into more than one subgroup (overlaps are more likely
in higher need schools and urban schools). So, it is not possible to determine whether students with disabilities who belong to other disadvantaged subgroups have different performance patterns from students with disabilities who do not. Such differences may have implications for interpreting student proficiency results and for making com-parisons across locale and need levels.
Exclusion of scaled scores. Data were the percent-age of students scoring at the warning, needs im-provement, proficient, and advanced level, rather than scaled scores. This limits the identification of progress to movement between proficiency levels, rather than within proficiency levels.
Unreported or missing data. For reasons already explained (see above “Excluded data”), data from about half of elementary schools (containing grade 4) were not included in the analyses of this report. This report does not provide information about how grade 4 students with disabilities are performing in schools that have very small num-bers for this subgroup or for other schools that were excluded for unknown reasons.

20 Performance PaTTernS for STudenTS WiTh diSabiliTieS in grade 4 maThemaTicS in maSSachuSeTTS
noTes
Schools were removed if they had unreported, 1. missing, or removed data for 2004 or 2006, or if students with disabilities did not improve over this time period.
A 504 plan is a legal document that outlines a 2. plan for instructional services, such as accom-modations for students in the general educa-tion setting. It differs from an Individualized Education Program. For more information, please see http://www.ed.gov/about/offices/list/ocr/504faq.html.
referenceS 21
references
Blackorby, J., Knokey, A. M., Wagner, M., Levine, P., Schil-ler, E., & Sumi, C. (2007). What makes a difference? Influences on outcomes for students with disabilities (Special Education Elementary Longitudinal Study SRI Project P10656). Washington, DC: U.S. Department of Education, Office of Special Education Programs. Retrieved June 20, 2007, from http://www.seels.net/designdocs/SEELS_W1W3_FINAL.pdf.
Cronin, J., Dahlin, M., Adkins, D., & Kingsbury, G. (2007). The proficiency illusion. Washington, DC: Thomas B. Fordham Institute. Retrieved July 22, 2008, from http://www.edexcellence.net/doc/The_Proficiency_Illusion.pdf.
Goldschmidt, P., Roschewski, P., Choi, K., Auty, W., Heb-bler, W., & Blank, R. (2005). Policymakers’ guide to growth models for school accountability: how do ac-countability models differ? Washington, DC: The Coun-cil of Chief State School Officers. Retrieved August 1, 2007, from http://www.ccsso.org/publications/details.cfm?PublicationID=287.
Gong, B., Perie, M., & Dunn, J. (2006). Using student longitudinal growth measures for school accountability under No Child Left Behind: an update to inform design decisions. Dover, NH: Center for Assessment. Retrieved July 19, 2007, from http://www.nciea.org/publications/GrowthModelUpdate_BGMAPJD07.pdf.
Individuals with Disabilities Act, Pub. L. No. 108-446, 108 (2004). Retrieved June 20, 2007, from http://idea.ed.gov/.
Johnson, K. E., Peck, K., & Wise, J. (2007). The students with disabilities subgroup and adequate yearly progress in Mid-Atlantic Region schools. (Issues & Answers Report, REL 2007–No. 018). Washington, DC: U.S. Department of Education, Institute of Education Sciences, National Center for Education Evaluation and Regional Assis-tance, Regional Educational Laboratory Mid-Atlantic. Retrieved August 1, 2007, from http://ies.ed.gov/ncee/edlabs/projects/project.asp?id=22.
Koretz, D. (2006). The pending reauthorization of NCLB: an opportunity to rethink the basic strategy. Paper for Civil
Rights Project/Earl Warren Institute Roundtable Dis-cussion on the Reauthorization of NCLB, Washington, DC, November 16, 2006.
Lee, J., Grigg, W., & Dion, G. (2007). The nation’s report card mathematics 2007 (NCES 2007-495). Washing-ton, DC: U.S. Department of Education, National Center for Education Statistics. Retrieved October 10, 2007, from http://nces.ed.gov/nationsreportcard/pdf/main2007/2007494.pdf.
Massachusetts Department of Elementary and Sec-ondary Education. (2006a). State 2006 adequate yearly progress report. Retrieved March 20, 2007, from http://profiles.doe.mass.edu/ayp2006/school.aspx?orgcode=00000000.
Massachusetts Department of Elementary and Secondary Education. (2006b). Profiles. Retrieved March 8, 2007, from http://profiles.doe.mass.edu/.
McLaughlin, M. J. (2006). Closing the achievement gap and students with disabilities: the new meaning of a “ free and appropriate public education.” Paper presented at the Symposium Examining America’s Commitment to Closing Achievement Gaps: NCLB and Its Alternatives, sponsored by the Campaign for Educational Equity, Teachers College, Columbia University, November 13–14, 2006.
New York City Department of Education. (2007). Similar school achievement comparison reports. Retrieved October 1, 2006, from http://schools.nyc.gov/daa/ARCHV_reports/default.asp#RR.
No Child Left Behind Act of 2001, Pub. L. No. 107–110. Retrieved April 2008 from http://www.ed.gov/nclb/landing.jhtml
Rothstein, R., Jacobsen, R., & Wilder, T. (2006). “Profi-ciency for all”—an oxymoron. Paper presented at the Symposium Examining America’s Commitment to Closing Achievement Gaps: NCLB and Its Alternatives, sponsored by the Campaign for Educational Equity, Teachers College, Columbia University, November 13–14, 2006.

22 Performance PaTTernS for STudenTS WiTh diSabiliTieS in grade 4 maThemaTicS in maSSachuSeTTS
Thurlow, M. L., Moen, R., & Altman, J. (2006). Annual performance reports (2003–2004): state assessment data (Technical Report 46). Minneapolis, MN: Uni-versity of Minnesota, National Center on Educational Outcomes. Retrieved April 2007, from http://www.education.umn.edu/NCEO/OnlinePubs/APR203-04.pdf.
U.S. Department of Education, National Center for Educa-tion Statistics. (2006). Common Core of Data, Public School Search. Retrieved June 15, 2007, from http://nces.ed.gov/ccd/schoolsearch/.
U.S. Department of Education, National Center for Educa-tion Statistics. (2007a). The condition of education 2007
(NCES 2007-064).Washington, DC: U.S. Government Printing Office.
U.S. Department of Education, National Center for Educa-tion Statistics. (2007b). Mapping 2005 state proficiency standards onto the NAEP scales (NCES 2007-482).Washington, DC: U.S. Government Printing Office.
VanGetson, G. R., & Thurlow, M. L. (2007). Nearing the target in disaggregated subgroup reporting to the public on 2004–2005 assessment results (Technical Report No. 46). Minneapolis, MN: University of Minnesota, National Center on Educational Outcomes. Retrieved April 2007, from http://education.umn.edu/NCEO/OnlinePubs/Tech46/.