
A Preliminary Assessment of Partitioning and Transmutation ...
Upload
independentCategory
view
1download
0
1
PERFORMANCE ON ACTINIDE TRANSMUTATION OF LEAD-THORIUM BASED ADS
R. Fernández, M. Embid, J. García-Sanz, E. GonzálezFACET group. CIEMAT.
Av. Complutense 22, Madrid 28040Spain
Abstract
The FACET group at CIEMAT is studying the properties and potentialities of several lead-cooledADS designs for actinide and fission product transmutation. The main characteristics of these systemsare the use of lead as primary coolant and moderator and fuels made by transuranics inside a thoriumoxide matrix.
The aim of the study is to analyse the effect of some operation parameters (fuel transuranicscomposition, thermal power and transuranics recycling scheme) in the ADS performance, mainly inthe achieved transmutation rates and in the accelerator requirements.
The model selected enhances the energy production by the 233U breeding from thorium seed. Thisbreeding can maintain the neutron multiplication during long burnups, improving the transmutationcapacity. The fuel inventory isotopic evolution during burnup will be presented illustrating thegeneral capabilities of this strategic option for transuranics transmutation.

2
Introduction
One of the major problems of nuclear power production is the undesired long-lived radioactivewaste that comes from the spent fuel used for electricity production. Currently many countries plan todeal with these products storing them into geological repositories. However, in the recent years anincreasing attention is paid to the transmutation option as a complementary activity to geologicaldisposal in a near future [1]. Among the foreseen advantages of transmutation are a reduction involume of the high level waste and a reduction in the long-term radiotoxicity inventory, with animpact in reducing the final costs and potential risks of the geological repository.
The transmutation of radioactive waste could be applied to two main groups of nuclides, eachgroup with its own elimination methods and different impact in the waste management strategy:
− The transuranics (TRUs) mainly neptunium, plutonium, americium and curium isotopescoming from the LWR’s discharge. They are responsible of the long-term radiotoxicity andtheir elimination should be done by fission since every neutron capture just increases themass number of the considered actinide. Any optimised TRUs transmutation strategy has toreach the highest fission to capture ratios, something not easy to achieve in the case of thefissile under threshold TRUs, and take into account the energy production duringtransmutation process.
− The fission products (FP), some of them with a very large radiotoxical potential in the shortor even in the long term. Their elimination means to transform them by neutron capture andsubsequent radioactive decay into stable isotopes, something that has some extra energy cost.
The impact of the transmutation in the waste management policy of each country will depend onthe size of the local nuclear power industry and the characteristics of the current and foreseen nuclearfuel cycle, among others. An optimal use of nuclear waste transmutation is unavoidable connected tothe development of partitioning methods due to the necessity to separate waste streams: TRUs and FPfrom the spent fuel uranium matrix. Currently, nuclear fuel reprocessing is available only in a fewcountries in the world. In addition, some countries assume that plutonium is another nuclear fuelinstead of as waste, and burn it with the MOX fuel technologies. To them, the TRUs eliminationmeans neptunium, americium and curium elimination in specially design systems, with differentproperties compared to the TRU-with plutonium charged ADS.
Due to the diverse points of view about transmutation, there is a wide scope of R&D strategiesthat has produced a large amount of proposed policies and systems for nuclear waste transmutationthat could be available in the near future. However, in the last decade the Accelerator Driven Systems(ADS) appear among the most promising transmutation systems. Basically the common componentsof every ADS are:
− A subcritical core (k<1), loaded with the unwanted TRUs and (maybe) FP to eliminate.
− A proton accelerator, producing a beam of some mA of intensity and an energy of a fewhundreds of MeV. This beam produces the spallation neutron source that the subcritical coreneed in order to maintain its operation regime.
The subcritical core configuration of the ADS would allow burning up some atypical actinidemixtures for long irradiation periods; with this kind of systems it is not necessary to reach somereactivity excess in order to start the operation, because the external source maintain the steady state.

3
The Energy Amplifier Model of Lead-thorium Based ADS
The ADS model considered in the present study is the so-called Energy Amplifier (EA), aconcept developed at CERN by Prof. C. Rubbia’s research group [2].
Basically an EA is an ADS cooled by molten lead, material that also works as spallation targetand neutron diffusing medium. Because of the special neutronics properties of lead, the neutronregime is fast (an energy spectrum centred on a few hundreds of keV). The fast EA design is, inprinciple, very adequate for elimination of those TRUs non-fissile under thermal spectra (seediscussion in refs. [2]). The EA concept is very flexible permitting:
− A neutron multiplication constant (keff) that could vary between 0.93 and 0.98. The chose ofkeff value has an important impact on accelerator requirements.
− Both metal and oxide fuel has been proposed, depending the final selection on the powerdensity limits and the working temperatures. Typically in the EA core, the TRUs charge totransmute is mixed into a thorium matrix. The presence of thorium allows the system tomaintain the neutron multiplication: the fissile TRUs burning can be compensated by the232Th to 233U breeding, followed by 233U fission.
− A wide range of operating conditions, with different thermal power (a few MW up to 1500 MW) or (equivalently) proton beam conditions (300 MeV to a few GeV of energy),depending on the model considered. The operating conditions will play an important role inthe transmutation efficiency.
− Options under study have been presented by Rubbia’s team [2] for FP incineration,distributing them in the lead diffusive media outside the EA core.
The simulations performed in this study have been focused primarily in the effects of the initialTRUs inventory composition, the thermal power and the proton beam energy on the performance ofthe system. The table 1 summarised the main parameters of the models under study. Two thermalenergy outputs have been considered: 200 MW, which corresponds to a large-size demo EA facility,and a medium-size energy production unit of 800 MW. For simulation purposes, it has been supposedthat the increase in thermal power is gained not directly by beam intensity increase but by protonkinetic energy growth, therefore going from 200 MWth to 800 MWth would imply a proton energy risefrom 380 MeV to 1 GeV.
The study on the nuclear fuel composition effect on the EA performance has been done for threeselected TRU mixtures. These mixtures have been calculated with ORIGEN2.1 [3] (table 2)modelling a typical PWR discharge. The differences are due to the cooling down time, considered asthe delay time between the PWR discharge and the EA load (10, 25 and 40 years). The hypothesis isthat the PWR discharge reprocessing produces a transuranics stream without any specific elementseparation inside it. This means that neptunium, plutonium, americium and curium are extracted inalmost the same relative percentage they have in the spend fuel.
Basically, increasing the cooling down time produces an increase in the 241Am concentration by241Pu decay. This conversion will have an important effect in neutronic properties evolution of the EAbecause while the 241Pu is a fissile actinide, the 241Am is fertile (by neutron capture it produces someamount of high fissile 242*Am). There is also a slight decrease of the 238Pu concentration while otherplutonium isotopes (239Pu, 240Pu and 242Pu) remain near to constant. Among the curium isotopes anotherrapid decayed isotope is the 244Cm.
4
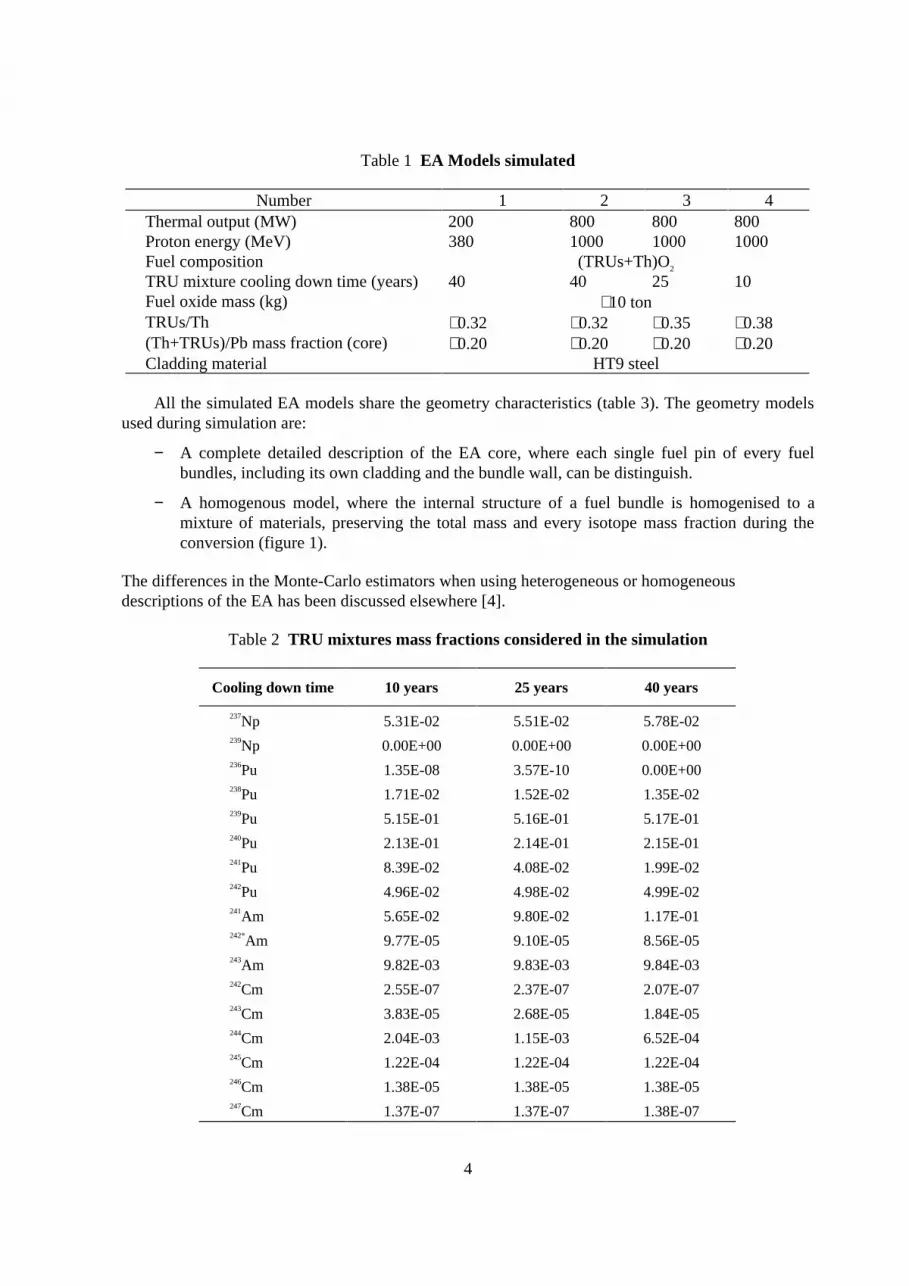
Table 1 EA Models simulated
Number 1 2 3 4Thermal output (MW) 200 800 800 800Proton energy (MeV) 380 1000 1000 1000Fuel composition (TRUs+Th)O2
TRU mixture cooling down time (years) 40 40 25 10Fuel oxide mass (kg) ∼10 tonTRUs/Th ∼0.32 ∼0.32 ∼0.35 ∼0.38(Th+TRUs)/Pb mass fraction (core) ∼0.20 ∼0.20 ∼0.20 ∼0.20Cladding material HT9 steel
All the simulated EA models share the geometry characteristics (table 3). The geometry modelsused during simulation are:
− A complete detailed description of the EA core, where each single fuel pin of every fuelbundles, including its own cladding and the bundle wall, can be distinguish.
− A homogenous model, where the internal structure of a fuel bundle is homogenised to amixture of materials, preserving the total mass and every isotope mass fraction during theconversion (figure 1).
The differences in the Monte-Carlo estimators when using heterogeneous or homogeneousdescriptions of the EA has been discussed elsewhere [4].
Table 2 TRU mixtures mass fractions considered in the simulation
Cooling down time 10 years 25 years 40 years
237Np 5.31E-02 5.51E-02 5.78E-02239Np 0.00E+00 0.00E+00 0.00E+00236Pu 1.35E-08 3.57E-10 0.00E+00238Pu 1.71E-02 1.52E-02 1.35E-02239Pu 5.15E-01 5.16E-01 5.17E-01240Pu 2.13E-01 2.14E-01 2.15E-01241Pu 8.39E-02 4.08E-02 1.99E-02242Pu 4.96E-02 4.98E-02 4.99E-02241Am 5.65E-02 9.80E-02 1.17E-01242*Am 9.77E-05 9.10E-05 8.56E-05243Am 9.82E-03 9.83E-03 9.84E-03242Cm 2.55E-07 2.37E-07 2.07E-07243Cm 3.83E-05 2.68E-05 1.84E-05244Cm 2.04E-03 1.15E-03 6.52E-04245Cm 1.22E-04 1.22E-04 1.22E-04246Cm 1.38E-05 1.38E-05 1.38E-05247Cm 1.37E-07 1.37E-07 1.38E-07

5
Table 3 Common geometry EA parameters
EA coreConfiguration HexagonalNumber of fuel bundles 120
Fuel bundlesFlat to flat 210.96 mmNumber of pin per bundle 169Pitch between pins 15.8 mmTotal length 150 cmFuel pins external diameter 8.2 mm
Proton beam, spallation targetBeam pipe material HT9Beam window material WThickness 3 mmExternal diameter 20 cm
VesselThickness 2.5 cmMaterial HT9Lead column height (with regard to the core center) 6 m
Figure 1 Homogenous model of the EA core fuel bundles array

6
Simulation Procedure
The simulations have been done using a combination of the following codes:
− NJOY94.61 for nuclear data processing [5]. The database used is the ENDF6R4 for neutrontransport calculations and reaction rates calculation. During the simulations data of 245isotopes have been used, being 196 fission fragments, and representing not less than 99% ofthe total mass inventory. The EAF3.1 database (about 650 isotopes) has been used for severalreaction rates calculation whenever the isotopes considered are not available in theENDF6R4 library. To handle with it, the EAF3.1 library has been converted to ENDF format.
− LAHET [6] for the simulation by Monte-Carlo of the proton beam interaction with lead. Thiscode calculates the external neutron source.
− MCNP4B [7] for the complete neutron simulation of the spallation source produced byLAHET, including all the neutron progeny via any multiplication reaction below 20 MeV. Itcalculates the neutron multiplication, the energy release by fission that permits to know thebeam intensity needed to work under a nominal power output, the neutron flux and specificpower core distributions and the neutron flux energy spectra at every core positions.
− ORIGEN2.1 [3] for any burnup calculation.
The aim of the code combination is to perform a coupled neutronic and isotopic time evolutioncalculation, where the neutronics and fuel depletion simulation tools shared all the necessary data.The simulation procedure is as follows (figure 2):
− A mesh division of the EA core is performed, where each fuel element is divided into 10axial zones. Each core division will have its own neutron flux estimate, energy release byfission and neutron flux energy spectrum estimators.
− Using LAHET and MCNP4B a complete simulation of the neutronics in steady state atconsidered conditions is done, obtaining the desired estimates.
− The following step is a set of burnup calculations, performing one for each core division withthe previous resulted neutron fluxes. Special ad-hoc one-group integrated cross sectionslibraries are written in ORIGEN2.1 format and used for every burnup calculation. The one-group cross sections are obtained integrating the cross sections weighted by the spectrumobtained by MCNP4B for each core zone. The burn up time step considered is of the order ofa few days.
− After all ORIGEN2.1 calculations have finished, an automatic procedure developed byFACET group translated the ORIGEN2.1 material descriptions formats to MCNP4B formats,creating a new MCNP input data file with an update of material composition for each coredivision.
− A new time step is performed beginning a new neutron transport simulation.

7
Figure 2 Combined neutronic and isotopic combined time evolution calculation scheme
LAHET&MCNP simulation
For each core division n ("cell") there is anestimate at time T of:
<Ef>n,T<Φ>n,T Φ(E) n,T
One group crosssections:
( ) ( )( )∫
∫=dEE
dEEE
Tn
Tnx
Tnx
,
,
,, φ
φσσ
ORIGEN calculationfor cell n at time Tnew
Tnew=Told+∆T
New materialcomposition for cell
n at time T=Tnew
ENDF6R4(245 isot.)
EAF3.1(≈650 isot.)
Neutron fluxintensity
Energy release byfission per protonNeutron flux
energy spectrum
During all the steps ORIGEN2.1 and MCNP4B shared the neutron flux data and materialcomposition for all the core regions. Figure 2 shows a scheme of the procedure.
Definition of ADS parameters of interest for a performance evaluation
The main interest of the ADS in general and the EA in particular is their utilisation for TRUstransmutation. Therefore elimination efficiency parameters should be defined for system comparisonpurposes. In addition, from the neutronics point of view the most important aspects of the ADSperformance are related with the accelerator requirements, once a fixed accelerator operation range isconsidered the maximum achievable burnup is fixed. Another EA relevant performance parameter isthe energy gained by fission per unit of energy consumed in the accelerated beam.
The simplest way of defining the elimination efficiency is:
ητη 1
;1
0
0 =−
=TimeN
NN f

8
Where N0 is the initial load; Nf is the remaining amount after irradiation and Time is the burnupperiod; τ could be defined as the characteristic elimination time. The Time units can be also burnupunits as GWdt. This formula is valid whenever the isotope disappearing could be adjusted to a linearfit. This is not the usual case, normally the isotopic transmutations follows at least an exponential fit,if not some other more complex laws. Therefore, another calculation procedure for the eliminationefficiency considers that the isotope time evolution is an exponential function, giving:
Again τ is the characteristic elimination time (burnup) as the time needed to reduce the isotopeinventory in a factor e. The lower τ values mean the higher elimination capacity. Expressing τ inGWdt units different thermal power systems can be compared.
For isotopes that follows non-simple exponential function laws the parameters η and τ are notconstant during the entire burnup considered. But in any case, for comparison purposes at equalburnup intervals, these parameters could be considered as logarithmic effective elimination timeconstants.
The transmutation is not possible under non-appropriate neutronic conditions. Considering thatthe external source is responsible of maintaining the operating regime, assuming a desired burnupperiod with the EA working at constant power output means that the ADS accelerator should providethe current needed at any time. The accelerator performance would be defined as the maximum andminimum beam intensity, binding its operational range. The lower ratio implies the less demandedaccelerator requirements, with its foreseen impact on cost and maintenance.
Another important parameter in the ADS neutronics study is the evolution of its neutron netmultiplication (M) and its multiplication constant with external source (ks), defined both as:
Where nn,f is neutron fission production per proton at steady state, nn,xn is the neutron productionby reaction such as (n,2n) or (n,3n) per proton and ns is the spallation neutron source per proton.During all the burnup the EA should be in subcritical state with a reactivity margin that is fixed bysecurity limitations. In Montecarlo simulations of ADS, the numbers nn,f and nn,xn can be estimatedeither directly (by counting the number of particles transported) or indirectly using track-lengthestimators.
The concept of energy gain is related with the neutron net multiplication per proton. The energygain is the energy produced per unit of energy transported by the proton beam Ep:
( )η
τηη 1;
1ln;exp
00 =
−=×−=
TimeN
NTimeNN f
f
Mk
n
nnnM s
s
sxnnfn 11;,, −=
++=

9
Where G0 is constant that depends on the nature of the fissile material loaded at EA core and thecharacteristics of the proton beam used; nn,fi are the neutrons per source proton that produce fission ofisotope i; Efi is the energy release by fission of isotope i and <Ef> is the energy release by fissionaveraged over all fissile isotopes weighted by their fission probability in the considered system. Withthese performance parameter definitions, both transmutation efficiency and operational valid rangecomparisons could be performed between different EA configurations.
Effect of the thermal power output on the neutronics and transmutation parameters
The first presented comparison is the thermal power output effect on the EA performance. The200 MW EA (case 1 of table 1) and 800 MW EA (case 2 of table 1) have been simulated and analysedfor this purpose. The differences in their initial properties are the thermal power considered (200 MWand 800 MW respectively) and the proton beam energy (380 MeV and 1 GeV). The beam current issupposed to vary adequately for constant power output working regime. The initial fuel compositionis the same in both cases (see tables 1 and 2) and also they shared the same geometry characteristics.
The time evolution of the main neutronics parameters (ks, beam current intensity, energy gainand G0) are shown in figures 3 and 4. The required accelerator operational limits are compared intable 4, where the G0 has been assumed as constant with time for each model. It is clear than thelowest ks evolution point has the lowest energy gain and the highest beam intensity demand, andreciprocally the highest ks point has the lowest beam intensity and the highest energy gain.
As can be seen in figure 3, in the 200 MW EA, after 2000 days of burnup, the maximum beamintensity required was near the starting point (150 days). This means than the burnup could be stillextended far from 2000 days from the point of view of accelerator performance. This is not the caseof the results presented in figure 4 for the 800 MW EA, where after 1000 days of burnup the beamintensity begins to grow almost linearly. After 1400 days of burnup, time that is assumed as thereference time for transmutation performance analysis, the necessary current reaches a maximum of18.30 mA. On the other hand, considering the different thermal power outputs, it should be noted that2000 days of burnup in the 200 MW EA is equivalent to 500 days in 200 MW EA. The maximumsover minimum ratios for the required accelerator beam intensity are 1.92 in the 200 MW EA modeland 1.99 in the case of 800 MW EA.
[ ]( )[ ]( )
[ ]( )
( )
s
so
s
s
p
sf
sp
f
sfnsxnnfn
fn
N
ifi
i
fin
ffn
N
i i
fin
p
N
ifi
i
fin
k
kG
k
k
E
nEG
nME
EGnnnnn
n
MeVEn
Enn
MeVE
MeVEn
G
−=
−×
=
×−×≈⇒+≈++
×
==
×
=
∑∑
∑
=
=
=
11
1
;;
;
,,,
,
1
,
,
1
,
1
,
ν
ν
ν
ννν
ν

10
Table 4. EA neutronics parameters at accelerator intensity highest demand, lowest demandand initial configurations for the two models (200 MW and 800 MW)
Max. Intensity Min. Intensity Initial
200 MWth
Ks 0.9669 ± 0.0026 0.9827 ± 0.0017 0.9714 ± 0.0024I(mA) 15.7 ± 1.2 8.2 ± 0.7 13.6 ± 1.0Energy gain 33.5 ± 2.4 64.3 ± 5.9 38.7 ± 3.0G0 1.12Time (days) 150 1000
800 MWth
Ks 0.9505 ± 0.0021 0.9753 ± 0.0018 0.9706 ± 0.0014I(mA) 18.3 ± 0.5 9.2 ± 0.4 11.1 ± 0.4Energy gain 43.7 ± 1.2 87.8 ± 3.2 71.9 ± 2.4G0 2.21Time (days) 1400 600
Figure 3. Time evolution of the ks, beam intensity, energy gain and G0 parameterfor the case 1 of table 1

11
Figure 4 Time evolution of the ks, beam intensity, energy gainand G0 parameter for the case 2 of table 1
Figure 5. Main plutonium isotopes time evolution for the EA 200 MW of case 1
12
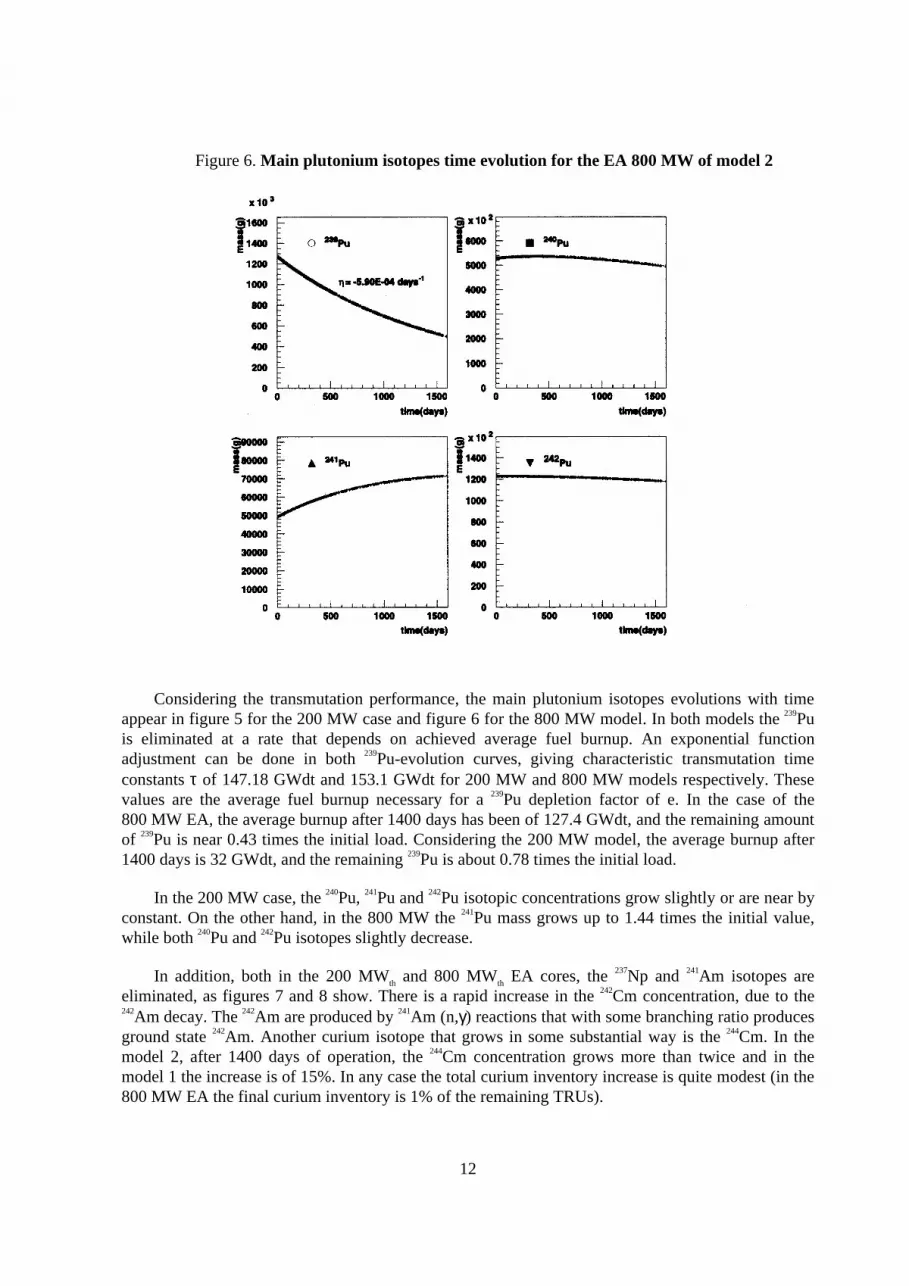
Figure 6. Main plutonium isotopes time evolution for the EA 800 MW of model 2
Considering the transmutation performance, the main plutonium isotopes evolutions with timeappear in figure 5 for the 200 MW case and figure 6 for the 800 MW model. In both models the 239Puis eliminated at a rate that depends on achieved average fuel burnup. An exponential functionadjustment can be done in both 239Pu-evolution curves, giving characteristic transmutation timeconstants τ of 147.18 GWdt and 153.1 GWdt for 200 MW and 800 MW models respectively. Thesevalues are the average fuel burnup necessary for a 239Pu depletion factor of e. In the case of the800 MW EA, the average burnup after 1400 days has been of 127.4 GWdt, and the remaining amountof 239Pu is near 0.43 times the initial load. Considering the 200 MW model, the average burnup after1400 days is 32 GWdt, and the remaining 239Pu is about 0.78 times the initial load.
In the 200 MW case, the 240Pu, 241Pu and 242Pu isotopic concentrations grow slightly or are near byconstant. On the other hand, in the 800 MW the 241Pu mass grows up to 1.44 times the initial value,while both 240Pu and 242Pu isotopes slightly decrease.
In addition, both in the 200 MWth and 800 MWth EA cores, the 237Np and 241Am isotopes areeliminated, as figures 7 and 8 show. There is a rapid increase in the 242Cm concentration, due to the242Am decay. The 242Am are produced by 241Am (n,γ) reactions that with some branching ratio producesground state 242Am. Another curium isotope that grows in some substantial way is the 244Cm. In themodel 2, after 1400 days of operation, the 244Cm concentration grows more than twice and in themodel 1 the increase is of 15%. In any case the total curium inventory increase is quite modest (in the800 MW EA the final curium inventory is 1% of the remaining TRUs).

13
As has been said, the EA is a breeder ADS. Basically, the main breeding reaction is the 232Thconversion to 233U by neutron capture followed by two β decays (233U and 233Pa). Figures 9 and 10summarised the 232Th to 233U breeding process rates for cases 1 and 2 respectively. In the 200 MWth EAthe 232Th characteristic disappearing constant is 693 GWdt, being the 233U conversion rate of 1.13×10⁻³
kg per kg of 232Th and GWdt. The 233Pa to 232Th ratio is almost constant after near 200 days, being thisequilibrium ratio of about 9×10⁻⁴. The results for the 800 MWth EA are shown in figure 10, where the232Th characteristic disappearing constant is 903.6 GWdt, and the 233U conversion rate is 6.26×10⁻⁴ kgper kg of 232Th and GWdt. The differences are because the 233U production is less efficient withincreasing irradiation time. The 233U inventory growth is limited to a maximum given by the 233U/232Thasymptotic equilibrium. The 233Pa to 232Th ratio is almost constant after about 200 days, being thisequilibrium ratio of near 3.9×10⁻³. As expected this 233Pa over 232Th ratio is neutron flux intensitydependent. In addition, the 242Cm over total curium inventory ratio are shown in figures 9 and 10. Forcase 1 this level reaches a maximum of near 0.68 after about 600 days, and in the model 2 it grows upto 0.85 after 250 days, time when the 242Cm mass begins to decrease.
Table 5 summarised the transuranics evolution for the two considered cases. The eliminationconstant has been calculated using the equation of 3 instead of exponential adjustment to theevolution data.
Figure 7. Time evolution of 237Np, 241Am, 242Cm and 244Cm for the EA 200 MW of case 1

14
Figure 8 Time evolution of 237Np, 241Am, 242Cm and 244Cm for the EA 800 MW of case 2
Figure 9 Time evolution of 233U, 233Pa to 232Th ratio, 233U to 232Th ratio and 242Cm to totalcurium inventory ratio for the EA 200 MW of case 1

15
Figure 10 Time evolution of 233U, 233Pa to 232Th ratio, 233U to 232Th ratio and 242Cm to totalcurium inventory ratio for the EA 800 MW of case 2
Table 5 Time evolution parameters of the main transuranics in the 200 MWth EA model
Isotope Initial (g) Final (g) kg /kg initial/GWdt
Eliminationconstant (y)
Elimination constant(GWdt)
237Np 1.42E+05 1.20E+05 -4.95E-03 2.24E+01 1.86E+02238Pu 3.33E+04 6.70E+04 3.18E-02 239Pu 1.27E+06 1.02E+06 -6.20E-03 1.74E+01 1.45E+02240Pu 5.29E+05 5.37E+05 4.50E-04 241Pu 4.91E+04 5.20E+04 1.86E-03 242Pu 1.23E+05 1.23E+05 -6.54E-05 1.84E+03 1.53E+04
241Am 2.87E+05 2.46E+05 -4.52E-03 2.47E+01 2.05E+02242Am 0.00E+00 2.20E+01
242*Am 2.11E+02 5.65E+03 8.10E-01 243Am 2.42E+04 2.88E+04 5.98E-03 242Cm 5.10E-01 4.54E+03 2.79E+02 243Cm 4.52E+01 1.47E+02 7.09E-02 244Cm 1.61E+03 1.82E+03 4.28E-03 245Cm 3.02E+02 3.59E+02 6.03E-03 246Cm 3.41E+01 4.03E-02 -3.14E-02 5.69E-01 4.73E+00247Cm 3.39E-01 1.77E-06 -3.14E-02 3.15E-01 2.62E+00

16
Table 5 (cont.) Time evolution parameters of the main transuranics in the 800 MWth EA model
Isotope Initial (g) Final (g) kg /kg initial/GWdt
Eliminationconstant (y)
Elimination constant(GWdt)
237Np 1.42E+05 7.06E+04 -1.80E-02 5.48E+00 1.82E+02238Pu 3.33E+04 1.09E+05 8.15E-02 239Pu 1.27E+06 5.53E+05 -2.02E-02 4.61E+00 1.53E+02240Pu 5.29E+05 5.06E+05 -1.53E-03 8.78E+01 2.92E+03241Pu 4.91E+04 7.06E+04 1.56E-02 242Pu 1.23E+05 1.19E+05 -1.13E-03 1.20E+02 3.95E+03
241Am 2.87E+05 1.48E+05 -1.73E-02 5.77E+00 1.92E+02242Am 0.00E+00 5.26E+01
242*Am 2.11E+02 9.02E+03 1.49E+00 243Am 2.42E+04 4.17E+04 2.57E-02 242Cm 5.10E-01 1.14E+04 7.99E+02 243Cm 4.52E+01 9.58E+02 7.20E-01 244Cm 1.61E+03 3.46E+03 4.13E-02 245Cm 3.02E+02 6.65E+02 4.31E-02 246Cm 3.41E+01 8.35E+01 5.18E-02 247Cm 3.39E-01 3.79E+00 3.63E-01
Effect of the Delay Time between the PWR Spent Fuel Discharge and the EA Fuel Load on theNeutronics and Transmutation Parameters
As has been explained in section 2, another parameter of interest is the influence of thetransuranics composition in the EA performance. For this purpose three different EA models havebeen considered (cases 2, 3 and 4 of table 1). The differences between the three are the TRUs loadcompositions that appear in table 2. All the three cases have a thermal power output of 800 MW.
From the point of view of time evolution of some neutronics parameters, figure 11 and 12 showthe simulation results for cases 3 and 4 respectively. Case 2 results are presented in figure 4. As canbe seen in figure 12, for the case 4 there is a progressive fall of the ks and an increase of beamintensity demand. This means that the new fissile material breeding is not able to compensatereactivity fall because of fissile TRU burning. The beam intensity maximum to minimum ratio is ashigh as 3.86, considering that the irradiation period is of 1400 days.
Figure 11 indicates that for case 3 there is a reactivity recovery similar to that of case 2(figure 4). The beam intensity maximum to minimum ratio is 1.78, less than in case 2 (1.99), with amaximum ks of 0.9643 taking place at 600 days of burnup (also 600 days in the model 2) and aminimum at the end of the cycle (1400 days) of 0.9384.
Table 6 summarised the transmutation performance parameters for the main TRUs loaded in theEA model 3 and 4. A comparison of the characteristic elimination constants indicates that for 237Np(value around 178 GWdt), 239Pu (150 GWdt) and 240Pu (2950 GWdt) are near the same for the threemodels (with differences smaller than 5%). For 241Am this elimination is clearly a function of itsinitial concentration: while for the cases 2 and 3 the value is almost constant of 195 GWdt, for case 4it rises to a value of 255 GWdt.

17
Evolution of TRU Transmutation Efficiency with the EA Burnup Cycle
Among the transmutation strategies there are two options for closing the fuel cycle:
− The one-through irradiation step: In this option the TRUs loaded fuel is burned up only once.The discharge will be stored almost directly in the secular repository.
− The closed cycle: Every spent fuel discharge is reprocessed and the remaining TRUs arereloaded in the transmutation system. This strategy allows increasing the final transmutationefficiency.
Basically the EA is designed to work in a TRUs transmutation closed cycle [2]. This strategyimplies that every EA discharge will be reprocessed. In the case of the EA this reprocessing wouldproduce four waste streams: fission and activation products, remaining 232Th, produced 233U andremaining TRUs. The 233U is separated for other purposes; the remaining TRU are recoveredaltogether and mixed with the adequate amount of 232Th and fresh TRUs coming from LWR spentfuel. The manufactured fuel should be able to maintain the nominal initial subcritical level onceloaded in the new EA core. The fission and activation products stream will be processed for properstorage or eventually some LLFF can be also eliminated in appropriated devices (e.g. the EA coreperiphery [2]).
Figure 11 Time evolution of the ks, beam intensity, energy gainand G0 parameter for the case 3 of table 1

18
Figure 12 Time evolution of the ks, beam intensity, energy gain and G0 parameter for the case 4of table 1
Table 6 Time evolution parameters of the main transuranicsin the 800 MWth-25 years decay time EA model
Model 3 800 MW 25 years decay time
Isotope Initial (g) Final (g) kg /kg initial/GWdt
Eliminationconstant (y)
Elimination constant(GWdt)
237Np 1.27E+05 6.21E+04 -4.01E-03 5.36E+00 1.78E+02238Pu 3.52E+04 9.62E+04 1.36E-02 239Pu 1.19E+06 5.10E+05 -4.49E-03 4.53E+00 1.50E+02240Pu 4.95E+05 4.74E+05 -3.37E-04 8.75E+01 2.91E+03241Pu 9.43E+04 7.97E+04 -1.22E-03 2.28E+01 7.58E+02242Pu 1.15E+05 1.13E+05 -1.27E-04 2.35E+02 7.82E+03
241Am 2.27E+05 1.19E+05 -3.73E-03 5.96E+00 1.98E+02242Am 0.00E+00 4.34E+01
242*Am 2.10E+02 7.26E+03 2.63E-01 243Am 2.27E+04 3.97E+04 5.89E-03 242Cm 5.48E-01 9.38E+03 1.34E+02 243Cm 6.20E+01 8.12E+02 9.49E-02 244Cm 2.67E+03 3.94E+03 3.72E-03 245Cm 2.83E+02 8.09E+02 1.46E-02 246Cm 3.20E+01 9.52E+01 1.55E-02 247Cm 3.18E-01 4.19E+00 9.55E-02
19
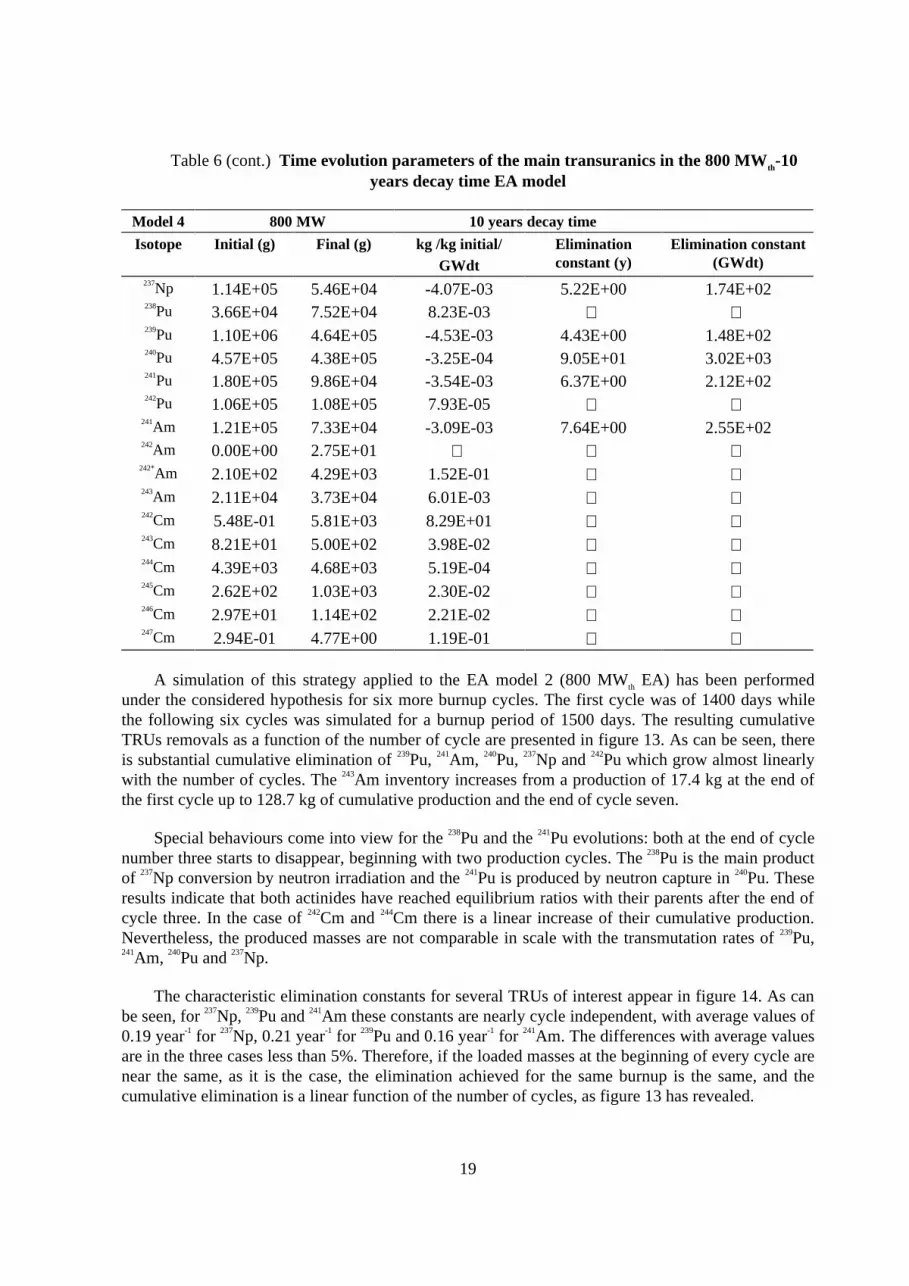
Table 6 (cont.) Time evolution parameters of the main transuranics in the 800 MWth-10years decay time EA model
Model 4 800 MW 10 years decay time
Isotope Initial (g) Final (g) kg /kg initial/GWdt
Eliminationconstant (y)
Elimination constant(GWdt)
237Np 1.14E+05 5.46E+04 -4.07E-03 5.22E+00 1.74E+02238Pu 3.66E+04 7.52E+04 8.23E-03 239Pu 1.10E+06 4.64E+05 -4.53E-03 4.43E+00 1.48E+02240Pu 4.57E+05 4.38E+05 -3.25E-04 9.05E+01 3.02E+03241Pu 1.80E+05 9.86E+04 -3.54E-03 6.37E+00 2.12E+02242Pu 1.06E+05 1.08E+05 7.93E-05
241Am 1.21E+05 7.33E+04 -3.09E-03 7.64E+00 2.55E+02242Am 0.00E+00 2.75E+01
242*Am 2.10E+02 4.29E+03 1.52E-01 243Am 2.11E+04 3.73E+04 6.01E-03 242Cm 5.48E-01 5.81E+03 8.29E+01 243Cm 8.21E+01 5.00E+02 3.98E-02 244Cm 4.39E+03 4.68E+03 5.19E-04 245Cm 2.62E+02 1.03E+03 2.30E-02 246Cm 2.97E+01 1.14E+02 2.21E-02 247Cm 2.94E-01 4.77E+00 1.19E-01
A simulation of this strategy applied to the EA model 2 (800 MWth EA) has been performedunder the considered hypothesis for six more burnup cycles. The first cycle was of 1400 days whilethe following six cycles was simulated for a burnup period of 1500 days. The resulting cumulativeTRUs removals as a function of the number of cycle are presented in figure 13. As can be seen, thereis substantial cumulative elimination of 239Pu, 241Am, 240Pu, 237Np and 242Pu which grow almost linearlywith the number of cycles. The 243Am inventory increases from a production of 17.4 kg at the end ofthe first cycle up to 128.7 kg of cumulative production and the end of cycle seven.
Special behaviours come into view for the 238Pu and the 241Pu evolutions: both at the end of cyclenumber three starts to disappear, beginning with two production cycles. The 238Pu is the main productof 237Np conversion by neutron irradiation and the 241Pu is produced by neutron capture in 240Pu. Theseresults indicate that both actinides have reached equilibrium ratios with their parents after the end ofcycle three. In the case of 242Cm and 244Cm there is a linear increase of their cumulative production.Nevertheless, the produced masses are not comparable in scale with the transmutation rates of 239Pu,241Am, 240Pu and 237Np.
The characteristic elimination constants for several TRUs of interest appear in figure 14. As canbe seen, for 237Np, 239Pu and 241Am these constants are nearly cycle independent, with average values of0.19 year-1 for 237Np, 0.21 year-1 for 239Pu and 0.16 year-1 for 241Am. The differences with average valuesare in the three cases less than 5%. Therefore, if the loaded masses at the beginning of every cycle arenear the same, as it is the case, the elimination achieved for the same burnup is the same, and thecumulative elimination is a linear function of the number of cycles, as figure 13 has revealed.

20
Conclusions
The aim of this study is to analyse the effects of the thermal power output level and the TRUsloaded in the fuel on the EA performance. Also a first approach to define the transmutation efficiencyof an EA operated in closed cycle is presented.
When comparing 200 MW and 800 MW EA systems its neutron multiplication constant can bemaintained in an acceptable operation range for long burnup periods (up to 110 GWdt in average) inboth cases. This is due to the 233U breeding from the 232Th loaded within the EA fuel. Therefore, inboth cases accelerator maximum to minimum beam intensity ratios are limited to less than 2. Fromthe point of view of TRU transmutation, the characteristic elimination constants for 237Np, 239Pu and241Am are near to constant in units of GWdt (∼180 GWdt, ∼150 GWdt and ∼195 GWdt respectively).This result implies that higher thermal power generation needs less burnup periods (in days) toachieve near to similar 237Np, 239Pu and 241Am elimination.
The use of the different proposed TRUs mixtures for this study in the EA fuel load has slighteffect on the performance from the neutronics point of view (e.g. the accelerator maximum tominimum beam intensity demand). The key is once again the 233U-breeding time evolution that shouldcompensate reactivity decrease due to fissile TRUs burn up. The transmutation performance coulddepend on the initial mass loaded of the actinide under study, as the 241Am case reveal in this study.
On the other hand, a closed fuel cycle strategy can be designed for the EA with substantialcumulative elimination of 239Pu, 241Am, 240Pu, 237Np and 242Pu which grow almost linearly with thenumber of cycles .
Figure 13a Cumulative elimination for several TRUs of interestas a function of the number of cycle
-500
0
500
1000
1500
2000
2500
3000
3500
4000
4500
Cycle 1 Cycle 2 Cycle 3 Cycle 4 Cycle 5 Cycle 6 Cycle 7
Cu
mu
lativ
e e
limin
ate
d m
ass
(kg
)
Np237
Pu239
Pu240
Pu242
Am241
Am243

21
Figure 13b Cumulative elimination for several TRUs of interest as a function of the number ofcycle. (Note that there is a factor 40 reduction is the Y axis scale comparing with figure 13a)
-100
-80
-60
-40
-20
0
20
Cycle 1 Cycle 2 Cycle 3 Cycle 4 Cycle 5 Cycle 6 Cycle 7
Cu
mu
lativ
e e
limin
ate
d m
ass
(kg
)
Pu238 Pu241
Am242* Cm242
Cm243 Cm244
Cm245 Cm246
Figure 14. Transmutation constants for the main TRUs of interestas a function of cycle number
0.00
0.05
0.10
0.15
0.20
0.25
Np237 Pu238 Pu239 Pu240 Pu241 Pu242 Am241 Am242 Am242*
Isotope
Elim
ina
tion
co
nst
an
t (1
/y)
Cycle 1Cycle 2Cycle 3Cycle 4Cycle 5Cycle 6Cycle 7

22
REFERENCES
[1] Accelerator Driven systems: Energy Generation and Transmutation of Nuclear Waste. StatusReport. IAEA-TECDOC-985 1997.
[2] C. Rubbia et al., Conceptual Design of a Fast Neutron Operated High Power Energy Amplifier.CERN/AT/95-44 (ET) 1995.
Rubbia et al., A Realistic Plutonium Elimination Scheme with Fast Energy Amplifiers andThorium-Plutonium Fuel. CERN/AT/95-53 (ET) 1995.
Rubbia et al., Fast Neutron Incineration in the Energy Amplifier As Alternative to GeologicStorage: The Case of Spain. CERN/LHC/97-01 (EET) 1997.
Rubbia,Resonance Enhanced Neutron Captures for Element Activation and WasteTransmutation. CERN/LHC/97-04 (EET) 1997.
[3] M. J. Bell, ORIGEN - The ORNL Isotope Generation and Depletion Code. V ORNL-4628. 1973.
[4] R. Fernández and E. M. González-Romero, Study on the Homogeneous and HeterogeneousGeometry Approaches for a Montecarlo Neutronic Calculation of the Energy Amplifier. InformeTécnico CIEMAT 834 1997.
[5] R. E. MacFarlane and D. W. Muir, The NJOY Nuclear Data Processing System, Version 91,1994.
[6] R. E. Prael and H. Lichtenstein, User Guide to LCS: The LAHET Code System. Group X-6. MS-B226. LANL, 1989.
[7] J. F. Briesmeister, Editor. MCNP - A general Monte Carlo N-particle transport code. Version4B. LA-12625 M., 1997.
Copyright © 2022 FDOKUMEN