
Transmutation of nuclear waste in accelerator-driven systems: Fast spectrum
246
Transmutation of Nuclear Waste in Accelerator-Driven Systems Adonai Herrera-Martínez Darwin College Hinc lucem et pocula sacra Department of Engineering University of Cambridge A dissertation submitted to the University of Cambridge for the degree of Doctor of Philosophy September 2004 CERN-THESIS-2005-033 01/09/2004
-
Upload
westinghousenuclear -
Category
Documents
-
view
2 -
download
0
Transcript of Transmutation of nuclear waste in accelerator-driven systems: Fast spectrum

Transmutation of Nuclear Wastein Accelerator-Driven Systems
Adonai Herrera-Martínez
Darwin College
Hinc lucem et pocula sacra
Department of Engineering
University of Cambridge
A dissertation submitted to the
University of Cambridge for the degree of
Doctor of Philosophy
September 2004
CE
RN
-TH
ESI
S-20
05-0
3301
/09
/20
04


A mis abuelos, en especial a María yJosé por su constante cariño y atención.
A mi padre, por los buenos recuerdosque perduran en mi memoria.
Con todos ellos me hubiera gustadocompartir este día.


Transmutation of Nuclear Waste in Accelerator-Driven Systems
Abstract
Today more than ever energy is not only a cornerstone of human development, but also a keyto the environmental sustainability of economic activity. In this context, the role of nuclearpower may be emphasized in the years to come. Nevertheless, the problems of nuclear waste,safety and proliferation still remain to be solved.
It is believed that the use of accelerator-driven systems (ADSs) for nuclear wastetransmutation and energy production would address these problems in a simple, clean andeconomically viable, and therefore sustainable, manner.
This thesis covers the major nuclear physics aspects of ADSs, in particular the spallationprocess and the core neutronics specific to this type of systems. The need for accurate nucleardata is described, together with a detailed analysis of the specific isotopes and energy rangesin which this data needs to be improved and the impact of their uncertainty. Preliminaryexperimental results for some of these isotopes, produced by the Neutron Time-of-Flight(n_TOF) experiment at CERN, are also presented.
The detailed design analysis of the TRIGA Accelerator-Driven Experiment (TRADE), thefirst ADS experiment at real power, is presented together with the time evolution of thesystem and some investigations which validate the concept of transmutation in ADSs.
A further design of the Energy Amplifier Demonstrator Facility (EADF), an 80 MWth lead-bismuth cooled subcritical device, is presented, where the intrinsic advantages of the use offast neutrons and the safety features of the device are demonstrated, using a state-of-the-artMonte Carlo burn-up code (EA-MC).
Finally, Several high-level waste transmutation strategies are assessed. These includethorium-based systems to transmute waste transuranics and long-lived fission fragments, aswell as the double strata approach, where plutonium is eliminated through the use of mixedoxide fuel (MOX) and the accumulated minor actinides (MAs) are eliminated in dedicatedMA burners.

Transmutation of Nuclear Waste in Accelerator-Driven Systems
The conclusion of this research recapitulates the key features found in the design of both ADSexperimental facilities and indicates their impact on nuclear waste transmutation. The safetyfeatures of the proposed ADS are summarised, together with design limitations due to the lackof accurate nuclear data. Finally, a possible nuclear waste transmutation scenario is proposedwith an intermediate step, which includes the development of MA burners, progressivelyshifting nuclear power towards the more acceptable thorium fuel cycle.

Transmutation of Nuclear Waste in Accelerator-Driven Systems
Acknowledgements
First and foremost, I wish to convey my sincere gratitude to my supervisors Yacine Kadi, atCERN, and Geoffrey Parks, at the University of Cambridge, for their invaluable help andsupport in carrying out the research included in this dissertation. I would also like to thankProf. Carlo Rubbia for his guidance and expertise in a wide range of fields, fromtransmutation of nuclear waste to photon detection and Monte Carlo codes.
I had the great pleasure of working with the Emerging Energy Technologies group at CERN.The kindness of every single member of this group, both past and present, made my stay atCERN a very enjoyable one. Special thanks go to Paolo Cennini for his steadfast sympathyduring these years, Enrico Chiaveri for his support in finishing this thesis, Alberto Mengonifor his patience and expertise in nuclear data and my colleague and friend Vasilis Vlachoudis,from whom I have learnt about innumerable subjects and who, together with his wife VivianSynteta, I hold dear.
I am especially grateful to numerous former and present students of the University ofCambridge and Darwin College for making my stay there unforgettable, and in particular, tomy good friends Fady El-Nahal, Elizabeth Son and the Frank Young House – Valencia group,among many others. I am greatly indebted to Roselle Dalzine, whose love and caring havebrought joy to my life from the day I met her, and whose support has been essential to thesuccessful completion of this dissertation.
Last and most importantly, I must express my deep gratitude to my family, especially mymother, Natividad Martínez Sanchez, my second mother and aunt, Amparo Martínez Sanchezand my stepfather, Ramón Nemesio Ruiz for their love and unfaltering support in spite of thephysical distance.
Adonai Herrera Martínez
Cambridge, September 2004

Transmutation of Nuclear Waste in Accelerator-Driven Systems
As required by the University regulations, I hereby state that this dissertation is my own workand contains nothing which is the outcome of work done in collaboration with others, exceptas specified and referenced in the text and Acknowledgements.
This dissertation contains no more than 68,000 words and 150 figures, includingbibliography, footnotes, tables and equations.
Adonai Herrera Martínez
Copyright © by the author. Published by the University of Cambridge (UK).

Transmutation of Nuclear Waste in Accelerator-Driven Systems
Contents
Chapter 1 Introduction .................................................................................................. 1
1.1 Energy Generation Problems .......................................................................... 2
1.1.1 Global Warming ................................................................................. 3
1.1.2 Availability and Reliability of Resources ............................................ 6
1.1.3 The Role of Nuclear Power ................................................................. 7
1.2 Problematic Aspects of Nuclear Waste ........................................................... 7
1.2.1 Nature of Nuclear Waste ..................................................................... 8
1.2.2 Storage in Deep Geological Repositories............................................. 9
1.2.3 Safety Issues ....................................................................................... 9
1.2.4 Proliferation Aspects........................................................................... 9
1.2.5 Transmutation of Nuclear Waste ....................................................... 10
1.3 Thesis Overview........................................................................................... 11
Chapter 2 Nuclear Waste............................................................................................. 13
2.1 Origin and Constituents of the Nuclear Waste............................................... 14
2.2 Radiotoxicity and its Effects ......................................................................... 16
2.3 Alternatives for Waste Disposal.................................................................... 18
2.3.1 Storage in Deep Geological Repositories........................................... 182.3.1.1 Decay heat production ...................................................................................... 19

Transmutation of Nuclear Waste in Accelerator-Driven Systems
2.3.1.2 Radioactive waste leakage into the biosphere ................................................. 19
2.3.1.3 Proliferation Aspects ........................................................................................ 19
2.3.1.4 Costs of the repositories ................................................................................... 20
2.3.1.5 Conclusion on storage in deep repositories..................................................... 21
2.3.2 Transmutation of the Radioactive Waste ........................................... 21
Chapter 3 ADS Background and Physics.................................................................... 27
3.1 ADS Description .......................................................................................... 27
3.2 History of the Accelerator-Driven Systems ................................................... 30
3.2.1 Early History..................................................................................... 313.2.1.1 First Energy Amplifier Test (FEAT)................................................................. 32
3.2.1.2 Transmutation by Adiabatic Resonance Crossing (TARC)............................. 33
3.2.1.3 MUltiplication Source Externe (MUSE) .......................................................... 35
3.2.2 Recent developments in Europe ........................................................ 36
3.3 ADS Physics................................................................................................. 37
3.3.1 The Spallation Process ...................................................................... 38
3.3.2 Neutron Multiplication in a Subcritical System ................................. 43
3.3.3 Neutron Source Multiplication: ksrc ................................................... 44
3.3.4 Neutron Source Importance: j* ......................................................... 45
3.4 Neutron Diffusion Theory for ADS............................................................... 47
3.4.1 Solution to the Diffusion Equation .................................................... 47
3.4.2 Diffusion in a High-Z Material.......................................................... 51
3.5 Fuels for ADS: Thorium Fuel Cycle ............................................................. 54
3.6 ADS Simulation using Monte Carlo Methods ............................................... 56
3.6.1 Monte Carlo Methods ....................................................................... 57
3.6.2 The FLUKA / EA-MC Code Package ............................................... 58
Chapter 4 Nuclear Data ............................................................................................... 63
4.1 The Importance of Nuclear Data ................................................................... 64

Transmutation of Nuclear Waste in Accelerator-Driven Systems
4.2 Status of Nuclear Data Cross-Sections .......................................................... 66
4.2.1 Thorium Cycle Isotopes .................................................................... 67
4.2.2 Plutonium Isotopes............................................................................ 71
4.2.3 Minor Actinides ................................................................................ 72
4.2.4 Coolants and Structural Materials...................................................... 74
4.2.5 Summary of the Status of the Nuclear Data for Transmutation .......... 75
4.3 Analysis of Sensitivity to Nuclear Data......................................................... 76
4.3.1 Sensitivity Analysis on a Thermal System: TRADE.......................... 77
4.3.2 Sensitivity Analysis on a Fast System: EADF ................................... 854.3.2.1 ThPuO2 and ThUO2 fuels.................................................................................. 85
4.3.2.2 50% plutonium – 50% minor actinides fuel mixture ....................................... 93
4.3.3 Conclusions: Cross-section priority list ............................................. 97
4.4 The Neutron Time-Of-Flight Experiment (n_TOF) ....................................... 98
4.4.1 Description of the n_TOF Facility..................................................... 99
4.4.2 Fission Ionisation Chamber (FIC) ................................................... 103
4.4.3 Measurements at n_TOF: Preliminary Cross-section Data............... 104
Chapter 5 The TRADE Experiment.......................................................................... 111
5.1 Description of the TRADE Facility............................................................. 112
5.1.1 Experimental Set-up........................................................................ 113
5.1.2 Spallation Target Design................................................................. 115
5.1.3 Radioprotection Aspects ................................................................. 117
5.1.4 Significance of TRADE towards an ADS Demonstration ................ 119
5.1.5 Experimental Objectives ................................................................. 121
5.2 Neutronic Characterisation ......................................................................... 122
5.2.1 Subcritical Configurations............................................................... 122
5.2.2 Nominal Parameters........................................................................ 123
5.2.3 Neutron Flux Distribution ............................................................... 1255.2.3.1 Spatial Distribution......................................................................................... 126

Transmutation of Nuclear Waste in Accelerator-Driven Systems
5.2.3.2 Neutron Energy Spectra ................................................................................. 127
5.2.3.3 Dynamic Behaviour of Fission and Spallation Neutrons .............................. 128
5.2.3.4 Burn-up Evolution........................................................................................... 131
5.3 Transmutation Studies ................................................................................ 132
5.3.1 Sensitivity of Transmutation to the Position in the Core .................. 133
5.3.2 Effect of the Moderator ................................................................... 1375.3.2.1 LLFFs Sensitivity ............................................................................................ 140
5.3.2.2 TRUs Sensitivity .............................................................................................. 141
5.3.3 LLFFs Transmutation Sensitivity of a Dedicated Matrix ................. 143
5.3.4 MAs Multiple Absorption Transmutation Scheme........................... 145
5.4 Conclusions ................................................................................................ 147
Chapter 6 HLW Transmutation in Fast ADS ........................................................... 149
6.1 The Concept of the Energy Amplifier ......................................................... 150
6.1.1 Description of the System ............................................................... 151
6.1.2 EA Fuel Burn-up Evolution............................................................. 153
6.2 The Energy Amplifier Demonstration Facility ............................................ 154
6.2.1 Description of the EA Demonstration Facility ................................. 155
6.2.2 Reference Configuration ................................................................. 158
6.2.3 Nominal Neutronic Parameters........................................................ 159
6.2.4 Neutron Flux Distribution ............................................................... 1626.2.4.1 Spatial Distribution......................................................................................... 163
6.2.4.2 Neutron Energy Spectra ................................................................................. 164
6.2.4.3 Dynamic Behaviour ........................................................................................ 168
6.2.4.4 Spallation Target............................................................................................. 170
6.2.5 Reactivity Safety Margins ............................................................... 1726.2.5.1 Temperature Coefficient ................................................................................. 172
6.2.5.2 Void Coefficient............................................................................................... 174
6.2.6 Fuel Burn-up Evolution................................................................... 175
6.2.7 SPX Toxicity at Discharge .............................................................. 181
6.2.8 Conclusions: The Use of MOX Fuel in Fast ADS............................ 182

Transmutation of Nuclear Waste in Accelerator-Driven Systems
6.3 HLW Transmutation Strategies and Assessment ......................................... 184
6.3.1 The Use of Thorium-TRU Fuel in ADS .......................................... 184
6.3.2 Double Strata Strategy for Transmutation of MA ............................ 1896.3.2.1 Specific Fuel Matrices for MAs Transmutation ............................................. 190
6.3.2.2 ADS Dedicated to Transmutation of MAs ...................................................... 191
6.4 Transmutation Strategies Assessment ......................................................... 197
Chapter 7 Final Conclusions...................................................................................... 201
7.1 Main Contributions..................................................................................... 202
7.2 Future Work ............................................................................................... 207
7.3 Concluding Summary ................................................................................. 208
Bibliography ................................................................................................................... 209

Transmutation of Nuclear Waste in Accelerator-Driven Systems

Transmutation of Nuclear Waste in Accelerator-Driven Systems
List of Figures
Figure 1.1. Atmospheric concentrations during the last millennium for some pollutantsproduced by human activity [2]. ............................................................................ 3
Figure 1.2. Effect of CO2 emissions on the average temperature of the planet for two differentscenarios [2]. ......................................................................................................... 4
Figure 2.1. Potential hazard index of the HLW from PWR spent fuel [19]. .......................... 17
Figure 2.2. Estimated costs of geological waste disposal for unit fuel mass [20]................... 20
Figure 2.3. Evolution of the potential hazard index before and after transmutation of the HLW[19]. .................................................................................................................... 22
Figure 2.4. Comparison between fission and capture cross-sections vs. neutron energy for240Pu and 241Am................................................................................................... 23
Figure 3.1. Schematic view of the main components of an accelerator-driven system (ADS)............................................................................................................................. 28
Figure 3.2. Comparison of the nuclear processes involved in the operation of a critical reactorand an ADS [26].................................................................................................. 29
Figure 3.3. Schematic layout of the EADF reactor core and auxiliary systems [27]. ............. 30
Figure 3.4. Average energy gain as a function of the proton beam kinetic energy in the FEATexperiment [28]. .................................................................................................. 33
Figure 3.5. Principles and layout of the TARC experiment [23]. .......................................... 34
Figure 3.6. Representation of the spallation process caused by a proton interacting with heavynuclei [52]. .......................................................................................................... 39
Figure 3.7. Spallation neutron yield for different materials and neutron energies calculatedwith FLUKA. ...................................................................................................... 40

Transmutation of Nuclear Waste in Accelerator-Driven Systems
Figure 3.8. Spallation product distribution on lead for 1 GeV protons. ................................. 41
Figure 3.9. Comparison between the evolution of the radiotoxicity of the spallation productsof a 1 GeV proton target and 1 tonne of fresh MOX fuel. .................................... 42
Figure 3.10. Comparison of the relation between M and the two of neutron multiplications (keff
and ksrc) [26]........................................................................................................ 46
Figure 3.11. Neutron flux distribution for spallation, subcritical (k = 0.9) and critical systems[26]. .................................................................................................................... 51
Figure 3.12. Vector diagram for the conservation of momentum during an elastic collision. 52
Figure 3.13. Comparison between the elastic scattering and capture cross-sections for naturallead. .................................................................................................................... 54
Figure 3.14. Decay chains of different actinides in the thorium fuel cycle [26]..................... 56
Figure 3.15. General architecture of the EA-MC simulation of neutron transport and elementevolution [38]...................................................................................................... 59
Figure 4.1. 243Am fission cross-section for ENDF/B-VI.8, JENDL-3.3 and JEFF-3.0........... 65
Figure 4.2. 137Cs experimental and evaluated capture data for ENDF/B-VI.8, JENDL-3.3 andJEFF-3.0.............................................................................................................. 66
Figure 4.3. Main discrepancies in the capture cross-section for 233U between ENDF/B-VI.8and JENDL-3.3. .................................................................................................. 68
Figure 4.4. Main discrepancies in the capture cross-section for 232Th between ENDF/B-VI.8and JENDL-3.3. .................................................................................................. 69
Figure 4.5. Discrepancies in the fission cross-section for 234U between libraries andexperimental data. ............................................................................................... 70
Figure 4.6. Main discrepancies in the fission cross-section for 238Pu between ENDF/B-VI.8and JEFF-3.0. ...................................................................................................... 71
Figure 4.7. Discrepancies in the capture cross-section for 237Np between libraries andexperimental data. ............................................................................................... 72
Figure 4.8. Discrepancies in capture data for 209Bi between ENDF/B-VI.8, JEFF-3.0 andEXFOR. .............................................................................................................. 75
Figure 4.9. Comparison of reaction rates for capture and fission in 235U using ENDF/B-VI.8and JENDL-3.3. .................................................................................................. 78

Transmutation of Nuclear Waste in Accelerator-Driven Systems
Figure 4.10. Comparison of reaction rates for (n, ne) and (n, ni) in 235U using ENDF/B-VI.8and JENDL-3.3. .................................................................................................. 79
Figure 4.11. Capture rates in 90Zr for ENDF/B-VI.8, JENDL-3.3 and JEFF-3.0. .................. 79
Figure 4.12. Neutron energy spectra in the fuel of TRADE for different ND libraries. ......... 80
Figure 4.13. Reaction rate discrepancies in TRADE for uranium isotopes and 232Th. ........... 82
Figure 4.14. Reaction rate discrepancies in TRADE for the plutonium isotopes. .................. 83
Figure 4.15. Reaction rate discrepancies in TRADE for MAs............................................... 84
Figure 4.16. Reaction rate discrepancies in TRADE for 56Fe, 90Zr, 99Tc and 129I................... 84
Figure 4.17. Neutron energy spectra in the fuel of EADF for different ND libraries. ............ 88
Figure 4.18. Reaction rate discrepancies in EADF for 232Th and the uranium isotopes. ........ 89
Figure 4.19. Comparison of reaction rates for capture and (n, ni) in 233U using ENDF/B-VI.8and JENDL-3.3. .................................................................................................. 89
Figure 4.20. Comparison of reaction rates for capture, fission and (n, ni) in 232Th for differentlibraries. .............................................................................................................. 90
Figure 4.21. Reaction rate discrepancies in EADF for plutonium isotopes............................ 91
Figure 4.22. Comparison of reaction rates for capture and fission in 240Pu using ENDF/B-VI.8and JENDL-3.3. .................................................................................................. 91
Figure 4.23. Reaction rate discrepancies in EADF for the elements in the coolant and LLFFs............................................................................................................................. 92
Figure 4.24. Comparison of reaction rates for capture, (n, 2n) and (n, ni) in 209Bi with JENDL-3.3 and JEFF-3.0. ................................................................................................ 93
Figure 4.25. Reaction rate discrepancies in EADF for MAs for the Pu-MAs fuel. ................ 95
Figure 4.26. Comparison of reaction rates for capture and fission in 241Am using ENDF/B-VI.8 and JENDL-3.3. .......................................................................................... 96
Figure 4.27. Comparison of reaction rates for capture and fission in 244Cm using ENDF/B-VI.8 and JENDL-3.3. .......................................................................................... 96
Figure 4.28. Layout of the n_TOF facility at CERN [79]. .................................................... 98
Figure 4.29. TOF tube sections from the spallation target (0 m) to the end of the TT2A tunnel(200 m) [78]. ..................................................................................................... 100

Transmutation of Nuclear Waste in Accelerator-Driven Systems
Figure 4.30. Neutron fluence energy spectra from fission chamber and gold foil activationmeasurements [78]. ........................................................................................... 101
Figure 4.31. (a) MC distribution of l evaluated at the energy of observation [78]; (b)simulation of the energy resolution at 185 m, where the 7 ns resolution due to theproton beam becomes dominant for high-energies [78]...................................... 102
Figure 4.32. Schematic view of the FIC assembly and its main elements [79]. ................... 103
Figure 4.33. Comparison of the measured 235U fission cross-section with some previousexperimental data [86]. ...................................................................................... 105
Figure 4.34. Comparison of some FIC measurement for 234U and previous experimental data[86]. .................................................................................................................. 105
Figure 4.35. Comparison of the fission cross-section ratio for 236U between differentmeasurements [86]. ........................................................................................... 106
Figure 4.36. Comparison of the fission cross-section ratio for 232Th between differentmeasurements [86]. ........................................................................................... 106
Figure 4.37. Comparison of the fission cross-section for 237Np between 38 - 42 eV [86]. .. 107
Figure 4.38. 207Pb (a) and 209Bi (b) capture radioactive kernel (resonance area) [87]. ......... 108
Figure 5.1. View of the main elements in the reactor area (a) and the TRIGA core (b) ofTRADE............................................................................................................. 113
Figure 5.2. TRADE experiment fuel distribution reference configuration [50]. .................. 114
Figure 5.3. RZ (a) and XY (b) energy deposition in the TRADE core for 1 mA of 140 MeVprotons. ............................................................................................................. 116
Figure 5.4. Evolution of the activity for: (a) the Ta 140 MeV target, compared to the W target(b), for TRADE. ................................................................................................ 116
Figure 5.5. Neutron flux spectrum for different BTL shielding configurations. .................. 118
Figure 5.6. Reactivity change for different subcritical configurations and proton energies [97]........................................................................................................................... 120
Figure 5.7. Transfer function for different perturbation frequencies in a TRIGA core and inMUSE [98]........................................................................................................ 120
Figure 5.8. Radial (a) and axial (b) neutron flux for 200 kW and different subcriticality levelsin TRADE. ........................................................................................................ 126

Transmutation of Nuclear Waste in Accelerator-Driven Systems
Figure 5.9. RZ (a) and XY (b) neutron flux distribution of the TRADE core for ksrc ª 0.90(FC3)................................................................................................................. 127
Figure 5.10. Neutron energy spectra for different parts of the core in TRADE. .................. 128
Figure 5.11. Time evolution of the neutron population up to 1 ms from the proton pulse: (a)for FC1, (b) for the spallation neutrons in different positions in the core, (c) fordifferent ksrc and (d) for different materials in ring B. ........................................ 130
Figure 5.12. High-energy neutron distribution around the spallation target of TRADE for 140MeV protons. .................................................................................................... 131
Figure 5.13. Evolution of the beam power (a) and fuel burn-up (b) for FC1 in TRADE...... 132
Figure 5.14. Capture rate vs. position in TRADE for several LLFFs (a) and rate normalised to1014 n/cm2/s (b). ................................................................................................ 133
Figure 5.15. Normalised neutron flux (a) and capture rate (b) in the 99Tc sample for differentpositions in TRADE. ......................................................................................... 135
Figure 5.16. Absorption half-life (a) and fission-to-absorption ratio (b) in different positionsof the core of TRADE for several TRUs. ........................................................... 136
Figure 5.17. Normalised neutron flux (a) and reaction rate (b) in the 241Am sample fordifferent positions in TRADE............................................................................ 137
Figure 5.18. Neutron energy spectra in the fuel (a) and in the moderator (b) for differentmoderating materials. ........................................................................................ 138
Figure 5.19. Neutron energy spectra in the fuel (a) and inner buffer (b), for the UZr fuel anddifferent buffers................................................................................................. 139
Figure 5.20. Capture rate (a) and transmutation half-life for a flux of 1014 n/cm2/s (b) for 99Tcand 129I. ............................................................................................................. 141
Figure 5.21. Fission rates (a) and fission-to-absorption ratios (b) for non-fissile TRUs anddifferent moderators. ......................................................................................... 142
Figure 5.22. Burn-up evolution for the 99Tc (a) and 129I (b) – ZrH2 transmutation matrices inTRADE............................................................................................................. 144
Figure 5.23. Burn-up evolution for the multiple absorption 237Np (a) and 241Am (b)transmutation schemes in TRADE..................................................................... 146
Figure 6.1. Schematic view of the 1500 MWth Energy Amplifier [1].................................. 152

Transmutation of Nuclear Waste in Accelerator-Driven Systems
Figure 6.2. Isotopic evolution with fuel burn-up for a typical thorium-fuel EA configuration[1]. .................................................................................................................... 154
Figure 6.3. EADF front and top schematic views highlighting the main components of thedevice [27]. ....................................................................................................... 157
Figure 6.4. EADF core cross-section showing the subassemblies and radii of the differentregions [27]. ...................................................................................................... 158
Figure 6.5. Radial (a) and axial (b) neutron flux distribution in EADF for UPuO2 (reference)fuel.................................................................................................................... 163
Figure 6.6. Neutron energy spectra in different regions of EADF for the referenceconfiguration. .................................................................................................... 164
Figure 6.7. Neutron flux spectra in the fuel (a) and the coolant (b) for different coolants inEADF................................................................................................................ 166
Figure 6.8. Fission-to-absorption ratios for different isotopes and coolants in EADF.......... 167
Figure 6.9. Comparison of the neutron survival probability between TRADE and EADF in thecore (a) and in different regions of the system for the total neutron population (b)and the spallation neutrons (c). .......................................................................... 169
Figure 6.10. Energy deposition ((a) and (c)) and neutron flux distribution ((b) and (d)) in thespallation target of EADF for the nominal 3.23 mA, 600 MeV Gaussian ((a) and(b)) and uniform ((c) and (d)) proton distribution............................................... 171
Figure 6.11. Variation of ksrc with temperature at the BOL in EADF for the referenceconfiguration. .................................................................................................... 173
Figure 6.12. Variation of ksrc with the void fraction in the coolant at the BOL in EADF. .... 175
Figure 6.13. Time evolution of the proton beam current and the source multiplication for oneburn-up cycle. ................................................................................................... 177
Figure 6.14. Actinide isotopic evolution (a) and mass balance (b) for the SPX fuel in EADF........................................................................................................................... 178
Figure 6.15. Comparison of actinide production per TW◊h between EADF and a PWR (usingUOX and MOX), as a function of fuel burn-up.................................................. 180
Figure 6.16. Evolution of the radiotoxic inventory for the SPX spent fuel in EADF. .......... 181
Figure 6.17. Evolution of ksrc with burn-up for an EA using (76% thorium / 24% plutonium)oxide fuel. ......................................................................................................... 185

Transmutation of Nuclear Waste in Accelerator-Driven Systems
Figure 6.18. Stockpile evolution for different elements present in a 1 GWth ThPuO2 EA.... 186
Figure 6.19. Isotopic inventory in a 1 GWth EA using ThPuO2 fuel for 120 GWd/t fuel burn-up. ..................................................................................................................... 187
Figure 6.20. HLW management strategies: Advance Fuel Cycle and Double Strata Fuel Cycle[19]. .................................................................................................................. 189
Figure 6.21. Effective neutron multiplication for different fuel types and quantities in the 250MWth MA burner. ............................................................................................. 192
Figure 6.22. Time evolution of ksrc and fuel burn-up (a), and the fractional amounts ofcaptures and fissions in MAs and captures in FFs during burn-up. ..................... 193
Figure 6.23. Detailed evolution of the actinide mass in the MA burner with burn-up.......... 194
Figure 6.24. Evolution of the radiotoxicity of 1 tonne of spent fuel from the MA burnercompared to 1 tonne of fresh fuel and the fuel coming from a conventional PWR........................................................................................................................... 196

Transmutation of Nuclear Waste in Accelerator-Driven Systems

Transmutation of Nuclear Waste in Accelerator-Driven Systems
List of Tables
Table 1.1. Energy consumption and CO2 emissions for different regions and time [4]............ 4
Table 1.2. Relative energy consumption from the main primary sources for different regionsin 2002 [6]............................................................................................................. 5
Table 2.1. Composition of the nuclear waste (LWR) for different types of fuel and levels ofburn-up [9] & [15]............................................................................................... 15
Table 2.2. Values of n and b for relevant actinides at 500 keV extracted from ENDF/B-VInuclear data library.............................................................................................. 24
Table 3.1. Neutron sources based on fusion, photonuclear, fission and spallation reactions [26& 53]................................................................................................................... 39
Table 4.1. Neutron cross-section data effects on ksrc for TRADE.......................................... 77
Table 4.2. Neutron balance of the actinides analysed in TRADE (thermal spectrum). .......... 81
Table 4.3. Isotopic composition of the ThPuO2 fuel for EADF............................................. 85
Table 4.4. Main neutron cross-section data effects on ksrc for the ThPuO2 fuel in EADF....... 86
Table 4.5. Neutron balance of the isotopes studied in EADF (fast spectrum)........................ 87
Table 4.6. Main neutron cross-section data effects on ksrc for the Pu-MAs fuel in EADF. ..... 94
Table 4.7. Neutron balance of MAs in the 50% plutonium 50% MAs fuel for EADF. .......... 94
Table 5.1. Effective dose due to 1 nA/m losses in the TRADE BTL for different shieldingconfigurations.................................................................................................... 118
Table 5.2. Main neutronic parameters of the TRADE ksrc configurations............................ 124
Table 5.3. Neutron-induced reactions in different parts of TRADE. ................................... 125

Transmutation of Nuclear Waste in Accelerator-Driven Systems
Table 5.4. Transmutation half-lives for LLFFs in different positions in TRADE for 1014
n/cm2/s. ............................................................................................................. 134
Table 5.5. Transmutation rates for 99Tc and 129I in a thermal spectrum using differentmatrices............................................................................................................. 143
Table 6.1. Main BOL neutronic parameters for the EADF reference configuration............. 160
Table 6.2. Neutron-induced reactions in different elements of EADF for its referenceconfiguration. .................................................................................................... 162
Table 6.3. Evolution of the main neutronic parameters of EADF after one burn-up cycle... 176
Table 6.4. TRUs and LLFFs production at end of cycle in PWRs and EADF per tonne ofspent fuel........................................................................................................... 179
Table 6.5. Comparison of the actinide balance per TW◊h for different systems, including theEA..................................................................................................................... 188
Table 6.6. Main characteristics of some of the dedicated fuels for MAs transmutation [107]........................................................................................................................... 190
Table 6.7. Comparison of the actinide balance per TW◊h for different systems, including theMA burner......................................................................................................... 198

Transmutation of Nuclear Waste in Accelerator-Driven Systems
Glossary
ADS Accelerator-Driven System
AISI American Iron and Steel Institute
ALI Annual Limits of Intake
ANL Argonne National Laboratory (US)
ARC Adiabatic Resonance Crossing
ATW Accelerator Transmutation of Waste
BOC Beginning-Of-Cycle
BOL Beginning-Of-Life
BTL Beam Transfer Line
BWR Boiling Water Reactor
CANDU CANadian Deuterium-Urarium reactor
CEA Commissariat à l'Energie Atomique (France)
CERN Conseil Européen pour la Recherche Nucléaire
CIEMAT Centro de Investigaciones Energéticas, Medioambientales y Tecnológicas (ES)
DOE Department Of Energy (US)
EA Energy Amplifier
EA-MC Energy Amplifier Monte Carlo
EADF Energy Amplifier Demonstration Facility
EET Emerging Energy Technologies group at CERN

Transmutation of Nuclear Waste in Accelerator-Driven Systems
ENDF Evaluated Nuclear Data File
ENEA Ente per le Nuove Tecnologie, l'Energia el'Ambiente (Italy)
EOC End-Of-Cycle
EOL End-Of-Life
EURATOM European Atomic Energy Community
EXFOR EXchange FORmat experimental nuclear data files
FBR Fast Breeder/Burner Reactor
FC Fuel Configuration
FEAT First Energy Amplifier Test
FERFICON Fertile-to-Fissile Conversion Program
FF Fission Fragment
FIC Fission Ionisation Chamber
FLUKA FLUktuierende Kaskade (Fluctuating Cascades) code
HLW High-Level Waste
IAEA International Atomic Energy Agency
INL Idaho National Laboratory (US)
IPHI Injecteur de Protons Haute Intensité project
IPPE Institute of Physics and Power Engineering (Russia)
JAERI Japan Atomic Energy Research Institute (Japan)
JEFF Joint Evaluated Fission and Fusion file
JENDL Japanese Evaluated Nuclear Data Library
JINR Joint Institute for Nuclear Research (Russia)
LBE Lead-Bismuth Eutectic
LEU Low-Enriched Uranium
LINAC LINear ACcelerator
LLFF Long-Lived Fission Fragment

Transmutation of Nuclear Waste in Accelerator-Driven Systems
LOCA Loss-Of-Coolant Accident
LWR Light Water Reactor
MA Minor Actinide
MAG Ministers’ Advisors Group
MASURCA MAquette de SURgénérateur à CAdarache facility
MC Monte Carlo
MEGAPIE MEGAwatt Pilot Experiment
MOX Mixed OXide Fuel
MTA Materials Testing Accelerator
MUSE MUltiplication Source Externe experiment
N_TOF Neutron Time-of-Flight experiment
ND Nuclear Data
NEA Nuclear Energy Agency
OECD Organisation for Economic Co-operation and Development
OMEGA Options Making Extra Gains for Actinides and Fission Fragments
OPEC Organisation of Petroleum Exporting Countries
ORNL Oak Ridge National Laboratory (US)
P&T Partitioning and Transmutation
PDF Probability Distribution Function
PS Proton Synchrotron particle accelerator at CERN
PSI Paul Scherrer Institute (Switzerland)
PTB Physikalisch-Technische Bundesanstalt (Germany)
PWR Pressurized Water Reactor
R&D Research and Development
TAC Total Absorption Calorimeter
TARC Transmutation by Adiabatic Resonance Crossing

Transmutation of Nuclear Waste in Accelerator-Driven Systems
TRADE TRIGA Accelerator-Driven Experiment
TRASCO TRAsmutazione SCOrie project
TRIGA Training, Research, Isotopes, General Atomics reactor
TRU Transuranic element
TWG Technical Working Group on ADSs
UNFCCC United Nations Framework Convention on Climate Change
UOX Uranium OXide fuel
UZrH Uranium-Zirconium-Hydride
XADS eXperimental Accelerator-Driven System
XADT eXperimental Accelerator-Driven Transmutation

Chapter 1 Introduction
1
Chapter 1
Introduction
The production of energy, in its many different forms, has always been a major concern forhumanity and has become one of the cornerstones of social development. In fact, a majorreason for the exponential technological development that occurred during the 20th century isthe development in the use of petroleum, discovering a major energy source with largespecific energy.
Nevertheless, this technological evolution has not come without cost: the pressure on theresources of the planet and the effect of major economic growth have bestowed upon theenvironment a large burden in the form of particle and gaseous emissions, and climatechange.
The production of energy through the use of nuclear interactions (i.e. nuclear fusion andfission) could play a major role in overcoming these problems. Unlike fusion, the technologyassociated with the splitting of the nucleus (fission) is well proven. Nevertheless, presentnuclear energy programs meet strong opposition in large parts of the globe for severalreasons:
∑ Public concern about plant safety and the consequences of accidents, magnified by theaccidents of Chernobyl (1986, a prompt-supercritical reactivity excursion) and Three-Mile Island (1979, a loss-of-coolant accident resulting in a core meltdown).
∑ Increasing international awareness about the possible diversion of this technologytowards military purposes, and in particular towards terrorism.
∑ The problem of waste, implicit in any human activity, which represents in this case amajor drawback due to the long-lived radiotoxicity of some of the by-products.

Chapter 1 Introduction
2
In this context, the transmutation of nuclear waste through the use of a subcritical assemblybased on the thorium cycle [1] potentially answers both the environmental need, as well as thegrowing social demands, for a safe carbon dioxide-free energy source. The use of a protonaccelerator to generate additional neutrons through the spallation reaction, necessary tomaintain reactor operation, ensures the control of the subcritical system, avoids criticalityaccidents and allows a flexibility in the composition of the fuel unachievable in criticalreactors. Moreover, the choice of thorium, an element abundant in the earth’s crust, as thebreeding matrix for the fuel reduces by several orders of magnitude the quantity of transuranicelements (TRUs) produced by neutron capture in some of the isotopes present in the fuel.
1.1 Energy Generation Problems
The level of development of any country is directly related to its energy consumption anddepends to a great extent on its capability to produce this energy. In order to maintain theeconomic situation in the Western World and to allow the rest of the world to achieve similarlevels of welfare, without jeopardising the biosphere, alternative sources of energy, as well asmore reasonable and efficient consumption methods, should be developed.
These goals are not only a matter of interest to the developed world, but also a moralobligation towards the rest, and majority, of the world and towards our future generations.Hence, the minimisation of the global warming, particle emission and pollution effects shouldbe a major goal while defining future international energy policies.
Figure 1.1 presents some indicators of the human influence on the atmosphere, such as CO2,SO2, N2O and CH4. The exponential increase in the concentration of these elements,coinciding with the industrial revolution, presents a serious threat to the environmentalsustainability of, not only specific ecosystems (confirmed by, for instance, the systematicdeforestation caused by the acid rain in some parts of Europe), but if the trends continue, ofthe planet as a whole.
In this sense, nuclear energy should be part of the R&D necessary to develop these alternativesources, since the use of nuclear power releases neither green house gases nor other chemicalpollutants, such as NOx (a critical component of photochemical smog), SOx (the main sourceof acid rain) or dust particles and aerosols. Therefore, a fundamental requirement may be totransform nuclear power in such a way as to be accepted by the general public, by dealingwith its main drawbacks.

Chapter 1 Introduction
3
Figure 1.1. Atmospheric concentrations during the last millennium for some pollutants produced by human
activity [2].
1.1.1 Global WarmingThe energy sector, from primary energy extraction to end-use, is one of the main sources ofgreenhouse gas emissions, in particular CO2, that raise concerns because of theirconsequences for global warming and climate change. Figure 1.2 shows two possiblescenarios predicting the impact of increasing CO2 levels on the average global temperature,included in [2], a study carried out by the World Meteorological Organisation and the UnitedNations Environment Programme. Even the most optimistic scenario (the blue curve),reducing CO2 emissions in order to maintain the concentration in the atmosphere to about 550ppm, would imply a global temperature rise of more than 2 ∞C in this century. Climate changeis a major global issue on the agenda of policy-makers, and, hence, a key objective will be theimplementation of measures aiming towards reducing greenhouse gas emissions from theenergy sector in the medium and long term, since the greenhouse gas emissions related toenergy use are estimated to represent some 75 to 90 percent of total anthropogenic emissions[3].

Chapter 1 Introduction
4
Figure 1.2. Effect of CO2 emissions on the average temperature of the planet for two different scenarios [2].
Although these emissions are currently dominated by the industrialised countries, they willincrease substantially once developing countries (in particular the rapidly growing economiesof China and India) reach the status of developed countries. Table 1.1 presents energyconsumption and CO2 emission levels at different times for different regions of the world. Thepredictions show a massive increase in CO2 emissions over the next quarter of the century ifpresent energy policies continue, implying a worse case scenario than the constant productioncase (the red curve) presented in Figure 1.2.
Table 1.1. Energy consumption and CO2 emissions for different regions and time [4].
Energy consumption (¥1018 J) CO2 emissions(106 metric tonnes carbon equivalent)Region
1990 2001 2010 2025 1990 2001 2010 2025Industrialised
countries 192.9 223.1 253.3 304.2 2844 3179 3572 4346
Former SovietUnion 80.5 56.2 69.5 86.8 1337 856 1038 1267
Developingcountries 94.2 146.9 184.3 284.4 1691 2487 3075 4749
Asia 55.4 89.7 116.2 184.2 1089 1640 2075 3263Middle East 13.8 21.9 26.6 38.0 231 354 420 601
Africa 9.8 13.1 15.2 21.1 179 230 261 361Latin America 15.2 22.0 26.6 41.1 192 263 319 523Total World 367.6 426.1 507.0 675.3 5872 6522 7685 10361
Following the 1992 Rio de Janeiro conference on sustainable development, 159 countries metin Kyoto from 2nd to 11th December 1997 to adopt a common policy in the fight against globalwarming. In the latter, known as the Kyoto Protocol, agreed upon by the Parties to the UnitedNations Framework Convention on Climate Change (UNFCCC), countries committed toreduce their greenhouse gas emissions. Also, the Protocol states that the developed countries(listed in annex 1 [5]) “shall undertake promotion, research, development and increased use ofnew and renewable forms of energy, of CO2 sequestration technologies and of advanced and

Chapter 1 Introduction
5
innovative environmentally sound technologies”. One important option that could be coveredby the last phrase, and is not specifically mentioned, is nuclear energy, which is essentiallycarbon-free. This option is rather unexploited, as revealed in Table 1.2, where the relativeworld energy consumption in the year 2002 from the main primary energy sources ispresented (commercial renewable energies are estimated to represent less than 2.5% of thetotal [6]).
Table 1.2. Relative energy consumption from the main primary sources for different regions in 2002 [6].
Relative energyconsumption Oil Natural
gas Coal Nuclear Hydroelectric
North America 39.2% 26.2% 21.8% 7.5% 5.2%Latin America 47.9% 19.7% 4.0% 1.0% 27.4%
Europe & Eurasia 32.7% 33.2% 17.9% 9.9% 6.3%Middle East 51.5% 45.9% 2.1% 0.0% 0.5%Asia Pacific 36.5% 10.9% 43.5% 4.3% 4.7%
Africa 40.8% 20.9% 31.1% 1.0% 6.4%Total World 37.5% 24.3% 25.5% 6.5% 6.3%
Of which: European Union 43.2% 23.6% 14.8% 13.7% 4.7%
There are a number of technical options that could help in reducing, or at least slowing theincrease of, greenhouse gas emissions from the energy sector. The list of options includes:improving the efficiency of energy conversion and end-use processes; shifting to less carbonintensive energy sources (such as shifting from coal and oil to natural gas); developingcarbon-free or low-carbon energy sources; and carbon sequestration (e.g. planting forests orcapturing and storing carbon dioxide). However, when the technological readiness and costsof the various options are taken into account, there are only a few options that could beimplemented in the short and medium term at an acceptable cost. Moreover, while a shifttowards the use of natural gas may reduce the problem of CO2 and particle emission to acertain extent, its generalised use would not solve the problem since the energy extractiondepends on burning (oxidising) the fuel, thus producing carbon oxides.
Nuclear power is one of the few options that are: currently available in the market;competitive in a number of countries, especially if global costs to society of alternativeoptions are considered; practically free of emissions of CO2 and other greenhouse gases; andsustainable at large-scale deployment (i.e. large energy supply can be supported by naturalresources which are plentiful and have no other use). Moreover, non-electrical applications ofnuclear energy, such as heat, potable water and hydrogen production, can be developed, andthese applications could enlarge significantly nuclear power’s contribution to greenhouse gasemission reduction.

Chapter 1 Introduction
6
1.1.2 Availability and Reliability of ResourcesThe reliability of the different energy sources is a matter of concern, particularly in view ofthe economic and political repercussions (e.g. surges in unemployment and inflation rates) ofthe 1973 (the nationalisation of oil fields by the OPEC states and the Arab countries’ oilembargo as a punishment for western support to Israel during the Yom Kippur war) and 1979(the drastic reduction in crude exports by Iran after the Revolution) oil crises. These events, inaddition to the effects of the miners’ strikes in 1972, 1974 and 1984 in the United Kingdom,showed the industrialised countries the risks of dependence on few energy sources andexternal (and in many cases unpredictable) suppliers, and compelled countries such as Franceand the UK to revise their energy policies diversifying their energy sources and consequentlyreducing their external energy dependency. In the case of France, these policies have resultedin the use of nuclear energy as their major source of electricity (76.4% of the total in the year2000 [7]).
However, a larger, although more predictable, matter of concern is the depletion of primaryenergy sources, in particular crude oil. It is well know that the oil reserves in the world arelimited and at the present rate of consumption (thus, assuming the optimistic scenario of noincrease in demand) will be extinguished within this century. In fact, the BP StatisticalReview of World Energy 2003 [6] predicts the exhaustion of the world’s oil reserves in 40years.
A similar scenario is expected for natural gas, since the proven reserves are predicted to lastfor 60 years at the present rate of production [6]. This energy source, although less pollutingwhen compared to petroleum, presents no major alternative to the latter in terms of sourcelifetime, given that the reserves of both will be predictably depleted in half a century.
In the case of coal, the reserves are estimated to last around 200 years at the present rate ofconsumption. This could extend the use of fossil fuels over a century, at the expense of alarger environmental impact due to the higher emission of pollutants arising through the useof this fuel. Even though desulphurisation and particle-filtering techniques are wellestablished, coal is arguably the most polluting of the fossil fuels, a source of large quantitiesof carbon, sulphur and nitrogen oxides, soot and other aerosols.
As mentioned earlier, there are few available alternatives that could take over on a large scale.The use of renewable energies is a major goal since they are practically non-polluting and theresources are inextinguishable. Nevertheless, the impact on world energy production of thesesources is rather small (estimated to be about 2.5% [6]) due to the low efficiency and the lowspecific energy of most of them (for instance, in order to produce 1 GWe using photovoltaicpanels, thousands of square kilometres would have to be covered). There is an obvious need

Chapter 1 Introduction
7
of investing in these types of technologies, but there is also a need to look for alternativessince these sources cannot fulfil global needs in the short or medium terms.
In addition, the hydropower may also contribute to reduce the weight of the fossil fuels in theenergy schemes. It is likely that micro-hydro-schemes will continue to expand this form ofelectricity generation worldwide since large hydroelectric dams attract a lot of scepticism andcriticism due to their large ecological impact in the region where they are constructed [8].Nonetheless, the total amount of energy available from these sources is limited by economicaland environmental factors, which imply that in several developed countries the productioncapabilities are being reached.
1.1.3 The Role of Nuclear PowerAs indicated in the previous section, no fossil fuel is neither non-polluting nor a reliableenergy source on which international energy policies could rely for sustainable development.The short lifespan of these sources and particularly their intrinsic polluting by-products makethem unsuitable for balancing the world’s increasing energy demands with a sustainablemeans of production, minimising their impact on the environment.
On the other hand, renewable energies do not yet represent a full-scale alternative, capable ofsubstituting for fossil fuels in a medium timescale, nor is hydropower. The production ofenergy through nuclear fusion is not yet technically available and probably will not beindustrially available for more than half a century.
In the current situation, nuclear power will inevitably play a major role in the future, not onlyin industrialised countries but also in developing countries where energy demand is surging.However, to make nuclear energy socially acceptable, the aforementioned concerns should beproperly addressed. Of these concerns the back-end of the fuel cycle is arguably the mosttechnically complex and politically controversial.
1.2 Problematic Aspects of Nuclear Waste
The problem of radioactive waste is a major drawback of the production of energy throughnuclear power. The long half-lives of some isotopes, reaching millions of years, make thisproblem a crucial one to solve. The fate of these radionuclides has given rise, for severaldecades already, to questions regarding the long-term safety of radioactive waste disposal.Many proposals have been made: geological disposal in deep underground facilitiesspecifically designed for this purpose, launching them into outer space, and burning them intodedicated nuclear facilities.

Chapter 1 Introduction
8
The generation of spent fuel and highly active waste materials amounts to quantities far inexcess of the capabilities of any outer space disposal programme, and such a practice wouldcreate contamination risks for both the atmosphere and the biosphere [9]. Thus, there is ageneral consensus among countries holding nuclear installations that geological disposal is anadequate solution for short and medium-lived wastes. Conversely, public opposition todisposal sites for high-level wastes (HLWs) have caused delays in the development of thesefacilities.
Partitioning and Transmutation (P&T) of radioactive and long-lived elements from the highlyradioactive waste streams in order to reduce or possibly to eliminate their radiotoxicity is thethird option under consideration. During the last decade, interest in P&T has grown, duemainly to the uncertainties about the safety of long-term repositories for HLW, their effect onproliferation and the possibility of obtaining extra-gain (producing energy) from the otherwiselong lasting highly radiotoxic waste.
1.2.1 Nature of Nuclear WasteThe definition of nuclear waste is a controversial one, since what may be considered waste insome countries may be considered valuable fuel in others. The most obvious example is theplutonium in the spent fuel, considered waste in, for example, Spain and the US and then usedas part of the mixed oxide fuel (MOX) in others, as it is the case in the France and Japan. Thisambivalence is extensive to a large part of the spent fuel, which could be used as fuel in fastsystems.
Nonetheless, considering the large number of elements present in the spent fuel, only theunused uranium and some isotopes of plutonium can be recycled into fresh fuel for thermalsystems. Therefore, the rest of the elements forming the spent fuel are generally consideredwaste products and their existence raises the issue of the closing of the fuel cycle.
These waste elements are predominantly formed by fission fragments (FFs, originated mostlyby the fission of 235U) of which the most hazardous are the long-lived fission fragments(LLFFs) and TRUs produced by neutron capture in the fuel and the subsequent decay chains.By separating the plutonium from the TRUs it is possible to obtain the minor actinides (MAs),elements such as neptunium, americium and curium, which, in general, present low thermalfission cross-section.
At present most nuclear waste is kept under surveillance in shallow depth-storage facilities(e.g. cooling ponds in nuclear power plants). However, concerns about leaks to the biosphereand the proliferation risks imply that this can only be a standby solution to be followed eitherby permanent storage in deep geological repositories and/or transmutation into lessradioactive nuclear species.

Chapter 1 Introduction
9
1.2.2 Storage in Deep Geological RepositoriesOne of the few viable options to deal with the most hazardous elements of the nuclear waste isthe storage of these in an underground repository, where they would lie for centuries untiltheir radiotoxicity was reduced to reasonable levels. The surveillance of these sites would be arequirement, although the control of the state of the containment elements is not alwaysconsidered.
Several possibilities appear in this scenario, such as vitrification of the waste or the use ofdifferent containment methods. The access to the waste after some time is also an issue since,for example, countries like Sweden have decided to perpetually seal the repositories oncefilled up.
This approach has several important drawbacks, since the basic idea of this approach is hidingthe waste and not the elimination of the hazardous elements. In particular, the greatdifficulties in assessing the seclusion of the containment during the hundreds of thousands ofyears make this option unreliable to the eyes of a large part of the scientific community andpublic opinion.
1.2.3 Safety IssuesThe intrinsic radiotoxicity of some of the elements present in the spent fuel justifies the greatconcern of the safety authorities in the control of these substances. The possible leakage ofsome of these elements into the biosphere could have unpredictable consequences for publichealth and for the environment in general.
The penetration of water into the repository could also set the conditions for a recriticalisationof the waste [10], due to the reflection and thermalisation of the radiation, which wouldotherwise escape from the waste canisters. A recriticalisation of the waste elements couldhave fatal consequences no only for the containing units but also for the whole repository.
Moreover, the persistence of these elements makes possible that the geological conditions oftheir storage may change thus facilitating the escape of radiotoxic waste centuries after theclosure of the repository.
1.2.4 Proliferation AspectsNuclear power is burdened by the fact that it was first developed to build an explosive deviceused for destructive purposes. The nuclear weapons era was launched abruptly upon the worldwith the first explosion of a nuclear weapon at Alamogordo, New Mexico (US), on July 16,1945. This was followed by two detonations in the war against Japan. By the early 1960sthere were five nuclear weapons countries [11].

Chapter 1 Introduction
10
Since then, fear of the diversion of civil nuclear elements towards military use has beenpresent in all civil nuclear programs. These fears were confirmed by the “horizontal” spreadof nuclear weapons during the 1960s and 1970s when more countries joined the “nuclearclub”. The risks of open proliferation of sensitive nuclear materials led US Presidents H.S.Truman and J. Carter to ban reprocessing and plutonium recycling.
The risk of diversion (through theft or development by a “rogue” state) of some of thesematerials towards terrorist purposes is currently a major concern in public opinion.Technically, the relatively large abundance of weapons-grade plutonium in conventionalnuclear waste could be a source of future nuclear weapons proliferation. Moreover, some ofthe minor actinides, such as 243Am (t1/2 = 7370 yr, a-decay into 239Np followed by b--decay,t1/2 = 2.35 d), could contribute in a few thousand years to the generation of weapons-grade239Pu, which could be a hazard for future generations.
On the other hand, the elimination of a large part of the existing nuclear arsenal was generallyaccepted with the end of the Cold War and the start of nuclear weapons elimination programs.Nevertheless, due to the age of some of these weapons, the presence of some daughterisotopes, e.g. 241Am (t1/2 = 432.2 yr from the b--decay of 241Pu, t1/2 = 14.29 yr) prevent thesematerials from being disposed of as fuel in conventional reactors.
1.2.5 Transmutation of Nuclear WasteThe remaining technically viable option would be to eliminate in dedicated systems thehazardous elements originated in the conventional nuclear reactors. Fortunately, 99.995% ofthe long lasting (> 500 years) radiotoxicity is found in a few elements and about 1% of thespent fuel (~300 kg/GWe/yr) [9].
The spent fuel contains several elements which are resistant to further elimination in thermalreactors. Therefore, conventional fission and transmutation cannot be done in ordinary lightwater reactors (LWRs). In order to eliminate these resilient nuclei (TRUs and LLFFs) in anefficient way, fast neutrons are necessary. However, TRUs can only be eliminated by fission,while LLFFs can be primarily transmuted by neutron capture; hence, different methods willhave to be used to get rid of them.
Very fast neutrons are produced by spallation by protons accelerated to a medium energy (~1GeV) by a dedicated, compact, high-current accelerator. This device called an Accelerator-Driven System (ADS) is:
∑ Non-critical, since the reaction rate is fully controlled by the current of the accelerator.∑ Preferable to a fast breeder reactor, as it offers higher safety, flexibility and efficiency.

Chapter 1 Introduction
11
The transmutation goals are to eliminate 99.9% of the TRUs and up to 95% of the LLFFs(99Tc and 129I). These goals are technically feasible and economically viable [12], and presenta realistic and safer alternative to the geological repositories in order to eliminate the HLW.Moreover, the use of thorium as a fuel matrix presents several advantages due to theabundance of this element and the lower TRU production compared to uranium.
1.3 Thesis Overview
This thesis gives an overview of the subjects related to the transmutation of nuclear waste inaccelerator-driven systems and summarises the major reasons for the development of thistechnology, highlighting its advantages. The main objective of the research is to assess thebest methods of transmutation of nuclear waste through the use of ADSs, and to contribute tothe design and development of some of the most relevant ongoing experiments in the field.
A detailed study of the nature and origin of nuclear waste is presented in Chapter 2. Theglobal dimension of this consequence of human activity is quantified together with anassessment of the hazards of these materials. The alternatives for waste disposal are alsoanalysed.
Chapter 3 serves as an introduction to the required background for studying ADSs, illustratingthe historical evolution of this type of systems. The physics related to these systems is alsodetailed, through discussion of the spallation process, taking place in the target and the reactorcore, where the transmutation process takes place, together with an overview of thecomputational methods used in reactor analysis.
The limitations in the design of these devices are addressed in Chapter 4. The need for reliablenuclear data is discussed and an extensive sensitivity analysis of different systems to thisfactor is presented. Moreover, preliminary experimental neutron cross-section data, which isbeing obtained by the neutron Time-Of-Flight facility (n_TOF) developed at the EuropeanOrganisation for Nuclear Research (CERN), is presented.
The first ADS experiment at real power, which foresees the coupling of a General AtomicTRIGA reactor with a proton accelerator, is currently in the design phase. Chapter 5 dealswith the neutronic design of this experiment, as well as with an analysis of the transmutationcapabilities of this device. The need to use fast neutrons in order to effectively transmutesome the components of the nuclear wastes is evidenced.
Chapter 6 presents a detailed analysis of the Energy Amplifier Demonstration Facility(EADF), an 80 MWth ADS cooled by lead-bismuth eutectic, dedicated to the demonstration of

Chapter 1 Introduction
12
the transmutation concept in this type of devices. The neutronic characteristics together withthe fuel burn-up evolution and transmutation efficiency of this fast system are explained. Toconclude this chapter, two different transmutation strategies, i.e. the use of thorium-basedADS and the double strata approach, are analysed.
Finally, Chapter 7 presents the final conclusions of the thesis, describing the most relevanttechnical aspects of the systems analysed and indicating their effect on the transmutationschemes. A clear distinction between the requirements for TRUs and LLFFs elimination ismade, together with a precise evaluation of different transmutation schemes. The optimalapproaches to effectively reduce the stockpile of these elements are summarised and finalrecommendations for future work are given.

Chapter 2 Nuclear Waste
13
Chapter 2
Nuclear Waste
Nuclear power constantly produces spent fuel containing a wide range of elements withdifferent physical characteristics. The composition of these by-products depends on severalfactors, such as the composition of the fresh fuel, the level of burn-up or the reactor type.However, all the constituents of the spent fuel can be classified as fission products or asactinides.
Apart from the short-lived fission products, the spent fuel contains significant quantities ofactinides and fission products with very long half-lives, which constitute a long-term (over10,000 years) radiotoxic hazard. The effects of a possible leakage of some of these elementsinto the biosphere can hardly be predicted due to the diversity of these elements, the largenumber of pollution channels, and the stochastic nature of their effects, as well as the longtime span of the analysis.
Therefore, several alternatives for dealing with this nuclear waste have been considered, fromshipping it into space to burying it under the seabed or dumping it into ocean trenches.However, there are only a few alternatives which are technically and economically viable andwhich give some degree of control over the fate of the nuclear waste. These options fall intotwo categories: the creation of deep geological repositories, or the elimination of the mosthazardous elements in dedicated systems (transmutation). The latter option is the only oneimplying the total elimination of the most radiotoxic elements, which would prevent theaforementioned long-term leakage or proliferation problems.

Chapter 2 Nuclear Waste
14
2.1 Origin and Constituents of the Nuclear Waste
Waste can arise at a number of different points in the nuclear fuel cycle, starting with themining of uranium ore, during its enrichment, in the nuclear reactor and as a result of thereprocessing of the spent fuel. The many types of waste involved may be classified accordingto different factors, such as their origin, physical state or level of radiotoxicity. TheInternational Atomic Energy Agency (IAEA) produced a five-level classification ofradioactive waste based on radioactivity and heat output [13]. This is a particularly usefulmethod of labelling nuclear waste as it highlights its two main hazards, namely heat andradioactivity, and gives an immediate assessment of the degree of radiotoxicity of theelement, containment required and the time span involved [14].
In particular, elements included in categories I (high-level of radioactivity, long-lived) and II(intermediate-level, long-lived) are considered the most hazardous materials and grouped asHLW. Since dealing with these elements is quite problematic, their storage or eliminationinvolves a great amount of R&D, as well as continuous political discussion (e.g. the creationof a HLW repository in Yucca Mountain has been appealed in court several times by the stateof Nevada, US).
Chemically, the two main components of the HLW are TRUs and LLFFs, representingrespectively 1.1% and 4% of the conventional spent nuclear fuel from a LWR. Table 2.1summarises the waste composition originating from a LWR for UOX and MOX, and differentaverage thermal burn-ups. The isotope and element masses in the waste are given for UOXwith an enrichment of 4.2%, an average thermal burn-up of ~50 gigawatts-day per tonne ofheavy metal (GWd/tHM) and after 5 years of cooling time. Since the relative isotopiccomposition changes with the type of fuel and the level of burn-up, three cases are presented,highlighting 33 GWd/tHM (~0.1 tonnes of fuel per day) as the most common level of LWRburn-up.
As mentioned in 1.2.1, the TRUs are produced through consecutive neutron captures anddecays in uranium in the fuel. These elements are responsible for most of the long-termradiotoxicity, both due to their profusion in the waste and their long half-lives combined withcomplicated decay chains. Clearly, fission is the most effective process to eliminate this typeof waste, avoiding the production of further actinides.
Fission fragments are the by-products of the fission reaction and, due to their nuclearinstability (excess of neutrons compared to the number of protons), most of them decaypromptly into more stable species. Nevertheless, some of them, such as 99Tc or 129I, are quiteabundant in the waste (both are close to the peaks of the fission product yields for thermalfission) and have lengthy half-lives and chemical properties that would enhance their

Chapter 2 Nuclear Waste
15
diffusion into the biosphere (high mobility). Therefore, although the transmutation of theseparticular LLFFs presents several technological and radiological difficulties, their eliminationrepresents a goal of the same level of importance as the MAs.
Table 2.1. Composition of the nuclear waste (LWR) for different types of fuel and levels of burn-up [9] & [15].
Isotopic composition with burn-up (%)Nuclide UOX MOX
Actinides
Isotope(kg/GWe/yr)50 GWd/tHM
Element(kg/GWe/yr)50 GWd/tHM
Half-life(yr) 33 GWd/tHM
3.5% 235U50 GWd/tHM
4.2% 235U43 GWd/tHM
8.2 % Pu234U 5.2 2.5¥105
235U 173.0 7.0¥108
236U 136.0 2.3¥107
238U 20424.0
20765.0 (U)
4.5¥109
0.03%0.8%0.7%98.5%
237Np 16.0 16.0 (Np) 2.1¥106 100.0 %238Pu 8.6 87.7 1.7% 3.4% 4.4%239Pu 125.3 2.4¥104 58.8% 49.1% 37.4%240Pu 71.2 6.6¥103 22.8% 27.9% 31.1%241Pu 30.3 14.3 11.7% 11.9% 14.5%242Pu 19.8
255.2 (Pu)
3.7¥105 5.0% 7.8% 12.6%241Am 11.6 432.7 72.6% 66.4% 61.2%243Am 4.8 16.4 (Am) 7.4¥103 27.2% 33.6% 38.8%243Cm 0.01 29.1 1.3% 0.6% 1.5%244Cm 1.5 18.1 92.9% 91.5% 86.8%245Cm 0.1 8.5¥103 4.9% 6.2% 10.9%246Cm 0.03
1.7 (Cm)
4.7¥103 0.8% 1.7% 0.7%
FFs Isotope(kg/GWe/yr)
Element(kg/GWe/yr)
Half-life(yr)
Activity(Bq/GWe-yr)
Decay Q-value(MeV)1
79Se 0.2 1.4 (Se) 1.1¥106 2.4¥1010 0.15 (b-)90Sr 15.0 26.0 (Sr) 28.79 8.1¥1016 0.55 (b-)93Zr 23.1 117.8 (Zr) 2.1¥105 2.4¥1012 0.03 (b-)99Tc 26.6 26.6 (Tc) 1.5¥106 1.6¥1013 0.29 (b-)
107Pd 7.5 14.6 (Pd) 6.5¥106 1.4¥1011 0.03 (b-)126Sn 0.7 2.4 (Sn) 1.0¥105 7.4¥1011 0.38 (b-)
129I 5.8 7.1 (I) 1.6¥107 3.9¥1010 0.19 (b-)135Cs 12.5 2.3¥106 4.6¥1011 0.27 (b-)137Cs 35.8 85.7 (Cs) 30.1 1.2¥1017 1.18 (b-)
As indicated in the previous table, the production rate of plutonium is about 255 kg/GWe/yr,whereas the quantity of MAs produced is 34 kg/GWe/yr. Concerning the FFs, the total amountpresent in the waste is approximately 800 kg/GWe/yr of which 130 kg/GWe/yr are LLFFs.Since the average energy production of a LWR is 1 GWe these can be taken as the averagevalues per reactor (LWR), loaded with ~26 tonnes of fuel.
Consequently, the quantity of nuclear waste produced worldwide by the 437 operatingconventional nuclear power plants (producing 362.9 GWe) during 2004 [16] totals ~7,930
1 The decay Q-value accounts for the energy of the parent isotope in the excited state minus the energy of thedaughter isotope in the ground state, determining the maximum possible energy of the emitted b-. Hence, thedecay will take place through the emission of a b- and its subsequent anti-ue carrying part of the energy of theexcited nucleus, and possibly some characteristic g’s, which will take the daughter isotope to the ground state.

Chapter 2 Nuclear Waste
16
tonnes of which 7,535 comes from uranium. The remaining 395 tonnes are divided into 290tonnes of FFs (of which 47 tonnes are LLFFs), 93 tonnes of plutonium and 12 tonnes of MAs.Extending these quantities to 40 years of average lifetime for a conventional nuclear reactor,the global stockpile of HLW rises to approximately 6,000 tonnes, assuming no furthercommissioning of new facilities (although there are 30 of these under construction and 32planned and 72 proposed, in 2004).
These figures illustrate the great problem health and safety authorities in various countries arepresently facing in order to manage these large amounts of HLW, with which something willeventually have to be done. Furthermore, the problem of military waste should also beconsidered, since the decay of the plutonium in the nuclear warheads, as well as the non-proliferation policies, may add a significant amount of radiotoxic material to the already largeHLW stockpile.
The use of plutonium to enrich the uranium fuel (MOX) slows the increase of the plutoniumstockpile to a certain extent (there is a limit on the quantity of the plutonium isotopes that canbe added to the fuel due to their low delayed neutron fraction (b), as further explained in2.3.2). This practice increases the production of MAs and plutonium isotopes resistant tothermal fission, thereby shifting the problem towards the accumulation of these species, alsohindering the fuel reprocessing due to the high radiotoxicity of some of these isotopes. Theuse of MOX can be beneficial (as contemplated in the multi-tier strategies for closing the fuelcycle [9]) as long as the large amounts of TRUs produced are dealt with in an acceptablemanner, since the accumulation of these species entails serious containment problems due tothe diversity in the chemical nature of these elements (e.g. americium is a volatile elementcompared to plutonium).
2.2 Radiotoxicity and its Effects
The potential radiotoxicity is defined as the activity of a certain quantity of radionuclidesweighted by the intake dose factors, thus indicating the dose received by all those who mighthave ingested or inhaled these substances. The calculation of this value obviously depends onthe physical properties of the radionuclides, but also, and above all, on their post-incorporation biokinetics.
Actinides (mainly a and g-decay) and LLFFs (b- and g-decay) present in the waste maytherefore be ranked on the basis of their intrinsic hazard (effective dose coefficients, Sv/Bq)coupled with their radioactive concentrations in the spent fuel or HLW (Bq/tHM). In theseterms, the following ranking can be made [17] for spent fuel seven years after discharge from

Chapter 2 Nuclear Waste
17
the reactor: 238, 239, 240, 241, 242Pu > 241, 243Am > 242, 243, 244, 245, 246Cm >> 237Np. In spite of thisclassification, the short-term radiotoxicity of some FFs is comparable to that of actinides forapproximately one century. Beyond 300 years only LLFFs remain significantly radioactiveand, thus, their radiotoxicity represents 0.1% that of the actinides [9].
The radiotoxic inventory can also be related to the Annual Limits of Intake (ALI, [18]), thusdefining the potential hazard index of the radionuclide as the ratio of the amount of thenuclide to its ALI value. Figure 2.1 shows the potential hazard over 10 million years of theHLW present in one tonne of spent fuel from a PWR (33 GWd/tHM and, uranium and 99.5%of the plutonium, recycled) and the level of radiological hazard of the 5 tonnes of naturaluranium needed to produced this amount of fresh fuel.
Figure 2.1. Potential hazard index of the HLW from PWR spent fuel [19].

Chapter 2 Nuclear Waste
18
The previous graph shows the influence on the radiotoxic inventory of the major isotopespresent in the nuclear waste. For the first hundred years, the activity in dominated by the shortand medium-lived FFs, principally 90Sr and 137Cs (assuming plutonium is mostly removedfrom the waste). Between one hundred and ten thousand years, the activity is primarilygenerated by the americium isotopes, to be later dominated by 237Np due to its longer half-lifeand its production from the decay of 241Am. The potential hazard of the LLFFs is orders ofmagnitude smaller than that of the MAs, but, since the confinement of all these species canonly be guaranteed for a short period (compared to the duration of their activity), the highmobility of the LLFFs (and 237Np) in the biosphere increases their potential danger.
2.3 Alternatives for Waste Disposal
Several alternatives for the final disposal of the HLW have been considered in order to closethe fuel cycle. As mentioned earlier, sending the most hazardous materials into space, buryingthem in the shallow layer of the seabed or in the ice caps, and dumping them into the oceantrenches were discarded due to economic non-viability and the unpredictable consequences ofan accident or a possible change in the environmental conditions.
Hence, the two favoured alternatives for nuclear waste disposal are storage in deep geologicalrepositories, and the transmutation of the most hazardous elements in dedicated systems andthe subsequent mid-term storage of the waste.
2.3.1 Storage in Deep Geological RepositoriesThe accumulation of the nuclear waste in underground facilities, vitrified or in any other solidor liquid form, has been favoured for a long time by the nuclear community due to the,allegedly, technical simplicity and low costs. Nevertheless, this solution presents seriousconceptual problems related to the isolation of the radioactive species (some of them beingwater soluble) and the extended period of the required containment.
The basic requirement for any geological formation is its ability to contain and isolate theradioactive wastes from the human environment until the activity of the waste has decayed tonon-hazardous levels. In order to reduce the probability of failure of confinement, mostconcepts rely on a system of independent, and often redundant, barriers such as leach-resistantwaste compounds, corrosion-resistant containers or the nature of the geological formation. Itis proposed to store permanently LWR waste directly from the reactor in bentonite (US) orafter reprocessing and vitrification (Europe).

Chapter 2 Nuclear Waste
19
2.3.1.1 Decay heat production
Before the final disposal of HLW, some period of interim storage, either on site or at acentralised location, is needed due, in particular, to the high a activity of some isotopes, e.g. 1cm3 of 244Cm (13.5 g/cm3, t1/2 = 18.1 yr and 5.9 MeV a-emission as the decay channel)generates 38 W of decay heat, which would raise the temperature of the same volume of waterat a rate of 9 ∞C/s. During this time, the temperature and radioactivity of the HLW decreasesystematically, making possible the later handling and transportation of the remaining waste.
Therefore, a cool-down period is necessary independent of the waste disposal method.Nonetheless, in the case of a final geological repository, a continuous amount of heat willhave to be removed from the canisters, not only degrading the properties of the containermaterials but also resulting in a large decay heat release inside the storage cave, leading tohigh working temperatures for all the components involved in the storage, thus threatening theconfinement of the waste. Furthermore, the risk of recriticality of the confined waste due to achange in the surrounding conditions, i.e. water infiltration, would amplify the degradation ofthe confinement [10]. In this aspect, a clear example of recriticality can be found today inOklo (Gabon), where several natural reactors occurred about 2,000 million years ago.
2.3.1.2 Radioactive waste leakage into the biosphere
There are serious concerns about possible leaks to the biosphere of, principally, 135Cs, 129I,99Tc, 93Zr and 237Np after a long period of time. The filtration of these isotopes intounderground water streams is a potential risk due to their high solubility. This would result inthe release of a certain quantity of these species into the biosphere. The contamination of thewater streams could have fatal consequences to the environment and the people living close tothe repository.
Moreover, the permanent closure of the repository once filled up would make it impossible torepair the source of the leakage, transforming this problem into a permanent one with no easysolution.
2.3.1.3 Proliferation Aspects
On the other hand, the possibility of intrusions into the repository after its closure cannot beignored. As mentioned in 1.2.4, since the use of nuclear power was first developed formilitary purposes, fear of the diversion of nuclear material towards the construction ofweapons is obviously justified.
Currently, the use of nuclear material by a terrorist group to produce weapons is also a majorconcern. Since the waste contains a great amount of weapons-grade plutonium, nuclear wasterepositories would be seen as major sources of these elements for a long period of time.

Chapter 2 Nuclear Waste
20
Moreover, the decay of some of the elements constituting the waste, such as 243Am, could alsogenerate a large amount of fissile material, literally producing plutonium mines in a fewthousands years. Indeed, in 25,000 years the decay of 90% of this isotope would produce analmost pure 239Pu mine.
2.3.1.4 Costs of the repositories
In addition to the previous drawbacks, it should be noted that storage of HLW in deepgeological repositories is technically possible but not easy, and may turn out to be veryexpensive (~1000 US$/kg of spent fuel). The estimated costs of geological storage are shownin Figure 1.2, where the actual packaging and disposal, preparation and R&D costs areindicated. Reprocessing is added, whenever appropriate (700 US$/kg) [20].
Figure 2.2. Estimated costs of geological waste disposal for unit fuel mass [20].
Underground storage may be performed either with or without reprocessing. Reprocessing ispresumed to offer added security to containment, since it allows vitrification and optimalpacking according to the nature of each element, but at extra cost. Note the large amount ofR&D and siting costs before the actual packaging and disposal costs and the added costs dueto reprocessing. These figures may well be underestimates, since, for instance, a full

Chapter 2 Nuclear Waste
21
benchmark study of all the consequences of deep storage of subcritical mixtures has not beenperformed and the additional costs of public opposition are still hard to assess.
The actual cost of a geological repository is therefore rather uncertain, as evidenced by thespread figures given in Figure 1.2. At the estimated cost of 700 US$/kg for Spain (for the sandsolution and no reprocessing) this would represent a projected cost of about 7.7 billion US$ tostore the waste produced by that country’s 11 power generating nuclear reactors during theirlifetimes [21].
2.3.1.5 Conclusion on storage in deep repositories
This strategy of disposal cannot be relied upon in the long term to provide the necessarypermanent isolation of the HLW from the human environment, and future generations shouldnot bear the risk of coexisting with the hazardous species left behind by their ancestors. Therisk of intrusion into the repositories by a hostile group would present a threat not only tocurrent international security but also into the future. Finally, it should be borne in mind thatthe cost of development of these repositories may well be beyond any of the presentestimations, since the public opposition to the few ongoing projects has substantiallyincreased the already high price of these facilities (e.g. the cost of the Yucca Mountainrepository is ~60 Billion US$).
2.3.2 Transmutation of the Radioactive WasteThe elimination of radioactive species from nuclear waste has motivated the research ofnumerous scientists since the development of nuclear power for civil purposes. But publicopinion and environmental concerns now make the full development of this kind oftechnology a priority. Since most of the long-term raditoxicity (99.99%) is due to a fewisotopes (less than 1% of the waste, ~300 kg/GWe/yr), the technical difficulties related to thehandling of the different elements are greatly reduced. Moreover, the elimination of actinidesclearly implies use of the fission process. As the technology to separate them chemically fromthe rest of the waste already exists, the option of producing transmutation fuel directly fromthese elements (after a cooling down period) may seem the most appropriate to simplify theprocess.
Figure 1.3 predicts the evolution of the radiotoxicity of the waste for different scenarios ofHLW elimination. This plot shows the radiotoxicity of the MAs and LLFFs reaching the levelof the radiotoxic inventory of 5 tonnes of natural uranium (needed to produce one tonne offresh fuel) in about 40,000 years. If 90%, 99.5% and 99.9% of MAs and LLFFs wereeliminated from the waste, the radiotoxicity would reach the indicated level in 2,500 years,400 years and 300 years respectively. This large reduction in the potential hazard from the

Chapter 2 Nuclear Waste
22
waste would result in a qualitative change in dealing with the HLW, since engineeringbarriers could ensure the safe storage of the remaining waste. It should be noted that, even iftransmutation were chosen as a method to eliminate HLW, some kind of disposal strategywould also be needed, although the requirements for this type of storage would be lessstringent.
Figure 2.3. Evolution of the potential hazard index before and after transmutation of the HLW [19].
At first glance, the elimination of the HLW could be carried out by adding small fractions ofthese elements to the LWR fuel or configuring dedicated pins in order to transmute theseisotopes. This approach has major drawbacks due to the fact that MAs generally present smallfission cross-sections at thermal energies. Figure 1.4 shows the fission and the capture cross-

Chapter 2 Nuclear Waste
23
section for 240Pu and the ratio between both as a function of the energy of the absorbedneutron. This ratio increases dramatically for neutron energies above 100 keV for all actinides(even for the fissile ones), as exemplified by the cases of 240Pu and 241Am. The low values ofthe fission-to-capture ratio for thermal energies would degrade the neutron economy in thereactor, thus forcing an increase in enrichment, and, for some isotopes, the TRU productionrate would be greater than the removal rate [22].
1x10⁻⁶
1x10⁻⁵
1x10⁻⁴
1x10⁻³
1x10⁻²
1x10⁻¹
1x100
1x101
1x10²
1x10³
1x10⁴
1x10⁵
1x10⁶
1x10⁷
1x10⁸
1x10⁻³ 1x10⁻² 1x10⁻¹ 1x100 1x101 1x10² 1x10³ 1x10⁴ 1x10⁵ 1x10⁶ 1x10⁷ 1x10⁸
Neutron energy (eV)
Pu-240 Capt
Pu-240 Fiss
Pu-240 Fiss/Capt
Am-241 Fiss/Capt
Figure 2.4. Comparison between fission and capture cross-sections vs. neutron energy for 240Pu and 241Am.
The transmutation of LLFFs at thermal energies would theoretically be possible, but, since thecapture cross-section at this energy range is generally small for most LLFFs, high neutronfluxes (considerably larger than the usual LWR flux of ~1014 n/cm2/s) would be needed inorder to produce significant transmutation rates.
Therefore, a transmutation strategy for HLW based on a conventional LWR would not reallybe feasible and would be technically inefficient. In such a case, the use of fast neutrons wouldincrease the transmutation of MAs through a two-fold effect: First, increasing the probabilityof fission, and thus, destruction of the MAs, and, second, reducing their production bycapture. For the LLFFs, a fast system could benefit from a high neutron flux (~1015 n/cm2/s),in particular at the epithermal energy range, where the capture resonances, and thus the high

Chapter 2 Nuclear Waste
24
capture probabilities, lie. This method is known as Transmutation by Adiabatic ResonanceCrossing (TARC) [23], and is explained in more detail in 3.2.1.2.
Nevertheless, the transmutation of TRUs in critical systems, especially in fast systems wherethe prompt neutron lifetime tends to be shorter, presents serious safety problems. As shown inTable 2.2, the fraction of delayed neutrons emitted per fission for TRUs is several timessmaller than that of 235U and 238U. This fact has enormous implications for the control of thereactor by reducing the already short reactor period of a fast system (typically 0.1 ms for afast-breeder/burner reactor, FBR [24]). Therefore, the insertion of a significant amount ofHLW would degrade the kinetic properties of a critical reactor hindering the control of thesystem.
Table 2.2. Values of n and b for relevant actinides at 500 keV extracted from ENDF/B-VI nuclear data library.
Isotope Neutrons perfission (n)
Delayed neutronsper fission
Delayed neutronfraction (b)
232Th 3.21 0.053 1.66%233Th 2.08 0.074 3.57%233Pa 2.20 0.023 1.03%233U 2.50 0.007 0.27%234U 2.43 0.010 0.43%235U 2.49 0.016 0.65%236U 2.44 0.022 0.92%238U 2.52 0.048 1.91%
237Np 2.61 0.012 0.47%238Pu 2.97 0.005 0.16%239Pu 2.94 0.006 0.21%240Pu 2.86 0.009 0.32%241Pu 3.01 0.016 0.53%242Pu 2.95 0.018 0.62%
241Am 3.30 0.005 0.14%242Am 3.36 0.007 0.19%243Am 3.29 0.010 0.29%244Cm 3.34 0.004 0.13%245Cm 3.60 0.006 0.17%
Moreover, TRUs present in general little or no negative reactivity feedbacks due to Dopplerbroadening in the capture resonances; thus, the use of dedicated fuels for transmutation,lacking isotopes with large capture resonances such as 238U, would degrade the temperaturesafety parameters of a reactor loaded with this fuel [25]. For a critical system, this processcould have undesirable consequences in the overall safety parameters of the reactor, whereasfor a device continuously operating below criticality it may be acceptable.
Another possible alternative would be the direct use of high-energy neutrons (e.g spallationneutrons) to transmute this waste. In this case, roughly 30% of the energy produced in a

Chapter 2 Nuclear Waste
25
fission reaction (~60 MeV out of 200 MeV/fission) would be needed just to transmute theLLFFs [26]. This option seems economically unviable, since the process is highly inefficientand it would imply spending a very large amount of the energy produced in the nuclear powerplants to eliminate just part of the radioactive waste.
Hence, the transmutation of HLW in a subcritical fast system seems the most technicallyfeasible and economically viable alternative. In order to maintain operation in such a system,an external neutron source would be needed. Generally, a proton accelerator is proposed tomake up the deficit of neutrons to maintain criticality through the spallation reaction. Such adevice, commonly called an Accelerator-Driven System (ADS) would have the advantage of aflexible fuel configuration (including the use of large amounts of TRUs and LLFFs) since itcould operate at different subcriticality levels. In fact, as estimated in [25], the minimum levelof subcriticality (multiplication coefficient, keff) in which such a device could operate in orderto be self-sufficient is keff ~0.7, although generally an ADS would be designed to operate inthe range 0.90 < keff < 0.99. Chapter 3 thoroughly describes these systems, with specialattention to their physics underlying their design.

Chapter 2 Nuclear Waste
26

Chapter 3 ADS Background and Physics
27
Chapter 3
ADS Background and Physics
As explained in the previous chapters, accelerator-driven subcritical reactors represent arealistic and viable technology for the elimination of high-level nuclear waste. The potentialelimination of the entire HLW stockpile by using a diverse range of fuels represents a majoradvantage of these systems.
Although classical neutron diffusion theory can be applied to the analysis of an ADS,analogously to conventional nuclear reactors, there are certain aspects of their operation thatrequire detailed analyses due to, for example, the presence of an external neutron source.These individualities have produced new research perspectives in the mature field of reactorphysics, recently inducing experiments in order to validate innovative concepts specificallydeveloped for the field of ADS, such as the neutron source importance.
The analysis methods also require revision given that these systems involve interactions ofhigh-energy charged particles (hundreds of MeV) and heterogeneous fuel compositions.Theses peculiarities make Monte Carlo (MC) methods particularly suitable for the simulationof these systems, facilitating the design of the systems and analysis of their evolution in time.
3.1 ADS Description
The term accelerator-driven subcritical system, or ADS, refers to a device formed by thecoupling of a subcritical nuclear reactor core with a charged-particle accelerator, generally aproton cyclotron or a proton linear accelerator (LINAC), as illustrated by Figure 3.1. In such asystem, the energy is produced as the result of the multiplying nuclear cascades initiated by

Chapter 3 ADS Background and Physics
28
the accelerated protons (or charge particles) interacting with the spallation target, rather thanof a self-sustained chain reaction as in conventional nuclear reactors.
Figure 3.1. Schematic view of the main components of an accelerator-driven system (ADS).
The term subcritical refers to the fact that an ADS operates in a non-self-sustained chainreaction mode (the usual values of the neutron multiplication coefficient are 0.95 ≤ k ≤ 0.98),thus minimising the possibility of criticality. The subcritical configuration depends on thefission-to-capture ratio (and hence on the fuel composition, core geometry, proton energy etc.)but it is independent of the proton current.
A subcritical blanket surrounds the spallation target, multiplying the spallation neutronsthrough fission; therefore, all nuclear processes in the core are subordinated to the operationof the accelerator, and the power produced is directly proportional to the intensity of theinjected beam, thus providing a mechanism for controlling the operation of the core and theoutput power, reducing the number of mechanical elements to control the reactor. Figure 3.2shows a comparison between the nuclear processes taking place in a conventional nuclearcritical reactor and in an Energy Amplifier (EA) [1], a lead-cooled ADS originally designed atthe European Organisation for Nuclear Research (CERN). Figure 3.3 shows the generallayout of the Energy Amplifier Demonstration Facility (EADF [27]), a prototype designed tovalidate the concept of the EA, highlighting the main components of the reactor core.
As a consequence of the subcritical operation and the decoupling of the neutron source(producing spallation neutrons) from the fissile fuel (generating fission neutrons), the range of

Chapter 3 ADS Background and Physics
29
possible fuels broadens, allowing the incorporation in the fuel of elements such as MAs, highplutonium contents and LLFFs, which degrade the neutronic characteristics of the nuclearcore to unacceptable levels in critical reactors.
Figure 3.2. Comparison of the nuclear processes involved in the operation of a critical reactor and an ADS [26].
The energy gain, G, is defined as the energy produced in the ADS relative to the energydissipated by the high-energy proton beam, and it is given by Equation 3.1:
�
G =G0
1- k=
G0
1- h ◊ (1- L)(Eq. 3.1)
where G0 is the gain proportionality constant, typically 2.4-2.5 for a properly designed ADS[1] (validated through the FEAT experiment [28]); k is the fission-driven multiplicationcoefficient k = h◊(1–L); L is the sum of fractional losses of neutrons (lost through severalprocesses, such as captures in structure and coolant, in fission-product poisons, leakage fromthe vessel etc.); h is the spectrum-averaged number of fission neutrons produced by a neutronabsorbed in the fissile isotope.
dies out

Chapter 3 ADS Background and Physics
30
Figure 3.3. Schematic layout of the EADF reactor core and auxiliary systems [27].
3.2 History of the Accelerator-Driven Systems
Even though it is only in the last few years that ADSs have become widely known to thepublic, the history of these systems goes as far back as the military nuclear program itself.The use of an accelerator in nuclear physics for different purposes (e.g. to produce exoticisotopes or to drive a subcritical core) has been extensively explored on several occasions inthe last fifty years, but it is only now that technological developments, both in acceleratorscience and in reactor technology, permit the construction of a full power accelerator-drivensubcritical device.

Chapter 3 ADS Background and Physics
31
3.2.1 Early HistoryIn 1941, G. Seaborg produced the first man-made plutonium using an accelerator. However,the first practical attempts to promote accelerators to generate potential neutron sources weremade in the late 1940’s by E.O. Lawrence in the United States, and W.N. Semenov in theformer Soviet Union. During the period 1950-54, the MTA (Materials Testing Accelerator)programme [29] at Lawrence Livermore (at that time the Livermore Research Laboratory)investigated in detail the use of accelerators to produce fissionable material. This project wassoon abandoned when high-grade uranium ores were discovered in the United States.
Almost concurrently in Canada, W.B. Lewis realised the value of accelerator breeding in thepower programme and initiated spallation neutron yield measurements with the McGillcyclotron [30]. The Canadian team at Chalk River has always been a strong proponent of sucha producer of fissile material, which could be used in conjunction with a conversion-efficientCANDU reactor.
A materials production accelerator – the Electronuclear Reactor – was patented in 1960 byLawrence et al. [31] to provide adequate quantities of material that could only be producedartificially. The targets considered were natural uranium and thorium and the artificiallyproduced materials were 239Pu and 233U respectively. This concept of accelerator breeding wasalso studied by Russian scientists who, under the guidance of V.I. Goldanski and R.G.Vassylkov, made a neutron yield experiment in depleted uranium blocks using the acceleratorin Dubna. Later studies (1975-88) in the Fertile-to-Fissile Conversion (FERFICON)Programme [32] – a collaborative effort between various laboratories – investigated theenergy dependence, up to 800 MeV, of the fertile-to-fissile conversion efficiency usingstandardised target materials and geometries.
A rather realistic ADS concept in the present sense, where safety issues and transmutation ofwaste play an important role, was developed in the late 1980’s by a research group atBrookhaven National Laboratory led by H. Takahashi and G. Van Tuyle and is now beingresearched in Japan as part of the OMEGA programme [33].
The first detailed design of a transmutation facility using thermal neutrons was published byC. Bowman’s Los Alamos group in 1991 introducing a common name: The AcceleratorTransmutation of Waste (ATW) [34 & 35].
In 1993 a group of CERN scientists led by C. Rubbia presented the basic concepts of a so-called “Energy Amplifier” [1], a subcritical nuclear system based on the thorium cycle, fed bya high intensity proton accelerator, intended to generate energy with small amounts of MAsand LLFFs production. Later on, the scientific feasibility and verification of the principle of

Chapter 3 ADS Background and Physics
32
energy amplification by a high-energy cascade were established in experiments such as FEAT[28] (autumn 1994) and TARC [23] (1997-1998).
3.2.1.1 First Energy Amplifier Test (FEAT)
The concept of the EA was originally developed on the basis of a computer simulation of therather complex interplay between the production of neutrons by spallation and theirsubsequent fission-based multiplication in a subcritical assembly. Even though there existedindirect evidence that these simulations were valid, there was an obvious need to test thisconcept in a small experiment.
The main idea, which gave the EA its name, was the production of a great amount of energyfrom an initial energy source, supplied by the accelerator in the form of kinetic energy to theprotons. The concept of G is therefore immediate; this gain was predicted to be 30-60 [1]. Themain purpose of FEAT was therefore to ascertain that there was such a gain and that itsmagnitude was in agreement with the value predicted by the FLUKA / EA-MC [36, 37 & 38]simulations. The experiment was carried out at CERN with the participation of researchgroups from France, Greece, Italy, Spain and Switzerland.
The overall power produced in the experiment was 1 W, and the energy of the incomingprotons could be varied; therefore the relation between the gain and the proton energy couldbe measured. The validation of the MC simulations that came from the agreement with theexperiment was another basic goal achieved through FEAT. Once the energy released wascalculated for different incoming proton energies, the results showed that the relationship waslike that of a first-order system, with constant gain above 1 GeV, and decreasing significantlybelow 800 MeV, as shown in Figure 3.4.
The neutron distribution in the experiment was calibrated with an Am-Be neutron sourceinserted in the centre of the device. The results confirmed the expected exponential behaviouras a function of the distance from the source. The multiplication factor for a point-like centredsource was found to be k = 0.915 ± 0.010. This was in good agreement with the MCsimulations which gave k = 0.920 ± 0.005 [38].
The results demonstrated that using the critical reactor formulation to describe a subcriticalsystem was inaccurate, since all the higher harmonics from the solution of the diffusionequation with an external neutron source needed to be evaluated, not just the fundamentalone. They also validated the precision of the FLUKA / EA-MC code results applied to thesesource systems.

Chapter 3 ADS Background and Physics
33
Figure 3.4. Average energy gain as a function of the proton beam kinetic energy in the FEAT experiment [28].
3.2.1.2 Transmutation by Adiabatic Resonance Crossing (TARC)
This experiment was part of a wider research program to test some of the physics concepts inthe field of radioactive waste elimination. In an ADS dedicated to nuclear wastetransmutation, where the TRUs are destroyed by fission, the long-term radiotoxicity would bedominated by LLFFs, whose elimination generally involves neutron capture followed bynuclear decay. The main goal of this experiment was to test the idea of adiabatic resonancecrossing (ARC), based on the properties of spallation neutrons diffusing in lead, to efficientlytransmute LLFFs. The object was also to perform a systematic study of the phenomenology ofspallation neutrons in pure lead.
Neutrons were produced by spallation at relatively high energy (some MeV), and, after havingbeen promptly moderated through (n, xn) and inelastic scattering (n, ni) reactions down toenergies of a few hundred keV, they were slowed down quasi-adiabatically, with their energydecreasing by small steps and reaching the capture resonance energy of an element to betransmuted, where neutrons have a high probability of being captured. This is the case for99Tc, which has a strong neutron capture resonance at 5.6 eV (4000 barns), covering fouraverage lethargy steps in lead. The 99Tc resonance integral is 310 barns, while the cross-section at thermal neutron energies is only of the order of 20 barns. Neutron capture in 99Tc

Chapter 3 ADS Background and Physics
34
(t1/2 = 211,100 yr) produces 100Tc (t1/2 = 15.8 s), which then decays to 100Ru, a stable element.Thus, the radiotoxicity could be eliminated in a single neutron capture, and, since 100Ru has asmall neutron capture cross-section and both 101Ru and 102Ru are stable, essentially, no newradioactive elements were produced. Figure 3.5 shows a schematic view of the TARCexperiment, numbering the different positions where samples were placed inside the leadblock, were and describes the underlying physical principles. The source (spallation) neutronsare produced at high energies and are diffused inside the lead bloc to produce an isolethargicspectrum. The resonance capture probability is therefore maximised due to the small energysteps in the neutron moderation.
Figure 3.5. Principles and layout of the TARC experiment [23].
The experiment was designed in such a way that several basic processes involved inaccelerator-driven systems could be studied in detail. The neutron production by GeV protonshitting a large lead volume and neutron transport properties were analysed, and the efficiencyof transmutation of LLFFs in the neutron flux produced by spallation neutrons was assessed.The entire program was fulfilled by performing neutron flux measurements over an energyrange from thermal up to a few MeV, and neutron capture rate measurements on 99Tc and on127I and 129I. A comparison of the experimental results with the MC simulations was alsoperformed, further validating these computational tools for transmutation purposes.

Chapter 3 ADS Background and Physics
35
3.2.1.3 MUltiplication Source Externe (MUSE)
MUSE (1-4) is a series of experiments hosted by the French Commissariat à l’ÉnergieAtomique (CEA) in the MAquete SURgénératrice de CAdarache (MASURCA) facility inCEA-Cadarache. The general purpose of these experiments was to study the physics ofsubcritical systems coupled with an accelerator, to understand the physical phenomenainvolved in their modelling and validate experimentally the main principles of these systems.These studies were conducted in a low power mock-up (< 5 kW) of a subcritical assembly,where temperature effects are negligible. The mock-up was coupled to a well-calibratedexternal neutron source, in terms of intensity and neutron energy, allowing the separation ofthe experimental validation of the multiplying medium behaviour from the experimentalvalidation of the source characteristics.
This program started in 1995 with the short, exploratory MUSE-1 experiment [39], providingsome insight into the physical behaviour of the neutron population in subcritical systems. andthe MUSE-2 experiment [40], in 1996, devoted to the experimental study of diffusingmaterials (sodium and stainless steel) placed around the external source.
The MUSE-3 experiment was performed [41] over three months in 1998. An external neutronsource (~108 n/s) based on the (d, t) reaction was used. This neutron generator operating inboth continuous and pulsed modes allowed the completion of the study of diffusing materials(sodium and pure lead) and the exploration of the dynamic behaviour of the multiplyingmedium for different subcriticality levels, and the observation of the dependence of the coreresponses as a function of the subcriticality levels.
From 2000 to 2003, the MUSE-4 [42] experiments were performed within the framework of alarge international collaboration including research and technology institutes from Belgium,Germany, UK, Italy, The Netherlands, Spain and Sweden, via the EURATOM 5th FrameworkProgram of the European Commission (EC). The MUSE-4 program was based on aparametric approach (1 critical + 3 subcritical sodium-cooled configurations, 1 configurationwith a lead-cooled zone, 2 kinds of target, and variation of the neutron generator frequency)and on the use of several experimental techniques and analysis methods. These methods wereaiming to study, first, the decreasing neutron population after the modification of the sourcelevel by the pulsed neutron source method and frequency variation method), and, second, theneutronic fluctuations in the fission chains (noise measurements). The determination of thereactivity level was of prime importance among the other neutronic parameters, since thisassessment is decisive for the acceptability of an ADS. The validation of the simulationtechniques and nuclear data (ND) to properly predict ADS behaviour was also a majorobjective of these tests.

Chapter 3 ADS Background and Physics
36
3.2.2 Recent developments in EuropeIn 1998 the Research Ministers of France, Italy and Spain, recognising the potential of ADSsfor the transmutation of HLW, decided to set up a group of advisors (Ministers’ AdvisorsGroup – MAG) to define a common R&D European platform for ADS.
A Technical Working Group (TWG) under the chairmanship of C. Rubbia was alsoestablished with the task of identifying the critical technical issues in which R&D in such ademonstration programme is needed. In October 1998, the TWG issued an interim report [43],which, in particular, highlighted the need for a demonstration programme, the basiccomponents and the different options for the proposed facility, and the R&D directly relevantto the realisation of such a facility.
In September 1999, the European TWG – composed of representatives of Austria, Belgium,Finland, France, Germany, Italy and Spain – issued a new technical report [44] aimed atproviding an overview of the different ongoing ADS activities in various European countries.
In 2000, the ETWG (further enlarged to include representatives of the EU-Joint ResearchCentres, Portugal and Sweden), recognising that the ADS R&D programme had reached aturning point with regard to programme co-ordination and resource deployment in Europe,and also taking into account the substantial recent progress on the subject in the United Statesand in Japan, issued a so-called “four-page document” [45] on a strategy for theimplementation of an ADS programme in Europe. In particular, the document called for theurgent definition of a consensual European “Roadmap” towards the demonstration offeasibility of a European waste transmutation facility.
In the European Roadmap towards the experimental demonstration of ADS [46], severalexperiments are indicated which should allow the validation of the separate components of anADS. This is the case for the accelerator (IPHI [47], TRASCO [48]), the spallation target (e.g.the MEGAPIE experiments [49]) and the subcritical core (FEAT, TARC and MUSE). Thecoupling of the components will be performed in a new system, with all innovative featuresincluded, with the exception of the subcritical core fuel, for which further research should becarried out. However, the case for the licensing of such a system will present some difficulty,in the absence of a preliminary coupling experiment at power. A way forward is simply to setup an experiment where an “existing” low power reactor, with well-known safety features, ismade subcritical and coupled with an accelerator, which should provide the needed protons toinduce spallation reactions on a target hosted inside the core.
As regards coupling, such an experiment would not need a high neutron yield from spallation.In fact, it could run with a neutron per proton production rate as low as one, since anoptimisation in terms of efficiency or transmutation will not be a requirement.

Chapter 3 ADS Background and Physics
37
The domain of interest of such an experiment would be to demonstrate reliable systemoperation, from start-up to nominal power level, up to shutdown, in the presence of thermalreactor feedback effects. The presence of control rods in the system would allow theverification of different modes of operation during fuel irradiation and the determination andmonitoring of reactivity levels with ad hoc techniques. The joint cooling of the target and ofthe subcritical core would be demonstrated, together with the solution of some practicalengineering problems of generic interest for an ADS, such as the configuration of the beamaccess to the core.
The possibility of running the experiment at different levels of subcriticality (e.g. achieved byappropriate fuel loading patterns), would allow experimental exploration of the transitionfrom an “external” source-dominated regime, to a core thermal-feedback-dominated regime.This transition is relevant, in particular, to understand the dynamic behaviour of an ADS,which, in the future full-scale demonstrations of transmutation, could have both a very low band very low Doppler reactivity feedbacks.
The proposed location for this pilot experiment, which would be the first example of ADScomponent coupling at “real size”, is the TRIGA reactor at the ENEA-Casaccia Centre (Italy),an existing pool reactor of 1 MW thermal power, cooled by natural convection of water in thereactor pool. The TRADE project [50] is based on the coupling of an upgraded commercialproton cyclotron with a tantalum solid target, surrounded by the TRIGA reactor in asubcritical configuration, as further explained in Chapter 5.
3.3 ADS Physics
As previously mentioned, ADS are nuclear multiplicative assemblies that operate in asubcritical configuration with the help of an external neutron source. This provides specificcharacteristics to these systems, such as operational flexibility and safety, and the ability touse a wide range of fuels. Hence, the basic physics that governs these systems is different tothat of conventional critical reactors. In addition, the operation and behaviour in accidentconditions require specific technological considerations, new to reactor engineering.
This section reviews the basic physics principles involved in the operation of such a deviceand the processes driving the major components of an ADS, i.e. the external neutron sourceand subcritical assembly. The sections on neutron multiplication in a subcritical system anddiffusion in the coolant examine general nuclear reactor concepts from the specific point ofview of a subcritical assembly subject to a non-thermal neutron spectrum.

Chapter 3 ADS Background and Physics
38
3.3.1 The Spallation ProcessThe concept of spallation covers the interaction of high-energy (from a few tens of MeV to afew GeV) hadrons or light nuclei with nuclear targets. In other words, it corresponds to thereaction mechanism by which a high-energy hadronic projectile knocks out of the nucleartarget some nucleons and/or light particles, leaving a residual nucleus (spallation product).Depending upon the conditions, the number of emitted light particles, and especially neutrons,may be quite large. This is, of course, a feature of utmost importance for an ADS. Figure 3.6describes the spallation reaction produced by a 1 GeV proton in a group of heavy nuclei.
At such a high projectile energy – high compared to the most probable energy of thermalneutrons (the peak in the Maxwell distribution of energies [51]) of 0.0253 eV – it is no longercorrect to think of the nuclear reaction as proceeding through the formation of a compoundnucleus. As shown in Figure 3.6, high-energy protons produce a wide range of reactionsthrough the interactions with the nuclei. At first, the fast direct process induced is an Intra-Nuclear Cascade (nucleon-nucleon collisions inside the nucleus); this reaction depends on thegeometrical cross-section of the different elements rather than the common reaction cross-sections used at lower energies. Pre-Compound Stage (including pre-equilibrium, multi-fragmentation, Fermi break-up) and Compound Nuclei (evaporation of neutrons mostly andhigh-energy fissions) are subsequent models of interactions between the secondary particlesand the nuclei of the spallation source. Finally, Low-Energy Inelastic Reactions – (n, xn), (n,a), (n, g), etc. – are produced once the energy of the secondary particles has decreased belowa certain threshold (assumed to be around 20 MeV for neutrons).
The relevant aspects of the spallation process are mainly characterised by:
∑ Spallation Neutron Yield (i.e. multiplicity of emitted neutrons), which determines therequirement in terms of the accelerator power (current and energy of incident protonbeam).
∑ Spallation Neutron Spectrum (i.e. energy distribution of emitted neutrons), whichdetermines the damage to and activation of the structural materials (design of the beamwindow and spallation target) and the kind of materials to be transmuted by the source.The spectrum of spallation neutrons evaporated from an excited heavy nucleusbombarded by high-energy particles is similar to the fission neutron spectrum slightlyshifting to higher energies. The average neutron energy <En> ≈ 3-4 MeV, higher than the~2 MeV of the fission neutrons due to the contribution of direct knockout neutrons. Thishigher average energy makes these source neutrons more suitable transmuting elementswith different resonance spectra, although the damage to the structural materials is alsomore intense.

Chapter 3 ADS Background and Physics
39
∑ Spallation Product Distribution, determining the radiotoxicity of the residues(radioprotection requirements).
∑ Energy Deposition, which determines the thermal-hydraulic requirements (coolingcapabilities and nature of the spallation target).
Figure 3.6. Representation of the spallation process caused by a proton interacting with heavy nuclei [52].
Several nuclear reactions are capable of producing neutrons, as presented in Table 3.1, whichsummarises the most common accelerator-based neutron sources. However the use of protonsminimises the energetic cost of the neutrons produced, especially because of the high neutronyield and the simplicity of their production.
Table 3.1. Neutron sources based on fusion, photonuclear, fission and spallation reactions [26 & 53].
Nuclearreactions
Incident particle& typicalenergies
Beamcurrent(part/s)
Neutronyield
(n/inc.part.)
Targetpower(MW)
Energydeposited per
neutron (MeV)
Neutronsemitted
(n/s)(e-, g) & (g, n) e- (60 MeV) 5 ¥ 1015 0.04 0.045 1500 2 ¥ 1014
3H (d, n) He4 2H (0.3 MeV) 6 ¥ 1019 10-5 – 10-4 0.3 104 1015
Fission ~1 57 200 2 ¥ 1018
Spallation (non-fissile target) 14 0.09 37 2 ¥ 1016
Spallation(fissile target)
p (1 GeV) 1015
30 0.4 55 4 ¥ 1016
Deuteron and triton projectiles produce more neutrons by spallation than protons in the energyrange below 1-2 GeV, but they also produce a higher contamination of the accelerator(activation of the cyclotron).

Chapter 3 ADS Background and Physics
40
The number of emitted neutrons varies as a function of the target nucleus and the energy ofthe incident particle; for protons as projectiles, it saturates around 2 GeV. Figures 3.7(a) and3.6(b), produced by the author using the FLUKA Monte Carlo code, show this fact, as well asthe neutron yield for different elements. Clearly, heavier elements, such as natural uranium(actinides in general), produce a higher number of neutrons by spallation; the main drawbackis that they may also fission and the products of both reactions are highly radioactive. On theother hand, the most efficient energies to produce spallation neutrons are given by the ratiobetween the neutron yield and the proton energy, shown in Figure 3.7(b). In the case of lead,the maximum yield is obtained at ~1.2 GeV whereas for a lighter nuclei such as aluminiumthe optimal energy is ~0.6 GeV. For elements presenting higher yields than lead (e.g. tungstenand uranium), the optimal energy to maximise the spallation cascade seems to be ~1.8 GeV.
In the case of tungsten ( W18474 ), although this element is lighter than lead ( Pb208
82 , double magicnumber), the density of the former is higher (rW = 19.3 g/cm3, rPb = 11.4 g/cm3) and thereforethe interaction rate in this element is greater. The choice of lead as the spallation target for themajority of full-scale ADS designs is partly due to the advantages of a liquid target over asolid one (the melting temperature for lead is low, TM = 327 ∞C, whereas for tungsten TM =3422 ∞C), since a liquid target presents less mechanical constraints and offers better thermalproperties, and partly due to the fact that lead reaction products are noticeably less active thanthe ones of any other acceptable spallation source.
0.01
0.1
1
10
100
0 0.2 0.4 0.6 0.8 1 1.2 1.4 1.6 1.8 2
Spal
latio
n ne
utro
n yi
eld
(n/p
)
Proton energy (GeV)
Al W Pb U
(a)
0
10
20
30
40
50
60
0 0.2 0.4 0.6 0.8 1 1.2 1.4 1.6 1.8 2
Spal
latio
n ne
utro
n yi
eld
(n/p
/GeV
)
Proton energy (GeV)
Al W Pb U
(b)
Figure 3.7. Spallation neutron yield for different materials and neutron energies calculated with FLUKA.
The spallation product distribution varies as a function of the target material and incidentproton energy. It has a very characteristic shape: at high masses it is characterised by thepresence of two peaks corresponding to (i) the initial target nuclei and (ii) those obtained afterevaporation, three very narrow peaks corresponding to the evaporation of light nuclei, and anintermediate zone corresponding to nuclei produced by high-energy fissions. Both peaks ofproduct composition can clearly be observed in Figure 3.8, produced by the author using

Chapter 3 ADS Background and Physics
41
FLUKA, which shows the spallation product distribution by mass number (blue curve, A),and by atomic number (dashed red curve, Z) generated by 1 GeV protons on a lead target.
As explained before, the highest peak shown in Figure 3.8 is centred on the mass of the targetisotopes (in this case, A ~207 amu). The isotopes above this mass are produced by activation,i.e. neutron capture in the target material. For an atomic mass 160 < A < 200, the isotopes areproduced through evaporation, therefore originating from the same initial nuclei as the lowmass peak (1 < A < 10). The peaked distribution in this energy region is mainly due to theproduction of a-particles, 3He, deuterons and tritons. The central region contains thedistribution of the isotopes produced through high-energy fission.
1x10-13
1x10-12
1x10-11
1x10⁻¹⁰
1x10⁻⁹
1x10⁻⁸
1x10⁻⁷
1x10⁻⁶
0 50 100 150 200
0 10 20 30 40 50 60 70 80 90
Isot
ope
prod
uctio
n (n
ucle
i/cm
3/pr
oton
)
Spallation product mass number (A)
Spallation product atomic number (Z)
Mass number (A)
Atomic number (Z)
High-energyfission products
Evaporationproducts
Activationproducts
Evaporatedelements
Figure 3.8. Spallation product distribution on lead for 1 GeV protons.
In fact, at high neutron energies, fission accounts for the majority of the nuclear interactionsoccurring in actinides. Similarly, high-energy fissions are also relevant in lead, as illustratedin Figure 3.8 by the symmetric fission fragment distribution. This distribution covers a largenumber of elements, between 30 < A < 160, and is centred in A ~90 (Z ~40), thus yielding amore uniform fragment distribution than the two-humped fragment distribution produced bythermal fission in fissile actinides (i.e. 233, 235U and 239Pu). These FFs are also lighter onaverage than those produced through thermal fission, since the initial mass of lead is ~12 %smaller than that of uranium.

Chapter 3 ADS Background and Physics
42
The radiotoxicity of these spallation products is therefore a key issue to address in order toevaluate the ADS potential to eliminate nuclear waste, given that the main objective of thesesystems is to reduce the radiotoxicity of the waste. Figure 3.9, produced by the author usingthe EA-MC code package, shows the origin of the radiotoxicity of the different spallationproducts in the lead target and its time evolution. At first, the doses are dominated by theevaporation products until their exponential decay ~4,000 years after irradiation. From thatmoment, mainly the activation products endure until their almost complete decay after~400,0000 years. The contribution of the high-energy fission fragments to the radiotoxicity isimportant for ~100 years, strongly decreasing afterwards.
1x101
1x10²
1x10³
1x10⁴
1x10⁵
1x10⁶
1x10⁷
1x10⁸
1x10⁹
1x10⁻² 1x10⁻¹ 1x100 1x101 1x10² 1x10³ 1x10⁴ 1x10⁵ 1x10⁶
Inge
stiv
e ra
diot
oxic
ity (S
v)
Time (yr)
MOX fuel(one tonne)
Total target toxicity
Activationproducts
Evaporationproducts
Fissionfragments
Figure 3.9. Comparison between the evolution of the radiotoxicity of the spallation products of a 1 GeV proton
target and 1 tonne of fresh MOX fuel.
Figure 3.9 also shows the time evolution of the radiotoxicity of 1 tonne of MOX fuel (initially20 % plutonium) compared with that of the spallation products of a 1 GeV, 10 mA leadspallation target after an extended period of ~7 years of irradiation.
Initially, fresh MOX (which itself is much less radiotoxic than spent fuel, as will be seen inChapter 6) is ~20 times more hazardous than the spallation products. In addition, MOX goesfrom ~125 times higher radiotoxicity 2 years after irradiation to ~250 times higher after 10years. For longer periods of time, the difference between radiotoxic levels of MOX and the

Chapter 3 ADS Background and Physics
43
spallation products continue to increase, in particular once the evaporation products in leadhave decayed. After 400,000 years, the toxicity of the target has dropped to ~40 Sv, while thatof the fresh MOX fuel is still ~8¥104 Sv.
The previous comparison shows large differences between the radiotoxicity of a spallationtarget subject to an intense and extended irradiation and MOX fuel before irradiation. If theseresults are compared with Figure 2.1, the differences are even larger, demonstrating that theradiation hazard of the spallation target is orders of magnitude smaller than that of spent fuelit would help to eliminate.
3.3.2 Neutron Multiplication in a Subcritical SystemIn a critical system the loss of neutrons by absorption is exactly compensated by theirproduction due to fission, therefore maintaining a constant population of neutrons in thesystem. This is not the case in a subcritical system, where the number of neutrons producedby fission is insufficient to compensate for their absorption, making the neutron populationexponentially decay with time. Evidently, the closer the system is to the critical state the moreneutron generations will be produced (continuing the multiplication longer in time) and thelarger the spread will be due to the diffusion of the neutrons in the medium. A thoroughcomparison of the dynamic behaviour of neutrons (both fission and spallation) in thermal andfast systems is presented in Chapters 5 and 6.
Therefore, in order to maintain continuous operation, an external source must supply theneutron deficit, and its intensity will increase as the system becomes more subcritical. Thisfact has some important implications transforming the essence of neutron multiplication in thesystem. In a critical system, the start-up phase and normal operation are decoupled, in thesense that the steady state is completely independent of the details of the source (i.e. position,intensity and energy spectrum) used to start the chain reaction, since these elements onlyaffect the start-up phase. Consequently, it is sufficient to evaluate the fundamental mode(eigenfunction) of a critical system when its stationary operation is studied.
In a subcritical device, since an external neutron source is necessary to compensate for thelack of reactivity, the system operates in the so-called source dominated regime, analogous tothe start-up condition. This implies that several modes (not just the fundamental one) will becontinuously excited, subordinating the reactor operation to the source characteristics (e.g. thepower produced by the core will be proportional to the intensity of the source).

Chapter 3 ADS Background and Physics
44
3.3.3 Neutron Source Multiplication: ksrc
These facts suggest a reconsideration of the definition of parameters such as the multiplicationcoefficient (k). If Nj is the number of neutrons in jth generation, and k the ratio of the numberof neutrons between one neutron generation and the previous one, then:
�
N j < N j-1 < N0
�
k j =N j
N j-1with
�
k j < 1 for
�
"j ≥ 1 (Eq. 3.2)
Thus, the total number of neutrons, NT , produced by fission multiplication (plus the originalsource, N0) in the system during m generations, is expressed by Equation 3.3:
�
NT = N0 + N1 + ... + Nm = N0 ◊ 1+ k1 + k1 ◊ k2 + ... + k jj=1
m
’Ê
Ë Á ˆ
¯ ˜ (Eq. 3.3)
In this sense, the present definition of the multiplication coefficient is essentially different,although related, to the definition of keff, taking into account the effect of the source in themultiplication process. From Equation 3.3, the total net multiplication of the system, Mn,representing the source amplification, can be defined:
�
Mn =NT
N0(Eq. 3.4)
In addition to this, if the system is close enough to criticality and the neutron population isdominated by the fissions, kkk kj @@ . In such a situation, the geometric series converges if|k| < 1, as presented in Equation 3.5:
�
NT = N0 ◊ k j
j=0
m
 = N0 ◊1- km
1- klimmÆ •æ Æ æ
N0
1- k(Eq. 3.5)
These results permit the definition of ksrc as:
�
NT ∫N0
1- ksrc, thus,
�
ksrc = 1-1Mn
(Eq. 3.6)
Therefore, generally srceff kk π , even though, under normal operation (i.e. system close tocriticality) both parameters tend to have similar values. Conceptually, keff is a parameterintrinsic to the system (i.e. independent of the source), which indicates how close the systemis to the critical state. In the case of subcritical systems, this parameter is useful tocharacterise the response of the system to variations of its configuration. In contrast, ksrc
relates the neutron population to the source intensity and the other characteristics of thesource; hence ksrc depends on the system geometry, materials and on the sourcecharacteristics.

Chapter 3 ADS Background and Physics
45
3.3.4 Neutron Source Importance: j*
By definition constant power operation requires n/keff neutrons per fission, which means thatan external source has to provide a number of neutrons per fission, which, in the case of beingdistributed exactly as the eigenfunction of the stationary problem, is given by Equation 3.7:
�
meff = n ◊1keff
-1Ê
Ë Á ˆ
¯ ˜ =n
Meff -1(Eq. 3.7)
In the case of an arbitrary external source, this equation becomes:
�
msrc = n ◊1ksrc
-1Ê Ë Á
ˆ ¯ ˜ =
nMsrc -1
(Eq. 3.8)
The ratio is known as the importance of source neutrons, as presented in Equation 3.9:
�
meff
msrc=1- keff( ) keff n( )1- ksrc( ) ksrc n'( ) = j* (Eq. 3.9)
This ratio evaluates the relative importance of the source neutrons with respect to the fissionneutrons generated in the subcritical assembly.
The operational safety margin on •k for an ADS with multiplication M (Figure 3.10(a)) canbe written as:
�
Dk•crit M( ) = k• M( ) ◊ j*
M -1(Eq. 3.10)
Figure 3.10(a) shows the neutron amplification M versus keff. The dashed line is theamplification that one would compute using keff instead of ksrc. The vertical and horizontalarrows indicate, respectively, the difference in the amplification at given keff and thedifference in ksrc (and hence the safety margin) at given amplification due to the distinctionbetween the two criticality factors, ksrc and keff. For example, for a ksrc ~0.98, the netmultiplication of the system M = 50. If the spallation source is removed, e.g. the proton beamis stopped, M would drop to ~30, and consequently the multiplication coefficient of thesystem, would decrease to the value of keff ~0.967.
This effect has important implications on the safety of an ADS, since this system will alwayshave a higher ksrc than keff, which is not modified by the spallation source. This fact guaranteesthat the system will become more subcritical after the spallation neutrons are removed,conferring another intrinsic safety factor to the device.

Chapter 3 ADS Background and Physics
46
Figure 3.10. Comparison of the relation between M and the two of neutron multiplications (keff and ksrc) [26].
Figure 3.10(b) represents function j*, the ratio of the actual safety margin to (1–ksrc) vs keff, ascomputed by a simple diffusive model for two cases with geometry schematising that of atypical ADS: (i) the fissile core is surrounded by a breeder (such as 238U blanket); (ii) the coreis surrounded by a diffuser (such as lead). In both cases, j* is well above unity and growswith keff.
In general, it is found that j* grows with k (Figure 3.10(b)). At a given k, j* increases with:
∑ the "containment" of the neutron source;∑ the ratio of the neutron diffusion length to the size of fissile core;∑ the presence of an absorbing medium "enclosing" the fissionable core, which in a sense
limits the "widening" of the neutron flux distribution as k is increased.
This parameter basically summarises how efficiently the source neutrons are used withrespect to the fission neutrons since in a ADS the energy distribution and behaviour of bothtypes of neutrons (and type of reactions they induce, survival probability etc.) differsnoticeably. Chapters 5 and 6 analyse these differences in the context of a thermal (TRADE)and a fast (EADF) ADS, respectively.
Moreover, [26] shows that the relation between the proton beam current ip, the power in thecore and its subcriticality is given by:
�
ip A( ) =n ◊
1keff
-1Ê
Ë Á ˆ
¯ ˜
j* ◊Z◊We f
(Eq. 3.11)
where W is the power produced in the core, ef is the energy per fission and Z is the number ofneutrons per incident proton (neutron yield). Thus, j* plays an important role in ADS

Chapter 3 ADS Background and Physics
47
performance assessment, where a higher value can sensibly reduce the proton beamrequirement, for a given subcriticality level.
3.4 Neutron Diffusion Theory for ADS
The neutron flux distribution (fx,y,z,t) is a basic parameter in the design of a nuclear reactor,particularly since the fuel consumption and the power distribution are generally proportionalto this parameter. In conventional nuclear reactors the flux distribution is mainly determinedby the boundary conditions due to the fact that they are designed to reach criticality andtherefore sustain a chain reaction. As explained in this section, for an ADS a precise definitionof the geometry and the energy distribution of the initial high-energy cascade is necessary inorder to obtain an accurate solution of the diffusion equation.
3.4.1 Solution to the Diffusion EquationTo illustrate some basic ideas, a simple uniform rectangular model will be considered,diffusing mono-energetic neutrons and operated away from criticality. The flux distribution inspace and time is represented by the one-group diffusion equation:
�
∂n∂t
= s + P - A + R (Eq. 3.12)
where s is the neutron source term; P represents the net rate at which neutrons are producedper unit volume by fission:
�
P = n -1( ) ◊ S f ◊f , where n is the average number of neutronsreleased per fission and Sf is the macroscopic cross-section for fission; A is the neutroncapture rate:
�
A = Sc ◊f . One-group diffusion theory describes the neutron leakage R in agiven uniform material through Fick’s law,
�
J = -D ◊—f , where D is the diffusion coefficient,f is the neutron flux and J is the neutron current, which represents the net vector flow ofneutrons through a surface. Fick’s law of diffusion shows that J is proportional to the gradientof the neutron flux, but oppositely directed; in other words, neutrons diffuse (or flowincreases) with decreasing neutron flux.
The neutron leakage in a unit volume is the difference between the incoming and outgoingneutron current:
�
∂∂tn x, y,z,t( ) ◊ DxDyDz = J x,t( ) - J x + Dx,t( )[ ] + J y,t( ) - J y + Dy,t( )[ ] + J z,t( ) - J z + Dz,t( )[ ]
(Eq. 3.13)

Chapter 3 ADS Background and Physics
48
The above equation is the differential form of the principle of conservation of mass, assumingthat the spatial neutron distribution in every coordinate is linearly independent. A Taylorseries expansion of Equation 3.13 gives the diffusion equation in a non-absorbing non-multiplying medium:
�
∂n∂t
= -—J = D—2f (Eq. 3.14)
Hence, in the general diffusion equation, the neutron leakage corresponds to
�
R = D ◊—2f . Theconcept of material buckling
�
Bm2 can be defined as:
�
Bm2 =
n ◊ S f - Sa
D(Eq. 3.15)
Assuming the system is in steady state, the one-group diffusion equation takes the followingform:
02m
2 =+f+f—DsB (Eq. 3.16)
where
�
D ª l tr 3 is the diffusion coefficient, ltr is the neutron transport mean free path, givenby
�
l tr = S t - m ◊ S s( )-1, where St, Ss and Sa are respectively the macroscopic total, scatteringand absorption cross-sections and
�
m is the average value of the cosine of the scattering angle.For the specific case of neutrons diffusing in a high-Z material, such as lead,
�
l tr @ Sa + S s( )-1
is a valid approximation [54].
The neutron flux is the solution of the Equation 3.16, where s is the contribution of theexternal source (neutrons per unit volume and unit time);
�
Bm2 can also be defined as:
�
Bm2 =
k• -1L2
(Eq. 3.17)
where k∞ and L are, respectively, the infinite multiplication factor and the diffusion length, asdefined by Equation 3.18 and Equation 3.19:
�
k• =n ◊ S f
Sa
�
L =D
Sa(Eq. 3.18 & Eq. 3.19)
In particular, when the reactor is an isotropic volume of fissile material and the neutrons aremono-energetic, k∞ and h are equivalent.
Considering a finite system, the boundary conditions of Equation 3.16 are vanishing flux andsource at the boundaries. This problem can be solved using the method of the eigenfunctions

Chapter 3 ADS Background and Physics
49
[55], whose central idea is that it is possible to obtain a solution to the diffusion equation interms of solutions to another differential equation. Thus, consider the wave equation:
�
—2y + H 2y = 0 (Eq. 3.20)
where H is a constant and the function y is required to satisfy the same boundary conditionsas the flux. Given that Equation 3.20 is an eigenfunction equation, its solutions form acomplete orthonormal basis, each eigenfunction yn corresponding to an eigenvalue Hn.
Moreover, the general solution to Equation 3.20 is:
�
y x( ) = F sin(Hx) + Kcos Hx( ) (Eq. 3.21)
Since f is an even function due to symmetry in space, only the even solutions (cosinefunctions) of the general one should be considered. The boundary condition at x = a/2 (or at x= –a/2) gives:
�
ya2
Ê Ë
ˆ ¯ = Kcos H ◊ a
2Ê Ë
ˆ ¯ = 0 (Eq. 3.21)
which leads to an infinite series of values for H, since Equation 3.21 will be satisfied by K = 0(the trivial solution) and Hn = n·p/a.
To form an orthonormal basis, the eigenfunctions in the solution must comply with
�
y nÚ2dx = 1, which implies that
�
K = 2 a .
The orthogonality condition can be expressed as:
�
y n ( x) ◊-a / 2
a / 2
Ú ym (x) ◊ dx =2a◊ cos mpx
aÊ Ë
ˆ ¯ ◊-a / 2
a / 2
Ú cos npxa
Ê Ë
ˆ ¯ ◊ dx = dnm ∫
1¨ m = n0¨ m π n
Ï Ì Ó
(Eq. 3.22)
By analogy to problems in acoustics, the eigenfunction corresponding to the lowest value of n(n = 1) is called the fundamental eigenfunction or first harmonic; all the other eigenfunctionsare referred to as higher harmonics.
Since the solution basis is a complete one, any function in the domain of the solutions ofEquation 3.20 (and, therefore, of Equation 3.16, since the differential operator and theboundary conditions are the same) can be expressed as a linear combination of theeigenfunctions:
�
f ( x) = Cny n ( x)n=1
•
 (Eq. 3.23)

Chapter 3 ADS Background and Physics
50
Any linear coefficient Cm is found by projecting f(x) on ym (using the orthogonality condition)as shown in Equation 3.24:
�
Cm = f ( x) ◊-a / 2
a / 2
Ú ym ◊ dx (Eq. 3.24)
Hence, the unknown neutron flux and the source can be expressed in the same way:
�
f( x) = Qny n ( x)n=1
•
Â
�
s( x) = Sny n ( x)n=1
•
 (Eq. 3.25 & Eq. 3.26)
Inserting Equations 3.25 and 3.26 into 3.16 yields:
�
Qnn( odd )Â d2y n
dx 2+ Bm
2 y nÈ
Î Í
˘
˚ ˙ = -
1D
Snn( odd )
 y n (Eq. 3.27)
Given that yn satisfies Equation 3.20, Equation 3.27 becomes:
�
Qnn( odd )Â -Hn
2 + Bm2( )y n[ ] = -
1D
Snn( odd )
 y n (Eq. 3.28)
Due to the orthogonality of the eigenfunctions, Equation 3.28 can be decoupled into aninfinite series of equations of the following type:
�
Qn Bm2 - Hn
2( )y n = -SnD
y n (Eq. 3.29)
Rearranging Equation 3.29, substituting Qn into Equation 3.25 and substituting for Bm and D:
�
f( x) =1
Sa◊
Sn1- k• - Hn
2 ◊L2( ) y n =Sn
Sa 1+ Hn2 ◊L2( ) ◊
11- kn
y nn( odd )
Ân( odd )Â (Eq. 3.30)
where kn is defined by:
�
kn =k•
1+ Hn2 ◊L2
(Eq. 3.31)
It follows that if all kn’s are smaller than unity, then the flux is given by a linear superpositionof eigenmodes; as soon as k1 = 1 the system becomes critical; the source is no longer neededto sustain the system, and the only surviving mode is the fundamental one.
If 02m >B , the system is supercritical, and therefore the source term is cancelled, resulting in:
�
f( x, y,z) = y lmqn( odd )Â =
8abc
cosplxa◊cosp
myb
◊cospqzcn( odd )
 (Eq. 3.32)

Chapter 3 ADS Background and Physics
51
On the other hand, if 02m <B , the system is subcritical, and the solutions are of exponential
form:
�
y(x) = A1 ◊e- g ◊x + B1 ◊e
g ◊x
y(y) = A2 ◊e- g ◊y + B2 ◊e
g ◊y
y(z) = A3 ◊e- g ◊z + B3 ◊e
g ◊z
È
Î
Í Í Í
˘
˚
˙ ˙ ˙
when
�
- g 2 =k• -1L2
(Eq. 3.33)
As shown in Figure 3.11, the neutron spatial distributions in an ADS and a conventionalreactor are rather different. Compared to the well-known cosine solution for the neutron fluxin the diffusion equation in critical reactors, ADS have both exponential and sinusoidalcomponents in the solution. If the subcritical system is far from criticality, the neutron fluxdistribution falls exponentially from the target region, decreasing rapidly and thereforedepleting the fuel around the target and imposing a highly non-uniform composition on thecore.
Figure 3.11. Neutron flux distribution for spallation, subcritical (k = 0.9) and critical systems [26].
3.4.2 Diffusion in a High-Z MaterialThe diffusion of neutrons in the core includes a whole range of rather complicated nuclearinteractions, such as elastic (n, ne) and inelastic (n, ni) scattering, radioactive capture (n, g),(n, 2n) and (n, 3n) – usually referred to as (n, xn) – fission, spallation (described in 3.3.1), etc.Of all these reactions, elastic scattering is arguably the most common one, having a decisiveinfluence on the neutron energy spectrum, and, thus, on the reactor behaviour. Therefore, the

Chapter 3 ADS Background and Physics
52
basic principles underlying this type of nuclear interaction, as well as the differences due tothe nature of the target nuclei are important to the development of ADS for nuclear wastetransmutation.
This basic process takes place when a neutron is elastically scattered from a nucleus at rest.The nucleus recoils from the site of the collision; thus the kinetic energy of the scatteredneutron is lower than its initial energy. Let pn and En be, respectively, the momentum andkinetic energy of the neutron before the collision,
�
pn' and '
nE the momentum and kineticenergy of the neutron after being scattered, and PM and EM the momentum and kinetic energyof the nucleus after the collision (Figure 3.12). The energy loss in elastic scattering can befound from the laws of conservation of energy (
�
En = En' + EM ) and momentum.
(
�
r p n =r p n
' +r P M ).
Figure 3.12. Vector diagram for the conservation of momentum during an elastic collision.
Applying the law of cosines to the momentum conservation:
�
PM2 = pn
2 + ( pn' )2 - 2 ◊ pn ◊ pn
' ◊cosq (Eq. 3.34)
Given that p2 = 2ME, combining momentum conservation with Equation 3.34, and since M(the mass of the target nucleus) over m (the neutron mass) is approximately A (the atomicnumber of the target nucleus),
�
A ◊ EM = En + En' - 2 En ◊ En
' ◊cosq (Eq. 3.35)
Using conservation of energy to substitute for EM in Equation 3.35:
�
(A +1) ◊ En' - 2 ◊ En ◊cosq ◊ En
' - (A -1) ◊ En = 0 (Eq. 3.36)
This quadratic equation in
�
En' has the solution:
�
En' =
EA +1( )2
◊ cosq + A2 - sin2 q( )2 (Eq. 3.37)
since the other solution for the equation is non-physical.

Chapter 3 ADS Background and Physics
53
Thus, for a minor collision q ª 0 , the energy of the neutron after the elastic interaction is
�
En ª En' . From Equation 3.37, it follows that the maximum energy loss (
�
En' ) min occurs when
q = p, when the neutron is scattered backwards. In this case Equation 3.37 yields:
�
En'( )min =
A -1A +1
Ê Ë
ˆ ¯
2
◊ En = a ◊ En (Eq. 3.38)
where
�
a =A -1A +1
Ê Ë
ˆ ¯
2
is the so-called collision parameter.
Hence, a ranges from 0 for 1H to 0.716 for 12C, 0.931 for 56Fe and 0.981 for 208Pb. This facthas important implications in the physics of transmutation, since it conditions the neutronenergy spectrum of the system. As mentioned in Chapter 2, the LLFFs have generally smallcross-sections except for very specific and narrow resonances. The neutron flux in theseresonances could have a large impact on the transmutation rate of these isotopes [23], and thisneutron flux depends only on x – the average change in lethargy2 – which in turn depends ononly the atomic mass of the target (and not the neutron energy). Thus, heavy nuclei producesmall x, which may increase the neutron flux inside the resonances and, therefore, giveshigher transmutation rates. In the case of the actinides, the fission-to-capture ratio is orders ofmagnitude larger in the high-energy range (above 1 MeV) for most of them. Therefore, only aneutron energy spectrum presenting large values in the resonance (epithermal) and fastregions, together with a large absolute value, may suit the purpose of transmuting thesenuclear species.
In this sense, the use of lead as a coolant seems favourable, since the maximum energy loss ofa neutron undergoing an elastic interaction (a head-to-head collision) is less than a 2% of theneutron energy, with an average mean free path lelas ª 3.4 cm independent of the neutronenergy (selas is constant between 10–3 and 105 eV, except for small resonances, as observed inFigure 3.13, produced by the author from the JENDL-3.2 data library).
Lead also presents a very low capture cross-section (the main isotope in natural lead, 208Pb, isdouble magic [56], and thus exceptionally stable), improving the neutron economy. Moreover,the large mass number, the largest A of the stable isotopes together with 209Bi, qualifies leadas a exceptional coolant for transmutation purposes, given the small energy loss in everycollision and the large l, providing a high neutron flux with a hard energy spectrum.
2 In treating the neutron slowing down process the energy variable may be replaced with the neutron lethargy,defined as u = ln(E0/E), where E0 is the maximum energy of a neutron in the system. Since du = -dE/E, thechanges in lethargy are independent of the neutron energy. The average change in lethargy, x, is generallyapproximated as x ª 2/(A+0.667), where A is the mass number of the target.

Chapter 3 ADS Background and Physics
54
1x10⁻⁴
1x10⁻³
1x10⁻²
1x10⁻¹
1x100
1x101
1x10²
1x10⁻⁵ 1x10⁻⁴ 1x10⁻³ 1x10⁻² 1x10⁻¹ 1x100 1x101 1x10² 1x10³ 1x10⁴ 1x10⁵ 1x10⁶ 1x10⁷ 1x10⁸
Cro
ss-s
ectio
n (b
)
Neutron energy (eV)
Elastic scattering
Neutron capture
Figure 3.13. Comparison between the elastic scattering and capture cross-sections for natural lead.
3.5 Fuels for ADS: Thorium Fuel Cycle
At a first stage, fuel-breeding systems were designed to operate using the 239Pu breeding cyclefrom 238U. This plutonium breeding cycle presents a number of problems common to both theuse of MOX fuel and the operation of plutonium fast breeders. These problems include theproduction of very large quantities of TRUs, which, as explained in Chapter 2, are highlyradiotoxic and difficult to eliminate.
Although fast critical systems may alleviate the plutonium stockpile, the spent fuel from thesesystems would contain large amounts of MAs. These elements present very unfavourablesafety parameters, such as a very small delayed neutron fraction (0.21 % for 239Pu, 0.14 % for241Am or 0.13 % for 244Cm compared to 0.65 % for 235U and 1.91 for 238U, as shown in Table2.2) and very low temperature feedback. The effect of Doppler broadening is less patent sincethe fast systems operate above the resonance region of many elements and MAs do notgenerally present distinctive capture resonances decoupled from the fission resonances, as isthe case of 238U.

Chapter 3 ADS Background and Physics
55
Additionally, the already small negative void coefficient in these systems may even becomepositive in the case of an increase in the coolant void due to a temperature rise or a Loss-Of-Coolant-Accident (LOCA). In fact, the void coefficient of a sodium cooled fast reactor is notdistinctly negative for some temperatures. Moreover, the MOX fuel in these systems presentsa temperature coefficient of ~-2¥10-5 per K (-2 pcm/K), which decreases with burn-up.
The thorium fuel cycle raised the interest of the nuclear industry since the 1950’s. Nowadays,these interest has increased even further as a means of eliminating TRUs. On the other hand,the fissile element in this cycle, namely 233U, presents a small delayed neutron fraction, thushindering the control of a critical system, and specifically a fast critical system loaded with alarge amount of higher actinides. Moreover, the production of 233Pa (intermediary in thebreeding process) and a larger fraction of 135Xe (1.4 % direct yield from 233U, compared to the0.3 % for 235U) and other samarium precursors (e.g. 147Nd and 149Pm) depletes the neutronpopulation due to the large thermal capture cross-section of these elements. This fact wouldrequire a higher level of fuel enrichment and would limit the length of the burn-up period.
Therefore, since an ADS may operate with a wide range of fuel mixtures and burn-upschemes, several designs of ADS have chosen the thorium cycle as a way of reducing thestockpile of plutonium waste from conventional reactors and nuclear warheads. Equation 3.39shows the breeding process taking place in the thorium cycle (as opposed to the 239Pubreeding process from 238U commonly used in sodium-cooled fast reactors):
�
232Th(n,g )233Thb - ,t 1
2=22min
æ Æ æ æ æ æ 233Pab - ,t 1
2=27days
æ Æ æ æ æ æ 233U(t 12
= 1.6 ¥105 yr) (Eq. 3.39)
During operation, the TRUs load would be fissioned, while 233U would progressively beproduced. The freshly bred 233U could compensate for the loss of reactivity due to theelimination of fissile plutonium and the poisoning produced by the FFs. Therefore, operationover long burn-ups (120-150 GWd/tHM [1]) could be possible.
As mentioned earlier, the thorium fuel cycle has several advantages over the uranium fuelcycle. The radiotoxicity accumulated is much smaller, since the production of TRUs during anoperating cycle is drastically reduced compared with the use of 238U as the matrix of the fuel.This fact is highlighted by Figure 3.14, where the differences between the paths to befollowed by 232Th and 238U to produce MAs by neutron capture can be appreciated. In the232Th chain there are two isotopes, namely 233U and 235U, for which the fission cross-section isorders of magnitude larger than the capture cross-section, therefore greatly reducing theproduction of TRUs. This issue is of great relevance given that a major part of the HLW iscomposed of these elements, which generally have a small total cross-section, and hence aredifficult to eliminate.

Chapter 3 ADS Background and Physics
56
Availability is another strong point in favour of this fuel cycle. Thorium is an abundantelement in the earth’s crust, about 12 g/tonne, three times the value for uranium [57], ranking35th by abundance, just after lead, and it is spread over the surface of the planet. In fact, [58]claims that there may be more energy available for use from thorium in the minerals of theearth’s crust than from all combined uranium and fossil fuel sources.
Figure 3.14. Decay chains of different actinides in the thorium fuel cycle [26].
The estimates of thorium abundance presume around 6¥106 tonnes in the whole world, whichcould produce ~15,000 TW◊yr of energy if used in EAs [1], about a factor of 100 larger thanthe known reserves of oil or gas and a factor 10 larger than coal, corresponding to 12.5centuries at the present world’s total rate of power consumption (10 TW) [57].
3.6 ADS Simulation using Monte Carlo Methods
The sequence of phenomena occurring in an ADS, from the high-energy proton inducedcascades within the target producing neutrons that are subsequently absorbed, to themultiplication of these source neutrons in the fuel, is a coupled physical problem requiringinnovative computational methods to be accurately solved. Therefore, for a correct simulationof an ADS, it is essential to understand the details of the physics related to all thesephenomena. In this context, an innovative simulation code was developed at CERN [37 & 38]using Monte Carlo (MC) techniques, and validated through several experiments, such asFEAT and TARC.

Chapter 3 ADS Background and Physics
57
The analysis of an ADS requires powerful simulation tools for:
∑ The modelling of the high-energy cascade and of the neutron production;∑ The transport of the low energy (E ≤ 20MeV) neutrons;∑ The description of the fuel evolution as a result of neutron interactions and nuclear
decays;∑ The nuclear transmutation and activation of the structural materials and coolant due to the
presence of a neutron fluence and of the proton beam induced high-energy cascade.
These requirements imply that the tools commonly used to simulate conventional criticalreactors cannot be applied to ADS, since the neutron flux strongly depends on the high-energycascade.
3.6.1 Monte Carlo MethodsMC methods are statistical methods (as opposed to deterministic methods, which solve thetransport equation), which sample a given problem with random numbers in order to solve it.Hence, the accuracy of the results depends strongly on the number of trials given to theproblem.
In the case of nuclear reactor engineering, these simulation methods take into account theprobabilities of different reactions occurring (i.e. cross-sections), while random numbers aregenerated and depending on the probability distribution function (PDF) for every case,different reactions occur which may drive other reactions (also depending on their PDFs andthe new random numbers generated).
There are several advantages in the use of MC methods to simulate an ADS. The largeamount of information provided by the point-like cross-sections, the continuous spatialresolution, accurate geometrical definition, full treatment of resonances and full 3Dcalculation of activation and spectrum-dependent transmutation effects are hardly achievableby deterministic methods.
Deterministic codes are based on the solution of the neutron transport equations, and in orderto make the problem solvable by the computer, a discretisation is introduced both in space andin energy. These codes operate on a spatial grid and on a fixed number of energy groups.While this approach is viable in many applications, and widely used to simulate criticalreactors, it has certain drawbacks when applied to the simulation of an ADS. Deterministiccodes calculate keff via an eigenvalue search of the multi-group equation system [59]. Thesemay ignore in their scattering matrix non-fission multiplicative processes such as (n, xn),which are of great importance for lead-cooled fast reactors and the thorium fuel cycle due tothe large (n, 2n) cross-sections for thorium and lead.

Chapter 3 ADS Background and Physics
58
The interplay between resonances in a material of time-varying composition would be acomplicated problem to solve using a multi-group analytical code; the self-consistent fluencefield would have to be computed and then used to condense the cross-sections at every burn-up step, with the supplementary condition of all fluences converging simultaneously, since thefluence in each region affects any other region. This fact, added to the space-dependent timeevolution of the fuel, would make difficult the computation of such a problem by an analyticalcode.
On the other hand, MC methods have several limitations which can affect the accuracy oftheir results. These limitations could be summarised as:
(a) the need for correct ND, in particular, cross-section information. Clearly, the accuracy ofthe cross-section data for a broad neutron energy range (10–5-2¥107 eV) may affect thefinal results of the reactor neutronic calculations, especially those for transmutation inADS, since the isotopes involved and the energy range are rare in conventional reactorphysics. Nevertheless, this effect is common to all transport codes and the ND is beingcontinuously improved by ongoing experiments, e.g. n_TOF [60], as elaborated inChapter 4;
(b) the physical model used to define high-energy reactions (especially neutron production atthe source); for low energy neutron transport this is mainly expressed by the data (partialreaction cross-sections, double differential cross-sections, etc.).
Another drawback of MC methods is the slow statistical convergence due to the randomnature of the events generated, correlated with the number of trial events N. This statisticalerror convergence is unfortunately proportional to √N (rather than N) making it rather slow.Moreover, this rate of convergence is guaranteed only provided the variance of thedistribution is finite. For example, this is not the case for the energy losses due to theionisation cascade of a charged particle in an ordinary medium, where the Landau distributionhas a variance which is infinite: its width (due to fluctuations) slowly decreases with thenumber of collisions log(√N). On the other hand, for a fission driven sub-critical multiplyingmedium, the variance of the distribution is large but finite [61], although the meanmultiplication factor M and related fluctuations are dominated by a few cascades with largefission multiplication. Therefore, accurate results for complex, time-dependent, 3D-geometryADS problems are currently achievable, in an acceptable time frame, by the use of fastparallel computers which can generate many events simultaneously.
3.6.2 The FLUKA / EA-MC Code PackageFLUKA / EA-MC is a three-dimensional point-energy MC code which stochasticallycalculates the distribution of neutrons in space as a function of energy and time. The neutron

Chapter 3 ADS Background and Physics
59
data are derived from the latest ND libraries, such as ENDF/B-VI (US), JENDL-3 (Japan),JEFF-3 (Europe) etc. Figure 3.15 shows the general architecture of the code package and theinformation flow.
The FLUKA / EA-MC simulation package integrates neutron transport and evolution of thematerial composition in the same code. To take into account the time evolution a burn-up stepis defined (e.g. 1 day), and, depending on the statistical requirements of the system, i.e. thenumber of neutrons (or equivalent protons) to reach convergence, the results are scaled up tothe accelerator current in order to obtain the operational values of the device.
Figure 3.15. General architecture of the EA-MC simulation of neutron transport and element evolution [38].
The spallation neutron source distribution is generated by FLUKA, transporting the neutronsdown to an energy of 19.6 MeV, and then writing to a history file. 19.6 MeV is selected forneutrons as being just below the upper limit (20 MeV) of neutron cross-section data sets.FLUKA performs the de-excitation of the nuclei in several steps:
∑ Interaction point selection and projectile tracking through the nucleus, according to Fermimotion (movement of nucleons inside the nucleus [62]), averaged hadron-nucleon cross-sections and nuclear mean field, including the Coulomb field;
∑ Secondary tracking into the nucleus, until interaction, escape, or energy cut-off.∑ Pre-equilibrium stage: whenever all excited nucleons are below a given energy threshold
(typically a few tens of MeV).∑ Evaporation stage: whenever the pre-equilibrium stage is finished, or all particles are
below a given threshold (usually of the order of the binding energy), and the system canbe assumed to be in equilibrium.

Chapter 3 ADS Background and Physics
60
∑ Final de-excitation stage: when the excitation energy is below the threshold for particleemission and it is dissipated through photon emission.
The EA-MC code follows all neutrons generated in the cascade initiated by the spallationsource produced by FLUKA. The neutron transport is modelled in time steps which varyadaptively according to the burn-up phase, since by reaching equilibrium the system changescomposition slower. The material evolution is performed between transport steps, and thematerial composition is updated according to the neutron interactions simulated in everymaterial zone. High-energy spallation products coming from FLUKA are added to thematerial composition on a proton-by-proton basis. The contribution of all fission, spallation,decay and activation products is considered explicitly during neutron transport.
The cross-sections are used directly from the pre-processing codes, without approximations;in some cases the cross-section for a single reaction channel can contain more than 60,000points – such is the case for thorium.
Every material can have a different temperature, inherited by the nuclear species producedthere. New temperatures can be generated during the simulation either by Doppler broadeningor by linear interpolation of existing evaluations. The fuel material in the core can containseveral hundred elements with cross-sections and up to 2000 different nuclear species. Due tothis fact, the code was optimised to reduce the time to transport the particles, which for aneutron is approximately 8 µs/processor on a Convex SPP2000 machine [38].
The solution of the Bateman equations, involving thousands of elements, is computed in orderto avoid approximations in the concentration evolution. Finally, a combination of storagetechniques, such as the sorting of the cross-sections of the commonly produced elements andthe most used energy ranges, together with decay chain algorithms, allows the evolution of allmaterials. The use of smoothing techniques in the case of very short-lived elements or strongconcentration gradients is also necessary in order to correctly compute concentrationsbetween burn-up steps.
As mentioned before, the neutron data is derived from the latest ND libraries: ENDF/B-VIrelease 8 (US), JENDL-3.3 (Japan), JEFF-3.0 (Europe), EAF-4.2 (Europe), CENDL-2.1(China), EFF-2.4 (Europe) and BROND-2 (Russia). The user has the option to utiliseindividual libraries or the CERN compilation of ND, JAR-95. For each nuclide in JAR-95,one evaluation out of those available has been selected on the basis of a systematiccomparison [63]. The selection was done isotope per isotope according to the evaluation ofthe resonances and the number of reaction cross sections. When both the resonance region andthe number of cross sections evaluated were similar, the most recently evaluated cross sectionwas selected.

Chapter 3 ADS Background and Physics
61
This Monte Carlo code package is used to perform the analyses presented in Chapters 5 and 6,from the transport of the high-energy particles (including the electromagnetic shower) to theneutronic simulation of the ADSs and their burn-up evolution. In fact, the wide range ofproblems where this code may be applied and the accuracy of the results, especiallyconcerning the isotopic evolution, are some of the benefits of using FLUKA / EA-MC.

Chapter 3 ADS Background and Physics
62

Chapter 4 Nuclear Data
63
Chapter 4
Nuclear Data
Accurate neutron cross-section data is fundamental to the reliable design of any transmutationdevice, and, in particular, of an ADS. Calculations of the behaviour of the core dependstrongly on the cross-section data: parameters such as the multiplication coefficient, powerdensities or reactivity may vary significantly depending on the Nuclear Data (ND) libraryused, since there is not yet a single universal data file with recommended best neutron cross-section values.
Moreover, the prediction of the nature of the waste generated in the nuclear fuel cycle and itsradiotoxicity is closely related to the accuracy of the ND. Given that the ultimate goal in thefield of transmutation is to reduce the radiotoxicity of the nuclear waste, the assessment of theproduction and destruction rates for the most hazardous isotopes requires precise knowledgeof the related ND.
The possible discrepancies between different ND libraries justify the need to improve thepresent data for several isotopes and reaction channels, for a wide range of neutron energiesfrom thermal to high-energy.
In this context, the n_TOF-ND-ADS project of the EURATOM 5th Framework Program wasconceived with the purpose of improving the ND related to transmutation in ADS. Thisproject involves the measurement of cross-section data for a wide range of isotopes andreaction channels in a neutron time-of-flight facility based at CERN. In particular, themeasurement of capture and fission cross-sections between 1 eV and 250 MeV of severalisotopes involved in ADS nuclear waste transmutation (e.g. MAs, lead or 209Bi), thorium fuelcycle (e.g. 232Th, 231, 233Pa or 232, 233, 234, 236U) and stellar nucleosynthesis (such as 151Sm orzirconium) are of especial relevance in this project.

Chapter 4 Nuclear Data
64
An analysis of the effects of different cross-section data was required in order to set a prioritylist for the isotopes to be measured. Parameters such as source multiplication coefficient ksrc,neutron spectra, neutron balance and one-group cross-sections for different isotopes usingdifferent ND evaluations had to be compared, highlighting the relative importance of differentisotopes and assessing the required accuracy for the given reaction cross-sections, thusestablishing the required precision of the measurements to be performed in the n_TOFexperiment.
4.1 The Importance of Nuclear Data
The experimental determination of neutron cross-sections for all the isotopes in theMendeleiev table has always been of primary importance in nuclear physics. Many of theoutstanding features of nuclear levels can be determined from the resonant structure of suchcross-sections and their decay schemes. These cross-sections have many different channelsand exhibit a complex phenomenology with numerous resonances over a very wide energyspectrum, extending from a fraction of eV to hundreds of keV of neutron kinetic energy.
In addition to such primary interest, current developments in fields such as nuclearengineering, radioisotope production for medical applications [64], humanitarian demining[65] and even propulsion for deep-space travel [66] have raised the practical need for betterknown cross-sections. In the case of modern nuclear reactor physics, the development ofaccelerator-driven devices to safely eliminate nuclear waste and produce energy in a clean,reliable way demands levels of accuracy in the knowledge of ND previously unnecessary. Thewide neutron energy range in which these devices operate and the diversity of elementsinvolved in their design justify an exhaustive research program to improve the presentknowledge of ND.
The design analysis of an ADS commonly makes use of MC techniques in order to predicttheir behaviour in a variety of possible configurations and operating conditions. In contrastwith the conventional multi-group methods used in reactor studies, the subcritical nature ofthe device, in which all fundamental modes are excited following a high-energy cascade, aspresented in Chapter 3, can only be properly studied with MC simulations of the complexnuclear phenomena. Thus, the extensive use of these techniques increases the importance ofthe accuracy of the libraries of cross-sections for neutron-induced reactions. The relativelyhigh energies involved require that not only neutron capture and fission, but also a largervariety of channels, such as, for instance, (n, 2n), (n, 3n), (n, np), etc., should be taken intoconsideration. The presence of a high-energy cascade necessitates the extension of theexploration to energies up to several hundreds of MeV’s.

Chapter 4 Nuclear Data
65
Consequently, the availability of reliable cross-section data for several channels andappropriate energies is a fundamental prerequisite for any computational method.Unfortunately, the available compilation databases present many uncertainties and substantialdifferences between them, due to the different fitting procedures and their reliance ondifferent theoretical models. Thus, these nuclear databases may not be completely accurateeither to design in detail an ADS prototype with a given precision (~50 pcm in ksrc) nor tosimulate in detail the behaviour of such a machine with a variety of different fuels, as requiredfor transmutation of HLW. Indeed, while some uranium related cross-sections are relativelywell known for some specific energies in the low-energy range, there are sometimes largedifferences between databases when it comes to neptunium, americium (Figure 4.1) andcurium, or more generally to TRUs (even some plutonium isotopes such as 238Pu or 242Pu).
1x10⁻⁴
1x10⁻³
1x10⁻²
1x10⁻¹
1x100
1x101
1x10⁻⁵ 1x10⁻⁴ 1x10⁻³ 1x10⁻² 1x10⁻¹ 1x100 1x101 1x10² 1x10³ 1x10⁴ 1x10⁵ 1x10⁶ 1x10⁷
Am
-243
fiss
ion
cros
s-se
ctio
n (b
)
Neutron energy (eV)
ENDF/B-VI
JENDL
JEFF
Figure 4.1. 243Am fission cross-section for ENDF/B-VI.8, JENDL-3.3 and JEFF-3.0.
Furthermore, the comprehensive elimination of HLW implies consideration of thetransmutation of several LLFFs into stable species. For such elements, the information is evenmore scarce and in many important cases, such as, for instance, 137Cs (Figure 4.2) or 90Sr,there are orders of magnitude discrepancies in the experimental data, which is mostlyconfined to the region of thermal or epithermal neutrons. In addition, the TARC method [23]requires precise information on the resonances and specifically their widths.

Chapter 4 Nuclear Data
66
4.2 Status of Nuclear Data Cross-Sections
A brief description of the present situation of the ND concerning the most relevant nuclei fornuclear waste transmutation is necessary. In particular, this description concentrates on themajor discrepancies in fission and capture cross-sections of actinides, since these not onlyaffect their transmutation rates but also the safety parameters of the system by, for example,increasing the uncertainties related to the value of keff, Doppler or void reactivity coefficients.The cross-section data in this section are those presently available in the internationallyrecognised ENDF/B-VI evaluated data format [67] and the Exchange Format (EXFOR)experimental data files [68] containing descriptive information on neutron, charged-particleand photon induced reactions on different target nuclei. The data from two different libraries,ENDF/B-VI.8 [69] and JENDL-3.3 [70], are compared, given that JEFF-3.0 [71] is for manyisotopes a carry-over from ENDF/B data.
1x10⁻⁵
1x10⁻⁴
1x10⁻³
1x10⁻²
1x10⁻¹
1x100
1x101
1x10²
1x10⁻² 1x10⁻¹ 1x100 1x101 1x10² 1x10³ 1x10⁴ 1x10⁵ 1x10⁶ 1x10⁷ 1x10⁸
Cs-
137
capt
ure
cros
s-se
ctio
n (b
)
Neutron energy (eV)
ENDF/B-VI
JENDL
JEFF
BJ
B ANL-60
J INL-77
Figure 4.2. 137Cs experimental and evaluated capture data for ENDF/B-VI.8, JENDL-3.3 and JEFF-3.0.
The difference between experimental and evaluated data is sometimes enormous, such as inthe case of 137Cs (Figure 4.2), where the EXFOR files present few experimental points, andonly at 0.025 eV (ten entries) and 1 eV (one entry), such as the measurements in ArgonneNational Laboratory (ANL) in 1960, and the one in Idaho National Laboratory (INL) in 1977.

Chapter 4 Nuclear Data
67
In this case, ND libraries predict rather different nuclear structures, depending on whichtheoretical model was applied to evaluate the cross-section.
This case is typical of the major part of the LLFFs ND, since few measurements have beenperformed due to the high activity and radiotoxicity of these elements (and the need for a highflux, high repetition-rate facility). For example, the EXFOR data present four measurementsof the capture cross-section of 135Cs at 0.025 eV (8 b), twelve measurements for 129I and tenmeasurements at 0.025 eV and 0.5 eV for 90Sr.
4.2.1 Thorium Cycle IsotopesThe experimental data for the isotopes involved in this cycle is rather incomplete and mostlybased upon theoretical models and nuclear systematics [72]. In particular, isotopes, such as234U or 233Pa, present no experimental cross-sections for (n, xn) reactions, and for 232Th and233U the information is fairly limited. A similar situation appears when inelastic scattering isanalysed. Few direct measurements of capture cross-section of 233U in the fast energy regionhave been performed and information on the fission cross-sections above 6 MeV for 232Th and233, 234U is also scarce.
It should be noted that a large part of the experimental data present in the ND files wasgenerated several decades ago. Moreover, the ND for MAs and thorium cycle isotopes ismuch more scarce than for the uranium-plutonium cycle.
The man-made isotope 233U is mainly obtained through breeding in 232Th, as shown inEquation 3.39, and therefore plays a major role in the thorium cycle, as the main fissileisotope. Ideally, the fission cross-section should be known in the energy region of interest to avery high accuracy, namely 1%. Generally, the fission cross-sections of 235U and 239Pu havebeen measured in precise experiments with a claimed accuracy of 2-3%.
Figure 4.3 presents the data for capture in 233U in the EXFOR files and the evaluated data inENDF/B-VI.8 and JENDL-3.3, showing large gaps of unmeasured energies which are filledby the values calculated theoretically. Conversely, measured values are sometimes replacedby calculated averages; such is the case of the unresolved resonance region, where the spacebetween resonances is so narrow that these are hardly distinguishable. For example, in Figures4.3 and 4.5 these regions correspond to an energy range between 200-2000 eV and 2-200 keVrespectively.
Special attention should be given to the data in the high-energy resonance region, which isavailable but not properly fitted to any model, and thus averaged for both libraries. There isalso an important gap in the experimental data between 20 keV and 300 keV that may beessential for a thorium-fuelled fast reactor. The absolute value of the relative difference in the

Chapter 4 Nuclear Data
68
cross-sections (green curve) seems to be about 10% in the energy range 1-10 eV and increasesseveral orders of magnitude at the end of the resonance region, reaching 2000% at 100 eV.This increase is due to the fact that the unresolved resonance region for ENDF/B-VI.8 starts at60 eV whereas for JENDL-3.3 it starts at 150 eV.
The main differences in the 233U fission cross-section occur in the energy range 10-1000 eV.As in the case of capture in 233U, the discrepancies in the fission cross-section for this energyrange stay around 10%, peaking at 90 eV where they reach ~600%. Obviously, if the cross-sections are grouped (in order to reduce computing time) the differences are reduced due towithin-group cancellation; therefore, the fewer the groups the smaller the discrepancies, butthis also implies a lower accuracy in the calculations, since less details, i.e. resonances, arepresent in the ND. The experimental data seems reasonably good except for a gap between10-70 keV and above 3 MeV. Hence an accurate evaluation of the data, together with newdifferential measurements to fill in the gaps and to confirm previous measurements uponwhich these evaluations were based, seems necessary.
1x10⁻⁶
1x10⁻⁵
1x10⁻⁴
1x10⁻³
1x10⁻²
1x10⁻¹
1x100
1x101
1x10²
1x10³
1x10⁴
1x10⁻⁶
1x10⁻⁵
1x10⁻⁴
1x10⁻³
1x10⁻²
1x10⁻¹
1x100
1x101
1x10²
1x10³
1x10⁴
1x10⁻² 1x10⁻¹ 1x100 1x101 1x10² 1x10³ 1x10⁴ 1x10⁵ 1x10⁶ 1x10⁷
U-2
33 c
aptu
re c
ross
-sec
tion
(b)
Relative difference (%
)
Neutron energy (eV)
ENDF/B-VI
JENDL
Relat. diff.
B3JF
BB
B BBBBB
B
XXXXXXXXXXXXXXXXXXXXXXXXXXXXXXXXXXXXXXXXXXXXXXXXXXXXXXXXXXXXXXXXXXXXXXXXXXXXXXXXXXXXXXXXXXXXXXXXXXXXXXXXXXXXXXXXXXXXXXXXXXXXXXXXXXXXXXXXXXXXXX
XXXXXXXXX
XXXXXXXXXXXXXXXXXXXXXXXXXXXXXXXXXX
XXXXXXX
XXX
X
X
X
X
X
X
X
X
X
X
XXXXXXXXXX
X
XXXXXX
XX
XXX
X
XXXXXXXXX
XX
XXX
XXXXX
XXX
X
XXXXXXXXXXXXXXXXXXXXXXXXXXXXXXXXXXXXXXXXXXXXXXXXXX
XXXXXXXXXXXXXXX
X
XXX
XX
XX
X
XXXX
X
X
X
X
X
XXX
XX
X
X
X
X
XXXXXXXXXXXXX
XXXXXXXXXX
XXXXXXXXXXXXXXXXXXXXXXXXXXXXXXXXXXXX
XXXXXXXXXX
X
XXXXXXXXXXXXXXXXXXXXXXXXXXXXXXXXXXXXXXXXXXXXXXXXXXXXXXXXXX
XXXXXXXXX
X
XXXXXXXXXX
XX
XXXXXXXXXXXXXXXXXXXXXXXXXX
XXXXXXXXXXXXXXXXXXXXXXXXXXXXXXX
X
XXXXXXXXXX
XXXXXXXXXXXXXXXXXXXXXXXXXXXXXXXX
XXX
X
XXXXXXX
X
XXX
XXXXXXXXXXXXX
X
XXXXXX
XXXXXXXXXXXX
XXXXX
XX
X
XXX
XX
XX
XX
X
XX
XXX
XX
XXXXXXXXXX
XXX
XXX
XX
X
XX
X
XX
X
XXX
X
X
X
X
XXX
X
X
X
XXX
X
X
XX
XXXXX
XX
X
X
XXXXXXXXXXXX
XX
XX
X
XXXXX
X
X
X
XX
X
X
X
XXX
XXXXXX
XX
X
XXXXXX
X
XXXX
XXXXXXXXXX
XX
XXXX
X
X
XX
X
XXXXX
XX
X
X
X
XXX
XXXXX
XXXXX
X
X
XX
X
XXX
X
X
X
X
XXX
XXXXXX
XX
X
XXXX
XXX
X
XXX
X
XXX
XX
X
X
X
X
X
X
X
X
X
X
XX
XXX
X
X
X
XX
X
X
X
XXXXX
XX
X
X
X
X
X
XXXX
XX
XX
XXXX
XXXXX
X
X
XXX
X
X
X
XX
XX
X
XX
X
X
XX
X
XX
XX
XX
X
XX
XXX
X
X
X
X
XXXXX
XXXXX
X
XX
X
X
X
X
X
X
X
X
X
X
X
X
X
XX
XXX
X
XXX
XXXX
XXXXXXX
XXXXXXXX
X
X
XX
XXX
X
X
X
X
X
X
XX
X
XXX
X
X
X
XX
X
XX
X
X
XX
XX
XXXX
X
X
X
XX
XXXXXX
X
XX
X
X
X
X
XX
XXX
X
X
X
X
X
X
XX
XX
X
XX
X
X
X
XX
X
XX
XX
XXX
X
X
XX
XXXXXXXXXXX
XXXXXXXXXXX
X
XX
X
X
XX
X
XX
XXXXX
X
XXXX
XXX
X
XXXX
X
XX
X
X
X
X
X
X
X
XXXXX
X
XXXX
X
X
X
XX
X
X
X
X
XX
XX
X
X
XX
X
X
X
X
X
XXX
X
X
X
X
XXX
X
XX
XXX
X
X
X
XXX
X
X
X
XX
XXX
X
XX
X
X
X
X
X
XXX
X
X
X
XX
XXXX
X
XX
X
XX
XXXXX
X
XXX
X
XXXX
XXX
XXXX
X
X
X
XX
XX
XX
XXXXX
X
X
XX
XX
X
X
XXX
XXXXX
X
XXXX
X
X
X
X
XXXXXXXXX
X
XX
XXXXX
X
X
X
XXX
X
XXX
X
X
XX
X
X
XX
X
X
X
XX
XXX
X
XXX
XXXX
XXX
X
XX
X
X
XX
XXXX
X
XX
X
X
X
X
XX
X
X
X
X
X
X
X
X
X
X
X
X
X
X
X
X
X
X
X
XXX
X
XX
XX
X
X
XX
X
XX
X
X
X
XX
XXX
XX
X
XXX
X
X
XX
X
XX
X
X
X
X
X
X
X
XXX
X
X
X
X
X
X
XX
X
X
X
X
X
X
X
X
X
X
XX
XX
X
X
X
XX
X
XX
X
X
XXX
X
X
X
X
X
X
X
X
X
X
X
X
XX
XXXX
X
XX
XXX
X
X
XX
XXXX
X
XXX
XX
X
X
X
X
X
XX
X
XX
X
XX
X
X
XXXX
X
X
XX
X
XX
X
X
X
X
XX
X
XXXXX
X
X
X
X
XX
XXXX
X
X
X
XX
X
X
X
X
X
X
XX
X
XX
XX
XXXXX
X
X
X
XXX
X
X
XXX
X
XX
XX
X
XXXX
X
X
XXXX
X
XXXXX
X
X
X
XXXXXXX
X
X
X
XX
XXX
X
XX
XXXXX
XXX
X
XX
X
X
X
X
X
X
XX
X
X
X
X
XX
XXX
X
XXXXXX
X
X
X
XXXXXX
X
X
XXXXXX
X
X
X
XX
X
X
X
XXXX
X
X
X
X
X
XX
X
X
X
XX
XXXX
X
XX
XX
XXXX
X
XXX
XXXXXX
X
X
X
X
XX
XXXXX
X
XXXX
X
X
X
X
XX
XXXXX
XX
X
X
X
XXX
XXX
X
XX
X
XX
X
XXXX
X
X
X
X
X
X
X
X
XXX
X
XX
X
X
X
X
XXX
X
X
X
XX
XXX
XXXXXX
X
XXXX
XXXX
X
X
X
X
XXXXXXXXX
XX
XXX
X
X
X
X
XXX
X
XXXX
XXXX
X
X
X
X
XX
XX
XX
X
X
X
X
X
XXXXX
X
XX
XX
X
X
X
X
X
X
X
X
XX
X
XXX
X
XX
XX
X
X
XX
X
X
XX
XX
X
X
X
X
X
X
X
X
X
X
XXX
XX
X
X
X
XX
X
XX
X
X
X
X
X
X
X
X
X
X
X
X
XX
X
XXXX
X
X
X
XX
XX
X
X
XX
X
XX
X
X
X
XXX
X
XX
X
X
X
X
X
X
XXX
X
XX
X
XX
X
X
XX
X
XXXXX
X
X
X
X
XX
X
X
X
X
X
X
X
X
XX
XX
X
XX
XXX
X
XXX
XX
XX
X
X
X
XX
X
XXX
X
XX
XX
X
XX
XXX
X
X
XX
X
X
X
X
X
X
X
XXXXX
X
X
XX
XXXX
X
X
X
X
X
X
XX
XXXXX
XX
XX
XX
XXX
X
X
X
X
X
X
XXXXX
X
XX
X
X
XX
X
X
X
XXXXX
XXXX
X
XX
X
XXXXX
X
X
XX
X
XXXXXX
XX
XX
X
X
X
X
XXXX
X
X
XX
XX
X
XX
X
X
XX
X
XX
X
XXX
XXXX
X
XX
XXXX
XX
XXXXX
XXXX
X
XX
X
X
X
X
XXX
X
X
XXXXXXXXXX
X
X
X
X
X
X
XX
XX
X
XXXX
XXXX
X
X
X
XX
XX
XX
XXXXXX
XX
X
XX
XXXXX
X
X
X
X
XX
X
XX
X
X
X
XXXXX
X
XXXX
X
XXX
X
XXX
X
XX
XX
XX
XXXX
X
X
X
XXXX
X
X
X
X
X
XXXX
X
X
X
XXX
X
XXX
X
XXX
XXXXXX
X
X
XX
X
XX
XXX
X
XXX
X
X
XX
X
X
X
XXXXX
X
X
XXXX
XX
X
X
XXXX
X
XXXXXX
XXX
X
X
X
X
X
XXX
X
X
XX
X
X
X
X
XXXXX
X
X
X
X
X
XXX
X
XX
X
XX
X
X
XXX
X
X
X
X
X
X
XXXX
X
XXX
XXXXX
XX
X
X
X
XXXX
XXXX
XXXX
X
X
X
XXXXXXXX
XX
X
XXXXX
XX
XXX
X
X
XXX
X
X
X
X
X
XXXXX
X
X
X
X
X
XXX
X
X
X
X
XX
X
X
XXX
XXX
X
XXX
X
XX
XX
XX
X
X
XX
XXXX
XXX
XX
XXX
X
X
XXX
X
XXX
X
X
X
X
XXXX
XX
X
X
XXXXX
XX
XX
XXXXXXXXX
XX
XX
X
XX
X
X
X
X
XXXXX
X
X
X
XXX
X
XXX
XX
X
XXXXX
XXX
X
X
X
X
XXXX
X
X
X
X
XXXX
X
X
X
XX
XXXXX
X
XXX
XX
X
XXX
XX
X
XXX
X
X
X
XX
XX
XX
X
XX
X
X
XX
XXX
XX
XXXX
X
X
X
X
X
X
X
X
X
X
X
XXX
X
XX
X
XX
X
X
X
X
XX
X
X
X
X
X
X
XXXXXX
X
XX
X
X
X
X
X
XXX
X
X
XX
X
X
XX
X
XX
X
XX
X
X
XXXX
X
X
X
X
X
X
XXX
X
X
X
X
XX
X
X
XX
X
XX
XX
XXXXXXXXXXX
X
X
X
X
X
X
X
XXX
X
X
XX
XX
XXXXX
X
X
XXX
XX
X
X
X
XX
X
XX
X
X
X
X
XX
X
X
XXX
X
X
X
X
XXX
X
XX
X
XXXX
X
XX
X
X
X
X
X
X
X
X
X
XX
X
X
X
XX
X
X
XX
XXXXX
XX
XXX
X
X
X
X
X
X
X
X
X
X
X
X
XX
X
XXXXXXXXXXX
X
XXX
X
X
X
X
XX
X
XX
XX
XX
X
XX
X
XXX
XXX
X
XXXXXX
X
X
XXX
X
X
X
XX
X
X
X
XXXX
X
X
X
XX
X
XXX
X
XXXXX
XXX
X
1
F
B ANL-46
3 ANL-50
J ITE-55
F ORL-61
B LAS-62
X RPI-68
1 HAR-71
F CAD-82
Figure 4.3. Main discrepancies in the capture cross-section for 233U between ENDF/B-VI.8 and JENDL-3.3.
The main fertile isotope of the thorium cycle is 232Th, which has an extensive experimentaldatabase of cross-sections. However, the evaluated data shows major discrepancies betweenlibraries and between these and the experimental data, far from the accuracy for 238U, theequivalent fertile isotope in the uranium-plutonium cycle. The capture process in 232Th

Chapter 4 Nuclear Data
69
directly dictates the breeding of 233U fuel, thus having a direct impact on power densities, keff
and fuel burn-up.
Moreover, the cross-section resonances need to be well known to predict the Dopplerreactivity effect. Figure 4.4 shows that the low energy resonance region presents a capturecross-section value over 10% larger for ENDF/B-VI.8. For the higher energy resonances, bothlibraries seem slightly shifted in energy, although JENDL-3.3 presents a larger number ofresonances. Another interesting discrepancy is the fact that the resonance region ends at 3.5keV in JENDL-3.3 but goes up to 4 keV for ENDF/B-VI.8.
There is scarce experimental data for (n, 2n) on 232Th, which after the b- decay of 231Th, leadsto the production of 231Pa, one of the major contributors to the long-lived radiotoxicity of thespent fuel in the thorium cycle, as explained in Chapter 6. Therefore, new precisemeasurements related to this threshold reaction (starting from ~50 keV) needs to beperformed.
1x10⁻³
1x10⁻²
1x10⁻¹
1x100
1x101
1x10²
1x10³
1x10⁴
1x10⁻³
1x10⁻²
1x10⁻¹
1x100
1x101
1x10²
1x10³
1x10⁴
1x100 1x101 1x10² 1x10³
Th-2
32 c
aptu
re c
ross
-sec
tion
(b)
Relative difference (%
)
Neutron energy (eV)
ENDF/B-VI
JENDL
Relat. diff.
Figure 4.4. Main discrepancies in the capture cross-section for 232Th between ENDF/B-VI.8 and JENDL-3.3.
Present in both fuel cycles, 234U gains importance in the thorium cycle because it is generatedby capture in 233U, as well as by capture in 233Pa and the b--decay of 234Pa. Its abundance andbehaviour are similar to 240Pu in the uranium-plutonium cycle. An interesting feature of thediscrepancies between ENDF/B-VI.8 and JENDL-3.3 for fission is the two orders ofmagnitude lower thermal cross-section in the latter, as shown by Figure 4.5. The EXFOR datashows a lack of measurements for low-energies and sizable discrepancies between evaluated

Chapter 4 Nuclear Data
70
and experimental data in the region 7-20 eV and for the resonance and the unresolvedresonance regions, which seem to show a constant 30% discrepancy. For the capture cross-section, both libraries seem to agree better, except for some small discrepancies in theresonance and high-energy regions.
1x10⁻⁶
1x10⁻⁵
1x10⁻⁴
1x10⁻³
1x10⁻²
1x10⁻¹
1x100
1x101
1x10²
1x10³
1x10⁴
1x10⁻⁵
1x10⁻⁴
1x10⁻³
1x10⁻²
1x10⁻¹
1x100
1x101
1x10²
1x10³
1x10⁴
1x10⁻³ 1x10⁻² 1x10⁻¹ 1x100 1x101 1x10² 1x10³ 1x10⁴ 1x10⁵ 1x10⁶ 1x10⁷
U-2
34 fi
ssio
n cr
oss-
sect
ion
(b)
Relative difference (%
)
Neutron energy (eV)
ENDF/B-VI
JENDL
Relat. diff.
JJ
J
J
JJJ
JJJJJJ
JJ
J
J
JJ
JJ
J
J
J
J
J
J
J
J
J
JJJ
JJ
J
JJ
J
J
JJJ
J
J
J
J
JJ
JJ
J
J
J
J
JJ
J
JJ
J
J
J
JJ
J
J
J
J
J
J
JJ
J
J
J
J
J
J
JJ
J
J
J
J
J
J
J
J
J
J
J
J
J
J
J
J
J
J
J
J
J
J
JJ
J
J
J
JJJ
J
J
JJ
JJ
J
JJJJJ
JJJ
JJJ
J
JJJJJJJJJJJJJ
JJJJJJJJJJ
JJJJ
JJJ
JJ
JJJJJJJJJJJJJ
J
JJ
JJJ
JJJJJJJJ
JJJ
JJJJJJ
J
J
JJ
J
J
J
JJ
J
JJ
J
J
JJ
JJJ
J
JJ
J
J
JJJ
JJJ
J
JJJJ
J
J
J
J
J
J
J
J
J
J
JJ
J
JJ
J
J
J
J
J
JJ
J
J
JJ
J
JJ
JJJ
J
JJ
J
JJ
J
JJ
JJ
J
J
JJ
JJJJ
J
J
JJ
J
J
J
J
J
J
J
J
J
J
JJ
J
J
J
JJJ
J
J
J
J
J
J
J
J
J
J
J
JJ
J
J
JJ
J
J
JJ
JJJ
J
JJ
J
J
J
J
J
J
JJ
JJJJ
JJ
J
J
J
J
J
J
J
J
J
J
J
J
J
J
J
J
J
J
J
JJ
JJ
J
J
J
J
J
J
JJ
J
J
J
J
J
J
J
J
J
J
JJ
JJ
JJ
J
J
J
J
J
JJ
J
J
J
J
J
J
J
J
J
J
JJ
J
J
J
J
J
J
J
J
J
J
J
JJ
J
JJJ
J
J
J
J
J
J
J
JJJJ
J
J
J
JJ
J
JJ
J
J
J
J
JJJJJ
J
J
J
J
J
JJ
J
J
J
J
J
JJ
J
J
J
J
J
J
J
J
J
J
J
J
J
JJ
J
JJ
J
J
J
J
J
J
J
J
J
JJ
J
J
J
J
J
J
J
J
J
J
JJ
JJ
J
J
J
J
J
J
J
J
JJ
J
J
JJ
JJ
JJJJ
J
J
J
J
JJ
JJ
J
J
J
J
J
J
J
J
J
J
J
J
J
J
J
JJJ
JJ
J
J
J
J
J
J
J
J
JJ
JJ
J
J
J
J
J
J
J
J
JJJ
J
J
J
J
J
JJ
J
JJ
J
J
J
J
J
J
JJ
J
J
J
J
J
JJJ
J
J
J
J
J
J
J
J
J
J
JJ
J
J
J
J
JJ
J
J
J
JJ
J
J
J
J
J
J
JJ
JJ
JJ
J
J
J
J
J
J
JJ
J
J
J
J
J
JJ
J
J
J
J
J
J
J
J
JJ
J
J
J
J
J
J
J
J
JJ
J
J
JJ
J
J
J
J
JJ
J
J
JJ
JJ
J
JJ
JJ
JJJJ
J
JJJJ
J
J
J
J
J
J
JJ
J
J
JJ
J
JJ
JJ
J
JJ
J
J
J
J
J
J
J
JJJ
J
J
J
JJ
J
J
J
J
J
J
J
J
J
J
JJ
J
J
J
J
J
J
J
JJ
JJ
JJ
JJ
JJ
JJ
J
J
J
J
J
JJ
J
J
J
J
J
JJJJ
J
J
J
JJ
JJ
J
J
J
JJ
JJ
J
J
J
J
J
J
J
JJ
J
J
JJJ
J
JJ
J
JJ
J
J
J
J
J
J
J
JJ
J
J
J
J
J
J
J
JJ
J
J
J
J
J
J
J
JJJ
J
J
J
J
J
JJ
J
J
J
JJ
J
J
J
J
J
J
JJ
J
J
J
J
J
J
J
J
J
J
J
J
J
JJ
J
J
J
J
J
J
JJJJ
JJ
J
J
J
J
JJJ
J
J
J
JJJJJ
JJ
J
J
JJJ
J
J
J
J
J
JJ
J
J
J
JJJ
J
JJJ
J
JJ
J
J
J
J
J
J
JJ
J
J
J
J
J
J
J
J
J
JJ
J
J
J
JJ
J
J
J
J
J
JJ
J
J
J
JJ
J
J
J
J
JJ
J
J
J
J
J
J
J
J
J
J
J
J
J
J
J
J
JJ
J
JJ
J
J
JJ
JJJ
J
J
JJ
JJ
JJ
J
J
J
JJ
J
J
J
JJ
J
JJ
J
J
J
J
JJ
J
J
J
J
J
J
JJ
J
J
JJ
J
J
J
JJ
J
JJ
J
J
J
J
J
J
J
JJ
J
J
J
J
J
J
J
J
J
J
JJ
J
J
J
J
J
J
J
J
J
J
J
J
JJ
JJ
J
JJJ
JJ
J
J
JJ
J
J
J
J
J
J
J
J
J
J
J
JJJJJ
J
J
JJ
J
J
J
J
J
J
J
J
J
JJJ
J
J
J
J
JJ
JJ
J
JJJJJJ
J
J
JJ
J
J
JJ
J
J
JJ
J
JJ
J
J
J
JJ
J
J
J
J
J
J
J
J
J
J
JJ
J
J
J
J
J
JJ
J
J
J
JJJ
JJ
J
J
JJJ
J
J
J
J
JJ
JJ
J
J
J
JJJJ
J
JJJ
J
J
J
J
JJ
J
JJ
J
JJJ
J
J
J
J
J
J
J
J
J
JJ
JJ
J
J
J
J
J
J
JJJ
J
J
J
JJ
J
J
J
J
JJ
J
JJ
J
J
J
J
J
J
JJJ
J
J
J
J
JJ
JJ
J
J
J
JJJ
J
J
J
J
J
JJJ
JJ
JJJJ
J
J
JJJ
J
J
JJJ
J
J
J
JJ
J
J
J
J
JJ
J
J
J
JJ
JJ
J
JJ
J
JJ
JJJ
J
J
JJJ
J
J
J
J
J
J
J
JJJJ
J
J
JJJ
J
JJJ
J
J
JJ
J
J
JJJ
J
J
JJJJJ
J
JJJJJ
JJ
JJJJ
J
J
J
J
JJJ
JJJ
J
J
J
J
JJJ
J
J
J
JJ
J
J
J
JJJJJJ
J
J
J
J
JJJ
J
J
J
J
J
J
JJ
J
JJJ
J
J
JJJ
J
JJ
J
J
JJJJJ
JJJJJJJJ
JJ
J
J
JJJ
J
J
JJJ
J
J
J
JJJ
J
J
J
JJ
J
J
J
JJ
JJ
J
J
JJJ
J
J
J
J
J
JJ
JJ
JJJJ
J
JJJ
J
J
J
J
J
JJ
J
J
J
JJ
J
JJJJ
J
J
J
J
JJ
J
J
J
J
JJ
J
J
JJ
J
J
J
JJJ
J
J
J
J
J
JJJ
J
J
J
JJ
J
J
J
J
JJJJ
JJJJJ
JJ
J
J
JJJ
J
J
JJ
JJ
J
JJJ
J
JJ
J
JJ
J
J
JJ
J
J
J
J
J
J
J
J
J
J
J
JJ
J
J
JJ
J
J
J
J
JJ
J
J
J
JJ
J
J
JJ
J
JJ
JJ
JJ
JJ
JJ
JJ
J
J
J
JJ
J
J
J
JJ
J
JJ
JJJ
J
J
JJ
JJ
JJJ
J
JJ
J
J
JJ
J
J
JJ
JJJ
J
J
JJ
J
J
JJ
JJ
JJJ
J
JJ
JJ
J
J
JJ
J
J
J
JJ
J
J
JJ
J
J
JJ
J
J
J
J
JJ
J
J
JJJJJ
J
JJ
J
J
J
J
J
JJ
JJJ
J
JJ
J
J
J
JJJJ
J
JJ
J
J
JJ
J
J
J
J
J
J
J
JJJJJ
J
JJ
JJJ
JJJ
J
JJ
J
J
J
J
J
J
J
J
J
JJJ
J
J
J
JJ
J
J
JJJ
J
J
J
J
JJ
J
J
J
J
J
JJJ
JJ
J
JJ
J
J
J
J
J
J
J
J
J
J
J
JJ
J
J
J
J
J
J
J
J
J
J
JJJ
J
J
J
J
JJ
J
J
J
J
JJ
J
J
JJJ
J
JJ
J
J
JJ
JJJJ
J
J
J
J
J
JJ
J
J
J
J
J
J
J
J
J
J
J
J
JJ
J
J
JJ
JJJ
J
J
J
J
J
J
J
J
J
JJ
J
J
JJ
JJ
J
JJJ
J
JJ
JJ
J
J
J
JJ
J
J
J
J
J
JJ
J
JJJJJ
J
JJ
J
J
J
J
J
J
JJ
J
JJ
J
J
J
J
JJ
J
J
J
J
JJJJ
J
J
J
J
J
J
JJJ
J
J
J
J
J
J
J
J
J
JJJ
J
J
JJ
J
J
J
J
J
J
J
J
J
J
J
JJ
J
JJJ
J
JJJJ
J
J
J
J
J
J
J
J
J
JJ
JJJ
J
JJJ
J
J
JJ
J
JJ
J
J
J
JJ
J
J
JJ
J
JJ
J
J
J
JJ
J
JJJ
JJ
JJ
JJ
JJJJ
J
J
J
J
JJJJ
J
JJJ
JJ
JJ
J
J
J
J
JJJJJ
JJ
J
JJ
JJ
J
J
J
JJ
JJ
J
JJ
J
J
J
J
J
JJ
JJ
J
J
J
J
J
JJ
JJJ
JJJJ
J
J
J
J
J
J
J
J
JJJ
J
J
JJ
J
J
J
J
JJ
J
J
J
JJ
J
J
J
J
J
J
J
J
JJ
J
J
J
J
J
J
JJ
JJJJJ
J
J
J
J
J
J
J
J
J
J
J
JJ
JJ
J
JJ
J
J
J
J
JJ
J
J
J
J
J
J
J
JJ
J
J
JJJ
J
J
J
JJJJ
JJ
J
JJJ
JJJ
J
JJ
JJJ
JJJ
J
J
J
JJJ
J
JJ
J
J
JJ
JJ
J
JJ
J
JJ
J
J
JJ
J
JJJJJJ
J
J
JJJJ
JJJ
JJ
J
J
J
JJ
J
J
J
JJ
JJ
JJJ
J
J
JJ
J
J
J
JJJ
J
JJ
JJJJJJ
J
J
JJJJJJ
J
J
J
JJJ
JJ
JJ
J
JJ
JJ
J
JJJJJJ
J
JJ
J
J
J
J
J
J
J
J
J
JJ
JJ
JJ
J
J
J
JJ
J
J
J
J
J
J
JJ
J
J
J
JJJ
JJJ
JJ
JJJJJ
J
JJ
JJ
J
J
J
J
J
J
JJ
J
J
J
J
J
J
JJJ
J
JJJJ
J
JJ
JJJJJ
JJ
J
J
J
J
J
J
JJJ
JJ
JJ
J
J
J
J
J
J
J
J
J
J
J
J
J
JJ
J
J
JJJ
J
JJ
JJJJJJJ
J
J
JJ
JJ
J
JJJ
JJJ
J
J
J
J
J
JJ
J
J
JJJJ
J
JJJ
JJ
J
JJ
JJJ
JJJ
JJ
JJJ
J
J
JJJ
JJJ
JJJJ
J
J
JJ
JJJJJ
JJ
JJ
JJ
JJ
JJJJ
JJJ
JJJJJ
J
J
J
J
J
JJJJ
JJ
JJJJJ
JJ
JJ
J
J
JJJ
JJJJ
JJJJ
JJJJ
JJ
JJ
J
J
J
J
JJJJJJ
JJ
JJJJ
J
JJJ
J
J
JJ
J
JJJ
JJJJ
J
J
JJJJJ
JJJ
J
JJJ
JJJJ
JJJJJ
JJ
J
J
J
J
JJ
J
JJ
JJ
J
J
J
J
JJ
JJJJ
J
J
J
JJJ
J
J
J
J
J
JJ
JJJ
JJ
J
JJ
J
J
JJJ
J
J
J
J
JJ
JJJ
J
J
JJ
J
J
JJJ
JJ
J
J
JJ
J
J
J
J
JJJ
J
J
J
J
J
J
J
JJ
J
J
J
J
JJ
J
J
JJ
J
J
J
J
JJJJJ
J
J
JJ
J
JJ
J
J
J
J
JJ
J
JJ
JJJ
J
J
J
J
J
J
J
J
J
JJJJJ
J
J
J
JJ
J
J
JJ
JJ
J
JJ
J
J
JJJJJ
J
J
JJ
J
J
J
JJJJ
J
J
J
J
JJJ
J
JJJ
JJJJ
JJ
J
J
J
JJ
J
J
JJ
J
J
J
J
J
JJJ
J
JJJJJJJJJJJJJJJJ
JJ
J
JJ
JJ
JJ
J
JJ
J
J
JJJJJ
JJJJJJJJJJ
JJJJJJJJJJJ
JJ
J
J
JJJJJJJJ
JJJJ
JJJJ
JJJ
JJJ
JJ
JJJJ
JJ
JJJJJJJJ
JJJ
J
JJJ
JJ
J
JJJJJ
J
J
JJJJJ
J
J
JJ
JJJ
JJJJ
JJ
JJJJ
J
J
JJJJJJJJJ
JJJJJ
JJ
JJJ
J
J
JJJ
JJ
J
J
J
J
J
J
J
JJJ
J
JJ
JJ
J
JJJ
JJ
JJ
J
JJ
JJJ
J
JJ
JJJ
JJJJJJJJJ
JJJ
J
JJ
JJJ
J
JJ
JJJ
J
J
J
JJ
J
J
J
J
J
J
JJ
JJJJJJJ
JJ
JJJJJJJJJJ
JJJJJJ
JJ
J
JJJJJJJJJ
J
JJ
JJ
J
JJJ
J
J
J
J
JJ
J
J
JJJJ
J
J
JJ
JJJJJJJ
JJ
JJJ
J
JJ
JJJJ
JJ
J
JJJ
JJJJ
J
J
JJ
JJJJ
JJJJJ
JJJJJJJJJ
JJJJJJJJJJJJJJJJJJ
JJ
JJJJJJJ
J
J
J
J
J
J
J
J
JJ
J
JJJJJJJJJJ
JJJJJJJ
JJJ
JJJ
JJJJJ
JJJ
J
J
JJ
J
J
JJJ
J
J
JJJJ
J
J
J
J
J
JJJ
J
JJ
J
JJJJ
JJ
J
JJ
JJJJJ
JJJ
JJJJJ
J
JJJ
J
JJJJJJJJ
JJJ
JJJJ
JJ
JJJ
JJJJ
JJJ
JJJJJJJJJJ
JJJJ
J
J
JJJ
J
JJJ
J
J
JJ
JJJJJJJJJJJJJJJJJ
J
J
JJJJJJJJJJJJJJJJJJ
JJJJJJJJ
J
J
JJJJ
J
J
J
JJJ
JJ
JJJJJJ
JJ
JJJJJJJJJJ
JJJJJJJJJJJJJJJJJJJJJJJ
J
JJJJJ
JJJ
JJJJJJJJJJJ
JJJJJ
JJJJJJJJ
JJJJJJJJJJ
JJJJJ
J
J
JJJ
JJ
J
JJ
JJJJJJ
JJJ
JJJJJJJJJJJJJJJJJ
J
JJJ
J
J
JJJJ
J
J
J
J
JJJJJJJ
J
JJJJJJ
JJJJJJJJJJJ
JJJJJJJJJJJJJJJJJJJ
JJ
JJ
JJJ
JJJJJJJJ
J
JJJJJJJJJJJJJJJ
JJ
JJJJJJ
JJJ
JJJ
JJJJ
JJJJJ
J
J
JJJJJJ
JJJJ
JJJJJJJJJJ
JJJ
JJJJJJJJ
JJ
JJJJJJJJ
JJJJJJJ
JJ
J
J
JJJ
J
JJJJJJ
J
J
J
J
J
J
JJJ
J
J
JJ
JJJ
J
JJJJJJJJJJJJ
J
JJJ
JJJJJJJJ
J
JJJ
J
JJJ
JJJJJJJJJJJ
JJJJJJJ
JJJJJJJJJJ
J
J
JJJJJ
JJJJJJJJ
J
J
JJ
JJ
JJJJJJ
JJJJJJJJJJJJJJJJJJJJJJ
JJJ
JJJJ
JJJJJJ
JJJJJJJJ
JJJJ
J
JJ
JJJ
JJJJJJ
J
JJJJJJJ
JJ
JJJJJJ
J
JJJJ
JJJ
J
JJ
JJJJJJ
JJJJJJJJ
JJJJJJJJJJJJJJ
JJJJJJJJJJJJJ
JJ
JJJJ
JJJJ
JJJJJJJJ
JJ
J
JJJJJJJJJJJJJJJJJ
J
J
J
JJJ
J
JJJJ
J
JJJ
JJJ
J
JJJ
J
JJJJ
J
JJJJJJJ
JJJ
JJJ
J
J
J
J
J
JJJJJJ
J
JJJJJ
JJJJ
JJ
JJ
JJ
J
J
J
J
J
J
JJ
J
J
J
JJ
JJ
JJJJ
JJJ
J
J
JJJJJJ
JJ
JJJ
J
JJ
J
J
JJJJJ
JJJJJ
JJJJ
JJJJJJJJJJ
JJJJJ
JJJJJJ
JJ
JJJJJJ
J
JJ
JJJJ
JJJ
J
JJJJ
JJJJJ
JJ
JJ
JJ
JJ
JJJJJJJ
J
JJJJJJJJJJJJ
JJJJ
JJ
JJJJ
JJJJJJJJJJJJJ
JJJJJJJJJJJJJJJ
JJJ
JJ
JJJJJJJJJJJJJJJJJJJ
JJJJJJ
JJJ
J
JJ
JJJJJJJ
JJJJJJJJJ
JJ
JJJJJJ
J
J
JJJJJJJJJJJJJJJJJJJJJJJJJJJJJJJJJJJJJJJJJJJJJJ
JJJJJJJJJJJJJJJJJJJJJJJJJJJJJJJJJJJJJJJJJJJJJJJJJJJJJJJJJJJJJJJJJJJJJJJJJJJJJJJJJJJJJJJJJJJJJJJJJJJJJJJJJJJJJJJJJJJJJJJJJJJJJJJJJJJJJJJJJJJJJJJJJJJJJJJJJJJJJJJJJJJJJJJJJJJJJJJJJJJJJJJJJJJJJJJJJJJJJJJJJJJJJJJJJJJJJJJJJJJJJJJJJJJJJJJJJJJJJJJJJJJJJJJJJJJJJJJJJJJJJJJJJJJJJJJJJJJJJJJJJJJJJJJJJJJJJJJJJJJJJJJJJJJJJJJJJJJJJJJJJJJJJJ
JJJJJJJJJJJJJ
J JAM-77
Figure 4.5. Discrepancies in the fission cross-section for 234U between libraries and experimental data.
The discrepancies in the ND for 236U and 232U, in particular for the resonance and high-energyregions, are rather relevant. The first takes part in both the uranium and the thorium cycles,contributing to the radiotoxicity of the waste (t1/2 ~2.34¥107 yr), as well as being theprecursor of the production of 237Np. The second, generated through (n, 2n) reactions in 233U,is a relevant isotope in thorium-based fast systems due to the importance of (n, xn) reactionsat high-energies. Its half-life (t1/2 ~90 yr) and strong a-decay (~5.3 MeV) are partiallyresponsible of the medium term (below 100 yr) radiotoxicity of the thorium-based spent. Infact, this role of this isotope in the thorium cycle is similar to the role of 238Pu in the uraniumcycle.
Finally, in the case of protactinium, and in particular to 231Pa and 233Pa, the evaluated dataalso shows important differences. For 231Pa, as previously mentioned, major contributor to thelong-term radiotoxicity in the thorium cycle spent fuel, presents important differences for thecapture cross-section in the unresolved resonance region (starting at ~20 eV for JENDL-3.0and at ~100 eV for ENDF/B-VI.8 and JEFF-3.0) and higher energies. The fission cross-sections are poorly known, showing significant discrepancies among the ND libraries for all

Chapter 4 Nuclear Data
71
the energy range, from thermal to high-energy energies. The case of 233Pa is quite similar,showing differences in the range of the capture resonances and in the value of the capturecross-section above 10 keV. Concerning the 233Pa threshold fission, the EXFOR files showonly two experimental data sets, the first measurement performed at 1.5 MeV (1966) and thesecond one carried out in Geel (Belgium) in 2002, where 11 points were obtained between 1 -8.5 MeV.
4.2.2 Plutonium IsotopesFor the plutonium fissile isotopes, 239Pu and 241Pu, fission and capture cross-sections arerather well known at thermal energies. Nevertheless, the resonance region and, in particular,the high-energy resonances (1-50 keV) present slight differences in the case of 239Pu.
Arguably, the least known isotopes are 238Pu and 242Pu, which represent a small amount ofconventional spent fuel, but would increase their presence in the case of multiple plutoniumrecycling and in the case of TRUs transmutation ((n, 2n) in 239Pu and capture followed by b--decay in 237Np and 241Am respectively). The fission and, to some extent capture, cross-sectionfor 238Pu presents noticeable discrepancies from 1 eV upwards, as described by Figure 4.6.
1x10⁻³
1x10⁻²
1x10⁻¹
1x100
1x101
1x10²
1x10³
1x10⁴
1x10⁵
1x10⁶
1x10⁻³
1x10⁻²
1x10⁻¹
1x100
1x101
1x10²
1x10³
1x10⁴
1x10⁵
1x10⁶
1x100 1x101 1x10² 1x10³ 1x10⁴
Pu-2
38 fi
ssio
n cr
oss-
sect
ion
(b)
Relative difference (%
)
Neutron energy (eV)
ENDF/B-VI
JEFF
Relat. diff.
Figure 4.6. Main discrepancies in the fission cross-section for 238Pu between ENDF/B-VI.8 and JEFF-3.0.
The high-energy resonances, together with the unresolved resonance region, seem to be acommon point of discrepancy for most of the isotopes studied, and happen to be of extremeimportance in fast systems, since the neutron flux peaks around those energies, and 238Pu (t1/2

Chapter 4 Nuclear Data
72
~90 yr, 5.5 MeV a-decay) contributes significantly to the medium-term radiotoxicity of theMOX spent fuel.
For 242Pu, the fission cross-section differs one order of magnitude even for thermal energiesbetween JEFF-3.0 and ENDF/B-VI.8, this last library lacking a major resonance at ~2 eV. Infact, the libraries only seem to agree for high-energy fission. Data for fission and capture for240Pu seem to agree with the exception of the high-energy resonance and unresolvedresonance regions, where different evaluations assign different amplitudes to these resonancesfor all three libraries.
4.2.3 Minor ActinidesThe experimental cross-section data for MA’s are quite limited, especially for sometransmutation schemes which foresee high concentrations of these elements in the fuel fordedicated transmutation systems.
1x10⁻⁵
1x10⁻⁴
1x10⁻³
1x10⁻²
1x10⁻¹
1x100
1x101
1x10²
1x10³
1x10⁴
1x10⁻⁵
1x10⁻⁴
1x10⁻³
1x10⁻²
1x10⁻¹
1x100
1x101
1x10²
1x10³
1x10⁴
1x10⁻³ 1x10⁻² 1x10⁻¹ 1x100 1x101 1x10² 1x10³ 1x10⁴ 1x10⁵ 1x10⁶ 1x10⁷
Np-
237
capt
ure
cros
s-se
ctio
n (b
)
Relative difference (%
)
Neutron energy (eV)
ENDF/B-VI
JENDL
Relat. diff.
JJJJJJ
JJJJJJJJJJJJJJJJJJJJJJJJJJJJJJJJJJJJJJJJJJJJJ
JJJJJJJJJJJJJJJJJJJJJJJJJJJJJJJJJJJJJJJJJJJJJJJJJJJJJJJJJJJJJJJJJJJJJJJJJJJJJJJJJJJJJJ
JJJJJJJJJJJJJJJJJJJJJJJJJJJJJJJJJJJJJJJJJJJJJJJJJJJJJJJJJJJJJJJJJJJJJJJJJJJJJJJ
J
JJ
JJJJJJJJJJJJJJJ
JJJJJJJ
JJJJJJJJJJJJJ
J
JJ
J
J
J
JJJJ
J
JJJJJJJJJJ
J
JJJJJJJJJJJJJJJJJJJJJJJJJJJJJJJJJJJJJJJJJ
J
J
JJJJJJJ
J
J
J
JJJJJJJJJJJJJJ
JJJJJJJ
J
JJJ
JJJJJ
JJ
J
J
JJ
J
JJJJJJJJ
JJJJJJ
JJJJJJJJJJJJ
JJJJ
JJJ
JJJ
J
J
J
J
JJ
JJJ
J
J
JJJ
J
JJJJJJ
J
J
J
J
JJ
J
J
J
J
J
J
J
J
J
J
JJ
J
J
J
JJ
J
J
J
J
J
J
J
JJ
J
J
J
J
J
J
J
J
JJ
J
J
J
J
J
J
J
J
J
J
J
J
J
J
J
J
J
J
J
J
JJ
J
J
JJJ
J
J
J
J
J
JJJ
J
J
J
JJ
J
J
J
J
J
J
JJ
J
J
JJ
JJ
J
J
J
J
J
J
J
J
JJ
J
JJ
J
J
J
J
J
J
J
J
J
J
J
JJJJ
J
J
J
J
J
J
J
JJJJ
J
J
J
J
J
J
J
J
J
J
J
JJJJ
JJ
JJJ
JJJJJJJJJJJJJ
JJJ
JJ
JJJJJJJJJJJJJJ
JJJJ
JJJJJJJJJJ
JJJJJJJJJJJJJ
JJ
JJJJJJJJJJJ
JJJ
JJ
J
J
JJ
JJJ
J
J
J
J
J
J
J
J
J
J
J
JJ
J
JJ
J
J
J
J
JJJJJ
JJJJJ
J
J
JJJJJJJJJ
J
JJJ
JJ
J
J
JJJ
JJJJ
J
J
J
J
J
J
J
JJJJ
JJJJJ
JJJJ
J
JJJJJ
J
JJ
JJJJJJJJJ
JJ
J
J
J
J
J
JJJJJJJ
J
J
J
J
JJJJJJJJJ
JJJJJJJJJ
JJJ
J
J
J
J
JJJJJJ
J
J
J
J
JJJJJJ
JJJJJJ
J
JJ
J
J
J
JJJ
J
J
J
JJ
J
J
J
J
J
J
J
J
JJJ
J
J
JJJJ
J
JJ
J
J
JJJJJJJJJ
J
JJJJJ
JJJ
JJ
JJJJJJJJJJ
JJJJJJJJJJJ
J
J
J
JJJ
J
J
J
J
JJJ
J
J
J
JJ
J
J
J
J
J
J
J
J
J
J
J
J
J
J
JJ
J
J
J
J
JJ
J
JJ
J
JJ
JJJJJJJJJJJ
JJJ
J
JJJ
J
J
JJ
JJ
J
J
J
JJ
J
J
J
J
J
J
J
JJ
JJJJJ
J
JJ
JJJJJJJJJJJ
JJJJJJJ
JJ
J
J
J
J
JJJJJJJJ
J
J
J
J
JJJJJ
J
J
J
J
J
JJJJJJJJJJ
J
J
J
JJJJJ
J
J
J
JJ
JJ
JJ
J
J
JJJ
J
J
JJJJJ
JJJJ
J
JJ
JJJJJ
JJ
J
J
J
JJJJJJJJJJJJJJJ
J
JJJJJ
JJJJJJ
J
J
J
J
J
JJ
JJJJ
JJJJJJ
J
JJ
JJJ
JJJJJJ
JJ
JJJ
J
JJJ
JJJJJ
J
JJJJJ
JJ
J
J
JJ
JJJ
J
J
J
JJJJJ
J
J
J
J
J
JJJ
JJ
JJJJJ
JJ
J
JJJ
JJ
JJ
J
J
J
J
J
J
J
J
J
J
J
J
J
J
J
JJ
JJ
J
JJ
J
J
J
J
J
J
J
JJ
J
JJ
J
JJ
J
J
J
J
J
J
J
J
J
JJJ
JJJ
JJ
JJ
J
J
J
J
J
J
J
J
J
JJ
JJ
JJJJJ
J
J
JJJJ
J
J
J
J
JJJ
J
J
JJ
J
J
J
J
J
J
JJ
J
J
J
J
J
J
JJ
JJ
J
J
J
J
J
JJJ
J
J
J
J
JJJ
J
JJ
J
J
J
JJ
J
J
JJJ
J
J
JJ
JJJJ
J
JJ
J
J
J
J
J
J
J
JJ
J
J
JJ
JJJ
J
JJ
J
J
J
J
JJ
J
J
J
J
JJ
J
J
J
J
J
JJ
J
J
J
J
J
JJ
JJ
JJ
J
J
J
JJ
J
J
J
J
JJ
J
JJJ
J
J
JJJ
J
J
J
JJ
JJ
J
J
J
JJ
J
J
J
JJ
J
J
J
J
JJJJ
J
J
J
J
J
JJ
J
J
J
J
JJ
JJ
J
J
J
J
J
J
JJJ
J
J
JJ
J
J
J
J
J
J
J
J
JJJ
J
JJJJ
J
JJJ
J
JJ
J
JJJJ
JJJ
J
J
J
J
J
J
J
J
J
J
J
J
J
J
J
J
JJ
J
J
J
J
J
J
JJ
J
J
J
JJ
J
JJ
J
JJ
JJ
JJ
J
J
J
JJ
J
J
J
J
JJJJ
J
JJ
J
JJ
JJ
J
J
JJJJJJ
JJ
J
J
J
J
JJJ
JJJJ
J
J
J
J
JJ
JJJ
J
JJ
J
J
J
JJ
JJ
JJJ
JJ
J
J
J
J
J
JJ
J
J
JJ
J
JJJJJJ
JJ
J
JJJ
J
JJJ
J
JJ
J
J
J
J
J
JJJ
J
J
J
JJJJ
J
JJ
JJ
J
J
J
J
J
JJJJJ
JJ
J
JJJJ
JJJJ
JJJJJJJJ
JJJJJJJJJJJJ
J
JJJJJJJJJJJ
JJJ
JJJJJ
JJJJ
JJ
J
J
JJJ
J
J
JJ
JJJJJJJJJJJJJJJ
JJJJ
J
JJJ
J
J
J
J
J
J
JJJ
JJ
J
J
J
JJJ
J
JJ
J
J
J
J
J
JJ
J
J
JJJJ
J
J
J
J
J
JJJJ
J
JJ
J
JJ
JJ
J
J
J
J
J
J
J
J
JJ
J
J
JJJ
J
J
JJ
J
J
J
JJ
J
J
J
J
JJ
J
J
J
JJ
J
JJJJJJJJJJJJJJJJJJJJJJJ
J
JJJJ
JJJJJJJJJJJ
JJJJ
JJ
JJ
J
J
J
J
J
J
J
JJ
J
JJ
J
JJ
JJ
J
JJ
JJJJJJ
JJ
JJJJJJ
JJJ
J
J
J
JJ
J
J
JJJJJJ
JJJJ
JJJJ
JJJ
J
J
JJ
J
J
JJ
J
J
J
J
J
J
J
J
J
JJ
JJ
J
J
J
J
J
J
JJJ
J
JJ
JJ
J
J
JJJJ
J
JJ
JJJJ
J
J
JJJJJ
J
J
J
J
JJ
JJJJJJJJ
JJJJJJJJJJJJJJJJ
JJJ
JJ
JJ
J
J
JJ
J
J
J
J
J
J
J
J
JJ
JJJJ
JJJJ
JJ
JJJJJJJJJJJJJJ
JJJJ
J
JJ
JJJJ
JJ
JJ
J
JJJ
JJJJJJJJJJJJJJJJJJJJJJJJJJJJ
JJ
JJJJJJ
J
J
JJJ
JJ
JJJJJJJJJJJJJJ
JJ
JJJJJ
J
J
J
J
JJ
J
J
JJJJJ
J
J
J
JJ
J
J
J
JJJJ
JJ
J
JJ
J
JJJ
JJJJJJJJJJ
JJJJ
J
JJ
J
JJ
J
J
J
J
J
J
J
JJ
J
J
J
J
J
J
J
J
J
JJJJ
JJJ
J
J
J
JJJ
JJ
JJJJJ
J
J
J
JJJJ
J
JJJ
J
J
JJ
JJ
JJ
J
JJ
J
J
J
JJJJJJJJJJJJ
JJJ
J
JJ
J
JJ
J
J
J
J
J
JJ
J
J
J
J
J
J
JJ
JJ
J
JJ
JJ
J
J
J
J
J
J
J
J
JJ
J
J
J
J
J
JJ
JJ
JJJJ
JJJJJJJJJJJJJJJJJJJ
JJJJJJJJJJ
JJ
J
JJ
J
JJJ
JJJJJ
J
JJ
JJJ
J
JJJJJJJJJ
JJ
JJ
J
JJ
JJ
J
J
J
JJ
JJ
J
JJ
J
J
J
J
J
J
J
JJ
JJ
J
J
J
JJJJJ
JJJJJJJJJ
J
JJ
JJ
J
JJJ
JJ
JJJJ
J
JJ
JJ
JJ
JJJJJJJJJJ
J
JJJJ
J
JJ
JJJJJJJJJJ
J
J
J
JJ
JJ
J
J
J
J
J
JJJ
JJJ
J
JJJJ
J
JJJ
J
J
J
JJ
JJJJJ
J
JJ
J
J
JJ
JJJJJJJJJJ
JJJJJJJJ
JJ
JJ
J
J
J
JJJ
JJJ
J
J
J
J
JJJ
JJ
JJ
JJJJJJJJJJ
JJJ
JJJ
JJJJ
J
J
J
J
J
J
J
JJJ
JJJJ
JJ
J
JJ
JJ
JJJ
J
J
J
JJ
J
JJ
J
JJJJJJJJ
JJ
J
JJ
JJJ
J
J
J
J
J
J
J
JJ
J
J
J
J
J
J
J
J
J
J
J
J
J
JJ
JJJ
JJ
J
JJJJ
JJJJ
JJJ
JJJJJ
J
JJJJJJ
J
JJ
JJ
JJJJJJJJJJJ
JJJJJJJJJ
J
JJ
J
JJJ
J
J
JJ
JJ
JJJJJJJJ
J
J
JJJ
J
JJJJJJJJ
JJ
J
JJ
J
JJJ
JJ
JJJJJJJJJJJJJJJJJJ
J
JJJ
J
J
J
J
J
J
JJ
JJJJJJJJ
JJ
J
JJJJ
J
J
JJ
JJ
J
JJJJJJJ
JJJJJ
J
J
J
J
JJJJJJ
JJ
J
J
J
J
JJJ
J
J
J
J
J
J
J
J
J
J
JJ
J
J
J
J
J
J
J
JJ
JJJJJJJJJJJJJJ
J
J
J
J
J
JJ
JJJ
J
J
JJJJJ
J
JJ
JJ
J
J
J
JJ
JJ
J
J
J
J
JJ
J
JJJJJ
J
JJ
JJJJJJJ
J
J
JJJ
JJJJJJJ
J
J
JJ
JJ
JJ
J
J
J
J
J
J
J
JJJ
J
J
J
J
J
J
JJJ
J
J
JJJ
JJJ
JJJJJJJJ
JJ
J
JJJJJJ
JJ
JJ
J
JJ
J
JJ
J
J
J
J
J
J
J
JJ
J
J
J
J
JJJJJJJ
JJ
J
J
J
JJJ
J
J
J
JJJJJ
J
JJ
JJJJJ
J
JJJJJJ
J
J
J
J
J
J
J
J
J
J
J
J
JJ
JJ
JJJJJJ
JJJ
J
JJ
J
JJ
JJ
JJJJ
JJ
J
J
JJ
JJ
J
JJJ
JJJ
J
J
J
J
JJJJJJJJ
J
J
J
JJ
J
J
J
J
J
JJ
J
JJ
JJJJ
JJ
J
JJ
J
J
JJ
JJ
JJ
JJJJJ
J
J
J
J
J
J
J
J
J
J
JJJJJJJJJJJ
JJJJ
JJJ
JJJJJ
JJJJJ
J
J
J
JJ
JJ
JJ
J
J
J
J
JJJJ
J
J
J
JJ
J
JJ
JJ
JJ
JJ
J
J
JJJ
J
JJJJ
J
JJ
JJJ
J
J
J
J
J
J
JJJ
JJJ
JJ
J
JJJJJJJ
JJ
J
J
J
J
JJ
JJ
JJJ
JJ
JJ
J
J
J
J
J
J
J
JJJ
J
JJJ
JJJJ
J
JJ
J
J
J
JJJJJJJ
J
JJJJJ
JJJJ
J
JJJ
J
JJJJJJJJJ
J
J
J
J
J
JJJ
JJ
J
JJ
JJJ
J
JJJJJJJ
J
J
JJJJJJJJJJ
J
J
J
J
J
J
JJJ
J
JJJ
J
J
J
JJ
J
JJ
JJ
J
JJ
JJJJ
JJJJJJJJ
JJJJ
JJ
JJ
J
JJJJ
J
J
J
JJ
JJ
JJJJJJJJJJJJJJ
JJ
JJJJJJJJJJJJJJJ
JJJJJJ
JJJJ
J
J
J
J
J
J
J
JJJJ
JJJJJJJJJJJJJJJ
JJJJJJJJ
JJJJ
JJJJ
JJ
J
JJJ
JJJJJJJJJJJJJJJ
J
JJ
JJ
JJJ
J
J
J
J
J
J
J
J
J
J
J
J
JJ
JJJJ
JJJ
JJ
J
JJ
J
JJJJ
J
J
J
JJJ
JJJJJ
JJJJ
JJJ
JJ
JJJ
J
J
J
JJJ
J
JJ
J
J
J
J
J
J
J
J
J
J
J
J
J
J
J
J
J
J
JJJJ
J
J
JJ
J
J
J
J
JJ
J
J
J
J
J
J
J
J
JJ
JJJJ
J
J
J
J
J
JJJJ
J
JJJ
JJJJJJJJJJJJJ
JJJJ
JJJJJJJJJ
J
JJ
JJJJJ
J
J
JJ
J
JJ
J
JJJ
J
J
J
J
J
J
J
J
JJJ
J
J
J
JJJ
J
J
J
J
J
JJJJ
JJJ
JJ
JJ
J
J
JJ
J
J
J
JJ
J
J
J
JJJJJJJJ
JJJJ
JJJJJ
J
JJ
JJ
J
JJJ
JJJJJ
JJJ
JJ
J
JJJ
JJ
J
J
J
J
J
JJJ
J
J
J
J
JJJJ
J
JJ
JJ
J
J
J
JJJ
JJ
J
JJJJ
JJJJJJJJJ
JJJJJJ
J
J
JJJJJJ
JJJJ
JJJ
JJJ
J
JJ
J
J
J
J
JJJJ
JJJ
JJJJJJ
JJ
JJ
JJ
J
J
JJ
J
JJ
J
J
J
J
J
JJ
J
JJ
J
JJ
J
J
JJ
J
JJJJJJ
JJ
JJ
J
JJJ
J
JJ
JJ
J
JJ
J
J
J
JJJJJJJ
JJJJJJJJJJJJ
J
JJJ
JJ
JJJJJ
JJJ
J
J
JJ
J
JJ
JJ
JJJJJJJJ
JJJ
J
JJ
J
JJ
J
J
J
J
J
JJJ
JJJJJJ
JJ
J
JJ
J
JJJ
J
J
J
J
JJ
J
JJ
JJJJJ
JJJ
J
JJ
JJJ
JJJ
J
JJ
J
J
JJJJJJJJJ
J
JJ
J
J
J
J
J
JJJ
JJJ
JJ
JJJJ
J
J
JJ
J
JJ
JJ
J
JJ
J
JJ
J
JJJJJJ
J
JJ
J
JJ
J
JJJJJJJ
J
JJ
J
JJ
JJJJJJ
J
J
J
J
J
J
JJJJJ
JJJ
J
J
J
J
J
J
JJ
J
JJ
J
JJ
JJ
J
JJJJJJ
JJ
J
J
J
JJJ
J
J
J
J
JJ
JJJJJJ
JJ
JJJJJJJJ
J
JJJ
J
JJJ
J
J
J
J
J
J
J
J
JJ
JJJ
J
J
JJJJ
J
JJ
JJ
JJ
JJJ
J
J
J
J
JJ
JJJJ
JJ
JJJJJ
JJJJJJJJJJ
J
J
J
JJJ
J
JJJ
JJJJ
J
J
J
J
J
J
JJ
J
JJJJJJ
JJJJJJJJJ
J
JJJJ
JJJJJJJJJJ
JJ
JJJJJJJJJJ
J
J
JJ
JJ
JJJJJJJJ
J
J
JJJ
JJ
J
JJ
J
J
J
JJJJ
JJJJJJ
JJJJ
J
J
JJ
J
JJ
J
JJJJJJ
JJ
JJJJ
JJJ
J
J
J
JJ
JJJJ
JJJJJ
J
J
JJJJJJ
J
JJJJJJJ
J
JJJJJ
J
J
J
J
JJ
J
J
J
J
JJ
JJ
J
JJ
JJ
JJJJ
J
J
JJ
JJJ
JJ
J
JJ
J
J
J
JJ
JJJJ
J
JJJ
JJJ
JJJJJJ
J
JJ
JJJ
J
JJJ
J
J
JJJJJJ
JJJJ
JJJ
JJJ
J
J
JJ
J
J
JJ
JJ
JJJJJ
J
J
JJ
JJ
J
J
J
JJJ
J
J
J
JJJ
JJJJJJJJJJJJ
J
J
J
J
JJ
J
JJ
JJ
JJJJJ
JJ
J
J
J
JJJJJJJ
JJJJJ
JJJJ
J
J
J
JJ
J
JJJJJJ
J
J
J
J
J
JJ
J
J
JJ
J
JJ
J
JJ
JJ
J
J
JJJJ
J
J
JJ
JJJ
J
J
J
JJ
JJ
JJJJJ
JJ
J
JJ
JJJJJ
J
JJJJ
JJ
JJJ
JJJJJJ
JJJJ
JJ
JJ
JJJJJJ
J
J
J
J
JJ
J
JJJJJJJ
JJJJJJJJJ
J
J
JJJJJ
J
J
JJ
JJ
J
J
JJ
J
J
J
J
J
JJJJJJ
J
J
J
JJJJJJ
J
J
J
JJ
JJ
J
J
JJ
J
JJJJJ
J
J
JJ
JJ
J
JJJJJJJJJJJ
JJ
JJ
JJJJJ
JJ
JJ
J
JJJ
JJJJJJJ
JJJ
J
JJJJ
JJJJ
J
JJJ
J
J
J
J
J
J
J
J
J
J
JJ
JJJ
JJJ
JJ
J
J
J
JJ
J
JJJ
J
JJJJ
J
JJ
J
J
J
J
J
J
J
J
JJJJJ
JJJJJJJJJJJJ
J
JJ
JJJJJJ
J
JJ
J
J
J
J
JJJ
J
J
JJ
JJJJJ
JJ
JJJJ
JJJJJJ
JJJJ
J
JJJ
J
J
J
JJ
JJ
J
J
JJJJJJ
J
J
JJ
J
J
J
J
JJJJJJ
JJJJJJJJ
JJJ
JJJ
J
JJ
J
J
JJ
J
JJJ
JJJJJ
JJ
JJJJJJJJJJ
JJJJJ
J
J
J
J
J
JJJJ
J
J
J
J
J
JJ
JJJ
J
J
J
JJ
JJJ
J
J
JJJ
J
J
JJJJJ
JJ
JJJJJJJJJJJJ
JJJJJJJJJJ
JJJJJJJJJJJJJJJJJJ
JJJJJJJJJJJJJJJJJJJJJJJJJJJJJ J
JJJJJJJJJ
J
J ORL-81
Figure 4.7. Discrepancies in the capture cross-section for 237Np between libraries and experimental data.
Several measurements of the fission cross-section of 237Np have already been made, belowand above fission threshold (Figure 4.7). However, the quality of the data is not alwaysacceptable, in accuracy, as well as in terms of the energy range covered. In particular, in thesub-threshold resonance energy region, 237Np has a small fission cross-section which isimportant for transmutation studies in fast systems, where the epithermal neutron flux is notnegligible in the periphery of the fuel core, and where some proposals to perform

Chapter 4 Nuclear Data
73
heterogeneous transmutation of minor actinides have been made. The capture data, althoughmore complete, also presents important discrepancies in the resonance region, in particularunresolved resonances above 150 eV, and no experimental data beyond 200 keV, as may beobserved in Figure 4.7.
Measurements of the cross-sections of 241Am are difficult to perform because of its highactivity (t1/2 = 433 yr). In addition to this difficulty, the fission cross-section of 241Am is lowerthan 0.5 b over the range 1-300 keV. Several measurements exist in the threshold region, butthe most recent ones differ between each other by more than 14%, below that point. Thecapture cross-section presents deviations of more than 10% in the unresolved resonanceregion. This reaction leads to the production of 242Cm (t1/2 ~163 d, a-decay), which in turngenerates the hazardous 238Pu.
Figure 4.1 shows the evident lack of ND for fission in 243Am across the energy range.Libraries largely differ in the thermal region and the discrepancies rise as far as 700% in theunresolved resonance region. Capture is better known for this isotope, although it presentssome discrepancies in the amplitude of some resonances.
Curium isotopes present large uncertainties in the cross-sections for every reaction across theenergy range, especially 244Cm due to its high a activity, making its measurement extremelyhard to perform. JEFF-3.0 and JENDL-3.3 seem to agree for capture at low energiespresenting a capture cross-section 50% higher than ENDF/B-VI.8, but disagree about itsvalue, again, in the unresolved resonance region. Discrepancies in the fission cross-section forthis isotope follow the same tendency except for larger discrepancies, of around 80%, for lowenergies.
The differences between libraries for fission and capture in 245Cm seem smaller than for244Cm but also appear to be systematic across the energy range. It is worth noticing the largediscrepancies in amplitude for the fission cross-section resonances between all three libraries,in particular for the large resonances at 1 eV, 2 eV and 4 eV. In these cases, the amplitude forJEFF-3.0 is more than one order of magnitude larger than that for ENDF/B-VI.8.
EXFOR data related to (n, xn) reaction is almost inexistent for MAs. Only 237Np presents ameasurement (1997), where 630 energy points between 1- 2.5 MeV were obtained. No (n,xn) public experimental data exists for americium or curium, their cross-sections being basedon theoretical models. As explained later in this chapter, these reactions are particularlyrelevant in fast system given that they gain importance at high neutron energies, contributingto the multiplication of the system and the production of different actinides.

Chapter 4 Nuclear Data
74
4.2.4 Coolants and Structural MaterialsFor structural materials, the capture, (n, xn) and scattering (elastic and inelastic) cross-sections are obviously of great interest due to their effect on the multiplication of the system.Elements such as zirconium or iron are omnipresent in nuclear reactors. In addition, lead andbismuth are the cooling elements in several fast reactor designs, appearing in great quantitiesin these cores, thus having a great impact on the neutronics of the system, as later described in4.3.2.
The nuclear data for the main zirconium isotope, 90Zr (52% natural abundance, compared to11% for 91Zr, 17% for 92Zr, 17% for 94Zr and 3% for 96Zr), agrees rather well for the differentlibraries up to roughly 10 keV, even though there are small discrepancies in the amplitudes ofsome resonances. As for all the isotopes studied, the high-energy resonances and theunresolved resonance region present serious discrepancies that in the case of the integral valueof the capture cross-section in that energy region exceeds 100% between ENDF/B-VI.8 andthe other two libraries.
The nuclear data for lead is, again, well known for low energies with increasing discrepanciesas the resonances increase in energy and major differences for the unresolved region, inparticular, for the capture cross-section in 208Pb (most prominent isotope for lead – 53%natural abundance, 24% for 206Pb, 22% for 207Pb and 1% 204Pb), where the differences reachthree orders of magnitude at 1 MeV. The average value of the discrepancies is more than 30%from 10 keV upwards.
For 209Bi, the only stable isotope of bismuth, the discrepancies in the capture cross-sectionpresented in Figure 4.8 are noticeable at all energies, from 10% at low energies up to sixorders of magnitude for some resonances. This is clearly explained by the lack ofexperimental data, since the points in Figure 4.8 represent the few experiments carried out tomeasure this cross-section.
Concerning the (n, xn) reactions in 209Bi, for which there is a number of experimentalmeasurements (54), the evaluations tend to differ in ~20% for all energies (threshold at ~7.4MeV). The case of the inelastic scattering is similar, with an acceptable set of measurements(87), and ~30% differences above 10 MeV and large uncertainties around the thresholdenergy (~900 keV). The evaluated elastic scattering cross-section also presents somedifferences in the resonance region above 100 keV.
As elaborated in Section 4.3.2, the uncertainties in the capture, (n, ne), (n, ni) and (n, xn)reactions may have important implications for the predictions of the multiplication of a lead-bismuth cooled system.

Chapter 4 Nuclear Data
75
1x10⁻⁶
1x10⁻⁵
1x10⁻⁴
1x10⁻³
1x10⁻²
1x10⁻¹
1x100
1x101
1x10²
1x10³
1x10⁴
1x10⁵
1x10⁶
1x10⁷
1x10⁻⁶
1x10⁻⁵
1x10⁻⁴
1x10⁻³
1x10⁻²
1x10⁻¹
1x100
1x101
1x10²
1x10³
1x10⁴
1x10⁵
1x10⁶
1x10⁷
1x100 1x101 1x10² 1x10³ 1x10⁴ 1x10⁵ 1x10⁶ 1x10⁷
Bi-2
09 c
aptu
re c
ross
-sec
tion
(b)
Relative difference (%
)
Neutron energy (eV)
ENDF/B-VI
JEFF
Relat. diff.
JJJJJJJJ
JJJJJJJJJ
B B BBB
FFFFFF
F
FFF
J MAC-76
B BEL-65
F MUT-97
Figure 4.8. Discrepancies in capture data for 209Bi between ENDF/B-VI.8, JEFF-3.0 and EXFOR.
4.2.5 Summary of the Status of the Nuclear Data for TransmutationThis introductory ND comparative analysis, although not exhaustive, evidenced somecommon tendencies among isotopes important to the transmutation of HLW in ADS. Fissionand capture cross-sections for thermal energies are relatively well known for some isotopes,such as 233, 235, 238U, 239, 241Pu or Pb, but even this energy range presents obvious differencesfor non-conventional isotopes, e.g. thorium, 238, 242Pu, americium, curium or bismuth.
The resonance region generally presents large discrepancies both in the number of resonancesand in the amplitude of these, due to different evaluations of the experimental data. Thesedifferences increase for the high-energy resonance region, where libraries often differ in theirprediction of the energy at which those end. This energy range is of great importance for fastsystems, since the neutron flux is maximum here. Therefore these differences will affect fastreactor calculations quantitatively more than differences in the thermal energy range. Theunresolved resonance region shows the same tendencies with the same implications, as in thecase of 243Am.
Since the neutron flux in fast systems tends to peak in an energy range, i.e. 300-700 keV,where many isotopes present important differences, the high-energy reaction channels such as(n, xn) and (n, ni), which were not considered very significant in thermal systems, gain

Chapter 4 Nuclear Data
76
importance in fast systems. And it is also for these reaction channels where largediscrepancies are found for a vast number of isotopes.
This data seems suitable for preliminary calculations, but not for precise predictions of thebehaviour of non-conventional systems, such as ADS, loaded with substantial quantities ofthese isotopes. Hence, an analysis of the effects of this nuclear data in several transmutationsystems is required in order to assess the reliability of the calculations performed for thesesystems.
4.3 Analysis of Sensitivity to Nuclear Data
Accurate cross-section information is fundamental for reliable prediction of the behaviour of anuclear reactor core. In particular, for an ADS, the level of uncertainty in Dr/cycle is ofparamount importance (e.g. at ksrc ~0.98 ± 2% uncertainty in Dr /cycle has seriousconsequences for safety analysis and accelerator current requirements). Thus, for a subcriticaldevice, uncertainties in the nuclear data limit the safety margins within which such a devicecould operate. Hence, for 0.90 ≤ ksrc ≤ 0.99 the precision should be similar to that required forcritical cores (±100 pcm for UO2, ±40 pcm for MOX).
As previously explained, the various cross-section libraries show significant differencesbetween their respective ND, for a wide range of energies. The use of different libraries cancause significant deviations in the results of design calculations. This analysis aimed toidentify the isotopes and reaction channels responsible for the largest discrepancies in themain neutronic parameters.
A neutron cross-section sensitivity analysis [73] was previously performed also using the EA-MC code package to study EADF [46], comparing the results of calculations based ondifferent nuclear data libraries. The results showed discrepancies in Dk/k ranging from 500 to2500 pcm for different types of fuels and ND libraries. Large neutron balance discrepanciesfor some reactions and isotopes (e.g. 25% for capture in 241Pu, 16% for fission in 240Pu) werediscovered.
The release of new versions of the nuclear data libraries (ENDF/B-VI.8, JEFF-3.0 andJENDL-3.3) led to the present study [74], also extending the previous work to other isotopesof interest. In addition, progress in the design of TRADE [50] generated interest in studyingthe effects of cross-section data for thermal ADSs, thus widening the energy range examinedin the study [75]. The comparison between libraries was performed using ENDF/B-VI.8 as areference library and systematically changing the ND library of a single isotope at a time,while keeping the ND intact for the rest of the isotope inventory. In this way, the effects of the

Chapter 4 Nuclear Data
77
discrepancies in the ND for every specific isotope were isolated, thus avoiding possiblecompensating effects.
It should be emphasised that these results show the relative discrepancies between libraries,and do not imply an assumption that one library is more accurate than another. The resultssimply estimate the level of uncertainty for every isotope and reaction.
4.3.1 Sensitivity Analysis on a Thermal System: TRADEAs detailed in Chapter 5, TRADE is a pilot experiment, to provide a global demonstration ofthe ADS concept. The experiment entails the coupling of a thermal reactor, an existing 1 MWTRIGA reactor in ENEA / Casaccia (Italy), to a 140 MeV, 1 mA proton cyclotron. For thereference configuration a multiplication coefficient ksrc = 0.97 - 0.98, a beam power Pbeam =14.2 kW and an energy gain G = 15.1, with a neutron yield for 140 MeV protons in tantalumof 0.8 n/p, are predicted. The fuel elements consist of a ternary alloy uranium-zirconium-hydrogen (the H-to-Zr atom ratio is 1.7:1; the uranium is enriched to 20% in 235U).
The effects of the different cross-sections for the isotopes in the fuel, 235U and 238U, and themain structural materials, 56Fe and 90Zr, were considered, together with global analysis of thedifferent ND libraries. Table 4.1 presents the results of this analysis, where the red entriesindicate large discrepancies between the reference library and the library in question. The blueentries denote small discrepancies between the results obtained when all the isotopes arechosen from the same library.
Table 4.1. Neutron cross-section data effects on ksrc for TRADE.
Isotopes ENDF/B-VI.8 JEFF-3.0 JENDL-3.3ksrc 0.97389 0.97362 0.97201
error ±0.00029 ±0.00018 ±0.00017U-235Dk/k (pcm) –28 –193
ksrc 0.97389 0.97391 0.97387error ±0.00029 ±0.00021 ±0.00020U-238
Dk/k (pcm) 2 –2ksrc 0.97349 0.97521 0.97572
error ±0.00020 ±0.00020 ±0.00021Zr-90Dk/k (pcm) 177 229
ksrc 0.97349 0.97425 0.97387error ±0.00020 ±0.00021 ±0.00027Fe-56
Dk/k (pcm) 78 39ksrc 0.97389 0.97615 0.97454
error ±0.00029 ±0.00022 ±0.00024Allisotopes Dk/k (pcm) 232 67
Large discrepancies were found for 90Zr between the reference library and both JENDL-3.3and JEFF-3.0.These are significant discrepancies for an isotope, which a priori may not haveseemed relevant in terms of system multiplication. Substantial discrepancies for 235U between

Chapter 4 Nuclear Data
78
ENDF/B-VI.8 and JENDL-3.3 can also be observed. When different libraries, are used for allthe isotopes large discrepancies appear between ENDF/B-VI.8 and JEFF-3.0.
No major differences can be observed in Figure 4.9, which compares the capture and fissionreaction rates in 235U as a function of neutron energy for ENDF/B-VI.8 and JENDL-3.3,except for a slightly higher capture rate in the 10-300 keV energy for fission, which couldcause minor differences in ksrc.
1x10⁹
1x10¹⁰
1x10¹¹
1x10¹²
1x10¹³
1x10¹⁴
1x10⁻⁵ 1x10⁻⁴ 1x10⁻³ 1x10⁻² 1x10⁻¹ 1x100 1x101 1x10² 1x10³ 1x10⁴ 1x10⁵ 1x10⁶ 1x10⁷ 1x10⁸
U-2
35 re
actio
n ra
te (r
eact
ions
/s)
Neutron energy (eV)
CAPT (endf)
FISS (endf)
CAPT (jendl)
FISS (jendl)
Figure 4.9. Comparison of reaction rates for capture and fission in 235U using ENDF/B-VI.8 and JENDL-3.3.
On the other hand, a slight discrepancy in the MeV region can be observed in Figure 4.10when comparing the elastic (n, ne) and the inelastic (n, ni) scattering reaction rates: JENDL-3.3 predicts more elastic and less inelastic scattering. This divergence shifts the spectrum ofthe neutrons, producing more moderation in the case of ENDF/B-VI.8, increasing theresonance escape probability and effectively increasing ksrc. The lower ksrc predicted byJENDL-3.3 when compared to ENDF/B-VI.8 is reflected in the shape of the radial neutronflux, having a higher value in centre of the core (7.96¥1012 n/cm2/s for ENDF/B-VI.8 versus8.06¥1012 n/cm2/s for JENDL-3.3) and a slightly lower one in the periphery (3.35¥1012
n/cm2/s for ENDF/B-VI.8 versus 3.32¥1012 n/cm2/s for JENDL-3.3).
As explained in Chapter 3, the differences in the shape of the neutron flux are related to thechanges in the diffusion of neutrons in a multiplying medium, evolving from an exponentialdistribution to a cosine distribution with increasing ksrc.

Chapter 4 Nuclear Data
79
1x10⁹
1x10¹⁰
1x10¹¹
1x10¹²
1x10¹³
1x10⁻³ 1x10⁻² 1x10⁻¹ 1x100 1x101 1x10² 1x10³ 1x10⁴ 1x10⁵ 1x10⁶ 1x10⁷ 1x10⁸
U-2
35 re
actio
n ra
te (r
eact
ions
/s)
Neutron energy (eV)
N,NE (endf)
N,NI (endf)
N,NE (jendl)
N,NI (jendl)
Figure 4.10. Comparison of reaction rates for (n, ne) and (n, ni) in 235U using ENDF/B-VI.8 and JENDL-3.3.
1x10⁹
1x10¹⁰
1x10¹¹
1x10¹²
1x10¹³
1x10⁻³ 1x10⁻² 1x10⁻¹ 1x100 1x101 1x10² 1x10³ 1x10⁴ 1x10⁵ 1x10⁶ 1x10⁷
Zr-9
0 ca
ptur
e ra
te (c
aptu
res/
s)
Neutron energy (eV)
ENDF/B-VI
JENDL
JEFF
Figure 4.11. Capture rates in 90Zr for ENDF/B-VI.8, JENDL-3.3 and JEFF-3.0.
The analyses using different ND libraries for all isotopes show contrasting results. JEFF-3.0gives discrepancies with ENDF/B-VI.8 (232 pcm) well above the statistical error, whereasJENDL-3.3 is in good agreement with ENDF/B-VI.8. As Table 4.1 shows, this change is

Chapter 4 Nuclear Data
80
mainly due to the lower capture rates in 90Zr, presented in Figure 4.11, using JEFF-3.0 andJENDL-3.3, thus increasing the value of ksrc. A detailed study of the energy spectrum of thecapture rate in 90Zr shows that the largest discrepancies are concentrated in the energy regionfrom 50 keV to 2 MeV, identifying where the cross-section data should be particularlyimproved, in the context of thermal reactors.
Comparison of the neutron energy spectra for different isotopes in the fuel evidences theminimisation of possible effects in the reactor behaviour due to a shift in the neutron spectrumcaused by the use of a different library. These so-called spectrum effects are reduced byrepeatedly changing a single isotope in the simulations of the device, as evidenced by Figure4.12.
1x10⁸
1x10¹⁰
2x10¹⁰
3x10¹⁰
1x10⁻³ 1x10⁻² 1x10⁻¹ 1x100 1x101 1x10² 1x10³ 1x10⁴ 1x10⁵ 1x10⁶ 1x10⁷
Neu
tron
flux
(n/c
m2/
s)
Neutron energy (eV)
ENDF (ref.)
JENDL (U-235)
JEFF (all isotopes)
abs (JENDL-ENDF)
abs (JEFF-ENDF)
Figure 4.12. Neutron energy spectra in the fuel of TRADE for different ND libraries.
To study several isotopes of importance for transmutation, small samples were placed insidefuel pins in different positions in the core. This procedure aimed to average differences in thespectrum of every fuel region. Table 4.2 presents the neutron balance results for the isotopesand reaction channels. Reactions are classified as “capture”, “fission” and “n,xn” and theirrates of occurrence are given as a relative percentage, with only reactions that contributesignificantly being listed. The columns headed by DJEFF and DJENDL present relativepercentage differences between the cross-section library in question and the reference(ENDF). These discrepancies are highlighted when greater than 2% and statistically

Chapter 4 Nuclear Data
81
significant. The values of DJEFF and DJENDL are omitted when the occurrence of thereaction is below 1% of the total reactions.
Table 4.2. Neutron balance of the actinides analysed in TRADE (thermal spectrum).
ENDF%
JEFF%
DJEFF%
JENDL%
DJENDL%
Capture 97.36 97.29 –0.07 97.38 +0.02Fission 1.08 1.21 +11.24 1.14 +4.70Th
232n,xn 1.56 1.50 –3.8 1.49 –4.49
Capture 9.31 9.37 +0.67 9.33 +0.19Fission 90.65 90.57 –0.09 90.62 –0.03U
233n,xn 0.04 0.06 0.05
Capture 91.45 91.50 +0.05 91.50 +0.05Fission 8.42 8.37 –0.46 8.31 –1.25U
234 n,xn 0.14 0.13 0.20Capture 15.69 15.70 +0.06 15.69 0.00Fission 84.31 84.29 –0.02 84.30 –0.01U
235 n,xn 0.007 0.007 0.005Capture 96.24 96.29 +0.05 96.19 –0.05Fission 3.13 3.11 –0.40 3.19 +2.00U
238 n,xn 0.63 0.60 0.62Capture 78.73 76.29 –3.10 78.50 –0.30Fission 20.88 23.50 +12.60 21.47 +2.80Pu
238n,xn 0.39 0.20 0.03
Capture 28.85 28.91 +0.21 28.90 +0.17Fission 71.08 71.04 –0.06 71.06 –0.03Pu
239 n,xn 0.06 0.05 0.04Capture 91.02 90.94 –0.09 91.01 –0.01Fission 8.88 8.90 +0.20 8.89 +0.10Pu
240 n,xn 0.10 0.20 0.10Capture 22.63 23.09 +2.00 22.60 –0.10Fission 77.32 76.83 –0.60 77.31 –0.01Pu
241 n,xn 0.05 0.08 0.09Capture 90.05 89.58 –0.52 90.05 0.00Fission 9.68 10.04 +3.73 9.82 +1.50Pu
242 n,xn 0.27 0.40 0.10Capture 92.98 92.96 –0.02 92.71 –0.29Fission 6.90 6.95 +0.78 7.15 +3.70Np
237n,xn 0.12 0.09 0.14
Capture 93.31 92.82 –0.52 92.73 –0.60Fission 6.67 7.12 +6.80 7.22 +8.30Am
241 n,xn 0.02 0.06 0.05Capture 94.41 94.13 –0.30 94.20 –0.22Fission 5.50 5.75 +4.80 5.71 +4.00Am
243 n,xn 0.10 0.12 0.09Capture 77.97 77.60 –0.47 79.04 +1.37Fission 21.74 22.28 +2.48 20.86 –4.05Cm
244 n,xn 0.29 0.12 0.10Capture 13.43 13.81 +2.83 13.42 –0.07Fission 86.56 86.17 –0.45 86.57 +0.01Cm
245n,xn 0.01 0.01 0.01

Chapter 4 Nuclear Data
82
The results for 235U and 238U seem to agree rather well for all the libraries. Other isotopessuch as 233U, 239Pu and 240Pu also appear to produce similar results. An unexpecteddiscrepancy is the 2% uncertainty in capture for 241Pu, since this is a fissile isotope fairlyabundant in nuclear waste. Moreover, the results show large deviations in the neutron balancefor several important isotopes: 11.2% in fission for 232Th, 12.6% in fission for 238Pu and 8.3%in fission for 241Am. Isotopes such as 242Pu, 237Np, 243Am and 244, 245Cm also presentconsiderable discrepancies in the neutron balance for this particular spectrum. Thesesignificant differences could have an important effect on the neutron multiplication of thesystem in the case of a core heavily loaded with these isotopes.
In order to fully analyse the effects of the divergences in the nuclear data, the integral value ofthe reaction rates for the different isotopes were obtained, and the results for different librarieswere compared. Figures 4.13 to 4.16 show the most notable differences between the reference(ENDF/B-VI.8) case and JENDL-3.3 and JEFF-3.0 results, for every isotope of interest.
Figure 4.13 shows the good agreement between calculations for the naturally occurringisotopes of uranium except for a 10% difference for inelastic scattering in 235U. Thisdivergence takes place mainly between 300 keV and 2 MeV, as can be observed in Figure4.10. Capture in 232Th and capture and fission in 233U and in 234U also agree well. On the otherhand, discrepancies increase for the other reactions in 232Th, 233U and 234U reaching a 33%discrepancy between ENDF/B-VI.8 and JEFF-3.0.
Figure 4.13. Reaction rate discrepancies in TRADE for uranium isotopes and 232Th.

Chapter 4 Nuclear Data
83
Figure 4.14 presents the discrepancies in the reaction rates for the main plutonium isotopes. Itis immediately apparent that inelastic scattering is the reaction channel giving the largestdiscrepancies, above 15% for all the isotopes and reaching 56% for 241Pu. Mainly because ofthe low yield of 238Pu, the reaction channels for this isotope present noticeable discrepancies,in particular 11% in fission (ENDF-JEFF), 12% in (n, ne) (ENDF-JEFF) and 38% in (n, ni)(ENDF-JENDL).
Figure 4.14. Reaction rate discrepancies in TRADE for the plutonium isotopes.
For the minor actinides involved in the study, again the inelastic scattering reaction gives thelargest discrepancies. The main curium isotope, 244Cm, presents the largest deviations in allthe reaction channels (above 10%), as can be observed in Figure 4.15.
The analysis of the reaction rates for 56Fe, 90Zr (structural materials), 99Tc and 129I (long-livedfission fragments) provides useful information about the uncertainties concerning theseelements, as shown in Figure 4.16. The (n, xn) reactions, which have a direct effect on themultiplication of the system as a source of neutrons, exhibit large discrepancies (15% for 56Fe,4% for 90Zr and 50% for 99Tc, for the (n, 2n) reaction); 129I is a particular issue since there isno (n, xn) information in the ENDF release.
This fact together with the possibility of transmuting this isotope through this reaction (128Idecays after 10 minutes through b– into 128Xe, which together with 129, 130, 131, 132Xe are stableisotopes), makes this cross-section an important one [76]. In the case of capture in 90Zr,differences reach 15% (ENDF-JENDL) and, as mentioned previously in this chapter, could

Chapter 4 Nuclear Data
84
have an important effect on the multiplication coefficient. As for most of rest of the isotopesanalysed, elastic and, especially, inelastic scattering reactions present large discrepancies,particularly for 99Tc, 90Zr and 129I.
Figure 4.15. Reaction rate discrepancies in TRADE for MAs.
Figure 4.16. Reaction rate discrepancies in TRADE for 56Fe, 90Zr, 99Tc and 129I.

Chapter 4 Nuclear Data
85
These figures show major differences in the reaction rates (especially in elastic and inelasticscattering) for many of the isotopes analysed. These have a direct effect on the neutron energyspectrum and consequently on ksrc. The results for 90Zr highlight the importance of thefrequently neglected need for accurate cross-section data for structural materials.
4.3.2 Sensitivity Analysis on a Fast System: EADFThe conceptual design of EADF is based on an 80 MWth annular core immersed in moltenlead-bismuth eutectic, which serves both as the primary coolant and spallation target. Thecentral cylinder contains the spallation target, coupling the proton accelerator and thesubcritical core. This device should demonstrate transmutation with a large number of MAsbased fuel assemblies. In this study, the fuel analysed was ThPuO2-based mixed with MAs.The neutron flux in the fuel is ~1015 n/cm2/s with an energy distribution peaking at ~300 keV.Chapter 6 provides an in-depth analysis of this project.
A previous study [73] analysed the effect of the discrepancies in the ND libraries for thereference fuel configuration, i.e. UPuO2. This study was performed using previous libraryreleases, i.e. ENDF/B-VI.6, JEFF-2.2 and JENDL-3.0, for the whole set of isotopes andanalysing its effect for different isotopes.
Therefore, the present study [74] is based on the analysis of the effects of different cross-section data for specific isotopes (isotope per isotope) for the main isotopes involved in thedesign of this system (i.e. coolant and isotopes present in the fuel), together with globalanalysis of the different ND libraries. For this purpose, three alternative types of fuel havebeen analysed: a ThPuO2 fuel (proposed at a second stage of device operation), a ThUO2 fuelwhere the plutonium was substituted by 233U, and a mixture of 50% Pu and 50% MAs, bothwith an isotopic composition typical of UO2 spent fuel with an average thermal burn-up of 33GWd/tHM, as described in Chapter 2. As explained earlier, this study makes use of the latestreleases of the aforementioned ND libraries (i.e. ENDF/B-VI.8, JEFF-3.0 and JENDL-3.3).
4.3.2.1 ThPuO2 and ThUO2 fuels
The first matrix is formed by thorium-oxide containing approximately 20% of highly fissileplutonium in order to start the fission chain at the beginning of the reactor cycle. The secondmatrix was formed by substituting plutonium with the equivalent amount of 233U to maintainthe system subcritical. Table 4.3 summarises the composition of the ThPuO2 fuel. In the caseof 99Tc and 129I, small quantities were added to the external Pb-Bi blanket.
Table 4.3. Isotopic composition of the ThPuO2 fuel for EADF.16, 17, 18O 232Th 237Np 238Pu 239Pu 240Pu 241Pu 242Pu 241Am0.666667 0.256697 0.000018 0.000209 0.053030 0.018664 0.001985 0.000974 0.001763

Chapter 4 Nuclear Data
86
Table 4.4 presents the largest discrepancies found in the multiplication coefficient. Vastdifferences in the predictions of this value can be observed, especially in the cases of the fourmajor isotopes in relation to transmutation in the thorium cycle: 232Th, 233U, 239Pu and 240Pu.The importance of the differences related to these plutonium isotopes is enhanced by thesmall quantities of these in the fuel.
Table 4.4. Main neutron cross-section data effects on ksrc for the ThPuO2 fuel in EADF.
Reference case ThPuO2: ENDF/B-VI.8, ksrc = 0.94613 ± 0.00090Isotopes JEFF-3.0 ∆k/k (pcm) JENDL-3.3 ∆k/k (pcm)Tc-99 +104 +146I-129 –62 –95
Pb-206 –145 –71Pb-207 –191 –249Pb-208 +103 +130Bi-209 –122 +207Th-232 +770 +703Pu-238 –29 –159Pu-239 –318 –625Pu-240 –376 –627Pu-241 +7 –181Pu-242 –136 –209Am-241 –134 –12
All isotopes +317 –61Reference case ThUO2: ENDF/B-VI.8, ksrc = 0.97424 ± 0.00083U-233 –1383 –1420U-234 +205 +61U-235 –100 –188U-238 –139 –270
It should be noticed that for both, but especially clearly in the case of JENDL-3.3, how majordifferences in ksrc, due to the cross-section discrepancies for different isotopes, are hiddenonce a whole library is used for all the isotopes. This effect is a potential source of criticalerrors in the designing of the reactor. Hence, ND is key to correctly predicting the behaviourof these systems.
Table 4.5 presents the isotopes showing the largest discrepancies in the neutron balance fordifferent reaction channels. Notice that the effects presented in Table 4.4 depend directly onthe composition of the fuel and the amount of every single isotope in the core, whereas theneutron balance mainly depends on the energy distribution of the neutron flux affecting theisotope (which depends on the design of the system). Practically, this implies thatdiscrepancies in calculations for a core highly loaded with more “exotic” isotopes, such as 238,
242Pu, 241Am and 244, 245Cm, would be much greater than the ones shown above.
Capture in 208Pb presents a large discrepancy between ENDF/B-VI.8 and JEFF-3.0 in theneutron balance, even though the capture cross-section is so small that this only represents a

Chapter 4 Nuclear Data
87
103 pcm difference in Dk/k. 238Pu shows major discrepancies in fission and capture, as doesfission in 237Np. On the other hand, 209Bi in JENDL-3.3 shows a 12.5% discrepancy incapture, which translates into 207 pcm in Dk/k. The large effects observed for 232Th, 233U,239Pu and 240Pu in Table 4.4 are a consequence of minor discrepancies in the neutron balancein isotopes abundant in the fuel, together with the effect of large discrepancies in the inelasticscattering cross-sections.
Table 4.5. Neutron balance of the isotopes studied in EADF (fast spectrum).
ENDF%
JEFF%
∆JEFF%
JENDL%
∆JENDL%
Capture 89.36 85.97 –3.79 85.46 –4.36Pb206 n,xn 10.64 14.03 –3.12 14.54 –1.96
Capture 92.96 91.11 –1.99 91.12 –1.98Pb207 n,xn 7.05 8.89 –0.71 8.88 –1.50
Capture 27.00 20.32 –24.74 20.43 –24.30Pb208 n,xn 73.00 79.68 +2.38 79.57 +1.95
Capture 58.95 58.92 –0.05 51.58 –12.50Bi209 n,xn 41.05 41.08 –2.08 48.42 +2.57
Capture 96.26 96.14 –0.13 96.17 –0.09Fission 2.46 2.64 +7.58 2.61 +6.31Th
232n,xn 1.28 1.22 1.22
Capture 8.179 8.033 –1.79 8.04 –1.74Fission 91.78 91.93 +0.16 91.92 +0.15U
233 n,xn 0.039 0.039 0.04Capture 28.23 26.48 –6.20 28.04 –0.67Fission 71.77 73.52 +2.44 71.96 +0.26U
235 n,xn 0.00 0.00 0.00Capture 87.68 85.56 –2.42 84.78 –3.31Fission 12.32 14.44 +17.21 15.22 +23.54U
234 n,xn 0.00 0.00 0.00Capture 94.51 94.85 +0.36 94.67 +0.17Fission 5.15 4.86 –5.73 4.98 –3.36U
238 n,xn 0.34 0.29 0.35Capture 40.60 31.14 –23.30 38.54 –5.07Fission 59.27 68.83 +16.13 61.46 +3.69Pu
238n,xn 0.13 0.04 0.35
Capture 21.92 22.25 +1.51 22.49 +2.60Fission 78.04 77.71 –0.42 77.48 –0.72Pu
239 n,xn 0.04 0.03 0.03Capture 59.39 60.14 –0.09 60.83 –0.01Fission 40.52 39.74 +0.20 39.10 +0.10Pu
240 n,xn 0.08 0.12 0.08Capture 15.17 16.20 +6.80 16.03 +5.70Fission 84.80 83.76 –1.30 83.92 –1.04Pu
241 n,xn 0.03 0.04 0.06Capture 69.37 69.97 +0.86 70.46 +1.57Fission 30.47 29.80 –2.20 29.46 –3.32Pu
242 n,xn 0.16 0.24 0.08

Chapter 4 Nuclear Data
88
The analysis of the possible spectrum effects in the fuel evidences again a large reduction ofthese by the systematic evaluation of a single isotope at a time. Figure 4.17 shows the neutronspectrum in the fuel using ENDF/B-VI.8 (blue curve), using JENDL-3.0 for 239Pu andENDF/B-VI.8 for the rest (red curve), using JEFF-3.0 for all the isotopes (yellow curve) andthe absolute values of the differences between the previous spectra. Differences are clearlynoticeable for ENDF-JEFF in the resonance region around 100 keV and around 1 MeV,whereas there are several orders lower for ENDF-JENDL (239Pu). Notice that the mostprobable energy in this system is around 300 keV, confirming the importance of accuratecross-section data in the resonance region.
1x10⁹
2x10¹²
4x10¹²
6x10¹²
8x10¹²
1x10¹³
1x10³ 1x10⁴ 1x10⁵ 1x10⁶ 1x10⁷
Neu
tron
flux
(n/c
m2/
s)
Neutron energy (eV)
ENDF (ref.)
JENDL (Pu-239)
JEFF (all isotopes)
abs (JENDL-ENDF)
abs (JEFF-ENDF)
Figure 4.17. Neutron energy spectra in the fuel of EADF for different ND libraries.
Figure 4.18 shows the discrepancies in the reaction rates for thorium and uranium isotopes.Inelastic scattering seems to be the least known reaction for all the isotopes, followedsurprisingly by fission in 232Th, 235U and 238U. The uncertainty in capture for 235U is alsosignificant.
Analysis of a one-group reaction cross-section can hide the fact that discrepancies are oftenconcentrated in a particular energy region, and that these may be compensated for across theenergy range. Figure 4.19 shows the capture and (n, ni) reaction rates for 233U, a goodexample of this situation. For this isotope ENDF/B-VI.8 presents a larger capture rate in theenergy range 1-10 keV, whereas JENDL-3.3 has a higher rate from 900 keV to 3 MeV. Theseresults compensate in the integral value but could have an important impact on the core

Chapter 4 Nuclear Data
89
behaviour due to the spectrum change, consequently affecting parameters such as n (averagenumber of neutrons released per fission) or the resonance escape probability of the system.The same tendency can be observed in the inelastic scattering energy spectra, where majordifferences in the reaction rates appear from 600 keV onwards, and smaller differences from70 to 200 keV. For the first energy range JENDL-3.3 presents a larger (n, ni) rate, whereas forthe second one it is ENDF/B-VI.8 which shows a slightly larger rate.
Figure 4.18. Reaction rate discrepancies in EADF for 232Th and the uranium isotopes.
1x10¹³
1x10¹⁴
1x10¹⁵
1x10¹⁶
1x10² 1x10³ 1x10⁴ 1x10⁵ 1x10⁶ 1x10⁷
U-2
33 re
actio
n ra
te (r
eact
ions
/s)
Neutron energy (eV)
CAPT (endf)
CAPT (jendl)
N,NI (endf)
N,NI (jendl)
Figure 4.19. Comparison of reaction rates for capture and (n, ni) in 233U using ENDF/B-VI.8 and JENDL-3.3.

Chapter 4 Nuclear Data
90
For the reaction rate spectra for 232Th (Figure 4.20), slight differences can be perceived forcapture across the whole energy range. On the other hand, for (n, ni) differences areconcentrated in the energy range starting at the threshold of the reaction (70 keV) up to 100keV. Fission also presents slight differences across most of the energy range of this reaction.
1x10¹²
1x10¹³
1x10¹⁴
1x10¹⁵
1x10¹⁶
1x10¹⁷
1x100 1x101 1x10² 1x10³ 1x10⁴ 1x10⁵ 1x10⁶ 1x10⁷
Th-2
32 re
actio
n ra
te (r
eact
ions
/s)
Neutron energy (eV)
CAPT (endf)
CAPT (jendl)
FISS (endf)
FISS (jeff)
N,NI (endf)
N.NI (jeff)
Figure 4.20. Comparison of reaction rates for capture, fission and (n, ni) in 232Th for different libraries.
The reaction rates for the plutonium isotopes (Figure 4.21) exhibit larger discrepancies thanthe uranium isotopes. Again, the largest deviations appear in the inelastic scattering reaction,reaching 74% for 241Pu. 238Pu appears to be the least known isotope, with uncertainties incapture reaching 30%. Elastic scattering (12%) and capture (10%) in 241Pu would also needimprovement. Analysis of the reaction rate spectra for 239Pu shows minor differences in thecapture reaction rate spectrum, in particular for 1-2 keV, 100 keV and above 800 keV. The (n,ni) reaction rate also exhibits slight discrepancies above 100 keV.
Even though the presence of 240Pu in the fuel is 2.8 times lower than that of 239Pu, itsinfluence on the variations of ksrc is as important as that of the latter. Figure 4.22 shows theorigin of this effect: the capture rate is systematically slightly higher from 1 keV onwards forJENDL, which effectively produces a lower ksrc when this library is used. The (n, ni) rate isalso larger for JENDL from 100 keV to 1 MeV. In the case of 241Pu differences appear clearerboth in the capture and especially in the inelastic scattering reaction rate. For this reaction,differences are evident along all the energy range for which the reaction is present (60 keV to

Chapter 4 Nuclear Data
91
8 MeV). These large differences are striking because of the importance of the isotope, themagnitude of the reaction and of the error itself (almost one order of magnitude for 500 keV).
Figure 4.21. Reaction rate discrepancies in EADF for plutonium isotopes.
1x10¹³
1x10¹⁴
1x10¹⁵
1x10¹⁶
1x10⁻¹ 1x100 1x101 1x10² 1x10³ 1x10⁴ 1x10⁵ 1x10⁶ 1x10⁷
Pu-2
40 re
actio
n ra
te (r
eact
ions
/s)
Neutron energy (eV)
CAPT (eadf)
CAPT(jendl)
FISS (eadf)
FISS (jendl)
Figure 4.22. Comparison of reaction rates for capture and fission in 240Pu using ENDF/B-VI.8 and JENDL-3.3.

Chapter 4 Nuclear Data
92
For the coolant (206, 207, 208Pb and 209Bi) and the LLFF (99Tc and 129I), Figure 4.23 presentsseveral differences worth remarking. As for the other isotopes, inelastic scattering is globallythe reaction exhibiting the largest discrepancies. These differences could have an importanteffect on the energy spectrum of the neutron flux, therefore changing the behaviour of thesystem and the other reaction rates. In addition, the large uncertainties connected with the (n,2n) reaction in all lead isotopes, ranging from 10% to 30%, could have a direct impact on themultiplication factor of the system, since this reaction accounts for rates comparable tocapture (roughly 10% in 206, 207Pb but 73% in 208Pb). 99Tc also exhibits large inconsistencies in(n, 2n) (41%), elastic (19%) and inelastic (21%) scattering. As explained previously,ENDF/B-VI.8 lacks potentially useful (n, 2n) information for 129I. The results using differentlibraries also disagree for capture (15%) and elastic scattering (18%) for this isotope. Finally,capture in the isotopes forming the coolant also present differences, with capture in 209Bi(16%) being possibly the most relevant due to the abundance of this isotope (50% of thecoolant) and the level of captures, one order of magnitude larger than in 208Pb (since the latteris a double magic isotope and therefore “transparent” to the neutrons).
Figure 4.23. Reaction rate discrepancies in EADF for the elements in the coolant and LLFFs.
Analysis of the reaction rate spectra for 207Pb shows similar trends to the other isotopes bydisplaying larger uncertainties at higher energies. ENDF/B-VI.8 exhibits a higher capture rateabove 150 keV and lower (n, 2n) and (n, ni) rates for all their energy ranges. On the otherhand, JEFF-3.0 seems to predict sharper capture resonances between 3-100 keV, andapparently this effect dominates the shift in ksrc, for which JEFF-3.0 predicts a lower value.

Chapter 4 Nuclear Data
93
For 209Bi, the most abundant isotope in the coolant, JEFF-3.0 and JENDL-3.3 exhibit oppositetendencies concerning ∆k/k, thus Figure 4.24 shows the comparison between the two. Asexpected, the capture rate is larger for JEFF-3.0 above 90 keV, whereas the rest of thereaction rates seem to agree, thus pointing out where the 329 pcm in ∆k/k are produced.
1x10¹³
1x10¹⁴
1x10¹⁵
1x10¹⁶
1x10¹⁷
1x10⁻² 1x10⁻¹ 1x100 1x101 1x10² 1x10³ 1x10⁴ 1x10⁵ 1x10⁶ 1x10⁷ 1x10⁸
Bi-2
09 re
actio
n ra
te (r
eact
ions
/s)
Neutron energy (eV)
Bi-209 capt jeff
Bi-209 n,2n jeff
Bi-209 n,ni jeff
Bi-209 capt jendl
Bi-209 n,2n jendl
Bi-209 n,ni jendl
Figure 4.24. Comparison of reaction rates for capture, (n, 2n) and (n, ni) in 209Bi with JENDL-3.3 and JEFF-3.0.
4.3.2.2 50% plutonium – 50% minor actinides fuel mixture
This fuel mixture was produced in order to assess the effect of large quantities of minoractinides in the core. It is formed by a mixture of 50% plutonium and 50% MAs, both with anisotopic composition typical of the UO2 spent fuel with an average thermal burn-up of 33GWd/tHM, as previously presented in Table 2.1.
The effect of these isotopes on the ksrc of the system can be found in Table 4.6. Largerdifferences appear due to the increasing presence of less-known isotopes. Despite of thelimited presence of 238Pu (1.7% of the plutonium isotopes), this isotope has a remarkableeffect on the ksrc, caused by the large discrepancies in the ND, as exemplified by Figure 4.6.This effect will increase with rising 238Pu concentration in the fuel during burn-up, as is thecase with the use of MOX fuels. The effect of ND discrepancies in 240Pu remains constant (asdoes its concentration in the fuel), although in this case JEFF-3.0 presents the largestdeviations; this gives an idea of the complexity of the interplay between different evaluatedresonances and neutron flux, since this effect is caused by a small change in the spectrum dueto the different isotopic composition and the disappearance of some resonances in the neutron

Chapter 4 Nuclear Data
94
flux, such as the one at 400 keV (elastic scattering in oxygen). Uncertainties related to 239Pubecome less important since the presence of this isotope in the fuel is reduced from 69% to59%. On the other hand, the presence of 241Pu increases from 2.6% to 11.7%, increasing theeffect of the differences in ND related to it. For the MAs, the uncertainties in 241Am have thestrongest effect since this is the most abundant isotope in the HLW, although discrepancies inthe ND for curium, and in particular for 244Cm, may produce large deviations in cases withhigher content of this isotope.
Table 4.6. Main neutron cross-section data effects on ksrc for the Pu-MAs fuel in EADF.
Reference case 50%Pu-50%MAs: ENDF/B-VI.8, ksrc = 0.86013 ± 0.00060Isotopes JEFF-3.0 ∆k/k (pcm) JENDL-3.3 ∆k/k (pcm)Np-237 –70 –135Pu-238 +514 –318Pu-239 –275 –288Pu-240 –558 –499Pu-241 +352 +42Pu-242 –142 –286Am-241 –499 +15Am-243 –147 +210Cm-244 +156 +248Cm-245 –125 –139
The discrepancies in the neutron balance for the MAs are presented in Table 4.7. These valuesshow the above-mentioned uncertainties in ND for curium, and also large discrepancies in theresults for fission in 241Am and 237Np. For the plutonium isotopes, the differences are similarto the values presented in Table 4.5, even though fission is slightly higher in this case due tothe harder spectrum.
Table 4.7. Neutron balance of MAs in the 50% plutonium 50% MAs fuel for EADF.
ENDF%
JEFF%
∆JEFF%
JENDL%
∆JENDL%
Capture 80.38 80.05 –0.41 79.07 –1.63Fission 19.59 19.92 +1.69 20.90 +6.69Np
237n,xn 0.03 0.03 0.03
Capture 84.72 86.13 +1.66 85.07 +0.41Fission 15.27 13.85 –9.30 14.91 –2.36Am
241 n,xn 0.01 0.3 0.02Capture 87.46 88.04 +0.66 87.84 +0.43Fission 12.49 11.91 –4.64 12.13 –2.88Am
243 n,xn 0.04 0.04 0.03Capture 62.27 52.98 –14.92 58.06 –6.76Fission 37.62 46.98 +24.88 41.92 +11.43Cm
244 n,xn 0.11 0.04 0.01Capture 15.10 11.45 –24.17 15.67 +3.78Fission 84.86 88.51 +4.30 84.33 –0.62Cm
245n,xn 0.03 0.04 0.00

Chapter 4 Nuclear Data
95
Analysis of the reaction rates for the MAs shows discrepancies above 10% for differentreaction channels in all isotopes. Inelastic scattering exhibits the largest discrepancies (above15% in most of them) followed by capture in curium (~30% discrepancy for both isotopes).Both americium isotopes show noticeable differences for (n, ni) (~25%) and capture (~15%).
Figure 4.25. Reaction rate discrepancies in EADF for MAs for the Pu-MAs fuel.
The abundance of 241Am in the spent fuel and its effect on the neutron multiplication justifiesthe need to improve the accuracy of the related ND. Figure 4.26 shows the discrepancies inthe reaction rates for 241Am between ENDF/B-VI.8 and JEFF-3.0, which seem to have animportant effect in ksrc (~500 pcm smaller ksrc using JEFF-3.0). The capture rate calculatedusing JEFF-3.0 is lower for the energy range between 100 eV and 100 keV, becoming clearlylarger from 200 keV (where the capture rate peaks) to 5 MeV (in fact, the capture reactionusing ENDF/B-VI.8 stops at 3 MeV). There is a similar effect in the fission rate, althoughsmaller in magnitude, showing a slightly higher value for ENDF/B-VI.8 below the fissionpeak at 1 MeV and a lower one above this point. The large discrepancies in capture comparedto fission explain the large discrepancies in ksrc between these two libraries. It also shows theextreme sensitivity of these systems to ND, since if the neutron energy spectrum was slightlysofter, the differences in ksrc could invert.

Chapter 4 Nuclear Data
96
1x10¹³
1x10¹⁴
1x10¹⁵
1x10¹⁶
1x10¹⁷
1x10⁻¹ 1x100 1x101 1x10² 1x10³ 1x10⁴ 1x10⁵ 1x10⁶ 1x10⁷
Am
-241
reac
tion
rate
(rea
ctio
ns/s
)
Neutron energy (eV)
CAPT (endf)
CAPT (jeff)
FISS (endf)
FISS (jeff)
Figure 4.26. Comparison of reaction rates for capture and fission in 241Am using ENDF/B-VI.8 and JENDL-3.3.
1x10¹³
1x10¹⁴
1x10¹⁵
1x10¹⁶
1x10¹⁷
1x10³ 1x10⁴ 1x10⁵ 1x10⁶ 1x10⁷
Cm
-244
reac
tion
rate
(rea
ctio
ns/s
)
Neutron energy (eV)
CAPT (endf)
CAPT (jeff)
FISS (endf)
FISS (jendl)
Figure 4.27. Comparison of reaction rates for capture and fission in 244Cm using ENDF/B-VI.8 and JENDL-3.3.
With respect to 244Cm, Figure 4.27 shows large discrepancies capture rate between 1-10 keV.ENDF/B-VI.8 exhibits almost one order of magnitude higher values for 3 keV. Beyond 10keV, this library still evidences a capture rate up to 1 MeV, hence the higher ksrc estimated

Chapter 4 Nuclear Data
97
using JEFF-3.0 and JENDL-3.3. The fission rate also exhibits a large difference between 1-10keV although the importance of fission at these energies is much smaller than that of capture.Beyond 20 keV, there are no major discrepancies in the fission rate for 244Cm. Although thediscrepancies in the capture rate appear large, the small quantity of 244Cm limits the effect ofthese differences on ksrc.
4.3.3 Conclusions: Cross-section priority listThe effects of the ND were found to be of major importance for reliable design of an ADS,especially in terms of safety. Also, the predictions of the spent fuel radiotoxicity may also beaffected since the actinide accumulation is directly connected with the isotopes’ fission andcapture cross-section. The discrepancies appear larger for fast systems, even though largeuncertainties were found at thermal energies for isotopes such as 241Pu and 244Cm.
Discrepancies in the ND for coolant and structural materials, such as 90Zr in the case ofTRADE, and 207Pb and 209Bi in the case of EADF, also have an important effect on theneutron multiplication of the system, which should not be neglected.
In the case of EADF, large uncertainties in the neutron balance for isotopes such as 237Np,238Pu and 241Am may have large effects on ksrc, depending of the configuration of the fuel.Moreover, even small differences in the neutron balance for 233U and 232Th introducesignificant changes in the neutron multiplication for the thorium-based fuel. There is also ageneral need to improve the scattering cross-sections, for most of the isotopes; theseuncertainties perturb the spectrum, therefore affecting transmutation rates, safety parametersand reactor behaviour, for example altering the resonance escape probability.
Hence, the differences between libraries are larger for a fast system due to the poorerknowledge of ND at energies above thermal. There is a systematic inaccuracy in the inelasticscattering cross-section for all the isotopes, generally amplified in a fast neutron flux. Capturein the coolant is also a source of discrepancies, and thus differences in the neutronmultiplication in the system. MAs undoubtedly present the largest discrepancies in bothfission and capture, showing capture rates deviating by more than 15% for americium andcurium.
Comparing sensitivity analysis results for the previous library release and the present work,there are some improvements in the fission and capture cross-sections for 240Pu, from 7% and15% to 3.4% and 8.5% respectively. The elastic scattering cross-section for 238Pu also seemsto have improved, from 22% to 11%, even though large differences are still present for (n, ni).For capture in 237Np, JENDL-3.3 shows an improvement compared to the previous release,even though fission still shows a large discrepancy when compared to ENDF/B-VI.8.Discrepancies related to other isotopes and reactions channels seem to maintain similar

Chapter 4 Nuclear Data
98
values, in particular large differences, such as capture, (n, ne) and (n, ni) in 241Pu (10%, 13%and 73% respectively) or fission and capture in 241Am (both 9%), remain.
Therefore, no major changes between library releases were found, with the exception of theaforementioned cases of capture in 237Np and 240Pu, and fission in 240Pu. This demonstratesthe need for new and precise ND measurements for an extended energy range and a largenumber of isotopes. These measurements should greatly reduce uncertainties in thecalculations of the different reactor parameters.
4.4 The Neutron Time-Of-Flight Experiment (n_TOF)
The lack of reliable ND for various isotopes related to transmutation and ADS technologymotivated in 1999 the proposal [77] to build an experimental facility in order to measureneutron-induced fission and capture cross-sections for several isotopes through the use of thetime-of-flight technique. The facility was built at CERN and finally commissioned in April2001 by the CERN/SL/EET group [78]. The n_TOF experiment started collecting data relatedto transmutation and astrophysics in 2002. Figure 4.28 presents a general view of the facility,highlighting the most relevant parameters.
Figure 4.28. Layout of the n_TOF facility at CERN [79].

Chapter 4 Nuclear Data
99
The n_TOF experiment uses the spallation mechanism as a source for neutrons by collidinghigh-energy protons against a lead target. The flight-path is ~200 m in order to optimiseneutron flux and energy resolution. The possibility to receive narrow high-intensity pulses atlow-repetition offers a high accuracy in the TOF measurements for high-energy neutrons.Hence, a high-neutron flux combined with a high energy resolution and low repetition ratemake this facility an appropriate one to accurately measure over a wide energy range isotopesthat could not be studied in other facilities due to their radioactivity and unavailability, suchas MAs, plutonium and certain FFs. The different detectors measuring the fission and capturecross-sections are placed in the experimental area at the end of the tube.
4.4.1 Description of the n_TOF FacilityIn order to measure different reaction cross-sections, the n_TOF experiment uses spallationneutrons produced by the collision of 20 GeV/c protons from the CERN PS ProtonSynchrotron against an 80¥80¥60 cm3 high-purity (99.999%) lead target (~30 n/proton at 1GeV and linearly growing for higher energies) followed by 5 cm of water. The accelerator iscapable of delivering up to 7¥1012 protons (with a Gaussian bunch shape, sx = 7.8 mm and sy
= 5.6 mm) per cycle concentrated in short time pulses – 6 ns r.m.s. (root mean square) –supplying up to 6 bunches per supercycle (~16.8 s). These facts result in a neutron flux at theend of the flight-path of ~6.2¥105 n/cm2/pulse in the energy range between 1 eV and 250MeV (neutron fluences of 1.2¥106 n/pulse and 8.0¥106 n/pulse for capture and fissionmeasurements, respectively).
The TOF tube has a 10∞ inclination from the proton beam direction to preserve the neutronfluence while reducing the number of unwanted charged particles. The pressure inside thevacuum tube is less than 1 mbar (neutron mean free path in air ~25 m at 1 atm) and the tube isformed by four different sectors, the first one (∆ = 80 cm), closest to the target, is made ofaluminium alloy whereas the others (∆ = 80, 60 and 40 cm) are made of stainless steel. Inspite of the 10∞ angle between the TOF tube and the proton beam, some charged particlescontaminate the neutron fluence. Therefore, a 30 tonne, 140 kW, 0.195 W, 2 m long dipolemagnet with a bending power of 1.5 T◊m was placed at 145 m to sweep away these unwantedsecondary charged particles. Two collimators were installed to reduce the radius of theneutron beam to 2 cm, required for the capture measurements to be performed with a 4p BaF2
calorimeter. The first one, 2 m long (beam shaping collimator), is located at 136.7 m and ismade of 1 m of iron and 1 m of concrete; its inner diameter is ∆ = 11.5 cm. The second(source screening) collimator with ∆ = 1.8 cm inner diameter, is placed at 178 m and isformed by 50 cm of 5% borated polyethylene, 125 cm of iron and 75 cm of 5% boratedpolyethylene. For the fission measurements, the second collimator is replaced by another one

Chapter 4 Nuclear Data
100
with a larger inner diameter of ∆ = 4 cm in order to exploit the full neutron fluence of theinstallation. Figure 4.29 shows a schematic view of the TOF tube, presenting its main details.
Initially, two concrete shielding walls of 2 and 3.2 m thickness and a chicane were placed inthe tunnel that houses the TOF tube to ensure proper background conditions. In September2001 an iron wall of 3.2 m thickness located at ~150 m was added to reduce further thebackground, by diminishing the muon component, which otherwise produces a neutronbackground from negative muon captures [80].
Figure 4.29. TOF tube sections from the spallation target (0 m) to the end of the TT2A tunnel (200 m) [78].
The neutron flux and its energy spectrum at the end of the flight-path is one of the mostimportant parameters of the facility, and its simulation posed a serious difficulty due to thelarge length of the neutron flight-path in the n_TOF tunnel [77]. Indeed, only one neutron outof 107 emerging from the lead target will reach the detector station at the end of the neutrontube due its small solid angle.
The beam 2D profile was determined using Micromegas detectors [81], and the neutron fluxwas characterised [78] using 235U and 238U fission chambers and by triple gold-foil activationat 4.9 eV, where gold presents a well-known resonance. Figure 4.30 presents the results of thesimulations and the aforementioned measurements of neutron energy spectrum at themeasuring station. The simulations exhibit a good agreement with the experimental values, inparticular for high-energies. The integrated value of the fluence is ~9.6¥105 neutrons / 7¥1012
protons (∆ = 1.8 cm collimator).
The energy resolution function ∆E/E of the facility was also evaluated during thecommissioning of the facility, which for non-relativistic particles can be estimated usingEquation 4.1:
�
DEE
=-2 ◊ Dtt
=2 ◊ Dll + L
(Eq. 4.1)
This equation shows the relation between the neutron energy E = mn/2◊(L/t)2 and the effectiveneutron path l inside the lead target followed by the 5 cm thick water moderator, L being the

Chapter 4 Nuclear Data
101
length of the flight-path. This effective neutron path can be evaluated as l = v◊t, where v is theneutron speed when entering the tube and t is the time elapsed since the generation of theneutron.
Figure 4.30. Neutron fluence energy spectra from fission chamber and gold foil activation measurements [78].
Figure 4.31 presents the distribution of l for different neutron energies (a) and ∆l as the r.m.sand variance of a Gaussian fit of l at its peak, for the energy range of interest (b). The valueof l in the lead target is a few centimetres for the lowest energies and increases with energyup to ~50 cm and its variance ∆l also varies greatly depending on the energy. At thermalenergies l presents a distribution somehow similar to a Maxwell distribution due tocontinuous scattering in the moderator, and above those energies ∆l rapidly decreases toreach a constant value for energies between 1-100 eV. For higher energies, ∆l rises due to theincreasing importance of evaporation, thus time delay, in the generation of neutrons belowseveral MeV. Beyond these energies, ∆l is greatly reduced due to the direct knock-out ofneutrons in the spallation reaction followed by their escape into the beam tube withoutinteracting.
The interest in using l to assess ∆E/E, instead of, for instance, t, is that this function onlydepends on ∆l for a given L >> l, and that therefore there is a one-to-one relationship them.The resolution function ∆E/E was validated by comparing well-known measured cross-sections with the database at narrow resonances (e.g. 7.1 eV 235U) and shown to be an

Chapter 4 Nuclear Data
102
accurate upper limit for the resolution, although only indicative of ∆E/E since Figure 4.31 isonly an approximation to the unknown real resolution function.
(a)
(b)
Figure 4.31. (a) MC distribution of l evaluated at the energy of observation [78]; (b) simulation of the energy
resolution at 185 m, where the 7 ns resolution due to the proton beam becomes dominant for high-energies [78].
Cross-section measurements were performed using a large range of detectors such as C6D6 g-ray detectors [81] and a 4p BaF2 calorimeter [82] for capture, and Parallel Plate Avalanche

Chapter 4 Nuclear Data
103
Counters (PPACS) [83] and Fission Ionisation Chamber (FIC) [84] for fission measurements.The involvement of the CERN-SL-ECT group, of which the author is a member, in thedefinition and production of the latter, justifies a brief description of this detector and somepreliminary measured data.
4.4.2 Fission Ionisation Chamber (FIC)The measurement of fission reactions with a counter based on the ionisation produced by thefission fragments in a gas, at the n_TOF facility was already proposed in [60]. After the goodresults achieved during the second n_TOF Commissioning [78] by using a Parallel PlateInduction Fission Chamber from the Physikalisch-Technische Bundesanstalt (PTB,Braunschweig, Germany), it was decided to build a dedicated counter based on the sameprinciple but optimised for the facility [85] since this type of detector is also simple and easyto operate.
Figure 4.32. Schematic view of the FIC assembly and its main elements [79].
Figure 4.32 shows the configuration of the detector. Apart from the windows, made withkapton foils 125 µm thick, all metallic parts are made out of aluminium alloy. The detector isfilled with gas (90% argon, 10% CF4) at 0.8 bar and no gas circulation is needed since itoperates in a non-proportional mode. The targets are stacked on the supports together with theother electrodes, facing the neutron beam. A total of 16 targets and 18 electrodes can be
Feedthrough

Chapter 4 Nuclear Data
104
mounted together with a 5 mm gap between layers. There is another stack of 3 targets and 4electrodes mounted perpendicular to the previous one, in order to evaluate the backgroundproduced by scattered neutrons. In the configuration for the 2002 run [84], the counter wasequipped with the following available targets:
∑ 234U: 7 targets, total mass ~37.7 mg in the main line;∑ 234U: 1 target, total mass ~5.4 mg in the background line;∑ 235U: 1 target, total mass ~5.06 mg in the main line;∑ 238U: 2 targets, total mass ~20 mg in the main line;∑ 238U: 1 target, total mass ~10 mg in the background line.
The fissile isotopes are deposited on both sides of 100 µm thick aluminium foils withdiameter ∆ = 72 mm in the form of a chemically stable compound such as, for example,U3O8. All electrodes are electrically connected to the feed-through located on the flange. Thetargets are held at ground potential by the preamplifier input while the facing electrodes are at–300 V potential. The front-end electronics and the HV distribution board are locatedimmediately after the feed-through.
4.4.3 Measurements at n_TOF: Preliminary Cross-section DataThe ongoing measurements at n_TOF have produced a myriad of promising results. The NDacquired in the experiment is still in the process of being evaluated by several research groupsin the n_TOF collaboration. This section presents some preliminary results for severalisotopes and reactions which show important discrepancies with previous measurements andevaluated data. It should be remarked that these results are still preliminary and require amore thorough analysis in order to be considered final. The fission results for actinides wereobtained using FIC and are the fruit of a joint effort between the EET group at CERN, theIPPE (Obninsk, Russia) and JINR (Dubna, Russia) research groups.
Figure 4.33 shows the adjusted fitting of the fission cross-section obtained using FIC withprevious experimental data for the well-known fission cross-section of 235U, in the resonanceregion between 8-25 eV. Since the cross-section measurements in FIC are relative to thefission cross-section of 235U, these measurements served to accurately calibrate the energy ofthe measurements (determining the total flight-path) by adjusting them to some well-knownresonances. They also help to experimentally determine the energy resolution, to some extentsince the Doppler broadening of resonances leads to loss of information.
The preliminary results of the measurements of the fission cross-section of 234U seem quitepromising, in particular concerning the energy resolution in the resonances, as exemplified byFigure 4.34, where the n_TOF measured resonances appear sharper (higher and narrower)
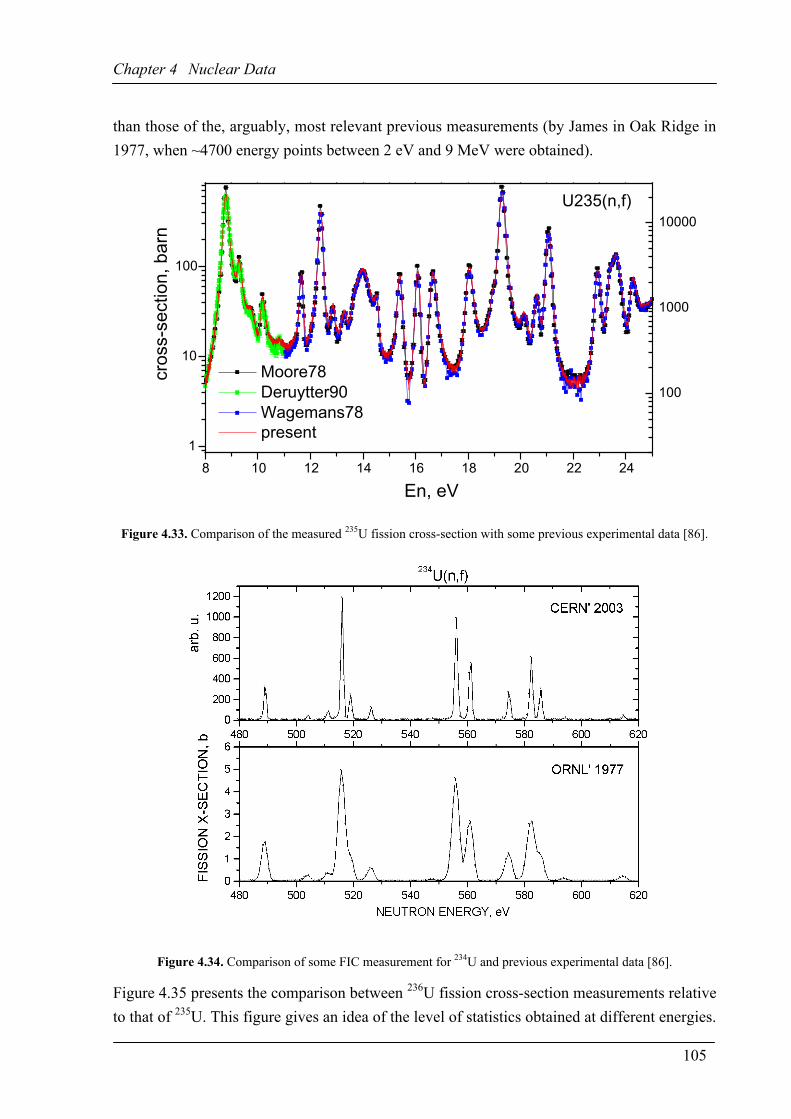
Chapter 4 Nuclear Data
105
than those of the, arguably, most relevant previous measurements (by James in Oak Ridge in1977, when ~4700 energy points between 2 eV and 9 MeV were obtained).
8 10 12 14 16 18 20 22 241
10
100
U235(n,f)
Moore78 Deruytter90 Wagemans78
cr
oss-
sect
ion,
bar
n
En, eV
100
1000
10000
present
Figure 4.33. Comparison of the measured 235U fission cross-section with some previous experimental data [86].
Figure 4.34. Comparison of some FIC measurement for 234U and previous experimental data [86].
Figure 4.35 presents the comparison between 236U fission cross-section measurements relativeto that of 235U. This figure gives an idea of the level of statistics obtained at different energies.

Chapter 4 Nuclear Data
106
The fine details between 500-100 keV may be of relevance in the analysis of a fast system, aselaborated in Section 4.3.2, therefore further beam-time is scheduled to improve the statisticsbelow 700 keV.
Figure 4.35. Comparison of the fission cross-section ratio for 236U between different measurements [86].
The fission cross-section for 232Th has an important impact on the neutronics of a thorium-based ADS, in particular since it accounts for more than 1% of the fissions produced in thesystem and discrepancies in this cross-section may provoke differences of hundreds of pcm inthe computation of ksrc.
Figure 4.36. Comparison of the fission cross-section ratio for 232Th between different measurements [86].

Chapter 4 Nuclear Data
107
Figure 4.36 shows the preliminary results of the measurements for this isotope performed inn_TOF compared with previous measurements. The data above 1 MeV show cleardiscrepancies with previous measurements and indicate the need of a new evaluation. Thestatistical uncertainties due to the small cross-section in the sub-threshold region may requirefurther measurements.
The measurements of the fission cross-section for 237Np presently show some promisingresults, such as the one shown in Figure 4.37, where the n_TOF measurements of theresonances in the 28-42 eV range seem more accurate than and rather different to previousmeasurements and the evaluated data in ENDF/B-VI. Indeed, the resonance at 39 eV is eighttimes larger than the respective evaluated data, and similar behaviour can be observed in theother three resonances in this energy range. The capture measurements for 237Np are currentlytaking place using a Total Absorption Calorimeter (TAC) and preliminary will results may beavailable in 2005.
Figure 4.37. Comparison of the fission cross-section for 237Np between 38 - 42 eV [86].
For 207Pb and 209Bi, the preliminary analyses of the n_TOF results show discrepancies,particularly in the resonance region, that justify a new evaluation of their capture cross-sections. Figures 6.38(a) and 6.38(b) show the radioactive kernel (area of the resonance, thusproportional to the cross-section using the Breit-Wigner formula) for some resonances in207Pb and 209Bi, respectively. For example, the n_TOF cross-section measurement for 207Pbshows resonances at 16 keV and 30 keV, which are not included in the evaluated data files,although they were detected in previous measurements. For 209Bi, up to 50% smaller cross-sections were found for some resonances compared to the evaluated data. The data in the

Chapter 4 Nuclear Data
108
evaluated files is based on an experiment performed in Oak Ridge (Macklin, 1976) whoseexperimental setup showed a higher sensitivity to neutrons. The discrepancies found betweenthe n_TOF experimental data and the ND libraries justify a cross-section evaluation for theisotopes in question, in order to include the new data in the ND files.
Figure 4.38. 207Pb (a) and 209Bi (b) capture radioactive kernel (resonance area) [87].
These preliminary results for the isotopes measured in n_TOF show very promisingpossibilities for reducing the uncertainties of the ND for many isotopes related totransmutation. This section was not meant to be exhaustive but to give several of themeasured and evaluated data for several isotopes whose ND discrepancies showed relevancein the previous sensitivity analysis.
The high neutron flux combined with the development of detectors that are less sensitive tothe neutron background have improved the accuracy of the measurements and reduced thestatistical uncertainties. The very broad energy range of the measurements (from thermalenergies to 250 MeV) and the good energy resolution of the facility (allowing the accuratedetection of narrow cross-section resonances) are other positive characteristics, and produceresults for energies which were not previously measured.
The author’s participation in this experiment began during the commissioning of the facility[78] in 2001. His involvement included the analysis of the radioprotection and shieldingaspects of the facility, particularly for the reduction of the muonic background [80]. Theauthor also participated in the calibration measurements of the FIC detector performed in PTB(Germany) [86] and has actively taken part in the 2002, 2003 and 2004 measuring campaignsat CERN. Finally, the results of [74], [75] and this dissertation have helped to determine themeasurement priority list and to expand it for future measurements. In fact, thesemeasurements are a worldwide effort, involving a number of countries including Japan,Russia and the European Union, to improve the ND related to HLW transmutation in ADS, as

Chapter 4 Nuclear Data
109
well as the fundamental knowledge of nuclear physics (e.g. 2nd and 3rd fission wells in 234U or232Th).
The n_TOF measuring campaign will conclude at the end of 2004. The data collected iscurrently been analysed and some of it may be available in 2005. There are plan to evaluatethis data and include it in the ND files (probably in JEFF). The organisation of futureactivities after the PS shutdown in 2005 (for example new cross-section measurements in2006) is currently being considered.
Clearly, the simulations presented in this dissertation are subject to the discrepancies in NDbetween libraries that were previously explained. The new measurements obtained in n_TOFalso show that some of the previously evaluated data may not be completely accurate.Therefore, the calculations in Chapter 5 and 6 may be precise only within a certain range, forexample thousands of pcm in ksrc, due to those uncertainties.

Chapter 4 Nuclear Data
110

Chapter 5 The TRADE Experiment
111
Chapter 5
The TRADE Experiment
The European Roadmap towards the experimental demonstration of ADS [46] indicatesseveral experiments which would allow to validate the separated components of an ADS. Thevalidation of the ADS concept may be summarised in three different levels, depending on thetype of experiments required:
∑ Level 1: validation of the different components taken separately (accelerator, target,subcritical core, dedicated fuels and fuel processing methods). FEAT, TARC and MUSEEuropean experimental programmes and the MEGAPIE project are examples ofexperiments at this level.
∑ Level 2: validation of the coupling of the different components in a realistic environment,i.e. using existing critical reactors adapted to the objectives at significant power levels.
∑ Level 3: validation in an installation explicitly designed for demonstration (e.g. the ADSinstallation described in the aforementioned European Roadmap, XADS). This third stepshould evolve to a demonstration of transmutation fuels, after a first phase in which thesubcritical core could be loaded with standard fuel.
The case for the licensing of a system such as the one foreseen in Level 3 could presentdifficulties, especially in absence of a preliminary coupling experiment at power. Therefore,the completion of an experiment where an existing low power reactor, with well-known safetyfeatures, is made subcritical and coupled with an accelerator by a spallation target hostedinside the core, is a necessary step towards the demonstration of the ADS concept.
The domain of interest in such an experiment is to show reliable operation of the system, fromstart-up to nominal power level, up to shutdown, in the presence of thermal reactor feedbackeffects. The presence of control rods in the system allows the verification of different modes

Chapter 5 The TRADE Experiment
112
of operation and the determination and monitoring of reactivity levels. The joint cooling ofthe spallation target and of the subcritical core could be studied, together with the solution ofsome practical engineering and safety problems of specific interest for an ADS, such as theconfiguration of the beam ingress into the core and the radioprotection and shielding aspectsof the beam-line inside the containment building.
The possibility of running the experiment at different levels of subcriticality (e.g. differentfuel loading patterns), allows the transition from an external source-dominated regime to acore thermal-feedback-dominated regime to be explored. This transition is relevant, inparticular to the understanding of the dynamic behaviour of an ADS, since future full-scaleADS prototypes for transmutation may have both a very low delayed neutron fraction andvery low temperature reactivity feedbacks (see Chapter 6 for an in-depth dynamic analysis ofthe Energy Amplifier Demonstration Facility, EADF).
Prof. Carlo Rubbia suggested that this pilot experiment, which will be the first example ofADS component coupling at real power, could be performed on the TRIGA (Training,Research, Isotopes, General Atomics) reactor [88] at the ENEA-Casaccia Centre (Italy), anexisting pool reactor of 1 MW thermal power, cooled by natural convection of water in thereactor pool.
5.1 Description of the TRADE Facility
The TRADE experiment is based on the coupling of an upgraded commercial protoncyclotron with a solid tantalum target, surrounded by the aforementioned reactor core in asubcritical configuration. This is achieved by removing the core’s innermost fuel ring (ring B)and the loading / unloading of the core’s outermost fuel ring (ring G) to reach the desiredsubcriticality level in small reactivity steps.
The spallation target will be hosted in the central thimble, at present used for high neutronflux irradiation. The target performance levels will be limited by the geometry of theirradiation channel; in spite of this, an adequate power deposition in the target (10-40 kW)should be achieved. For this reason, natural and forced convection cooling of the target shouldbe envisaged. Figure 5.1 shows the main elements of the coupling in the reactor area (a) and aclose-up view of the core and the entering beam-line (b), where the target in the centralthimble may be seen. These figures are graphical representations of the detailed FLUKA /EA-MC model used to simulate the behaviour of the reactor, the results of which are detailedin this chapter.

Chapter 5 The TRADE Experiment
113
Figure 5.1. View of the main elements in the reactor area (a) and the TRIGA core (b) of TRADE.
5.1.1 Experimental Set-upDue to the modularity of the TRIGA reactor, different fuel rod subcritical distributions andcontrol rod arrangements are possible. The chosen reference core configuration for theanalyses (Figure 5.2) is characterised by:
∑ The central channel (future spallation target);∑ 6 fuel rods removed from ring B (water);∑ 9 fuel rods in ring C (+3 control rods);∑ 18 fuel rods in ring D;∑ 24 fuel rods in ring E;∑ 28 fuel rods in ring F (+1 source channel, +1 control rod);∑ 23 fuel rods in ring G (+11 graphite pins, +1 rabbit channel, +1 loop channel).
The core consists of an annular structure, with six coaxial cylindrical rings of fuel elementsplus one central element, immersed in water which serves as the coolant (Figure 5.2). Adetailed description of the reactor can be found in [89]. The reactor and the experimentalfacilities are surrounded by a concrete shield structure and the core and reflector assembliesare located at the bottom of an aluminium tank (190.5 cm diameter). The overall height of thetank is ~7 m, thus the core is shielded by about 6 m of water. The core, surrounded by thegraphite reflector, consists of a lattice of fuel elements, graphite rods and control rods. Thereare 127 channels divided in seven concentric rings (1-36 channels per ring). The channels areloaded with fuel rods, graphite rods and control rods depending on the power level required.
The diameter of the core is 56 cm, while the height is 72 cm. Neutron reflection is providedby graphite contained in an aluminium tank which is surrounded by 5 cm of lead acting as a

Chapter 5 The TRADE Experiment
114
radiation and thermal shield. An empty aluminium tube (15 cm diameter and 0.6 cm thick)traverses the graphite reflector tangentially to the reactor core for thermal flux irradiations.The core components are contained within top and bottom aluminium grid plates: the top gridhas 126 holes for fuel elements and control rods and a central thimble for high-fluxirradiations. The reactor core is cooled by natural convention of the water in the reactor pool.
Figure 5.2. TRADE experiment fuel distribution reference configuration [50].
The fuel elements consist of a stainless steel cladding (AISI-304, 0.05 cm thick, 7.5 g/cm3
density) characterised by an external diameter of 3.73 cm and a total height of 72 cm, end capincluded. The fuel is a cylinder (38.1 cm high, 3.63 cm in diameter, 5.8 g/cm3 density) of aternary alloy uranium-zirconium-hydrogen (the H-to-Zr atom ratio is 1.7 to 1; the uranium,enriched to 20% in 235U, accounts for 8.5% of the mixture in weight: the total uranium contentof a rod is 190.4 g, of which 37.7 g is fissile) with a metallic zirconium rod inside (38.1 cmhigh, 0.5 cm in diameter, 6.49 g/cm3 density) to improve the heat transfer inside the fuel.There are two graphite cylinders (8.7 cm high, 3.63 cm in diameter, 2.25 g/cm3 density) at thetop and bottom of the fuel rod. Externally two end-fittings are present in order to allow theremote movements and the correct locking to the grid. The control rods are made of graphitewith powdered boron carbide, where 10B is the actual neutron absorber, with a 20% naturalabundance and a thermal (n, a) cross-section of ~4000 b. The graphite rods are similar to the
control rods but without boron inside the central volume.

Chapter 5 The TRADE Experiment
115
5.1.2 Spallation Target DesignThe design of the spallation target is arguably the most challenging issue in TRADE. Sincethis is the first ADS experiment at real power, the interactions between high-energy beam andtarget and the coupling of the latter with the reactor core entail unprecedented problems innuclear core design. The presence of an external decoupled neutron source (the spallationtarget) and the beam energy deposition in it require detailed studies to assess the performanceof the experiment and guarantee safety during operation.
The design of the target has undergone several modifications since the initial proposal of asolid tungsten target, with a conical void to homogenously distribute the power deposited (andthe neutrons produced) along the inner surface. The accelerator would supply ~0.13 mA (atthe beginning-of-life (BOL)) of 110 MeV protons (~14 kW deposited in the target). Due todifficulties in the fabrication of the tungsten target and foreseen mechanical constraints (largestresses due to the concentrated energy deposition), it was proposed to use tantalum instead oftungsten [90]. Tantalum offers better machining and mechanical properties and similarneutronic characteristics, although it is considerably more expensive. The neutron yield for110 MeV protons is the same for both elements (~0.45 n/p), as are the current requirements[91].
Moreover, an energy upgrade for the accelerator was considered in order to improve thespallation neutron yield, reducing the current requirements, and allowing the possibility of thelater use of this machine as a booster for the large accelerator (at least 600 MeV) coupled tothe fast lead-bismuth cooled ADS prototype. The energy range between 140-300 MeV wasstudied [92], and 140 MeV was found to be optimal for efficient proton use (large numbers ofprotons escape the target for higher energies), target durability (shorter core lifetime withincreasing proton energies due to increasing radiation damage) and radioprotection riskassessment (increasing high-energy neutrons escapes with increasing proton energies), asexplained in 5.1.3.
Several geometrical options for the target were also analysed due to the very restrictinggeometrical and thermo-mechanical requirements. Up to ten designs of the cylindrical target(with a conical void inner surface) have been studied. For the final configuration, the neutronyield is ~0.75 n/p and the power deposited in the target is ~11 kW (smaller than for 110 MeVdue to the increase in neutron yield and source importance, j*).
Figure 5.3 shows the energy deposition in the TRADE core for an RZ view (a) and for an XYview (b), for a normalised beam current of 1 mA. The maximum energy deposition occurs atthe target contact surface with tip of the conical void (due to the Gaussian profile of the beamand the protons scattered at small angles towards the tip), reaching ~930 W/cm3 for thenominal beam current 0.08 mA (~12 kW/mA/cm3, beyond the scale in Figure 5.3(a)). The

Chapter 5 The TRADE Experiment
116
power density in the fuel pins ranges from 2 to 10 W/cm3 depending on the position and thepower required from the core. Notice the small energy deposition in the control and graphiteelements (Figure 5.3(b)). In any case, it is clear that the thermo-mechanical requirements ofthe spallation target are much greater than those of a conventional core due to a maximumpower density at least two orders of magnitude larger, thus the need for a detailed targetdesign.
Figure 5.3. RZ (a) and XY (b) energy deposition in the TRADE core for 1 mA of 140 MeV protons.
The activation of the target is a major concern for the experiment. The activity of the targetafter one year of operation for the reference configuration, i.e. ksrc ~0.977 and 200 kW of corethermal output, is ~242 TBq (Figure 5.4(a)), where the captures in tantalum (activationproducts) dominate the decay activity for ~10 years. Beyond 20 years, the spallation products,in particular hafnium (i.e. 172Hf), lutetium (i.e. 173Lu) and finally tritium dominate themedium-lived activity (< 100 years).
1x10⁻¹
1x100
1x101
1x10²
1x10³
1x10⁴
1x10⁵
1x10⁶
0.1 1 10 100
Tot
al a
ctiv
ity (
GB
q) p
er y
r of
irra
diat
ion
Decay time (yr)
Total spallation
Hf-172
Hf-175
Ta-182
H-3
Hf-173
Lu-174
Yb-169Hf-181
Total activity (a)
Total activation
Lu-173
1x10⁻³
1x10⁻²
1x10⁻¹
1x100
1x101
1x10²
1x10³
1x10⁴
1x10⁵
1x10⁶
0.1 1 10 100 1000
Tot
al a
ctiv
ity (
GB
q) p
er y
ear
of ir
radi
atio
n
Decay time (yr)
Activation W 110 MeV
(b)
Spallation W110 MeV
Activation Ta 110 MeV
Spallation Ta 140 MeVSpallation Ta110 MeV
Activation Ta140 MeV
Figure 5.4. Evolution of the activity for: (a) the Ta 140 MeV target, compared to the W target (b), for TRADE.

Chapter 5 The TRADE Experiment
117
It is worthwhile to compare the total activity for different target designs. Figure 5.4(b) showsthe lower activity from activation products for the tungsten target with 110 MeV protonscompared to the tantalum target with 110 MeV and 140 MeV protons. The lower capturecross-section of the former entails less neutron captures in the target, and therefore lessactivation products.
5.1.3 Radioprotection AspectsAnother important and unusual aspect of the design of an ADS facility is the radioprotection.The impact of particles escaping the beam transfer line (BTL), the bending and focusingmagnets and the core, due to losses during normal operation as well as for accident scenarios,requires detailed study to guarantee the safety of the staff working in the facility.
An exhaustive analysis of the BTL shielding requirements to keep the dose to workers belowan acceptable and legal maximum (10 mSv/h) was performed [93], considering normal losses(1 nA/m per mA of beam current in the straight section and 100 nA/m/mA in the bendingmagnets). Several shielding materials and thicknesses were analysed as well as the doses inseveral accident conditions [94].
The results obtained for different shielding and beam pipe materials are summarised in Table5.1. The use of borated barite concrete was recommended because of its larger density (3.5g/cm3 compared to 2.4 g/cm3 for conventional Portland concrete), the considerable total cross-section of barium for high and epithermal energies (particularly, the capture resonances of135Ba) and the absorption of the thermal neutrons through the (n, a) reaction in 10B (20% ofnatural boron). The reference configuration (140 cm of barite concrete with a 2 mm stainlesssteel beam pipe) gives an acceptable dose rate at the surface of the BTL shielding, unlike thewater shielding case analysed in [95], which reaches 70 mSv/h for 20 cm of iron followed by120 cm of water.
The effects of the different shielding materials on the neutron energy spectrum may beobserved in Figure 5.5. The effect of the large total macroscopic cross-section for iron at high-energies produces a shift of the neutron flux (due to inelastic processes such as spallation)towards the fast region (103-106 eV), where the total cross-section is smaller compared toother shielding materials. The resonance in 54Fe at ~10 keV may be clearly seen for the caseswhere a significant amount of iron is used.
The barite concrete also to reduces significantly the high-energy neutron flux by producingspallation in barium and latter capturing those neutrons at lower energies. Since the dose isdominated by the high-energy component of the neutron flux, the use of barite is a veryefficient method of reducing the neutron-induced dose.

Chapter 5 The TRADE Experiment
118
Table 5.1. Effective dose due to 1 nA/m losses in the TRADE BTL for different shielding configurations.
Shielding Configuration Beam pipe Effective dose atthe surface (mSv/h)
Eff. dose 5 m fromthe surface (mSv/h)
1 m normal concrete 8 mm Al 350 641 m barite concrete 8 mm Al 100 18
1.4 m barite concrete 8 mm Al 9.5 2.41.4 m barite concrete 8 mm AISI304 7.9 1.81.4 m barite concrete 2 mm Al 8.3 1.9
1.4 m barite concrete (ref. config.) 2 mm AISI304 7.5 1.720 cm Fe, 1.2 m barite concrete 8 mm AISI304 3.7 0.820 cm Cu, 1.2 m barite concrete 8 mm AISI304 3.2 0.820 cm Cu, 1.2 m barite concrete 2 mm Al 3.9 0.9
5 cm Cu, 15 cm 10B-poly, 1.2 m barite conc. 2 mm Al 10.5 2.420 cm 10B-poly, 1.2 m barite concrete 2 mm Al 10.8 2.5
20 cm Fe 1 m H2O, 20 cm Fe 2 mm Al 33.2 7.720 cm Fe 1 m 10B-H2O (B 6.7% at.), 20 cm Fe 2 mm Al 34.6 8.1
20 cm Fe, 1 m H2O 2 mm Al 70 16.31.4 m Fe 2 mm Al 1 0.2
2 m barite concrete 2 mm AISI304 0.4 0.1220 cm Fe, 1.8 m barite concrete 8 mm AISI304 0.2 0.0620 cm Cu, 1.8 m barite concrete 8 mm AISI304 0.2 0.06
1x10²
1x10³
1x10⁴
1x10⁵
1x10⁶
1x10⁷
1x10⁻¹ 1x100 1x101 1x10² 1x10³ 1x10⁴ 1x10⁵ 1x10⁶ 1x10⁷ 1x10⁸
Neu
tron
flux
(n/c
m2/
s/m
A)
Energy (eV)
140 cm barite concrete
20 cm iron - 120 cm water
20 cm iron -100 cm water - 20 cm iron
140 cm iron
Figure 5.5. Neutron flux spectrum for different BTL shielding configurations.

Chapter 5 The TRADE Experiment
119
A delicate issue in the design of the BTL is the design of the bending and focusing magnets,which are needed to drive the proton beam into the core. In principle, the BTL includes a setof permanent samarium-cobalt (Sm2Co17) bending magnets. The magnetic field produced bythese magnets is rather sensitive to the radiation damage, thus a study of the demagnetisationdue to the ~4¥106 Gy/yr/mA expected dose was performed [96], and an acceptable magneticfield loss (below 0.1% per year) was found. On the other hand, the effective dose due to thelosses in the bending magnets during normal operation and in an accident scenario (collisionof the proton beam on the magnet) were found to be unacceptably high (~30 mSv/s/mA forthe latter case), requiring important changes in the BTL layout in order to shield theseelements.
5.1.4 Significance of TRADE towards an ADS DemonstrationIn order to be a representative experiment for the validation of the ADS concept, severalrequirements have to be met, defining certain parameters, such as the choice of the externalneutron source. A core power of several hundred kW is needed to explore the dynamics,reactivity control and power monitoring in an ADS, from a source dominated regime of krsc ª0.9 to a reactor feedback dominated regime krsc ª 0.99. The use of ~140 MeV protons issuggested after considering several factors. In order to explore deeply subcriticalconfigurations higher proton energies (e.g. 300 MeV) would be advisable, due to the lowertarget energy deposition for the same subcriticality and core power levels (Figure 5.6). Thehigher j* and proton range in the target material (thus, spreading the energy deposition) forhigher proton energies are responsible for these enhanced characteristics. Nevertheless, thelimited size of the spallation target and the high-energy proton leakage into the core [92], theaccelerator cost and the size of the BTL magnets and the radioprotection problems posed bythese for higher energies [93] indicated ~140 MeV as an optimum. Moreover, this protonkinetic energy allows the reactivity range planned for XADS to be explored withoutexceeding the maximum power level in the target (~30 kW) for a nominal power output in thecore of 200 kW. It would also permit deeply subcritical configurations (i.e. krsc ª 0.90) to beexplored at 200 kW for short periods of time (~50 kW in the target), or during longer periodsat the expense of a lower core power.
In terms of neutron spectrum, the thermal spectrum in TRADE allows some experimentsrepresentative also of a fast neutron spectrum to be performed. In fact, although the kineticparameters of TRADE and of a fast neutron spectrum are very different, their kinetic responseto perturbations are similar, except for the shifting to lower frequencies of the thermal systemtransfer function (due to longer neutron lifetimes), as presented in Figure 5.7. In fact, theresponses to perturbations in reactivity increase in parallel (the thermal system being lesssensitive to higher frequencies) until they reach their respective plateaux, where both systems

Chapter 5 The TRADE Experiment
120
present the same response for small reactivity changes at low frequencies. For a reactivitydrop of –5000 pcm (approximately the worth of a control rod) the magnitude of the transferfunction is very close after the response saturates (at ~100 kHz for the fast and ~300 Hz forthe thermal system).
Figure 5.6. Reactivity change for different subcritical configurations and proton energies [97].
Figure 5.7. Transfer function for different perturbation frequencies in a TRIGA core and in MUSE [98].

Chapter 5 The TRADE Experiment
121
These features allow the dynamic behaviour of an ADS to be investigated and validatedindependently from the neutron spectrum and make the TRADE experiment a naturalsuccessor to the FEAT, TARC and MUSE experiments and an essential precursor to a futurehigh-power ADS experiment.
The design and handling of the spallation target, the establishment of licensing procedures forADS, the analysis of the impact of the BTL in the reactor building and the development ofspecific detectors are also very relevant issues towards the experimental demonstration of afast ADS.
Moreover, the intrinsic safety of the TRIGA reactor in terms of temperature effects may beapplied to the TRADE experiment. The power and temperature coefficients for a core powerrise from a cold start to 200 kW are ~–3.0 pcm/kW (–6.8 pcm/K), and from 200 kW to 500kW are ~–2.8 pcm/kW (–14.2 pcm/K) [50]. The large negative values of these reactivitycoefficients are related to the choice of the fuel. This fuel design presents a larger Dopplerbroadening compared to oxide fuel due to the large amount of hydrogen, producing a highepithermal flux. This fact, together with a high chemical and mechanical stability, and anefficient retention of the volatile FFs, qualify this fuel as an excellent one for high-powerdensity facilities.
5.1.5 Experimental ObjectivesThe experiments relevant to ADS development to be carried out in TRADE may concern thefields presented in the following, non-exhaustive, summary:
∑ The dynamic regime: the possibility to operate at some hundred kW of power and atdifferent subcriticality levels (0.90 £ ksrc £ 0.99) will allow the dynamic behaviour of thesystem vs. the neutron importance of the external source to be validated experimentally.
∑ Subcriticality measurements at real power in order to obtain relevant information on theoptimal subcriticality level of a full-scale ADS.
∑ Correlation between reactor power and proton current. This correlation can be studied atdifferent subcriticality and power levels.
∑ Reactivity control by different means and possibly by neutron source importancevariation, keeping the proton current constant. In principle, this can be achieved bychanging the neutron diffusion properties of the buffer medium around the spallationsource (e.g. using different materials in the empty innermost fuel ring close to the target).
∑ Start-up and shut down procedures, including suitable techniques and instrumentation.∑ The study of the impact of beam failures in the behaviour of the core is of major
importance for ADS. TRADE presents the advantage of lower response frequencies thatmake possible the study of slower dynamic feedbacks than in a fast ADS.

Chapter 5 The TRADE Experiment
122
Moreover, an important feature of the TRADE set-up is the possibility to carry out, before thecoupling with the accelerator, a preliminary experimental campaign by inserting into thecurrent central thimble a known standard neutron source, and performing static and dynamicmeasurements for different subcriticality levels. For example, for the second type ofmeasurements, the configuration of the TRIGA reactor allows the application of a widevariety of techniques devoted to the determination of the subcriticality level, such as sourcejerk, pulsed neutron source analyses, rod drop and modified source multiplication. This set ofexperiments will provide a link with the MUSE experiments and characterise the subcriticalcore from a safety point of view. In fact, the experiments in TRADE will benefit from theextensive experimental techniques development performed in the zero-power MUSEexperimental program, since most of the experimental techniques are directly applicable, inparticular in the domain of reactivity level measurement and monitoring.
5.2 Neutronic Characterisation
The description of the subcritical and critical configurations illustrates the core layout for thedifferent experiments and their comparison evidences the fundamental differences withrespect to the behaviour of the neutron population inside the core for different ksrc values. Thedetermination of the neutronic characteristics of these configurations is essential in order topredict their behaviour during operation and understand the experimental results.Furthermore, precise understanding of the behaviour of the neutron population in the systemmay give an insight into the transmutation potential of such systems.
Several neutronic parameters of the proposed TRADE configurations were analysed using theFLUKA / EA-MC Monte Carlo code, including realistic models of in-vessel structures, whichmay affect the overall neutronics. An extensive study of these aspects was published in [99].
The analysis of the spallation neutron population is also a necessary step for the design of thesystem, since the distribution is essentially different and independent from that for fissionneutrons.
5.2.1 Subcritical ConfigurationsThree subcritical core configurations were chosen to analyse the behaviour of the reactor atdifferent levels of subcriticality, as future candidates for the experimental phase. Two otherworking conditions were also analysed to compare with the previous ones and to assess thecore behaviour in different thermal conditions:

Chapter 5 The TRADE Experiment
123
∑ A reference configuration (FC1) consisting of 102 fuel rods (reference core configurationwith the 3 control rods withdrawn, i.e. fuel follower inserted) resulting in a ksrc ª 0.977,operated at 200 kWth and cooled by natural convection.
∑ A second configuration (FC2) consisting of 107 fuel rods (FC1 with 5 additional fuelrods in ring G, i.e. 28 fuel pins in that ring) resulting in a slightly subcritical core, i.e. ksrc
ª 0.988, operated at 200 kWth and cooled by natural convection.∑ A third configuration consisting (FC3) of 79 fuel elements (FC1 without fuel rods in
ring G, and the control rods partially inserted) resulting in a deeply subcritical core, i.e.ksrc ª 0.901, with the spallation target cooled by forced convection.
∑ A critical core configuration (FC4) consisting of 108 fuel rods (FC1 with the controlrods at critical level, as in FC3) operated at different power levels (i.e., 200 kW, 500 kWand 1 MW) and cooled by natural convection has been also analysed to compare with thesubcritical ones.
∑ Studies of the different configurations operating at higher power ratings (500 kWth and1 MW) in order to analyse the thermal-hydraulic characteristics of both the core and thespallation target were also performed. The average fuel temperature for the three powerlevels analysed, i.e. 200 kW, 500 kW and 1 MW, would be Tfuel ª 114 °C, 174 °C and321 °C.
5.2.2 Nominal Parameters
The main neutronic parameters for the three TRADE subcritical configurations, in addition tothe critical case for comparison purposes, are summarised in Table 5.2. Even though TRADEwill operate with control rods, the source multiplication coefficient of 0.977 (different to thevalue of keff ª 0.974) was chosen to avoid criticality conditions with adequate safety margins,under all normal conditions as well as for transient and accident conditions, like in a fast ADSprototype. The general operation margins for an ADS may be summarised in three differentlevels: due to uncertainties in reactivity measurement (~1000 pcm), due to uncertainties inND (~1000 pcm) and due to a possible cold shutdown (absence of temperature feedbacks,~500 pcm).
If the experiment was to produce a constant reactor power (Pth) of 200 kW for the differentconfigurations, there would be a need to strongly increase the accelerator current (Ip), from0.05 mA for ksrc ª 0.99 to 0.42 mA for ksrc ª 0.90. Similarly, for the same configuration, anincrement in Ip would imply an increment in Pth and power deposition in the target. On theother hand, ksrc (and thus keff) would remain constant, since these parameters only depend onthe definition of the system and the nature of the fuel (keff) and also the source neutron spatialand energy distribution (ksrc) but not on the intensity of the source or the power produced in

Chapter 5 The TRADE Experiment
124
the core. Nevertheless, the reactor power would indeed affect the time evolution of themultiplication coefficients since it has a direct effect on the burn-up of the fuel, and thereforeon the evolution of its isotopic composition. For FC2, the value of j* is close to 1 since thesystem is very close to criticality, and therefore ksrc and keff are very similar. Even though thedifference between ksrc and keff becomes larger with decreasing multiplication, the value of j*
is in the reference case (FC1) is higher than in FC3 due to be better confinement of the sourceneutrons in FC1. The higher spallation neutron flux required for FC3 (Figure 5.8(a)) and themore diffusive medium in the core (23 fuel rods in FC1 are substituted by graphite rods inFC3) enhance the leakage of the spallation neutrons.
Table 5.2. Main neutronic parameters of the TRADE ksrc configurations.
Global parameters Symbol FC4 Referencecase FC2 FC3
Initial fuel mixture LEU UZrH UZrH UZrHInitial fuel mass mfuel (kg) 245.9 235.2 246.4 181.0
Initial U concentration mU/mfuel (wt.%) 8.5 8.5 8.5Initial fissile enrichment 235U/238U (at.%) 20 20 20Thermal power output Pth (kW) 200 200 200Proton beam energy Ep (MeV) — 140 140
Spallation neutron yield N (n/p) — 0.75 0.75Net neutron multiplication M — 38.3 71.0 9.8
Source multiplication coeff. ksrc 1.000 0.977 0.988 0.901Effective multiplication coeff. keff 1.000 0.974 0.988 0.891
Neutron source importance j* — 1.134 1.035 1.113Energetic gain G — 16.7 30.4 4.4
Gain coefficient G0 — 0.39 0.37 0.44Accelerator current Ip (mA) — 0.09 0.05 0.42
Beam power Pbeam (kW) — 12.7 6.8 58.7Core power distributions
Av. fuel power density Pth/Vfuel(W/cm3) 4.8 4.9 4.7 6.5
Spec. fuel power density Pth/mU(W/gHM) 9.7 10.0 9.6 13.3
Radial peaking factor Pmax/Pavg 1.45 1.48 1.46 1.76Axial peaking factor Pmax/Pavg 1.45 1.51 1.48 1.78
Table 5.3 summarises the neutron-induced reactions taking place in different locations in thewhole reactor core and also, specifically, in the fuel elements. The fuel is clearly absorbingthe majority of the neutrons (~64%), followed by the cooling water (~19%) and the cladding(~10%). Even though there is a large neutron leakage out of the core (as later described inSection 5.2.3 and illustrated by the neutron flux radial profile in Figure 5.8(a)), the smallnumber of neutron escapes (~0.02%) shows that the neutron population is well containedinside the system (by the ~6 m of water above the core, the graphite reflectors, the lead

Chapter 5 The TRADE Experiment
125
shielding and the concrete around the vessel). This fact implies that the system is rathersensitive to the insertion of empty channels, such as the beam tube, hence the need for severalbending magnets in the core to avoid neutron streaming upwards through the beam tube, Thesimilar values for neutron absorption in the different fuel rings show a rather flat radialneutron distribution in the core for the reference configuration. The importance of the (n, xn)reactions, unusually large for a thermal system, is related to the interaction of the spallationneutrons in inner fuel elements, where (n, xn) reactions account for ~1.6% of the total. Thelarge number of captures in the tantalum target (~2.4%) justifies the need for a precise studyof the activation of the target and its disposal scheme.
Table 5.3. Neutron-induced reactions in different parts of TRADE.
Reactor coreNeutron Absorption Inventory Neutron Absorption Inventory
Reactor vessel 0.001% Absorber rods 0.85%Neutron shield 1.03% Cladding 10.47%
Aluminium lining 1.22% Fuel ring C 9.59%Upper grid 0.04% Fuel ring D 12.89%Lower grid 0.06% Fuel ring E 15.17%
Spallation target 2.42% Fuel ring F 15.58%Primary coolant 19.07% Fuel total 63.74%Core reflector 0.77% Escapes 0.02%Main Nuclear Reactions Main Nuclear Reactions
Capture 58.55% (n, xn) 1.17%Fission 38.83% Others 1.41%
Fuel assembliesNeutron Absorption Inventory Neutron Absorption Inventory
LEUZrH fuel 68.85% Central Zr bar 0.09%AISI-304 cladding 12.01% Coolant 19.05%
Main Nuclear Reactions Main Nuclear ReactionsCapture 53.48% (n, xn) 1.20%Fission 44.91% Others 0.45%
5.2.3 Neutron Flux DistributionAs explained in Chapter 3, the power distribution in a subcritical system is rather sensitive tothe core’s intrinsic multiplication factor. As the latter increases towards unity (the criticalitycondition), the neutron flux higher harmonics disappear and the neutron spatial distribution inthe core tends towards the fundamental harmonic. Since the spallation neutron distribution iscompletely decoupled from the core, only the intensity varies for the different configurations,altering the neutron flux level and energy spectra in the inner regions of the core.

Chapter 5 The TRADE Experiment
126
5.2.3.1 Spatial Distribution
The radial (Figure 5.8(a)) and axial (Figure 5.8(b)) neutron flux distribution (200 kW reactorpower) for the high ksrc configurations, i.e. FC1 and FC2, as well as for the critical case, havemoderate peaking factors (fmax/favg µ Pmax/Pavg ~1.5), suggesting that the thermal-hydraulicproperties of the core are compatible with a presence of an intense spallation neutron sourcein the central channel. In the case of FC3, the high fluxes in the central regions of the coreproduce large peaking factors (~1.8), which is particularly important in the central fuelelements close to the spallation target.
As mentioned above, there is large neutron leakage from the core indicated by theexponentially decreasing radial flux in the outer regions in Figure 5.8(a). This is the result ofthe presence of higher harmonics (even for the critical case) in the neutron flux. The axial fluxdistributions for FC1, FC2 and FC4 exhibit similar behaviour, with a parabolic distributioncentred in the middle of the core and a moderate power peaking factor, due to domination bythe fission neutrons of the total neutron population. On the other hand, the effect of thespallation neutrons in FC3 is evident from the displacement of the neutron flux axialdistribution (the blue curve in Figure 5.8(b)), since they account for ~10% of the total neutronpopulation. Although the production of the spallation neutrons is isotropic, the scattering (andthus the transport) is forward peaked, as further illustrated in 5.2.3.3.
B
B
B
B
B
B
B
B
B
B
J
JJ
J
J
J
J
J
J
J
H
H
H H
H
H
H
H
H
H
F F F
F
F
F
F
F
F
F
1.0x10¹¹
2.1x10¹²
4.1x10¹²
6.1x10¹²
8.1x10¹²
1.0x10¹³
1.2x10¹³
1.4x10¹³
1.6x10¹³
0 10 20 30 40 50
Neu
tron
flux
(n/c
m2/
s)
Distance to the center of the core (cm)
B k 0.90
J k 0.97
H k 0.99
F k 1.0
(a)
2.0x10¹²
4.0x10¹²
6.0x10¹²
8.0x10¹²
1.0x10¹³
1.2x10¹³
1.4x10¹³
1.6x10¹³
-20 -15 -10 -5 0 5 10 15 20
Neu
tron
flux
(n/c
m2/
s)
Vertical distance to the center of the fuel pin (cm)
k 0.90
k 0.97
k 0.99
k 1.0
(b)
Figure 5.8. Radial (a) and axial (b) neutron flux for 200 kW and different subcriticality levels in TRADE.
Figure 5.9 shows the axial (a), and radial neutron fluxes for FC3 and a 1 mA proton beam.The parabolic neutron flux distribution in the Z direction may be seen, as well as the efficientreflection produced by the surrounding water. The effect of the inserted control rods is visiblein Figure 5.5(b), followed by a prompt homogenisation of the flux.
The neutron flux distribution for higher power levels, i.e. 500 kW and 1 MW, is essentiallythe same, only varying proportionally in intensity. That is, for FC1 producing a core power of

Chapter 5 The TRADE Experiment
127
500 kW the neutron flux in ring C is ~1.9¥1013 n/cm2/s and the power deposited in the target~28 kW. Obviously, the thermal-hydraulic requirements may change qualitatively, inparticular concerning the cooling of the spallation target, thus limiting the time the systemoperates at power levels beyond 200 kW.
Figure 5.9. RZ (a) and XY (b) neutron flux distribution of the TRADE core for ksrc ª 0.90 (FC3).
5.2.3.2 Neutron Energy Spectra
The analysis of neutron flux spectra is a necessary step in order to characterise the system.TRADE is essentially a thermal system, cooled and moderated by water and using a fuelmatrix rich in hydrogen. Despite the important fuel enrichment (20% 235U) and the rathersmall pitch between fuel elements (~2.35 mm for ~18 mm radius fuel elements), theabundance of hydrogen guarantees the thermalisation of the fission neutrons inside the fuel,therefore defining the very characteristic two-humped spectrum (the thermal and the high-energy humps).
Moreover, the presence of a water buffer region (empty fuel channels in ring B) causes aprompt energy loss for the spallation neutrons and their diffusion, increasing the efficiency ofthe source neutrons (and thus j*), as illustrated in the next section.
Figure 5.6 shows the neutron energy spectrum for different regions of the core for FC1. Thetarget presents a harder neutron flux and the energy spectrum shows a high-energy peakaround 2-3 MeV (the spallation peak) and the resonances of tantalum (in particular, the~15,000 b resonance at 4 eV). The thermal hump (Maxwell distribution) is due to the neutronsreflected into the centre of the core. The fuel regions present similar neutron energy spectra,with decreasing integral value with the distance from the centre of the core.
The graphite reflector and the lead shielding present well-thermalised spectra with almost nohigh-energy peak and a continuous epithermal region more than one order of magnitude

Chapter 5 The TRADE Experiment
128
smaller than their thermal peak. The effect of the 10B in the control rods is clear, absorbing thethermal neutrons in the region.
The presence of the spallation source produces a relative energy shift from the high-energyflux (target region) to the thermal distribution (reflector region) permitting, to a limited extent,the analysis of different elements under different spectrum conditions.
1x10⁷
1x10⁸
1x10⁹
1x10¹⁰
1x10¹¹
1x10⁻³ 1x10⁻² 1x10⁻¹ 1x100 1x101 1x10² 1x10³ 1x10⁴ 1x10⁵ 1x10⁶ 1x10⁷
Neu
tron
flux
(n/c
m2/
s)
Energy (eV)
Ta target
Ring B
Ring C
Ring D
Ring E
Ring F
Ring G
C reflector
Pb shielding
Neutron abs. F01
Figure 5.10. Neutron energy spectra for different parts of the core in TRADE.
5.2.3.3 Dynamic Behaviour of Fission and Spallation Neutrons
Study of the nature and behaviour of the spallation neutrons is essential in order to understandthe operation of an ADS, since, as explained in Chapter 3, the origin and behaviour of theseneutrons is decoupled from the multiplicative assembly. Figures 5.11(a), (b), (c) and (d) showthe differences in the time evolution (up to 1 ms) of the neutron population for differentTRADE configurations.
In the case of FC1, the neutron population is dominated by the fission neutrons after ~20 ms(Figure 5.11(a)). The spallation neutron population falls exponentially whereas the totalneutron population is sustained by fission. At 100 ms, the spallation neutrons account only for5% of the total neutrons and at 1 ms they account for 0.1%. Since this is a subcriticalconfiguration (ksrc ª 0.97), the total neutron population slowly decreases, although dying out

Chapter 5 The TRADE Experiment
129
at longer time scales. The spatial distribution and survival time of the spallation neutrons isstrongly correlated to j*, hence the importance of properly diffusing and confining theseinside the core. Of the total spallation neutrons at 1 ms, ~30% reached ring B and ~7% ring C(Figure 5.11(b)). There is a ~20 ms delay in reaching ring C before which only very high-energy neutrons, also producing spallation in the fuel, have reached this region. The neutronsreaching rings B and C after a few hundred ms are the ones which have been scattered to lowerenergies inside the spallation target. These neutrons have a lower probability of escaping thetarget (increasing the gap between the total number of spallation neutrons and those in the fuelrings), since they may be trapped in the resonance region of tantalum and eventually captured.
The time evolution of the neutron population for subcritical and critical configurations givesan excellent basis for understanding the multiplicative processes undergone in every case bythe system. Figure 5.11(c) shows the neutron population survival probability normalised toone source neutron. There is a clear qualitative difference between the source-dominatedregime (ksrc ª 0.90) and the fission-dominated regime (ksrc ª 0.97-0.99). In the first case, alarge number of spallation neutrons is required to maintain the multiplicative reaction (10% ofthe total), and their weight in the total neutron population, although falling exponentially, isstill remarkable after several hundred ms. The strong subcriticality of this configuration maybe observed from the negative slope of the evolution of the total neutron population, dying outin a few ms. On the other hand, FC1 and FC2 exhibit similar behaviour, except for a certaindifference in the neutron population lifetime. For these configurations, the spallation neutronsare quickly absorbed, producing the first fissions, which are later propagated by fissionneutrons throughout the multiplicative medium. Clearly, the neutron population dies awaywith a longer period the closer the configuration is to the critical state. Finally, in the case ofkeff = 1.0 the initial neutron source is amplified until the neutrons are completely diffused inthe core, after which the population remains approximately constant. This behaviour is similarto that of the fission neutrons in FC2.
Analysis of the neutrons’ behaviour for different materials in the buffer region indicates that,although the total neutron population remains unaffected by the material used, the leakagetime varies greatly, as illustrated in Figure 5.11(d). Since the neutron energy loss after ascattering reaction in lead is rather small, the neutrons escape ring B much faster (almost asquickly as in vacuum) through this buffer material. Therefore, the difference in spallationneutron migration time (correlated with the energy spectrum of these neutrons) suggests thepossibility of performing different experiments for different neutron energies, withoutaffecting the magnitude of the feedback.
This analysis is also very important to predict the response of the system to beam failures.Figure 5.11(a) shows a 35% decrease in the neutron population compared to the initial value

Chapter 5 The TRADE Experiment
130
(not considering the spallation neutron peak) after 1 ms. In this sense, TRADE will help tounderstand the dynamic coupling between a spallation neutron source and a reactor core fordifferent subcritical levels, thus response frequencies. It will be easier to perform thesedynamic measurements in TRADE than in EADF since, as explained later in Chapter 6, thedynamic response of the latter is significantly faster (99.9% of the neutron population hasdisappeared after 1 ms).
Figure 5.11. Time evolution of the neutron population up to 1 ms from the proton pulse: (a) for FC1, (b) for the
spallation neutrons in different positions in the core, (c) for different ksrc and (d) for different materials in ring B.
In all three subcritical cases (FC1, FC2 and FC3) the neutron population is dominated by thefission neutrons (roughly 97%, 99% and 90% of the total neutron population) and only in thedeeply subcritical FC3 configuration is the spallation neutron population noticeable in theoverall neutron distribution, causing an asymmetrical axial neutron distribution close to the

Chapter 5 The TRADE Experiment
131
spallation target, in particular for neutrons above 20 MeV, as illustrated in Figure 5.12. Theangle of asymmetry (following the forward-peaked elastic scattering for high-energies) of thesource neutrons is proportional to the proton beam energy, thus preventing the use of a higherenergy proton beam. Moreover, these high-energy neutrons are scarcely affected by thepresence of a moderating medium, and represent a major contributor to the outside dose andatom displacements in the reactor structures [99]. This is not the case for the protons, whichfor 140 MeV are entirely confined inside the target region, since most of their energy is lostthrough ionisation (~94% of the proton energy loss).
Figure 5.12. High-energy neutron distribution around the spallation target of TRADE for 140 MeV protons.
5.2.3.4 Burn-up Evolution
The simulation of the time evolution of the system, fuel core composition (fissile materials,MAs production, FFs, poisons etc.) is a characteristic feature of the EA-MC code. It may helpto assess the transmutation capability of TRADE for plutonium, MAs and LLFFs since thelevel of burn-up is high enough to produce measurable quantities of transmuted isotopes. Theevolution of the system has been calculated for one year of burn-up at different power levels,i.e. 200 kW, 500 kW and 1 MW. Over this period, the reactivity of the system dropped 2069pcm, 4482 pcm and 8220 pcm respectively.
Therefore, a core thermal output of 200 kW requires ~0.27 mA, and ~1 mA for 500 kW. Inthe case of 1 MW output power, this reactivity swing would have to be compensated by adrastic change in the accelerator current, requiring over 3 mA after one year. This requiredcurrent would entail unacceptable power depositions in the spallation target (Figure 5.13(a)),making this core power level impossible to reach safely for the FC1 configuration. On theother hand, an output power of 200 kW is attainable for the whole cycle, thus implying anaverage burn-up of ~5 GWd/tHM (Figure 5.13(b)). This average burn-up level represents ~12GWd/tHM burn-up in the central part of the core, i.e. 6% of the initial fissile material.

Chapter 5 The TRADE Experiment
132
0
50
100
150
200
250
300
350
0 50 100 150 200 250 300 350 400
Bea
m p
ower
(kW
)
Time (days)
Pth = 1.0 MW
Pth = 500 kW
Pth = 200 kW
(a)
BBBBBBBBBBBBBBBBBBBBBBB
BB
BB
BB
BBBB
BB
BBB
B
B B
BBBB
BB
BB
B
BB B
BB
BB
BB
JJJJJJJJJJJJJJJJJJ
JJJJJJJJ
JJJ J
J JJJJ J
JJJ J J J
JJ J
JJ
J JJ
J J JJ
J
J JJJ
HHHHHHHHHHHHHHHHHHHHHHH
HHHHH H H H H H H H H H
H H H H H H H H H H H H HH H H H H H H
H H
0
5
10
15
20
25
0 50 100 150 200 250 300 350 400
Ave
rage
bur
nup
(GW
d/tH
M)
Time (days)
Pth = 1.0 MW
Pth = 500 kW
Pth = 200 kW
(b)
Figure 5.13. Evolution of the beam power (a) and fuel burn-up (b) for FC1 in TRADE.
These results show that the desired subcriticality levels and power distributions can beachieved. In particular, TRADE may allow a significant range of subcriticality levels to beinvestigated, from ksrc ª 0.90 (source dominated regime) to criticality (core feedbackdominated regime) for an extended burn-up cycle. For a standard core output power of 200kW, the corresponding accelerator current, i.e. 90 mA for FC1, produces power depositions inthe target that can be removed. The final list of experiments to be performed in TRADE,which is still to be defined, includes a whole range of dynamic and reactivity measurements.However, the extended burn-up, the different neutron energy spectra in the core and thepresence of an intense spallation source may allow experiments specifically related to HLWtransmutation.
5.3 Transmutation Studies
As mentioned earlier, TRADE is primarily an experiment to validate the coupling of the mainelements of an ADS, without dealing with the transmutation aspects. However, it could alsobe used to investigate the transmutation potential of a thermal ADS, by means of dedicatedfuel pins loaded with different samples of LLFFs and TRUs. These experiments may bepossible due to the large amount of fissile material present in the fuel (20% 235U in theuranium), allowing extended burn-ups in the central part of the core of ~30% per MWth◊yr.Even though it may not be possible to reach such burn-up levels due to the limitations inpower deposition in the target (see Section 5.1.4), the ~6% burn-up level attainable at 200 kWis sufficient to produce results which could be chemically analysed. Moreover, the stabilityunder irradiation (e.g. helium production, swelling etc.) of matrices specific for transmutationcould also be studied.

Chapter 5 The TRADE Experiment
133
In order to analyse the viability of these experiments and to identify the key parameters in thetransmutation process, the most radiotoxic non-fissile isotopes present in the HLW wereplaced in the simulated TRADE core. By changing the conditions to which these isotopeswere subject (i.e. position in the core, transmutation matrix, neutron spectrum), the feasibilityof transmutation of these isotopes and the matrices was assessed.
5.3.1 Sensitivity of Transmutation to the Position in the CoreAs a first stage, several samples of the isotopes to analyse were placed in the central part ofeither a fuel pin or a graphite rod, in different positions in the core, in order to analyse thesensitivity of transmutation to the position in the core (and thus, to the variations in theneutron spectrum). The volume of these cylindrical samples was 65 cm3 (r = 1.815 cm, h =3.176 cm), a sixth of the volume of the fuel, and the number of atoms of the analysed isotopewas kept constant (~2.336¥1023 atoms/cm3) in order to analyse the transmutation potential ofthe isotopes, independently of abundance. The calculations were performed simulating 5¥106
protons in all the cases (~2¥107 transported neutrons) in order to obtain sufficient statisticalrelevance and comparable results. The FC3 set-up was chosen (ksrc ª 0.90) so as also to studythe effect of the spallation source on the transmutation potential.
The number of captures in several LLFFs for different positions in the core is presented inFigure 5.12(a). The value of the neutron flux is clearly vital to the transmutation rate since thenumber of captures decreases drastically with decreasing flux for most of the isotopes. On theother hand, 90Sr, 126Sn, 137Cs and, to some extent, 93Zr present rather low capture rates andseem unaffected by the flux change, showing the difficulties for transmuting these elements
(a)
B
B
B
B
B
B
B
B
J J J J J J J J
H HH
H H HH H
F
F
F
F
F
F
F
F
P
P
P
P
PP
PPR R R R R R R R
Q
Q
Q
Q
Q
Q
Q
Q
1
1
1
1
11
1
1F F F F F F F F
6
6
6
6
6
6
6
6
0.0x100
2.0x10¹³
4.0x10¹³
6.0x10¹³
8.0x10¹³
1.0x10¹⁴
1.2x10¹⁴
1.4x10¹⁴
0 10 20 30 40 50
Cap
ture
rate
(cap
ture
s/s)
Distance to the centre of the core (cm)
B Se-79
J Sr-90
H Zr-93
F Tc-99
P Pd-107
R Sn-126
Q I-129
1 Cs-135
F Cs-137
6 Sm-147
Ring B
Ring C
Ring D
Ring E
Ring F
Ring G
Graphite reflector
Lead shielding
B
B
B B
B
B
B
B
J J J J J J J JH H H H H H H H
FF
F FF
F
F
F
P P P P P PP P
R R R R R R R R
Q QQ
Q
Q
Q
1 11 1 1
1
1
1
F F F F F F F F
6
6
66
6
6
6
6
0.0x100
5.0x10¹⁴
1.0x10¹⁵
1.5x10¹⁵
2.0x10¹⁵
2.5x10¹⁵
3.0x10¹⁵
3.5x10¹⁵
4.0x10¹⁵
4.5x10¹⁵
5.0x10¹⁵
0 10 20 30 40 50
Cap
ture
rate
(cap
ture
s/s)
for 1
E14
n/cm
2/s
Distance to the centre of the core (cm)
B Se-79
J Sr-90
H Zr-93
F Tc-99
P Pd-107
R Sn-126
Q I-129
1 Cs-135
F Cs-137
6 Sm-147
BC
D EF
G
Graphite
Lead
(b)
Figure 5.14. Capture rate vs. position in TRADE for several LLFFs (a) and rate normalised to 1014 n/cm2/s (b).
For the isotopes that seem affected by the change in the integral value of the flux, there is anoticeable change in slope from rings F to G, clearly seen in Figure 5.12(b) by normalising to

Chapter 5 The TRADE Experiment
134
a common neutron flux. This change in slope, ~5 larger capture rate for some isotopesbetween the fuel region and the lead shield, is related to the neutron energy spectra in theregions, and it is particularly important for 99Tc and 129I, which are the most radiotoxicisotopes of the LLFFs, and for 147Sm and 79Se. As mentioned before, the elimination of 93Zr,107Pd and 135Cs may present some difficulties due to the low transmutation rates and thepresence of stable isotopes of these elements in the waste that would be activated.
Even though this system is not designed to maximise the transmutation efficiency, the half-lives of the isotopes in the reactor may give an idea of the reactor dwell time to transmute thegiven isotopes. These transmutation half-lives are normalised to an average flux of ~1014
n/cm/s (typical of the LWR) in order to compare the effects of the different spectra. Asmentioned before, only 79Se, 99Tc, 129I, 147Sm and perhaps 135Cs present reasonabletransmutation half-lives, as shown in Table 5.4. For example, the transmutation half-life for99Tc ranges from 51 years (ring B) to 25 years (lead shielding). On the other hand, isotopessuch as 90Sr, 126Sn and 137Cs display unreasonable dwell times (thousands of years), advisingagainst this method of transmutation unless more accurate and radically different capturecross-section data is measured.
Table 5.4. Transmutation half-lives for LLFFs in different positions in TRADE for 1014 n/cm2/s.
Isotope Ring B Ring C Ring E Ring F Ring G Graphite LeadDecay half-life (yr) Transmutation half-life (yr) for 1014 n/cm2/s
79Se 1.1¥106 yr 38 yr 32 yr 37 yr 33 yr 25 yr 12 yr 8 yr90Sr 29 yr 31125 yr 23472 yr 23037 yr 19534 yr 21032 yr 14914 yr 17821 yr93Zr 1.5¥106 yr 744 yr 710 yr 859 yr 714 yr 617 yr 387 yr 340 yr99Tc 2.1¥105 yr 51 yr 47 yr 50 yr 46 yr 36 yr 19 yr 15 yr
107Pd 6.5¥106 yr 147 yr 151 yr 162 yr 161 yr 135 yr 103 yr 99 yr126Sn 1¥105 yr 5632 yr 5188 yr 6238 yr 6025 yr 4135 yr 3104 yr 2463 yr
129I 1.6¥107 yr 54 yr 47 yr 55 yr 49 yr 36 yr 18 yr 13 yr135Cs 2.3¥106 yr 91 yr 83 yr 96 yr 86 yr 67 yr 37 yr 30 yr137Cs 30 yr 3411 yr 3274 yr 3890 yr 3712 yr 3072 yr 3072 yr 1538 yr147Sm 1¥1011 yr 32 yr 28 yr 31 yr 28 yr 21 yr 10 yr 7 yr
These results show the potential decrease in radiotoxicity achievable by inserting LLFFstargets in a 1014 n/cm2/s reactor core under different neutron spectra. Notice the large half-lifereduction for major isotopes in the HLW, such as 99Tc (t1/2 going from 2.1¥105 yr to 15 yr)and 129I (t1/2 reducing from 1.6¥107 yr to 13 yr). These reductions justify the efforts towardsdeveloping efficient transmutation strategies for LLFFs, since the feasibility is well-proven.Moreover, these results may be greatly improved by the definition of transmutation matricesfor these isotopes which would enhance capture inside the resonances, thus making use of theARC effect (see Chapter 3).
In order to illustrate the process undergone by the LLFFs samples in the core, Figure 5.15(a)shows the normalised neutron flux in the 99Tc sample for three positions in the core (in B, G

Chapter 5 The TRADE Experiment
135
and in the lead shielding), superimposed on the capture cross-section for this isotope. Thedeeper depletion of the neutron flux in the 5.6 keV (~5400 b) and 21 keV (~1600 b)resonances for the sample placed in lead can be clearly seen. This fact, together with greaterimportance of the thermal flux in this position, explains the higher transmutation efficiencyfor this element (as well as for 147Sm, 79Se, 129I and 135Cs) in the more epithermal and thermalfluxes. This hypothesis is corroborated by Figure 5.15(b), where the normalised capture ratefor these core regions are shown. The largest number of captures occurs due to the thermalpeak, especially for the samples in ring G and in the lead shielding followed by the resonanceregion, where the flux is heavily depleted (since there is no fuel to produce neutrons in thisenergy range). Therefore, the dilution of the LLFFs in the core or the design of transmutationmatrices in order to achieve an isolethargic flux in the resonance region, and could be placedin the periphery of the core, seem of great importance in order to maximise the transmutationrates.
0.000001
0.00001
0.0001
0.001
0.01
0.1
0.1
1
10
100
1000
10000
1x10⁻³ 1x10⁻² 1x10⁻¹ 1x100 1x101 1x10² 1x10³ 1x10⁴ 1x10⁵ 1x10⁶ 1x10⁷
Nor
mal
ized
neu
tron
flux
(arb
itrar
y un
its)
Tc-99 capture cross-section (b)
Energy (eV)
Ring B
Ring G
Pb shielding
Capture cross-section
(a)
0.0001
0.001
0.01
0.02
1x10⁻³ 1x10⁻² 1x10⁻¹ 1x100 1x101 1x10² 1x10³ 1x10⁴ 1x10⁵ 1x10⁶
Nor
mal
ized
cap
ture
rate
in T
c-99
(arb
itrar
y un
its)
Energy (eV)
Ring B
Ring G
Pb shielding
(b)
Figure 5.15. Normalised neutron flux (a) and capture rate (b) in the 99Tc sample for different positions in
TRADE.
For TRUs, the same procedure was used to analyse transmutation potential. Samples of themain TRUs fissionable isotopes, thus excluding the fissile isotopes, were placed in differentpositions and the absorption half-lives, normalised to a neutron flux of 1014 n/cm2/s, werecalculated (Figure 5.16(a)). Since the thermal capture cross-section is orders of magnitudelarger than the threshold fission cross-section for these isotopes and the system is dominatedby the thermal flux, the average reactor dwell time for these isotopes decreases with distanceto the centre of the core.
Nevertheless, Figure 5.16(b) shows that almost all the absorption reactions result in theemission of a photon, rather than fission, thus continuing the production of TRUs. In fact, thefission-to-absorption ratio gives a better indication of the transmutation efficiency for theseelements. Figure 5.16(b) shows these values for 237Np, 238Pu, 240Pu, 242Pu, 241Am, 243Am and244Cm in different positions in the core. The values are remarkably low for all the isotopes,

Chapter 5 The TRADE Experiment
136
with a maximum ratio of 0.26 for 238Pu in ring B. This isotope, together with 244Cm, givesratios twice the size of the rest, due to the smaller differences between capture and fissioncross-sections at low energies.
0
10
20
30
40
50
60
0 10 20 30 40 50
Abs
orpt
ion
half-
life
(yr)
for 1
E14
n/cm
2/s
Distance to the centre of the core (cm)
Np-237
Pu-238
Pu-240
Pu-242
Am-241
Am-243
Cm-244
B C
D EF
G
Graphite
Lead
(a) (b)
B
B
B B
B
B
BB
J
J
J
J
J
J
J
J
H
H
H H
H
H
H H
F
F
F F
F
F
FF
P
P
P P
P
P
P P
R
R
R R R
R
RR
1
1
11
1
1
1
1
0
0.05
0.1
0.15
0.2
0.25
0 10 20 30 40 50
Fiss
ion-
to-a
bsor
ptio
n ra
tio (a
rbitr
ary
units
)
Distance to the centre of the core (cm)
B Np-237
J Pu-238
H Pu-240
F Pu-242
P Am-241
R Am-243
1 Cm-244
B
CD E
F
G
Graphite Lead
(b)
Figure 5.16. Absorption half-life (a) and fission-to-absorption ratio (b) in different positions of the core of
TRADE for several TRUs.
All these isotopes follow basically the same trend, with larger fission-to-absorption ratio closeto the target, due to the presence of high-energy spallation neutrons, and a negligible ratio inthe periphery of the core, where the fission high-energy hump disappears and the thermalpeak gains importance (Figure 5.10). The larger significance of the thermal region, in whichcapture is favoured over fission, produces the decrease in the ratio for ring C compared torings D and E. In the case of 241, 243Am and 237Np, the fission ratio falls below 10% of all theabsorption reactions in any position of the core.
The shorter absorption times for most of these TRUs under a very thermal flux (in thegraphite reflector and lead shielding, below 10 yr) combined with their very low fission-to-absorption ratio implies an increase in the toxicity of the waste, since capture is enhancedunder these circumstances and so is the production of MAs, also depleting the neutronpopulation (thus requiring a higher enrichment to maintain the reaction). On the other hand, inthe regions where the fission-to-absorption ratio is slightly larger, the absorption half-lives aresignificant for most of these isotopes (compared to the ~1.7 yr for 235U), hindering theeffective elimination these isotopes.
Figure 5.17 illustrates the differences in the neutron flux and reaction rates for differentpositions in the core for 241Am (and, in general, for the studied TRUs). The neutron flux in thesample was normalised and plotted against the 241Am fission and capture cross-sections(Figure 5.17(a)), showing the decrease of the thermal flux (compared to Figure 5.10). Thischange in the flux is due to the large 241Am thermal capture cross-section (~1000 b) and

Chapter 5 The TRADE Experiment
137
explains the major role of capture in the reactions occurring in the 241Am sample. The shift ofthe importance in the flux between the high-energy regions and the epithermal and thermalregions shown in Figure 5.17(a), explains the drop in the fission-to-absorption ratio for themore distant positions (Figure 5.16(b)). Since the neutron spectrum becomes softer withdistance from the spallation source, this ratio decreases accordingly, as well as the energyrange where the absorption reactions occur. From Figure 5.16(b) it is clear that in order tomaximise the number of fissions in 241Am, and thus the transmutation efficiency of thedevice, a harder spectrum is required. This is the case for all non-fissile actinides, and thereason why fast systems are proposed for TRUs elimination.
0.000001
0.00001
0.0001
0.001
0.01
0.001
0.01
0.1
1
10
100
1000
10000
1x10⁻³ 1x10⁻² 1x10⁻¹ 1x100 1x101 1x10² 1x10³ 1x10⁴ 1x10⁵ 1x10⁶ 1x10⁷
Nor
mal
ized
neu
tron
flux
(arb
itrar
y un
its)
Am
-241 reaction cross-section (b)
Energy (eV)
Ring B
Ring C
Ring E
Graphite reflector
Capture cross-section
Fission cross-section
(a)
0.0001
0.001
0.01
0.02
1x10⁻⁴ 1x10⁻³ 1x10⁻² 1x10⁻¹ 1x100 1x101 1x10² 1x10³ 1x10⁴ 1x10⁵ 1x10⁶ 1x10⁷
Nor
mal
ized
reac
tion
rate
(arb
itrar
y un
its)
Energy (eV)
Capture (ring B)
Fission (ring B)
Capture (ring C)
Fission (ring C)
Capture (Pb shielding)
(b)
Figure 5.17. Normalised neutron flux (a) and reaction rate (b) in the 241Am sample for different positions in
TRADE.
5.3.2 Effect of the ModeratorThe neutron spectrum is a key factor in making possible the transmutation of HLW, thereforestudy of the effect of the moderator in transmutation is a necessary step to assess thefeasibility of nuclear waste transmutation and determine the optimal conditions for thisprocess.
A preliminary analysis was performed changing the nature of the coolant in the core in orderto evaluate its effect on the system. The effect of water was compared to the most commoncoolants and moderators in nuclear reactors, i.e. graphite, sodium, lead and helium. Althoughthe whole nature of the coolant was changed in every case, the neutron energy spectra in thefuel in ring C display a striking similarity (Figure 5.18(a)).
These results are related to the large quantity of hydrogen in the fuel, which softens theneutron spectrum independently of the nature of the moderator. Even though the high energyneutron peak is present in the fuel in all cases, the presence of an equally large thermal peak,in particular when using water or graphite as moderator, dominates the reactions occurring in

Chapter 5 The TRADE Experiment
138
this region (and, in fact, in the rest of the core, except for the spallation target) due to thegreater reaction cross-sections for this energy range. This effect is enhanced by the small fuelpitch (~2.35 mm), reducing the role of the moderator in the characterisation of the neutronenergy spectrum.
1x10⁹
1x10¹⁰
1x10¹¹
1x10⁻³ 1x10⁻² 1x10⁻¹ 1x100 1x101 1x10² 1x10³ 1x10⁴ 1x10⁵ 1x10⁶ 1x10⁷
Neu
tron
flux
in th
e fu
el (n
/cm
2/s)
Energy (eV)
Water
Graphite
Sodium
Lead
Helium
(a)
1x10⁵
1x10⁶
1x10⁷
1x10⁸
1x10⁹
1x10⁻³ 1x10⁻² 1x10⁻¹ 1x100 1x101 1x10² 1x10³ 1x10⁴ 1x10⁵ 1x10⁶ 1x10⁷
Neu
tron
flux
in th
e mod
erat
or (n
/cm
2/s)
Energy (eV)
Water Graphite Sodium Lead Helium
(b)
Figure 5.18. Neutron energy spectra in the fuel (a) and in the moderator (b) for different moderating materials.
The spectrum in the moderator is obviously affected by the neutron thermalisation in the fuel,presenting a highly isolethargic flux in lead or sodium, except at ~3 keV, where 23Na presentsan enormous resonance (the total cross-section increasing from 2 b to 400 b). The spectrum inthe helium coolant is similar to that in the fuel, except for a decrease in the high-energy peak(no fissile material). For graphite and water, the thermal Maxwell distribution clearlydominates the neutron spectra. The neutron flux in graphite, and in particular the thermal one,is one order of magnitude larger than in water due to the small total cross-section of 12Ccompared to 1H and the larger neutron diffusion length in graphite.
Hence, in order to study the effect of the moderator on the transmutation of HLW (and tosuggest possible experimental settings for TRADE), the moderator in rings B, C and D wasreplaced by the aforementioned elements, and a uranium-zirconium metallic fuel was used inrings C and D. The substitution of this inner buffer material produces a much morecharacteristic spectrum for every material, permitting an investigation of the HLWtransmutation sensitivity to the moderator.
The comparison of the neutron spectra in the fuel and moderator between the different cases isillustrated by Figure 5.19(a) and (b), respectively. In the case of the fuel, the high-energy peakis clearly the most relevant energy region of the spectrum. The contribution of the thermalpart to the energy spectrum is approximately two orders of magnitude smaller, except in thecase of water, where the thermal peak can still be perceived.

Chapter 5 The TRADE Experiment
139
1x10⁷
1x10⁸
1x10⁹
1x10¹⁰
1x10112x1011
1x10⁻³ 1x10⁻² 1x10⁻¹ 1x100 1x101 1x10² 1x10³ 1x10⁴ 1x10⁵ 1x10⁶ 1x10⁷
Neu
tron
flux
in th
e fu
el (n
/cm
2/s)
Energy (eV)
Water
Graphite
Sodium
Lead
Helium
(a)
1x10⁷
1x10⁸
1x10⁹
1x10¹⁰
1x10112x1011
1x10⁻³ 1x10⁻² 1x10⁻¹ 1x100 1x101 1x10² 1x10³ 1x10⁴ 1x10⁵ 1x10⁶ 1x10⁷
Neu
tron
flux
in th
e m
oder
ator
(n/c
m2/
s)
Energy (eV)
Water
Graphite
Sodium
Lead
Helium
(b)
Figure 5.19. Neutron energy spectra in the fuel (a) and inner buffer (b), for the UZr fuel and different buffers.
The effect of uranium resonances on the neutron flux can be clearly observed in the fuel, e.g.at 6 eV for 238U and at 0.2 and 1 eV for 235U, as a reduction of the neutron flux in those

Chapter 5 The TRADE Experiment
140
regions. In the case of sodium, the aforementioned elastic scattering resonance at ~3 keVproduces a deep depletion of the flux at this energy, since the neutrons at that energy arerapidly scattered to a lower energy (hence the fill-up region right after the resonance).
The use of graphite as a moderator produces a high fast and epithermal spectrum, decreasingwith energy, as can be clearly observed in Figure 5.19(b). This effect is due to the constant(~4 b) 12C total cross-section between 0.01 eV and 100 keV, which produces a neutronslowing down in small lethargy steps. This shift in the spectrum from the high-energy peak tothe fast and epithermal plateau is less pronounced in the case of sodium, lead and helium dueto their greater diffusion lengths. In fact, since helium is completely transparent to neutrons,there is a thermal contribution to the flux coming from the water around the reactor andaround the outer fuel rings (E, F and G).
5.3.2.1 LLFFs Sensitivity
The effect of these neutron energy spectra on the transmutation of 99Tc and 129I is presented inFigure 5.20. The capture rate for both isotopes when using water as a moderator is generally~3 times larger than in the other cases. Consequently, the isotope absorption half-life isgreatly reduced for this energy spectrum. Therefore, in order to efficiently transmute theseisotopes, and LLFFs in general, the neutron energy should be greatly moderated beforereaching the isotopes to transmute, by using a very efficient moderator, such as water, incompact systems or by using appropriate transmutation matrices to contain the isotopes andoptimise the neutron energy spectrum.
Moreover, the positive effect of hydrogen from the UZrH fuel on the transmutation rates isobvious by comparing Figure 5.14(a) and Figure 5.20(a). The capture rates in ring C in theformer are almost twice those in the latter. This fact translates into a larger half-life in the corebefore transmutation occurs (Figure 5.20(b)).
Hence, there is a clear need of a high thermal and epithermal (from 1-1000 eV) flux in orderto transmute these isotopes. In this type of compact, small-pitched core, these conditions maybe mainly achieved by using a hydrogen-rich environment. In addition, the effect of dilutionof the isotopes in specific transmutation matrices should be studied in order to maximise theefficiency of the process.
Nevertheless, the possibility of transmutation of LLFFs in high-flux reactors moderated by anelement showing a large diffusion length (addressed in Chapter 6) should not be neglected. Inthis scheme, the neutron energy flux may be tuned more precisely than in thermal systems toenhance the transmutation process.

Chapter 5 The TRADE Experiment
141
TC-99 I-1290.0x100
5.0x10¹²
1.0x10¹³
1.5x10¹³
2.0x10¹³
2.5x10¹³
3.0x10¹³
3.5x10¹³
4.0x10¹³C
aptu
re ra
te (c
aptu
res/
s)
Isotope
Water Graphite Sodium Lead Helium
(a)TC-99 I-129
0
100
200
300
400
500
600
700
Abs
orpt
ion
half-
life
(yr)
for 1
E14
n/cm
2/s
Isotope
Water Graphite Sodium Lead Helium
(b)
Figure 5.20. Capture rate (a) and transmutation half-life for a flux of 1014 n/cm2/s (b) for 99Tc and 129I.
5.3.2.2 TRUs Sensitivity
In the case of TRUs, the effect of the neutron energy spectrum imprinted by the moderator isclear for all the isotopes analysed. The fission rates when lead or helium is the moderator are50-100% higher compared to the case of water (Figure 5.21(a)). The fission-to-absorptionratios are also increased by the replacement of the water in the inner rings by a lessmoderating material, as illustrated by Figure 5.21(b). In fact, these ratios increasesignificantly for all the non-fissile isotopes, and in particular for 238Pu, 240Pu and 242Pu, whichare particularly important in transmutation schemes for different reasons.
Although 238Pu one of the least abundant plutonium isotopes in HLW, extended fuel burn-upsand use of MOX fuel would imply the accumulation of this isotope after fuel reprocessing.Additionally, in MAs elimination schemes, it would also be produced through the a-decay of242Cm (t1/2 ª 163 d; originated by neutron capture in 241Am becoming 242Am, which in turnmay undergo a b– decay, t1/2 ª 16 h). Finally, the use of plutonium-rich fuels in fast systemswould enhance the (n, xn) reactions in plutonium, in particular (n, 2n) in 239Pu, consequentlyincreasing the 238Pu stockpile. This isotope may then be responsible for a large part of theradiotoxicity of the spent fuel, since it presents a medium half-life (t1/2 ª 88 yr) and decaysemitting a highly ionising 5.5 MeV a-particle, thus producing a large quantity of decay heatin the first one hundred years after discharge. The case of 244Cm is somewhat similar, since itproduces a large amount of decay heat and should be eliminated in an efficient way in order toreduce the risks while handling the spent fuel. 240Pu and particularly 242Pu are gates to theamericium isotopes (241Am and 243Am respectively); therefore, neutron capture enhancementin the former would entail an increase in the production of the latter.
For 237Np, 241Am and 243Am, the number of fissions per absorbed neutron is relatively smallfor these case studies. Nevertheless, lead produces fission-to-capture ratios 2-3 times higherthan water and reduces the risk of further capture – decay chains. These rates may be

Chapter 5 The TRADE Experiment
142
sufficient to continuously reduce the MAs stockpile in a uranium-free HLW transmutationscenario, since the equilibrium concentration of these species in the thorium cycle is very low,as discussed in Chapter 3.
Np-237 Pu-238 Pu-240 Pu-242 Am-241 Am-243 Cm-2440.0x100
5.0x10¹²
1.0x10¹³
1.5x10¹³
2.0x10¹³
2.5x10¹³
3.0x10¹³
3.5x10¹³
4.0x10¹³
4.5x10¹³
5.0x10¹³
Fiss
ion
rate
(fis
sion
s/s)
Isotope
Water Graphite Sodium Lead Helium
(a)
Np-237 Pu-238 Pu-240 Pu-242 Am-241 Am-243 Cm-2440
0.1
0.2
0.3
0.4
0.5
0.6
0.7
0.8
Fiss
ion-
to-a
bsor
ptio
n ra
tio (a
rbitr
ary
units
)
Isotope
Water Graphite Sodium Lead Helium
(b)
Figure 5.21. Fission rates (a) and fission-to-absorption ratios (b) for non-fissile TRUs and different moderators.

Chapter 5 The TRADE Experiment
143
These results, combined with the large differences in the fission-to-absorption ratios betweenwater and the other moderators, show the advantages of large-diffusion length high-Amaterials as coolant and moderator in order to efficiently transmute TRUs, since fission isenhanced at high neutron energies.
Nevertheless, double capture transmutation strategies for 237Np and 241Am have beenproposed [100]. These strategies should be studied and compared against the fast-fissionapproach.
5.3.3 LLFFs Transmutation Sensitivity of a Dedicated MatrixThe use of dedicated matrices in order to transmute LLFFs in a thermal spectrum, such as theone produced in LWRs, has been repeatedly proposed as an economical approach to eliminatethis type of waste [9 & 101]. In particular, the use of a ZrH2 matrix loaded with differentquantities of 99Tc and 129I was studied in [102]. Here, the transmutation targets proposed inthe TARC experiment, i.e. KTcO4, PbBi(Tc) and PbI2, have been analysed and compared withthe ZrH2 mixtures, since the effect of the matrices and the isotope dilution are key factors inthe development of successful LLFFs transmutation schemes.
The transmutation efficiency of these matrices is summarised in Table 5.5. The resultspreviously presented for a sample of the pure isotope placed in ring C are also included forpurposes of comparison. The mass of the isotope contained in the sample is obviously acritical factor for the absolute transmutation rates. Nevertheless, the efficiency of the captureprocess clearly decreases with the concentration of the LLFFs. The isotope transmutationhalf-life decreases strongly with dilution for 99Tc and 129I. For the former, it goes from 47 yrfor a metallic target to 23 yr for 3% 99Tc diluted in lead-bismuth. The case of 129I is rathersimilar, showing that dilution in the matrix is necessary in order to achieve transmutation ratesthat may substantially reduce the stockpile of these elements.
Table 5.5. Transmutation rates for 99Tc and 129I in a thermal spectrum using different matrices.
Transmutation Matrix Isotopemass (g)
Capture rate(captures/s)
Capture rate pergram of isotope(captures/s/g)
Transmutationhalf-life (yr) for
1014 n/cm2/sMetallic 99Tc 262.0 g 7.7¥1013 2.9¥1011 47 yr
60% ZrH2 – 40% 99Tc 310.0 g 9.5¥1013 3.1¥1011 43 yrKTcO4 62.7 g 3.7¥1013 5.9¥1011 31 yr
99Tc
97% PbBi – 3% Tc 20.7 g 2.0¥1013 9.7¥1011 23 yrPure 129I 341.0 g 7.6¥1013 2.2¥1011 47 yr
40% ZrH2 – 60% CaI2 85.9 g 4.2¥1013 4.9¥1011 27 yr129IPbI2 35.2 g 2.2¥1013 6.3¥1011 24 yr
This dilution actually enhances the efficiency of the TARC process, avoiding the depletion ofthe neutron flux in the thermal region and especially in the resonance region. In this sense, the

Chapter 5 The TRADE Experiment
144
matrices proposed in [101] as a heterogeneous transmutation scheme (dedicated rods placedin the core) are rather efficient compared to the use of the pure isotope. On the other hand,since the LLFFs transmutation efficiencies not only affect the transmutation rates by whichthese isotopes are eliminated, but also importantly their concentration equilibrium, an efficienttransmutation method to be investigated may be the dilution of the LLFFs in the core reflectoror the homogeneous dilution of these isotopes in the fuel (although this last method wouldproduce lower transmutation rates due to the harder spectrum in the fuel).
Analysis of the isotopic evolution of the samples shows a slight reduction of theconcentrations of 99Tc and 129I, and the production of the daughter products 100Ru and 130Xe(Figure 5.22(a) and (b)). Even though the system is not optimised to transmute HLW, thetransmutation rates seem rather small, with large differences in the equilibrium concentrationsbetween the LLFFs and their stable transmutation products.
1x10⁻⁷
1x10⁻⁶
1x10⁻⁵
1x10⁻⁴
1x10⁻³
1x10⁻²
1x10⁻¹
1x100
1x101
0 50 100 150 200 250 300 350
Isot
ope
mas
s (kg
)
Time (d)
Tc-99
Ru-100
Tc-98
Ru-99
Ru-101
(a)1x10⁻⁷
1x10⁻⁶
1x10⁻⁵
1x10⁻⁴
1x10⁻³
1x10⁻²
1x10⁻¹
1x100
0 50 100 150 200 250 300 350
Isot
ope
mas
s (kg
)
Time (d)
I-129
I-127
Xe-130
Xe-128
I-130
Te isotopes
Xe-131(b)
Figure 5.22. Burn-up evolution for the 99Tc (a) and 129I (b) – ZrH2 transmutation matrices in TRADE.
The case of 99Tc shows a better transmutation rate than 129I, with a concentration of 100Ruincreasing faster than that of 130Xe. Additionally, 100Ru is a radiation-stable species, with alow capture cross-section (sth ª 8 b, with only one known resonance), thus the concentrationof daughter products (101, 102Ru) from this isotope is very low, and these isotopes are alsostable. In fact, the transmutation of 99Tc may be economically profitable, as suggested in[103], given that ruthenium is a very rare and expensive element and its production in largequantities in nuclear reactors seems feasible. For 129I, besides a lower production of itstransmutation daughter product, 130Xe, the presence of 127I in the HLW iodine (75% 129I, 25%127I) generates 128Xe. The fact that these are gaseous by-products complicates the process,since dissolution of iodine in the fuel would deteriorate the mechanical performance formedium and long burn-ups.

Chapter 5 The TRADE Experiment
145
Hence, a high concentration of stable daughter isotopes seems to be an essential prerequisitefor a successful transmutation scheme. Transmutation rates of the order of tens of kilogramsper year are required to reduce the stockpile of LLFFs, as presented in Chapter 2. In thissense, a combination of LLFFs dilution in a non-capturing matrix, high neutron flux withimportant thermal and epithermal spectra, extended burn-up cycles and positioning of thetargets at the periphery of the core (to avoid poisoning the reactor and increase the neutroneconomy) appears to be an optimal method to transmute LLFFs. In the case of 129I, the use ofsome type of powder matrix and the presence of an upper plenum may be necessary in orderto evacuate the gas released (i.e. xenon) and avoid further neutron capture.
5.3.4 MAs Multiple Absorption Transmutation SchemeThe possibility of eliminating the most abundant MAs in HLW (i.e. 237Np and 241Am) byinserting a suitable sample in a thermal spectrum has been proposed in [100]. This methodwould take advantage of these isotopes’ large capture cross-section at thermal energies (sth ª200 b and 800 b, respectively) and the very high fission cross-section (sth ª 3000 b) of theshort-lived daughter isotopes (t1/2 ª 2.1 d for 238Np and t1/2 ª 16 h for 242Am) and their furtherb–-decay.
In the case of 237Np, this implies the production of 238Np, rapidly decaying into 238Pu, which,through a second capture in a thermal spectrum, would produce the fissile 239Pu. For 241Am,the aforementioned neutron capture and b–-decay into 242Cm may be followed by an a-decay(t1/2 ª 162 d into 238Pu) or by a neutron capture (sth ª 200 b) to produce the readily fissile243Cm.
These multiple absorption schemes, although quite indirect and neutron expensive methodsfor transmuting these species, should still be evaluated as possible alternatives to eliminatethese isotopes. Figure 5.23(a) and (b) illustrate the isotope evolution applying this method, for237Np and 241Am, respectively, showing a reduction of ~6% in these isotopes during a oneyear burn-up cycle at 1 MW. On the other hand, the concentration of 238Pu, and hence 239Pu,for both cases is rather different. In fact, this transmutation approach seems more feasible for237Np given that the concentration of the fissile 239Pu is approximately one order of magnitudehigher than in the case of 241Am.
Moreover, Figure 5.23(a) shows small concentrations of ‘parasitic’ TRUs, such as 234U,originating from the a-decay of 238Pu (t1/2 ª 88 yr), and the inevitable 240Pu, which, in turn,enhances the production of more MAs. Alternatively, enhancing neutron capture in americiumseems to complicate the elimination of the HLW, diversifying the nature of the elementsinvolved (Figure 5.23(b)). The production of 242*Am (the first isomeric state; thermalbranching ratio ~20%) is favourable, since this is a very fissile isotope (fisssth ª 10,000 b). In

Chapter 5 The TRADE Experiment
146
contrast, the short-lived 242Am (ground state) rapidly decays either by b– emission or byelectron-capture. In the first case 242Cm is produced, which rapidly reaches its equilibriumconcentration due to its short half-life, and consequently produces an equal amount of 238Pu.The electron-capture process in 242Am, responsible for a noticeable generation of 242Pu,combined with neutron capture in 242*Am (captsth ª 2,000 b), produces more 243Am. Thisisotope is the gate to 244Cm, whose medium half-life (t1/2 ª 18 yr) and energetic a-decay (5.8MeV) gives it a major role in the high radiotoxicity of this fuel.
1x10⁻⁶
1x10⁻⁵
1x10⁻⁴
1x10⁻³
1x10⁻²
1x10⁻¹
1x100
0 50 100 150 200 250 300 350
Isot
ope
mas
s (kg
)
Time (d)
Np-237
Pu-238
Pu-239
Np-238
Pu-240
U-234
(a)1x10⁻⁶
1x10⁻⁵
1x10⁻⁴
1x10⁻³
1x10⁻²
1x10⁻¹
1x100
0 50 100 150 200 250 300 350
Isot
ope
mas
s (kg
)
Time (d)
Am-241
Am-243
Cm-242Pu-238
Pu-242
Cm-244Am-242*
Np-237
Pu-239
Pu-240
(b)
Figure 5.23. Burn-up evolution for the multiple absorption 237Np (a) and 241Am (b) transmutation schemes in
TRADE.
On the other hand, the use these special matrices to enhance the thermal flux, producingneutron capture and then produce fission in the daughter products before their decay, namelyin 238Np (t1/2 ª 2.1 d) and 242Am (t1/2 ª 16 h), would require very large thermal fluxes, giventhat for a flux of 1015 n/cm2/s even their fission half-lives (3.8 d and 2.7 d, respectively) aresignificantly longer than their decay half-lives.
Therefore, the application of this transmutation scheme for 237Np and 241Am seems feasiblealthough slow (large differences between equilibrium concentrations) and neutronicallycumbersome (the need for several neutrons in order to obtain a fission). It would also increasethe activity of the waste and hinder its further handling due to the production of largequantities of 238Pu and, in the case of 241Am, the hazardous 244Cm.

Chapter 5 The TRADE Experiment
147
5.4 Conclusions
The experimental demonstration of the ADS concept requires an intermediate step prior to thedevelopment of an industrial prototype of the device. TRADE will help the understanding ofseveral features specific to these systems, such as the behaviour of the spallation neutronsinside a multiplicative core at real power and the transition between a source-dominated and afeedback-dominated regime. The preliminary analysis of TRADE, shows that it could wellfulfil these requirements, given the compactness, versatility and intrinsic safety of the 1 MWTRIGA reactor. The accurate design of the solid tantalum spallation target and theradioprotection aspects of the facility (in particular the beam losses along the bendingmagnets) are major issues in the design of the experiment that are being carefully addressed.
The neutronic parameters of the experiment have been well characterised for differentsubcritical configuration set-ups, in order to understand the nuclear processes undergone inthe core. As mentioned before, the research to be carried out in TRADE is significant to thedevelopment of a high power fast-ADS. In particular, the dynamic experiments may beextendable to this latter system except for a shift towards lower frequencies. This is explainedby the slowing effect of the cooling water, particularly the buffer region around the spallationtarget.
Therefore, essential experiments, such as the behaviour of the system and the neutrondistribution in the core after a beam failure will be studied in TRADE. The acceptableduration of these events will also be analysed at different subcritical levels, thus, withdifferent response transfer functions. The lower response frequency will facilitate themeasurements and helping to predict the dynamic behaviour of a fast ADS.
Additionally, studies have been performed in order to evaluate the transmutation potential ofthe system and to propose several set-ups to perform multiple experiments directly related tothe transmutation of HLW.
These studies show the reduction of the half-lives for some important LLFFs, such as 79Se,99Tc, 129I, 147Sm and perhaps 135Cs, from decay half-lives of thousands of years to decades oftransmutation half-lives. This is not the case for isotopes like 90Sr, 126Sn, 137Cs and 93Zr,which due to their small capture cross-section and the lack of clear resonances or poorknowledge of the ND related to these isotopes, present discouraging transmutation half-lives.Another important issue concerning the transmutation of LLFFs is the need for dilution. Thisis a major requirement for TARC, since it is based on the resonance capture, and the excess inconcentration of the isotope to transmute would produce self-shielding effects.
For the non-fissile TRUs, it has been shown that softer neutron energy spectra decrease thefission-to-absorption ratio. The use of special matrices to enhance the thermal component in

Chapter 5 The TRADE Experiment
148
the flux require very large fluxes (larger than 1015 n/cm2/s) and if fission is not produced, themass of actinides destroyed in the cycle is negligible (~7% of the initial mass, in TRADE).This results in an actinide mixture which is significantly more radiotoxic (mainly due to 238Puand 244Cm) than the initial one.
These preliminary analyses show the need to study and design a long-burn-up, high-flux, fastneutron system in order to transmute HLW, in particular its most hazardous elements, i.e. theTRUs. This is the goal of the Chapter 6, where the safety aspects, neutronic characteristicsand transmutation schemes are studied in the context of the Energy Amplifier DemonstrationFacility (EADF).

Chapter 6 HLW Transmutation in Fast ADS
149
Chapter 6
HLW Transmutation in Fast ADS
As presented in Chapter 3, in the early 1990s the international community began to considerthe concept of ADS as a suitable alternative for the elimination of HLW. Several researchprograms were launched and led to the definition of several technological alternatives. Amongthese alternatives drawing international attention there was the Energy Amplifier (EA), a ~1.5GWth thorium-based lead-cooled ADS. This innovative inherently safe system was conceivedby Prof. C. Rubbia and developed by his group (Emergency Energy Technologies) at CERN,where work is still ongoing in the context of the aforementioned European Roadmap towardsthe experimental demonstration of ADS [46].
The last stage of the Roadmap foresees the commissioning of a low-power (100-300 MWth)experimental installation, considered a necessary step in order to demonstrate the industrialfeasibility of ADS. In particular, this demonstration facility, referred to as an eXperimentalADS or XADS, would aim to successively demonstrate the following:
∑ The coupling of a high-power accelerator with a subcritical fast reactor.∑ Qualification and operation of the innovative fuel.∑ The efficiency of plutonium, MAs and LLFFs transmutation.
There are several prototypes for this demonstrator with different design characteristics. Thefundamental difference between the two main candidates is the nature of the coolant. Theprototype proposed by Framatome, PDS-XADS, uses helium as the primary coolant, whereasthe demonstrator proposed by Ansaldo, Energy Amplifier Demonstration Facility (EADF,also known as LBE-XADS), is based on a lead-bismuth eutectic (LBE) coolant. Both presentadvantages and disadvantages, although in terms of safety (e.g. no separation betweenspallation target and coolant, and negative void coefficient) and transmutation efficiency (i.e.

Chapter 6 HLW Transmutation in Fast ADS
150
possibility to benefit from a highly isolethargic flux) the lead-cooled alternative seemsadvisable.
Consequently, this chapter is dedicated to the neutronic characterisation of the LBEexperimental facility (Energy Amplifier Demonstration Facility, EADF), and assessment ofthe transmutation potential of such a device for the reference fuel configuration. The burn-upevolution of the system is also analysed in detail since it plays a significant role in theassessment of this device as a future alternative for HLW elimination.
6.1 The Concept of the Energy Amplifier
The EA is the result of a ‘cross-fertilisation’ between the technology of modern particleaccelerators and that of nuclear power, in particular the development of fast neutron breederreactors and of fuel reprocessing. As previously explained, in an ADS the energy is producedas the result of nuclear cascades, rather than from a self-sustained chain reaction as in theconventional reactors. This is also the case for the EA, where all the nuclear processes in thecore are subsidiary to the operation of the accelerator. Relativistic protons produced by acyclotron or a LINAC initiate these nuclear cascades and the power produced is directlyproportional to the intensity of the injected beam. The probability of a criticality accident issuppressed since the device operates far away from criticality at all times. The underlyingphysical principles of energy amplification and the transmutation possibilities of the devicewere demonstrated in the FEAT and TARC experiments performed at CERN, summarised inChapter 3.
An EA module may consist of a 1500 MWth unit coupled with a 1-1.5 GeV proton acceleratorof 10-20 mA. A modular cyclotron was designed in order to fulfil this task, similar to the onecurrently operated in the Paul Scherrer Institute (PSI, Switzerland). In fact, an EA plant mayconsist of several ADS coupled with an extra accelerator to supply beam protons in the caseof a beam failure in one of the other accelerators.
Another relevant feature of this design is the removal by natural convection of the generatedheat inside the core, thus avoiding coolant pumps. As described in [1]: “The EA is a large,passive device in which a proton beam is dumped and the heat generated by nuclear cascadesis extracted, without other major elements of variability”.
A great asset of the EA is its potential for closing the fuel cycle, reducing the HLW stockpiledue to the fuel flexibility of the device. Moreover, the fuel itself needs no access during thewhole burn-up, and it may be sealed as a non-proliferation safeguard measure.

Chapter 6 HLW Transmutation in Fast ADS
151
6.1.1 Description of the SystemThe geometry of the EA, illustrated by Figure 6.1, is rather slim (~6 m diameter) and tall (~25m). The slenderness of the main vessel improves the uniformity of the flow of the liquid leadand of the natural circulation for heat removal, since the heat extraction is based on a naturalconvection-driven molten lead pool. There are four 375 MWth heat exchangers to transfer theheat from the primary cooling circuit to the intermediate heat transport system (Pb-Bieutectic). These are located above the core between the support cylinder and the walls of thevessel.
This device would operate away from criticality at all times (0.95 ≤ k ≤ 0.98), and the injectedbeam current would directly control the power produced. As mentioned earlier, the nominalproton current is approximately 12.5 mA; this means that 7.8¥1016 protons would beaccelerated up to a kinetic energy of ~1 GeV (at this velocity the protons become relativisticsince their velocity is ~0.875 times that of the speed of light in vacuum), and then sent into aliquid lead target to generate, through the spallation process, the neutrons needed to drive thenuclear reactions in the core. The nominal external power provided by the beam Pext ª 12.5MW, corresponding to an energy gain G = PEA/Pext ª 120.
The favourable characteristics of lead in terms of neutron transparency (large diffusion lengthand small energy loss after scattering) and small capture cross-section (208Pb is a doublemagic isotope), as described in Chapter 3, justifies the choice of molten lead as the coolant.The device would be operated in analogy with Fast Breeders3, by using fast rather thanthermal neutrons.
An important feature of the device is the use of natural convection alone to remove all theheat produced inside the core. Convection cooling has been widely used in pool-type reactorsat small power levels. It has been shown in [1] that an extension of this very safe method tothe very large power of the EA is possible, because of the unique properties of lead, namelyhigh density, large dilatation coefficient and large heat capacity. Convection is spontaneouslydriven by temperature difference; therefore circulation pumps are unnecessary, providing theEA with yet another safety feature. In the convective mode, a very large mass of liquid lead(~10,000 tonnes), with a large heat capacity moves slowly (≤ 2.0 m/s inside the core, about1/3 of this speed elsewhere) transferring the heat from the top of the core to the heatexchangers located 20 metres above and returning at a lower temperature (∆T ª –200 ºC)from the heat exchangers to the bottom of the core.
3 Fast breeders are generally liquid sodium cooled, at a maximum temperature of 600-700 ∞C. The boilingtemperature of lead is extremely high (1743 ∞C) and it is a passive element, in contrast with sodium, which isextremely reactive with any polar substance such as water.

Chapter 6 HLW Transmutation in Fast ADS
152
Figure 6.1. Schematic view of the 1500 MWth Energy Amplifier [1].
The EA may operate with a wide range of fuels, such as thorium-plutonium-based fuels, usingplutonium to drive the breeding of 233U from thorium (therefore reducing the plutoniumstockpile in the waste and producing fissile material). The EA may be particularly suitable foreliminating MAs given that it is a thorium-based subcritical fast system, hence, presentingvery low equilibrium concentrations for higher actinides subject to a fission-favourableenvironment. Furthermore, the addition of LLFFs in the reactor is foreseen in order totransmute these species into short-lived isotopes, by the means of the ARC method (seeChapter 3). The EA would initially be loaded with a mixture of actinide waste and thorium, inthe approximate ratio 0.16 to 0.84 by weight.
During operation, the actinides would be fissioned, while 233U would be progressivelyproduced. The bred 233U would compensate for the drop of reactivity due to the decreasingactinide mixture and that due to the build-up of FFs. Therefore, a balanced operation over along burn-up corresponding to five years of operation without external intervention would bepossible without loss of reactivity in the core.

Chapter 6 HLW Transmutation in Fast ADS
153
Thorium was chosen as the main fuel for the EA since the accumulated radiotoxicity relatedto this fuel cycle is much smaller than in the uranium cycle. The production of higheractinides during an operating cycle is greatly reduced compared with the use of 238U as thematrix of the fuel. Also, in terms of availability, thorium is more abundant and more widelyspread in the earth’s crust than uranium. The estimations of abundance presume ~6¥106
tonnes worldwide, which could produce 15,000 TW·yr of energy if used in EAs [1], about afactor of 100 larger than the known reserves of oil or gas and a factor 10 larger than coal. Thiswould correspond to ~12 centuries at the present world’s total energy consumption, i.e. 9405million tonnes of oil equivalent or ~4.83 TW·yr.
The nominal power of 1500 MWth would require 27.3 tonnes of mixed oxide fuel and the fueldwelling time is expected to be 5 years at full power. The device would benefit from anextended fuel burn-up of ~120 GWd/tHM, with almost constant reactor parameters (i.e. ksrc,thermal feedbacks and fuel composition), since the fissile material would be internallyregenerated inside the thorium fuel. Reference [1] shows that the captures due to FFs may becompensated by operating initially with a breeding ratio below equilibrium. Throughout theburn-up, the growth of the fissile fuel concentration would counterbalance the poisoning dueto FFs. In that case, neither refuelling nor shuffling (mainly due to the homogeneous fuelpower distribution) would be necessary for the specified duration of the burn-up. At the endof the burn-up cycle the spent fuel would be fully replaced and reprocessed.
6.1.2 EA Fuel Burn-up EvolutionAs explained in Chapter 3, the thorium-based fuel cycle presents many advantages comparedto the uranium-based one, from the availability of the resources to the production of higheractinides. In fact, the use of 232Th to breed fissile 233U entails very low equilibriumconcentrations of TRUs in the fuel, of the order of 10–8 times that of 232Th, as illustrated byFigure 6.2.
The low equilibrium concentration of TRUs in the thorium fuel has important implications fortransmutation. Any amount of these elements added to the fuel will be progressivelytransmuted until the equilibrium concentration is reached. Therefore, the plutonium and MAstransmutation rates in a thorium-based matrix are significantly larger, as elaborated later, thanusing uranium-based fuel, such as MOX fuel.
Figure 6.2 show the isotopic evolution with burn-up of a typical EA configuration, breeding233U from 232Th. The burn-up cycle extends to 120 GWd/t of fuel (~5 years) withoutrefuelling or shuffling. For this burn-up level, a small change in the mass of 232Th may beobserved due to the breeding process. The concentration of 233U slowly increases andcompensates for the neutron captures produced by the FFs, which are mainly responsible for

Chapter 6 HLW Transmutation in Fast ADS
154
the limitations in the duration of the burn-up cycle, and the actinides presenting small fissioncross-sections. A significant amount of 234U (~120 kg) is produced by the end of the cycle,and from it, an increasing mass of 235U (~12 kg at EOL) is produced. The production of 233Pastabilises around 30-40 kg, compensating the loss of 233U. Also 231Pa, 230Th, 232U and 236Ureach their equilibrium concentrations of the order of kg. Finally, TRUs, such as 237Np and238Pu, appear in very small concentrations, 150 g and 30 g respectively, showing the reducedlevel of TRU generation for an energy production of ~66 TW·h.
Figure 6.2. Isotopic evolution with fuel burn-up for a typical thorium-fuel EA configuration [1].
The very interesting perspectives generated by this system require the confirmation of a realsize experiment, since the operation and the technical details of a large power subcritical lead-cooled device have never been tested. In this context, the EADF is a necessary step to theapplication of fast system technology to HLW elimination and energy production.
6.2 The Energy Amplifier Demonstration Facility
The remarkable potentialities of the ADS concept, and, in particular, of the EA, to eliminateHLW drove several European political institutions to set up a Technical Working Group(TWG) whose primary task is to define common guidelines for the development of this

Chapter 6 HLW Transmutation in Fast ADS
155
technology. This TWG agreed on the need to build a demonstration facility of significantpower (~100 MWth) within ten years, in order to develop industrial strategies leading to theactual exploitation of the concept.
The scientific feasibility of these systems has been proven in previous experiments (seeChapter 3). Nevertheless, more experimental accuracy is needed both in nuclear physics andin ADS technology. For the former, the need for better and more comprehensive nuclear datafor a large variety of nuclei has been underlined in Chapter 4. Notably, the effect of theneutron cross-section discrepancies on the prediction of the ADS parameters, for a wide rangeof energies, is motivating the extensive experimental programme previously described (i.e.n_TOF). For the latter, the coupling of different ADS elements and the transition betweendifferent operating regimes will be investigated in the TRADE experiment, as described inChapter 5.
Therefore, the experimental programme to be carried out in the demonstrator can bedecoupled into two concepts: XADS (eXperimental Accelerator-Driven System) and XADT(eXperimental Accelerator-Driven Transmutation). The former is meant to demonstrate theoperation of the accelerator/spallation target/subcritical core layout in realistic conditions andwith sufficient power. The latter seeks to prove the capability to transmute various actinidesand LLFFs and to test and qualify innovative fuels for that purpose.
The basic parameter of the demonstrator is the thermal power output. This was set to ~100MWth by the TWG on the basis of transmutation rates of the order of tens of kg/yr. TheRoadmap for Developing ADS for Nuclear Waste Incineration [46] establishes that a largerpower output (for instance 300 MWth) would considerably complicate the realisation andoperation of the device and greatly increase its costs. On the other hand, a smaller system(~10 MWth) would reduce the HLW fraction undergoing transmutation and the power density;likely becoming insufficient to achieve significant changes in the fuel in a realistic time.
As previously mentioned, there are several candidate designs for the demonstrator. However,the LBE-cooled system has several great advantages. First, the coolant and spallation targetare the same material, so physical separation between them may be avoided. Secondly,several accidental conditions (e.g. loss-of-coolant accidents) may be handled better with thisdesign than with helium- or sodium-cooled ones.
6.2.1 Description of the EA Demonstration FacilityAs in the case of the Energy Amplifier conceptual design [1], the EADF core consists of anannular structure, immersed in molten LBE, which serves as the primary coolant andspallation target. The central annulus contains the spallation target unit, which couples theproton accelerator to the subcritical core, as may be seen in Figure 6.3. The core is arranged in

Chapter 6 HLW Transmutation in Fast ADS
156
a honeycomb array forming an annulus with eight coaxial hexagonal rings of fuel and dummysubassemblies.
The choice for the accelerator between a cyclotron, a LINAC or a combination of both has notyet been taken. In any case, the EADF design includes a multi-stage (2-3) 600 MeV, ~5 mAproton accelerator, which implies a 2-4 upscaling of existing machines (i.e. the cyclotron inPSI).
The reactor assembly presents a simple primary coolant flow path with riser and downcomerchannels. The core (heat source) is located below the riser channels and the heat exchangers(heat sink, at the top of the downcomer channels). This layout allows an efficient use ofnatural circulation of the coolant, the flow of which is enhanced by the additional injection ofargon bubbles. This method, based on the principle of gas lifting, keeps the coolant circulatingat a higher flow rate, the level of which may be controlled by the amount of gas injected [27].
The use of LBE as the primary coolant (Tmelting ~123 °C, Tboiling ~1670 °C, r ~10.5 g/cm3)permits the operation of the system at low temperature (compared to the use of pure moltenlead, Tmelting ~327 °C), reducing erosion/corrosion problems and creep damage in thestructures.
A synthetic organic diathermic fluid was chosen as the secondary coolant due to its chemicalstability with the primary coolant, good thermal properties at high temperatures, low vapourpressure and stability against radiolysis under radiation.
One of the main requirements in the design of the facility is the need to accommodatedifferent core configurations, containing MAs and LLFFs assemblies at different locationspresenting the required neutron flux level and energy spectrum. As detailed later, thiscapability is ensured by the nature of the coolant, presenting a long diffusion length andcontinuous isolethargic spectrum in small energy steps.
However, EADF initially seeks to demonstrate the technical feasibility of a fast neutron ADS,cooled by molten LBE, and not that of incinerating TRUs. Consequently, the use of the well-known Super-Phénix [104] type uranium-plutonium MOX fuel (SPX), instead of a thorium-based fuel, was adopted. This SPX has already been certified and operated in theaforementioned installation, and its behaviour in this particular context is well understood.
The need for great operational flexibility may also be better achieved without any electricalenergy generation constraints imposed on the system. Hence, the facility has been designed todissipate the generated heat to the external atmosphere. A more detailed description of EADFmay be found in [27].

Chapter 6 HLW Transmutation in Fast ADS
157
Figure 6.3. EADF front and top schematic views highlighting the main components of the device [27].
0.00 m
12.00 m

Chapter 6 HLW Transmutation in Fast ADS
158
6.2.2 Reference ConfigurationThe EADF has been conceived to produce a nominal output thermal power of ~80 MWth. Asexplained before, this is considered to be the minimum thermal output power in order for theexperiment to be representative for transmutation, since the objective of the device is not onlyto operate a fast ADS at real power but also to validate the concept of transmutation at largescale (of the order of kg).
The core basic fuel subassembly is an hexagonal cluster of 90 SPX MOX fuel pins (~20%plutonium). The pin diameter and active length are ~8.5 mm and ~87 cm, respectively. Thesefuel pins are subdivided in 4 radial zones consisting of the steel clad, intermediate gap region,the fuel pellet and a central void region (motivated by the large amount of gaseous FFs due toextended burn-ups).
The core is arranged in a honeycomb array forming an annulus with four coaxial hexagonalrings of 120 fuel subassemblies, as illustrated by Figure 6.4. The fuel core is itself surroundedby an annular array of four rings of dummy subassemblies, which are essentially empty ducts,in order to allow the irradiation of different test fuels. The total number of fuel subassembliesis 294, allowing the irradiation of a large number of elements at once. The core inner andouter radii are correspondingly ~31.5 cm and ~85.1 cm, with an outer diameter for the regioncontaining the dummy elements of ~1,278 cm.
Figure 6.4. EADF core cross-section showing the subassemblies and radii of the different regions [27].
The neutron yield of protons at 600 MeV is rather reasonable (~15 n/p), and helps to limit thefinal size of the machine. The power deposition in the target of 5 mA 600 MeV is ~3 MW,which entails the use of a liquid spallation target (LBE) in order to dissipate such a largeamount of heat without mechanical degradation. The interface between the beam line and thespallation target is one of the most complex decisions in the design. No choice has been made

Chapter 6 HLW Transmutation in Fast ADS
159
between using a ‘hot window’ of a high melting temperature material, such as tungsten,possibly cooled by an auxiliary cooling loop, and using the ‘windowless’ approach, byinserting the beam line directly into the target without a mechanical barrier.
The operating temperature for the primary coolant ranges from ~300 °C core inlet temperatureto ~400 °C core outlet temperature. Under these operating conditions the workingtemperatures remain far from the LBE freezing point (123 °C) and from the stainless steelcreep temperature (~566 °C) and even from the carbon steel creep threshold (~427 °C).
The fuel pin total length is 127.2 cm, of which 87.0 cm is active. The rest is made up of theupper (16.2 cm) and lower (15.0 cm) plenum, designed to collect the volatile LLFFs duringextended periods of burn-up. The outer diameter of the pin is 0.85 cm, with a stainless steelcladding thickness of ~560 mm.
The SPX fuel is a natural uranium (~82%) / plutonium (~18%) oxide (UPuO2), containingsome traces of both americium and neptunium isotopes. The plutonium contains ~71% fissileisotopes (mainly 239Pu), and thus is a classical Fast Breeder fuel (producing 239Pu fromneutron capture in 238U and a double b– decay in ~2.4 days). Therefore, the fissile enrichmentof the UPuO2 fuel is 13.33%.
6.2.3 Nominal Neutronic Parameters
The main neutronic parameters at the Beginning-Of-Life (BOL) for the EADF referenceconfiguration are summarised in Table 6.1. The reference fuel-loading scheme foresees ~3.8tonnes of the SPX fuel previously described. The simulations of EADF were carried out usingas a base a detailed geometrical model previously developed at CERN by the EET group.
As previously explained in Chapter 5, the value of ~0.96 for the source multiplicationcoefficient was chosen in order to avoid criticality conditions, with adequate safety margins.Particularly for EADF, the uncertainties in ND are larger than for a thermal system since sucha device operates is a less-known energy region. As elaborated in Chapter 4, there is poorexperimental information for many of the isotopes involved and even poorer for the energyregions above 1 eV (resonance and unresolved resonance regions, as well as for higherenergies). The discrepancies in ksrc found for isotopes such as 239Pu and 240Pu reached ~600pcm between EADF/B-VI.8 and JENDL-3.3 (see Chapter 4); thus the total discrepanciesbetween libraries for plutonium-rich fuels may reach 2000 pcm [73 & 74]. Moreover, the coldstart-up margin is of great importance for such a system, since the breeding elements present awide range of resonances which may produce a reactivity leap of ~1000 pcm during a coldshutdown, as explained in Section 6.2.5.1. Therefore, the safety margins under which this

Chapter 6 HLW Transmutation in Fast ADS
160
device operates should be larger than for a thermal system, and specifically larger than forTRADE.
The spallation neutron yield (N) is ~15 n/p, a much more efficient yield than the 0.71 n/p ofthe 140 MeV target of TRADE, since the nominal proton energy for EADF (600 MeV) ismuch closer to the optimal value for yield (~1.2 GeV), as explained in Chapter 3. The 3.23mA nominal proton beam current (Ip) implies an energy deposition of 1.94 MW at thebeginning of cycle. The removal of such a large amount of power deposited may pose sometechnical problems. To solve these problems and study the physical principles occurring inthis system, a 1 MW LBE spallation source experiment (MEGAPIE [49]) has beencommissioned in the SINQ facility in PSI. The energy gain G ª 42.35 is not the foreseen onefor a full-scale EA (~120), but it is sufficient to demonstrate the concept of energyamplification in a fast ADS at power.
Table 6.1. Main BOL neutronic parameters for the EADF reference configuration.
Global Parameters Symbol (units) Reference case(SPX fuel)
Initial fuel mixture MOX UPuO2
Initial fuel mass mfuel (kg) 3792.0Initial plutonium concentration mPu/mfuel (wt.%) 18.09
Initial fissile enrichment mfissile/mfuel (wt.%) 13.33Thermal power output Pth (MW) 80Proton beam energy Ep (MeV) 600
Spallation neutron yield N (n/p) 15.04 ± 0.14Net neutron multiplication M 26.69 ± 0.79
Source multiplication coeff. ksrc 0.96254 ± 0.001Effective multiplication coeff. keff 0.96124 ± 0.001
Neutron source importance j* 1.036Energetic gain G 42.35
Gain coefficient G0 1.59Accelerator current Ip (mA) 3.23 ± 0.10
Beam power Pbeam (MW) 1.94 ± 0.06Core power disributions
Avg. fuel power density Pth/Vfuel (W/cm3) 259.57Spec. fuel power density Pth/mfuel (W/g of fuel) 22.43
Radial peaking factor Pmax/Pavg 1.25Axial peaking factor Pmax/Pavg 1.16
This configuration presents large fuel power densities (~260 W/cm3) due to the high densityof the fuel (r ª 11.6 g/cm3) and the extra need of fissions to breed the fuel in order tomaintain the power output without either shuffling or adding new fuel. On the other hand, thesystem exhibits very low axial and radial power peaking factors (1.16-1.25) due to the large

Chapter 6 HLW Transmutation in Fast ADS
161
diffusion length of the coolant, thus allowing the neutrons to reach the outer regions of fuel.This fact impacts positively on the safety characteristics of this system, imposing looserrestrictions on the cooling of the fuel. These reduced power peaking factors, which may beperceived in Figure 6.5 (described in the next section), also permit a more homogeneous burn-up of the fuel, therefore allowing longer burn-up cycles.
Even though this fuel was designed for use in a sodium-cooled fast reactor (i.e. Super-Phénix), its use in EADF may help to assess the TRU elimination potential of this device.Indeed, the breeding equilibrium is given by the ratio of the absorption cross-section of thedaughter product to the capture (breeding) cross-section of the parent for a specific energyspectrum. Taking into account the softer neutron energy spectrum in a sodium-cooled system(as explained later in Section 6.2.4.2), the value of the plutonium breeding equilibrium in aLBE-cooled machine is lower (~15% versus the nominal ~18% plutonium content in the SPXfuel), thus transmuting the excess concentration of plutonium.
In order to give an idea of the distribution of the neutron-induced reactions occurring in thesystem, Table 6.2 summarises these nuclear processes in the most relevant locations, as wellas the specific reactions taken place in the fuel. As expected, the fuel is clearly absorbingmost of the neutrons in the system (~60%), followed by the stainless steel reflector and thesupport grids (~12% and 10%, respectively). The LBE coolant only absorbs ~10%, comparedto the ~20% captured by the water in TRADE. This fact is a major contributor to the higherattainable integrated flux in fast systems (typically ~1015 n/s/cm2) compared to a LWR (~1014
n/s/cm2). The reasonable amount of inelastic nuclear interactions occurring in the structuralmaterials and the cladding imply only a moderate activation of these elements. Nevertheless,the radiation damage (in displacements per atom, dpa) undergone by some of these elements,and in particular by the fuel cladding (~3.2 dpa/yr), should motivate a detailed analysis of themechanical implications. There is a small but important percentage of escapes, so theradioprotection aspects will play an important role in the construction designs of the facility.
In terms of reaction types, capture is clearly the most important nuclear process (66% of thetotal) due to the breeding process in the fuel and breeding blankets and the lower resonanceescape probability of the system. These factors are enhanced by the high neutron flux in theresonance region, as presented in the next section. Fission accounts for 31% of the reactionsand the (n, xn) reactions logically increase their importance (compared to a thermal system) to~2% of the inelastic nuclear interactions.
For the fuel matrix, although plutonium represents ~18% of the fuel mass, it accounts for 59%of the reactions occurring in the fuel. This element produces ~89% of the fission and ~30% ofthe capture reactions, mostly in 239Pu, mainly due to the larger absorption cross-section of theplutonium isotopes compared to 238U. On the other hand, uranium contributes with ~39.5% of

Chapter 6 HLW Transmutation in Fast ADS
162
the reactions, mostly captures in 238U. Only ~0.3% of the reactions in the fuel are (n, xn)which implies that the majority of this type of interaction occur in the coolant and thestructural materials. This fact emphasises the need to improve the related ND, as concluded inChapter 4, since (n, xn) reactions may indeed alter the neutron multiplication of the wholesystem.
Table 6.2. Neutron-induced reactions in different elements of EADF for its reference configuration.
Reactor coreNeutron Absorption Inventory Neutron Absorption InventoryReactor structures 3.82% Reflector 12.04%Reactor coolant 10.06% Support grids 10.47%
Spallation target assembly 1.93% Breeding blankets 2.95%Fuel 59.74% Heat exchangers 2.28%
Fuel cladding 1.54% Escapes 0.15%Main Nuclear Reactions Main Nuclear Reactions
Capture 66.01% (n, xn) 2.14%Fission 31.13% Others 0.42%
Fuel matrixNeutron Absorption Inventory Neutron Absorption Inventory
Uranium 39.52% Americium 1.42%Plutonium 59.04% Others (16O and 237Np) 0.003%
Main Nuclear Reactions Main Nuclear ReactionsCapture 51.10% (n, xn) 0.33%Fission 48.12% Others 0.20%
6.2.4 Neutron Flux DistributionComplementary to the description of the neutron flux distribution in TRADE, the analysis ofthe spatial, energy and time distribution of the neutron flux in EADF, as well as the behaviourof the spallation neutrons, helps to characterise neutronically this facility. Moreover, thecomparison between both experiments allows the essential differencess between thermal andthe less-known fast systems, and in particular, between a thermal ADS, such as TRADE, anda fast one, i.e. EADF, to be highlighted.
The neutron flux distribution (particularly the spatial distribution), which strongly depends onthe multiplication factor, has direct impact on the performance of the facility and theachievable level of burn-up and transmutation rates. Therefore, a precise characterisation willallow, for example, the placement of the LLFFs and distribution of the fuel breeding materialto be optimised.

Chapter 6 HLW Transmutation in Fast ADS
163
6.2.4.1 Spatial Distribution
The radial neutron flux distribution for the reference configuration fuel is illustrated by Figure6.5(a). The neutron flux in the spallation target region is slightly lower than in the fuelsubassemblies, ~1015 n/cm2/s in both locations. These considerable flux levels, as well as thehigh power densities produced in the core (~260 W/cm3), are brought about by the substantialfissile enrichment (~13.3%) and the moderate fuel pitch (13.4 mm; ~1.5 times the fuel pindiameter). The flux in the incineration blanket, namely ~3.1¥1014 n/cm2/s (three times largerthan the average flux in the fuel of a LWR), may allow significant transmutation rates forLLFFs. The low fluxes in the reactor vessel (nearly four orders of magnitude lower than in thefuel) show the good neutron confinement in the core produced by the ~6 m diameter vessel(thus, ~2.1 m of LBE coolant between the core boundary and the reactor vessel).
The axial neutron flux (Figure 6.5(b)) presents the well-known cosinusoidal shape with apeaking factor of ~1.15. As previously explained, the large neutron diffusion length in LBEand the small energy loss in every interaction produces a very moderate ratio between theaverage flux in the fuel and its maximum value (at the centre of the pin). In turn, this results inmore homogeneous fuel breeding and fissile depletion than in a system with higher peakingfactors.
J J J J
J
JJ
J
J
1x10¹⁰
1x10¹¹
1x10¹²
1x10¹³
1x10¹⁴
1x10¹⁵
1x10¹⁶
0 50 100 150 200 250 300 350
Neu
tron
flux
(n/c
m2/
s)
Radial distance (cm)
(a)Spallation target
Spallationtube
Targetvessel
Fuel
Incinerationblanket
Core protection Primary coolant
Reactorvessel
Safetyvessel
5.0x10¹⁴
6.0x10¹⁴
7.0x10¹⁴
8.0x10¹⁴
9.0x10¹⁴
1.0x10¹⁵
1.1x10¹⁵
1.2x10¹⁵
-50 -40 -30 -20 -10 0 10 20 30 40 50
Neu
tron
flux
(n/c
m2/
s)
Axial distance from the centre of the core (cm)
(b)
Active length
Topbreedingendcap
Bottombreedingendcap
Figure 6.5. Radial (a) and axial (b) neutron flux distribution in EADF for UPuO2 (reference) fuel.
The core gives good neutron containment, with a much smaller leakage than in the case ofTRADE (Figure 5.8(a)), where the flux at the boundaries of the core was less than two ordersof magnitude smaller.
The good containment of the neutron population has interesting implications fortransmutation. The presence of absorbing elements in the periphery of the core affects theneutron population in the fuel only slightly, thus effectively decoupling the incineration

Chapter 6 HLW Transmutation in Fast ADS
164
blanket from the fuel core, as shown later by the small effect on ksrc of the LLFFstransmutation strategies.
6.2.4.2 Neutron Energy Spectra
The energy spectra in different elements of EADF, represented in Figure 6.6, show a cleardomination by neutrons in the fast and high-energy regions. This is a rather representativeexample of the neutron energy distribution in fast systems, with a flux peak in the fuelbetween 100 keV and 1 MeV (the energy of the actual peak depends on the fuel pitch andstrongly affects the fission-to-absorption ratio for some MAs), and very small values below 1eV. The 238U resonances in the fuel may be clearly seen (6.5 eV, 21 eV and 70 eV), as well asin the breeding blanket. Moreover, the resonance in bismuth (209Bi) at 800 eV may beperceived in most of the regions represented in Figure 6.6.
1x10⁷
1x10⁸
1x10⁹
1x10¹⁰
1x10¹¹
1x10¹²
1x10¹³
1x10¹⁴
1x10⁻³ 1x10⁻² 1x10⁻¹ 1x100 1x101 1x10² 1x10³ 1x10⁴ 1x10⁵ 1x10⁶ 1x10⁷
Neu
tron
flux
(n/c
m2/
s)
Energy (eV)
Spallation target
UPuO2 fuel
Breeding blanket
Incineration blanket
Primary coolant
Secondary coolant
Reactor vessel
Figure 6.6. Neutron energy spectra in different regions of EADF for the reference configuration.
As mentioned before, the neutron energy spectrum in the fuel peaks at ~300 keV and fallsexponentially with decreasing energy, to a value almost five orders of magnitude smaller inthe tenths of eV region. As elaborated in Chapters 4 and 5, the value of the capture cross-section for actinides (in general, for all elements) decreases with energy above the unresolvedresonance region, thus the ratio between fission and capture increases at higher energies.

Chapter 6 HLW Transmutation in Fast ADS
165
Therefore, a harder (higher in energy) neutron spectrum will effectively enhancetransmutation of otherwise fission-resilient isotopes.
On the other hand, the rather flat and smooth (except for the resonance in 209Bi) flux in thecoolant is produced by several elastic interactions in small isolethargic steps with an almostconstant cross-section. This might help in the neutron resonance crossing of any elementplaced in or around the coolant region, although it also implies an enhancement in theactivation of the core structures.
The high flux, and particularly in the epithermal region, in the incineration blanket permits theenhancement of the resonance captures, as understood through the TARC experiment,presented in Chapter 3. The use of different transmutation matrices for LLFFs and the dilutionof these may induce high transmutation rates, and will be analysed later.
As previously indicated by Figure 6.5(a), the neutron flux beyond the core effectivelydecreases due to the use of such a large amount of coolant. The energy spectra in the reactorvessel and the heat exchangers illustrate this process. The effect of the hydrogen on the latter(the secondary coolant is an organic diathermic fluid – 1.6 1H per 12C, r ª 0.8 g/cm3 – is clearfrom the distinctive bump in the flux at thermal energies (~0.025 eV).
The neutron energy spectrum requirements for transmutation of HLW have been extensivelyexplained previously, drawing a clear conclusion: the need for a fast energy spectrum in orderto effectively eliminate TRUs. Therefore, comparison of the neutron flux spectrum in EADFfor different coolants (Figure 6.7) may be useful to understand which of the proposed systemsmay be better suited to transmute HLW, and in particular TRUs.
Figure 6.7(a) shows the normalised neutron energy spectra in the fuel of EADF using LBE,sodium or helium as coolants. Certain similarities in the high-energy region may be observed,although helium presents a slightly harder spectrum. Below ~30 keV the neutron flux usinghelium coolant becomes lower than the ones for LBE or sodium. This is, in fact, the mainasset of the use of helium: the very hard spectrum due to its very large diffusion length. Themain differences between LBE and sodium occur below 3 keV (resonance in sodium), wherethe neutron flux in the sodium-cooled fuel becomes significantly higher compared to LBE(and helium), hence enhancing the energy region where most of the captures are produced(see the sensitivity analysis for EADF in Chapter 4).
The normalised neutron fluxes in the coolant are illustrated in Figure 6.7(b). The flux inhelium seems significantly harder with an epithermal region at least one order of magnitudelower that the high-energy region. On the other hand both LBE and sodium present verysimilar fluxes for all the energy range except for a slightly higher flux in sodium between 0.1eV and 1 keV. Therefore LBE and sodium present isolethargic fluxes in the coolant (except

Chapter 6 HLW Transmutation in Fast ADS
166
for the large resonance in sodium). This is particularly interesting for transmutation of LLFFs,since, as explained in Chapter 5, epithermal and thermal neutron spectra reduce thetransmutation half-life of these species.
1x10⁻⁸
1x10⁻⁷
1x10⁻⁶
1x10⁻⁵
1x10⁻⁴
1x10⁻³
1x10⁻²
1x10⁻¹
1x10⁻¹ 1x100 1x101 1x10² 1x10³ 1x10⁴ 1x10⁵ 1x10⁶ 1x10⁷
Nor
mal
ised
neu
tron
flux
in th
e fu
el (a
rbitr
ary
units
)
Energy (eV)
Lead-bismuth
Sodium
Helium
(a)
1x10⁻⁸
1x10⁻⁷
1x10⁻⁶
1x10⁻⁵
1x10⁻⁴
1x10⁻³
1x10⁻²
1x10⁻¹
1x10⁻³ 1x10⁻² 1x10⁻¹ 1x100 1x101 1x10² 1x10³ 1x10⁴ 1x10⁵ 1x10⁶ 1x10⁷
Nor
mal
ised
neu
tron
flux
in th
e co
olan
t (ar
bitra
ry u
nits
)
Energy (eV)
Lead-bismuth
Sodium
Helium
(b)
Figure 6.7. Neutron flux spectra in the fuel (a) and the coolant (b) for different coolants in EADF.

Chapter 6 HLW Transmutation in Fast ADS
167
Therefore, the use of helium as coolant produces the hardest spectrum in the fuel, whichenhances the elimination of TRUs, as seen in Figure 6.8, followed by LBE. Sodium presents alarger neutron flux below 2 keV, which reduces the fission-to-absorption ratio of actinides.For the coolant, helium barely perturbs the energy distribution (the moderation coming fromthe structures and the core itself). Such a spectrum is less compatible with the LLFFstransmutation unless special moderating matrices are produced. The neutron energy spectrumin LBE and sodium coolants show very similar characteristics, with high epithermal regions,although the flux in sodium seems slightly softer.
U-235 U-238 Pu-238 Pu-239 Pu-240 Pu-241 Pu-242 Am-241 Np-2370
0.1
0.2
0.3
0.4
0.5
0.6
0.7
0.8
0.9
Fiss
ion-
to-a
bsor
ptio
n ra
tio (a
rbitr
ary
units
)
Helium
LBE
Sodium
Figure 6.8. Fission-to-absorption ratios for different isotopes and coolants in EADF.
The effects of the different energy spectra on the fission-to-absorption rate for the actinidespresent in the fuel at BOL are presented in Figure 6.8. As mentioned above, the fission-to-absorption ratio in helium is higher than both in LBE and sodium, for all the isotopes. For thefissile isotopes, i.e. 235U, 239Pu and 241Pu, the differences between the coolants are minor,since these isotopes have higher fission cross-sections than capture cross-sections across theenergy range. For non-fissile isotopes, the ratio for helium is generally 5-17% higher than forLBE, which in turn is 2-10% higher than for sodium.

Chapter 6 HLW Transmutation in Fast ADS
168
6.2.4.3 Dynamic Behaviour
The dynamic behaviour of the neutrons (both coming from fission and from spallation) in afast ADS is rather different to that in a thermal system (hence the shift towards lowerfrequencies in the transfer function of TRADE). Therefore, a detailed study of this behaviouris necessary in order to completely understand the operation of EADF and the limitations ofits thermal exploratory counterpart.
Figure 6.9 clearly shows the large differences in reactor period between a fast EADF andTRADE. Even though they have somewhat similar values of ksrc (0.963 and 0.977,respectively), the time dependence of the neutron survival probability is radically different forthe two systems. As elaborated in Chapter 5, the neutron population in TRADE peaks due tothe spallation reaction, reaching equilibrium values after 10-20 ms. The spallation neutronsexponentially fade away, accounting for ~10% of the neutrons after 100 ms (0.1% after 1 ms,see Chapter 5). The propagation of the fission neutrons in the core can be perceived by thesubtle increase in the survival probability of all the neutrons at ~150 ms, followed by a slowdecrease due to the subcritical nature of the system.
On the other hand, Figure 6.9(a) shows the neutron survival probability in EADF is saturatedafter the initial spallation neutron production despite the rapid disappearance of these neutrons(more than 10 times faster than in TRADE and accounting for less than 0.1% of the totalneutron population after 100 ms). This saturation is due to the combination of a heavy (highatomic mass) diffusing medium (with low capture cross-section; hence, giving neitherimportant energy losses nor flux depletion) and fast fission processes. Herewith, the firstimportant difference: the efficiency of the source. The number of fissions produced perspallation neutron is more than one order of magnitude larger for EADF (and, consequently,the proton current requirement decreases).
Between 100 and 250 ms, the neutron population diminishes steadily (note the logarithmical y-axis). Thereafter, the most relevant discrepancies between thermal and fast systems appear.The neutron survival probability in EADF presents a spiked profile, which corresponds to thecapture and fission resonances of the system. This feature is only possible in a system wherethe moderator element is a heavy nucleus and presents a reasonable and constant elastic cross-section.
As a result of the analysis of the neutron population evolution (normalised to the initialspallation neutrons), the overall differences between the dynamic behaviour of the systemsmay be inferred. The fission neutron propagation in the core of EADF takes place in a fewtens of ms whereas it takes ~150 ms in TRADE. Moreover, the (negative) exponential reactorperiod is substantially different, ranging from ~2 ms in TRADE to ~40 ms in EADF.Therefore, the prompt neutron lifetimes in these systems go from ~50 ms to ~1 ms.

Chapter 6 HLW Transmutation in Fast ADS
169
Figure 6.9. Comparison of the neutron survival probability between TRADE and EADF in the core (a) and in
different regions of the system for the total neutron population (b) and the spallation neutrons (c).
These dynamic parameters have a direct impact on reactor control, and particularly on thelength of the beam trips. As observed in Chapter 5, a thermal ADS may withstand a beam

Chapter 6 HLW Transmutation in Fast ADS
170
failure of 1 ms (considered a normal duration for a beam trip) losing 25% of the neutrons,which can be regained if the beam is reconnected at nominal current. On the other hand, abeam trip of 1 ms on a fast system, and particularly on EADF, implies the disappearance of~99.9% of the neutron population, therefore requiring a complete restart of the machine, sincethe insertion of the proton beam at nominal intensity may induce thermal shocks in the target,fuel and structures. Hence the need to study experimentally the effects of beam failures inTRADE, since the system is less sensitive to these than EADF; the knowledge gathered in thisexperiment will be applicable to a fast device at higher frequencies.
The evolution of the neutron population in the buffer and fuel regions of TRADE and EADFis presented in Figure 6.9(b). The neutron survival probabilities follow the characteristictrends of their respective systems. Furthermore, the transparency to neutrons of the LBEcoolant may be clearly seen in the nearly overlapping population distributions, whereas inTRADE the substantially higher neutron survival probability in the fuel indicates theconfinement of a large fraction of the neutrons in the fuel region due to the strong reflectioneffect of the water.
Concerning the behaviour of the spallation neutrons, there is no difference in the survivalprobability of these neutrons (which undergo an exponential attenuation) between the bufferand fuel regions in TRADE. On the other hand, the evolution of the spallation neutronpopulation in EADF faithfully represents the different nuclear interactions occurring indifferent regions. These neutrons rapidly (in ms) disappear from the buffer region due to thelarge diffusion length of the coolant and reach the fuel (Figure 6.9(c)). In this region, theyscatter and eventually produce an inelastic interaction; thus only a few of them reachresonance energies.
6.2.4.4 Spallation Target
In order to understand the behaviour of the spallation target in steady state and to determinethe nuclear processes brought forth by the accelerated protons, a specific analysis wasperformed. Two different beam distributions were considered for the nominal beamparameters (3.23 mA of 600 MeV protons): a Gaussian beam profile (Figure 6.10(a) and6.10(b)), with a standard deviation (sxy) half of the beam tube width (hence ~95% of the beamwas confined in the tube and the remaining 5% was collimated before the collision region),and a uniform beam profile (Figure 6.10(c) and 6.10(d)).
The 600 MeV proton range in LBE (28.27 cm) may be clearly seen as a sharp drop in theenergy deposition for both beam distributions (at ~–40 cm in Figure 6.10(a) and 6.10(c)). Thisis due to the fact that most of the energy carried by the protons is lost through ionisation(~66%) and nuclear recoils and heavy fragments (~2%). The electro-magnetic cascade is

Chapter 6 HLW Transmutation in Fast ADS
171
exponentially dissipating ~30% of the beam energy and only ~2% is carried by secondaryneutrons. This explains the large power densities observed close to the target, where most ofthe 1.94 MW beam is deposited in the first 20 cm. However, the difference in maximumpower deposition between the two beam distributions is considerable. The uniformdistribution gives a maximum deposition of ~450 W/cm3, whereas for the Gaussian profile(sxy ª 4 cm) the maximum is ~3.4 kW/cm3, requiring an enhanced coolant flow in the target.Hence, the beam shape should be defined by a fine interplay between its optics andcollimation.
Figure 6.10. Energy deposition ((a) and (c)) and neutron flux distribution ((b) and (d)) in the spallation target of
EADF for the nominal 3.23 mA, 600 MeV Gaussian ((a) and (b)) and uniform ((c) and (d)) proton distribution.
In terms of the spallation neutron flux, both beam-shapes present the same sphericaldistribution beyond ~10 cm from the beam axis. In the region close to the target the Gaussianbeam profile obviously shows a higher flux (~3¥1015 n/cm2/s), which is propagated (althoughattenuated) along the beam axis due to the forward anisotropy of the high-energy elasticscattering.

Chapter 6 HLW Transmutation in Fast ADS
172
6.2.5 Reactivity Safety MarginsMany of the parameters that determine the multiplication factor of any reactor, such asresonance capture and coolant density, depend on temperature. This is especially true for afast neutron device operated with uranium-based fuel such as EADF, where the Dopplerbroadening of the capture resonances in 238U (as well as in 232Th) produce an effectiveincrease in the resonance integral with temperature, therefore reducing the reactivity of thesystem. Additionally, the variation in the coolant density, or the loss thereof, strongly affectsthe behaviour of the neutron population (e.g. energy spectra, diffusion length etc.), and thusthe multiplication factor.
It is well known that in order to guarantee the safety of the system the effect of theseparameters on the multiplication factor (or on the reactivity) should be negative, since anoverall negative feedback would tend to stabilise the system towards its equilibrium value. Onthe other hand, depending on the direction of the changes, positive feedback would make thesystem divert either towards a shutdown or, in the worst case scenario, a core meltdown.Consequently, analysis of these parameters is of great relevance for a nuclear reactor.
6.2.5.1 Temperature Coefficient
The temperature coefficient, aT, is arguably the most important of the reactivity coefficientsfor a multiplicative device. Two physical effects mainly influence this parameter: theaforementioned Doppler broadening and the moderator temperature effect. The former, alsocalled the prompt temperature coefficient due to its immediate contribution to the neutronmultiplication, occurs mostly in the fuel due to the presence of well-defined captureresonances in 238U and 232Th, but not in other actinides. The latter, also called the delayedtemperature coefficient due to the slow propagation of its effects to the reactivity of thesystem, is due to a complex interplay between large number of factors: for example, theenergy spectrum differences between fuel and moderator, the discrepancies between fissilematerial and moderator absorption cross-sections, the behaviour of the reactor poisons and amyriad of other effects, such as the variation of the number of neutrons per fission reaction(which in turn depends on the neutron energy spectrum, and hence on the moderatortemperature). A more exhaustive description of these effects may be found in [105].
With respect to EADF, the variation of ksrc with fuel temperature is illustrated in Figure 6.11,together with its first derivative, representing the relative change for each temperature intervaland being approximately equal to aT (since the proportionality factor is
�
ksrc2 and this is close
to unity). It should be noted that the right-hand y-axis represents -dk/dT, and therefore thenegative slope of the variation of ksrc versus the temperature.

Chapter 6 HLW Transmutation in Fast ADS
173
The multiplication of the system clearly decreases as the temperature increases. This producesa reduction in ksrc of ~–960 pcm between ambient temperature (293 K, zero power) andnominal conditions (80 MWth with a temperature of ~900 K).
B
B
B
B
B
B J
J
J
J
J
0.95
0.955
0.96
0.965
0.97
0.975
0
0.2
0.4
0.6
0.8
1
1.2
1.4
1.6
1.8
200 700 1200 1700 2200
ksrc
- dk/dT (pcm/K
)
Temperature (K)
B ksrc
J dk/dT
Figure 6.11. Variation of ksrc with temperature at the BOL in EADF for the reference configuration.
For lower temperatures, the aT presents similar values to those of a conventional PWR (–3using UOX fuel), although smaller than for TRADE (~–10 pcm/K using LEUZrH).Nevertheless, as the temperature increases aT seems to approach 0, although remainingnegative even for high fuel temperatures (~–0.36 pcm/K between 1300 and 2300 K). In spiteof this, aT presents very reasonable values for the normal temperature range of operation (~–1pcm/K between 900 and 1300 K), similar to those of sodium-cooled reactors (~–2 pcm/K)[105].
Similar to the start-up effects on reactivity but with the opposite sign, the result of a coldshutdown is an increase in reactivity of ~1.5 pcm/K, which in the case of a critical systemwould have to be dealt through precautions, given that the core gains reactivity as thetemperature of the fuel is reduced and could drive to an unstable feedback situation.Therefore, the system should be designed to be subcritical enough to withstand a reactivityswing of ~1000 pcm for a temperature change from 900 K to 293 K.

Chapter 6 HLW Transmutation in Fast ADS
174
6.2.5.2 Void Coefficient
Another important reactivity coefficient, partially related to the coolant temperature, is thecoolant void coefficient, aV. This coefficient represents the reactivity (or ksrc) change with thecoolant fraction present in the system. A reduction in the amount of coolant could occur dueto several factors, which may or may not be temperature related. The increase of the vapourfraction in the system due to a temperature rise is a common way of controlling the reactivityin Boiling Water Reactors (BWRs). Water boiling may also occur in a Pressurized WaterReactor (PWR) accidentally due to a depressurisation of the reactor vessel. And, of course,the impact on reactivity of a Loss-Of-Coolant Accident (LOCA) must be assessed for anytype of reactor, since it is behind some of the most important accidents in the history ofcommercial nuclear reactors, for instance Chernobyl, where excessive coolant voiding in thiswater-cooled graphite-moderated reactor increased the reactivity of the system due to areduction in the neutron absorption.
The variation of ksrc versus decreasing coolant fraction (or increasing void fraction) ispresented in Figure 6.12, at the same time as its first derivative (dk/dx) in order to give anestimation of the variation of the multiplication factor for every voiding interval. Themultiplication of the system is, at first, moderately reduced due to an increase in the coolantvoid fraction, going from the reference 0.962 to 0.926 for 40% void. As the coolant fractiondecreases, aV drops exponentially towards ksrc ~0.66, the source multiplication of the systemonce all the coolant is removed from the reactor.
The moderate decrease of ksrc for small void fractions, as in the case of the expansion of thecoolant or for the injection of some argon bubbles to enhance the coolant flow, augments thesafety parameters without hindering the control of the system. For example, aV ª –70 pcm/%between 0 and 10% void, which will imply no burden to the accelerator since the increase inthe current would be ~56 mA, 1.7% of the nominal beam current.
In case of a larger loss of coolant fraction, the negative value of aV increases significantly, to~–1480 pcm/% for a 90% coolant void (–940 pcm/% in dk/dx shown in the plot). Below thiscoolant fraction, aV decreases (becoming more negative) rapidly, to reach a value of ~–2700pcm/% (–1207 pcm/% in dk/dx shown in the plot) for complete coolant void. This enormousreactivity drop in the case of major coolant losses, if not an absolute guarantee, stronglyindicates the stability of the system in the case of a serious LOCA accident.
These values are quite favourable if compared to the ~–190 pcm/% in a PWR [106] andespecially compared to sodium-cooled systems, where reactivity changes due to voids arerather small and their sign depends on the circumstances (such as the neutron leakage) [105],and to helium-cooled systems, where the void reactivity feedback is not present.

Chapter 6 HLW Transmutation in Fast ADS
175
JJ J J
J
J
J
J
J
J
J
J
J
J
0.65
0.7
0.75
0.8
0.85
0.9
0.95
1
0
200
400
600
800
1000
1200
1400
100 90 80 70 60 50 40 30 20 10 0
ksrc
- dk/dx (pcm / %
)
Coolant fraction (%)
ksrc J dk/dx
Figure 6.12. Variation of ksrc with the void fraction in the coolant at the BOL in EADF.
In fact, these are major assets of a LBE (or lead) cooled system compared to a sodium-cooledor a helium-cooled fast system. For the same type of fuel, the prompt temperature coefficientis quite similar in all three fast systems. Conversely, the void coefficient using LBE is clearlynegative and very significant for any amount of void in the system, whereas for helium-cooledsystems it is nonexistent (neutrons barely interact with the helium gas), and thus total relianceon the prompt temperature feedback to compensate reactivity changes. For sodium-cooledsystems, the void reactivity feedback is, at best, close to 0, as mentioned before, becomingpositive for some configurations.
6.2.6 Fuel Burn-up EvolutionAn essential attribute of ADS is their capability to adapt to the subcriticality level given bythe fuel composition at any burn-up step. Nevertheless, this feature requires accurate design inorder to maintain sensitive parameters, such as ksrc or target power densities, below crucialsafety margins. Therefore, precise analysis of the evolution of the system with time (or fuelburn-up) is necessary to accurately design such a facility.
Moreover, the evolution of the actinide inventory is of utmost importance to prove theconcept of transmutation in large quantities (kg) of radionuclides and to assess the

Chapter 6 HLW Transmutation in Fast ADS
176
transmutation potential of EADF. The evolution of the neutronic parameters with burn-upshould indicate the feasibility of extended period of operation, without refuelling, and thecomposition and toxicity of the spent fuel.
The values of the main neutronic parameters at the Beginning-Of-Life (BOL) and at the End-Of-Life (EOL) are presented in Table 6.3, Their time evolution (in a 900 days cycle) shows afuel burn-up of 20 GWd/t of fuel (or equivalently 23 GWd/tHM), which corresponds to aconsumption of ~20 kg of fuel. During this cycle, the fissile enrichment drops from 13.33% ofthe fuel to 12.25%. The amount of plutonium in the fuel also decreases, from 18.09% of thefuel mass to 16.69%. The reduction in the fissile enrichment implies a Dksrc of ~2800 pcm(ksrc at the EOL is ~0.935). Despite this drop, the energy gain at EOL, ~23.55, is stillconsiderable and confirms the system as a formidable source of energy.
Table 6.3. Evolution of the main neutronic parameters of EADF after one burn-up cycle.
Global Parameters Symbol (units) BOL EOLFuel mixture MOX UPuO2 UPuO2
Fuel mass mfuel (kg) 3792.0 3721.0Plutonium concentration mPu/mfuel (wt.%) 18.09 16.69
Fissile enrichment mfissile/mfuel (wt.%) 13.33 12.25Thermal power output Pth (MW) 80 80Proton beam energy Ep (MeV) 600 600
Cycle length Trefuel (d) – 900Fuel burn-up (GWd/t of fuel) – 20
Spallation neutron yield N (n/p) 15.04 ± 0.14 15.04 ± 0.14Source multiplication coeff. ksrc 0.96254 ± 0.001 0.93460 ± 0.001Net neutron multiplication M 26.69 ± 0.79 15.29 ± 1.00
Energetic gain G 42.35 23.22Gain coefficient G0 1.59 1.52
Accelerator current Ip (mA) 3.23 ± 0.10 6.00 ± 0.09Beam power Pbeam (MW) 1.94 ± 0.06 3.60 ± 0.06
The decline in neutron multiplication brings about an ~86% increase in the acceleratorcurrent, up to 6 mA. These parameters will determine the final engineering design of differentparts of the facility, such as the cooling system and the layout of the spallation target. In thiscase, the current increase entails the evacuation of 3.6 MW of beam power, with a maximumenergy deposition of ~6.3 kW/cm3 (with a heat capacity of ~130 J/kg◊K, the temperatureincrease DT ª 5 K/s; thus the flow of the liquid target should be carefully studied in order toavoid regions without flow, where the LBE may vaporise).
The time evolution of the source multiplication coefficient and the proton beam intensity isillustrated by Figure 6.13. The linear evolution in time (or fuel burn-up) of these twoparameters is evidenced by the graph. The initial fluctuation of ksrc is due to the effect of the

Chapter 6 HLW Transmutation in Fast ADS
177
short-lived isotopes (mainly FFs) during the small time intervals (initially, three days). Theslope of the linear fit shows a source multiplication loss of ~–139 pcm/GWd/t of fuel (orequivalently, such a reduction every 40 days, since burn-up is also linear with time). For Ip,the loss of reactivity brings about an increase of ~0.14 mA/GWd/t of fuel. Since most of theelements present in the fuel have already reached equilibrium concentrations by the end of thecycle, as may be observed in Figure 6.14(a), the proton current and ksrc variations may be usedto extrapolate the beam requirements for more extended burn-ups.
0.90
0.91
0.92
0.93
0.94
0.95
0.96
0.97
0.98
0.99
1.00
0
2
4
6
8
10
12
14
16
18
20
0 100 200 300 400 500 600 700 800 900 1000
ksrc
Proton beam current (m
A)
Time (d)
Source multiplication coefficientProton beam current
Figure 6.13. Time evolution of the proton beam current and the source multiplication for one burn-up cycle.
The evolution with burn-up of the isotopic inventory for the SPX fuel represented by Figure6.14(a) shows how the concentration of the major isotopes in the SPX fuel (i.e. 235, 238U,239, 240, 241, 242Pu and 241Am) remain almost constant, obviously except for the small amount ofused fuel. The concentration of 238Pu increases by ~56%, which will contribute to theradiotoxicity of the spent fuel for more than 100 years after discharge, as elaborated in thenext section. There is an increase in the inventory of higher actinides, specifically 243Am and242Cm, of below 1 kg. The generation of 244Cm is quite small (~20 g) but may cause someproblems in the case of multiple reprocessing schemes.
By the end of the burn-up cycle (20 GWd/t of fuel, 23 GWd/tHM), the total actinides balanceis ~–71 kg, of which ~–57 kg is transmuted uranium. This reduction in the mass of uranium ismainly caused by the fuel breeding process, since 238U accounts for 99.5% of the uraniummass and its fission-to-absorption ratio is 11.4%. The rest of the fuel mass loss (~–14 kg) isdue to the burning of plutonium. On the other hand, a small amount of MAs has been

Chapter 6 HLW Transmutation in Fast ADS
178
produced, namely +401 g of neptunium, +281 g of americium and +406 g of curiumproduced, as illustrated by Figure 6.14(b).
1x10⁻³
1x10⁻²
1x10⁻¹
1x100
1x101
1x10²
1x10³
1x10⁴
1x10⁻³
1x10⁻²
1x10⁻¹
1x100
1x101
1x10²
1x10³
1x10⁴
0 100 200 300 400 500 600 700 800 900 1000
Isot
ope
inve
ntor
y (k
g)
Time (d)
U-238
Pu-239
Pu-240
Pu-241
U-235
U-236
U-234
Cm-244
Np-237
Pu-242
Am-241
Pu-238
Am-243
Cm-242
(a)
-90
-80
-70
-60
-50
-40
-30
-20
-10
0
10
-90
-80
-70
-60
-50
-40
-30
-20
-10
0
10
0 5 10 15 20 25
Act
inid
e bu
rn-u
p (k
g)
Average burn-up (GWd/tHM)
Totalactinides
Uranium
Plutonium
NeptuniumAmericium Curium
(b)
Figure 6.14. Actinide isotopic evolution (a) and mass balance (b) for the SPX fuel in EADF.

Chapter 6 HLW Transmutation in Fast ADS
179
The linear relation between burn-up and elimination rates may be observed in Figure 6.14(b),where the actinide balance in EADF as a function of the fuel burn-up for the 3.35 tonnes ofHM in the fuel is shown.
As the isotopic evolution of this fuel has shown, even though the plutonium concentration isreduced, there is a generation of higher actinides. Some of these isotopes contribute stronglyto the radiotoxicity of the spent fuel and, although less important than plutonium due to theirsmaller production rates, these may pose serious radiological problems if not treated. Aspreviously explained, the accumulation of these elements, even in deep storage repositories,entails the risk of a leak into the biosphere, as well as the menace of proliferation.
Table 6.4 compares the production of TRUs at the EOL in a PWR (using UOX and MOX)fuels and their elimination in EADF. The use of MOX fuel in thermal systems reduces thegeneration of plutonium but increases the production of higher actinides, in particular ofamericium and curium. On the other hand, EADF offers a significant amount of plutoniumtransmutation (–3.7 kg/tHM) and a low production of MAs, at EOL. These results clearlyshow the advantages of using fast systems to reduce the TRU stockpile.
Table 6.4. TRUs and LLFFs production at end of cycle in PWRs and EADF per tonne of spent fuel.
Element(kg per tonne of fuel)
PWR (UOX)33 GWd/tHM [9]
PWR (MOX)43.5 GWd/tHM [9]
EADF (SPX)23 GWd/tHM
Plutonium +9.73 +5.50 –3.70Neptunium +0.42 +0.16 +0.11Americium +0.37 +4.83 +0.07
Curium +0.02 +0.92 +0.01Technecium-99 +0.82 +1.00 –1.19
Iodine-129 +0.17 +0.21 –1.17
A study of LLFF transmutation potential was also carried out introducing, in one case 297 kgof 99Tc in the form of KTcO4, and in a second case 297 kg of 129I as PbI2, into the incinerationblanket, without greatly perturbing the reactivity of the system (~1000 pcm at BOL). Table6.4 shows the significant transmutation rates achieved (~2 kg/yr) proving the feasibility atlarge scale of this process.
Another way of comparing the actinide production (or elimination) rates, normalising perTW◊h of thermal energy output, is illustrated by Figure 6.15. A conventional PWR (usingUOX fuel) produces on average ~13 kg/TW◊h of TRUs, whereas the using of MOX generates~11 kg/TW◊h. For EADF, the use of SPX entails an actinide destruction of 41 kg/TW◊h, ofwhich 34 kg/TW◊h is natural uranium. These values stabilise after ~3 GWd/tHM. Theplutonium transmutation rate stabilises quickly to 8.1 kg/TW◊h.
For MAs, the neptunium levels rise at first due to the breeding process reaching stable levels(230 g/TW◊h) at ~4 GWd/tHM. The quantities of americium and curium produced (160

Chapter 6 HLW Transmutation in Fast ADS
180
g/TW◊h and 16 g/TW◊h respectively) are lower than those produced in PWRs using UOX(~800 g/TW◊h and ~33 g/TW◊h respectively) and much smaller than those produced withMOX (~4.8 kg/TW◊h of americium and 910 g/TW◊h of curium).
For LLFFs, at equal energy output such a strategy may eliminate the production of at least 2.5LWRs; the transmutation rate for the previous loading is ~–2.6 kg/TW◊h of 99Tc or 129I,whereas the production of a conventional LWR is ~1.01 kg/TW◊h of 99Tc and 221 g/TW◊h of129I. The transmutation half-life of such a process is ~100 yr for both isotopes, worse than the~30 yr calculated in Chapter 5 for a 1014 n/cm2/s thermal flux. This transmutation efficiencymay be improved, as shown by [21] and explained later, by diluting these isotopes in theperiphery of the core in a large system.
-50
-40
-30
-20
-10
0
10
20
-50
-40
-30
-20
-10
0
10
20
0 5 10 15 20 25
Act
inid
e pr
oduc
tion
(kg/
TWh)
Average burn-up (GWd/tHM)
Totalactinides
Uranium
Plutonium
Neptunium Americium Curium
TRUs in PWR (UOX)
TRUs in PWR (MOX)
Tc-99 I-129
Figure 6.15. Comparison of actinide production per TW◊h between EADF and a PWR (using UOX and MOX),
as a function of fuel burn-up.
The comparison between the actinide balances clearly indicates that the use of UPuO2 fuel ina lead-cooled system is an efficient way of reducing the stockpile of plutonium (rather thanmerely maintaining its present levels), with little MAs generation. Moreover, the onlylimitation on plutonium content in an ADS is the critical mass of the fuel, in order to maintainsubcriticality.
On the other hand, the use of MOX in a critical system (either thermal or fast) is limited bythe worsening of the dynamic values of the system (e.g. the delayed neutron fraction) and the
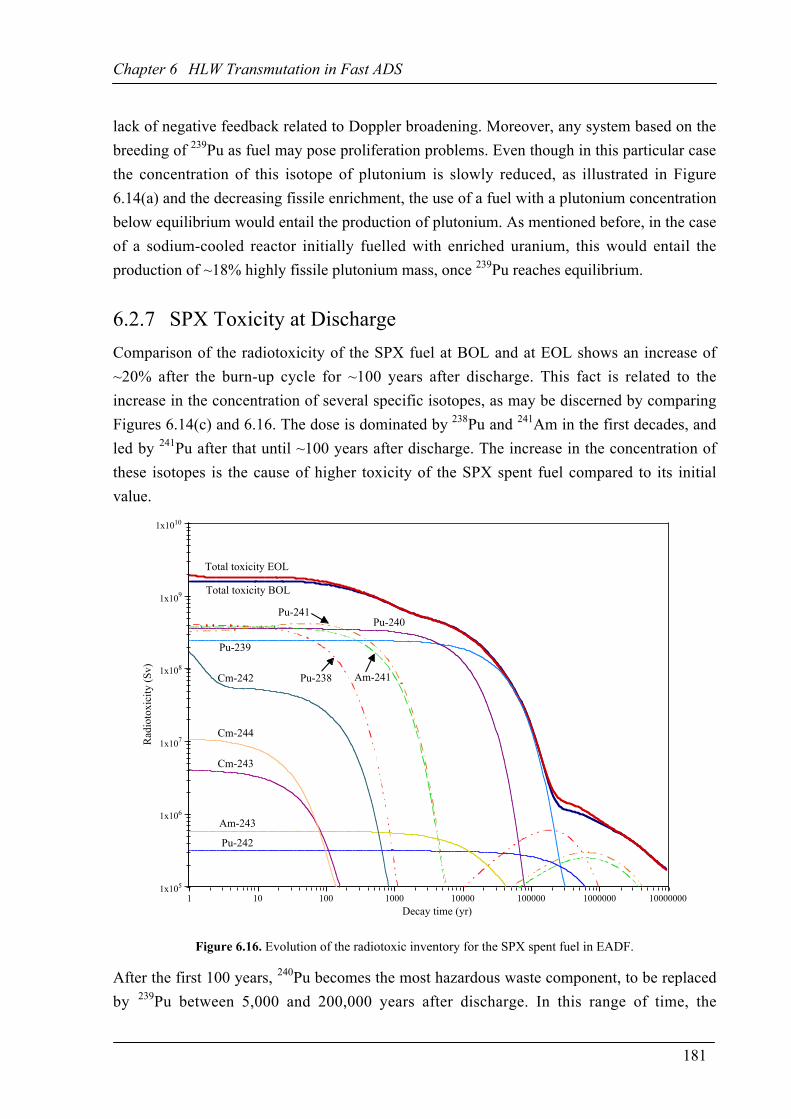
Chapter 6 HLW Transmutation in Fast ADS
181
lack of negative feedback related to Doppler broadening. Moreover, any system based on thebreeding of 239Pu as fuel may pose proliferation problems. Even though in this particular casethe concentration of this isotope of plutonium is slowly reduced, as illustrated in Figure6.14(a) and the decreasing fissile enrichment, the use of a fuel with a plutonium concentrationbelow equilibrium would entail the production of plutonium. As mentioned before, in the caseof a sodium-cooled reactor initially fuelled with enriched uranium, this would entail theproduction of ~18% highly fissile plutonium mass, once 239Pu reaches equilibrium.
6.2.7 SPX Toxicity at DischargeComparison of the radiotoxicity of the SPX fuel at BOL and at EOL shows an increase of~20% after the burn-up cycle for ~100 years after discharge. This fact is related to theincrease in the concentration of several specific isotopes, as may be discerned by comparingFigures 6.14(c) and 6.16. The dose is dominated by 238Pu and 241Am in the first decades, andled by 241Pu after that until ~100 years after discharge. The increase in the concentration ofthese isotopes is the cause of higher toxicity of the SPX spent fuel compared to its initialvalue.
1x10⁵
1x10⁶
1x10⁷
1x10⁸
1x10⁹
1x10¹⁰
1 10 100 1000 10000 100000 1000000 10000000
Rad
ioto
xici
ty (S
v)
Decay time (yr)
Total toxicity EOL
Total toxicity BOL
Pu-239
Cm-242
Cm-244
Cm-243
Am-243
Pu-242
Pu-238
Pu-240Pu-241
Am-241
Figure 6.16. Evolution of the radiotoxic inventory for the SPX spent fuel in EADF.
After the first 100 years, 240Pu becomes the most hazardous waste component, to be replacedby 239Pu between 5,000 and 200,000 years after discharge. In this range of time, the

Chapter 6 HLW Transmutation in Fast ADS
182
radiotoxicity drops more than two orders of magnitude and both fresh and spent SPX fuelpresent the same values due to the clear domination of 239Pu. Beyond 200,000 years, 238Pu,241Pu and 241Am consecutively take the lead again, appearing from the a-decay chain of 242Cmand 245Cm and the b–-decay of 241Pu, respectively.
The consequences of nuclear reactions other than fission in 239Pu, particularly capture and (n,2n), seem to be the origin of the increase in radiotoxicity of the SPX spent fuel. Theproduction of 238Pu (a minor isotope in PWR spent fuel) entails an increment in the dosereceived through waste handling during the first century after discharge. The accumulation of241Am, 241Pu and, later, 240Pu has the same origin and similar implications at a longer timescale.
The production of curium isotopes, although rather scarce (~406 g after discharge), may havea larger impact on the toxicity of the spent fuel if double-strata transmutation schemes areapplied; thus curium production should be limited to avoid further production of 238Pu, 241Puand 244Cm.
6.2.8 Conclusions: The Use of MOX Fuel in Fast ADSIn the roadmap to the demonstration of a fast ADS for energy production and HLWtransmutation there is a clear need to construct and operate a real power fast ADS which,taking advantage of the experience and knowledge attained through TRADE concerning thephysics behaviour during operation in a large number of situations, will prove those conceptsand help to foresee technological problems in the path towards an industrial prototype.
The preceding analysis confirms that the 80 MWth lead-bismuth cooled EADF fulfils theserequirements. The feasibility of such a device has been established with only a fewtechnological problems yet to be solved, such as the cooling of the spallation target and thefeasibility of the windowless option. The neutronic parameters show high neutron fluxesrequiring acceptable proton intensities (3-6 mA at 600 MeV), moderate fuel temperatures andvery small power peaking (~1.16), hence confirming some of the safe features of the device.The large negative void (aV ª –70 pcm/% for small void fractions and up to aV ª –1200pcm/% for complete void) and temperature (i.e. ~–1.5 pcm/K around the 900 K nominal fueltemperature) coefficients evidence the passive safety of EADF.
The use of LBE as a coolant for EADF has been compared with other alternatives, inparticular with the use of helium or sodium. The use of helium as coolant offers the advantageof a harder neutron spectrum, enhancing fission in TRU, whereas sodium presents anoticeably softer neutron spectrum. On the other hand, the aforementioned reactivityfeedbacks of a LBE-cooled device are more favourable than those of the other options,

Chapter 6 HLW Transmutation in Fast ADS
183
especially if they are compared with the non-existence of void reactivity feedback in heliumand with the, at best, very small coefficient in sodium-cooled systems.
A value of ksrc ª 0.96 was chosen due to the need to operate far from criticality at all times,taking into account the limitations in ND presented in Chapter 4. The dynamic behaviour ofthe neutrons (spallation and fission) has also been investigated, showing some of the basicdifferences in terms of diffusion between thermal and fast systems.
The short prompt neutron lifetime of the system (~1 ms compared to 50 ms in TRADE) gives amuch faster neutron population decrease than in a thermal system, for the same neutronmultiplication. This fact shows the great sensitivity of a fast system to beam interruptions,since after a 1 ms beam trip the neutron population in EADF would drop to 0.1% of its initialvalue. Hence the need to investigate these types of events in a system such as TRADE, whosesafety features are well known and give a slower response to beam interruptions and reactivityinsertions.
Study of the effect of burn-up on the fuel composition is another goal of EADF. A fuel burn-up of 23 GWd/tHM eliminates a significant amount of plutonium with a small MAsproduction, particularly compared to the use of MOX in LWRs. In fact, comparing TRUproduction in terms of energy output, EADF may eliminate ~60% of the plutonium producedin a PWR using UOX. The transmutation of large quantities of 99Tc and 129I is also possiblewithout disturbing the multiplication of the system, posing fewer problems in terms of safetyand neutron economy.
These results show that the use of MOX fuel in fast systems is an option in order to reduce theplutonium stockpile at a considerable rate, obtaining thermal power at the same time.However, this method may not be the optimal approach to plutonium elimination since it isbased on the breeding of fissile plutonium itself, thus limiting the transmutation rate.Moreover, the presence of plutonium in the core entails an increase in the MAs stockpile,even in fast systems, eventually shifting the problem towards the elimination of MAs, reducedin mass but comparable in radiotoxicity.
Furthermore, these uranium-plutonium fuels could also be used to enrich plutonium if itsinitial concentration was lower than its equilibrium concentration in the system, thereforeposing serious proliferation threats. In fact, this is one of the reasons (together with concernsabout the use of sodium in proximity to water) why Super-Phénix was shut down in 1998 bythe French government after strong pressure from public opinion.

Chapter 6 HLW Transmutation in Fast ADS
184
6.3 HLW Transmutation Strategies and Assessment
From the previous section, it seems clear that the use of uranium-plutonium fuel is noteffectively closing the fuel cycle since the production of MAs is enhanced by these types offuel, even when used in fast systems.
Therefore, two main approaches to HLW transmutation have been conceived: (i) the use of athorium-based fuel, using plutonium as a seed to start the fission chain, thus eliminating asignificant amount of TRUs while producing energy based on the thorium cycle. The use ofdevices operating in this way would represent ~30% of the installed nuclear power capacity.(ii) The use of a few ADS at the end of a multiple strata fuel cycle, where these systemswould be heavily loaded with MAs in order to eliminate them through the use of different fuelmatrices, effectively closing the fuel cycle. These systems would represent ~9% of the energyproduced by nuclear power.
The first is the approach proposed by C. Rubbia at CERN, in which part of the energy load isgenerated by thorium-based EA, while the second is the approach taken in the multi-tiersstrategies proposed by the Japan Atomic Energy Research Institute (JAERI) in the scope ofthe OMEGA (Options Making Extra Gains for Actinides & FFs / One Method ExpectingGeneral Acceptance of Nuclear Energy) programme or alternatively by the FrenchCommissariat à l’Énergie Atomique (CEA).
6.3.1 The Use of Thorium-TRU Fuel in ADSAs previously explained, the thorium-cycle offers a realistic alternative to the use of MOXand other uranium-plutonium fuels to reduce the TRUs stockpile and obtain energy from thisprocess. This may be a strategy for the use of the EA, eliminating large quantities of TRUscoming directly from spent fuel in a single integrated cycle (single stratum), using thorium-based fuel, since this fuel offers reduced production of those elements. This scheme wasthoroughly studied in [21] as an alternative to geological storage to eliminate the HLW for thecase of Spain.
The basic model of a lead-cooled 1 GWth EA was taken as a base in order to assess thepotential of such a strategy. The thorium oxide fuel was ‘enriched’ with ~24% TRUs, i.e. 2.95tonnes, from PWR spent fuel, of which 20% was plutonium (~2540 kg), 1.3% neptunium(~158 kg), 2% americium (~250 kg) and 0.04% curium (~6 kg). The isotopic compositionwas that of PWR spent fuel with a level of burn-up of ~33GWd/tHM, after a cool-downperiod of ~15 years.

Chapter 6 HLW Transmutation in Fast ADS
185
This TRU concentration is optimal to maximise the transmutation rate avoiding largereactivity swings between Beginning-Of-Cycle (BOC) and End-Of-Cycle (EOC), thuskeeping the proton current below 15 mA for the burn-up cycle. Figure 6.17 shows theevolution of ksrc with burn-up for that particular fuel load in the EA. The initial ksrc of ~0.974reaches a maximum value of ~0.986 at 50 GWd/t of fuel. This maximum is reached due to theincreasing concentration of 233U, which has reached ~330 kg, i.e. approximately half of itsequilibrium concentration, and even though the mass of plutonium has been reduced by 364kg (~14% of the initial mass), as illustrated by Figure 6.18. A higher initial concentration ofplutonium would entail of the reduction the fuel mass in order to keep the core safelysubcritical. Hence, the breeding of 233U would be reduced and the initial fissile elementswould be burned faster, producing a larger reactivity swing. In fact, Dk/k is 0 between BOC (0GWd/t) and EOC (120 GWd/t) for this particular TRU loading, as may be observed in Figure6.17.
0.90
0.91
0.92
0.93
0.94
0.95
0.96
0.97
0.98
0.99
1.00
0 20 40 60 80 100 120 140 160
ksrc
Burn-up (GWd/t of fuel)
Figure 6.17. Evolution of ksrc with burn-up for an EA using (76% thorium / 24% plutonium) oxide fuel.
Figure 6.18 shows the evolution of the actinide inventory in the system for a burn-up cycle of120 GWd/t of fuel (~3 years). The transmutation of plutonium with this configuration duringthis period is –770 kg (–30% of the initial plutonium mass). The transmutation of americiumis also important, accounting for –71 kg (–30% of its initial mass), although some of it istransformed into curium (+23 kg, four times the initial mass). The balance of 237Np is alsorather favourable since –68 kg (–45%) is eliminated.

Chapter 6 HLW Transmutation in Fast ADS
186
As previously explained, since the thorium fuel is basically plutonium-free, any quantity ofTRUs added will decrease to their equilibrium concentrations. Since the equilibriumconcentrations of TRUs are at least 10–5 that of 232Th (see Figure 6.2), the TRU masses will bereduced to tens of grams at equilibrium. Figure 6.18 shows that none of the hazardouselements used as ‘enrichment’ has reached its equilibrium concentration, thus all their masseswill continue to decrease in a second cycle. The curium concentration is the only one thatrose, but this has already started decreasing towards equilibrium. Therefore, if the equivalentmass of the transmuted elements was added to the fuel at the end of the cycle, a similartransmutation rate would be obtained.
1
10
100
1000
10000
1
10
100
1000
10000
0 20 40 60 80 100 120 140 160
Act
inid
e st
ockp
ile (k
g)
Burn-up (GWd/t of fuel)
Uranium
Plutonium
Americium
Neptunium
Curium
Th-232
Figure 6.18. Stockpile evolution for different elements present in a 1 GWth ThPuO2 EA.
The isotopic evolution of the system is summarised in Figure 6.19. Obviously, there is a largeproduction of 233U (~610 kg), since the cycle is based on the breeding of this fissile element.On the other hand, the fuel presents three orders of magnitude smaller quantities of 236U thanof 233U. This shows again the very small equilibrium concentrations of higher actinides in thethorium cycle, since any TRU produced in this cycle would have to be produced by neutroncapture in 236U.
As previously mentioned, the concentration of plutonium is significantly reduced (–770 kg,–30% of the initial concentration), in particular that of 239Pu (–752 kg, –50%) and 241Pu (–61kg, –31%). A similar situation occurs with 237Np (–68 kg, –43%) and 241Am (–83 kg, –38%),although part of their mass is transformed into 238Pu (+80 kg, +165%) or , in the case of
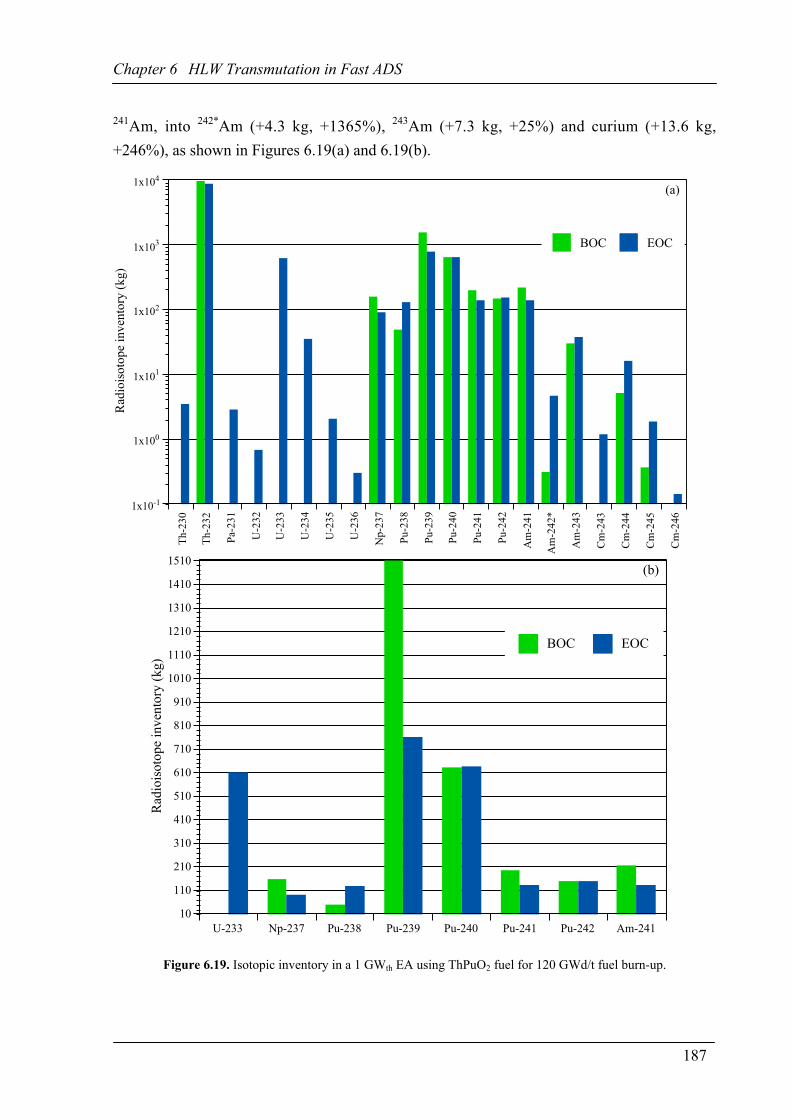
Chapter 6 HLW Transmutation in Fast ADS
187
241Am, into 242*Am (+4.3 kg, +1365%), 243Am (+7.3 kg, +25%) and curium (+13.6 kg,+246%), as shown in Figures 6.19(a) and 6.19(b).
Th-2
30
Th-2
32
Pa-2
31
U-2
32
U-2
33
U-2
34
U-2
35
U-2
36
Np-
237
Pu-2
38
Pu-2
39
Pu-2
40
Pu-2
41
Pu-2
42
Am
-241
Am
-242
*
Am
-243
Cm
-243
Cm
-244
Cm
-245
Cm
-246
1x10⁻¹
1x100
1x101
1x10²
1x10³
1x10⁴
Rad
iois
otop
e in
vent
ory
(kg)
BOC EOC
(a)
U-233 Np-237 Pu-238 Pu-239 Pu-240 Pu-241 Pu-242 Am-24110
110
210
310
410
510
610
710
810
910
1010
1110
1210
1310
1410
1510
Rad
iois
otop
e in
vent
ory
(kg)
BOC EOC
(b)
Figure 6.19. Isotopic inventory in a 1 GWth EA using ThPuO2 fuel for 120 GWd/t fuel burn-up.

Chapter 6 HLW Transmutation in Fast ADS
188
In order to compare the HLW transmutation capability of different systems the actinidebalances per TW◊h in a PWR, EADF and EA have been summarised in Table 6.5. Theadvantages of an EA in terms of TRU elimination are clearly visible. For the same energyoutput, one EA could eliminate the waste of ~2.5 conventional PWRs. This applies not onlyto plutonium but also to neptunium and americium, whose mass balances are clearly negative,unlike in the case of a MOX-based fast system, such as EADF. The mass of curium increasesslightly mainly being 244Cm (a-decay, t1/2 ª18 yr), which could be reinserted in the reactor ina second cycle or extracted and placed in a secular repository for ~50 years to become 240Pu,which may be reinserted into the fresh fuel.
Table 6.5. Comparison of the actinide balance per TW◊h for different systems, including the EA.
Actinide balance(kg/TW◊h)
PWR (UOX)41 GWd/tHM [9]
EADF (UPuO2)23 GWd/tHM
EA (ThPuO2)120 GWd/t of fuel
Plutonium +11.3 –8.1 –27.6Neptunium +1.18 +0.23 –2.55Americium +1.04 +0.16 –2.65
Curium +0.03 +0.016 +0.86Technecium-99 +1.01 –2.62 –3.8 [21]
For 99Tc, [21] shows that with a dilution in lead of 260 ppm, that is a fractional density of2.686 mg/cm3, 50 kg/yr of 99Tc could be transmuted in 25 m3 in an EA, thus resulting in atransmutation half-life of 1.4 years, much shorter than in a well thermalised spectrum (~15years for 99Tc calculated in Chapter 5).
Effectively, these numbers imply that the reference 1.5 GWth EA [1] is able to eliminatecontinuously the TRUs and LLFFs waste of 1.5-2 LWRs (3 GWth), thus potentially allowing aprogressive shift from the uranium-plutonium fuel cycle to the less polluting thorium fuelcycle operated in fast ADS.
The application of this strategy to the elimination of nuclear waste in the UK would entail theconstruction of ~8 EA in order to eliminated the HLW of the 23 operating reactors (11.85GWe). These EAs would also add 4.74 GWe (40% thermal efficiency) to the grid (~30% ofthe nuclear energy once the units were connected to the grid and ~5% of the total electricalenergy production) allowing a reduction in the use of greenhouse gas-emitting energy sourcesand the replacement of the oldest nuclear power plants after their decommissioning. The caseof Spain (9 operating reactors) would be similar, requiring the construction of 5 EA units,which would produce ~3 GWe. On the other hand, France would require the construction of~42 EA units (~25 GWe) to deal with the waste of its 59 reactors (63.47 GWe).
This transmutation scheme was designed to eliminate 99.9% of the radiotoxicity of the HLW,reducing its toxicity to that of the original fuel uranium ore in ~500 years, as presented in

Chapter 6 HLW Transmutation in Fast ADS
189
Chapter 2 by Figures 2.1 and 2.3. This scheme would eliminate the need for a geologicalrepository, only requiring secular disposal for the remaining waste.
Another great advantage of this transmutation strategy is its inability to enrich plutonium tobuild nuclear weapons, since the HLW from spent fuel is used directly to produce the EA,avoiding plutonium separation. A small fraction of 238U may be added to the fuel to avoidproduction of uranium with high 233U (fissile) concentrations.
6.3.2 Double Strata Strategy for Transmutation of MAThe use of ADS as a back-end of the fuel cycle has been lately proposed as an alternativemethod to geological disposal after HLW separation. In fact, several strategies have beensuggested, some including the use of MOX in LWR, others the use of Fast Burner Reactors(FBR) or both, to eliminate the plutonium present in the HLW. They may be summarised inthe double strata scheme presented in Figure 6.19, where the first stratum includes the optionsjust mentioned. As explained previously, these processes produce an increasing amount ofMAs, which cannot be effectively eliminated in those systems without an unacceptabledegradation of their safety parameters. Therefore, a second stratum has been proposed inorder to deal with these elements.
Figure 6.20. HLW management strategies: Advance Fuel Cycle and Double Strata Fuel Cycle [19].

Chapter 6 HLW Transmutation in Fast ADS
190
The so-called Partitioning & Transmutation (P&T) stratum is supposed to take the spent fueleffluents after reprocessing and, once the appropriate fuel is fabricated, eliminate them in anADS dedicated to this purpose. This strategy foresees a mass flow from the first stratum to thesecond one of ~3.5% of the mass of the spent fuel, 3.4% corresponding to FFs and 0.1%corresponding to MAs.
Once the partitioning is achieved, the mass inserted in the ADS depends on which LLFFstransmutation scheme is chosen. In the case of only MAs being used in the fuel, theaforementioned 0.1% (i.e. ~30 kg/GWe/yr from a LWR) would finally make it into the ADS.If 99Tc and 129I were also included, 0.25% of the initial spent fuel would be treated in thetransmutation stage. In any event, the mass of the elements finally configuring the ADS fuelwould be minimal compared to the initial mass of spent fuel.
Another important asset for this transmutation strategy is the independent development ofeach stratum. Although the P&T cycle still requires some research and development (R&D),which is, in fact, the core of this dissertation, this R&D only refers to the second stratum.Therefore, the commercial cycle remains unaffected except for the HLW accumulation due tothe delay in applying transmutation.
It should be noted that, although the size of the waste stream finally going to the repositorieswould be greatly reduced, these would still be required, although with much less restrictionson safety and secular confinement, particularly to hold the short-lived FFs.
6.3.2.1 Specific Fuel Matrices for MAs Transmutation
The high power densities and the deep levels of burn-up foreseen for these MA burners entailthe development of new types of fuel matrices capable of containing large amounts of MAs(some of them being volatile) and withstanding extreme irradiation without failing. The MAfuel distribution should be homogeneous, with no separation among MAs, in order tofacilitate fuel fabrication and reduce handling doses. For these purposes, several fuel typeshave been considered, and the most promising ones may be summarised in three groups:metallic, oxide and nitride fuels. Table 6.6 shows some general information on these types offuels.
Table 6.6. Main characteristics of some of the dedicated fuels for MAs transmutation [107].
Fuel characteristics Metallic fuels[TRU – Zr]
Oxide fuels[TRU – OX]
Nitride fuels[TRU – 15N]
Heavy metal density (g/cm3) ~12.5 ~10 ~13.5Melting point (K) ~1500 ~3000 ~3000
Thermal conductivity (W/m◊K) ~20 ~3 ~20Reprocessing knowledge and
irradiation database Limited Good Poor

Chapter 6 HLW Transmutation in Fast ADS
191
All of them present advantages and disadvantages, starting from the high density (required toproduce a harder neutron spectrum), high conductivity but low melting point of the metallicfuels, to the high melting point and good knowledge of but low conductivity of the oxidefuels. The properties of the nitride fuels seem remarkable: high density, high conductivity,high melting point and low irradiation damage. On the other hand, these are poorly knownfuels and they require the enrichment of the nitrogen with 15N (0.366% of natural nitrogen),since (n, p) reactions in 14N may be significant, producing 14C (t1/2 ª 5730 yr).
Therefore, all these fuel types require further investigation in order to determine the best oneto be used in the MA burner. This is a key issue to the development of this transmutationscheme, and why several research institutes, such as ANL (US), CEA – Cadarache (France)and JAERI (Japan), among others, are currently putting great emphasis on the study of one ormore of these fuel types under irradiation.
6.3.2.2 ADS Dedicated to Transmutation of MAs
In this transmutation strategy, ADSs have been proposed to eliminate large amounts of MAsin a safe and efficient way. Their intrinsic safety due to their operation below criticality makesthem ideal for handling fuels presenting negative safety characteristics, such as small delayedneutron fractions and low or even no negative reactivity feedbacks.
The thermal power output of such a device is still undecided, with systems ranging from acouple hundred MW to 1 GW under consideration. A possible candidate may be a 250 MWth
compact reactor, which, due to its high specific power and compactness, would be a perfectindustrial prototype to explore a large number of transmutation schemes. Therefore,preliminary calculations were performed in order to study the viability of such a strategy andassess the achievable transmutation rates.
The reactor is a stainless steel cylindrical tank of ~9 m height and 4.4 m diameter containingthe fuel core and the LBE coolant, similar to EADF. The cylindrical fuel core is 1.9 m inheight and 1.7 m in diameter. The core is formed by 7.5 mm ¥ 7.5 mm fuel cells containing~6 mm diameter cylindrical fuel pins. The central part of the core was voided in order toinsert the proton beam line and create a ~30 cm buffer region in order to effectively diffusethe spallation neutrons.
Several types of fuels were initially tested to evaluate the maximum mass of fuel that could beinserted in the core without reaching criticality, illustrated by Figure 6.21. A comparison ofcoolants for some of these fuels was also performed in order to assess the specific powercapabilities of these systems. The mass, for a given fuel volume, was varied increasing thesmear density of the fuel, since, in the final design, some void may be required toaccommodate the large quantities of volatile FFs produced by the very long burn-ups.

Chapter 6 HLW Transmutation in Fast ADS
192
Of the different fuels analysed, the use of pure metallic MAs offers the largest actinide massesbelow criticality, with the LBE case being closest to criticality, followed by helium andsodium. For TRUs, using the LWR standard spent fuel composition with a 10% smear density(~870 kg of oxide fuel), the LBE-cooled reactor becomes supercritical (keff ª 1.13), whereasthe same mass in sodium and helium are quite subcritical. This behaviour is similar to theEADF case, where the sodium coolant and especially the helium coolant (due to the neutronescapes) made the system noticeably more subcritical.
The addition of 10% waste plutonium to the metallic MA mixture reduces significantly thecritical mass of fuel, going from 3.4 tonnes to 2.5 tonnes of fuel, which is important for theassessment of possible combined Pu-MAs burning strategies. The use of fuel matrices such as15N and zirconium softens the neutron energy spectrum via scattering reactions, hence slightlyreducing keff for a given MA mass.
0.0
0.2
0.4
0.6
0.8
1.0
1.2
0 0.5 1 1.5 2 2.5 3 3.5 4 4.5 5
keff
MAs mass (tonnes)
MAs Metal LBE cooled
MAs Metal He cooled
MAs Metal Na cooled
MAs Metal+10% Pu LBE cooled
Waste Pu+MAs Metal LBE cooled
Waste Pu+MAs Metal He cooled
Waste Pu+MAs Metal Na cooled
MAs Nitr LBE cooled
MAs Zirc LBE cooled
Criticality
Figure 6.21. Effective neutron multiplication for different fuel types and quantities in the 250 MWth MA burner.
Therefore, a pure MA metallic fuel was chosen as a case study in order to evaluate thetransmutation potential of the device. The MA composition is similar to that coming from afirst stratum combining LWR UOX and MOX use, i.e. 12.5% 237Np, 50% 241Am, 25% 243Amand 12.5% 244Cm. The initial fuel mass inserted in the core is ~2.16 tonnes, in order to avoidcriticality conditions during the burn-up cycle, as illustrated by Figure 6.22(a).

Chapter 6 HLW Transmutation in Fast ADS
193
During the extended burn-up cycle ksrc changes significantly, from the initial ksrc of ~0.786(producing an energy gain of G ª 4.3) to a maximum ksrc of ~0.969 after 4.5 years (1650days) of operation, equivalent to a fuel burn-up of 225 GWd/tHM. This very low initial ksrc
entails an excessive proton current (~64 mA), proving the need to increase the initial fuelmass. However, the large reactivity increase after 225 GWd/tHM, i.e. Dk ª 1830 pcm, makesthat impossible, since the system would become supercritical during burn-up if the fuel masswas significantly increased. Therefore, it will be necessary to add plutonium (~10%) to theMA fuel in order to increase the initial reactivity of the system and reduce the reactivity swingduring burn-up.
In the maximum multiplication state, the system has an energy gain of G ª 49, requiring abeam current of ~10 mA. The rise in ksrc is due to a combination of the decrease in the neutroncaptures in the MAs, the increase in the fissile isotopes previously bred and the relativelysmall FF capture fraction (6% of the neutron absorbing reactions), as observed in Figure6.22(b). The fissile isotopes responsible for the increase in ksrc are: 238Pu (240 kg, for which60% of the absorbed neutrons produce fissions, as explained in Chapter 4), 245Cm (45 kg,85% fission fraction) and, to some extent, 239Pu (15 kg, 80% fission fraction).
JJJJJJJJJJJJJJJJJJJJJJJJJJJJJJJJJJJJJJJJJJJJJJJJJJJJJJJJJJJJJJJJJJJJJJJJJJJJJJJJJJJJJJJJJJJJJJJJJJJJJJJJJJJJJJJJJJJJJJJJJJJJJJJJJJJJJJJJJJJJJJJJJJJJJJJJJJJJJJJJJJJJJJJJJJJJJJJJJJJJJJJJJJJJJJJJJJJJJJJJJJJJJJJJJJJJJJJJJJJJJJJJJJJJJJJJJJJJJJJJJJJJJJJJJJJJJJJJJJJJJJJJJJJJJJJJJJJJJJJJJJJJJJJJJJJJJJJJJJJ
0.10
0.20
0.30
0.40
0.50
0.60
0.70
0.80
0.90
1.00
0
200
400
600
800
1000
1200
0 1000 2000 3000 4000 5000 6000 7000 8000 9000
ksrc
Burn-up (G
Wd/tH
M)
Time (d)
ksrc
Burn-up
(a)
0.0
0.1
0.2
0.3
0.4
0.5
0.6
0.7
0.8
0.9
1.0
0.0
0.1
0.2
0.3
0.4
0.5
0.6
0.7
0.8
0.9
1.0
0 100 200 300 400 500 600 700 800 900 1000
Frac
tiona
l am
ount
Burn-up (GWd/tHM)
MA fission
MA capture
FF capture
(b)
Figure 6.22. Time evolution of ksrc and fuel burn-up (a), and the fractional amounts of captures and fissions in
MAs and captures in FFs during burn-up.
From this maximum, ksrc slowly decreases until about 13.6 years (~5000 days, 600 GWd/tHMburn-up) when the slope becomes steeper and G drops below 5. It is perhaps at this point thata long cool-down period (30-60 years, enough for 70%-90% of the 244Cm to have decayed)followed by reprocessing could be foreseen, although, as explained later, the radiotoxicity ofthe spent fuel is smaller than that of fresh fuel. Thus, if the technology to produce this fuel isdeveloped, reprocessing it may not be a difficult task. When the fuel burn-up has reached 600GWd/tHM (hence the line marking the status of the reactor parameters at that level of burn-up), the number of captures in the FFs is of the same order of magnitude as the number of

Chapter 6 HLW Transmutation in Fast ADS
194
captures or fissions in MAs. The cool-down period would allow the decay of the short-livedFFs poisoning the reactor and reprocessing would allow the insertion of ‘fresh’ MAs.
Figure 6.23 explains the system’s behaviour previously shown in Figure 6.20. The massbalance in this 250 MWth device at the EOL (600 GWd/tHM) is ~–1,400 kg of actinides, 65%of the initial actinide mass (Figure 6.23(a)). While the total amount of actinides is reduced at aconstant rate of ~–100 kg/yr, equivalent to the yearly production of 3-4 conventional 1 GWe
LWRs, the composition of the actinide mixture changes significantly. The concentration ofthe americium isotopes (Figure 6.23(c)) and 237Np (the only neptunium isotope shown inFigure 6.23(a)) fall exponentially, transmuted either by fission or by neutron capture andsubsequent decay. The concentration of plutonium isotopes (Figure 6.23(b)) increases due tocaptures mainly in the abundant americium isotopes up to +410 kg at 400 GWd/tHM and thendecreases (+340 kg at 600 GWd/tHM). For curium (Figure 6.23(d)), there is a smallconcentration increase (+27%) until 100 GWd/tHM due to the captures in americium (242Cmfrom 241Am and 244Cm from 243Am). Beyond that level of burn-up, the curium mass is steadilyreduced down to 210 kg at EOL (–25% of curium eliminated).
0
500
1000
1500
2000
2500
0 100 200 300 400 500 600 700 800 900 1000
Act
inid
e in
vent
ory
(kg)
Burn-up (GWd/tHM)
Total actinides
Americium
Curium Plutonium
Neptunium
(a)
0
50
100
150
200
250
300
350
400
450
500
0 100 200 300 400 500 600 700 800 900 1000
Plut
oniu
m in
vent
ory
(kg)
Burn-up (GWd/tHM)
Plutonium
Pu-238
Pu-239
Pu-240
Pu-241
Pu-242
(b)
0
200
400
600
800
1000
1200
1400
1600
1800
0 100 200 300 400 500 600 700 800 900 1000
Am
eric
ium
inve
ntor
y (k
g)
Burn-up (GWd/tHM)
Americium
Am-241
Am-242*
Am-243
(c)
0
50
100
150
200
250
300
350
400
0 100 200 300 400 500 600 700 800 900 1000
Cur
ium
inve
ntor
y (k
g)
Burn-up (GWd/tHM)
Curium
Cm-242
Cm-243
Cm-244
Cm-245
Cm-246
(d)
Figure 6.23. Detailed evolution of the actinide mass in the MA burner with burn-up.

Chapter 6 HLW Transmutation in Fast ADS
195
Of all the isotopes produced by neutron capture in MAs, 238Pu is the most abundantlyproduced, as several decay reactions result in its production. First, neutron capture in 241Amfollowed by the b–-decay of 242Am (t1/2 ª 16 h) into 242Cm (t1/2 ª 163 d), which yields 238Puafter an a-decay. Neutron capture in 237Np produces the same result after the b–-decay of238Np (t1/2 ª 2 d). As mentioned before, the production of 238Pu (together with 245Cm and, to alesser extent, 239Pu) causes the ksrc increase previously shown.
Another isotope of great importance during burn-up is 244Cm, since this isotope presentsstrong a activity for approximately half a century. The mass of 244Cm increases slightly up to100 GWd/tHM (+10 kg, +3.6%), thereafter gradually decreasing down to 160 kg (–44%).
These results show that such a device may be quite efficient in reducing the MAs stockpilecoming from the conventional waste stream. A transmutation rate of 100 kg/yr would imply~1.4 tonnes of MAs eliminated during a cycle period of 14 years and an average netelectricity production of ~60 MW (taking into consideration the accelerator requirements).Therefore, such a device (250 MWth) could effectively eliminate the MA waste produced by 3conventional 3 GWth LWRs (at a rate of ~30 kg/GWe/yr, as explained in Chapter 2), while theplutonium would be dealt with by either LWRs using MOX (although this would increasesignificantly the production of MA, as explained before) or by FBRs.
The application of this transmutation strategy to the case of France would involve theconstruction of ~5 MA burners (1 GWth) serving 59 LWRs (63.47 GWe). For the UK a single1 GWth device would be sufficient to deal with the MA waste of the 23 reactors (11.85 GWe).Spain would only need a 600 GWth MA burner to deal with its MA waste. In all these cases,the MA burners would produce ~3% of the installed nuclear power.
It also seems clear that the ND related to the previously considered unimportant 238Pu and244Cm is of extreme importance to these systems, since the large discrepancies in ND for theseisotopes, presented in Chapter 4, will have a significant effect on the uncertainties in thedesign and operation of these devices. Indeed, the ND analysis in Chapter 4 shows adiscrepancy in ksrc of ~500 pcm for a 238Pu concentration of 0.31% weight in the 50%plutonium / 50% MA fuel. A similar situation occurs for 244Cm, which produces a ~250 pcmdiscrepancy in ksrc for a concentration of 2.2% in the same type of fuel. These effects wouldbe magnified in the MA burner as the concentration of these isotopes increases with burn-up,affecting the prediction not only of ksrc but also of safety parameters, such as the Dopplerreactivity coefficient. Therefore, the presence of significant quantities of these isotopes incritical reactors will entail serious design problems, since ND for them is poor and criticalsystems are far more sensitive to reactivity changes than subcritical ones. This may have direimplications for multiple recycling MOX schemes, both in thermal systems and FBRs.

Chapter 6 HLW Transmutation in Fast ADS
196
The radiotoxicity of the spent fuel from the MA burner should also be studied in order toassess the feasibility of the fuel fabrication and reprocessing. Figure 6.24 shows the evolutionof the radiotoxicity of 1 tonne of spent fuel of the MAs after a fuel burn-up of 600 GWd/tHMand the main isotopes contributing to this radiotoxicity. The toxicity of 1 tonne of fresh MAburner fuel as well as 1 tonne of PWR fuel (both fresh and spent) is also presented. As may beexpected, the initial radiotoxicity of 1 tonne of ‘fresh’ fuel formed by pure MAs is orders ofmagnitude larger (~1,000 times greater) than that of PWR spent fuel due to the highconcentration of 244Cm. This may cause problems during the fuel fabrication stage, since thedoses to workers and structures involved may exceed safety limits with present technology.
1x10³
1x10⁴
1x10⁵
1x10⁶
1x10⁷
1x10⁸
1x10⁹
1x10¹⁰
1x10¹¹
1x10⁻¹ 1x100 1x101 1x10² 1x10³ 1x10⁴ 1x10⁵ 1x10⁶ 1x10⁷
Spec
ific
radi
otox
icity
(Sv/
t)
Time (yr)
PWR fresh fuel
PWR spent fuel
MA burnerspent fuel
MA burnerfresh fuel
Pu-238
Am-241
Cm-244
Figure 6.24. Evolution of the radiotoxicity of 1 tonne of spent fuel from the MA burner compared to 1 tonne of
fresh fuel and the fuel coming from a conventional PWR.
Therefore, although there may still be some technological barriers to fully develop a MAburner (in particular concerning the accelerator and fuel fabrication), such a device has greatpotential for transmutation of TRUs, and, in particular, for efficiently eliminating the MAwaste stream coming from the commercial cycle in a double strata transmutation scheme. Onthe other hand, the partitioning phase may entail some proliferation and radiological risks,since the plutonium separated could be diverted towards weapons production and the pureMAs present a very high specific radiotoxicity.

Chapter 6 HLW Transmutation in Fast ADS
197
In this HLW transmutation strategy, the options to eliminate LLFFs, in particular 99Tc and129I, are numerous. Strategies ranging from creating specific targets to insert in LWRs (takingadvantage of the large number of units available) to the dilution of these isotopes in freshUOX fuel (somewhat inefficient due to the hard neutron spectrum in the fuel) have beenconsidered in [9]. It seems that the insertion of these isotopes in moderated sub-assemblies inFBRs or in thermal high flux reactors (HFR) yields good transmutation rates (~100 kg/yr) andprocess efficiency (~15 yr transmutation half-lives), although still far from the shorttransmutation half-life (~1.4 yr) predicted in [21] using the TARC method [23].
6.4 Transmutation Strategies Assessment
Two rather different conceptual approaches to transmutation have been studied. The analysesof both schemes show the clear applicability of the concept of transmutation to thecommercial nuclear fuel cycle. In fact, none of these transmutation strategies present majortechnological challenges, although both still require some development in specific areas, suchas an increase in proton beam current delivered (the cyclotron in PSI currently delivers ~1.6mA at 590 MeV) or the precise design of a tens of MW spallation target.
As explained in Chapter 3, the thorium cycle offers clear advantages in terms of MAproduction since the quantities of isotopes produced beyond 235U are orders of magnitudesmaller than the fuel mass (e.g. for a mass of 600 kg of 233U there are 300 g of 236U at the endof a 120 GWd/t cycle). This approach offers the advantage of effectively treating the HLW inthe spent fuel without the need for TRU separation. In fact fresh fuel may be fabricatedseparating the FFs from the actinides, and then uranium from the rest, and finally using thesein the thorium-based systems (~76% fuel in an EA). The feasibility of transmutation ofLLFFs, in particular 99Tc and 129I, in these systems has also been studied. Great dilution isrequired in order to achieve a larger efficiency (transmutation rates of 50 kg/yr are predictedin the EA with a dilution of 260 ppm in lead).
These systems would be designed to produce a significant amount of power, i.e. 1.5 GWth inthe case of the EA, and could therefore supply part of the energy demand which wouldotherwise be produced by conventional power plants. This fact could allow a progressivechange from conventional uranium-based nuclear power plants to reactors based on thethorium cycle, once this is properly established.
The need to develop a completely new fuel cycle might, in fact, be the main drawback of thisapproach, as it may, for some, be a significant economic burden. The uranium cycle is wellestablished in the nuclear industry, and, even if transmutation is accepted, the impact on the

Chapter 6 HLW Transmutation in Fast ADS
198
commercial cycle should be minimised. In this context, the concept of the double strata andthe MA burner is developed: a compact flexible system, with reduced power output dedicatedto the elimination of MAs.
Unlike in the thorium-TRU strategy, the plutonium would be managed by using MOX, eitherin LWRs or in FBRs (still to be fully developed industrially), at the expense of a higherproduction of MAs. Moreover, the partitioning phase gains importance in this strategy, sincethe plutonium has to be separated from the MAs at EOC. This plutonium separation createsproliferation risks, which cannot be neglected, since the threats of diversion have regainedimportance.
Table 6.7 shows the actinide inventory balance per TW◊h for a PWR, the EA and the MAburner. The MA burner shows a large efficiency in eliminating MAs, in particular americium,while producing plutonium. These results show that a 1 GWth MA burner could eliminate theMAs of ~10 LWRs (1 GWe, ~3 GWth) combining the use of UOX and MOX, whereas the 1.5GWth EA would reduce the stockpile of MA at a lower rate (1 EA to 1.5 LWRs). Conversely,the EA would eliminate both the MA inventory (at a slower rate) and waste plutonium, whichin the case of transmutation in double strata is left for the commercial cycle. However, theMA burner fuel will have to be doped with plutonium (~10%) in order to control thereactivity swing during burn-up and raise the initial neutron multiplication, relieving somestrain on the accelerator requirements.
Table 6.7. Comparison of the actinide balance per TW◊h for different systems, including the MA burner.
Actinidebalance
(kg/TW◊h)
PWR (UOX)41 GWd/tHM
[9]
PWR (MOX)43.5 GWd/tHM
[9]
EA (ThPuO2)120 GWd/t of
fuel
MA burner (pureMAs)
600 GWd/tHMPlutonium +11.3 +5.5 –27.6 +10.7Neptunium +1.18 +0.16 –2.55 –7.7Americium +1.04 +4.83 –2.65 –46.3
Curium +0.03 +0.92 +0.86 –2.3
Fewer units of the MA burner (1 GWth) would be required, 1 per ~10 LWRs (1 GWe), ~3% ofthe installed nuclear capacity (e.g. ~10 MA units in the US or ~5 in Japan), compared to the 1EA (1.5 GWth) per 1.5 LWRs (~30% of the installed power, ~65 EA units in the US or ~30 inJapan). Scaling to the 363 GWe/yr produced globally, the elimination of the MA waste beingproduced would require the construction of ~37 MA burners, producing ~13 GWe plus theextensive use of MOX in LWRs, whereas the elimination of the HLW in EAs would involvethe construction of ~242 EA units. The added value in the latter scenario is the addition of~145 GWe to the grid, which would help meet increasing world energy demands and relievedependence on fossil fuels. In fact, this energy equates to ~5% of the primary energyconsumption (~223¥1018 J/yr, see Chapter 1), reducing greenhouse gas emission by ~160million tonnes of carbon equivalent.

Chapter 6 HLW Transmutation in Fast ADS
199
Hence, MA burners would entail a smaller impact on the present nuclear industry, although itis not clear which scheme would require more technological development in order to beindustrially operational. The fuel fabrication process in the double strata approach seems morecomplicated than that of the EA (which uses TRUs directly from the spent fuel), due to theadded difficulties of the partitioning phase. The design of MA burner fuel itself requiresfurther investigation, since such large concentrations of MAs (some of them, like 244Cm, veryradioactive) hinder the production these high actinide density fuels, and the very high powerdensities foreseen for these types of devices require the development and analysis of specificfuels, such as the nitride fuels.
Therefore, further experimental studies should be carried out in order to determine the finalstrategy to transmute HLW. In this context, EADF appears as a milestone since the devicewould not only validate the concept of safely transmuting HLW in fast ADS and help in thedevelopment of the technology required to produce an industrial prototype, but also allow theirradiation and study of new types of fuels, such as ThPuO2 or TRU-15N, experimentallyvalidating the benefits and handicaps of both systems.

Chapter 6 HLW Transmutation in Fast ADS
200

Chapter 7 Final Conclusions
201
Chapter 7
Final Conclusions
In previous Chapters of this dissertation, the need for alternatives to traditional energy sourceshas been discussed. Global warming, produced by the emission of CO2 and other greenhousegases, the limited availability of fossil fuels and the world’s growing energy demands justifythorough research into non-conventional sources of energy with the potential to substitutetraditional ones within a reasonable timescale.
In this context, the future role of nuclear power seems clear. Producing no greenhouse gasemissions with extensive fuel resources, nuclear power represents an established technology,ready for the challenge.
However, the dangers posed by the high-level nuclear waste (HLW) produced by nuclearreactors cannot be neglected. From the threats of nuclear weapon proliferation to the latentrisk of leakage into the biosphere, these dangers require a permanent solution if nuclearenergy is to achieve public acceptance. The negative view that public opinion has aboutnuclear power is often wrongly disregarded by the nuclear industry. Indeed, public opinionhas driven several political decisions, adverse to nuclear energy, such as the progressiveabandonment of nuclear power in Germany or the shut-down and decommissioning of Super-Phénix. This attitude could change if the HLW hazard was removed and danger ofsupercritical excursions was avoided.
Numerous studies have proposed different alternatives for disposing of or destroying HLW.Arguably, none of these alternatives presents the intrinsic safety and elimination potential thattransmutation in Accelerator-Driven Systems (ADS) offers. While other systems merely storeHLW without any long-term safety guarantees, transmutation in ADS promises to be a safe,

Chapter 7 Final Conclusions
202
economically and technically viable, efficient method of transforming HLW into low activitywaste requiring only secular storage for a few hundreds years.
The physical principles of HLW transmutation in ADS are now well understood, includingthe spallation reaction, acting as an external neutron source, which poses no major problemsin terms of radiotoxicity, particularly when compared to that of the spent fuel. For theaccelerator, the optimal proton energy in terms of neutron yield was found to be ~1.5 GeV,which is slightly beyond present cyclotron technology but easily achieved by other modernaccelerators. The thorium fuel cycle has also been studied, illustrating its advantages in termsof low actinide production and fuel availability. Also the application of Monte Carlo (MC)techniques to solve design problems in advanced nuclear systems has been described, withspecific reference to the validity and operation of the FLUKA / EA-MC code package and itscompilation of Nuclear Data (ND).
7.1 Main Contributions
The roadmap towards the validation of the ADS concept and its application on a large scaleforesees several experiments in order to study and develop several ADS components. Theresearch detailed in this doctoral thesis covers the three specified levels towards theexperimental demonstration of transmutation in ADS:
∑ Level 1: the validation of separate components – in the present case, the assessment ofthe lack of experimental ND and the effects of the discrepancies between evaluated NDlibraries on the key reactor parameters. This work set a priority list for the isotopes andreaction channels to be measured, for example, in the neutron Time-of-Flight (n_TOF)experiment.
∑ Level 2: The neutronic design of the first real power ADS in the form of the coupling of a1 MWth TRIGA reactor with a 110-140 MeV, 1 mA proton accelerator, i.e. the TRIGAAccelerator-Driven Experiment (TRADE). The limitations of such a device wereanalysed and some possible experiments proposed.
∑ Level 3: The neutronic analysis of the Lead-Bismuth Eutectic (LBE) 80 MWth EnergyAmplifier Demonstration Facility (EADF) together with a comparison with other fastsystem options, in particular sodium- and helium-cooled systems. The limitations fortransmutation of using MOX in a fast system were also highlighted.
∑ Finally: A comparative assessment of two major transmutation strategies – the use ofthorium-plutonium fuel in fast ADS and the double strata approach, where the plutoniumis eliminated by the use of MOX and the minor actinides (MAs) are burnt in a dedicatedADS (MA burner).

Chapter 7 Final Conclusions
203
In this context, the improvement of ND is a necessary step to accurately design these systems.Therefore, the identification of the most relevant isotopes for transmutation and theaforementioned assessment of the impact of the discrepancies between ND libraries on ADSnuclear parameters were essential for configuring a measurement priority list.
Capture and/or fission reactions in some of these isotopes, such as 90Zr, 206, 207, 208Pb, 209Bi,90Zr, 234U, 237Np or 243Am, have already been measured in the n_TOF facility at CERN,offering promising results. Nonetheless, the analysis of the sensitivity for the latest ND libraryreleases presented in Chapter 4 showed that other important isotopes and reaction channelswere overlooked in previous measurements, and that their related discrepancies have a majorimpact on ADS design. Some of these isotopes and reaction channels are:
∑ 238Pu, present in small quantities in conventional HLW (~2%). Its related ND shows largediscrepancies above 1 eV and has a strong impact on plutonium and especially on MAtransmutation schemes, being the daughter product of a neutron capture followed by b–-decays in 237Np and 241Am. The effect of these discrepancies is perceived in the variationof the multiplication coefficient, which may be as large as thousands of pcm in the caseof high concentrations of this isotope, as well as in the reaction rates, showing up to 30%discrepancies between libraries, and introducing a large uncertainty in the isotope’sinventory.
∑ 241Am, the most abundant MA isotope in commercial spent fuel after long burn-ups ormultiple recycling schemes. Large discrepancies in reaction rates (e.g. 15% neutroncapture) with an important effect on the multiplication of MA burners.
∑ 244Cm, responsible for most of the MA mid-term radiotoxicity, appears in significantquantities in plutonium elimination schemes. Its related ND presents large differences forthe entire energy range in all reactions. Reaction rates differ by more than 10% inTRADE, and it also presents a capture rate discrepancy of 32% in a MA fuel for fastsystems. Its accumulation may have important effects on the reprocessing of the fuel.
∑ 99Tc and 129I, the cross-sections of which are poorly known, give discrepancies of up to15% in capture rates and above 40% for (n, xn) reactions, and constitute the mostsignificant long-lived fission fragments (LLFFs) in terms of radiological hazard.
∑ Inelastic scattering cross-sections show large discrepancies for all isotopes due to thecomplexity of their measurement. This is an important reaction channel in the definitionof the neutron energy spectrum in fast systems, for example, showing discrepancies of upto 71% for 241Pu.
∑ Contributing to the neutron multiplication of the system and damage to the structures,experimental data for (n, xn) reactions is almost nonexistent. It seems particularlyrelevant for coolant and structural materials in fast systems, such as 206, 207, 208Pb and209Bi.

Chapter 7 Final Conclusions
204
These discrepancies clearly affect the reliability of the design calculations for ADSexperiments, including those in this dissertation, and in particular for MA burners. Hence, anyADS containing a significant quantity of these isotopes would be obliged to operate at a lowersubcritical level due to uncertainties in the burn-up reactivity swing. For example, an ADSfully loaded with MA may have to operate at least 3000 pcm below criticality (i.e. ksrc ª 0.97)at all times, particularly in the middle of the cycle when ~50% of the mass in the system canbe 238Pu and 244Cm.
Secondly, the validation of the ADS concept requires a preliminary step in order to integrateits different components into a single well-known system. The feasibility of this experiment(TRADE) has been demonstrated and neutronic design calculations performed. These showedthat for the innovative, solid ~30 kW spallation target design a maximum power deposition of~1 kW/cm3 should be expected under reference operating conditions. This means that noadditional cooling system is needed for the target. However, this implies that the experimentwill not be able to operate for long periods of time at nominal core power (200 kW) fordeeply subcritical configurations (e.g. ksrc ª 0.90). For the target activation, a total activity of~37 TBq is to be expected after a one year cool-down period and one year of irradiation atnominal power (~11 kW). The activity rapidly decays and 60 years after irradiation theactivity falls below 0.1 TBq and is dominated by tritium.
A detailed study of the radiological impact of the beam line transfer showed that, for thereference beam losses of 1 nA/m/s, 140 cm thick barite shielding would reduce the dose at theshielding surface to 7.5 mSv/h, below the legal maximum of 10 mSv/h for unlimited accessworking areas.
The neutronic characterisation of the TRADE experiment confirmed that it is safe to performsuch an experiment in the TRIGA core. The power peaking factors are moderate (~1.5 for ksrc
ª 0.977), avoiding large thermal stresses in the fuel elements. The availability of control rods,low energy output and very large reactivity feedbacks (for example, ~10 pcm/K) guaranteessafety for the large number of experiments that are to be performed in this system.
An important feature of TRADE is the longer neutron lifetime compared to EADF (50 msversus 1 ms). This fact allows reactivity insertions and events such as beam failures to beinvestigated at a lower response frequency (the reactor period in TRADE for ksrc ª 0.977 is ~2ms), and thus with a larger operational safety margin. This is an important issue consideringthat the exponential period of EADF is of the order of 40 ms, which would imply a total powerdrop for a 1 ms beam trip.
Moreover, the feasibility of LLFF and transuranic (TRU) transmutation in TRADE wasassessed. For the former, isotopes such as 79Se, 99Tc, 129I, 147Sm and perhaps 135Cs present

Chapter 7 Final Conclusions
205
transmutation half-lives between 7 and 30 yr for very thermal fluxes of ~1014 n/cm2/s. Thesevalues are quite promising, but still far from the 1.4 yr obtained in the TARC experiment. Onthe other hand, it seems clear that in order to achieve this transmutation efficiency, largeneutron fluxes and a very large isotopic dilution is required.
For the non-fissile TRUs, the fission-to-absorption ratio was shown to decrease with softerneutron fluxes. The use of special matrices to enhance the thermal flux, producing neutroncapture and fission in the daughter products before their decay, particularly 238Np (t1/2 ª 2.1 d)and 242Am (t1/2 ª 16 h), would require very large thermal fluxes (thus, higher enrichment),given that for a flux of 1015 n/cm2/s even their fission half-lives (3.8 d and 2.7 d, respectively)are longer than their decay half-lives. If those flux levels are not reached, the mass ofactinides destroyed in the cycle is negligible (~7% of the initial mass in TRADE), resulting inan actinide mixture that is significantly more radiotoxic (mainly due to 238Pu and 244Cm) thanthe initial one.
It seems clear that a thermal ADS would be easier to operate and control, and could producereasonable LLFFs transmutation rates, but so could a thermal critical reactor. Conversely, theuse of water as the coolant limits the neutron fluxes due to the small but relevant thermalneutron capture in the abundant 1H (thscapt ª 0.3 b) compared, for example, to the 0.5 mb of208Pb. The extension of the burn-up periods is also affected by the higher thscapt of the fissionfragments (FFs). Finally, such a device would be very inefficient in terms of TRUtransmutation due to the low fission-to-absorption ratio for most of the non-fissile actinides,~20% for 238Pu and 244Cm, ~10% for 240, 242Pu and ~5% for 237Np and 241, 243Am.
Therefore, the need for a fast system to efficiently transmute TRUs and reduce theaccumulated stockpile seems evident. Unfortunately, TRUs present much lower delayedneutron emission, compared to the 0.65% delayed fraction (b) in 235U or the 1.91% of 238U. Inparticular, the high concentrations of 238Pu (b ª 0.16%), 239Pu (b ª 0.21%) and 241Am (b ª0.14%) would degrade the control of a critical fast reactor, in which the prompt neutronlifetimes are orders of magnitude lower (~0.1 ms for a fast breeder reactor). Moreover, thenegative effect on reactivity produced by the broadening of the capture resonances withincreasing temperature (Doppler broadening) is rather small in fast systems, since theepithermal flux in these systems is ~4 orders of magnitude smaller than the fast flux and only238U and 232Th present distinctive capture resonances. Taking these facts into account, theimportance of developing a fast ADS is clear.
In this context, the experimental validation of the fast ADS concept producing significanttransmutation rates should take place in EADF. The neutronic analysis of this device showsimportant safety features. The low initial subcriticality level, i.e. ksrc ª 0.96, and the 18%plutonium concentration in the uranium-plutonium fuel, higher than the plutonium

Chapter 7 Final Conclusions
206
equilibrium concentration for this system, guarantee a neutron multiplication level well below1 throughout the burn-up. The very small peaking factors minimise the thermal stress in thefuel and assure a homogeneous burn-up.
The negative reactivity feedbacks of EADF (aT ª –1 pcm/K, aV ª –100 pcm/% for smallcoolant voids and aV ª –1500 pcm/% for a major coolant void) show the high passive safetyof the system. These numbers have special relevance when compared to helium-cooledsystems, which present a harder neutron energy spectrum slightly enhancing the transmutationrates but giving no void coefficient, and sodium-cooled reactors, where the transmutationrates are worse due to a softer spectrum and the void coefficient is, at best, close to 0.
Nevertheless, the use of uranium-plutonium fuel offers limited capabilities for eliminatingplutonium and increases the stockpile of MAs. The decrease in the initial fissile enrichmenthas to be compensated by fissile breeding to maintain reactivity levels for extended burn-ups.Producing plutonium and higher actinides in order to maintain the reaction to eliminateplutonium does not seem an efficient way of proceeding.
Therefore, two HLW elimination strategies in fast ADS were assessed: (a) the use of thoriumfuel ‘enriched’ with waste TRUs to reduce the HLW stockpile and produce significantquantities of energy, thus opening a gate to the progressive shift of the present uranium-basedcommercial fuel cycle towards thorium-based fuels; and (b) the partial decoupling of thecommercial stratum, which would deal with plutonium by using MOX and perhaps fastreactors, from the Partitioning and Transmutation stratum, which would deal with theelimination of the MAs produced in the commercial cycle.
Both strategies obviously offer advantages and disadvantages. The MA transmutation rateachieved in the MA burner is ~–46 kg/TW◊h, whereas an Energy Amplifier (EA) usingthorium-uranium fuel eliminates ~–28 kg/TW◊h of plutonium and ~–5 kg/TW◊h of MAs(EADF using uranium-plutonium fuel only achieves ~–8 kg/TW◊h elimination of plutoniumand produces ~+40 g/TW◊h of MAs).
This has certain implications for the commercial cycle. The EA thorium-uraniumtransmutation strategy entails ~30% of installed power being produced by EA, compared tothe ~3% of installed power from MA burners required by the double strata scheme. Scaled tothe 363 GWe/yr produced globally, the elimination of the MA waste being produced wouldrequire the construction of ~37 MA burners, producing ~13 GWe plus the extensive use ofMOX in LWRs, whereas the elimination of the HLW in EAs would involve the constructionof ~242 EA units. The added value of the latter scenario is the addition of ~145 GWe to thegrid, which would help meet increasing world energy demands and reduce dependence onfossil fuels.

Chapter 7 Final Conclusions
207
On the other hand, the partitioning process in the double strata strategy entails proliferationrisks due to the separation of plutonium from the HLW. This problem cannot be neglectedsince it would involve the separation of several hundreds of kilograms of highly fissileplutonium per reactor per year, increasing the risk of diversion.
Therefore, if the ADS experimental program continues successfully and assuming that thesecurity requirements in the partitioning phase are fulfilled, the double strata strategy could becommercially applicable at medium term (~30 yr) since it does not require the development ofa new fuel cycle. But the advantages in terms of availability and waste reduction of thethorium cycle are clear. Therefore, effort should be put into developing a commercial thoriumcycle. In this context, the double strata strategy could be an intermediate step towards theproduction of clean, virtually inexhaustible energy in completely different systems, such asthe EA.
7.2 Future Work
There is still a very large amount of research to be performed for the industrial validation ofthe transmutation of HLW in fast ADS. Hence, the following list is not exhaustive, butidentifies further research that could be performed based on this dissertation:
∑ An analysis of the sensitivity to ND of fast ADS during burn-up is quite important. Thisis especially true for MA burners, since the concentration of isotopes showing largedifferences in ND between current libraries, in particular 238Pu and 244Cm, increasesgreatly with burn-up. This could produce very large discrepancies in the reactorparameters when calculated with different libraries.
∑ The correlation between uncertainties in reaction cross-sections and reactivity feedbacksshould be analysed. Reactivity feedbacks are partially based on the broadening of theresonance cross-sections with temperature, and these are poorly known for manyisotopes, particularly for higher actinides.
∑ As mentioned before, the measurement of cross-sections for isotopes, such as 238Pu,241Am, 244Cm, and reactions, such as (n, xn) and inelastic scattering for any isotopesinvolved in HLW transmutation in fast systems, is a necessary step to improve accuracyin the design of these systems.
∑ The study of the discrepancies in b between ND libraries and its consequent measurementfor isotopes presenting large uncertainties. The delayed neutron fraction may haveimportant consequences in the control of fast systems loaded with large amounts of MAs,which generally show very little delayed neutron emission.

Chapter 7 Final Conclusions
208
∑ Analysis of a thorium-plutonium fuel load in EADF to study the behaviour of the systemand the transmutation rates to be expected. In fact, this is a possible set-up for a secondstage in EADF (XADT).
∑ A deeper assessment of LLFFs transmutation in different systems. The application of theTARC method is fast reactors seems quite promising, although the transmutation of 99Tcand 129I in LWRs should be assessed and, if possible, applied in the near future to reducethe stockpile of these elements.
∑ The precise design and optimisation of the fuel load of the MA burner concept seemsnecessary to develop the double strata scheme. More detailed definition of MA burneroperation and the length of the burn-up (trying to minimise the reprocessing step) are alsorequired. The different fuel options should be carefully studied, precisely defining itscomposition since some plutonium doping will be necessary to avoid large reactivityswings during the burn-up cycle.
∑ Finally, the study of these transmutation strategies for HLW stockpile elimination inspecific countries is essential to prove the economic viability of the process and to informthe decisions that will be taken in the near future in countries like France about the fate ofthe HLW.
7.3 Concluding Summary
The elimination of HLW is a crucial issue if nuclear power is to be seen as a publiclyacceptable energy source, particularly in the context of the growing world energy demands.HLW transmutation in ADS appears as an efficient and safe way of solving this problempermanently. There is a clear research roadmap towards the validation of this concept. Thedesign calculations for several of the experiments involved in this validation prove theirfeasibility. However, there are several technological issues to be resolved, requiring theintensification of the present research efforts in the field of HLW transmutation in ADS. Theinvolvement of the nuclear industry is also essential to successfully develop this technologyand introduce new fuel cycles in innovative systems.

Bibliography
209
Bibliography
* Papers to which the author contributed.
[1] C. Rubbia, J.A. Rubio, S. Buono, F. Carminati, N. Fiétier, J. Gálvez, C. Gelès, Y.Kadi, R. Klapisch, P. Mandrillon, J.-P. Revol, Ch. Roche, "Conceptual Design of afast Neutron Operated High Power Energy Amplifier", CERN/AT/95-44 (ET), 1995.See also C. Rubbia, "A High Gain Energy Amplifier Operated with fast Neutrons",AIP Conference Proceedings 346, International Conference on Accelerator-DrivenTransmutation Technologies and Applications, Las Vegas (NV), US, 1994.
[2] Intergovernmental Panel on Climate Change, “Climate Change 2001: SynthesisReport”, Cambridge University Press, Cambridge, UK, 2001.
[3] Nuclear Energy Agency (NEA), “Nuclear Power and Climate Change”, Organisationfor Economic Co-Operation and Development (OECD), 2000.
[4] Energy Information Administration (EIA), “International Energy Outlook 2003:World Energy Consumption”, DOE/EIA-0484, 2003.Also: http://www.eia.doe.gov/oiaf/ieo/world.html
[5] United Nations (UN), “Kyoto Protocol to the United Nations Framework Conventionon Climate Change”, FCCC/CP/1997/L.7/Add.1, Kyoto, Japan, 1997.
[6] BP Group, “Statistical Review of World Energy 2003”, BP Statistical Review ofWorld Energy, 2003. Also: http://www.bp.com.
[7] Commissariat à l’Énergie Atomique (CEA), “Memento sur l’Énergie – Energy DataBook 2001”, Service des Etudes Économiques, CEA Saclay, France, 2001.
[8] H.J. Cruickshank, “Module F14 Notes – Engineering for Sustainable Development”,Department of Engineering, University of Cambridge, UK, 2001.
[9] Nuclear Energy Agency (NEA), “Actinide and Fission Product Partitioning and

Bibliography
210
Transmutation: Status and Assessment Report”, Organisation for Economic Co-Operation and Development (OECD), 1999.
[10] J. Ahn, E. Greenspan, D.A. Roberts, P.L. Chambré, “Possibility of UndergroundAutocatalytic Criticality by Actinides in vitrified HLW”, International Conference onFuture Nuclear Systems, Global ’97, Yokohama, Japan, 1997.
[11] International Atomic Energy Agency (IAEA), “Underground Disposal of RadioactiveWaste, Basic Guidance”, IAEA Safety Series No. 54, Vienna, Austria, 1981.
[12] C. Rubbia, S. Buono, E. González, Y. Kadi, J.A. Rubio, “A Realistic PlutoniumElimination Scheme with Fast Energy Amplifiers and Thorium-Plutonium Fuel”,CERN/AT/95-53 (ET), 1995.
[13] I.S. Roxburg, “Geology of High-Level Nuclear Waste Disposal: An Introduction”,Chapman and Hall, 1987.
[14] F.J. Rahn, A.G. Adamantiades, J.E. Kenton, C. Braum, “A Guide to Nuclear PowerTechnology: A Resource for Decision Making”, John Wiley & Sons, 1984.
[15] S.Y.F. Chu, L.P. Ekström, R.B. Firest, “The Lund/LBNL Nuclear Data SearchVersion 2.0, February 1999”, http://nucleardata.nuclear.lu.se/nucleardata/toi/.
[16] World Nuclear Association, http://www.world-nuclear.org/info/reactors.htm.
[17] L.H. Baetslé, “Role and Influence of Partitioning and Transmutation on theManagement of Nuclear Waste Streams” OECD/NEA Report on P&T, N∞ 3, 1992.
[18] ICRP Publication 68, “Dose Coefficients for Intake of Radionuclides by Workers”,Vol. 20, N∞ 4, 1994.
[19] T. Mukaiyama, “Motivation and Programs for Transmutation of Nuclear Waste”,Frédéric Joliot – Otto Hahn Summer School 2002 Lectures, CEA - Cadarache,France, 2002.
[20] “The cost of high-level waste disposal in geological repositories”, OECD/NEA, 1993.
[21] C. Rubbia, S. Buono, Y. Kadi, J.A. Rubio, “Fast Neutron Incineration in the EnergyAmplifier as Alternative to Geologic Storage: the Case of Spain”, CERN/LHC/97-01(EET), 1997.
[22] M. Salvatores, “The Physics of Transmutation in Critical or Subcritical Reactors”,Comptes Rendus – Physique, Tome 3 (2002) – N∞ 7-8, Éditions Elsevier, 2002.
[23] The TARC Collaboration, “The TARC Experiment (PS211): Neutron-Driven Nuclear

Bibliography
211
Transmutation by Adiabatic Resonance Crossing”, CERN 99-11. Also: EuropeanCommission, “Neutron-driven Nuclear Transmutation by Adiabatic ResonanceCrossing”, European Commission Project Report, EUR 19117, 1999.
[24] G.T. Parks, “Module C1 Notes – Nuclear Power Engineering”, Department ofEngineering, University of Cambridge, UK, 2001.
[25] M. Eriksson, J.E. Cahalan, “Applicability of Passive Safety to Accelerator-DrivenSystems”, Nuclear Application for the New Millennium, AccApp/ADTTA '01, ANSWinter meeting, Reno (NV), US, 2001.
[26] Y. Kadi, J.P. Revol, “Design of an Accelerator-Driven System for the Destruction ofNuclear Waste”, Accelerator-Driven Systems for Energy Production and WasteIncineration: Physics, Design and Related Nuclear Data, Abdus Salam ICTP, 2002.
[27] “Energy Amplifier Demonstration Facility Reference Configuration: SummaryReport”, ANSALDO Nucleare, EA-B0.00-1-200 – Rev. 0, 1999.
[28] S. Andriamonje et al. Physics Letters B, 348, 697–709, 1995, and J. Calero et al.Nuclear Instruments and Methods A, 376, 89–103, 1996.
[29] “Status of the MTA Process”, Livermore Research Laboratory Report LRL-102, 1954.
[30] W.B. Lewis, “The Significance of the Yield of Neutrons from Heavy Nuclei Excited toHigh Energies”, Atomic Energy of Canada Limited Report AECL 968, 1952.
[31] E.O. Lawrence, E.M. McMillan, L.W. Álvarez, “Electro-nuclear Reactor”, UnitedStates Patent No. 2,933,442 Apr. 19, 1960.
[32] J.S. Gilmore, G.J. Russell, H. Robinson, R.E. Prael, “Fertile-to-Fissile and FissionMeasurements for Depleted Uranium and Thorium Bombarded by 800-MeV Protons”,Nuclear Science and Engineering, 99, 4152, 1988.
[33] T. Mukaiyama, “Omega Programme in Japan and ADS Development at JAERI”,Proceedings of an Advisory Group meeting, Taejon, Republic of Korea, IAEA –TECDOC – 1365, 1999.
[34] C.D. Bowman et al., “Nuclear Energy Generation and Waste Transmutation Using anAccelerator-Driven Intense Thermal Neutron Source”, Nuclear Instrumentation andMethods in Physics Research (Sec. A), A320, 336, 1992. Also as LA-UR-91-2601,Los Alamos National Laboratory (LANL) (NM), US, 1991.
[35] F. Venneri, C.D. Bowman, R. Jameson, “Accelerator-Driven Transmutation of Waste(ATW) A New Method for Reducing the Long-Term Radioactivity of Commercial

Bibliography
212
Nuclear Waste”, LA-UR93-752, LANL (NM), US, 1993.
[36] A. Fassò, A. Ferrari, P.R. Sala, “Electron-photon transport in FLUKA: Status”,invited talk in the Proceedings of the Monte Carlo 2000 Conference, Lisbon, October2000, A. Kling, F. Barao, M. Nakagawa, L. Tavora, P. Vaz (eds.), Springer-VerlagBerlin, p. 159-164, 2001.
[37] A. Fassò, A. Ferrari, J. Ranft, P.R. Sala, “FLUKA: Status and Prospective forHadronic Applications”, invited talk in the Proceedings of the Monte Carlo 2000Conference, Lisbon, October 2000, A. Kling, F. Barao, M. Nakagawa, L. Tavora, P.Vaz eds., Springer-Verlag Berlin, p. 955-960, 2001.
[38] Y. Kadi, “The EA-MC Monte Carlo Code Package”, in Proceedings of the FifthInternational Meeting on Simulating Accelerator Radiation Environment – SARE-5:Models and Codes for Spallation Neutron Sources, OECD Headquarters; Paris,France, 2000.
[39] M. Salvatores, M. Martini, I. Slessarev, R. Soule, J.C. Cabrillat, J.P. Chauvin, P.Finck, R. Jacqmin, A. Tchistiakov, “MUSE-1: A first experiment at MASURCA tovalidate the physics of subcritical multiplying systems relevant to ADS”, inProceedings of the Second International Conference on Accelerator DrivenTransmutation Technologies and Applications (ADTTA’96), Kalmar, Sweden, 1996.
[40] R. Soule, M. Salvatores, R. Jacqmin, M. Martini, J.F. Lebrat, P. Bertrand, U. Broccoli,V. Peluso, “Validation of neutronic methods applied to the analysis of fast subcriticalsystems: the MUSE-2 experiments” in Proceedings of the International Conference onFuture Nuclear Systems (Global’97), Yokohama, Japan, Vol. 1, pp. 639-645, 1997.
[41] J.F. Lebrat et al., “Experimental investigation of multiplying subcritical media inpresence of an external source operating in pulsed or continuous mode: the MUSE-3experiment” in Proceedings of the Third International Conference on AcceleratorDriven Transmutation Technologies and Applications (ADTTA’99), Prague, CzechRepublic, 1999.
[42] G. Aliberti, G. Imel, G. Palmiotti, “MUSE-4 Experiment Measurements andAnalysis”, ANL-AFCI-092, Argonne National Laboratory (ANL), US, 2003.
[43] Technical Working Group on ADSs, “Interim Report of the Technical Working Groupon Accelerator Driven Subcritical Systems”, Ente per le Nuove tecnologie, l’Energia el’Ambiente (ENEA), Italy, October 1998. Also: http://www.enea.it/com/ADS/
[44] Technical Working Group on ADSs, “Overview of the Ongoing Activities in Eaurope

Bibliography
213
snd Recommendations of the Technical Working Group on Accelerator-DrivenSubcritical Systems”, ENEA, September 1999. Also: http://www.enea.it/com/ADS/
[45] European Technical Working Group on ADS, “Nuclear Waste Transmutation usingAccelerator-Driven Systems” , ENEA, Italy, February 2000. Also:http://www.enea.it/com/ADS/
[46] European Technical Working Group on ADS, “A European Roadmap for DevelopingAccelerator-Driven Systems (ADS) for Nuclear Waste Incineration”, ENEA, ISBN88-8286-008-6, April 2001. Also: http://www.enea.it/com/ADS/
[47] J.M. Lagniel, S. Joy, J.L. Lemarie, A.C. Mueller, “IPHI, The Saclay High-IntensityProton Injector Project”, Proceedings of the Particle Accelerator Conference PAC’97,Vancouver, Canada, May 1997.
[48] A. Pisent et al., “TRASCO 100 MeV High Intensity Proton Linac”, Proceedings ofEPAC 2000, Vienna, Austria, June 2000.
[49] G.S. Bauer, M. Salvatores, and G. Heusener, “MEGAPIE, a 1 MW Pilot Experimentfor a Liquid Metal Spallation Target”, to be published in Proceedings of IWSMT-4 (J.Nucl. Mat.) and Proc. ICANS XV (JAERI-KEK report).
[50]* The TRADE Collaboration, “Triga Accelerator Driven Experiment (TRADE): FinalFeasibility Report”, ENEA Report, April, 2002.
[51] K.H. Beckurts, K. Wirtz, “Neutron Physics”, Springer-Verlag, 1964.
[52] “CLEFS CEA - N∞46 - Printemps 2002”, Commissariat à l’Énergie Atomique(CEA), France, 2002.
[53] W. Gudowski, “Reactor Physics: Program of the lectures”, Royal Institute ofTechnology (KTH), Sweden, 1997.
[54] J.R. Lamarsh, A. Baratta, “Introduction to Nuclear Engineering”, 3rd Edition, PrenticeHall, 2001.
[55] J.R. Lamarsh, “Introduction to Nuclear Reactor Theory”, Addison-Wesley, 1966.
[56] J.L. Muñoz-Cobo, A. Escrivà, “Física Nuclear”, Universitat Politècnica de València –99.4078, Spain, 1999.
[57] C. Rubbia, "The Energy Amplifier: A Description for the Non-Specialists",CERN/ET/96-01, 1996.
[58] M. Winter, http://www.webelements.com/webelements/elements/text/Th/geol.html,

Bibliography
214
The University of Sheffield and Webelements Ltd, UK, 2003.
[59] W.M. Stacey, “Nuclear Reactor Physics”, John Wiley & Sons, 2001.
[60] C. Rubbia et al., “A high Resolution Spallation driven Facility at the CERN-PS tomeasure Neutron Cross Sections in the Interval from 1 eV to 250 MeV”,CERN/LHC/98-02 (EET), 1998.
[61] S. Atzeni, Y. Kadi and C. Rubbia, “Statistical Fluctuations in Monte CarloSimulations of the Energy Amplifier”, CERN/LHC/97-12 (EET), 1997.
[62] K.S. Krane, “Introductory Nuclear Physics”, John Wiley & Sons, 1987.
[63] F. Carminati, I. Goulas, J.P. Revol, “A Nuclear Data Base for the EA Monte Carlo”,CERN/AT/EET 95-008, 1995.
[64] C. Rubbia, “Resonance enhanced neutron captures for element activation and wastetransmutation”, CERN-LHC-97-004-EET, Geneva, 1997. See also: P. Froment, MCogneau, T. Delbar, G. Ryckewaert, I Tilquin, J. Vervier, “The production ofradioisotopes for medical applications by the adiabatic resonance crossing (ARC)technique”, Nuclear Instruments Methods Phys. Res., A 493 (2002) 165-175.
[65]* C. Rubbia, A Herrera-Martínez, Y. Kadi, “Humanitarian Demining: 10.8 MeVCharacteristic Gamma Detection from 14N”, paper in preparation.
[66] C. Rubbia, “Report of the Working Group on a Preliminary Assessment of a NewFission Fragment Heated Propulsion Concept and its Applicability to MannedMissions to the Planet Mars” Italian Space Agency, Rome, Italy, April 1999.
[67] ENDF-102, “Data Formats and Procedures for Evaluated Nuclear Data File ENDF-6” , Cross-section Evaluation Working Group, BNL-NCS-44945, Rev.2/97,Brookhaven National Laboratory (BNL) (NY), US, 1997.
[68] “EXFOR, database of experimental nuclear reaction cross-section”, IAEA NuclearData Section, 2004. Also: http://www-nds.iaea.or.at/zvd/ andhttp://www.nndc.bnl.gov/exfor/
[69] P.F. Rose (Ed.): "ENDF-201, ENDF/B-VI Summary Documentation", BNL-NCS-17541, 4th Edition (1991). “Revision 8”, BNL (NY), US, 2001.
[70] K. Shibata et al., "Japanese Evaluated Nuclear Data Library Version 3 Revision-3:JENDL-3.3”, J. Nucl. Sci. Technol., 39, 1125, 2002.

Bibliography
215
[71] R. Jacqmin, R. Forrest, J. Rowlands, A. Nouri and M. Kellett: "Status of the JEFF-3Project”, Proceedings of the International Conference on Nuclear Data for Scienceand Technology, Vol. 1, p.54, 2002.
[72] S. Ganesan, “A review of the current status of nuclear data for major and minorisotopes of the thorium cycle”, Proceedings of the International Topical Meeting onAdvances in Reactor Physics and Mathematics and Computation into the NextMillennium, Pittsburgh (PA), US, 2000.
[73] M. Dahlfors, Y. Kadi, “Sensitivity Analysis of Neutron Cross Sections Relevant forAccelerator-Driven Systems”, Journal of Nuclear Science and Technology,Supplement 2, p. 1198-1201, 2002. Also: C. Rubbia, M. Dahlfors, Y. Kadi,“Sensitivity Analysis of Neutron Cross Sections Relevant for Accelerator-DrivenSystems”, in the Management Report of the n_TOF-ND-ADS EC programme undercontract no. FIKW-CT-2000-00107.
[74]* A. Herrera-Martínez, M. Dahlfors, Y. Kadi, G.T. Parks, “Importance of NeutronCross-sections for Transmutation”, Proceedings of the International Workshop onNuclear Data for the Transmutation of Nuclear Waste (TRAMU), ISBN 3-00-012276-1, GSI-Darmstadt, Germany, September 2003.
[75]* Y. Kadi, A. Herrera-Martínez, M. Dahlfors, “The TRADE Experiment: Importance ofNeutron Cross-Sections”, Proceedings of the International Conference on the Physicsof Fuel Cycles and Advanced Nuclear Systems: Global Developments, PHYSOR2004, Chicago (IL), US, April 2004.
[76] V. Henzl et al., “Study of 129I Transmutation by High Energy Neutrons Produced inLead Spallation Target”, Proceedings of the International Workshop on Nuclear Datafor the Transmutation of Nuclear Waste (TRAMU), ISBN 3-00-012276-1, GSI-Darmstadt, Germany, September 2003.
[77] The n_TOF Collaboration, “Proposal for a Neutron Time of Flight Facility”,CERN/SPSC 99-8, CERN, 1999.
[78]* C. Borcea, P. Cennini, M. Dahlfors, A. Ferrari, G. García-Muñoz, P. Haefner, A.Herrera-Martínez, Y. Kadi, V. Lacoste, E. Radermacher, F. Saldaña, V. Vlachoudis, L.Zanini, C. Rubbia, S. Buono, V. Dangendorf, R. Nolte, M. Weierganz, “Results fromthe Commissioning of the n_TOF Spallation Neutron Source at CERN”, NuclearInstruments and Methods in Physics Research A 513 (2003) 524–537, 2003.
[79]* The n_TOF Collaboration, “CERN n_TOF Facility: Performance Report”,CERN/INTC-O-011; INTC-2002-037; CERN-SL-053-ECT, 2003.

Bibliography
216
[80]* V. Vlachoudis, C. Borcea, S. Buono, P. Cennini, M. Dahlfors, A. Ferrari, A. Herrera-Martínez, Y. Kadi, V. Lacoste, E. Radermacher, C. Rubbia, L. Zanini,“Radioprotection and Shielding Aspects of the n_TOF Spallation Source”, CERN-SL-2002-010-ECT and Proceedings of the 6th Meeting on Shielding Aspects ofAccelerators, Targets and Irradiation Facilities, SATIF-6 SLAC (CA), US, April,2002.
[81] R. Plag, M. Heil, F. Kaeppeler, P. Pavlopoulos, R. Reifarth, and K. Wisshak, “Anoptimized C6D6 detector for studies of resonance-dominated (n, g) cross sections”,Nuclear Instruments and Methods A, 2002.
[82] M. Heil, et al., Nuclear Instruments and Methods A, 459, 229, 2001.
[83] C. Stéphan, L. Ferrant, B. Berthier, S. David, L. Tassan-Got, C.O. Bacri, F. Rejmund,C. Moreau and the n-TOF Collaboration, “Neutron induced fission cross-sectionmeasurements”, Journal of Nuclear science and Technology, Supplement 2, 276,2002.
[84]* The n_TOF Collaboration, “A Detailed Study of Hyperdeformed States of Uranium inthe 234U(n,f) Reaction”, CERN/INTC 2002-022, P145-Add.1, 2002.
[85] P. Cennini, V. Lacoste, “Proposal for a Fission Detector based on the measurementof the ionization produced by the absorption in gas of the Fission Fragments”, SL-Note-2000-006-EET, 2000.
[86]* P. Cennini et al., “High Resolution Measurements of Neutron Induced Fission Cross-sections of 236, 238U, 232Th and 237Np from 1 eV to 1 MeV”, to be published in theProceedings of the 12th International Seminar of Interaction of Neutrons with Nuclei(ISINN-12), Dubna, Russia, 2004.
[87] C. Domingo-Pardo, PhD Thesis, University of Valencia (Spain), 2005.
[88] Training, Research, Isotopes, General Atomics (TRIGA): General Atomics officialwebsite http://triga.ga.com/
[89] L. Di Palo, G. Focaccia, E. Lo Prato, F. Marsili, M. Perni, A. Verri, “RC-1REATTORE 1 MW – Progetto Definitivo e Rapporto di Sicurezza”, CNEN CentroStudi Nucleari Casaccia, 1966.
[90]* The International TRADE Collaboration, “2nd TRADE Progress Report”, ENEAReport, March 2003.
[91]* F. Pisacane, G. Bianchini, N. Burgio, M. Carta, A. D’Angelo, A. Santagata, S. Monti,

Bibliography
217
Y. Kadi, A. Herrera-Martínez, L. Zanini, M. Salvatores, “Evaluation of the SpallationTarget Design Characteristics for the Triga Accelerator-Driven Experiment(TRADE)”, Proceedings of the Accelerator Applications in a Nuclear RenaissanceConference, AccApp 03, San Diego (CA), US, June 2003.
[92]* Y. Kadi, C. Rubbia, P. Agostini, M. Carta, A. Herrera-Martínez, C. Krakowiak, L.Maciocco, S. Monti, M. Palomba, F. Piscane, M. Salvatores, “The TRADEExperiment: Status of the Project and Physics of the Spallation Target”, Proceedingsof the International Conference on the Physics of Fuel Cycles and Advanced NuclearSystems: Global Developments, PHYSOR 2004, Chicago (IL), US, April, 2004.
[93]* A. Herrera-Martínez A. Ferrari, Y. Kadi, L. Zanini, G.T. Parks, C. Rubbia, N. Burgio,M. Carta, A. Santagata, L. Cinotti, “Radiological Impact of the TRiga Accelerator-Driven Experiment (TRADE)”, CERN-SL-2002-007-ECT and Proceedings of the 12th
Biennial RPSD Topical Meeting, Santa Fe (NM), US, April, 2002.
[94]* L. Zanini, A. Ferrari, A. Herrera-Martínez, Y. Kadi, C. Rubbia, N. Burgio, M. Carta,A. Santagata, L. Cinotti, “Radioprotection calculations for the TRADE experiment”,CERN-SL-2002-043-ECT and Proceedings of the 3rd International Workshop ofUtilization and Reliability of High Power Proton Accelerators, Santa Fe (NM), US,May 2002.
[95]* L. Picardi, C. Ronsivalle, M. Salvatores, S. Monti, L. Cinotti, N. Burgio, M. Carta, Y.Kadi, N. Meda, G. Locatelli, A. Santagata, L. Zanini, A. Herrera-Martínez, “Design ofthe Proton Beam Line for the TRADE Experiment”, Proceedings of the AcceleratorApplications in a Nuclear Renaissance Conference, AccApp 03, San Diego (CA), US,June 2003.
[96]* L. Zanini, A. Herrera-Martínez, Y. Kadi, “Preliminary calculations of the radiationdamage of the permanent magnets for TRADE”, SL-2002-037-ECT, 2002.
[97] M. Carta, “TRADE – Progress in Neutronics”, talk in TRADE status meeting, ENEA– Rome, September 2003.
[98] D. G. Naberejnev, G. Imel, G. Palmiotti, M. Salvatores, “Physics study of the TRADE:TRIGA Accelerator Driven Experiment”, ANL-AFCI-091, ANL, US, September2003.
[99]* C. Rubbia, M. Carta N. Burgio, C. Ciavola A. D’Angelo, A. Dorado, A. Festini, S.Monti, A. Santagata, F. Troiani, M. Salvatores, M. Delpech, Y. Kadi, A. Ferrari, A.Herrera-Martínez, L. Zanini, G. Imel, “Preliminary Neutronic Analyses of the TRIGA-ADS Demonstration Facility”, in Nuclear Science and Engineering (NSE): Vol 148,

Bibliography
218
pag 103-123 (Sept 2004); also in Proceedings of the International Conference on theNew Frontiers of Nuclear Technology: Reactor Physics, Safety and High-PerformanceComputing, PHYSOR 2002, Seoul, Korea, October, 2002.
[100] “CLEFS CEA - N∞46 - Printemps 2002”, Commissariat à l’Énergie Atomique(CEA), France, 2002.
[101] Nuclear Energy Agency, “Actinide and Fission Product Partitioning andTransmutation”, Seventh Information Exchange Meeting, Jeju, Republic of Korea,October 2002.
[102] Y. Kim, R.N. Hill, W.S. Yang, H. Kahlil, “Transmutation of Long-Lived FissionProducts in the ATW System”, Proceedings of the Actinide and Fission ProductPartitioning and Transmutation: Seventh Information Exchange Meeting, Jeju,Republic of Korea, Nuclear Energy Agency, October 2002.
[103] A.A. Kozar et al., “The Achievement of high 99Tc Transmutation Rates in the SMResearch Reactor”, Proceedings of the Actinide and Fission Product Partitioning andTransmutation: Seventh Information Exchange Meeting, Jeju, Republic of Korea,Nuclear Energy Agency, October 2002.
[104] G. De Antoni, ANSALDO Nucleare (private communication).
[105] S. Glasstone, A. Sesonske, “Nuclear Reactor Engineering”, 4th Edition, Chapman &Hall, 1994.
[106] M. Kauchi, Y. Shimazu, “Optimal Burnable Poison-Loading in a PWR with CarbonCoated Particle Fuel”, Journal of Nuclear Science and Technology, Vol. 40. No. 1, p.22-29, January, 2003.
[107] T. Ogawa, “Dedicated Fuels for Transmutation: Nitrides and Alloys”, Frédéric Joliot– Otto Hahn Summer School 2002 Lectures, CEA - Cadarache, France, 2002.