Performance of Indian Manufacturing in the Post Reform Period
32
Munich Personal RePEc Archive Performance of Indian Manufacturing in the Post Reform Period Gupta, Poonam and Kumar, Utsav 10 September 2010 Online at https://mpra.ub.uni-muenchen.de/24898/ MPRA Paper No. 24898, posted 14 Sep 2010 11:36 UTC
-
Upload
khangminh22 -
Category
Documents
-
view
2 -
download
0
Transcript of Performance of Indian Manufacturing in the Post Reform Period

Munich Personal RePEc Archive
Performance of Indian Manufacturing in
the Post Reform Period
Gupta, Poonam and Kumar, Utsav
10 September 2010
Online at https://mpra.ub.uni-muenchen.de/24898/
MPRA Paper No. 24898, posted 14 Sep 2010 11:36 UTC

1
Performance of Indian Manufacturing in the Post Reform Period
Poonam Gupta and Utsav Kumar
1
Abstract
Many emerging countries in recent decades have relied on a development strategy that focused primarily on promoting the manufacturing sector and the exports of manufactured goods. However, an acceleration of growth of output and employment in manufacturing has eluded India. This is despite the fact that the central focus of the reforms in the 1980s and 1990s was to unshackle the manufacturing sector. Instead it is the services sector which has grown rapidly, contributing about two-third of GDP growth in recent years. This paper discusses the reasons behind the modest performance of the manufacturing sector in India post reforms. It argues that there are many factors that have inhibited the growth of industrial sector in India. One major factor is the rigid and strict labor laws which have affected the industrial performance in a number of ways, by keeping the size of the establishments small, by not encouraging the production of labor intensive goods, by pushing activities to the unorganized sector, and by keeping the Indian industry uncompetitive. Besides the labor laws other factors that are responsible for the modest performance of the manufacturing sector include difficulty in the acquisition of land for industrial use, inadequate financing and infrastructure, and cumbersome business climate. The paper presents arguments and evidence which shows the importance of these factors. Keywords: Delicesning, employment, growth, India, infrastructure, labor market regulations, liberalization, manufacturing, reforms, services
1 Poonam Gupta is a Professor at the Indian Council for Research on International Economic Relations and Utsav Kumar is a consultant with the Asian Development Bank (Manila). We would like to thank Rana Hasan for collaboration on earlier projects (Gupta et al., 2008 and 2009) from which we draw at various places in this paper. We would also like to thank Chetan Ghate and an anonymous referee for several useful comments. The views expressed here are those of the authors and do not represent the views of the Asian Development Bank, its Executive Directors, or the countries that they represent. Correspondence email addresses: [email protected] and [email protected], respectively.
2
I. Introduction
Many emerging countries in recent decades, including many East Asian countries and most recently China, have relied on a development strategy that focused primarily on promoting the manufacturing sector and the exports of manufactured goods. This is what India had hoped to achieve when it introduced substantial product market reforms in its manufacturing sector starting in the mid 1980s. Large payoffs were expected in the form of higher growth and employment generation after these policy reforms were introduced. However, the payoffs till date have been limited. India, no doubt, has grown impressively in the last fifteen years, but the main contribution to growth has come from the services sector rather than from the manufacturing sector. Moreover, within manufacturing it is the relatively capital- or skill-intensive industries, not the labor-intensive ones that have grown faster, contrary to what one would expect in a labor abundant country like India. One of the main components of reforms in India was the liberalization of the industrial licensing regime, or “delicensing”. Under the Industries Development and Regulatory Act of 1951 every investor over a very small size needed to obtain a license before establishing an industrial plant, adding a new product line to an existing plant, substantially expanding output, or changing a plant’s location. Over time, many economists and policymakers began to view the licensing regime as generating inefficiencies and rigidities that were holding back Indian industry. The process of delicensing started in 1985 with the dismantling of industrial licensing requirements for a group of manufacturing industries. Delicensing reforms accelerated in 1991, and by the late 1990s virtually all industries had been delicensed. Other major reforms that have been introduced in the Indian industrial sector include liberalization of trade regime, abolition of policies which reserved certain sectors for small scale industries, and removal of barriers to the inflow of foreign capital. There are several factors which are believed to have limited the gains from reforms in India. These include rigid labor market institutions, regulatory burden which makes not only entry but also the exit of firms very difficult, lack of adequate infrastructure, unavailability of adequate financing due to underdeveloped financial markets, and perhaps the lack of political or administrative will to implement some of the reforms that have been announced. Difficulty in the acquisition of land has been experienced in recent years by the businesses in their attempts to set up large production units. Another factor that has been highlighted in the firm level surveys is the scarcity of skilled labor. This may not indicate the lack of labor per se but perhaps an indication of the difficulty of finding workers with the “right” skill set. As the skill requirement of the manufacturing sector increases, scarcity of skills may come up as a constraint going forward. In this paper we discuss the empirical evidence which shows the way in which various factors have affected the industrial performance. There are several papers in the literature
3
(Aghion et al. (2006), Besley and Burgess (2004), Krueger (2007), Gupta et al. (2008 and 2009)) which discuss the factors affecting the growth in the industrial sector and some of them present systematic empirical evidence as well. One caveat of the empirical work on related issues is that due to data limitations as well as the difficulty in establishing the counterfactual, it is not quite possible to show the effects of these factors on industrial performance very precisely. For example, labor market regulations can affect the performance of the manufacturing sector through a variety of channels such as deterring entry, especially into the labor intensive sectors; encouraging firms to keep their size small, or worse still keeping their size so small that they operate in the informal sector; but none of the papers have managed to show these effects empirically.2 Based on the available evidence it is also not possible to quantify the relative gains that can be expected from relaxing each one of the constraints mentioned above. Our view is that it is the whole gamut of reforms, and not just partial reforms dealing with only some of the issues listed above, that would help turn the industrial sector around in India. Just as merely easing the entry barriers in the past has not proved to be a sufficient condition for faster growth in the sector, isolated reforms on any of these counts may not suffice as well. For example, even if the process of land acquisition for setting up industrial units is streamlined and the land can be acquired easily, unless labor market reforms are carried out as well, making it feasible for the firms to lay off workers or to close the production unit entry into the sector would remain limited. In India reforms are typically implemented only after they have been subject to a lot of debate and after some sort of a political consensus is reached on them. Since the federal governments in the recent past have been formed by a coalition of different political parties, representing different constituencies and different ideologies, the consensus building on reforms has become politically that much more important, and takes that much longer. The gestation lag in implementing the reforms, i.e., the time it takes from the initiation of the groundwork on a major reform proposal, to the time it is discussed and a consensus is built and it is finally approved by the legislators and implemented, is significant. Unfortunately, with respect to some of the crucial reforms, such as the ones related to the labor market, the groundwork has not even started. Thus the likelihood that some of the key constraints to the growth of manufacturing sector would be removed in the foreseeable future is small. A more likely scenario is that the current growth paradigm in the industrial sector would continue.
2 The registered units are covered annually by the Annual Survey of Industries (ASI), whereas the unorganized sector is surveyed every five years by the National Sample Survey Organization (NSSO). The data from the two sources are not directly comparable. Data on aggregate organized and unorganized manufacturing at the all India level and states is provided in the national accounts. Most studies related to the performance of manufacturing sector in India focus on the registered manufacturing sector, since a lack of comparable annual data precludes any detailed study of the unorganized sector and its comparison with the organized sector.
4
The rest of the paper is organized as follows: Section II compares the Indian growth experience across sectors with the cross country experience. Section III compares the Indian manufacturing sector with that in selected other countries. Section IV provides an overview of the changes in the regulatory framework introduced in the industrial sector in India and discusses the empirical evidence which shows how these regulatory changes have affected the manufacturing sector. Section V discusses the factors that have inhibited the growth in the industrial sector. Section VI looks at the way some of these factors have affected the relative size of the services and industrial sectors. The last section concludes.
II. Growth and Structural Transformation in India in Context with the
International Experience3
Many observers (for example, Gordon and Gupta (2004), Kochhar et al. (2006), and more recently Eichengreen and Gupta (2010)) have documented the pattern of structural transformation in India and have shown that while India seems to have left behind its days of the Hindu-growth rate and has grown rapidly in recent years, its industrial sector has underperformed the services sector. Thus the share of industrial sector in GDP has remained more or less constant, while that of services has increased, and agriculture has declined. Figure 1 shows the shares of agriculture, industry, and services sectors in GDP in India since independence. The share of agriculture has steadily declined from 55 per cent in 1950-51 to less than 18 per cent in 2007-08. The share of industry, on the other hand, increased rapidly in the first 15 years after independence, rather modestly from mid 1960s through the early 1990s, and has stagnated since then. Meanwhile, the share of the service sector has increased from 30 per cent of GDP in 1950 to 55 per cent in 2007-08, if anything at an accelerating pace as the period progressed.4
Figure 1: Shares of Agriculture, Industry and Services in India
3 This section draws from Eichengreen and Gupta (2009) and Eichengreen and Gupta (2010). 4 CSO, the main source of data for GDP growth and sectoral growth rates in India, defines agriculture as including agriculture, and forestry and fishing; and industry as manufacturing, electricity, gas and water, mining and quarrying and construction. Year 2007-08 refers to the period April 2007-March 2008, we alternatively refer to it as 2007.

5
10
20
30
40
50
60
1950 1960 1970 1980 1990 2000 2010year
Agrculture Industry
Services
Source: Central Statistical Organization, India.
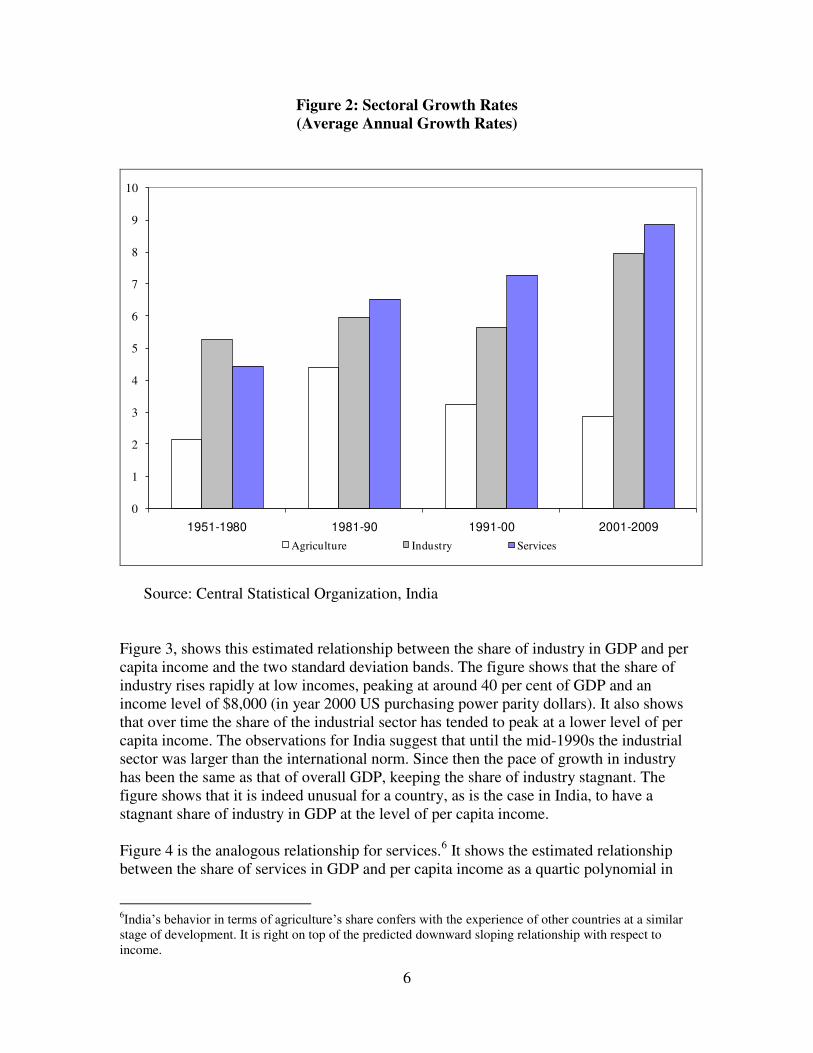
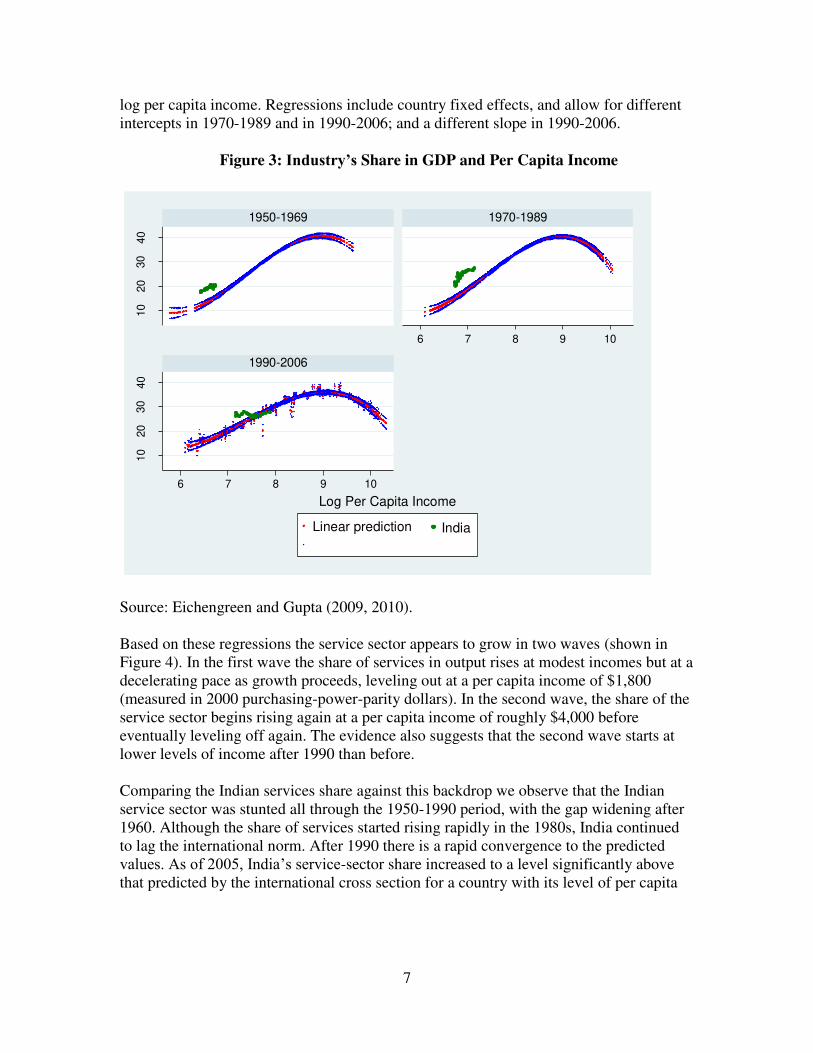
Figure 2 shows the average growth rates of agriculture, services, manufacturing and industry over these periods. It shows even more clearly how the growth rate of services has accelerated while that of agriculture has declined. The growth of industry has been more modest than that of services, averaging 6 per cent during the 1990s and though a little higher since the turn of the century, growth in the industrial sector still remains below that of the services sector. Has India’s pattern of development been unusual in anyway? Eichengreen and Gupta (2009, 2010) use data for 80 countries from 1950-2006 to compare the evolution of the shares in GDP of the three main sectors, namely, agriculture, industry, and services, in India with the experience of other countries. They estimate the relationship between the share of industry in GDP and per capita income as a cubic polynomial in log per capita income. Regressions include country fixed effects and allow for a different intercept in 1970-1989 as well as 1990-2006; and a different slope in 1990-2006.5
5 They use data from the World Development Indicators, which, consistent with the CSO, defines agriculture as including agriculture, and forestry and fishing; and industry as manufacturing, electricity, gas and water, mining and quarrying and construction. For further details see Eichengreen and Gupta (2009, 2010).
6
Figure 2: Sectoral Growth Rates
(Average Annual Growth Rates)
0
1
2
3
4
5
6
7
8
9
10
1951-1980 1981-90 1991-00 2001-2009
Agriculture Industry Services
Source: Central Statistical Organization, India
Figure 3, shows this estimated relationship between the share of industry in GDP and per capita income and the two standard deviation bands. The figure shows that the share of industry rises rapidly at low incomes, peaking at around 40 per cent of GDP and an income level of $8,000 (in year 2000 US purchasing power parity dollars). It also shows that over time the share of the industrial sector has tended to peak at a lower level of per capita income. The observations for India suggest that until the mid-1990s the industrial sector was larger than the international norm. Since then the pace of growth in industry has been the same as that of overall GDP, keeping the share of industry stagnant. The figure shows that it is indeed unusual for a country, as is the case in India, to have a stagnant share of industry in GDP at the level of per capita income.
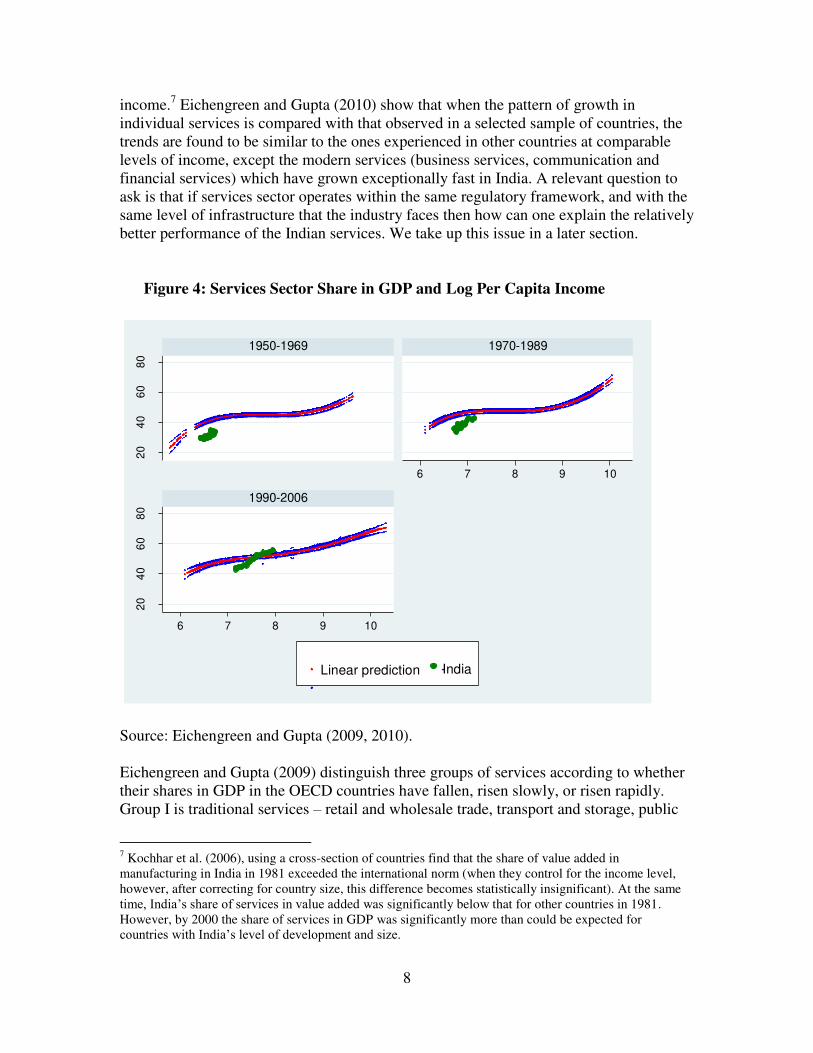
Figure 4 is the analogous relationship for services.6 It shows the estimated relationship between the share of services in GDP and per capita income as a quartic polynomial in
6India’s behavior in terms of agriculture’s share confers with the experience of other countries at a similar stage of development. It is right on top of the predicted downward sloping relationship with respect to income.
7
log per capita income. Regressions include country fixed effects, and allow for different intercepts in 1970-1989 and in 1990-2006; and a different slope in 1990-2006.
Figure 3: Industry’s Share in GDP and Per Capita Income
10
20
30
40
10
20
30
40
6 7 8 9 10
6 7 8 9 10
1950-1969 1970-1989
1990-2006
Linear prediction India
Log Per Capita Income
Source: Eichengreen and Gupta (2009, 2010).
Based on these regressions the service sector appears to grow in two waves (shown in Figure 4). In the first wave the share of services in output rises at modest incomes but at a decelerating pace as growth proceeds, leveling out at a per capita income of $1,800 (measured in 2000 purchasing-power-parity dollars). In the second wave, the share of the service sector begins rising again at a per capita income of roughly $4,000 before eventually leveling off again. The evidence also suggests that the second wave starts at lower levels of income after 1990 than before.
Comparing the Indian services share against this backdrop we observe that the Indian service sector was stunted all through the 1950-1990 period, with the gap widening after 1960. Although the share of services started rising rapidly in the 1980s, India continued to lag the international norm. After 1990 there is a rapid convergence to the predicted values. As of 2005, India’s service-sector share increased to a level significantly above that predicted by the international cross section for a country with its level of per capita
8
income.7 Eichengreen and Gupta (2010) show that when the pattern of growth in individual services is compared with that observed in a selected sample of countries, the trends are found to be similar to the ones experienced in other countries at comparable levels of income, except the modern services (business services, communication and financial services) which have grown exceptionally fast in India. A relevant question to ask is that if services sector operates within the same regulatory framework, and with the same level of infrastructure that the industry faces then how can one explain the relatively better performance of the Indian services. We take up this issue in a later section.
Figure 4: Services Sector Share in GDP and Log Per Capita Income
20
40
60
80
20
40
60
80
6 7 8 9 10
6 7 8 9 10
1950-1969 1970-1989
1990-2006
Linear prediction India
Source: Eichengreen and Gupta (2009, 2010). Eichengreen and Gupta (2009) distinguish three groups of services according to whether their shares in GDP in the OECD countries have fallen, risen slowly, or risen rapidly. Group I is traditional services – retail and wholesale trade, transport and storage, public
7 Kochhar et al. (2006), using a cross-section of countries find that the share of value added in manufacturing in India in 1981 exceeded the international norm (when they control for the income level, however, after correcting for country size, this difference becomes statistically insignificant). At the same time, India’s share of services in value added was significantly below that for other countries in 1981. However, by 2000 the share of services in GDP was significantly more than could be expected for countries with India’s level of development and size.

9
administration and defense – whose share in GDP has fallen in the advanced countries. Group II is a hybrid of traditional and modern services consumed mainly by households – education, health and social work, hotels and restaurants, and other community, social and personal services – whose share has risen linearly with per capita income. Group III is made up of modern services consumed by the household and corporate sectors – financial intermediation, computer services, business services, communications, and legal and technical services – whose share in GDP in the OECD countries has risen rapidly.
Service-sector growth in India is widespread across activities. However, the fastest growing activities are business services, communication and banking, all of which belong to Group III. Business services, which include computer-related services, machinery rental, accounting, legal services, technical services, and research, of which computer services (which accounted for more than four-fifths of business services in 2008-09) is the single fastest-growing segment. Financial services include banking and insurance, with banking being the largest and fastest growing. Other rapidly growing sectors include hotels, restaurants, education, health (Group II), and trade and transport (Group I). The transport sector includes road transport, railway transport, air transport and water transport. The most dynamic of these is road transport, which has increased six-fold since early 1990s. The stagnant service sectors have been public administration and defense, whose growth seems to have leveled off, and miscellaneous other personal services.
Eichengreen and Gupta (2010) show that the share of Group I services stagnated
following an early period of rapid growth. In contrast, the share of Group II continued growing steadily, while that of Group III has accelerated since 1990. On balance, then, India has been moving in the direction of higher-tech services.
Some observers have dismissed the growth of modern services on the grounds
that these activities constitute only a small share of output and therefore contribute only modestly to the growth of GDP. Eichengreen and Gupta (2010) show that the contribution of communication, business services, financial services, education, health and hotels and restaurants has in fact risen to the point where it accounted for more than four percentage points of growth to services (roughly half of total growth) in 2000-08. These activities alone explain most of the acceleration in services sector growth. The contribution of trade, transport, public administration and defense to the growth of services has remained stable since1980s, indicating that these activities have not played a role in the acceleration in the rate of growth of service sector activity.
Eichengreen and Gupta (2010) further compare the growth of different services in
India and the OECD countries, using EUKLEMS data. They show that the share of Group I services in India is in line with the international norm. The share of Group I services starts tapering off at a per capita income level of $3,000 in 2000 PPP USD, which is close to India’s 2008 per capita income of roughly $2,900 (again in year 2000 PPP dollars). Thus the share of Group I services is likely to stabilize soon.
10
The share of Group II services is similarly unexceptional. International comparisons suggest that some activities within this group, such as health care and education, have considerable scope for expansion. Group III services have been the fastest growing in India and that their take-off began at much lower incomes than in the OECD countries.
Bosworth, Collins and Virmani (2007) discuss the limitations of the sectoral GDP and employment data in India. They express reservations about the quality of the data in activities that are conducted in the informal (unorganized) sector and point to the possibility that data on price inflation for services are not reliable and emphasize the shortcomings of the annual data for employment in services. They suspect that service-sector growth is probably overestimated because the price deflator underestimates inflation for services. Similar concerns have been raised by Nagraj (2007). Eichengreen and Gupta (2010) discuss these data issues but conclude that even if the measurement of value added in unorganized sector is likely to be imprecise, the direction of the bias is not clear. They specifically address the concern of Bosworth et al (2007) that the rate of increase of deflators for certain services is underestimated, by comparing the relative deflators for services sub-sectors (relative to the deflator for manufacturing for India) with the average of the OECD countries. They find that for all the services (except banking), the deflator has grown either faster or at the same pace in India as in the OECD countries. Thus, deflators for services in India do not underestimate price inflation.
III: Characteristics of the Indian Manufacturing Sector
There are certain other facets of the industrial sector in India, besides a stagnant share in GDP, which are somewhat unique to the Indian growth experience. Some of these are discussed below.
A. Informal Sector
The manufacturing sector in India is characterized by a duality. There is a formal sector, also referred to as the registered sector, defined as the units employing 10 or more workers using power, and those employing 20 or more workers without using power; and a large informal sector, or unorganized sector, referred to as the “unregistered” manufacturing. The unorganized sector is very much a manifestation of the regulatory framework that businesses face in India. As Panagariya (2008) shows the moment a manufacturing unit exceeds a certain size it is subjected to a whole host of regulations. Hence, unsurprisingly, a large number of units choose to remain in the unorganized sector.

11
The share of the registered manufacturing sector in total manufacturing value added has been increasing since 1980 and by 2007-08, registered manufacturing sector accounted for 70 per cent of the total manufacturing value added. Though in terms of employment, the unorganized manufacturing continues to account for 80 per cent of employment (based on the 2000-01 NSSO round on unorganized manufacturing and ASI data on organized manufacturing). In comparison, in China the formal sector accounts for a majority of both employment and output of the manufacturing sector.8
B: Size of the Manufacturing Unit
A second peculiar feature of the Indian manufacturing is the small size of the manufacturing unit with in the formal sector. Kochhar et al. (2006) compare the average size of establishments, as measured by valued added per establishment, in India with the average size of the manufacturing sector as a whole and for the nine largest industries in tem emerging market countries. They find that the average size of the establishment in India is much smaller at about US$300,000 compared to a size of about US$4 million in the comparator countries. An alternative way to look at this is the size distribution of manufacturing sector employment. Table 1 shows that the share of employment in higher employment intervals (100-199 and above) is much larger in the case of China’s manufacturing firms than in the Indian registered factories. 9 In China among manufacturing firms of designated size and above, only 25 per cent of the firms and 3.3 per cent of total employment belong to the firms with less than 50 employees, while in India the respective shares in this low interval are nearly three-fourth of factories and more than 20 per cent of employment in those factories. Table 1: Size Distribution in the Formal Manufacturing Sector: China and India
China India
Employment Designated size and above
Registered Manufacturing
Interval % firms % employment
% factories % employment
0-49 25.0 3.3
76.8 20.5
50-99 26.2 8.2
10.7 11.7
100-199 23.0 14.2
6.1 12.8
200-499 17.3 23.3
4.0 17.2
500-999 5.3 15.9
1.5 12.2
1000-1999 2.0 12.2
0.6 8.4
2000-4999 0.9 12.1
0.3 8.3
8 Defined as all state-owned industrial enterprises and non-state industrial enterprises with annual sales over five million Yuan. Source: Kumar (2008) 9 van Ark et al. (2009) note that it may not be easy to compare China’s manufacturing firms of designated size and above and India’s registered manufacturing factories. China’s cut-off criterion in the firm distribution is the level of annual sales, whereas in India it is the number of employees. Besides the Indian data is at the factory level, the Chinese data is at the firm level (a firm may have more than one factory).
12
5000 and above 0.2 10.8 0.1 9.0
Source: van Ark et al. (2009) D: Skill Intensive Sectors
Another peculiar feature that has often been pointed out is that India’s manufacturing sector has been more skill intensive than would be expected for a country with a similar level of development as India (Panagariya (2004) and Kochhar et al. (2006)). Panagariya (2004) argues that reforms have been unable to provide an impetus to the labor-intensive manufacturing industries in India and exports of labor intensive-industries have not grown rapidly. On the other hand it is the capital- or skilled labor-intensive industries that have seen the fastest export growth. Kochhar et al. (2006) show that the composition of the Indian manufacturing sector is inclined towards the skill intensive sector. Using cross-country data on composition of the manufacturing sector at the beginning of the reform period in 1981 as well as twenty years later in 2000, they show that the value added in above-median-skill-intensive industries relative to the value added in the below-median skill intensive industries in India was above what would be expected both in 1981 and 2000.
IV: Indian Policy Framework and Liberalization
Since the early-1950s and up until the early-1980s, the evolution of India's manufacturing sector was guided by industrial and trade policies that protected the domestic industry and gave the state a central role in investment decisions. Industrial policy worked through an elaborate system of industrial licensing. Under the Industries Development and Regulatory Act of 1951 every investor over a very small size needed to obtain a license before establishing an industrial plant, adding a new product line to an existing plant, substantially expanding output, or changing a plant’s location. A strict regime of import and export controls defined trade policy. Tariff rates as high as 200 per cent were not uncommon, non-tariff barriers remained widespread, and the industrial licensing regime continued to impose binding constraints on the entry and growth of most firms. In addition, beginning 1950, the policy of small-scale reservations was initiated to encourage labor intensive manufacturing in the private sector. The key element of this policy, introduced in 1967, was that production and all further expansion or capacity creation in some products was reserved only for the small-scale sector. The medium- or large-scale units were allowed to continue production but were not permitted any further capacity expansion. The small scale industries reservation and its progressive expansion to include all the unskilled labor intensive products resulted in the size of these

13
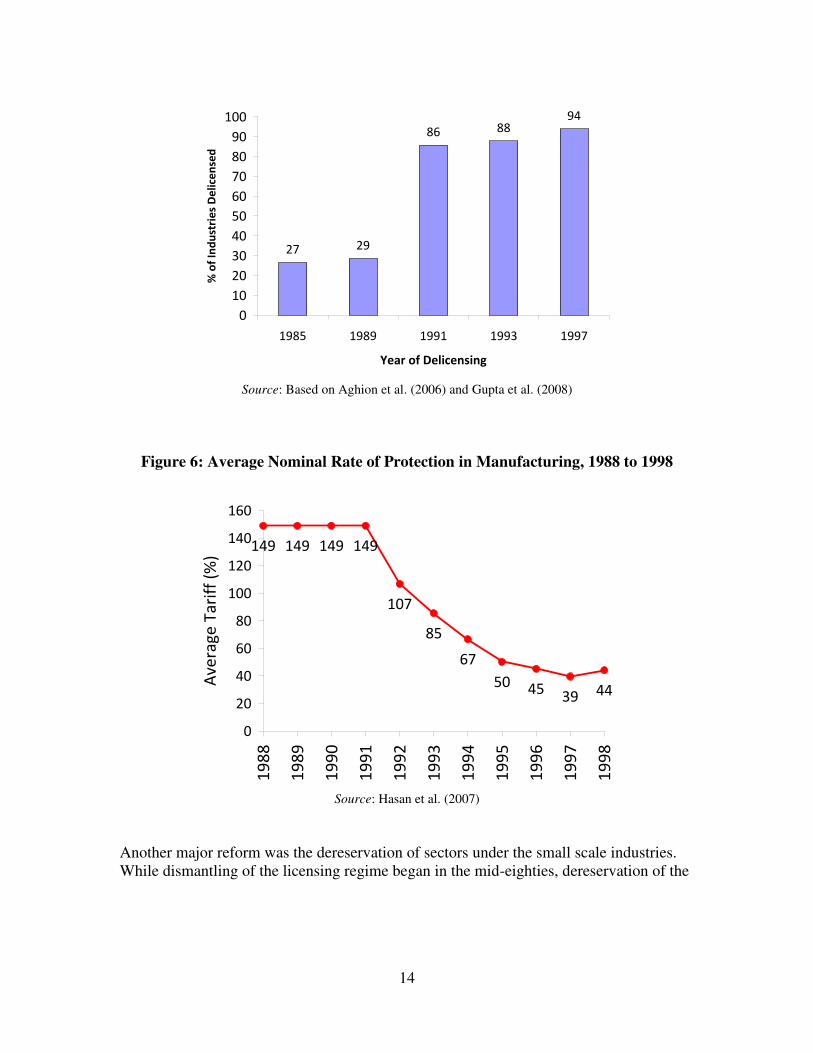
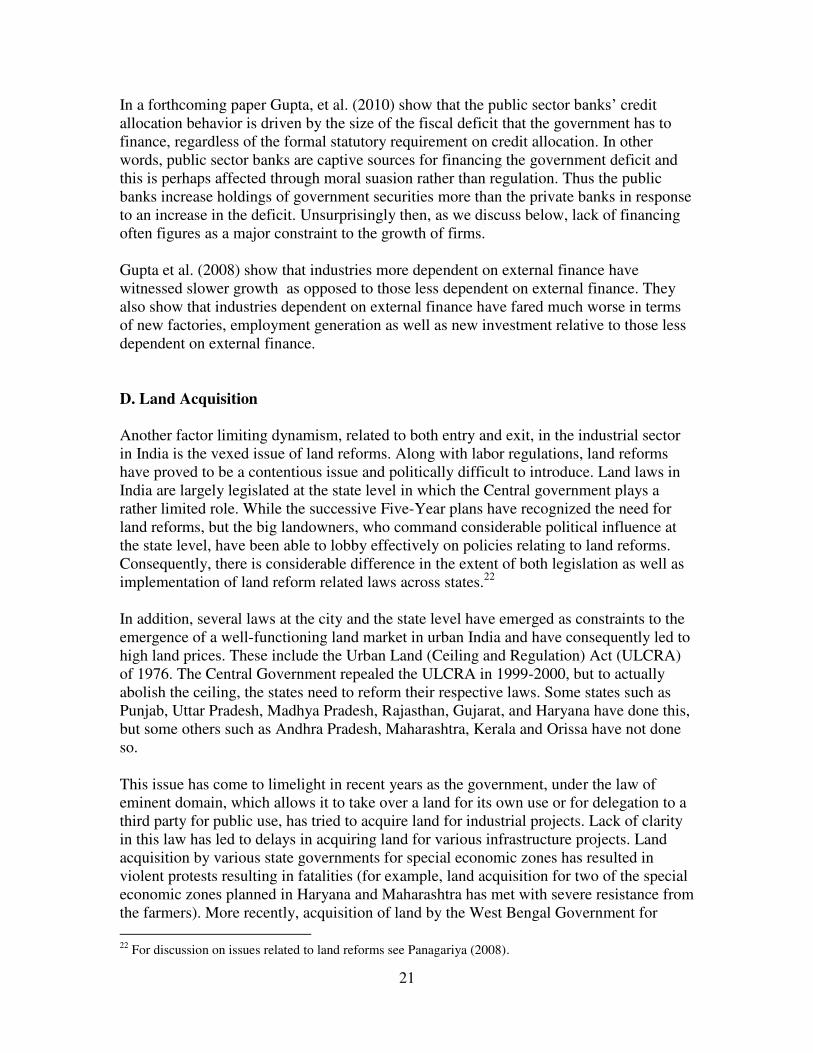
units remaining very small while the large players were not allowed to reap the economies of scale by expanding capacity.10 While the state-led import substitution policy framework helped create a diversified manufacturing sector, industrial stagnation since the mid-1960s – increasingly blamed on the policy framework – led to some marginal efforts aimed at liberalizing these regimes in the late 1970s and early-1980s (see Ahluwalia 1987, 1991). In the process the industrial and import licensing requirements were eased. More serious efforts to unshackle the industrial sector from various regulations began sometime in the mid-1980s. These reforms consisted of abolition of the licensing regime, liberalization of the trade regime, and removal of restrictions on foreign investment. One major reform that was introduced in 1985 was delicensing, i.e. the exemption from the requirement of obtaining an industrial license. Automatic entry into about 25 broad categories of industries was allowed at the time. The next major reform of the licensing regime came in 1991 when the industrial licensing was abolished except in the case of a small number of industries (see Figure 5 for the time path of delicensing). This was also the year in which a decisive break was made with the trade policies of the past. The liberalization of 1991 included the removal of most licensing and other non-tariff barriers on the imports of intermediate and capital goods, the simplification of the trade regime, devaluation of the Indian rupee and the introduction of an explicit dual exchange market in 1992 (see Figure 6). For a detailed discussion of the evolution of the trade policy regime in the Indian manufacturing sector and its various sub-sectors see Das (2003) and Pursell et al. (2007).
Figure 5: Cumulative Share of Industries Delicensed
10 Mohan (2002) provides a comprehensive discussion and a critical evaluation of the small-scale industry policy in India.
14
27 29
86 8894
0
10
20
30
40
50
60
70
80
90
100
1985 1989 1991 1993 1997
Year of Delicensing
% o
f In
du
stri
es
De
lice
nse
d
Source: Based on Aghion et al. (2006) and Gupta et al. (2008)
Figure 6: Average Nominal Rate of Protection in Manufacturing, 1988 to 1998
149 149 149 149
107
85
67
50 4539 44
0
20
40
60
80
100
120
140
160
19
88
19
89
19
90
19
91
19
92
19
93
19
94
19
95
19
96
19
97
19
98
Ave
rag
e T
ari
ff (
%)
Source: Hasan et al. (2007)
Another major reform was the dereservation of sectors under the small scale industries. While dismantling of the licensing regime began in the mid-eighties, dereservation of the

15
small scale sector began only in 1997. The total number of products on the list was progressively trimmed from 821 in 1998-99 to 21 items in October 2008.11
V. What is Still Holding Back the Growth in the Indian Manufacturing Sector
As is widely recognized the payoffs from these reforms have been small in terms of the growth of the industrial sector or employment generation. The gains have perhaps also been concentrated in certain regions or in certain sectors. Evidence in Gupta et al. (2009) shows that the delicensing reforms have resulted in relatively higher growth of the industries which are not intensive in the use of unskilled labor, and of industries which rely less on infrastructure. Evidence therein also shows that the reforms have yielded higher growth in states which have flexible labor markets and have better infrastructure and more developed financial sector. Thus while the overall growth effect from delicensing has been small, it has been particularly small in labor intensive industries. In addition employment elasticity of growth in industry has been small, and employment generation has been sluggish in the post reform period. Next we discuss the factors that are considered responsible for the rather muted effect of reforms on the industrial sector’s performance.
A. Labor Market Regulations
One key factor that is believed to have limited the gains from reforms is the labor market institutions in India, which are considered to be quite rigid and by some observers, even more rigid than those in most OECD countries (OECD (2007)). Even though extensive product markets reforms have been undertaken in India these have not been complemented by the reforms of the labor market regulations (see Krueger 2007, Panagariya 2008). India's labor regulations have been criticized on many counts including the sheer size and scope of regulations, their complexity, and inconsistencies across individual pieces of regulations. Under the Indian constitution both the federal and the state governments have jurisdiction over issues related to labor. Panagariya (2008) reports that there are 45 different national and state level labor legislations in India. The labor laws apply only to the organized sector, i.e., only to factories above a certain size in terms of the number of employees.12 As the size of factory, in terms of the number of workers employed, increases it increasingly becomes subject to more legislations. For example, if a factory has more than 10 employees it comes under the purview of the Factories Act 1948 with regulations
11 http://commerce.nic.in/pressrelease/pressrelease_detail.asp?id=2325. Mohan (2002) provides a comprehensive discussion and a critical evaluation of the small-scale industry policy in India. 12 As observed by the Economic Survey 2005-06, the Indian labor market is characterized by a dichotomy
in which the establishments in the unorganized sector are not subject to any regulation, while the organized sector is regulated fairly stringently.

16
concerning the safety norms, overtime, employment of women etc. When the employee size increases beyond 20, it becomes subject to the Employees Provident Funds and Miscellaneous Provisions Act of 1952; and at 50 or more workers it has to offer mandatory health insurance to the employees and is subject to the worker-management dispute resolution process under the IDA 1947. At a size of 100 and above the factory loses the right to fire workers or to even reassign their work, change their working conditions, or technologically upgrade the facility.13 As Debroy (2010) points out, among the regulations governing the employment of labor in India, a few specific pieces of the legislation are considered more constraining to the Indian firms. These include Chapter VB of the Industrial Disputes Act (IDA), Section 9A of the IDA, and Section 4 of the Trade Unions Act. As per Chapter VB of the IDA it is necessary for firms employing more than 100 workers to obtain the permission of state governments in order to retrench or lay off workers.14 While the IDA does not prohibit retrenchments, but as Datta-Chaudhuri (1996) has argued, states have often been unwilling to grant permission to retrench. Section 9A of the IDA lays out the procedures that must be followed by employers before changing the terms and conditions of work which introduces additional rigidities for firms in using their existing workers effectively.15 In particular, worker consent is required in order to modify job descriptions or to move workers from one plant to another in response to changing market conditions. Another complex regulation is the Trade Union Act of 1926 that regulates the formation and working of trade unions. Under Section 4 of the original Trade Unions Act, any seven people could form and register a trade union. These seven people or the office bearers of the unions did not have to be employees of the factory. It was also not required under the Act to test the representativeness of a trade union, through secret ballots or otherwise. According to Anant (2000), this resulted in the proliferation of multiple and rival unions, making it difficult to arrive at a consensus among workers. Following the recommendations of the Second Labor Commission, amendments were introduced in the Trade Unions Act in 2001 whereby union registration required that at least 10 per cent or one hundred of the workmen, whichever was less, were engaged or employed in the establishment or industry with which it was connected.16 The amendment further stipulated that for a trade union to be registered it should have at last seven members
13 For a detailed review of Indian labor regulations and the debate surrounding the issue of rigidity, see Anant et al. (2006), and Panagariya (2008). 14 Until 1976, IDA allowed firms to layoff or retrench workers as per economic circumstances as long as certain requirements such as the provision of sufficient notice, severance payments, and the order of retrenchment among workers (last in first out) were met. An amendment in 1976 (the introduction of Chapter VB), however, made it compulsory for employers with more than 300 workers to seek the prior approval of the appropriate government before workers could be dismissed. A further amendment in 1982 widened the scope of this regulation by making it applicable to employers with 100 workers or more. 15 An employer must give a notice of three weeks in writing to the workers of any change in the working conditions including change in shift work, grade classification, rules of discipline, technological change that may affect the demand for labor, changes in process or department etc. 16 http://www.commonlii.org/in/legis/num_act/tua2001230/

17
employed with the establishment or the industry with which the proposed trade union was to be connected, on the date of the application. In addition, eligibility provisions related to office-bearers were strengthened to ensure that no more than a certain number of office bearers were outsiders, and the holding of annual elections and auditing of accounts was made mandatory. Hiring contract workers can enable firms to get around many of the regulatory restrictions on adjusting employment levels, production tasks etc., however, Section 10 of the Contract Labor Act, which empowers the Government to prohibit the employment of contract labor, limits this course of action. Some analysts believe that India’s labor laws do not matter much for the industrial performance. The view is that the rigidity inducing regulations have been either ignored (see Nagaraj (2002)) or circumvented through the increased usage of temporary or contract labor (see Datta (2003) and Ramaswamy (2003)). Sharma (2006) argues that the use of voluntary retirement schemes, closures via informal routes (such as non-payment of electricity bills), use of temporary and contractual workers, dispensing away with non-core activities and related workers, and outsourcing have allowed Indian industry to adjust its workforce despite the labor regulations.17 Ultimately, whether India’s labor laws have created significant rigidities in labor markets or not is an empirical issue. Since under the Indian constitution both the federal and the state governments have jurisdiction over issues related to labor, there is useful variation across states in the way labor regulations have evolved and have been implemented. Several papers exploit this variation to ask whether the industries have benefited less from liberalization in the states with more rigid labor market regulations. The evidence overwhelmingly supports the view that the labor market regulations have inhibited the growth of industrial growth in India. Besley and Burgess (2004) and Aghion et al. (2006), for example, have looked at the effect that labor regulations have had on industrial growth in India. They use state-level amendments to the Industrial Disputes Act (IDA) to classify states as pro-worker, neutral, or pro-employer. While Besley and Burgess find that industrial performance has been weaker in Indian states with pro-worker labor laws, Aghion et al. (2006) find that states with pro-worker labor laws experienced limited benefits from delicensing reforms. In recent work, Gupta et al. (2009) have analyzed the impact of delicensing on industrial performance by using a somewhat different approach. In addition to labor regulations they also look at the role of factors in influencing industrial performance. In particular, they look at how the availability of infrastructure or financial depth at the state level has affected the growth of India's manufacturing sector post delicensing. They draw upon the work of Bhattacharjea (2008), OECD (2007), Ahsan and Pages (2007), and Besley and Burgess (2004) for classifying states’ stance on labor regulations. Finally, instead of relying solely on cross-state heterogeneity in labor regulations, they also rely on heterogeneity in industry-specific characteristics. Using the industry level data from
17 For a further discussion see, Papola (2008).

18
India's organized manufacturing sector they find that the impact of delicensing has been highly uneven across industries. In particular, industries which are labor intensive have experienced smaller gains from reforms. One of their most powerful results is the one which shows that the states with relatively inflexible labor regulations have experienced slower growth of labor-intensive industries and slower employment growth.
Figure 7: Real Output in Labor Intensive Industries in States with Flexible and
Inflexible Labor Laws
19.6
19.8
20
20.2
20.4
20.6
20.8
21
21.2
21.4
21.6
19
80
19
82
19
84
19
86
19
88
19
90
19
92
19
94
19
96
19
98
20
00
20
02
20
04
Log o
f R
eal
Gro
ss V
alu
e A
dd
ed
Real Gross Value Added in Labor Intensive Industries in Flexible Labor Markets
Real Gross Value Added in Labor Intensive Industries in Inflexible Labor Markets Source: Gupta et al. (2009)
Figure 7 above compares the growth of labor intensive industries in states with flexible labor laws with that in states with inflexible labor laws. It shows that the growth in labor intensive industries has been faster in states with flexible labor laws as compared to the states with inflexible labor laws. Further, the difference in the performance of the labor intensive industries in states with flexible labor laws and states with inflexible labor has increased over time. This highlights the importance of considering not only industry- and state-specific features but also how these two might interact in understanding the industrial performance in India. Labor reforms are considered to be one of the most politically-difficult reforms that need to be implemented in India, but there are areas in which useful progress can be made. For example, the less controversial labor reforms (such as unifying and harmonization of statutes, and reducing the procedural and transaction costs) can be carried out with relative ease, and the irrelevant laws can be eliminated or simplified. For the more contentious regulations, it might perhaps be useful to move them fully to the state list. It might also be useful to start with small steps when it comes to liberalizing lay-offs (or

19
retrenchment) related labor laws. To begin with, for example, the firms that have been unprofitable for a certain number of consecutive years can be given the right to exit, and lay off labor (with appropriate severance pay); or while the existing workers can be grandfathered, the firms can be given the right to fire newly hired workers. Allowing the firms flexibility in conditions under which workers can be reassigned to other tasks; or allowing for provisions for the speedy resolution of worker-management disputes might also be easier to carry out.18 To make the changes in labor market regulations politically more acceptable the Chinese experience might offer some useful lessons for India. The large scale labor market reforms and the large restructuring of public sector enterprises in China were carried out simultaneously and the sequencing of related reforms, such as social security, pension reforms etc., was calibrated carefully. Importantly the local and provincial governments were allowed to carry out the reforms as they deemed appropriate. It served two purposes, first the programs could be tailored to the needs of specific geographical areas and industries; and second, opposition, if any, was localized and could be addressed at that level rather than it derailing the whole process (see Gupta and Palit (2010) for details). The discussion so far has focused on how the labor laws have affected the performance of the Indian manufacturing sector. A related point, and one of equal interest, is how have the labor regulations affected the services sector. The answer to this is not straightforward. While theoretically fewer regulations apply to services, e.g. key aspects of the Industrial Disputes Act (1947), such as Chapter VB, apply to establishments as defined in the Factories Act which cover the manufacturing sector (the services sector come under the Shops and Establishments Act); and some services under private ownership are not covered by the Trade Union Act. In practice, even the laws that do apply to services have not been invoked. Thus in effect there are no known cases in which the modern services in organized sector have been affected by the application of labor laws. Anecdotal evidence suggests that in the fast growing modern sectors such as IT, finance and communications, labor is not unionized and the labor unions do not even exist.
B. Infrastructure Bottlenecks
Another well known constraint on growth in India is its crumbling infrastructure. One does not need any scientific evidence to show that infrastructure in India needs to be improved, as the erratic and costly electricity supply, congested roads, ports and airports are for all to witness. The 2007 OECD Economic Survey of India compares infrastructure in India with other countries and finds that India has fallen behind badly in most of the areas. According to the Deputy Chairman of the Planning Commission, Mr. Montek Singh Ahluwalia, India needs to increase its investment in infrastructure from 5 per cent of GDP in 2006-07 to about 9 per cent of GDP by the end of the Eleventh Five-Year Plan, by 2011-12, (McKinsey, 2007). Total investment in infrastructure as a share of
18 See Panagariya (2008), Debroy (2010) and Report of the Second National Commission on Labor (2002).

20
GDP in India during the Tenth-Five Year Plan (2002-03 to 2006-07) is anticipated to be about 5 per cent, and during the Eleventh-Five Year to be around 8 per cent according to the revised estimates (Haldea 2010). An interesting comparison in this regard is with the infrastructure investment in China. As a share of the GDP, infrastructure investment in China in 2005 was 7.6 percentage points greater than the average investment during the Tenth-Five Year Plan in India and 4.6 percentage points greater than the projected investment for the Eleventh-Five Year Plan in India. Not only is China’s investment as a share of GDP greater than that of India, China’s GDP base is larger as well.19 To examine the impact of infrastructure on industrial performance, Gupta et al. (2008) classify industries according to their intensity of use of the infrastructure (i.e. the ratio of expenditure on energy and distribution to gross value added) and find that post delicensing industries more dependent on infrastructure grew less as compared to industries which are not as dependent on infrastructure. Gupta et al. (2009) use the variation in availability of infrastructure varies across states to show that the gain in manufacturing sector output in the post delicensing period has been smaller in states with inferior infrastructure. 20
C. Financing Constraints
A third factor affecting the growth of the industrial sector has been that the financial sector has not able to meet the credit requirements of the small and medium sized firms, thus holding back their growth (see Banerjee and Duflo 2004; Nagaraj 2005; McKinsey 2006).21 There have been several far reaching reforms in the financial sector consisting of deregulation of interest rates, some dilution of public ownership of banks, and opening up of the sector to private domestic and foreign banks. While all of these reforms have helped the banking sector become more competitive, profitable, efficient and resilient, ownership has remained largely with the government, with the public ownership of banks being around 70 per cent. Another feature of the banking sector is the low share of credit allocation to the private sector because of regulations on the allocation of credit which require banks to allocate a substantial percentage of their total advances to government securities and other priority sectors. Banerjee et al. (2004) show that the Indian firms remain credit constrained, and attribute it partly to the incentive structure that the bank managers face, which discourages them to lend to the private sector, lest they incur non-performing loans. In effect then they prefer to invest in safe government securities (see Banerjee and Duflo, 2004)
19 Source: Authors’ calculation, Planning Commission (2007), Haldea (2010), Lall et al. (2007). 20 Issues related to infrastructure have been discussed in detail by Stuti Khemani in Chapter 18 of this volume. 21 Also see Chapter 25 by Subhasis Gangopadhyay.
21
In a forthcoming paper Gupta, et al. (2010) show that the public sector banks’ credit allocation behavior is driven by the size of the fiscal deficit that the government has to finance, regardless of the formal statutory requirement on credit allocation. In other words, public sector banks are captive sources for financing the government deficit and this is perhaps affected through moral suasion rather than regulation. Thus the public banks increase holdings of government securities more than the private banks in response to an increase in the deficit. Unsurprisingly then, as we discuss below, lack of financing often figures as a major constraint to the growth of firms. Gupta et al. (2008) show that industries more dependent on external finance have witnessed slower growth as opposed to those less dependent on external finance. They also show that industries dependent on external finance have fared much worse in terms of new factories, employment generation as well as new investment relative to those less dependent on external finance. D. Land Acquisition
Another factor limiting dynamism, related to both entry and exit, in the industrial sector in India is the vexed issue of land reforms. Along with labor regulations, land reforms have proved to be a contentious issue and politically difficult to introduce. Land laws in India are largely legislated at the state level in which the Central government plays a rather limited role. While the successive Five-Year plans have recognized the need for land reforms, but the big landowners, who command considerable political influence at the state level, have been able to lobby effectively on policies relating to land reforms. Consequently, there is considerable difference in the extent of both legislation as well as implementation of land reform related laws across states.22 In addition, several laws at the city and the state level have emerged as constraints to the emergence of a well-functioning land market in urban India and have consequently led to high land prices. These include the Urban Land (Ceiling and Regulation) Act (ULCRA) of 1976. The Central Government repealed the ULCRA in 1999-2000, but to actually abolish the ceiling, the states need to reform their respective laws. Some states such as Punjab, Uttar Pradesh, Madhya Pradesh, Rajasthan, Gujarat, and Haryana have done this, but some others such as Andhra Pradesh, Maharashtra, Kerala and Orissa have not done so.
This issue has come to limelight in recent years as the government, under the law of eminent domain, which allows it to take over a land for its own use or for delegation to a third party for public use, has tried to acquire land for industrial projects. Lack of clarity in this law has led to delays in acquiring land for various infrastructure projects. Land acquisition by various state governments for special economic zones has resulted in violent protests resulting in fatalities (for example, land acquisition for two of the special economic zones planned in Haryana and Maharashtra has met with severe resistance from the farmers). More recently, acquisition of land by the West Bengal Government for
22 For discussion on issues related to land reforms see Panagariya (2008).
22
leasing to Tata Motors for manufacturing the much-publicized Nano car resulted in strong protests from farmers on account of inadequate compensation. Ultimately, Tata Motors moved the entire proposed investment out of West Bengal and the new plant was eventually set up in Gujarat. The incident also served to highlight the political economy issues involved in acquiring agricultural land for non-agrarian purposes and the need to satisfy the various constituencies involved.
Since Chapter 11 of this volume provides a detailed discussion of how land has emerged as a constraint to industrialization and issues related to the acquisition of agricultural land for purposes of industrialization, we do not delve into the details here.
E. Further Factors pointed out in the Enterprise Surveys23
Besides the factors reported above, the Investment Climate Survey (ICS) conducted by the World Bank indicates tax related issues and business environment as the constraints that the Indian firms face. The data reported in the World Bank's investment climate survey consists of the responses of managers to questions about how various regulatory and other factors influence their firms. A key question is about the extent to which various factors, ranging from regulatory and governance issues to infrastructure related concerns are considered "a problem for the operation and growth" of the surveyed firm's business. The World Bank’s Investment Climate Survey, gives the fraction of firms describing a given factor as a major or very severe obstacle in the 2005 ICS survey (similar patterns are observed using the 2002 ICS survey). Tax related issues, such as the tax administration system or complaints about tax rates, are considered to be a major constraint by more than 40 per cent of respondents. Besides the tax related issues, infrastructure is seen to be a critical obstacle for the operations and growth of the firms.24 Almost 40 per cent of the respondents cite infrastructure as a major or severe obstacle. In a follow-up question on what constituted the single most important obstacle for firms’ operation and growth, infrastructure and in particular electricity was considered a major problem. Governance issues (including concerns with corruption) and the cost and access to finance were cited as the other obstacles to growth by the firms. We also look at the responses of the firms in a survey of about 250 firms from some of the most labor intensive sectors, apparel, bicycles, gems and jewelry, leather, and sports goods, conducted by ICRIER (Field Survey on “How to Enhance Employment Generation and Exports of Labour Intensive Firms”).25 In this survey the respondents report infrastructure (and electricity); financing; and skilled labor availability to be the most serious constraints on growth. Just like in the ICS survey, they also point to specific
23 This section draws on Gupta et al. (2009). 24 Infrastructure includes electricity, telecommunications, and transportation. Disaggregating this variable shows that the concern with infrastructure is overwhelmingly driven by concerns with electricity. Telecommunications are hardly considered a problem. 25 This survey was conducted by a team led by Dr. Deb Kusum Das. We thank him for sharing the data with us.
23
regulations especially those related to taxes and fiscal benefits among things that can be improved.26 Surprisingly labor regulations do not show up as a significant concern for firms in either of these surveys. One way to reconcile it with the systematic empirical evidence is that there is an ex-ante effect of the labor regulations on entry by firms and on an investor’s choice of which specific sectors (for example, services versus manufacturing) and subsectors (for example, a more labor intensive manufacturing industry versus a less labor-intensive one) to enter, as well as the choice of production technologies, scale, and desired levels of employment to adopt. As pointed out in Krueger (2007), the counterfactual of what could have been for these choices in the absence of strict labor laws cannot be captured in the surveys,. Hence the survey based results are perhaps less credible when it comes to the effects of labor market regulations. VI: Explaining the Growth in Services
Finally, it remains somewhat of a puzzle that if the service sector operates under the same regulatory framework in which the industrial sector operates in India, and with the same infrastructure, then how has the services sector been able to overcome these barriers whereas the manufacturing sector has not been able to.27 There can be two reasons for it: first the services sector does not face similar regulations as the industrial sector, including the labor laws; and second, services do not rely as much on infrastructure as the industries. We use the state level variation in the shares of services and industry and in the regulatory framework and infrastructure to examine if these factors are associated with the shares of services and industry in the domestic product of the states. We estimate the following regression for the period 1985-2005. Results are shown in Table 2.
1980 5 5
5
( / ) ( / ) ( ) ( )
( ) ( ) ( Re )
(Pr Re )
jt j jt jt
jt j j
j jt
Services SDP Services SDP LogPerCapitaNSDP LogPopulation
LiteracyRate PhysicalInfra LaborMarket gulation
oductMarket gulation YearFE
(1) The dependent variable in equation 1 is the share of the services sector in Net State Domestic Product (SDP) of state j at time period t. The explanatory variables include the
26 See Gupta et al. (2009) for details. 27 Some people suspect that one reason why the services sector is growing fast and the industrial sector is growing relatively slowly is because of increasing outsourcing from industry to services overtime. Thus, in a sense, the stagnant share of industry in India and an increasing share of services could merely be a relabeling phenomenon. Eichengreen and Gupta (2010) do not find evidence to support the view that the outsourcing from industry to services is increasing. They show that only 1/3 of the growth of demand derives from the outsourcing of activities from manufacturing to services, rather, most production that does not go toward exports derives from the growth of final demand at home.

24
initial share of services in the SDP of the states in 1980 (Services/SDP)j1980. This serves to capture the initial conditions and state specific features. Other variables are log per capita income (as measured by net state domestic product per capita), total population of the state, and literacy rate, all lagged. We also include measures of the state’s physical infrastructure, labor market regulation, and product market regulation; all the three variables are time invariant. We estimate the specification in equation 1 using Ordinary Least Squares procedure for the years 1985, 1990, 1995, 2000, and 2005. The regressions include year fixed effects. Table 2: State Characteristics and the Share of Services in State Domestic Product
(1) (2) (3) (4) (5) (6) (7)
Dependent Variable: Share of Services in NSDP, 1985-2005; Estimation
Using OLS
Share of Service, 1980 0.385*** 0.27*** 0.24*** 0.20** 0.21** (4.97) (4.09) (3.61) (2.42) (2.42) Lag Log NSDP per capita 2.59 -0.92 2.86 4.31 4.46 7.19*** 7.38*** (1.61) (0.63) (0.95) (1.56) (1.61) (2.98) (3.03) Lag Log population 3.765*** 4.99*** 5.32*** 5.64*** 5.65*** 6.75*** 6.78*** (3.16) (5.71) (6.22) (7.31) (7.25) (10.91) (10.77) Lag literacy rate 0.29*** 0.31*** 0.27*** 0.28*** 0.27*** 0.27*** (8.45) (8.92) (6.45) (6.29) (6.17) (5.97) Physical Infrastructure -1.52* -1.46* -1.76* -1.74** -1.97** (1.83) (1.78) (1.95) (2.21) (2.25) Labor market regulation 2.86 2.92 4.57** 4.66** (1.22) (1.24) (2.29) (2.33) Product market regulation -1.97 -1.45 (1.10) (0.75) Constant 0.69 11.8 -24.3 -35.9 -37.0 -61.3*** -62.6*** (0.04) (0.89) (0.86) (1.40) (1.44) (2.69) (2.73)
Year FE Yes Yes Yes Yes Yes Yes Yes Observations 74 74 74 74 74 74 74 R-squared 0.73 0.85 0.86 0.87 0.87 0.85 0.85
Robust t statistics in parentheses, * significant at 10%; ** significant at 5%; *** significant at 1%
We start with a very parsimonious specification and then add more state features
to examine what influences the size of the services sector. We see in columns 1 through 5, that the states which had a higher initial share of services in state domestic product continue to have a higher share. Similarly, states with a larger population also have a larger share of services in the state domestic product, perhaps because services cater directly to the final consumer demand. Another interesting pattern that emerges is the importance of literacy rate, states with a higher literacy rate tend to have bigger service sector. One can think of this as services requiring more education not just in terms of highly qualified engineers but also call centers or customer services in a retail store or bank requiring minimum education and language skills.
25
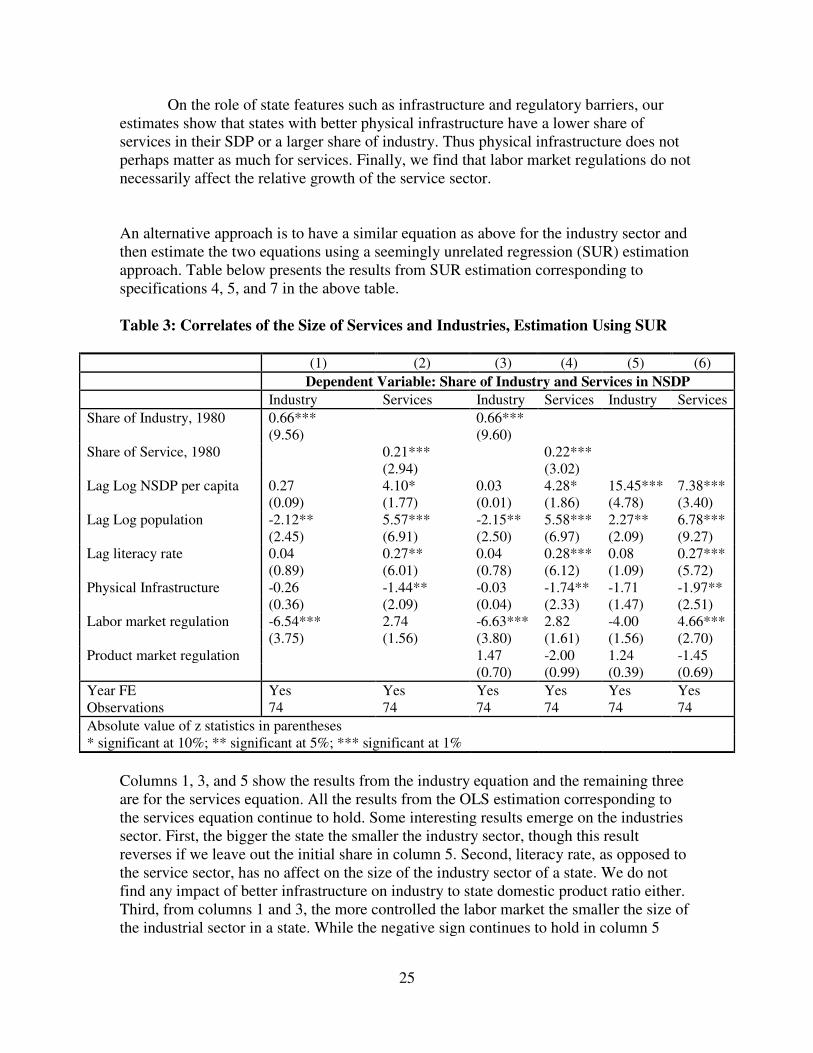
On the role of state features such as infrastructure and regulatory barriers, our estimates show that states with better physical infrastructure have a lower share of services in their SDP or a larger share of industry. Thus physical infrastructure does not perhaps matter as much for services. Finally, we find that labor market regulations do not necessarily affect the relative growth of the service sector. An alternative approach is to have a similar equation as above for the industry sector and then estimate the two equations using a seemingly unrelated regression (SUR) estimation approach. Table below presents the results from SUR estimation corresponding to specifications 4, 5, and 7 in the above table. Table 3: Correlates of the Size of Services and Industries, Estimation Using SUR
(1) (2) (3) (4) (5) (6)
Dependent Variable: Share of Industry and Services in NSDP
Industry Services Industry Services Industry Services
Share of Industry, 1980 0.66*** 0.66*** (9.56) (9.60) Share of Service, 1980 0.21*** 0.22*** (2.94) (3.02) Lag Log NSDP per capita 0.27 4.10* 0.03 4.28* 15.45*** 7.38*** (0.09) (1.77) (0.01) (1.86) (4.78) (3.40) Lag Log population -2.12** 5.57*** -2.15** 5.58*** 2.27** 6.78*** (2.45) (6.91) (2.50) (6.97) (2.09) (9.27) Lag literacy rate 0.04 0.27** 0.04 0.28*** 0.08 0.27*** (0.89) (6.01) (0.78) (6.12) (1.09) (5.72) Physical Infrastructure -0.26 -1.44** -0.03 -1.74** -1.71 -1.97** (0.36) (2.09) (0.04) (2.33) (1.47) (2.51) Labor market regulation -6.54*** 2.74 -6.63*** 2.82 -4.00 4.66*** (3.75) (1.56) (3.80) (1.61) (1.56) (2.70) Product market regulation 1.47 -2.00 1.24 -1.45 (0.70) (0.99) (0.39) (0.69)
Year FE Yes Yes Yes Yes Yes Yes Observations 74 74 74 74 74 74
Absolute value of z statistics in parentheses * significant at 10%; ** significant at 5%; *** significant at 1%
Columns 1, 3, and 5 show the results from the industry equation and the remaining three are for the services equation. All the results from the OLS estimation corresponding to the services equation continue to hold. Some interesting results emerge on the industries sector. First, the bigger the state the smaller the industry sector, though this result reverses if we leave out the initial share in column 5. Second, literacy rate, as opposed to the service sector, has no affect on the size of the industry sector of a state. We do not find any impact of better infrastructure on industry to state domestic product ratio either. Third, from columns 1 and 3, the more controlled the labor market the smaller the size of the industrial sector in a state. While the negative sign continues to hold in column 5

26
when we do not control for initial share, the result is not significant at the conventional level but at 15 percent level. Our results above are broadly in line with the hypothesis that the regulatory burden have impacted services less as compared to the industries and that it is features like literacy and size of the state that affect the extent of services in any state. VII Summary and Conclusion
This paper discusses the record of manufacturing growth in India and the factors that are considered responsible for the rather modest growth in this sector in India. The paper argues that there are many factors that have inhibited the growth of industrial sector in India. One major factor has been that the labor laws have been rigid and strict and these have affected the industrial performance in a number of ways, by keeping the size of the establishments small, by not encouraging production of labor intensive goods, by pushing activities to the unorganized sector, and by keeping the Indian industry uncompetitive. The labor laws would undoubtedly be politically difficult to introduce, but one way to reduce the resistance could be to grandfather some of the existing schemes and by making laws applicable to new industries more flexible; and to let the states introduce the reforms. Economic incentives can be provided to states that promote industrial growth and employment and the best practices in these states can be adopted elsewhere. This dualism and decentralization has been the Chinese way to successfully bring many policy changes, including those related to labor laws, and might as well work in India too. This paper discusses that besides labor laws there are other factors that have been responsible for the modest performance of the manufacturing sector. These include difficulty in the acquisition of land, inadequate financing and infrastructure, and cumbersome business climate. The paper presents arguments and evidence which shows the importance of these factors. For faster poverty reduction and to raise the standards of living, India needs both industry and services sector to grow faster, but because of these constraints there seems to be a long way to go before Indian manufacturing takes off. It would need an enabling environment in which land can be acquired easily; labor can be hired and laid off as required; businesses can be opened as well as closed with ease; there is adequate financing and physical infrastructure available; and finally skills are available aplenty. Unless this whole package is available, small tinkering in the policy framework are unlikely to unleash the potential of the sector. Given India’s vast population and the masses of unskilled, uneducated people in the work force, it is important that any growth path is intensive in its use of labor and particularly unskilled labor. Observers point to the necessity of high growth in Indian manufacturing, especially in unskilled manufacturing, on the grounds that it would generate employment. While this paper did not address the issue of employment, two points are worth mentioning. First, as shown by Rangarajan et al. (2007), employment intensity of growth is smaller in manufacturing than in the services sector, and as shown in Krueger (2007) the employment intensity of growth in the manufacturing sector in India is decreasing overtime. Eichengreen and Gupta (2010) note that the declining intensity of employment,

27
overall and in manufacturing, is not a feature that is unique to India but is seen in other countries as well. Second, as noted in Eichengreen and Gupta (2010), the skill content of labor employed in both manufacturing and services is increasing overtime and shows tendencies toward convergence. It is not that the manufacturing employs only low-skilled labor while modern services employ only high-skilled labor, both sectors are rather moving towards the employment of skilled labor; and the skilled-unskilled mix of labor in the two sectors is becoming increasingly alike. To the extent that the expansion of both modern manufacturing and modern services might be constrained by the availability of skilled labor going forward, this just underscores the importance for India of continuing to invest in labor skills. Bibliography
Aghion, P., R. Burgess, S. Redding, and F. Zilibotti. 2006. “The unequal effects of
liberalization: Evidence from dismantling the License Raj in India.” CEP
Discussion Paper no. 728. Ahluwalia, I. 1987. Industrial Growth in India: Stagnation since the Mid-Sixties. Delhi:
Oxford University Press. __________. 1991. Productivity and Growth in Indian Manufacturing. Delhi: Oxford
University Press. Ahluwalia. M. 2002. “Economic reforms in India since 1991: Has gradualism worked?”
Journal of Economic Perspectives, 16 (3): 67-88. Where did you cite this paper in the text I did not find
Ahsan, A. and C. Pagés. 2007. “Are all labor regulations equal? Assessing the effects of
job security, labor dispute and contract labor laws in India.” Policy Research
Working Paper no. 4259. World Bank. Anant, T.C.A. 2000. “Reforming the Labour Market,” in S. Gangopadhyay and W.
Wadhwa (eds.), Economic Reforms for the Poor. Delhi: Konark. Anant, T.C.A., R. Hasan, P. Mohapatra, R. Nagaraj, R. and S.K. Sasikumar. 2006.
“Labor markets in India: Issues and perspectives.” in J. Felipe and R. Hasan (eds), Labor Markets in Asia: Issues and Perspectives. London: Palgrave Macmillan for the Asian Development Bank. 205-300.
van Ark, B., V. Chen, A. Erumban, and U. Kumar. 2009. “The Cost Competitiveness of
the Manufacturing Sector in China and India: An Industry and Regional Perspective”, The Conference Board Economics Working Paper, EPWP#09-02.
Banerjee, A. and E. Duflo. 2008. “Do firms want to borrow more? Testing credit
constraints using a directed lending program." Bureau of Research and Economic
28
Analysis of Development. Working Paper no. 5. Available at http://www.cid.harvard.edu/bread/abstracts/005.htm.
Banerjee, A., S. Cole, and E. Duflo. 2004. “Banking reform in India.” Bureau of
Research and Economic Analysis of Development. Policy Paper no. 6. Besley, T. and R. Burgess. 2004. “Can regulation hinder economic performance?
Evidence from India.” Quarterly Journal of Economics, 119(1): 91-134. Bhattacharjea, A. 2006. “Labour market regulation and industrial performance in India: A
critical review of the empirical evidence.” The Indian Journal of Labour
Economics, 49(2): 211-32. Where did you cited this paper in the text I did not find??
__________. 2008. "How do Indian firms respond to employment protection
legislation?" mimeo. Bosworth, B., S. M. Collins and A. Virmani.2007. “Sources of Growth in the Indian
Economy ”, NBER working paper. W12901. Das, D. K.. 2003. "Manufacturing productivity under varying trade regmies: India in the
1980s and 1990s," ICRIER, New Delhi Working Papers 107. Datta-Chaudhuri, M. 1996. “Labor markets as social institutions in India.” IRIS-India
Working Paper no. 10. University Of Maryland at College Park. Debroy, B. 2010. “Segmentation and Unification in the People’s Republic of China’s
Labor Market: Lessons for India.” in K. Gerhaeusser, Y. Iwasaki, and V. B. Tulasidhar (eds), Resurging Asian Giants: Lessons from the People’s Republic of China and India. pp. 167-200. Asian Development Bank: Manila.
Datta, R. 2003. “Labor market, social institutions, economic reforms and social cost.” in
S. Uchikawa (ed), Labour Market and Institution in India, 1990s and Beyond. New Delhi: Manohar.
Eichengreen, B. and P. Gupta. 2009. “Two Waves of Services Growth”, NBER
Working Paper# 14968.
Eichengreen, B. and P. Gupta. 2010. “Services Sector Growth: India’s Road to Economic Growth. Indian Council for Research on International Economic
Relations (ICRIER) Working Paper no 249.
Gordon, J. and P. Gupta. 2004. “Understanding India’s services revolution.” Working Paper no. WP/04/171. International Monetary Fund.
29
Gupta, P., R. Hasan, and U. Kumar. 2008. “What constrains Indian manufacturing?” ICRIER. Working Paper no. 211.
Gupta, P., R. Hasan, and U. Kumar. 2009. “Big Reforms but Small Payoffs: Explaining
the Weak Record of Growth in Indian Manufacturing” in S. Bery, B. Bosworth, and A. Panagariya (eds), India Policy Forum, volume 5, pp 59-108.
Gupta, P. and A. Palit. 2010. “Reforms of the State Owned Enterprises in Resurging
Asian Giants: Lessons from the People's Republic of China and India.” in K. Gerhaeusser, Y. Iwasaki, and V. B. Tulasidhar (eds), Resurging Asian Giants:
Lessons from the People’s Republic of China and India. pp. 167-200. Asian Development Bank: Manila.
Gupta, P., K. Kochhar, and S. Panth. 2010. “Bank Ownership and the Effects of Financial
Liberalization: Evidence from India”. mimeo. Haldea, G. 2010. “Building Infrastructure: Challenges and Opportunities”. Presentation
at Planning Commission. New Delhi. Available at http://infrastructure.gov.in/presentation_march23_2010/pres/building-infrastructure.pdf
Hasan, R., D. Mitra, and K.V. Ramaswamy. 2007. “Trade reforms, labor regulations, and
labor-demand elasticities: Empirical evidence from India.” Review of Economics
and Statistics, 89(3, August): 466–81. Kochhar, K., U. Kumar, R. Rajan, A. Subramanian, and I. Tokatlidis. 2006. “India’s
pattern of development: What happened, what follows?” Journal of Monetary
Economics. vol. 53: 981-1019. Krueger, A.O. 2007. “The missing middle.” The Stanford Center for International
Development Working paper no. 343. Kumar, U. 2008. “Will India Become the New Engine of Manufacturing Production in
the World?” Presentation at Tsinghua University, Beijing. Lall, R., A. Rastogi, and R. Anand. 2007. “Financing and Implementation of
Infrastructure Projects”, mimeo, IDFC. McKinsey Global Institute. 2006. Accelerating India’s Growth through Financial System
Reform. San Francisco: McKinsey&Company. McKinsey. 2007. Clearing the Way for Robust Growth: An Interview with India’s Chief
Economic planner. The McKinsey Quarterly.Special Edition: Building a Better India. McKinsey&Company.
30
Mohan, R. 2002. “Small Scale Industrial Policy in India: a Critical Evaluation.” In: Krueger, A. O. (Ed.), Economic Policy Reforms and the Indian Economy. Chicago: University of Chicago Press.
Nagaraj, R. 2002. “Trade and labor market linkages in India: Evidence and issues.”
Economic Series Working Paper no. 50. East West Center, Hawaii. Nagaraj, R. 2005. “Industrial Growth in China and India: A Preliminary Comparison."
Economic and Political Weekly, Vol. 40, No. 21, May 21-27, 2005. China-India Comparison
Nagaraj, R. 2009. “Is Services Sector Output Overestimated? An Enquiry” Economic and
Political Weekly, 44(5), January 31, 2009. OECD. 2007. OECD Economic Surveys: India. Volume 2007, Issue no. 14. Organization
for Economic Co-operation and Development: Paris Panagariya, A. 2004. “India’s Trade Reform.” in S. Bery, B. Bosworth, and A.
Panagariya (eds), India Policy Forum, vol. 1, 1–57. Panagariya, A. 2008. India: The Emerging Giant. Oxford University Press. New York Papola, T. S. 2008. Labor Regulation in Indian Industry. Volume 1-10. Bookwell
Publishers: New Delhi. Planning Commission. 2007. “Projections of Investment in Infrastructure During the
Eleventh Plan”, The Secretariat for the Committee on Infrastructure, Planning Commission, Government of India.
Pursell, G., N. Kishor, and K. Gupta. 2007. “Manufacturing Protection in India Since
Independence,” ASARC Working Paper 2007/07, Australia South Asia Research Centre, Australian National University.
Ramaswamy, K.V. 2003. “Liberalization, outsourcing and industrial labor markets in
India: Some preliminary results.” In Labour Market and Institution in India:
1990s and Beyond, edited by Shuji Uchikawa. New Delhi: Manohar. Rangarajan, C., Padma Iyer Kaul, Seema. 2007. “Revisiting Employment and Growth”.
ICRA Bulletin Money and Finance. September 2007. pp 57-68. Report of the Second National Commission on Labor. 2002. Ministry of Labour and
Employment. Government of India. Sharma, A. N. 2006. “Flexibility, Employment and Labour Market Reforms in India,”
Economic and Political Weekly, May 27, 2006, pp. 2078-85;

31
World Bank. 2004. India Investment Climate Assessment 2004: Improving
Manufacturing Competitiveness.