
A multi-period mixed integer programming model for the problem of relocating a global manufacturing...
10
A MULTI-PERIOD MIXED INTEGER PROGRAMMING MODEL FOR THE PROBLEM OF RELOCATING A GLOBAL MANUFACTURING FACILITY Abraham Zhang * and George Q. Huang Department of Industrial and Manufacturing Systems Engineering, University of Hong Kong Citation: Abraham Zhang, George Q. Huang. (2010). “A multi-period mixed integer programming model for the problem of relocating a global manufacturing facility”. Journal of the Chinese Institute of Industrial Engineers, 27(6), 407-417. ABSTRACT In recent years, changing business conditions have triggered labor-intensive global manufacturers to consider relocating out of the Pearl River Delta (PRD) of China, known as “The World’s Factory”. This paper presents a multi-period mixed integer programming (MIP) model for the problem of relocating a global manufacturing facility. The objective function of the model is to maximize total after-tax profit. The model addresses dynamic aspects of timing, including potential developments in business factors and the need of a gradual capacity transfer in order not to disrupt supply chain activities. The model application generates an optimal capacity transfer schedule and forecasts after-tax profits. In general, a stable exchange rate for the Chinese currency RMB would make lower-cost areas of China more competitive. Also, dramatic RMB appreciation would enhance the comparative advantage of Asian lower-cost countries. A rapid hike in oil prices would make locations near major markets more favorable in order to avoid high transportation costs. Keywords: facility relocation; global manufacturing; supply chain management; mixed integer programming; Pearl River Delta * Corresponding author: [email protected] 1. INTRODUCTION During the 1990s, the Pearl River Delta (PRD) of China emerged as “The World’s Factory” for a variety of labor-intensive products. A large number of global manufacturers, funded mainly by investment from Hong Kong and Taiwan, established their operations in the region to take advantage of its low labor costs and favourable industry policies. In recent years, however, business conditions have changed dramatically. Since 2005, the Chinese currency (the Chinese Yuan also known as RMB) has appreciated over 20% against the United States dollar (USD). Labor costs in the region have climbed rapidly with minimum wage standards increasing by about 70% from 2004 to 2008 [4]. During the same period, the price of international crude oil hit historical heights. Transportation costs rose in line with oil prices. Industrial policies for labor-intensive manufacturing have also changed direction. In 2006 and 2007, China’s central government reduced export value-added tax (VAT) rebates for a very large category of labor-intensive products. Local governments in the PRD region started an industrial restructuring program. Further set-up of labor-intensive production operations has been discouraged and existing ones encouraged to relocate. With these changes, the business profit margin for labor-intensive global manufacturing has dropped sharply. Consequently, many global manufacturers have started to relocate all or part of their production activities or have made plans to do so [2, 3]. The facility relocation problem shares some common attributes with the well-known facility location problem [9, 17]. They are both concerned with the determination of the optimal number, capacity, and location of a set of facilities to serve demands from a set of spatially distributed customers [9, 10]. Both problems are strategic in supply chain planning. Decisions made usually lead to a substantial amount of irreversible investment on new site construction and setup as well as hiring and training. Nevertheless, the facility relocation problem is still distinctively different from the facility location problem in several ways. For facility relocation, equipment and employees may be transferrable and incur moving expenses and employee compensation. Productivity may decrease at both existing facilities and relocated facilities during the transition. In addition, the relocation process must carefully manage
Transcript of A multi-period mixed integer programming model for the problem of relocating a global manufacturing...
A MULTI-PERIOD MIXED INTEGER PROGRAMMING
MODEL FOR THE PROBLEM OF RELOCATING A GLOBAL
MANUFACTURING FACILITY
Abraham Zhang* and George Q. Huang
Department of Industrial and Manufacturing Systems Engineering, University of Hong Kong
Citation: Abraham Zhang, George Q. Huang. (2010). “A multi-period mixed integer programming
model for the problem of relocating a global manufacturing facility”. Journal of the Chinese Institute of
Industrial Engineers, 27(6), 407-417.
ABSTRACT
In recent years, changing business conditions have triggered labor-intensive global
manufacturers to consider relocating out of the Pearl River Delta (PRD) of China, known as
“The World’s Factory”. This paper presents a multi-period mixed integer programming
(MIP) model for the problem of relocating a global manufacturing facility. The objective
function of the model is to maximize total after-tax profit. The model addresses dynamic
aspects of timing, including potential developments in business factors and the need of a
gradual capacity transfer in order not to disrupt supply chain activities. The model application
generates an optimal capacity transfer schedule and forecasts after-tax profits. In general, a
stable exchange rate for the Chinese currency RMB would make lower-cost areas of China
more competitive. Also, dramatic RMB appreciation would enhance the comparative
advantage of Asian lower-cost countries. A rapid hike in oil prices would make locations near
major markets more favorable in order to avoid high transportation costs.
Keywords: facility relocation; global manufacturing; supply chain management; mixed
integer programming; Pearl River Delta
* Corresponding author: [email protected]
1. INTRODUCTION
During the 1990s, the Pearl River Delta (PRD)
of China emerged as “The World’s Factory” for a
variety of labor-intensive products. A large number of
global manufacturers, funded mainly by investment
from Hong Kong and Taiwan, established their
operations in the region to take advantage of its low
labor costs and favourable industry policies. In recent
years, however, business conditions have changed
dramatically. Since 2005, the Chinese currency (the
Chinese Yuan also known as RMB) has appreciated
over 20% against the United States dollar (USD).
Labor costs in the region have climbed rapidly with
minimum wage standards increasing by about 70%
from 2004 to 2008 [4]. During the same period, the
price of international crude oil hit historical heights.
Transportation costs rose in line with oil prices.
Industrial policies for labor-intensive manufacturing
have also changed direction. In 2006 and 2007,
China’s central government reduced export
value-added tax (VAT) rebates for a very large
category of labor-intensive products. Local
governments in the PRD region started an industrial
restructuring program. Further set-up of
labor-intensive production operations has been
discouraged and existing ones encouraged to relocate.
With these changes, the business profit margin for
labor-intensive global manufacturing has dropped
sharply. Consequently, many global manufacturers
have started to relocate all or part of their production
activities or have made plans to do so [2, 3].
The facility relocation problem shares some
common attributes with the well-known facility
location problem [9, 17]. They are both concerned
with the determination of the optimal number,
capacity, and location of a set of facilities to serve
demands from a set of spatially distributed customers
[9, 10]. Both problems are strategic in supply chain
planning. Decisions made usually lead to a substantial
amount of irreversible investment on new site
construction and setup as well as hiring and training.
Nevertheless, the facility relocation problem is still
distinctively different from the facility location
problem in several ways. For facility relocation,
equipment and employees may be transferrable and
incur moving expenses and employee compensation.
Productivity may decrease at both existing facilities
and relocated facilities during the transition. In
addition, the relocation process must carefully manage

the phase-out of existing facilities and smooth the
transition into new facilities to minimize potential
disruption of supply chain activities [7].
The facility location problem has received
considerable attention from both academicians and
practitioners [9, 11, 13]. Due to their similarity, facility
relocation can draw insights from facility location
studies. Facility location problems are often modelled
through mixed integer programming (MIP) techniques
[18]. However, most MIP models assume static
business conditions and use a single-period planning
horizon [9]. These models are inadequate for the
realistic settings where there are significant changes
over time in the business environment. Such changes
are often the major cause of relocation [7], as now
experienced by global manufacturers in the PRD
region. It is thus essential to use multiple planning
periods to address the dynamic aspects of timing for
the relocation decision.
In contrast to the attention given to the facility
location problem, only a few models have been
developed for facility relocation. Melachrinoudis and
Min [7] built a multi-period MIP model for the
relocation and phase-out of a hybrid
plant/warehousing facility. Melo et al. [8] proposed a
MIP model for the strategic design of supply chain
networks. These two models considered relocation
costs and a gradual capacity transfer, factors unique to
facility relocation. However, both models dealt with a
domestic context and did not include international
factors which are crucial for global manufacturing.
The objective of this research is to develop a
multi-period MIP model for the facility relocation
problem faced by global manufacturers in the PRD
region. The model considers international factors
including currency exchange rates, tariffs, and transfer
pricing [15]. Dynamic aspects of time-sensitive
business factors are incorporated through multi-period
parameters and the design of experimental scenarios.
Model application is illustrated through a
representative case. An optimal capacity transfer
schedule is generated and after-tax profits are forecast.
The case study also offers managerial insights about
where and when to relocate global manufacturing
operations.
The rest of this paper is organized as follows.
Section 2 describes the research problem. Section 3
develops a multi-period MIP model. Section 4
illustrates the model application and gives results.
Section 5 concludes the research and identifies future
work.
2. PROBLEM DESCRIPTION
The problem faced by global manufacturers in
the PRD region can be illustrated through a
hypothetical footwear business representative of
business in the region. Footwear is a typical
labor-intensive product. The global manufacturer
operates under the business mode of processing trade,
which is characterized by processing locally while
utilizing imported raw materials and exporting finished
products. Processing trade involves about 70,000
enterprises in the PRD region and accounted for 47.2%
of China’s total foreign trade in 2006 [1]. Figure 1
depicts its supply chain configuration. The
headquarters in Hong Kong controls business level
communications. Finished products are first sold from
factories to the headquarters under internal transfer
prices, and then traded with overseas customers. Long
term customers include large retailers like Wal-Mart
Stores, Inc. and they set free on board (FOB) prices.
The global manufacturer bears trucking costs to the
nearest seaports. Production relocation will not affect
market demand as long as it does not affect supply
chain costs born by customers.
Offshore trade allows physical cargoes to be
shipped from factories to customers directly. The
trading affiliate acts as a consigner but is not involved
in the day to day order fulfilment. Such a business
arrangement minimizes tax duties as Hong Kong levies
taxes on a territorial basis. In fact, offshore trade
represented 93% of total exports of goods in Hong
Kong in 2005 [1]. This study considers the preferred
situation that business negotiation also occurs outside
of Hong Kong, and thus corporate income tax levied
on the trading operation is reduced to zero.
Figure 1: A representative supply chain
Global manufacturers face several challenges as
they consider relocation. The first challenge is
choosing where to relocate. Possibilities can be
grouped into three categories: lower cost areas in
China, lower cost countries in Asia, and low cost
countries near major markets. Though labor costs in
the coastal areas of China have climbed rapidly in
recent years, most non-coastal areas have maintained
relatively stable labor costs. Relocation to lower cost
countries in Asia avoids risks from continual RMB
appreciation and the decrease of export VAT rebates in
China. Relocation to low cost countries near major
markets minimizes risks associated with high oil
prices. A qualitative appraisal has shortlisted a
representative location from each category. They are
Qingyuan, Guangdong, China (O-PRD), Chennai,
Tamil Nadu, India (India) and Baja California, Mexico
(Mexico). Investment incentives are available at all
three locations. However, such a qualitative analysis is
not sufficient for the facility relocation decision. It is
necessary to employ a sound analytical tool to quantify
costs and profits.
The second challenge arises from the strategic
nature of the decision. New facilities are expected to be
in operation for an extended time period in order to
recover relocation costs. With changes in the business
environment, a currently profitable factory could
become unprofitable in the future. Decision makers
need to understand the optimal relocation destinations
under various business environment scenarios. Such an
understanding will help decision makers weigh the
risks against benefits before committing a substantial
investment.
The third challenge is the planning of a gradual
capacity transfer in order not to disrupt demand
fulfilment. A realistic approach is to divide relocation
into several phases and implement them step by step. If
more than one new facility is to be established, the
sequence of facility setup needs to be optimized.
3. MODEL DEVELOPMENT
3.1 Model assumption
This research builds a multi-period MIP model to
help resolve the above facility relocation problem and
overcome its challenges. It is assumed that trade
operation remains at the headquarters in Hong Kong
due to its favourable tax policies. Multiple
manufacturing facilities in the PRD region are viewed
as a single facility by consolidating all their
transferrable capacity. Their facility index f is 1. It is
possible that the global manufacturer may keep some
capacity in the PRD region to support its product
design and development in the region. Such a residual
capacity is excluded from the scope of this study. The
planning horizon is 10 years, which is typical for a
strategic facility location/relocation decision. The
planning horizon is divided into 10 periods and each
period represents one year. Model formulation
assumes that freight costs vary linearly with oil price.
Prevailing tariff rates do not change in the planning
horizon. Following Melachrinoudis & Min [7], the
model has several other underlying assumptions:
Model formulation is based on the
single-product case. Model application
considers multiple commodities in the same
product family by using weighted average prices
and costs.
Demand in a period is met by production in the
same period. Just-in-time production mode has
gained popularity. As the duration of a period is
as long as one year, inventory carried over from
one period to another could be neglected.
No capacity transfer occurs in period 0 to
account for the time required for planning and
new site setup. New site setup and capacity
transfer are finished at the start of a period.
Closure of an existing facility happens at the end
of a period.
Capacity at a new location is non-decreasing in
the planning horizon. It often takes several years
to recover relocation costs and overcome the
learning curve at new sites. Thus, newly
installed capacity is not expected to be removed
during the planning horizon.
Current capacity is sufficient to meet future
demand in the planning horizon and capacity
expansion is not considered. However, the
model can be extended for capacity expansion
and reduction scenarios [8].
3.2 Notations
Indices
m The index for markets, Mm ,...,1
f The index for facilities, Ff ,...,1
t The index for time periods, Tt ,...,0
Parameters
mtD Yearly demand at market m in period t
mtSCC Unit supply chain cost for goods to arrive at
market m in period t
fDFC Base domestic freight cost per unit from
facility f to nearest seaports
fmIFC Base international freight cost per unit from
facility f to market m
ftRMC Delivery duty paid raw material cost per unit
at facility f in period t
ftOVC Other variable cost per unit at facility f in
period t
ftFSC Fixed one time cost for the setup or closure of
facility f in period t
ftFOC Fixed operating cost at facility f in period t
tFHQ Fixed operating cost of the headquarters in
period t
tCHQ Capacity retaining cost of the headquarters in
period t
ftCRC Unit capacity retaining cost at facility f in
period t
ftRLC Unit capacity relocation cost from existing
facility to facility f in period t
ftDLC Unit direct labor cost at facility f in period t
tOP Oil price average in period t
OPB Oil price at base level
fte Exchange rate to USD from the currency used
at facility f in period t

ftTAX Corporate income tax rate at facility f in
period t
ftVAT Realized VAT rate at facility f in period t
fmIDT Inventory days for finished products in transit
from facility f to market m
fmTAR Tariff rate imposed by market m for products
from facility f
Correlation factor between freight costs and
oil price
Inventory holding cost coefficient
t A fraction of total transferrable capacity up to
period t
fLB Lower bound of the transfer price at facility f
Q Initial transferrable capacity
L A sufficiently large constant
Variables
fmtq Production quantity at facility f for market m
in period t
ftCAP Capacity of facility f in period t
ft Operating status of facility f in period t (1 if in
operation; 0 otherwise)
fmtSP Selling price per unit at FOB term from
facility f to market m in period t
ftOI Operating profit at facility f in period t
ftOI Operating loss at facility f in period t
3.3 Model formulation
Based on the above defined notations, several
cost components can be derived. Variable
manufacturing cost consists of raw material cost, direct
labor cost and other variable cost:
ftftftftft eOVCDLCRMCMFGC )( tf ,
(1)
Domestic freight cost is a function of base
domestic freight cost and oil price:
fttfft eOPBOPDFCDFCC ))1/(1( tf ,
(2)
The headquarters in Hong Kong has the lowest
tax rate and a lower transfer price always leads to a
higher after-tax profit. Thus, upper bounds are not
considered in the model. The transfer price at its lower
bound can be derived as:
))(( ftftftftfftffmt OVCDLCeRMCLBMFGCLBTP
tmf ,,
(3)
Value-added tax is charged based on the
difference between the transfer price and raw material
cost. It can be obtained as:
ftftfmtfmt VATRMCTPVATC )(
ftftftftftftf VATRMCOVCDLCeRMCLB )))(((
tmf ,,
(4)
The objective function
The objective function is to maximize total
after-tax profit from period 1 to 10. By summarizing
net profits at the headquarters and manufacturing
facilities, the objective function can be expressed as:
Maximize:
T
t
F
f
M
m
F
fftttfmtfmtfmt CAPCHQFHQqTPSP
1 1 1 1
))((
+
T
t
F
fftftft OIOITAX
1 1
))1((
(5)
Constraints
Operating income at manufacturing facilities is
the difference between sales revenue and operating
costs. Operating costs include variable manufacturing
cost, domestic freight cost, value-added tax, capacity
retaining cost, fixed operating cost, relocation cost and
fixed setup cost. Using non-negative variables
ftOI and
ftOI to distinguish operating profits and
operating loss [15, 16], operating income can be
expressed as:
ftft OIOI
M
mfmtfmtftftfmt qVATCDFCCMFGCTP
1
)(
ftftftft FOCCAPCRC
)1()1( tfftfttfftft FSCCAPCAPRLC
1, tf
(6)
Substituting fmtTP , ftMFGC , ftDFCC and
fmtVATC with equations (1)~(4), constraint (6) can be
rewritten as:
ftft OIOI =
))((
))(((1
ftftftft
M
mftftftftf
eOVCDLCRMC
OVCDLCeRMCLB
fmtftftftftftftf
fttf
qVATRMCOVCDLCeRMCLB
eOPBOPDFC
))))(((
))1/(1(
ftftftft FOCCAPCRC
)1()1( tfftfttfftft FSCCAPCAPRLC
1, tf
(7)
Supply chain costs born by customers include
purchasing cost, inventory holding cost for goods in
transit, international freight cost and import tariffs paid
to the customs [5]. Production relocation is not
intended to affect supply chain costs and this condition
can be expressed as:
mtfmfmt
tfmfmfmtfmt
SCCTARSP
OPBOPIFCIDTSPSP
)1/(1(
tmf ,,
(8)
Besides constraints (7) and (8), the MIP model
includes other constraints listed as follows:
QCAPft 0,1 tf
(9)
0ftCAP 0,2 tf
(10)
QCAPCAP t
T
ttfft
1)1( 1,1 ft
(11)
QCAPF
fft
1
1t
(12)
0)1( tfft CAPCAP 1,2 tf
(13)
f
mtfmt Dq tm ,
(14)
M
mftfmt CAPq
1
tf ,
(15)
ftft LCAP tf ,
(16)
}1,0{ft tf ,
(17)
fmtq and ftCAP are integers tmf ,,
(18)
All variables 0
(19)
Equations (9) and (10) initialize production
capacity in period 0. Constraint (11) limits the fraction
of capacity transferred by each period. The upper
bound t is expressed as a fraction of initial capacity
and is an increasing function of time. It reflects the
practical need of a gradual capacity transfer in order
not to disrupt demand fulfilment [7]. Equation (12)
ensures that total capacity remains unchanged.
Constraint (13) sets production capacity as
non-decreasing at relocation destinations in the
planning horizon. Equation (14) is a demand
constraint. Constraint (15) is a capacity constraint.
Constraint (16) ensures no capacity remains in a closed
facility. Constraints (17) to (19) define the
characteristics of variables.
It is well known that MIP is non-deterministic
polynomial-time hard (NP-hard) due to the existence
of integer variables. The branch-and-cut method,
which integrates the branch-and-bound and the cutting
plane algorithms, has been widely used to solve MIP
models efficiently [6]. The MIP model presented
above is solved by the branch-and-cut method through
commercial mixed integer solver ILOG CPLEX
11.2.0. For the representative case given in the
following section, the model formulation requires 220
integer variables, 619 continuous variables, and 838
constraints. The CPU running time for all experimental
scenarios ranges from 2 to 10 seconds on a computer
with Intel® Dual-core 1.5G processor and 2G RAM.
This shows the computational performance of the
model is comparable with that of Melachrinoudis and
Min [7]. It is also reported in the literature that integer
programming models of a much larger problem size
can be solved through ILOG CPLEX solver within an
acceptable CPU running time [14, 19].
4. MODEL APPLICATION AND
RESULTS
4.1 Experimental data
The MIP model is applied with the
representative global footwear manufacturer in the
PRD region as described in section 2. Markets
considered are the United States (US), the European
Union (EU) and Japan. Their demands are 3,840,000,
2,880,000 and 1,920,000 units respectively in period
0, with annual increases of 96,000, 72,000 and 48,000
respectively in the following 10 periods. Initial
capacity Q is 10,800,000 units per year. Capacity
transfer limit t is 0% in period 0, 20% in period 1,
60% in period 2, and reaches 100% from period 3
onwards.
Tables 1 to 3 present input data according to
parameter definitions as given in section 3. All
transportation modes use 40FT containers, each
containing 4,800 units of finished products. The
correlation factor between oil price tOP and freight
costs, ftDFCC and fmtIFCC , is 40.4% in relation to
base oil price OPB of $75 per barrel [12]. Inventory
holding cost coefficient is 25% per year. All cash
values are in 2008 constant dollars.
Table 1: Import tariff rates, international freight costs and inventory days in transit
To
From fmTAR fmIFC fmIDT
US EU Japan US EU Japan US EU Japan
PRD 20% 16.9% 8% $0.593 $0.445 $0.240 28 28 10
O-PRD 20% 16.9% 8% $0.593 $0.445 $0.240 28 28 10
India 20% 11.9% 8% $0.752 $0.451 $0.646 35 18 18
Mexico 0% 0% 4% $0.167 $0.351 $0.844 7 14 28
Table 2: Domestic freight costs and tax related data
fDFC ftVAT fLB ftTAX
PRD ¥0.288 4% 1.3 15% for 5..0t ; 25% for 10..6t
O-PRD ¥0.552 4% 1.3 0% for 5..0t ; 12.5% for 8..6t ; 25% for 10..9t
India $0.049 0% 1.4 0% for 5..0t ; 22.75% for 10..6t
Mexico $0.042 0% 1.4 0% for 5..0t ; 20% for 10..6t
Table 3: Time-sensitive cost data for the first period
Costs closely related with labor cost Other costs
ftFSC ftRLC ftDLC Increase
per year ftFOC ftCRC ftOVC Increase
per year
PRD ¥500,000 0.00 ¥10.22 8.1% ¥500,000 ¥8.82 ¥1.20 2.3%
O-PRD ¥300,000 ¥5.83 ¥7.85 5.3% ¥300,000 ¥6.46 ¥0.96 -0.4%
India $150,000 $1.94 $0.94 4.5% $50,000 $1.15 $0.12 3.0%
Mexico $300,000 $2.92 $2.17 2.4% $130,000 $2.03 $0.09 0.8%
Parameters such as direct labor cost and capacity
retaining cost are highly time-sensitive. They are
adjusted based on constant dollars according to
historical trends from 2000 to 2008 [20]. Data in 2008
are used for the first period. For manufacturing
operations, these costs are categorized in table 3 and
the rates of increase per year are given. For the
headquarters in Hong Kong, its fixed operating cost
tFHQ is $100,000 and unit capacity retaining cost
tCHQ is $0.13 in the first period. Both values
decrease by 0.7% every year. Unit supply chain costs
mtSCC are $7.8, $7.4, and $7.1 respectively for the
US, EU and Japan markets in the first period, with an
annual increase of 1.3% per year. Raw material costs
are stable at $2.35 per unit at all locations.
Key operational attributes of this representative
company are based on a leading global footwear
manufacturer in the PRD region [21]. Supplementary
data were collected from industrial practitioners, Hong
Kong Trade Development Council (HKTDC),
Investment Commission of India, ProMexico, Werner
International, State Administration of Foreign
Exchange (China), Ministry of Finance (China),
Guangdong Municipal Labor & Social Security
Bureau, United States Department of Labor, Japan
Customs, Shenzhen Container Trailer Association, two
major shipping lines, and two international freight
forwarders.
4.2 Experimental scenarios
Parameter values presented above do not
include RMB exchange rate and oil price, which both
demonstrated a high level of uncertainty in recent
years. The RMB has been under pressure to appreciate,
but it is difficult to predict its rate of appreciation. Oil
price has risen and fluctuated wildly in the past five
years. The rising trend is generally expected to
continue. However, its future movement may still be
very volatile. To incorporate these uncertainties, three
experimental scenarios are designed for these two
business factors, and they are illustrated in figure 2(a)
and (b).
For RMB exchange rate, the stable scenario
defines that RMB to USD exchange rate will be stable
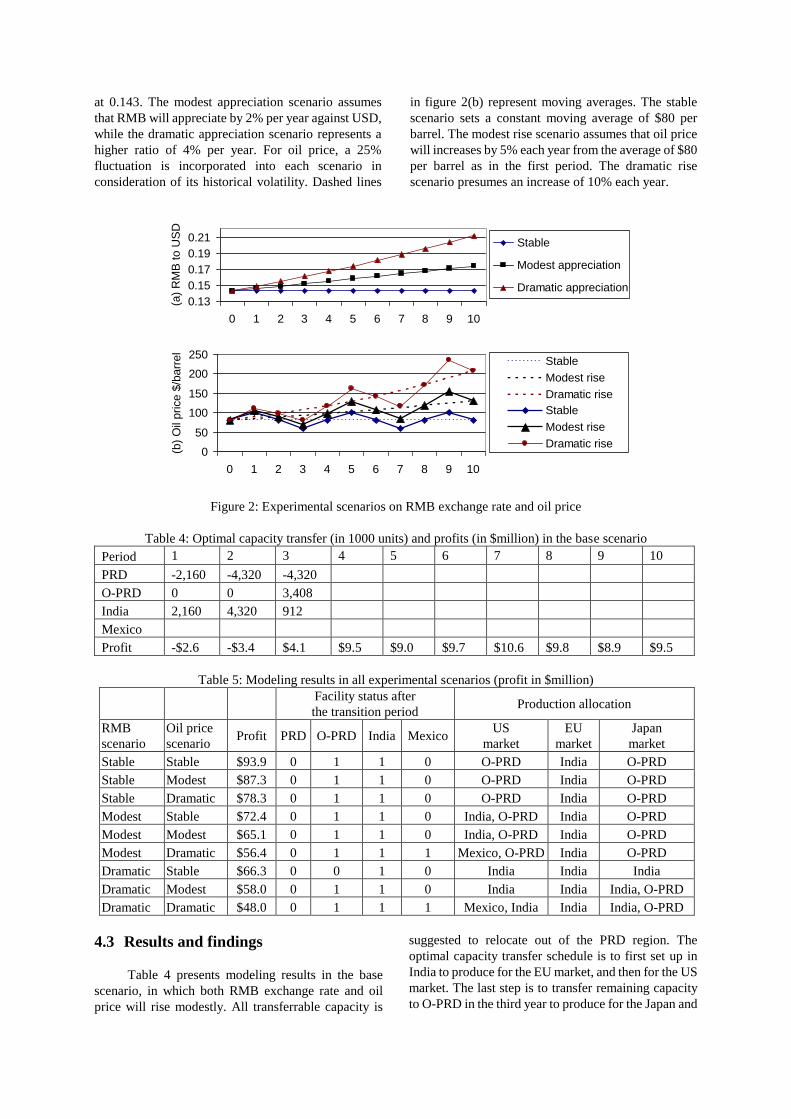
at 0.143. The modest appreciation scenario assumes
that RMB will appreciate by 2% per year against USD,
while the dramatic appreciation scenario represents a
higher ratio of 4% per year. For oil price, a 25%
fluctuation is incorporated into each scenario in
consideration of its historical volatility. Dashed lines
in figure 2(b) represent moving averages. The stable
scenario sets a constant moving average of $80 per
barrel. The modest rise scenario assumes that oil price
will increases by 5% each year from the average of $80
per barrel as in the first period. The dramatic rise
scenario presumes an increase of 10% each year.
0.13
0.15
0.17
0.19
0.21
0 1 2 3 4 5 6 7 8 9 10
(a)
RM
B to U
SD
Stable
Modest appreciation
Dramatic appreciation
0
50
100
150
200
250
0 1 2 3 4 5 6 7 8 9 10
(b)
Oil
price $
/barr
el
Stable
Modest rise
Dramatic rise
Stable
Modest rise
Dramatic rise
Figure 2: Experimental scenarios on RMB exchange rate and oil price
Table 4: Optimal capacity transfer (in 1000 units) and profits (in $million) in the base scenario
Period 1 2 3 4 5 6 7 8 9 10
PRD -2,160 -4,320 -4,320
O-PRD 0 0 3,408
India 2,160 4,320 912
Mexico
Profit -$2.6 -$3.4 $4.1 $9.5 $9.0 $9.7 $10.6 $9.8 $8.9 $9.5
Table 5: Modeling results in all experimental scenarios (profit in $million)
Facility status after
the transition period Production allocation
RMB
scenario
Oil price
scenario Profit PRD O-PRD India Mexico
US
market
EU
market
Japan
market
Stable Stable $93.9 0 1 1 0 O-PRD India O-PRD
Stable Modest $87.3 0 1 1 0 O-PRD India O-PRD
Stable Dramatic $78.3 0 1 1 0 O-PRD India O-PRD
Modest Stable $72.4 0 1 1 0 India, O-PRD India O-PRD
Modest Modest $65.1 0 1 1 0 India, O-PRD India O-PRD
Modest Dramatic $56.4 0 1 1 1 Mexico, O-PRD India O-PRD
Dramatic Stable $66.3 0 0 1 0 India India India
Dramatic Modest $58.0 0 1 1 0 India India India, O-PRD
Dramatic Dramatic $48.0 0 1 1 1 Mexico, India India India, O-PRD
4.3 Results and findings
Table 4 presents modeling results in the base
scenario, in which both RMB exchange rate and oil
price will rise modestly. All transferrable capacity is
suggested to relocate out of the PRD region. The
optimal capacity transfer schedule is to first set up in
India to produce for the EU market, and then for the US
market. The last step is to transfer remaining capacity
to O-PRD in the third year to produce for the Japan and

US markets. After the capacity relocation out of the
PRD region, demand in the US market will be met by
production from both O-PRD and India. Production
allocation between these two facilities will vary in
periods to minimize total cost as a response to changes
in business factors especially oil price. In the first two
years of the transition period, operating loss is
expected due to high relocation expenditures.
However, after-tax profits will be much improved after
the transition.
Optimal relocation decisions are also obtained
for alternative scenarios. The combination of 3
scenarios for both RMB exchange rate and oil price
leads to 9 scenarios in total with the inclusion of the
base scenario. Scenario definition and optimization
results are given in table 5.
Modeling results show that the EU market
should mostly be served from production in India.
Besides the labor cost advantage in India, favorable
tariffs play an important role. Footwear products of
China origin suffer from the antidumping tariff rate of
16.9% in the EU market, while those of India origin
enjoy the preferential tariff rate of 11.9%. In
comparison with China, manufacturing in India to
serve the EU market also benefits from lower freight
costs due to a shorter shipping distance.
Demand in the US should be fulfilled from
O-PRD if the RMB exchange rate stays stable. If the
RMB appreciates 2% or 4% per year against the USD,
India would become most cost competitive as long as
oil price does not rise dramatically to drive up freight
costs. If oil price increases by 10% per year as in the
dramatic scenario, the effect of high oil price would
become dominant to make Mexico most attractive to
serve the US market. The North American Free Trade
Agreement (NAFTA) is also crucial for the potential
shift of manufacturing to Mexico. As can be seen from
table 1, labor-intensive footwear products from
Mexico incur zero tariffs in the US market, while those
from China or India are imposed with very high tariff
rates of 20% on average.
The Japan market should be served by
production in O-PRD in most cases. If the RMB
exchange rate is stable or appreciates modestly at 2%
per year, O-PRD will maintain its comparative
advantage over India. If the RMB appreciates 4% per
year as in the dramatic scenario, India will become
more favorable. However, even if that is the case, a
portion of demand should still be fulfilled from O-PRD
if oil price rises modestly or dramatically. This is
because the logistics advantage of O-PRD at higher oil
prices partially offsets its disadvantage from the
dramatic RMB appreciation.
These above findings are expected to be valid in
general for labor-intensive global manufacturers in the
PRD region whose supply chains and cost structures
are similar to the representative company. Varying
degrees of labor-intensiveness and
freight-intensiveness may lead to differences in
optimal relocation decisions. However, the general
cause-and-effect relationships do not change.
5. CONCLUSIONS AND FUTURE
WORK
This paper deals with the facility relocation
problem of global manufacturing. The research is
motivated by the changing business conditions in the
Pearl River Delta of China, known as “The World’s
Factory” since the 1990s. Rising operating costs in the
region have triggered global manufacturers to plan for
relocation. A multi-period mixed integer programming
facility relocation model is developed for global
manufacturers in the region. Modeling results suggest
optimum relocation decisions.
This paper makes several contributions. First, it
identifies research opportunities on the relocation of
labor-intensive global manufacturing out of the Pearl
River Delta of China. The phenomenon is significant
and warrants further study. Second, a multi-period
facility relocation model is presented for the industrial
problem, and its application is illustrated through a
representative case. The model employs multiple
planning periods to addresses dynamic aspects of
timing, including potential developments in business
factors and the need of a gradual capacity transfer in
order not to disrupt demand fulfilment. Third,
modeling results offer managerial insights on
labor-intensive global manufacturing location and
relocation decisions. In general, a stable RMB
exchange rate would make lower-cost areas of China
more competitive. Dramatic RMB appreciation would
enhance the comparative advantage of manufacturing
in Asian lower-cost countries, which are represented
by India in the numerical example. A rapid hike in oil
prices would cause global manufacturing to move near
major markets, for example, Mexico in relation to the
US market.
The research has its limitations. First, as most
products from the PRD region compete mainly on cost
in international markets, the modeling work focuses on
cost. Modeling results may not be applicable for global
manufacturers with different competitive strategies
like marketing, product design and development, etc.
Second, the quantitative analysis does not consider
intangible factors, for example, political stability and
cultural differences. In addition, suggested relocation
decisions are subject to future uncertainties. The
research does not exclude the possibility that it may be
altered by unexpected factors.
An immediate extension of the multi-period
model will be to address uncertainties through
stochastic programming. Uncertainties in demand and
business operating costs will be considered.

REFERENCES
1. GPRD Business Council, Implications of
mainland processing trade policy on Hong Kong,
The Greater Pearl River Delta Business Council,
Hong Kong (2007).
2. HKTDC, Cost escalation and trends for export
price increase - A look at the rising production
costs in the PRD, Hong Kong Trade Development
Council, Hong Kong (2007).
3. HKTDC, Latest development and strategies of
Hong Kong companies' processing trade business
in the Pearl River Delta, Hong Kong Trade
Development Council, Hong Kong (2008).
4. HKTDC, Upward pressure on export prices
mounting but competitiveness maintained, Hong
Kong Trade Development Council, Hong Kong
(2008).
5. Huang, G.Q., X.Y. Zhang and L. Liang, "Towards
integrated optimal configuration of platform
products, manufacturing processes, and supply
chains", Journal of Operations Management, 23,
267-290 (2005).
6. Lodi, A., "Mixed integer programming
computation", in M. Jünger et al. (eds), 50 Years
of Integer Programming 1958-2008, Springer,
Berlin, 619-645 (2010).
7. Melachrinoudis, E. and H. Min, "The dynamic
relocation and phase-out of a hybrid, two-echelon
plant/warehousing facility: A multiple objective
approach", European Journal of Operational
Research, 123, 1-15 (2000).
8. Melo, M.T., S. Nickel and F. Saldanha da Gama,
"Dynamic multi-commodity capacitated facility
location: A mathematical modeling framework for
strategic supply chain planning", Computers &
Operations Research, 33, 181-208 (2006).
9. Melo, M.T., S. Nickel and F. Saldanha da Gama,
"Facility location and supply chain management -
A review", European Journal of Operational
Research, 196, 401-412 (2009).
10. Nickel, S. and J. Puerto, Location theory: A
unified approach, Springer, New York, NY
(2005).
11. Owen, S.H. and M.S. Daskin, "Strategic facility
location: A review", European Journal of
Operational Research, 111, 423-447 (1998).
12. Rubin, J. and B. Tal, Will soaring transport costs
reverse globalization?, CIBC World Markets Inc.,
Toronto StrategEcon, May 27, 4-7 (2008).
13. Snyder, L.V., "Facility location under uncertainty:
A review", IIE Transactions, 38, 547-554 (2006).
14. Tsiakis, P., N. Shah and C.C. Pantelides, "Design
of multi-echelon supply chain networks under
demand uncertainty", Industrial & Engineering
Chemistry Research, 40, 3585-3604 (2001).
15. Vidal, C.J. and M. Goetschalckx, "A global supply
chain model with transfer pricing and
transportation cost allocation", European Journal
of Operational Research, 129, 134-158 (2001).
16. Vila, D., A. Martel and R. Beauregard, "Designing
logistics networks in divergent process industries:
A methodology and its application to the lumber
industry", International Journal of Production
Economics, 102, 358-378 (2006).
17. Weber, A., Theory of the location of industries,
The University of Chicago Press, Chicago (1929).
18. Wilhelm, W., et al., "Design of international
assembly systems and their supply chains under
NAFTA", Transportation Research Part E, 41,
467-493 (2005).
19. Yang, T.H., R.T. Wang and C.H. Tseng, "The
application of goal programming to the
Scheduling problem of the professional baseball
league", Journal of the Chinese Institute of
Industrial Engineers, 26, 135-146 (2009).
20. Zhang, J., "Effect of exchange rate, inflation and
wages on the purchasing power of consumers in
different economies", 8th Global Conference on
Business & Economics, Oct. 18-19, Florence,
Italy (2008).
21. Zhao, G., Features of born global processing
plants in the global outsourcing industry, PhD
thesis, The University of Hong Kong, Hong Kong
(2006).
ABOUT THE AUTHORS
Abraham Zhang is a Ph.D. candidate in the
Department of Industrial and Manufacturing Systems
Engineering, The University of Hong Kong. He
obtained his Dual Master Degrees in Industrial
Engineering from Georgia Institute of Technology
(USA) and in Logistics and Supply Chain Management
from National University of Singapore. His research
activities include global manufacturing, supply chain
management, mathematical modeling.
George Q. Huang is a professor in the Department of
Industrial and Manufacturing Systems Engineering,
The University of Hong Kong. He obtained BEng and
PhD degrees from Southeast University (China) and
Cardiff University (UK) respectively. He has
conducted extensive research in collaborative product
development, ubiquitous manufacturing and
cross-border logistics with substantial financial
supports from the university, government and
industrial funding bodies.
(Received March 2010; revised June 2010; accepted
July 2010)
針對全球化製造工廠搬遷問題的多階混合整數規劃模型
張錫平*,黃國全
香港大學工業與製造系統工程系
香港薄扶林道
摘要
最近幾年,營商環境的變化導致勞動密集型的全球化製造商考慮搬離
享有“世界工廠”聲譽的中國珠江三角洲。本文提出一個針對全球化
製造工廠搬遷問題的多階混合整數規劃模型。該模型的目標函數實現
稅後利潤的最大化。該模型考慮與時間相關的動態因素,包括營商環
境的變化趨勢以及分階段的產能轉移以避免擾亂供應鏈管理。應用該
模型可以制定最優的產能轉移計劃並預測稅後利潤。總體而言,穩定
的人民幣匯率有利於提高中國内陸低成本地區的競爭力。人民幣快速
升值則會導致亞洲更低成本國家獲得比較競爭優勢。為避免高昂的運
輸成本,油价高漲有可能使靠近主要國際市場的地區獲益。
關鍵詞:選址,全球化製造,供應鏈管理,混合整數規劃,
珠江三角洲
(*聯絡人:[email protected])