PERFORMANCE OF HYBRID FIBER-REINFORCED ... - ERA
285
University of Alberta PERFORMANCE OF HYBRID FIBER-REINFORCED POLYMER NANOCOMPOSITE PIPES by Mohammad Towhidul Bashar A thesis submitted to the Faculty of Graduate Studies and Research in partial fulfillment of the requirements for the degree of Doctor of Philosophy Department of Mechanical Engineering ©Mohammad Towhidul Bashar Fall 2013 Edmonton, Alberta Permission is hereby granted to the University of Alberta Libraries to reproduce single copies of this thesis and to lend or sell such copies for private, scholarly or scientific research purposes only. Where the thesis is converted to, or otherwise made available in digital form, the University of Alberta will advise potential users of the thesis of these terms. The author reserves all other publication and other rights in association with the copyright in the thesis and, except as herein before provided, neither the thesis nor any substantial portion thereof may be printed or otherwise reproduced in any material form whatsoever without the author's prior written permission.
-
Upload
khangminh22 -
Category
Documents
-
view
2 -
download
0
Transcript of PERFORMANCE OF HYBRID FIBER-REINFORCED ... - ERA

University of Alberta
PERFORMANCE OF HYBRID FIBER-REINFORCED
POLYMER NANOCOMPOSITE PIPES
by
Mohammad Towhidul Bashar
A thesis submitted to the Faculty of Graduate Studies and Research
in partial fulfillment of the requirements for the degree of
Doctor of Philosophy
Department of Mechanical Engineering
©Mohammad Towhidul Bashar
Fall 2013
Edmonton, Alberta
Permission is hereby granted to the University of Alberta Libraries to reproduce single copies of this thesis and to lend
or sell such copies for private, scholarly or scientific research purposes only. Where the thesis is converted to, or
otherwise made available in digital form, the University of Alberta will advise potential users of the thesis of these
terms.
The author reserves all other publication and other rights in association with the copyright in the thesis and, except as
herein before provided, neither the thesis nor any substantial portion thereof may be printed or otherwise reproduced in
any material form whatsoever without the author's prior written permission.

Dedication
“This thesis is dedicated to my late wife Jannatul Ferdous, you who have made the ultimate
sacrifice. You encouraged and supported me in every step of this PhD degree. It is the fond
memory of your love, patience and understanding that would always inspire me.”

Abstract
Due to their attractive properties, pipes and vessels made from fiber-reinforced polymer
composites are increasingly being used for the storage and transmission of pressurized
fluids. Yet, the inherent anisotropy and inhomogeneity of fiber-reinforced composites in
conjunction with complex loading conditions may result in a variety of failure
mechanisms that restrict their application. In composite pipes, structural failure such as
burst and collapse is characterized by a fast loss of the contained fluid, whereas
functional failure occurs due to transverse matrix micro-cracking that generates
interconnected pathways through the pipe thickness allowing for the fluid to escape.
Recently, polymer nanocomposites have evolved as a new class of high-performance
multifunctional materials that often outperform conventionally filled and unfilled
polymers in terms of their properties. In the present study, the effect of nano-
reinforcements on matrix micro-cracking in filament-wound composites was investigated.
It was hypothesized that transverse matrix cracking in polymer composites can be
mitigated by reinforcing the matrix with an appropriate nano-particulate phase.
This research work involved the synthesis, characterization and property evaluation of
bulk epoxy nanocomposites and hybrid fiber-reinforced epoxy nanocomposites modified
with organophilic nanoclay and acrylic triblock-copolymer. The epoxy-clay
nanocomposites exhibited superior tensile stiffness with a reduction in ductility. Block-
copolymer addition enhanced toughness and ductility of bulk epoxy. The present study
further demonstrated that optimal mechanical property enhancements in an epoxy can be
achieved through the formation of a ternary nanocomposite incorporating nanoclay and
acrylic triblock-copolymer.
The presence of nanoparticles in the matrix of fiber-reinforced composites imparted an
insignificant effect on delamination fracture toughness, while decreasing fiber volume
fraction significantly improved fracture toughness. In block-copolymer modified
composite pipes, enhanced matrix ductility caused a build-up of strain energy during
applied loading until a sudden release of this energy resulted in the initiation and
subsequent propagation of matrix cracks. In response an improvement in leakage failure
strain was observed, however the process did not suppress matrix micro-cracking in
composite pipes, and failure strength remained unaffected. Strength was even reduced in
composite pipes modified with nanoclay, which is thought to stem from nanoclay
aggregates that may have acted as stress concentration points expediting micro-crack
initiation.

Acknowledgements
I would like to extend my sincere gratitude to my supervisors, Dr. Pierre Mertiny and Dr.
Uttandaraman Sundararaj for their invaluable guidance and inspiration during the course
of this research project. Their thoughtful ideas and encouragement provided constant
motivation throughout this degree program.
I am also very grateful for the continued research funding provided by Dr. Pierre Mertiny
from his research grant and his constant support throughout this study.
The author would also like to convey his thanks to Dr. Zihui Xia and the members of the
Advanced Composite Materials Engineering group for their support, technical expertise
and suggestions during the time of this research work. The author acknowledges the helpful
instructions of Dr. Anastasia Elias in regards to the DMA analysis. The author also acknowledges
the generous contribution of Dr. Robert Barsotti from Arkema in providing the M52 and M52N
block-copolymers. The author wants to thank Bernie Faulkner for helping with the test setup and
lab assistance. I also thank Randy Mandryk, Diane Caired, George Braybrooke and Joyce Chau in
providing analytical and experimental resources. All assistance rendered by the faculty,
technical and staff members of the Department of Mechanical Engineering are also
greatly acknowledged.
Finally, I would like to thank the Department of Mechanical Engineering at University of
Alberta for giving me the opportunity to conduct this research project.

Table of Contents
Chapter 1. Introduction 1
1.1 BACKGROUND 1
1.2 FILAMENT-WOUND COMPOSITE PIPE 2
1.2.1 Stress Analysis and Elastic Properties of Composite Pipe 4
1.2.2 Failure Mechanisms in Filament-wound Composite Pipe 5
1.2.3 Functional Failure in Filament-wound Composite Pipe 7
1.2.4 Matrix Cracking in Fiber-reinforced Composite Laminates 9
1.2.5 Puck’s Failure Theory for Filament-wound Composite Pipe 12
1.3 TOUGHENING OF THERMOSET EPOXY 14
1.3.1 Toughening Mechanisms in Epoxy 16
1.3.1.1 Shear Yielding and Cavitation 18
1.3.1.2 Crazing/Normal Yielding 19
1.3.1.3 Crack-tip Blunting 20
1.3.1.4 Rubber Stretching and Tearing 21
1.3.1.5 Crack Pinning 22
1.3.1.6 Crack Deflection/Crack Bifurcation 22
1.4 POLYMER NANOCOMPOSITES 24
1.4.1 Epoxy-clay Nanocomposites 25
1.4.1.1 Structure of Layered Silicate Clay 25
1.4.1.2 Morphology of Epoxy-clay Nanocomposites 27
1.4.1.3 Exfoliation Behavior of Epoxy-clay Nanocomposites 28
1.4.1.4 Physical and Mechanical Properties of Epoxy-clay Nanocomposites 31
1.5 NANOSTRUCTURED BLOCK-COPOLYMERS 32
1.5.1 Synthesis of Block-copolymers 33
1.5.2 Phase Behavior of Block-copolymers 34
1.5.3 Application of Self-assembled Nanostructured Block-copolymers 37
1.6 OBJECTIVE AND SCOPE OF THE PRESENT RESEARCH 39
1.6.1 Organization of the Dissertation 40

REFERENCES
42
Chapter 2. Materials and Experimental Procedure 58
2.1 MATERIAL SYSTEM 58
2.2 PREPARATION OF NANOCOMPOSITES 64
2.2.1 Epoxy-clay Nanocomposites 64
2.2.1.1 Mechanical Dispersion 64
2.2.1.2 Ultrasonic Dispersion 66
2.2.2 Block-copolymer/Epoxy Blends 67
2.2.3 Epoxy Hybrid Nanocomposites 69
2.2.4 Machining of the Specimens 69
2.2.5 Fabrication of Fiber-reinforced Epoxy Nanocomposites 70
2.2.6 Nanocomposite Pipe Fabrication 72
REFERENCES 73
Chapter 3. Characterization and Testing Methods of
Nanocomposites
76
3.1 X-RAY DIFFRACTION 76
3.2 TRANSMISSION OPTICAL MICROSCOPY 78
3.3 TRANSMISSION ELECTRON MICROSCOPY 78
3.4 SCANNING ELECTRON MICROSCOPY 79
3.5 DIFFERENTIAL SCANNING CALORIMETRY 81
3.6 FOURIER TRANSFORM INFRARED SPECTROSCOPY 83
3.7 DYNAMIC MECHANICAL THERMAL ANALYSIS 84
3.8 TENSILE TEST 87
3.9 MODE-I FRACTURE TOUGHNESS TEST 89
3.10 MODE-I INTERLAMINAR FRACTURE TOUGHNESS TEST 93
3.11 FIBER VOLUME FRACTION MEASUREMENT 97
3.12 MECHANICAL TESTING OF NANOCOMPOSITE TUBES 97
3.13 DETECTION OF PIPE FAILURES 99

REFERENCES
100
Chapter 4. Morphology, Mechanical and Fracture Properties of
Epoxy-clay Nanocomposites
103
4.1 INTRODUCTION 103
4.2 RESULTS AND DISCUSSION 106
4.2.1 Morphology of the Epoxy-clay Nanocomposites 106
4.2.2 Tensile Property of the Epoxy-clay Nanocomposites 115
4.2.3 Fracture Property of the Epoxy-clay Nanocomposites 119
4.2.4 Fractographic Study of the Epoxy-clay Nanocomposites 121
4.2.5 Thermal Property of the Epoxy-clay Nanocomposites 125
4.3 CONCLUSIONS 126
REFERENCES 128
Chapter 5. Study of Morphology and Mechanical Property of
Acrylic Triblock-copolymer Modified Epoxy
132
5.1 INTRODUCTION 132
5.2 RESULTS AND DISCUSSION 134
5.2.1 Miscibility of Block-copolymer/Epoxy Blends 134
5.2.2 Microstructure of Cured Block-copolymer/Epoxy Blends 136
5.2.3 Tensile Properties of Block-copolymer/Epoxy Blends 140
5.2.4 Fracture Properties of Block-copolymer/Epoxy Blends 143
5.3 CONCLUSIONS 148
REFERENCES 149
Chapter 6. Microstructure and Mechanical Properties of Epoxy
Hybrid Nanocomposites
154
6.1 INTRODUCTION 154
6.2 RESULTS AND DISCUSSION 156
6.2.1 X-ray Diffraction Analysis of Hybrid Nanocomposites 156

6.2.2 Microstructure Study of Hybrid Nanocomposites 157
6.2.3 Tensile Properties of Hybrid Nanocomposites 160
6.2.4 Fracture Properties of Hybrid Nanocomposites 164
6.2.5 Fracture Surface Study of Hybrid Nanocomposites 167
6.3 CONCLUSIONS 169
REFERENCES 171
Chapter 7. Interlaminar Fracture Behavior of Nanoparticle
Modified Epoxy/Basalt Fiber-reinforced Laminates
175
7.1 INTRODUCTION 175
7.2 RESULTS AND DISCUSSION 177
7.2.1 Mode-I Interlaminar Fracture Toughness of the Fiber Composites 177
7.2.2 Comparison of Bulk Polymer and Fiber Composite Fracture Energy 183
7.2.3 Fracture Surface Analysis 187
7.3 CONCLUSIONS 190
REFERENCES 190
Chapter 8. Study of Matrix Micro-cracking in Nanoclay and
Acrylic Triblock-copolymer Modified Epoxy/Basalt Fiber-
reinforced Pressure-retaining Structures
194
8.1 INTRODUCTION 194
8.2 RESULTS AND DISCUSSION 196
8.2.1 TOM Microscopy Study of Bulk Epoxy Nanocomposites 196
8.2.2 Fracture Properties of Bulk Epoxy Nanocomposites 198
8.2.3 Mechanical Properties of Hybrid Nanocomposite Tubes 200
8.2.3.1 Qualitative Analysis of Functional and Structural Failure 201
8.2.3.2 Biaxial Stress-strain Response 203
8.2.3.3 Fracture Analysis of Hybrid Nanocomposite Tubes 206
8.3 CONCLUSIONS 210
REFERENCES 210

Chapter 9. Conclusions 214
9.1 SUMMARY OF RESEARCH FINDINGS AND CONTRIBUTIONS 214
9.2 TOPICS OF FUTURE STUDY 215
9.2.1 Permeability Based Leakage Modeling to Detect Functional Failure in
Composite Pipe
216
9.2.2 Micromechanical Modeling of Damage in Nanoparticle Filled Composite
Pipe
217
9.2.3 Final Considerations 219
REFERENCES 220
Appendix A 223
EXPERIMENTALLY GENERATED GRAPHS 223
Appendix B 234
EXPERIMENTAL DATA 234

List of Tables
Table 2-1 Physical characteristics of the epoxy resin system [8]. 62
Table 2-2 Physical properties of the neat epoxy resin in cured state [8]. 62
Table 2-3 Physical properties of the layered silicate nanoclay [10-12]. 63
Table 2-4 Physical and chemical properties of the Nanostrength® M52N [13]. 63
Table 2-5 Property of the basalt fiber reinforcements [14]. 63
Table 4-1 Clay, organic modifier, d-spacing and corresponding nanocomposite
morphology.
115
Table 4-2 Property of epoxy nanocomposites containing various concentrations
of I.30E.
116
Table 5-1 Property of modified epoxy blends constraining various types and
concentrations of block-copolymers.
141
Table 6-1 Compositions of different single-component epoxy systems and hybrid
nanocomposites.
157
Table 6-2 Mechanical properties of modified epoxy containing various types and
compositions of nanofiller.
162
Table 7-1 Fracture energy of bulk epoxy and its nanocomposites and
corresponding fiber-reinforced composites.
180
Table 8-1 Fiber volume fraction and nominal wall thickness for fiber-reinforced
nanocomposite tubes.
201
Table 8-2 Experimental failure stresses of hybrid fiber-reinforced nanocomposite
tubes.
205

List of Figures
Figure 1.1 Pictures of the exterior of a pipe taken during weepage test (an
ultraviolet die penetrant was used).
8
Figure 1.2 1, 2, 3, 23,31 and 21 are stresses acting on a unidirectional
composite element related to the natural axes. The stresses n, nt and
n1, which are decisive for interfiber failure are defined by the (x1, xn,
xt) coordinate system. Reprinted with permission from [49].
Copyright 1998 Elsevier Limited.
14
Figure 1.3 Toughening mechanisms in rubber modified polymers. Reprinted
with permission from [51]. Copyright 1988 Elsevier Limited.
17
Figure 1.4 A SEM micrographs of acrylic based block-copolymer (M52)
modified epoxy fracture surface illustrating features from particle
cavitation and matrix shear deformation process.
19
Figure 1.5 (a) A schematic of crack-pinning mechanism (Adapted from [51].
Copyright 1988 Elsevier Limited.), and (b) a SEM micrograph of
epoxy-clay (I.28E) nanocomposite fracture surface showing features
from crack-pinning mechanism.
23
Figure 1.6 SEM micrographs of epoxy-clay (I.30E) nanocomposite fracture
surface showing: (a) crack deflection/bifurcation mechanism, and (b)
crack deflection and matrix deformation.
24
Figure 1.7 Idealized structure of 2:1 layered silicates (MMT). Reprinted with
permission from [110, 128]. Copyright 1999 Springer-Verlag Berlin
Heidelberg.
27
Figure 1.8 A schematic illustration of three basic nanoclay structures in a
polymer matrix.
28
Figure 1.9 Phase diagram of a linear diblock-copolymer melt predicted from
self-consistent mean-field theory. Four ordered morphologies are
shown: lamellar (lam), gyroid (gyr), hexagonal (hex) and body-
centered cubic (bcc), and a disordered (dis) phase. Reprinted with
35

permission from [136, 143]. Copyright 2004 John Wiley and Sons.
Figure 1.10 Different nanostructured block-copolymer morphologies formed
inside an epoxy resin.
37
Figure 2.1 Formation of an epoxy prepolymer. 59
Figure 2.2 A schematic representation of the epoxy curing reaction. 60
Figure 2.3 Representative chemical structures of the alkylammonium ions and
acrylic block-copolymers used in this study.
61
Figure 2.4 Picture of powdered nano-fillers: (a) I.30E and (b) M52N. 62
Figure 2.5 Mold used for epoxy casting. 65
Figure 2.6 Process flow diagram of nanocomposite fabrication by mechanical
mixing method.
65
Figure 2.7 Liquid epoxy resin EPON 826 with and without nano-fillers. 67
Figure 2.8 Processing steps for nanocomposite fabricated by ultrasonic mixing
method.
68
Figure 2.9 A schematic of the processing steps for fiber-reinforced epoxy
nanocomposites.
71
Figure 2.10 Tubular specimen geometry and fiber direction. 73
Figure 2.11 Tubular basalt fiber-reinforced epoxy/M52N composite specimens. 73
Figure 3.1 X-ray diffraction trace of I.30E organoclay. 77
Figure 3.2 TOM image of modified epoxy containing 1 wt% M52N block-
copolymer.
78
Figure 3.3 TEM microscopy images of (a) 1 wt% nanoclay and (b) 3 wt%
block-copolymer modified epoxy.
79
Figure 3.4 SEM microscopy images of (a) 3 wt% nanoclay and (b) 3 wt%
block-copolymer modified epoxy.
80
Figure 3.5 Schematic of a DSC instrument. 82
Figure 3.6 DSC trace of cured neat epoxy sample (EPON 826/EPIKURE 9551). 82
Figure 3.7 FTIR spectrum of cured neat epoxy (EPON 826/EPIKURE 9551). 84
Figure 3.8 (a) A schematic of the DMA 8000 instrument and mode of testing [7]
and (b) epoxy specimens used for DMTA analysis.
85
Figure 3.9 DMTA analysis showing storage modulus and tanδ curves of 86

modified epoxy containing 5 wt% M52 block-copolymer.
Figure 3.10 Geometry of the tensile test specimen (dimensions in millimeters). 88
Figure 3.11 (a) Tensile testing setup and (b) failed specimens after tensile testing. 88
Figure 3.12 Typical stress-strain response of the neat epoxy sample (EPON
826/EPIKURE 9551).
89
Figure 3.13 A schematic of the single edge notch bend specimen (dimensions in
millimeters).
91
Figure 3.14 Pre-cracking arrangements for (a) blunt crack and (b) sharp crack. 92
Figure 3.15 Pre-crack configurations: (a) blunt crack and (b) sharp crack. 92
Figure 3.16 Mode-I fracture toughness testing of bulk epoxy nanocomposite. 92
Figure 3.17 A schematic of the double-cantilever beam specimen. 94
Figure 3.18 Mode-I interlaminar fracture toughness testing of fiber-reinforced
nanocomposite laminates.
95
Figure 3.19 Load-displacement curves of the DCB test specimen (neat epoxy). 95
Figure 3.20 Data reduction procedures employed: (a) modified beam theory, (b)
compliance calibration and (c) modified compliance calibration.
96
Figure 3.21 Resistance curves obtained from different data reduction methods. 96
Figure 3.22 (a) Multi-axial testing instrument and (b) structurally failed tubular
test specimens.
98
Figure 3.23 Global biaxial stress-strain response of filament-wound pipe made
with an epoxy polymer containing 3 wt% of M52N block-copolymer.
99
Figure 3.24 Fluid volume versus intensifier pressure for pipe tested under biaxial
loading.
100
Figure 4.1 Typical X-ray diffraction peaks of the organoclay and unmodified
clay.
107
Figure 4.2 XRD analysis results showing interlamellar spacing of nanoclay at
various stages of I.30E-epoxy nanocomposite processing: (a)
organoclay, (b) organoclay in epoxy resin before curing agent
addition and (c) after cure.
108
Figure 4.3 X-ray scattering traces of nanocomposites containing 1 wt%
nanoclay in epoxy.
109

Figure 4.4 X-ray diffraction patterns of nanocomposites: (a), (b) and (c)
prepared by ultrasonic dispersion and (d) and (e) by mechanical
dispersion of I.30E clay.
110
Figure 4.5 Transparency of: (a) neat epoxy and nanocomposites containing 1
wt%, 2 wt% and 3wt% I.30E clay and (b) nanocomposites containing
1 wt% of respective nanoclays, both prepared by ultrasonic
dispersion method.
111
Figure 4.6 TEM micrographs of nanocomposites made by ultrasonic dispersion
of epoxy containing (a) 1 wt% I.30E (high magnification) and 2 wt%
I.30E clay at (b) high magnification and at (c) low magnification.
112
Figure 4.7 TEM micrographs of nanocomposites prepared by mechanical
mixing of epoxy containing: 1 wt% I.30E at (a) high and (b) low
magnifications and (c) 2 wt% I.30E clay.
113
Figure 4.8 TEM images of nanocomposites comprising 1 wt% I.28E in epoxy
at: (a) high magnification and (b) low magnification.
114
Figure 4.9 TEM images of nanocomposites comprising 1 wt% PGW in epoxy
at: (a) high magnification and (b) low magnification.
114
Figure 4.10 Influence of I.30E clay concentration on tensile modulus of
nanocomposites.
117
Figure 4.11 Tensile strength of nanocomposites as a function of I.30E clay
content.
117
Figure 4.12 Relation between tensile elongation and I.30E clay loading of
nanocomposites.
118
Figure 4.13 Tensile properties of different nanoclay filled epoxy (ultrasonic
mixing).
118
Figure 4.14 Influence of I.30E clay concentration on fracture toughness of
nanocomposites.
120
Figure 4.15 The variation of fracture energy of nanocomposites with I.30E clay
loading.
120
Figure 4.16 Fracture energy of the different nanoclay reinforced nanocomposites. 121
Figure 4.17 SEM micrograph of a neat epoxy fracture surface. 121

Figure 4.18 Fracture surface micrographs (SEM) of nanocomposites made by
ultrasonic dispersion of epoxy containing (a) 1 wt%, (b) 1 wt% (high
magnification), (c) 2 wt% and (d) 3 wt% I.30E clay.
123
Figure 4.19 Fracture surface micrographs (SEM) of nanocomposites made by
mechanical dispersion of epoxy containing (a) 1 wt%, (b) 1 wt%
(high magnification), (c) 2 wt% and (d) 3 wt% I.30E clay.
124
Figure 4.20 Fracture surface micrographs (SEM) of nanocomposites comprised
of 1 wt% I.28E clay in epoxy at: (a) low magnification and (b) high
magnification.
125
Figure 4.21 Fracture surface micrographs (SEM) of nanocomposites comprised
of 1 wt% PGW clay in epoxy at: (a) low magnification and (b) high
magnification.
125
Figure 4.22 Glass transition temperature of nanocomposites as a function of I.30E
clay content.
127
Figure 5.1 FTIR spectra of cured (a) neat epoxy and (b) 5 wt% M52 and (c) 5
wt% M52N modified epoxy blends.
136
Figure 5.2 Transparency of (a) neat epoxy and (b) 3 wt% M52, (c) 3 wt%
M52N, (d) 5 wt% M52N and (e) 5 wt% M52 modified epoxy blends.
137
Figure 5.3 TEM micrographs of 3 wt% M52 block-copolymer modified epoxy
blends at (a) low and (b) high magnifications.
138
Figure 5.4 TEM micrographs: (a) 3 wt% M52N (without osmic acid straining)
and (b) 5 wt% M52N (with osmic acid staining) block-copolymer
modified epoxy blends.
138
Figure 5.5 DSC thermograms of cured (a) neat epoxy and (b) 5 wt% M52 and
(c) 5 wt% M52N block-copolymer modified epoxy.
139
Figure 5.6 DMTA plot showing storage modulus and tan δ curves of neat and 5
wt% block-copolymer modified epoxy.
140
Figure 5.7 Tensile modulus of modified epoxy as a function of block-copolymer
content.
142
Figure 5.8 Influence of block-copolymer concentration on tensile strength of
modified epoxy.
142
Figure 5.9 Effect of block-copolymer content on modulus of modified epoxy. 143
Figure 5.10 Fracture toughness of modified epoxy plotted against corresponding
block-copolymer concentration.
144
Figure 5.11 Strain energy release rate of modified epoxy plotted against
corresponding block-copolymer concentration.
145
Figure 5.12 Fracture surface micrographs (SEM) of modified epoxy comprised of
3 wt% M52 block-copolymer at (a) low (1000x) and (b) high
(10000x) magnifications.
147
Figure 5.13 Fracture surface micrographs (SEM) of modified epoxy comprised of
3 wt% M52N block-copolymer: (a) low magnification of 20000x and
high magnification of (b) 50000x and (c) 100000x.
147
Figure 6.1 X-ray diffraction patterns of (a) organoclay and cured
nanocomposites: (b) 1 wt% and (c) 2 wt% I.30E nanoclay filled
epoxy, (d) 3B&1C and (e) 1B&3C hybrid compounds.
158
Figure 6.2 TEM images of (a) sample 1C a nanoclay filled epoxy and (b)
sample 3B a block-copolymer dispersed epoxy.
159
Figure 6.3 TEM images of 3B&1C a hybrid nanocomposite: pictures are taken
at high magnification for specimens (a) without and (b) with osmic
acid staining and (d) at low magnification.
160
Figure 6.4 Tensile stress-strain response of modified epoxy with respect to
nanofiller contents.
161
Figure 6.5 Tensile modulus of composites in reference to different nanofiller
compositions.
162
Figure 6.6 Tensile strength of composites as a function of different nanofiller
compositions in epoxy.
163
Figure 6.7 Dependence of composite tensile elongation on various nanofiller
compositions in modified epoxy.
164
Figure 6.8 Crack initiation and crack growth behavior of SENB specimens
made with: (a) neat epoxy, (b) sample 3C a nanoclay filled epoxy
and 1B&3C a hybrid nanocomposite and (c) sample 3B a block-
copolymer modified epoxy and 3B&1C a hybrid nanocomposite.
165

Figure 6.9 Fracture toughness of epoxy composites as a function of different
nanofiller compositions.
167
Figure 6.10 SEM images of SENB fracture surfaces of sample 3C a nanoclay
filled epoxy nanocomposite at (a) low magnification and (b) high
magnification.
168
Figure 6.11 SEM images of SENB fracture surfaces of sample 3B a block-
copolymer modified epoxy at (a) low magnification and (c) high
magnification.
169
Figure 6.12 SEM images of SENB fracture surfaces of 1B&1C a hybrid
nanocomposite at (a)-(b) high magnification.
170
Figure 7.1 Load-displacement curves of the DCB test specimens made with: (a)
neat epoxy and modified epoxy containing (b) 3 wt% I.30E and (c) 5
wt% M52N respectively.
178
Figure 7.2 Variations in strain energy release rate with delamination length of
different fiber composites.
179
Figure 7.3 Dependence of delamination energy on fiber volume fraction of
different fiber composites.
182
Figure 7.4 SEM pictures of the cross-section of laminate made with neat epoxy
taken at: (a) low and (b) high magnifications.
182
Figure 7.5 Crack initiation energy (NL) of the fiber composites with
corresponding fracture energy of the bulk polymers as a function of
I.30E content.
184
Figure 7.6 Crack initiation energy (NL) of the fiber composites with
corresponding fracture energy of the bulk polymers as a function of
M52N content.
185
Figure 7.7 Comparison between steady-state delamination energy of fiber
composites and strain energy of bulk polymers.
186
Figure 7.8 Fiber bridging that took place during delamination in a laminate
made of neat resin and basalt fiber.
187
Figure 7.9 SEM image of a DCB fracture surface of a laminate made with neat
epoxy.
188

Figure 7.10 SEM images of DCB fracture surface of 3 wt% I.30E modified
epoxy laminate taken at (a) low and (b) high magnifications.
189
Figure 7.11 SEM images of the DCB fracture surface of 3 wt% M52N modified
epoxy laminate taken at (a) low and (b)-(d) high magnifications.
189
Figure 8.1 TOM images of cured block-copolymer/epoxy blend: sharp pre-cracked
fracture surface examined under (a) bright field, (b) cross-polarized light
and (c) blunt pre-cracked surface under cross-polarized light.
197
Figure 8.2 Critical stress intensity factors of nanocomposites relative to I.30E
nanoclay concentration.
199
Figure 8.3 Critical stress intensity factors of nanocomposites relative to M52N
block-copolymer concentration.
200
Figure 8.4 Photographs of specimen failure mode: (a) functional failure
(epoxy/glass fiber tube) and (b) structural failure (epoxy/basalt fiber
tube).
202
Figure 8.5 Hoop stress-strain response for [2H:1A] loading of [ 603]T wound
tubes containing 3 wt% filler-matrix content.
204
Figure 8.6 Axial stress-strain response for [2H:1A] loading of [ 603]T wound
tubes containing 3 wt% filler-matrix content.
205
Figure 8.7 Maximum hoop strain corresponding to functional failure of hybrid
nanocomposite tubes as a function of nanofiller loading.
207
Figure 8.8 Hoop failure stress of hybrid nanocomposite tubes as a function of
M52N block-copolymer loading.
207
Figure 8.9 Hoop failure stress of hybrid nanocomposite tubes as a function of
I.30E nanoclay loading.
209
Figure 9.1 Unit-cell model for filament-wound composite pipe. 217
Figure 9.2 (a) Axial stress-strain response and (b) bi-axial straining of the
filament-wound pipe.
219

Nomenclature
Δ is the delamination correction factor determined as the x-axis intercept of
the C1/3
versus a1 plot
Φ is the energy calibration factor
δ is the phase lag
δ1 is the load-point displacement
is the crack-opening displacement
ε is the engineering strain
ε0 is the strain amplitude
1, 2 are the normal strains in the local coordinate system
is the true tensile strain
c is the critical strain for craze formation
εf is the matrix failure strain
x, y are the normal strains in the global coordinate system
{ } are the midplane strains of the laminate
is the tear energy of rubber
12 is the shear strain in the local coordinate system
m is the fracture energy of the matrix
xy is the shear strain in the global coordinate system
{ } are the midplane curvatures of the laminate
λ is the wavelength (0.17889 nm) of X-ray beam (Co/K-alpha1 radiation)
λ1 is the extension ratio when rubber particle tear
µs is a pressure coefficient
is the wavenumber, which is reciprocal of the wavelength of radiation
θ is the filament winding angle
θ0 is the angle of incidence
is the crack-tip radius
ρf, ρm, ρp are the density of the fiber, matrix and nanoparticles, respectively
σ is the engineering stress

σ0 is the stress amplitude
1, 2, 3 are the normal stresses in the local coordinate system
is the true tensile stress
, are normal stresses parallel and perpendicular to the fibers, respectively
ff, mf are longitudinal strengths related to fiber and matrix failure, respectively
mf, Af are transverse strengths corresponding to matrix and interface failure,
respectively
mF is a fictitious strength value attainable if the fibers were elongated up to
the breaking point of the matrix
F is the normal strength perpendicular to the fibers
A is the axial stress applied to the pipe
H is the hoop stress applied to the pipe
c is the critical stress attained at a distance c ahead of the crack-tip
m is the hydrostatic stress
σys is the yield stress
n normal stress (Mohr’s stress) acting on the fracture plane
x, y are the normal stresses in the global coordinate system
o is the intrinsic shear strength of the material
12 is the shear stress in the local coordinate system
are shear stresses parallel and perpendicular to the fibers
mf, Af are shear strengths referring to the types of failure in the composite
F is the shear strength
nt, n1 shear stresses (Mohr’s stresses) acting on the fracture plane
oct is the critical octahedral shear stress
xy is the shear stress in the global coordinate system
, 12 are the Poisson’s ratios
0 is the frequency of radiation
ω is the angular frequency
A1 is taken as the slope of a plot between a1/h0 and cube root of compliance
C1/3

a is the overall crack length of the SENB specimen
ao is the initial delamination length of the DCB specimen
a1 is the delamination length of the DCB specimen
B is the thickness of the SENB specimen
b is the width of the DCB specimen
C is the compliance defined as the ratio of the load-point displacement to the
applied load, δ1/P1
c is the velocity of light (2.998×10⁸ m/s)
D is the internal pipe diameter
d001 is the spacing between imaginary atomic planes (interlamellar spacing of
nanoclay)
2d is the interparticle spacing
E is the Young’s modulus
E0 is the energy of a photon
E1, E2 are the Young’s moduli of the lamina
El is the loss modulus
Es is the storage modulus
F is the axial force applied to the pipe
xf is a shape factor
G12 is the shear modulus
GIC is the strain energy release rate
ΔGIC is the increase in fracture energy
GQ is the conditional strain energy release rate
H is the Planck’s constant (6.626×10⁻³⁴
J.s)
h0 is the thickness of the DCB sample
h' is the laminate thickness
KI is the stress intensity factor
KIC is the fracture toughness
KIcs is the measured stress intensity factor at the onset of crack growth
mf, mm, mp are the mass of the fiber, matrix and nanoparticles, respectively
Nx, Ny, Nxy are the resultant in-plane forces acting in a laminate

n is an integer
n1 is the slope of a least square plot of log (δ1/P1) versus log(a1)
P, P1 is the applied load
,
are the slopes of the (n, nt) and (n, n1) fracture envelopes, respectively
at n=0
pi is the internal pressure in the pipe
po is the atmospheric pressure
Q11, Q12, Q22, Q66 are the reduced stiffness coefficients
are fracture resistances
r is the particle radius
ry is the radius of the plastic zone
S is the support span distance during fracture testing of the SENB specimen
T is the line energy of the crack front
t is the time
t0 is the wall thickness of the pipe
tg is the glass transition temperature
U is the energy estimated by integrating the area under the load versus load-
point displacement curve of the mode-I fracture test
Vf is the fiber volume fraction
VP is the volume fraction of the rubber particle
W is the width of the SENB specimen
X, Y are time and temperature dependent parameters

Abbreviations
ACME advanced composite materials engineering
ASTM American standard test method
BDMA benzyldimethylamine
BTFA boron trifluoride monoethylamine
CC compliance calibration method
CDS characteristic damage state
CTBN carboxyl-terminated butadiene-acrylonitrile
DCB double-cantilever beam
DMTA dynamic mechanical thermal analysis
DSC differential scanning calorimetry
FTIR Fourier transform infrared spectroscopy
MBT modified beam theory
MCC modified compliance calibration method
MDA methylene dianiline
NMA nadic methyl anhydride
ODA octadecyl ammonium
ODT order-disorder transition
ODTMA octadecyl trimethyl ammonium
OOT order-order transition
SCMF self-consistent mean-field
SEM scanning electron microscopy
SENB single edge notch bend
TEM transmission electron microscopy
TGAP triglycidyl p-amino phenol
TGDDM tetraglycidyldiamino diphenylmethane
TOM transmission optical microscopy
WAXD wide angle X-ray diffraction
XRD X-ray diffraction

1
Chapter 1
Introduction
1.1 BACKGROUND
Excellent load bearing capacity and exceptional resilience against extreme climatic condition
have made filament-wound composite structures especially attractive in challenging
conditions, such as applications in arctic and cryogenic environment, oil and gas exploration
(e.g. off-shore risers and on-shore down-hole tubulars) and aerospace (e.g. fuselages and
propellant tanks) [1]. Lately, filament-wound composites are being used in automotive drive
shafts, utility poles and process/high-pressure piping under varied service conditions. Similar
to other fiber-reinforced polymeric composites, the primary advantages of adopting filament-
wound composite piping are corrosion resistance and a high strength-to-weight ratio. In
recent times, with the advent of computer-controlled winding machines, it has become
possible to fabricate composite pipes having almost any conceivable winding angle, pattern
and lay-up configuration designed to perform in specific application. As in most composite
materials, fibers are the structural back-bone of a composite piping providing strength and
stiffness. The polymer matrix, on the other hand, provides structural integrity, corrosion
resistance, easy processability and cost effectiveness of the composite part, and during
service, transfers load between the fibers. High-pressure tubulars are intended to sustain
diverse loading conditions throughout their service life, which may be from internal pressure
and/or axial loading. However, failure mechanism in composite tubulars, involving damage
initiation and progression, accumulation and interaction under varied loading (e.g. uniaxial,
multiaxial, monotonic or fatigue loading) and environmental conditions, are extremely
complex (e.g. localized or global failure of the material). Inhomogeneity and anisotropy in
the composite structure and diversity in available material systems further engender any
particular damage mechanism and failure criterion to accurately and reliably describe the
composite behavior. A state-of-the-art filament-winding facility was setup at the Mechanical
Engineering Department of the University of Alberta with the intention to investigate and

2
understand the material behavior and failure mechanisms of fiber-reinforced polymeric
tubulars. As part of a comprehensive study on the performance of high-pressure composite
tubulars, discrete failure modes are being investigated under a variety of loading, processing
and geometric conditions at the Advanced Composite Materials Engineering (ACME) lab
[1]. Specifically, the aim of these investigations was to study deformation and fracture
behavior [1-8], determine functional and structural failure strengths, and develop failure
envelopes for composite pipes. To date, the studies carried out by Ellyin et al. [1-2], Mertiny
et al. [3-5, 9] and Martens and Ellyin [6, 10] all have recognized two distinct failure events
that commonly appear in a pressurized tubular. One is functional failure, also known as
leakage/weepage failure that results as a consequence of cracking in the matrix phase, even
though the structural integrity and load bearing capacity of the pipe may be unaffected. The
other kind of failure is structural or burst failure that happens when the structure is unable to
carry the applied loading or collapses completely.
To this extent, the present new research initiative was implemented to focus on synthesis,
characterization, manufacturing and application of filament-wound hybrid
basalt/epoxy/nanoparticle reinforced composite pipes. In the present study a strong emphasis
is given on the mitigation of leakage, and hence transverse matrix cracking in filament-
wound composite pipes in the framework of nanotechnology. It is understood that up until
now there has only been a limited amount of studies that are devoted to reinforcing filament-
wound structures with nanoparticles [11].
1.2 FILAMENT-WOUND COMPOSITE PIPE
The performance of filament-wound composite structure is dependent on the properties of
constituent materials (i.e. fiber, matrix and fiber-matrix interface) as well as on the
manufacturing and design parameters (e.g. fiber lay-up, laminate stacking sequence, mandrel
diameter, winding tension, winding time, fiber wet-out, etc.). This has been revealed by the
investigations conducted by Cohen [12] and Cohen at el. [13]. Previously, Spencer and Hull
[14] investigated the effect of winding angle (35°, 45°, 65° and 75°) on the deformation
and failure of composite pipes. In the case of weepage failure, they observed the pipe that
was wound with a 55° winding angle sustained maximum axial and hoop stresses under
pressure vessel type loading. Soden et al. [15] documented that an increasing winding angle

3
relative to the tube axis provided greater circumferential tensile strength, while lower
winding angles developed higher axial strength in the pipe. Mertiny et al. [4] studied the
effect of different multi-angle lay-up configurations ([±60°3]T, [±45°, ±60°2]T and [±30°,
±60°2]T) under varied biaxial stress ratios, and concluded that multi-angle filament wound
tubes performed better in preventing damage. The use of a multidirectional laminate is
typical for a composite structure that is subject to combined and complex loading situations.
Rousseau et al. [16] studied the degree of interweaving (winding pattern) in filament-wound
pipes, and observed an increase in damage growth occurring at crossover undulating regions
for condition of closed-ended internal pressure loading. From experimental observation,
Mertiny and Ellyin [3] stated that the winding bandwidth and fiber volume function of
finished parts are influenced by the imposed winding tension during the fabrication process.
In another study, Mertiny and Ellyin [5] reported increasing winding tension to lead to higher
consolidation of the fiber material, hence producing tubulars with higher fiber volume
fraction, which also resulted in greater failure stresses for fiber dominated loading conditions.
The loading scenario, such as the type of loading (e.g. tension, compression, bending, torsion,
internal pressure, etc.), loading ratio, loading rate, cyclic or monotonic loading and
environmental effect [17] (e.g. temperature, aqueous or acidic condition, etc.) all have
relevant contributions to the failure characteristics of a composite pipe. The typical loading
conditions for pressure pipes are combinations of biaxial stress ratios caused by internal
pressure and axial stress under monotonic or fatigue loading. Three main loading ratios have
frequently been stated in many publications; these are pure axial tension or compression, pure
internal pressure, and the closed end condition or pressure vessel type loading [18-19]. It has
been documented that for a tube with a particular lay-up configuration the leakage and
ultimate failure strength varied significantly depending on the applied circumferential to axial
loading ratio [15]. Studies conducted by Ellyin et al. [2] and Carroll et al. [20] demonstrated
that biaxial failure stress-strain behavior of filament-wound glass-fiber/epoxy tubular are
dependent on loading rate, i.e. failure stresses increased with higher loading rate. Similarly,
Mertiny and Gold [9] and others have observed the effect of time-dependent behavior on
stress-strain response and damage mechanism of composite pipes [20-21]. In the case of
functional failure, a loading rate dependency is to be expected as weepage is the outcome of a
matrix-dominated failure event. Ellyin and Martens [10] and Kujawski et al. [22] studied

4
functional failure behavior of multidirectional glass-fiber/epoxy pipes under fatigue loading,
and noted early damage initiation for cyclic loading. In a dynamic loading scheme, damage
by matrix cracking, fiber debonding and delamination are major causes of concern for fatigue
life reduction in composite tubulars.
In the present study, a [±60°3]T angle-ply lay-up was chosen purposefully for the design
loading condition (where circumferential to axial load ratio is 2:1). It has been documented in
the published literature that this winding angle produces a high discrepancy between leakage
and ultimate failure strengths under a loading ratio of 2:1 [23], hence indicating a strong
susceptibility of this combination of lay-up geometry and loading to leakage failure.
It is natural to expect an axial oriented winding angle to sustain a larger axial load.
Alternatively, a hoop winding would provide maximum strength in the circumferential
direction. The highest stress that a tubular structure will endure before fiber failure (i.e.
rupture of the pipe) can be estimated using the netting analysis technique, which assumes
applied stresses to be carried by forces in the fibers and a negligible contribution from resin
phase. Applying netting analysis approximation for the selected loading condition, tan2θ = 2,
where is the fiber angle with respect to the cylindrical axis, an optimum winding angle of
approximately ±55° is found. It can be surmised that the selected lay-up configuration of
[±60°3]T provides a stronger performance for hoop dominated loading ratios, while it
contributes rather poorly for axial loading conditions.
1.2.1 Stress Analysis and Elastic Properties of Composite Pipe
The composite structure of a filament-wound pipe can be envisaged as an angle-ply
laminate. As the cylindrical shell of a composite pipe is usually relatively thin compared
to other dimensions only in-plane stresses (plane stress condition) are considered. In this
context, classical laminate theory has widely been applied, which considers each lamina
to be composed of a linear elastic orthotropic homogenous material. The fundamental
unit in a laminate is the single unidirectional lamina. The stress-strain relationship of an
angle-ply lamina in a local coordinate frame can be written as.
{
} {
} {
} (1.1)

5
The reduced stiffness coefficients are
,
,
and , where E1 and E2 are the Young’s moduli in parallel and transverse to the
fiber directions,
is the Poisson’s ratio, and G12 is the shear modulus.
It is assumed that in a laminate the laminae are perfectly bonded to each other, which
implies no slip occurs at the interfaces between different laminae. If the strain varies
linearly through the laminate thickness, then the laminate strains in a global coordinate
system are:
{
} {
} {
} (1.2)
where { } and { } are midplane strains and curvatures. Then stresses in each lamina can
be integrated over the whole laminate thickness to give the resultant in-plane forces.
{
} ∫ {
}
(1.3)
where h’ is the laminate thickness. As expressed above the stress analysis and elastic
properties of the composite pipe can be predicted from the constitutive properties of the
laminae by laminate theory. But, the laminate theory does not adequately address the
complexity of the composite structure (e.g. the effect of material inhomogeneity, lay-up
sequences, etc.). As well, it does not give answers to damage micromechanics and
mechanisms of the fracture process. Classical laminate theory, while being restrictive in
theoretical and computational premise for the accurate analysis and prediction of pre-
existing, progressive or degradative damage, can still be regarded as a useful tool for
failure analysis of composite pipes.
1.2.2 Failure Mechanisms in Filament-wound Composite Pipe
In recent years, significant research has been conducted to find accurate and reliable design
methodologies and analytical predictions for the behavior of filament-wound composite
pipes. A review of the existing literatures revealed that failure behavior of ±60° and ±55°
helically wound pipes [18-19, 23] have been the subject of many studies that has provided
substantial understating of failure mechanism in these lay-up geometries. A large amount of

6
literature is available on stress-strain behavior, failure micromechanics, damage description
and failure modes of composite pipes [5-6]. Experimentally determined failure envelopes
(biaxial failure envelopes) have been developed for various combinations of biaxial loading
ratio for filament-wound pipes with given lay-up configurations [10, 15, 23]. In an actual
setup, these failure envelopes can be adopted to provide an acceptable design basis and
guideline for safe operational specifications, under the condition that the material and
fabrication system remain the same for comparable loading scenarios.
In accordance to the physical observations made during testing of 60° filament-wound
pipes, Meijer and Ellyin [7] characterized failure events into five general categories based on
the first failure mode detected for various combinations of hoop and axial loading. These are
tensile axial failure under axial dominated load ratios (0:1 and 1:1), weepage under closed
end pressure vessel type loading (2:1), local leakage in constrained end condition manifested
by fine jets of fluid spraying from local sites (4:1, 4.5:1 and 5:1), burst failure under hoop
dominated stress ratios (7:1, 1:0, 7:-1 and 2:-1) and compressive axial failure (0:-1). The load
ratio shown in brackets corresponds to applied biaxial hoop to axial stresses. Spencer and
Hull [14] observed the following phenomena to occur during failure of composite pipes:
nonlinearity in elastic response, whitening, audible cracking, weepage, bending, bucking and
fiber failure followed by prominent structural damage to the composite pipe. Damage
mechanisms in filament-wound structures are not mutually exclusive, besides not restricted to
any particular failure event. For instance, a study by Mertiny and Ellyin [5] on filament-
would glass fiber-reinforced [±60°3]T pipes confirmed that in the case of pure hoop loading
(1:0) and pure axial loading (1:15) functional failure coincided with structural failure. They
also documented that the functional failure occurred at 0.3% transverse strain (i.e. stain
transverse to the fiber direction) regardless of the considered stress ratios [5]. Similar findings
were reported by Aps et al. [24]. Even though substantial progress has been made in
understating the material and failure behavior of composite pipes, limited knowledge is still
prevalent in areas like weepage failure concerning transverse matrix cracking [25]. Therefore,
in order to produce reliable and safe composite tubulars it is of great importance that the
uncertainty regarding matrix cracking should be addressed adequately.

7
1.2.3 Functional Failure in Filament-wound Composite Pipe
Micro-damage associated with the evolution of leakage in composite pipes wound at 55°
and 65° fiber angles was studied by Jones and Hull [26]. They witnessed first visual
evidence of matrix damage in the form of thin white streaks parallel to the fibers as the pipe
was subject to applied loading. On further pressurization more streaks became evident with
increasing number and length, along with small opaque areas in the matrix. These striations
evolved in all the laminae that made up the tube shell, and propagated rapidly in the through-
thickness direction forming a continuous interconnected network through which fluid can
permeate. They correlated the appearance of these fine striations to transverse cracking
perpendicular to the lamina plane and opaque patches as cracking parallel to the lamina plane
(i.e. interlaminar cracking).
Normally functional failure is recognized through manifestation of the weepage phenomenon
by appearance of fluid droplets on the wall of a pipe after sufficient matrix damage has
developed [26]. Figure 1.1 presents photographs of a composite pipe that has suffered
leakage failure. The images show white streaks parallel to the fiber direction and droplets of a
fluorescent fluid under ultraviolet light. The cracking may have initiated from debonding at
the fiber-matrix interface or within the matrix itself in a region at or near the fiber surface
where the strain concentration is significantly high [26]. Strain magnification takes place in
the resin between densely packed fibers, because fibers and polymers have elastic constants
that are very different from each other. Bai et al. [18] studied the mechanical behavior of
glass-fiber/epoxy filament-would tubes, and observed transverse crack nucleation arising
from pre-existing defects (e.g. porosity, voids and debonded fibers) [16]. Generally,
transverse cracks propagate through the resin around the fibers which has frequently been
associated with interlaminar cracking. Transverse cracking results from tensile stress acting
transverse to the fiber, whereas interlaminar cracking develops in response to shear stresses.
It is therefore perceived that in a composite pipe the through-thickness leakage path consists
of both intralaminar cracks (transverse matrix cracking) in the laminae and interlaminar
cracks (delamination) between the laminae. Slow weepage of contained fluid is an indication
that sufficient matrix cracking has developed to result in fluid loss towards the outer surface
of the tube wall. Transverse cracking unavoidably results in changes in thermoelastic
properties (e.g. stiffness reduction), redistribution of internal stresses and stress-strain

8
nonlinearity in the composite structure, which are indications of damage initiation and
accumulation in the laminate [27]. Weepage considerably reduces the operating pressure of
the filament-wound pipes. Consequently, without any additional containment medium (e.g.
liner), functional failure restricts their application in any high-pressure system.
Figure 1.1 Pictures of the exterior of a pipe taken during weepage test (an ultraviolet die
penetrant was used).
9
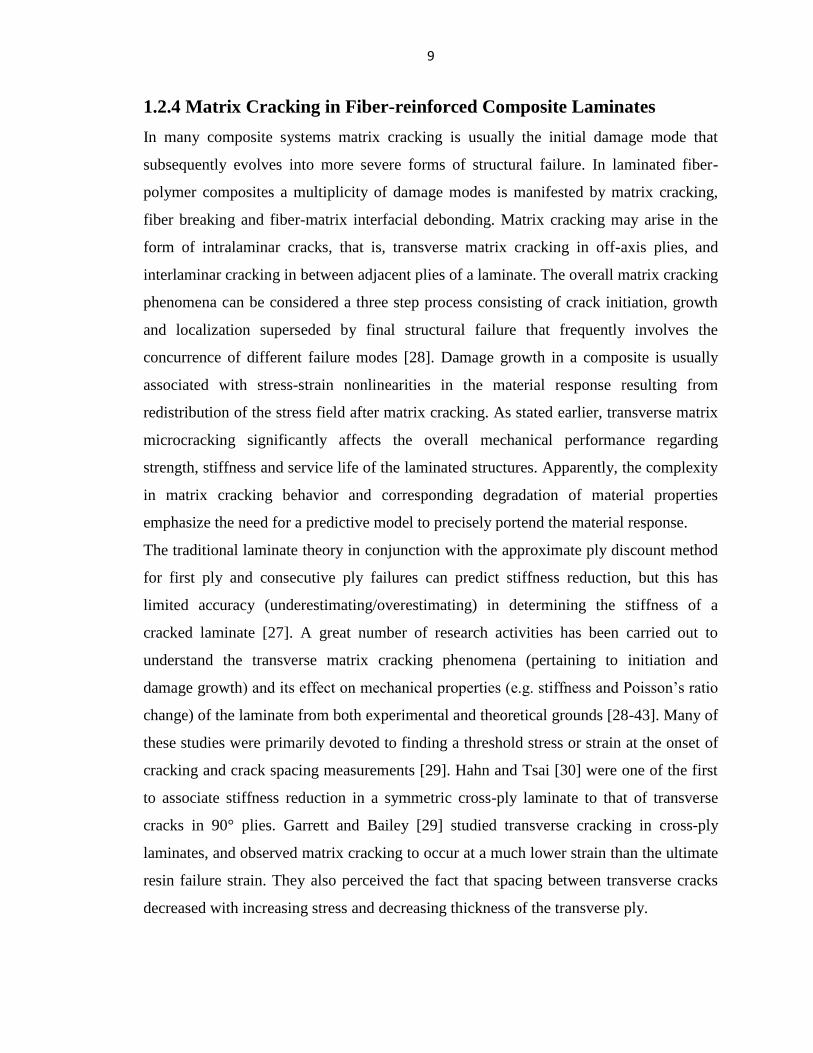
1.2.4 Matrix Cracking in Fiber-reinforced Composite Laminates
In many composite systems matrix cracking is usually the initial damage mode that
subsequently evolves into more severe forms of structural failure. In laminated fiber-
polymer composites a multiplicity of damage modes is manifested by matrix cracking,
fiber breaking and fiber-matrix interfacial debonding. Matrix cracking may arise in the
form of intralaminar cracks, that is, transverse matrix cracking in off-axis plies, and
interlaminar cracking in between adjacent plies of a laminate. The overall matrix cracking
phenomena can be considered a three step process consisting of crack initiation, growth
and localization superseded by final structural failure that frequently involves the
concurrence of different failure modes [28]. Damage growth in a composite is usually
associated with stress-strain nonlinearities in the material response resulting from
redistribution of the stress field after matrix cracking. As stated earlier, transverse matrix
microcracking significantly affects the overall mechanical performance regarding
strength, stiffness and service life of the laminated structures. Apparently, the complexity
in matrix cracking behavior and corresponding degradation of material properties
emphasize the need for a predictive model to precisely portend the material response.
The traditional laminate theory in conjunction with the approximate ply discount method
for first ply and consecutive ply failures can predict stiffness reduction, but this has
limited accuracy (underestimating/overestimating) in determining the stiffness of a
cracked laminate [27]. A great number of research activities has been carried out to
understand the transverse matrix cracking phenomena (pertaining to initiation and
damage growth) and its effect on mechanical properties (e.g. stiffness and Poisson’s ratio
change) of the laminate from both experimental and theoretical grounds [28-43]. Many of
these studies were primarily devoted to finding a threshold stress or strain at the onset of
cracking and crack spacing measurements [29]. Hahn and Tsai [30] were one of the first
to associate stiffness reduction in a symmetric cross-ply laminate to that of transverse
cracks in 90° plies. Garrett and Bailey [29] studied transverse cracking in cross-ply
laminates, and observed matrix cracking to occur at a much lower strain than the ultimate
resin failure strain. They also perceived the fact that spacing between transverse cracks
decreased with increasing stress and decreasing thickness of the transverse ply.

10
Various analytical models (i.e. shear-lag [28, 31], continuum damage mechanics [32],
self-consistent approximation [33-34] and variational approach [35]) have been
developed mainly to evaluate the influence of transverse matrix cracking on effective
material properties of the cracked laminates. Aveston and Kelly [36] developed a
multiple fracture theory that describes the theoretical stress-strain behavior of a
composite after matrix cracking. Reifsnider [37] analyzed transverse matrix cracks in
laminates, and made the important finding of the formation of distinct cracking pattern
after sufficient loading to the composite. Reifsnider termed this uniform periodic
saturation pattern in crack spacing at particular off-axis plies as characteristic damage
state (CDS). Highsmith and Reifsnider [31] were among the first researchers to conduct
analytical studies based on shear-lag analysis to predict stiffness reduction as a result of
matrix cracking in composite laminates. They implemented a shear-lag analysis to model
the stress transfer between the cracked lamina and the neighboring laminae, where a thin
layer of matrix rich region is assumed to transfer load between adjacent plies. In
developing this analytical model, they neglected the mutual interactions between cracks,
and assumed that normal stresses in the loading direction are constant across the ply
thickness. Hence, they have observed good correlation between experimental and
analytical data. Lee and Daniel [28] used shear-lag analysis to adopt a progressive
transverse cracking model for cross-ply laminates under uniaxial tensile loading. Their
proposed method gave closed form solutions for stiffness, crack density and stress
distribution in the cracked laminate as a function of applied loading and properties of the
laminae. McCartney [38] modeled stress transfer between adjacent plies in a 0°-90°-0°
cross-ply laminate containing transverse cracks, and estimated the effect of matrix
cracking on laminate stiffness, Poisson’s ratio and thermal expansion coefficient. By
employing a self-consistent method Dvorak et al. [33] evaluated thermoelastic properties
(e.g. stiffness and thermal expansion coefficients) of a damaged lamina that contains a
specified density of transverse cracks. Based on fracture mechanics principles Dvorak
and Laws [34] further investigated the mechanics of transverse matrix cracking in a
single ply of a composite laminate under in-plane loading. They presumed transverse
cracking to initiate from localized regions of debonded fibers acting as crack nucleation

11
sites, and studied the onset of unstable cracking by considering the influence of adjacent
plies on the cracked ply.
Hashin [35, 39] used variational methods to evaluate stiffness reductions and stresses in
cross-ply laminates in the presence of intralaminar cracks based on the principle of
minimum complementary potential energy. Applying the variational approach he
predicted the stiffness reduction in a [0°/90°3]S glass/epoxy laminate, which was in good
agreement with experimental results. Talreja [32] presented a continuum mechanics
model to characterize the mechanical response of a damaged laminate by a set of internal
vector field variables that represent the damage state. A constitutive equation for
isothermal small-deformation behavior of the composite was derived by taking into
account the condition of the damaged laminate. Continuum damage modeling does not
only require the elastic constants of the constituents of the undamaged composite but also
damage-related material constants, which have to be determined experimentally. The
stiffness changes associated with transverse cracking determined by continuum damage
modeling showed good agreement with the experimental results [27, 40]. On the
hypothesis of Talreja’s [32] continuum damage mechanics theory a lamina-based damage
model was presented by Li et al. [41] that can describe the mechanical response of the
damaged laminate. In this model the damage variables are associated with each specific
cracked lamina allowing effective material properties to be related directly to individual
laminae. This lamina-based damage representation can subsequently be resolved into a
more detailed ply-by-ply laminate analysis for determining general material properties of
the composite by taking into account lay-up configurations and position of the cracked
ply. Their complete damage model combines vector field representation of damage with a
damage growth law in the form of crack multiplication.
Recently, Roberts et al. [42] formulated a shear-lag based model to relate crack density as
a function of applied stress, and used the procedure developed by Gudmundson and Zang
[43] to determine the thermoelastic properties of cracked laminates by deriving an
expression for compliance, strains and thermal strains (related to crack density). Finally,
combining these two functions yielded an expression for a nonlinear stress-strain
relationship. They have found excellent agreement between the predicted stress-strain

12
behavior and experimental results obtained from biaxial testing (internal pressure and
axial load) done with fiber-reinforced composite pipe.
1.2.5 Puck’s Failure Theory for Filament-wound Composite Pipe
A number of failure theories exist as documented by the World Wide Failure Exercise [25,
44] that increases the debate and uncertainty regarding their proper use in modeling and
designing composite materials. Based on sound physical background both micro-mechanical
and phenomenological models are widely used in the design practice.
According to Puck’s laminate failure theory, the types of failure that occur in composites fall
into three general categories, i.e. cohesive failures of the fiber and matrix, and adhesive
failure of the fiber-matrix interface [45]. Fiber failure is followed by ultimate failure of the
structure, and in many instances preceded by matrix or interfacial failure. Puck inferred that
theoretically interfiber failure (i.e. matrix and interfacial failure) should be evaluated
separately from fiber failure with different failure criteria. Based on simplified
micromechanical assumptions Puck and Schneider [45] established a failure criterion that
gives a better approximation and reasonable basis for failure analysis of filament-wound
composite tubes, i.e.:
For fiber failure
(1.4)
For matrix failure
(
)
(
)
(
) (
)
(1.5)
For interface failure
(
)
(1.6)
where and are normal stresses parallel and perpendicular to the fibers, respectively,
and are shear stresses parallel and perpendicular to the fibers. ff and mf are
longitudinal strengths related to fiber and matrix failure, respectively, and mf and Af are
transverse strengths related correspondingly to matrix and interface failure. mf and Af are
shear strengths with subscripts referring to the types of failure in the composite. Since in

13
equations (1.5) and (1.6) the criteria for resin and interface failures were hypothetical in
nature, Puck in subsequent publications [46-47] modified the interfiber failure theory into a
semi-empirical equation as expressed in the following.
(
)
(
)
(
)
(1.7)
where, F is the normal strength perpendicular to the fibers, and F is the shear strength.
mF is a fictitious strength value attainable if the fibers were elongated up to the breaking
point of the matrix. Since, leakage failure (i.e. transverse cracking) in composite pipe is
associated with matrix and interfacial failure, then for transverse cracks to grow both
transverse tensile stress and shear stress need to be considered. Previously, validity of
the above failure criteria has been proven in the literature [14, 47] under combined torsional
and axial tensile loading for hoop wound tubes. As = 0, equation (1.7) becomes.
(
)
(
)
(1.8)
Composites made of epoxy and glass fibers are intrinsically very brittle, and a failure theory
based on a brittle facture criterion would be more appropriate to describe their fracture
behavior. Then a fracture hypothesis employing Coulomb-Mohr brittle fracture theory would
be more applicable than a failure criterion based on von Mises yield theory for ductile metals.
Puck adopted a Coulomb-Mohr brittle failure hypothesis to transform his failure theory into a
physically based phenomenological fracture criterion. Puck’s theory for interfiber fracture is
formulated based on Mohr’s stresses (normal stress n and shear stresses nt and n1 as shown
in Figure 1.2) acting on the fracture plane. Based on Puck’s theory the fracture condition for
interfiber failure can be expressed as [48-50]:
(
)
(
)
(
)
(
)
(
)
(1.9)
(1.10)
where
are fracture resistances, and
and
are the slopes of the
(n, nt) and (n, n1) fracture envelopes, respectively at n = 0.

14
Figure 1.2 1, 2, 3, 23,31 and 21 are stresses acting on a unidirectional composite element
related to the natural axes. The stresses n, nt and n1, which are decisive for interfiber failure
are defined by the (x1, xn, xt) coordinate system. Reprinted with permission from [49].
Copyright 1998 Elsevier Limited.
1.3 TOUGHENING OF THERMOSET EPOXY
In regard to conventional and novel applications, thermosetting epoxy is one of the
mainstream and versatile polymers available for structural parts, adhesives, thin film
coatings and matrix material for fiber-reinforced polymer composites. At present, epoxy
has been extensively used in aerospace, marine and automotive applications. The
application of epoxy has marked advantages over many engineering polymers, i.e. better
stiffness, creep resistance, chemical inertness and elevated temperature applicability.
However, the impressive physical and mechanical properties of epoxy bring about certain
drawbacks, such as high brittleness and notch sensitivity. As a consequence of this
inherent brittleness the structural strength of the finished part made from epoxy degrades
easily subsequent to matrix damaged. Toughening of epoxy has therefore gained a great
deal of attention, and substantial activities and efforts have been focused towards this
direction. In general, common epoxies have mode-I fracture energy values in the range of
80-300 J/m2, either in bulk or adhesive or delamination fracturing in fiber composites

15
[51]. The significance of toughness in the sense of material failure is that it is a physical
parameter (i.e. plane-strain critical stress intensity factor (KIc), strain energy release rate
(GIc), Izod impact strength and area under the tensile stress-strain curve) that estimates
the failure energy or failure stress of a material.
In an elastomer technology handbook, Sue et al. [52] mentioned many different
approaches by which an epoxy can be toughened, that is, (1) chemical
modification/functionalization of the epoxy backbone; (2) increasing the epoxide
monomer molecular weight; (3) decreasing the cross-link density of cured epoxy; and (4)
adding a second dispersed phase. The process of incorporating a toughener phase
(typically less than 20 wt%) may involve organic modifiers, liquid rubbers [53-59],
thermoplastic spheres [60], core-shell particles [61-63] and nanostructured block-
copolymers [64]. Furthermore, the addition of inorganic particles, notably silica [65-66],
glass beads [67], alumina [65] and nanoclay [68-69] has become a commonly recognized
practice. In this respect, butadiene-acrylonitrile elastomers (e.g. carboxyl-terminated
butadiene-acrylonitrile (CTBN)) are used extensively to toughen epoxy [70]. In modified
epoxies, impressive improvements in fracture energies as high as 2-4 kJ/m2 for
elastomers and 0.5-1 kJ/m2 for particle filled systems have been achieved [51]. Bagheri et
al. [70] presented a critical review exploring the aspect of different material
behaviors/parameters that leverage rubber-toughening of epoxy. It has been shown that
material properties, such as matrix cross-link density [56, 71-72], type of rubber particle
[73], particle morphology [74-76] and size [55, 58, 61, 77], degree of dispersion [61] and
interfacial property [52] play important roles in the toughness enhancement of modified
epoxy.
Even though, the incorporation of rubber dispersants to an epoxy resin can significantly
improve the fracture energy of the modified epoxy, the process also affects the glass
transition temperature, thermal expansion coefficient, yield strength and stiffness [78].
The extent of changes in epoxy properties is dependent on modifier composition and
volume fraction. It has been affirmed in previous publications that the toughness of
rubber modified epoxy increases with increasing rubber content until it reaches a plateau,
while for rubber concentrations exceeding 15-20 wt% toughness decreases [59, 79-80].
This is because a phase inversion is expected when elastomer becomes the dominant

16
phase. Bascom et al. [80-81] reported a significant increase in bulk epoxy fracture energy
by a factor of 30 after addition of elastomers, but did not observe any enhancement by a
similar magnitude when modified epoxy was used as an adhesive. Likewise, Hunston
[82] did not observe comparable increases in fracture energies of bulk resin and fiber
composites. In adhesives the constraining effect of bondline thickness on the
development of the plastic zone, and in fiber composites fibers restricting matrix
deformation, are thought responsible for suppression of toughening effects. The general
consensus conveyed in the published literature is that increasing resin toughness over a
limiting value (roughly a strain energy value of 700 J/m2) cannot effectively be translated
into interlaminar fracture toughness considering that fiber volume fraction to remain
constant [82-85].
In engineering and specialty polymers, certain types of particulate fillers play a unique
role for improving physical and mechanical properties of the substrate polymer. The
presence of inorganic particles [65-67] in a thermoset epoxy may enhance matrix
toughness, stiffness and strength [86]. Furthermore, toughening of epoxy by particulate
reinforcements brings about changes in the coefficient of thermal expansion, thermal
conductivity, glass transition temperature and ductility. Recently, the concept of hybrid
composite by infusion of two or more rubbery and rigid particulate reinforcements with a
polymer matrix has been shown as an effective method of creating novel multifunctional
material [62-63, 65-69]. A brief review on hybrid composites revealed that significant
improvements in fracture energy is attainable while at the same time maintaining
stiffness, strength and ductility of the unmodified epoxy by the formation of a ternary
composite system [63]. These studies pointed out the fact that the development of
superior material properties mainly stems from a cooperative influence of both rubbery
and rigid particles in thermosetting epoxy.
1.3.1 Toughening Mechanisms in Epoxy
In light of the foregoing discussion it can be ascertained that it is very important to
understand the basic fundamentals of different operative toughening mechanisms in
epoxy, and the circumstances under which they operate. There have been reports of
several possible toughening mechanisms that can explain the principle behind toughness

17
enhancements in modified polymers (see Figure 1.3) [51-52]. The plausible toughening
theories are [51]: (1) Shear banding near rubber particles; (2) rupture of rubber particles
after cavitation; (3) stretching, (4) debonding and (5) tearing of rubber particles; (6)
transparticle fracture; (7) debonding of hard particles; (8) crack deflection by hard
particles; (9) voided/cavitated rubber particles; (10) crazing; (11) plastic zone at craze tip;
(12) diffuse shear yielding; (13) shear band/craze interaction; and (14) crack pinning by
hard particles. Typically, most of these toughening phenomena have in common that they
associate dissipation of fracture energy primarily to a deformation process. It has been
explained by Kinloch et al. [53] that in unmodified and rubber modified epoxies three
types of crack growth behaviours commonly occur, i.e. brittle stable crack growth, brittle
unstable crack growth in slip-stick fashion, and ductile stable crack growth. Moreover,
crack growth in polymers is effected by stain rate and temperature in response to their
viscoelastic nature [67, 87]. The crack growth behaviour of the different nanocomposite
systems studied in this research is the subject matter of Section 6.2.4.
Figure 1.3 Toughening mechanisms in rubber modified polymers. Reprinted with
permission from [51]. Copyright 1988 Elsevier Limited.

18
1.3.1.1 Shear Yielding and Cavitation
In general, yield flow behaviour in polymer is manifested by shear yielding or crazing.
Shear yielding is one of the most recognised toughening mechanisms in polymers.
Polymer yields by sliding of molecules that are conducive to each other when
experiencing a critical shear stress for yielding. A modified von Mises criterion based on
the octahedral shear stress and taking into consideration the pressure dependency of
polymer can appropriately describe the shear yielding behaviour as expressed below.
√
(1.11)
(1.12)
where oct is the critical octahedral shear stress, o is the intrinsic shear strength of the
material, µs is a pressure coefficient, m is the hydrostatic stress, and 1, 2, and 3 are the
principal stresses. Originally, the von Mises criterion was developed for metals, which
assumes that yielding will take place when resultant shear stress in any material plane
exceeds the critical octahedral shear stress. Bascom et al. [80, 88] documented substantial
enhancement in fracture energy associated with a large plastic zone resulting from the
cavitation of the CTBN rubber in modified epoxy. The cavitated rubber particles act as
initiation sites for plastic shear yielding, or it can be interpreted that cavitation simply
promotes large scale plastic shear yielding [79]. Kinloch et al. [53, 67] and Pearson and
Yee [55-57, 59] undertook a series of studies on rubber toughened epoxies that put
forward further experimental evidence and explanation in support of the aforementioned
toughening mechanism. In rubber toughened epoxies Pearson and Yee [55] observed the
following sequential toughening events to take place. First, rubber particle cavitation
occurs (either by internal cavitation or debonding at the interface), which is followed by
shear banding. It was speculated that a large hydrostatic tensile stress component at the
crack-tip results in cavitated particles by relieving the plane-strain constraint through
reduction of the bulk modulus. At that point, the concentrated deviatoric stress
component is sufficient enough to cause shear yielding. There are notable distinctions in
the characteristics of different shear yielding processes found in polymers; the term
yielded zone is used to define the crack-tip plastic zone, and diffused shear involves shear
straining over a large volume, while localised shear is more concentrated to certain areas

19
in the specimen. Figure 1.4 shows features from the cavitation/debonding and succeeding
shear deformation on the fracture surface of a block-copolymer (M52) modified epoxy.
Figure 1.4 A SEM micrograph of acrylic based block-copolymer (M52) modified epoxy
fracture surface illustrating features from particle cavitation and matrix shear deformation
process.
1.3.1.2 Crazing/Normal Yielding
Sultan and McGarry [58] were among the first researchers to study the effect of rubber
dispersion on toughness of epoxy. They observed micro-cavitation to develop in the
epoxy samples that contained CTBN rubber having ~1.2 µm particle size. They have
attributed such yielding phenomenon to craze formation and matrix stretching. Crazing
represents an important yielding mechanism in thermoplastics, but before Bucknall [89] it
was not recognized in thermosets. The physical interpretation of craze initiation in
polymer has developed through the work of Maxwell et al. [90] and Bucknall et al. [89,
91]. In glassy thermoplastics crazing is a form of tensile yielding accompanied with
molecular rearrangement leading to cavitation (micro-voids) when experiencing critical
straining of the material. Crazing is a highly localised deformation process that appears as
a stress-whitening zone on the stressed polymer. However, many researchers [56-57, 59]
have expressed their scepticism about the occurrence of craze in thermosetting epoxy,
(a)

20
and did not find convincing evidence for craze formation in cured epoxies where the
chain length between cross-links is very small. To satisfy the condition for craze
formation Oxborough and Bowden [92] developed a critical strain based criterion of the
following form:
(1.13)
where c is the critical strain for craze formation, E is the Young’s modulus, 1, 2 and 3
are principal stresses, is the Poisson’s ratio, and X and Y are time and temperature
dependent parameters.
1.3.1.3 Crack-tip Blunting
The yield behaviour of polymer involving localized plastic shear deformation can be
explained in the context of an associated crack-tip blunting process. In principle the
localized shear yielding relives the effective stress intensity by crack-tip blunting, thereby
requiring higher applied stress for crack initiation. The yielding behaviour of material at
the crack-tip, in turn, will bear significance on the subsequent mode of crack growth, and
hence on the toughness value [93]. The relevant parameter of crack-opening displacement
can define the extent of crack-tip blunting according to the following expression:
(1.14)
where KIcs is the measured stress intensity factor at the onset of crack growth, and ys is
the tensile yield stress. It can be inferred from the above equation that crack-tip blunting
would increase with decreasing yield stress of the material. A quantitative model
developed for certain epoxy systems by Kinloch and Williams [87] correlates fracture
toughness with the degree of crack-tip blunting at the onset of crack propagation, which
is expressed as:
(1.15)
(1.16)
where is the crack-tip radius, c is the critical stress attained at a distance c ahead of the
crack-tip, and KI is the stress intensity for propagating a sharp crack. This equation
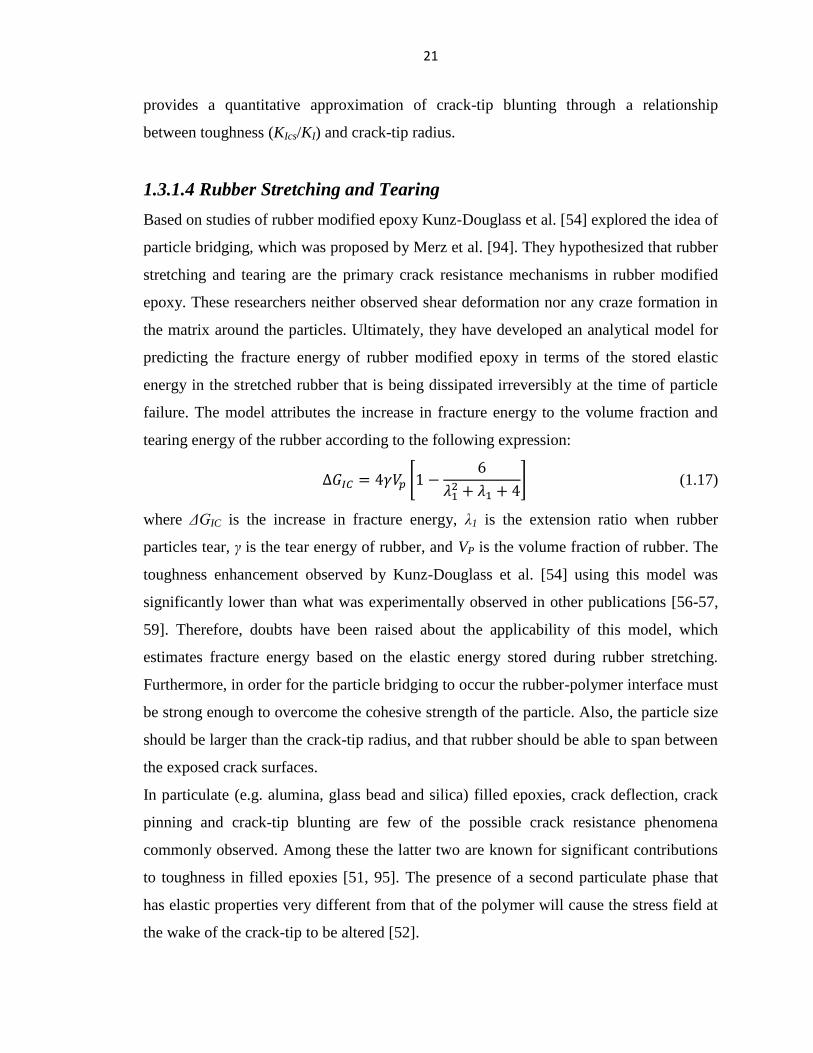
21
provides a quantitative approximation of crack-tip blunting through a relationship
between toughness (KIcs/KI) and crack-tip radius.
1.3.1.4 Rubber Stretching and Tearing
Based on studies of rubber modified epoxy Kunz-Douglass et al. [54] explored the idea of
particle bridging, which was proposed by Merz et al. [94]. They hypothesized that rubber
stretching and tearing are the primary crack resistance mechanisms in rubber modified
epoxy. These researchers neither observed shear deformation nor any craze formation in
the matrix around the particles. Ultimately, they have developed an analytical model for
predicting the fracture energy of rubber modified epoxy in terms of the stored elastic
energy in the stretched rubber that is being dissipated irreversibly at the time of particle
failure. The model attributes the increase in fracture energy to the volume fraction and
tearing energy of the rubber according to the following expression:
[
] (1.17)
where ΔGIC is the increase in fracture energy, λ1 is the extension ratio when rubber
particles tear, γ is the tear energy of rubber, and VP is the volume fraction of rubber. The
toughness enhancement observed by Kunz-Douglass et al. [54] using this model was
significantly lower than what was experimentally observed in other publications [56-57,
59]. Therefore, doubts have been raised about the applicability of this model, which
estimates fracture energy based on the elastic energy stored during rubber stretching.
Furthermore, in order for the particle bridging to occur the rubber-polymer interface must
be strong enough to overcome the cohesive strength of the particle. Also, the particle size
should be larger than the crack-tip radius, and that rubber should be able to span between
the exposed crack surfaces.
In particulate (e.g. alumina, glass bead and silica) filled epoxies, crack deflection, crack
pinning and crack-tip blunting are few of the possible crack resistance phenomena
commonly observed. Among these the latter two are known for significant contributions
to toughness in filled epoxies [51, 95]. The presence of a second particulate phase that
has elastic properties very different from that of the polymer will cause the stress field at
the wake of the crack-tip to be altered [52].

22
1.3.1.5 Crack Pinning
It is known that in a brittle matrix when a crack front is obstructed and pinned down by a
rigid well-bonded particle, the crack front becomes bowed out between the particles
resulting in secondary cracks to form. Consequently, more energy would be required to
propagate this new non-linear crack front, which depends on particle size and
interparticle spacing. Lange has put forward an expression for increasing fracture energy
as a result of crack pinning [96-97], i.e.:
(1.18)
where T is the line energy of the crack front, and 2d is the interparticle spacing. The ratio
of the particle size (diameter = 2r) to particle spacing is related to the particle volume
fraction:
( ) (1.19)
For a penny-shaped crack, Lange’s line energy is a function of the particle size, hence:
(1.20)
Finally,
(1.21)
where m is the fracture energy of the matrix. The above equation shows that the increase
in fracture energy is linearly dependent on the ratio of r and d. Figure 1.5 shows the
micrographic evidence of the crack pinning mechanism in an epoxy-clay (I.28E)
nanocomposite.
1.3.1.6 Crack Deflection/Crack Bifurcation
The presence of second phase particles in the path of a propagating crack may results in
repeated perturbation of the crack front from its original propagation path. As a result
additional facture surface is created by deflection and/or bifurcation of the primary crack
into multiple secondary cracks which are not necessarily coplanar [98]. The increase in
fracture energy as a consequence of the distorted crack path can be estimated from the
following equation.

23
(1.22)
Figure 1.6 shows severely textured surface morphology resulted from a crack deflection
mechanism when the path of a propagating crack encountered uniformly distributed
nanoparticles. It has been reported in literatures that the occurrence of crack deflection
mechanism only brings about modest toughness improvement [51, 98]. The rigid
particles may also introduce local stress concentration as the particles have elastic
properties (i.e. Young’s modulus) significantly different from those of the matrix. The
presence of these stress concentrator particles ahead of the crack-tip aid in initiating
localized matrix shear deformation that result in blunting of the crack-tip.
Figure 1.5 (a) Schematic of crack-pinning mechanism (Adapted from [51]. Copyright
1988 Elsevier Limited.), and (b) a SEM micrograph of epoxy-clay (I.28E) nanocomposite
fracture surface showing features from crack-pinning mechanism.
(a) (b)

24
Figure 1.6 SEM micrographs of epoxy-clay (I.30E) nanocomposite fracture surface
showing: (a) crack deflection/bifurcation mechanism, and (b) crack deflection and matrix
deformation.
1.4 POLYMER NANOCOMPOSITES
In recent years there have been tremendous efforts and interest in developing
multifunctionality and diversity in polymer properties that has fostered innovative
research approaches towards synthesizing advanced nanostructured materials. Polymer
nanocomposites are a combination of a polymeric phase (e.g. thermoplastic, thermoset or
elastomer) with one or more reinforcing filler material having at least one dimension in
the nanometer scale (0.1-100 nm) [99]. Polymer nanocomposites exhibit novel material
properties with significantly enhanced mechanical, thermal, electrical and
physicochemical properties. The unique characteristics of nanoparticles, i.e. having
nanoscale dimensions, large surface area per unit volume (high aspect ratio) and
molecular perfections by their nature, can yield a high-performance material when
incorporated into a polymer matrix. Properties of nanocomposites are also influenced by
the nature of the constituents (matrix and filler), their morphology, interfacial
characteristics, degree of mixing and synthesis methods. Lately, polymer nanocomposites
are finding applications in gas barrier films, scratch resistant coatings, flame retardant
products and even in structural and commodity plastics (e.g. automotive parts) [100].
According to their geometric dimensions nano-reinforcements can be classified into three
distinct categories: isodimensional nanoparticles (e.g. nanosilica, carbon black, and
(a) (b)

25
polyhedral oligomeric sislesquioxane), fibrous materials (e.g. carbon nanofibers and
carbon nanotubes) and layered materials (when the nanofillers have one dimension in the
nanometer range such as graphite and layered silicate (clay)) [101-102]. Polymer-clay
nanocomposite was first developed by researchers at the Toyota research center from
polyamide 6 and organoclay [103-104]. This procedure has later been adopted for other
polymer systems, namely epoxy, unsaturated polyester, poly(-caprolactome), silicon
rubber, polystyrene, polyimide, polypropylene, poly(ethylene terephthalate) polyurethane
and others [105].
1.4.1 Epoxy-clay Nanocomposites
Polymer-clay nanocomposites are inorganic/organic hybrids. Nanoscale dispersion of the
layered silicate into a polymer resin, thus generating polymer-clay nanocomposite, may
result in exceptional enhancements in material properties relative to the micro and fiber
composites [101, 106]. Normally, polymer-clay nanocomposites contain very small
amounts of nano-dispersants, about 2-3 vol%. Consequently the finished products are
light-weight (owing to their comparable property enhancement) compared to traditionally
filled composites. Polymer nanocomposites can be processed employing conventional
processing techniques, for instance extrusion, injection molding and resin casting (e.g.
wet lay-up, resin transfer molding, resin film infusion, etc.).
1.4.1.1 Structure of Layered Silicate Clay
In nanocomposite research, layered silicate clays are sometimes referred to as nanoclay or
organoclay, which are actually inorganic particles derived from synthetic or natural
source. Silicate clay (e.g. montmorillonite, hectorite and saponite) shown in Figure 1.7
falls into the general class of phyllosilicates that has a 2:1 layered type structure
consisting of either hydrous magnesium or aluminum silicates. Their crystal structure is
made of an edge-shared aluminum or magnesium octahedral layer fused between two
silicon tetrahedral sheets. Montmorillonite (M0.5-1.2(Al3.5-2.8Mg0.5-1.2)Si8O20(OH)4),
hectorite (M0.5-1.2(Mg5.5-4.8Li0.5-1.2)Si8O20(OH)4) and saponite (M0.5-1.2(Mg6)(Si7.5-6.8Al0.5-
1.2)O20(OH)4) are the most widely used smectite type clays, among which
montmorillonite (MMT) is the most accounted for layered silicate known for processing

26
of nanocomposites [101]. Typically, in a layered silicate each layer thickness is ~1 nm,
having lateral dimension about 30 nm to ~1 µm, aspect ratio of 10~1000, and an
approximate surface area of 750 m2/g. Layered silicate constitutes a moderate surface
charge due to isomorphic substitution of Si4+
for Al3+
in the tetrahedral lattice or
substitution of Al3+
in the octahedral by Mg2+
or Fe2+
. As a result, the layered silicate
becomes negatively charged that is counterbalanced by charge compensating counter-ion
( Li+, Na
+, K
+, Ca
2+) attached to the surface. Normally, the surface charge of a clay is
quantified by a parameter known as cation exchange capacity (CEC is expressed in
meq/100g) of the layered silicate [107-108]. Naturally, individual clay nanolayers arrange
themselves into repeat structures (i.e. tactoids) giving rise to usual van der Walls gaps
(also known as gallery or interlayer region) between two clay platelets. The intrinsic
hydrophilicity of layered silicates requires that they must be made organophilic for
application with the polymer, and to improve wetting properties of the clay. Lan et al.
[109] showed that long chain alkylammonium (also alkylphosphonium and
alkylsulfonium) surface modifiers can render organophilic characteristic to layered
silicate, and reduce the surface energy of the silicate layers thus improving their
compatibility towards epoxy [110]. In order for the intragallery adsorption of polymer to
happen the polarity of the clay surface modifier should match that of the polymer [105].
Quaternary ammonium salts, tertiary amine, phenylene methylamine, imidazole, etc. are
commonly used as organic surface modifiers for epoxy-clay nanocomposite preparation.
In a study Brown et al. [111] observed that the hydroxyl-substituted quaternary
ammonium surface modifiers rendered catalytic functionality as well enhanced
miscibility of clay towards both components of the epoxy/diamine reactive mixture. They
have also mentioned about three specific types of interactions present between quaternary
ammonium ions and the polymer matrix as per surfactant used: strong specific
interactions (H-bonding), dipolar (aromatic) and van der Waals (alkyl). Pinnavaia and
Wang [112] showed that the acidic form of ion-exchanged (e.g. acidic onium ions)
montmorillonite clay can catalyze homopolymerization of diglycidyl ether of bisphenol A
(DGEBA) in the clay galleries at sufficiently high temperature. The influence (e.g.
amount, size, functionally, polarity and acidity) of silicate interlayer surfactants on

27
preparation of epoxy-clay nanocomposites has been studied by many researchers, notably
Kornmann et al. [113], Zilg et al. [114] and Xidas and Triantafyllidis [115].
Figure 1.7 Idealized structure of 2:1 layered silicates (MMT). Reprinted with permission
from [110, 128]. Copyright 1999 Springer-Verlag Berlin Heidelberg.
1.4.1.2 Morphology of Epoxy-clay Nanocomposites
Based on the combination of the different constituents chosen (e.g. layered silicate,
organic cation and polymer) and the adopted processing conditions, organoclay can be
transformed to give rise to micro or nanostructured morphologies inside a polymer
matrix. A mixture of polymer and inorganic silicate does not necessarily produce a
nanocomposite, rather the immiscibility or partial miscibility between constituents in
most cases develop conventional microcomposites (i.e. phase-separated structure) having
clay microaggregates evenly or unevenly distributed in the matrix. In the phase-separated
morphology polymers are unable to penetrate between the silicate layers. Inefficient
chemical or physical interaction between the polymer and the dispersant typically ushers

28
inferior material properties in such microcomposites. If in a compatible polymer and clay
system the monomers or oligomers are able to migrate into the clay galleries, two more
fundamental clay morphologies can be distinguished, i.e. intercalated and exfoliated
nanocomposites. If the clay is still able to maintain a well-ordered multilayer structure
even after the presence of diffusing polymers/prepolymers into the interlayers an
intercalated nanocomposite evolves. In an intercalated architecture, polymers are able to
swell and increase the interlayer distance, but are unable to completely dislodge the clay
platelets. As a result, intercalated nanocomposites are expected to have less than the
optimal property enhancement. A nanocomposite can be regarded as an exfoliated or
delaminated structure when individual silicate platelets are homogenously and uniformly
dispersed in the polymer matrix, typically rendering a monolithic structure [100-101,
105-108]. This molecularly dispersed clay configuration generally brings about the
highest degree of property enhancement that is possible in the epoxy-clay
nanocomposites. Figure 1.8 shows the three main types of epoxy-clay nanocomposite
morphologies.
Figure 1.8 A schematic illustration of three basic nanoclay structures in a polymer
matrix.
1.4.1.3 Exfoliation Behavior of Epoxy-clay Nanocomposites
For the successful processing of epoxy-clay nanocomposites it is a prerequisite that
enough epoxy monomers or oligomers are pre-intercalated into the clay galleries in order
to participate in the intragallery polymerization that must also be comparable or higher
Phase-separated Intercalated Exfoliated
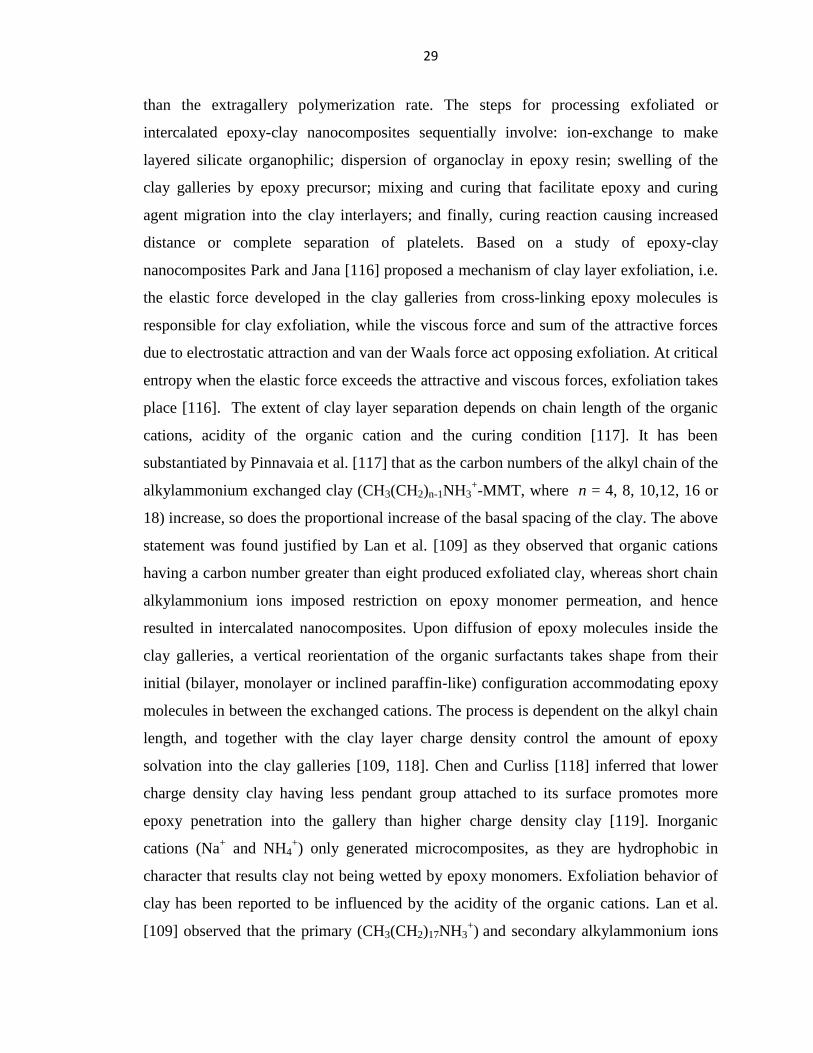
29
than the extragallery polymerization rate. The steps for processing exfoliated or
intercalated epoxy-clay nanocomposites sequentially involve: ion-exchange to make
layered silicate organophilic; dispersion of organoclay in epoxy resin; swelling of the
clay galleries by epoxy precursor; mixing and curing that facilitate epoxy and curing
agent migration into the clay interlayers; and finally, curing reaction causing increased
distance or complete separation of platelets. Based on a study of epoxy-clay
nanocomposites Park and Jana [116] proposed a mechanism of clay layer exfoliation, i.e.
the elastic force developed in the clay galleries from cross-linking epoxy molecules is
responsible for clay exfoliation, while the viscous force and sum of the attractive forces
due to electrostatic attraction and van der Waals force act opposing exfoliation. At critical
entropy when the elastic force exceeds the attractive and viscous forces, exfoliation takes
place [116]. The extent of clay layer separation depends on chain length of the organic
cations, acidity of the organic cation and the curing condition [117]. It has been
substantiated by Pinnavaia et al. [117] that as the carbon numbers of the alkyl chain of the
alkylammonium exchanged clay (CH3(CH2)n-1NH3+-MMT, where n = 4, 8, 10,12, 16 or
18) increase, so does the proportional increase of the basal spacing of the clay. The above
statement was found justified by Lan et al. [109] as they observed that organic cations
having a carbon number greater than eight produced exfoliated clay, whereas short chain
alkylammonium ions imposed restriction on epoxy monomer permeation, and hence
resulted in intercalated nanocomposites. Upon diffusion of epoxy molecules inside the
clay galleries, a vertical reorientation of the organic surfactants takes shape from their
initial (bilayer, monolayer or inclined paraffin-like) configuration accommodating epoxy
molecules in between the exchanged cations. The process is dependent on the alkyl chain
length, and together with the clay layer charge density control the amount of epoxy
solvation into the clay galleries [109, 118]. Chen and Curliss [118] inferred that lower
charge density clay having less pendant group attached to its surface promotes more
epoxy penetration into the gallery than higher charge density clay [119]. Inorganic
cations (Na+ and NH4
+) only generated microcomposites, as they are hydrophobic in
character that results clay not being wetted by epoxy monomers. Exfoliation behavior of
clay has been reported to be influenced by the acidity of the organic cations. Lan et al.
[109] observed that the primary (CH3(CH2)17NH3+) and secondary alkylammonium ions

30
(CH3(CH2)17N(CH3)H2+) performed better than the tertiary (CH3(CH2)17N(CH3)2H
+) and
quaternary (CH3(CH2)17N(CH3)3+) ammonium ions regarding exfoliation of the layered
silicate when cured with m-phenylene diamine. Additionally, it was noted that all these
surfactants have same C18 chain length and initial swelling of the clay interlayer by epoxy
prepolymer. According to the authors of this study alkylammonium ions can catalyze an
epoxy-amine curing reaction that depends on the acidity of the cation, thereby causing
catalytic polymerization inside the clay gallery to be higher than outside the interlayer,
facilitating further separation of the clay layers [107].
The choice of epoxy resin and curing agent plays an important role in influencing the
exfoliation of silicate layers. Becker et al. [120-121] investigated the influence of
different high-functionality epoxy resins, bifunctional diglycidyl ether of bisphenol-A,
trifunctional triglycidyl p-amino phenol (TGAP) and tetrafunctional tetraglycidyldiamino
diphenylmethane (TGDDM) on exfoliation of octadecyl ammonium ion-modified
montmorillonite. It was found from their study that bifunctional epoxy (DGEBA)
provided better exfoliation than high-functionality resins. Messersmith and Giannelis
[122] studies different curing agents, nadic methyl anhydride (NMA),
benzyldimethylamine (BDMA), boron trifluoride monoethylamine (BTFA) and
methylenedianiline (MDA) in preparation of epoxy-clay nanocomposites. The composites
prepared by the addition of NMA, BDMA or BTFA, respectively in the
DGEBA/organoclay mixture resulted in delamination of the organoclay, unlike the MDA,
which produced an opaque composite. It was thought that the bifunctional amine
molecules may have caused bridging of the silicate layers thus preventing further
separation of the clay galleries [122]. Park and Jana [116] inferred that layer separation of
clay occurs before gelation of the reactive resin mixture; hence, this imposes a time
constraint on the exfoliation process [123]. Furthermore, the degree of exfoliation and
intercalation is dependent on mixing and curing conditions, such as mixing time, curing
time and temperature [117]. It was stated by Lan et al. [109] that a low curing
temperature and slow diffusion of polymer in the clay galleries will adversely affect
exfoliation [124]. On the contrary, too high curing temperature is also not preferred
because that would favor faster extragallery polymerization resulting in intercalated
nanocomposites. Also the dispersion technique, e.g. mechanical or ultrasonic mixing has

31
a pronounce influence on epoxy solvation into the clay gallery and successive
delamination into nanolayers. The effect of mixing efficiency on exfoliation behavior of
epoxy-clay nanocomposites has been investigated by Hernandez et al. [125] Liu et al.
[126] and Yasmin et al. [127].
Synthesis approaches for the preparation of epoxy-clay nanocomposites includes several
established fabrication methodologies: exfoliation-adsorption, in-situ intercalative
polymerization and melt intercalation [101, 128]. In the exfoliated-adsorption method a
suitable solvent (in which the polymer is soluble) is used to disperse the layered silicate
into single layers, whereby adsorbing the polymer or prepolymer onto the silicate
nanolayers. When the solvent is extracted, the clay nano-sheets reassemble into clay
tactoids fusing in between the polymer. The in-situ intercalative polymerization requires
layered silicate to be swollen/pre-intercalated within the liquid monomer (that acts as
solubilizing agent) enabling polymerization to initiate subsequently in the gallery spaces
either by addition of heat or an initiator. Alternatively, in the melt intercalation method
organoclay is directly mixed statically or under shear with the molten polymer. This is a
preferred method for processing thermoplastic-clay nanocomposites employing such
techniques as extrusion or injection molding. However, exfoliation-adsorption and in-situ
intercalative polymerization processes are frequently adopted for the fabrication of
epoxy-clay nanocomposites.
1.4.1.4 Physical and Mechanical Properties of Epoxy-clay
Nanocomposites
Polymer-clay nanocomposites have significantly improved physical and mechanical
properties, which can be advantageous for specific engineering applications and in
specialty products. The versatility in nanocomposite properties comes in many different
forms and parameters, such as mechanical properties (stiffness, strength, and fracture and
impact resistance), dimensional stability, barrier properties (for gas and liquid), flame
retardance, chemical resistance, optical properties and thermal stability [129]. In a study
of mechanical properties of clay-reinforced nanocomposite Lan and Pinnavaia [130]
documented an almost tenfold increase in modulus and strength of a rubbery epoxy for a
15 wt% addition of organoclay. In an exfoliated nanocomposite the impressive increase

32
in stiffness is attributed to a mechanism of shear deformation and stress transfer to the
high stiffness and high aspect ratio individual silicate platelets [117, 130]. Kornmann et
al. [124] reported simultaneous improvements in fracture toughness and Young’s
modulus of epoxy-clay nanocomposites, while maintaining the tensile strength constant.
Studies on raising the fracture toughness of epoxy-clay nanocomposites have shown
mixed results. An uniformly dispersed phase-separated or intercalated nanoclay is
generally known to enhance toughness as observed by Kornmann [113] and Zerda and
Lesser [131], while insignificant toughness improvements are reported for perfectly
exfoliated layered silicate [132].
An increase in glass transition temperature was reported in the literature, and limited
segmental mobility at the polymer-clay interphase is thought to be the main reason [122,
129]. Conversely, a reduction in the glass transition temperature was also documented for
epoxy-clay nanocomposites [129]. Layered silicate nanocomposite can improve
dimensional stability as shown by a reduction of the thermal expansion coefficients [133].
Enhanced barrier and solvent absorption resistance are due to the presence of
homogenously dispersed high aspect ratio clay lamellae, which make the migration path
for the diffusing molecules more torturous and thus impermeable [106, 134]. As already
mentioned, silicate layers reduce permeability; the thermal stability is thereby increased
by affecting the diffusion of the volatile decompositions during thermal degradation
[135]. Clay nanocomposites may also provide extraordinary self-extinguishing and
increased flame retardance [111]. In epoxy-clay nanocomposites the exceptional barrier
property, chemical resistant, flammability resistance and decreased solvent uptake
mechanisms primarily stem from the diffusion inhibition/perturbation caused by the clay
platelets.
1.5 NANOSTRUCTURED BLOCK-COPOLYMERS
Block-copolymers are composed of two or more chemically dissimilar homopolymers
bonded together by covalent linkage to form macromolecular networks that have the
ability to spontaneously self-assemble to arrange into nanostructures [136]. A diverse
array of nanostructured materials is possible by utilizing the ability of block-copolymers
to generate periodic ordered structures. The knowledge of block-copolymer synthesis and

33
the underlying principle of self-organizing characteristics has gone through steady
development for years, but only recently are nanotechnological applications emerging.
The development of nanoscale structures and their repeatability, control over domain
sizes and directional properties of block-copolymers has promising new applications in
high-value-added specialty products. The great control over morphology and domain
dimensions of block-copolymer nanostructures is associated with molecular parameters
(molecular weight and molecular architecture) and the composition of the copolymers. In
a recent review Lodge [137] emphasized future directions of block-copolymer research
referring to the following unique aspects of their behavior: absolute control over domain
dimensions; control over morphology; control over domain functionality; quantitative
prediction of equilibrium structures; and the advantage of being a polymeric material.
1.5.1 Synthesis of Block-copolymers
The most common synthesis processes for block-copolymers are anionic polymerization
and controlled radical polymerization techniques [136]. But, there are other possible
routes through which block-copolymers can be prepared. A chain-growth polymerization
allowing for the sequential addition of monomers through active polymerization centers
and avoiding unwanted chain transfer and termination reactions is the general process of
controlled/living polymerization for block-copolymer synthesis. Industrial production of
common thermoplastic elastomer polystyrene-b-polybutadiene-b-polystyrene and
amphiphilic block-copolymer polyoxyethylene-b-polyoxypropylene-b-polyoxyethylene
involves anionic polymerization. Recently, living polymerization of polyolefins (e.g.
polyethylene and polypropylene) by metal-catalyzed synthesis method has made possible
processing of new olefin based block-copolymers. A short review on synthetic
approaches for block-copolymers was presented by Hillmyer [138]. The advent of
synthetic chemistry made achievable the synthesis of almost any imaginable block-
copolymer architectures by reasonably manipulating chemical composition of the
constituents. For instance, a block-copolymer made of two dissimilar monomers A and B
can have variety of structural configurations, i.e. diblock (AB), linear triblock (ABA),
multiblock (AB)n, stars with diblock arm (AB)n, hetero-arm stat, H-shaped copolymer,
etc. [136]. If a third block C is present more complex and diverse range of architectures

34
(e.g. ABC, ACB, CAB, etc.) are possible. Moreover, a block-copolymer made of more
than two copolymer segments would have significant variations in its constituents,
composition, architecture, sequence and functionality. Then, the alternative to an ABC
triblock-copolymer would be to blend different (e.g. AB and AC) diblock-copolymers. In
this regard the extensive and elaborate research activities that have been carried out so far
developed various exquisitely structured block-copolymers, but still there are areas that
have immense potential for future development.
1.5.2 Phase Behavior of Block-copolymers
The block-copolymer phase behavior in the molten state has been the subject of many
theoretical and experimental investigations that involve finding the three-dimensional
periodic ordered morphologies, which develop by a self-assembling microphase
separation process. In block-copolymer melts, microphase separation is driven by an
interplay between thermodynamic incompatibilities (unfavorable mixing enthalpy and
small mixing entropy) and chemical bond constraints of different chemically dissimilar
block segments [139- 140]. In block-copolymers the formation of these uniformly-spaced
ordered structures are responsible for their specific properties.
A linear AB diblock is the simplest block-copolymer structure that has been well studied
to establish an equilibrium phase behavior [139, 141-143]. The morphology diagram of a
linear AB type diblock-copolymer is presented in Figure 1.9 [136, 143], where f is the
volume fraction of one block, N=NA+NB is the overall degree of polymerization (where
NA and NB are numbers of A and B monomers, respectively), and χ is the temperature
dependent Flory-Huggins interaction parameter representing interaction between different
block segments. The product of χN is used to evaluate the extent of microphase
separation, and when this value passes a critical value an order-disorder transition (ODT)
takes place, and block-copolymers microphase separate leading to spatially-distributed
repeated structures. For a symmetric diblock-copolymer (fa = 0.5) a lamellar phase (lam)
is observed, while asymmetry in the composition gives rise to alternating phase structures
that include hexagonally packed cylinders (hex), body-centered cubic spheres (bcc) and
bicontinuous cubic gyroid (gyr). It has been shown that for a symmetric diblock-
copolymer order-disorder transition occurs at N 10.5, and order-order transition

35
(OOT) from (bcc) to (hex) to (lam) with increasing N takes place. Unlike composition,
the architecture of (AB-type) block-copolymers has little influence on the phase behavior
as an identical set of ordered morphologies (i.e. lamellar, cylindrical, spherical and
gyroid) were observed for homologous triblock (ABA) and diblock (AB) melts [144].
However, it can be speculated that the phase behavior of multi-component block-
copolymers (e.g. ABC triblock-copolymer) would be rather complex with the interplay of
more than one interaction parameters [145].
Figure 1.9 Phase diagram of a linear diblock-copolymer melt predicted from self-
consistent mean-field theory. Four ordered morphologies are shown: lamellar (lam),
gyroid (gyr), hexagonal (hex) and body-centered cubic (bcc), and a disordered (dis)
phase. Reprinted with permission from [136, 143]. Copyright 2004 John Wiley and Sons.
36
Meier [146] developed the basic understanding of microdomain formation in block-
copolymers in terms of molecular and thermodynamic concepts as interplay between
interfacial tension and chain stretching. Later, the implementation of self-consistent
mean-field (SCMF) theory provided the basic theoretical premise for block-copolymer
phase diagram on the basis of computing the free energy of possible microdomain
structures. Helfand and coworkers [141, 147] used the SCMF scheme to describe the
phase behavior in the strong-segregation limit (N10), while Leibler’s [142] approach
focuses on the stability of the disordered phase in the weak-segregation limit (N~10).
Recently, a more accurate theoretical prediction of the block-copolymer phase diagram
employing a novel technique for solving self-consistent field equations has been adapted
by Matsen et al. [143, 148] that adequately correlates to experimental observations.
Traditionally, amphiphilic block-copolymers have been used as compatibilizers or
surfactants due to their ability to reduce interfacial tension between immiscible polymer
phases similar to small amphiphiles (e.g. soap and detergent) in water [136, 149]. The
amphiphilic characteristic that allows selective partitioning of one block over another in a
selective solvent or in another homopolymer has significant importance in the self-
assembling property of block-copolymers. Similar to the structures commonly observed
in surfactant systems, the blend of a block-copolymer with a homopolymer that is
compatible with one of the segments has been found to generate the following
morphologies: spherical and worm-like micelles, vesicles, and lamellar, cylindrical, cubic
spherical and bicontinuous phases [149]. The formation of spherical micelles by
aggregation of the immiscible block has been observed in selective solvent/homopolymer
in the case of the miscible block being the dominant phase. As the concentration of the
immiscible block is increased relative to the miscible block, the local packing changes
resulting in the insoluble block being assembled into cylindrical micelles or vesicles. The
configurations and ordering into these microstructures depend on the concentration and
volume ratio between insoluble and soluble blocks, and are also influenced by such
parameters as temperature, molecular weight, monomer interactions (e.g. block/block,
block/solvent and block/homopolymer interactions), chain flexibility and copolymer
architectures. Recently, the formation of nanoscale morphologies in reactive blends of
thermosetting epoxy and block-copolymers has been brought into light by numerous

37
researchers [150-151]. Traditionally, epoxy has been toughened with rubber dispersants
by formation of micron size inclusions in the epoxy precursor. Improvement in toughness
by rubber modifiers has particular drawbacks of degrading the important thermo-
mechanical properties of the cured epoxy. The process also has the tendency to expel
rubber from the epoxy matrix during network formation. An alternative to this approach
would be to use a block-copolymer having one of its segments soluble in the epoxy resin
[150-151]. The ability of block-copolymers to generate distinct nanostructure phases in a
moderate-to-high concentration of epoxy precursor has the potential to yield
commercially viable products having novel material properties. Figure 1.10 shows
schematics of a few block-copolymer nanostructures observed in a selective
solvent/homopolymer, such as epoxy.
Figure 2.10 Different nanostructured block-copolymer morphologies formed inside an
epoxy resin.
1.5.3 Application of Self-assembled Nanostructured Block-copolymers
High-value-added specialty polymers (e.g. nanocomposites) that utilize the self-directing
nature of block-copolymers to form nanostructures can achieve extraordinary
A ABABA triblock-copolymer Epoxy
VesicleSpherical micelle Cylindrical micelle

38
improvements in toughness, ductility, creep resistance and permeability properties. A
class of industrially important block-copolymers that has been in use commercially for
almost forty years is known as thermoplastic elastomers. Thermoplastic elastomers
consist of a thermoplastic segment that is covalently linked to an elastomeric segment,
and possesses properties, such as rubber elasticity and processability of a thermoplastic
[152]. Hillmyer et al. [151] were the first to develop a method for the synthesis of
nanostructure domains in blends of reactive epoxy resin and a diblock-copolymer (e.g.
polyethyleneoxide-b-polyethylethylene or polyethyleneoxide-b-poly(ethylene-alt-
propylene)). The block-copolymers retained their ordered nanostructures even after
thermoset cross-linking reaction. Recent work on modified epoxy having well-defined
block-copolymer nanostructures has been shown to accomplish marked improvements in
toughness and ductility [153-155].
It has been predicted that block-copolymer nanostructures also have potential
applications in biomedical science, chemical separation, catalysis and electronics. The
self-ordering nano-structuring mechanism of block-copolymers has exciting and far-
reaching application in synthesis and processing of various organic and inorganic
nanoporous materials (by templating approach) [156-157]. The specific porosity and
surface property of these mesoporous materials can find special applications in separation
catalysis, nanoporous membrane technology and nanomaterial templating. Chen et al.
[158] showed that polymerization between dicyclopentadiene and a diblock-copolymer
(made of a chemically etchable polylactide block and non-degradable polystyrene block)
and subsequent removal of the minority phase can develop nanoscopic porosity in the
matrix. Influence of external fields on block-copolymer microstructure was explored by
Keller et al. [159], who investigated the degree of alignment in extruded triblock-
copolymers. It is now well understood that orientation of the microstructures to a certain
extent is possible when block-copolymers are subjected to flow [159-160] or in the
presence of an electrical field [161]. The resulting morphologies that evolve from domain
alignment can find promising new applications particularly in lithography, pattering and
thin films. The development of nanostructures in solution and control over the integrity of
these domain structures has practical applications in the biomedical and pharmaceutical
fields for drug delivery, tissue engineering and medical imaging. In-situ hydrogel

39
formation by assembly of block-copolymers in aqueous solution, block-copolymer
micelles as solubilizing agent and physicochemical response of these microphases to
stimuli have potential application in controlled release of therapeutic drugs [162-163].
However, formidable challenges still exist with regards to block-copolymer
nanostructuration. For example, Lodge [137] pointed out several key issues that need to
be overcome: having block-copolymer nanostructures free of defects; developing
microdomains with specific orientations; preparing irregular three-dimensional
nanostructures; expediting the kinetics of the self-assembly process; and separating
processing and thermodynamic constrains.
1.6 OBJECTIVE AND SCOPE OF THE PRESENT RESEARCH
Pressure piping and vessels made from fiber-reinforced polymer composites possessing
novel material properties have overcome many of the deficiencies of metallic structures
as storage and transmission medium for a variety of fluids. Fiber composites have
significantly higher strength in the fiber direction, and consequently a relatively small
transverse tensile loading perpendicular to the fiber can initiate matrix micro-cracking.
Transverse matrix cracking may develop by cohesive failure of the matrix or adhesive
failure of the fiber-matrix interface. It was generally observed for fiber composites that
transverse cracks initiate from zones of higher fiber packing, and propagate rapidly in the
through thickness direction. Leakage failure in response to transverse cracking limits the
suitability of fiber-reinforced composite pipes in certain high-pressure applications, and
can severely reduce the useful service life in a process or field operation. Failure events
in filament-wound composite structures (i.e. functional and structural failures) are
dependent on properties of the constituent materials, specimen fabrication procedures and
imposed loading conditions. It has been mentioned earlier in this chapter that by
judiciously working with the many design and manufacturing parameters one may find
means (e.g. using a liner) for hindering or circumventing leakage failure in pressure-
bearing composite structures. But, a preferable alternative would be to modify or
reinforce the existing material system with a suitable modifier (e.g. nano or micro
particles). In this regard, the modified resin system (with nanoparticles) may allow full
utilization of the ultimate strength of the composite by effectively resisting transverse

40
cracking. To date, any development in nanotechnology concerning filament-wound
pressure retaining structures is very limited [164], and the most recent studies were
narrowly focused on reducing gas permeability and micro-cracking in cryogenic
environments [165-167].
The primary objective of the present research was to enhance the mechanical properties of
fiber-reinforced polymer piping by incorporating nanoparticles into the material system. It
was anticipated that the process would prevent matrix damage and enhance composite
strength and strain at leakage failure. The undertaken research initiative involved an
extensive experimental study based on a phenomenological approach to understand the
complex deformation and failure mechanism of composite pipes under specific biaxial
loading conditions. Furthermore, this investigation was intended to study the damage events,
leakage prediction and fracture analysis of polymer composite pressure pipes by applying the
principle of emerging nanotechnology. In this scheme, synthesis, characterization and
material property evaluation of the bulk epoxy nanocomposites and hybrid fiber-reinforced
composite pipes were performed.
1.6.1 Organization of the Dissertation
This section outlines the presentation of the thesis. In Chapter 2 novel ideas regarding
synthesis, formulation and development of cutting-edge polymer nanocomposite systems
are explored. A description on preparation of polymer nanocomposite materials and
manufacturing of fiber-reinforced polymer pressure pipes is also provided. In Chapter 3
designing of appropriate experimental procedures, characterization criteria, data
acquisition, data validation and data analysis methods for evaluation of the behavior of
composite samples are presented. In this chapter analysis and testing methodologies for
the determination of morphological, chemical, physical, thermal, mechanical and fracture
properties of polymer composites are also explained. In Chapter 4 a study on the
influence of alkylammonium ion surface modifiers and different nanoclay dispersion
methods (i.e. ultrasonic mixing and mechanical blending) on the development of various
nanocomposite morphologies is presented. The manner in which nanoclay
microstructures affected the mechanical properties, deformation and fracture process of
the nanocomposite was discussed. In Chapter 5 the study of the effect of acrylic triblock-

41
copolymer concentration, composition, and generated nanostructures on the thermo-
mechanical properties of the modified epoxy is reported. Miscibility and nanostructure
development in block-copolymer/epoxy blends were herein studied. In Chapters 4 and 5
causal relationships between the modifiers (nanoclay and block-copolymer) morphology
and resulting property enhancement in the modified epoxy are presented. The research
findings summarized in Chapter 6 convey the idea of a synergistic improvement of
important thermo-mechanical properties by commixing two or more nano-reinforcements
with a polymeric substrate. A hybrid nanocomposite prepared by combining an acrylic
triblock-copolymer with organophilic nanoclay in a thermosetting epoxy was able to take
advantage of the favorable properties of different nanoparticles. It has been documented
in the past that transverse cracking in composite pipes has frequency been associated with
interlaminar cracking [26], hereby motivating an experimental study aimed at
understanding the interlaminar fracture behavior of filament-wound composites. In
Chapter 7 the effect of nano-reinforcements on delamination mechanism of filament-
wound basalt fiber-reinforced laminates is described. A qualitative correlation was sought
regarding the translation of bulk epoxy fracture energy in delamination energy of fiber
composites. In composite laminates interlaminar fracture is influenced by matrix
toughness as well as other crack resistance phenomena (e.g. fiber pull-out, fiber bridging
and fiber breakage) commonly associated with the fibers. In Chapter 8 the study of
fracture behavior of nanoclay and acrylic triblock-copolymer modified epoxy/basalt
fiber-reinforced pipes is presented. This investigation was embarked upon based on the
hypothesis that nanoparticles would enhance matrix toughness; in response to that
transverse matrix micro-cracking would be suppressed. The consequence of nanoparticle
addition on the extent of transverse matrix cracking was ascertained in terms of leakage
failure stresses and strains of the modified systems. In Chapter 9 a few recommendations
is made on future work with the filament-wound composite pipes.

42
REFERENCES
1. ELLYIN, F., 2002. On the design and analysis of fiber reinforced polymeric
composite pipes and vessels, American Society of Mechanical Engineers, Pressure
Vessels and Piping Division (Publication) PVP 2002, pp. 153-162.
2. ELLYIN, F., CARROLL, M., KUJAWSKI, D. and CHIU, A.S., 1997. Behavior
of multidirectional filament wound fibre glass/epoxy tubulars under biaxial loading.
Composites Part A: Applied Science and Manufacturing, 28(9-10), pp. 781-790.
3. MERTINY, P. and ELLYIN, F., 2001. Selection of optimal processing parameters
in filament winding, 33rd International SAMPE Technical Conference -Advancing
Affordable Materials Technology-, November 5, 2001 - November 8, 2001 2001, Soc. for
the Advancement of Material and Process Engineering, pp. 1084-1095.
4. MERTINY, P., ELLYIN, F. and HOTHAN, A., 2004. An experimental
investigation on the effect of multi-angle filament winding on the strength of tubular
composite structures. Composites Science and Technology, 64(1), pp. 1-9.
5. MERTINY, P. and ELLYIN, F., 2002. Influence of the filament winding tension
on physical and mechanical properties of reinforced composites. Composites Part A:
Applied Science and Manufacturing, 33(12), pp. 1615-1622.
6. MARTENS, M. and ELLYIN, F., 2000. Biaxial monotonic behavior of a
multidirectional glass fiber epoxy pipe. Composites Part A: Applied Science and
Manufacturing, 31(9), pp. 1001-1014.
7. MEIJER, G. and ELLYIN, F., 2008. A failure envelope for 60 filament wound
glass fibre reinforced epoxy tubulars. Composites Part A: Applied Science and
Manufacturing, 39(3), pp. 555-564.
8. WOLODKO, J., MERTINY, P., MEIJER, G., MARTENS, M. and ELLYIN, F.,
2001. Development of a facility for filament winding GFRP tubulars, 46th International
SAMPE Symposium and Exhibition 2001 a Materials and Processes Odyssey, May 6,
2001 - May 10, 2001, Soc. for the Advancement of Material and Process Engineering, pp.
1271-1282.
9. MERTINY, P. and GOLD, A., 2007. Quantification of leakage damage in high-
pressure fibre-reinforced polymer composite tubular vessels. Polymer Testing, 26(2), pp.
172-179.

43
10. ELLYIN, F. and MARTENS, M., 2001. Biaxial fatigue behaviour of a
multidirectional filament-wound glass-fiber/epoxy pipe. Composites Science and
Technology, 61(4), pp. 491-502.
11. BASHAR, M.T., SUNDARARAJ, U. and MERTINY, P., 2011. Study of Matrix
Micro-cracking in Nanoclay and Acrylic Tri-block-copolymer Modified Epoxy/basalt
Fiber-reinforced Pressure-retaining Structures. Express polymer letters, 5, pp. 882-896.
12. COHEN, D., 1997. Influence of filament winding parameters on composite vessel
quality and strength. Composites Part A: Applied Science and Manufacturing, 28(12), pp.
1035-1047.
13. COHEN, D., MANTELL, S.C. and ZHAO, L., 2001. The effect of fiber volume
fraction on filament wound composite pressure vessel strength. Composites Part
B:Engineering, 32(5), pp. 413-429.
14. SPENCER, B. and HULL, D., 1978. Effect of winding angle on the failure of
filament wound pipe. Composites, 9(4), pp. 263-271.
15. SODEN, P.D., KITCHING, R., TSE, P.C., TSAVALAS, Y. and HINTON, M.J.,
1993. Influence of winding angle on the strength and deformation of filament-wound
composite tubes subjected to uniaxial and biaxial loads. Composites Science and
Technology, 46(4), pp. 363-378.
16. A , ., P , D. and D , ., 1 . The influence of
winding patterns on the damage behaviour of filament-wound pipes. Composites Science
and Technology, 59(9), pp. 1439-1449.
17. MERTINY, P., 2012. Leakage failure in fibre-reinforced polymer composite
tubular vessels at elevated temperature. Polymer Testing, 31(1), pp. 25-30.
18. BAI, J., SEELEUTHNER, P. and BOMPARD, P., 1997. Mechanical behaviour of
± 55 ° filament-wound glass-fibre/epoxy-resin tubes: I. Microstructural analyses,
mechanical behaviour and damage mechanisms of composite tubes under pure tensile
loading, pure internal pressure, and combined loading. Composites Science and
Technology, 57(2), pp. 141-153.
19. HULL, D., LEGG, M.J. and SPENCER, B., 1978. Failure of glass/polyester
filament wound pipe. Composites, 9(1), pp. 17-24.

44
20. CARROLL, M., ELLYIN, F., KUJAWSKI, D. and CHIU, A.S., 1995. The rate-
dependent behaviour of ± 55 ° filament-wound glass-fibre/epoxy tubes under biaxial
loading. Composites Science and Technology, 55(4), pp. 391-403.
21. Macek, R.W. and Hackett, R.M., 1992. Viscoelastic analysis of filament-wound
composite material systems. Journal of Reinforced Plastics and Composites, 11, pp.567-
581.
22. KUJAWSKI, D., ELLYIN, F. and CULEN, M.S., 1998. The fatigue behaviour of
filament-wound fiberglass/epoxy tubes under cyclic pressure. Journal of Reinforced
Plastics and Composites, 17(3), pp. 268-281.
23. SODEN, P.D., KITCHING, R. and TSE, P.C., 1989. Experimental failure stresses
for ±55° filament wound glass fibre reinforced plastic tubes under biaxial loads.
Composites, 20(2), pp. 125-135.
24. ASP, L.E., BERGLUND, L.A. and TALREJA, R., 1996. Prediction of matrix-
initiated transverse failure in polymer composites. Composites Science and Technology,
56(9), pp. 1089-1097.
25. HINTON, M.J., KADDOUR, A.S. and SODEN, P.D., 2002. A comparison of the
predictive capabilities of current failure theories for composite laminates, judged against
experimental evidence. Composites Science and Technology, 62(12-13), pp. 1725-1797.
26. JONES, M.L.C. and HULL, D., 1979. Microscopy of failure mechanisms in
filament-wound pipe. Journal of Materials Science, 14(1), pp. 165-174.
27. TALREJA, R., 1985. Transverse cracking and stiffness reduction in composite
laminates. Journal of Composite Materials, 19(4), pp. 355-375.
28. LEE, J.W. and DANIEL, I.M., 1990. Progressive transverse cracking of crossply
composite laminates. Journal of Composite Materials, 24(11), pp. 1225-1243.
29. GARRETT, K.W. and BAILEY, J.E., 1977. Multiple transverse fracture in 90°
cross-ply laminates of a glass fibre-reinforced polyester. Journal of Materials Science,
12(1), pp. 157-168.
30. HAHN, H.T. and TSAI, S.W., 1974. On the behaviour of composite laminates
after initial failures. Journal of Composite Materials, 8, pp. 288-305.
31. HIGHSMITH, A.L. and REIFSNIDER, K.L., 1982. Stiffness-reduction
mechanisms in composite laminates. Damage in Composite Materials, 775, pp. 103-117.

45
32. TALREJA, R., 1985. CONTINUUM MECHANICS CHARACTERIZATION OF
DAMAGE IN COMPOSITE MATERIALS. Proceedings of the Royal Society of
London, Series A: Mathematical and Physical Sciences, 399(1817), pp. 195-216.
33. DVORAK, G.J., LAWS, N. and HEJAZI, M., 1985. Analysis of progressive
matrix cracking in composite laminates-I. Thermoelastic properties of a play with cracks.
Journal of Composite Materials, 19(3), pp. 216-234.
34. DVORAK, G.J. and LAWS, N., 1987. Analysis of progressive matrix cracking in
composite laminates-II. First ply failure. Journal of Composite Materials, 21(4), pp. 309-
329.
35. HASHIN, Z., 1986. Analysis of stiffness reduction of cracked cross-ply laminates.
Engineering Fracture Mechanics, 25(5-6), pp. 771-778.
36. AVESTON, J. and KELLY, A., 1973. Theory of multiple fracture of fibrous
composites. Journal of Materials Science, 8(3), pp. 352-362.
37. REIFSNIDER, K.L. 1977. SOME FUNDAMENTAL ASPECTS OF THE
FATIGUE AND FRACTURE RESPONSE OF COMPOSITE MATERIALS.
Proceedings 14th Annual Meeting, Society of Engineering Science, Bethlehem, PA 1977,
pp. 343-383.
38. MCCARTNEY, L.N., 1992. Theory of stress transfer in a 0°-90°-0° cross-ply
laminate containing a parallel array of transverse cracks. Journal of the Mechanics and
Physics of Solids, 40(1), pp. 27-68.
39. HASHIN, Z., 1985. Analysis of cracked laminates: a variational approach.
Mechanics of Materials, 4(2), pp. 121-136.
40. TALREJA, R., YALVAC, S., YATS, L. and WETTERS, D., 1992. Transverse
cracking and stiffness reduction in cross ply laminates of different matrix toughness.
Journal of Composite Materials, 26(11), pp. 1644-1663.
41. LI, S., REID, S.R. and SODEN, P.D., 1998. A continuum damage model for
transverse matrix cracking in laminated fibre-reinforced composites. Philosophical
Transactions of the Royal Society London, Series A (Mathematical, Physical and
Engineering Sciences), 356(1746), pp. 2379-412.

46
42. ROBERTS, S.J., EVANS, J.T., GIBSON, A.G. and FROST, S.R., 2003. The
effect of matrix microcracks on the stress-strain relationship in fiber composite tubes.
Journal of Composite Materials, 37(17), pp. 1509-1523.
43. GUDMUNDSON, P. and ZANG, W., 1993. An analytic model for thermoelastic
properties of composite laminates containing transverse matrix cracks. International
Journal of Solids and Structures, 30(23), pp. 3211-3231.
44. SODEN, P.D., HINTON, M.J. and KADDOUR, A.S., 1998. A comparison of the
predictive capabilities of current failure theories for composite laminates. Composites
Science and Technology, 58(7), pp. 1225-1254.
45. PUCK, A. and SCHNEIDER, W., 1969. On failure mechanisms and failure
criteria of filament-wound glass-fibre/resin composites. Plastics and Polymers, 37(127),
pp. 33-44.
46. PUCK, A., 1969. Calculating the strength of glass fiber/plastic laminates under
combined load. Kunststoffe, German Plastics, 59, pp. 18-19.
47. KNAPPE, W. and SCHNEIDER, W., 1973. ROLE OF FAILURE CRITERIA IN
THE FRACTURE ANALYSIS OF FIBER/MATRIX COMPOSITES. , pp. 543-556.
48. PUCK, A. and SCHURMANN, H., 2002. Failure analysis of FRP laminates by
means of physically based phenomenological models. Composites Science and
Technology, 62(12-13), pp. 1633-62.
49. PUCK, A. and SCHURMANN, H., 1998. Failure analysis of FRP laminates by
means of physically based phenomenological models. Composites Science and
Technology, 58(7), pp. 1045-67.
50. Lutz G. The Puck theory of failure in laminates in the context of the new
guideline VDI2014 Part 3. In: Proceedings of Conference on Damage in Composite
Materials, Stuttgart, 2006.
51. GARG, A.C. and MAI, Y.-W., 1988. Failure mechanisms in toughened epoxy
resins-A review. Composites Science and Technology, 31(3), pp. 179-223.
52. SUE, H.-J., GARCIA-MEITIN, E.I. and PICKELMAN, D.M., 1993. Toughening
concept of rubber-modified high performance epoxies. In: CHEREMISINOFF, N.P. and
CHEREMISINOFF, P.N., ed, Elastomer Technology Handbook. Boca Raton: CRC Press,
pp. 661.

47
53. KINLOCH, A.J., SHAW, S.J., TOD, D.A. and HUNSTON, D.L., 1983.
Deformation and fracture behaviour of a rubber-toughened epoxy: 1. Microstructure and
fracture studies. Polymer, 24(10), pp. 1341-1354.
54. KUNZDOUGLASS, S., BEAUMONT, P. and ASHBY, M., 1980. A Model for
the Toughness of Epoxy-Rubber Particulate Composites. Journal of Materials Science,
15(5), pp. 1109-1123.
55. PEARSON, R.A. and YEE, A.F., 1991. Influence of particle size and particle size
distribution on toughening mechanisms in rubber-modified epoxies. Journal of Materials
Science, 26(14), pp. 3828-3844.
56. PEARSON, R.A. and YEE, A.F., 1989. Toughening mechanisms in elastomer-
modified epoxies - Part 3 The effect of cross-link density. Journal of Materials Science,
24(7), pp. 2571-2580.
57. PEARSON, R.A. and YEE, A.F., 1986. Toughening mechanisms in elastomer-
modified epoxies - Part 2 Microscopy studies. Journal of Materials Science, 21(7), pp.
2475-2488.
58. SULTAN, J. and MCGARRY, F., 1973. Effect of Rubber Particle-Size on
Deformation Mechanisms in Glassy Epoxy. Polymer Engineering and Science, 13(1), pp.
29-34.
59. YEE, A.F. and PEARSON, R.A., 1986. Toughening mechanisms in elastomer-
modified epoxies - Part 1 Mechanical studies. Journal of Materials Science, 21(7), pp.
2462-2474.
60. KINLOCH, A.J., YUEN, M.L. and JENKINS, S.D., 1994. Thermoplastic-
toughened epoxy polymers. Journal of Materials Science, 29(14), pp. 3781-3790.
61. BÉCU-LONGUET, L., BONNET, A., PICHOT, C., SAUTEREAU, H. and
MAAZOUZ, A., 1999. Epoxy networks toughened by core-shell particles: influence of
the particle structure and size on the rheological and mechanical properties. Journal of
Applied Polymer Science, 72(6), pp. 849-858.
62. GAM, K.T., MIYAMOTO, M., NISHIMURA, R. and SUE, H.-J., 2003. Fracture
behavior of core-shell rubber-modified clay-epoxy nanocomposites. Polymer
Engineering and Science, 43(10), pp. 1635-1645.

48
63. MAROUF, B.T., PEARSON, R.A. and BAGHERI, R., 2009. Anomalous fracture
behavior in an epoxy-based hybrid composite. Materials Science and Engineering A,
515(1-2), pp. 49-58.
64. THOMPSON, Z.J., HILLMYER, M.A., LIU, J., SUE, H.-J., DETTLOFF, M. and
BATES, F.S., 2009. Block copolymer toughened epoxy: Role of cross-link density.
Macromolecules, 42(7), pp. 2333-2335.
65. MOLONEY, A.C., KAUSCH, H.H. and STIEGER, H.R., 1983. The fracture of
particulate-filled epoxide resins - Part 1. Journal of Materials Science, 18(1), pp. 208-
216.
66. HSIEH, T.H., KINLOCH, A.J., MASANIA, K., SOHN LEE, J., TAYLOR, A.C.
and SPRENGER, S., 2010. The toughness of epoxy polymers and fibre composites
modified with rubber microparticles and silica nanoparticles. Journal of Materials
Science, 45(5), pp. 1193-1210.
67. KINLOCH, A.J., MAXWELL, D.L. and YOUNG, R.J., 1985. The fracture of
hybrid-particulate composites. Journal of Materials Science, 20(11), pp. 4169-4184.
68. FRÖHLICH, J., THOMANN, R. and MÜLHAUPT, R., 2003. Toughened epoxy
hybrid nanocomposites containing both an organophilic layered silicate filler and a
compatibilized liquid rubber. Macromolecules, 36(19), pp. 7205-7211.
69. FRÖHLICH, J., THOMANN, R., GRYSHCHUK, O., KARGER-KOCSIS, J. and
MÜLHAUPT, R., 2004. High-performance epoxy hybrid nanocomposites containing
organophilic layered silicates and compatibilized liquid rubber. Journal of Applied
Polymer Science, 92(5), pp. 3088-3096.
70. BAGHERI, R., MAROUF, B.T. and PEARSON, R.A., 2009. Rubber-toughened
epoxies: A critical review. Polymer Reviews, 49(3), pp. 201-225.
71. LEVITA, G., DE PETRIS, S., MARCHETTI, A. and LAZZERI, A., 1991.
Crosslink density and fracture toughness of epoxy resins. Journal of Materials Science,
26(9), pp. 2348-2352.
72. KANG, B.U., JHO, J.Y., KIM, J., LEE, S.-S., PARK, M., LIM, S. and CHOE,
C.R., 2001. Effect of molecular weight between crosslinks on the fracture behavior of
rubber-toughened epoxy adhesives. Journal of Applied Polymer Science, 79(1), pp. 38-
48.

49
73. BORGGREVE, R.J.M., GAYMANS, R.J. and SCHUIJER, J., 1989. Impact
behaviour of nylon-rubber blends. 5. Influence of the mechanical properties of the
elastomer. Polymer, 30(1), pp. 71-77.
74. QIAN, J.Y., PEARSOR, R.A., DIMONIE, V.L., SHAFFER, O.L. and EL-
AASSER, M.S., 1997. The role of dispersed phase morphology on toughening of
epoxies. Polymer, 38(1), pp. 21-30.
75. BAGHERI, R. and PEARSON, R.A., 1996. Role of blend morphology in rubber-
toughened polymers. Journal of Materials Science, 31(15), pp. 3945-3954.
76. DAY, R.J., LOVELL, P.A. and PIERRE, D., 1997. Toughening of epoxy resins
using particles prepared by emulsion polymerization: Effects of particle surface
functionality, size and morphology on impact fracture properties. Polymer International,
44(3), pp. 288-299.
77. KIM, D.S., CHO, K., KIM, J.K. and PARK, C.E., 1996. Effects of particle size
and rubber content on fracture toughness in rubber-modified epoxies. Polymer
Engineering and Science, 36(6), pp. 755-768.
78. GUILD, F.J. and YOUNG, R.J., 1989. A predictive model for particulate filled
composite materials - Part 2 Soft particles. Journal of Materials Science, 24(7), pp. 2454-
2460.
79. BAGHERI, R. and PEARSON, R.A., 1996. Role of particle cavitation in rubber-
toughened epoxies: 1. Microvoid toughening. Polymer, 37(20), pp. 4529-4538.
80. BASCOM, W., COTTINGTON, R., JONES, R. and PEYSER, P., 1975. Fracture
of Epoxy-Modified and Elastomer-Modified Epoxy Polymers in Bulk and as Adhesives.
Journal of Applied Polymer Science, 19(9), pp. 2545-2562.
81. HUNSTON, D.L. and BASCOM, W.D., 1984. FAILURE BEHAVIOR OF
RUBBER-TOUGHENED EPOXIES IN BULK, ADHESIVE, AND COMPOSITE
GEOMETRIES. Rubber-Modified Thermoset Resins. Based on a symposium held at the
186th Meeting of the American Chemical Society. 1984, ACS, pp. 83-99.
82. HUNSTON, D.L., 1984. Composite interlaminar fracture: effect of matrix
fracture energy. Composites technology review, 6(4), pp. 176-180.

50
83. HUNSTON, D.L., MOULTON, R.J., JOHNSTON, N.J. and BASCOM, W.D.,
1987. MATRIX RESIN EFFECTS IN COMPOSITE DELAMINATION: MODE I
FRACTURE ASPECTS. ASTM Special Technical Publication 1987, pp. 74-94.
84. BRADLEY, W.L., 1989. Understanding the translation of neat resin toughness
into delamination toughness in composites. Mechanical and corrosion properties. Series
A, Key engineering materials, 37, pp. 161-198.
85. JORDAN, W., BRADLEY, W. and MOULTON, R., 1989. Relating resin
mechanical-properties to composite delamination fracture-toughness. Journal of
Composite Materials, 23(9), pp. 923-943.
86. GUILD, F.J. and YOUNG, R.J., 1989. A predictive model for particulate-filled
composite materials - Part 1 Hard particles. Journal of Materials Science, 24(1), pp. 298-
306.
87. KINLOCH, A.J. and WILLIAMS, J.G., 1980. Crack blunting mechanisms in
polymers. Journal of Materials Science, 15(4), pp. 987-96.
88. BASCOM, W.D., TING, R.Y., MOULTON, R.J., RIEW, C.K. and SIEBERT,
A.R., 1981. The fracture of an epoxy polymer containing elastomeric modifiers. Journal
of Materials Science, 16(10), pp. 2657-64.
89. C.B. BUCKNALL, 1977. Toughened Plastics. London: Applied Science
Publishers LTD.
90. MAXWELL, B. and RAHM, L.F., 1949. Rheological properties of polystyrene
below 80C. Industrial and Engineering Chemistry, 41, pp. 1988-1993.
91. BUCKNALL, C.B. and SMITH, R.R., 1965. Stress-whitening in high-impact
polystyrenes. Polymer, 6(8), pp. 437-446.
92. OXBOROUGH, R.J. and BOWDEN, P.B., 1973. A general critical-strain
criterion for crazing in amorphous glassy polymers. Philosophical Magazine, 28(3), pp.
547-59.
93. KINLOCH, A.J., SHAW, S.J., TOD, D.A. and HUNSTON, D.L., 1983.
Deformation and fracture behaviour of a rubber-toughened epoxy: 2. Failure Criteria.
Polymer, 24(10), pp. 1355-1363.
94. MERZ, E.H., CLAVER, G.C. and BAER, M., 1956. Studies on heterogeneous
polymeric systems. Journal of Polymer Science, 22(101), pp. 325-341.

51
95. SPANOUDAKIS, J. and YOUNG, R.J., 1984. Crack propagation in a glass
particle-filled epoxy resin. Part 1. Effect of particle volume fraction and size. Journal of
Materials Science, 19(2), pp. 473-486.
96. LANGE, F.F., 1970. The interaction of a crack front with a second-phase
dispersion. Philosophical Magazine, 22(179), pp. 983-92.
97. LANGE, E.F. and RADFORD, K.C., 1971. Fracture energy of an epoxy
composite system. Journal of Materials Science, 6(9), pp. 1197-203.
98. LEE, J. and YEE, A.F., 2000. Role of inherent matrix toughness on fracture of
glass bead filled epoxies. Polymer, 41, pp. 8375-8385.
99. KOO, J.H., 2006. Polymer nanocomposites processing, characterization, and
applications. New York: McGraw-Hill.
100. OKAMOTO, M., 2006. Recent advances in polymer/layered silicate
nanocomposites: An overview from science to technology. Materials Science and
Technology, 22(7), pp. 756-779.
101. HUSSAIN, F., HOJJATI, M., OKAMOTO, M. and GORGA, R.E., 2006. Review
article: Polymer-matrix nanocomposites, processing, manufacturing, and application: An
overview. Journal of Composite Materials, 40(17), pp. 1511-1575.
102. THOSTENSON, E.T., LI, C. and CHOU, T., 2005. Nanocomposites in context.
Composites Science and Technology, 65(3-4), pp. 491-516.
103. KOJIMA, Y., USUKI, A., KAWASUMI, M., OKADA, A., FUKUSHIMA, Y.,
KURAUCHI, T. and KAMIGAITO, O., 1993. Mechanical properties of nylon 6-clay
hybrid. Journal of Materials Research, 8(5), pp. 1185-1189.
104. OKADA, A. and USUKI, A., 1995. The chemistry of polymer-clay hybrids.
Materials Science and Engineering C, 3(2), pp. 109-115.
105. LEBARON, P.C., WANG, Z. and PINNAVAIA, T.J., 1999. Polymer-layered
silicate nanocomposites: An overview. Applied Clay Science, 15(1-2), pp. 11-29.
106. GIANNELIS, E.P., 1996. Polymer layered silicate nanocomposites. Advanced
Materials, 8(1), pp. 29-35.
107. KE, Y.C., 2005. Polymer-layered silicate and silica nanocomposites. Amsterdam:
Elsevier.

52
108. UTRACKI, L.A., 2004. Clay containing polymer nanocomposites. Shawbury,
UK: Rapra Technology Ltd.
109. LAN, T., KAVIRATNA, P.D. and PINNAVAIA, T.J., 1995. Mechanism of clay
tactoid exfoliation in epoxy-clay nanocomposites. Chemistry of Materials, 7(11), pp.
2144-2150.
110. GIANNELIS, E.P., KRISHNAMOORTI, R. and MANIAS, E., 1999. Polymer-
silicate nanocomposites: Model systems for confined polymers and polymer brushes. pp.
107-147.
111. BROWN, J.M., CURLISS, D. and VAIA, R.A., 2000. Thermoset-layered silicate
nanocomposites. Quaternary ammonium montmorillonite with primary diamine cured
epoxies. Chemistry of Materials, 12(11), pp. 3376-3384.
112. WANG, M.S. and PINNAVAIA, T.J., 1994. Clay-polymer nanocomposites
formed from acidic derivatives of montmorillonite and an epoxy resin. Chemistry of
Materials, 6(4), pp. 468-474.
113. KORNMANN, X., THOMANN, R., MÜLHAUPT, R., FINTER, J. and
BERGLUND, L., 2002. Synthesis of amine-cured, epoxy-layered silicate
nanocomposites: The influence of the silicate surface modification on the properties.
Journal of Applied Polymer Science, 86(10), pp. 2643-2652.
114. ZILG, C., MÜLHAUPT, R. and FINTER, J., 1999. Morphology and
toughness/stiffness balance of nanocomposites based upon anhydride-cured epoxy resins
and layered silicates. Macromolecular Chemistry and Physics, 200(3), pp. 661-670.
115. XIDAS, P.I. and TRIANTAFYLLIDIS, K.S., 2010. Effect of the type of
alkylammonium ion clay modifier on the structure and thermal/mechanical properties of
glassy and rubbery epoxy-clay nanocomposites. European Polymer Journal, 46(3), pp.
404-417.
116. PARK, J.H. and JANA, S.C., 2003. Mechanism of exfoliation of nanoclay
particles in epoxy-clay nanocomposites. Macromolecules, 36(8), pp. 2758-2768.
117. PINNAVAIA, T.J., LAN, T., WANG, Z., SHI, H. and KAVIRATNA, P.D., 1996.
CLAY-REINFORCED EPOXY NANOCOMPOSITES: SYNTHESIS, PROPERTIES,
AND MECHANISM OF FORMATION. ACS Symposium Series 622,1996, pp. 250-261.

53
118. CHEN, C. and CURLISS, D., 2003. Preparation, Characterization, and
Nanostructural Evolution of Epoxy Nanocomposites. Journal of Applied Polymer
Science, 90(8), pp. 2276-2287.
119. KORNMANN, X., LINDBERG, H. and BERGLUND, L.A., 2001. Synthesis of
epoxy-clay nanocomposites: Influence of the nature of the clay on structure. Polymer,
42(4), pp. 1303-1310.
120. BECKER, O., CHENG, Y.-B., VARLEY, R.J. and SIMON, G.P., 2003. Layered
silicate nanocomposites based on various high-functionality epoxy resins: The influence
of cure temperature on morphology, mechanical properties, and free volume.
Macromolecules, 36(5), pp. 1616-1625.
121. BECKER, O., VARLEY, R. and SIMON, G., 2002. Morphology, thermal
relaxations and mechanical properties of layered silicate nanocomposites based upon
high-functionality epoxy resins. Polymer, 43(16), pp. 4365-4373.
122. MESSERSMITH, P.B. and GIANNELIS, E.P., 1994. Synthesis and
characterization of layered silicate-epoxy nanocomposites. Chemistry of Materials, 6(10),
pp. 1719-1725.
123. KE, Y., LU, J., YI, X., ZHAO, J. and QI, Z., 2000. Effects of promoter and curing
process on exfoliation behavior of epoxy/clay nanocomposites. Journal of Applied
Polymer Science, 78(4), pp. 808-815.
124. KORNMANN, X., BERGLUND, L.A., THOMANN, R., MULHAUPT, R. and
FINTER, J., 2002. High performance epoxy-layered silicate nanocomposites. Polymer
Engineering and Science, 42(9), pp. 1815-1826.
125. HERNANDEZ, M., SIXOU, B., DUCHET, J. and SAUTEREAU, H., 2007. The
effect of dispersion state on PMMA-epoxy-clay ternary blends: In situ study and final
morphologies. Polymer, 48(14), pp. 4075-4086.
126. LIU, W., HOA, S.V. and PUGH, M., 2005. Organoclay-modified high
performance epoxy nanocomposites. Composites Science and Technology, 65(2), pp.
307-316.
127. YASMIN, A., ABOT, J.L. and DANIEL, I.M., 2003. Processing of clay/epoxy
nanocomposites by shear mixing. Scripta Materialia, 49(1 SPEC.), pp. 81-86.

54
128. ALEXANDRE, M. and DUBOIS, P., 2000. Polymer-layered silicate
nanocomposites: Preparation, properties and uses of a new class of materials. Materials
Science and Engineering R: Reports, 28(1), pp. 1-63.
129. BECKER, O. and SIMON, G.P., 2005. Epoxy layered silicate nanocomposites.
Advances in Polymer Science, 179, pp. 29-82.
130. LAN, T. and PINNAVAIA, T.J., 1994. Clay-reinforced epoxy nanocomposites.
Chemistry of Materials, 6(12), pp. 2216-2219
131. ZERDA, A.S. and LESSER, A.J., 2001. Intercalated clay nanocomposites:
Morphology, mechanics, and fracture behavior. Journal of Polymer Science, Part B:
Polymer Physics, 39(11), pp. 1137-1146.
132. MIYAGAWA, H. and DRZAL, L.T., 2004. The effect of chemical modification
on the fracture toughness of montmorillonite clay/epoxy nanocomposites. Journal of
Adhesion Science and Technology, 18(13), pp. 1571-1588.
133. MASSAM, J. and PINNAVAIA, T.J., 1998. CLAY NANOLAYER
REINFORCEMENT OF A GLASSY EPOXY POLYMER. Materials Research Society
Symposium Proceedings 1998, 520, pp. 223-232.
134. BECKER, O., VARLEY, R.J. and SIMON, G.P., 2004. Thermal stability and
water uptake of high performance epoxy layered silicate nanocomposites. European
Polymer Journal, 40(1), pp. 187-195.
135. GILMAN, J.W., 1999. Flammability and thermal stability studies of polymer
layered-silicate (clay) nanocomposites. Applied Clay Science, 15(1-2), pp. 31-49.
136. HAMLEY, I.W., 2004. Developments in block copolymer science and technology.
West Sussex: John Wiley & Sons, Ltd.
137. LODGE, T.P., 2003. Block copolymers: Past successes and future challenges.
Macromolecular Chemistry and Physics, 204(2), pp. 265-273.
138. HILLMYER, M., 1999. Block copolymer synthesis. Current Opinion in Solid
State and Materials Science, 4(6), pp. 559-564.
139. BATES, F.S. and FREDRICKSON, G.H., 1999. Block copolymers-designer soft
materials. Physics Today, 52(2), pp. 32-38.

55
140. SMART, T., LOMAS, H., MASSIGNANI, M., FLORES-MERINO, M.V.,
PEREZ, L.R. and BATTAGLIA, G., 2008. Block copolymer nanostructures. Nano
Today, 3(3-4), pp. 38-46.
141. HELFAND, E., 1975. Block copolymer theory. III. Statistical mechanics of the
microdomain structure. Macromolecules, 8(4), pp. 552-556.
142. LEIBLER, L., 1980. Theory of microphase separation in block copolymers.
Macromolecules, 13(6), pp. 1602-1617.
143. MATSEN, M.W. and BATES, F.S., 1996. Unifying weak- and strong-segregation
block copolymer theories. Macromolecules, 29(4), pp. 1091-1098.
144. MATSEN, M.W. and THOMPSON, R.B., 1999. Equilibrium behaviour of
symmetric ABA triblock copolymer melts. Journal of Chemical Physics, 111(15), pp.
7139-7146.
145. ZHENG, W. and WANG, Z., 1995. Morphology of ABC triblock copolymers.
Macromolecules, 28(21), pp. 7215-7215.
146. MEIER, D.J., 1996. Theory of block copolymers. I. Domain formation in A-B
block copolymers. Journal of Polymer Science, Part B: Polymer Physics, 34(11), pp.
1821-1838.
147. HELFAND, E. and WASSERMAN, Z.R., 1976. Block copolymer theory. 4.
Narrow interphase approximation. Macromolecules, 9(6), pp. 879-888.
148. MATSEN, M.W. and SCHICK, M., 1994. Stable and unstable phase of a diblock
copolymer melt. Physical Review Letters, 72(16), pp. 2660-2660.
149. RUZETTE, A.-V. and LEIBLER, L., 2005. Block copolymers in tomorrow's
plastics. Nature Materials, 4(1), pp. 19-31.
150. LIPIC, P.M., BATES, F.S. and HILLMYER, M.A., 1998. Nanostructured
thermosets from self-assembled amphiphilic block copolymer/epoxy resin mixtures.
Journal of the American Chemical Society, 120(35), pp. 8963-8970.
151. HILLMYER, M.A., LIPIC, P.M., HAJDUK, D.A., ALMDAL, K. and BATES,
F.S., 1997. Self-assembly and polymerization of epoxy resin-amphiphilic block
copolymer nanocomposites. Journal of the American Chemical Society, 119(11), pp.
2749-2750.
56
152. SPONTAK, R.J. and PATEL, N.P., 2000. Thermoplastic elastomers:
Fundamentals and applications. Current Opinion in Colloid and Interface Science, 5(5-
6), pp. 334-341.
153. HYDRO, R.M. and PEARSON, R.A., 2007. Epoxies toughened with triblock
copolymers. Journal of Polymer Science, Part B: Polymer Physics, 45(12), pp. 1470-
1481.
154. GERARD, P., BOUPAT, N.P., FINE, T., GERVAT, L. and PASCAULT, J.-P.,
2007. Toughness properties of lightly crosslinked epoxies using block copolymers.
Macromolecular Symposia, 256, pp. 55-64.
155. WU, J., THIO, Y.S. and BATES, F.S., 2005. Structure and properties of PBO-
PEO diblock copolymer modified epoxy. Journal of Polymer Science, Part B: Polymer
Physics, 43(15), pp. 1950-1965.
156. YANG, P., ZHAO, D., MARGOLESE, D.I., CHMELKA, B.F. and STUCKY,
G.D., 1999. Block copolymer templating syntheses of mesoporous metal oxides with
large ordering lengths and semicrystalline framework. Chemistry of Materials, 11(10),
pp. 2813-2826.
157. BRONSTEIN, L., KRÄMER, E., BERTON, B., BURGER, C., FÖRSTER, S. and
ANTONIETTI, M., 1999. Successive use of amphiphilic block copolymers as
nanoreactors and templates: Preparation of porous silica with metal nanoparticles.
Chemistry of Materials, 11(6), pp. 1402-1405.
158. CHEN, L., PHILLIP, W.A., CUSSLER, E.L. and HILLMYER, M.A., 2007.
Robust nanoporous membranes templated by a doubly reactive block copolymer. Journal
of the American Chemical Society, 129(45), pp. 13786-13787.
159. KELLER, A., PEDEMONTE, E. and WILLMOUTH, F.M., 1970. Macro-lattice
from segregated amorphous phases of a three block copolymer. Nature, 225(5232), pp.
538-539.
160. HAMLEY, I.W., 2001. Structure and flow behaviour of block copolymers.
Journal of Physics Condensed Matter, 13(33), pp. R643-R671.
161. AMUNDSON, K., HELFAND, E., QUAN, X., HUDSON, S.D. and SMITH,
S.D., 1994. Alignment of lamellar block copolymer microstructure in an electric field. 2.
Mechanisms of alignment. Macromolecules®, 27(22), pp. 6559-6570.

57
162. JEONG, B., BAE, Y.H., LEE, D.S. and KIM, S.W., 1997. Biodegradable block
copolymers as injectable drug-delivery systems. Nature, 388(6645), pp. 860-862.
163. JEONG, B., KIM, S.W. and BAE, Y.H., 2002. Thermosensitive sol-gel reversible
hydrogels. Advanced Drug Delivery Reviews, 54(1), pp. 37-51.
164. YOKOZEKI, T., IWAHORI, Y. and ISHIWATA, S., 2007. Matrix cracking
behaviors in carbon fiber/epoxy laminates filled with cup-stacked carbon nanotubes
(CSCNTs). Composites Part A: Applied Science and Manufacturing, 38(3), pp. 917-924.
165. MILLER, S.G. and MEADOR, M.A., 2007. POLYMER- LAYERED SILICATE
NANOCOMPOSITES FOR CRYOTANK APPLICATIONS, Collection of Technical
Papers - AIAA/ASME/ASCE/AHS/ASC Structures, Structural Dynamics and Materials
Conference 2007, pp. 7530-7538.
166. KIM, M., HONG, J., KANG, S. and KIM, C., 2008. Enhancement of the crack
growth resistance of a carbon/epoxy composite by adding multi-walled carbon nanotubes
at a cryogenic temperature. Composites Part A: Applied Science and Manufacturing,
39(4), pp. 647-654.
167. TIMMERMAN, J.F., HAYES, B.S. and SEFERIS, J.C., 2002. Nanoclay
reinforcement effects on the cryogenic microcracking of carbon fiber/epoxy composites.
Composites Science and Technology, 62(9), pp. 1249-1258.

58
Chapter 2
Materials and Experimental Procedure
SYNOPSIS: The experimental work involved the selection of appropriate constituents
and material systems; development of nanocomposite synthesis techniques; setup of
procedural standards and characterization criteria. After establishing proper experimental
procedures through trial and error, a series of nanocomposite specimens and prototype
pipe structures were fabricated. Epoxy-clay nanocomposites were synthesized by two
separate nanoclay dispersion schemes, that is, in-situ intercalative polymerization and
exfoliation-adsorption processes. Block-copolymer/epoxy blends were prepared through
self-assembling pattern generation by dissolution of block-copolymer in the epoxy
polymer. Hybrid nanocomposite samples were produced by following a special sample
preparation technique that is specific to the intended material system. A state-of-the-art
numerically controlled filament winding facility was used for manufacturing fiber-
reinforced pipes having a specific lay-up configuration and fiber orientation.
2.1 MATERIAL SYSTEM
Epoxy can be referred to as the molecules that contain more than one epoxide group (also
known as oxirane or epoxy group). The three-membered ring of an epoxy group is
composed of an oxygen atom bonded with two carbon atoms [1-2]. The diepoxy resin
diglycidyl ether of bisphenol-A (DGEBA) is undoubtedly the most commonly used
epoxy polymer, which is derived from a step-growth polymerization (condensation
polymerization) reaction between bisphenol-A and epichlorohydrin in the presence of a
strong alkali [3]. The formation of a low molar mass epoxy resin is shown in Figure 2.1.
The properties of the resulting epoxy compound depend on n, which is the number of
repeating units and varies between 0 from 25 [4]. Another feature that characterizes the
epoxy is the epoxide equivalent weight representing the weight of epoxy resin in grams
that contains 1 mole of epoxide.
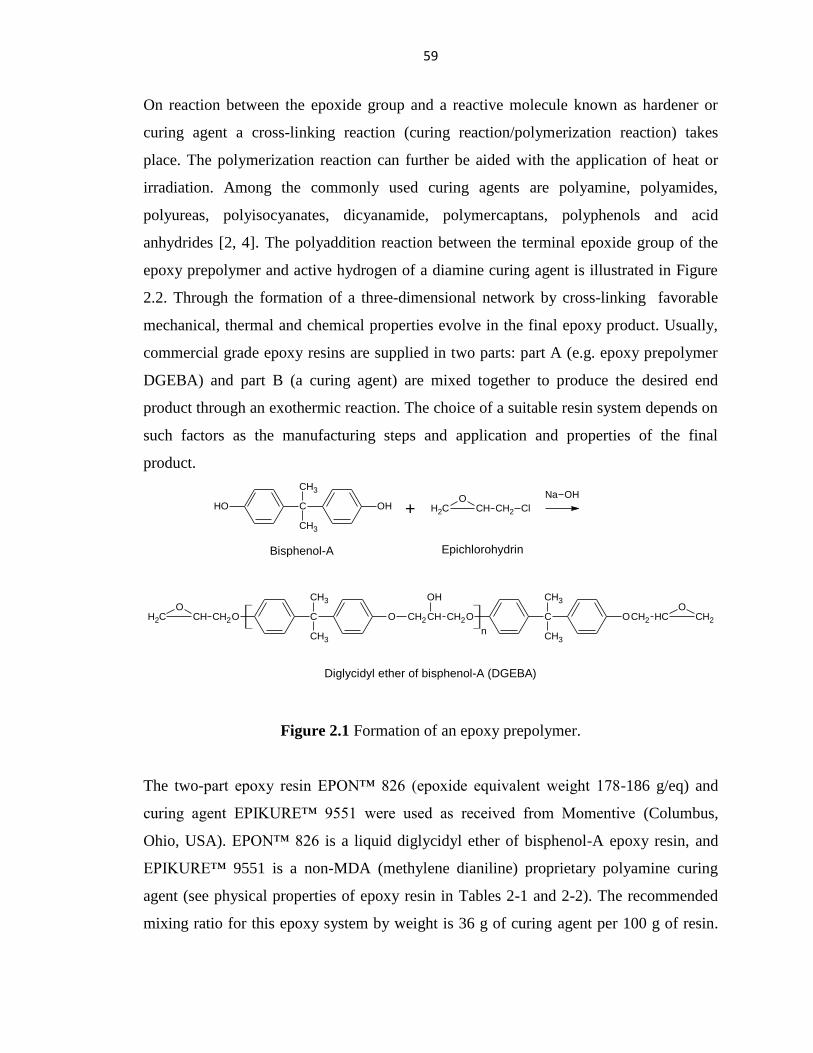
59
On reaction between the epoxide group and a reactive molecule known as hardener or
curing agent a cross-linking reaction (curing reaction/polymerization reaction) takes
place. The polymerization reaction can further be aided with the application of heat or
irradiation. Among the commonly used curing agents are polyamine, polyamides,
polyureas, polyisocyanates, dicyanamide, polymercaptans, polyphenols and acid
anhydrides [2, 4]. The polyaddition reaction between the terminal epoxide group of the
epoxy prepolymer and active hydrogen of a diamine curing agent is illustrated in Figure
2.2. Through the formation of a three-dimensional network by cross-linking favorable
mechanical, thermal and chemical properties evolve in the final epoxy product. Usually,
commercial grade epoxy resins are supplied in two parts: part A (e.g. epoxy prepolymer
DGEBA) and part B (a curing agent) are mixed together to produce the desired end
product through an exothermic reaction. The choice of a suitable resin system depends on
such factors as the manufacturing steps and application and properties of the final
product.
C
CH3
CH3
OHOH ClCH2CHO
CH2
Na OH
+
C
CH3
CH3
O OCH2 CH2CH CH2O C
CH3
CH3
OCHO
CH2 CH2 CHO
CH2
OH
n
Diglycidyl ether of bisphenol-A (DGEBA)
Bisphenol-A Epichlorohydrin
Figure 2.1 Formation of an epoxy prepolymer.
The two-part epoxy resin P ™ 826 (epoxide equivalent weight 178-186 g/eq) and
curing agent P K ™ 551 were used as received from Momentive (Columbus,
Ohio, USA). P ™ 826 is a liquid diglycidyl ether of bisphenol-A epoxy resin, and
P K ™ 9551 is a non-MDA (methylene dianiline) proprietary polyamine curing
agent (see physical properties of epoxy resin in Tables 2-1 and 2-2). The recommended
mixing ratio for this epoxy system by weight is 36 g of curing agent per 100 g of resin.

60
This particular epoxy resin system is suitable for application in filament winding and
resin transfer molding operations.
Commercially available organoclays Nanomer I.30E (CH3(CH2)17NH3-MMT) and
Nanomer I.28E (CH3(CH2)17N(CH3)3-MMT) and PGW - an unmodified sodium-
montmorillonite (Na-MMT) clay were supplied by Nanocor Inc. (Hoffman Estates,
Illinois, USA) (see physical properties of layered silicate in Table 2-3). The organoclay
I.30E is an octadecyl ammonium (ODA) (i.e. primary alkylammonium ion) exchanged
sodium-montmorillonite. I.28E was surface treated with a quaternary alkylammonium ion
octadecyl trimethyl ammonium (ODTMA).
NHH
NH H
N
CH2
CH2
CH
CH
OH
OH
CH3
CH3
N
CH2
CH2 CH
CH
OH
OH
CH3
CH3
Diamine
CHO
CH2CH3
CHO
CH2CH3
CH2
OCH CH3
CH2
OCH CH3
+
Diglycidyl ether of bisphenol-A (DGEBA)
Crosslinked network
Figure 2.2 A schematic representation of the epoxy curing reaction.
In an effort to enhance the toughness of epoxy polymer, ABA type commercial grade
acrylic triblock-copolymers Nanostrength® M52 and M52N (see properties in Table 2-4)
were added. These block-copolymers were synthesized by Arkema (Philadelphia,
Pennsylvania, USA) via controlled free radial polymerization. The M52

61
poly(methylmethacrylate-b-butylacrylate-b-methylmethacrylate) block-copolymer is
comprised of an elastomeric middle block poly(n-butylacrylate) (PBuA) and two epoxy
compatible side blocks of poly(methylmethacrylate) (PMMA). The M52N block-
copolymer has similar structure as the M52 block-copolymer, but the side blocks are
made of random copolymers of methylmethacrylate (MMA) and N,N-dimethylacrylamide
(DMA). Incorporation of DMA units is intended to increase the block-copolymer
miscibility with epoxy, and to provide greater stability of the nanostructures during the
cross-linking reaction [5, 6]. The specific chemical formulae of the M52 and M52N are
propriety in nature and are withheld by the manufacturer. Figures 2.3 shows
representative chemical structures of the clay surface modifiers and block-copolymers
employed in this study. Figure 2.4 shows photographs of the as-delivered nano-filler
materials.
The fiber composites were made with the basalt fiber KV12 (see properties in Table 2-5)
having a liner density of 1200 tex, which was supplied by Kamenny Vek (Dubna,
Moscow Region, Russia). A comparative study of basalt, E-glass and S-glass fiber
reinforcements on the performance of filament-wound tubular structures can be found in
reference [7].
CH3 (CH2)17 N+
H
H
H
CH3 (CH2)17 N+
CH3
CH3
CH3
Octadecyl ammonium Octadecyl trimethyl ammonium
CH2 C
C
CH3
O
O
CH3
Cl CH2 C
C
H
O
O
C4H9
CH2 C
C
CH3
O
O
CH3
CH3
n m l
Poly(methylmethacrylate-b-butylacrylate-b-methylmethacrylate)
C N
CH
O
CH2
CH3
CH3
N,N-dimethylacrylamide
Figure 2.3 Representative chemical structures of the alkylammonium ions and acrylic
block-copolymers used in this study.

62
Table 2-1 Physical characteristics of the epoxy resin system [8].
Property EPON 826 EPIKURE 9551
Viscosity at 25°C (cP) 6500-9500 30-70
Density at 25°C (g/cm3) 1.16 0.96
Epoxide equivalent weight (g/eq) 178-186
Amine hydrogen equivalent weight (g/eq) 57-67
Mix ratio of resin/curing agent by weight 100 36
Mix viscosity resin/curing agent at 25°C (cP) 1100
Pot life (resin/curing agent) at 25°C, (h) 2.5
Gel time (resin/curing agent) at 25°C, (h) 6.4
Table 2-2 Physical properties of the neat epoxy resin in cured state [8].
Property Value
Tensile strength at 25°C (MPa) 68.9
Tensile modulus at 25°C (GPa) 2.76
Tensile elongation at 25°C (%) 10.6
Fracture toughness (MPam0.5
) 1.27
Glass transition temperature (°C) 110
Coefficient of thermal expansion (µm/m°C) 56
Water up-take (%) 1.8
Figure 2.4 Picture of powdered nano-fillers: (a) I.30E and (b) M52N.
(a) (b)

63
Table 2-3 Physical properties of the layered silicate nanoclay [10-12].
Property I.30E I.28E PGW
Appearance White powder White powder White powder
Mean dry particle size
(µm)
8-10 8-10 16-22 [9]
Specific gravity 1.71 1.9 2.6
Moisture content (%) 3 max 3 max 12 max
Aspect ratio 200-400
Surface area (m2/g) 750
CEC (meq/100g) 145
Organic content (wt%) 25-30 [9] 25-30 [9] --
Table 2-4 Physical and chemical properties of the Nanostrength® M52N [13].
Property Description
Appearance White/yellow powder
Melting point Approximately 160°C
Solubility in solvent Aromatic solvents, aldehydes, ketones,
acetic esters, chlorinated solvents
Solubility in water Insoluble
Thermal decomposition >280°C
Table 2-5 Property of the basalt fiber reinforcements [14].
Property Description
Monofilament diameter (µm) 10-22
Linear density (tex) 1200
Type of sizing Silane
Sizing content (wt%) 0.4
Resin compatibility Epoxy and phenolic
Moisture content (wt%) <0.1
Tensile strength of epoxy impregnated strand (MPa) 2800-3000 (ASTM D2343)
Tensile modulus of epoxy impregnated strand (GPa) 85-90

64
2.2 PREPARATION OF NANOCOMPOSITES
Preparation and processing of epoxy nanocomposites from resin, curing agent and nanofillers
involved such major steps as mixing, dispersion, degassing and curing. In the following,
optimum processing condition are described as found from several trials by manipulating
processing (i.e. mixing time and temperature, extent of dispersion, method of dispersion, etc.)
and material parameters.
2.2.1 Epoxy-clay Nanocomposites
Nanocomposites were synthesized by two separate nanoclay dispersion schemes. In-situ
intercalative polymerization was performed using a mechanical agitator; this is hereafter
termed as mechanical dispersion. An exfoliation-adsorption process was carried out using an
ultrasonic probe with the aid of the solvent acetone, which is hereafter designated as
ultrasonic dispersion.
2.2.1.1 Mechanical Dispersion
Prior to dispersion into the epoxy precursor, nanoclay I.30E was dried in an oven at an
elevated temperature of 120°C for a period of 24 hours to remove any adsorbed water.
Afterwards, the nanoclay was allowed to cool down to room temperature. Then, a measured
amount of nanoclay (depending on the filler matrix loading) was gently added to 150 g of
preheated EPON 826 resin at 60°C in a 250 ml glass beaker. The mixture was mechanically
mixed for 30 minutes with an impeller type shear mixer (built in-house) running at
900 revolutions per minute. Pre-heating melted crystalline solids that may have been present
as a result of storing epoxy resin at room temperature and also reduced resin viscosity. The
low molecular weight of the epoxy prepolymer allowed direct addition of the nanoclay in the
epoxy resin. Then, a stoichiometric amount of the curing agent was added to the epoxy-clay
solution, followed by mechanical mixing at 60°C for five minutes using the same mechanical
stirrer mentioned above. Any entrapped air and volatiles formed during mixing with the
curing agent were evacuated by a vacuum pump operated at 80 kPa for 20 minutes. Vacuum
was applied by placing the steel mold inside a specially designed vacuum chamber. The final
mixture was cured in an open mold made of mild steel having internal dimensions of 21 cm
by 11.5 cm by 2.5 cm (see Figure 2.5). The steel mold was coated with a layer of release

65
agent Frekote® 770-NC (Henkel, Rocky Hill, Connecticut, USA) and subsequently heated to
60C before the resin mixture is poured into the mold cavity. Curing of the nanocomposite
was performed in an oven at 120°C for two hours. Afterwards, it was allowed to cool down
to room temperature. Composite samples having 1 wt%, 2 wt% and 3 wt% of I.30E clay
were produced using this method. Figure 2.6 shows a process flow diagram for the
mechanical dispersion method.
Figure 2.5 Mold used for epoxy casting.
Figure 2.6 Process flow diagram of nanocomposite fabrication by mechanical mixing
method.
Neat epoxy samples were prepared through a procedure where preheated epoxy resin was
directly mixed with the curing agent and subsequently cured as per in the same manner as
mentioned above. Note that with increasing filler loading, the reactive mixture becomes more

66
viscous. The highly viscous nature of the mixture significantly limits the ability to remove
entrapped gases with vacuum. Hence, clay loading of nanocomposites prepared for this study
did not exceed 3 wt% to maintain the integrity and uniformity of the samples. It was also
confirmed from manufacturer technical data [11] that the dispersion of organoclay is
expected to increase the mixture viscosity.
2.2.1.2 Ultrasonic Dispersion
At the beginning of the ultrasonic dispersion process, a specified amount of the dried
nanoclay was added to 125 ml acetone in a 250 ml beaker. The mixture was then held at
room temperature for six hours. During this time, pre-swelling of the clay occurred by
diffusion of solvent into the clay interlayers. 150 g preheated EPON 826 at 60C was then
incorporated with the nanoclay solution in a 600 ml beaker, and immediately after the epoxy
addition ultrasonic mixing was initiated. Roughly a 300 ml mixture of nanoclay, acetone and
EPON 826 was subjected to sonication in a glass beaker. To obtain the desired level of resin
viscosity for efficient ultrasonic mixing, the system temperature was slowly raised to 80°C.
Sonication was performed by a Branson model S-75 Sonifier (Branson Ultrasonics
Corporation, Danbury, Connecticut, USA) at 80°C for eight hours. The ultrasonic probe was
operated at 75 W power output with 20 kHz output frequency. A step horn sonotrode with a
12.7 mm tip diameter was used to transmit ultrasonic energy. To prevent the generation of
excessive heating during ultrasonic mixing of the polymer and nanoclay fillers, the
temperature was maintained by momentarily stopping the ultrasonic probe. Ultrasonic
dispersion was aided by the polar solvent acetone, which reduced the viscosity of the mixture
to facilitate penetration of the epoxy precursor into the interlamellar region of the stacked
clay sheets [15-16]. Afterward, the solution was mechanically blended for two hours.
Acetone was removed from the solution by vacuum extraction performed at 80 kPa. Figure
2.7 shows an epoxy-nanoclay solution after acetone was stripped off and neat DGEBA epoxy
resin.
The amount of resin as designated above was for preparing dog-bone specimens. To fabricate
thicker specimens, as in the case of the fracture toughness testing, a greater amount of
constituents was added in the starting solution. Finally, the epoxy-clay blend was mixed with
EPIKURE 9551 curing agent. Subsequent exposure to vacuum the curing was accomplished

67
in a manner similar to that described above for mechanical dispersion. Nanocomposites
containing 1, 2 and 3 wt% I.30E, 1 wt% I.28E and 1 wt% PGW clay were produced
according to this procedure. Figure 2.8 shows a flow chart for the ultrasonic dispersion
process.
Figure 2.7 Liquid epoxy resin EPON 826 with and without nano-fillers.
2.2.2 Block-copolymer/Epoxy Blends
One of the advantages of M52 and M52N block-copolymers is their excellent solubility
in epoxy precursor. Powdered block-copolymer was easily dissolved in the epoxy resin
by melt mixing with the application of heat. To manufacture acrylic block-copolymer
modified epoxy compounds, initially block-copolymer (i.e. M52 or M52N) powder was
manually mixed with the EPON 826 epoxy resin at room temperature. The temperature of
the mixture was raised to 80°C, which allowed the block-copolymer to dissolve into the
epoxy resin with the application of prolonged heating. Heating was continued until
complete miscibility of block-copolymer was achieved leading to a transparent and
homogenous solution as shown in Figure 2.7. Caution was taken regarding the
completion of block-copolymer dissolution in epoxy. The probable matching refractive
indexes of the epoxy and swollen block-copolymer powder may give such misimpression
of uniform homogenization of the mixture by casual visual observation. Therefore, each
solution was carefully inspected under bright light to detect any remnant undissolved
powder. Dissolution time varied upon block-copolymer concentration. After complete
EPON 826EPON 826/I.30E EPON 826/M52N

68
dissolution was confirmed through good optical transparency, a stoichiometric amount of
the EPIKURE 9551 curing agent was introduced to the solution at 60°C, and mixed for
five minutes by a mechanical stirrer. Mechanical mixing was followed by a degassing
cycle in a vacuum chamber at 80 kPa for 20 minutes to remove all the volatiles from the
blend. Similar procedures were followed for cured epoxy blends containing 1, 3 and 5
wt% of respective M52 and M52N additives.
Figure 2.8 Processing steps for nanocomposite fabricated by ultrasonic mixing method.

69
2.2.3 Epoxy Hybrid Nanocomposites
To fabricate epoxy hybrid nanocomposites, an acetone-clay solution was mixed with an
initially prepared blend of EPON 826-M52N block-copolymer. The preparation of
acetone-clay solution and EPON 826-M52N blend are identical to those described in the
previous Sections 2.2.1.2 and 2.2.2, respectively. The remaining steps were the same as
for epoxy-clay nanocomposite processing done by the ultrasonic method. In hybrid
nanocomposite processing, instead of adding EPON 826, the EPON 826-M52N blend
was incorporated into the acetone-clay solution. The following hybrid nanocomposite
formulations were produced: 1B&1C = 1 wt% M52N and 1 wt% I.30E; 1B&3C = 1 wt%
M52N and 3 wt% I.30E; and 3B&1C = 3 wt% M52N and 1 wt% I.30E.
2.2.4 Machining of the Specimens
Standard test specimens were machined from the cured epoxy nanocomposites,
conforming to the specific requirements of the intended test methods. Test specimens for
tensile, fracture, and dynamic mechanical thermal analysis (DMTA) were machined from
the cast neat epoxy and nanocomposite samples. The standard geometries were chosen by
conforming with the ASTM standards, and the specific illustrations can be found in the
testing section in Chapter 3. The machining of the tensile specimen begins with a cured
epoxy plate about ~6 mm thick. First, the top and bottom surfaces of this epoxy sheet
were machined down to the specified thickness with a digitally controlled milling
machine. The final profiling to the dumbbell shape was done by a water jet cutter. A
vacuum assisted clamping jig was used to clamp the specimen tight to the machine while
milling is done on the opposite surface. After machining, the gauge-section of the tensile
samples were polished successively with 400 and 600 grit emery cloths to provide a
notch-free even surface finish. Considering the notch sensitivity of epoxy, polishing was
done to avoid premature and unexpected fracture of specimen that may initiate from
flaws and scratches. The cast epoxy plates for DMTA and fracture toughness testing
specimen were machined by following a similar procedure as done before for tensile test
samples. The final DMTA samples were cut using a hand saw from the flattened sheet to
the exact dimension. In single edge notch bend (SENB) specimens used for fracture
toughness testing a notch was created by the aforementioned milling machine using a 60

70
diamond cutter. The deviations/variations from the exact design specifications were
minimum and within ±.01 mm, which is within the recommended tolerance of the
standards.
2.2.5 Fabrication of Fiber-reinforced Epoxy Nanocomposites
Basalt fiber-reinforced uniaxial laminate plates were manufactured by filament winding using
a numerically controlled WMS 4-axis filament winding machine (McClean Anderson,
Schofield, WI, USA). This machine has the capacity to produce composite pipes as large as 4
m in length and 0.66 m in diameter [17]. To fabricate the laminated plates, continuous basalt
fiber strands from three creels were hoop wound onto a rotating flat mandrel having
dimensions of 150 mm by 200 mm. The surface of the mandrel was coated with release agent
Frekote® 770-NC. While en-route to the mandrel, fiber strands were thoroughly impregnated
with epoxy-nanoparticle formulation contained in a drum-type resin bath maintained at 30°C.
A computer controlled fiber tensioning system was used to apply steady fiber tension during
the winding process. Higher fiber tow tension consolidated fiber lay-ups and displaced excess
resin. Increased winding tension is recommended to make parts having appropriate fiber
volume fraction and low void content [18-19]. The winding tension was therefore
manipulated depending on the fiber packing required. The fiber volume fraction was adjusted
by changing the applied load from the tensioning system as well as selectively employing
vacuum bagging (see subsequent paragraph) to those samples that were required to have
increased fiber volume fraction. A 50 µm thin ethylene tetrafluoroethylene film insert was
placed at the mid-plane of the laminate stack as a crack initiator. Laminates were made of 8
plies, four on top and the rest below the thin film insert. Each ply was approximately ~0.625
mm thick with the quasi unidirectional lay-up having a fiber configuration of [±89.5°4]T. A
detailed description of the filament winding machine and the processing steps can be found in
reference [20]. Figure 2.9 illustrates the filament winding manufacturing process used to
fabricate laminate plates.
After completion of the winding process the mandrel with resin-wet fibers was covered
with a layer of polyamide cloth peel fly, a polypropylene bleeder cloth, a release film and
finally a vacuum bag to bleed out the excess resin, entrapped air and other volatiles.
Curing was performed at 120C for two hours with the application of continuous vacuum

71
of 80 kPa. After curing, the laminates were machined by a water jet cutter according to
the specified dimensions, 120 mm long and 20 mm wide including an initial delamination
length of 50 mm. Resin laden top and bottom surfaces were manually sanded down to
give the average thickness of about ~5 mm using 400 grit emery cloth. Afterwards, piano
hinges were attached on each side of the specimens using a 3M Scotch-Weld DP460 Off-
White adhesive (3M, St. Paul, Minnesota, USA). After attaching the hinges, specimens
were left overnight for the adhesive to cure. Laminates made with neat epoxy, 1 and 3
wt% I.30E clay and 1, 3 and 5 wt% M52N block-copolymer modified epoxy were
processed by following the procedures mentioned in the preceding sections.
Figure 2.9 A schematic of the processing steps for fiber-reinforced epoxy
nanocomposites.

72
2.2.6 Nanocomposite Pipe Fabrication
Filament-wound basalt fiber-reinforce epoxy nanocomposite tubes were fabricated,
having various concentrations of either M52N or I.30E nanoparticles. Fiber-reinforced
nanocomposite pipes were manufactured by pulling five continuous basalt fiber strands
from their creels using the WMS 4-axis filament winding machine. The fiber rovings
were impregnated with polymer resin by passing them through the drum-type resin bath
before reaching the mandrel. Six layers of resin-wet fiber material were helical [±θ]
wound successively onto a chrome-plated steel mandrel having a diameter and length of
38.1 mm and 762 mm, respectively. The mandrel surface was coated with a layer of
release agent Frekote® 770-NC before initiation of the winding process. Throughout the
manufacturing process a numerically controlled tensioning system steadily applied
26.7 N tension to each fiber strand. Curing of the specimens occurred at 80°C for one
hour and 120°C for 2.5 hours, followed by cooling down to room temperature. Curing
was performed in a digitally controlled industrial oven (Wisconsin Oven). The mandrels
located in the oven were connected with a drive system to allow constant rotation during
curing, which promoted part roundness and even resin accumulation on the surface. Upon
completion of the curing cycle the filament-wound tubular specimens were extracted
from the mandrel. 190 mm long finished pieces were cut from the extracted part using a
tile saw, and tube extremities were reinforced with aluminum end connections. The pipe
ends were attached with aluminum end connections to protect the pipe extremities from
damage due to gripping by the testing machine. The bonding surfaces of the aluminum
end-tabs were roughen by sand blasting and subsequently cleaned with acetone.
Aluminum end-caps were then adhesively bonded to the pipe specimen by using Scotch-
Weld DP460 Off-White adhesive from 3M. A specimen schematic is shown in Figure
2.10, where dimensions are in mm. For mechanical testing, a rubber bladder liner was
inserted inside each tubular specimen. The rubber bladder was designed to enable the
assessment of functional as well as structural failure in the same experiment. Composite
pipes were also fitted with two strain gauge rosettes aligned at the middle of the gauge
section, assigned parallel and perpendicular to the tube axis. All specimens had a [±60°3]T
interwoven angle-ply fiber architecture, an inside diameter of 38.1 mm and a gage length
of 90 mm. Figure 2.11 shows a test specimen with attached aluminum end connections.

73
Figure 2.10 Tubular specimen geometry and fiber direction.
Figure 2.11 Tubular basalt fiber-reinforced epoxy/M52N composite specimens.
REFERENCES
1. Lee, H. and Neville, K., 1982. HandBook of Epoxy Resins. New York: McGraw
Hill.
2. May, C.A. and Tanaka, Y., 1987. Epoxy Resins Chemistry and Technology. New
York: Marcel Dekker.
3. Young, R.J. and Lovell, P.A., 2011. Introduction to polymers. Boca Raton: CRC
press.
4. Salamone, J.C., 1996. Polymeric Materials Encyclopedia. New York: CRC press.
Axial
load
Internal
pressure
202 mm
38
.1 m
m
90 mm
+600
-600
Rubber
bladderPipe sectionTest specimen

74
5. GERARD, P., BOUPAT, N.P., FINE, T., GERVAT, L. and PASCAULT, J.-P.,
2007. Toughness properties of lightly crosslinked epoxies using block copolymers.
Macromolecular Symposia, 256, pp. 55-64.
6. MAIEZ-TRIBUT, S., PASCAULT, J.P., SOULÉ, E.R., BORRAJO, J. and
WILLIAMS, R.J.J., 2007. Nanostructured epoxies based on the self-assembly of block
copolymers: A new miscible block that can be tailored to different epoxy formulations.
Macromolecules, 40(4), pp. 1268-1273.
7. MERTINY, P., JUSS, K. and EL GHAREEB, M.M., 2009. Evaluation of glass
and basalt fiber reinforcements for polymer composite pressure piping. Journal of
Pressure Vessel Technology, Transactions of the ASME, 131(6), pp. 0614071-0614076.
8. Starting formulation 8023, Resin system for filament winding and RTM,
Momentive.
9. Xidas P. I., Triantafyllidis K. S.: Effect of the type of alkylammonium ion clay
modifier on the structure and thermal/mechanical properties of glassy and rubbery epoxy-
clay nanocomposites. European Polymer Journal, 46, 404-417 (2010).
10. Technical data, Lit. T-12, Nanocomposites using Nanomer® I.28E nanoclay,
Nanocor.
11. Technical data, Lit. T-11, Epoxy nanocomposites using Nanomer® I.30E
nanoclay, Nanocor.
12. Technical data, Lit. G-105, Polymer grade montmorillonites, Nanocor.
13. Material safety data sheet, NANOSTRENGTH® M52N NP, Arkema.
14. Product technical information, KV12, Kamenny Vek.
15. BALAKRISHNAN, S., START, P.R., RAGHAVAN, D. and HUDSON, S.D.,
2005. The influence of clay and elastomer concentration on the morphology and fracture
energy of preformed acrylic rubber dispersed clay filled epoxy nanocomposites. Polymer,
46(25), pp. 11255-11262.
16. BROWN, J.M., CURLISS, D. and VAIA, R.A., 2000. Thermoset-layered silicate
nanocomposites. Quaternary ammonium montmorillonite with primary diamine cured
epoxies. Chemistry of Materials, 12(11), pp. 3376-3384.
17. MEIJER, G. and ELLYIN, F., 2008. A Failure envelope for ±600
filament wound
glass fibre reinforced epoxy tubulars. Composites Part A, 39, pp. 555-564.

75
18. COHEN, D., MANTELL, S.C. and ZHAO, L., 2001. The effect of fiber volume
fraction on filament wound composite pressure vessel strength. Composites Part
B:Engineering, 32(5), pp. 413-429.
19. MERTINY, P. and ELLYIN, F., 2001. SELECTION OF OPTIMAL
PROCESSING PARAMETERS IN FILAMENT WINDING. 33rd International SAMPE
Technical Conference 2001, pp. 1084-1095.
20. WOLODKO, J., MERTINY, P., MEIJER, G., MARTENS, M. and ELLYIN, F.,
2001. Development of a facility for filament winding GFRP tubulars, 46th International
SAMPE Symposium and Exhibition 2001 a Materials and Processes Odyssey, May 6,
2001 - May 10, 2001, Soc. for the Advancement of Material and Process Engineering, pp.
1271-1282.

76
Chapter 3
Characterization and Testing Methods of Nanocomposites
SYNOPSIS: Different characterization and testing methods were employed to provide
insight into the material behavior of the nanocomposites. Design of experimental
procedures, suitable testing regimes and data reduction schemes were developed allowing
for the determination of material properties from a minimum number of tests. An array of
advanced characterization and testing equipment were employed to perform the
experimental study. Data acquisition, data analysis and data validation were done
accordingly. Microstructure, morphology, chemical, physical, thermal and mechanical
properties of the nanoparticles, polymers and nanocomposites were measured according
to established design methodologies and standard test methods. Morphology and
nanostructure of the nanoparticles and nanocomposites were examined by X-ray
diffraction and various microscopic techniques. Chemical and physical analyses of the
epoxy nanocomposites were done with Fourier transform infrared spectroscopy and
differential scanning calorimetry. Final properties of the developed nanocomposites were
evaluated with standard tensile testing, dynamic mechanical thermal analysis, mode-I
fracture toughness testing and mode-I interlaminar testing. A multiaxial testing machine
specially built for the assessment of fluid leakage and burst failures allowed
determination of failure strengths of the pressurized composite tubulars.
3.1 X-RAY DIFFRACTION
Wide angle X-ray diffraction (WAXD) or simply X-ray diffraction (XRD) is a method of
characterizing materials by knowing their atomic arrangement and crystal structure.
Crystals are atomic structures that are ordered in a periodic manner. Using X-ray
scattering principle, spacings of different imaginary atomic planes (d-spacing) of a crystal
structure can be determined by Bragg’s law as the distance between the diffracting
planes. In this technique an incident beam of X-rays strikes a specimen placed on the

77
goniometer, which is simultaneously rotated allowing the angle of incidence to be varied.
The incident X-rays are primarily scattered by the electrons of the sample’s atom. A
diffraction pattern is developed through constructive interference of the scattered X-rays.
The detected interference pattern is then converted to provide useful information
regarding structure of the material, i.e. scattering intensity as a function of diffraction
angle (2θ). A wide-angle X-ray diffraction study of the epoxy-clay and hybrid
nanocomposites was performed by Rigaku Geigerflex 2173 (Rigaku Corporation, Tokyo,
Japan) diffractometer with a vertical goniometer. The diffractometer is fitted with a Co-
tube as an X-ray source and a graphite monochromator to filter K-beta wavelength. Tests
were run at 40 kV and 30 mA, and the samples were scanned between 2θ = 1 to 30° by
changing the angle of incidence at a rate of 0.008 2θsec-1
. XRD traces were analyzed to
measure the basal spacing between the silicate layers. Figure 3.1 shows an XRD spectrum
of organically modified I.30E nanoclay. In this figure a prominent peak can be seen that
provided information about the interlamellar spacing of nanoclay, d001 according to
Bragg’s law [1].
(3.1)
where n is an integer, λ = 0.17889 nm is wavelength of X-ray beam (Co/K-alpha1
radiation) and θ0 is the angle of incidence.
Figure 3.1 X-ray diffraction trace of I.30E organoclay.
200
400
600
800
1000
1200
1400
1600
0 2 4 6 8 10 12
Inte
nsi
ty (
counts
)
Two-theta (deg)
d001 = 2.23 nm
d002

78
3.2 TRANSMISSION OPTICAL MICROSCOPY
Transmission optical microscopy (TOM) is a light-optical microscopy method in which
visible light penetrates an optically transparent thin sample and passes through a lens to
produce a magnified image of the specimen.
Thin sections (5~10 µm) of the epoxy nanocomposite fracture surface were investigated
by transmission optical microscopy. To prepare the thin sections, nanocomposite blocks
were first placed in a Reichert-Jung Ultracut E (C. Reichert Optische Werke AG, Vienna,
Austria) microtome and sectioned with a diamond cutter. These sections represent an area
near the starter crack taken normal to the fracture surface and parallel to the crack
propagation direction. The subsurface birefringent zone was explored under bright field
and between cross polarizers using a Leica DMRXA (Leica Microsystems, Wetzlar,
Germany) microscope directly connected to a Nikon DXM 1200 (Nikon Corp., Tokyo,
Japan) digital camera. Figure 3.2 shows a thin layer of an epoxy sample viewed under
transmission optical microscopy.
Figure 3.2 TOM image of modified epoxy containing 1 wt% M52N block-copolymer.
3.3 TRANSMISSION ELECTRON MICROSCOPY
In transmission electron microscopy (TEM) a beam of high-energy electrons is
transmitted through an ultrathin (<0.5 µm) specimen. The transmitted electrons are

79
focused with a sequence of electromagnetic lenses, and images are recorded with an
appropriate imaging device at a very high resolution. TEM is based on the same concept
as transmission optical microscope [2].
In the present study, TEM offered direct visualization of the nanocomposite morphology.
Information regarding size and structure of nanoparticles, particle distribution and degree
of dispersion in a matrix material can be obtained from TEM. Microstructure of the cured
epoxy nanocomposites was examined in a Morgagni 268 (FEI, Hillsboro, Oregon, USA)
transmission electron microscope with an acceleration voltage of 80 kV. This device has
a magnification of up to 200,000x. 40~60 nm thin sections were prepared by a Reichert-
Jung Ultracut E microtome equipped with a diamond knife. Ultrathin sections were then
laid onto 300 mesh copper grids and placed inside the TEM for scanning. Some of the
composite samples containing M52N block-copolymer were allowed to stain overnight in
4% osmic acid (OsO4). Figure 3.3 exhibits intercalated clay structures and block-
copolymer vesicles in epoxy matrices.
Figure 3.3 TEM microscopy images of (a) 1 wt% nanoclay and (b) 3 wt% block-
copolymer modified epoxy.
3.4 SCANNING ELECTRON MICROSCOPY
Scanning electron microscopy (SEM) is a microscopy method that uses a beam of
accelerated electrons to scan a sample surface [2]. The interaction of the incident electron
beam with the specimen resulted in ejection of secondary electrons, backscattered electrons,
transmitted electrons, X-rays, visible light and heat. Commonly secondary and back-scattered
(a) (b)

80
electrons and X-rays are collected by special detectors and converted to generate images
revealing the sample surface morphology, chemical composition and crystal structure. To be
effectively examined by SEM the material must be electrically conductive or the sample
surface should be coated with a layer of conductive substance like carbon, gold or chromium.
Some of the advantages of SEM compared to conventional optical microscopy are higher
image resolution, larger depth of field and clarity. The principle and fundamentals of electron
microscopy can be explored in more detail in reference [2].
Fracture surfaces of neat epoxy and the corresponding nanocomposites were probed by a
JEOL 6301F field emission scanning electron microscope (JEOL Ltd., Tokyo, Japan).
Scanning electron microscopy was performed on fracture surfaces of single edge notch bend
(SENB) specimens at an acceleration voltage of 5 kV and 10kV respectively for the clay and
M52N filled epoxy samples. Depending on the size of the nano-inclusions and the type of
constituents to be examined a conductive coating was applied on the sample surfaces.
Fracture surfaces of epoxy-clay nanocomposites and M52 modified epoxy was coated with
gold, while chrome was applied on the fracture surface of M52N toughened epoxy. The
fracture surface of the laminate plates was carbon coated before being inspected by SEM.
The JEOL 6301F SEM can generate high magnification images of up to 250,000x, thus
allowing inspection of the nano-level surface features to a resolution of about ~3 nm. Figure
3.4 shows SEM micrographs of the modified epoxy fracture surfaces. Sub-micron size
intercalated clay and cavities formed by pulled out block-copolymer vesicles are visible on
the modified epoxy fracture surfaces of Figure 3.4.
Figure 3.4 SEM microscopy images of (a) 3 wt% nanoclay and (b) 3 wt% block-
copolymer modified epoxy.
(a) (b)
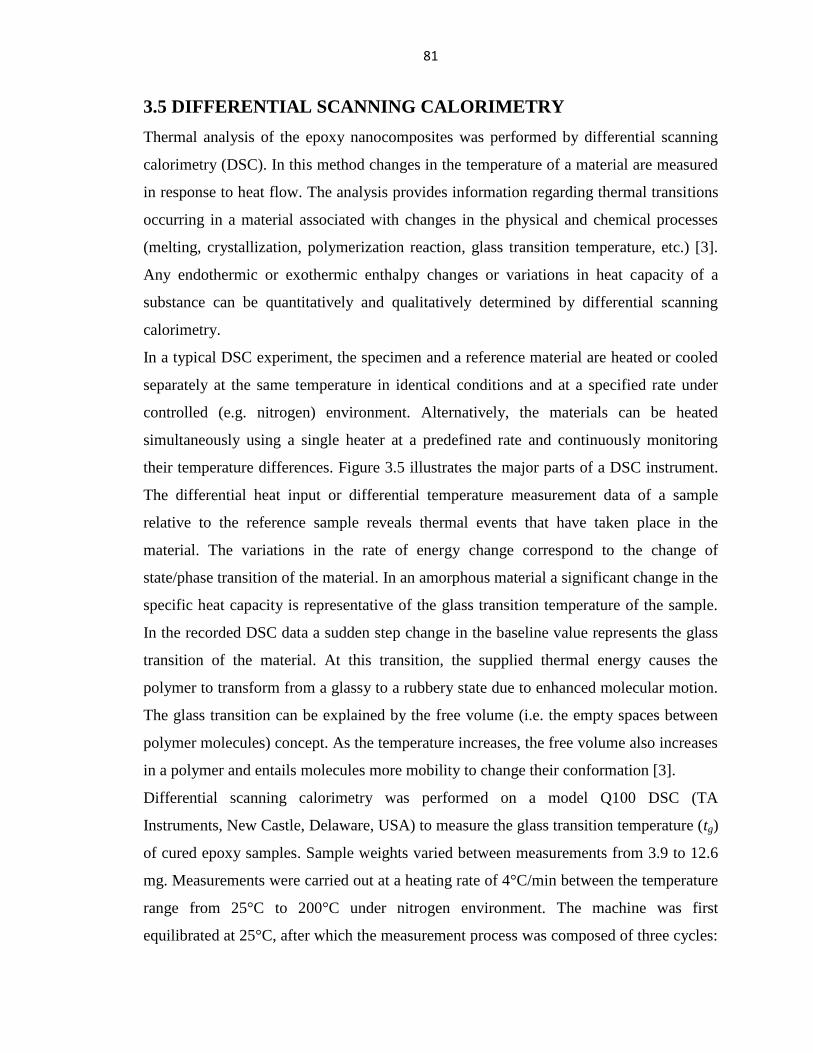
81
3.5 DIFFERENTIAL SCANNING CALORIMETRY
Thermal analysis of the epoxy nanocomposites was performed by differential scanning
calorimetry (DSC). In this method changes in the temperature of a material are measured
in response to heat flow. The analysis provides information regarding thermal transitions
occurring in a material associated with changes in the physical and chemical processes
(melting, crystallization, polymerization reaction, glass transition temperature, etc.) [3].
Any endothermic or exothermic enthalpy changes or variations in heat capacity of a
substance can be quantitatively and qualitatively determined by differential scanning
calorimetry.
In a typical DSC experiment, the specimen and a reference material are heated or cooled
separately at the same temperature in identical conditions and at a specified rate under
controlled (e.g. nitrogen) environment. Alternatively, the materials can be heated
simultaneously using a single heater at a predefined rate and continuously monitoring
their temperature differences. Figure 3.5 illustrates the major parts of a DSC instrument.
The differential heat input or differential temperature measurement data of a sample
relative to the reference sample reveals thermal events that have taken place in the
material. The variations in the rate of energy change correspond to the change of
state/phase transition of the material. In an amorphous material a significant change in the
specific heat capacity is representative of the glass transition temperature of the sample.
In the recorded DSC data a sudden step change in the baseline value represents the glass
transition of the material. At this transition, the supplied thermal energy causes the
polymer to transform from a glassy to a rubbery state due to enhanced molecular motion.
The glass transition can be explained by the free volume (i.e. the empty spaces between
polymer molecules) concept. As the temperature increases, the free volume also increases
in a polymer and entails molecules more mobility to change their conformation [3].
Differential scanning calorimetry was performed on a model Q100 DSC (TA
Instruments, New Castle, Delaware, USA) to measure the glass transition temperature (tg)
of cured epoxy samples. Sample weights varied between measurements from 3.9 to 12.6
mg. Measurements were carried out at a heating rate of 4°C/min between the temperature
range from 25°C to 200°C under nitrogen environment. The machine was first
equilibrated at 25°C, after which the measurement process was composed of three cycles:
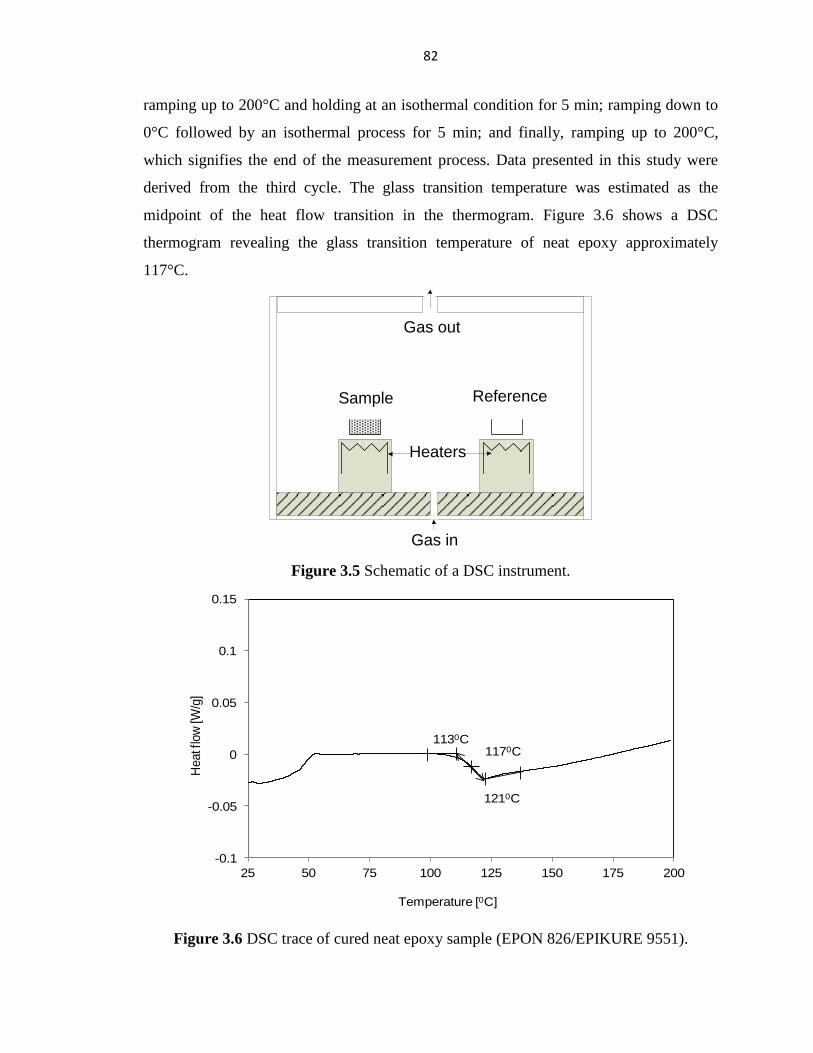
82
ramping up to 200°C and holding at an isothermal condition for 5 min; ramping down to
0°C followed by an isothermal process for 5 min; and finally, ramping up to 200°C,
which signifies the end of the measurement process. Data presented in this study were
derived from the third cycle. The glass transition temperature was estimated as the
midpoint of the heat flow transition in the thermogram. Figure 3.6 shows a DSC
thermogram revealing the glass transition temperature of neat epoxy approximately
117°C.
Figure 3.5 Schematic of a DSC instrument.
Figure 3.6 DSC trace of cured neat epoxy sample (EPON 826/EPIKURE 9551).
E-12E-13
ReferenceSample
Gas in
Gas out
Heaters
-0.1
-0.05
0
0.05
0.1
0.15
25 50 75 100 125 150 175 200
Heat f
low
[W/g
]
Temperature [0C]
1130C
1210C
1170C

83
3.6 FOURIER TRANSFORM INFRARED SPECTROSCOPY
Fourier transform infrared (FTIR) spectroscopy is a method that involves the
absorption/emission of infrared radiation of the electromagnetic spectrum by a material
(i.e. solid, liquid or gas). IR spectroscopy can identify the chemical structure in a
compound and provides information pertaining to its compositions, chemical bonds,
functional groups and degree of branching. Molecules are composed of atoms that are
constantly vibrating. The absorption of infrared radiation occurs when the frequency of
vibrating atoms in a molecule equals the frequency of infrared radiation. The absorption
of specific IR radiation by a molecule can therefore be associated with its molecular
structure. A particular molecule can have many different vibrational modes (e.g.
symmetric or asymmetric stretching and in plane or out of plane bending), but absorption
only takes place for vibrations that cause an oscillating dipole moment [3]. In principle,
the Fourier transform method generates absorbance or transmittance spectra from the
recorded scans done on the sample with an infrared light for the specified wavelength
range. The frequency of electromagnetic radiation is directly related to energy. The
energy of a photon can be expressed by Planck’s equation [3].
(3.2)
where h is the Planck’s constant (6.626×10⁻³⁴
J.s), c is the velocity of light (2.998×10⁸
m/s), υ0 is the frequency of radiation and is the wavenumber, which is reciprocal of the
wavelength of radiation.
FTIR was performed at a Nicolet Magna 750 FTIR spectrometer (Nicolet Instrument
Corporation, Madison, Wisconsin, USA) connected to a Nic-Plan microscope. Infrared
spectra of neat epoxy and epoxy blends containing certain weight fraction of block-
copolymer were acquired. Cured epoxy specimens were placed onto a KBr plate and run
at a resolution of 4 cm-1
. About 32 scans were performed for each sample. The specimen
surfaces were initially smoothened before placing on the KBr plate. Figure 3.7 shows the
IR spectrum of neat epoxy after curing. In the FTIR spectrum the infrared radiation is
expressed by the wavenumber between 650 cm-1
and 4000 cm-1
. The following
characteristic absorption bands are identified from infrared spectrum [4-5]. The O-H
stretching vibration band is specified in the region of 3200-3600 cm-1
, which is centered
at 3411 cm-1
. Stretching vibration bands of methyl and methylene (C-H) groups occur at

84
2963, 2928 and 2870 cm-1
. The C=O stretching absorption peak is found at 1709 cm-1
.
Absorption bands at 1607, 1581 and 1508 cm-1
are suggestive of aromatic (C=C)
stretching vibration. The absorption band at 1104 cm-1
can be assigned to C-N stretching.
Stretching vibration bands of aromatic and aliphatic ethers (C-O-C) are specified at 1245
and 1035 cm-1
, respectively. Out of plane bending of a p-substituted phenyl ring is
represented by 827 cm-1
band. Spectral data further reveals the disappearance of the
characteristic absorption peaks 3056 (stretching) and 915 cm-1
(bending) bands [5]
associated with the epoxy group as a result of the epoxy curing reaction.
Figure 3.7 FTIR spectrum of cured neat epoxy (EPON 826/EPIKURE 9551).
3.7 DYNAMIC MECHANICAL THERMAL ANALYSIS
The viscoelastic properties of a polymer can be characterized by dynamic mechanical
analysis. If a viscoelastic material is subjected to variable loading by an oscillating
sinusoidal force (stress σ), it is known that the resultant displacement response (strain ε)
will be out of phase (i.e. phase lag) to the stress [3, 6]. The conditions can be expressed as
follows [3].
0
0.05
0.1
0.15
0.2
0.25
0.3
5001000150020002500300035004000
Abso
rbance
Wavenumbers (cm-1)
O-H
C-N
C-H
C=C
C=O
C-O-C
p-substituted phenyl ring

85
(3.3)
where ω is the angular frequency, t is the time and δ is the phase lag. The out of phase
and in phase components of stress can be used to determine the complex modulus of a
material, that is, the storage modulus, Es=(σ0/ε0)cosδ, and the loss modulus,
El=(σ0/ε0)sinδ, which represent the elastic and viscous energy portions, respectively. The
tanδ provides information on the damping behavior of the material. A schematic diagram
of a dynamic mechanical thermal analysis (DMTA) system, loading mode and specimen
geometry are shown in Figure 3.8.
Figure 3.8 (a) A schematic of the DMA 8000 instrument and mode of testing [7] and (b)
epoxy specimens used for DMTA analysis.
Dynamic mechanical thermal analysis of fully cured epoxy samples was performed on a
DMA 8000 dynamic mechanical analyzer (PerkinElmer, Waltham, Massachusetts, USA).
The present study involved two separate testing procedures to measure the stiffness and
Single cantilever bending
(a)(b)

86
damping behavior of the neat and filled epoxy. In one method the specimen stiffness as a
function of modulus and geometry was measured at a constant frequency in an isothermal
condition. In another approach the specimen temperature was varied while maintaining a
constant frequency. The DMTA experiments were performed under single cantilever
bending mode of the DMA 8000 analyzer having a working stiffness range of 2×10²
to
1×10⁸ N/m. Measurements were done at a heating rate of 5° C/min over a temperature
range of 25° C to 150° C. During the tests an oscillatory displacement with an amplitude
of 0.05 mm was applied at a fixed frequency of 1 Hz. A specimen dimension of 20 by 8
by 1 mm was chosen according to standard ASTM D 4065-06 [8]. The dynamic storage
modulus and glass transition temperate were determined. The glass transition was taken
as the peak position representing a prominent change in the tanδ curve. At this
temperature the polymer chains acquired sufficient mobility to move past each other.
Figure 3.9 shows a typical DMTA curve. From this plot the glass transition temperature
and storage modulus (at room temperature) were estimated as 122°C and 2.41 GPa,
respectively.
Figure 3.9 DMTA analysis showing storage modulus and tanδ curves of modified epoxy
containing 5 wt% M52 block-copolymer.

87
3.8 TENSILE TEST
Uniaxial tensile testing was conducted using dog-bone specimens by conforming to the
procedure mentioned in the standard ASTM D 638-03 [9]. A representative schematic of
the tensile test specimen is shown in Figure 3.10. Tensile testing was performed on a
MTS 810 (MTS Systems Corporation, Eden Prairie, Minnesota, USA) universal testing
machine, having MTS 647 axial hydraulic wedge grips and a Teststar™ s controller.
The MTS machine has a maximum dynamic and static force capacity of 100 and 120 kN,
respectively [10]. Samples were tested either under load or under displacement control
mode. Under load control conditions a constant loading rate of 4.5 N/s was applied, and
the load cell was adjusted for a maximum load of 4.5 kN before sample failure. For the
given samples this loading rate is equivalent to an initial displacement rate of ~5×10⁻³
mm/s, but increases as testing progresses. This loading rate was chosen in accordance
with testing done on the same epoxy system by previous researchers [11-12]. Some
samples were tested also at stroke control condition at 8.33×10⁻³
mm/s, which
corresponds to an initial loading rate of ~11 N/s that decreases with time. During
mounting in the hydraulic griping system, vertical alignment of the specimen was
carefully adjusted. A MTS 634.12E-24 axial extensometer was attached to the specimen
by MTS Quick-Attach springs. Model 634.12E-24 has a gauge length of 25 mm and
maximum strain range of -10% to 50%. To protect the specimen from extensometer knife
edge penetration, small pieces of cloth were bonded at the point of contact to the
specimen using M-Bond strain gauge adhesive. The force, displacement and auxiliary
strain signals were acquired. In this study true tensile stress and tensile strain at break
were determined from Equation (3.4).
(3.4)
where σ and ε are the engineering stress and strain, respectively. The modulus was
estimated from the slope of the linear section of the stress-strain curve. Figure 3.11 shows
the MTS 810 testing machine and few of the tested specimens. Slight differences in
tensile test results were observed between two different loading conditions. For neat
epoxy the average modulus, tensile strength and strain at break were estimated to be 2.82
GPa, 82.2 MPa and 8.53 % and 2.88 GPa, 73.3 MPa and 8.5 % respectively from the load

88
and displacement control tests. Material yielding was observed in the displacement
control test. This behavior is reflective of the viscoelastic nature of the polymer due to the
strain rate dependency as shown in the true stress-strain curves of Figure 3.12. A previous
study done with the same EPON 826/ EPIKURE 9551 epoxy system demonstrated its
nonlinear viscoelastic behavior that is dependent on the loading rate [13]. Any discretion
regarding the viscoelastic nature of the present epoxy system was not made, as it was not
the intension of this study. Though, the differences in resin property between the two test
methods were obvious, but can be regarded negligible, for example variation in modulus
was about 2%. To be consistent in the use of tensile test results, the load control test data
were used throughout this thesis and stroke control results were limited in use only to the
study of epoxy hybrid nanocomposites.
Figure 3.10 Geometry of the tensile test specimen (dimensions in millimeters).
Figure 3.11 (a) Tensile testing setup and (b) failed specimens after tensile testing.
(a) (b)

89
Figure 3.12 Typical stress-strain response of the neat epoxy sample (EPON
826/EPIKURE 9551).
3.9 MODE-I FRACTURE TOUGHNESS TEST
Plane-strain fracture toughness tests were performed according to the standard
ASTM D5045-99 to determine fracture toughness, KIC, and strain energy release rate, GIC, of
the nanocomposite samples [14]. The single edge notch bend (SENB) geometry (see Figure
3.13) was chosen, and testing was performed on a MTS 810 universal testing machine by
three-point bending. It is known that the fracture toughness of a material is dependent on the
testing rate and temperature [15]. In this study all the tests were done at room temperature
with a crosshead speed of 0.2 mm/min.
Two methods were chosen to pre-crack specimens prior to the testing (see Figure 3.14). In
the first method a single-sided razor blade was attached to a previously designed jig (please
refer to reference [12]), and mounted onto the MTS machine. A SENB specimen was then
placed on a flat metal base stationed on the opposite arm of the MTS machine. The razor
blade was then vertically inserted inside the machined notch and finally pressed down to a
depth of 1 mm at the notch tip at a loading rate of 0.2 mm/min. This generated a blunt crack
as shown in Figure 3.15(a). The blunt crack length was kept to a minimum, i.e. not deeper
than 1 mm, because further penetration of the razor blade generated a wedge like motion at
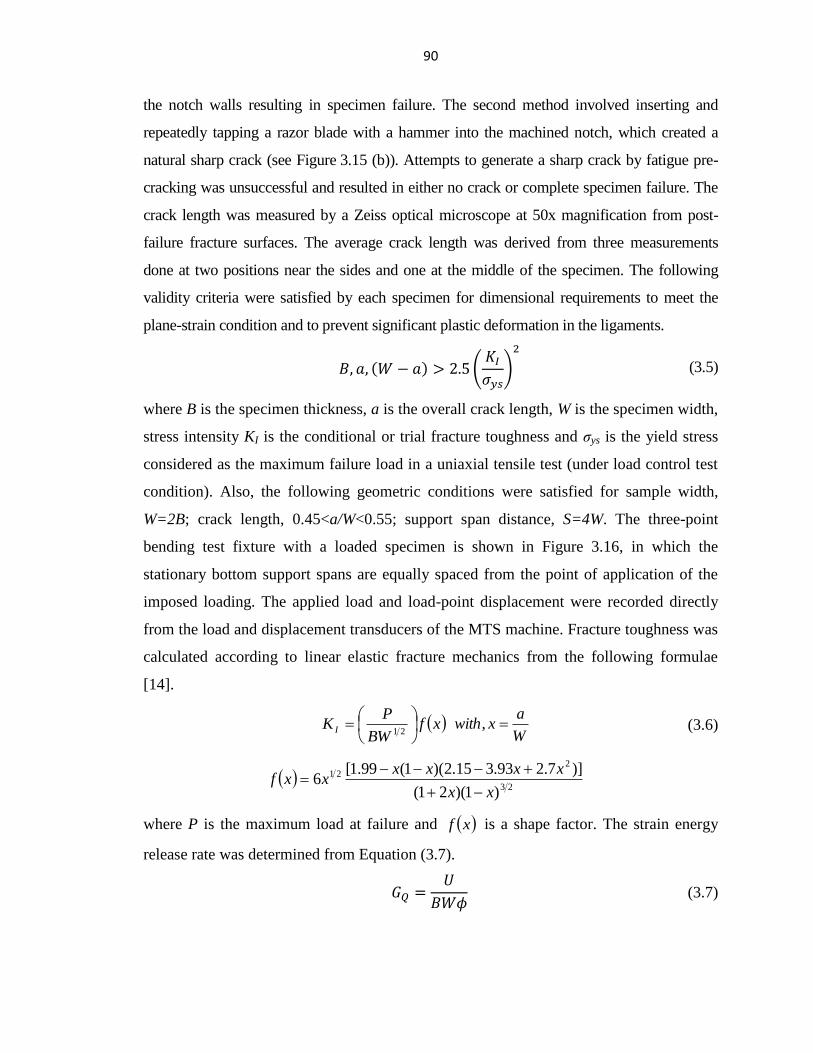
90
the notch walls resulting in specimen failure. The second method involved inserting and
repeatedly tapping a razor blade with a hammer into the machined notch, which created a
natural sharp crack (see Figure 3.15 (b)). Attempts to generate a sharp crack by fatigue pre-
cracking was unsuccessful and resulted in either no crack or complete specimen failure. The
crack length was measured by a Zeiss optical microscope at 50x magnification from post-
failure fracture surfaces. The average crack length was derived from three measurements
done at two positions near the sides and one at the middle of the specimen. The following
validity criteria were satisfied by each specimen for dimensional requirements to meet the
plane-strain condition and to prevent significant plastic deformation in the ligaments.
(
)
(3.5)
where B is the specimen thickness, a is the overall crack length, W is the specimen width,
stress intensity KI is the conditional or trial fracture toughness and σys is the yield stress
considered as the maximum failure load in a uniaxial tensile test (under load control test
condition). Also, the following geometric conditions were satisfied for sample width,
W=2B; crack length, 0.45<a/W<0.55; support span distance, S=4W. The three-point
bending test fixture with a loaded specimen is shown in Figure 3.16, in which the
stationary bottom support spans are equally spaced from the point of application of the
imposed loading. The applied load and load-point displacement were recorded directly
from the load and displacement transducers of the MTS machine. Fracture toughness was
calculated according to linear elastic fracture mechanics from the following formulae
[14].
xf
BW
PK I
21
W
axwith , (3.6)
23
221
)1)(21(
)]7.293.315.2)(1(99.1[6
xx
xxxxxxf
where P is the maximum load at failure and xf is a shape factor. The strain energy
release rate was determined from Equation (3.7).
(3.7)

91
where U is the energy estimated by integrating the area under the load versus load-point
displacement curve and the energy calibration factor ϕ can be expressed as.
(3.8)
[
] [
]
[
] [ ]
[
] [
]
An alternative to the above procedure is to use the equation, ;
where E and υ are respectively the modulus and Poisson’s ratio.
Figure 3.13 A schematic of the single edge notch bend specimen (dimensions in
millimeters).

92
Figure 3.14 Pre-cracking arrangements for (a) blunt crack and (b) sharp crack.
Figure 3.15 Pre-crack configurations: (a) blunt crack and (b) sharp crack.
Figure 3.16 Mode-I fracture toughness testing of bulk epoxy nanocomposite.
(a) (b)

93
3.10 MODE-I INTERLAMINAR FRACTURE TOUGHNESS TEST
The mode-I interlaminar fracture toughness, GIC, of double-cantilever beam (DCB)
specimens was estimated according to the ASTM D 5528-01 standard [16]. The specimen
configuration is shown in Figure 3.17. The specimen thickness and initial delamination
length were chosen to satisfy the following criteria specified in the ASTM standard.
√
(3.9)
(
)
where ao is the initial delamination length, h0 specimen thickness and E1 is the longitudinal
lamina modulus estimated by strength of materials approach. All tests were performed under
displacement control on the MTS 810 universal tester with a constant displacement rate. A
specimen was mounted horizontally with both arms of the attached hinges gripped by the
hydraulic wedge grips of the MTS machine. To visually measure crack propagation, starting
from the insert film edge, one side of each specimen was marked at 1 mm increments for the
first 5 mm and subsequently at 5 mm increments for the next 45 mm, see Figure 3.18.
Initially, a 5 mm increase in the delamination length was allowed to grow from the edge of
the starter film insert at a crosshead speed of 2.5 mm/min followed by unloading at a rate of
25 mm/min. Afterwards, the sample was delaminated to a length of 50 mm from the insert
edge at a reloading speed of 2.5 mm/min, and subsequently unloaded at 5 mm/min. During
the test, load and opening mode displacement values were recorded, see Figure 3.19 for a
neat epoxy laminate. Delamination was visually observed and recorded in the load-
displacement data points to measure the initiation value of GIC as well to calculate the energy
required for steady-state crack propagation. The strain energy release rate was determined
using three different data reduction methods. According to the modified beam theory (MBT)
the following formula was used to calculate the strain energy release rate.
| | (3.10)
where P1 is the load, δ1 is the load-point displacement, b is the specimen width, a1 is the
delamination length and Δ is the delamination correction factor determined as the x-axis
intercept of the C1/3
versus a1 plot. The compliance, C, is defined as the ratio of the load-point

94
displacement to the applied load, δ1/P1 (see Figure 3.20 (a)). As stated in the compliance
calibration (CC) method the opening mode-I interlaminar fracture toughness was determined
from the following expression.
(3.11)
where n1 is the slope of a least square plot of log (δ1/P1) versus log(a1) obtained by using the
data points for the delamination onset and propagation values (see Figure 3.20 (b)). In
accordance with the modified compliance calibration (MCC) method the mode-I interlaminar
fracture toughness was calculated as follows.
⁄
(3.12)
where h0 is the thickness of the specimen and A1 is taken as the slope of a plot of a1/h0 with
respect to the cube root of compliance C1/3
(see Figure 3.20 (c)).
In this study, two crack initiation values were measured for each laminate. One of the crack
initiation values, termed ‘ L’, represents the point at which nonlinearity in the load-
displacement curve becomes apparent. The visually observed delamination initiation point,
termed ‘ ’, was taken as the point corresponding to a 1 mm crack extension though the
laminate. In Figure 3.21, a delamination resistance curve was plotted with fracture energy
values calculated from different methods. In the present study the modified beam theory
method was ultimately chosen for estimating the mode-I interlaminar fracture toughness of
fiber-reinforced laminates.
Figure 3.17 A schematic of the double-cantilever beam specimen.
120 mm
20 m
m
h
Film
insert
Piano
hinge
Laminate
50 mm

95
Figure 3.18 Mode-I interlaminar fracture toughness testing of fiber-reinforced
nanocomposite laminates.
Figure 3.19 Load-displacement curves of the DCB test specimen (neat epoxy).
0
10
20
30
40
50
60
0 10 20 30 40 50
Load [N
]
Displacement [mm]
loading
loading
unloading
unloading

96
Figure 3.20 Data reduction procedures employed: (a) modified beam theory, (b)
compliance calibration and (c) modified compliance calibration.
Figure 3.21 Resistance curves obtained from different data reduction methods.
-4
-3.8
-3.6
-3.4
-3.2
-3
-2.8
-2.6
-2.4
-2.2
-2
1.6 1.7 1.8 1.9 2 2.1
log
(C)
log(a1)
Slope, n
0
0.02
0.04
0.06
0.08
0.1
0.12
-50 50 150
C1
/3 [m
/N]1
/3
a1 [mm]
Intercept, Δ
10
12
14
16
18
20
22
24
26
0.03 0.08 0.13
a1/h
0[/
]
C1/3 [m/N]1/3
Slope, A1
(a) (c)(b)
0
100
200
300
400
500
600
700
40 60 80 100 120
De
lam
ina
tion
en
erg
y [J/m
2]
Delamination length [mm]
MBT method
CC method
MCC methodNL
VIS
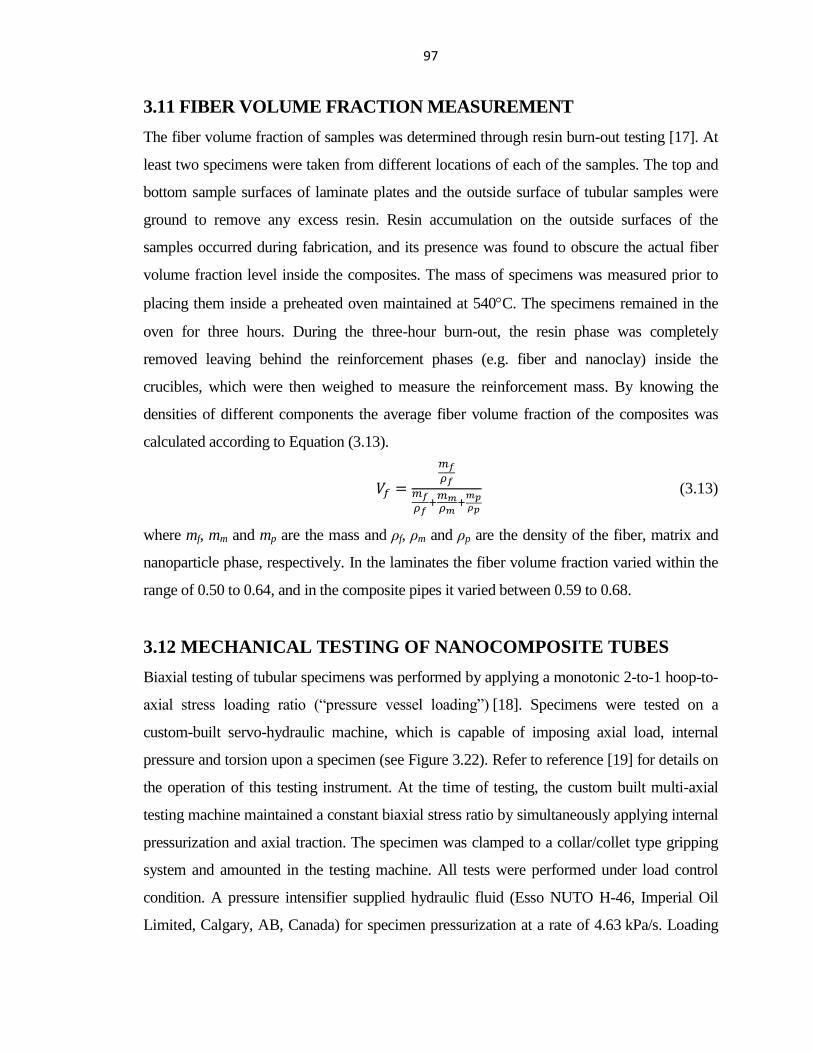
97
3.11 FIBER VOLUME FRACTION MEASUREMENT
The fiber volume fraction of samples was determined through resin burn-out testing [17]. At
least two specimens were taken from different locations of each of the samples. The top and
bottom sample surfaces of laminate plates and the outside surface of tubular samples were
ground to remove any excess resin. Resin accumulation on the outside surfaces of the
samples occurred during fabrication, and its presence was found to obscure the actual fiber
volume fraction level inside the composites. The mass of specimens was measured prior to
placing them inside a preheated oven maintained at 540C. The specimens remained in the
oven for three hours. During the three-hour burn-out, the resin phase was completely
removed leaving behind the reinforcement phases (e.g. fiber and nanoclay) inside the
crucibles, which were then weighed to measure the reinforcement mass. By knowing the
densities of different components the average fiber volume fraction of the composites was
calculated according to Equation (3.13).
(3.13)
where mf, mm and mp are the mass and ρf, ρm and ρp are the density of the fiber, matrix and
nanoparticle phase, respectively. In the laminates the fiber volume fraction varied within the
range of 0.50 to 0.64, and in the composite pipes it varied between 0.59 to 0.68.
3.12 MECHANICAL TESTING OF NANOCOMPOSITE TUBES
Biaxial testing of tubular specimens was performed by applying a monotonic 2-to-1 hoop-to-
axial stress loading ratio (“pressure vessel loading”) [18]. Specimens were tested on a
custom-built servo-hydraulic machine, which is capable of imposing axial load, internal
pressure and torsion upon a specimen (see Figure 3.22). Refer to reference [19] for details on
the operation of this testing instrument. At the time of testing, the custom built multi-axial
testing machine maintained a constant biaxial stress ratio by simultaneously applying internal
pressurization and axial traction. The specimen was clamped to a collar/collet type gripping
system and amounted in the testing machine. All tests were performed under load control
condition. A pressure intensifier supplied hydraulic fluid (Esso NUTO H-46, Imperial Oil
Limited, Calgary, AB, Canada) for specimen pressurization at a rate of 4.63 kPa/s. Loading

98
was continued until ultimate specimen failure (i.e. structural failure). The data acquisition
system permitted recording of hoop and axial strains, axial load and stroke, internal pressure
and pressure intensifier volume. Applied hoop and axial stresses were estimated by applying
the principle of thin-wall membrane theory [18]. Hoop and axial stresses were calculated
according to Equations (3.14) and (3.15).
0
0
2
2
t
ptppD ooi
H
(3.14)
0000
00
2
4
4
tDt
F
tDt
tDptppD ooi
A
(3.15)
where D is the internal pipe diameter, t0 is the wall thickness, pi and F are the internal
pressure and axial force applied to the pipe, and po is the atmospheric pressure.
Figure 3.22 (a) Multi-axial testing instrument, and (b) structurally failed tubular test
specimens.
Typical stress-strain curves are presented in Figure 3.23 for a tube sample subjected to a
biaxial loading condition. The radial stress component was ignored in this study
considering its comparatively small magnitude and the use of thin-wall membrane
geometry. From the recorded intensifier fluid volume, the cumulative fluid volume loss
was calculated that transmitted though the micro-cracked pipes (i.e. fluid volume loss).
The fluid volume loss data was corrected for compressibility of the hydraulic fluid and
Pipe specimen
(a) (b)

99
expansion effects of the specimen and the testing machine’s hydraulic system (e.g.
hoses). Figure 3.24 shows intensifier fluid volume and fluid volume loss data with
corresponding intensifier pressure for a composite pipe made with an epoxy polymer
containing 3 wt% of M52N block-copolymer.
Figure 3.23 Global biaxial stress-strain response of filament-wound tube made with an
epoxy polymer containing 3 wt% of M52N block-copolymer.
3.13 DETECTION OF PIPE FAILURES
Quantification of previously mentioned failure events was critical as this would typically
standardize the performance of the composite pipes for their intended service condition.
To identify functional and structural failure events from the same test setup, each pipe
sample was fitted with an internal rubber bladder, which enabled pressurization until
catastrophic pipe failure. Prior to testing, the inside of a rubber bladder as well as the
annular region in between the pipe and the bladder were filled with hydraulic fluid.
Pressurization occurred from inside the bladder. In the course of the experiment, the
initiation, accumulation and coalescence of matrix cracks provided pathways for fluid to
escape through the composite structure. In this study, functional failure in the form of
leakage was characterized by a prescribed fluid loss volume through the tube wall (i.e. a
loss corresponding to 1% of the internal pipe volume). After a certain amount of fluid

100
loss from the annulus, the inflating rubber bladder provides a seal inside the specimen.
Pressurization was continued until rapid loss of fluid indicating pipe burst (i.e. structural
failure) was ascertained from the hydraulic system.
Figure 3.24 Fluid volume versus intensifier pressure for tube tested under biaxial
loading.
REFERENCES
1. Utracki, L.A., 2004. Clay-Containing Polymeric Nanocomposites. Shawbury:
Rapra Technology Limited.
2. EGERTON, R.F., 2005. Physical principles of electron microscopy: an
introduction to TEM, SEM, and AEM. New York: Springer.
3. Young, R.J. and Lovell, P.A., 2011. Introduction to polymers. Boca Raton: CRC
press.
4. MERTZEL, E. and KOEING, J.L., 1986. Application of FT-IR and NMR to
epoxy resins. Advances in Polymer Science, 75, pp. 73-112.
5. NIKOLIC, G., ZLATKOVIC, S. CAKIC, M., CAKIC, S., LACNJEVAC, C. and
RAJIC, Z., 2010. Fast Fourier transform IR characterization of epoxy GY systems
crosslinked with aliphatic and cycloaliphatic EH polyamine adducts. Sensors, 10, pp.
684-696.
101
6. Meyers, M. A. and Chawla, K.K., 2009. Mechanical Behavior of Materials (2nd
Edition). Cambridge University Press.
7. Product literature (Brochure), DMA 8000 Dynamic Mechanical Analyzer, Perkin
Elmer.
8. Standard practice for plastics: dynamic mechanical properties: determination and
report of procedures, ASTM D 4065-06, ASTM international, West Conshohocken, PA,
USA.
9. Standard test method for tensile properties of plastics, ASTM D 638-10, ASTM
international, West Conshohocken, PA, USA.
10. Technical data, MTS 810 & 856 material testing systems, MTS Systems
Corporation.
11. Hu, Y., Multiaxial behavior and viscoelastic constitutive modeling of epoxy
polymers. PhD Thesis, University of Alberta, Edmonton, Alberta, 2002.
12. Brown, G.M., Mechanical properties of Alumina/Epoxy nanocomposites:
influence of processing and processing induced inhomogeneities. MSc Thesis, University
of Alberta, Edmonton, Alberta, 2004.
13. HU, Y., XIA, Z. and ELLYIN, F., 2003. Deformation Behavior of an Epoxy
Resin Subject to Multiaxial Loadings. Part I: Experimental Investigations. Polymer
Engineering and Science, 43(3), pp. 721-733.
14. Standard test methods for plane-strain fracture toughness and strain energy release
rate of plastic materials, ASTM D 5045-99, ASTM international, West Conshohocken,
PA, USA.
15. GARG, A.C. and MAI, Y.-W., 1988. Failure mechanisms in toughened epoxy
resins-A review. Composites Science and Technology, 31(3), pp. 179-223.
16. Standard test method for mode I interlaminar fracture toughness of unidirectional
fibre-reinforced polymer matrix composites, ASTM D 5528-01, ASTM international,
West Conshohocken, PA, USA.
17. Mertiny, P. and Ellyin, F., 2002. Influence of the filament winding tension on
physical and mechanical properties of reinforced composites. Composites Part A, 33, pp.
1615-1622.

102
18. SODEN, P.D., KITCHING, R., TSE, P.C., TSAVALAS, Y. and HINTON, M.J.,
1993. Influence of winding angle on the strength and deformation of filament-wound
composite tubes subjected to uniaxial and biaxial loads. Composites Science and
Technology, 46(4), pp. 363-378.
19. ELLYIN, F. and WOLODKO, J., 1997. TESTING FACILITIES OF
MULTIAXIAL LOADING OF TUBULAR SPECIMENS. ASTM Special Technical
Publication 1997, pp. 7-24.

103
Chapter 4
Morphology, Mechanical and Fracture Properties of Epoxy-clay
Nanocomposites1
SYNOPSIS: The effects of organic modifier and processing method on morphology and
mechanical properties of epoxy-clay nanocomposites were investigated and discussed in this
chapter. Unmodified and alkylammonium-ion-exchanged clay were used to produce
nanocomposites involving two different processing methods. In this study, the preparation of
nanocomposites by exfoliation-adsorption method was accomplished using an ultrasonic
mixing procedure, and mechanical blending was used for in-situ intercalative polymerization.
The study of nanocomposite microstructure revealed that the organoclay, which was
ultrasonically mixed with the epoxy was partially exfoliated and intercalated inside the
polymer matrix. On the other hand, organoclay remained in a phase-separated and
flocculated state after the mechanical blending process. The tensile stiffness of resulting
nanocomposites increased for both dispersion techniques. Stiffness increased significantly for
the ultrasonic dispersion method by realizing the reinforcing potential of exfoliated silicate
layers. However, tensile strength decreased slightly and ductility reduced significantly.
During plane-strain fracture testing nanocomposites with exfoliated and intercalated nanoclay
morphology was found to be ineffective in enhancing the fracture toughness.
Nanocomposites with intercalated and phase-separated morphology, on the other hand, had
improved crack resistance predominantly by crack deflecting and crack pinning mechanisms.
4.1 INTRODUCTION
Polymer nanocomposites have unique multifunctional properties that distinguish them from
traditional polymer microcomposites. Recently it has been demonstrated that nano-scale
dispersion of layered silicate in relatively small quantities can significantly enhance the
1 A version of this chapter has been submitted for publication: BASHAR, M., SUNDARARAJ, U. and
MERTINY, P., 2013. Effect of nanoclay structures on fracture behavior of epoxy-clay nanocomposites
prepared by different dispersion methods. Journal of Applied Polymer Science.

104
properties of a substrate polymer [1-3]. Having high aspect ratio, large surface area and good
interfacial properties, layered silicate clay added to a polymer matrix can contribute to
significant cost savings as a property enhancer. Clay-containing polymer nanocomposites
may offer beneficial properties, such as good mechanical properties [1-2, 4-9], dimensional
stability, barrier properties [2, 4], flame retardancy [4, 10], optical properties and thermal
stability [1-2, 4]. In pursuit of optimized property enhancements, this area of nanoscience has
been extensively studied with polymers such as epoxy, unsaturated polyester, polystyrene,
polyimide, polypropylene and polyurethane [11].
Typically polymer clay nanocomposites exhibit three distinct morphologies, i.e. phase-
separated, intercalated and exfoliated structures [3, 11]. Superior mechanical, thermal and
barrier properties are usually obtained for an exfoliated architecture, i.e. individual silicate
lamellae are homogenously distributed in the polymer matrix. However, achieving complete
exfoliation is difficult because of the layered silicate’s tendency to form aggregates due to
such forces as electrostatic attraction and van der Waals force [12-13]. Surface modifiers
such as alkylammonium ions can promote organophilic characteristics in the layered silicate,
thereby making it more compatible with epoxy and the curing agent, which also provides a
catalytic influence on the polymerization reaction [10, 12]. The key to a successful formation
of exfoliated nanocomposites is faster rates of intragallery polymerization due to the catalytic
effect of the surface modifiers compared to rates for competing extragallery reactions [14].
The effect of alkylammonium ion modification on the mechanism of clay intercalation and
exfoliation has been studied extensively by several researchers [12, 15-17]. The degree of
clay exfoliation and intercalation also depends on the type of clay [8, 12], cation exchange
capacity [16, 18], chemical nature of the interlayer cations [7-10, 12], curing agent [6, 15],
curing temperature and time [9, 12, 15, 19], resin type [19-20] and dispersion method [21-
22]. As mentioned earlier, there are several processing routes that can lead to well dispersed
layered silicate nanocomposite; these are in-situ intercalative polymerization [7, 18],
exfoliation-adsorption [10, 23] and melt processing [21].
Individual silicate layers provide excellent stiffness and strength in two dimensions due to
their high aspect ratio, stiffness and interaction at the molecular level. Lan and Pinnavaia [5]
and Pinnavaia et al. [13] attributed the exceptional increase in the stiffness of nanocomposites
in an exfoliated state to a reinforcing effect through stress transfer to the rigid individual

105
silicate nano-sheets. Likewise, Messersmith and Giannelis [6] observed significant
improvement in the dynamic storage modulus when dispersing organoclay into an epoxy
matrix. Up to now, various researchers have documented similar enhancement in epoxy
mechanical properties; notably Kornmann et al. [7, 9], Zilg et al. [8], Xidas et al. [17], Becker
et al. [20], Miyagawa and Drzal [23], Zerda and Lesser [24], Yasmin et al. [25] and Kinloch
and Taylor [26] all recognized stiffness increase in the epoxy-clay nanocomposites.
Furthermore, nanoclay has the ability to simultaneously increase toughness and stiffness of a
polymer. This is highly advantageous compared to, for example, rubber toughened epoxy,
where toughness is increased at the expense of other thermo-mechanical properties (i.e.
stiffness and glass transition temperature). In a study, Zilg et al. [8] achieved good balance
between toughness/stiffness improvements in nanocomposites comprised of anisotropic
laminated nanoparticles instead of exfoliated clay platelets. According to these researchers,
the intercalated and/or phase-separated clay particles would be more effective in impeding
crack propagation than the delaminated isolated clay platelets. Similarly, Kornmann et al. [7]
showed that conventionally filled epoxy-clay composites resulted in the best toughening
effect, and Miyagawa and Drzal [23] inferred that larger intercalated organoclay particles
provided better fracture resistance than the exfoliated platelets. Moreover, Becker et al. [20]
and Siddiqui et al. [27] demonstrated increase in polymer fracture toughness with a mixture
of mostly intercalated and exfoliated organoclay in epoxy. Studies conducted so far on the
fracture and deformation mechanisms of nanoclay-filled epoxy have qualitatively shown
evidence of crack deflection, crack pinning, cavitation and matrix deformation phenomena
that improved crack propagation resistance in nanocomposites [22, 24, 28-29]. Zerda and
Lesser [24] documented crack deflection and branching by intercalated nanoclay diverting
cracks in a tortuous path while creating additional fracture surface area. In epoxy-clay
nanocomposites, formation of microcracks from within the clay interlayers and subsequent
propagation associated with the creation of new surface area due to crack deflection were
considered to be the primary energy dissipation mechanism by Wang et al. [28]. Liu et al.
[29] identified several crack resistance phenomena, particle-matrix interfacial debonding,
microvoiding, matrix shear yielding and crack deflection to work cooperatively in an
intercalated nanocomposite. Liu et al. [22] showed crack pinning and crack-tip blunting (e.g.

106
localized matrix deformation) mechanisms to function together or separately in different
nanoclay-filled epoxy systems made by various preparation techniques.
The above literature review clearly demonstrates considerable disagreement and differences
in opinion among researchers on the operative crack resistance mechanism in epoxy
nanocomposites and its dependence on the nanoclay morphology (i.e. exfoliated, intercalated
and particulate). Nanocomposite processing in fact affects the organoclay dispersion and its
microstructure, and consequently has pronounced influence on the fracture micromechanism.
Therefore, the need for a systematic evaluation from processing to microstructure evolution
associated with final mechanical property development of the micro/nano composites derived
from organoclay would necessitate further study. In this section of the thesis the effect of the
processing/mixing method and the contribution of the organic modifier on the epoxy-clay
nanocomposite dispersion were investigated. Different characterization and experimental
techniques were involved to study the morphology and mechanical properties of resulting
nanocomposites. A correlation between mircostructural and mechanical properties of the
nanocomposites prepared by in-situ intercalative polymerization and exfoliation adsorption
processes was observed.
4.2 RESULTS AND DISCUSSION
4.2.1 Morphology of the Epoxy-clay Nanocomposites
The microstructure of epoxy nanocomposites was studied by WAXD and TEM. The epoxy-
clay nanocomposites were prepared according to the synthesis methods described in the
Sections 2.2.1.1 and 2.2.1.2. XRD traces of the unmodified clay (PGW) and the primary
(I.30E) and quaternary (I.28E) alkylammonium ion treated nanoclays are shown in
Figure 4.1. Interlayer spacing of the nanoclay was estimated from the 2θ angle of the peak in
the XRD curve. Using the prominent diffraction peak, the d-spacing, d001, was estimated as
1.24 nm, 2.23 nm and 2.39 nm for the PGW, 1.30E and I.28E clays respectively. X-ray
diffraction patterns of the I.30E organoclay and a mixture of nanoclay-epoxy (by ultrasonic
mixing) containing 1 wt% layered silicate are shown in Figure 4.2. Before curing, the
blending of epoxy resin with acetone and clay using ultrasonic dispersion promoted
interdiffusion of epoxy pre-polymer in between the clay galleries. Swelling of the silicate

107
layers with epoxy expanded the interlayer distance, thereby shifted the XRD peak to the left,
where d001 = 3.15 nm. However, the reflection completely disappeared in the case of cured
I.30E-epoxy nanocomposites.
Figure 4.1 Typical X-ray diffraction peaks of the organoclay and unmodified clay.
Figure 4.3 presents XRD traces of the nanocomposites that were prepared by the ultrasonic
mixing technique, with each nanocomposite containing 1 wt% of the respective clays. The
diffraction peak of the inorganic PGW clay remains unaltered and overlaps with the lower
angle scattering peak of the epoxy polymer showing an overall peak broadening effect, but
also indicates that this nanocomposite has a phase-separated morphology. A phase-separated
morphology implies that the epoxy resin was not able to effectively penetrate between the
clay platelets. This type of morphology is normally expected for untreated clays. The absence
of a reflection peak for the nanocomposite containing the I.30E clay signifies either an
exfoliated or an intercalated structure with interlayer distance exceeding 8.83 nm (which is
0
500
1000
1500
2000
2500
0 5 10 15
Inte
nsity (
co
un
ts)
Two-theta (deg)
I.30E, d001 = 2.23 nm
I.28E, d001 = 2.39 nm
PGW, d001 = 1.24 nm
d002

108
the detection limit for WAXD, i.e. 2θ ≥ 1). The epoxy nanocomposite that was reinforced
with the I.28E clay shows slightly expanded basal spacing of d001 = 2.85 nm, which was
estimated from its diffraction peak. The increase in layer separation from 2.39 nm to 2.85 nm
most likely occurred due to epoxy solvation that took place during the ultrasonic blending
phase. Pinnavaia et al. [13] reported a d-spacing of d001 = 3.69 nm when a similar quaternary
alkylammonium ion, CH3(CH2)17N(CH3)3+, exchanged clay was swollen by the epoxy resin.
In that study, the authors assumed that a reorientation of the quaternary onium ion occurred
from its usual lateral bilayer orientation to a vertical configuration that maximizes solvation
interaction with the epoxy. Initial solvation of the clay galleries is important for later
diffusion of the curing agent and the epoxide, and subsequent initiation of the intragallery
polymerization. The charge density of the clay and the chain length of the alkylammonium
ion are major controlling factors in epoxy solvation that determine migration and the amount
of epoxy resin that can occupy the intergallery space [12, 16].
Figure 4.2 XRD analysis results showing interlamellar spacing of nanoclay at various
stages of I.30E-epoxy nanocomposite processing: (a) organoclay, (b) organoclay in epoxy
resin before curing agent addition and (c) after cure.
0
200
400
600
800
1000
1200
0 5 10 15
Inte
nsity (
co
un
ts)
Two-theta (deg)
d001= 2.23 nm
d001= 3.15 nm
(c)
(b)
(a)

109
Figure 4.3 X-ray scattering traces of nanocomposites containing 1 wt% nanoclay in epoxy.
Figure 4.4 shows diffraction patterns of the cured epoxy nanocomposites containing various
weight fractions of the I.30E clay fabricated by the two different processing techniques. No
distinguishable diffraction peak was observed for the nanocomposites produced by ultrasonic
mixing containing 1 wt% and 2 wt% I.30E clay, but the composite having 3 wt% clay
showed a distinct peak revealing an interlayer spacing of d001 = 2.73 nm. In contrast,
mechanical mixing generated a combination of phase-separated and intercalated architectures
as evidenced by the broadening of the diffraction peak, which indicates significant variations
in the layer spacing among different clay particles. The scattering apex representing
interlayer spacing of d001 = 2.68 nm and 2.63 nm was found respectively for the 1 wt% and
3 wt% I.30E clay loadings. The possibility of an inclined orientation of the exchanged onium
ion is probable in these cases, and has been reported previously in the literature [12].
0
50
100
150
200
250
300
0 5 10 15
Inte
nsity (
co
un
ts)
Two-theta (deg)
I.28E-Epoxy
PGW-Epoxy
I.30E-Epoxy
d001 = 2.85 nm
d001 = 1.24 nm

110
Figure 4.4 X-ray diffraction patterns of nanocomposites: (a), (b) and (c) prepared by
ultrasonic dispersion and (d) and (e) by mechanical dispersion of I.30E clay.
Nanocomposites prepared by the ultrasonic dispersion method were transparent after curing
as shown in Figure 4.5. This means that the dispersed particles are quite small and/or the
concentrations were low enough not to significantly affect the scattering of visible light,
which has a wavelength between 380 to 740 nm in the electromagnetic spectrum. From the
TEM images in Figures 4.6 and 4.7 it is apparent that the mixing techniques have greatly
influenced the degree of the dispersion of I.30E nanoclay, that is, ultrasonic dispersion
produced partially exfoliated and intercalated nanocomposites (see Figure 4.6), whereas
mechanical dispersion formed mostly phase-separated and intercalated clay agglomerates
(see Figure 4.7). The nanocomposites prepared by the ultrasonic technique shown in Figure
4.6(a) displays exfoliated disordered individual 1 nm thick silicate platelets as well as
laminated parallel platelets with a layer separation of 10-15 nm for the 1 wt% I.30E-epoxy
0
50
100
150
200
250
300
350
0 5 10 15
Inte
nsity (
co
un
ts)
Two-theta (deg)
d001= 2.63 nm
d001= 2.68 nm
d001= 2.73 nm
(b)
(c)
(d)
(e)
1 wt% I.30E
3 wt% I.30E
2 wt% I.30E
3 wt% I.30E
1 wt% I.30E
(a)
d002
d002
d002

111
nanocomposite. In Figure 4.6(b) the nanocomposite containing 2 wt% I.30E also exhibits an
intercalated morphology. For the same nanocomposite system, randomly dispersed
submicron-size intercalated particles can be seen at lower magnification (see Figure 4.6(c)).
The samples made by mechanical mixing appear to retain its stacked layer structures as
tactoids as evidenced in Figure 4.7 for 1 and 2 wt% I.30E concentrations. This morphology
resembles the conventional phase-separated structures in clay in which clay tactoids are
attached together to from large agglomerates. TEM images in Figure 4.8 show an intercalated
morphology and randomly distributed clay tactoids in the epoxy that was modified with the
I.28E clay. Phase-separated and larger clay microaggregates are clearly visible in Figure 4.9
for the composite made with the unmodified PGW clay. The white areas shown in Figures
4.7(b) and 4.9(b) were formed during the ultra microtoming process due to severing of the
clay particles from the epoxy matrix.
Figure 4.5 Transparency of: (a) neat epoxy and nanocomposites containing 1 wt%, 2
wt% and 3wt% I.30E clay and (b) nanocomposites containing 1 wt% of respective
nanoclays, both prepared by ultrasonic dispersion method.
In agreement with the observation made by Zilg et al. [8] and Lan et al. [12], it was also
found that the primary ammonium ion is more effective than the quaternary ammonium ion
in increasing the interlamellar distance of the layered silicate. According to Lan et al. [12] the
apparent differences in the microstructure of the two organoclay systems can be explained by
the catalytic influence of the acidic alkylammonium ion on the epoxy-amine curing reaction
in the following order; H3(CH2)17NH3+> CH3(CH2)17N(CH3)H2
+ > CH3(CH2)17N(CH3)2H
+>
Neat 1 wt%, 2 wt%, 3 wt% I.30E PGW I.30E I.28E
(a) (b)
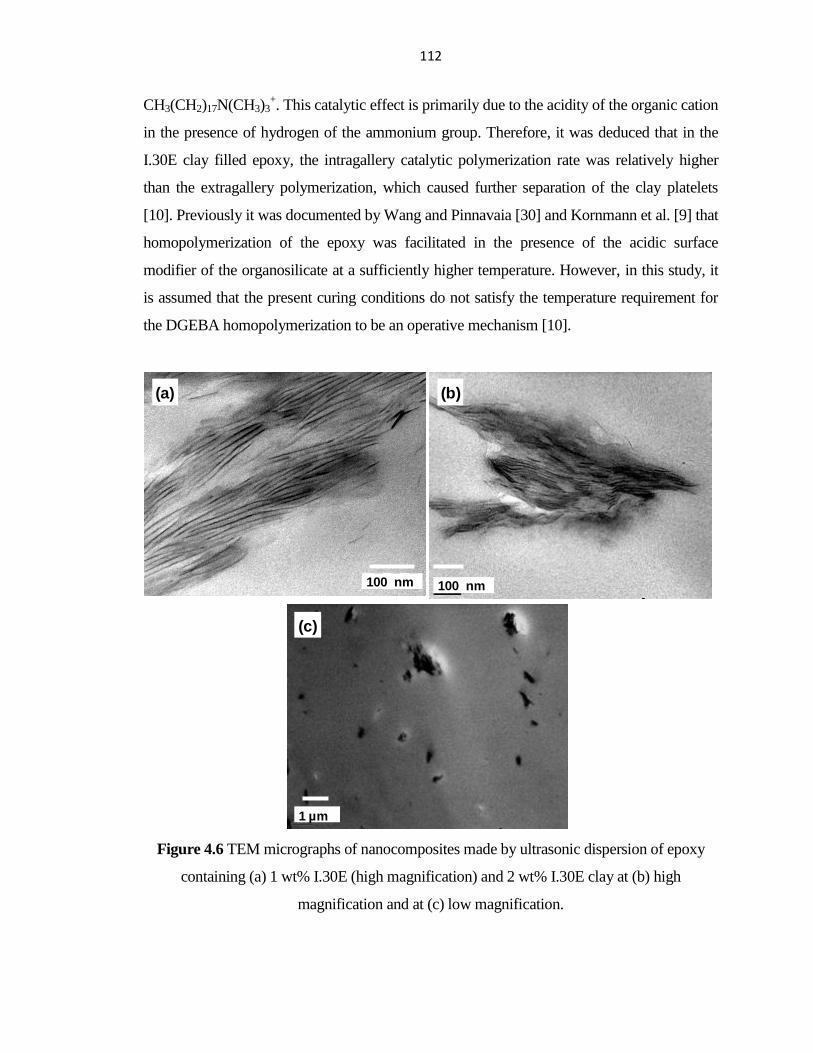
112
CH3(CH2)17N(CH3)3+. This catalytic effect is primarily due to the acidity of the organic cation
in the presence of hydrogen of the ammonium group. Therefore, it was deduced that in the
I.30E clay filled epoxy, the intragallery catalytic polymerization rate was relatively higher
than the extragallery polymerization, which caused further separation of the clay platelets
[10]. Previously it was documented by Wang and Pinnavaia [30] and Kornmann et al. [9] that
homopolymerization of the epoxy was facilitated in the presence of the acidic surface
modifier of the organosilicate at a sufficiently higher temperature. However, in this study, it
is assumed that the present curing conditions do not satisfy the temperature requirement for
the DGEBA homopolymerization to be an operative mechanism [10].
Figure 4.6 TEM micrographs of nanocomposites made by ultrasonic dispersion of epoxy
containing (a) 1 wt% I.30E (high magnification) and 2 wt% I.30E clay at (b) high
magnification and at (c) low magnification.
1 µm
100 nm100 nm
(a) (b)
(c)

113
Figure 4.7 TEM micrographs of nanocomposites prepared by mechanical mixing of epoxy
containing: 1 wt% I.30E at (a) high and (b) low magnifications and (c) 2 wt% I.30E clay.
Table 4-1 presents the intergallery spacing of the organoclays and their respective
nanocomposites composed of 1 wt% of the organoclay. From the XRD and TEM
investigations some distinctions can be made between the morphology of the nanocomposites
made by the different dispersion methods. On the micro-scale, ultrasonic mixing caused de-
aggregation of the large layered silicate clusters, and on the nano-scale, it promoted
intragallery diffusion of the epoxy prepolymer and the curing agent allowing the
development of long range ordered structures (i.e. intercalated clay). In contrast, mechanical
mixing produced larger clay aggregates with the formation of predominantly phase-separated
clay tactoids. The ultrasonic method caused breaking up of the large clay aggregates into
finely dispersed uniformly distributed submicron-size (< 1 µm) clay particles as shown in
Figure 4.6(c) (see also [21, 23]). Prolonged ultrasonic mixing also influenced the epoxy
1 µm100 nm
100 nm
(a) (b)
(c)

114
solvation into the clay gallery. The importance of epoxy solvation prior to the curing reaction
has been well documented in the literature [18]. Therefore, it can be inferred that ultrasonic
mixing offered better dispersion. However, neither of the dispersion methods achieved
homogenously dispersed isolated exfoliated platelets resembling a monolithic structure for
the nanocomposites. Similar observations have been documented by other researchers based
on micro and nano-scale studies on epoxy layered silicate nanocomposites [7, 18].
Figure 4.8 TEM images of nanocomposites comprising of 1 wt% I.28E in epoxy at: (a) high
magnification and (b) low magnification.
Figure 4.9 TEM images of nanocomposites comprising of 1 wt% PGW in epoxy at: (a) high
magnification and (b) low magnification.
1 µm50 nm
(a) (b)
100 nm 1 µm
(a) (b)

115
Table 4-1 Clay, organic modifier, d-spacing and corresponding nanocomposite morphology.
Clay Organic modifier d-spacing of the
organoclay, d001a
d-spacing and morphology of
organoclay (1 wt%) in cured epoxya, b
I.30E CH3(CH2)17NH3+
2.23 nm
10~15 nm, exfoliated/intercalated (U)
(measured by TEM)
2.68 nm, phase-separated (M)
I.28E CH3(CH2)17N(CH3)3+
2.39 nm 2.85 nm, intercalated (U)
PGW none 1.24 nm 1.24 nm, phase-separated (U)
a Interlayer spacing was measured using the prominent diffraction peak from XRD traces.
b U = ultrasonic mixing; M = mechanical mixing.
4.2.2 Tensile Property of the Epoxy-clay Nanocomposites
All nanocomposites prepared by the different blending protocols with varying compositions
of the I.30E clay were subjected to uniaxial tensile testing. The average tensile property
values are presented in Table 4-2 along with the corresponding standard deviations. The
tensile properties of the nanocomposites and the unfilled epoxy resin are presented in
Figures 4.10-4.13 with corresponding clay loadings. The lines drawn in the graphs illustrate
general trends in the data but are not intended to signify any mathematical correlation. Error
bars represent one standard deviation of four tests done on each set of specimens. The tensile
modulus and strength of the pristine epoxy were measured to be 2.8 GPa and 82 MPa
respectively. The tensile modulus of the nanocomposites prepared by ultrasonic blending
increased substantially, i.e. a maximum of 20% increase was observed in response to 3 wt%
I.30E nanoclay addition. Stiffness improved slightly in the nanocomposites processed by a
mechanical agitator for the same clay loadings. The degree of exfoliation of the high aspect
ratio rigid nano-platelets and superior interfacial adhesion of the exfoliated/intercalated
nanoclay with the epoxy polymer contributed to the substantial stiffness improvement in the
case of the ultrasonic mixed nanocomposites [25]. It can be surmised that well intercalated
uniformly dispersed smaller submicron-size I.30E clay particles further influenced the
stiffness. In contrast, for the mechanically mixed samples, the modulus increase was

116
relatively small, probably due in part to the inefficient layer separation of the nanoclay. In
addition, the phase-separated clay aggregates formed during the mechanical mixing behaved
akin to conventional microparticles that require higher filler concentrations to achieve
substantial stiffness enhancement.
Table 4-2 Property of epoxy nanocomposites containing various concentrations of I.30E.
Filler matrix
loading (wt%)a
Tensile
modulus
(GPa)
Tensile
strength
(MPa)
Elongation
(%)
Fracture
toughness
(MPam0.5
)
Strain
energy
(J/m2)
0 (neat epoxy) 2.82 ± 0.08 82.2 ± 1.56 8.53 ± 0.16 0.78 ± 0.05 235 ± 28
1 wt% I.30E (U) 3.25 ± 0.04 84.7 ± 1.56 6.12 ± 0.5 0.79 ± 0.03 225 ± 11
2 wt% I.30E (U) 3.23 ± 0.04 80.6 ± 2.78 5.51 ± 0.97 0.81 ± 0.05 245 ± 12
3 wt% I.30E (U) 3.36 ± 0.03 76.7 ± 3.51 4.08 ± 0.56 0.77 ± 0.01 230 ± 9
1 wt% I.30E (M) 2.84 ± 0.03 72.8 ± 3.5 4.8 ± 0.75 0.78 ± 0.04 240 ± 26
2 wt% I.30E (M) 2.92 ± 0.02 69.8 ± 0.42 3.96 ± 0.07 0.83 ± 0.04 265 ± 30
3 wt% I.30E (M) 2.97 ± 0.01 69.1 ± 1.19 3.78 ± 0.17 0.93 ± 0.06 320 ± 32
a U = ultrasonic mixing; M = mechanical mixing.
Tensile strength values remained almost unchanged for samples formulated by ultrasonic
mixing (see Figure 4.11). Nanocomposites that were made by the mechanical mixing method
exhibited a considerable loss in tensile strength, which is in agreement with the results
reported by other researchers [24]. It is assumed that clay aggregates present in the epoxy
matrix acted as stress concentrators during the loading process causing the composite to fail
at a reduced load level and ductility [7, 24]. Strain values at break reduced significantly with
the addition of clay nanoparticles in the epoxy matrix for all of the clay nanocomposites (see
Figure 4.12). The reduction in tensile elongation is believed to stem from an embrittlement
effect caused by the stiffer clay nanofillers in the epoxy network [17, 24].
Figure 4.13 shows tensile test results of nanocomposites each containing 1 wt% of the PGW,
I.30E and I.28E nanoclay respectively. In comparison to the nanocomposites made from
PGW and I.28E, I.30E organosilicate generated greater mechanical property enhancement in
epoxy. Previously, Pinnavaia et al. [13] reported that in a rubbery epoxy better reinforcing
efficiently was achieved with the primary alkylammonium ion (exfoliated nanocomposites)

117
than the quaternary alkylammonium ion treated montmorillonite (intercalated
nanocomposites) at higher clay loadings (>5 wt%).
Figure 4.10 Influence of I.30E clay concentration on tensile modulus of nanocomposites.
Figure 4.11 Tensile strength of nanocomposites as a function of I.30E clay content.
2
2.2
2.4
2.6
2.8
3
3.2
3.4
3.6
0% 1% 2% 3% 4%
Te
nsile
mo
du
lus [G
Pa
]
Epoxy clay loading [wt%]
Ultrasonic mixing Mechanical mixing
0
20
40
60
80
100
0% 1% 2% 3% 4%
Te
nsile
str
en
gth
[M
Pa
]
Epoxy clay loading [wt%]
Ultrasonic mixing Mechanical mixing

118
Figure 4.12 Relation between tensile elongation and I.30E clay loading of nanocomposites.
Figure 4.13 Tensile properties of different nanoclay filled epoxy (ultrasonic mixing).
0
2
4
6
8
10
0% 1% 2% 3% 4%
Te
nsile
str
ain
[%
]
Epoxy clay loading [wt%]
Ultrasonic mixing Mechanical mixing
1.0
0
1.1
6
0.9
9
1.0
1
1.0
0
1.0
3
0.7
6
0.8
7
1.0
0
0.7
2
0.4
6
0.5
9
0
0.2
0.4
0.6
0.8
1
1.2
1.4
Epoxy I.30E I.28E PGW
Norm
. tensi
le p
ropert
ies
[/]
Epoxy clay nanocomposite
Modulus Strength Strain

119
4.2.3 Fracture Property of the Epoxy-clay Nanocomposites
Figures 4.14 and 4.15 depict the fracture energy in the form of the critical stress intensity
factor and the strain energy release rate of the neat epoxy and its nanocomposites in relation
to the respective nanoclay loadings. The fracture toughness and the strain energy release rate
of the neat epoxy were measured as 0.78 MPa.m
0.5 and 235 J/m
2, respectively. For the
ultrasonically produced nanocomposites, the toughness values remained almost identical to
that of the pristine epoxy. However, the fracture toughness increased substantially for the
mechanical dispersion method. The mechanical dispersion method seems more effective than
the ultrasonic mixing method in toughening epoxy by generating phase-separated
microparticles. Similar behavior was also observed for the critical energy release rate; for
example, by mechanically mixing 3 wt% of I.30E clay with epoxy, an increase of about 35%
was observed relative to the unmodified epoxy. Figure 4.16 shows fracture energies of
nanocomposites each containing 1 wt% of a specific type of the organosilicate; these
nanocomposites were prepared by ultrasonic mixing. It is demonstrated that the quaternary
alkylammonium ion (I.28E) exchanged montmorillonite affords a substantial improvement in
epoxy toughness compared to the primary alkylammonium ion (I.30E). This finding is in
agreement with observations previously made by Zilg et al. [8], who found that conventional
composites as well quaternary ammonium ion exchanged fluoromica filled epoxy showed
higher toughness than nanocomposites based on protonated primary amines.
In the present investigation, it was concluded that the epoxy-clay microcomposites provided
better crack resistance than the nanocomposites. In nanoclay modified epoxy, crack
deflection and bifurcation [22, 27, 29], crack pinning [22, 27] and matrix deformation [22,
29] are the most commonly observed crack resistance mechanisms. Matrix deformation and
crack pinning are the dominant energy absorption mechanisms since crack deflection
phenomenon enhances toughness only to a limited extent. Crack resistance phenomena are
further explored with regard to the micromechanisms of the fracture process in the following
section.

120
Figure 4.14 Influence of I.30E clay concentration on fracture toughness of nanocomposites.
Figure 4.15 The variation of fracture energy of nanocomposites with I.30E clay loading.
400
500
600
700
800
900
1000
1100
0% 1% 2% 3% 4%
Fra
ctu
re to
ughness
[kP
a. m
.5]
Epoxy clay loading [wt%]
Ultrasonic mixing Mechanical mixing
100
150
200
250
300
350
400
0% 1% 2% 3% 4%
Str
ain
energ
y r
ele
ase r
ate
[J/m
2]
Epoxy clay loading [wt%]
Ultrasonic mixing Mechanical mixing

121
Figure 4.16 Fracture energy of the different nanoclay reinforced nanocomposites.
4.2.4 Fractographic Study of the Epoxy-clay Nanocomposites
Figure 4.17 shows smooth and featureless fracture surfaces of the unfilled epoxy representing
insignificant matrix deformation that is usually observed in a homogenous brittle material.
Figure 4.17 SEM micrograph of a neat epoxy fracture surface.
In general, the fracture surface of the modified epoxy was coarse and rough; the result of
crack propagation through intricate and perturbed paths. Figure 4.18 shows the fracture
1.0
0
1.0
1
1.2
4
0.9
7
1.0
0
0.9
5
1.5
7
1.0
9
0
0.2
0.4
0.6
0.8
1
1.2
1.4
1.6
1.8
Epoxy I.30E I.28E PGW
No
rm. fr
actu
re e
ne
rgy [/]
Epoxy clay nanocomposite
Fracture toughness
Strain energy release rate
100 nm1 µm
(a) (b)

122
surfaces of the nanocomposites made by blending I.30E clay with epoxy using the ultrasonic
probe. Note that arrows in the fractographic images illustrate the crack propagation direction.
The higher magnification image in Figure 4.18(b) exhibits epoxy network penetration in
between the silicate layers, which correlates well with the intercalated morphology observed
by TEM microscopy. Clear evidence of the distorted and perturbed crack path can be seen in
lower magnification images of Figures 4.18(a), (c) and (d). These tortuous paths were caused
by a crack deflection mechanism when the path of a propagating crack was impeded by the
uniformly distributed nanoparticles (i.e. both the intercalated parallel platelets and exfoliated
isolated platelets). As this nanocomposite is mostly composed of intercalated clay structures,
one would expect to see an increase in fracture toughness, but the smaller submicron-size
intercalated clay tactoids behaved akin to exfoliated platelets. This notion was corroborated
by the strong increase in modulus values [31]. In Figure 4.18(d), the fracture surface becomes
comparatively rough for the clay loading increasing to 3 wt%. In spite of the rough surface
texture, river markings are comparatively shallow indicating insignificant matrix
deformation. The above observation leads to the inference that in this particular epoxy
system, the occurrence of crack deflection mechanism only provided insignificant energy
dissipation [32]. In some instances, cracks have penetrated through clay clusters (i.e.
interparticle fracture and clay delamination). It is notable from the SEM micrographs that no
visual debonding of the particle matrix interface can be observed. This indicates that there is
strong interfacial adhesion between the layered silicate and epoxy in an exfoliated and
intercalated structure, which also indicates that these rigid well-bonded nanoclay particles
restrict the ability of adjacent epoxy polymer to experience matrix deformation.
Figure 4.19 shows SEM images of the fracture surfaces of mechanically mixed
nanocomposites showing agglomerated clay of various sizes. The appearance of the textured
surface, steps and clusters are indicative of a significant consumption of fracture energy.
Figure 4.19(b) depicts a high magnification micrograph of a phase-separated clay structure.
Fractographic evidence suggests that at a low clay concentration, agglomerated micron-size
I.30E clay resulted in crack deflection and crack pinning mechanisms to be operative. This
behavior closely resembles that of conventional microparticles. Characteristic pinning tails
can be seen behind the particles. Such step structures form when crack fronts from two
different fracture planes meet each other after being blocked by inclusions. Previously,

123
Moloney et al. [33] observed that the crack-pinning mechanism was responsible for
increasing fracture toughness in silica and alumina modified epoxy. In another study, Kinloch
et al. [34] discussed crack-pinning mechanism in glass particle filled epoxy citing the
fractographic evidence of crack bowing and experimental fracture energy values. In the
present study, it was observed that the size of clay aggregates increases with increasing clay
concentration, while at the same time the interparticle distance decreases and roughness
increases. The fracture surface shown in Figure 4.19(d) for a higher clay content of 3 wt%
provides evidence for matrix deformation and particle debonding – this further distinguishes
the composites prepared by the mechanical dispersion. At higher concentration, the clay
agglomerates may act as stress concentrators during the fracture process and instigate
localized matrix shear yielding around the clay inclusions or cause interfacial failure at the
epoxy-clay interface.
Figure 4.18 Fracture surface micrographs (SEM) of nanocomposites made by ultrasonic
dispersion of epoxy containing (a) 1 wt%, (b) 1 wt% (high magnification), (c) 2 wt% and (d)
3 wt% I.30E clay.
(a) (b)
(c) (d)
100 nm
10 µm
10 µm
10 µm
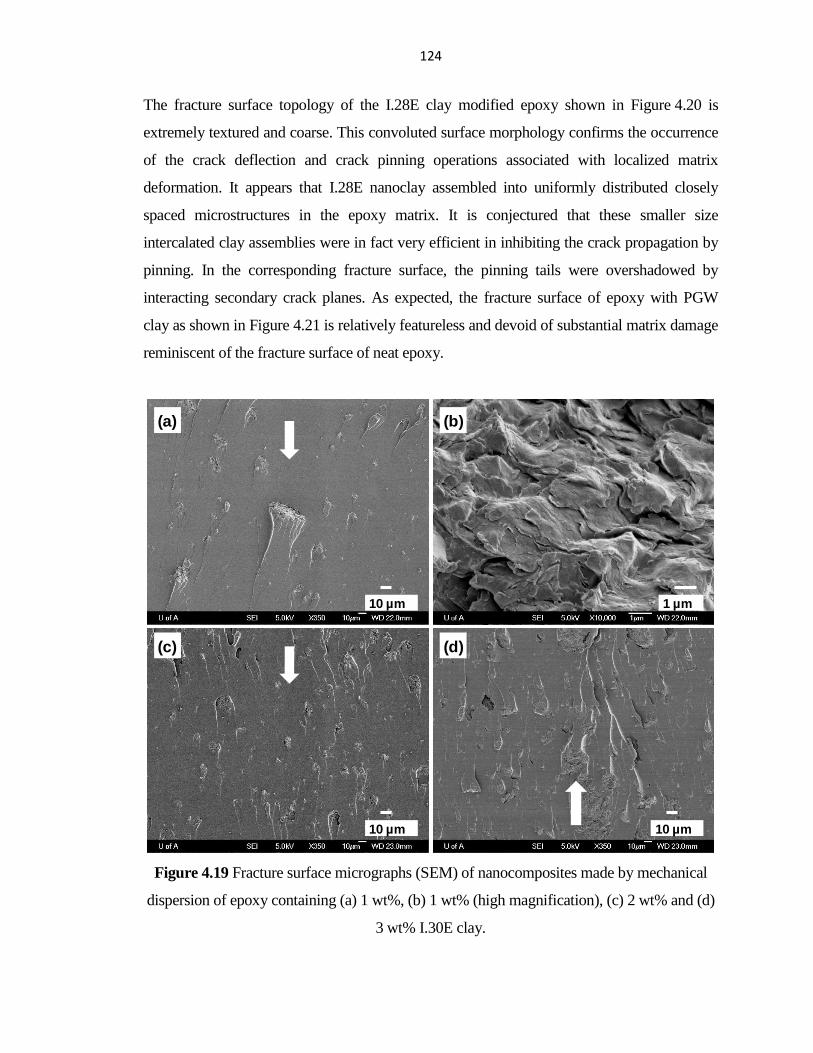
124
The fracture surface topology of the I.28E clay modified epoxy shown in Figure 4.20 is
extremely textured and coarse. This convoluted surface morphology confirms the occurrence
of the crack deflection and crack pinning operations associated with localized matrix
deformation. It appears that I.28E nanoclay assembled into uniformly distributed closely
spaced microstructures in the epoxy matrix. It is conjectured that these smaller size
intercalated clay assemblies were in fact very efficient in inhibiting the crack propagation by
pinning. In the corresponding fracture surface, the pinning tails were overshadowed by
interacting secondary crack planes. As expected, the fracture surface of epoxy with PGW
clay as shown in Figure 4.21 is relatively featureless and devoid of substantial matrix damage
reminiscent of the fracture surface of neat epoxy.
Figure 4.19 Fracture surface micrographs (SEM) of nanocomposites made by mechanical
dispersion of epoxy containing (a) 1 wt%, (b) 1 wt% (high magnification), (c) 2 wt% and (d)
3 wt% I.30E clay.
(a) (b)
(c) (d)
10 µm
10 µm
1 µm
10 µm

125
Figure 4.20 Fracture surface micrographs (SEM) of nanocomposites comprised of 1 wt%
I.28E clay in epoxy at: (a) low magnification and (b) high magnification.
Figure 4.21 Fracture surface micrographs (SEM) of nanocomposites comprised of 1 wt%
PGW clay in epoxy at: (a) low magnification and (b) high magnification.
4.2.5 Thermal Property of the Epoxy-clay Nanocomposites
Figure 4.22 delineates the glass transition temperature of the neat epoxy and its
nanocomposites as a function of the I.30E organosilicate content, which was determined by
DSC tests. The glass transition temperature of the neat epoxy was measured to be 117.5C. A
progressive reduction of the glass transition temperature was observed in the composites
produced by the exfoliation-adsorption method. Likewise, the samples that were produced
using the intercalative polymerization method showed a decrease without rendering any
definite trend in the glass transition temperature. In the literature, there have been reports of
(a) (b)
10 µm 1 µm
(a) (b)
10 µm 1 µm

126
increasing glass transition temperature with nanoclay loading; and restricted segmental
mobility due to epoxy being tied down at the polymer-clay interface is thought to be the
reason [6, 35]. Others have shown reductions in the glass transition temperature of epoxy-
clay nanocomposites [35]. In the past, the plasticizing effect of the free molecules present in
the form of untreated resin, hardener and modifier [9, 19-20], homopolymerization of the
DGEBA [9, 19-20] and thermal degradation of the organic modifiers at a higher curing
temperature [9, 19, 22] have been identified to contribute to the reduction in glass transition
temperature. The homopolymerization of the DGEBA resin can occur through catalytic
influence of the alkylammonium ion of the organoclay. As a result, an overall reduction of
crosslink density within the epoxy network is expected. In this study, phase-separated clay
tactoids having limited epoxy solvation during the mechanical mixing and mostly
intercalated structures of the ultrasonically dispersed clay showed a decrease in glass
transition temperature. For these two dissimilar morphologies, the decline in the glass
transition temperature did not originate from homopolymerization of DGEBA or thermal
decomposition of the modifier at the curing temperature of 120C. Therefore, the possible
cause may be the plasticization of the intragallery polymer at the epoxy-clay interphase by
the long chain primary alkylammonium modifier of the organoclay. Chen et al. [36]
contemplated similar effect by a long-chain organic surfactant at the interphase that formed
near the surface between the intercalated silicate layers. Triantafillidis et al. [37] reported on
plasticizing effects of organic surfactant chains, which reduced the glass transition
temperature of an epoxy-clay nanocomposite.
4.3 CONCLUSIONS
The presented study explored how variations in the nanoclay dispersion method can
significantly affect the morphology, and hence, the mechanical properties of epoxy
nanocomposites. In the case of primary alkylammonium exchanged clay (I.30E), the
microscopic study and XRD traces of the nanocomposites revealed the creation of partly
exfoliated and laminated silicate layers by ultrasonic dispersion, and phase-separated and
intercalated clay agglomerates by mechanical blending. The quaternary alkylammonium
treated (I.28E) and unmodified clay (PGW) assembled into intercalated clay tactoids and
phase-separated microaggregates in the epoxy matrix respectively.

127
Figure 4.22 Glass transition temperature of nanocomposites as a function of I.30E clay
content.
The final properties of the nanocomposites were found to be very much dependent on the
macrostructure of the nanoclay inclusion. Although full exfoliation was not achieved in any
of the nanocomposite systems, considerable stiffness increase was observed for ultrasonically
dispersed I.30E clay. An enhancement in modulus was attributed to a combined reinforcing
effect of delaminated clay platelets and intercalated submicron clay tactoids, whereas
toughness was found to be independent of silicate layer separation. In contrast, the phase-
separated and agglomerated I.30E clay from mechanical dispersion and the intercalated I.28E
clay provided substantial fracture resistance. It is speculated that micro-reinforcements
through crack deflection and crack pinning and subsequent matrix deformation mechanisms
are the key to providing high crack propagation resistance. The nanocomposites fabricated by
either dispersion technique resulted in slight reductions in the glass transition temperature, via
the plasticizing effect of the organic surfactant present. This study highlights the fact that the
100
102
104
106
108
110
112
114
116
118
120
0% 1% 2% 3% 4%
Gla
ss tra
nsitio
n te
mp
era
ture
[0C
]
Filler matrix loading [wt%]
Ultrasonic mixing Mechanical mixing

128
type of organic modifier and the processing method have significant influence on the ultimate
properties of the nanocomposites.
REFERENCES
1. KOJIMA, Y., USUKI, A., KAWASUMI, M., OKADA, A., FUKUSHIMA, Y.,
KURAUCHI, T. and KAMIGAITO, O., 1993. Mechanical properties of nylon 6-clay
hybrid. Journal of Materials Research, 8(5), pp. 1185-1189.
2. OKADA, A. and USUKI, A., 1995. The chemistry of polymer-clay hybrids.
Materials Science and Engineering C, 3(2), pp. 109-115.
3. HUSSAIN, F., HOJJATI, M., OKAMOTO, M. and GORGA, R.E., 2006. Review
article: Polymer-matrix nanocomposites, processing, manufacturing, and application: An
overview. Journal of Composite Materials, 40(17), pp. 1511-1575.
4. GIANNELIS, E.P., 1996. Polymer layered silicate nanocomposites. Advanced
Materials, 8(1), pp. 29-35.
5. LAN, T. and PINNAVAIA, T.J., 1994. Clay-reinforced epoxy nanocomposites.
Chemistry of Materials, 6(12), pp. 2216-2219.
6. MESSERSMITH, P.B. and GIANNELIS, E.P., 1994. Synthesis and
characterization of layered silicate-epoxy nanocomposites. Chemistry of Materials, 6(10),
pp. 1719-1725.
7. KORNMANN, X., THOMANN, R., MÜLHAUPT, R., FINTER, J. and
BERGLUND, L., 2002. Synthesis of amine-cured, epoxy-layered silicate
nanocomposites: The influence of the silicate surface modification on the properties.
Journal of Applied Polymer Science, 86(10), pp. 2643-2652.
8. ZILG, C., MÜLHAUPT, R. and FINTER, J., 1999. Morphology and
toughness/stiffness balance of nanocomposites based upon anhydride-cured epoxy resins
and layered silicates. Macromolecular Chemistry and Physics, 200(3), pp. 661-670.
9. KORNMANN, X., BERGLUND, L.A., THOMANN, R., MULHAUPT, R. and
FINTER, J., 2002. High performance epoxy-layered silicate nanocomposites. Polymer
Engineering and Science, 42(9), pp. 1815-1826.

129
10. BROWN, J.M., CURLISS, D. and VAIA, R.A., 2000. Thermoset-layered silicate
nanocomposites. Quaternary ammonium montmorillonite with primary diamine cured
epoxies. Chemistry of Materials, 12(11), pp. 3376-3384.
11. ALEXANDRE, M. and DUBOIS, P., 2000. Polymer-layered silicate
nanocomposites: Preparation, properties and uses of a new class of materials. Materials
Science and Engineering R: Reports, 28(1), pp. 1-63.
12. LAN, T., KAVIRATNA, P.D. and PINNAVAIA, T.J., 1995. Mechanism of clay
tactoid exfoliation in epoxy-clay nanocomposites. Chemistry of Materials, 7(11), pp.
2144-2150.
13. PINNAVAIA, T.J., LAN, T., WANG, Z., SHI, H. and KAVIRATNA, P.D., 1996.
CLAY-REINFORCED EPOXY NANOCOMPOSITES: SYNTHESIS, PROPERTIES,
AND MECHANISM OF FORMATION. ACS Symposium Series 622,1996, pp. 250-261.
14. KE, Y.C., 2005. Polymer-layered silicate and silica nanocomposites. Amsterdam:
Elsevier.
15. PARK, J.H. and JANA, S.C., 2003. Mechanism of exfoliation of nanoclay
particles in epoxy-clay nanocomposites. Macromolecules, 36(8), pp. 2758-2768.
16. CHEN, C. and CURLISS, D., 2003. Preparation, Characterization, and
Nanostructural Evolution of Epoxy Nanocomposites. Journal of Applied Polymer
Science, 90(8), pp. 2276-2287.
17. XIDAS, P.I. and TRIANTAFYLLIDIS, K.S., 2010. Effect of the type of
alkylammonium ion clay modifier on the structure and thermal/mechanical properties of
glassy and rubbery epoxy-clay nanocomposites. European Polymer Journal, 46(3), pp.
404-417.
18. KORNMANN, X., LINDBERG, H. and BERGLUND, L.A., 2001. Synthesis of
epoxy-clay nanocomposites: Influence of the nature of the clay on structure. Polymer,
42(4), pp. 1303-1310.
19. BECKER, O., CHENG, Y.-B., VARLEY, R.J. and SIMON, G.P., 2003. Layered
silicate nanocomposites based on various high-functionality epoxy resins: The influence
of cure temperature on morphology, mechanical properties, and free volume.
Macromolecules, 36(5), pp. 1616-1625.

130
20. BECKER, O., VARLEY, R. and SIMON, G., 2002. Morphology, thermal
relaxations and mechanical properties of layered silicate nanocomposites based upon
high-functionality epoxy resins. Polymer, 43(16), pp. 4365-4373.
21. HERNANDEZ, M., SIXOU, B., DUCHET, J. and SAUTEREAU, H., 2007. The
effect of dispersion state on PMMA-epoxy-clay ternary blends: In situ study and final
morphologies. Polymer, 48(14), pp. 4075-4086.
22. LIU, W., HOA, S.V. and PUGH, M., 2005. Organoclay-modified high
performance epoxy nanocomposites. Composites Science and Technology, 65(2), pp.
307-316.
23. MIYAGAWA, H. and DRZAL, L.T., 2004. The effect of chemical modification
on the fracture toughness of montmorillonite clay/epoxy nanocomposites. Journal of
Adhesion Science and Technology, 18(13), pp. 1571-1588.
24. ZERDA, A.S. and LESSER, A.J., 2001. Intercalated clay nanocomposites:
Morphology, mechanics, and fracture behavior. Journal of Polymer Science, Part B:
Polymer Physics, 39(11), pp. 1137-1146.
25. YASMIN, A., ABOT, J.L. and DANIEL, I.M., 2003. Processing of clay/epoxy
nanocomposites by shear mixing. Scripta Materialia, 49(1 SPEC.), pp. 81-86.
26. KINLOCH, A.J. and TAYLOR, A.C., 2003. Mechanical and fracture properties
of epoxy/inorganic micro- and nano-composites. Journal of Materials Science Letters,
22(20), pp. 1439-1441.
27. SIDDIQUI, N.A., WOO, R.S.C., KIM, J.-K., LEUNG, C.C.K. and MUNIR, A.,
2007. Mode I interlaminar fracture behavior and mechanical properties of CFRPs with
nanoclay-filled epoxy matrix. Composites Part A: Applied Science and Manufacturing,
38(2), pp. 449-460.
28. WANG, K., CHEN, L., WU, J., TOH, M.L., HE, C. and YEE, A.F., 2005. Epoxy
nanocomposites with highly exfoliated clay: Mechanical properties and fracture
mechanisms. Macromolecules, 38(3), pp. 788-800.
29. LIU, T., TJIU, W., TONG, Y., HE, C., GOH, S. and CHUNG, T., 2004.
Morphology and fracture behavior of intercalated epoxy/clay nanocomposites. Journal of
Applied Polymer Science, 94(3), pp. 1236-1244.

131
30. WANG, M.S. and PINNAVAIA, T.J., 1994. Clay-polymer nanocomposites
formed from acidic derivatives of montmorillonite and an epoxy resin. Chemistry of
Materials, 6(4), pp. 468-474.
31. BASHAR, M.T., SUNDARARAJ, U. and MERTINY, P., 2012. Microstructure
and mechanical properties of epoxy hybrid nanocomposites modified with acrylic tri-
block-copolymer and layered-silicate nanoclay. Composites Part A: Applied Science and
Manufacturing, 43, pp. 945-954.
32. GARG, A.C. and MAI, Y.-W., 1988. Failure mechanisms in toughened epoxy
resins-A review. Composites Science and Technology, 31(3), pp. 179-223.
33. MOLONEY, A.C., KAUSCH, H.H. and STIEGER, H.R., 1983. The fracture of
particulate-filled epoxide resins - Part 1. Journal of Materials Science, 18(1), pp. 208-
216.
34. KINLOCH, A.J., MAXWELL, D.L. and YOUNG, R.J., 1985. The fracture of
hybrid-particulate composites. Journal of Materials Science, 20(11), pp. 4169-4184.
35. BECKER, O. and SIMON, G.P., 2005. Epoxy layered silicate nanocomposites.
Advances in Polymer Science, 179, pp. 29-82.
36. CHEN, J.-S., POLIKS, M.D., OBER, C.K., ZHANG, Y., WIESNER, U. and
GIANNELIS, E., 2002. Study of the interlayer expansion mechanism and thermal-
mechanical properties of surface-initiated epoxy nanocomposites. Polymer, 43(18), pp.
4895-4904.
37. TRIANTAFILLIDIS, C.S., LEBARON, P.C. and PINNAVAIA, T.J., 2002.
Homostructured mixed inorganic-organic ion clays: A new approach to epoxy polymer-
exfoliated clay nanocomposites with a reduced organic modifier content. Chemistry of
Materials, 14(10), pp. 4088-4095.

132
Chapter 5
Study of Morphology and Mechanical Property of Acrylic
Triblock-copolymer Modified Epoxy2
SYNOPSIS: Acrylic triblock-copolymers of different compositions and constituents
were used to modify epoxy resin. In epoxy the block-copolymers self-assembled to
generate different nanostructured phases. Spherical micelles and vesicles were formed
due to preferential interactions among constituents of the blends. The effect of modifier
concentration and morphology on the resulting mechanical properties was investigated.
At a modifier content of 5 wt% a more than threefold increase in critical strain energy
was observed relative to the unfilled epoxy for the block-copolymer/epoxy systems
studied. This improvement was accompanied by slight reductions in the tensile stiffness,
strength and glass transition temperature of developed epoxy blends. Microstructure
studies revealed that during crack propagation, vesicle and micelle structures respectively
underwent debonding and cavitation followed by shear yielding of the substrate matrix.
5.1 INTRODUCTION
Thermosetting polymer epoxy has been recognized as one of the materials of choice for
structural adhesives, thin film coatings and matrix materials for fiber-reinforced polymer
composites. Compared to other engineering polymers, epoxy resins generally provide
better stiffness, creep resistance, chemical inertness and high temperature applicability.
Unfortunately they are also subject to certain shortcomings, such as having high
brittleness and notch sensitivity. To date, significant research has been conducted to
increase the toughness of epoxy resin by reinforcing with dispersed micro-particles.
Blending epoxy with a liquid-rubber phase [1-12] is a rather established method, and
incorporating thermoplastic [13-16] and core-shell [17-22] particles are known to have
2 A version of this chapter has been published as: BASHAR, M.T., SUNDARARAJ, U. and MERTINY, P.,
2013. Morphology and mechanical properties of nanostructured acrylic tri-block-copolymer modified
epoxy, Polymer Engineering and Science, DOI: 10.1002/pen.23648.
133
improved epoxy toughness. These micron size particles can distinctly enhance epoxy
toughness, but at the same time degrade important mechanical and thermal properties
(e.g. stiffness and service temperature). Also, many of these particles pose considerable
mixing and dispersion problems.
Toughening thermosets by elastomeric/thermoplastic particles is an extensively studied
topic, and numerous toughening mechanisms have been observed thus far. Particle
cavitation [5-8, 23], matrix shear yielding [4-9, 22-24], crazing [1-2, 23-24], rubber
stretching [3, 23-24], crack pinning [23-24] and crack deflection [23-24] are some of the
toughening concepts well recognized in rubber modification of polymer. Depending on
the material systems and operating conditions (e.g. applied loading), desired toughening
is achieved by the function of a single mechanism or through a complex combination of
simultaneous and successive actions of different processes. It is therefore of great
importance to thoroughly understand the principles and fundamentals of different
toughening mechanisms to effectively apply the appropriate toughener phase in order to
meet the intended toughness requirement of a polymer. Material properties such as matrix
cross-link density [7, 11-12], particle morphology [21-22, 25] and size [1, 8, 19-20],
degree of dispersion [20] and interfacial property [24] also influence the toughness of
rubber modified epoxy. It was observed that lightly cross-linked epoxies can easily
deform and shear yield [26], and for effective toughening the optimal particle size was
located within the range of 0.2 to 5 μm.
Recently it has been demonstrated that nanostructured block-copolymers can be an
attractive alternative to the conventional micro-particles. Self-assembling amphiphilic
block-copolymers provide a highly efficient way of improving epoxy toughness with a
relatively low amount of additive loading [26-41]. Typically, block-copolymers are
distinct and chemically dissimilar polymer blocks linked together by covalent bonds. Up
until very recently, the application of block-copolymer has been mainly concentrated as
compatibilizing agents and surfactants. The unique toughness property of block-
copolymer modified thermosets stem from their characteristic self-ordering micro/nano
domain configurations inside the thermoset. According to the dilute disordered phase
behavior in a selective solvent such as epoxy, the block-copolymers can spontaneously
self-assemble mainly into three equilibrium morphologies, i.e. spherical micelles,

134
cylindrical micelles and vesicles [28, 31-35]. Organization to the nanostructured
morphologies is dictated by chemical interactions (block-block, block-solvent), polymer
molecular weight, copolymer/solvent composition and concentration [32-34, 36].
It should be mentioned that there are alternative ways to toughen epoxy, which require
chemical flexibilization/functionalization of epoxy backbone, increasing molecular
weight of the epoxy monomer and reducing density of the epoxy cross-link network [24].
Modification of the epoxy resin chemistry or changed to a different polymer system was
not within the scope of this research. Therefore, toughening by dispersion of a second-
phase material was chosen as the preferred method for this study. The intent of the
present research is to study the toughening effect of two ABA type triblock-copolymers
on the epoxy system under investigation. These ABA triblock-copolymers are expected
to easily dissolve in epoxy and self-organize on the nano-level due to the affinity between
epoxy monomer and poly(methylmethacrylate) and the repulsion between epoxy and the
middle poly(n-butylacrylate) block. A miscibility study and morphology characterization
of the block-copolymers in epoxy was performed by different analytical techniques.
Tensile properties, fracture toughness and associated crack resistance micromechanisms
of the fully cured block-copolymer/epoxy blends were investigated.
5.2 RESULTS AND DISCUSSION
5.2.1 Miscibility of Block-copolymer/Epoxy Blends
In the M52 and M52N block-copolymers PBuA is the immiscible block causing
segregation in epoxy and PMMA and P(MMA-co-DMA) are the miscible blocks giving
compatibility towards epoxy. Binary mixtures containing DGEBA resin and any of the
M52 and M52N block-copolymers appeared transparent preceding curing, indicating no
macroscopic phase separation and complete miscibility with the epoxy precursor.
Preparation of different block-copolymer/epoxy blends are presented in Section 2.2.2.
Previously, Ritzenthaler et al. [42] and Woo and Wu [43] reported formation of
homogenous solutions between different compositions of poly(methylmethacrylate)
(PMMA) with DGEBA. Their inference was based on the transparency of the solutions
and the detection of a single glass transition temperature that is dependent on the
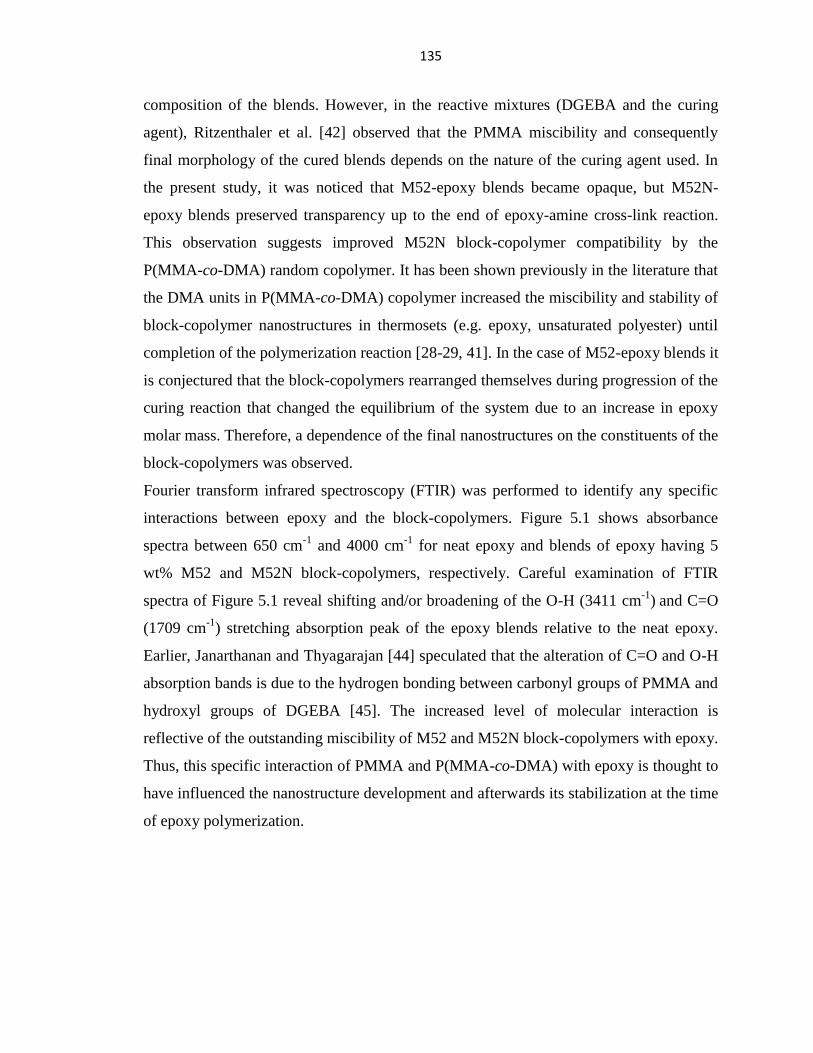
135
composition of the blends. However, in the reactive mixtures (DGEBA and the curing
agent), Ritzenthaler et al. [42] observed that the PMMA miscibility and consequently
final morphology of the cured blends depends on the nature of the curing agent used. In
the present study, it was noticed that M52-epoxy blends became opaque, but M52N-
epoxy blends preserved transparency up to the end of epoxy-amine cross-link reaction.
This observation suggests improved M52N block-copolymer compatibility by the
P(MMA-co-DMA) random copolymer. It has been shown previously in the literature that
the DMA units in P(MMA-co-DMA) copolymer increased the miscibility and stability of
block-copolymer nanostructures in thermosets (e.g. epoxy, unsaturated polyester) until
completion of the polymerization reaction [28-29, 41]. In the case of M52-epoxy blends it
is conjectured that the block-copolymers rearranged themselves during progression of the
curing reaction that changed the equilibrium of the system due to an increase in epoxy
molar mass. Therefore, a dependence of the final nanostructures on the constituents of the
block-copolymers was observed.
Fourier transform infrared spectroscopy (FTIR) was performed to identify any specific
interactions between epoxy and the block-copolymers. Figure 5.1 shows absorbance
spectra between 650 cm-1
and 4000 cm-1
for neat epoxy and blends of epoxy having 5
wt% M52 and M52N block-copolymers, respectively. Careful examination of FTIR
spectra of Figure 5.1 reveal shifting and/or broadening of the O-H (3411 cm-1
) and C=O
(1709 cm-1
) stretching absorption peak of the epoxy blends relative to the neat epoxy.
Earlier, Janarthanan and Thyagarajan [44] speculated that the alteration of C=O and O-H
absorption bands is due to the hydrogen bonding between carbonyl groups of PMMA and
hydroxyl groups of DGEBA [45]. The increased level of molecular interaction is
reflective of the outstanding miscibility of M52 and M52N block-copolymers with epoxy.
Thus, this specific interaction of PMMA and P(MMA-co-DMA) with epoxy is thought to
have influenced the nanostructure development and afterwards its stabilization at the time
of epoxy polymerization.

136
Figure 5.1 FTIR spectra of cured (a) neat epoxy and (b) 5 wt% M52 and (c) 5 wt%
M52N modified epoxy blends.
5.2.2 Microstructure of Cured Block-copolymer/Epoxy Blends
The epoxy blends that were modified with M52 block-copolymer are opaque, and the
ones containing M52N block-copolymer are transparent after cure as shown in Figure
5.2. This observation suggests that in M52 modified epoxy the dispersed phases are
probably large enough to scatter visible light; this interpretation has been further
supported by TEM microscopy. TEM micrographs shown in Figure 5.3 and 5.4 reveal a
two-phase morphology of the block-copolymer modified epoxy, where the epoxy domain
appears gray and block-copolymer phase seems black. Randomly dispersed bilayer
vesicles with size ranging between 200~400 nm are visible in the M52-epoxy blend (see
Figure 5.3). In Figure 5.4, samples made with M52N exhibit disordered spherical
micelles with diameter of approximately 20~30 nm and without any sharp interface (i.e.
0
0.1
0.2
0.3
0.4
0.5
0.6
5001000150020002500300035004000
Ab
sorb
an
ce
Wavenumbers (cm-1)
(c)
(b)
(a)
OH (3411cm-1)
OH (3416cm-1)
OH (3424cm-1) C=O (1733cm-1)
C=O (1709cm-1)
C=O (1709cm-1)

137
diffused boundary) between the matrix and block-copolymers. Similar nanostructured
morphologies have been reported earlier by Gerard et al. [28] and Maiez-Tribut et al. [41]
between epoxy and P[(MMA-co-DMA)-b-BuA-b-(MMA-co-DMA)] block-copolymer.
Gerard et al. [28] reported a reaction-induced phase separation of PMMA homopolymers
and P[MMA-b-BuA-b-MMA] block-copolymers in epoxy, but when a random
copolymer of methylmethacrylate (MMA) and N,N-dimethylacrylamide (DMA) was
introduced in epoxy, a miscible mixture was achieved. Therefore, it is presumed in this
study that the existence of P(MMA-co-DMA) block in the M52N block-copolymer
stabilizes the micelle configurations during the time of epoxy curing. Spherical micelles
have a structure consisting of a rubbery core encircled by a spherical hard shell. On the
other hand, vesicles are made of a bilayer spherical shell enclosing an epoxy core.
Previous studies on amphiphilic block-copolymers in epoxy systems documented
transitions from spherical to cylindrical micelles to vesicles with decreasing volume
fraction of the miscible block [31-34]. The TEM micrographs also evidence the absence
of macroscopic phase-separation of different polymer phases.
Figure 5.2 Transparency of (a) neat epoxy and (b) 3 wt% M52, (c) 3 wt% M52N, (d) 5
wt% M52N and (e) 5 wt% M52 modified epoxy blends.
(a)(b)(c)(d)(e)

138
Figure 5.3 TEM micrographs of 3 wt% M52 block-copolymer modified epoxy blends at
(a) low and (b) high magnifications.
Figure 5.4 TEM micrographs: (a) 3 wt% M52N (without osmic acid straining) and (b) 5
wt% M52N (with osmic acid staining) block-copolymer modified epoxy blends.
Figure 5.5 shows the DSC traces of pure epoxy and its blends with 5 wt% M52 and
M52N block-copolymers respectively. The evolution of a single glass transition
temperature (Tg) slightly lower than the Tg of neat epoxy indicates a uniform dispersion
of block-copolymer to a very small scale (i.e. nano-scale) and good compatibility with
epoxy [34, 37, 42]. In Figure 5.6 dynamic mechanical-thermal spectra from DMA test are
compared between 5 wt% block-copolymer/epoxy blends and neat epoxy. From the tan δ
versus temperature plot maximum peak values were taken as the α-relaxation peak
representing the glass transition temperature. In the fully cured epoxy blends, a single
1000 nm
(a)
5000 nm
(b)
500 nm 100 nm
(a) (b)

139
relaxation peak near the pure epoxy relaxation is located. This observation further
corroborates previous TEM and DSC results that macrophase phase-separation did not
take place during thermoset network formation, but rather that dispersed nanostructured
domains randomly distributed in the epoxy substrate. It was noticed that the Tg values
measured for neat epoxy are 117oC and 119
oC according to the DSC and DMTA
methods, which indeed are quite close. The Tg values estimated for the block-copolymer
modified epoxy demonstrated some variability among different measurement methods,
which again can be considered well within the experimental uncertainty of these
techniques. Furthermore, it was observed that the relaxation time was shortened in the
case of the modified systems with respect to the neat resin, yet this observation is not
very conclusive. It was also ascertained from the DMTA results that the modified epoxies
exhibited a lower storage modulus value compared to the neat epoxy in the 30oC to 100
oC
temperature range.
Figure 5.5 DSC thermograms of cured (a) neat epoxy and (b) 5 wt% M52 and (c) 5 wt%
M52N block-copolymer modified epoxy.
-0.1
-0.05
0
0.05
0.1
0.15
50 100 150 200
He
at flo
w [W
/g]
Temperature [0C]
Neat epoxy M52/Epoxy
M52N/Epoxy
(a)
(b)
(c)

140
Figure 5.6 DMTA plot showing storage modulus and tan δ curves of neat and 5 wt%
block-copolymer modified epoxy.
5.2.3 Tensile Properties of Block-copolymer/Epoxy Blends
Average tensile property values are reported in Table 5-1 along with the corresponding
standard deviations. At least four specimens were tested for each epoxy blends except
that the 3 wt% M52N modified epoxy data is based on only two tests. The influence of
the block-copolymer weight percentages on mechanical properties of the cured epoxy is
shown in Figures 5.7 and 5.8. Tensile modulus of M52 and M52N modified epoxy
systems are compared in Figure 5.7 for various block-copolymer concentrations. It was
observed that stiffness remained almost unchanged with increasing M52 content, while
the addition of M52N caused a slight reduction in modulus [38]. Tensile strength results
are presented in Figure 5.8 for the modified epoxy blends. As expected, strength values
decreased only marginally for the whole range of modifier concentrations studied.
Pearson and Yee [6] and Bagheri and Pearson [9, 22] reported that increasing rubber
content caused reduction of the modulus and yield strength of modified epoxies. It has
been discussed in the literature [6, 9, 10, 15] that the application of tensile loading
resulted in stress concentrations around the particle inclusions until dissipation of this
0
0.1
0.2
0.3
0.4
0.5
0.6
0.7
0.0E+00
5.0E+08
1.0E+09
1.5E+09
2.0E+09
2.5E+09
3.0E+09
20 40 60 80 100 120 140 160
Ta
n δ
Sto
rag
e m
od
ulu
s [P
a]
Temperature [°C]
M52/Epoxy M52N/Epoxy Epoxy

141
energy by matrix deformation, leading to a reduction in the yield stress of the material. A
similar tendency is observed in the present study for the block-copolymer/epoxy blends
with a minor reduction in strength and stiffness. It was also inferred that with increasing
block-copolymer concentration, more dispersed particles with interacting/overlapping
stress fields would further decrease composite failure strength [6]. It is thought that the
particle size and distribution, morphology (e.g. micelles and vesicles) and interfacial
adhesion all played an important role in the stress distribution around the particles. It
should be noted that the vesicles are made of spherical structures of hard and rubbery
shells and an enclosed epoxy domain. It is presumed that a complex stress state exists
associated with the vesicles, which will require further investigation of the stress
distribution in epoxy to fully understand the mechanism of failure. In general, retention of
both tensile modulus and strength is an indication of good compatibility (e.g. interface
property) and stability of the nanostructured block-copolymers with epoxy. Room
temperature modulus values normalized with respect to the unmodified epoxy are plotted
in Figure 5.9, presenting both tensile and DMTA (see also Figure 5.6) test data. These
results indicate consistency and good agreement among different test methods regarding
measurement of modulus. The block-copolymer addition resulted in a modest drop in
epoxy stiffness, irrespective of the test method used.
Table 5-1 Property of modified epoxy blends constraining various types and
concentrations of block-copolymers.
Filler matrix
loading (wt%)
Tensile
modulus
(GPa)
Tensile
strength
(MPa)
Fracture
toughness
(MPam0.5
)
Strain
energy
(J/m2)
Glass
transition
temp (0C)
0 (neat epoxy) 2.82 ± 0.08 82.2 ± 1.56 0.78 ± 0.05 235 ±28 117
1 wt% M52 2.81 ± 0.11 79.6 ± 1.07 0.99 ± 0.06 350 ± 46 104
3 wt% M52 2.73 ± 0.03 76.7 ± 2.35 1.28 ± 0.07 605 ± 44 110
5 wt% M52 2.78 ± 0.03 75.6 ± 0.4 1.51 ± 0.06 865 ± 55 108
1 wt% M52N 2.71 ± 0.04 78.8 ± 0.6 0.87 ± 0.04 285 ± 37 115
3 wt% M52N 2.68 ± 0.01 74.1 ± 2.89 1.26 ± 0.12 495 ± 78 99
5 wt% M52N 2.64 ± 0.05 77.7 ± 0.38 1.48 ± 0.03 765 ± 60 111

142
Figure 5.7 Tensile modulus of modified epoxy as a function of block-copolymer content.
Figure 5.8 Influence of block-copolymer concentration on tensile strength of modified
epoxy.
0
0.5
1
1.5
2
2.5
3
3.5
0% 1% 2% 3% 4% 5% 6%
Te
nsile
mo
du
lus [G
Pa
]
Epoxy block-copolymer loading [wt%]
M52/Epoxy M52N/Epoxy
0
10
20
30
40
50
60
70
80
90
0% 1% 2% 3% 4% 5% 6%
Te
nsile
str
en
gth
[M
Pa
]
Epoxy block-copolymer loading [wt%]
M52/Epoxy M52N/Epoxy

143
Figure 5.9 Effect of block-copolymer content on modulus of modified epoxy.
5.2.4 Fracture Properties of Block-copolymer/Epoxy Blends
Figure 5.10 illustrates fracture toughness of modified epoxy as a function of block-
copolymer content. All the epoxy blends greatly enhanced epoxy fracture toughness
approximately proportional to modifier loading, that is, the data points for the fracture
toughness of the modified epoxy in Figure 5.10 follow a liner relationship with block-
copolymer concentration. But, it is expected that at significantly higher concentrations the
initial linear trend will eventually reach a plateau, similar to the behavior what was
observed in the case of rubber modified epoxy [9, 18]. An approximately two-fold
increase for both the M52 and M52N blends was the observed maximum for a modifier
loading of 5 wt%. Critical strain energy release rate values are presented in Figure 5.11.
As expected, the strain energy for the blends containing 5 wt% block-copolymers
improved remarkably by a factor of 3.5 for the M52 and about 3.2 for the M52N over the
base epoxy. The vesicles in M52 modified epoxy generated marginally higher fracture
toughness than the spherical micelles of M52N block-copolymer. Comparable
0.5
0.6
0.7
0.8
0.9
1
1.1
0% 1% 2% 3% 4% 5% 6%
No
rma
lize
d m
od
ulu
s [/]
Epoxy block-copolymer loading [wt%]
M52/Epoxy (Tensile)
M52/Epoxy (Storage)
M52N/Epoxy (Tensile)
M52N/Epoxy (Storage)

144
improvements in the fracture energy for vesicles and spherical micelles toughened epoxy
systems have been reported before in the published literature [30, 33-34]. It is thought
that the cavitation/debonding of the block-copolymer inclusions and subsequent matrix
shear deformation are the main energy dissipation modes for the modified epoxy blends
[27, 36], which has been discussed further in light of the micromechanisms of the fracture
process in the following.
Figure 5.10 Fracture toughness of modified epoxy plotted against corresponding block-
copolymer concentration.
Fracture surface micrographs (using SEM) of pure epoxy and block-copolymer
toughened epoxy are displayed in Figures 4.16 (see Chapter 4), 5.12 and 5.13. The neat
epoxy fracture surface shown in Figure 4.16 is clearly plain and featureless, which is
typical of a brittle failure in an amorphous material. In comparison to the neat resin, the
fracture surface of M52 modified epoxy shown at low magnification in Figure 5.12(a) is
extensively uneven, more convoluted and coarse, which are definite signs of significant
crack resistance. Morphological evidence from the higher magnification image of Figure
0
0.2
0.4
0.6
0.8
1
1.2
1.4
1.6
1.8
0% 1% 2% 3% 4% 5% 6%
Fra
ctu
re to
ug
hn
ess [M
Pa
.m.5]
Epoxy block-copolymer loading [wt%]
M52/Epoxy M52N/Epoxy

145
5.12(b) exhibits vesicle pullout, spherical craters, cleaved edges and matrix deformation.
These visible markings on the cracked surface correlate well with the large fracture
toughness increase observed with the vesicles morphology. Therefore, from the above
illustrations, it may be hypothesized that in the M52 modified epoxy, crack propagation is
predominantly by particle-matrix interfacial debonding followed with matrix shear
deformation and/or by crack deflection, which are all energy absorption phenomena [32,
34]. As the opposite fracture surfaces detached by ligament breaking, the vesicles either
extracted or remained embedded in the same position to the matrix. It becomes apparent
that vesicle cavitation did not take place because of an encased inner core made of a rigid
cross-linked epoxy network having high cavitation resistance. Also from Figure 5.12(b)
uniform dispersion of vesicles is clearly evident.
Figure 5.11 Strain energy release rate of modified epoxy plotted against corresponding
block-copolymer concentration.
It is apparent from the low magnification image in Figure 5.13(a) that the spherical
micelles in M52N modified epoxy generated matrix rich regions and relatively plain
0
100
200
300
400
500
600
700
800
900
1000
0% 1% 2% 3% 4% 5% 6%
Str
ain
en
erg
y r
ele
ase
ra
te [J/m
2]
Epoxy block-copolymer loading [wt%]
M52/Epoxy M52N/Epoxy
146
surface features devoid of significant matrix damage that is reminiscent of pure epoxy.
Figures 5.13(b)-(c) (at high magnification) shows some interesting surface morphology of
the epoxy matrix that contains spherical micelles, such as minute spherical nano-cavities
and microscopic fine surface roughness. It is surprising to note that the size and
morphology of the spherical micelles and vesicles have marked differences, but are still
able to yield equivalent toughness. Several researchers have documented the importance
of the reinforcement size in rubber toughened [1, 8, 19-20] and block-copolymer [34]
modified epoxies. The vesicles studied are well within the optimal size ranges of 0.2 to 5
μm, but the micelles size fall below that reported previously for efficient toughening of
epoxy. Pearson and Yee [8] showed that smaller rubber particles were more effective in
toughening epoxy than the larger particles, and their smallest particles were about 0.2 µm
in size. According to Pearson and Yee [8], the particle size effect on toughening can be
realized based on its behavior at the crack-tip plastic zone, i.e. smaller particles cavitate,
while larger particles play the role of bridging sites. Recently, Liu et al. [38] showed
evidence of nano-scale cavitation processes in spherical micelles as small as 15 nm in
size by relieving the hydrostatic stress state at the crack-tip. Similar toughening
mechanisms are well established in the field of rubber modified epoxy [5-8].
In agreement with the hypothesis presented by Wu et al. [32] and Liu et al. [38], the
present author speculates that during plane-strain fracture testing the triaxial stress state at
the crack front dilates/cavitates the poly(n-butylacrylate) rubbery core of the micelles,
thereby modifying the stress condition to initiate matrix shear yielding. Hence, for the
spherical micelles, the crack resistance mechanism is equivalent of particle cavitation
(debonding), which alters the stress field ahead of the crack-tip and promotes matrix
shear yielding. The above observation is also supported by tensile and fracture toughness
results. Wu et al. [32] and Gerard et al. [28] respectively showed worm-like (cylindrical)
micelles and micro-clustered block-copolymer structures (i.e. interconnected/co-
continuous structures), which demonstrated the highest fracture toughness improvements.
Therefore, it can be presumed that in the present study even greater toughness
enhancement would be achieved if a worm-like micelle structure or an interconnected
morphology [21-22] was obtained.

147
Figure 5.12 Fracture surface micrographs (SEM) of modified epoxy comprised of 3 wt%
M52 block-copolymer at (a) low (1000x) and (b) high (10000x) magnifications.
Figure 5.13 Fracture surface micrographs (SEM) of modified epoxy comprised of 3 wt%
M52N block-copolymer: (a) low magnification of 20000x and high magnification of (b)
50000x and (c) 100000x.
(a) (b)
1 µm10 µm
(a) (b)
100 nm1 µm
100 nm
(c)

148
5.3 CONCLUSIONS
The present chapter documents the formation of well dispersed nanostructured phases by
self-assembly of block-copolymers within the epoxy polymer. The constituents of the
block-copolymer were found to be very important for the initial nanostructuration of the
epoxy; especially the epoxy miscible blocks have shown pronounced influence over the
formation of nano-domains, i.e. spherical micelles and vesicles. The modified epoxy
showed improved toughness, which is dependent on filler concentrations and
morphology. In the investigated DGEBA epoxy system improvements in toughness were
achieved without any significant reductions in other desirable mechanical (e.g. structural
stiffness and strength) properties. A causal relationship between the modifier morphology
and resulting property enhancement of the block-copolymer/epoxy system was presented.
In the developed epoxy systems, the dispersed block-copolymer modifiers act to induce
shear yielding of the matrix by relieving the triaxial stress condition at the crack-tip with
mechanisms such as cavitation and/or debonding of the toughener phase. These are all
accepted crack resistance mechanisms for rubber toughened epoxy, and have been
reported recently in the literature [27-28, 30-36, 38-40] concerning amphiphilic block-
copolymer modified epoxy. It is surprising to note that despite differences in block-
copolymer compositions, particle morphology and size-scale, both spherical micelles and
vesicles resulted in equivalent mechanical properties. The above observation would
require more investigation to further elucidate these phenomena. It is presumed that final
properties are greatly influenced by the constituents of the block-copolymers, their self-
assembling morphology and the induced deformation mechanics under applied loading.
The greater advantages of using block-copolymers in epoxy are improved toughness with
far lower additive requirement (for example in comparison to the CTBN rubber loading),
chemical compatibility between the dispersed and continuous phases providing strong
interfacial properties, and the retention of important thermo-mechanical properties.

149
REFERENCES
1. SULTAN, J. and MCGARRY, F., 1973. Effect of Rubber Particle-Size on
Deformation Mechanisms in Glassy Epoxy. Polymer Engineering and Science, 13(1), pp.
29-34.
2. C.B. BUCKNALL, 1977. Toughened Plastics. London: Applied Science
Publishers LTD.
3. KUNZDOUGLASS, S., BEAUMONT, P. and ASHBY, M., 1980. A Model for
the Toughness of Epoxy-Rubber Particulate Composites. Journal of Materials Science,
15(5), pp. 1109-1123.
4. BASCOM, W., COTTINGTON, R., JONES, R. and PEYSER, P., 1975. Fracture
of Epoxy-Modified and Elastomer-Modified Epoxy Polymers in Bulk and as Adhesives.
Journal of Applied Polymer Science, 19(9), pp. 2545-2562.
5. KINLOCH, A.J., SHAW, S.J., TOD, D.A. and HUNSTON, D.L., 1983.
Deformation and fracture behaviour of a rubber-toughened epoxy: 1. Microstructure and
fracture studies. Polymer, 24(10), pp. 1341-1354.
6. YEE, A.F. and PEARSON, R.A., 1986. Toughening mechanisms in elastomer-
modified epoxies - Part 1 Mechanical studies. Journal of Materials Science, 21(7), pp.
2462-2474.
7. PEARSON, R.A. and YEE, A.F., 1989. Toughening mechanisms in elastomer-
modified epoxies - Part 3 The effect of cross-link density. Journal of Materials Science,
24(7), pp. 2571-2580.
8. PEARSON, R.A. and YEE, A.F., 1991. Influence of particle size and particle size
distribution on toughening mechanisms in rubber-modified epoxies. Journal of Materials
Science, 26(14), pp. 3828-3844.
9. BAGHERI, R. and PEARSON, R.A., 1996. Role of particle cavitation in rubber-
toughened epoxies: 1. Microvoid toughening. Polymer, 37(20), pp. 4529-4538.
10. GUILD, F.J. and YOUNG, R.J., 1989. A predictive model for particulate filled
composite materials - Part 2 Soft particles. Journal of Materials Science, 24(7), pp. 2454-
2460.

150
11. LEVITA, G., DE PETRIS, S., MARCHETTI, A. and LAZZERI, A., 1991.
Crosslink density and fracture toughness of epoxy resins. Journal of Materials Science,
26(9), pp. 2348-2352.
12. KANG, B.U., JHO, J.Y., KIM, J., LEE, S.-S., PARK, M., LIM, S. and CHOE,
C.R., 2001. Effect of molecular weight between crosslinks on the fracture behavior of
rubber-toughened epoxy adhesives. Journal of Applied Polymer Science, 79(1), pp. 38-
48.
13. KINLOCH, A.J., YUEN, M.L. and JENKINS, S.D., 1994. Thermoplastic-
toughened epoxy polymers. Journal of Materials Science, 29(14), pp. 3781-3790.
14. GIRODET, C., ESPUCHE, E., SAUTEREAU, H., CHABERT, B., GANGA, R.
and VALOT, E., 1996. Influence of the addition of thermoplastic preformed particles on
the properties of an epoxy/anhydride network. Journal of Materials Science, 31(11), pp.
2997-3002.
15. HÖFFLIN, F., KÖNCZÖL, L., DÖLL, W., MORAWIEC, J. and MÜLHAUPT,
R., 2000. Toughening of epoxy resins modified with polyetherester block copolymers:
the influence of modifier molecular architecture on mechanical properties. Journal of
Applied Polymer Science, 76(5), pp. 623-634.
16. ZHENG, S., WANG, J., GUO, Q., WEI, J. and LI, J., 1996. Miscibility,
morphology and fracture toughness of epoxy resin/poly(styrene-co-acrylonitrile) blends.
Polymer, 37(21), pp. 4667-4673.
17. LIN, K.-F. and SHIEH, Y.-D., 1998. Core-shell particles designed for toughening
the epoxy resins. II. Core-shell-particle-toughened epoxy resins. Journal of Applied
Polymer Science, 70(12), pp. 2313-2322.
18. HE, J., RAGHAVAN, D., HOFFMAN, D. and HUNSTON, D., 1999. The
influence of elastomer concentration on toughness in dispersions containing preformed
acrylic elastomeric particles in an epoxy matrix. Polymer, 40(8), pp. 1923-1933.
19. KIM, D.S., CHO, K., KIM, J.K. and PARK, C.E., 1996. Effects of particle size
and rubber content on fracture toughness in rubber-modified epoxies. Polymer
Engineering and Science, 36(6), pp. 755-768.
20. BÉCU-LONGUET, L., BONNET, A., PICHOT, C., SAUTEREAU, H. and
MAAZOUZ, A., 1999. Epoxy Networks Toughened by Core-Shell Particles: Influence of

151
the Particle Structure and Size on the Rheological and Mechanical Properties. Journal of
Applied Polymer Science, 72(6), pp. 849-858.
21. QIAN, J.Y., PEARSOR, R.A., DIMONIE, V.L., SHAFFER, O.L. and EL-
AASSER, M.S., 1997. The role of dispersed phase morphology on toughening of
epoxies. Polymer, 38(1), pp. 21-30.
22. BAGHERI, R. and PEARSON, R.A., 1996. Role of blend morphology in rubber-
toughened polymers. Journal of Materials Science, 31(15), pp. 3945-3954.
23. GARG, A.C. and MAI, Y.-W., 1988. Failure mechanisms in toughened epoxy
resins-A review. Composites Science and Technology, 31(3), pp. 179-223.
24. SUE, H.-J., GARCIA-MEITIN, E.I. and PICKELMAN, D.M.,1993. Toughening
concept of rubber-modified high performance epoxies. In: CHEREMISINOFF, N.P. and
CHEREMISINOFF, P.N., ed, Elastomer Technology Handbook. Boca Raton: CRC Press,
pp. 661.
25. DAY, R.J., LOVELL, P.A. and PIERRE, D., 1997. Toughening of epoxy resins
using particles prepared by emulsion polymerization: Effects of particle surface
functionality, size and morphology on impact fracture properties. Polymer International,
44(3), pp. 288-299.
26. THOMPSON, Z.J., HILLMYER, M.A., LIU, J., SUE, H.-J., DETTLOFF, M. and
BATES, F.S., 2009. Block copolymer toughened epoxy: Role of cross-link density.
Macromolecules, 42(7), pp. 2333-2335.
27. HYDRO, R.M. and PEARSON, R.A., 2007. Epoxies toughened with triblock
copolymers. Journal of Polymer Science, Part B: Polymer Physics, 45(12), pp. 1470-
1481.
28. GERARD, P., BOUPAT, N.P., FINE, T., GERVAT, L. and PASCAULT, J.-P.,
2007. Toughness properties of lightly crosslinked epoxies using block copolymers.
Macromolecular Symposia, 256, pp. 55-64.
29. SERRANO, E., GERARD, P., LORTIE, F., PASCAULT, J.-P. and PORTINHA,
D., 2008. Nanostructuration of unsaturated polyester by all-acrylic block copolymers, 1 -
use of high-molecular-weight block copolymers. Macromolecular Materials and
Engineering, 293(10), pp. 820-827.

152
30. RUIZ-PÉREZ, L., ROYSTON, G.J., FAIRCLOUGH, J.P.A. and RYAN, A.J.,
2008. Toughening by nanostructure. Polymer, 49(21), pp. 4475-4488.
31. THIO, Y.S., WU, J. and BATES, F.S., 2006. Epoxy toughening using low
molecular weight poly(hexylene oxide)-poly(ethylene oxide) diblock copolymers.
Macromolecules, 39(21), pp. 7187-7189.
32. WU, J., THIO, Y.S. and BATES, F.S., 2005. Structure and properties of PBO-
PEO diblock copolymer modified epoxy. Journal of Polymer Science, Part B: Polymer
Physics, 43(15), pp. 1950-1965.
33. DEAN, J.M., LIPIC, P.M., GRUBBS, R.B., COOK, R.F. and BATES, F.S., 2001.
Micellar structure and mechanical properties of block copolymer-modified epoxies.
Journal of Polymer Science, Part B: Polymer Physics, 39(23), pp. 2996-3010.
34. DEAN, J.M., GRUBBS, R.B., SAAD, W., COOK, R.F. and BATES, F.S., 2003.
Mechanical properties of block copolymer vesicle and micelle modified epoxies. Journal
of Polymer Science, Part B: Polymer Physics, 41(20), pp. 2444-2456.
35. DEAN, J.M., VERGHESE, N.E., PHAM, H.Q. and BATES, F.S., 2003.
Nanostructure toughened epoxy resins. Macromolecules, 36(25), pp. 9267-9270.
36. KISHI, H., KUNIMITSU, Y., IMADE, J., OSHITA, S., MORISHITA, Y. and
ASADA, M., 2011. Nano-phase structures and mechanical properties of epoxy/acryl
triblock copolymer alloys. Polymer, 52(3), pp. 760-768.
37. LARRAÑAGA, M., SERRANO, E., MARTIN, M.D., TERCJAK, A.,
KORTABERRIA, G., DE LA CABA, K., RICCARDI, C.C. and MONDRAGON, I.,
2007. Mechanical properties-morphology relationships in nano-/microstructured epoxy
matrices modified with PEO-PPO-PEO block polymers. Polymer International, 56(11),
pp. 1392-1403.
38. LIU, J., SUE, H.-J., THOMPSON, Z.J., BATES, F.S., DETTLOFF, M., JACOB,
G., VERGHESE, N. and PHAM, H., 2008. Nanocavitation in self-assembled amphiphilic
block copolymer-modified epoxy. Macromolecules, 41(20), pp. 7616-7624.
39. BASHAR, M.T., SUNDARARAJ, U. and MERTINY, P., 2011. Study of Matrix
Micro-cracking in Nanoclay and Acrylic Tri-block-copolymer Modified Epoxy/basalt
Fiber-reinforced Pressure-retaining Structures. Express polymer letters, 5, pp. 882-896.
153
40. BASHAR, M.T., SUNDARARAJ, U. and MERTINY, P., 2012. Microstructure
and mechanical properties of epoxy hybrid nanocomposites modified with acrylic tri-
block-copolymer and layered-silicate nanoclay. Composites Part A: Applied Science and
Manufacturing, 43, pp. 945-954.
41. MAIEZ-TRIBUT, S., PASCAULT, J.P., SOULÉ, E.R., BORRAJO, J. and
WILLIAMS, R.J.J., 2007. Nanostructured epoxies based on the self-assembly of block
copolymers: A new miscible block that can be tailored to different epoxy formulations.
Macromolecules, 40(4), pp. 1268-1273.
42. RITZENTHALER, S., GIRARD-REYDET, E. and PASCAULT, J.P., 2000.
Influence of epoxy hardener on miscibility of blends of poly(methyl methacrylate) and
epoxy networks. Polymer, 41(16), pp. 6375-6386.
43. WOO, E.M. and WU, M.N., 1996. Blends of a diglycidylether epoxy with
bisphenol-A polycarbonate or poly(methyl methacrylate): Cases of miscibility with or
without specific interactions. Polymer, 37(12), pp. 2485-2492.
44. JANARTHANAN, V. and THYAGARAJAN, G., 1992. Miscibility studies in
blends of poly(N-vinyl pyrrolidone) and poly(methyl methacrylate) with epoxy resin: a
comparison. Polymer, 33(17), pp. 3593-3597.
45. KWEI, T.K., 1984. EFFECT OF HYDROGEN BONDING ON THE GLASS
TRANSITION TEMPERATURES OF POLYMER MIXTURES. Journal of polymer
science. Polymer letters edition, 22(6), pp. 307-313.

154
Chapter 6
Microstructure and Mechanical Properties of Epoxy Hybrid
Nanocomposites3
SYNOPSIS: In this chapter the morphology and mechanical properties of acrylic
triblock-copolymer and organophilic layered silicate nanoclay modified epoxy hybrid
nanocomposites were investigated. Three-phase ternary nanocomposites showed
coexistence of both intercalated nanoclay and nanostructured block-copolymer (i.e.
spherical micelles) in epoxy. Experimental results revealed that the block-copolymer
significantly enhanced fracture toughness. Increased toughness coincided with a slight
reduction of tensile stiffness and strength in the case of block-copolymer modified epoxy.
The nanoclay filled nanocomposites exhibited superior stiffness and slight improvement
in tensile strength while compromising ductility. Optimum property enhancement was
observed in the case of epoxy hybrid nanocomposites. Mechanical properties of the
hybrid nanocomposites depend on microstructure, dispersion state and the ratio between
organic and inorganic nanofiller contents.
6.1 INTRODUCTION
Polymer nanocomposites are emerging as a new breed of high performance materials,
exceeding many of the properties of the conventional polymer composites [1-5].
Sometimes a compromise between properties must be tolerated because
multifunctionality in all three dimensions and different length scales is difficult to
achieve. However, by incorporating two or more different types of nanoparticles, and
combining their useful properties in a matrix substrate may effectively circumvent the
above situation. Thereby a material possessing various favorable characteristics necessary
for certain high-performance applications can be produced.
3 A version of this chapter has been published as: BASHAR, M., SUNDARARAJ, U. and MERTINY, P.,
2012. Microstructure and mechanical properties of epoxy hybrid nanocomposites modified with acrylic tri-
block-copolymer and layered-silicate nanoclay. Composites A, 43(6), pp. 945-954.

155
Epoxy is preferred for many applications in the aerospace, marine and automobile
industries. But, the inherent brittleness of epoxy resulted in limited resistance against
crack propagation. Several methods have been frequently employed to provide excellent
toughening to epoxy. Among these, incorporating a second rubbery phase is a commonly
recognized practice. General wisdom about rubbery and rigid particulate inclusions is that
soft particles increase ductility and toughness, and conversely, hard particles enhance
stiffness and strength of the polymer matrix. The above statement was found justified
also for the present study as revealed by the subsequently presented results.
Extensive research has been conducted by incorporating a diverse range of dispersed
phases into the epoxy matrix, i.e. liquid rubbers [6-9], thermoplastic spheres [10-12],
core-shell particles [13-16] and nanostructured block-copolymers [17-21]. In most of
these cases, improved toughness was achieved whilst lowering the stiffness and strength
of epoxy. Inorganic particles such as silica [22-23], glass beads [8], alumina [22] and
nanoclay [1-5, 12, 14-16, 24-26] are known to enhance stiffness, strength and in some
instances toughness of the thermoset epoxy while compromising ductility.
Thus, blending both rigid and rubbery nanoparticles in a thermosetting polymer would be
an interesting alternative. Previous studies have successfully incorporated two or more
particulate reinforcements in an epoxy, thereby generating so-called hybrid composites
[4-5, 8, 12, 14-16, 24-25]. A recent study conducted by Marouf et al. [16] provided an
excellent and brief review on nanoclay-filled/rubber-modified epoxy hybrid
nanocomposites. Most of the publications documented significant improvements in
fracture energy while maintaining stiffness, strength and ductility of the unmodified
epoxy through formation of a ternary nanocomposite [14, 24-25]. The synergistic effects
of both rubber and nanoclay on thermosetting epoxy were cited as the reason for these
enhancements. Rubber particle cavitation [14, 16, 25], matrix shear yielding [14, 25],
crack bifurcation and deflection by clay particles [5, 14, 16, 25] were attributed to be the
predominant crack resistance phenomena in epoxy hybrid nanocomposites. In contrast to
the single-additive system, a reduction in fracture energy of the hybrid epoxy was also
observed [15-16]. Marouf et al. [16] speculated that in a hybrid nanocomposite, the
occurrence of competing micromechanisms associated with dispersed rubber and
nanoclay were responsible for this behavior.

156
Much of the literature on epoxy hybrid composites focused either on two different micro
particles [8] or micro-nano combinations containing micron size rubber particles [15, 23-
25]. Previous chapters already described the significant improvements in fracture energy
by dispersing acrylic based block-copolymer in epoxy, and the considerable increase of
stiffness imparted by nanoclay addition. Therefore, in an effort to synergistically combine
favorable properties of various nano-reinforcements in a thermosetting epoxy, the current
study incorporated two different nano-phases, i.e. acrylic triblock-copolymer M52N and
layered silicate I.30E nanoclay into the epoxy polymer. It has been reported in the
technical literature [17-19] that significant improvement in epoxy toughness can be
achieved with relatively minor reductions in strength and elastic modulus when a small
amount of block-copolymer was added as a modifier. The significant enhancement of
fracture resistance was primarily attributed to the nanostructuration of block-copolymers
within epoxy matrix, which is very much dependent on the specific morphology of the
nano-inclusions (i.e. spherical micelles, cylindrical micelles and vesicles). On the other
hand, nanoclay is well known for developing a marked increase in epoxy stiffness with
the formation of nanocomposites [1-3, 27-29], and several investigators have
demonstrated improved toughness mainly with conventional and intercalated clay
morphologies [27-29].
The focus of this work was to synergistically enhance mechanical properties (such as
tensile stiffness, strength and fracture toughness) of the resulting hybrid nanocomposites.
The current study involved characterizing the nanocomposites by various morphological
examinations. Toughening mechanisms and tensile yield behaviors were explored with
respect to the associated modifier compositions. The formulations of the single-
component epoxy systems and hybrid nanocomposites as evaluated and compared in this
chapter are summarized in Table 6-1.
6.2 RESULTS AND DISCUSSION
6.2.1 X-ray Diffraction Analysis of Hybrid Nanocomposites
Figure 6.1 compares X-ray diffraction results of the single-component epoxy-clay
nanocomposites with hybrid nanocomposites containing both block-copolymer and clay

157
nanoparticles. The preparation methods of single-component and hybrid nanocomposites
are described in the Sections 2.2.1.2, 2.2.2 and 2.2.3. XRD traces of I.30E-epoxy
nanocomposites revealed that the prominent diffraction peak was absent when 1 wt% and
2 wt% I.30E were incorporated in epoxy. Hybrid nanocomposites (i.e. 3B&1C and
1B&3C) examined by X-ray diffraction also did not exhibit any well-defined peak [24].
The absence of the diffraction peak is indicative of either an exfoliated morphology or
highly intercalated structure for the prepared nanocomposites. Even coexistence of an
exfoliated and intercalated morphology cannot be fully discerned, so further investigation
by TEM microscopy was required. Therefore, from the XRD results, it was confirmed
that the epoxy polymer was able to effectively penetrate between the clay interlayers. It
has been assumed that during the curing, catalytic effect of the primary alkylammonium
ions of the nanoclay influenced the epoxy-amine curing reaction, and increased the clay
interlamellar distance. It can also be inferred from the XRD curves in Figure 6.1 that the
individual clay platelets are at least 8.8 nm apart from each other, which is the detection
limit of the WAXD.
Table 6-1 Compositions of different single-component and hybrid nanocomposites.
Material system Clay content
(wt%)
Block-copolymer content
(wt%)
0 (neat epoxy) 0 0
1C 1.0 0
3C 3.0 0
1B 0 1.0
3B 0 3.0
1B&1C 1.0 1.0
1B&3C 3.0 1.0
3B&1C 1.0 3.0
6.2.2 Microstructure Study of Hybrid Nanocomposites
TEM micrographs of Figure 6.2 show microstructures and nanoparticle dispersions in
cured epoxy. These micrographs provided additional information on particle dimensions

158
and interlayer distances of the layered silicate. Composites prepared by combining
different compositions of I.30E and M52N additive mixtures with epoxy were found to
be transparent under visible light. As shown before in Chapter 4, nanocomposites
prepared by ultrasonic mixing of layered silicate with epoxy mainly had intercalated and
few exfoliated nanostructures. Characteristic ordered layer structures of clay are shown in
Figure 6.2 (a) having an average layer separation of about 10~15 nm. The TEM
micrograph in Figure 6.2 (b) shows randomly dispersed spherical micelles with diameter
of about 20~30 nm (see Chapter 5 for more information on block-copolymer modified
epoxy). In a previous study, Dean et al. [17] identified the presence of spherical micelles
in epoxy by analyzing the small-angle X-ray scattering and TEM results of a blend
containing block-copolymer (e.g. PEO-PEP or PEO-PI) and epoxy. Formation of the two-
phase morphology is crucial for toughness improvement as well as for preserving other
important mechanical properties of epoxy.
Figure 6.1 X-ray diffraction patterns of (a) organoclay and cured nanocomposites: (b) 1
wt% and (c) 2 wt% I.30E nanoclay filled epoxy, (d) 3B&1C and (e) 1B&3C hybrid
compounds.
0
50
100
150
200
250
300
350
400
0 5 10 15
Inte
nsity (
co
un
ts)
Two-theta (deg)
(a)
(b)
(c)
(d)
(e)
d001= 2.23 nm

159
Figure 6.2 TEM images of (a) sample 1C a nanoclay filled epoxy and (b) sample 3B a
block-copolymer dispersed epoxy.
A combination of intercalated nanoclay and nanostructured block-copolymer morphology
is shown for the 3B&1C hybrid nanocomposite in Figure 6.3, which correlates well with
the XRD results. It is evident from Figure 6.3 (a) that some of the block-copolymers were
able to infiltrate amid the clay interlayers. This has been reported before by Frohlich et al.
[5] who observed that liquid rubber diffused between the silicate galleries. Likewise,
Balakrishnan et al. [25] noticed clay particles preferentially attaching themselves on the
rubber surface. Figure 6.3 (b) shows the same hybrid nanocomposite sample after
straining with osmic acid. Clearly osmic acid has dissolved the block-copolymer in the
hybrid nanocomposite specimen. Finely dispersed, randomly distributed, mostly
submicron-size intercalated clay tactoids have been observed in the low magnification
TEM micrograph of Figure 6.3 (c). The straight lines in Figure 6.3 (c) are knife marks left
from the microtoming process. It has been ascertained that sonication caused a
breakdown of larger clay agglomerates into smaller particles, and similar observation has
been previously reported by Hernandez et al. [12].
200 nm100 nm
(b)(a)

160
Figure 6.3 TEM images of 3B&1C a hybrid nanocomposite: pictures are taken at high
magnification for specimens (a) without and (b) with osmic acid staining and (d) at low
magnification.
6.2.3 Tensile Properties of Hybrid Nanocomposites
Typical tensile stress-strain curves of the neat epoxy and its nanocomposites are shown in
Figure 6.4. The figure illustrates that the stress increased almost linearly with strain for
acrylic block-copolymer dispersed epoxy until it reached a maximum value. Subsequent
yielding of the specimen was followed by ultimate failure. The clay nanocomposite
demonstrated an apparent loss of DGEBA ductility, and did not yield before ultimate
failure of the specimen. The behavior of hybrid nanocomposites was dictated by the
relative amount of block-copolymer and clay contents.
Table 6-2 lists tensile properties of the hybrid and single-component systems and
corresponding standard deviations. Tensile test results represent average values from
(b)(a)
200 nm
2 µm
200 nm
(c)

161
three or more test samples. Normalized tensile moduli of the hybrid nanocomposites
along with the single-additive composites are shown in Figure 6.5. Error bars correspond
to one standard deviation. For layered silicate nanocomposites, Lan and Pinnavaia [1]
showed that the stiffness increased significantly due to the presence of exfoliated high
aspect ratio rigid clay platelets. To a lesser extent, this was observed in the current study
as stiffness increased with increasing I.30E concentration for the predominantly
intercalated nanocomposites [27]. When 3 wt% nanoclay was incorporated in epoxy (i.e.
sample 3C), the value of modulus increased by 16%. As expected, addition of acrylic
block-copolymer caused a slight reduction in modulus [4]. Stiffness of 1B&3C hybrid
nanocomposite containing 1 wt% M52N and 3 wt% I.30E generated similar improvement
as with only 3 wt% I.30E in epoxy. Therefore, for hybrid materials, the stiffness
enhancement is directly dependent on silicate content [5], while the block-copolymer
additive has only limited influence on modulus. Superior interfacial properties of
intercalated nanoclay may also have contributed to the stiffening effect.
Figure 6.4 Tensile stress-strain response of modified epoxy with respect to nanofiller
contents.
0
10
20
30
40
50
60
70
80
90
0 2 4 6 8 10 12
Str
ess [M
Pa]
%Strain [/]
Neat epoxy
3C
3B
1B&1C
1B&3C
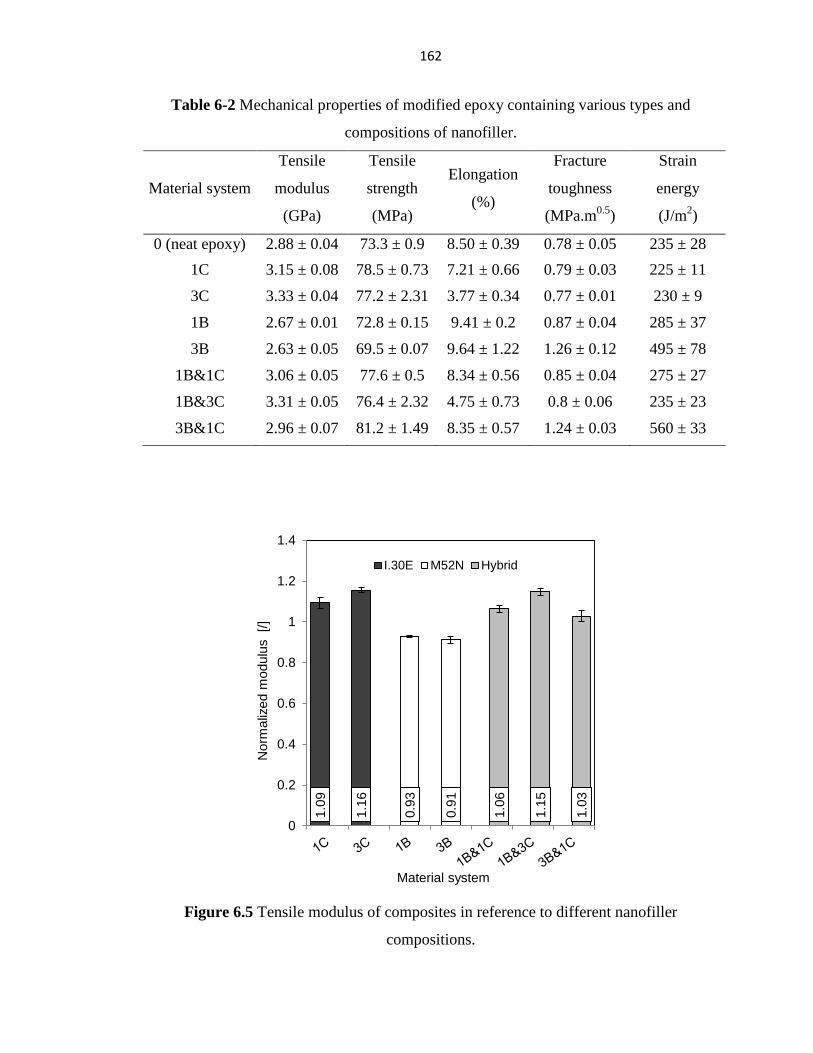
162
Table 6-2 Mechanical properties of modified epoxy containing various types and
compositions of nanofiller.
Material system
Tensile
modulus
(GPa)
Tensile
strength
(MPa)
Elongation
(%)
Fracture
toughness
(MPa.m0.5
)
Strain
energy
(J/m2)
0 (neat epoxy) 2.88 ± 0.04 73.3 ± 0.9 8.50 ± 0.39 0.78 ± 0.05 235 ± 28
1C 3.15 ± 0.08 78.5 ± 0.73 7.21 ± 0.66 0.79 ± 0.03 225 ± 11
3C 3.33 ± 0.04 77.2 ± 2.31 3.77 ± 0.34 0.77 ± 0.01 230 ± 9
1B 2.67 ± 0.01 72.8 ± 0.15 9.41 ± 0.2 0.87 ± 0.04 285 ± 37
3B 2.63 ± 0.05 69.5 ± 0.07 9.64 ± 1.22 1.26 ± 0.12 495 ± 78
1B&1C 3.06 ± 0.05 77.6 ± 0.5 8.34 ± 0.56 0.85 ± 0.04 275 ± 27
1B&3C 3.31 ± 0.05 76.4 ± 2.32 4.75 ± 0.73 0.8 ± 0.06 235 ± 23
3B&1C 2.96 ± 0.07 81.2 ± 1.49 8.35 ± 0.57 1.24 ± 0.03 560 ± 33
Figure 6.5 Tensile modulus of composites in reference to different nanofiller
compositions.
1.0
9
1.1
6
0.9
3
0.9
1
1.0
6
1.1
5
1.0
3
0
0.2
0.4
0.6
0.8
1
1.2
1.4
Norm
aliz
ed m
odulu
s
[/]
Material system
I.30E M52N Hybrid
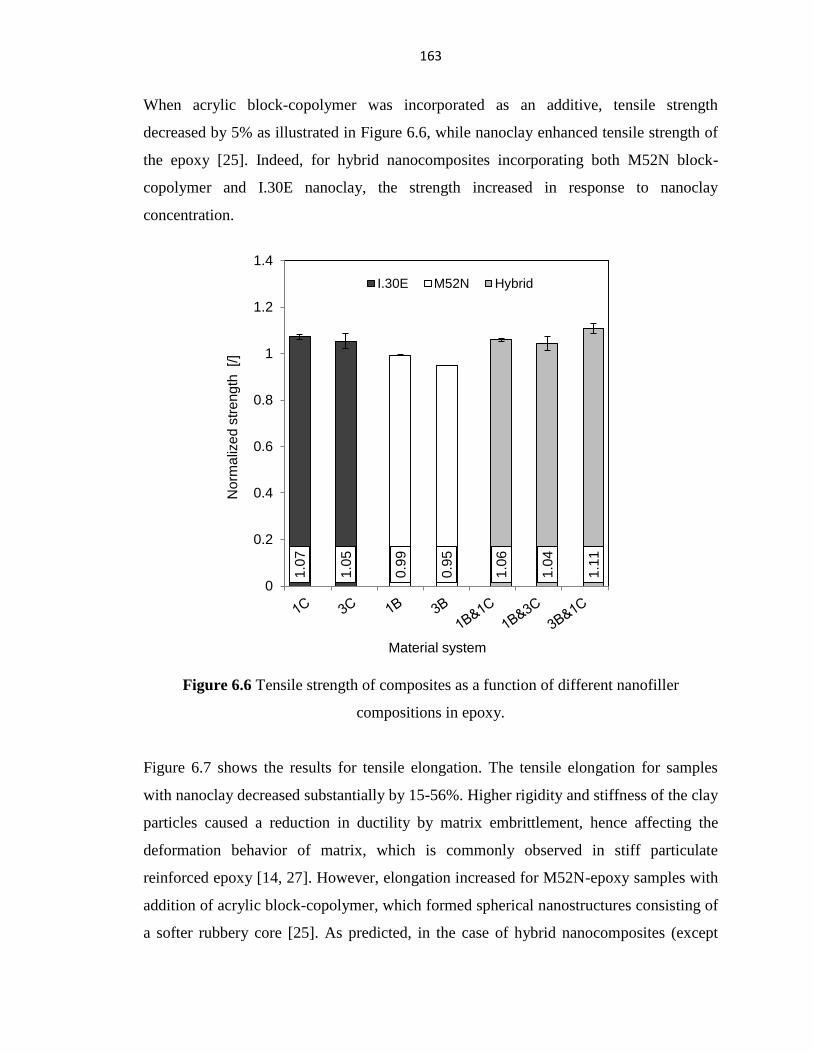
163
When acrylic block-copolymer was incorporated as an additive, tensile strength
decreased by 5% as illustrated in Figure 6.6, while nanoclay enhanced tensile strength of
the epoxy [25]. Indeed, for hybrid nanocomposites incorporating both M52N block-
copolymer and I.30E nanoclay, the strength increased in response to nanoclay
concentration.
Figure 6.6 Tensile strength of composites as a function of different nanofiller
compositions in epoxy.
Figure 6.7 shows the results for tensile elongation. The tensile elongation for samples
with nanoclay decreased substantially by 15-56%. Higher rigidity and stiffness of the clay
particles caused a reduction in ductility by matrix embrittlement, hence affecting the
deformation behavior of matrix, which is commonly observed in stiff particulate
reinforced epoxy [14, 27]. However, elongation increased for M52N-epoxy samples with
addition of acrylic block-copolymer, which formed spherical nanostructures consisting of
a softer rubbery core [25]. As predicted, in the case of hybrid nanocomposites (except
1.0
7
1.0
5
0.9
9
0.9
5
1.0
6
1.0
4
1.1
1
0
0.2
0.4
0.6
0.8
1
1.2
1.4
No
rma
lize
d s
tre
ng
th [/]
Material system
I.30E M52N Hybrid

164
1B&3C), strain at break was close to the value for neat epoxy. Enhancement of modulus
and strength and retention of ductility indicates that the strengthening effect of the
nanoclay and the ductility enhancement of block-copolymer are simultaneously operative
in the hybrid nanocomposites.
Figure 6.7 Dependence of composite tensile elongation on various nanofiller
compositions in modified epoxy.
6.2.4 Fracture Properties of Hybrid Nanocomposites
Figures 6.8 (a-c) display load-displacement behavior of the fracture process of SENB
specimens for both filled and unfilled epoxies. As depicted in Figure 6.8 (a), unmodified
epoxy shows unstable brittle crack growth behavior where the crack propagates by the
characteristic slip/stick mechanism. Modified epoxy fracture behavior is dependent on the
specific filler compositions. The simple composite with 3 wt% I.30E (i.e. sample 3C) and
the hybrid composite 1B&3C in Figure 6.8 (b) manifest a stable brittle crack growth
characteristic where the load increases linearly to a maximum followed by steady and
0.8
5
0.4
4
1.1
1
1.1
3
0.9
8
0.5
6
0.9
8
0
0.2
0.4
0.6
0.8
1
1.2
1.4N
orm
aliz
ed
str
ain
[/]
Material system
I.30E M52N Hybrid

165
controlled crack propagation. The appearance of the fracture surface is characterized as a
distinct brittle failure, and this kind of fracture process correlates well with the
insignificant toughening effect of nanoclay as will be shown later in this chapter. It can
be observed from Figure 6.8 (c) that 3 wt% M52N modified epoxy (i.e. sample 3B) and
3B&1C composite exhibited significant increase in load up to certain higher value at
which point fast unstable crack growth took place. This sudden failure mechanism
occurred because, in the process of load increment, a substantial amount of elastic energy
was stored, until finally a sudden release of this energy is accompanied by instantaneous
unstable crack propagation.
Figure 6.8 Crack initiation and crack growth behavior of SENB specimens made with:
(a) neat epoxy, (b) sample 3C a nanoclay filled epoxy and 1B&3C a hybrid
nanocomposite and (c) sample 3B a block-copolymer modified epoxy and 3B&1C a
hybrid nanocomposite.
Fracture toughness of the modified epoxy in terms of critical stress intensity factor was
measured at room temperature. Table 6-2 summarizes dissipated fracture energies
associated with propagating a sharp crack through the SENB specimens made from neat
epoxy and its nanocomposites. The values of pristine epoxy fracture toughness and strain
energy were calculated to be 0.78 MPa.m0.5
and 235 J/m2 respectively, which are typical
for an unmodified, highly cross-linked brittle epoxy. Figure 6.9 illustrates the effect of
nanoparticle concentration on fracture toughness of different nanocomposite systems. In
I.30E-epoxy nanocomposites, addition of layered silicate did not introduce any
0
50
100
150
200
250
0 0.0002 0.0004
Lo
ad
[N
]
Displacement [m]
3B&1C
3B
0
20
40
60
80
100
120
0 0.0002 0.0004
Lo
ad
[N
]
Displacement [m]
Neat epoxy
0
20
40
60
80
100
120
140
160
0 0.0002 0.0004 0.0006
Lo
ad
[N
]
Displacement [m]
3C
1B&3C
(a) (b) (c)

166
considerable change to epoxy fracture toughness. Even though the nanoclay
concentration was increased from 1 wt% to 3 wt%, the toughness remained almost
constant relative to the unmodified epoxy. Similar observation was made by Balakrishnan
et al. [25] and Gam et al. [14]. Frohlich et al. [5] identified crack deflection and crack
branching as the main fracture modes in nanocomposites containing organoclay, and
observed minor/insignificant improvements in fracture toughness. Kinloch and Taylor
[28] studied mechanical and fracture properties of I.30E modified epoxy samples. Similar
to present findings, these researchers also observed only a small toughening effect of this
organoclay in epoxy. Others have inferred intercalated structures provide better crack
resistance than exfoliated clay [27, 29].
However, incorporating M52N block-copolymer in epoxy matrix greatly increased
fracture toughness and strain energy relative to the neat epoxy, as has been previously
observed for rubber toughened thermosets [7, 9]. Increases of approximately 60% and
110% were observed in fracture toughness and strain energy respectively by adding 3
wt% M52N (i.e. sample 3B). It is believed that during the fracture process, the stress field
ahead of the crack-tip caused the rubbery poly(n-butylacrylate) core of the triblock-
copolymer to cavitate. These cavitated particles initiate and facilitate subsequent matrix
shear yielding, which has been previously reported by Liu et al. [19] for block-copolymer
micelle structures in epoxy.
As expected, toughness of the hybrid nanocomposites was higher and closer to the
toughness of M52N-epoxy composites. It was ascertained from these results that the
fracture toughness of the hybrid epoxy improved significantly mainly because of the
presence of block-copolymer dispersant. As noted, the contribution of nanoclay to the
fracture process of the hybrid materials was insignificant. For example, 3B&1C hybrid
nanocomposite containing 3 wt% M52N block-copolymer and 1 wt% I.30E clay
generated 60% increase in fracture toughness, which is the same order of magnitude as
that of 3 wt% M52N in epoxy (i.e. sample 3B). Similar improvements for hybrid
nanocomposites have been documented before in the literature [14]. The strain energy
values in Table 6-2 for different nanocomposites show the same trend as fracture
toughness. It has been observed that the facture mechanisms and their associated fracture
energies are significantly different for the block-copolymer and clay modified epoxies. It

167
is also surmised that the low ductility and high cross-link density of the epoxy polymer
has an influence on the fracture properties of the reinforced epoxy [14].
Figure 6.9 Fracture toughness of epoxy composites as a function of different nanofiller
compositions.
6.2.5 Fracture Surface Study of Hybrid Nanocomposites
Fracture surfaces of the neat epoxy and its nanocomposites were examined by SEM, and
the images are displayed in Figures 6.10 through 6.12. The arrow indicates crack
propagation direction.
The fracture surface of nanoclay filled epoxy in Figure 6.10 (a) is extensively textured
and the morphology is coarser and the surface is rougher. It is remarkable that the
extensively convoluted morphology of the I.30E-epoxy fracture surface did not generate
the expected toughness that was reported by various authors for intercalated clay
architecture [27, 29]. It is speculated that intercalated submicron-size clay tactoids and
exfoliated clay platelets are responsible for this behavior. It can be seen that the
1.0
1
0.9
9
1.1
1
1.6
2
1.0
9
1.0
2
1.5
9
0
0.2
0.4
0.6
0.8
1
1.2
1.4
1.6
1.8
2
No
rma
lize
d fra
ctu
re to
ug
hn
ess [/]
Material system
I.30E M52N Hybrid

168
intercalated structures only resulted in perturbation of the natural crack path by deflection
and branching, which are known to be a less effective toughening mechanism [30]. The
smaller dimension intercalated clay particles shown in Figure 6.10 (a) did not provide
effective resistance to crack propagation through such mechanism as crack pinning, even
though few clay clusters and aggregates were present in the nanocomposites. Based on
these observations the present author speculates that without the occurrence of prominent
energy dissipating toughening mechanisms (e.g. matrix shear yielding and crack pinning),
the fracture toughness of nanoclay filled epoxy remained unchanged. The high
magnification image in Figure 6.10 (b) shows laminated clay layers with epoxy
penetrating in between adjacent clay sheets.
Figure 6.10 SEM images of SENB fracture surfaces of sample 3C a nanoclay filled
epoxy nanocomposite at (a) low magnification and (b) high magnification.
In contrast, the block-copolymer modified epoxy surface as shown in the low
magnification image of Figure 6.11 (a) exhibits no visible sign of extensive roughness,
and areas of matrix rich domains are also evident, similar to pure epoxy (see Figure 4.17).
It is apparent from Figure 6.11 (b) that the spherical micelles in M52N modified epoxy
created a significant number of spherical cavities. In accordance with present findings on
M52N block-copolymer dispersed epoxy, it can be concluded that voiding of the rubbery
core of the spherical micelles in front of a propagating crack aided subsurface matrix
shear deformation (see Chapter 5). This implies that a large amount of energy was
(a) (b)

169
dissipated during the fracture process. Figure 6.11 (b) further illustrates homogenous but
random distribution of the acrylic block-copolymer additive.
Figure 6.11 SEM images of SENB fracture surfaces of sample 3B a block-copolymer
modified epoxy at (a) low magnification and (c) high magnification.
The fracture surface of the hybrid nanocomposite 1B&1C is shown in Figure 6.12. The
1B&1C fracture surfaces exhibit a flat and plane surface morphology, identical to the
block-copolymer fracture surface. It is also noteworthy that the evidence of three-phase
morphology of the hybrid nanocomposites is clearly visible in Figure 6.12 (a), i.e.
discrete nanoscopic holes formed by cavitated block-copolymers marked by white circles
and intercalated nanoclay in epoxy substrate. The toughness enhancement is thought to be
by void formation followed by matrix yielding due to the presence of dispersed spherical
block-polymer nanostructures. Confirming what was observed previously for nanoclay
reinforced epoxy, the crack resistance effect of the nanoclay was not seen in the hybrid
nanocomposites.
6.3 CONCLUSIONS
The present investigation successfully demonstrated the strategy of simultaneously
incorporating both triblock-copolymer and nanoclay as a significant property enhancer by
generating nanostructured domains in thermosetting epoxy. This study substantiated that
the epoxy modified with a small amount of particular type of nano-additive resulted in
(a) (b)

170
significant increase in specific mechanical property. Furthermore, the hybrid
nanocomposites illustrated the potential of generating optimal mechanical property by
taking advantage of the favorable properties of different nanoparticles.
Figure 6.12 SEM images of SENB fracture surfaces of 1B&1C a hybrid nanocomposite
at (a)-(b) high magnification.
Dispersed spherical micelles in acrylic block-copolymer modified epoxy and intercalated
silicate layers in nanoclay filled epoxy were observed by various characterization
methods. In an epoxy hybrid nanocomposite, when both particles are present, a three-
phase morphology was observed. Addition of acrylic triblock-copolymer M52N greatly
enhanced toughness of the thermosetting epoxy, and this increase in toughness was
attributed to a mechanism of particle cavitation and subsequent matrix shear deformation.
Organoclay I.30E significantly improved stiffness of the epoxy nanocomposites while
maintaining fracture toughness constant through a less efficient failure mode of crack
diversion and branching, presumably by the presence of submicron-size intercalated clay
tactoids. A hybrid nanocomposite prepared by combining block-copolymer with nanoclay
in a thermosetting epoxy achieved enhanced toughness and stiffness over the neat epoxy.
From the results of this work, it can be inferred that the 3B&1C hybrid nanocomposite
made with 3 wt% M52N and 1 wt% I.30E introduced a significant improvement in
toughness while slightly enhancing tensile stiffness and strength of the epoxy. Results
also indicate an influence of both nanoclay and block-copolymer on the fracture and
tensile properties of the epoxy nanocomposites. Therefore, the general conclusion is that
(a) (b)

171
the mechanical property enhancement in hybrid nanocomposites depends on the specific
combination of different dispersants and their nanostructured morphology in a composite
system, and thus, optimization of the type and concentration of different dispersants and
their interactions is critical to obtain multi-functional properties.
REFERENCES
1. LAN, T. and PINNAVAIA, T.J., 1994. Clay-reinforced epoxy nanocomposites.
Chemistry of Materials, 6(12), pp. 2216-2219.
2. LAN, T., KAVIRATNA, P.D. and PINNAVAIA, T.J., 1995. Mechanism of clay
tactoid exfoliation in epoxy-clay nanocomposites. Chemistry of Materials, 7(11), pp.
2144-2150.
3. MESSERSMITH, P.B. and GIANNELIS, E.P., 1994. Synthesis and
characterization of layered silicate-epoxy nanocomposites. Chemistry of Materials, 6(10),
pp. 1719-1725.
4. FRÖHLICH, J., THOMANN, R. and MÜLHAUPT, R., 2003. Toughened epoxy
hybrid nanocomposites containing both an organophilic layered silicate filler and a
compatibilized liquid rubber. Macromolecules, 36(19), pp. 7205-7211.
5. FRÖHLICH, J., THOMANN, R., GRYSHCHUK, O., KARGER-KOCSIS, J. and
MÜLHAUPT, R., 2004. High-performance epoxy hybrid nanocomposites containing
organophilic layered silicates and compatibilized liquid rubber. Journal of Applied
Polymer Science, 92(5), pp. 3088-3096.
6. SULTAN, J. and MCGARRY, F., 1973. Effect of Rubber Particle-Size on
Deformation Mechanisms in Glassy Epoxy. Polymer Engineering and Science, 13(1), pp.
29-34.
7. KINLOCH, A.J., SHAW, S.J., TOD, D.A. and HUNSTON, D.L., 1983.
Deformation and fracture behaviour of a rubber-toughened epoxy: 1. Microstructure and
fracture studies. Polymer, 24(10), pp. 1341-1354.
8. KINLOCH, A.J., MAXWELL, D.L. and YOUNG, R.J., 1985. The fracture of
hybrid-particulate composites. Journal of Materials Science, 20(11), pp. 4169-4184.
172
9. YEE, A.F. and PEARSON, R.A., 1986. Toughening mechanisms in elastomer-
modified epoxies - Part 1 Mechanical studies. Journal of Materials Science, 21(7), pp.
2462-2474.
10. KINLOCH, A.J., YUEN, M.L. and JENKINS, S.D., 1994. Thermoplastic-
toughened epoxy polymers. Journal of Materials Science, 29(14), pp. 3781-3790.
11. HÖFFLIN, F., KÖNCZÖL, L., DÖLL, W., MORAWIEC, J. and MÜLHAUPT,
R., 2000. Toughening of epoxy resins modified with polyetherester block copolymers:
the influence of modifier molecular architecture on mechanical properties. Journal of
Applied Polymer Science, 76(5), pp. 623-634.
12. HERNANDEZ, M., SIXOU, B., DUCHET, J. and SAUTEREAU, H., 2007. The
effect of dispersion state on PMMA-epoxy-clay ternary blends: In situ study and final
morphologies. Polymer, 48(14), pp. 4075-4086.
13. BÉCU-LONGUET, L., BONNET, A., PICHOT, C., SAUTEREAU, H. and
MAAZOUZ, A., 1999. Epoxy Networks Toughened by Core-Shell Particles: Influence of
the Particle Structure and Size on the Rheological and Mechanical Properties. Journal of
Applied Polymer Science, 72(6), pp. 849-858.
14. GAM, K.T., MIYAMOTO, M., NISHIMURA, R. and SUE, H.-J., 2003. Fracture
Behavior of Core-Shell Rubber-Modified Clay-Epoxy Nanocomposites. Polymer
Engineering and Science, 43(10), pp. 1635-1645.
15. SUBRAMANIYAN, A.K. and SUN, C.T., 2007. Toughening polymeric
composites using nanoclay: Crack tip scale effects on fracture toughness. Composites
Part A: Applied Science and Manufacturing, 38(1), pp. 34-43.
16. MAROUF, B.T., PEARSON, R.A. and BAGHERI, R., 2009. Anomalous fracture
behavior in an epoxy-based hybrid composite. Materials Science and Engineering A,
515(1-2), pp. 49-58.
17. DEAN, J.M., LIPIC, P.M., GRUBBS, R.B., COOK, R.F. and BATES, F.S., 2001.
Micellar structure and mechanical properties of block copolymer-modified epoxies.
Journal of Polymer Science, Part B: Polymer Physics, 39(23), pp. 2996-3010.
18. DEAN, J.M., GRUBBS, R.B., SAAD, W., COOK, R.F. and BATES, F.S., 2003.
Mechanical properties of block copolymer vesicle and micelle modified epoxies. Journal
of Polymer Science, Part B: Polymer Physics, 41(20), pp. 2444-2456.

173
19. LIU, J., SUE, H.-J., THOMPSON, Z.J., BATES, F.S., DETTLOFF, M., JACOB,
G., VERGHESE, N. and PHAM, H., 2008. Nanocavitation in self-assembled amphiphilic
block copolymer-modified epoxy. Macromolecules, 41(20), pp. 7616-7624.
20. GERARD, P., BOUPAT, N.P., FINE, T., GERVAT, L. and PASCAULT, J.-P.,
2007. Toughness properties of lightly crosslinked epoxies using block copolymers.
Macromolecular Symposia, 256, pp. 55-64.
21. HYDRO, R.M. and PEARSON, R.A., 2007. Epoxies toughened with triblock
copolymers. Journal of Polymer Science, Part B: Polymer Physics, 45(12), pp. 1470-
1481.
22. MOLONEY, A.C., KAUSCH, H.H. and STIEGER, H.R., 1983. The fracture of
particulate-filled epoxide resins - Part 1. Journal of Materials Science, 18(1), pp. 208-
216.
23. HSIEH, T.H., KINLOCH, A.J., MASANIA, K., SOHN LEE, J., TAYLOR, A.C.
and SPRENGER, S., 2010. The toughness of epoxy polymers and fibre composites
modified with rubber microparticles and silica nanoparticles. Journal of Materials
Science, 45(5), pp. 1193-1210.
24. LIU, W., HOA, S.V. and PUGH, M., 2004. Morphology and performance of
epoxy nanocomposites modified with organoclay and rubber. Polymer Engineering and
Science, 44(6), pp. 1178-1186.
25. BALAKRISHNAN, S., START, P.R., RAGHAVAN, D. and HUDSON, S.D.,
2005. The influence of clay and elastomer concentration on the morphology and fracture
energy of preformed acrylic rubber dispersed clay filled epoxy nanocomposites. Polymer,
46(25), pp. 11255-11262.
26. BASHAR, M.T., SUNDARARAJ, U. and MERTINY, P., 2011. Study of Matrix
Micro-cracking in Nanoclay and Acrylic Tri-block-copolymer Modified Epoxy/basalt
Fiber-reinforced Pressure-retaining Structures. Express polymer letters, 5, pp. 882-896.
27. ZERDA, A.S. and LESSER, A.J., 2001. Intercalated clay nanocomposites:
Morphology, mechanics, and fracture behavior. Journal of Polymer Science, Part B:
Polymer Physics, 39(11), pp. 1137-1146.
174
28. KINLOCH, A.J. and TAYLOR, A.C., 2003. Mechanical and fracture properties
of epoxy/inorganic micro- and nano-composites. Journal of Materials Science Letters,
22(20), pp. 1439-1441.
29. ZILG, C., MÜLHAUPT, R. and FINTER, J., 1999. Morphology and
toughness/stiffness balance of nanocomposites based upon anhydride-cured epoxy resins
and layered silicates. Macromolecular Chemistry and Physics, 200(3), pp. 661-670.
30. GARG, A.C. and MAI, Y.-W., 1988. Failure mechanisms in toughened epoxy
resins-A review. Composites Science and Technology, 31(3), pp. 179-223.

175
Chapter 7
Interlaminar Fracture Behaviour of Nanoparticle Modified
Epoxy/Basalt Fiber-reinforced Laminates4
SYNOPSIS: The effect of nano-reinforcements on mode-I interlaminar fracture
toughness of filament-wound basalt fiber-reinforced laminates was studied. It was found
that delamination fracture toughness was not influenced by the presence of nanoparticles
in the matrix. Decreasing fiber volume fraction, on the other hand, significantly improved
interlaminar fracture energy. Rigid fibers in these composites constrict the stress field
ahead of the crack-tip. Hence, increasing resin content enhanced composite delamination
energy by increasing the capacity for matrix deformation. Interlaminar crack propagation
through the composite was observed to occur mainly by interfacial failure and matrix
cracking.
7.1 INTRODUCTION
Intrinsic heterogeneity and anisotropy in fiber-reinforced polymer (FRP) structures often
introduce significant complexity, which obscures the appreciation of distinct failure
mechanisms. In high-pressure applications, fluid leakage through the wall of a composite
pipe or vessel as a result of transverse matrix cracking usually constitutes failure and thus
terminates service life [1-3]. This particular failure event, which is frequently termed
functional failure, severely degrades performance of pressure-bearing composite structures
even though the material may still be able to sustain applied mechanical loads. It is widely
believed that transverse micro-cracking is a matrix dominated phenomenon but there are
various other factors that contribute to the initiation and propagation of micro-cracks (e.g.
fiber volume fraction, fiber architecture and applied loading conditions). Micro-cracking in
4 A version of this chapter has been published as: BASHAR, M., SUNDARARAJ, U. and MERTINY, P.,
2013. Mode-I interlaminar fracture behavior of nanoparticle modified epoxy/basalt fibre-reinforced
laminates. Polymer Testing, 32(2), pp. 402-412.

176
pressure-bearing composite structures frequently occurs in conjunction with interlaminar
cracking between adjacent plies, i.e. delamination. The occurrence of transverse matrix
micro-cracking in conjunction with delamination greatly increases the possibility of fluid
leakage through the wall of a pipe or vessel [1-2].
Advances in nanotechnology have generated considerable optimism regarding significant
improvements in mechanical, thermal, electrical and barrier properties of nano-reinforced
materials. Lately, substantial efforts have been made towards improving polymer toughness
by incorporating nanoparticles in brittle matrix systems such as epoxy [4-6]. Traditionally,
epoxy is toughened through techniques such as flexibilization of the epoxy backbone,
lowering polymer cross-link density and addition of dispersed micro-particles. In contrast,
nano-scale particles have been shown to impart considerable improvements in polymer
toughness relative to their micro-scale counterparts while maintaining important mechanical
properties at comparatively low filler contents. Several studies on the fracture behaviour of
nanoparticle reinforced laminated composites have shown improvements in interlaminar
fracture toughness [7-10], interlaminar shear strength [11-12], flexural strength [11] and
micro-crack density [12].
An organically modified sodium-montmorillonite (Na-MMT) nanoclay and an acrylic based
triblock-copolymer were chosen for this study. Inside a polymer the transformation of
lamellar tactoids of sodium-montmorillonite into intercalated clay nanostructures are known
to increase epoxy toughness [8-11, 13]. Acrylic block-copolymers have the ability to self-
assemble to form nanostructures (e.g. micelles, vesicles) through selective chemical
interactions with the epoxy matrix [6, 14-15]. It has been demonstrated in the technical
literature that nanoclay has the ability to improve epoxy fracture behaviour by crack pinning,
crack deflection and matrix deformation mechanisms [6, 9]. In block-copolymer toughened
epoxy, particle cavitation, debonding and matrix shear yielding are recognized toughening
mechanisms for resisting crack propagation [14]. Matrix deformation [16-20], fiber pull-out,
fiber bridging, fiber breakage [16] and interfacial debonding [18-19] are the major forms of
delamination energy dissipation processes occurring in fiber composites. Moreover, factors
such as fiber volume fraction [19, 21-25], ply thickness [18], fiber type and orientation [24-
26], residual stress state [16] and material uniformity [17] are also known to affect mode-I
interlaminar fracture toughness. It has generally been agreed upon that in a fiber composite

177
increasing the neat resin toughness above a certain limiting value cannot effectively be
translated into interlaminar fracture toughness [16-19]. Therefore, for fiber composite
systems the question remains, is it worthwhile to enhance the resin toughness beyond a
certain trade-off value. A thorough understanding of the relationship between the composite
delamination fracture toughness with the corresponding resin toughness would provide
insight into this question.
In this part of a thesis the influence of resin toughness associated with different nanoparticle
incorporation and fiber volume fraction on fracture properties of the given epoxy system was
investigated. Delamination resistance of filament-wound fiber-reinforced composites were
evaluated. Fracture energies of modified epoxies and their corresponding fiber composites
were contrasted providing a quantitative analysis.
7.2 RESULTS AND DISCUSSION
7.2.1 Mode-I Interlaminar Fracture Toughness of the Fiber Composites
The sample preparation and measurement methods of mode-I interlaminar fracture toughness
testing of fiber composites are elaborated in Sections 2.2.5 and 3.10, respectively. Specimens
were tested at least in quadruplicate for each laminate system with a specific matrix
composition. Figure 7.1 presents characteristic load-displacement graphs of unidirectional
basalt fiber laminates obtained from opening mode delamination tests. The data relate to a
delamination growth approaching 50 mm from the edge of starter crack film. All load-
displacement curves shown in Figure 7.1 were found to be linear up to the onset of crack
initiation, after which stable crack growth behaviour was observed. The crack opening
displacement of the laminates made with the nanoclay containing resin formulation was
found to be smaller than that of neat epoxy laminates. This was attributed to an embrittlement
effect of the rigid nanoclay fillers on the epoxy matrix [20]. The unloading curves in Figure
7.1 clearly demonstrate that extending the crack by 5 mm through the composite followed by
unloading to zero displacement did not introduce any appreciable permanent deformation in
the specimens as the load prior to reloading was found to be zero.

178
Figure 7.1 Load-displacement curves of the DCB test specimens made with: (a) neat epoxy
and modified epoxy containing (b) 3 wt% I.30E and (c) 5 wt% M52N respectively.
The crack growth resistance curves (R-curves) shown in Figure 7.2 delineate the variations in
critical strain energy release rate as a function of delamination length for different fiber
composites fabricated under identical conditions. Initially, delamination fracture energy
increased monotonically until at a later stage in the experiment steady-state crack propagation
associated with significant fiber bridging became effective. It is presumed here that a
substantial amount of energy was dissipated due to fiber bridging, and strain energy reached a
plateau as shown by the resistance curves. The steady-state plateau value was reached after a
crack growth of roughly 35 mm, with the nanoparticle filled composites showing a steeper
rise in the resistance curve in the earlier stages of delamination. R-curves shown in Figure 7.2
also indicate that adding I.30E and M52N into epoxy polymer increased both the onset of
interlaminar crack initiation and propagation energy. It is important to note though that
nanofiller addition was also accompanied by a decrease in fiber volume fraction as recorded
in Table 7-1. Also tabulated in Table 7-1 are the fracture energies and fiber volume fractions
of the fiber composites and corresponding bulk nanocomposites, along with standard
deviations. The composite made with unmodified epoxy, GIC at initiation was measured to be
120 J/m2 and 240 J/m
2, respectively for NL and VIS (according to the definition given in
Chapter 3); this composite has a fiber volume fraction of 0.64. It is interesting to note that the
visually observed crack initiation value (VIS) of fiber composite closely matches the GIC of
the neat resin of 240 J/m2. Identical fracture energy values may be interpreted as the existence
of a representative plastic zone size for the bulk neat epoxy and associated fiber composite
(a) (c)
0
10
20
30
40
50
60
0 10 20 30 40 50
Load [N
]
Displacement [mm]
Neat Epoxy
loading
loading
unloading
0
10
20
30
40
50
60
70
80
0 10 20 30 40 50
Load [N
]
Displacement [mm]
5 wt% M52N/Epoxy
(b)
0
10
20
30
40
50
60
70
80
0 10 20 30 40
Load [N
]
Displacement [mm]
3 wt% I.30E/Epoxy

179
[15]. However, this deduction is disputable in the present context as the visual crack initiation
value (VIS) is associated with an appreciable crack growth of 1 mm through the laminate
interlayer, and other fiber dominated energy dissipation phenomena were thereby operative.
It was shown previously by Hsieh et al. [7] in a study on fiber composites modified with
CTBN rubber microparticles and silica nanoparticles that delamination initiation energy
exceeded bulk polymer fracture energy due to contributions from additional toughening
mechanisms, i.e. fiber debonding, fiber pull-out and fiber bridging. Nevertheless, being a
function of matrix toughness, crack initiation energy may be regarded as a conservative
minimum value in composite interlaminar fracture toughness testing [26]. Considering the
importance of crack initiation data for the composite structures under consideration, the
fracture energy associated with the point of deviation from linearity (NL) was herein chosen
as the interlaminar crack initiation value.
Figure 7.2 Variations in strain energy release rate with delamination length of different fiber
composites.
0
200
400
600
800
1000
0 20 40 60 80 100 120
De
lam
ina
tio
n e
ne
rgy [J/m
2]
Delamination length [mm]
Neat epoxy
3 wt% I.30E/Epoxy
5 wt% M52N/Epoxy
NL
VIS

180
Table 7-1 Fracture energy of bulk epoxy and its nanocomposites and corresponding
fiber-reinforced composites.
Particle-
matrix
loading
Fiber
volume
fraction
Fracture energy, J/m2
Fiber composite Bulk composite
Initiation Propagation
NL VIS
0 wt% (Neat) 0.64 120 ± 8 240 ± 33 600 ± 33 235 ± 28
0 wt% (Neat) 0.55 230 ± 17 410 ± 63 795 ± 91
1 wt% M52N 0.59 175 ± 33 370 ± 37 595 ± 65 280 ± 37
3 wt% M52N 0.63 150 ± 18 355 ± 31 610 ± 69 495 ± 78
5 wt% M52N 0.56 255 ± 32 535 ± 35 785 ± 53 765 ± 60
1 wt% I.30E 0.58 155 ± 22 290 ± 39 490 ± 51 225 ± 11
3 wt% I.30E 0.5 195 ± 7 365 ± 23 645 ± 95 230 ± 9
Figure 7.3 presents interlaminar fracture toughness as a function of laminate fiber volume
fraction. This figure highlights the fact that decreasing fiber volume fraction of the laminate
made of neat epoxy resin from 0.65 to 0.55 significantly improved composite delamination
fracture energy. Similarly, interlaminar fracture energy values for composites fabricated with
modified polymer matrices increased at higher resin contents. Jordan et al. [19] also reported
a rise in steady-state delamination resistance energy from 620 J/m2 to 1015 J/m
2 by lowering
fiber volume fraction from 0.71 to 0.60 in a rubber toughened epoxy composite. Their
microscopic study further revealed that the resin-rich interlaminar region between plies in the
composite with the lowest fiber volume fraction doubled in thickness compared to the lowest
resin content composite. Lee [25] also observed higher delamination initiation energy with
increasing resin content (from 0.27 to 0.40) in glass and graphite fiber epoxy laminates.
Davies et al. [23] presented evidence of increasing mode-II interlaminar fracture toughness
(both initiation and propagation) with decreasing fiber content (from 0.65 to 0.42) in quasi-
unidirectional glass fiber epoxy composites. They prescribed this effect to stem from
increased plastic deformation in a thicker resin-rich interlaminar region. The above literature
findings support the premise that matrix dominated fracture processes such as delamination
initiation are strongly influenced by the resin content [26]. It was postulated by Hunston [16]

181
and others [17-19, 27] with regards to interlaminar fracture in fiber composites that the rigid
fibers restrict the development of a plastic zone at the crack-tip. In the present study, the
improvement in the fiber composite strain energy with increasing resin concentration
implicates the presence of such a constraining influence by the fibers. In other words, with
decreasing fiber volume fraction the resin occupied region between adjacent fibers became
larger, which reduces the constraining effect of the fiber. To further support this conjecture an
analysis of the plastic zone size was conducted. According to linear elastic fracture
mechanics the plastic zone size in neat epoxy under plane-strain condition was approximated
to be 6 µm from Equation (7.1) [28].
(
)
(7.1)
where ry is the radius of the plastic zone and KI is the stress intensity factor (0.78 MPa.m
0.5).
The tensile yield stress σys = 73.25 MPa of the neat epoxy was determined by uniaxial tensile
testing. Figure 7.4 displays cross-section views from the middle portion of the specimen
thickness for a laminate made with pure epoxy having a fiber volume fraction of 0.64. Note
that broken fiber edges visible in Figure7.4 are merely artifacts produced during polishing of
the sample surface. Figure 7.4 displays a closely packed fiber arrangement with diminutive
fiber-fiber spacing of typically less than ~6 µm. This observation in conjunction with the
theoretical plastic zone size substantiates the notion that the influence of matrix ductility was
restricted during interlaminar fracture, and that rigid fibers affected the stress field away from
the crack-tip. Critical failure stresses were thus ascertained at lower loads than suggested
from bulk polymer fracture testing. This deduction is supported by work of Bradley [18] who
stated that if interlayer spacing between plies (i.e. fiber-fiber spacing) matches or exceeds the
damage zone size in the bulk polymer, interlaminar fracture toughness would at least be
equivalent to the matrix toughness. Conversely, resin toughness does not effectively translate
into delamination fracture toughness if the fiber-fiber spacing is smaller than the bulk
composite deformation zone. The phenomena described above are assumed to have been
operative for the fiber-reinforced epoxy composites under investigation.

182
Figure 7.3 Dependence of delamination energy on fiber volume fraction of different fiber
composites.
Figure 7.4 SEM pictures of the cross-section of laminate made with neat epoxy taken at: (a)
low and (b) high magnifications.
0
100
200
300
400
500
600
700
800
900
0.5 0.55 0.6 0.65
De
lam
ina
tio
n e
ne
rgy [J/m
2]
Fiber volume fraction [/]
(Neat epoxy)_initiation (Neat epoxy)_propagation
(I.30E/Epoxy)_initiation (I.30E/Epoxy)_propagation
(M52N/Epoxy)_initiation (M52N/Epoxy)_propagation
(a) (b)

183
7.2.2 Comparison of Bulk Polymer and Fiber Composite Fracture Energy
In Figures 7.5 and 7.6, interlaminar crack initiation energy (NL) of the fiber composites and
the fracture energy of corresponding bulk polymers were plotted against the respective I.30E
and M52N nanofiller loadings. From Figure 7.5, it is observed that nanoclay dispersants
enhanced interlaminar crack initiation energy (NL); yet, this improvement was lower when
compared to the composite made with neat epoxy having a fiber volume fraction of 0.55.
This behaviour can be explained by the earlier findings for nanoclay filled bulk
nanocomposites where resistance to crack growth values remained almost unchanged with
nanoclay addition. Previously, Kim et al. [20] considered an embrittling effect of rigid silica
fillers to lead to reduced epoxy matrix deformation. Embrittlement of the epoxy matrix was
presumably responsible for the unaltered fracture energy of their modified epoxy even though
additional toughening mechanisms associated with the rigid fillers may have been operative.
In a separate study, Subramanian and Sun [13] documented the alignment of nanoclay along
the fiber axis (i.e. crack propagation direction) causing reduction in composite delamination
propagation energy relative to unmodified laminates. Therefore, it may be hypothesized that
the existence of few nanoclay aggregates (as shown in Chapter 6 and reference [6]) may have
acted as stress concentration points causing micro-cracks to initiate instead of resisting crack
propagation. Contrary to the above observation a moderate improvement in initial fracture
energy was observed by Becker et al. [8] and Siddiqui et al. [9] in carbon fiber-reinforced
epoxy-clay nanocomposites. In these studies, fiber volume fractions were considerably lower,
so it can be assumed that constraining effects of the fibers would be of less significance
compared to the present study. Also, the authors in [8-9] mentioned improvements in the bulk
composite fracture energies with nanoclay loading (which was not the case in the present
study).
As shown in Figure 7.6 for block-copolymer modified epoxy the interlaminar crack initiation
energy of the fiber composites was substantially less than the fracture energy of the
corresponding bulk polymers. This result can be explained by fibers constricting the
development of the crack-tip plastic zone. No significant effect of nano-reinforcements on
interlaminar fracture toughness values was observed because the range of fiber volume
fractions studied herein was too high for full utilization of the modified epoxy fracture
toughness. This notion is substantiated considering the laminates made with neat and 5 wt%

184
block-copolymer toughened epoxy with comparable fiber volume fractions of ~0.55, in
which case practically identical crack growth resistance values were recorded. Also, these
laminates exhibited initial delamination resistance (NL) values of 230 J/m2 and 255 J/m
2
which are representative of the bulk epoxy fracture energy of 235 J/m2. Therefore, for the
fiber composites it is surmised that full utilization of neat epoxy toughness could only be
achieved for the low fiber volume fractions of ~0.55.
Figure 7.5 Crack initiation energy (NL) of the fiber composites with corresponding fracture
energy of the bulk polymers as a function of I.30E content.
FV
F 0
.64
F
VF
0.5
5
F
VF
0.5
8
FV
F 0
.5
0
50
100
150
200
250
300
350
400
450
500
0% (neat) 0% (neat) 1% 3%
Str
ain
en
erg
y [J/m
2]
Filler [I.30E] matrix loading [wt%]
Bulk polymers Fiber composites

185
Figure 7.6 Crack initiation energy (NL) of the fiber composites with corresponding fracture
energy of the bulk polymers as a function of M52N content.
In Figure 7.7, steady-state delamination energies of the fiber composites are plotted against
the fracture energies of the corresponding bulk polymers for respective nanofiller
compositions. It can be observed that for a brittle epoxy system (i.e. nanoclay modified
epoxy) the delamination fracture toughness is greater than the resin fracture energy as
previously documented by Hunston et al. [16]. In the present study, laminates were produced
by the filament winding process, which introduced significant fiber intermingling (e.g. fiber
nesting) and misalignment between adjacent plies. As a result of considerable debonding of
the fibers from the matrix and subsequent crack propagation, a region of bridged fibers
formed stretching behind the crack-tip before ultimate fiber breakage occurred (see Figure
7.8). Consequently, toughening mechanisms such as fiber pull-out, fiber bridging and fiber
breakage accounted for further dissipation of energy in the fiber composites. Note also that in
FV
F 0
.64
FV
F 0
.55
F
VF
0.5
9
FV
F 0
.63
F
VF
0.5
6
0
100
200
300
400
500
600
700
800
900
1000
0%(neat) 0%(neat) 1% 3% 5%
Str
ain
en
erg
y [J/m
2]
Filler [M52N] matrix loading [wt%]
Bulk polymers Fiber composites

186
unidirectional composites fiber bridging during delamination crack growth is considerably
more prevalent compared to angle-ply or woven fiber laminates. In contrast, in a ductile
polymer the higher fracture toughness corresponds to the formation of a larger deformation
zone at the crack-tip. For the fiber composites made with the ductile resin system (i.e. block-
copolymer modified epoxy) limited transfer of neat resin fracture energy into composite
steady-state delamination energy signifies the restraining influence of the fibers. Clearly, this
effect is more pronounce in a tougher polymer than in a brittle polymer [16-19, 27].
According to the literature [9, 16, 19] cited, the general consensus is that for resin fracture
energies exceeding 700 J/m2 the improvement in fiber composite interlaminar fracture
toughness is only moderate, and increasing the resin GIC further to values over 2000 J/m2
would have a rather insignificant effect on fiber composite fracture toughness.
Figure 7.7 Comparison between steady-state delamination energy of fiber composites and
strain energy of bulk polymers.
0
100
200
300
400
500
600
700
800
900
1000
0 200 400 600 800 1000
Fib
er
com
posite d
ela
min
ation e
nerg
y [J/m
2]
Bulk polymer fracture energy [J/m2]
Neat epoxy
I.30E/Epoxy
M52N/Epoxy

187
Figure 7.8 Fiber bridging that took place during delamination in a laminate made of neat
resin and basalt fiber.
7.2.3 Fracture Surface Analysis
In the neat epoxy laminates planar crack growth proceeded mainly by debonding along the
fiber-matrix interface as revealed by SEM examination of cracked surfaces as shown in
Figure 7.9. Fiber-matrix interfacial failure is known also to influence delamination fracture
toughness, since improving neat resin toughness without strong enough interfacial bonding
would not adequately enhance fiber composite fracture toughness. Visual observation
suggests little matrix deformation, as has been assumed for the densely packed fiber
arrangements. For nanoclay modified laminates the fractographic evidence of Figure 7.10
shows crack extension along the fiber-matrix interface with the absence of appreciable matrix
deformation, which is reminiscent of brittle fracture behaviour. Nanoclays can be seen
embedded in the epoxy matrix providing little resistance to crack propagation.
Figure 7.11 exhibits fracture surfaces of a block-copolymer toughened composite illustrating
that fracture clearly occurs along or close to the interface rather than by cohesive failure
through the matrix. The SEM pictures also suggest that the morphology of the fiber
composite fracture surface is significantly different from samples with block-copolymer
modified epoxy resin shown in Figure 5.13 (in Chapter 5). The bulk polymer showed random
distribution of nanostructured micelles, while in fiber composite coated fibers and nodular
interface structures are apparent. Again, no sign of significant matrix deformation is
noticeable. The differences in morphology may manifest that the matrix behaved differently
in the fracture process of the fiber composites. Li et al. [29] studied interfacial structures of

188
glass fiber-reinforced polystyrene composites, where triblock-copolymer coupling agents
polystyrene-b-poly(n-butylacrylate)-b-poly(γ-methacryloxypropyltrimethoxysilane) were
chemically grafted on the fiber surface. They observed so-called hemispherical domain
morphology at the fiber interface where PBuA blocks collapsed onto the glass surface
surrounded by a layer of polystyrene blocks interdiffused with the polystyrene matrix melt. In
the present study it is hypothesized that a similar but nodular domain structure was composed
of a PBuA core and a PMMA corona due to the preferential interaction between different
block segments towards epoxy and fiber reinforcement. This convoluted morphology seen at
the epoxy-glass interface possibly substantiates stronger interfacial adhesion between the
matrix and the fibers; however, this postulate requires further corroboration. In summary, for
the various fiber composite systems studied herein the crack growth was mainly by a
combination of fiber-matrix interfacial debonding and matrix cracking notwithstanding
differences in the resin formulation. It was also noticed visually that fracture surfaces of
filament-wound composites are not as plane as commonly observed in laminated composites.
Furthermore, corrugated features of the fracture surface in fiber composites generally suggest
the creation of additional surface area with the expense of more fracture energy. Similar to
the idea proposed before, at the time of laminate fabrication intermingling of fibers between
adjacent plies resulted in fiber nesting. Hence, for the crack propagation to occur the nested
fibers needed to be pulled out from adjacent plies by changing the planar crack front to
meander along the fibers causing greater energy dissipation.
Figure 7.9 SEM image of a DCB fracture surface of a laminate made with neat epoxy.

189
Figure 7.10 SEM images of DCB fracture surface of 3 wt% I.30E modified epoxy laminate
taken at (a) low and (b) high magnifications.
Figure 7.11 SEM images of the DCB fracture surface of 3 wt% M52N modified epoxy
laminate taken at (a) low and (b)-(d) high magnifications.
(a) (b)
Clay
(a) (b)
(c) (d)

190
7.3 CONCLUSIONS
A qualitative correlation can be derived from the present results regarding the translation of
bulk epoxy fracture energy into fiber composites. Based on the above observations it can be
inferred that the main governing factor in delamination crack initiation was matrix ductility,
provided that firstly the crack-tip plastic zone was not affected by a restraining effect from
adjacent fibers, and secondly, fiber-matrix bonding strength was sufficiently high. Steady-
state crack propagation values of nanoclay filled epoxy composites were found to surpass the
bulk polymer fracture energy. In this type of fiber composite, matrix toughness as well as
other crack resistance phenomena commonly associated with the presence of fibers (e.g. fiber
pull-out, fiber bridging and fiber breakage) substantially increased delamination fracture
toughness. On the other hand, in the block-copolymer modified epoxy composites the
equivalent improvement of delamination energy to the fullest extent of bulk polymer fracture
energy was not realized as fibers restricted crack-tip plastic zone size. It was further found
that reductions in fiber volume fraction enhanced interlaminar fracture toughness in the fiber
composites, which was attributed to the formation of a matrix deformation zone with less
interference from rigid fibers. In accord with other published works this investigation showed
that for strain energy values exceeding 700 J/m2 an increase in resin toughness does not
adequately transfer into composite interlaminar fracture toughness when fiber volume
fractions are maintained at comparable levels.
REFERENCES
1. JONES, M.L.C. and HULL, D., 1979. Microscopy of failure mechanisms in
filament-wound pipe. Journal of Materials Science, 14(1), pp. 165-174.
2. MARTENS, M. and ELLYIN, F., 2000. Biaxial monotonic behavior of a
multidirectional glass fiber epoxy pipe. Composites Part A: Applied Science and
Manufacturing, 31(9), pp. 1001-1014.
3. MERTINY, P. and ELLYIN, F., 2002. Influence of the filament winding tension
on physical and mechanical properties of reinforced composites. Composites Part A:
Applied Science and Manufacturing, 33(12), pp. 1615-1622.
4. BASHAR, M.T., SUNDARARAJ, U. and MERTINY, P., 2012. Microstructure
and mechanical properties of epoxy hybrid nanocomposites modified with acrylic tri-

191
block-copolymer and layered-silicate nanoclay. Composites Part A: Applied Science and
Manufacturing, 43, pp. 945-954.
5. MILLER, S.G. and MEADOR, M.A., 2007. POLYMER- LAYERED SILICATE
NANOCOMPOSITES FOR CRYOTANK APPLICATIONS, Collection of Technical
Papers - AIAA/ASME/ASCE/AHS/ASC Structures, Structural Dynamics and Materials
Conference 2007, pp. 7530-7538.
6. BASHAR, M.T., SUNDARARAJ, U. and MERTINY, P., 2011. Study of Matrix
Micro-cracking in Nanoclay and Acrylic Tri-block-copolymer Modified Epoxy/basalt
Fiber-reinforced Pressure-retaining Structures. Express polymer letters, 5, pp. 882-896.
7. HSIEH, T.H., KINLOCH, A.J., MASANIA, K., SOHN LEE, J., TAYLOR, A.C.
and SPRENGER, S., 2010. The toughness of epoxy polymers and fibre composites
modified with rubber microparticles and silica nanoparticles. Journal of Materials
Science, 45(5), pp. 1193-1210.
8. BECKER, O., VARLEY, R.J. and SIMON, G.P., 2003. Use of layered silicates to
supplementary toughen high performance epoxy-carbon fiber composites. Journal of
Materials Science Letters, 22(20), pp. 1411-1414.
9. SIDDIQUI, N.A., WOO, R.S.C., KIM, J.-K., LEUNG, C.C.K. and MUNIR, A.,
2007. Mode I interlaminar fracture behavior and mechanical properties of CFRPs with
nanoclay-filled epoxy matrix. Composites Part A: Applied Science and Manufacturing,
38(2), pp. 449-460.
10. XU, Y. and HOA, S.V., 2008. Mechanical properties of carbon fiber reinforced
epoxy/clay nanocomposites. Composites Science and Technology, 68(3-4), pp. 854-861.
11. HAQUE, A., SHAMSUZZOHA, M., HUSSAIN, F. and DEAN, D., 2003. S2-
glass/epoxy polymer nanocomposites: Manufacturing, structures, thermal and mechanical
properties. Journal of Composite Materials, 37(20), pp. 1821-1838.
12. TIMMERMAN, J.F., HAYES, B.S. and SEFERIS, J.C., 2002. Nanoclay
reinforcement effects on the cryogenic microcracking of carbon fiber/epoxy composites.
Composites Science and Technology, 62(9), pp. 1249-1258.
13. SUBRAMANIYAN, A.K. and SUN, C.T., 2008. Interlaminar fracture behavior of
nanoclay reinforced glass fiber composites. Journal of Composite Materials, 42(20), pp.
2111-2122.

192
14. WU, J., THIO, Y.S. and BATES, F.S., 2005. Structure and properties of PBO-
PEO diblock copolymer modified epoxy. Journal of Polymer Science, Part B: Polymer
Physics, 43(15), pp. 1950-1965.
15. BASHAR, M.T., SUNDARARAJ, U. and MERTINY, P., 2011. STUDY OF
FRACTURE BEHAVIOR OF NANOCLAY FILLED EPOXY/BASALT FIBER-
REINFORCED NANOCOMPOSITES, Proceedings of the 26th
ASC Technical
Conference 2011, pp. 1-12.
16. HUNSTON, D.L., 1984. Composite interlaminar fracture: effect of matrix
fracture energy. Composites technology review, 6(4), pp. 176-180.
17. HUNSTON, D.L., MOULTON, R.J., JOHNSTON, N.J. and BASCOM, W.D.,
1987. MATRIX RESIN EFFECTS IN COMPOSITE DELAMINATION: MODE I
FRACTURE ASPECTS. ASTM Special Technical Publication 1987, pp. 74-94.
18. BRADLEY, W.L., 1989. Understanding the translation of neat resin toughness
into delamination toughness in composites. Mechanical and corrosion properties. Series
A, Key engineering materials, 37, pp. 161-198.
19. JORDAN, W., BRADLEY, W. and MOULTON, R., 1989. Relating Resin
Mechanical-Properties to Composite Delamination Fracture-Toughness. Journal of
Composite Materials, 23(9), pp. 923-943.
20. KIM, J., BAILLIE, C., POH, J. and MAI, Y.-W., 1992. Fracture toughness of
CFRP with modified epoxy resin matrices. Composites Science and Technology, 43(3),
pp. 283-297.
21. COMPSTON, P. and JAR, P.-Y.B., 1999. Influence of fibre volume fraction on
the mode I interlaminar fracture toughness of a glass-fibre/vinyl ester composite. Applied
Composite Materials, 6(6), pp. 353-368.
22. LEE, S., 1986. A Comparison of Fracture-Toughness of Matrix Controlled Failure
Modes - Delamination and Transverse Cracking. Journal of Composite Materials, 20(2),
pp. 185-196.
23. DAVIES, P., CASARI, P. and CARLSSON, L.A., 2005. Influence of fibre
volume fraction on mode II interlaminar fracture toughness of glass/epoxy using the
4ENF specimen. Composites Science and Technology, 65(2), pp. 295-300.
193
24. MAROM, G., ROMAN, I., HAREL, H., ROSENSAFT, M., KENIG, S. and
MOSHONOV, A., 1988. The strain energy release rate of delamination in fabric-
reinforced composites. International Journal of Adhesion and Adhesives, 8(2), pp. 85-91.
25. JORDAN, W.M. and BRADLEY, W.L., 1984. EFFECT OF RESIN CONTENT
ON THE DELAMINATION FRACTURE BEHAVIOR OF GRAPHITE EPOXY
LAMINATES. National SAMPE Symposium and Exhibition (Proceedings) 1984, pp.
1422-1437.
26. RUSSELL, A.J. and STREET, K.N., 1982. FACTORS AFFECTING THE
INTERLAMINAR FRACTURE ENERGY OF GRAPHITE/EPOXY LAMINATES.
Proceedings of the ICCM-IV conference on Progress in Science and Engineering in
Composites 1982, pp. 279-286.
27. JORDAN, W.M. and BRADLEY, W.L., 1987. MICROMECHANISMS OF
FRACTURE IN TOUGHENED GRAPHITE-EPOXY LAMINATES. ASTM Special
Technical Publication 1987, pp. 95-114.
28. Anderson, T.L., 2005. Fracture Mechanics Fundamentals and Applications.
Boca Raton: CRC Press.
29. LI, Y., LIN, Q., CHEN, L. and ZHOU, X., 2009. Assembly of triblock copolymer
brush at glass fiber/polystyrene interface and its effect on interfacial shear strength.
Composites Science and Technology, 69(11-12), pp. 1919-1924.

194
Chapter 8
Study of Matrix Micro-cracking in Nanoclay and Acrylic
Triblock-copolymer Modified Epoxy/Basalt Fiber-reinforced
Pressure-retaining Structures5
SYNOPSIS: In fiber-reinforced polymer pressure-retaining structures, such as pipes and
vessels, micro-level failure commonly causes fluid permeation due to matrix cracking.
This chapter explores the effect of nano-reinforcements on matrix cracking in filament-
wound basalt fiber/epoxy composite structures. The mechanical properties and
micromechanism of fracture processes in bulk epoxy nanocomposites and hybrid fiber-
reinforced composite tubes modified with acrylic triblock-copolymer and organophilic
layered silicate clay were investigated. Is has been confirmed in the previous chapters of
the thesis that block-copolymer addition significantly enhances epoxy fracture toughness
by a mechanism of particle cavitation and matrix shear yielding, whereas toughness
remained unchanged in nanoclay filled nanocomposites due to the occurrence of lower
energy resistance phenomena such as crack deflection and branching. Composite tubes
modified with either the organic and inorganic nanoparticles exhibited moderate
improvements in leakage failure strain (i.e. matrix cracking strain); however, reductions
in functional and structural failure strength were observed.
8.1 INTRODUCTION
Filament winding is known to be one of the most economic and efficient methods for
producing fiber-reinforced polymer (FRP) structures such as pipes and vessels. Pressure-
retaining structures made from FRP are becoming increasingly popular, and are frequently
considered as an alternative to conventional metallic structures. Improved performance in
5 A version of this chapter has been published as: BASHAR, M., SUNDARARAJ, U. and MERTINY, P.,
2011. Study of matrix micro-cracking in nanoclay and acrylic tri-block-copolymer modified epoxy/basalt
fiber-reinforced pressure-retaining structures. eXPRESS Polymer Letters, 5(10), pp. 882-896.

195
terms of high specific strength and corrosion resistance can be achieved with FRP pressure
structures. However, the performance of these structures is dependent on the diverse and
sustained loading conditions throughout their service life. It is therefore of great importance
to understand their complex material behavior and damage mechanisms under different
loading conditions and environmental effects.
In the design and application of composite pressure piping, functional and structural failure
mechanisms must be considered [1-6]. In the case of functional failure (e.g. leakage) the
structure is unable to contain the pressurized fluid, even though it is still able to sustain the
applied mechanical loading. Leakage in composite tube or pressure vessel is attributed to the
phenomenon causing fluid permeation through multiple pathways in the tube wall. Structural
failure (e.g. burst failure) is thus characterized by the pipe’s inability to carry the applied
loading. These types of failure usually occur as separate events, but can happen as
concomitant damage events depending on the applied loading situation. Functional failure is
typically distinguished by fluid weepage and wetting of the outer wall. Due to fluid
transmission through the wall, composite pressure structures have restricted application
without any ancillary support medium (e.g. liner). Leakage is directly related to transverse
matrix micro-cracking which is characterized by a reduction of composite stiffness as well as
nonlinear stress-strain behavior. Functional failure is known to occur when transverse tensile
loading normal to the fibers exceeds a certain threshold value [6].
On the basis of experimental evidence presented in the preceding chapters it can be inferred
that thermosetting polymers such as epoxies are particularly prone to matrix cracking. One
possible route to enhance crack resistance of thermosets is by dispersing a second particulate
phase inside the polymer matrix. In case of the dispersed particulate/epoxy system, the
mechanism of toughening can be as diverse as the multifarious reinforcements available [7].
Irrespective of the operative crack resistance mechanism, the sole purpose of the dispersant is
to aid the deformation process for dissipating energy. In FRP structures the presence of a
fibrous reinforcement phase introduced additional complexity to polymer toughening. It is
known that toughness enhancements as observed in bulk polymers are not always
transferrable to the same extent to fiber composite systems [8-9].
Recently, it has become an established procedure to develop polymer nanocomposites by
commixing a polymeric phase with one or more reinforcing nano-scale materials, hence

196
generating remarkable physical properties in the developed material. As of now,
nanotechnology in the context of filament-wound pressure piping and vessels has received
only limited attention [10-11]. Since leakage failure is the consequence of matrix cracking in
a polymeric composite pipe, incorporating a nano-scale phase may be an effective means for
enhancing matrix toughness to resist transverse cracking. The notion underlying such efforts
is to improve matrix toughness and thus effectively reduce fluid leakage in filament-wound
pressure bearing structures. With this intention in mind, two different types of nanoparticles
were investigated in this study, i.e. inorganic clay I.30E [11-14] and organic triblock-
copolymer M52N [11, 15-19].
The study presented in this chapter investigated the proposition that incorporation of
nanoparticles into a material system (polymer resin) can be an effective means to inhibit
and/or impede transverse matrix cracking. As a consequence leakage failure of filament-
wound composite pipe is expected to be suspended or delayed based on the postulation of
increased crack resistance by the nanoparticle filled epoxy matrix. In this study several
epoxy-nanoparticle formulations were developed, and filament-wound hybrid fiber-
reinforced nanocomposites with various concentrations of nanoparticles were fabricated.
Mechanical and fracture studies of bulk epoxy nanocomposites were performed, and hybrid
filament-wound epoxy composite tubes were subjected to biaxial stress testing. Thus, this
research provided considerable insight into the micro-failure mechanism of filament-wound
fiber-reinforced tubulars in the presence of nano-inclusions.
8.2 RESULTS AND DISCUSSION
8.2.1 TOM Microscopy Study of Bulk Epoxy Nanocomposites
Transmission optical microscopy (TOM) allowed visualization of polymer deformation by
identifying the birefringence and voided zone underneath the fracture surface. Assuming that
a propagating crack would leave behind traces of a subsurface damage zone, TOM was
employed to confirm the presence of a plastic zone for the pre-crack geometries shown in
Figure 3.15. Figure 8.1 shows the existence of matrix deformation or shear banding that
occurred under plane-strain fracture. The birefringent region for a sharp crack is mainly
confined in the process zone near the starter crack (see Figure 8.1(b)), whereas for a blunt

197
crack the birefringent region shown in Figure 8.1(c) traverses the whole cross-section due to
crack-tip plasticity. Dean et al. [15-16] and Hydro and Pearson [17] reported similar
subsurface localized matrix deformation for block-copolymer (i.e. PEO-PEP, PMMA-PBuA-
PMMA) modified epoxy. TOM images taken under bright field and cross-polarized light
conditions represent a toughened epoxy containing 1 wt% M52N. The size of the crack-tip
plastic zone can be estimated theoretically according to the Irwin equation [20]. In a plane-
strain condition, the Irwin equation, i.e. Equation (7.1) yields the radii of the plastic zone
7.52 µm and 80.04 µm for the sharp and blunt crack geometries, respectively. In terms of the
linear elastic fracture mechanics, the stress situation at the crack-tip can adequately explain
the damage behavior as observed by TOM microscopy. Under plane-strain condition, a
triaxial state of stress caused an intense stress field at the sharp crack-tip, thereby imposing
restrictions on the plastic zone size. For the blunt crack-tip the stress is distributed over a
wider section (mimicking a state of plane-stress) that contributed to the formation of a
relatively larger plastic zone. In the later sections it will be shown that these differences in the
stress field have a considerable effect on the toughening mechanism of the modified epoxy.
Figure 8.1 TOM images of cured block-copolymer/epoxy blend: sharp pre-cracked fracture
surface examined under (a) bright field, (b) cross-polarized light and (c) blunt pre-cracked
surface under cross-polarized light.
(a) (c)(b)
Crack propagation
100µm 100µm100µm

198
8.2.2 Fracture Properties of Bulk Epoxy Nanocomposites
As mentioned earlier, fracture toughness of the neat epoxy was estimated to be 0.78
MPa m0.5
. In Figures 8.2 and 8.3 average stress intensity factors of neat epoxy and its
nanocomposites (i.e. incorporating I.30E nanoclay and M52N block-copolymer respectively)
are compared for the sharp and blunt pre-crack geometries. Note that in the following, error
bars shown in graphs represent plus and minus one standard deviation for tests performed in
triplicate or greater; lines represent first or second degree polynomial trend lines. Only
marginal or no improvement in fracture toughness was achieved for nanocomposites with a
sharp crack, and for a sample containing 2 wt% I.30E with a blunt crack a moderated drop in
fracture energy of up to 10% was observed (see Figure 8.2). According to Zilg et al. [12] and
Zerda and Lesser [13], a mostly intercalated structure rather than an exfoliated
nanocomposite improves toughness by exposing additional surface area during the
propagation of a sharp crack. However, clay nanocomposites prepared in this study behaved
differently, primarily due to partial exfoliation of the nanoclay, and secondly, because of the
relatively smaller size of the intercalated nanoclay. It has been shown in Chapter 4 (in Figure
4.18) that most of the particles are very small on the micron level, indicating a rather uniform
distribution of submicron-size particles. The ultrasonic mixing process is considered to be the
cause for the breakdown of clay agglomerates into the submicron-size. In Chapter 4,
micromechanisms of the fracture process were explored and discussed in light of the
insignificant toughening effect of nanoclay in epoxy matrix. Presented in Section 4.2.4, the
fracture surface morphology of the nanoclay filled epoxy evidenced repeated perturbation of
the crack front from its original propagation path due to the presence of submicron
intercalated clay. This resulted from the bifurcation and/or deflection of the primary crack
into multiple secondary cracks which are not necessarily coplanar [21].
As presented in Figure 8.3 the behavior of block-copolymer filled epoxy was rather different.
It is shown that a sharp pre-cracked nanocomposite containing 5 wt% M52N yields an almost
twofold improvement in toughness, which reveals a direct contribution of block-copolymer
loading on fracture toughness. Pearson and Yee [22-23] observed cavitation induced plastic
deformation for rubber toughened epoxy, and Wu et al. [19] described a similar crack
resistance phenomenon for nanostructured (micelle) block-copolymer modified epoxy. The
author also observed similar phenomena during the fracture process. It is documented in

199
Section 5.2.4 that cavitation of the spherical micelles occurred during the fracture process.
This is substantiated by the presence of minute spherical cavities with approximately ~20 nm
size that are randomly dispersed in the polymer matrix. Hydrostatic tension ahead of the
sharp crack-tip caused cavitation of the rubbery core of the block-copolymer resulting in
localized shear deformation of the epoxy matrix; both are energy absorption mechanisms. In
the case of blunt cracks only a minor enhancement in critical stress intensity became obvious,
which is assumed to be the effect of crack-tip plasticity evidenced by a large deformation
zone shown in TOM microscopy in Figure 8.1(c). Thus, without any discernible distinction
in fracture energy between the block-copolymer modified epoxy and the neat epoxy the
behavior with a blunt crack practically resembles tensile fracture. Subramaniyan and Sun [14]
documented an equivalent effect of crack-tip zone plasticity in their study of organoclay and
core-shell rubber toughened epoxy. As discussed by Subramaniyan and Sun [14] it appears
that fracture behavior associated with propagation of blunt cracks is dominated by a stress
concentration factor and not a stress intensity factor at failure.
Figure 8.2 Critical stress intensity factors of nanocomposites relative to I.30E nanoclay
concentration.
0.4
0.5
0.6
0.7
0.8
0.9
1
1.1
1.2
0% 1% 2% 3% 4%
Filler (I.30E) matrix loading [wt%]
Norm
aliz
ed s
tress inte
nsity facto
r [ / ]
Blunt crack
Sharp crack

200
Figure 8.3 Critical stress intensity factors of nanocomposites relative to M52N block-
copolymer concentration.
8.2.3 Mechanical Properties of Hybrid Nanocomposite Tubes
The fabrication method and mechanical testing of the hybrid fiber-reinforced nanocomposite
tubes are presented in Sections 2.2.6 and 3.12, respectively. Prior to mechanical testing of the
hybrid fiber-reinforced nanocomposite tubes, fiber volume fractions were determined by
resin burn-out testing, and nominal wall thicknesses were also calculated. Corresponding data
are summarized in Table 8-1. Tube samples made with I.30E and M52N exhibited, for the
most part, decreasing fiber volume fraction with increasing nanofiller content. Accordingly,
the reverse trend resulted for the wall thicknesses, which increased with rising nanofiller
content. An increase in resin viscosity with nanofiller loading is assumed to have caused this
behavior.
0.4
0.6
0.8
1
1.2
1.4
1.6
1.8
2
2.2
0% 1% 2% 3% 4% 5% 6%
Filler (M52N) matrix loading [wt%]
Norm
aliz
ed s
tress inte
nsity facto
r [ / ]
Blunt crack
Sharp crack

201
Table 8-1 Fiber volume fraction and nominal wall thickness for fiber-reinforced
nanocomposite tubes.
Particle-matrix
loading
Fiber volume fraction
(%)
Nominal wall thickness
(mm)
0 wt% (Neat) 66.8 1.306
1 wt% I.30E 59.9 1.472
2 wt% I.30E 59.9 1.472
3 wt% I.30E 58.8 1.499
1 wt% M52N 66.0 1.333
3 wt% M52N 65.9 1.341
5 wt% M52N 65.2 1.355
8.2.3.1 Qualitative Analysis of Functional and Structural Failure
In the present test case two obvious failure events were observed in the filament-wound
composite tubes under the applied loading condition. For the pressure vessel type loading
investigated here functional failure always preceded structural failure of the tubes.
Functional failure was manifested by weepage, which is a passive fluid leakage
mechanism through the tube wall. Weepage ultimately affects the capacity of fluid
containment by a pressurized tubular terminating its useful service life. Leakage is the
consequence of micro-damage within the polymer matrix phase and does not primarily
affect the load-bearing capacity and structural integrity of the specimen. Noticeable
changes in leakage rate can be a valuable indicator of the damaged state in the pipe
structure as it depends on such parameters as crack density, size and interconnectivity. In
composite pipes, micro-cracks develop parallel to the fiber direction due to resultant
transverse loading acting perpendicular to the fiber [3] (see Figure 8.4 (a)). Fine striations
formed by transverse cracking are mainly confined in the specific lamina where they
initiated. It should be noted here that transverse matrix cracking phenomenon is only
possible by having an opening mode of positive displacement acting transverse to the
fiber direction [6]. Microscopy inspection of the cracking mechanism by Jones and Hull
[1] identified that both transverse matrix cracking and inter-ply delamination processes
were operative at the time of fracture in filament-wound pipes. The tubes manufactured

202
in this study appeared to be opaque due to differences in the refractive indices of the
basalt fibers and epoxy resin. As such, the investigation of micro-crack initiation and
progression by visualization was not possible during pressure testing.
It is presumed that with increasing load more cracks would accumulate and coalesce;
hence, small oil-wet zones were apparent on the outer surface of the pipe. This
phenomenon of fluid penetration originating from internal matrix cracks ultimately wets
the whole tube perimeter forming droplets to pour down. Intuitively, it can be inferred
from the droplet formation that an extensive network of cracks had developed through the
matrix to cause fluid loss. Post failure inspection of functionally failed fiber-reinforced
composite tubes revealed multiple aligned, nearly homogenously distributed cracks,
which form numerous interconnected fluid pathways from the inner to the outer pipe
surface. The majority of these cracks are oriented parallel to the fiber direction with
crossover undulation points indicating delamination of the laminates [3].
Figure 8.4 Photographs of specimen failure mode: (a) functional failure (epoxy/glass fiber
tube) and (b) structural failure (epoxy/basalt fiber tube).
(a) (b)

203
The tests were continued surpassing the leakage failure point until the intensifier fluid was
exhausted by a catastrophic rupture of the specimen. The breakdown was sudden producing a
localized perforation of the pipe that frequently occurred near one of the end connections.
Structural failure in composite tubulars was therefore recognized as the loss of ultimate
structural integrity. Transverse matrix cracking resulted in considerable damage to the
polymer, facilitating the realignment of fibers in the direction of maximum principal stress,
i.e. the 55o direction [24]. Being constrained at the specimen end connections, the fibers
experienced localize fiber bending. These stress concentrations at the end caps are considered
to be the cause for failure to occur remotely close to the tube ends. At failure opening, broken
and frayed fiber strands could be seen, which is typically the characteristic of a
predominately fiber dominated failure (see Figure 8.4 (b)). Clearly, functional failure did not
coincide with the structural failure event. While the former is dominated by a micro structural
progressive damage mechanism, the latter is controlled by a macro damage mode.
8.2.3.2 Biaxial Stress-strain Response
Figures 8.5 and 8.6 illustrate the biaxial stress versus strain plots of the composite tubes made
with 3 wt% filler concentration. Stress and strain values were computed in the principal
direction of the applied loading. An almost linear stress-stress response can be observed in
hoop direction (Figure 8.5) before functional failure, whereas for the axial direction non-
linear behavior was present long before the functional failure point (Figure 8.6). Considering
the studied fiber configuration of 60°, the axial deformation is largely influenced by the
response of the polymer, and this deformation was greater for the block-copolymer modified
resin system. As load increases, a steady shift from linearity to non-linear behavior is
indicative of beginning of matrix cracking and damage propagation, which manifested itself
in a decrease in stiffness. The stress-strain behavior substantiates the idea that a matrix
dominated progressive damage mode is operative over the loading range. In the composite
tubes with M52N and I.30E modified epoxy, functional failure occurred at axial strains of
1.07% and 0.6% and circumferential strains of 0.25% and 0.2%, respectively.
Table 8-2 summarizes failure stresses (i.e. functional and structural failure strengths) of
the tested nanocomposite tubes. Failure stresses were calculated by following the method
outlined in Section 3.12. The hoop and axial leakage failure stresses of the neat epoxy

204
tube were found to be 175.40 MPa and 91.26 MPa, respectively. Following leakage
failure a more complex deformation process associated with significant non-linear
behavior was observed upon further stressing of the composite tube. It was noticed that
the hoop stress-strain behavior changed from a rising trend toward decreasing strain, and
that axial stain increased significantly after the functional failure. This has been observed
before in other studies [4], and was related to a decreasing transverse stiffness of the
composite pipe. As a result of substantial matrix cracking, the fibers tend to realign
themselves along the direction of the resulting force. The fiber realignment process thus
causes changes in the specimen geometry, affecting circumferential and axial directional
strains in the gage section of the specimen. Burst failure stresses of 476.92 MPa and
246.9 MPa were recorded in hoop and axial direction for neat epoxy pipe. The sample
therefore endured an approximately 2.7 times higher structural failure load than for
functional failure. This clearly demonstrates the susceptibility of these tubular pressure
vessels to leakage damage under the given loading condition and specimen lay-up
configuration.
Figure 8.5 Hoop stress-strain response for [2H:1A] loading of [ 603]T wound tubes
containing 3 wt% filler-matrix content.
0
20
40
60
80
100
120
140
160
180
200
0 0.1 0.2 0.3 0.4
Applie
d h
oop s
tre
ss (
MP
a)
Global strain (%)
3 wt% M52N
3 wt% I.30E

205
Table 8-2 Experimental failure stresses of hybrid fiber-reinforced nanocomposite tubes.
Functional failure stress Structural failure stress
Particle-matrix
loading
Hoop
(MPa)
Axial
(MPa)
Hoop
(MPa)
Axial
(MPa)
0 wt% (Neat) 175.40 91.26 476.92 246.90
1 wt% I.30E 151.94 78.48 372.76 191.96
2 wt% I.30E 132.99 69.02 346.29 178.57
3 wt% I.30E 147.86 76.18 349.86 179.96
1 wt% M52N 181.68 94.10 452.78 233.99
3 wt% M52N 173.85 90.17 445.30 230.10
5 wt% M52N 161.72 83.77 446.21 230.34
Figure 8.6 Axial stress-strain response for [2H:1A] loading of [ 603]T wound tubes
containing 3 wt% filler-matrix content.
0
10
20
30
40
50
60
70
80
90
100
0 0.2 0.4 0.6 0.8 1
Applie
d a
xia
l str
ess (
MP
a)
Global strain (%)
3 wt% M52N
3 wt% I.30E

206
8.2.3.3 Fracture Analysis of Hybrid Nanocomposite Tubes
It is a common inference that transverse matrix cracking initiates near or at the fiber-matrix
interface and then transmits through the resin matrix. Matrix cracks usually initiate at very
low global stain levels due to high strain concentrations near the fiber resulting from the
elastic discontinuity at the interface [1, 25]. Figure 8.7 depicts the influence of nanofiller
loadings on maximum hoop strain, which usually is congruent with the leakage point at this
loading ratio. Maximum hoop strain of the unmodified epoxy tubes was measured to occur at
a mechanical strain of approximately 2400 . Note that in the published literature it was
reported that functional failure occurred at about ~0.3% transverse-to-the-fiber strain for
specimens having fiber arrangement and loading condition comparable to this study [6]. For
a M52N loading of 5 wt% an increase in leakage failure strain of about 30% was observed.
Hence, M52N significantly enhanced the leakage failure strain and at the same time,
somewhat reduced stress-strain non-linearity. These results correspond to those reported by
Garrett and Bailey [26] and Sjogren and Berglund [27-28], who demonstrated a significant
increase in transverse cracking strains as a direct consequence of modifier concentration.
Conversely, for nanoclay modified tubes the leakage failure strain remained practically
unaffected, and a maximum of 10% increase in strain was observed for 3 wt% nanoclay in
the matrix.
Functional and structural hoop failure stresses are presented with corresponding nanofiller
loadings in Figures 8.8 and 8.9. The graph for M52N block-copolymer modified epoxy
reveals that the hoop stress at leakage increased by only 4% with the addition of 1 wt%
M52N (see Figure 8.8). For the remainder of block-copolymer concentrations a less
pronounced effect on leakage strength was noticed, and a simultaneous decrease in leakage
and burst strength was observed for 5 wt% M52N. Test data for tubes made with I.30E filled
polymer showed that the nanoclay imparted significant reductions in both the leakage and
burst failure strengths (see Figure 8.9). In summary, failure strength reductions were strongly
correlated with I.30E loading, whereas strength values remained relatively stable when the
polymer matrix was reinforced with M52N block-copolymer.

207
Figure 8.7 Maximum hoop strain corresponding to functional failure of hybrid
nanocomposite tubes as a function of nanofiller loading.
Figure 8.8 Hoop failure stress of hybrid nanocomposite tubes as a function of M52N block-
copolymer loading.
0
500
1000
1500
2000
2500
3000
3500
4000
0% 1% 2% 3% 4% 5% 6%
Filler matrix loading [wt%]
Max h
oop s
train
[m
icro
str
ain
]
M52N/Epoxy
I.30E/Epoxy
0.4
0.5
0.6
0.7
0.8
0.9
1
1.1
0% 1% 2% 3% 4% 5% 6%
Filler (M52N) matrix loading [wt%]
No
rma
lize
d h
oo
p s
tre
ss [
/ ]
Structural failure
Functional failure
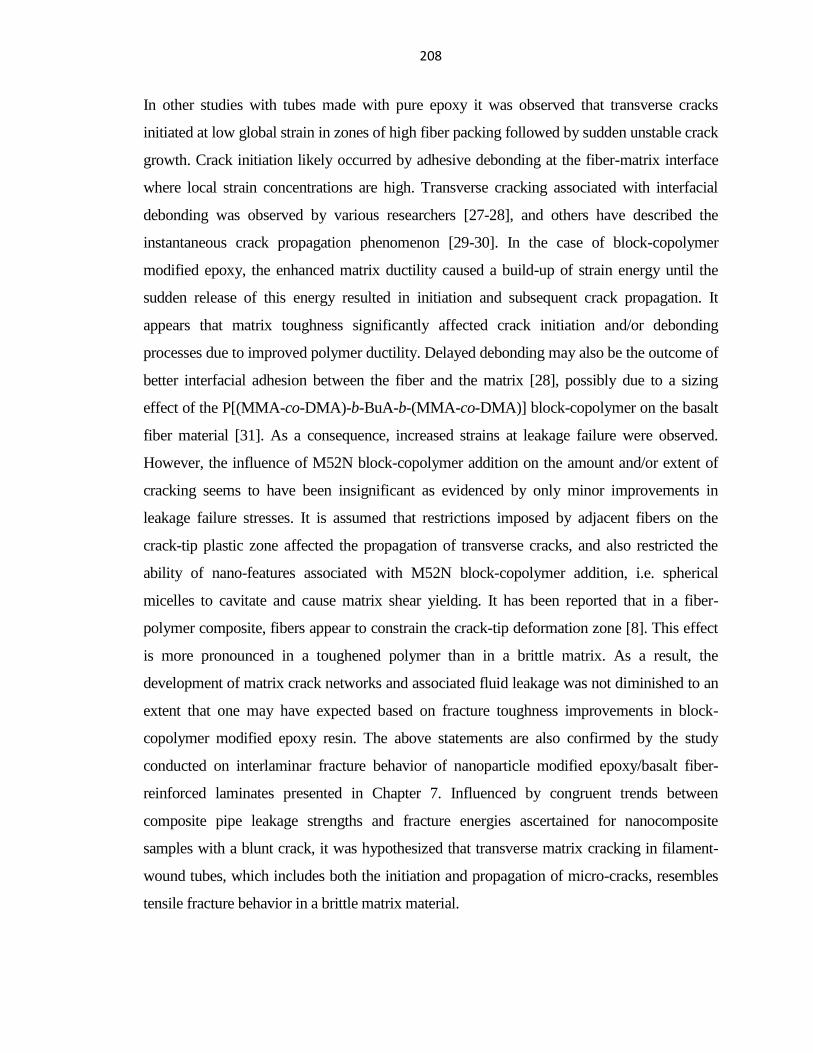
208
In other studies with tubes made with pure epoxy it was observed that transverse cracks
initiated at low global strain in zones of high fiber packing followed by sudden unstable crack
growth. Crack initiation likely occurred by adhesive debonding at the fiber-matrix interface
where local strain concentrations are high. Transverse cracking associated with interfacial
debonding was observed by various researchers [27-28], and others have described the
instantaneous crack propagation phenomenon [29-30]. In the case of block-copolymer
modified epoxy, the enhanced matrix ductility caused a build-up of strain energy until the
sudden release of this energy resulted in initiation and subsequent crack propagation. It
appears that matrix toughness significantly affected crack initiation and/or debonding
processes due to improved polymer ductility. Delayed debonding may also be the outcome of
better interfacial adhesion between the fiber and the matrix [28], possibly due to a sizing
effect of the P[(MMA-co-DMA)-b-BuA-b-(MMA-co-DMA)] block-copolymer on the basalt
fiber material [31]. As a consequence, increased strains at leakage failure were observed.
However, the influence of M52N block-copolymer addition on the amount and/or extent of
cracking seems to have been insignificant as evidenced by only minor improvements in
leakage failure stresses. It is assumed that restrictions imposed by adjacent fibers on the
crack-tip plastic zone affected the propagation of transverse cracks, and also restricted the
ability of nano-features associated with M52N block-copolymer addition, i.e. spherical
micelles to cavitate and cause matrix shear yielding. It has been reported that in a fiber-
polymer composite, fibers appear to constrain the crack-tip deformation zone [8]. This effect
is more pronounced in a toughened polymer than in a brittle matrix. As a result, the
development of matrix crack networks and associated fluid leakage was not diminished to an
extent that one may have expected based on fracture toughness improvements in block-
copolymer modified epoxy resin. The above statements are also confirmed by the study
conducted on interlaminar fracture behavior of nanoparticle modified epoxy/basalt fiber-
reinforced laminates presented in Chapter 7. Influenced by congruent trends between
composite pipe leakage strengths and fracture energies ascertained for nanocomposite
samples with a blunt crack, it was hypothesized that transverse matrix cracking in filament-
wound tubes, which includes both the initiation and propagation of micro-cracks, resembles
tensile fracture behavior in a brittle matrix material.

209
For the nanoclay modified epoxy material it was concluded that the presence of few
flocculated clay particles provided an uneven distribution of stress concentration points
throughout the epoxy matrix, which supposedly acted as initiation sites for transverse matrix
cracks. Due to enhanced stress fields resulting from the interaction of clay aggregates and the
applied loading, leakage strength of the composite tubes was degraded. The cause for
reduced structural strength is believed to also lay with the aforementioned distribution of
stress concentration points. Substantial matrix cracking further caused reduced structural
strength. In the presence of a weakened fiber-matrix load-sharing mechanism, fibers failed at
their weakest points at reduced global load levels. The degraded matrix also allowed fibers to
realign along the direction of the resulting force (55o to the axial direction), thus imposing
additional loading upon the fibers.
Figure 8.9 Hoop failure stress of hybrid nanocomposite tubes as a function of I.30E nanoclay
loading.
0.4
0.5
0.6
0.7
0.8
0.9
1
1.1
0% 1% 2% 3% 4%
Filler (I.30E) matrix loading [wt%]
Norm
aliz
ed h
oop s
tress [ / ]
Structural failure
Functional failure
210
8.3 CONCLUSIONS
The common intuition about transverse matrix cracking is that it is the consequence of stress
acting transverse to the fiber direction. Based on these observations the idea was to reinforce
the relatively brittle epoxy matrix with a nano-particulate phase with the intent to mitigate the
progression of micro-cracks. Yet, the intended reinforcement effect could not be realized,
despite a considerable improvement in fracture toughness for one type of the tested
nanocomposite system, i.e. the M52N triblock-copolymer modified epoxy.
In the bulk nanocomposite system modification of epoxy with M52N rendered significant
improvements of epoxy toughness by a process of particle cavitation and localized shear
deformation of the matrix. In contrast, I.30E clay exhibited an almost negligible influence on
epoxy toughness, where the fracture properties of the nanocomposites are dictated by the
exfoliated and intercalated morphology of the clay.
It was hypothesized that the transverse cracking process for fiber composite tubes made with
M52N block-copolymer toughened epoxy begins with prolonged straining followed by fiber-
matrix interfacial debonding and immediate crack propagation. Crack progression was also
influenced by alteration of the crack-tip stress field by adjacent fibers. In case of the I.30E
nanoclay modified epoxy pipes, transverse matrix cracking was further accelerated in the
presence of micron size clay aggregates which acted as stress concentrators. Even though
leakage failure strain improved moderately for some of the hybrid nanocomposite tubes,
these enhancements proved insignificant for the leakage failure strength, and the damage
mechanism was found to practically resemble that of the neat epoxy composite tubes.
REFERENCES
1. JONES, M.L.C. and HULL, D., 1979. Microscopy of failure mechanisms in filament-
wound pipe. Journal of Materials Science, 14(1), pp. 165-174.
2. ELLYIN, F., CARROLL, M., KUJAWSKI, D. and CHIU, A.S., 1997. Behavior of
multidirectional filament wound fibreglass/epoxy tubulars under biaxial loading.
Composites Part A: Applied Science and Manufacturing, 28(9-10), pp. 781-790.
3. MARTENS, M. and ELLYIN, F., 2000. Biaxial monotonic behavior of a
multidirectional glass fiber epoxy pipe. Composites Part A: Applied Science and
Manufacturing, 31(9), pp. 1001-1014.

211
4. MEIJER, G. and ELLYIN, F., 2008. A failure envelope for 60 filament wound glass
fibre reinforced epoxy tubulars. Composites Part A: Applied Science and Manufacturing,
39(3), pp. 555-564.
5. MERTINY, P., ELLYIN, F. and HOTHAN, A., 2004. An experimental investigation
on the effect of multi-angle filament winding on the strength of tubular composite
structures. Composites Science and Technology, 64(1), pp. 1-9.
6. MERTINY, P. and ELLYIN, F., 2002. Influence of the filament winding tension on
physical and mechanical properties of reinforced composites. Composites Part A: Applied
Science and Manufacturing, 33(12), pp. 1615-1622.
7. GARG, A.C. and MAI, Y.-W., 1988. Failure mechanisms in toughened epoxy resins-
A review. Composites Science and Technology, 31(3), pp. 179-223.
8. HUNSTON, D.L., 1984. Composite interlaminar fracture: effect of matrix fracture
energy. Composites technology review, 6(4), pp. 176-180.
9. BRADLEY, W.L., 1989. Understanding the translation of neat resin toughness into
delamination toughness in composites. Mechanical and corrosion properties. Series A,
Key engineering materials, 37, pp. 161-198.
10. MILLER, S.G. and MEADOR, M.A., 2007. POLYMER- LAYERED SILICATE
NANOCOMPOSITES FOR CRYOTANK APPLICATIONS, Collection of Technical
Papers - AIAA/ASME/ASCE/AHS/ASC Structures, Structural Dynamics and Materials
Conference 2007, pp. 7530-7538.
11. BASHAR, M.T., SUNDARARAJ, U. and MERTINY, P., 2011. Study of Matrix
Micro-cracking in Nanoclay and Acrylic Tri-block-copolymer Modified Epoxy/basalt
Fiber-reinforced Pressure-retaining Structures. Express polymer letters, 5, pp. 882-896.
12. ZILG, C., MÜLHAUPT, R. and FINTER, J., 1999. Morphology and
toughness/stiffness balance of nanocomposites based upon anhydride-cured epoxy resins
and layered silicates. Macromolecular Chemistry and Physics, 200(3), pp. 661-670.
13. ZERDA, A.S. and LESSER, A.J., 2001. Intercalated clay nanocomposites:
Morphology, mechanics, and fracture behavior. Journal of Polymer Science, Part B:
Polymer Physics, 39(11), pp. 1137-1146.
212
14. SUBRAMANIYAN, A.K. and SUN, C.T., 2007. Toughening polymeric composites
using nanoclay: Crack tip scale effects on fracture toughness. Composites Part A: Applied
Science and Manufacturing, 38(1), pp. 34-43.
15. DEAN, J.M., LIPIC, P.M., GRUBBS, R.B., COOK, R.F. and BATES, F.S., 2001.
Micellar structure and mechanical properties of block copolymer-modified epoxies.
Journal of Polymer Science, Part B: Polymer Physics, 39(23), pp. 2996-3010.
16. DEAN, J.M., GRUBBS, R.B., SAAD, W., COOK, R.F. and BATES, F.S., 2003.
Mechanical properties of block copolymer vesicle and micelle modified epoxies. Journal
of Polymer Science, Part B: Polymer Physics, 41(20), pp. 2444-2456.
17. HYDRO, R.M. and PEARSON, R.A., 2007. Epoxies toughened with triblock
copolymers. Journal of Polymer Science, Part B: Polymer Physics, 45(12), pp. 1470-
1481.
18. GERARD, P., BOUPAT, N.P., FINE, T., GERVAT, L. and PASCAULT, J.-P., 2007.
Toughness properties of lightly crosslinked epoxies using block copolymers.
Macromolecular Symposia, 256, pp. 55-64.
19. WU, J., THIO, Y.S. and BATES, F.S., 2005. Structure and properties of PBO-PEO
diblock copolymer modified epoxy. Journal of Polymer Science, Part B: Polymer
Physics, 43(15), pp. 1950-1965.
20. HSIEH, T.H., KINLOCH, A.J., MASANIA, K., SOHN LEE, J., TAYLOR, A.C. and
SPRENGER, S., 2010. The toughness of epoxy polymers and fibre composites modified
with rubber microparticles and silica nanoparticles. Journal of Materials Science, 45(5),
pp. 1193-1210.
21. LEE, J. and YEE, A.F., 2000. Role of inherent matrix toughness on fracture of glass
bead filled epoxies. Polymer, 41(23), pp. 8375-8385.
22. PEARSON, R.A. and YEE, A.F., 1986. Toughening Mechanisms in Elastomer-
modified Epoxies. Part 2: Microscopy Studies. Journal of Materials Science, 21(7), pp.
2475-2488.
23. YEE, A.F. and PEARSON, R.A., 1986. Toughening mechanisms in elastomer-
modified epoxies - Part 1 Mechanical studies. Journal of Materials Science, 21(7), pp.
2462-2474.

213
24. MERTINY, P. and GOLD, A., 2007. Quantification of leakage damage in high-
pressure fibre-reinforced polymer composite tubular vessels. Polymer Testing, 26(2), pp.
172-179.
25. ASP, L.E., BERGLUND, L.A. and TALREJA, R., 1996. Prediction of matrix-
initiated transverse failure in polymer composites. Composites Science and Technology,
56(9), pp. 1089-1097.
26. GARRETT, K.W. and BAILEY, J.E., 1977. Effect of Resin Failure Strain on the
Tensile Properties of Glass Fiber-reinforced Polyester Cross-ply Laminates. Journal of
Materials Science, 12(11), pp. 2189-2194.
27. SJOGREN, B.A. and BERGLUND, L.A., 1999. Toughening mechanisms in rubber-
modified glass fiber/unsaturated polyester composites. Polymer Composites, 20(5), pp.
705-712.
28. SJOGREN, B.A. and BERGLUND, L.A., 2000. Effects of matrix and interface on
damage in GRP cross-ply laminates. Composites Science and Technology, 60(1), pp. 9-
21.
29. WANG, A.S.D., 1984. Fracture Mechanics of Sublaminate Cracks in Composite
Materials. Composites technology review, 6(2), pp. 45-62.
30. PARVIZI, A., GARRETT, K. and BAILEY, J., 1978. Constrained Cracking in Glass
Fiber-Reinforced Epoxy Cross-Ply Laminates. Journal of Materials Science, 13(1), pp.
195-201.
31. LI, Y., LIN, Q., CHEN, L. and ZHOU, X., 2009. Assembly of triblock copolymer
brush at glass fiber/polystyrene interface and its effect on interfacial shear strength.
Composites Science and Technology, 69(11-12), pp. 1919-1924.

214
Chapter 9
Conclusions
9.1 SUMMARY OF RESEARCH FINDINGS AND CONTRIBUTIONS
In this study, the effect of nano-reinforcements on matrix micro-cracking of filament-
wound composite structures was explored. The motivation for the current research arose
from the hypothesis that homogenously dispersed nano-inclusions in a polymer matrix
would prevent or mitigate transverse-to-the-fibers crack initiation and subsequent
propagation. The present study investigated morphology, physical, chemical, thermal,
mechanical and fracture properties of bulk epoxy nanocomposites and hybrid fiber-
reinforced epoxy nanocomposite structures. The nanocomposites with an epoxy matrix
were prepared with various concentrations of two types of commercially available
nanofillers i.e. organoclay and acrylic triblock-copolymer. Flat specimens for
interlaminar fracture testing and tubular samples for pressure testing were filament-
wound for this investigation.
The present study demonstrated that variations in the nanoclay dispersion method and the
type of organic modifier can significantly affect the resulting nanocomposite
morphology, and hence, the enhancement or even reduction of mechanical properties of
epoxy-clay nanocomposites. For the acrylic triblock-copolymer modified epoxy,
improved toughness without major reductions of important thermo-mechanical properties
was ascertained. It was observed that the final properties were greatly influenced by the
concentrations and constituents of the block-copolymers, their self-assemble morphology
and the induced deformation mechanics in the matrix under applied loading. A
particularly notable finding of this study is that tailorable and thus application-optimal
mechanical property enhancements in an epoxy can be achieved through the formation of
a ternary nanocomposite system where both intercalated nanoclay and nanostructured
block-copolymer coexist.

215
The study of filament-wound fiber-reinforced laminates revealed that delamination crack
initiation was not influenced by the presence of nanoparticles in the matrix, whereas a
decreasing fiber volume fraction significantly improved interlaminar fracture energy.
This investigation showed that for strain energy values exceeding about 700 J/m2 an
increase in resin toughness does not adequately transfer into interlaminar fracture
toughness of fiber composites if the fiber volume fraction remained constant. The second
specimen type studied herein, i.e. composite pipes modified with either the organic and
inorganic nanoparticles, exhibited moderate improvements in leakage failure strain;
however, reductions in functional failure (weepage) and structural failure (burst) strength
were observed.
This thesis research makes valuable contributions to science and engineering as this
project provided considerable insight into the micro-failure mechanism of filament-
wound fiber-reinforced tubulars in the presence of nano-inclusions. Prior to this thesis
work and resulting publications, the subject matter had received inadequate attention in
the technical literature. The presented results illustrate the promise and potential of
nanofiller modification for composite structures, especially for pressure-bearing filament-
wound vessels and piping used for the storage and transport of fluids in the energy
industry.
9.2 TOPICS OF FUTURE STUDY
The significant complexity associated with matrix micro-cracking in filament-wound
composite structures makes it difficult to reasonably model leakage failure events with
existing analytical and numerical methods. Due to the presence of multiple cracks and
their interaction and coalescence during the matrix cracking process, it was recognized
that fracture mechanics modeling must be prohibitively complex. As such, the
characterization and standardization of composite pressure-retaining structures are
presently done primarily by rigorous experimental investigations. To alleviate the
requirement for time consuming and extensive testing, the following approaches are
recommended which will involve both the experimental and theoretical study of the
weepage failure phenomena.

216
9.2.1 Permeability Based Leakage Modeling to Detect Functional
Failure in Composite Pipe
This proposed research intends to develop a mechanistic material damage model that will
effectively be applicable to predict functional failure events in various pressurized
composite vessels. In this scheme, an empirical permeability criterion will establish a
relationship between local leakage failure strain and fluid permeability in individual plies.
Previously, Mertiny and Gold [1-2] investigated a permeability based leakage assessment
method similar to that proposed by Wolodko [3] for composite pipes. The noted leak
detection method was based on Darcy’s law with the assumption of uniformly distributed
and interconnected fluid pathways through the damaged composite structure [4]. This
method cannot adequately quantify the extent of damage state in individual plies, as
damage is predominantly inhomogeneous and discontinuous. This procedure is also
dependent on other weepage failure quantification techniques (e.g. a specific fluid
volume loss technique) to determine an intrinsic permeability parameter. For the
proposed methodology, permeability is considered to depend on the damage condition
specific to the individual ply relative to the matrix crack initiation and progression in a
representative composite pressure vessel. The global permeability of the composite will
then be established on the basis of a series combination of this local permeability value in
each lamina [5-6]. An adequate description for fluid transmission across interfaces
between laminae may have to be defined as well. Therefore, it is hypothesized that the
damage state in terms of permeability of the respective lamina can be characterized
through the local strain in a lamina. An empirical permeability-stain relationship may
thus be developed, which would then allow the prediction of functional failure from the
stress-strain response of any composite vessel. Thus, the proposed model will establish a
standard failure criterion for various cylindrical specimens having different geometries
and fiber layup configurations.

217
9.2.2 Micromechanical Modeling of Damage in Nanoparticle Filled
Composite Pipe
As a continuation of the work completed thus far, it is proposed to investigate the effect
of a nanoparticle modified matrix phase on the damage in fiber-reinforced composite
pipes through micro-mechanical modeling. The proposed numerical modeling assumes
the filament-wound composite to be an orthotropic continuum having a fiber architecture
that resembles a periodic array. Figure 9.1 illustrates how a two-cell model of the
filament-wound tube can be implemented for the intended fiber orientation. This
meso/micro-mechanical model is similar to the rhombohedral repeated unit cell model
employed by ia et al. [7] for angle ply [±θ] laminates. The laminate is considered to be
a periodic array of the two-cell repeating units in the in-plane direction, with each cell
consisting of a single fiber in +θ or –θ direction. The model neglects undulations and
crossovers of the filaments, and each successive layer is thought to be made of a single
continuous lamina having a specific fiber orientation. Assuming a uniform fiber
distribution throughout, the fiber diameter in the unit cell is estimated from the fiber
volume fraction of the tested filament-wound pipes.
Figure 9.1 Unit-cell model for filament-wound composite pipe.

218
Unified periodic boundary conditions will be adopted for the two-cell model as illustrated
by Xia et al. [7] for a unidirectional laminate with off-axis loading. To develop the
constitutive model for a fiber/polymer/nano-phase (e.g. basalt/EPON826/M52N)
composite system, the polymer/nano-phase material will be assumed as a single
homogenous continuum having linear elastic properties. The elastic constants that will be
used for polymer/nano-phase are taken from the experiments done on different bulk
nanocomposite samples. If needed, even a non-linear viscoelastic constitutive model can
be implemented taking into consideration time-dependent properties of the matrix
material [8]. In the proposed model, the fiber reinforcement should be specified as linear
elastic.
In the proposed approach it should be explored to model matrix crack initiation and
propagation by a smeared crack approach as presented by Rots [9], and which may be
correlated with a suitable matrix damage criteria (e.g. maximum strain criteria, maximum
stress criteria, equivalent stress criteria). Xia et al. [10] in their study used a maximum
principal strain criterion, i.e. ε1 ≥ εf indicating that the matrix will crack if the maximum
principal strain ε1 exceeds the matrix failure strain εf. The maximum failure strain can be
conveniently estimated from the experimental data of epoxy and its nanocomposites as
shown in Figure 3.12. Once cracks are generated they cause a reduced composite stiffness
as the matrix is unable to transfer tensile and shear loads across the crack plane.
Therefore, a post-damaged constitutive model may be employed. It may be adequate to
consider perfect bonding between the fiber and the matrix discounting interfacial
debonding. If interfacial failure is the dominating failure mechanism then a cohesive
interface damage model may effectively be implemented. Figure 9.2(a) shows the global
stress-strain response derived from biaxial testing of a filament-wound tube. A similar
response is expected from the micro-mechanical modeling, which will be compared
against the experimental results. From Figure 9.2(a) two separate moduli can be specified
by drawing two tangents to the curve, and their knee point refer to accelerated matrix
cracking which usually is congruent with the leakage point. In Figure 9.2(b) bi-axial
straining of the filament-wound pipe in axial and hoop direction is shown, where the
beginning of the negative slope is an indication of the onset of leakage. It is therefore

219
expected that the proposed micro-mechanical model would allow for the identification of
leakage events as well as the corresponding failure stress and strain values.
Figure 9.2 (a) Axial stress-strain response and (b) bi-axial straining of the filament-
wound pipe.
9.2.3 Final Considerations
In Chapter 7 of this thesis, an extensive investigation substantiated that interlaminar
fracture toughness is increased by decreasing fiber volume fraction because more energy
is being expensed when the crack-tip plastic zone has less interference from adjacent
fibers [11]. Also, the findings in Chapter 8 for filament-wound tubes highlighted the fact
that increasing fiber spacing would ease restrictions imposed by fibers on the crack-tip
deformation zone, thereby lessening the probability of transverse crack initiation and
subsequent propagation [12]. Both of the above propositions imply the objective of
facilitating less constrained matrix deformation in the course of the applied loading of a
composite structure. It has been conjectured in this study that due to the constraining
influence of the fibers, matrix fracture is dominated by a brittle failure process rather than
matrix deformation processes [13]. Conversely, the advantage of having higher resin
content may result in reduced structural strength properties of a composite tubular, in
0
20
40
60
80
100
120
0 0.5 1 1.5 2 2.5
Axia
l str
ess [M
Pa]
Axial strain [%]
1 wt% M52N
5 wt% M52N0
0.2
0.4
0.6
0.8
1
1.2
1.4
1.6
0 0.1 0.2 0.3 0.4
Axia
l str
ain
[%
]Hoop strain [%]
1 wt% M52N
(a) (b)

220
which case a balance has to be found between the leakage improvement and associated
degradation in burst strength.
This study disputes the notion put forward previously by some researchers [14-16] that
improving transverse cracking strain would enhance leakage resistance or leakage failure
strength of the composite piping. Even though it was possible to improve cracking strain
by increasing matrix ductility via incorporation of a second rubbery phase, it did not
inhibit or mitigate weepage failure of composite pipes. In the same manner, it can be
conceptualized that modifying the epoxy resin chemistry, e.g. by flexibilizing the epoxy
backbone, increasing epoxide equivalent weight or lowering cross-link density, would
have a rather insignificant effect on transverse cracking strength as well. In fact, this
thesis research suggests that the transverse cracking phenomenon is to some extent
analogous to tensile failure in bulk epoxy. Consequently, the notion of enhancing
polymer toughness appears not to be an effective means for resolving the issue of
transverse matrix cracking in filament-wound composites. Intuitively, it is plausible that
raising polymer toughness brings about disadvantage of lowering other physical
properties, such as strength and glass-transition temperature, which was observed herein
for rigid (i.e. clay) and flexible (i.e. nanostructured block-copolymer) dispersed
particulate systems. Alternative to the above methods, one could shift to a completely
different resin system that should provide considerably higher ultimate strength and
elongation than the present epoxy resin. Certainly, a possible route for improving leakage
failure behavior, besides employing a lined piping structure, would be to optimize the
fiber architecture (stacking sequence, fiber angle, lamina thickness etc.) of the filament-
would structures.
REFERENCES
1. MERTINY, P. and GOLD, A., 2007. Quantification of leakage damage in high-
pressure fibre-reinforced polymer composite tubular vessels. Polymer Testing, 26(2), pp.
172-179.
2. Mertiny, P., and Gold, A. Investigation of leakage failure and permeability
properties of high-pressure fiber-composite pipes and vessels. CSME forum 2006.
Calgary, Canada, May 2006.
221
3. Wolodko, Y., Biaxial fatigue and leakage characteristics of fiber reinforce
composite tubes. PhD Thesis, University of Alberta, Edmonton, Alberta, 1999.
4. KUMAZAWA, H., AOKI, T. and SUSUKI, I., 2003. Analysis and Experiment of
Gas Leakage Through Composite Laminates for Propellant Tanks. AIAA Journal, 41(10),
pp. 2037-2044.
5. ROY, S. and BENJAMIN, M., 2004. Modeling of permeation and damage in
graphite/epoxy laminates for cryogenic fuel storage. Composites Science and Technology,
64(13-14), pp. 2051-2065.
6. PEDDIRAJU, P., NOH, J., WHITCOMB, J. and LAGOUDAS, D.C., 2007.
Prediction of cryogen leak rate through damaged composite laminates. Journal of
Composite Materials, 41(1), pp. 41-71.
7. XIA, Z., ZHANG, Y. and ELLYIN, F., 2003. A unified periodical boundary
conditions for representative volume elements of composites and applications.
International Journal of Solids and Structures, 40(8), pp. 1907-1921.
8. ZHANG, Y., XIA, Z. and ELLYIN, F., 2005. Nonlinear viscoelastic
micromechanical analysis of fibre-reinforced polymer laminates with damage evolution,
Micromechanics of Materials 2005, Elsevier Ltd, pp. 591-604.
9. ROTS, J.G., 1991. Smeared and discrete representations of localized fracture.
International Journal of Fracture, 51(1), pp. 45-59.
10. XIA, Z., CHEN, Y. and ELLYIN, F., 2000. A meso/micro-mechanical model for
damage progression in glass-fiber/epoxy cross-ply laminates by finite-element analysis.
Composites Science and Technology, 60(8), pp. 1171-1179.
11. BASHAR, M.T., SUNDARARAJ, U. and MERTINY, P., 2013. Mode-I
Interlaminar Fracture Behavior of Nanoparticle Modified Epoxy/Basalt Fibre-Reinforced
Laminates. Polymer testing, 32, pp. 402-412.
12. BASHAR, M.T., SUNDARARAJ, U. and MERTINY, P., 2011. Study of Matrix
Micro-cracking in Nanoclay and Acrylic Tri-block-copolymer Modified Epoxy/basalt
Fiber-reinforced Pressure-retaining Structures. Express polymer letters, 5, pp. 882-896.
13. ASP, L.E., BERGLUND, L.A. and TALREJA, R., 1996. A Criterion for Crack
Initiation in Glassy Polymers Subjected to a Composite-like Stress State. Composites
Science and Technology, 56, pp. 1291-1301.

222
14. JONES, M.L.C. and HULL, D., 1979. Microscopy of failure mechanisms in
filament-wound pipe. Journal of Materials Science, 14(1), pp. 165-174.
15. SJOGREN, B.A. and BERGLUND, L.A., 1999. Toughening mechanisms in
rubber-modified glass fiber/unsaturated polyester composites. Polymer Composites,
20(5), pp. 705-712.
16. SJOGREN, B.A. and BERGLUND, L.A., 2000. Effects of matrix and interface
on damage in GRP cross-ply laminates. Composites Science and Technology, 60(1), pp.
9-21.

223
Appendix A
EXPERIMENTALLY GENERATED GRAPHS
Figure A.1 FTIR spectrum of neat epoxy.
Figure A.2 FTIR spectrum of pure M52N block-copolymer.

224
Figure A.3 FTIR spectrum of pure M52 block-copolymer.
Figure A.4 FTIR spectrum of 5 wt% M52N block-copolymer modified epoxy.

225
Figure A.5 FTIR spectrum of 5 wt% M52 block-copolymer modified epoxy.

226
Figure A.6 DSC test result of neat epoxy.
Figure A.7 DSC thermogram of pure M52N block-copolymer.
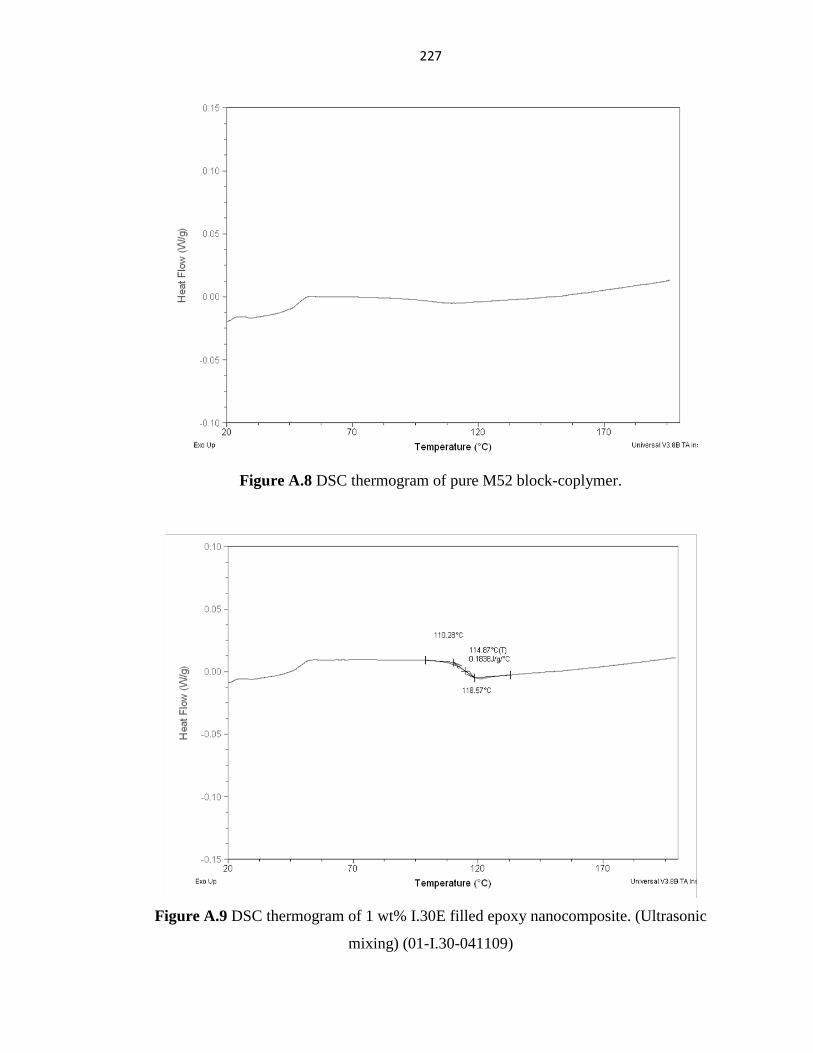
227
Figure A.8 DSC thermogram of pure M52 block-coplymer.
Figure A.9 DSC thermogram of 1 wt% I.30E filled epoxy nanocomposite. (Ultrasonic
mixing) (01-I.30-041109)

228
Figure A.10 DSC thermogram of 2 wt% I.30E filled epoxy nanocomposite. (Ultrasonic mixing)
(02-I.30-071109)
Figure A.11 DSC thermogram of 3 wt% I.30E filled epoxy nanocomposite. (Ultrasonic mixing)
(03-I.30-111109)

229
Figure A.12 DSC thermogram of 1 wt% I.30E filled epoxy nanocomposite. (Mechanical mixing)
(01-I.30-210610)
Figure A.13 DSC thermogram of 2 wt% I.30E filled epoxy nanocomposite. (Mechanical mixing)
(02-I.30-220610)

230
Figure A.14 DSC thermogram of 3 wt% I.30E filled epoxy nanocomposite. (Mechanical mixing)
(02-I.30-230610)
Figure A.15 DSC thermogram of 1 wt% M52N modified epoxy. (01-M52N-261009)

231
Figure A.16 DSC thermogram of 3 wt% M52N modified epoxy. (03-M52N-281009)
Figure A.17 DSC thermogram of 5 wt% M52N modified epoxy. (05-M52N-311009)

232
Figure A.18 DSC thermogram of 1 wt% M52 modified epoxy. (01-M52-291009)
Figure A.19 DSC thermogram of 3 wt% M52 modified epoxy. (03-M52-301009)

233
Figure A.20 DSC thermogram of 5 wt% M52 modified epoxy. (05-M52-011109)
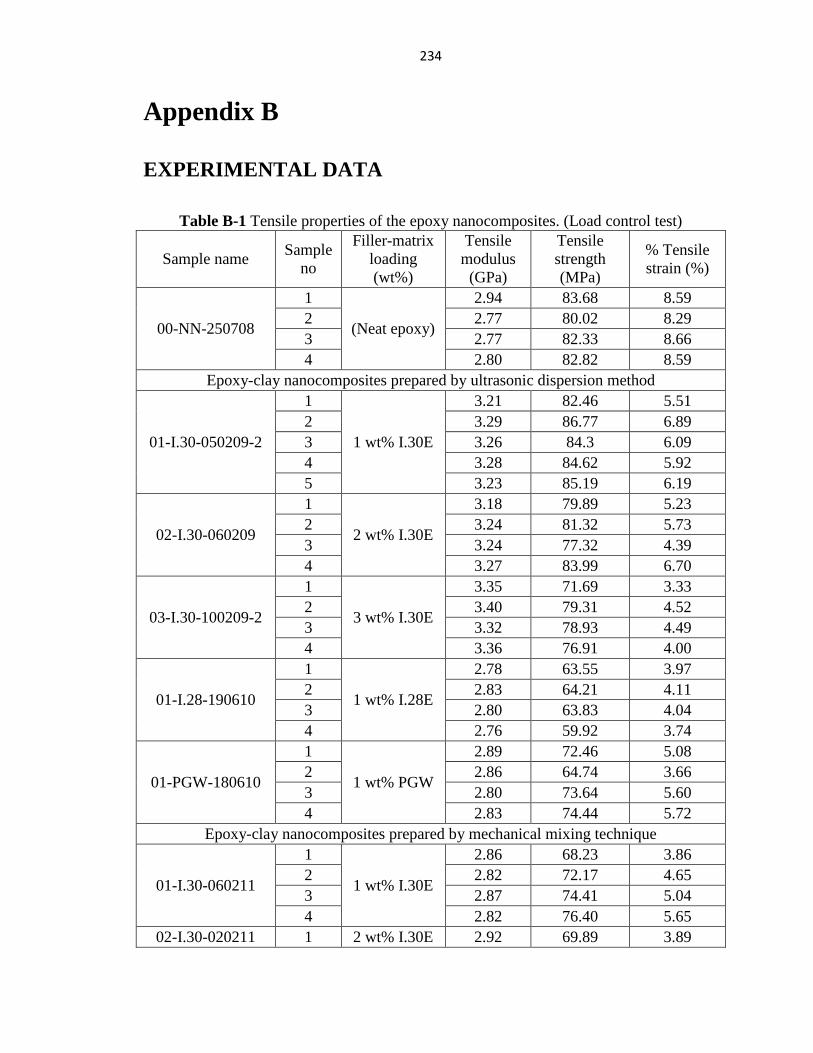
234
Appendix B
EXPERIMENTAL DATA
Table B-1 Tensile properties of the epoxy nanocomposites. (Load control test)
Sample name Sample
no
Filler-matrix
loading
(wt%)
Tensile
modulus
(GPa)
Tensile
strength
(MPa)
% Tensile
strain (%)
00-NN-250708
1
(Neat epoxy)
2.94 83.68 8.59
2 2.77 80.02 8.29
3 2.77 82.33 8.66
4 2.80 82.82 8.59
Epoxy-clay nanocomposites prepared by ultrasonic dispersion method
01-I.30-050209-2
1
1 wt% I.30E
3.21 82.46 5.51
2 3.29 86.77 6.89
3 3.26 84.3 6.09
4 3.28 84.62 5.92
5 3.23 85.19 6.19
02-I.30-060209
1
2 wt% I.30E
3.18 79.89 5.23
2 3.24 81.32 5.73
3 3.24 77.32 4.39
4 3.27 83.99 6.70
03-I.30-100209-2
1
3 wt% I.30E
3.35 71.69 3.33
2 3.40 79.31 4.52
3 3.32 78.93 4.49
4 3.36 76.91 4.00
01-I.28-190610
1
1 wt% I.28E
2.78 63.55 3.97
2 2.83 64.21 4.11
3 2.80 63.83 4.04
4 2.76 59.92 3.74
01-PGW-180610
1
1 wt% PGW
2.89 72.46 5.08
2 2.86 64.74 3.66
3 2.80 73.64 5.60
4 2.83 74.44 5.72
Epoxy-clay nanocomposites prepared by mechanical mixing technique
01-I.30-060211
1
1 wt% I.30E
2.86 68.23 3.86
2 2.82 72.17 4.65
3 2.87 74.41 5.04
4 2.82 76.40 5.65
02-I.30-020211 1 2 wt% I.30E 2.92 69.89 3.89
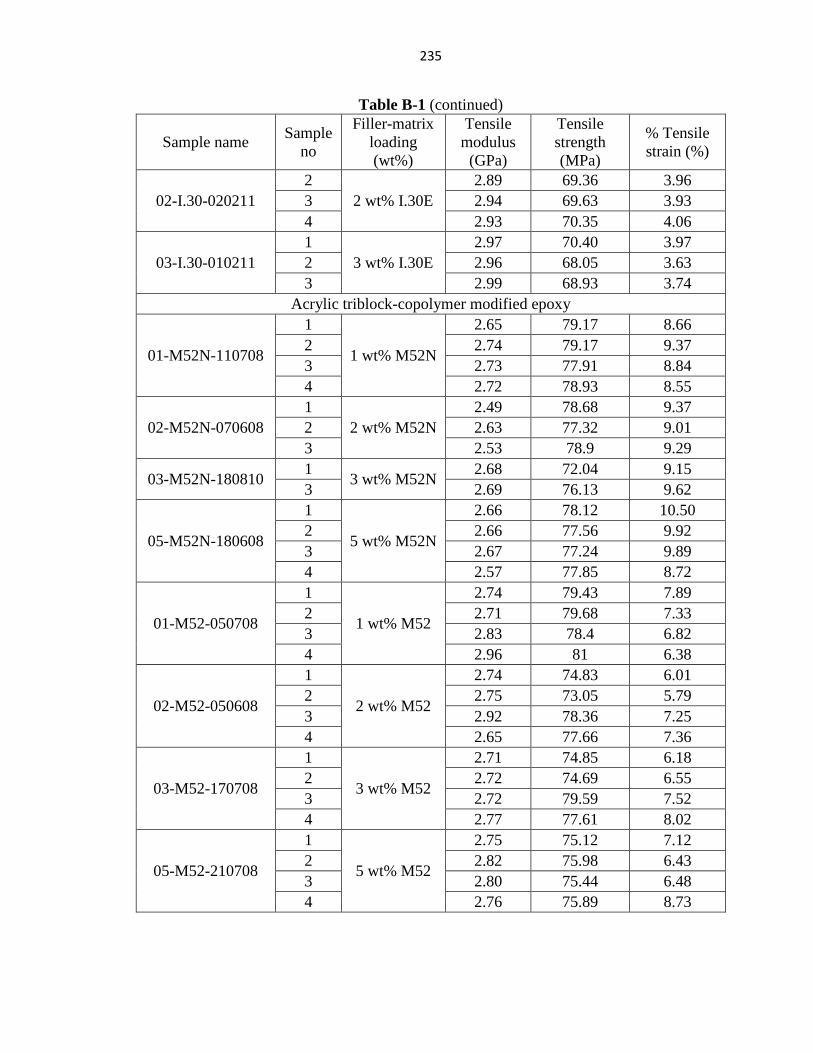
235
Table B-1 (continued)
Sample name Sample
no
Filler-matrix
loading
(wt%)
Tensile
modulus
(GPa)
Tensile
strength
(MPa)
% Tensile
strain (%)
02-I.30-020211
2
2 wt% I.30E
2.89 69.36 3.96
3 2.94 69.63 3.93
4 2.93 70.35 4.06
03-I.30-010211
1
3 wt% I.30E
2.97 70.40 3.97
2 2.96 68.05 3.63
3 2.99 68.93 3.74
Acrylic triblock-copolymer modified epoxy
01-M52N-110708
1
1 wt% M52N
2.65 79.17 8.66
2 2.74 79.17 9.37
3 2.73 77.91 8.84
4 2.72 78.93 8.55
02-M52N-070608
1
2 wt% M52N
2.49 78.68 9.37
2 2.63 77.32 9.01
3 2.53 78.9 9.29
03-M52N-180810 1
3 wt% M52N 2.68 72.04 9.15
3 2.69 76.13 9.62
05-M52N-180608
1
5 wt% M52N
2.66 78.12 10.50
2 2.66 77.56 9.92
3 2.67 77.24 9.89
4 2.57 77.85 8.72
01-M52-050708
1
1 wt% M52
2.74 79.43 7.89
2 2.71 79.68 7.33
3 2.83 78.4 6.82
4 2.96 81 6.38
02-M52-050608
1
2 wt% M52
2.74 74.83 6.01
2 2.75 73.05 5.79
3 2.92 78.36 7.25
4 2.65 77.66 7.36
03-M52-170708
1
3 wt% M52
2.71 74.85 6.18
2 2.72 74.69 6.55
3 2.72 79.59 7.52
4 2.77 77.61 8.02
05-M52-210708
1
5 wt% M52
2.75 75.12 7.12
2 2.82 75.98 6.43
3 2.80 75.44 6.48
4 2.76 75.89 8.73

236
Table B-2 Tensile properties of epoxy nanocomposites. (Stroke control test)
Sample name Sample
no
Filler-matrix
loading
(wt%)
Tensile
modulus
(GPa)
Tensile
strength
(MPa)
% Tensile
strain (%)
00-NN-300607
2
(Neat epoxy)
2.92 73.07 8.37
3 2.86 74.24 8.94
4 2.86 72.46 8.20
Epoxy-clay nanocomposites prepared by ultrasonic dispersion method
01-I.30-050209-1
1
1 wt% I.30E
(1C)
3.15 77.77 6.69
2 3.24 79.31 8.12
3 3.20 79.06 7.71
4 3.03 77.72 6.87
5 3.12 78.67 6.68
03-I.30-100209-1
2
3 wt% I.30E
(3C)
3.32 80.06 4.25
3 3.36 77.9 3.73
4 3.28 74.65 3.44
5 3.36 76.3 3.65
Acrylic triblock-copolymer modified epoxy
01-M52N-160608
1 1 wt% M52N
(1B)
2.68 72.6 9.31
2 2.68 72.89 9.64
4 2.66 72.79 9.28
03-M52N-230708 2
3 wt% M52N
(3B)
2.63 69.49 7.98
3 2.69 69.45 9.46
03-M52N-300708 1 2.58 69.62 10.49
2 2.60 69.53 10.63
05-M52N-140708
1
5 wt% M52N
2.64 68 8.44
2 2.61 67.41 9.54
3 2.58 67.37 11.04
Epoxy hybrid nanocomposites
01I.30-01M52N-
270209
1
1B&1C
3.11 78.16 7.59
2 3.09 76.97 8.56
3 2.99 77.56 8.91
5 3.07 77.77 8.29
03I.30-01M52N-
240510
1
1B&3C
3.24 73.69 4.16
2 3.34 78.92 5.10
3 3.34 75.44 4.14
4 3.31 77.67 5.61
01I.30-03M52N-
250510
1
3B&1C
3.01 82.64 8.17
2 2.96 81.58 8.59
3 2.84 78.99 7.51
4 2.97 80.54 8.41
5 3.04 82.37 9.07

237
Table B-3 Dynamic mechanical analysis test results.
Sample name Sample no Filler-matrix
loading (wt%)
Storage
modulus (GPa)
00-NN-100211
Epoxy_Tem
(Neat epoxy)
2.69
1 2.50
2 2.61
3 2.67
01-M52N-170810
1
1 wt% M52N
2.68
2 2.52
3 2.62
4 2.64
5 2.54
03-M52N-180810
1
3 wt% M52N
2.49
2 2.38
3 2.62
4 2.73
5 2.66
05-M52N-190810
1
5 wt% M52N
2.44
2 2.56
3 2.56
4 2.47
5 2.53
01-M52-090810
1
1 wt% M52
2.70
2 2.62
3 2.71
4 2.89
03-M52-120810
1
3 wt% M52
2.56
2 2.70
3 2.54
4 2.50
05-M52-130810
1
5 wt% M52
2.62
2 2.61
3 2.78
4 2.60
8 2.57
10 2.39

238
Table B-4 Nanocomposite fracture test results. (Sharp crack system)
Sample name Sample
no
Filler-matrix
loading
(wt%)
Crack
length
(mm)
Fracture
toughness
(MPa.m.5
)
Strain
energy
(J/m2)
00-NN-151209
2
(Neat epoxy)
9.52 0.87 283
3 9.85 0.73 204
4 10.36 0.80 243
5 10.15 0.74 213
7 9.90 0.76 227
8 10.19 0.78 243
Epoxy-clay nanocomposite fabricated by ultrasonic mixing method
01-I.30-041109
30
1 wt% I.30E
9.60 0.77 218
31 9.52 0.76 208
32 9.60 0.78 232
36 9.52 0.83 234
37 9.56 0.80 232
02-I.30-071109
41
2 wt% I.30E
9.52 0.75 235
42 9.77 0.80 234
43 10.02 0.88 258
44 10.07 0.83 249
45 9.60 0.77 232
46 9.52 0.80 256
03-I.30-111109
47
3 wt% I.30E
9.52 0.79 239
48 9.69 0.78 220
49 9.77 0.77 232
50 9.73 0.76 220
01-I.28-091109
51
1 wt% I.28E
9.69 1.05 347
52 9.52 1.02 386
53 9.69 0.84 374
01-PGW-091109 54
1 wt% PGW 9.81 0.76 308
56 9.56 0.75 206
Epoxy-clay nanocomposite prepared by mechanical mixing method
01-I.30-210610
2
1 wt% I.30E
10.45 0.77 220
3 11.04 0.74 215
5 10.83 0.77 248
7 10.74 0.84 271
02-I.30-220610
1
2 wt% I.30E
10.74 0.88 297
3 10.70 0.79 245
5 11.12 0.82 231
7 11.04 0.85 280

239
Table B-4 (continued)
Sample name Sample
no
Filler-matrix
loading
(wt%)
Crack
length
(mm)
Fracture
toughness
(MPa.m.5
)
Strain
energy
(J/m2)
03-I.30-230610
3
3 wt% I.30E
10.11 0.95 329
4 10.96 0.84 312
5 9.69 0.93 304
6 10.96 1.02 366
7 9.85 0.92 281
Acrylic triblock-copolymer modified epoxy
01-M52N-261009
11
1 wt% M52N
9.56 0.91 308
12 9.52 0.89 298
13 9.52 0.86 298
14 9.56 0.81 228
03-M52N-281009
15
3 wt% M52N
9.64 1.38 604
16 10.02 1.34 491
17 9.94 1.17 465
18 9.85 1.16 421
05-M52N-311009
20
5 wt% M52N
9.81 1.53 825
21 9.90 1.49 805
22 10.24 1.47 727
23 9.98 1.45 701
01-M52-291009
9
1 wt% M52
10.28 1.00 361
10 9.85 1.06 423
57 9.81 0.99 343
58 10.19 0.98 332
59 10.07 0.90 300
03-M52-301009 69
3 wt% M52
10.62 1.29 586
70 10.70 1.38 670
03-M52-100810 3 10.96 1.20 570
5 9.85 1.24 601
05-M52-011109 72
5 wt% M52
10.32 1.59 857
75 10.02 1.54 839
05-M52-110810
4 9.60 1.54 963
5 9.85 1.42 796
6 10.15 1.51 872
8 9.81 1.45 860
Epoxy hybrid nanocomposites
01I.30-01M52N-
081109
33
1B&1C
9.52 0.88 292
34 9.52 0.90 302
35 9.60 0.85 246
38 9.69 0.86 303

240
Table B-4 (continued)
Sample name Sample
no
Filler-matrix
loading
(wt%)
Crack
length
(mm)
Fracture
toughness
(MPa.m.5
)
Strain
energy
(J/m2)
01I.30-01M52N-
081109
39 1B&1C
9.85 0.80 249
40 9.60 0.82 257
03I.30-01M52N-
210810
1
1B&3C
10.28 0.75 235
2 9.77 0.84 245
3 9.85 0.85 261
4 10.24 0.74 207
01I.30-03M52N-
200810
1
3B&1C
10.02 1.22 555
2 9.77 1.25 557
3 9.77 1.21 527
4 9.85 1.27 607

241
Table B-5 Nanocomposite fracture test results. (Blunt crack system)
Sample name Sample
no
Filler-matrix
loading
(wt%)
Crack
length
(mm)
Fracture
toughness
(MPa.m.5
)
Strain
energy
(J/m2)
00-NN-220908 1
(Neat epoxy)
10.5 2.70 2549
2 10.5 2.65 2577
00-NN-071108 1 10.5 2.58 2525
Epoxy-clay nanocomposites fabricated by ultrasonic mixing method
01-I.30-180109
1
1 wt% I.30E
10.5 2.46 2127
2 10.5 2.52 2315
3 10.5 2.40 2014
02-I.30-210109
1
2 wt% I.30E
10.5 2.27 1693
2 10.5 2.39 1655
3 10.5 2.51 1961
Acrylic triblock-copolymer modified epoxy
01-M52N-120908 1
1 wt% M52N
10.5 2.89 2891
2 10.5 2.82 2747
01-M52N-190908 1 10.5 2.77 3031
03-M52N-180908 1
3 wt% M52N
10.5 3.03 3078
2 10.5 2.92 3086
03-M52N-131108 1 10.5 2.81 2922
05-M52N-170908 1
5 wt% M52N
10.5 2.68 2319
2 10.5 2.96 2966
05-M52N-101108 1 10.5 2.66 2604
01-M52-100908
1
1 wt% M52
10.5 2.68 2522
2 10.5 2.77 2686
3 10.5 2.65 2553
03-M52-110908
1
3 wt% M52
10.5 2.74 2553
2 10.5 2.76 2511
3 10.5 2.69 2506
05-M52-160908
1
5 wt% M52
10.5 2.57 2436
2 10.5 2.68 2620
3 10.5 2.57 2521

242
Table B-6 Mode-I interlaminar fracture toughness test data of the flat laminates.
Sample name Sample
no
Particle-matrix
loading (wt%)
Fiber
volume
fraction
Interlaminar fracture energy
(J/m2)
Initiation Propagation
NL VIS
Neat
2
(Neat epoxy) 0.64
109 208 630
3 126 287 581
5 117 244 624
7 126 229 563
Neat_vol
1
(Neat epoxy) 0.55
242 487 876
2 241 449 775
3 238 428 901
4 206 360 745
5 213 336 683
01-I.30
2
1 wt% I.30E 0.58
149 277 530
3 133 231 566
5 172 292 458
7 185 332 474
8 141 314 433
03-I.30
1
3 wt% I.30E 0.50
192 376 733
2 201 352 713
3 183 381 533
5 194 329 729
6 193 379 528
01-M52N
1
1 wt% M52N 0.59
135 334 683
2 186 418 567
5 166 382 532
6 214 351 593
03-M52N
1
3 wt% M52N 0.63
161 336 699
4 148 359 620
5 125 358 639
6 156 318 514
7 172 401 581
03-M52N_vol
2
3 wt% M52N 0.53
403 846 1203
3 423 675 1396
4 413 744 1149
5 410 685 1050
05-M52N
1
5 wt% M52N 0.56
222 495 750
3 252 519 807
4 240 561 852
5 298 570 736

243
Table B-7 Mode-I interlaminar fracture energy of the flat laminates calculated by
different data reduction methods.
Load point
displacement
(mm)
Applied
load (N)
Delamination
length a, (mm)
Interlaminar fracture energy (J/m2)
MBT
method
CC
method
MCC
method
Specimen name: Neat-02
4.14 29.46 50 109 122 124
6.67 35.35 51 208 231 217
7.08 36.69 52 226 250 238
8.12 39.03 53 272 299 283
8.96 40.67 54 308 338 319
10.42 45.66 55 396 433 411
12.92 45.26 60 456 487 469
15.21 44.86 65 499 525 517
18.33 44.96 70 568 589 587
21.04 43.06 75 591 604 608
23.75 42.01 80 617 624 637
26.46 39.38 85 613 613 628
28.96 39.22 90 637 631 664
32.29 36.47 95 631 620 648
35.41 35.30 100 641 625 660
Specimen name: Neat-03
5.21 29.08 50 126 141 140
8.96 38.94 51 287 318 296
10.16 41.82 52 345 380 354
11.21 44.41 53 398 436 410
12.25 43.67 54 422 460 425
13.08 42.92 55 437 474 434
14.75 41.90 60 452 478 455
17.25 41.00 65 488 505 491
19.75 39.87 70 514 523 518
22.25 39.19 75 539 540 548
25.37 36.99 80 552 545 553
27.87 36.67 85 573 559 583
30.58 35.53 90 582 561 594
33.50 33.84 95 581 554 592
36.59 32.72 100 589 556 600
Specimen name: Neat-05
5.13 26.27 50 117 127 125
8.26 34.49 51 244 263 246
9.30 37.61 52 296 317 299
10.34 39.46 53 340 363 342

244
Table B-7 (continued)
Load point
displacement
(mm)
Applied
load (N)
Delamination
length a, (mm)
Interlaminar fracture energy (J/m2)
MBT
method
CC
method
MCC
method
11.38 39.90 55 368 389 370
13.41 42.54 60 433 448 450
15.91 43.07 65 490 497 513
18.42 39.62 70 492 491 506
21.75 40.55 75 563 554 583
24.67 38.63 80 577 561 594
27.58 35.66 85 567 545 575
31.54 33.31 90 578 550 574
36.12 34.65 95 659 621 663
39.67 34.63 100 693 647 705
Specimen name: Neat-07
4.75 30.47 50 126 139 134
7.04 37.96 51 229 251 234
8.08 40.96 52 280 305 284
8.71 44.06 53 320 347 329
9.33 45.53 54 349 378 360
9.75 46.22 55 365 393 378
11.38 47.67 60 412 434 437
14.71 47.26 65 497 513 513
17.00 45.87 70 526 535 543
19.71 42.17 75 530 532 535
22.42 43.04 80 585 579 599
24.92 39.91 85 574 562 581
26.79 37.55 90 554 537 563
29.08 35.88 95 549 527 559
32.00 35.73 100 577 549 593
Specimen name: Neat_vol-01
5.62 51.02 50 242 269 252
8.33 70.08 51 487 536 501
9.58 77.09 52 607 665 624
10.21 79.80 53 660 719 681
11.04 79.45 54 702 760 714
11.46 80.98 55 732 789 751
13.14 77.88 60 758 798 781
15.43 78.23 65 842 869 874
16.89 66.60 70 742 752 749

245
Table B-7 (continued)
Load point
displacement
(mm)
Applied
load (N)
Delamination
length a, (mm)
Interlaminar fracture energy (J/m2)
MBT
method
CC
method
MCC
method
21.47 66.64 80 850 837 880
23.56 60.65 85 809 787 825
26.26 60.04 90 852 820 876
30.22 57.84 95 904 861 915
33.56 56.50 100 940 887 951
Specimen name: Neat_vol-02
5.62 51.35 50 241 265 257
8.33 65.58 51 449 491 463
10.00 70.84 52 574 625 580
10.42 72.00 53 600 649 609
10.83 73.82 54 631 679 646
11.46 73.25 55 654 700 663
12.27 73.56 60 660 690 699
13.94 70.96 65 682 698 725
15.40 66.08 70 663 666 704
17.69 60.29 75 660 652 684
20.19 55.17 80 655 638 663
23.10 58.80 85 762 733 790
25.60 55.34 90 759 722 780
29.15 52.74 95 788 742 798
31.65 50.72 100 789 736 800
Specimen name: Neat_vol-03
5.62 52.14 50 238 259 245
8.13 65.79 51 428 462 427
8.54 68.11 52 459 493 462
9.58 72.29 53 540 576 540
10.42 75.26 54 603 640 602
11.04 75.68 55 635 670 631
12.38 78.52 60 694 714 715
14.88 77.57 65 778 783 796
16.76 76.64 70 820 809 847
19.05 71.20 75 822 797 837
21.34 67.79 80 835 797 845
23.42 63.77 85 822 775 829
27.80 63.96 90 936 871 933
29.88 63.03 95 950 874 960

246
Table B-7 (continued)
Load point
displacement
(mm)
Applied
load (N)
Delamination
length a, (mm)
Interlaminar fracture energy (J/m2)
MBT
method
CC
method
MCC
method
Specimen name: Neat_vol-04
6.04 46.51 50 206 242 225
8.33 59.73 51 360 421 389
9.58 62.95 52 431 500 458
10.21 65.05 53 469 540 499
11.04 68.20 54 525 601 560
11.66 68.53 55 551 626 584
13.83 69.13 60 624 687 662
15.50 68.04 65 652 700 699
17.17 66.13 70 668 699 721
19.46 60.31 75 658 675 693
21.75 59.51 80 694 698 733
24.25 58.13 85 723 715 764
26.75 55.16 90 726 707 761
29.46 52.27 95 728 699 755
33.21 53.16 100 803 761 837
Specimen name: Neat_vol-05
4.96 56.51 50 213 232 214
6.62 67.64 51 336 364 330
7.25 72.17 52 388 416 381
7.67 74.57 53 418 447 414
8.08 76.14 54 445 472 441
8.50 76.58 55 465 490 459
8.71 74.51 60 437 448 450
11.00 75.82 65 532 531 538
12.46 74.31 70 561 548 569
14.12 72.34 75 589 564 597
16.63 72.44 80 663 623 667
18.92 69.23 85 689 638 684
20.58 68.10 90 707 645 708
22.25 62.53 95 673 606 666
23.71 60.22 100 664 591 660
Specimen name: 01-I.30-02
4.41 37.84 50 149 160 157
6.49 48.29 51 277 294 282
7.53 50.83 52 333 352 333

247
Table B-7 (continued)
Load point
displacement
(mm)
Applied
load (N)
Delamination
length a, (mm)
Interlaminar fracture energy (J/m2)
MBT
method
CC
method
MCC
method
8.99 50.86 54 386 405 375
9.62 52.09 55 417 436 405
10.88 53.41 60 453 463 455
12.96 47.02 65 446 448 431
14.63 48.40 70 488 484 486
16.09 44.37 75 465 455 461
17.96 42.26 80 470 454 465
19.84 41.56 85 485 464 486
22.33 40.71 90 510 483 512
25.67 41.27 95 567 533 572
28.58 37.97 100 557 519 550
Specimen name: 01-I.30-03
4.74 33.18 50 133 146 142
6.82 40.72 51 231 253 238
7.65 41.49 52 261 283 263
8.90 44.45 53 321 346 319
9.53 45.57 54 347 373 345
9.64 43.99 55 335 358 332
11.54 47.22 60 404 421 412
14.04 44.01 65 431 441 427
16.12 45.80 70 487 489 494
18.83 41.90 75 493 488 486
21.33 42.33 80 536 524 536
24.04 41.24 85 561 541 560
26.54 38.78 90 556 531 552
28.20 38.27 95 558 527 564
30.70 38.59 100 588 550 604
Specimen name: 01-I.30-05
4.78 38.33 50 172 189 185
6.66 47.51 51 292 319 306
7.28 48.05 52 318 346 330
7.70 48.13 53 332 360 343
8.54 51.27 54 386 417 400
8.72 51.70 55 392 422 410
10.17 50.77 60 419 443 444
11.84 43.26 65 389 406 397

248
Table B-7 (continued)
Load point
displacement
(mm)
Applied
load (N)
Delamination
length a, (mm)
Interlaminar fracture energy (J/m2)
MBT
method
CC
method
MCC
method
15.80 41.18 75 438 446 450
17.88 39.46 80 450 454 462
19.55 36.96 85 438 438 449
22.46 35.26 90 457 453 463
24.13 36.17 95 480 473 502
26.63 32.70 100 458 448 469
Specimen name: 01-I.30-07
4.70 41.27 50 185 201 198
6.78 52.30 51 332 360 347
7.20 51.92 52 345 372 357
7.82 54.49 53 387 417 403
8.45 54.62 54 413 443 425
8.86 56.26 55 440 470 457
10.66 54.40 60 477 501 494
13.16 52.12 65 528 547 537
14.83 51.69 70 554 568 575
16.50 46.19 75 520 527 531
17.75 44.02 80 504 506 523
19.83 37.71 85 458 456 458
21.50 36.55 90 458 453 464
24.00 36.20 95 483 474 493
26.08 36.01 100 499 487 517
Specimen name: 01-I.30-08
4.34 36.81 50 141 161 160
7.26 49.66 51 314 356 336
7.68 51.24 52 337 381 363
8.30 53.32 53 374 421 404
8.93 53.22 54 396 443 423
9.13 52.83 55 397 442 425
10.96 51.49 60 434 474 464
12.84 49.41 65 459 491 487
14.51 42.82 70 423 447 437
15.96 39.53 75 407 424 419
17.84 38.61 80 422 433 437
19.50 38.55 85 438 445 463
21.59 34.92 90 419 422 434

249
Table B-7 (continued)
Load point
displacement
(mm)
Applied
load (N)
Delamination
length a, (mm)
Interlaminar fracture energy (J/m2)
MBT
method
CC
method
MCC
method
25.75 34.03 100 446 441 472
Specimen name: 03-I.30-01
4.81 45.09 50 192 211 206
7.31 59.18 51 376 412 391
8.15 61.65 52 431 469 444
8.56 62.60 53 453 491 468
9.40 64.24 54 503 542 516
8.96 60.62 55 446 479 462
10.98 64.08 60 541 569 570
13.06 65.94 65 623 643 665
15.15 59.67 70 616 626 642
17.65 57.99 75 660 662 684
20.15 54.04 80 667 660 681
21.81 51.50 85 654 641 673
25.15 52.57 90 734 712 760
28.27 51.63 95 775 745 803
32.02 47.06 100 766 731 771
Specimen name: 03-I.30-02
4.46 47.40 50 201 217 215
6.54 57.43 51 352 378 359
6.96 59.73 52 384 410 395
7.38 60.80 53 408 434 420
8.21 62.98 54 463 491 473
8.45 64.04 55 478 505 493
10.82 66.01 60 587 611 605
12.49 64.48 65 619 635 645
14.57 61.95 70 653 662 678
16.66 60.93 75 692 694 725
19.57 56.35 80 712 707 727
22.70 52.63 85 731 721 733
24.36 49.96 90 709 694 717
26.45 46.90 95 689 670 696
28.74 47.56 100 726 701 749
Specimen name: 03-I.30-03
4.81 44.35 50 183 201 197
7.52 59.92 51 381 416 396

250
Table B-7 (continued)
Load point
displacement
(mm)
Applied
load (N)
Delamination
length a, (mm)
Interlaminar fracture energy (J/m2)
MBT
method
CC
method
MCC
method
9.40 62.81 53 485 524 489
9.82 63.42 54 505 542 510
10.23 61.85 55 506 541 507
11.48 60.27 60 519 542 529
13.56 61.24 65 586 601 604
15.44 55.61 70 572 577 579
17.31 54.08 75 591 587 602
18.98 51.95 80 592 579 607
20.64 47.42 85 559 542 568
21.89 45.34 90 542 519 557
23.98 40.75 95 510 484 513
26.48 39.46 100 522 491 525
Specimen name: 03-I.30-05
3.99 59.21 50 194 214 207
5.66 71.74 51 329 360 337
6.07 72.89 52 354 386 361
6.91 75.76 53 413 447 414
7.74 76.77 54 463 498 455
7.66 74.06 55 436 467 430
8.40 73.82 60 448 468 456
10.07 73.91 65 507 518 515
12.15 72.39 70 567 569 568
13.40 70.74 75 580 572 588
15.69 70.71 80 646 628 653
17.57 68.34 85 667 640 672
19.86 68.23 90 719 682 728
22.15 66.27 95 746 700 753
24.86 64.65 100 784 728 787
Specimen name: 03-I.30-06
4.01 52.24 50 193 216 219
6.30 66.23 51 379 422 407
6.93 67.83 52 421 466 448
7.55 68.19 53 454 501 478
7.97 69.77 54 483 531 510
8.38 68.51 55 492 539 515
10.12 66.42 60 538 578 561

251
Table B-7 (continued)
Load point
displacement
(mm)
Applied
load (N)
Delamination
length a, (mm)
Interlaminar fracture energy (J/m2)
MBT
method
CC
method
MCC
method
14.29 61.73 70 623 650 640
15.75 55.34 75 581 600 590
16.79 55.03 80 584 596 611
18.46 45.02 85 499 504 498
19.71 45.78 90 515 517 532
21.37 46.83 95 546 544 579
23.87 44.34 100 552 546 580
Specimen name: 01-M52N-01
4.79 35.23 50 135 149 143
8.33 50.74 51 334 365 335
9.17 52.20 52 373 405 371
9.58 52.50 53 387 418 385
10.00 54.14 54 411 442 413
10.83 56.31 55 457 489 459
12.28 56.67 60 491 511 503
15.61 57.40 65 597 607 601
18.53 57.86 70 677 675 681
21.03 57.36 75 724 709 732
22.69 51.63 80 669 645 669
24.36 49.64 85 660 627 666
27.07 46.71 90 660 619 659
30.40 47.06 95 715 664 719
32.69 44.43 100 697 640 699
Specimen name: 01-M52N-02
5.00 44.70 50 186 197 199
8.12 62.66 51 418 441 432
8.75 63.96 52 454 475 467
9.58 66.26 53 508 529 520
10.21 64.82 54 522 541 526
11.46 63.20 55 564 581 550
12.19 61.19 60 546 549 549
14.90 58.16 65 598 589 586
16.36 56.06 70 598 579 594
17.61 53.28 75 580 552 583
19.28 49.11 80 557 523 556
20.73 47.61 85 554 513 560

252
Table B-7 (continued)
Load point
displacement
(mm)
Applied
load (N)
Delamination
length a, (mm)
Interlaminar fracture energy (J/m2)
MBT
method
CC
method
MCC
method
25.32 44.21 95 574 520 579
26.98 43.86 100 582 523 598
Specimen name: 01-M52N-05
5.21 41.32 50 166 183 174
8.75 57.44 51 382 418 380
9.37 59.62 52 419 456 419
10.21 62.36 53 472 510 471
10.63 62.96 54 490 526 489
11.17 62.44 55 504 538 500
12.23 62.50 60 521 541 532
14.52 58.77 65 551 557 550
16.60 61.42 70 624 618 638
18.06 54.47 75 573 557 575
19.31 52.12 80 559 534 567
20.77 48.31 85 533 501 537
22.44 44.84 90 511 475 512
25.15 44.10 95 541 496 541
27.44 42.20 100 543 492 540
Specimen name: 01-M52N-06
5.23 49.87 50 214 234 223
7.31 59.12 51 351 380 350
7.73 60.30 52 373 402 373
8.14 60.70 53 390 418 390
8.77 63.35 54 433 461 434
9.40 62.19 55 449 476 443
9.98 61.54 60 444 459 455
12.07 62.01 65 510 516 521
14.36 60.37 70 559 555 565
16.44 59.93 75 603 589 612
18.11 55.22 80 583 560 585
20.19 53.03 85 595 564 596
21.86 49.88 90 579 543 579
23.94 47.52 95 579 537 577
26.65 47.58 100 619 568 621
Specimen name: 03-M52N-01
5.21 38.67 50 161 179 175

253
Table B-7 (continued)
Load point
displacement
(mm)
Applied
load (N)
Delamination
length a, (mm)
Interlaminar fracture energy (J/m2)
MBT
method
CC
method
MCC
method
10.00 53.34 52 416 456 415
10.42 56.00 53 449 489 455
11.04 56.01 54 470 509 473
11.67 56.13 55 491 529 492
13.78 60.87 60 592 622 613
16.49 56.93 65 626 642 632
18.57 54.81 70 643 647 650
20.65 53.10 75 658 650 669
23.15 50.63 80 670 651 678
25.24 48.12 85 662 635 671
28.57 45.96 90 685 649 685
31.49 44.54 95 701 656 701
33.99 45.77 100 747 692 765
Specimen name: 03-M52N-04
5.62 31.50 50 148 161 153
9.58 45.61 51 359 389 359
10.42 47.34 52 400 430 398
11.25 49.90 53 449 480 450
11.67 48.26 54 444 473 441
12.29 50.34 55 482 510 483
13.53 47.94 60 475 490 482
16.45 45.54 65 517 523 513
18.95 44.66 70 552 548 549
21.24 43.76 75 575 562 577
23.53 42.69 80 591 570 598
26.03 40.36 85 589 561 593
29.57 39.78 90 630 593 633
32.28 36.26 95 600 559 594
36.03 37.18 100 659 608 660
Specimen name: 03-M52N-05
4.79 30.86 50 125 137 135
9.17 46.86 51 358 391 364
10.42 49.11 52 420 456 422
11.25 50.77 53 463 500 465
11.67 52.82 54 493 529 502

254
Table B-7 (continued)
Load point
displacement
(mm)
Applied
load (N)
Delamination
length a, (mm)
Interlaminar fracture energy (J/m2)
MBT
method
CC
method
MCC
method
13.84 52.24 60 536 559 554
16.34 46.91 65 535 547 537
18.63 48.33 70 594 597 609
21.34 46.49 75 620 614 633
24.05 43.79 80 626 611 633
26.55 41.81 85 628 606 636
29.05 39.28 90 617 588 621
31.97 39.56 95 654 618 669
35.92 36.97 100 659 616 660
Specimen name: 03-M52N-06
4.72 38.48 50 156 168 163
7.43 50.61 51 318 341 319
7.85 51.75 52 338 361 340
8.26 51.81 53 352 373 353
8.68 52.79 54 372 392 374
9.42 53.84 55 406 426 405
11.15 54.19 60 453 465 457
13.02 55.76 65 512 516 527
15.10 52.68 70 530 525 539
15.93 50.84 75 512 499 533
18.02 45.95 80 497 478 506
20.52 42.98 85 504 479 504
22.60 40.06 90 494 465 490
25.10 41.31 95 541 504 547
27.18 38.09 100 518 478 518
Specimen name: 03-M52N-07
4.83 39.80 50 172 184 179
8.16 55.69 51 401 428 398
8.79 58.57 52 448 475 448
9.20 59.88 53 472 499 476
9.62 59.69 54 485 510 488
10.24 58.55 55 500 523 496
10.52 56.46 60 463 475 481
13.23 53.89 65 522 526 526
15.31 51.59 70 545 542 548
16.98 48.80 75 540 530 545

255
Table B-7 (continued)
Load point
displacement
(mm)
Applied
load (N)
Delamination
length a, (mm)
Interlaminar fracture energy (J/m2)
MBT
method
CC
method
MCC
method
22.19 43.96 85 574 551 566
24.06 42.84 90 578 550 578
26.36 41.81 95 590 557 594
28.44 39.98 100 583 546 589
Specimen name: 03-M52N_vol-02
6.88 75.30 50 403 449 427
10.83 101.46 51 846 934 861
12.50 107.66 52 1022 1122 1025
13.12 109.24 53 1075 1172 1080
13.54 109.10 54 1094 1186 1100
13.77 109.08 55 1099 1184 1113
16.12 112.67 60 1253 1312 1290
19.25 106.21 65 1333 1363 1342
21.75 100.59 70 1353 1355 1354
22.79 98.18 75 1316 1293 1353
25.50 87.47 80 1251 1208 1250
26.96 85.40 85 1233 1174 1256
29.25 79.91 90 1199 1126 1214
31.75 75.35 95 1177 1091 1186
35.08 72.55 100 1203 1103 1205
Specimen name: 03-M52N_vol-03
6.46 76.37 50 423 473 445
8.54 93.51 51 675 752 703
9.58 100.74 52 804 891 838
10.62 106.04 53 926 1020 961
11.46 109.87 54 1021 1119 1060
12.29 113.70 55 1118 1219 1162
14.55 113.57 60 1239 1322 1299
17.05 108.94 65 1311 1371 1365
20.17 102.42 70 1377 1417 1407
22.25 95.51 75 1342 1360 1369
25.17 86.72 80 1310 1310 1306
27.88 85.95 85 1369 1353 1382
29.96 84.57 90 1382 1351 1419
32.67 81.90 95 1396 1352 1440
35.38 81.17 100 1436 1378 1501
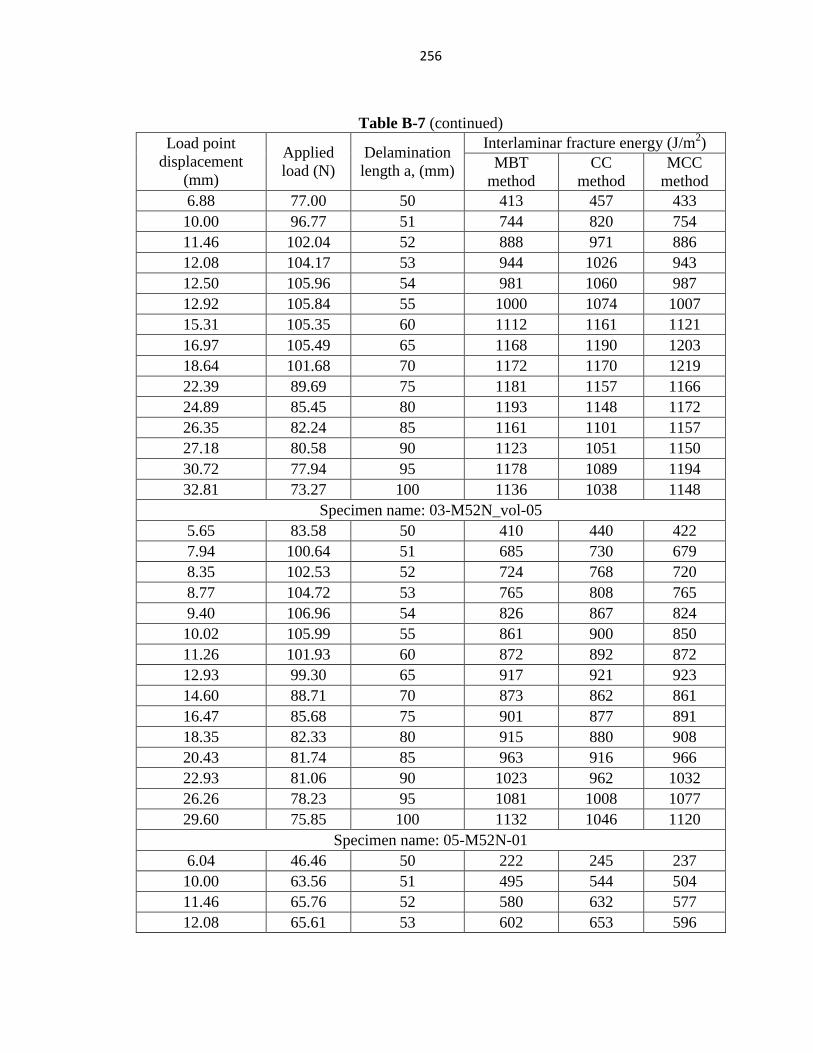
256
Table B-7 (continued)
Load point
displacement
(mm)
Applied
load (N)
Delamination
length a, (mm)
Interlaminar fracture energy (J/m2)
MBT
method
CC
method
MCC
method
6.88 77.00 50 413 457 433
10.00 96.77 51 744 820 754
11.46 102.04 52 888 971 886
12.08 104.17 53 944 1026 943
12.50 105.96 54 981 1060 987
12.92 105.84 55 1000 1074 1007
15.31 105.35 60 1112 1161 1121
16.97 105.49 65 1168 1190 1203
18.64 101.68 70 1172 1170 1219
22.39 89.69 75 1181 1157 1166
24.89 85.45 80 1193 1148 1172
26.35 82.24 85 1161 1101 1157
27.18 80.58 90 1123 1051 1150
30.72 77.94 95 1178 1089 1194
32.81 73.27 100 1136 1038 1148
Specimen name: 03-M52N_vol-05
5.65 83.58 50 410 440 422
7.94 100.64 51 685 730 679
8.35 102.53 52 724 768 720
8.77 104.72 53 765 808 765
9.40 106.96 54 826 867 824
10.02 105.99 55 861 900 850
11.26 101.93 60 872 892 872
12.93 99.30 65 917 921 923
14.60 88.71 70 873 862 861
16.47 85.68 75 901 877 891
18.35 82.33 80 915 880 908
20.43 81.74 85 963 916 966
22.93 81.06 90 1023 962 1032
26.26 78.23 95 1081 1008 1077
29.60 75.85 100 1132 1046 1120
Specimen name: 05-M52N-01
6.04 46.46 50 222 245 237
10.00 63.56 51 495 544 504
11.46 65.76 52 580 632 577
12.08 65.61 53 602 653 596

257
Table B-7 (continued)
Load point
displacement
(mm)
Applied
load (N)
Delamination
length a, (mm)
Interlaminar fracture energy (J/m2)
MBT
method
CC
method
MCC
method
13.75 66.79 55 680 729 666
14.43 67.55 60 680 709 698
17.76 64.39 65 754 768 752
20.47 63.62 70 814 812 814
22.35 58.17 75 772 756 765
24.02 55.35 80 752 725 752
25.68 52.43 85 728 691 731
28.18 49.15 90 716 672 714
31.10 49.46 95 763 707 769
34.43 48.43 100 794 728 800
Specimen name: 05-M52N-03
6.04 53.58 50 252 282 274
9.58 70.40 51 519 577 536
10.83 74.39 52 612 675 626
11.67 73.78 53 646 708 651
12.08 73.45 54 657 716 662
12.62 71.10 55 657 711 653
13.79 72.88 60 693 730 716
16.08 67.30 65 706 726 713
17.75 62.29 70 684 688 687
19.41 60.98 75 696 688 709
21.29 59.60 80 711 691 731
24.21 61.41 85 796 762 829
27.29 58.53 90 819 773 842
30.25 54.93 95 817 762 829
33.16 50.82 100 796 735 795
Specimen name: 05-M52N-04
6.04 46.97 50 240 258 253
10.42 64.61 51 561 600 557
11.04 66.90 52 607 646 606
11.67 68.08 53 644 682 644
12.29 68.62 54 675 710 674
12.92 70.61 55 720 754 723
14.50 69.71 60 749 766 768
17.00 69.14 65 820 822 845
19.09 64.09 70 806 795 825

258
Table B-7 (continued)
Load point
displacement
(mm)
Applied
load (N)
Delamination
length a, (mm)
Interlaminar fracture energy (J/m2)
MBT
method
CC
method
MCC
method
23.88 58.11 80 824 789 840
27.01 56.96 85 871 823 888
30.34 53.20 90 872 816 876
33.25 50.90 95 876 810 878
35.13 45.22 100 788 722 778
Specimen name: 05-M52N-05
6.02 53.59 50 298 328 337
9.56 65.62 51 570 625 601
10.18 64.82 52 591 645 617
10.60 65.37 53 611 665 641
11.22 65.75 54 642 695 671
11.61 67.21 55 669 721 707
13.84 68.14 60 754 799 809
15.92 66.27 65 791 825 856
18.01 61.82 70 786 809 847
20.51 57.34 75 784 797 836
22.59 52.81 80 754 758 799
25.30 47.98 85 728 726 758
28.42 43.28 90 703 695 714
31.34 43.82 95 749 735 775
34.47 42.56 100 765 746 794

259
Table B-8 Fiber volume fraction data for the flat laminate samples. (Mode-I interlaminar
fracture test samples)
Sample
name
Filler-
matrix
loading
Tow
tension (N)
Lamina
layers
Sample
mass (g)
Fiber
mass (g)
Fiber volume
fraction
Neat (Neat
epoxy)
26.7 8 7.42 6.05 0.66
26.7 8 6.74 5.38 0.63
Neat_vol 0.0 8 7.39 5.56 0.57
0.0 8 6.81 4.98 0.54
01-I.30 1 wt%
I.30E
26.7 8 4.14 3.13 0.57
26.7 8 2.80 2.13 0.58
03-I.30 3 wt%
I.30E
26.7 8 5.26 3.68 0.50
26.7 8 5.30 3.67 0.50
01-M52N 1 wt%
M52N
26.7 8 7.70 5.93 0.59
26.7 8 7.58 5.67 0.56
26.7 8 5.24 4.04 0.59
26.7 8 5.81 4.60 0.62
03-M52N 3 wt%
M52N
26.7 8 8.10 6.43 0.62
26.7 8 3.40 2.74 0.64
26.7 8 8.54 6.71 0.61
03-
M52N_vol
0.0 8 6.52 4.81 0.55
0.0 8 7.31 5.15 0.51
05-M52N 5 wt%
M52N
26.7 8 8.66 6.56 0.57
26.7 8 8.07 5.91 0.54

260
Table B-9 Experimentally determined functional failure (leakage) stresses of filament-
wound composite pipes for 2-to-1 hoop-to-axial loading ratio.
Filler-matrix
loading
(wt%)
Sample
name FVF
Failure
pressure
(kPa)
Axial failure
load (N)
Hoop
stress
(MPa)
Axial
stress
(MPa)
Neat epoxy T007 0.68 12124 965.2 175.29 90.66
T008 0.66 12139 1144.4 175.51 91.87
1 wt% M52N
T003 0.66 12976 1071.1 183.91 95.28
T004 0.66 13054 1111.8 185.03 96.07
T022
12429 977.4 176.09 90.94
3 wt% M52N
T005 0.65 12652 1014.0 178.21 92.13
T006 0.67 12235 953.0 172.29 88.90
T023
12147 1152.5 171.04 89.50
5 wt% M52N
T001 0.65 11087 863.4 154.37 79.62
T002 0.66 11756 912.2 163.77 84.45
T024
11987 1115.9 167.02 87.23
1 wt% I.30E
T012 0.59 12715 1075.1 163.16 84.37
T013 0.61 11141 924.5 142.79 73.74
T014
11688 957.0 149.87 77.32
2 wt% I.30E
T015
10864 920.4 139.20 71.99
T016 0.60 11040 1010.0 141.48 73.58
T017
9247.6 843.0 118.28 61.50
3 wt% I.30E
T018 0.61 10931 863.4 137.55 70.75
T019 0.57 11554 928.5 145.46 74.91
T020
12743 1062.9 160.57 82.90

261
Table B-10 Experimentally determined structural failure (burst) stresses of filament-
wound composite pipes for 2-to-1 hoop-to-axial loading ratio.
Filler-matrix
loading
(wt%)
Sample
name FVF
Failure
pressure
(kPa)
Axial failure
load (N)
Hoop
stress
(MPa)
Axial
stress
(MPa)
Neat epoxy T007 0.68 32243 2524.9 468.75 242.17
T008 0.66 33363 2777.4 485.09 251.63
1 wt% M52N
T003 0.66 32355 2553.4 460.86 238.05
T004 0.66 28818 2366.1 410.31 212.50
T022
34196 2663.4 487.17 251.43
3 wt% M52N
T005 0.65 33373 2598.2 472.57 243.84
T006 0.67 30055 2317.2 425.44 219.38
T023
30933 2598.2 437.91 227.09
5 wt% M52N
T001 0.65 31612 2431.3 442.93 228.28
T002 0.66 31905 2451.6 447.05 230.39
T024
32020 2647.1 448.66 232.34
1 wt% I.30E
T012 0.59 27869 2243.9 359.27 185.17
T013 0.61 29306 2309.1 377.87 194.47
T014
29559 2345.7 381.15 196.25
2 wt% I.30E
T015
27821 2191 358.65 184.58
T016 0.60 26731 2191 344.55 177.79
T017
26045 2162.5 335.67 173.36
3 wt% I.30E
T018 0.61 27141 2101.4 343.55 176.49
T019 0.57 27947 2227.6 353.79 182.09
T020
27825 2219.5 352.24 181.30