Perceptually-driven decision theory for interactive realistic rendering
30
Perceptually-Driven Decision Theory for Interactive Realistic Rendering REYNALD DUMONT, FABIO PELLACINI, and JAMES A. FERWERDA Cornell University In this paper we introduce a new approach to realistic rendering at interactive rates on commodity graphics hardware. The approach uses efficient perceptual metrics within a decision theoretic framework to optimally order rendering operations, pro- ducing images of the highest visual quality within system constraints. We demonstrate the usefulness of this approach for various applications such as diffuse texture caching, environment map prioritization and radiosity mesh simplification. Although here we address the problem of realistic rendering at interactive rates, the perceptually-based decision theoretic methodology we introduce can be usefully applied in many areas of computer graphics. Categories and Subject Descriptors: I.3.7 [Computer Graphics]: Three-Dimensional Graphics and Realism General Terms: Algorithms, Human Factors, Performance Additional Key Words and Phrases: Human vision, visual perception, perceptually-based rendering 1. INTRODUCTION Many important graphics applications demand realistic rendering of complex scenes at interactive rates (simulation, training systems, virtual environments, scientific visualization, games), but this is a computationally intensive process for which satisfactory solutions do not yet exist. Performance increases in hardware-based graphics accelerators have enabled significant improvements in rendering capabilities, but concurrent increases in user requirements for realism, complexity and interactivity mean that computational demands will continue to outstrip computational resources for the foreseeable future. Over the years, many researchers have developed efficiency schemes to reduce the computational load of the rendering process. Level-of-detail methods, frustum, occlusion, detail culling, and image-based representations all seek to reduce the number of polygons that need to be sent through the graphics pipeline. The vast majority of these approaches take advantage of geometric visibility to speed up the rendering process. Since realism is often the goal of rendering, greater efficiencies can be realized by taking advantage of the limitations of the human visual system and not rendering scene features that will be impercepti- ble. Significant advances have recently been made in the development of perceptual rendering metrics [Bolin and Meyer 1998; Ferwerda et al. 1997; Myszkowski 1998; Ramasubramanian et al. 1999], which Authors’ address: Program of Computer Graphics, Rhodes Hall, Cornell University, Ithaca, NY 14853; email: {reynald;fabio;jaf}@ graphics.cornell.edu. Permission to make digital or hard copies of part or all of this work for personal or classroom use is granted without fee provided that copies are not made or distributed for profit or direct commercial advantage and that copies show this notice on the first page or initial screen of a display along with the full citation. Copyrights for components of this work owned by others than ACM must be honored. Abstracting with credit is permitted. To copy otherwise, to republish, to post on servers, to redistribute to lists, or to use any component of this work in other works requires prior specific permission and/or a fee. Permissions may be requested from Publications Dept., ACM, Inc., 1515 Broadway, New York, NY 10036 USA, fax: +1 (212) 869-0481, or [email protected]. c 2003 ACM 0730-0301/03/0400-0152 $5.00 ACM Transactions on Graphics, Vol. 22, No. 2, April 2003, Pages 152–181.
-
Upload
independent -
Category
Documents
-
view
4 -
download
0
Transcript of Perceptually-driven decision theory for interactive realistic rendering

Perceptually-Driven Decision Theory for InteractiveRealistic Rendering
REYNALD DUMONT, FABIO PELLACINI, and JAMES A. FERWERDACornell University
In this paper we introduce a new approach to realistic rendering at interactive rates on commodity graphics hardware. Theapproach uses efficient perceptual metrics within a decision theoretic framework to optimally order rendering operations, pro-ducing images of the highest visual quality within system constraints. We demonstrate the usefulness of this approach for variousapplications such as diffuse texture caching, environment map prioritization and radiosity mesh simplification. Although herewe address the problem of realistic rendering at interactive rates, the perceptually-based decision theoretic methodology weintroduce can be usefully applied in many areas of computer graphics.
Categories and Subject Descriptors: I.3.7 [Computer Graphics]: Three-Dimensional Graphics and Realism
General Terms: Algorithms, Human Factors, Performance
Additional Key Words and Phrases: Human vision, visual perception, perceptually-based rendering
1. INTRODUCTION
Many important graphics applications demand realistic rendering of complex scenes at interactiverates (simulation, training systems, virtual environments, scientific visualization, games), but thisis a computationally intensive process for which satisfactory solutions do not yet exist. Performanceincreases in hardware-based graphics accelerators have enabled significant improvements in renderingcapabilities, but concurrent increases in user requirements for realism, complexity and interactivitymean that computational demands will continue to outstrip computational resources for the foreseeablefuture.
Over the years, many researchers have developed efficiency schemes to reduce the computational loadof the rendering process. Level-of-detail methods, frustum, occlusion, detail culling, and image-basedrepresentations all seek to reduce the number of polygons that need to be sent through the graphicspipeline. The vast majority of these approaches take advantage of geometric visibility to speed up therendering process.
Since realism is often the goal of rendering, greater efficiencies can be realized by taking advantageof the limitations of the human visual system and not rendering scene features that will be impercepti-ble. Significant advances have recently been made in the development of perceptual rendering metrics[Bolin and Meyer 1998; Ferwerda et al. 1997; Myszkowski 1998; Ramasubramanian et al. 1999], which
Authors’ address: Program of Computer Graphics, Rhodes Hall, Cornell University, Ithaca, NY 14853; email: {reynald;fabio;jaf}@graphics.cornell.edu.Permission to make digital or hard copies of part or all of this work for personal or classroom use is granted without fee providedthat copies are not made or distributed for profit or direct commercial advantage and that copies show this notice on the firstpage or initial screen of a display along with the full citation. Copyrights for components of this work owned by others than ACMmust be honored. Abstracting with credit is permitted. To copy otherwise, to republish, to post on servers, to redistribute to lists,or to use any component of this work in other works requires prior specific permission and/or a fee. Permissions may be requestedfrom Publications Dept., ACM, Inc., 1515 Broadway, New York, NY 10036 USA, fax: +1 (212) 869-0481, or [email protected]© 2003 ACM 0730-0301/03/0400-0152 $5.00
ACM Transactions on Graphics, Vol. 22, No. 2, April 2003, Pages 152–181.

Perceptually-Driven Decision Theory for Interactive Realistic Rendering • 153
use computational models of visual thresholds to efficiently produce approximated images that areindistinguishable from the highest quality “gold standard” renderings. While these perceptually-basedapproaches are promising, two factors limit their usefulness for interactive rendering. First, comput-ing the metrics is itself a computationally intensive process that can take seconds or minutes. Theinvestment in computing a metric may prove efficient in an offline application, but the demands ofinteractive rendering do not allow sufficient time for metric computation. Second, these metrics arebased on threshold measures of the visible differences between a rendered image and a “gold standard”image. In an interactive rendering scenario, time and resources are typically so limited that the differ-ences will be well above threshold. Here the appropriate question is not, “how can I create an imagethat is visually indistinguishable from the gold standard,” but “how can I make an image of the highestpossible quality given my constraints.” Methods that order possible rendering operations to achievehigh quality within system constraints offer a promising solution.
In this paper we introduce a new framework for realistic rendering at interactive rates using com-modity graphics hardware. This approach uses efficient perceptual metrics within a decision theoreticframework to optimally order rendering operations, producing images of optimal visual quality withinsystem constraints. We applied this framework to develop a cache management scheme for a hardware-based rendering system that uses map-based methods to simulate diffuse and non-diffuse global illu-mination effects. We also demonstrate the usefulness of the system by simplifying the radiosity meshused to represent the global illumination solution.
In the following sections, we first review previous work and outline the framework. Then, we describethe design and implementation of three applications. Finally, we present the results produced by thesystem, evaluate our contributions, and discuss future work.
2. PREVIOUS WORK
2.1 Interactive Rendering
Interactive hardware-based rendering systems have existed for more than three decades. Limitationsin hardware capabilities and expanding demands for complexity and realism have always constrainedthe performance of such systems. Over the years, many techniques have been developed to improve therendering efficiency of such systems. Space does not permit an exhaustive discussion of these effortsbut Aliaga et al. [1999]; Cohen-Or et al. [2000]; Manocha and Aliaga [2000] and Moller and Haines[1999] provide comprehensive reviews.
Many of these techniques aim to reduce the number of polygons sent through the graphics pipeline.One class of algorithm uses progressive geometric simplification (levels-of-detail, LODs) for componentsof the scene [Luebke 2000]. Given the location of the observer, geometric or perceptual metrics determinewhich LOD to use to satisfy frame rate and image quality requirements. A second class of algorithm,Frustum|Occlusion|Detail culling, computes visibility and discards non-visible polygons [Airey 1990;Cohen-Or et al. 2000; Durand et al. 2000; Luebke and Georges 1995; Schaufler et al. 2000; Teller 1992].In densely occluded models, these techniques drastically reduce the number of polygons sent to thehardware. A third class of algorithms uses image-based representations to replace distant objects withimages called impostors, which are warped to produce perspective effects [Decoret et al. 1999; Macieland Shirley 1995; Schaufler 1995; Shade et al. 1996].
Researchers from UNC recently presented a system that combined several of these techniques [Aliagaet al. 1999]. While these techniques are worthwhile, they treat surface shading as a black box, andtherefore overlook the potential for using shading approximations to increase system performance.
ACM Transactions on Graphics, Vol. 22, No. 2, April 2003.

154 • R. Dumont et al.
2.2 Realistic Shading
Most interactive rendering systems only calculate the diffuse reflection in an environment. Howeverthe increasing power of today’s graphics hardware allows more sophisticated shading effects such astransparency, specular and glossy reflections, and soft shadows, to be added. Recently, research hasbeen done to support more accurate reflection and global illumination effects, but these techniquesmake intensive use of the hardware and typically reduce frame rates [Diefenbach 1997; Moller andHaines 1999; Walter et al. 1997]. Moreover, most of these techniques only simulate a subset of shadingeffects, and it is unclear how to combine them or to include them in other systems. Alternate approachesto realistic shading for interactive rendering use image based representations and simulate shadingeffects by reprojection [Bastos et al. 1999; Lischinski and Rappoport 1998]. While these methods avoidthe costs of recomputation, their memory requirements are often high.
Other shading methods for interactive rendering are linked to specific global-illumination algorithms.Some of these methods add a hardware-based rendering pass to display results from a global illumi-nation solution [Stamminger et al. 2000b; Sturzlinger and Bastos 1997]. Additional approaches makeuse of massively parallel computation to obtain interactive frame rates through ray-tracing [Martinet al. 1999; Udeshi and Hansen 1999; Ward and Simmons 1999]. Recent work has decoupled lightingand display processes to provide interactive display rates while a global illumination client updates theshading solution at a lower rate [Stamminger et al. 2000a; Tole et al. 2002; Walter et al. 1999].
When material appearance is more important than physical correctness, simplified shading repre-sentations and approximate reprojection methods such as hardware-based environment mapping offerexcellent performance for interactive rendering. Recently, a number of researchers have presentedmethods for doing fast, realistic shading using environment maps [Cabral et al. 1999; Greene 1986;Heidrich and Seidel 1999; Kautz and McCool 2000; Kautz et al. 2000].
2.3 Decision Theory and Perceptual Metrics
Decision theory is widely used in computer science to address resource allocation problems in cachingsystems, databases, user interfaces, artificial intelligence, operating systems and computer games. How-ever to the best of our knowledge, very little work has been done in the graphics community that explic-itly uses a decision theoretic framework. Notable exceptions are work by Horvitz and Lengyel [Horvitzand Lengyel 1997; Lengyel and Snyder 1997] and Funkhouser and Sequin [1993]. Each of these paperspresent systems that use perceptual metrics to drive decision theoretic resource allocation schemes ininteractive rendering applications. In these papers, the decision theoretic frameworks are excellent,but the perceptual metrics they use are limited and do not take advantage of knowledge of humanvision. At the other end of the spectrum is work by Bolin and Meyer [1998], Gibson [1998], Myszkowskiet al. [1999, 2001] and Myszkowski [1998], Ramasubramanian et al. [1999] and Walter et al. [2002]that uses sophisticated perceptual metrics to drive offline photorealistic rendering systems. While thesemetrics can produce high quality images that are visually indistinguishable from physically accuratesimulations, their computational expense has limited their usefulness for interactive rendering.
Recently two papers have been presented to address the use of perceptual metrics for interactive ap-plication. In Luebke and Hallen [2001], Luebke uses such metrics to optimize the rendering of geometriclevels of detail. In Dumont et al. [2001], we presented a work prior to this one where a perceptual metricis employed to reduce the memory required for each diffuse texture while keeping the best image quality.
2.4 Texture Map Caching Schemes
Texture mapping is an effective technique to increase the visual quality of images in rendering systemsand now part of commodity graphics accelerators. Current graphics accelerators employ fast memory forACM Transactions on Graphics, Vol. 22, No. 2, April 2003.

Perceptually-Driven Decision Theory for Interactive Realistic Rendering • 155
texture storage. To achieve the best possible framerate, all the textures should reside in texture memorysince loading textures from main memory is a slow operation that causes dramatic framerate reductions.Hardware developers try to address this problem by increasing texture memory or by speeding uptexture swapping operations. However such improvements do not solve the problem when the total sizeof textures exceeds the capacity of board memory.
Hardware texture compression is now frequently used to increase the effective size of texture mem-ory. A simple lossy scheme presented by S3 [1998] can now be found in most off-the-shelf graphicsboards. Talisman [Torberg et al. 1996] is an example of a non-standard graphics pipeline that employsa hardware-based compression scheme similar to JPEG. A texture compression algorithm based onvector quantization has been proposed to be used in hardware in Beers et al. [1996].
Software caching schemes try to address texture memory limitations by using a subset of the texturesset to render the current frame. Many of the texture caching algorithms described in the literatureuse specialized caching schemes to address specific applications. For example, Quicktime VR [Chen1995] cuts texture panoramas into vertical strips for caching purposes. Many simple metrics, basedon viewing distance and viewing angle, have been proposed in terrain visualization applications [Blow1998; Cohen-Or et al. 1996; Horvitz and Lengyel 1997; Osborn 1994]. A progressive loading approachfor terrain visualization has been presented in Cline and Egbert [1998]; this scheme tolerates imagedegradation to ensure framerate during its loading steps.
While these approaches have proven to be fairly effective, they either do not guarantee frame rate,or if they do, they cannot guarantee that the rendered image has the best possible quality.
In the following sections we show how an analysis of texture content and illumination conditions canhelp to provide high quality rendering at interactive frame rates.
3. A NEW APPROACH FOR INTERACTIVE REALISTIC RENDERING
3.1 Rendering Under Constraints
Rendering complex and realistic 3D scenes is computationally intensive. Since interactive applicationshave limited computational resources (e.g. memory, processing), the optimal design of such systemsremains difficult. The problem we intend to address here is how to better allocate available resourcesto optimize performance (e.g. image quality, frame rate).
3.2 A Decision Theoretic Approach to Rendering Under Constraints
This section will introduce the key concepts used in our rendering framework. We will base our frame-work on a decision theoretic approach. Decision theory is a body of knowledge designed to help a decision-maker choose optimally between a set of alternatives in light of their possible consequences. Typicallythe decision-maker has to choose between a set of possible actions each of which has an expected utility.Often, the chosen action is the one that maximizes the total expected utility.
This formalism can be adapted for interactive rendering. The problem we are trying to address canbe stated in the following way: given a set of constraints, what is the best set of rendering actionsthat maximize the utility of the rendered images. Figure 1 illustrates the major components of ourdecision-theoretic rendering framework. Some examples will clarify the function of each component.
1) Constraints: We first have to define the constraints of the system, which can be of two differentkinds: resource limitations and design decisions.
In a hardware based rendering application, the number of textures may be constrained by the amountof physical memory in the graphics hardware (limited resources). In a raytracing application, the budgetof rays to cast is constrained by the desired per frame computation time (a design decision).
ACM Transactions on Graphics, Vol. 22, No. 2, April 2003.

156 • R. Dumont et al.
Fig. 1. Decision theoretical framework.
2) Rendering actions: We need to consider the rendering actions affected by the constraints andfor each of these actions, the approximations the system might perform to respect the constraints.
In a raytracing algorithm, possible rendering actions might be: “compute primary ray,” “compute lightsource contribution,” “compute specular contribution . . .”
In many cases the approximations of a rendering action form an ordered set of alternatives. In aLOD scheme such as Luebke and Hallen [2001], the approximations used to display an object are thedifferent levels of detail.
The set of all approximations used to render an image is called the rendering state of the system.This state may be modified at each frame or asynchronously.
Next, we have to describe how the rendering actions relate to the constraints by defining the cost ofeach action and approximation relative to a specific constraint.
In an interactive raytracer, the cost of each rendering action can be evaluated as the number ofray cast operations needed. For an OpenGL application, the cost might be defined as the number ofprimitives that have to be rendered.
3) Utility functions: In order to decide which rendering actions to take, we need to be able tomeasure the utility of a rendering state, which can be defined as how different the image produced bythe current state is with respect to a gold standard image that represents the best output of the systemwithout constraints.
One of the important insights that makes decision theory useful in interactive rendering is that theutilities of different rendering states only need to be ranked ordinally to allow optimal decision-making.This allows us to create fast methods for evaluating the utility function, since it is only necessary tocalculate an accurate ordering of different states rather than accurate values for each state.
4) Resource allocation: the ordering and decision making processes are embodied in a resourceallocation algorithm whose role is to determine at each frame the rendering state that minimizes thecost and maximizes the utility. Unfortunately, in the general case the problem of maximizing utilityunder the set of constraints is nondeterministic polynomial-time (NP) complete [Garey and Johnson1979; Horvitz and Lengyel 1997]. While some approximations exist for the general case [Horvitz andLengyel 1997; Sahn 1975], in many instances we can design an algorithm that takes advantage of thespecifics of our problem domain [Dumont et al. 2001; Horvitz and Lengyel 1997; Luebke and Hallen2001].
It is important to point out that in the design of interactive systems, the computational cost to makedecisions has to be negligible with respect to the rendering cost. In particular the cost of calculatingthe utility of different rendering approximations and executing the resource allocation algorithms hasto be extremely low.ACM Transactions on Graphics, Vol. 22, No. 2, April 2003.

Perceptually-Driven Decision Theory for Interactive Realistic Rendering • 157
3.3 Utility Metrics
To guide the selection of a rendering state for each frame, we need to measure the utility of a set ofrendering approximations. As demonstrated by Horvitz and Lengyel [1997] and Wanger et al. [1992]utility largely depends on the user’s task. For example, technical illustrations may have higher utilitythan photographs for training purposes, but photographs have higher utility when judging materialproperties. The dependence of the utility function on the task is key to being able to generalize the de-cision theoretic framework to various kinds of rendering algorithms. Consequently, the utility functionhas to be defined with respect to the target application context.
We will now formalize the utility function for one particular application context that is ‘interactiverealistic rendering.’ Let Qt be the utility of the system at frame t. The system is characterized by theset of rendering actions A ={ai} required to display an image that can be computed using a number ofdifferent approximations ji. The rendering state J at time t is given by the set of approximations inuse at that time, and is written as Jt ={ ji,t} where ji,t is the approximation used for action ai at timet. The utility Qt of a given frame can be written as:
Qt =∑
i
q( ji,t) (1)
The above formulation expresses the fact that the utility of the system is the sum of the expected utilityq( ji,t) of each rendering action. In most cases, q( ji,t) depends only on the selected approximation ji,t .However, more complex applications may require that the quality of a rendering action ai depends ofthe choice of all other rendering actions (to capture interactions among the actions), and/or the historyof previous actions (to capture temporal effects such as popping). These cases are beyond the scope ofthis paper but might be the subject of valuable future work.
Without losing generality we can assume that the function q is separable in two factors: an importancefactor (α) and an error factor (ε). We will write
q( ji,t) = α( ji,t) · [−ε( ji,t)] (2)
ε is the difference between the utility of the current image and the utility of the gold standard. α acts asa weighting factor that represents the importance of a rendering action. Intuitively we can say that ifa user does not care about a particular action (α→ 0), then rough approximations will not significantlydecrease utility. Conversely, if the action is important (α→ 1) utility will strongly depend on the errorε. In our formulation, the maximum utility is 0 (i.e. the gold standard image) and decreases to –∞ ascoarser approximations are used.
3.4 Perceptually-Based Utility Metrics
An important instance of the utility function is when the goal of the rendering system is photorealism. Inthis case the utility function measures how visibly different the rendered image is from a photorealisticgold standard. In this context, we will call the utility measure (Q) quality. The task dependence of Qsimply becomes the goal of reproducing the visual appearance of a scene.
From equation (2) we can now describe the quality function as the product of two terms: the visualsaliency α of artifacts introduced by the rendering action and the perceptible error ε.
A metric based on a psychophysical model of the human visual system is well suited to accuratelymeasure visual differences in images.
Metrics for visual saliency are a new area of research in computer graphics. Yee et al. [2001] hasintroduced a sophisticated metric based on low-level visual processing and a model of attention thatproduces conspicuity maps used to evaluate the probability that a change in an image will be detected.
ACM Transactions on Graphics, Vol. 22, No. 2, April 2003.

158 • R. Dumont et al.
Fig. 2. Left, threshold-versus-intensity function; Middle, contrast-sensitivity function; Right, masking function.
This work holds great promise for the future, but this metric is currently computationally expensiveto be used as it is in an interactive system. Until now, the most efficient implementation of this metrichas been done by Haber et al. [2001]. As will be explained in Section 5, we will follow the work ofHorvitz and Lengyel [1997] to define saliency as a function of the image area subtended by the result ofa particular rendering approximation. In the future, more sophisticated and efficient saliency modelscan replace this one without modifying this framework.
Perceptible error can be computed through the use of a Visible Difference Predictor (VDP) [Daly 1993].VDPs have become an important foundation for perceptually-based approaches to rendering [Bolin andMeyer 1998; Ferwerda et al. 1997; Myszkowski et al. 1999, 2001; Myszkowski 1998; Ramasubramanian1999]. VDPs predict the per-pixel probability that observers will detect a difference between two im-ages rendered using different approximations. Most VDPs incorporate three models of human vision:luminance sensitivity, contrast sensitivity, and visual masking (Figure 2).
The threshold vs. intensity function (TVI) describes the luminance sensitivity of the visual systemas a function of background luminance, modeling visual adaptation. The contrast sensitivity function(CSF) describes variations in sensitivity for patterns of various spatial frequencies. The visual system’snonlinear response to pattern contrast is described by the masking function.
Previously published VDPs are too computationally expensive for interactive rendering systems.Fortunately, since we are using the VDP within a decision theoretic framework, we are primarilyinterested in ranking the rendering actions in terms of their contributions to image quality. Thereforewe can often roughly approximate the values of the terms in the VDP without changing the rankorder of the rendering actions. This allows us to develop a VDP that can be evaluated at interactiverates.
4. AN INTERACTIVE RENDERING SYSTEM
4.1 Application Context
The decision-theoretic framework presented in the previous section can be applied to any interactiveapplication where allocating resources can be easily handled (texture memory, number of primitivessent to the pipeline, number of rays . . .). The only prerequisite is to be able to define a utility functionQ that depends on the user’s specific task.
Although some recent approaches have dramatically improved the performance of interactive raytracing engines and seem very promising for the future [Martin et al. 1999; Wald et al. 2000; Waldet al. 2001a, 2001b; Walter et al 1999], these techniques remain inappropriate for scenes containing alarge number of polygons and light sources, leaving the hardware-based approach a practical solutionACM Transactions on Graphics, Vol. 22, No. 2, April 2003.

Perceptually-Driven Decision Theory for Interactive Realistic Rendering • 159
Fig. 3. System Overview.
for interactive rendering. However, we foresee that a perceptually-driven decision theoretic approachcan also be efficiently used in a ray-tracing context.
The performances of today’s hardware-based interactive rendering systems are also constrained (bypolygon fill rates, texture map capacity, and polygon count). When users require photorealistic elementsin their scenes, the time to rasterize all the primitives or the memory required to display all theappropriate maps (texture maps, environment maps, light maps) is often greater than today’s boardcapacities. In many cases, using simple heuristics to handle this problem might fail. For instance, whentoo many maps have to be displayed on the same frame, Dumont et al. [2001] have demonstrated thatsimple metrics might ensure image quality at the price of a dramatic reduction in frame rate. Decisiontheory and fast perceptual metrics are therefore a practical solution to cope with the allocation problem.
4.2 Overview of Our Rendering System
We have applied the framework to improve the performance of an interactive realistic rendering systemthat uses commodity graphics hardware.
This system allows interactive walkthroughs of high-quality global illumination solutions. It rendersindirect diffuse reflection (with the help of a radiosity algorithm) and indirect arbitrary reflection (withthe help of pre-filtered environment maps).
We decided to not use any complex or specific hardware architectures or parallel computers andfocused only on standard PCs (Pentium III) with off-the-shelf graphics boards (NvidiaTM GeForce II).These assumptions result in a system that can be used on typical PCs. To this end, we also used astandard OpenGL implementation (release 1.2).
As seen in Figure 3, two uncoupled processes are respectively responsible for global illuminationcomputation and interactive display. A third one is introduced to handle the resource allocation problem.
ACM Transactions on Graphics, Vol. 22, No. 2, April 2003.

160 • R. Dumont et al.
This design allows to use any global illumination algorithm without modifying either the display processor our resource allocation algorithm.
Each scene is composed of a set of polygons organized into objects. This representation facilitatesmodeling, data manipulation and the simulation of non-diffuse reflection.
The global-illumination algorithm used is an optimized, spectral version of the hierarchical radiosity[Hanrahan et al. 1991]. For the scenes included in this paper, computation of the radiosity solution isa view-independent process that takes one to two minutes.
The radiosity algorithm estimates the diffuse radiosity values for each patch and subpatch in thescene. As a result, each input polygon has a solution mesh attached to it. For complex polygonal objects,interpolated normals allow more accurate (and smoother) representation of the radiosity solution andnon-diffuse effects. We use a geometric simplification algorithm with a perceptually-based criterion toreduce the complexity of the mesh on each patch (see Section 5.4). For efficient display, each radiositysolution is inserted in an optimal data structure based on interleaved vertex arrays and display lists(OpenGL functionalities). Hierarchical frustum culling is also used to further increase the efficiency ofthe system.
5. APPLICATION OF THE FRAMEWORK
5.1 Hard Constraints in Interactive Realistic Rendering
The performance of hardware-based interactive rendering systems is not only constrained by polygoncount but also by fill rates and texture map capacity. The level of realism demanded by today’s appli-cations requires the extensive use of various types of maps (texture maps, light maps, environmentmaps . . .), making these constraints all the more relevant.
New perceptual metrics dedicated to hardware-based rendering are described hereafter to solvethis problem. Our perceptual metrics will combine image space information (i.e. luminance, contrastand frequency content), with object space information (e.g. material properties, texture content andenvironmental illumination).
We first decided to apply our perceptually based decision theoretic framework to solve the difficultdiffuse texture map management problem. This is described in Section 5.2.
Then, when environment maps are used to convey directional effects, additional processing is neededfor each map, creating still more work for the graphics hardware. A second application described inSection 5.3 extends our map management to non-diffuse reflections.
Finally, a third application presented in Section 5.4 uses perceptually based utility functions anddecision theory to simplify radiosity meshes.
5.2 Diffuse Texture Management
5.2.1 Motivation. Today, mip-mapping is traditionally used to avoid aliasing artifacts associatedwith texture mapping. Current graphics hardware implements perspective-correct mip-mapping, whichinterpolates between textures of different resolutions based on the projected area of the pixels beingrendered. However, for a given projected polygon, hardware always selects the same mip-map level,whatever its texture and its illumination condition. In the example shown in Figure 4, level 1 hasalways been selected by the hardware (with 3 distinct textures).
To reduce memory usage, coarser representation of the textures can be used without any perceivableloss in the visual quality of the resulting frame and unnecessary mip-map levels can be removed from theboard memory. A perceptual metric based on information such as texture contrast, frequency content,illumination condition and occlusion effects might improve decisions made by the hardware.ACM Transactions on Graphics, Vol. 22, No. 2, April 2003.

Perceptually-Driven Decision Theory for Interactive Realistic Rendering • 161
Fig. 4. Improving mip-map selection.
5.2.2 Rendering Actions, Approximations and Costs. We first define our set of rendering actions aias the drawing of textured polygons with diffuse reflectances. In order to maximize the frame rate, wehave to ensure that the current texture set we use is smaller than texture memory. When this is notpossible, the scene should be displayed with the texture set that maximizes visual image quality, whilerespecting texture memory constraints. To obtain this set, we can only load a subpart of each originalmip-map pyramid (called from now on subpyramid), chosen using a perceptually-based quality metric.
Next, we define a texture tuple as (Ti, ji) to be the rendering approximation of a texture mip-mappyramid Ti rendered using a subpyramid starting at level ji (higher values of ji correspond to lowerresolution). For each subpyramid we define a cost function ci as equal to its size in memory.
5.2.3 An Efficient Perceptually-Based Quality Function for Diffuse Texture Maps. For each texture,the quality metric has to predict the differences in visual quality between the image rendered usingthe texture subpyramid (Ti, ji) and the one with the high-resolution “gold standard” image texturepyramid (Ti, vi) (0≤ vi < ji). Thus, our resource allocation scheme can be seen as the maximization ofthe total quality Q , while keeping the total cost C =∑i ci smaller than texture memory limits.
Intuitively, the benefit qD( ji) of a rendered texture is proportional to the probability αD( ji) that weare focusing our attention to this specific texture, and the visual degradation εD( ji) that may occur byreducing its resolution.
More precisely, this can be written as:
Quality function qD( ji) = Visual saliency αD( ji)× (−Perceived error εD( ji))
We can then formally write the overall quality of the rendered image as:
Q D =∑
i
qD( ji) =∑
i
[αD( ji) · [−εD( ji)]] (3)
Here, t has been removed from the equation for clarity since history is not taken into account in thisimplementation of the framework. In this formulation, the maximum benefit is 0 when we are usingthe gold standard texture pyramid and it decreases when we use lower resolution subpyramids.
Figure 5 illustrates the calculation of each of these two terms (α and ε).Following [Horvitz et al. 1997], we model visual saliency as proportional to the pixel coverage of the
texture in the current frame. This is a statistical model based on the premise that we are focusing ourACM Transactions on Graphics, Vol. 22, No. 2, April 2003.

162 • R. Dumont et al.
Fig. 5. Quality function calculation.
attention on each part of the image with equal probability. We can simply write
αD( ji) ∝ Ai (4)
where Ai is the area in pixel covered by texture Ti.Other heuristics for α could give greater weight to the central area of an image (as this is usually
where people look in a walkthrough system). An interesting extension to this work might look at eyetracking systems to develop importance-based saliency metrics that provide greater values for α wherethe users focus their attention in the scene.
The perceptible error term εD(ji) measures the perceptible differences between the image renderedusing the gold standard texture pyramid and the one rendered using a subpyramid. It can be writtenas:
εD( ji) =∑
vi≤m< ji
(Ai,m
Ai· f D(m, ji)
)(5)
where vi is the lowest mip-map level visible in the current frame for texture Ti (finest resolution used),m is the m-th mip-map level (m is greater than vi), Ai is the area covered in the gold standard image bytexture Ti, Ai,m is the area covered in the gold standard image by m, and f D(m, ji) computes the errorusing a filtered texture ji (with a lower resolution) versus a higher resolution one, m.
As seen in Figure 5, the error produced by using ji is the weighted average of the visible errors f inthe regions drawn in the “gold standard image” using the different mip-map levels m (m< ji).
To evaluate f D, we use a formulation based on a Visible Difference Predictor, VDP Daly [1993].A VDP predicts the per-pixel probability that an observer will detect a difference between twoimages rendered using different approximations. Using this model of the human visual system, theperceivable error can be written as the product of the VDP times the physical error. For the levels whenvi ≤ m < ji (the ones that need to be drawn but are not in the subpyramid (Ti, ji)), the error canACM Transactions on Graphics, Vol. 22, No. 2, April 2003.

Perceptually-Driven Decision Theory for Interactive Realistic Rendering • 163
then be estimated as:
f D(m, ji) = 1Ai,m·∑
x, y∈Ai,m
[(1
ji,m
imagesC)x, y· VDP x, y
](6)
Here, f D(m, ji) is equal to the difference 1 in color C using mip-map level ji instead of m multiplied bythe probability of detection of the error (VDP), normalized by the pixel coverage. The color differencesin this paper are calculated in the CIELAB color space.
The color C at a pixel x, y is defined as:
Cx, y = T x, y · I x, y
where C is the pixel color, T is the trilinearly interpolated texture color and I the Gouraud interpolatedvertex color (illumination).
Note that all the illumination information I used to calculate perceived error are tone mapped,clamped and quantized to be as they will appear on the final display device. By doing so, our perceptualquality metric is more accurate since it is based on the actual values that will be displayed on thescreen.
We chose the VDP developed by Ramasubramanian [Ramasubramanian et al. 1999] for its accuracyand computational efficiency.
This VDP is defined as:
VDP = 1TVI× Elevation
The TVI term describes the luminance contribution to error visibility while the Elevation factor cap-tures the changes in error sensitivity caused by the spatial frequency content of the image. It is basedon a contrast sensitivity function (CSF), corrected by a masking function.
In this formulation, the luminance dependent TVI component can be computed in real-time once perframe, but the spatially-dependant Elevation component one cannot, which makes this VDP too slowto be used in a real-time system.
The insight that allows us to speed up the computation is the fact that our application does notrequire a metric that is accurate for each pixel but only for each texture. The efficiency of this newmetric derives from evaluating the spatial contribution as a pre-process (which can be done duringmip-map pyramid creation), and by evaluating the simpler luminance component on the fly. By takingthis approximation, we obtain a VDP formulation that is efficient enough for real-time applications,while accurately predicting the perceived error for each texture. With these modifications, the functionf D(m, ji) becomes:
f D(m, ji) = LuminanceContribution · SpatialContribution
=[
1TVI(Li,m)
· Li,m
]·
1nTexels
.1
Ti,m.∑
u,v∈Ti,m
(1
ji ,mtexelsT
)u,v
Elevation(Ti,m)u,v
(7)
where Ti,m is the mth mip-map level of texture i, T i,m the average color of this mip-map level and I theaverage luminance on the screen in the area covered by this mip-map level, and finally, Li,m = T i,m · Iis the average diffusely-reflected luminance.
Let us describe the meaning of this equation with the help of Figure 6, the spatial contribution termcan be seen as a normalized sum of the per pixel differences between the two mip-map levels dividedby the elevation value at this pixel. The differences are now taken on the texture values Tand not thecolor ones as before. In order to take into account the actual illumination of the texture in the scene,the spatial contribution has to be multiplied by Li,m before being divided by the TVI term.
ACM Transactions on Graphics, Vol. 22, No. 2, April 2003.

164 • R. Dumont et al.
Fig. 6. Computation of the spatial contribution.
Fig. 7. Elevation maps for some textures (computed here at their finest resolution, i.e. level 0) from left to right: Tiles, Marble,Wood tiles, Wood.
If the same texture is used for different objects under different conditions of illumination and withdifferent material properties, we estimate f D(m, ji) for each object and keep the maximum estimate.
To guarantee a more conservative approach and avoid overestimation of masking effects the Elevationterm Elevation(Ti,m)u,v in Equation (7) can be replaced by min(Elevation(Ti,m)u,v, Elevation(Ti, ji)u,v) asdescribed in Daly [1993]. In our tests, we did not notice any significant difference between these twoapproaches.
Figure 7 presents some Elevation maps used to evaluate spatial contributions. For each texture,the elevation map is presented below. For each elevation map, the brighter the value of a pixel, thehigher the frequency component is. As we can notice elevation maps accurately detect high frequencyfeatures in the textures. The elevation map of the last texture, a lightwood, is almost black since thecorresponding texture contains almost no high frequency component.ACM Transactions on Graphics, Vol. 22, No. 2, April 2003.

Perceptually-Driven Decision Theory for Interactive Realistic Rendering • 165
5.2.4 Resource Allocation Algorithm. During a walkthrough, decisions need to be made to respectthe system constraints. In the application described above, these decisions concern the loading/unloading and the determination of the best resolution for diffuse texture maps.
These decisions are made by our resource allocator algorithm which can be summarized as:
1. TextureIDMap:a. Acquisition→ Per-pixel informationb. Treatment→ Per–object and per-texture information
2. Perception metrics→ Estimates (qD)3. Resource Allocation
Combined together, these steps have a non-negligible cost. We decided to amortize the total cost bydistributing the computation steps over time, especially the switching of textures to avoid large demandson the hardware at the same time. By doing this, the overhead per frame does not exceed a couple ofmilliseconds.
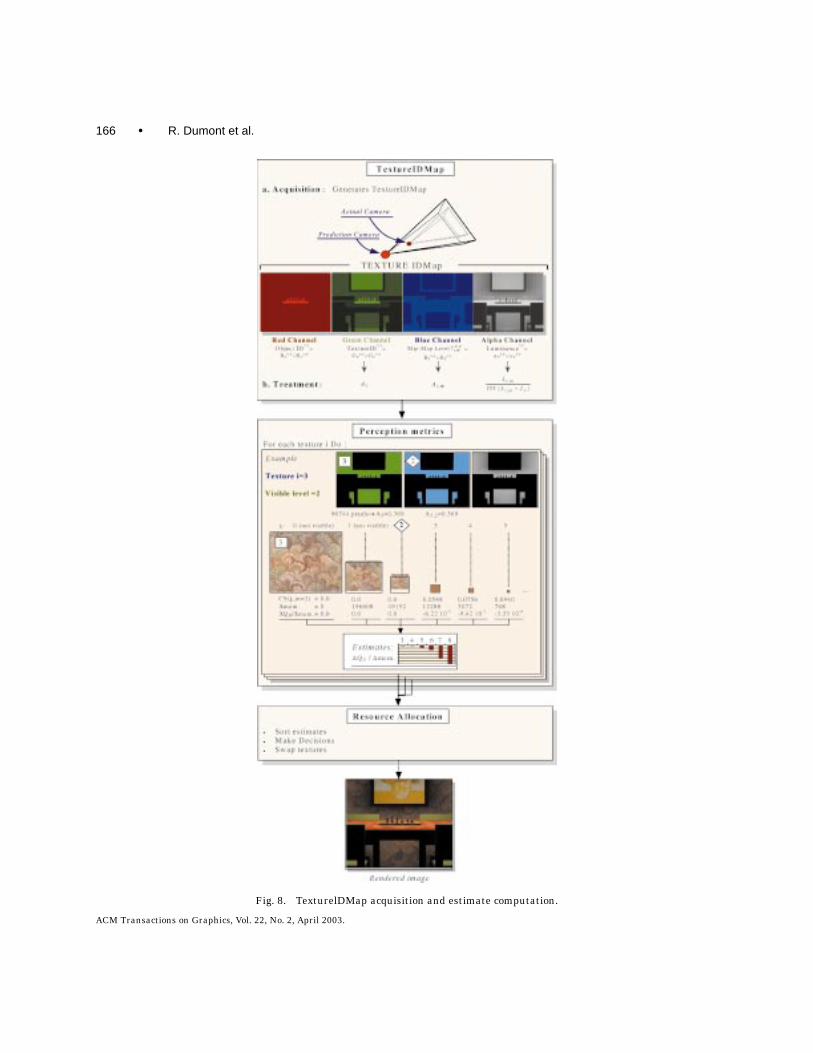
This entire process is illustrated in Figure 8 and described in the next three Sections 5.2.4.1, 5.2.4.2and 5.2.4.3.
5.2.4.1 TextureIDMap. We use the graphics hardware to compute an optimized data structure(called the TextureIDMap) that simplifies the process of obtaining values needed by our perceptionmetric. The structure used here is an extension of the TextureIDMap presented in Dumont et al.[2001]. Its treatment provides the following information:
• Luminance.• Material properties—ρs, ρd, texture.• Pixel coverage and mip-mapped levels used for each texture.
We obtain this information with a single display pass, where for each polygon, the R, G, B and αvalues of the vertices are set as:
RP = ObjectID; G P = TextureID; BP = 255;αP = I
To determine the mip-map levels required when rendering with the high-resolution gold standardtexture set, we render the polygons with a special mip-mapped texture, whose values are constant overthe texels. This encodes the mip-map pyramid levels:
RT = 1; GT = 1; BT =Mip-Map Level;αT = 1
The combination of the polygon color and this texture (with blending operation) fills the frame-bufferwith all the required information. After this step, all per-pixel information has been calculated.
Treatment of the frame-buffer values now provides the final information required (e.g. pixel coverageper texture, average of I per object, etc.). Additional material property information is obtained fromeach object ID. Since the allocation algorithm runs asynchronously, we use a prediction camera placedslightly behind the location of the actual viewing camera to anticipate the appearance of previouslynon-visible textures.
The TextureIDMap predicts mip-map level usage while solving the occlusion problem. If a texturedpolygon is occluded by another one, its texture quality is reduced, eventually to zero. Visibility of objectsis also treated. Unlike previous texture caching approaches our metric takes occlusion events intoaccount. This allows us to handle both open environments such as terrains and cluttered environmentssuch as architectural scenes.
ACM Transactions on Graphics, Vol. 22, No. 2, April 2003.
166 • R. Dumont et al.
Fig. 8. TexturelDMap acquisition and estimate computation.
ACM Transactions on Graphics, Vol. 22, No. 2, April 2003.

Perceptually-Driven Decision Theory for Interactive Realistic Rendering • 167
5.2.4.2 Perception Metrics Computation. Once the TextureIDMap has been generated, our algo-rithm calls the perception metric to obtain estimates (qD ’s) for each visible texture.
In Figure 8, we demonstrate the computation of quality measures for the wallpaper texture (num-ber 3). To clearly show the effect of this texture on quality, the images presented in this step only showinformation on this texture; black pixels represent areas where the texture is not present. Below theseimages, the values obtained from the metrics are presented. Note that levels 0, 1 and 2 produce no valuesince only levels above 2 need estimates (here, levels 0 and 1 are not used in the “gold standard” image).We present in this figure 1QD ’s instead of Q D ’s since our ordering algorithm for texture managementactually uses delta values (see Section 5.2.4.3). Finally, the graph shows the effect that using differentapproximations (mip-map levels) has on the quality measure. It illustrates that coarser approximationssignificantly reduce quality with almost no gain since the higher levels of a mip-map do not requiremuch additional memory.
5.2.4.3 Resource Allocation. Once the quality values are obtained, the resource allocator has tomake decisions regarding the mip-map subpyramids. Our optimization algorithm minimizes the de-crease in quality and maximizes the reduction in memory usage for textures. To summarize, startingwith the gold standard solution, it reduces its overall quality until system constraints are met.
Please note that when the system does not reach its limits, full rendering is performed (i.e. goldstandard images). Decisions are made when the system is constrained, otherwise all diffuse texturemip-map levels can be used.
We first sort all the possible texture subpyramids with respect to 1qDi ( ji, ji + 1)/1ci( ji, ji + 1) (esti-mated degradation between level ji and ji+1 divided by memory saved while using level ji+1 insteadof level ji). By doing this, all the quality estimates for every diffuse texture are mixed together in onelist. The heapsort has been selected over the quicksort algorithm for its better behavior in rankingpreordered and/or small sets of values. Starting with the full texture set, we then keep reducing its sizeby discarding the texture levels that have smaller 1qDi ( ji, ji +1)/1ci( ji, ji +1) until the size of the setis smaller than the allowed size (i.e. board texture memory).
By doing so, non-visible mip-map levels are discarded first (maximum decrease in memory for noreduction in quality). Then, visible mip-map levels that produce low reductions in quality are removed.Consequently, this optimization algorithm allows zooming in close to a surface while getting the appro-priate fine resolution mip-map level since all other textures will have been removed before.
5.3 Extension to Non-Diffuse Reflections
5.3.1 Decision Theoretic Approach for Non-Diffuse Reflections. Our interactive system handles non-diffuse reflections with the help of environment mapping techniques (as described hereafter). Today’shardware can only display a small number of environment maps or a significant reduction in the framerate may occur. We would like to benefit from our decision theoretic approach to efficiently manage thedisplay of all the environment maps used to represent the scene. Perception metrics can be used todetermine the non-diffuse reflections that are more salient for the observer.
5.3.2 Handling Complex Reflections in Hardware-Based Systems. We first need to briefly describethe rendering equations used to display diffuse and non-diffuse surfaces in a single pass at renderingtime.
In the general rendering equation, the luminance L at a point x in a specific direction ωout is equalto:
Lout(x, Eωout) =∫
fr (x, Eωin, Eωout) · Lin(x, Eωin) · cos θ · dωin
ACM Transactions on Graphics, Vol. 22, No. 2, April 2003.

168 • R. Dumont et al.
Fig. 9. Hardware-Based non-diffuse surfaces (rendered in real-time). (chromium—pure specular, copper—low gloss, marble—layered).
where fr is the so-called bidirectional reflection distribution function (BRDF). Many BRDF models aredivided into two terms (a diffuse component, and a non-diffuse/directional component).
The general rendering equation can then be rewritten as:
Lout(x, Eωout) = ρd
∫frd (x, Eωin, Eωout) · Lin(x, Eωin) · cos θ · dωin
+ ρs
∫frs (x, Eωin, Eωout) · Lin(x, Eωin) · cos θ · dωin
where ρs and ρd are weighting factors with ρd + ρs = 1.Since the diffuse term is direction independent, we can rewrite L as
Lout(x, Eωout) = ρd · Reflectivity(x)π
· Irradiance(x)+ ρs
∫frs (x, Eωin, Eωout) · Lin(x, Eωin) · cos θ · dωin
and use any global illumination algorithm to obtain the irradiance for each point in the scene.Non-diffuse reflections may be rendered with environment map methods [Greene 1986]. Although
they only approximate purely specular reflections, environment maps can produce convincing view-dependent effects. Pre-filtered environment maps [Cabral et al. 1999; Heidrich et al. 1999; Kautz andMcCool 2000; Kautz et al. 2000] offer a means to render glossy reflections. Here the BRDF is taken to bea filter, and convolution techniques produce an “image” of the reflected environment. In our system, weuse Kautz’s hardware-accelerated pre-filtering algorithm [Kautz et al. 2000] to render glossy surfaces.We adapted this method to our environment maps and use an image-processing library to realize theconvolution pass. As in [Kautz et al. 2000], we are able to compute and filter an environment map atrendering time. These maps can be attached to any object in the scene and rendered as necessary. Asstated in [Kautz and McCool 2000], various BRDF models may be used to filter an environment map.Here we use the normalized Phong model for its simplicity and efficiency. We use multi-texturing capa-bilities to combine the diffuse contribution and non-diffuse contribution in one pass (see some resultsin Figure 9). In this context, the rendering equation used for our hardware-based rendering becomes:
Lout(x, Eωout) = ρd · T · I + ρs Fe(x, Eωin, Eωout)
where T is a diffuse texture (with its mip-mapped levels), I is the Irradiance divided by π provided bythe global illumination process), and Fe the filtered environment map at x (computed using the spectralproperties of the material).ACM Transactions on Graphics, Vol. 22, No. 2, April 2003.

Perceptually-Driven Decision Theory for Interactive Realistic Rendering • 169
5.3.3 Rendering Actions, Approximations and Costs. Here, the set of rendering actions a′i is thecomputation and display of filtered environment maps Fei. Since computation time is the main con-straint here (the larger the BRDF lobe, the lower the resolution implied by the filtering process), theset of possible approximations is limited to displaying the environment map or not. The associated costis the rendering time which is roughly equivalent for each environment map.
5.3.4 An Efficient Perceptually-Based Quality Function for Non-Diffuse Materials. To make deci-sions and respect hardware constraints, we have to predict the visual importance of each environmentmap attached to each non-diffuse object.
We can formally write the quality qE of an object i as:
qE (i) = αE (i) · [−εE (i)] (8)
Similar to the diffuse case, the saliency term for a non-diffuse object can be written as:
αE ( ji) ∝ Ai (9)
where Ai is the area in pixels covered by object i.Unfortunately, since view-dependent mapping deforms the reflected image, it is not possible to com-
pute the exact Elevation factor from the environment maps. We define a metric that is similar to the onepresented in Section 5.2.3 (equation (7)) but we take the spatial component to be the per-pixel differ-ences between the highest and lowest mip-map levels weighted by the average of the elevation map forthe diffuse mip-map level used. This modification captures the reduction of sensitivity to environmentalreflections caused by masking effects created by the diffuse texture.
We can thus write the perceptible error term as:
f E (i) = Le
TVI(Li,m + Le)·
1nTexels
· 1Fe·
∑u,v∈Fe
1texelsu,v
AverageElevation(Ti, ji )
(10)
where Ti is the underlying diffuse texture and ji its approximation for the given frame.If an environment map is used on different objects, the highest estimate is kept.It should be noted that this metric is independent of the BRDF model used since it is directly based on
the filtered environment map. Therefore, different reflection models can be introduced without changingthe formulation.
In the presence of arbitrary reflectances, we have to take into account the effect of a non-diffusereflection on the perception of the underlying diffuse texture when surfaces exhibit diffuse and non-diffuse behavior (ρs> 0). To predict the perception of the diffuse texture, we have to generalize theformulation of the perceived error εD presented in the Section 5.2.3. Now, the TVI term will depend onboth the diffuse and non-diffuse reflected luminances.
Now f D(m, ji) becomes:
f D(m, ji) = LuminanceContribution · SpatialContribution
= Li,m
TVI(Li,m + Le)·
1nTexels
.1
Ti,m.∑
u,v∈Ti,m
(1
ji ,mtexelsT
)u,v
Elevation(Ti,m)u,v
(11)
with Li,m = ρdi · T i,m · I (average diffuse reflection) and Le = ρsi · F e (average non-diffuse reflection ofthe environment).
The only difference between this equation and equation (7) is Le added in the TVI term.ACM Transactions on Graphics, Vol. 22, No. 2, April 2003.

170 • R. Dumont et al.
Fig. 10. Quality (Q D and Q E ) estimates produced by the metric (images rendered in real-time).
These two metrics take the perceptual consequences of a large range of surface reflectance effectsinto account. These effects are related to the irradiance on each polygon, the magnitude and contrastof the surrounding environment, and the material properties of the object (ρs and ρd , the spread of thelobe and texture on the object); they are illustrated in Figure 10.
In this figure, it can be seen that the contribution to the quality measure that depends on the diffusetexture (Q D) decreases when the non-diffuse reflection becomes dominant. This occurs with increasingvalues of ρs (see 2, 5 and 8), or under low illumination conditions (compare 5 and 7). This phenomenonis also accentuated for low contrast textures (e.g. dark wood—see 1 and 4). The contribution to qualitythat depends on the reflection of the environment (Q E ) decreases when the contrast of the reflection isreduced because of low environmental contrast (compare 5 and 9), or low-pass filtering by the BRDF(see 3 and 6), and increases when the diffuse reflection becomes low (see 5 and 8).
5.3.5 Resource Allocation Algorithm. During an interactive session, decisions need to be made torespect system constraints with respect to the display of several environment maps per frame. In thisapplication, these decisions concern the computation, loading and unloading of environment maps.ACM Transactions on Graphics, Vol. 22, No. 2, April 2003.

Perceptually-Driven Decision Theory for Interactive Realistic Rendering • 171
Here, the goal for our optimization algorithm is to minimize the decrease in quality as well as thecomputation time for environment maps. Decisions are made when the system is constrained otherwiseall environment maps can be used and displayed.
The algorithm presented in 5.2.4 is modified to manage both diffuse textures and environment maps.First, the TextureIDMap treatment provides visibility information for each non-diffuse object. Then,both perception metrics (qD and qE ) are calculated. Finally, the resource allocator processes diffuse es-timates and non-diffuse estimates to make a decision with respect to diffuse textures and environmentmaps.
If the system runs into constraints, the resource allocator allows omission of environment mapscomputation, and/or display, for objects whose pixel coverage is not too large (e.g. pixel coverage below0.1% of the screen pixels). As for the diffuse texture case, environment maps with lower quality valuesare discarded first. The system first determines the number of maps it can actually display to sustaina given frame rate. This number (initialized to the total number of environment maps visible on thescreen) may decrease when in some circumstances the target frame rate cannot be accomplished.
5.4 Constraint-Based Radiosity Mesh Simplification
5.4.1 Motivation. To demonstrate the generality of our framework we also applied its concepts toour radiosity mesh simplification process.
Mesh simplification on radiosity meshes might significantly reduce the large amount of data requiredafter computation to represent the illumination solution (i.e. the mesh elements and their radiosityvalues). At the earlier stages of the resolution process, when light sources emit their power, refinementof the scene polygons might create fine mesh elements that may be unnecessary to represent the finalsolution. Indeed, after the many iterations required to compute the multiple bounces of the scene globalillumination, the radiosity solution is in many circumstances, a lot “smoother” than the sole directillumination solution. Adding a mesh simplification algorithm at the end of the radiosity computationhas proven to be useful to greatly reduce the size of its final solution [Hoppe 1996].
5.4.2 Threshold Based Mesh Simplification. After radiosity computation, each input polygon hasa mesh of radiosity elements attached to it. Our previous algorithm was quite simple. For all inputpolygons, a recursive process, starting from the bottom of each hierarchy of elements, determines ateach internal node (i.e. a node that is not a leaf) if the variation of illumination over its surface can bereproduced without its sub-elements. If so, the sub-elements are removed from the hierarchy. To makethis decision the algorithm compares the illumination variation reconstructed from the node and fromits four descendants. If the difference between these two reconstructions is below a fixed threshold,removal is authorized (see Figure 11).
This algorithm has two major drawbacks. First, a threshold-based algorithm does not give any controlon the size of the resulting mesh. Given the illumination condition, in some cases, almost no simplifi-cation can be realized. When performance is an important factor, such an approach is not very useful.Second, it uses a simplification criterion that is solely based on photometry. This criterion does not takeinto account perceptual effects such as masking and contrast sensitivity to make its decisions. Usinga perceptual metric might greatly help to exploit visual limitations and remove mesh elements in anunnoticeable way.
5.4.3 Perceptually-Driven Decision Theory for Mesh Simplification. Therefore, a radiosity meshsimplification algorithm is also a good candidate for application of our decision theory framework. In-deed, the hardware is greatly constrained by the number of polygons it can rasterize perframe.
ACM Transactions on Graphics, Vol. 22, No. 2, April 2003.

172 • R. Dumont et al.
Fig. 11. Photometry-based simplification criterion.
In the gold “standard image” each element has to be displayed. However, this rendering action canbe approximated with meshes that contain fewer elements. The cost for each approximation is equal tothe number of elements contained into the mesh.
Instead of using a threshold, we would like to let the system (or the user) fix k, a number of dis-playable mesh elements and let the algorithm finding the most appropriate elements reconstruct theillumination as close as possible to the actual one. Therefore, the role of the resource allocator is to usea utility function to maximize the image quality while reducing the number of elements to the fixedconstraint k.
To do so, let us define a p-node. A node in a hierarchy of radiosity elements is defined as a p-node whenall its children are considered as leaves of the hierarchy. To reduce the mesh, simplification has to occurat a p-node level. The p-node becomes itself a leaf and its parent might become a p-node as well. Toapply our decision theory framework and keep the final number of elements under a fixed constraint,we consider each input polygon hierarchy of elements. We first compute for each internal node thedifference δBI between the radiosity function at this node and the one constructed from its children(as in Figure 11). We then sort all δBI /BI (and their respective nodes) in a single list (and ensure thata node will be always inserted after its children). Once this process is done, that list contains valuesand nodes from all hierarchies. The list is finally traversed until the constraint (the final numberof elements) is met. During this traversal, each list element is a p-node when encountered; its fourchildren can then be removed from their respective hierarchy decreasing the total number of elementsby 3.
This algorithm gives acceptable results as described before. It provides the capability to controlthe size of the radiosity mesh used for the walkthrough. However, an algorithm using a perceptualmetric would provide better results. To do so, we simply replaced our previous photometry-based cri-terion (δBI/BI ) by a new one using the VDP defined in Section 5.2.3. Our perceptually based criterionis:
δBI · VDP = δBI
TVI(BI )· 1
Elevation(0)(12)
Where Elevation represents the elevation map of the polygon texture. Since this mesh simplification iscompletely view-independent, we use the finest mip-map level (level 0) as a heuristic to predict wherehighly contrasted features may cause masking effects.
Our final algorithm finds the k most perceptually important mesh elements. It discards elements inareas where masking effects or contrast conditions create unperceivable illumination variations andwill keep others where the eye might notice subtle differences.ACM Transactions on Graphics, Vol. 22, No. 2, April 2003.

Perceptually-Driven Decision Theory for Interactive Realistic Rendering • 173
Fig. 12. Texture caching with diffrent metrics. Even with a simple example as this one, naive metrics with no allowed degradationwould provide poor frame rates since all the visible textures on the screen already overload the board texure capacity (14 1K× 1Ktextures).
Fig. 13. Variation of qi (A), subpyramids loaded (B), frames per second (C) along time.
6. RESULTS AND DISCUSSION
6.1 Texture Management Scheme
We first compared our algorithm with a classical load/unload priority scheme that uses a heuristic basedon visible textures without any texture analysis. In many circumstances this texture managementheuristic fails. Indeed, if in one frame all the visible textures overload the board memory, this heuristicwill preserve image quality but at the price of a dramatic reduction in frame rate. In our test we foundthat in some cases, this method could only produce 4 frames per second while our algorithm yieldedrates above 60 frames per second. Figure 12 shows on a simple case how simple metrics might fail.Progressive loading as in Cline and Egbert [1998] would solve this problem but without any guaranteeon image quality.
We used two test scenes to evaluate the texture map management approach explained in this paper.Our first test scene is a highly textured architectural scene containing approximately 100,000 radiosityelements after mesh simplification. Figure 13-A shows the variation over time of values of the totalquality function (QDi), for each texture i present in this environment. As the observer moves into thescene, new parts of the scene become visible (or occupy more space on the screen), while others go outof view. As a result, the evaluation of the quality function varies with time. Figure 13-B presents theevolution of the active texture set over time for the same scene during the same walkthrough. This graphshows the minimum mip-map levels that are loaded onto the graphics board for each texture present inthe scene. As one can observe, in this walkthrough, most of the time the minimum mip-map levels usedare 1 or 2 except between the 50th second and 65th second of the walkthrough where dramatic changesin the rendering state occur. This corresponds to a particular moment of the walkthrough where theobserver has moved toward a picture on the wall to see it in greater detail. As he moves toward thepicture, the resource allocator gives more memory to this particular texture to permit rendering it atfull resolution (level 0). As a result, this affects the approximations chosen for the other textures andsome of them are almost completely removed from the board memory. We also tested this scene with
ACM Transactions on Graphics, Vol. 22, No. 2, April 2003.

174 • R. Dumont et al.
Fig. 14. Comparison between our decision theory based texture caching and the gold standard frames (top: w/o perceptually-based texture caching, 3 frames per second; bottom: w/perceptually-based texture caching, 40 frames per second).
high-resolution textures (1024 by 1024) to greatly overload the board memory (the set of textures was4 times bigger than the memory allowed by our system). Under these conditions, the rendering systemran at 3 frames per second. With the framework presented in this paper the framerate remains above40 frames per second as shown in Figure 13-C. In Figure 14 we can observe that the images renderedusing our system at 40 frames per second are very close to the gold standard images rendered with nodegradation but at 3 frames per second.
Some snapshots from this walkthrough scene are shown in Figure 15. In these images the diagramon the left indicates the approximation chosen for each texture (the longer the bar, the coarser theapproximation). The graphs indicate that the optimal texture set is different for each location. Theimage on the lower right shows the scene when the observer has moved toward the picture.
6.2 Environment Maps
To illustrate our second quality function (for surfaces with arbitrary reflectances), we used the secondscene “chess pieces” presented in Figure 16. The scene contains 20,000 radiosity mesh elements aftersimplification. Each chess piece has its own complex material property (i.e. pure specular, glossy ma-terial, and varnished wood with different ρs and ρd ). Reflections are rendered with the help of filteredenvironment maps at 25 frames per second. As the observer moves around the chessboard, the relativeeffect on the quality Q E of the reflection on each piece varies. In the various views shown in Figure 16,the graph on the left indicates the ranking given by our resource allocator. Each non-diffuse object isrepresented with a colored square. In this graph, the higher the square, the more visually important isits reflection of the environment onto this piece. Each bar on the right-hand part of the graph representsthe value of Q E at that time. As the observer moves toward the chessboard, fewer pieces are visiblebut their respective importance increases (as the saliency term gets larger).
6.3 Overall Performances with Diffuse and Non-Diffuse Reflections
Figure 17 illustrates performance for two constrained rendering situations. In the first case (highestcurve, cache 1), the system had to respect a fixed frame rate constraint (30 fps) whatever the effectthis had on image quality. In the second case (lowest curve, cache 2), the system had to avoid dramaticACM Transactions on Graphics, Vol. 22, No. 2, April 2003.

Perceptually-Driven Decision Theory for Interactive Realistic Rendering • 175
Fig. 15. Walkthrough in an architectural scene.
Fig. 16. Interactive rendering of arbitrary reflectances.
ACM Transactions on Graphics, Vol. 22, No. 2, April 2003.

176 • R. Dumont et al.
Fig. 17. Evolution of the frame rate over time.
Fig. 18. Decision theory based radiosity mesh simplification (top row: photometry-based criterion; bottom row: perceptually-driven method; from left to right: radiosity solution, mesh, zoom in).
changes in the rendering state to maintain a particular image quality level (which implies a reductionon the obtained frame rate). In both cases, we can observe that although initial frame rates are low(initialization time), performance improves and reaches equilibrium as the framework begins to operate.
6.4 Radiosity Mesh Simplification
A third test scene has been used to illustrate our constraint-based mesh simplification algorithm(Figure 18). For this scene, the mesh resulting from the radiosity computation consists of 41000 el-ements. We fixed the number of elements to be displayed to be 10000 and tested both criterions. Inour experiment, our perceptual metric produced better results than the photometric criterion as weexpected.
As one can notice in Figure 18, when using the photometry-based approach, some artifacts appear onthe ceiling. The perceptually based approach has detected the strongly visible illumination gradient thatACM Transactions on Graphics, Vol. 22, No. 2, April 2003.

Perceptually-Driven Decision Theory for Interactive Realistic Rendering • 177
is not masked by any texture. It produced more mesh elements in this area. Fewer elements have beengenerated in the left part of the scene where illumination conditions are darker and masking effectsare induced by the texture of the wall. Masking effect also permits the perceptually based algorithm todiscard some elements on the floor and the red carpet. We obtained similar results on the architecturalscene (shown in Figure 15).
Further investigations might provide a better system (e.g. view-dependent mesh reduction). However,this experiment was set up to prove how easily perceptually driven decision theory could be applied tomany constrained graphics systems.
7. DISCUSSION, CONCLUSION, AND FUTURE WORK
In this paper we have introduced a new approach for realistic rendering of complex environmentsat interactive rates on commodity graphics hardware. The approach uses a framework grounded indecision theory and visual perception to optimize rendering operations.
The framework we have introduced provides a sound methodology for reasoning about the inter-actions between application requirements and system constraints, and for finding ways to balancethese conflicting demands to optimize system performance. The tools that decision theory supplies foroptimally ordering potential actions under constraints should be useful in many areas of computergraphics.
The framework has been used to develop a cache management system for a hardware-based render-ing system that uses map-based methods to simulate global illumination effects. We have shown thatusing the framework significantly increases the performance of the system and allows interactive walk-throughs of scenes with complex geometry, lighting, and material properties. This work has introducedseveral important new components for design of interactive rendering systems.
The texture/environment maps management system we have developed should be useful in a varietyof interactive rendering scenarios. It could be incorporated into graphics APIs like Performer, Direct3dor OpenGL to improve the performance of PC rendering applications. It could be used in client/serverrendering for telecollaboration or shared virtual environments, where client memory and networkbandwidth would be the constraints to optimize within. It could be used to automate the laborioushand-tuning of texture and environment maps currently done in memory-constrained console gamingapplications. It can also be extensible, allowing additional map-based shading methods (e.g. shadowmaps, light maps, photon maps) to be used to increase the realism and performance of interactiverendering applications.
Using this framework, a constraint-based radiosity mesh simplification algorithm has been devel-oped. It provides a strict control on the final size of the mesh. This is very useful to ensure that a fixednumber of polygons is sent to the graphics pipeline or over a network or the Internet. It can be seen asan efficient compression algorithm.
We have introduced in this paper new perception metrics for realistic rendering. To our knowledgethese are the first decision-theoretic perception metrics fast enough to be used for interactive realisticrendering. Although they can be evaluated quickly, they are grounded in visual psychophysics and useboth image plane (luminance, spatial contrast and masking) and object space information (environmen-tal contrast, surface contrast gloss) properties to determine perceived error. Our final quality metricformulations only depend on factoring the VDP as the product of a luminance component and a spatialcomponent, which makes it practical to use and independent of the VDP used. Different VDPs can beintroduced without changing the formulations.
While these results are promising, there is much additional work to be done. First, we would liketo develop more comprehensive perception metrics and perceptual utility functions. For interactiverealistic rendering, the difficulty is achieving both visual accuracy and high frame rates. Our VDP
ACM Transactions on Graphics, Vol. 22, No. 2, April 2003.

178 • R. Dumont et al.
metric has been developed as a tradeoff between precision and computation time. We achieve this byonly needing to compute rankings of perceptual utility. Future work on enhancing the metric has to becarefully done to keep the calculations real-time, and work on optimizing/simplifying the metric must bedone carefully to avoid producing perceptible distortions. Interesting future work can be done to eitherfurther refine the VDP used to provide more accurate estimates, or reduce it for better efficiency whilekeeping the same ordering. For example, we can incorporate the chromatic and temporal properties ofvision, and more advanced models of saliency and visual attention. With such improvements, small andtextured moving objects, as well as vivid colors might be considered as they should: as strong visualattention attractors. The influence of camera motions might also be considered.
We wish to explore how the perceived quality of a particular rendering state depends on the historyof previous states and the properties of future states to see if further efficiencies can be gained byexploiting memory and anticipation processes in human perception.
We also would like to conduct some experiments to evaluate the image quality obtained with ourapproach. Again, we would like to emphasize that the goal of this approach is to provide the bestpossible output under constraints and not to produce images that are perceptually indistinguishablefrom a gold standard. Additionally, our approach has been developed for walkthrough applications(relatively slow motion compared to flight or driving simulation). For highly dynamic applications suchas these, some assumptions may become invalid. For example, it is not necessarily true that thresholdsgiven by a static VDP are correct for a dynamic display. Our tests have shown that this may not be toogreat a concern for our metric since ordinal ranking of thresholds is our only concern, however furtherformal experiments should be done to validate these observations.
Finally, we would like to develop a better understanding of how the user’s task influences the bestchoice of rendering parameters, so that perceptually-based decision theoretic methods can be appliedbeyond realistic rendering to task domains as diverse as scientific visualization, technical illustration,and artistic expression.
ACKNOWLEDGMENTS
Thanks to Kavita Bala, Steve Berman, Steve Westin and the anonymous reviewers for their helpfulcomments. Thanks to Peggy Andersen for proofreading the paper multiple times and Jeremy Selanfor technical help. Special thanks to Don Greenberg for his unconditional support during tough times.This work has been realized using equipment generously donated by Intel Corporation and nVidiaCorporation.
REFERENCES
AIREY, J. 1990. Increasing Update Rates in the Building Walkthrough System with Automatic Model-Space Subdivision andPotentially Visible Set Calculations. Ph.D. thesis, UNC-CH CS Department TR #90-027 (July).
ALIAGA, D., COHEN, J., WILSON, A., BAKER, E., ZHANG, H., ERIKSON, C., HOFF, K, HUDSON, T., STURZLINGER, W., BASTOS, R., WHITTON, M.,BROOKS, F., AND MANOCHA, D. 1999. MMR: An Integrated Massive Model Rendering System Using Geometric and Image-Based Acceleration. Symposium on Interactive 3D Graphics (I3D), April.
BASTOS, R., HOFF, K., WYNN, W., AND LASTRA, A. 1999. Increased Photorealism for Interactive Architectural WalkthroughsProceedings Interactive 3D 99 Atlanta, Georgia, USA Symposium on Interactive 3D Graphics (I3D), April.
BEERS, A. C., AGRAWALA, M., AND CHADDHA, N. 1996. Rendering from Compressed Textures. SIGGRAPH ’96 Conference Pro-ceedings.
BLOW, J. 1998. Implementing a Texture Caching System. Game Developer, April.BOLIN, M. R. AND MEYER, G. 1998. A Perceptually Based Adaptive Sampling Algorithm, Proceedings of SIGGRAPH 98, Com-
puter Graphics Proceedings, Annual Conference Series, pp. 299–310 (July, Orlando, Florida).CABRAL, B., OLANO, M., AND NEMEC, P. 1999. Reflection-Space Image Based Rendering Proceedings of SIGGRAPH 99, Computer
Graphics Proceedings, Annual Conference Series.
ACM Transactions on Graphics, Vol. 22, No. 2, April 2003.

Perceptually-Driven Decision Theory for Interactive Realistic Rendering • 179
CHEN, S. E. 1995. Quicktime VR—An image-Based Approach to Virtual Environment Navigation. ACM SIGGRAPH ’95 Con-ference Proceedings.
CLINE, D. AND EGBERT, P. K. 1998. Interactive Display of Very Large Textures. IEEE Visualization ’98 Conference Proceedings.COHEN-OR, D., CHRYSANTHOU, Y., AND SILVA, C. T. 2000. A survey of visibility for Walkthrough Applications in Visibility: Problems,
Techniques, and Applications. SIGGRAPH 00 Course notes.COHEN-OR, D., RICH, E., LERNER, U., AND SHENKAR, V. 1996. A Real-Time Photo-Realistic Visual Flythrough. IEEE Trans. Visual.
Comput. Graph.DALY, S. 1993. The Visual Difference Predictor : An Algorithm for the Assessment of Visual Fidelity. Digital Image and Human
Vision. MIT Press.DECORET, X., SCHAUFLER, G., SILLION, F. X., AND DORSEY, J. 1999. Multi-Layered Impostors for Accelerated Rendering. In Comput.
Graph. Forum (Proc. Eurographics ’99), volume 18, pages C61–C72, September.DIEFENBACH, P. 1997. Multi-Pass Pipeline Rendering: Realism For Dynamic Environments. ACM-SIGGRAPH Symposium on
Interactive 3D Graphics, Providence, RI. April.DUMONT, R., PELLACCINI, F., AND FERWERDA, J. A. 2001. A Perceptually-Based Texture Caching Algorithm for Hardware-Based
Rendering. Rendering Techniques ’01, Proceedings of the Eurographics Workshop on Rendering. Eurographics.DURAND, F., DRETTAKIS, G., THOLLOT, J., AND PUECH, C. 2000. Conservative Visibility Preprocessing Using Extended Projections.
Proceedings of SIGGRAPH 00, Computer Graphics Proceedings, Annual Conference Series, pp. 239–248.FERWERDA, J., PATTANAIK, S. N., SHIRLEY, P., AND GREENBERG, D. P. 1997. A model of visual masking for computer graphics. In
Turner Whitted, editor, SIGGRAPH 97 Conference.FUNKHOUSER, T. A. AND SEQUIN, C. H. 1993. Adaptive Display Algorithms for Interactive Frame Rates During Visualization of
Complex Virtual Environments. Computer Graphics (SIGGRAPH ‘93), Los Angeles, CA, August, pp. 247–254.GAREY, M. R. AND JOHNSON, D. S. 1979. Computers and Intractability : A Guide to the Theory of NP-Completeness. W. H.
Freeman and Company, New York.GIBSON, S. 1998. Efficient Radiosity Simulation using Perceptual Metrics and Parallel Processing. Ph.D. Thesis, Department
of Computer Science, University of Manchester, September.GREENE, N. 1986. Environment Mapping and Other Applications of World Projections. IEEE CG&A, November.HABER, J., MYSZKOWSKI, K., YAMAUCHI, H., AND SEIDEL, H. P. 2001. Perceptually Guided Corrective Splatting, Computer Graphics
Forum (Proc. Eurographics 2001), pp. C142–C152, September.HANRAHAN, P., SALZMAN, D., AND AUPPERLE, A. 1991. A rapid hierarchical radiosity algorithm for unoccluded environments.
SIGGRAPH ’91 Proceedings, 197–205, July.HEIDRICH, W. AND SEIDEL, H.-P. 1999. Realistic, Hardware-accellerated Shading and Lighting Proceedings of SIGGRAPH 99,
Computer Graphics Proceedings, Annual Conference Series.HOMAN, I., ELDRIDGE, M., AND PROUDFOOT, K. 1998. Prefetching in a Texture Cache Architecture. Proceedings 1998 Eurograph-
ics/Siggraph workshop on graphics hardware.HOPPE, H. 1996. Progressive meshes. Comput. Graph. (SIGGRAPH 1996 Proceedings), pages 99–108.HORVITZ, E. AND LENGYEL, J. 1997. Perception, Attention, and Resources: A Decision-Theoretic Approach to Graphics Rendering.
Proceedings of the Thirteenth Conference on Uncertainty in Artificial Intelligence, August.KAUTZ, J. AND MCCOOL, M. D. 2000. Approximation of Glossy Reflection with Prefiltered Environment Maps, Graphics Interface
2000, pages 119–126, May.KAUTZ, J., VAZQUEZ, P.-P., HEIDRICH, W., AND SEIDEL, H.-P. 2000. A Unified Approach to Prefiltered Environment Maps, Proceed-
ings of the 11th Eurographics Workshop on Rendering, pages 185–196, June.LENGYEL, J. AND SNYDER, J. 1997. Rendering with Coherent Layers, Proceedings of SIGGRAPH 97, Computer Graphics Pro-
ceedings, Annual Conference Series, pp. 233–242 (August 1997, Los Angeles, California).LINDSTROM, P., KOLLER, D., HODGES, L. F., RIBARSKY, W., FAUST, N., AND TURNER, G. 1995. Level-of-Detail Managements for Real-
Time Rendering of Photo-Textured Terrain. GIT-GVU Technical Report.LISCHINSKI, D. AND RAPPOPORT, A. 1998. Image-Based Rendering for Non-Diffuse Synthetic Scenes. Eurographics Workshop on
Rendering.LUEBKE, D. AND HALLEN, B. 2001. Perceptually-Driven Simplification for Interactive Rendering. Rendering Techniques ’01,
Proceedings of the Eurographics Workshop on Rendering. Eurographics.LUEBKE, D. P. 2000. Advanced Issues in Level of Detail. SIGGRAPH 00 Course notes.LUEBKE, D. P. AND GEORGES, C. 1995. Portals and Mirrors: Simple, Fast Evaluation of Potentially Visible Sets. Proceedings of
the 1995 Symposium on Interactive 3-D Graphics. April, ACM Press.
ACM Transactions on Graphics, Vol. 22, No. 2, April 2003.

180 • R. Dumont et al.
MACIEL, P. W. C. AND SHIRLEY, P. 1995. Visual Navigation of Large Environments Using Textured Clusters. In 1995 SymposiumInteractive 3D Graphics, pages 95–102.
MANOCHA, D. AND ALIAGA, D. 2000. Interactive Walkthroughs of Large Geometric Datasets, SIGGRAPH 00 Course notes.MARTIN, W., SLOAN, P. P. J., SHIRLEY, P., AND SMITS, B. 1999. Charles Hansen Interactive Ray Tracing Steven Parker. Symposium
on Interactive 3D Graphics (I3D), April.MOLLER, T. AND HAINES, E. 1999. Real Time Rendering. A. K. Peters.MYSZKOWSKI, K., ROKITA, P., AND TAWARA, T. 1999. Perceptually-informed accelerated rendering of high quality walkthrough
sequences, Eurographics Rendering Workshop 1999. (June, Granada, Spain). Eurographics.MYSZKOWSKI, K. 1998. The Visible Differences Predictor: Applications to Global Illumination Problems. Eurographics Render-
ing Workshop ’98 Proceedings.MYSZKOWSKI, K., TAWARA, T., AKAMINE, H., AND SEIDEL, H. P. 2001. Perception-Guided Global Illumination Solution for Animation
Rendering. Proceedings of SIGGRAPH 01, Computer Graphics Proceedings, Annual Conference Series.OBORN, S. M. 1994. UTAH: The Movie. Master’s Thesis, Utah State University.PALMER, S. E. 1999. Vision Science. Photons to Phenomenology. MIT Press.PELLACINI, F., FERWERDA, J., AND GREENBER, D. P. 2000. Toward a psychophysically-based light reflection model for image syn-
thesis. SIGGRAPH 2000 Conference Proceedings, Annual Conference Series, pages 55–64. Addison Wesley, July.RAMASUBRAMANIAN, M., PATTANAIK, S. N., AND GREENBERG, D. 1999. A Perceptually Based Physical Error Metric for Realistic Image
Synthesis, Proceedings of SIGGRAPH 99, Computer Graphics Proceedings, Annual Conference Series, pp. 73–82 (August,Los Angeles, California).
RUSHMEIER, H. E. AND ROGOWITZ, B. E. 2001. Are image quality metrics adequate to evaluate the quality of geometric objects?Proceedings of SPIE Vol. 4299, Human Vision and Electronic Imaging VI.
RUSHMEIER, H. E., ROGOWITZ, B. E., AND PIATKO, C. 2000. Perceptual issues in substituing texture for geometry. Proceedings ofSPIE Vol. 3959, Human Vision and Electronic Imaging V, 372–383.
S3TC 1998. DirectX 6.0 Standard Texture Compression. S3 Inc.SAHN. 1975. Approximate algorithms for the 0/1 knapsack problem. JACM 22, 1.SCHAUFLER, G. 1995. Dynamically Generated Impostors. In Proc. GI Workshop MVD’95, pages 129–136, November.SCHAUFLER, G., DORSEY, J., DECORET, X., AND SILLION, F. X. 2000. Conservative Volumetric Visibility with Occluder Fusion.
Proceedings of SIGGRAPH 00, Computer Graphics Proceedings, Annual Conference Series, pp. 229–238.SHADE, J., LISCHINSKI, D., SALESIN, D. H., DEROSE, T., AND SNYDER, J. 1996. Hierarchical Image Caching for Accelerated Walk-
throughs of Complex Environments. Proceedings of SIGGRAPH 96, Computer Graphics Proceedings, Annual Conference Seriespages 75–82, August.
STAMMINGER, M., HABER, J., SCHIRMACHER, H., AND SEIDEL, H.-P. 2000. Walkthroughs with Corrective Texturing, RenderingTechniques 2000 (Proc. Eurographics Workshop on Rendering), Springer.
STAMMINGER, M., SCHEEL, A., GRANIER, X., PEREZ-CARZOLA, F., AND DRETTAKIS, G. 2000. Efficient Glossy Global Illumination withInteractive Viewing, in Computer Graphics Forum 19(1), pp. 13–26.
STURZLINGER, W. AND BASTOS, R. 1997. Interactive Rendering of Globally Illuminated Scenes. In Rendering Techniques ’97,Proceedings of the Eurographics Workshop on Rendering. Eurographics.
TELLER, S. 1992. Visibility Computation in Densely Occluded Polyhedral Environments. Ph.D. thesis, UC Berkeley CSDepartment, TR #92/708.
TOLE, P., PELLACINI, F. AND GREENBERG, D. 2002. Interactive Global Illumination in Dynamic Scenes. SIGGRAPH 2002 Confer-ence Proceedings, Annual Conference Series, Addison Wesley, July.
TORBORG, J. AND KAJIYA, J. T. 1996. Talisman: Commodity Realtime 3D Graphics for the PC. SIGGRAPH ’96 ConferenceProceedings.
UDESHI, T. AND HANSEN, C. 1999. Towards Interactive Photorealistic Rendering of Indoor Scenes: A Hybrid Approach, In Euro-graphics Rendering Workshop Proceedings, Springer.
WALD, I., BENTHIN, C., WAGNER, M., AND SLUSALLEK, P. 2001a. Interactive Rendering with Coherent Ray-Tracing. ComputerGraphics Forum, Proceedings of the Eurographics.
WALD, I., SLUSALLEK, P., AND BENTHIN, C. 2001b. Interactive Distributed Ray-Tracing of Highly Complex Models. RenderingTechniques ’01, proceedings of the Eurographics Rendering Workshop, London, June.
WALTER, B., DRETTAKIS, G., AND PARKER, S. 1999. Interactive Rendering Using the Render Cache. Rendering Techniques ’99, G.Larson, D. Lichinski (Eds), Springer-Verlag, Wien (Proc. 10th Eurographics workshop on Rendering, Granada, Spain.
WALTER, B., PATTANAIK, S. N., AND GREENBERG, D. P. 2002. Using Perceptual Texture Masking for Efficient Image Synthesis. Toappear in Computer Graphics Forum (Proc. Eurographics 2002), September.
ACM Transactions on Graphics, Vol. 22, No. 2, April 2003.

Perceptually-Driven Decision Theory for Interactive Realistic Rendering • 181
WALTER, B., ALPPAY, G., LAFORTUNE, E., FERNANDEZ, S., AND GREENBEG, D. P. 1997. Fitting virtual lights for non-diffuse walk-throughs. In Turner Whitted, editor, SIGGRAPH 97 Conference Proceedings, Annual Conference Series, pages 45–48. ACMSIGGRAPH, Addison Wesley, August.
WANGER, L. R., FERWERDA, J. A., AND GREENBERG, D. P. 1992. Perceiving spatial relationships in computer-generated images.IEEE Computer Graphics and Applications.
WARD, G. AND SIMMONS, M. 1999. The Holodeck Ray Cache: An Interactive Rendering System for Global Illumination in Non-diffuse Environments. ACM Trans. Graph. 18(4), 361–398, October.
WATSON, B., FRIEDMAN, A., AND MCGAFFEY, A. 2001. Measuring and Predicting Visual Fidelity. SIGGRAPH 2001 ConferenceProceedings, Annual Conference Series, Addison Wesley, August.
YEE, Y. L. H., PATTANAıK, S., AND GREENBERG, D. 2001. Spatiotemporal Sensitivity and Visual Attention for Efficient Renderingof Dynamic Environments. ACM Trans. Graph. 20(1), pp. 39–35, January.
Received December 2001; revised August 2002; accepted September 2002
ACM Transactions on Graphics, Vol. 22, No. 2, April 2003.