
Perceived risk, risk tolerance and trust in debt decisions
241
Copyright is owned by the Author of the thesis. Permission is given for a copy to be downloaded by an individual for the purpose of research and private study only. The thesis may not be reproduced elsewhere without the permission of the Author.
-
Upload
khangminh22 -
Category
Documents
-
view
1 -
download
0
Transcript of Perceived risk, risk tolerance and trust in debt decisions

Copyright is owned by the Author of the thesis. Permission is given for a copy to be downloaded by an individual for the purpose of research and private study only. The thesis may not be reproduced elsewhere without the permission of the Author.

i
Perceived Risk, Risk Tolerance and Trust in Debt
Decisions
A thesis presented in partial fulfilment of the requirements for the degree of
Doctor of Philosophy
in Finance
at Massey University, Manawatu,
New Zealand
Phung Thai Minh Trang
2020

ii
Abstract
The perceived risk of stock investment, risk tolerance and trust play important roles in the stock
market and in use of debt for stock investment, yet the relationship between these has received
little attention. This thesis examines these direct and indirect relationships using three
independent essays using structural equation modelling as the main technique. Vietnam is used
as an illustrative example, as the use of informal borrowing is common. This thesis surveyed
420 Vietnamese individual investors and found the following results.
Essay One finds that the perceived risk is positively associated with borrowing sources and the
use of informal debt. Leverage risk and opportunity risk also directly relate to borrowing
sources. Borrowing sources is positively related to perceived risk and debt decisions. Perceived
risk is a mediator between borrowing sources and informal debt, and borrowing sources act as
a mediator between perceived risk and debt decisions.
The results of Essay Two show that risk tolerance has a direct relationship to the use of financial
leverage, while investment horizons are related to the use of informal debt. Risk tolerance
positively relates to the use of informal debt and mediates between investment horizons and
debt decisions among stockbrokers.
In Essay Three, the results reveal that there is a significantly positive relationship between trust
in the stock market, and trading frequency and the use of informal debt. Trust in stockbrokers
and brokerage firms are directly related to the use of informal debt. Trading frequency is also
positively associated with trust in the stock market and the use of financial leverage. Trust is a
mediator between trading frequency and informal debt, and trading frequency acts as a
mediator between trust and financial leverage.
Findings from this thesis will help provide useful insights into investors’ behaviour and its
impact on debt decisions for stock investment amongst individual investors, users and non-

iii
users of informal and formal borrowing, stockbrokers and non-stockbrokers, male and female
investors in the Vietnam stock market and other stock markets.

iv
Acknowledgements
This PhD journey has assisted me in making great changes in my life. One of the biggest
changes has been becoming an independent researcher. In terms of my character, I am not
naturally confident enough to put my comments or arguments into my research. Through my
supervisors’ guidance, I have learned useful lessons and have become a more confident person.
Thanks, therefore, must first go to my supervisors: Prof. Martin Young, Dr Michael Naylor,
and Dr Wei-Huei Hsu.
I express myself thankfulness to the Vietnamese individual investors who took the time to
answer the survey, which provided the raw data for my research. Thanks must also go to the
session Chairs and comments at the conferences and the school seminars I attended.
Importantly, special thanks go to my uncle for caring for my children while I have been busy
working on this PhD thesis. Lastly, I would like to say, “thank you very much” to my husband,
my children, my mom, my sisters, my brother, and my fellow PhD students for their
encouragement and on-going support. I could not have made my PhD thesis a successful one
without your support.

v
Tables of Contents
Abstract .................................................................................................................................. ii
Acknowledgements ............................................................................................................... iv
Tables of Contents ................................................................................................................. v
List of Figures ........................................................................................................................ x
List of Tables ....................................................................................................................... xii
Chapter 1 Overview ................................................................................................................... 1
1.1 The importance of informal and formal debt in stock investment ................................... 1
1.2 Factors driving debt decisions and the primary research questions ................................. 4
1.3 Vietnam stock market and individual investors ............................................................... 6
1.3.1 The Vietnam stock market ......................................................................................... 6
1.3.2 Vietnamese individual investors ................................................................................ 7
1.4 Family and borrowing culture in Vietnam ....................................................................... 8
1.4.1 Family culture ............................................................................................................ 8
1.4.2 Borrowing and lending money culture ...................................................................... 9
1.5 Structure of the thesis ..................................................................................................... 10
Chapter 2 Theoretical Background .......................................................................................... 12
Introduction to this chapter .................................................................................................. 12
2.1 Behavioural decision theory .......................................................................................... 12
2.2 Expected Utility Theory (EUT) ..................................................................................... 13
2.3 Perceived risk ................................................................................................................. 15
2.3.1 Concepts of perceived risk ...................................................................................... 15
2.3.2 Investors’ perceived risk .......................................................................................... 16
2.3.3 Investors’ rationality and risk aversion ................................................................... 18
2.3.4 The trade-off between risk and returns .................................................................... 21
2.4 Trust in decision-making ............................................................................................... 23
2.4.1 Concepts of trust ...................................................................................................... 23
2.4.2 Trust in finance ........................................................................................................ 24
2.5 Behavioural finance framework ..................................................................................... 25
2.5.1 Prospect theory and its concepts .............................................................................. 25
2.5.2 Key concepts of prospect theory ............................................................................. 26
2.5.3 Heuristic and its concepts ........................................................................................ 29
2.5.4 The concepts of heuristics ....................................................................................... 29

vi
2.6 Recent research on investors’ behavioural biases in Vietnam ....................................... 33
2.7 Summary ........................................................................................................................ 34
Chapter 3 Methodology ........................................................................................................... 36
Introduction to this chapter .................................................................................................. 36
3.1 Structural equation model (SEM) .................................................................................. 36
3.1.1 The importance of SEM in testing the relationships between variables ................. 36
3.1.2 SEM structure .......................................................................................................... 38
3.1.3 Estimated relationship values .................................................................................. 39
3.1.4 Measurement error ................................................................................................... 42
3.1.5 A model fit ............................................................................................................... 43
3.2 Sample size .................................................................................................................... 44
3.3 Survey process ............................................................................................................... 45
3.3.1 Trial interviews ........................................................................................................ 45
3.3.2 Questionnaire design ............................................................................................... 46
3.3.3 A pilot test ............................................................................................................... 46
3.3.4 Human ethics approval ............................................................................................ 46
3.3.5 A final survey .......................................................................................................... 47
3.4 Robustness check ........................................................................................................... 47
3.4.1 The Hayes and Preacher’s approach ........................................................................ 48
3.4.2 Causality analysis in the SEM method .................................................................... 49
3.4.3 T-test, propensity score matching and instrumental variable methods ................... 50
3.4.4 Locations selection bias ........................................................................................... 51
3.4.5 Response bias .......................................................................................................... 54
3.5 Investor characteristics ................................................................................................... 56
3.6 Debt decisions and reasons for this use of debt ............................................................. 58
3.6.1 Debt decisions definition ......................................................................................... 58
3.6.2 Findings of debt decisions ....................................................................................... 59
3.6.3 Reasons for the use of debt by investors ................................................................ 60
3.7 Control variables ............................................................................................................ 60
3.8 Summary ........................................................................................................................ 61
Chapter 4 Essay One: Perceived Risk, Borrowing Sources, and Debt Decisions ................... 63
4.1 Introduction .................................................................................................................... 63
4.2. Literature review and hypothesis development ............................................................ 65
4.2.1 Facets of perceived risk ........................................................................................... 65
4.2.2 Hypothesis development ......................................................................................... 66

vii
4.3 Methodology .................................................................................................................. 68
4.4 Results ............................................................................................................................ 70
4.4.1 Levels of perceived risk ........................................................................................... 70
4.4.2 Borrowing sources and debt decisions .................................................................... 71
4.4.3 Test of reliability ..................................................................................................... 74
4.4.4 Test of correlations between variables .................................................................... 74
4.4.5 Results of main SEM models and discussion .......................................................... 77
4.5 Results of sub-group analysis ........................................................................................ 84
4.6 Robustness check ........................................................................................................... 91
4.6.1 Robustness check using alternative measures ......................................................... 91
4.6.2 Robustness check using multiple and stepwise regression ...................................... 93
4.6.3 Robustness check using the Hayes and Preacher’s approach .................................. 93
4.6.4 Robustness check using the t-test and propensity score matching approach .......... 95
4.6.5 Robustness check on locations selection bias and response bias ............................ 97
4.7 Demographics ................................................................................................................ 98
4.8 Conclusions, contributions, implications, limitations and further research ................. 101
4.8.1 Conclusions ........................................................................................................... 101
4.8.2 Contributions and implications .............................................................................. 101
4.8.3 Limitations and further research ............................................................................ 103
Chapter 5 Essay Two: Risk Tolerance, Investment Horizons and Debt Decisions ............... 105
5.1 Introduction .................................................................................................................. 105
5.2. Literature review and hypothesis development .......................................................... 106
5.2.1 Risk tolerance in decision-making ........................................................................ 106
5.2.2 Hypothesis development ....................................................................................... 106
5.3 Methodology ................................................................................................................ 109
5.4 Main results .................................................................................................................. 110
5.4.1 Investor characteristics and investment horizons .................................................. 110
5.4.2 Levels of risk tolerance.......................................................................................... 110
5.4.3 Test of reliability of the risk tolerance scale and correlations ............................... 112
5.4.4 Main results and discussion ................................................................................... 114
5.5 Results of additional analysis ....................................................................................... 120
5.5.1 Sub-groups ............................................................................................................. 120
5.5.2 Mediating role of risk tolerance............................................................................. 127
5.5.3 Facets of risk tolerance .......................................................................................... 129
5.6 Robustness check ......................................................................................................... 133

viii
5.6.1 Robustness check using additional measures ........................................................ 133
5.6.2 Robustness check using multiple and stepwise regressions .................................. 135
5.6.3 Robustness check using Hayes and Preacher’s approach ...................................... 136
5.6.4 Robustness check using the t-test and propensity score matching approach ........ 137
5.6.5 Robustness check using the instrumental variables method .................................. 138
5.6.6 Robustness check on locations selection and response bias .................................. 140
5.7 Demographics .............................................................................................................. 141
5.8 Conclusions, contributions, implications, limitations and further research ................. 144
5.8.1 Conclusions ........................................................................................................... 144
5.8.2 Contributions and implications .............................................................................. 144
5.8.3 Limitations and further research ............................................................................ 146
Chapter 6 Essay Three: Trust, Trading Frequency and Debt Decisions ................................ 147
6.1 Introduction .................................................................................................................. 147
6.2 Literature review and hypothesis development ........................................................... 148
6.3 Methodology ................................................................................................................ 150
6.4. Main results and discussion ........................................................................................ 151
6.4.1 Levels of trust ........................................................................................................ 151
6.4.2 Reliability test of the scale of trust ........................................................................ 153
6.4.3 Test of correlations ................................................................................................ 153
6.4.4 Results of main SEM models and discussion ........................................................ 155
6.5. Results of additional analysis ...................................................................................... 159
6.5.1 Results of six facets of trust ................................................................................... 160
6.5.2 Results of subgroup analysis ................................................................................. 162
6.6 Robustness check ......................................................................................................... 168
6.6.1 Robustness check using additional measures ........................................................ 169
6.6.2 Robustness check using multiple and stepwise regression .................................... 170
6.6.3 Robustness check using the Hayes and Preacher’s approach ................................ 171
6.6.4 Robustness check using the T-test method ............................................................ 173
6.6.5 Robustness check on locations selection and response bias .................................. 174
6.7 Demographics .............................................................................................................. 176
6.8 Conclusions, contributions, implications, limitations and further research ................. 179
6.8.1 Conclusions ........................................................................................................... 179
6.8.2 Contributions and implications .............................................................................. 179
6.8.3 Limitations and further research ............................................................................ 181
Chapter 7 Conclusions ........................................................................................................... 182

ix
Introduction to this chapter ................................................................................................ 182
7.1 Major findings .............................................................................................................. 182
7.2 Contributions ................................................................................................................ 185
7.3 Implications and recommendations ............................................................................. 186
7.4 Further areas of research .............................................................................................. 190
References: ......................................................................................................................... 192
Appendix 1 – Consent form and Questionnaire – English version .................................... 205
Appendix 2: Consent form and Questionnaire - Vietnamese version ................................ 216

x
List of Figures
Figure 1.1: Formal debt, informal debt and innovation performance of enterprises ................. 2
Figure 1.2: Informal debt used by households in developing countries .................................... 3
Figure 1.3: Informal and formal debt used by investors for stock investment .......................... 4
Figure 1.4: The VN-index performance from 2000 through 2019 ............................................ 6
Figure 2.1: Conceptual background of the thesis ..................................................................... 13
Figure 2.2: A summary of concepts of perceived risk ............................................................. 17
Figure 2.3: A summary of investors’ behaviour in investment decision-making .................... 18
Figure 2.4: A summary of the perspectives of the risk-return trade-off .................................. 22
Figure 2.5: A summary of the key concepts of Prospect theory .............................................. 26
Figure 2.6: A summary of the key concepts of heuristics ........................................................ 30
Figure 3.1: Structural equations modelling overview .............................................................. 38
Figure 3.2: Covariance relationships between constructs ........................................................ 39
Figure 3.3: Fit Indices Demonstrating Goodness-of-Fit Across Different Model Situations .. 43
Figure 3.4: A summary of research phases .............................................................................. 45
Figure 4.1: A summary of measures of perceived risk, borrowing sources and debt decisions
.................................................................................................................................................. 69
Figure 4.2: Perceived risk, borrowing sources and debt decisions (SEM1) ............................ 79
Figure 4.3: Facets of risk, borrowing sources and debt decisions (SEM2) ............................. 82
Figure 4.4: Borrowing sources, perceived risk and debt decisions (SEM3) ............................ 83
Figure 4.5: Perceived risk, borrowing sources and debt decisions between stockbrokers and
non-stockbrokers ...................................................................................................................... 85
Figure 4.6: Perceived risk, borrowing sources and debt decisions between male and female
investors ................................................................................................................................... 88
Figure 4.7: Perceived risk, borrowing sources and debt decisions (SEM8) ............................ 92
Figure 4.8: A summary of demographics .............................................................................. 100
Figure 5.1: Measures of risk tolerance, investment horizons, and debt decisions ................. 109
Figure 5.2: Risk tolerance, investment horizons, and debt decisions (SEM1) ...................... 116
Figure 5.3: Investment horizons, risk tolerance and debt decisions (SEM2) ........................ 118
Figure 5.4: Risk tolerance, investment horizons and debt decisions between stockbrokers and
non-stockbrokers .................................................................................................................... 122
Figure 5.5: Risk tolerance, investment horizons and debt decisions between male and female
investors ................................................................................................................................. 125
Figure 5.6: Investment horizons, risk tolerance and debt decisions among stockbrokers
(N=170) (SEM7) .................................................................................................................... 128
Figure 5.7: Risk tolerance, investment horizons and debt decisions (SEM8) ....................... 134

xi
Figure 6.1: Measures of trust, trading frequency and debt decisions .................................... 151
Figure 6.2: Trust, trading frequency and debt decisions (SEM1) .......................................... 157
Figure 6.3: Trading frequency, trust and debt decisions (SEM2) .......................................... 158
Figure 6.4: Six facets of trust, trading frequency and debt decisions (SEM3) ...................... 161
Figure 6.5: Trust, trading frequency and debt decisions between stockbrokers and non-
stockbrokers ........................................................................................................................... 163
Figure 6.6: Trust, trading frequency and debt decisions between male and female investors
................................................................................................................................................ 165
Figure 6.7: Trading frequency, trust and debt decisions (SEM8) .......................................... 169
Figure 6.8: A summary of six demographics ......................................................................... 177
Figure 7.1: A summary of the findings of Essay One ............................................................ 183
Figure 7.2: A summary of the findings of Essay Two ........................................................... 184
Figure 7.3: A summary of the findings of Essay Three ......................................................... 185

xii
List of Tables
Table 3.1: A summary of the survey respondents.................................................................... 52
Table 3.2: A summary of suburbs in Ho Chi Minh City ......................................................... 53
Table 3.3: Results of investor characteristics .......................................................................... 57
Table 3.4: A summary of debt decisions ................................................................................. 59
Table 4.1: Description of overall perceived risk and its seven facets ...................................... 70
Table 4.2: Perceived risk among groups .................................................................................. 71
Table 4.3: A summary of the borrowing sources ..................................................................... 73
Table 4.4: Results of the reliability of perceived risk and its facets ........................................ 75
Table 4.5: A summary of the correlations between variables .................................................. 76
Table 4.6: Perceived risk, borrowing sources and debt decisions (SEM1) ............................. 79
Table 4.7: Facets of risk, borrowing sources and debt decisions (SEM2) ............................... 82
Table 4.8: Borrowing sources, perceived risk, debt decisions (SEM3) ................................... 83
Table 4.9: Perceived risk, borrowing sources and debt decisions between stockbrokers and non-
stockbrokers ............................................................................................................................. 86
Table 4.10: Perceived risk, borrowing sources and debt decisions between male and female
investors ................................................................................................................................... 89
Table 4.11: Perceived risk, borrowing sources and debt decisions between users and non-users
of borrowing sources................................................................................................................ 90
Table 4.12: Perceived risk, borrowing sources and debt decisions (SEM8) ........................... 92
Table 4.13: Results of direct relationships using multiple regression and stepwise regression
.................................................................................................................................................. 94
Table 4.14: Results of indirect effects – Hayes and Preacher’s approach ............................... 95
Table 4.15: The T-test results of the six variables between the two groups of perceived risk
(N=392) .................................................................................................................................... 96
Table 4.16: The results for the relationship between perceived risk and debt decisions (N=392)
.................................................................................................................................................. 97
Table 4.17: Results of an effect of locations on debt decisions ............................................... 98
Table 5.1: A summary of investment horizons ...................................................................... 110
Table 5.2: A summary of investors’ risk tolerance ................................................................ 111
Table 5.3: Results of the reliability of the 13-item risk tolerance ......................................... 112
Table 5.4: The correlations between risk tolerance, investment horizons, and debt decisions
................................................................................................................................................ 113
Table 5.5: Risk tolerance, short-term stock investment, and debt decisions (SEM1) ........... 116
Table 5.6: Investment horizons, risk tolerance, and debt decisions (SEM2) ......................... 119

xiii
Table 5.7: Risk tolerance, investment horizons and debt decisions between stockbrokers and
non-stockbrokers .................................................................................................................... 123
Table 5.8: Risk tolerance, investment horizons and debt decisions between male and female
investors ................................................................................................................................. 126
Table 5.9: Risk tolerance, investment horizons, and informal debt between users and non-users
of borrowing sources.............................................................................................................. 127
Table 5.10: Investment horizons, risk tolerance and debt decisions among stockbrokers
(N=170) (SEM7) .................................................................................................................... 129
Table 5.11: Results of the total variance explained by the components of risk tolerance ..... 130
Table 5.12: Five components of risk tolerance ...................................................................... 131
Table 5.13: Facets of risk tolerance between this chapter and Grable and Lytton’s studies . 132
Table 5.14: Risk tolerance, investment horizons and debt decisions (SEM3)....................... 134
Table 5.15: Robustness check on the direct relationships ..................................................... 135
Table 5.16: A summary of the results using Hayes and Preacher’s approach (N=170) ........ 136
Table 5.17: The t-test results of six variables between two groups of risk tolerance (N=336)
................................................................................................................................................ 137
Table 5.18: The results of the relationship between risk tolerance and debt decisions (N=336)
................................................................................................................................................ 138
Table 5.19: The findings of an instrumental variable for risk tolerance ................................ 139
Table 5.20: Results of an effect of locations on debt decisions ............................................. 140
Table 5.21: A summary of demographics .............................................................................. 143
Table 6.1: A summary of trust between groups ..................................................................... 152
Table 6.2: A summary of six facets of trust ........................................................................... 152
Table 6.3: Test of reliability of the scale of overall trust ....................................................... 153
Table 6.4: The correlations between trust, trading frequency and debt decisions ................. 154
Table 6.5: Trust, trading frequency and debt decisions (SEM1) ........................................... 157
Table 6.6: Trading frequency, trust and debt decisions (SEM2) ........................................... 159
Table 6.7: The results of six facets of trust, trading frequency, and debt decisions (SEM3) 161
Table 6.8: Trust, trading frequency and debt decisions between stockbrokers and non-
stockbrokers ........................................................................................................................... 164
Table 6.9: Trust, trading frequency and debt decisions between male and female investors 166
Table 6.10: Trust, trading frequency and debt decisions between users and non-users of
borrowing sources .................................................................................................................. 168
Table 6.11: Trading frequency, trust and debt decisions (SEM8) ......................................... 170
Table 6.12: Results of direct relationships between multiple and stepwise regression ......... 171
Table 6.13: Results of the relationships using Hayes and Preacher’s approach .................... 172
Table 6.14: The t-test results of six control variables between two groups of trust (N=420) 173

xiv
Table 6.15: The results of the relationship of trust to informal debt (N=420) ...................... 174
Table 6.16: Results of an effect of locations on debt decisions ............................................. 175

1
Chapter 1 Overview
1.1 The importance of informal and formal debt in stock investment
The use of debt for stock investment is common and often regarded as an essential part of the
growth of stock markets. This debt can be from both formal and informal borrowing sources.
Formal borrowing sources include bankers, credit institutions, and brokerage firms. Informal
borrowing sources encompass family (e.g. parents, brothers, sisters) and non-family (e.g.
friends, colleagues, managers). Chandavarkar (1985) argues that instead of considering these
two sectors as discrete financial enclaves, informal and formal financial sectors should be seen
as forming a continuum, with many sub-markets within each sector, and many connections
between the two.
Informal finance sources can be more accessible than the formal sector due to its type of loan
transactions and flexibility of operations (e.g. Germidis, Kessler, & Meghir, 1991; Ghate,
1992). The loan transactions are personalised in the informal sector, while the loan transactions
are arms-length in the formal sector. Formal loan terms are standardised, whereas informal loan
terms are outside the purview of the regulations. Borrowers from informal lenders also have
flexibility in terms of loan purpose, interest rate, collateral requirements, maturity periods, and
debt rescheduling, whereas borrowers from formal lenders do not (Ghate, 1992).
The role of the informal debt sector increasingly plays an important role in economic
development for both enterprises and individuals. At the enterprise level, informal debt exerts
a strong influence on innovation performance. This debt becomes more important as new
enterprises have constrained access to formal sources. Informal capital is a unique source for
them in accessing financing (Wu, Si, & Wu, 2016).

2
The relationship between formal and informal debt changes with increased business activity,
as indicated in Figure 1.1. That is, at high levels of business activity, the use of informal debt
increases, while the use of formal debt decreases.
Figure 1.1: Formal debt, informal debt and innovation performance1 of enterprises
Wu et al. (2016, p. 267)
At the household level, informal debt is mostly used for production and consumption (Barslund
& Tarp, 2008; Guirkinger, 2008; Mohieldin & Wright, 2000), indicating that informal debt
contributes to the growth of the economy. Households use informal debt due to their limited
access to formal sources. Low rates of interest, low transaction costs, and uncomplicated
procedures are also the primary reasons for the use of informal debt (Barslund & Tarp, 2008;
Guirkinger, 2008; Mohieldin & Wright, 2000).
Most households in developing countries have used informal debt, as shown in Figure 1.2. The
informal debt levels used are around 62.5% in Madagascar (Zeller, 1994), 42.5% in Egypt
1 Innovation is defined as “the development and implementation of new ideas by people who over time engage
in transactions with others within an institutional order.” (Van de Ven, 1986; Wu et al. 2016). Innovation
performance is largely related to the new product sales (Wu et al., 2016).

3
(Mohieldin & Wright, 2000), 48% in Vietnam (Barslund & Tarp, 2008), 26% in Peru
(Guirkinger, 2008), 19% in China (Turvey & Kong, 2010), 72% in India (Guérin, d'Espallier,
& Venkatasubramanian, 2013), and 75% in Thailand (Tanomchat & Sampattavanija, 2018).
Figure 1.2: Informal debt used by households in developing countries
While there are numerous studies on the use of informal debt, there has been no publicised
research on the use of informal debt by individual investors for stock investment to the author’s
knowledge. This thesis examines the use of informal debt in addition to formal debt by
Vietnamese individual investors for stock investment, and that this choice can influence their
investment decisions. Based on trial interviews and a pilot test of 20 individual investors, most
of them (19 investors) use debt for stock investment. Among these, 9 investors use both
informal and formal debt, 2 investors use only informal debt, and 8 investors use only formal
debt for stock investment, as shown in Figure 1.3.
63%
42.5%
48%
26%
19%
72%75%
42%
Madagascar Egypt Vietnam Peru China India Thailand Bangladesh

4
Figure 1.3: Informal and formal debt used by investors for stock investment
Use of debt (known as debt decisions) is a risky decision regardless of whether it is informal
or formal debt because users of debt (i.e. investors) face problems personally and legally if
investment outcomes result in investors being unable to cover their debt obligations. The
literature finds that behavioural factors like perceived risk, risk tolerance, and trust play a vital
role in decision-making under risk (e.g. Grable, 2000, 2008; Kahneman & Tversky, 1979;
Stout, 2009; Zak & Knack, 2001). Based on this evidence, this thesis investigates whether the
perceived risk of stock investment, risk tolerance, or trust in the stock market are key drivers
of debt decisions.
1.2 Factors driving debt decisions and the primary research questions
The “perceived risk” of stock investment is defined by Peter and Tarpey Sr (1975) as the level
of potential loss concerns and level of importance of this potential loss. Many finance studies,
(e.g. Kahneman & Tversky, 1979; Nofsinger, 2008; Thaler & Johnson, 1990), have suggested
that investors are only concerned about financial risk. However, this thesis argues that, when
investing in stocks, investors may have additional risk concerns rather than just financial risk.
These additional concerns are information safety (safety risk), time waste (time risk), social
standing (social risk), wrong choices among stocks (choice risk), missing out on other financial
5
opportunities (opportunity risk), and debt problems (leverage risk) (Peter & Tarpey Sr, 1975;
Hoyer et al., 2016). These concepts of perceived risk are derived from consumer theory and
potentially provides valuable insights into investors’ perceived risk and its relationship with
debt decisions.
“Risk tolerance” is defined by Grable (2000) as the maximum amount of uncertainty that a
person is willing to accept when making a decision. Risk tolerance is sometimes used to
describe risk preference (e.g. Grable, 2000, 2008). Since risk tolerance affects a broad range of
personal financial choices, for example, (Grable & Roszkowski, 2008), this thesis argues that
risk tolerance is strongly associated with debt decisions.
“Trust” in the stock market is defined by Shapiro (2012) as the asymmetric agency, through
which individuals or organisations (known as agents – those trusted) act on behalf of others
(known as principals - trustors). In the case of A trusts B, B holds the position of trust regardless
of whether A considers B trustworthy, feels confident about B, or whether B encapsulates the
interest of A that B serves. B here acts with disinterestedness, full and honest disclosure,
diligence, duties of care or performance that is consistent with A’s expectations under the
circumstances (Shapiro, 2012). This thesis argues that trust in the stock market is related to
debt decisions.
This thesis, in short, argues that the perceived risk of stock investment, risk tolerance and trust
in the stock market strongly relate to debt decisions, using both roles: a predictor and mediator
in debt decision. The following general research questions are:
1/ What roles does the perceived risk of stock investment play in debt decisions?
2/ What roles does risk tolerance play in debt decisions?
3/ What roles does trust in the stock market play in debt decisions?
6
1.3 Vietnam stock market and individual investors
1.3.1 The Vietnam stock market
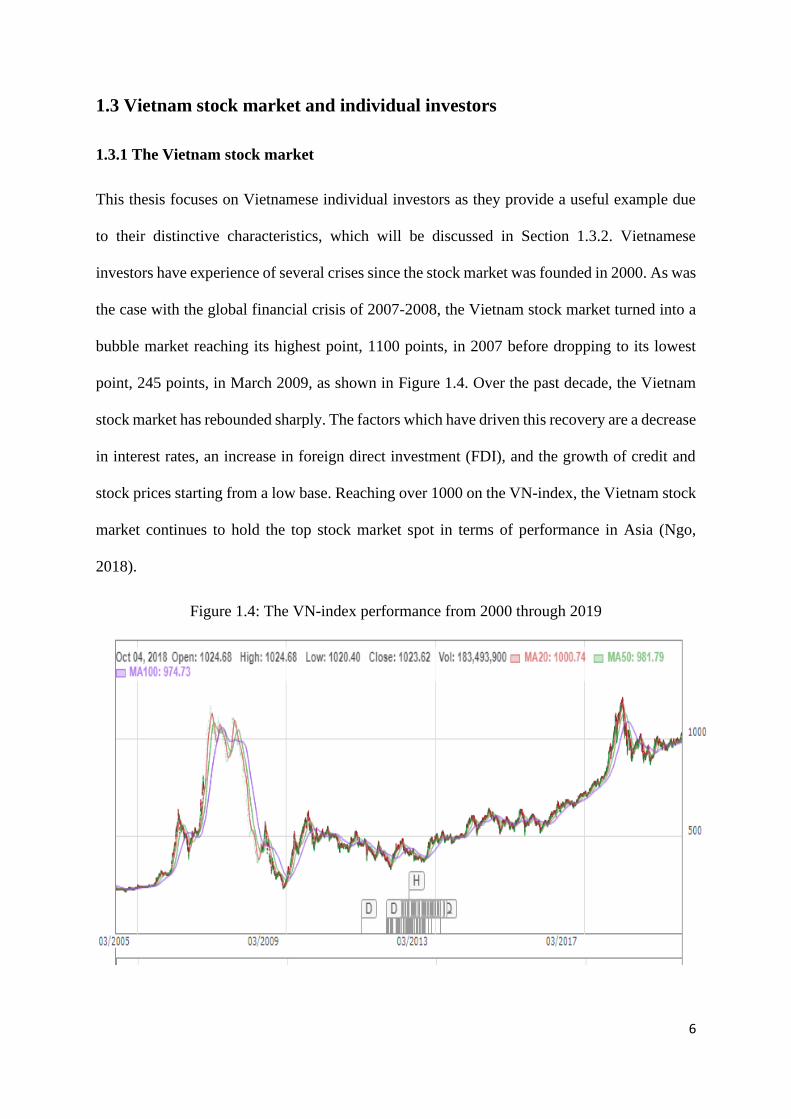
This thesis focuses on Vietnamese individual investors as they provide a useful example due
to their distinctive characteristics, which will be discussed in Section 1.3.2. Vietnamese
investors have experience of several crises since the stock market was founded in 2000. As was
the case with the global financial crisis of 2007-2008, the Vietnam stock market turned into a
bubble market reaching its highest point, 1100 points, in 2007 before dropping to its lowest
point, 245 points, in March 2009, as shown in Figure 1.4. Over the past decade, the Vietnam
stock market has rebounded sharply. The factors which have driven this recovery are a decrease
in interest rates, an increase in foreign direct investment (FDI), and the growth of credit and
stock prices starting from a low base. Reaching over 1000 on the VN-index, the Vietnam stock
market continues to hold the top stock market spot in terms of performance in Asia (Ngo,
2018).
Figure 1.4: The VN-index performance from 2000 through 2019

7
1.3.2 Vietnamese individual investors
The Vietnam stock market has useful characteristics. Firstly, individual investors dominate the
Vietnam stock market, making up 99% of participants. This differs from the developed
markets, where institutional investors rather than individual investors are the primary
participants. Most investors are young (approximately 50% age 26-35) and do not have much
experience in stock investment (around 50% have less than 3 years of experience) (Trang &
Khuong, 2017). For these reasons, the research on the behaviour of Vietnamese individual
investors applied in this thesis is of significant interest as they are generally new to the market
and are still learning.
Secondly, investors typically use high levels of financial leverage. While Vietnamese law
imposes a maximum lending ratio of 1:1, in some instances, individual investors use higher
levels of debt, with a leverage ratio of even up to 1:4.2 This increases the risk of substantial
losses when stock prices fall. It is almost certain, therefore, that investors have currently used
financial leverage for stock investment.
Lastly, informal borrowing is common in Vietnamese culture. Many Vietnamese websites
discuss issues around borrowing and give some advice on how to deal with people who ask
“you” to borrow money. A list of typical borrowers is often quite wide, including
acquaintances, friends, colleagues (co-workers), best friends, and relatives. 3 Informal
borrowing is also a unique source for Vietnamese households as they have limited access to
formal lenders (e.g. Barslund & Tarp, 2008; Nguyen, 2008; Nguyen & Berg, 2014). These
2 According to the website of Vnexpress (2010): http://kinhdoanh.vnexpress.net/tin-tuc/chung-khoan/thi-truong-
truot-doc-vi-don-bay-tai-chinh-2705286.html
3 According to the following websites: DKN (2018): https://mb.dkn.tv/van-hoa/khi-5-loai-nguoi-nay-hoi-muon-
tien-ban-se-tra-loi-ra-sao.html
Thanhnien.vn (2018): https://thanhnien.vn/doi-song/cho-nguoi-quen-muon-tien-lam-du-cach-doi-no-cung-danh-
om-cuc-tuc-691567.html

8
characteristics will help explain why Vietnamese investors use informal debt for the stock
market.
Based on these characteristics, this thesis provides useful insights into investors’ behaviour and
its impact on the use of formal and informal debt for stock investment in the Vietnam stock
market.
1.4 Family and borrowing culture in Vietnam
1.4.1 Family culture
Vietnam is an emerging economy, being the world’s most 15th populous country in the world.
Vietnam has strong economic growth due to the expansion of networks and reform policies.
GDP per capita has sharply increased by 123% within 10 years (2008-2018), USD 1149 (2008)
compared to USD 2566 (2018), according to the data of the world bank4. The culture of
Vietnam is one of the oldest in Southeast Asian, approximately 4000 years ago, and strongly
influenced by Chinese culture (Confucian social ).
In a Vietnamese family, multiple generations have been living together, including
grandparents, parents, children, single aunts or uncles. Children have been in a family until
they get married, regardless of what their ages are. However, married sons, especially the oldest
or youngest sons (including his wife and children) have still lived with their parents because of
being in charge of taking care of their parents. Grandparents can get involved in many
activities, for example, nurturing their grandchildren.
Men overall have more influence on family decisions than women in a family. The older man
is usually the household head, who has more influence in financial and non-financial decision-
making. A family head also acts as a judge if there are quarrels between members. Women are
4 https://data.worldbank.org/indicator/NY.GDP.PCAP.CD?locations=VN

9
also responsible for housework and raising children. Wives often sacrifice for her husband and
children, and importantly, tolerate unfair treatment to keep the family in peace.
1.4.2 Borrowing and lending money culture
“Blood is thicker than water”
Borrowing from parents is common in Vietnamese culture. Good and loyal relationships
between members in a family are more important than others, which conforms to the proverb
“blood is thicker than water”5. The elders show their care for the younger, and the younger
express their respect to the seniors. They, therefore, willingly help each other when members
have difficulties. The following reasons explain why parents willingly lend their children
money. (i) They do this with the hope that their money may help their children solve these
problems and then have better lives. (ii) Parents’ money may create opportunities for their
children to fulfil their dream for entrepreneurship or investment. (iii) As being household
heads, lending money to children may increase their influence in a family and hold children’s
respect.
Cash holding preference
Eighty per cent (80%) of Vietnamese prefer using cash for daily buying and selling
transactions6, explaining why they also borrow cash from parents or friends. According to Dr
Nguyen Tri Hieu - a specialist of finance - banking, cash is the main means of payment in
Vietnam for three reasons.
5 https://www.itourvn.com/blog/traditional-vietnamese-family-
values#:~:text=In%20a%20Vietnamese%20family%2C%20multiple%20generations%20are%20living,live%20
with%20their%20family%20until%20they%20get%20married.
6 https://www.tin247.com/vi-sao-nguoi-dan-viet-nam-van-thich-chi-tieu-bang-tien-mat-hon-la-thanh-toan-truc-
tuyen-4-27530603.html

10
First, there is not any Vietnamese law on the use of non-cash payment. For payees, payment
by cash is faster and safer, preventing their personal information being hacked by hackers or
virus attacks online. For sellers, cash receipt may avoid the burden of taxes obligations. In
practice, Vietnamese laws on bankruptcy or enterprise protection in terms of bankruptcy remain
unclear and require a time-consuming process, even though they have fulfilled their tax
obligations, causing a consequence that every business itself protects and survives according
to their own ways.
Second, there are no official community education programs on the use of e-banking for
payment, resulting in most people being uncomfortable and unfamiliar with this instrument.
Currently, several workshops or seminars on the use of e-banking have been taking place.
However, the focus of participants is on undergraduates or higher, meaning that students in
high schools (age of 15-18) or secondary schools (age of 12-14) have no ideas about e-banking
payment.
Finally, frauds in the finance-banking system and cheating payments online are common in
Vietnam, becoming a serve problem without appropriate solutions because the origin of these
problems emanates from false understandings of information. These causes people to lose trust
in the banking system in Vietnam, and as a consequence, households are more likely to keep
cash at home than in a bank.
1.5 Structure of the thesis
The structure of this thesis is based on a three-essay format. Essay one (presented in Chapter
4) examines the inter-relationships between perceived risk of stock investment, borrowing
sources, and debt decisions. Essay two (presented in Chapter 5) investigates the inter-
relationships between risk tolerance, investment horizons, and debt decisions. Essay three
(presented in Chapter 6) examines the inter-relationships between trust in the stock market,

11
trading frequency, and debt decisions. These relationships are tested after controlling for six
demographics; gender, age, marital status, education, income, and financial literacy. Early
versions of these essays have been presented at academic conferences.7
The key technique for the three essays is “structural equation modelling” (SEM), utilising
cross-sectional data of 420 Vietnamese individual investors. This thesis also analyses the
differences in the relationship between perceived risk, risk tolerance, and trust to debt decisions
between subgroups; stockbrokers and non-stockbrokers, male and female investors, and users
and non-users of borrowing sources (informal and formal). Other techniques are also applied
to carry out robustness checks of the findings by SEMs, including multiple regression, stepwise
regression, Hayes and Preacher’s approach, a t-test method, propensity score matching (PSM)
method, and the instrumental variables (IVs) approach.
The remainder of this thesis is as follows. Chapter 2 presents the theoretical background of this
thesis. The methodology is presented in Chapter 3. Chapter 4 serves as Essay 1, Chapter 5 as
Essay 2, and Chapter 6 as Essay 3. Chapter 7 ends by presenting the conclusions, including
significant findings, contributions, implications and recommendations, and suggestions for
further areas of research.
7 The early version of Study 1 (Chapter 4) of this thesis was presented at the 2nd Asia Conference on Business
and Economic Studies (ACBES 2019), University of Economics Ho Chi Minh City, Vietnam, September 2019
https://acbes.ueh.edu.vn/, and at the 3rd Sydney Banking and Financial Stability Conference 2019 (SBFC 2019),
University of Sydney Business School, Australia, December 2019 https://sbfc.sydney.edu.au/.
The early version of Study 2 (Chapter 5) of this thesis was presented at the 23rd International Congress on
Modeling and Simulation (MODSIM2019), Modeling and Simulation Society of Australia and New Zealand Inc.,
Australia, December 2019 https://mssanz.org.au/modsim2019/index.html., and at the 23rd New Zealand Finance
Colloquium – NZFC, Lincoln University, New Zealand, February 2019 https://nzfc.ac.nz/cfp/.
The early version of Study 3 (Chapter 6) of this thesis was presented at International Conference on Business and
Finance 2019, University of Economics Ho Chi Minh City, Vietnam, August 2019
https://vietnam2019.sciencesconf.org/, and at the 24rd New Zealand Finance Colloquium – NZFC, Auckland
University of Technology, New Zealand, February 2020 https://www.nzfc.ac.nz/cfp/index.html

12
Chapter 2 Theoretical Background
Introduction to this chapter
Behavioural decision theory includes traditional finance and behavioural finance. Scholars of
behavioural finance and consumer behaviour argue the assumptions used in traditional finance.
This chapter begins with the behavioural decision theory and expected utility theory (EUT).
The following sections are the concept of perceived risk, investors’ rationality and risk
aversion, a risk-return trade-off, and trust in decision-making. This chapter ends with the
behavioural finance framework and a summary.
2.1 Behavioural decision theory
Behavioural decision theory developed by Edwards (1954, 1961) focuses on a restricted range
of human activity, especially how people choose between options (Hansson, 1994).
Behavioural decision theory has two facets; normative and descriptive (Edwards, 1954, 1961;
Hansson, 1994; Hickson & Khemka, 2014; Slovic, Fischhoff, & Lichtenstein, 1977). A
normative theory provides prescriptive functions or uses decision rules to help decision-makers
maximise their expected utility of outcomes. The focus of the normative theory is, therefore,
on how people should make decisions. In contrast, the descriptive theory is a description of
decision-makers’ beliefs and values, and the way they incorporate these beliefs and values into
their decisions. Hence, the descriptive theory focuses on how people actually make decisions.
In personal financial decisions, there are different perspectives among traditional finance,
behavioural finance, and consumer behaviour. Traditional finance originates from normative
theory, and behavioural finance and consumer behaviour are derived from descriptive theory,
as shown in Figure 2.1.

13
Figure 2.1: Conceptual background of the thesis
Behavioural decision theory
Financial decisions under risk and
uncertainty
Normative theory Descriptive theory
Traditional finance Behavioural finance Consumer
behaviour
Collected by this thesis
The assumptions made under the traditional finance framework have been much debated by
scholars of behavioural finance and consumer behaviour. This begins with the debates on the
assumptions of Expected Utility Theory (EUT) that are presented below.
2.2 Expected Utility Theory (EUT)
One of the basic concepts underlying traditional theory is expected utility theory (EUT)
developed by Von Neumann and Morgenstern (1944). EUT assumes that people choose
between any two alternatives based on their preferences and that these preferences are always
consistent. For example, if he/she prefers A to B, A is always chosen. Noticeably, the
preferences between any two choices are independent of the presence of a third option, for
example, C. This means that a person always prefers A to B regardless of the existence of C.
Also, if he/she prefers A to B and B to C, he/she will prefer A to C.
This assumption has been argued against by scholars of behavioural finance, where investors’
preferences may change and be inconsistent over time (e.g. Grable & Roszkowski, 2008;

14
Kahneman & Tversky, 1979; Nofsinger, 2008; Thaler & Johnson, 1990; Weber, Blais, & Betz,
2002). Moreover, a decision maker’s perception of choice may change according to the
presentation of information referred to as “decision frame”.
Tversky and Kahneman (1981) argue that a decision to be made is based on the “frame”.
“Decision frame” is described as “the decision-maker’s conception of acts, outcomes, and
contingencies associated with a particular choice” (Tversky & Kahneman, 1981, p. 453). In
other words, it relates to how a decision-maker takes a problem into account, with “frame”
referring to the description or presentation of a problem (Ackert, 2014; Shefrin, 2002).
In traditional finance, the frame is independent of behaviour or irrelevant to behaviour (known
as frame independence) due to a decision-maker having consistent preferences in decision-
making and information always being available (Shefrin, 2002). By contrast, scholars of
behavioural finance, for example, Tversky and Kahneman (1981), debate that the frame is
relevant to behaviour and affects decision-making (known as frame dependence), and that
because a decision-maker has limited resources and ability, they make a decision based on both
the presentation of this problem and their personal characteristics.
This thesis also argues that individual investors’ preferences are inconsistent. Investors may
prefer stock A to stock B at present, but B to A in the future. Likewise, between formal and
informal debt for stock investment, individual investors may choose both formal and informal
debt in varying proportions. Traditional finance would suggest that one would be preferred to
the other and investors would only borrow from both sources if their preferred source was
exhausted.
Moreover, a decision to be made should not be focused only on two alternatives. Rather, other
factors should be considered; for example, personal characteristics, emotions, risk attitudes,
and prior outcomes; due to their impacts on choice decisions (Grable & Roszkowski, 2008;

15
Kahneman & Tversky, 1979; Nofsinger, 2008; Thaler & Johnson, 1990; Weber et al., 2002).
It is also essential to examine whether these additional factors dampen the impact of the
preferences on choice decisions.
2.3 Perceived risk
2.3.1 Concepts of perceived risk
Scholars of both finance and consumer behaviour also have different perspectives around the
concept of perceived risk. Perceived risk plays a vital role in decision-making (Bélanger &
Carter, 2008; Cunningham, 1967; Weber et al., 2002). In consumer behaviour theory, Bauer
(1960) defines perceived risk as “the sense that any action of a consumer will produce
consequences which he cannot anticipate with anything approximating certainty, and some of
which at least are likely to be unpleasant” (p.24). Perceived risk is also characterised as a
person’s subjective feelings of certainty to act in an uncertain environment (Cunningham,
1967), or a subjective expectation of suffering a loss to pursue the desired outcome (Bélanger
& Carter, 2008). In finance, perceived risk may be described as “a person’s standing on the
continuum from risk aversion to risk-seeking” (Weber et al., 2002, p. 264).
Perceived risk differs from actual risk. The way that risk is perceived can be more or less severe
than actual risk. Established research shows that people do not always have a realistic or
accurate view of actual risk (e.g. Gilbert, 2009; Schneier, 2006). For example, Gilbert (2009)
argues that individuals are likely to over-react or under-react to actual risks. They worry more
about anthrax (intentional action) than influenza (a natural accident) although an annual death
toll of anthrax may be zero, while an annual death toll of influenza may be a half-million
people. Schneier (2006) also reveals that people underestimate risks they voluntarily take, and
overestimate risks they cannot control. In stock investment, perceived risk may lead to adverse
results. For example, investors tend to be overly optimistic about the potential for good

16
performance or be excessively confident about their ability in predicting the possible good
outcomes of the investments they make (e.g. Barber & Odean, 2001; Kim and Nofsinger,
2003). As a result, these optimism or overconfidence biases lead to suboptimal returns.
Behavioural biases will be examined in Section 2.6.
Perceived risk also varies based on personal characteristics or a country’s culture. Namely,
males are more overconfident or less risk-averse than females (Barber & Odean, 2001; Weber
et al., 2002). Kim and Nofsinger (2003) also find that people in Asian culture tend to be more
overconfident than people in other cultures. Products in less-developed countries are perceived
as riskier due to the high likelihood of poor quality (Alden, Stayman, & Hoyer, 1994).
2.3.2 Investors’ perceived risk
The concept of perceived risk differs between finance and consumer behaviour frameworks.
As shown in Figure 2.2, in traditional finance theory, objective risk is normally measured
through beta or standard deviation, while in behavioural finance or consumer behaviour
frameworks, the subjective risk is measured through investors’ perspectives.
Within the finance framework, investors are seen as being only concerned about financial risk
(gain or loss) when investing in stocks. This may lead to an inaccurate assessment of the
perceived risk of an investment because investors miss some critical facets of the risk. Within
a consumer behaviour framework, consumers are concerned with a wide variety of risk
including financial risk (potential to suffer financial harm); performance risk (perform more
poorly than expected); safety risk (create harm to their safety); psychological risk (harm their
sense of self and, thus, create negative emotions); social risk (do harm to their social standing);
and time risk (lead to loss of time).
Given that both investors and consumers make decisions under uncertainty, it could be posited
that investors may, in addition to financial risk, be concerned about the other facets of risk used

17
in consumer theory. This thesis thus explores this and finds that, as well as financial risk,
investors are concerned about additional six kinds of risk, namely information safety, social
standing, investment opportunities, investment time, investment choice, and the use of leverage
for investment. The findings of this thesis provide novel insights into investor behaviour.
Figure 2.2: A summary of concepts of perceived risk
Individual investors’
perceived risk
Traditional
finance
Behavioural
finance
Consumer behaviour This thesis
Objective risk Subjective risk Subjective risk Subjective risk
Concerned
about: only
financial risk
(gain or loss)
Concerned about:
only financial risk
(gain or loss)
Concerned about:
financial risk,
performance, safety risk,
psychological risk, social
risk, and time risk.
Concerned about: Financial
risk, safety risk, social risk
opportunity risk, time risk,
choice risk, and leverage
risk.
Collected by this thesis
In summary, based on the consumer behaviour framework in terms of perceived risk, this thesis
finds that investors are concerned with seven facets of risk, namely financial risk, safety risk,
social risk, opportunity risk, time risk, choice risk, and leverage risk. These facets of risk form
investors’ perceived risk of stock investment.
The three fields of traditional finance, behavioural finance and consumer theory have differing
perspectives of the relationship between risk and return in terms of investor behaviour. The
traditional finance framework assumes that investors are always rational and risk-averse, and
the relationship between risk and return is positive. These assumptions have been the focus of
much debate by scholars of behavioural finance and consumer theory. These debates are
presented below.

18
2.3.3 Investors’ rationality and risk aversion
Within traditional finance framework, for example, modern portfolio theory (MPT) by
Markowitz (1952) and the Capital Asset Pricing Model (CAPM) by Sharpe (1964), Lintner
(1965) and Mossin (1966) assume that investors are rational and risk-averse in terms of their
expected returns. This means that for a specific level of return, investors prefer a less risky
portfolio to a riskier one. In general, scholars of traditional finance ignore all behavioural
factors, which often play a part in human decision-making. These assumptions have been
debated by scholars of behavioural finance and consumer behaviour and are outlined in Figure
2.3.
Figure 2.3: A summary of investors’ behaviour in investment decision-making
Individual investors’ behaviour
Traditional
finance
Behavioural finance Consumer behaviour This thesis
Rational Irrational Irrational Irrational
Risk-averse
always
Case 1:
Risk-averse in the gains
situations.
Risk-seeking in the loss
situations.
Most consumers are
risk-taking
Investors who use debt
are more risk-tolerant
than those who do not
Case 2:
Risk-averse after gains.
Risk-seeking after
losses
Case 3:
Risk-seeking under
circumstances
Collected by this thesis
19
Within the behavioural finance framework, many scholars argue that investors are not always
rational because inadequate information, cognitive limitations, mental short-cuts, heuristics, or
emotions can influence decision-making processes away from what may seem strictly rational,
for example (Bikas, Jurevičienė, Dubinskas, & Novickytė, 2013; Bloomfield, 2010;
Kahneman & Tversky, 1979; Ricciardi, 2008) . Investors are risk-averse in winning situations
and risk-seeking in losing situations (Chen, Kim, Nofsinger, & Rui, 2007; Kahneman &
Tversky, 1979; Rau, 2014). Importantly, investors also have a range of needs apart from
maximising monetary outcomes and, thus, they may choose a course of action to satisfy these
needs, e.g. loss avoidance instead of optimising the financial result (Barber & Odean, 2013;
Barberis & Huang, 2001; Berkelaar & Kouwenberg, 2009; Easley & Yang, 2015; Rau, 2014).
There are three cases to assess whether investors are risk-averse or risk-taking. First, investors
may be risk-seeking in winning situations and risk-averse in losing situations (Chen, Kim,
Nofsinger, & Rui, 2007; Kahneman & Tversky, 1979; Rau, 2014). Investors are averse to loss
(known as loss aversion) (e.g. Barber & Odean, 2013; Barberis & Huang, 2001; Berkelaar &
Kouwenberg, 2009; Easley & Yang, 2015; Rau, 2014) and feel more pain for a loss than
pleasure for gains. This leads them to hold a losing investment longer to avoid the loss and to
sell a gaining investment soon because they think their profit will erode. This is referred to as
a disposition effect (Chen, Kim, Nofsinger, & Rui, 2007; Kahneman & Tversky, 1979; Rau,
2014). These behaviours will be discussed in Section 2.5.
Second, investors may become risk-takers after gains and risk-averters after losses (Nofsinger,
2008; Ricciardi, 2008; Thaler & Johnson, 1990). Winners (who gained early) may take more
risk because they think their gains are not their own money (known as a house-money effect).
Losers (who lost early) may take less risk because they feel they will continue to be unlucky
(referred to as a risk-aversion effect) (Nofsinger, 2008; Thaler & Johnson, 1990).
20
Finally, some investors may be risk-taking no matter what their prior results are. That is, either
winners or losers take on more risk for the next investment. This is because losers will engage
in riskier activities in an attempt to regain losses (known as the break-even effect) so are willing
to accept a double-or-nothing toss of the coin, even when they have less than a 50% chance of
winning (Kahneman & Tversky, 1979; Nofsinger, 2008). As a result, in most circumstances,
investors are risk-taking, regardless of whether they have prior gains or losses.
Bauer (1960) states that consumer behaviour framework has approached buying choices from
a different angle, arguing that consumers are not perfectly rational because, as human beings,
consumers are often constrained from accessing data sources and limit the ability to calculate
the risks involved correctly. As a result of this assumption, consumers tend to assess risk
through their less than perfect judgement (Bauer, 1960; Peter & Tarpey Sr, 1975; Sedgwick &
Pokorny, 2010).
Most consumers are risk-taking in the sense that they are facing many kinds of risk when
buying a product (Bauer, 1960; Sedgwick & Pokorny, 2010). For example, consumers are
facing safety risk where their personal information may be leaked by hackers or viruses when
they buy online.
This thesis is open to the view about investors being irrational in decision-making to that found
by scholars of behaviour finance and consumer behaviour (e.g. Barber & Odean, 2013;
Barberis & Huang, 2001; Berkelaar & Kouwenberg, 2009; Easley & Yang, 2015; Rau, 2014;
Sedgwick & Pokorny, 2010). Moreover, this thesis argues that investors who use debt for stock
investment are prone to be more risk-tolerant than those who do not, no matter what kinds of
debt are used (formal or informal). This is because more debt, particularly higher levels of debt
means more leverage and therefore, more risk and a greater chance of insolvency if stock
investments go bad.
21
Not only do scholars of behavioural finance and consumer behaviour debate investors’
rationality and risk aversion, but they also argue the positive relationship between risk and
return inherent in the models of traditional finance.
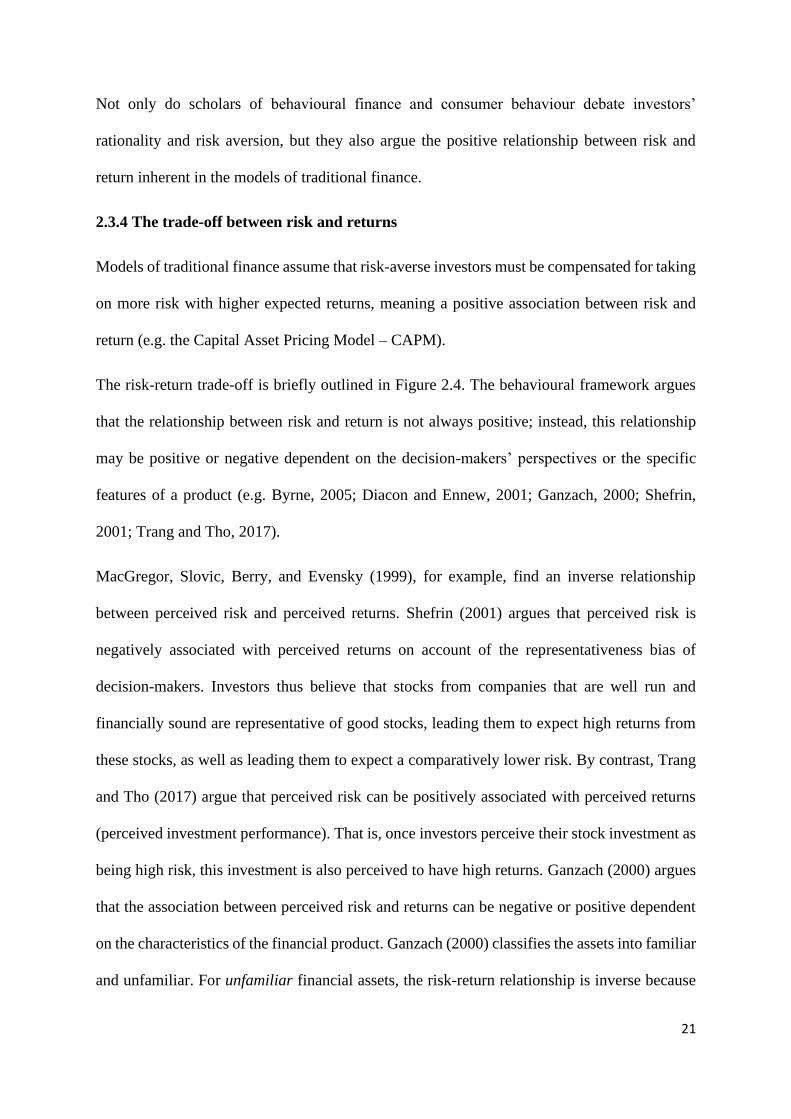
2.3.4 The trade-off between risk and returns
Models of traditional finance assume that risk-averse investors must be compensated for taking
on more risk with higher expected returns, meaning a positive association between risk and
return (e.g. the Capital Asset Pricing Model – CAPM).
The risk-return trade-off is briefly outlined in Figure 2.4. The behavioural framework argues
that the relationship between risk and return is not always positive; instead, this relationship
may be positive or negative dependent on the decision-makers’ perspectives or the specific
features of a product (e.g. Byrne, 2005; Diacon and Ennew, 2001; Ganzach, 2000; Shefrin,
2001; Trang and Tho, 2017).
MacGregor, Slovic, Berry, and Evensky (1999), for example, find an inverse relationship
between perceived risk and perceived returns. Shefrin (2001) argues that perceived risk is
negatively associated with perceived returns on account of the representativeness bias of
decision-makers. Investors thus believe that stocks from companies that are well run and
financially sound are representative of good stocks, leading them to expect high returns from
these stocks, as well as leading them to expect a comparatively lower risk. By contrast, Trang
and Tho (2017) argue that perceived risk can be positively associated with perceived returns
(perceived investment performance). That is, once investors perceive their stock investment as
being high risk, this investment is also perceived to have high returns. Ganzach (2000) argues
that the association between perceived risk and returns can be negative or positive dependent
on the characteristics of the financial product. Ganzach (2000) classifies the assets into familiar
and unfamiliar. For unfamiliar financial assets, the risk-return relationship is inverse because

22
the judgments pertain to the global preference, while for the familiar financial assets, the risk-
return association is positive because the actual values of risk and expected returns determine
this trade-off.
Figure 2.4: A summary of the perspectives of the risk-return trade-off
The relationship between risk and
returns
Traditional
finance
Behavioural
finance
Consumer behaviour This thesis
A positive risk-
return tradeoff
Positive or
negative risk-return
tradeoff
Positive or negative risk-
benefit tradeoff
Positive relationship
between risk-debt
Collected by this thesis
Peter and Tarpey Sr (1975) also argue that there is a negative relationship between perceived
risk and perceived returns among consumers. Peter and Tarpey Sr (1975) examine three models
of making decisions on brand preference. Model 1 pertains to choices of brands that minimise
loss (perceived risk). Model 2 focuses on options of the brand that maximises gain (perceived
return), and model 3 is where consumers select the brand that maximises net gains (net
perceived returns = gain minus loss). Of those, they argue that the net perceived return model
(model 3) accounts for more variance in brand preference than model 1 and 2, indicating that
consumers expect both high returns and low risk. Alhakami and Slovic (1994) investigate 40
different activities and find an inverse relationship between perceived risk and perceived
benefits. Diacon and Ennew (2001) argue that, for investments with below-average levels of
consumer distrust (e.g. banks and building society accounts), a decrease in risk (distrust) leads

23
to an increase in perceived return (benefit), showing a negative relationship between perceived
risk and returns. However, for investments with higher-than-average distrust levels (e.g., an
endowment policy or personal pension), perceived risk is positively associated with the
perceived return (benefit). Agarwal and Teas (2001) find that consumers’ performance risk and
financial risk negatively influence the perceived value of products. Byrne (2005) explores that
the relationship between perceived risk and returns is positive and that the positive risk-return
trade-off only occurs to experts, but not to novices.
As a result, some scholars (e.g. Byrne, 2005; Ganzach, 2000; Trang & Tho, 2017) find a
positive risk-return relationship, while others (e.g., Diacon & Ennew, 2001; MacGregor et al.,
1999; Shefrin, 2001) argue that the relationship between risk and return is inverse.
This thesis does not address the relationship between risk and return. Instead, it applies this
positive risk-return relationship. It is a fact that using debt effectively enhances returns through
leverage, and so, the link between debt levels and expected return is positive. This thesis
examines the relationship between perceived risk and debt decisions and finds a positive link
between perceived risk and the use of informal debt.
2.4 Trust in decision-making
2.4.1 Concepts of trust
Trust plays an important role in investor decision-making. Hardin (2006) define trust as
cognitive, not as an action or choice because “our trust in another is essentially a matter of
relevant knowledge about that other, in particular, knowledge of reasons the other has to be
trustworthy” (p. 38). Trust pertains to an encapsulated interest that refers to a notion that A
trusts B due to X. That is, A believes B has some reason to act in A’s best interest (Cook,
2001; Hardin, 2001). Cook (2001) argues that this model does not make much sense because

24
A might trust B due to X, Y but not Z. Also, it is hard to say who the B is and what the X is in
the relation “A trusts B to do X”.
Barbalet (2009) also argues that trust is often emotional rather than cognitive or rational. The
basis of trust “is the feeling of confidence in another's future actions and also confidence
concerning one’s judgment of another” (Barbalet, 2009, p. 375). Also, trust is non-transitive;
that is, when A trusts B and B trusts C, it does not mean that A trusts C; and since trust has a
central emotional factor it cannot be transitive (Barbalet, 2009). Like Barbalet (2009), Pixley
(2004) states that the future is unknowable and implications of its unknowability seem
terrifying. Thus, trust surrounding uncertainty enables decisions to be made.
Shapiro (2012) has a different view of trust. Shapiro conceptualises trust as the asymmetric
agency in which individuals or organisations (known as agents – those trusted) act on behalf
of others (known as principals - trustors). Shapiro argues that in a case of A trusts B, B holds
the position of trust regardless of whether A considers B trustworthy, feels confident about B,
or whether B encapsulates the interest of A that B serves. B here acts with disinterestedness,
full and honest disclosure, diligence, duties of care, or performance that is consistent with A’s
expectations under the circumstances.
This thesis follows Shapiro’s perspectives and investigates the extent to which investors trust
their advisors, friends (who work for securities companies), brokerage firms, and stock
exchanges when investing in stocks.
2.4.2 Trust in finance
Trust plays a vital role in social capital, for example, (Barbalet, 2009). Social capital is viewed
as “an investment that persons make in social relationships that enhance or enrich their social
resources” (Barbalet, 2009, p. 377). Trust is an essential ingredient for the success of a
securities market (Stout, 2009).

25
Within the behavioural finance framework, for example, Stout (2009) argues that investors do
not always behave in a cool, calculating, or a purely self-interested manner. Statman (2005)
also states that investors are never rational and that they are not “rational expectations
investors”. Instead, they are “trusting investors”, who readily believe that at least some people
and some organisations are trustworthy (Stout, 2009, p. 5). That is, trusting investors think that
trustees desist from exploiting their trust, even though they do not know what precludes this
exploitation (Stout, 2009).
Trust is found to be positively associated with risk-taking behaviour, for example, stock market
participation (Georgarakos & Pasini, 2011; Guiso, Sapienza, & Zingales, 2008). As with these
scholars, this thesis assumes that the relationship between trust and risk-taking behaviour is
positive, meaning a positive trust-debt association. Prospect theory and heuristics are the
foundation of behavioural finance.
2.5 Behavioural finance framework
2.5.1 Prospect theory and its concepts
Behavioural finance is descriptive and underscores why investors make decisions (Ackert,
2014). Proponents of behavioural finance (Bikas, Jurevičienė, Dubinskas, & Novickytė, 2013;
Bloomfield, 2010; Kahneman & Tversky, 1979; Ricciardi, 2008) debate that traditional
models cannot delineate investors’ actual behaviour, and that the assumptions about investors
appear unrealistic; Investors may be irrational (not always rational) or risk-taking (not always
risk-averse). They may also have inconsistent preferences, seek satisfactory choices, have
opportunities to earn abnormal returns or expect high returns with low risk; For example,
Kaniel, Liu, Saar, and Titman (2012) find that investors make abnormal returns throughout the
periods of earnings announcements. One of the well-known theories related to behavioural
finance is the prospect theory.

26
Prospect theory developed by (Kahneman & Tversky, 1979; Tversky & Kahneman, 1981)
highlights that people inconsistently make decisions; they are risk-averse in terms of gains, but
risk-taking in terms of losses. The S-shaped value function also indicates convexity in the
domain of losses and concavity in the area of gains. Importantly, the value function is steeper
for losses than for gains, meaning that pain from losses is much greater than pleasure from
gains. This behaviour is known as loss aversion (Kahneman & Tversky, 1979, p. 279); Loss
aversion also shows that people who make a loss after prior gains are less loss-averse than
those making a loss after previous losses.
2.5.2 Key concepts of prospect theory
As shown in Figure 2.5, the key concepts of prospect theory are the disposition effect, regret
aversion, mental accounting, and self-control (Brabazon, 2000; Strahilevitz, Odean, & Barber,
2011; Waweru, Munyoki, & Uliana, 2008).
Figure 2.5: A summary of the key concepts of Prospect theory
Key concepts of Prospect
theory
Disposition
effect
Regret aversion Mental accounting Self-control
Collected by this thesis
The disposition effect defined by Shefrin & Statman (1985) as situations where investors tend
to sell winning stocks (winners) too soon and hold onto losing stocks (losers) too long. Odean
(1998) states that investors are reluctant to realise losses but quick to realise gains. Winning
stocks sold too soon implies that these stocks continue to perform well after being sold. Losing
stocks held too long suggests that these stocks continue to perform poorly, for example, (Chen,

27
Kim, Nofsinger, & Rui, 2007; Kahneman & Tversky, 1979; Nofsinger, 2008; Rau, 2014;
Shefrin & Statman, 1985). Nofsinger (2008) states that one of the reasons to explain the
disposition effect is tax issues in countries where there is a capital gains tax on equities. If
stocks are sold for a profit, tax on the capital gains must be paid, thus decreasing the amount
of the gain. In contrast, if stocks are sold for losses, these losses give opportunities to reduce
taxes, hence decreasing the amount of the loss.
The regret aversion effect is defined as “an emotional feeling associated with the ex-post
knowledge that a different past decision would have fared better than the one chosen” (Shefrin
& Statman, 1985, p. 781). Regret aversion is described as a “painful cognitive and emotional
state of feeling sorry for misfortunes, limitations, losses, transgressions, shortcomings or
mistakes” (Landman, 1993, p. 36). Regret differs from pride: regret is the pain of realising that
prior decisions become bad ones, whereas pride is the joy of realising that prior decisions
become good ones. People often seek actions that bring pride for them and avoid actions that
bring them regret (Nofsinger, 2008). Investors fear regret and seek pride results in the
disposition effect; they sell winning stocks too soon and hold onto losing stocks too long (Chen,
Kim, Nofsinger, & Rui, 2007; Kahneman & Tversky, 1979; Rau, 2014). Also, investors face
greater regret about holding onto a losing stock too long than about selling a winning stock too
soon (Fogel & Berry, 2006; Shefrin & Statman, 1985); As a result, regret is an element in the
disposition effect because the pain associated with the realisation of loss is greater than the
pride associated with the realisation of gains. The third behaviour with respect to prospect
theory is mental accounting.
Mental accounting is defined as “the set of cognitive operations used by individuals and
households to organize, evaluate, and keep track of financial activities” (Thaler, 1999, p. 183).
Mental accounting is also viewed as a process by which people code, classify, and evaluate
outcomes by gathering their money into non-interchangeable mental accounts (Pompian,

28
2012a). Mental accounting provides a better understanding of the psychology of choice because
“mental accounting rules are not neutral” (Thaler, 1999, p. 185). According to the expected
utility theory, money is fungible, while researchers of behavioural finance contend that money
is non-fungible in one mental account and is not well replaced by money in another account
(Barberis, & Huang, 2001; Pompian, 2012a; Thaler, 1999); for example, money for a vacation
is not a good substitute for money for bills (Pompian, 2012a). The potentially serious problem
is that mental accounting may predispose investors to treat stocks in a portfolio separately, or
they construct portfolios regardless of the correlations among these stocks, leading to
suboptimal overall outcomes (Pompian, 2012b). Mental accounts, e.g. retirement accounts, are
useful for investors who have good self-control because self-control reminds them to avoid
overspending at the point of payment (Nofsinger, 2008).
Lastly, self-control is defined as “the human behavioural tendency that causes people to
consume today at the expense of saving for tomorrow” (Pompian, 2012b, p. 211). Everyone is
assumed to be “both a farsighted planner and a myopic doer”, which leads to internal conflict
as the planner suggests saving money for the future while the doer would like to consume
money today (Thaler & Shefrin, 1981, p. 392). The conflict is that one is concerned with long-
term goals, e.g. saving for retirement (the planner), and the other is interested in short-term
satisfaction, e.g. shopping (the doer) (Barberis & Huang, 2001; Pompian, 2012b; Thaler &
Shefrin, 1981). This phenomenon contradicts the traditional finance of optimal saving decision
under risk, whereby income risk (uncertainty about future non-capital income) increases
current saving (Barberis & Huang, 2001; Menezes & Auten, 1978). This conflict is similar to
the agency conflict between the owners and managers of a firm. Both individuals and firms
attempt to preclude these conflicts. People often fail to pursue their long-term goals because
they prefer spending today over saving for tomorrow, or they have a strong desire and weak
willpower, indicating a lack of planning or lack of self-control (Heidhues & Kőszegi, 2010;

29
Lusardi, 1999). Investors who are biased against self-control often prefer investing in stocks to
investing in bonds, or they lack basic financial knowledge such as compounding of interest.
For instance, the majority wish to have $50 immediately instead of receiving $100 in two-year
time, even given the 41% annual return (Nofsinger, 2008, p. 98).
2.5.3 Heuristic and its concepts
Scholars of behavioural finance also argue that not only is a decision to be made based on the
key concepts of prospect theory, but investors also make decisions based on rules of thumb,
which is known as heuristics.
Simon (1978), a founder of the theory of bounded rationality, argues that people would like to
make rational decisions, but they are restricted by available information and by limited ability.
This means that, in many circumstances, people make decisions which are satisfactory rather
than optimal. Tversky and Kahneman (1974) argue that, when faced with risky or uncertain
situations, decision-makers use rules of thumb known as heuristics to solve problems.
Heuristics are useful for decision-makers, attaining good outcomes (Todd & Gigerenzer, 2003),
but sometimes resulting in suboptimal outcomes or systematic errors (Huberman, 2001;
Tversky & Kahneman, 1974).
2.5.4 The concepts of heuristics
Five key heuristics concepts; representativeness, overconfidence, gambler’s fallacy, anchoring,
and availability are summarised in Figure 2.6.

30
Figure 2.6: A summary of the key concepts of heuristics
Key concepts of
heuristics
Representativeness
Overconfidence Gambler’s fallacy Anchoring Availability
Collected by this thesis
Representativeness is defined by Kahneman & Tversky (1972) as an assessment of an uncertain
event by inferring from (i) the similarity of this event to its parent population and (ii) the
outcomes of this event generated at random. People assess a sample according to the degree to
which this sample is similar to the entire sample (standard); e.g., a librarian is assessed based
on the degree to which they resemble the prototypical librarian (Gilovich, 1991). This
judgement is helpful because it shares a resemblance. However, if we over-apply this judgment,
we encounter difficulty because all things are not always equal; e.g., not all librarians are
always the prototypical librarian (Gilovich, 1991). Moreover, people evaluate uncertain action
by generating the random outcomes of this action (Kahneman & Tversky, 1972). A key feature
of apparent randomness is the lack of systematic patterns; therefore, irregularity and local
representativeness are considered as two general properties for randomness (Kahneman &
Tversky, 1972). Irregularity indicates that an uncertain event fails to reflect the randomness.
For example, consider the sequence outcomes in a fair coin flipping (heads and tails). If the
outcomes are H T H T H T H T or T T H H T T H H, these outcomes are not viewed as
representative of a random generating process because their order is too perfect (Kahneman &
Tversky, 1972). Local representativeness assumes that small samples are representative of
large samples (Kahneman & Tversky, 1972). This assumption causes people to display bias in
decision-making because short-term behaviour is taken to be indicative of long-term trends.

31
For instance, when equity returns have been high for many years (from 1982 to 2000 in the US
and Western Europe), investors believe high equity returns are common (e.g. Chen, Kim,
Nofsinger, & Rui, 2007; Ritter, 2003). Investors also buy only hot shares and avoid shares with
poor performance, or define good shares as the shares whose firms have good past earnings
growth (e.g. Chen, Kim, Nofsinger, & Rui, 2007; De Bondt & Thaler, 1995; Phung, 2015).
Overconfidence is defined as “overestimation of one’s actual performance, over-placement of
one’s performance relative to others, and excessive precision in one’s beliefs” (Moore & Healy,
2008, p. 502). Overconfident people believe their knowledge is greater than it actually is, or
their information is more precise than it is (Barber & Odean, 2001; Merkle, 2017; Odean,
1998). Overconfident investors believe their knowledge or investment skills are above average
(Dorn & Huberman, 2005; Glaser & Weber, 2007; Odean, 1999). They trade excessively;
importantly, men tend to be more overconfident and, consequently, are more likely to trade
than women and earn lower returns than women (Barber & Odean, 2000). They also
underestimate risks, overestimate expected returns, hold undiversified stock portfolios
(Pompian, 2012a), and have suboptimal outcomes (Barber & Odean, 2013) or poor investment
results (Pompian, 2012a). This behaviour appears difficult to correct because people find it
hard to “revise self-perception of their knowledge and abilities” (Pompian, 2012a, p. 45).
Gambler’s fallacy (also known as Monte Carlo fallacy or the fallacy of the maturity of chances)
is defined by Lepley (1963) as the belief that, if a random event repeatedly occurs on one
direction during a certain period, then the event will subsequently move repeatedly in the
opposite direction in the future to ensure that randomness is evened out. The law of small
numbers boasts the belief in gambler’s fallacy; for example, if a fair coin has five heads in a
row, people believe that tails will come up because more tails might arise to offset against a
large number of heads (Barberis & Thaler, 2003). This belief is false because they have a
misperception of the fairness of the law of chances, in which the probability of random events

32
is independent (Barberis & Thaler, 2003; Tversky & Kahneman, 1971). Investors affected by
gambler’s fallacy incorrectly predict a reverse trend of stock prices (Brabazon, 2000). They
believe that, if shares have traded a large number of times, these shares will trade less in the
next time period; if shares have not been traded for a long time, these shares will trade in this
time period; if they have not earned returns for several trades, they will gain for the next trades
(Luong & Ha, 2011; Ngoc, 2014; Phung, 2015).
Anchoring is defined as people relying too heavily on initial pieces of information to make
subsequent decisions (Tversky & Kahneman, 1975). People often “anchor too much on the
initial value” (Barberis & Thaler, 2003, p. 1068). People often take account of a reference point
as the anchor, then predict the outcomes according to this adjusted anchor. Investors make
decisions based on their purchase prices as reference points (Kahneman & Riepe, 1998). This
phenomenon causes investors to expect changes in current stock prices to be consistent with
their historical trends, and to anticipate future share prices to relate closely to the initial values
(the anchor); as a result, suboptimal outcomes ensue (Brabazon, 2000; Kahneman & Riepe,
1998; Pompian, 2012a).
Finally, availability is defined as arising in situations in which “people assess the frequency of
a class or the probability of an event by the ease with which instances or occurrences can be
brought to mind” (Tversky & Kahneman, 1975, p. 1127). People are often biased by
availability because they find it easy to recall frequent situations (Tversky & Kahneman, 1973).
Pompian (2006) classified availability into four facets: (a) Retrievability, where people tend to
select investments with available information; (b) categorisation, where investors attempt to
categorise information that suits a specific reference; (c) the narrow range of experience, where
investors select investments that match their narrow range of life experiences, the regions they
live in, and the people they contact; and (d) resonance, where investors choose investments that
are similar to their personality or have characteristics related to their behaviour.

33
Vietnamese investors are the respondents of this thesis. It is essential, therefore, to review
current studies on the effect of behavioural finance on investment decisions in Vietnam.
2.6 Recent research on investors’ behavioural biases in Vietnam
The literature on investor behaviour in Vietnam is small in volume. Phan and Zhou (2014)
interview 20 retail investors to find that 4 behaviour biases affect investment intentions;
overconfidence, excessive optimism, the psychology of risk, and herd behaviour. The results
indicate 4 key investor attributes.
First, overconfidence: 60% of informants exhibit overconfidence. They strongly believe in their
abilities in regard to investment regardless of their participation in any training courses on stock
investment. They also believe that they have better abilities in investment than others, that they
are in full control of their investment, and that their successful investment emanates from their
knowledge. Interestingly, 100% of informants believe that they genuinely understand the
Vietnamese stock market. Second, excessive optimism: 70% of informants reveal excessive
optimism about; (a) continuing to purchase stocks, even when the market has a downward
trend, (b) increasing their investment capital in the next year, and (c) that the Vietnamese stock
market would rebound in the next year. Third, the psychology of risk: 45% of investors prefer
a period of price fluctuations because they believe that they will earn high returns from these
fluctuations. Sixty per cent of them readily hold the losing stocks longer until their prices go
up and invest in firms that are familiar to them or firms that pay cash dividends. Lastly, herd
behaviour: Sixty per cent of investors make decisions based on the ideas of others, the crowd,
or the movements of the digital stock board.
Ngoc (2014) surveys 188 individual investors and discovers that investors are biased in
decision-making. The behaviour biases include herding, overconfidence-gamblers’ fallacy, and
anchoring-ability biases affecting investment decisions. Ton and Dao (2014) survey 422
34
investors and find that excessive optimism, risk psychology, and excessive pessimism
positively influence long-term investments. In contrast, overconfidence and herd behaviour
negatively impact on long-term investments. Cuong and Jian (2014) survey 472 retail investors,
40.5% of which were female, and find that overconfidence, excessive optimism, the
psychology of risk, and herd behaviour have a significant impact on the individuals’ attitude
towards investment. The authors, interestingly, do not observe higher overconfidence among
male investors than among female investors. Phung (2015) conducts in-depth interviews and a
survey of 220 individual investors, and finds that representativeness and over/under-reaction
positively, and gambler’s fallacy negatively, affected investment decisions.
Nguyen and Pham (2018) investigate the relationship between search-based sentiment and
stock market reactions in the Vietnam stock market. The sentiment index is established from
the Google Trends’ Search Volume Index of financial and economic terms Vietnamese search
from January 2011 to January 2018. The authors find that the sentiment-induced impact is
mostly driven by pessimism, and optimistic investors appear to postpone investment until the
market corrects. Tho, Trang, and Van Hoa (2018) construct research scales to distinguish risk
avoidance, ambiguity avoidance and uncertainty avoidance and then survey 400 investors. The
results show that investors are most likely to avoid; ranked in descending order; uncertainty,
ambiguity and risk, and female investors are more likely to avoid these situations than men.
An increase in participation in investment courses leads to a rise in avoidance of risk, ambiguity
and uncertainty, and to choosing safer investments.
2.7 Summary
This chapter has examined the theoretical background of this thesis relating to finance theory
and to consumer behaviour. Scholars have, however, opposing views amongst the framework
of traditional finance, behavioural finance, and consumer behaviour. This thesis largely focuses

35
on investors’ decision-making in the context of traditional finance, behavioural finance,
consumer behaviour. This thesis presents current literature on investors’ perceived risk, the
relationship between risk and return, investors’ rationality and risk aversion, the trade-off
between risk and return, and investors’ trust in decision-making. This thesis also focuses on
prospect theory, heuristics and current research of investors’ behavioural biases in Vietnam.
The main tenets of this thesis are summarised as follows. First, investors can choose both
informal and formal debt for stock investment. Second, a decision to be made is affected by
many facets of risk, including financial risk, safety risk, social risk opportunity risk, time risk,
choice risk, and leverage risk. Third, investors who use debt are more prone to risk-tolerant
than those who do not. Lastly, the relationship between risk and debt is positive.

36
Chapter 3 Methodology
Introduction to this chapter
Structural equation modelling (SEM) is the main method applied to this thesis because SEM is
the most useful technique for examining the direct and indirect relationships of multiple
variables in a model concurrently. This chapter starts with an introduction to the structural
equation modelling technique. The focus of SEM is on the importance of SEM, SEM structure,
estimated relationship values, measurement error, and model fit. The following sections discuss
the sample size, survey process, and the robustness checks. Additional techniques employed to
examine the robustness of the results by SEMs are multiple and stepwise regression, Hayes and
Preacher’s approach, a t-test method, the propensity score matching method, and the
instrumental variables (IVs) approach. Solutions to locations selection bias and response bias
are also presented in the robustness check section. This chapter also presents investors’
characteristics, debt decisions, control variables, and ends with a summary.
3.1 Structural equation model (SEM)
3.1.1 The importance of SEM in testing the relationships between variables
As defined by Hair, Black, Babin, and Anderson (2014), structural equation modelling is “a
family of statistical models that seek to explain the relationships among multiple variables”
(p.546).
The SEM technique can examine mediating relationships between variables. “Mediating
variables” are “prominent in psychological theory and research”, and their role is to transmit
the impact of an independent variable on a dependent variable (MacKinnon, Fairchild, & Fritz,
2007, p. 593). The mediating variable is also referred to as the mediator variable, intermediary
variable, or intervening variable.

37
SEM is useful in testing theories that have multiple equations, with the multiple variables acting
as independent and dependent variables, as shown in Figure 3.1. These theories are based on
the perspectives arising from prior empirical studies, experience, and observations of actual
behaviour or attitudes. In other words, an SEM model is a representation of a theory that
provides a consistent and comprehensive explanation of phenomena, benefiting both academia
and industry. The notable point is that SEM can be used for all kinds of variants such as
nonmetric, categorical variables, and even a MONOVA model (Hair et al., 2014).
Hair et al. (2014) illustrate an example where SEM can examine the variable of satisfaction
acting as both independent and dependent variables in a model including the image,
satisfaction, and loyalty of customers:
If we believe that image creates satisfaction and satisfaction creates loyalty, then
satisfaction is both a dependent and an independent variable in the same theory
(p.542).
SEM has two distinctive advantages compared to other techniques, such as multiple regression.
First, SEM can assist researchers in testing the covariance among factors and, in particular, the
factors operating as both a(n) independent and dependent variable. Second, SEM directly
accommodates measurement errors in predicting the impacts of the independent variables in
any particular dependence association.
MacKinnon et al. (2007) state that “mediating variables” are “prominent in psychological
theory and research” (p.593). Their role is to transmit the impact of an independent variable on
a dependent variable; the mediating variable also has other names such as mediator variable,
intermediary variable, or intervening variable.

38
Figure 3.1: Structural equations modelling overview
Source: (Hair et al., 2014)
3.1.2 SEM structure
SEM overall has three advantages, for example, (Hair et al., 2014). These are; (i) an ability to
estimate multiple and interrelated dependence relationships, (ii) an ability to represent
unobserved concepts in these relationships and account for measurement errors in the
estimation process, and (iii) an ability to define a model to explain the entire set of relationships.
SEM consists of two essential components; the measurement model, and the structural model.
The former indicates how measured variables come together to represent constructs. The latter
reveals how constructs are associated with each other, often with multiple dependence
relationships. Note that multiple regression is not applicable in this model on account of a
separate analysis in a model.
A single SEM model mostly contains both correlational (or covariance) relationships and
dependence relationships among exogenous and endogenous variables. Exogenous constructs
are seen as independent variables and determined by factors outside of the model. Endogenous
constructs are dependent variables and affected by elements within the model.
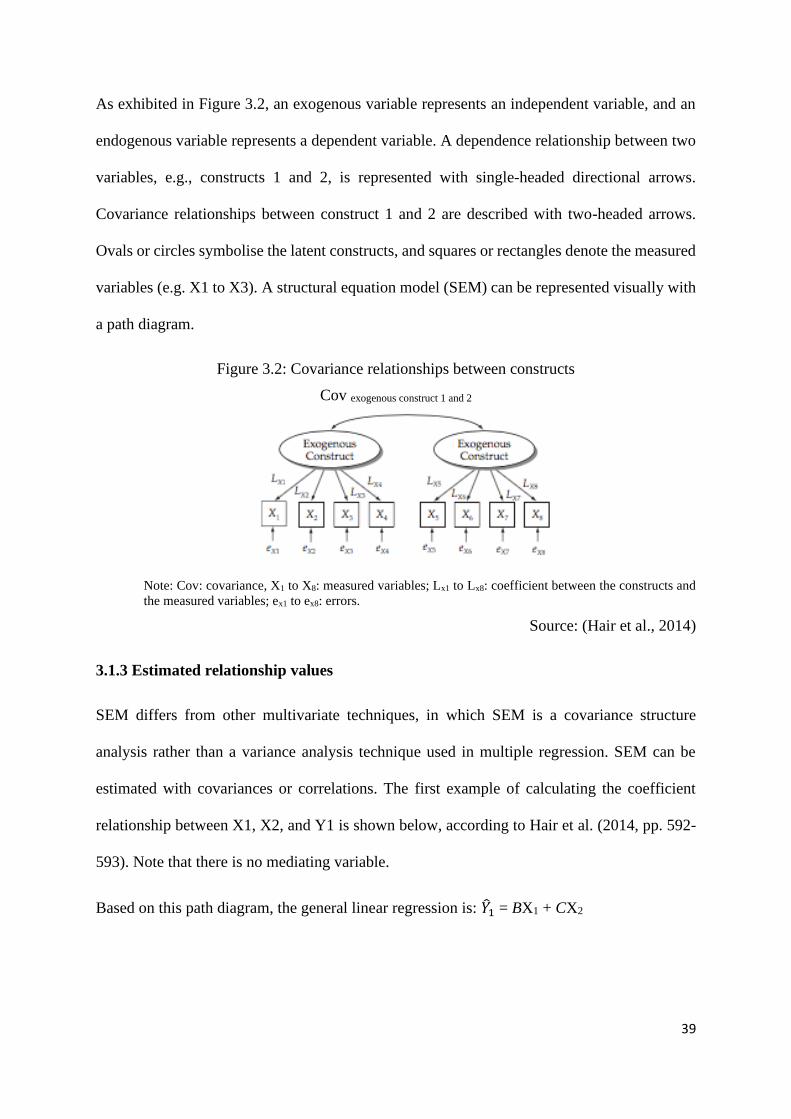
39
As exhibited in Figure 3.2, an exogenous variable represents an independent variable, and an
endogenous variable represents a dependent variable. A dependence relationship between two
variables, e.g., constructs 1 and 2, is represented with single-headed directional arrows.
Covariance relationships between construct 1 and 2 are described with two-headed arrows.
Ovals or circles symbolise the latent constructs, and squares or rectangles denote the measured
variables (e.g. X1 to X3). A structural equation model (SEM) can be represented visually with
a path diagram.
Figure 3.2: Covariance relationships between constructs
Cov exogenous construct 1 and 2
Note: Cov: covariance, X1 to X8: measured variables; Lx1 to Lx8: coefficient between the constructs and
the measured variables; ex1 to ex8: errors.
Source: (Hair et al., 2014)
3.1.3 Estimated relationship values
SEM differs from other multivariate techniques, in which SEM is a covariance structure
analysis rather than a variance analysis technique used in multiple regression. SEM can be
estimated with covariances or correlations. The first example of calculating the coefficient
relationship between X1, X2, and Y1 is shown below, according to Hair et al. (2014, pp. 592-
593). Note that there is no mediating variable.
Based on this path diagram, the general linear regression is: �̂�1 = BX1 + CX2

40
The estimated covariance matrix between X1, X2, and Y1 is indicated below:
Direct paths: Indirect paths: Total path: The estimated correlation
X1->X2 = A X1 -> X2 = A CorrX1,X2 = A
X1 -> Y1 = B X1 ->X2 -> Y1 = AC X1 -> Y1 = B + AC CorrX1,Y1 = B + AC
X2 -> Y1 = C X2 -> X1-> Y1 = AB X2 -> Y1 = C + AB CorrX2,Y1 = C + AB
The table of Bivariate Correlations also shows the correlation value of 0.5 for X1 and X2, 0.6
for X1 and Y1, and 0.7 for X2 and Y1. This means that:
0.5 = A
0.6 = B + AC
0.7 = C + AB
Substituting A = 0.5:
0.6 = B + 0.5C
0.7 = C + 0.5 B
Solving for B and C:
B = 0.33
C = 0.53
As a consequence, the equation indicates the coefficient regression relationship between X1,
X2 and Y1:
Y1̂ = 0.33 X1 + 0.53 X2

41
The second example is illustrated for the estimated values for direct and indirect impact (Hair
et al., 2014, p. 563). Note that Job Satisfaction is a mediating variable.
There are three equations. Equation 1 shows a direct impact of Supervision, Work
Environment, and Co-workers on Job Satisfaction. Equation 2 indicates a direct influence of
Job Satisfaction on Job Search. Equation 3 inhibits an indirect effect of Supervision, Work
Environment, and Co-workers on Job Search through Job Satisfaction.
�̂�Job Satisfaction = β1 (Supervision) + β1 (Work Environment) + β1 (Co-workers) (1)
�̂�Job Search = π1 (Job Satisfaction) (2)
�̂�𝐽𝑜𝑏 𝑆𝑒𝑎𝑟𝑐ℎ = α1 (Supervision) + ∞2 (Work Environment) + α3 (Co-workers) (3)
First, an equation indicates a direct impact of supervision, work environment and co-workers
on job satisfaction:
�̂�Job Satisfaction = 0.065 (Supervision) + 0.219 (Work Environment) + 0.454 (Co-workers) (1’)
Second, an equation reveals a direct effect of job satisfaction on job search:
�̂�Job Search = 0.5 (Job Satisfaction) (2’)

42
Replacing equation (1’) into equation (2’), we get equation (3’), showing an impact of
supervision, work environment, and co-workers on job search through job satisfaction:
�̂�Job Search = 0.5 [0.065 (Supervision) + 0.219 (Work Environment) + 0.454 (Co-workers)]
�̂�Job Search = 0.0325 (Supervision) + 0.1095 (Work Environment) + 0.227 (Co-workers) (3’)
3.1.4 Measurement error
One of the problems with multiple regression is that although measurement errors can emanate
from many sources, there are “no direct means of correcting for known levels of measurement
error for the dependent or independent variables” (Hair et al., 2014, p. 168). In contrast, SEM
(or summated scales) can address measurement errors.
Measurement error is defined as the extent to which the observed values are not representative
of the true values (Hair et al., 2014, p. 7). Measurement error is inversely related to reliability
- a measure of the degree to which a set of the measured variables of a latent construct is
internally consistent based on how highly interrelated the items are with each other. The greater
the relationship between a construct and the measured variables, the lower the measurement
errors are. The effect of measurement error can be written as:
y,x = t * x
where: y,x: the observed regression coefficient, t: the true structural coefficient, x: the reliability of the predictor
variable.
SEM makes an estimate of the actual structural coefficient (t) rather than the observed
regression coefficient (y,x). The reliability value (x) is in the range of -1 through +1, reaching
1 when it is perfect, meaning that there is no measurement error. If x < |1|, y,x < t, it is
indicated that the relationships estimated with typical multivariate procedures will understate
the actual links. Therefore, the coefficient regression relationship predicted by SEM exceeds
those by regression techniques with single equations.

43
3.1.5 A model fit
SPSS, AMOS and STATA software were applied to test the direct and indirect relationship
between variables. Unlike the regression analysis or other dependence techniques that seek to
explain relationships in a single equation, an SEM model tests a set of relationships
representing multiple relationships. As SEM focuses on the entire model, a measure of fit
reflects the overall model, not any single relationship. As a result, measures of fit, e.g., R2 for
multiple regression, are not well suited for SEM. SEM uses a series of measures that describe
how well a theory explains the input data. Model fit is determined by the correspondence
between the observed covariance matrix and an estimated covariance matrix that results from
the proposed model.
A model is assessed as fit if it fulfils the following criteria by Hair et al. (2014, p. 584), as
shown in Figure 3.3. For example, Chi-square # 0, degree of freedom #0, Goodness-of-fit index
(GFI), Comparative fit index (CFI), Tucker-Lewis index (TLI) >0.95, RMSEA<0.07.
Figure 3.3: Fit Indices Demonstrating Goodness-of-Fit Across Different Model Situations
No. of Stat.
vars. (m)
N<250 N>250
m≤12 12<m<30 m≥30 m<12 12<m<30 m≥30
X2 Insignificant
p-values
expected
Significant
p-values
even
with good
fit
Significant
p-values
expected
Insignificant
p-values
even with
good fit
Significant
p-values
expected
Significant
p-values
expected
CFI or TLI 0.97 or better 0.95 or
better
Above 0.92 0.95 or
better
Above 0.92 Above
0.90
RNI May not
diagnose
misspecification
well
0.95 or
better
Above 0.92 0.95 or
better, not
used with
N > 1,000
Above
0.92, not
used with
N > 1,000
Above
0.90, not
used with
N > 1,000
SRMR Biased upward,
use other
indices
0.08 or less
(with CFI
of 0.95 or
higher
Less than
0.09 (with
CFI above
0.92)
Biased
upward; use
other
indices
0.08 or less
(with CFI
above 0.92)
0.08 or less
(with CFI
above 0.92)
RMSEA Values < 0.08
with CFI = 0.97
or higher
Values <
0.08 with
CFI of 0.95
or high
Values <
0.08 with
CFI above
0.92
Values <
0.07 with
CFI of 0.97
or higher
Values <
0.07 with
CFI of 0.92
or higher
Values <
0.07 with
CFI of 0.90
or higher
Note m = number of observed variables; N applies to a number of observations.
X2: Chi-square, CFI: Comparative fit index, TLI: Tucker-Lewis index, RNI: Relative non-centrality index,
SRMR: Standardised root mean residual, RMSEA: Root mean square error of approximation.
Source: (Hair et al., 2014)

44
3.2 Sample size
The sample size of this study is computed based on the following studies. First, according to
Hair et al. (2014), the minimum ratio of observations to variables is 5:1, but the preferred ratio
is 15:1 or 20:1 (p.177). With 10 variables in a model, the sample size required is 200 (20:1).
Second, Krejcie and Morgan (1970) propose the sample size computed via the formula:
s = X2 NP (1 – P) ÷ d2 (N −1) + X2 P (1 – P)
where:
s = required sample size.
X2 = the table value of chi-square for 1 degree of freedom at the desired confidence level (3.841).
N = the population size.
P = the population proportion (assumed to be .50 since this would provide the maximum sample size); and
d = the degree of accuracy expressed as a proportion (.05).
The number of individual investors trading on the Vietnamese stock market is approximately
1.5 million (Baomoi, 2016). The sample size required is s = (3.841 x 1,500,000 x 0.5(1-0.5)/
{0.05x0.05(1,500, 000 -1) + 3.841x0.5(1-0.5) = 384 respondents.
Third, Zikmund, Babin, Carr, and Griffin (2013) recommend the sample size calculated with
the formula:
where:
n: number of items in the sample.
Zc.l.2: square of the confidence level in standard error units.
p: the estimated proportion of success.
q: (q= 1-p), or estimated proportion of failures; and
E2: square of the maximum allowance for error between the true proportion and the sample proportion, Zc.l.Sp
squared.
At the 95% confidence level (Zc.l.2 = 95%), the 85% estimated proportion of success, the sample
size required is: n= (1.96)2 *0.85*0.15/ (0.035)2 = 400 respondents.

45
Overall, the sample size of this thesis (420 observation) fulfils the guidelines of these studies.
3.3 Survey process
This research was undertaken through five phases over two years (9/2017 - 9/2019), as shown
in Figure 3.4.
Figure 3.4: A summary of research phases
1 month
(9/2017)
11 months
(10/2017 - 8/2018)
3 months
(9 - 11/2018)
4 months
(12/2018 - 3/2019)
5 months
(4 - 8/2019)
Collected by this thesis
3.3.1 Trial interviews
For the first stage, this thesis conducts trial interviews with ten investors, with half having less
than three years, and half having three years or more, experience. This is because the majority
are young and have less than three years of investment experience, which is consistent with
prior studies (e.g. Tho et al., 2018; Trang & Khuong, 2017). This phase lasts one month;
September 2017. For example, investors were asked the following questions:
1/ Do you often borrow money to invest in stocks?
2/ If yes, what kinds of debt do you generally use for stock investment?
3/ Could you give me some reasons why you use this kind of debt?
4/ What facets of risk are you generally concerned with as investing in stocks?
5/ Do you often invest in stocks for the short term (less than 1 year)?
6/ Do you trust the stock market in general?
7/ Who and what do you often trust regarding stock investment?
The trial interviews aim to discover whether they often borrow money from informal lenders
and formal lenders for stock investment. The reasons for the use of debt are presented in Section
Phase 1:
Trial
interviews
Phase 2:
Questionnaire
design
Phase 3:
A pilot test
Phase 4:
Ethics
approval
Phase 5:
Final surveys

46
3.6.3. Interviewees were found to be mainly concerned about financial loss, personal
information safety due to trading online, time wastage, social standing, opportunity loss, debt
problems, and making the wrong decisions. They also invest in stocks for the short term (less
than one year) and highly trust the stock market in general.
3.3.2 Questionnaire design
The second stage relates to the questionnaire design. Based on the trial interviews and
literature, the scales were developed, including perceived risk, borrowing sources, trust, trading
frequency, risk tolerance, investment horizons, and debt decisions. This thesis also invited
New Zealanders (native English speakers) to assess how understandable and straightforward
the questionnaire was with the aim of ensuring the quality of questions in terms of readability
and understandability. After receiving feedback from these readers, the questionnaire was
translated into Vietnamese and re-examined by a senior lecturer at Massey University, whose
nationality is Vietnamese. This phase spanned 11 months, from October 2017 through August
2018.
3.3.3 A pilot test
The third stage is the pilot test undertaken in Vietnam. Five Vietnamese individual investors
first re-examined the questionnaire to ensure that questions were readable and understandable.
Then the questionnaire was sent to 25 Vietnamese individual investors. The main feedback was
that mutual funds do not apply to the Vietnam stock market. Alternatively, mutual funds should
be changed to fund certificates. This phase was finished in three months, from September
through November 2018.
3.3.4 Human ethics approval
The fourth stage pertains to the Human Ethics approval for the questionnaire. After corrections
were made based on the feedback, the questionnaire was submitted to the Massey University

47
Human Ethics Committee in order to ensure the project met the University’s standards on
research ethics. The assessment process lasted four months (from December 2018 through
March 2019). The human ethics approval was granted with notification SOB 19/07 on 21
March 2019.
3.3.5 A final survey
Finally, after receiving the ethics approval, the questionnaire was distributed to 600 individual
investors through many instruments: Qualtrics Massey survey; social media, Facebook and
Zalo; emails; workshops; and paper-based survey. This elicited 420 responses, being a 70%
response rate. The data collection was carried out in two stages; first, the questionnaire was
sent to 200 investors from which were collected 145 responses. After that, the questionnaire
was distributed to a further 400 investors from which were received 275 responses. The survey
process lasted 5 months. Due to the fact that participants must be individual investors, the
sample should be defined as a snowball sample. Data collection was supported by friends,
colleagues, acquaintances, and workshops on stock investment8 through recommendations
from brokerage firms. These brokerage firms are RongViet, Maybank, Military Bank (MB),
VnDirect, Asia Commercial Bank (ACB), Sacombank, Vietcombank, and DongA Securities
Corporation. The survey lasted 5 months from April through August 2019. Respondents’
locations are presented in the robustness check in Sections 3.4.4 and 3.4.5.
3.4 Robustness check
This thesis applies other techniques to test the robustness of the results found by SEM models.
First, alternative measures for the main variables strengthen the significant relationship by
SEMs. Second, multiple regression and stepwise regression are applied to re-test the direct
8 The workshops of stock investment were organised by Maybank: https://maybank-
kimeng.com.vn/kimengportal/

48
relationships, and Hayes and Preacher’s approach used to re-examine the indirect relationships
using SEMs. Third, a t-test and then the propensity matching score are applied to reduce the
selection bias. Fourth, the instrumental variables (IVs) approach is applied to deal with the
endogeneity issue. Lastly, solutions are suggested for locations and response biases. This
chapter outlines the Hayes and Preacher’s approach, the causality analysis in the SEM method,
propensity matching score, the IVs approach, and solutions to the locations and response
biases.
3.4.1 The Hayes and Preacher’s approach
This approach is developed by Hayes (2017) and Hayes and Preacher (2010) to examine the
direct and indirect relationships between variables. This approach is widely used and cited by
many scholars of marketing. However, this approach only tests a relationship between one
independent and one dependent variable in a model. This differs from the SEM technique, in
which multiple independent and dependent variables can be tested in a model.
Hayes and Preacher’s approach presents a cause-effect relationship with the lower-level
confidence interval (LLCI) and upper-level confidence interval (ULCI). The smaller
confidence intervals indicate “greater predictive accuracy” (Hair et al., 2014, p. 161). A
relationship is assessed as significant (p<0.1) if zero is not included between LLCI and ULCI
(Hair et al., 2014, p. 189). A typical model illustrated below includes an independent variable
denoted as X, a mediating variable as M, and a dependent variable as Y.

49
3.4.2 Causality analysis in the SEM method
Causation refers to the cause and effect between two variables, in which one variable must
arise before the other and be the outcome of the other. A causal relationship can be created
through strong theoretical support.
Causal research designs traditionally comprise an experiment with some controlled
manipulation. SEM, however, is often used in non-experimental conditions, leading to some
limitations on drawing causal inferences. It is noted that SEM alone cannot generate causality,
but can make a causal relationship if it conforms to the following conditions (Hair et al., 2014;
Hunt, 2002; Pearl, 1998):
(i) Covariation: As presented above, SEM can determine systematically and statistically
significant covariation between constructs. Estimated paths in the structure SEM model
provide evidence that covariance is present.
(ii) Sequence: A sequence in the causation of two variables indicates that one variable must
occur before the other. For example, entertain the idea that many dominos are standing in a
row and a ball hitting the first domino makes the other dominos fall. As a result, if this ball is
the cause of this effect, the ball must hit the first domino before the others drop. An experiment
or longitudinal data can provide the evidence of sequence because they can account for the
time period in which events arise. However, with the cross-sectional survey, since all variables
are measured at the same point in time, they cannot explain the time sequence. Consequently,
theoretical arguments must be used to contend that the sequence of an impact is from one
construct to another.
(iii) Nonspurious covariance: A spurious relationship refers to a connection between two
factors that seem causal but is actually not. This spuriousness is affected by another factor that
is not included in a model. For instance, although a correlation between ice cream consumption

50
and the levels of drowning is statistically significant, it is implausible to say that eating ice-
cream causes drowning. Another factor may be the temperature, e.g., high temperatures cause
high levels of consumption of ice-cream or more swimming. A structural relationship is
deemed as nonspurious if; (i) this relationship remains significant no matter how many other
constructs are added in the model, and (ii) the construct’s error is independent of the causal
construct (Hair et al., 2014, p. 557).
(iv) Theoretical support: SEM can test and analyse the correlations between variables but
cannot decide which variable is a cause or an effect. This is because, as shown above, all factors
in an SEM model are measured in the same period. Theoretical support, therefore, plays a vital
role with cross-sectional data, establishing a causal ordering and a rationale for the observed
covariance.
In summary, SEM can provide evidence of systematic covariation and help in understanding
that a relationship is not spurious. However, SEM cannot establish a causal inference alone and
can only do so if SEM meets the four conditions already mentioned.
3.4.3 T-test, propensity score matching and instrumental variable methods
Methods for dealing with problems of causal relationships suggested by scholars (e.g. Diamond
& Sekhon, 2013; Ho, Imai, King, & Stuart, 2007; Papies, Ebbes, & Van Heerde, 2017) are a
T-test, Propensity Score Matching (PSM), and the Instrumental Variables (IVs) approach.
These methods are applied in this thesis.
A t-test is performed to determine the statistical significance of the difference in the variable’s
mean between the two groups. The t-test assumes a null hypothesis that the means between the
two groups are equal. This thesis will use a t-test method to examine “the two samples with
equal variance” of six control variables between two groups, for example, of perceived risk. If
the null hypothesis is rejected, this means that the means of these control variables between the

51
two groups are different, possibly leading to the confounding effect in which these six control
variables may influence both perceived risk and debt decisions. Thus, propensity score
matching should be applied to deal with these issues.
As stated by Rosenbaum and Rubin (1983), the propensity score method plays a central role in
observational studies for a causal effect. This method may reduce bias if the selection on
observables assumption holds (Diamond & Sekhon, 2013). The PSM relates to creating an
artificial control group by matching each treated variable with a non-treated variable that has
similar characteristics. PSM matches treated factors to untreated factors based on the
propensity score. In general, PSM finds similar randomisation to solve problems of selection
bias that often occurs in non-experimental methods.
Endogenous problems are also a threat to inferring causal relationships (Papies et al., 2017).
The standard method to solve endogeneity is to employ an instrumental variable (IV) approach.
IVs are used as an explanatory variable is related to the error term. A valid instrument relates
to the changes in the explanatory variable but does not relate to the dependent variable. In other
words, using an IV to identify the unobserved correlation allows a researcher to explore the
causal impact of a predictor on the outcome variable.9
3.4.4 Locations selection bias
Vietnam has four main areas; Ho Chi Minh City (HCM City) in the South, Ha Noi Capital in
the North, Da Nang City in the Middle of the country, and Mekong Delta in the Western region.
The respondents of this thesis live in all these areas, which will reduce sampling bias.
9 According to Instrumental variables estimation:
https://en.wikipedia.org/wiki/Instrumental_variables_estimation
and Statistics How to: https://www.statisticshowto.datasciencecentral.com/instrumental-variable/

52
As shown in Table 3.1, approximately 58% of individual investors live in Ho Chi Minh City,
which is the biggest city in Vietnam, followed by Ha Noi Capital (24.1%), Da Nang City
(7.1%), Mekong Delta (6.4%), and other locations (4.3%).
Respondents who are living in Ho Chi Minh City dominate the sample. This is because Ho Chi
Minh City (HCM City) is the biggest city in terms of population and economy. HCM City is
the economic centre of Vietnam, with a GDP per capita much higher than the country’s
average.10
Table 3.1: A summary of the survey respondents
Stages Sent
questionnaires
Received
responses
Response
rate %
Frequency % Locations
I 200 145 72.5%
86 59.3% HCM City
35 24.2% Ha Noi Capital
10 6.9% Da Nang City
6 4.1% Mekong Delta
8 5.5% Others
145 100%
II 400 275 68.8%
158 57.5% HCM City
66 24.0% Ha Noi Capital
20 7.3% Da Nang City
21 7.6% Mekong Delta
10 3.6% Others
275 100%
I+II 600 420 70%
244 58.1% HCM City
101 24.1% Ha Noi Capital
30 7.1% Da Nang City
27 6.4% Mekong Delta
18 4.3% Others
Total 420 100%
Collected by this thesis
10 The government aims to raise GDP per capita to US$9,800 in 2020. Details of HCM City are presented at
https://indochina-properties.com/location/ho-chi-minh-city/about

53
As exhibited in Table 3.2, 244 respondents live in all suburbs in Ho Chi Minh City. Of these,
respondents living in District 1, which is the central district of Ho Chi Minh City (HCM City),
make up around 11%, followed by Tan Binh District (6.4%), Binh Thanh District and Go Vap
District (5.2% each). This sample can, therefore, be seen as proxying the location of
Vietnamese investors.
Table 3.2: A summary of suburbs in Ho Chi Minh City
Suburbs in HCM City Frequency Proportion
District 1 48 11.4%
Tan Binh District 27 6.4%
Binh Thanh District 22 5.2%
Go Vap District 22 5.2%
District 10 14 3.3%
Thu Duc District 12 2.9%
District 2 11 2.6%
District 5 11 2.6%
District 9 10 2.4%
District 7 9 2.1%
Binh Tan District 9 2.1%
District 8 8 1.9%
District 6 7 1.7%
Phu Nhuan District 7 1.7%
District 3 6 1.4%
Tan Phu District 5 1.2%
Binh Chanh District 4 1.0%
District 4 3 0.7%
District 11 3 0.7%
District 12 3 0.7%
Nha Be District 2 0.5%
Hoc Mon District 1 0.2%
Total 244 100%
Collected by this thesis

54
This thesis also examines whether respondents’ locations dampen the relationships of
perceived risk, risk tolerance or trust to debt decisions after controlling for seven
demographics; gender, age, marital status, education, income, financial literacy, and locations.
This analysis is presented in Chapters 4, 5, and 6. Response bias is also a concern in this thesis
because this bias may skew the results.
3.4.5 Response bias
Response bias is defined by Furnham (1986) as a tendency that respondents have to respond to
the questions inaccurately or falsely. The causes of this bias are derived from the measurement
process, including leading questions and social desirability (Furnham, 1986; Krumpal, 2013).
Leading questions refer to problems with the wording of the questions. For example, questions
are not understandable or readable, leading respondents to be confused and then answer falsely.
Social desirability is defined by Krumpal (2013) as the tendency of respondents to respond to
the questions in a way that will be viewed favourably by others. This bias leads to a severe
problem with research related to self-reports.
To minimise the risk of response bias, first, as already presented above, this thesis designed the
questionnaire carefully, then asked New Zealanders (native English speakers who neither know
about economics nor finance) to examine how understandable and readable the questions are.
In Vietnam, Vietnamese individual investors were also asked to re-examine the wording of the
questions before the final survey was distributed.
Second, this thesis includes some questions to check respondents’ consistency in responding
to the questions. For example, considering questions 3, 5 and 9 below, if a respondent chooses
both “9”: I do not borrow money from any family sources in question 3, and I do not borrow
money from any non-family sources in question 5, the respondent should write down 0% (zero)
of informal borrowing in question 9 for consistency.

55
Question 3: Thinking about borrowing from family sources such as parents, a spouse, sisters, brothers, relatives,
to invest in shares (you can choose more than 1 answer):
□ 1. Parents.
□ 2. Grandparents.
□ 3. Brothers/sisters.
□ 4. Parents in law.
□ 5. Brothers/sisters in law.
□ 6. Cousins/nieces/nephews.
□ 7. Husband/wife.
□ 8. Other family sources: ……….
□ 9. I do not borrow from any family sources.
Question 5: Borrowing from non-family sources such as friends, teachers, co-workers, … (you can choose more
than 1 answer):
□ 1. Friends
□ 2. Girlfriends/boyfriends/partners
□ 3. Teachers/lecturers
□ 4. Colleagues/co-workers
□ 5. Bosses/managers
□ 6. Business partners
□ 7. Neighbours
□ 8. Other non-family sources: ……….
□ 9. I do not borrow from any non-family sources.
Question 9: Thinking about the total money for share investment, how would you divide this amount between
the borrowing and your own money?
The total money for share investment: %
Borrowing from informal sources (family and/or non-family)
Borrowing from formal sources
My equity
Total 100%
This thesis also has an additional check of respondents’ consistency between question 8 and
12 in relation to personal information. Namely, the income level selected in question 8 should
be inconsistent with their choice of the main field of occupation.
Question 8: On average, how much income (VND) per month do you receive from your work?
□ 0
□ less than 10 million
□ 10 million – 50 million
□ more than 50 million – 100 million
□ more than 100 million
Question 12: What is your main field of occupation?
□ 1. Fund manager
□ 2. Broker-dealer
□ 3. Brokerage manager/director
□ 4. Financial advisor
□ 5. Banking officer
□ 6. Business owner

56
□ 7. CEO (Chief executive officer)
□ 8. CFO (Chief financial officer)/ Chief Accountant
□ 9. Investment officer
□ 10. Accountant
□ 11. Administrative officer/manager
□ 12. Sale/Marketing officer/manager
□ 13. Teacher/lecturer
□ 14. Other: …….
Finally, regarding an issue of non-response bias, it is, of course, impossible to access the
personal information of non-participants. This thesis, consequently, cannot compare between
participants and non-participants in terms of gender, age, education, etc. According to
Armstrong and Overton (1977), it is best for the non-response rate to be kept under 30% of the
sample. The non-response rate to the thesis questionnaire is 30%, thereby reducing the non-
response bias.
3.5 Investor characteristics
This thesis presents the personal characteristics of 420 individual investors. Male investors
dominate the sample, making up around 61%, as summarised in Table 3.3. Sixty-two per cent
(62%) single investors compares with 38% married investors. Most investors have a university
degree (around 86%), higher levels of financial literacy than the average (around 59%), and
less than 5 years (about 77%) of stock investment experience. The majority of investors have
income of either up to VND 10 million, or VND 10-50 million per month (up to USD 500, or
USD 500-2500 per month). Over half of the investors (around 53%) invest in stocks worth
between VND 200 to 500 million per year (USD 10,000-25,000 per year). These investor
characteristics are arguably typical of the Vietnamese investor population and are consistent
with the samples used in prior studies in Vietnam (e.g., Tho et al., 2018; Trang & Tho, 2017).

57
Table 3.3: Results of investor characteristics
This table shows the following predominant investor characteristics: male investors, investors aged 25-35, single
investors, investors having a university degree, less than 5 years of investment experience, income between VND
10 million to 50 million (USD 500 – 2500 per month), trading frequency between 1 time per week and 3 times
per month, investment amount less than 200 million (USD 10000) per year, and having higher levels of financial
literacy than the average.
Characteristics Freq. % Characteristics Freq. %
I. Gender VI. Investment experience
Male 258 61.4 < 3 years 239 56.9
Female 162 38.6 3-5 years 86 20.5
>5-10 years 51 12.1
II. Age > 10- 20 years 44 10.5
<25 98 23.3 VII. Income (VND)/ month
25-35 238 56.7 No income 22 5.2
36-45 68 16.2 Up to 10 million 151 36.1
46-55 7 1.7 10-50 million 224 53.3
>55 9 2.1 > 50 - 100 million 17 4.0
III. Marital status > 100 million 6 1.4
Single 259 61.7 VIII. Trading frequency
Married 155 36.8 At least once a day 48 11.4
Divorced/widow (or) 6 1.5 1 - 6 times/week 113 26.9
IV. Education levels: 1-3 times/month 158 37.6
Up to secondary school 4 1.0 IX. 1-2 times/quarter 55 13.1
High school 13 3.0 1-3 times/year 20 4.8
University 362 86.2 Less than once a year 26 6.2
Master or more 41 9.8 X. Investment amount: VND/year
V. Financial literacy <200 million 263 62.6
Mean: 9.57 200-500 million 88 21.0
Less than Mean 164 39.0 501-1 billion 33 7.9
More than Mean 247 58.8 >1-3 billion 21 5.0
Not answered 9 2.1 >3 billion 15 3.6
N 420 100 N 420 100

58
3.6 Debt decisions and reasons for this use of debt
3.6.1 Debt decisions definition
“Debt decisions” is defined as the level of debt which investors use for stock investment. This
debt decision has two measures; “financial leverage”, and “informal debt”. For this thesis,
financial leverage is defined as the credit investors obtain only through brokerage firms, while
informal debt is the credit investors obtain through family and non-family sources. This
definition of financial leverage is used, as it is a common term in Vietnam. Debt decisions are
risky decisions no matter what kinds of debt is involved, informal or formal, because users of
debt may face possible insolvency if they do not manage debt well. The following question
relates to the use of informal debt (question 9 in Appendix 1 and 2).
Thinking about the total money for stock investment, how would you divide this amount between the borrowing
and your own money?
The total money for stock investment: %
Borrowing from informal sources (informal debt)
Borrowing from formal sources (formal debt)
My equity
Total 100%
Financial leverage differs from formal debt. Financial leverage is the debt that investors only
borrow from brokerage firms, while formal debt is borrowed from a variety of sources such as
banks, credit institutions, brokerage firms, and other formal lenders. The following question
pertains to financial leverage (question 10 in Appendix 1 and 2).
Supposing that a stock (a share) has the highest financial leverage in accordance with the brokerage firms’ rules
if you would like to buy this share, what financial leverage ratios do you often use?
□ do not leverage
□ less than 20%
□ 20% to less than 30%
□ 30% to less than 50%
□ Use the highest lending ratio
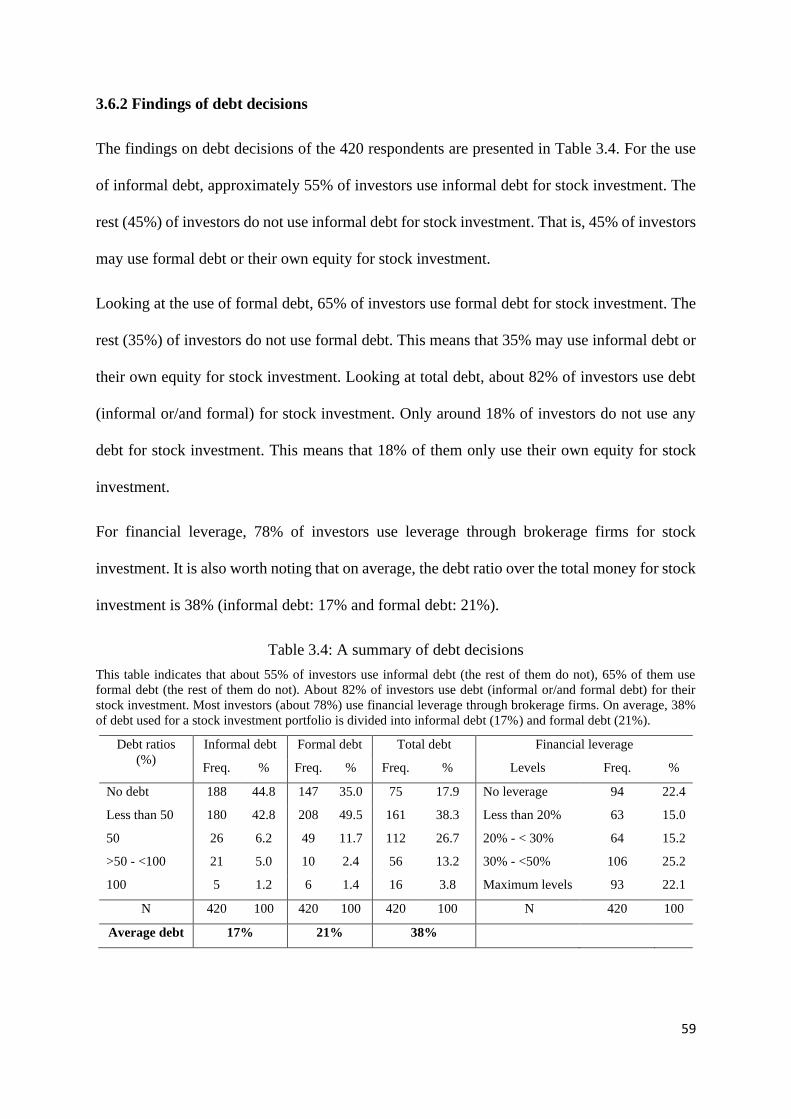
59
3.6.2 Findings of debt decisions
The findings on debt decisions of the 420 respondents are presented in Table 3.4. For the use
of informal debt, approximately 55% of investors use informal debt for stock investment. The
rest (45%) of investors do not use informal debt for stock investment. That is, 45% of investors
may use formal debt or their own equity for stock investment.
Looking at the use of formal debt, 65% of investors use formal debt for stock investment. The
rest (35%) of investors do not use formal debt. This means that 35% may use informal debt or
their own equity for stock investment. Looking at total debt, about 82% of investors use debt
(informal or/and formal) for stock investment. Only around 18% of investors do not use any
debt for stock investment. This means that 18% of them only use their own equity for stock
investment.
For financial leverage, 78% of investors use leverage through brokerage firms for stock
investment. It is also worth noting that on average, the debt ratio over the total money for stock
investment is 38% (informal debt: 17% and formal debt: 21%).
Table 3.4: A summary of debt decisions
This table indicates that about 55% of investors use informal debt (the rest of them do not), 65% of them use
formal debt (the rest of them do not). About 82% of investors use debt (informal or/and formal debt) for their
stock investment. Most investors (about 78%) use financial leverage through brokerage firms. On average, 38%
of debt used for a stock investment portfolio is divided into informal debt (17%) and formal debt (21%).
Debt ratios
(%)
Informal debt Formal debt Total debt Financial leverage
Freq. % Freq. % Freq. % Levels Freq. %
No debt 188 44.8 147 35.0 75 17.9 No leverage 94 22.4
Less than 50 180 42.8 208 49.5 161 38.3 Less than 20% 63 15.0
50 26 6.2 49 11.7 112 26.7 20% - < 30% 64 15.2
>50 - <100 21 5.0 10 2.4 56 13.2 30% - <50% 106 25.2
100 5 1.2 6 1.4 16 3.8 Maximum levels 93 22.1
N 420 100 420 100 420 100 N 420 100
Average debt 17% 21% 38%
60
3.6.3 Reasons for the use of debt by investors
The thesis examined the reasons why investors use informal debt and financial leverage for
stock investment, based on the investor interviews, the literature review, and anecdotes.
Investors use informal debt for stock investment, possibly because first, informal borrowing is
common in Vietnamese culture. So, both borrowers and lenders may feel comfortable with this
form of borrowing. Lenders feel this because they think they help their borrowers. Borrowers
believe they help lenders by contributing extra income from their returns from the stock
investment to informal lenders if their stock investment succeeds. Second, investors have
limited access to formal lenders, and informal borrowing becomes a unique source of funds for
investors. This is consistent with the findings of prior studies (e.g. Guirkinger, 2008; Mohieldin
& Wright, 2000; Nguyen & Berg, 2014). Finally, investors may also feel less pressured, and
may even avoid legal problems, if they cannot return the money to the informal lenders.
Investors using just financial leverage for stock investment may have sufficient access to
borrowings through brokerage firms. This is in line with previous studies (e.g. Guirkinger,
2008; Mohieldin & Wright, 2000; Nguyen & Berg, 2014). Also, it is possible that people whom
investors know have a low or average income will, as a result, have insufficient money to lend
to investors. Investors may wish to borrow a large amount of money to invest in stocks, and
only brokerage firms meet this borrowing.
3.7 Control variables
Literature finds a number of variables related to demographics have an effect on investment
decisions, including gender, age, education, marital status, income, and financial literacy.
Women are often more risk-averse than men (e.g. Barber & Odean, 2001; Frijns et al., 2008;
Grable, 2000; Hallahan et al., 2003; Kannadhasan, 2015; Lucarelli & Brighetti, 2011; Tho et
al., 2018; Yao et al., 2011). Risk-taking levels increase when age increases (Frijns et al., 2008;

61
Grable, 2000; Pålsson, 1996; Wang & Hanna, 1997). Single people are more likely to take risk
than married people (e.g. Grable, 2000), and higher-income investors tend to take more risk
(Grable, 2000; Hallahan et al., 2003; Hallahan, Faff, & McKenzie, 2004; Morin & Suarez,
1983; Riley Jr & Chow, 1992; Yao et al., 2011). Higher education levels or financial knowledge
is associated with higher risk-taking behaviour (Grable, 2000; Hallahan et al., 2004;
Kannadhasan, 2015; Riley Jr & Chow, 1992; Yao et al., 2011). Based on this evidence, this
thesis considers these factors as control variables.
These six control variables, with the exception of financial literacy, are measured through
simple questions, for example, “what is your age?” Financial literacy is measured through 16
questions as for a number of existing studies (Balloch, Nicolae, & Philip, 2014; Van Rooij,
Lusardi, & Alessie, 2011). All questions are attached in Appendix 1 and 2. All of these control
variables are evaluated through a t-test to deal with the possible selection bias, which is
presented in the robustness checks of Chapters 4, 5, and 6.
This thesis also examines whether other demographics, such as work experience, investment
experience, or investment amount, significantly affect debt decisions. The results find that most
of these have no significant relationship with debt decisions. These demographic variables are,
therefore, are not included in a model.
3.8 Summary
This chapter first presented the structural equation modelling (SEM) that is the primary method
of this thesis. The importance of SEM is that SEM can test the direct and indirect relationships
in a model concurrently and directly accommodates measurement errors in predicting the
relationships between variables, while other techniques such as multiple regression or stepwise
regression cannot. In terms of assessment of a model fit, R squared is the main measure to
assess a model fit when using the multiple regression or stepwise regression. By contrast, SEM

62
uses a series of measures that describe how well a theory explains the input data. For example,
Chi-square # 0, degrees of freedom #0, Tucker-Lewis index (TLI), Goodness-of-fit index
(GFI), Comparative fit index (CFI) > 0.95, and Root mean square error of approximation
(RMSEA) < 0.7. Second, this chapter presents details of the sample. Using the sample size of
420 respondents conforms to the criteria suggested by Hair et al. (2014), Krejcie and Morgan
(1970) and Zikmund et al. (2013). Third, the thesis has 5 phases of the survey process, through
trial interviews, questionnaire design, a pilot test, Human ethics approval of the questionnaire
and a 5-month survey. Fourth, the robustness checks applied to test the relationships by SEMs
is presented. Fifth, the personal characteristics of 420 investors are presented. Sixth, this
chapter presents the reasons for the use of debt by investors, and lastly, ends with a description
of the control variables.

63
Chapter 4 Essay One: Perceived Risk, Borrowing
Sources, and Debt Decisions11
4.1 Introduction
The main objective of this chapter is to investigate the extent to which perceived risk directly
relates to borrowing sources and debt decisions and mediates between borrowing sources and
debt decisions.
The use of debt by investors to increase the rate of return is common in many countries and
often regarded as an essential part of the growth of financial markets. Recent research has,
however, little paid attention to investors’ use of debt and what factors relate to this use of debt.
Also, while there has been significant research on formal and informal debt, to the best of the
author’s knowledge, there has been no academic research examining the use of informal debt
by individual investors for stock investment. This chapter will examine whether the perceived
risk of stock investment and available borrowing sources predict the use of debt for stock
investment, as well as the impact of perceived risk on the use of informal debt.
The importance of debt decisions and their definitions were presented in Chapters 1 and 3.
“Debt decisions” are defined as the level of debt which investors use for stock investment.
“Informal debt” is defined as the credit investors obtain through informal lenders for stock
investment. “Financial leverage” is defined as the credit investors obtain only through
brokerage firms for stock investment. A debt decision is a risky decision no matter what kinds
11 The early version of this chapter was presented at the 3rd Sydney Banking and Financial Stability Conference
2019 (SBFC 2019), University of Sydney Business School, Australia, December 2019.
https://sbfc.sydney.edu.au/
The first version of this chapter (N = 145) was presented at the 2nd Asia Conference on Business and Economic
Studies (ACBES 2019), University of Economics Ho Chi Minh City, Vietnam, September 2019.
https://acbes.ueh.edu.vn/
64
of debt are utilised, informal or formal, because users of debt may face possible insolvency if
they do not manage debt well.
Based on Peter and Tarpey Sr (1975), this chapter defines “perceived risk” as the subjective
levels of an investor’s concern about the risks of their stock investment. This is different from
the actual objective risk. It is a fact that investors typically find it hard to make the right decision
under risk or uncertainty because they cannot precisely predict possible outcomes (Statman,
2005). A risky decision to be made is thus often based on the judgment on how hazardous an
event is (Kahneman & Tversky, 1979; Shefrin, 2002). As investment decisions are made based
on perceived risk rather than objective risk, there is significant literature on risk perception.
This chapter examines risk within consumer behaviour framework and argues that, when
making a buying decision, investors perceive multiple aspects of risk instead of only financial
risk. This differs from both traditional and behavioural finance in which investors are assumed
to be only concerned about financial gains or loss (financial risk) when making a purchase
decision. This chapter introduces ideas from consumer theory and argues that investors may
have additional risk concerns; such as information safety (safety risk), social standing (social
risk), time waste (time risk), missing out on other opportunities (opportunity risk), wrong
choices (choice risk), or debt problems (leverage risk). Taking these additional facets of risk
into account provides a better understanding of investors’ perceived risk and its impact on debt
decisions.
The remainder of this chapter is as follows. Section 4.2 presents a literature review and
hypothesis development. The methodology is described in Section 4.3. Section 4.4 outlines the
main results, and Section 4.5 presents the results of additional analysis. The robustness check
is in Section 4.6, and demographics are discussed in Section 4.7. Section 4.8 presents the
conclusions, contributions, implications, limitations and further research.

65
4.2. Literature review and hypothesis development
4.2.1 Facets of perceived risk
The literature for this section was presented in Section 2.3. This chapter thus focuses only on
the definition of the perceived risk of stock investment and its facets.
“Perceived risk” includes two components; uncertainty and consequences (Bauer, 1960;
Cunningham, 1967), or probability of loss and importance of loss (Peter & Ryan, 1976; Peter
& Tarpey Sr, 1975). Following Peter and Tarpey Sr (1975), perceived risk of stock investment
is described as the level of potential loss concerns and the level of importance of this potential
loss.
The exploratory investor interviews found that the perceived risk of stock investment consisted
of seven facets. These facets are summarised below. Among them, four facets of risk (financial
risk, safety risk, social risk, time risk) are consistent with consumer behavioural framework.
Three aspects of risk; opportunity risk, choice risk, and leverage risk; were discovered through
the interviews.
Financial risk The possibility that investors make a loss in their stock investment portfolio.
Safety risk The possibility that investors’ information is leaked by hackers or attacked by viruses.
Social risk The possibility that investors are held in low esteem by a certain group because they make
a large loss in stock investment.
Time risk The possibility that investors spend much time on stock investment and the results are not
what they expect.
Opportunity risk The possibility that investors miss out on other financial investment opportunities if they
use all the money for stock investments.
Choice risk The possibility that investors make a wrong decision on choosing stocks for their portfolio.
Leverage risk The possibility that investors’ investment returns are inadequate to cover their loan interest
and principal at maturity.
The existing literature, as a result, has paid much attention to the relationship between
perceived risk and returns, but little attention to the relationship between perceived risk and

66
debt decisions. This leads this chapter to examine this risk-debt link through the following
hypotheses.
4.2.2 Hypothesis development
Traditional finance and some scholars of behaviour finance argue that the relationship between
risk and return is positive (e.g. Byrne, 2005; Diacon & Ennew, 2001; Ganzach, 2000; Trang &
Tho, 2017). This means that investors will only accept higher risk if they are compensated with
higher expected returns. This chapter argues that a higher level of the perceived risk of stock
investment equates to higher expected returns, and this may lead to the use of more borrowing
sources and higher debt. This chapter thus examines the following hypotheses.
H4.1: The higher the level of the perceived risk of stock investment, the higher the number of
borrowing sources used.
H4.2: The higher the level of the perceived risk of stock investment, the higher the level of
informal debt used.
H4.3: The higher the level of the perceived risk of stock investment, the higher the level of
financial leverage used.
Winning or losing situations are found to affect investors’ risk perception. Investors are risk-
averse to gain situations and risk-taking to loss situations (Kahneman & Tversky, 1979). Past
outcomes also influence investors’ current risk perception. Investors tend to take more risk
after gains and take less risk after losses (Nofsinger, 2008; Thaler & Johnson, 1990). This
chapter argues that an increase in the number of borrowing sources may cause current risk
concerns about stock investment.
H4.4: The higher the number of borrowing sources, the higher the level of the perceived risk
of stock investment.

67
Recent studies also uncover that households in developing countries borrow money from many
informal and formal lenders for production and consumption (Diagne, 1999; Zeller, 1994),
(Barslund & Tarp, 2008; Guirkinger, 2008; Mohieldin & Wright, 2000; Nguyen, 2008; Nguyen
& Berg, 2014). This chapter argues that investors also borrow money from informal and formal
lenders and that more available sources will lead to the use of higher debt.
H4.5: The higher the number of borrowing sources, the higher the level of informal debt used.
H4.6: The higher the number of borrowing sources, the higher the level of financial leverage
used.
Perceived risk is found to be a mediator between perceived quality and perceived value
(Sweeney, Soutar, & Johnson, 1999). Performance risk mediates between quality and value
(Agarwal & Teas, 2001), meaning that performance risk can account for why a higher quality
leads to a higher value for money. This chapter thus argues that perceived risk may mediate
between borrowing sources and debt decisions, with the following hypotheses:
H4.7: Perceived risk of stock investment mediates between borrowing sources and informal
debt.
H4.8: Perceived risk of stock investment mediates between borrowing sources and financial
leverage.
This chapter also argues that perceived risk relates to borrowing sources, and borrowing
sources pertain to debt decisions. This reveals that borrowing sources may mediate between
perceived risk and debt decisions, with the following hypotheses:
H4.9: Borrowing sources mediates between perceived risk of stock investment and informal
debt.
68
H4.10: Borrowing sources mediates between perceived risk of stock investment and financial
leverage.
4.3 Methodology
This main methodology was outlined in Chapter 3. This chapter only presents the measures of
perceived risk, borrowing sources, and debt decisions, as shown in Figure 4.1. Perceived risk
is measured based on Peter and Tarpey Sr (1975)’s formula. Mitchell (1999) assesses the model
of Peter and Tarpey Sr (1975) as one of the best models in comparison with other models (such
as Deering & Jacoby, 1972; Dowling & Staelin, 1994; Horton, 1976; Stone & Winter, 1987).
Each facet of risk is computed by multiplying the probability of loss (PL) by the importance of
loss (IL). There are seven facets of risk, and the sum of these seven facets together form the
overall perceived risk of stock investment (coded as PERI). Borrowing sources are described
as the number of sources investors borrow money from for stock investment.

69
Figure 4.1: A summary of measures of perceived risk, borrowing sources and debt decisions
I. Perceived risk of stock investment
PERI = ∑ (𝐧𝐢=𝟏 SAFRi + SOCRi + OPPRi + TIMRi + CHOIRi + LEVRi + FINRi
)
SAFR : Safety risk; = ln (SAF1i * SAF2i) CHOIR : Choice risk; = ln (CHO1i * CHO2i)
SAF1 : the probability of safety loss; CHO1 : the probability of choice loss;
SAF2 : the importance of safety loss; CHO2 : the importance of choice loss;
SOCR : Social risk; = ln (SOC1i * SOC2i) LEVR : Leverage risk; = ln (LEL1i * LEL2i)
SOC1 : the probability of social loss; LEL1 : the probability of leverage loss;
SOC2 : the importance of social loss; LEL2 : the importance of leverage loss;
OPPR : Opportunity risk; = ln (OPP1i * OPP2i) FINR : Financial risk; = ln (FIN1i * FIN2i)
OPP1 : the probability of opportunity loss; FIN1 : the probability of financial loss;
OPP2 : the importance of opportunity loss; FIN2 : the importance of financial loss;
TIMR : Time risk; = ln (TIM1i * TIM2i) PERI : Perceived risk of stock investment;
TIM1 : the probability of time loss; i: ith investor; n= 420.
TIM2 : the importance of time loss;
II. Borrowing sources
FINFS =∑ (𝐈𝐍𝐁𝐎 + 𝐅𝐁𝐎)𝐧𝐢
where:
INBO: borrowing from the informal lenders
FBO: borrowing from the formal lender
FINFS: borrowing sources;
i: ith investors, n=420.
III. Debt decisions
INFD = ∑ (𝐈𝐍𝐅𝐃)𝐧𝐢 i
LEVE = ∑ (𝐋𝐄𝐕𝐄)𝐧𝐢 i
where:
INFD: informal debt ratios (%)
LEVE: levels of financial leverage (1: no leverage to 5: maximum leverage ratios).
i: ith investors, n=420.
Borrowing sources are a categorical variable with 0 as no borrowing, 1 as borrowing from one
informal or formal lender, and 2 as borrowing from both informal and formal lenders. In
Vietnamese culture, a family is often an extended family, including spouses, parents (in-law),
single brothers or sisters (in-law), single aunts or uncles, nieces, nephews. Also, non-family

70
lenders involve many kinds of people as friends, colleagues, managers, neighbours. This thesis,
therefore, divides informal lenders into two groups: family and non-family. This categorization
helps achieve a better understanding of whom investors borrow money from for stock
investment. Debt decisions and six control variables were presented in Section 3.6.
4.4 Results
The investor characteristics were presented in Section 3.5. This chapter describes investors’
perceived risk, borrowing sources and debt decisions, followed by the reliability of the scale
of perceived risk, the correlations between variables and the main results of this chapter.
4.4.1 Levels of perceived risk
Investors’ overall perceived risk is composed of seven facets; financial risk, safety risk, social
risk, time risk, opportunity risk, choice risk, and leverage risk, as revealed in Table 4.1. On
average, investors are most concerned about leverage risk, followed by choice risk, safety risk,
opportunity risk, social risk, and financial risk. For financial risk, most investors are highly
concerned about their loss being over 10% of their equity.
Table 4.1: Description of overall perceived risk and its seven facets
This table shows investors’ overall perceived risk and its facets. The majority of investors have higher levels of
overall perceived risk than the average (53%). On average, investors are most concerned about leverage risk,
followed by choice risk, safety risk, opportunity risk, social risk, and financial risk.
Indicators Safety
risk
Social
risk
Opportunity
risk
Time
risk
Choice
risk
Leverage
risk
Financial
risk
Overall
perceived risk
Mean 13.80 10.75 11.93 13.12 14.20 16.21 8.69 88.71
Median 12 9 12 12 15 16 6 87
Minimum 1 1 1 1 1 1 1 22
Maximum 25 25 25 25 25 25 25 162
Standard deviation 6.46 6.46 6.00 5.91 6.06 7.20 6.24 25.89
Below mean (%) 51 60 46 54 48 61 53 53
Over mean (%) 49 40 54 46 52 39 47 47
N 420 420 420 420 420 420 420 420

71
Levels of perceived risk, in general, differ among groups, as indicated in Table 4.2. Users of
debt have a higher level of risk concern than non-users of debt. This supports the debate of this
study that investors are not always risk-averse. Besides this, non-stockbrokers are also more
concerned about investment risk than stockbrokers. The risk of stock investment perceived by
female investors is higher than that by male investors. This result is consistent with prior studies
in which males are more risk-taking than females, for example (Barber & Odean, 2001; Frijns,
Koellen, & Lehnert, 2008; Grable, 2000; Hallahan, Faff, & McKenzie, 2003; Kannadhasan,
2015; Lucarelli & Brighetti, 2011; Tho et al., 2018; Yao, Sharpe, & Wang, 2011).
Table 4.2: Perceived risk among groups
This table shows investors’ overall perceived risk and its facets. Users of debt have a higher level of risk concern
than non-users of debt. Besides this, non-stockbrokers and female investors are more concerned about investment
risk than stockbrokers and male investors, respectively.
Perceived
risk
Non-users
of debt
Users
of debt
Non-stock-
brokers
Stock-
brokers
Male
investors
Female
investors
All
investors
Mean 15.69 16.49 16.41 16.24 16.02 16.87 16.35
Median 16.18 16.87 16.97 16.70 16.57 17.21 16.80
Minimum 7.97 5.93 5.93 6.58 5.93 6.64 5.93
Maximum 21.2 21.8 21.80 21.80 21.80 21.80 21.8
Std. dev. 0.29 0.15 0.175 0.21 2.80 0.20 2.74
N 75 345 251 169 258 162 420
Note: Std. dev.: standard deviation
4.4.2 Borrowing sources and debt decisions
Debt decisions were presented in Section 3.6.1. This chapter only presents borrowing sources
that are briefly in Table 4.3. Investors have no borrowing from family (around 30%), non-
family (about 44%), and formal sources (around 19%). Approximately 93% of investors
borrow from at least one source. Among them, 26% of them borrow from one informal or
formal source, and nearly 67% of them borrow from both informal and formal sources. Overall,
the number of investors who use both informal and formal sources for stock investors

72
dominates the sample. The primary lenders are parents (36%), friends (34%), and brokerage
firms (about 40%).

73
Table 4.3: A summary of the borrowing sources
Investors have no borrowing from informal sources; family (around 30%), and non-family (about 44%), and formal sources (around 19%). Remarkably, only about 7% of
investors borrow neither from informal nor formal sources. That is, most investors borrow money from at least one source for stock investment. The primary lenders are parents,
friends, and brokerage firms.
Family sources Freq. % Non-family sources Freq. % Formal sources Freq. % Borrowing sources Freq. %
No borrowing 124 29.5 No borrowing 184 43.8 No borrowing 79 18.8 No borrowing 31 7.4
Parents (in-law) 151 36 Friends 144 34.3 Brokerage firms 163 38.8 Informal or formal 109 26.0
Husband/wife 77 18.3 Other 30 7.1 Banks 152 36.2
Brothers
/sisters (in-law)
47 11.3 Colleagues/co-
workers
18 4.3 Credit
institutions
13 3.1 Both informal and
formal
280 66.6
Other 18 4.2 Girlfriend/boyfriend
/partner
18 4.3 Other 13 3.1
Cousins/nieces
/nephews
3 0.7 Business partners 16 3.8
Neighbours 6 1.4
Bosses/managers 4 1.0
N 420 100 N 420 100 N 420 100 420 100

74
4.4.3 Test of reliability
The reliability coefficients (Cronbach’s alpha) of seven facets of risk are shown in Table 4.4.
All Cronbach’s alphas of each facet of risk are more than 0.612; for example, 0.612 (choice
risk), and 0.882 (leverage risk). Perceived risk has a Cronbach’s alpha of 0.679, although some
inter-correlation is less than 0.3. In general, each facet of risk and overall perceived risk fulfils
acceptable or high internal consistency, which enables them to be variants in a model.
4.4.4 Test of correlations between variables
This study tests Pearson’s correlation coefficients between variables. As shown in Table 4.5,
most facets of risk variables have a positive inter-correlation at a significant level (p<0.05).
For example, safety risk has a positive correlation with social risk, opportunity risk, time risk,
choice risk, leverage risk, and perceived risk. Perceived risk positively correlates with choices
among borrowing sources and informal debt.
Overall perceived risk has correlations with its seven facets at significant levels which are,
ranked in descending order, time risk, leverage risk, choice risk, opportunity risk, social risk,
safety risk, and financial risk.
12According to Hair et al. (2014)’s guidelines, to ensure that a variable has sufficient reliability, Cronbach’s
alpha of each variable should exceed a threshold of 0.6. Internal consistency (the item-to-total correlations)
exceeds 0.5, and the inter-item correlation exceeds 0.3.

75
Table 4.4: Results of the reliability of perceived risk and its facets
This table examines the reliability coefficients (Cronbach’s alpha) of each facet of risk and overall perceived risk.
All variables have Cronbach’s alpha greater than 0.6; safety risk (0.684), social risk (0.833), opportunity risk
(0.802), time risk (0.798), choice risk (0.705), leverage risk (0.861), financial risk (0.835), and perceived risk
(0.629). The results show that all these variables have sufficient reliability.
Scale Mean if
Item Deleted
Scale Variance
if Item Deleted
Corrected
Item-Total
Correlation
Squared
Multiple
Correlation
Cronbach's alpha
if item deleted
Safety risk 0.684
SAF1 3.97 0.972 0.521 0.272
SAF2 3.36 1.151 0.521 0.272
Social risk 0.833
SOC1 3.14 1.118 0.714 0.510
SOC2 3.16 1.265 0.714 0.510
Opportunity risk 0.802
OPP1 3.36 0.921 0.671 0.450
OPP2 3.39 1.047 0.671 0.450
Time risk 0.798
TIM1 3.59 0.855 0.664 0.441
TIM2 3.51 0.877 0.664 0.441
Choice risk 0.705
CHO1 3.87 0.859 0.545 0.297
CHO2 3.59 0.876 0.545 0.297
Leverage risk 0.861
LEV1 4.00 1.111 0.756 0.572
LEV2 3.88 1.139 0.756 0.572
Financial risk 0.835
FIN1 2.90 1.368 0.718 0.516
FIN2 2.68 1.226 0.718 0.516
Perceived risk (PERI) 0.629
SAFR 13.8752 6.114 0.315 0.109 0.600
SOCR 14.2139 5.426 0.390 0.192 0.575
OPPR 14.0422 5.782 0.389 0.232 0.577
TIMR 13.9028 5.654 0.561 0.425 0.534
CHOIR 13.8181 5.863 0.466 0.334 0.559
LEVR 13.7318 5.715 0.376 0.202 0.580
FINR 14.4890 6.593 0.046 0.006 0.702
SAF1: probability of safety loss, SAF2: importance of safety loss, SOC1: probability of social loss, SOC2:
importance of social loss, OPP1: probability of opportunity loss, OPP2: importance of opportunity loss, TIM1:
probability of time loss, TIM2: importance of time loss, CHO1: probability of choice loss, CHO2: importance of
choice loss, LEV1: probability of leverage loss, LEV2: importance of leverage loss, FIN1: probability of
financial loss, FIN2: importance of financial loss, SAFR: safety risk, SOCR: social risk, OPPR: opportunity risk,
TIMR: time risk, CHOIR: choice risk, LEVR: leverage risk, FINR: financial risk, PERI: perceived risk of stock
investment.

76
Table 4.5: A summary of the correlations between variables
This table tests the correlation between variables. Most variables have inter-correlation at a significant level. For example, safety risk correlates with social risk, opportunity
risk, time risk, choice risk, leverage risk, and perceived risk. Perceived risk also positively correlates with borrowing sources and informal debt.
SAFR 2 3 4 5 6 7 8 9 10 11 12 13 14 15 16 17
1.SAFR 1.000
2.SOCR 0.250** 1.000
3.OPPR 0.203** 0.363** 1.000
4.TIMR 0.200** 0.376** 0.481** 1.000
5.CHOIR 0.200** 0.271** 0.307** 0.521** 1.000
6.LEVR 0.190** 0.289** 0.237** 0.435** 0.440** 1.000
7.FINR 0.084 0.009 -0.024 -0.002 0.056 -0.023 1.000
8.PERI 0.458** 0.573** 0.576** 0.633** 0.578** 0.582** 0.306** 1.000
9.FINFS 0.029 0.081 0.095 0.106* 0.052 0.217** -0.004 0.190** 1.000
10.GEN 0.128** 0.047 0.089 0.071 0.105* 0.116* 0.065 0.146** 0.073 1.000
11.AGE -0.076 -0.069 -0.069 -0.182** -0.128** -0.206** 0.057 -0.126** -0.050 -0.199** 1.000
12.MAR -0.014 0.063 0.003 -0.086 -0.067 -0.090 0.037 -0.013 -0.023 -0.059 0.491** 1.000
13.EDU -0.098* -0.106* -0.042 -0.010 -0.038 -0.041 0.005 -0.047 -0.036 -0.105* 0.076 0.131** 1.000
14.INC -0.046 -0.044 -0.072 -0.101* -0.074 -0.106* 0.089 -0.022 -0.099* -0.193** 0.418** 0.297** 0.238** 1.000
15.FIL -0.117* -0.072 0.004 0.078 0.136** 0.175** -0.031 0.075 -0.012 -0.098* -0.046 -0.023 0.230** 0.087 1.000
16.INFD 0.047 0.117* 0.049 0.076 0.100* 0.112* 0.070 0.154** 0.176** 0.053 -0.114* -0.135** -0.011 -0.133** -0.042 1.000
17.LEVE -0.075 0.016 -0.044 0.000 -0.027 0.076 -0.035 0.029 0.260** -0.076 0.060 0.051 0.017 0.131** 0.175** -0.071 1.000
N 420 420 420 420 420 420 420 420 420 420 420 420 420 420 420 420 420
**. Correlation is significant at the 0.01 level (2-tailed).
*. Correlation is significant at the 0.05 level (2-tailed). SAFR: safety risk, SOCR: social risk, OPPR: opportunity risk, TIMR: time risk, CHOIR: choice risk, LEVR: leverage risk, FINR: financial risk, PERI:
perceived risk of stock investment, FINFS: choices among borrowing sources, GEN: gender, AGE: age, MAR: marital status, EDU: education levels, INC: income, FIL: financial literacy, INFD: informal
debt, LEVE: financial leverage.

77
4.4.5 Results of main SEM models and discussion
This study develops three structural equation models (SEM1, SEM2, and SEM3). SEM1
examines borrowing sources as a mediator between perceived risk and debt decisions. SEM2
examines borrowing sources a mediator between seven facets of risk and debt decisions. SEM3
tests perceived risk as a mediator between borrowing sources and debt decisions. The
relationships are tested after controlling for six personal characteristics; gender, age, marital
status, education, income, and financial literacy. It is noted that other demographics are also
tested, including investment amount, work experience, and investment experience among
investors. The results, however, find that most of these variables have no significant association
with debt decisions.
The results of SEM 1 are exhibited in Figure 4.2 and Table 4.6. The results indicate a direct
relationship between perceived risk and borrowing sources at 0.186 (p<0.01) in support of
H4.1, in which the higher the level of risk concerns, the higher the number of borrowing sources
used. Investors with higher concern for risk associated with stock investment prefer more
borrowing sources because they then avoid dealing with a large debt amount from only one
source. Alternatively, their debt amount can be divided across a number of smaller sources,
and consequently, problems of repayment become less severe.
Borrowing sources is positively associated with both the use of informal debt at 0.149 (p<0.01)
and financial leverage at 0.283 (p<0.01), in support of H4.5 and H4.6, respectively. The use of
more borrowing sources leads to the use of higher debt (informal and financial leverage). This
supports the view that investors who borrow money from many sources can effectively double-
up on debt coming from both informal and formal lenders: that is, they borrow money from
parents and friends first, and then continue to borrow from brokerage firms. This infers that
investors with more borrowing sources are more likely to be risk-lovers and that they use higher
debt in the hope of achieving higher returns.

78
Perceived risk also pertains to informal debt at 0.124 (p<0.01), supporting H4.2, in which the
higher the level of risk concerns, the higher the level of informal debt being used. The result
finds no significant relationship of perceived risk to financial leverage, which does not support
H4.3. Overall, our finding of a positive risk-debt link adds to the literature alongside prior
studies on a positive risk-return trade-off (e.g. Byrne, 2005; Diacon & Ennew, 2001; Ganzach,
2000; Trang & Tho, 2017). Investors with higher risk perception of stock investment prefer
informal debt to formal debt. Two reasons account for this: first is the avoidance of legal
problems. Due to parents and friends being the main informal borrowing sources, investors
(borrowers) may avoid commitments of repayment to their parents or friends if they cannot
return the money to them. Second is the tendency to invest small amounts in stock investment,
and as a result, this borrowing is not a substantial concern to the parents and friends.

79
Figure 4.2: Perceived risk, borrowing sources and debt decisions (SEM1)
This figure presents a direct link of perceived risk to borrowing sources, perceived risk to informal debt, and
borrowing sources to informal debt and financial leverage at a significant level (p<0.1). SEM1 also uncovers
borrowing sources as a mediator between perceived risk and debt decisions at a significant level.
A model fit with criteria: Chi-square: 16.764, df: 12, GFI: 0.978, TLI: 0.904, CFI: 0.975, RMSEA: 0.053.
PERI: overall perceived risk, FINFS: borrowing sources, GEN: gender, AGE: age, EDU: education levels, MAR:
marital status, INC: income, FIL: financial literacy, INFD: informal debt, LEVE: financial leverage.
Table 4.6: Perceived risk, borrowing sources and debt decisions (SEM1)
This table shows a direct association of perceived risk with borrowing sources, the perceived risk with informal
debt, and borrowing sources with informal debt and financial leverage at a significant level (p<0.1). SEM1 also
uncovers borrowing sources as a mediator between perceived risk and debt decisions at a significant level.
Relationships Unstandardised
Weights
Standardised
Weights S.E. C.R. P
Hypotheses
I. Direct relationship
FINFS <--- PERI 0.042 0.186 0.011 3.829 0.000*** H4.1
FINFS <--- GEN 0.039 0.031 0.063 0.616 0.538
FINFS <--- AGE 0.016 0.021 0.041 0.386 0.700
FINFS <--- EDU -0.005 -0.003 0.076 -0.060 0.952
FINFS <--- INC -0.085 -0.097 0.047 -1.789 0.074*
INFD <--- FINFS 0.051 0.149 0.017 3.092 0.002*** H4.5
INFD <--- PERI 0.010 0.124 0.004 2.579 0.010*** H4.2
INFD <--- MAR -0.052 -0.130 0.019 -2.747 0.006***
LEVE <--- INC 0.120 0.143 0.039 3.106 0.002***
LEVE <--- FIL 0.031 0.168 0.008 3.641 0.000***
LEVE <--- FINFS 0.272 0.283 0.045 6.030 0.000*** H4.6
LEVE <--- PERI -0.007 -0.034 0.010 -0.722 0.470 H4.3
II. Indirect relationship
PERI->FINFS->INFD 0.002 0.028 *** H4.9
PERI->FINFS->LELE 0.011 0.053 *** H4.10
Note: *: p<0.1, **: p<0.05, ***: p<0.01
PERI: perceived risk, GEN: gender, AGE: age, EDU: education, MAR: marital status, INC: income, FIL: financial
literacy, FINFS: borrowing sources, INFD: informal debt, LEVE: financial leverage.

80
The results of SEM2 are presented in Figure 4.3 and Table 4.7. The findings show that
opportunity risk and leverage risk have a direct association with borrowing sources at 0.107
(p<0.05) and 0.242 (p<0.01), respectively, which also supports H4.1. As a result of findings
by SEM1 and SEM2, in addition to the overall perceived risk, investors are concerned about
missing out on other financial investment opportunities if they use all the money for stock
investments. They are also concerned about their returns being inadequate to cover their debt,
leading to borrowing from more sources so as to reduce a severe debt amount from only one
source.
In addition, borrowing sources relate to informal debt at 0.176 (p<0.01) and financial leverage
at 0.260 (p<0.01), which supports H4.5 and H4.6. Borrowing sources are also a mediator
between opportunity risk and informal debt at 0.019 (p<0.01), between opportunity risk and
financial leverage at 0.028 (p<0.01), between leverage risk and informal debt at 0.042
(p<0.01), and between leverage risk and financial leverage at 0.063 (p<0.01). These results
support H4.9 and H4.10. These hypotheses have already been mentioned in SEM1.
The findings of SEM3 are indicated in Figure 4.4 and Table 4.8. SEM3 finds a direct
relationship of borrowing sources to perceived risk at 0.177 (p<0.01) in support of H4.4, in
which an increase in the number of borrowing sources leads to higher risk concerns about stock
investment. This result contributes to the literature alongside prior studies (e.g. Nofsinger,
2008; Thaler & Johnson, 1990) in which past outcomes affect current risk perception. Investors
with more borrowing sources are more concerned about the risk of stock investment. When
faced many borrowing sources, investors worry about having large borrowings from many
lenders, leading them to be more aware of the risk of stocks chosen for investment.
Model SEM3 also manifests the link of perceived risk to informal debt at 0.12 (p≤0.01) (H4.2),
borrowing sources to informal debt at 0.15 (p<0.01) (H4.5), and financial leverage at 0.28
(p<0.01) (H4.6). These hypotheses were mentioned in SEM1 and SEM2.

81
The results also show that perceived risk mediates between borrowing sources and informal
debt at 0.022 (p<0.01) in support of H4.7. The use of more borrowing sources leads to more
concerns about the risk of stock investment, and more risk concerns result in the choice of
informal debt for stock investment, and as a result, perceived risk links borrowing sources to
informal debt decisions. In other words, the mediating role of perceived risk may explain why
a higher number of borrowing sources leads to the use of higher informal debt. This result also
contributes to the literature. SEM3, however, finds no significant indirect impact of borrowing
sources on financial leverage through perceived risk, which does not support H4.8.
In summary, based on the main results of SEMs, as presented above, this chapter reiterates that
borrowing, especially informal borrowing is part of Vietnamese culture. Investors with higher
risk perception of stock investment tend to use more borrowing sources and higher informal
debt, and those with more borrowing sources are more likely to use debt for stock investment.

82
Figure 4.3: Facets of risk, borrowing sources and debt decisions (SEM2)
This figure reveals a direct relationship of opportunity risk and leverage risk to borrowing sources and borrowing
sources to informal debt and financial leverage at a significant level (p<0.1). In addition, borrowing sources are
a mediator between opportunity risk, leverage risk, and debt decisions at a significant level.
Model fit criteria: Chi-square: 22.676, df: 15, GFI: 0.990, TLI: 0.954, CFI: 0.985, RMSEA: 0.035.
SAFR: safety risk, SOCR: social risk, OPPR: opportunity risk, TIMR: time risk, CHOIR: choice risk, LEVR:
leverage risk, FINR: financial risk, FINFS: borrowing sources, INFD: informal debt, LEVE: financial leverage.
Table 4.7: Facets of risk, borrowing sources and debt decisions (SEM2)
This table indicates a direct link of opportunity risk and leverage risk to borrowing sources and borrowing sources
to informal debt and financial leverage at a significant level (p<0.1). In addition, borrowing sources are a mediator
between opportunity risk, leverage risk, and debt decisions at a significant level.
Relationships Unstandardised
Weights
Standardised
Weights S.E. C.R. P
Hypotheses
I. Direct relationship
FINFS <--- SOCR 0.013 0.017 0.041 0.323 0.747
FINFS <--- OPPR 0.097 0.107 0.049 1.997 0.046** H4.1
FINFS <--- TIMR 0.010 0.009 0.067 0.149 0.882
FINFS <--- CHOIR -0.083 -0.078 0.061 -1.354 0.176
FINFS <--- LEVR 0.209 0.242 0.045 4.594 0.000*** H4.1
FINFS <--- FINR 0.012 0.017 0.034 0.356 0.722
FINFS <--- SAFR 0.019 0.019 0.048 0.386 0.699
INFD <--- FINFS 0.060 0.176 0.017 3.650 0.000*** H4.5
LEVE <--- FINFS 0.250 0.260 0.045 5.514 0.000*** H4.6
II. Indirect relationship
OPPR->FINFS->INFD 0.006 0.019 *** H4.9
OPPR->FINFS->LEVE 0.024 0.028 *** H4.10
LEVR->FINFS->INFD 0.013 0.042 *** H4.9
LEVR->FINFS->LEVE 0.052 0.063 *** H4.10
Note: *: p<0.1, **: p<0.05, ***: p<0.01
SAFR: safety risk, SOCR: social risk, OPPR: opportunity risk, TIMR: time risk, CHOIR: choice risk, LEVR:
leverage risk, FINR: financial risk, FINFS: borrowing sources, INFD: informal debt, LEVE: financial leverage.

83
Figure 4.4: Borrowing sources, perceived risk and debt decisions (SEM3)
This figure indicates that borrowing sources affect perceived risk, informal debt and financial leverage. Perceived
risk also relates to informal debt at a significant level. SEM3, however, finds no significant relationship of
perceived risk to financial leverage. Moreover, perceived risk significantly mediates between borrowing sources
and informal debt.
Model fit criteria: Chi-square: 14.181, df: 12, GFI: 0.993, TLI: 0.978, CFI: 0.994, RMSEA: 0.021.
FINFS: borrowing sources, PERI: perceived risk, GEN: gender, AGE: age, EDU: education, MAR: marital status,
INC: income, FIL: financial literacy, INFD: informal debt, LEVE: financial leverage.
Table 4.8: Borrowing sources, perceived risk, debt decisions (SEM3)
This table reveals the direct association of borrowing sources with perceived risk as well as debt decisions.
Perceived risk also pertains to informal debt at a significant level. The perceived risk significantly mediates
between borrowing sources and informal debt. However, SEM3 finds no significant link of perceived risk to
financial leverage.
Unstandardised
Weights
Standardised
Weights S.E. C.R. P
Hypotheses
I. Direct relationship
PERI <--- FINFS 0.776 0.177 0.208 3.738 0.000*** H4.4
PERI <--- GEN 0.672 0.121 0.270 2.486 0.013**
PERI <--- EDU -0.289 -0.043 0.329 -0.879 0.379
PERI <--- AGE -0.289 -0.085 0.164 -1.765 0.077*
PERI <--- FIL 0.079 0.094 0.041 1.935 0.053*
INFD <--- PERI 0.010 0.124 0.004 2.579 0.010** H4.2
INFD <--- FINFS 0.051 0.149 0.017 3.092 0.002*** H4.5
INFD <--- MAR -0.052 -0.130 0.019 -2.747 0.006***
LEVE <--- INC 0.120 0.144 0.039 3.106 0.002***
LEVE <--- FIL 0.031 0.168 0.008 3.641 0.000***
LEVE <--- PERI -0.007 -0.034 0.010 -0.722 0.470 H4.3
LEVE <--- FINFS 0.272 0.283 0.045 6.030 0.000*** H4.6
II. Indirect relationship
FINFS->PERI->INFD 0.008 0.022 *** H4.7
FINFS->PERI->LEVE -0.005 -0.006 0.470 H4.8
Note: *: p<0.1, **: p<0.05, ***: p<0.01
FINFS: borrowing sources, PERI: perceived risk, GEN: gender, AGE: age, EDU: education, MAR: marital status,
INC: income, FIL: financial literacy, INFD: informal debt, LEVE: financial leverage.

84
4.5 Results of sub-group analysis
This chapter next examines the differences in the relationship of perceived risk to borrowing
sources and debt decisions amongst sub-groups: stockbrokers and non-stockbrokers, male and
female investors and users and non-users of borrowing sources. Eight models are developed.
SEM4 will examine this relationship among investors who are also stockbrokers, while SEM5
will investigate this relationship among investors who are non-stockbrokers13. Male investors
and female investors will be presented in SEM6 and SEM7, respectively. Non-users and users
of borrowing sources will be tested through four models using multiple regression techniques
due to the small sample. This analysis will find which group has the strongest relationship of
perceived risk to debt decisions.
The first sub-group analysis is between stockbrokers (N=169) and non-stockbrokers (N=251).
Figure 4.5 and Table 4.9 summarise the results as follows. Both SEM4 and SEM5 find an
association of perceived risk (overall) with the use of borrowing sources at 0.24 (p<0.01) and
0.1 (p<0.1), and the use of informal debt at 0.13 (p<0.1) and 0.12 (p<0.05), respectively.
Borrowing sources also relate to the use of financial leverage at 0.246 (p<0.01) and 0.247
(p<0.01), respectively. These results indicate that perceived risk predicts the use of borrowing
sources and the use of informal debt, and borrowing sources pertain to the use of financial
leverage among stockbrokers and non-stockbrokers.
For the relationship between borrowing sources and the use of informal debt, only SEM4 finds
a link from borrowing sources to informal debt at 0.25 (p<0.01), while SEM5 does not. This
means that borrowing sources only relate to the use of informal debt among stockbrokers.
13 Non-stockbrokers (N=251) include, in descending order, other jobs (25.1%), banking officers (17.9%),
sales/marketing managers (14.7%), administrators (12%), investment officers (9.6%), business owners (4.8%),
accountants (3.9%), teachers/lecturers (3.2%), financial advisors (3.2%), find managers (2.8%), brokerage
managers (1.2%), CFOs (1.2%), and CEOs (0.4%).

85
Figure 4.5: Perceived risk, borrowing sources and debt decisions between stockbrokers and non-stockbrokers
This figure shows that both SEM4 and SEM5 find a link of perceived risk (overall) to borrowing sources and the use of informal debt and borrowing sources to financial
leverage at a significant level. This indicates that perceived risk directly relates to borrowing sources and informal debt, and borrowing sources are associated with financial
leverage among stockbrokers or non-stockbrokers. For the relationship between borrowing sources and informal debt, only SEM4 finds an association of borrowing sources
with informal debt at 0.25 (p<0.01), while SEM5 does not. This means that borrowing sources only explain the use of informal debt among stockbrokers.
Perceived risk, borrowing sources and debt decisions among stockbrokers (SEM4)
(N=169)
Perceived risk, borrowing sources and debt decisions among non-stockbrokers
(SEM5) (N=251)
Model fit criteria: Chi-square: 5.234, Df: 12, GFI: 0.994, TLI: 1.160, CFI: 1.000,
RMSEA: 0.000.
Model fit criteria: Chi-square: 14.828, Df: 12, GFI: 0.988, TLI: 0.948, CFI: 0.986,
RMSEA: 0.031.
PERI: perceived risk, FINFS: borrowing sources, GEN: gender, AGE: age, EDU: education levels, MAR: marital status, INC: income, FIL: financial literacy,
INFD: informal debt, LEVE: financial leverage.

86
Table 4.9: Perceived risk, borrowing sources and debt decisions between stockbrokers and non-stockbrokers
This table presents that both SEM4 and SEM5 find a link of perceived risk (overall) to borrowing sources and the use of informal debt and borrowing sources to financial
leverage at a significant level. This indicates that perceived risk directly relates to borrowing sources and informal debt, and borrowing sources are associated with financial
leverage among stockbrokers and non-stockbrokers. For the relationship between borrowing sources and informal debt, only SEM4 finds an association of borrowing sources
with informal debt at 0.25 (p<0.01), while SEM5 does not. This means that borrowing sources only explain the use of informal debt among stockbrokers.
Perceived risk, borrowing sources and debt decisions among stockbrokers
(SEM4) (N=169)
Perceived risk, borrowing sources and debt decisions among non-non-stockbrokers
(SEM5) (N=251)
*: p<0.1, **: p<0.01, ***: p<0.001, PERI: perceived risk, FINFS: borrowing sources, GEN: gender, AGE: age, EDU: education levels, MAR: marital status, INC: income,
FIL: financial literacy, INFD: informal debt, LEVE: financial leverage.

87
The second sub-group analysis is between male (N=258) and female investors (N=162). Figure
4.6 and Table 4.10 present the findings of the relationship between perceived risk, borrowing
sources, and debt decisions between male and female investors. SEM6 finds a positive link of
perceived risk (overall) to borrowing sources at 0.21 (p<0.01) and the use of informal debt at
0.2 (p<0.01), and a negative association of perceived risk with the use of financial leverage at
-0.13 (p<0.05), while SEM7 does not. Both these SEMs uncover a positive connection of
borrowing sources to the use of financial leverage at 0.35 (p<0.01) and 0.17 (p<0.05),
respectively.
These findings indicate that perceived risk can predict the use of borrowing sources, informal
debt and financial leverage among male investors. Borrowing sources can explain the use of
financial leverage among male and female investors. It is worthy of note that SEM6 does find
that perceived risk is negatively associated with the use of financial leverage among male
investors, while both SEM1 and SEM2 do not find a significant association between perceived
risk and financial leverage among all investors.
Perceived risk, in short, is positively related to the use of informal debt among investors and
inversely associated with the use of financial leverage among male investors. That is, higher-
risk concern investors tend to use higher informal debt and lower financial leverage. This result
is plausible because, in a typical debt portfolio, the total debt is 100%, which means that if the
use of informal debt increases, the use of formal debt must decrease.

88
Figure 4.6: Perceived risk, borrowing sources and debt decisions between male and female investors
This figure shows that SEM6 finds a positive link of perceived risk (overall) to borrowing sources and the use of informal debt, and a negative link of perceived risk to the use
of financial leverage, while SEM7 does not. Both SEMs present a relationship of borrowing sources to the use of financial leverage at 0.35 (p<0.01) and 0.17 (p<0.05),
respectively. These results mean that perceived risk can predict the use of borrowing sources, informal debt, and financial leverage among male investors. In contrast, only
borrowing sources can explain the use of financial leverage among female investors.
Perceived risk, borrowing sources and debt decisions among male investors (SEM6)
(N=258)
Perceived risk, borrowing sources and debt decisions among female investors
(SEM7) (N=162)
Model fit criteria: Chi-square: 4.584, Df: 9, GFI: 0.996, TLI: 1.091, CFI: 1.000,
RMSEA: 0.000.
Model fit criteria: Chi-square: 6.750, Df: 9, GFI: 0.991, TLI: 1.066, CFI: 1.000,
RMSEA: 0.031.
PERI: perceived risk, FINFS: borrowing sources, GEN: gender, AGE: age, EDU: education levels, MAR: marital status, INC: income, FIL: financial literacy,
INFD: informal debt, LEVE: financial leverage.

89
Table 4.10: Perceived risk, borrowing sources and debt decisions between male and female investors
This table presents that SEM6 finds a positive link of perceived risk (overall) to borrowing sources and the use of informal debt, and a negative link of perceived risk to the use
of financial leverage, while SEM7 does not. Both SEMs present a relationship of borrowing sources to the use of financial leverage at 0.35 (p<0.01) and 0.16 (p<0.05),
respectively. These results mean that perceived risk can predict the use of borrowing sources, informal debt, and financial leverage among male investors. In contrast, only
borrowing sources can explain the use of financial leverage among female investors.
Perceived risk, borrowing sources and debt decisions among male investors (SEM6)
(N=258)
Perceived risk, borrowing sources and debt decisions among female investors
(SEM7) (N=162)
*: p<0.1, **: p<0.01, ***: p<0.001, PERI: perceived risk, FINFS: borrowing sources, GEN: gender, AGE: age, EDU: education levels, MAR: marital status, INC: income,
FIL: financial literacy, INFD: informal debt, LEVE: financial leverage.
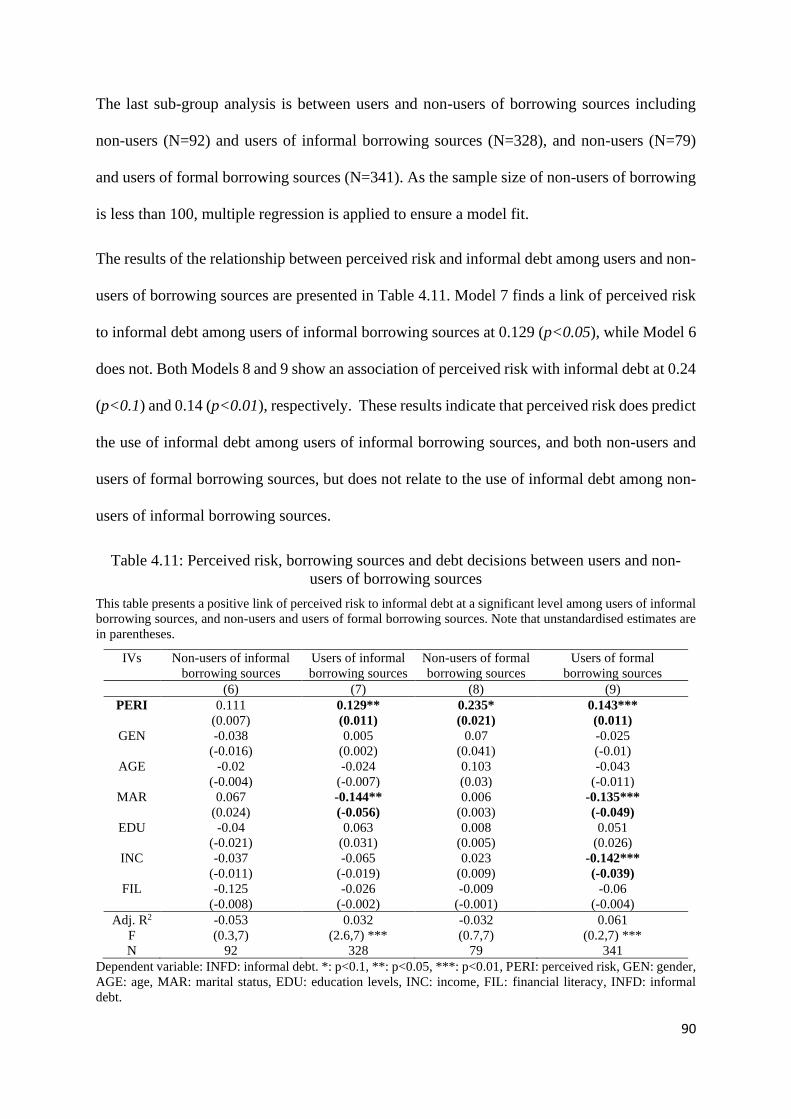
90
The last sub-group analysis is between users and non-users of borrowing sources including
non-users (N=92) and users of informal borrowing sources (N=328), and non-users (N=79)
and users of formal borrowing sources (N=341). As the sample size of non-users of borrowing
is less than 100, multiple regression is applied to ensure a model fit.
The results of the relationship between perceived risk and informal debt among users and non-
users of borrowing sources are presented in Table 4.11. Model 7 finds a link of perceived risk
to informal debt among users of informal borrowing sources at 0.129 (p<0.05), while Model 6
does not. Both Models 8 and 9 show an association of perceived risk with informal debt at 0.24
(p<0.1) and 0.14 (p<0.01), respectively. These results indicate that perceived risk does predict
the use of informal debt among users of informal borrowing sources, and both non-users and
users of formal borrowing sources, but does not relate to the use of informal debt among non-
users of informal borrowing sources.
Table 4.11: Perceived risk, borrowing sources and debt decisions between users and non-
users of borrowing sources
This table presents a positive link of perceived risk to informal debt at a significant level among users of informal
borrowing sources, and non-users and users of formal borrowing sources. Note that unstandardised estimates are
in parentheses.
IVs Non-users of informal
borrowing sources
Users of informal
borrowing sources
Non-users of formal
borrowing sources
Users of formal
borrowing sources
(6) (7) (8) (9)
PERI 0.111
(0.007)
0.129**
(0.011)
0.235*
(0.021)
0.143***
(0.011)
GEN -0.038
(-0.016)
0.005
(0.002)
0.07
(0.041)
-0.025
(-0.01)
AGE -0.02
(-0.004)
-0.024
(-0.007)
0.103
(0.03)
-0.043
(-0.011)
MAR 0.067
(0.024)
-0.144**
(-0.056)
0.006
(0.003)
-0.135***
(-0.049)
EDU -0.04
(-0.021)
0.063
(0.031)
0.008
(0.005)
0.051
(0.026)
INC -0.037
(-0.011)
-0.065
(-0.019)
0.023
(0.009)
-0.142***
(-0.039)
FIL -0.125
(-0.008)
-0.026
(-0.002)
-0.009
(-0.001)
-0.06
(-0.004)
Adj. R2 -0.053 0.032 -0.032 0.061
F (0.3,7) (2.6,7) *** (0.7,7) (0.2,7) ***
N 92 328 79 341
Dependent variable: INFD: informal debt. *: p<0.1, **: p<0.05, ***: p<0.01, PERI: perceived risk, GEN: gender,
AGE: age, MAR: marital status, EDU: education levels, INC: income, FIL: financial literacy, INFD: informal
debt.

91
In summary, between subgroups, perceived risk has the strongest relationship to the use of
informal debt among non-users of formal borrowing, followed by male investors, users of
formal borrowing, stockbrokers, users of informal borrowing, and non-stockbrokers. Female
investors’ perceived risk does not explain their use of informal debt. Alternatively, some
demographics, marital status, and financial literacy can explain this use of informal debt among
female investors, which are presented in Section 4.7.
4.6 Robustness check
This chapter applies other techniques to ensure the robustness of the results found by the SEM
findings. The additional tests are the following; alternative measures of perceived risk and debt
decisions, multiple linear regression, stepwise regression, Hayes and Preacher's approach,
causality analysis in the SEM model, the T-test, and solutions to locations and response biases.
The methodology used here was outlined in Section 3.4.
4.6.1 Robustness check using alternative measures
Additional measures are then applied to perceived risk and debt decisions. Perceived risk is
measured by summing up the seven facets without using logarithm (ln) for each facet. Debt
decisions are computed through the total informal and formal debt.
The eighth SEM model, SEM8, is developed to test the relationship of perceived risk to
borrowing sources and debt decisions. SEM8 aims to examine the robustness of the results by
SEMs using alternative measures for perceived risk and debt decisions.
Figure 4.7 and Table 4.12 summarise the results of SEM8. Perceived risk directly relates to
borrowing sources at 0.13 (p<0.01) and debt decisions at 0.08 (p<0.1). Borrowing sources is
associated with debt decisions at 0.32 (p<0.01). Borrowing sources mediate between perceived
risk and debt decisions at 0.04 (p<0.01). These results are consistent with those from SEM1,
indicating the link of perceived risk to debt decisions are robust using additional measures.
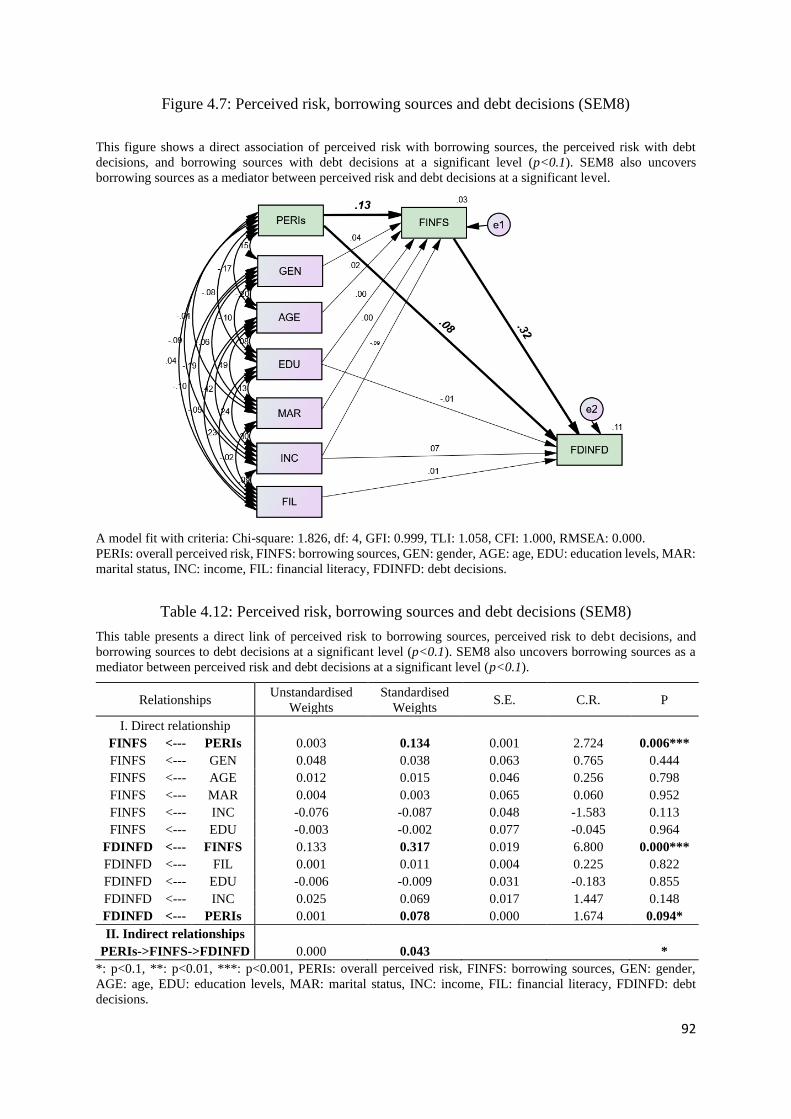
92
Figure 4.7: Perceived risk, borrowing sources and debt decisions (SEM8)
This figure shows a direct association of perceived risk with borrowing sources, the perceived risk with debt
decisions, and borrowing sources with debt decisions at a significant level (p<0.1). SEM8 also uncovers
borrowing sources as a mediator between perceived risk and debt decisions at a significant level.
A model fit with criteria: Chi-square: 1.826, df: 4, GFI: 0.999, TLI: 1.058, CFI: 1.000, RMSEA: 0.000.
PERIs: overall perceived risk, FINFS: borrowing sources, GEN: gender, AGE: age, EDU: education levels, MAR:
marital status, INC: income, FIL: financial literacy, FDINFD: debt decisions.
Table 4.12: Perceived risk, borrowing sources and debt decisions (SEM8)
This table presents a direct link of perceived risk to borrowing sources, perceived risk to debt decisions, and
borrowing sources to debt decisions at a significant level (p<0.1). SEM8 also uncovers borrowing sources as a
mediator between perceived risk and debt decisions at a significant level (p<0.1).
Relationships Unstandardised
Weights
Standardised
Weights S.E. C.R. P
I. Direct relationship
FINFS <--- PERIs 0.003 0.134 0.001 2.724 0.006***
FINFS <--- GEN 0.048 0.038 0.063 0.765 0.444
FINFS <--- AGE 0.012 0.015 0.046 0.256 0.798
FINFS <--- MAR 0.004 0.003 0.065 0.060 0.952
FINFS <--- INC -0.076 -0.087 0.048 -1.583 0.113
FINFS <--- EDU -0.003 -0.002 0.077 -0.045 0.964
FDINFD <--- FINFS 0.133 0.317 0.019 6.800 0.000***
FDINFD <--- FIL 0.001 0.011 0.004 0.225 0.822
FDINFD <--- EDU -0.006 -0.009 0.031 -0.183 0.855
FDINFD <--- INC 0.025 0.069 0.017 1.447 0.148
FDINFD <--- PERIs 0.001 0.078 0.000 1.674 0.094*
II. Indirect relationships
PERIs->FINFS->FDINFD 0.000 0.043 *
*: p<0.1, **: p<0.01, ***: p<0.001, PERIs: overall perceived risk, FINFS: borrowing sources, GEN: gender,
AGE: age, EDU: education levels, MAR: marital status, INC: income, FIL: financial literacy, FDINFD: debt
decisions.

93
4.6.2 Robustness check using multiple and stepwise regression
The models using multiple regression are each labelled “a” and models with stepwise
regression are each labelled “b”, with results shown in Table 4.13. The results show a
significant relationship of perceived risk and borrowing sources to informal debt, borrowing
sources to financial leverage, perceived risk to borrowing sources, borrowing sources to
perceived risk, and opportunity risk and leverage risk to borrowing sources. In general, these
results are consistent with those from the SEMs.
4.6.3 Robustness check using the Hayes and Preacher’s approach
The approach by Hayes and Preacher (2010) tests perceived risk as a mediator between
borrowing sources and informal debt and borrowing sources as a mediator between perceived
risk and debt decisions. This approach was mentioned in Section 3.4.1.
The results are shown in Table 4.14. Models 1-7 indicate that borrowing sources significantly
mediate between perceived risk and informal debt in Model 1, between perceived risk and
financial leverage in Model 2, opportunity risk and informal debt in Model 3, opportunity risk
and financial leverage in Model 4, leverage risk and informal debt in Model 5, and leverage
risk and financial leverage in Model 6. Moreover, perceived risk significantly mediates
between borrowing sources and informal debt in Model 7. Overall, the results from applying
the Hayes and Preacher's approach are consistent with those using SEMs.
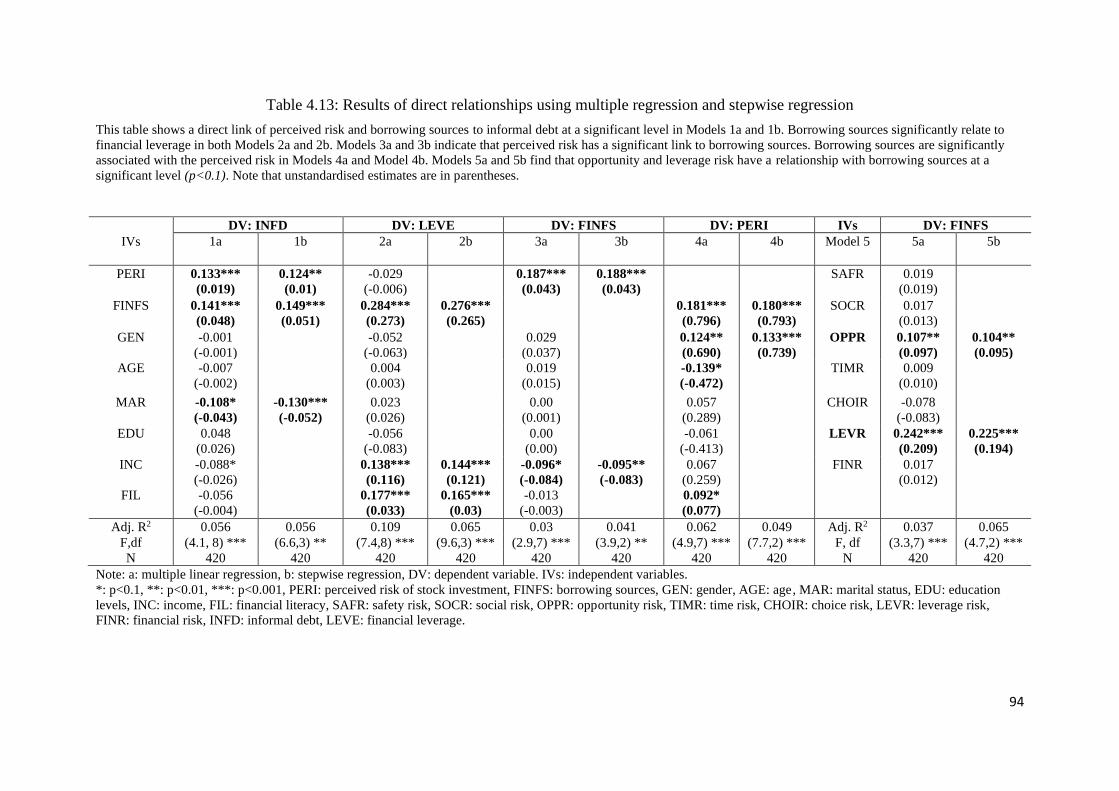
94
Table 4.13: Results of direct relationships using multiple regression and stepwise regression
This table shows a direct link of perceived risk and borrowing sources to informal debt at a significant level in Models 1a and 1b. Borrowing sources significantly relate to
financial leverage in both Models 2a and 2b. Models 3a and 3b indicate that perceived risk has a significant link to borrowing sources. Borrowing sources are significantly
associated with the perceived risk in Models 4a and Model 4b. Models 5a and 5b find that opportunity and leverage risk have a relationship with borrowing sources at a
significant level (p<0.1). Note that unstandardised estimates are in parentheses.
IVs
DV: INFD DV: LEVE DV: FINFS DV: PERI IVs DV: FINFS
1a 1b 2a 2b 3a 3b 4a 4b Model 5 5a 5b
PERI 0.133***
(0.019)
0.124**
(0.01)
-0.029
(-0.006)
0.187***
(0.043)
0.188***
(0.043)
SAFR 0.019
(0.019)
FINFS 0.141***
(0.048)
0.149***
(0.051)
0.284***
(0.273)
0.276***
(0.265)
0.181***
(0.796)
0.180***
(0.793)
SOCR 0.017
(0.013)
GEN -0.001
(-0.001)
-0.052
(-0.063)
0.029
(0.037)
0.124**
(0.690)
0.133***
(0.739)
OPPR 0.107**
(0.097)
0.104**
(0.095)
AGE -0.007
(-0.002)
0.004
(0.003)
0.019
(0.015)
-0.139*
(-0.472)
TIMR 0.009
(0.010)
MAR -0.108*
(-0.043)
-0.130***
(-0.052)
0.023
(0.026)
0.00
(0.001)
0.057
(0.289)
CHOIR -0.078
(-0.083)
EDU 0.048
(0.026)
-0.056
(-0.083)
0.00
(0.00)
-0.061
(-0.413)
LEVR 0.242***
(0.209)
0.225***
(0.194)
INC -0.088*
(-0.026)
0.138***
(0.116)
0.144***
(0.121)
-0.096*
(-0.084)
-0.095**
(-0.083)
0.067
(0.259)
FINR 0.017
(0.012)
FIL -0.056
(-0.004)
0.177***
(0.033)
0.165***
(0.03)
-0.013
(-0.003)
0.092*
(0.077)
Adj. R2 0.056 0.056 0.109 0.065 0.03 0.041 0.062 0.049 Adj. R2 0.037 0.065
F,df (4.1, 8) *** (6.6,3) ** (7.4,8) *** (9.6,3) *** (2.9,7) *** (3.9,2) ** (4.9,7) *** (7.7,2) *** F, df (3.3,7) *** (4.7,2) ***
N 420 420 420 420 420 420 420 420 N 420 420
Note: a: multiple linear regression, b: stepwise regression, DV: dependent variable. IVs: independent variables.
*: p<0.1, **: p<0.01, ***: p<0.001, PERI: perceived risk of stock investment, FINFS: borrowing sources, GEN: gender, AGE: age, MAR: marital status, EDU: education
levels, INC: income, FIL: financial literacy, SAFR: safety risk, SOCR: social risk, OPPR: opportunity risk, TIMR: time risk, CHOIR: choice risk, LEVR: leverage risk,
FINR: financial risk, INFD: informal debt, LEVE: financial leverage.
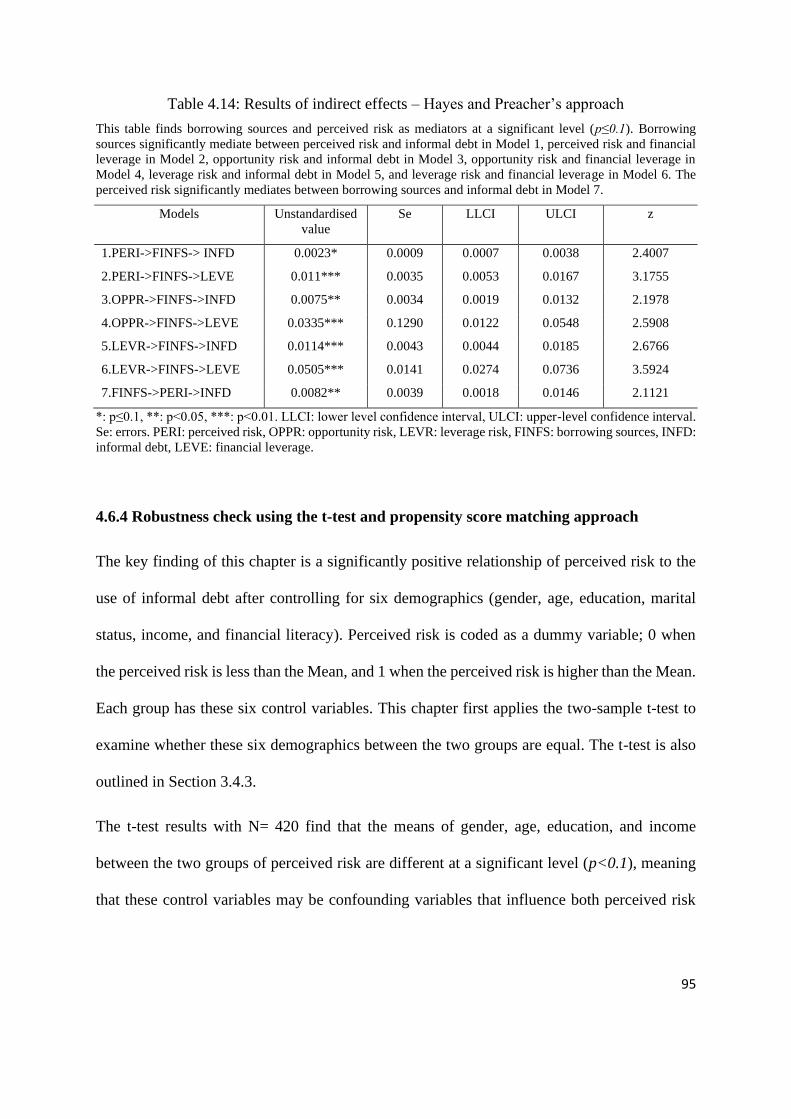
95
Table 4.14: Results of indirect effects – Hayes and Preacher’s approach
This table finds borrowing sources and perceived risk as mediators at a significant level (p≤0.1). Borrowing
sources significantly mediate between perceived risk and informal debt in Model 1, perceived risk and financial
leverage in Model 2, opportunity risk and informal debt in Model 3, opportunity risk and financial leverage in
Model 4, leverage risk and informal debt in Model 5, and leverage risk and financial leverage in Model 6. The
perceived risk significantly mediates between borrowing sources and informal debt in Model 7.
Models Unstandardised
value
Se LLCI ULCI z
1.PERI->FINFS-> INFD 0.0023* 0.0009 0.0007 0.0038 2.4007
2.PERI->FINFS->LEVE 0.011*** 0.0035 0.0053 0.0167 3.1755
3.OPPR->FINFS->INFD 0.0075** 0.0034 0.0019 0.0132 2.1978
4.OPPR->FINFS->LEVE 0.0335*** 0.1290 0.0122 0.0548 2.5908
5.LEVR->FINFS->INFD 0.0114*** 0.0043 0.0044 0.0185 2.6766
6.LEVR->FINFS->LEVE 0.0505*** 0.0141 0.0274 0.0736 3.5924
7.FINFS->PERI->INFD 0.0082** 0.0039 0.0018 0.0146 2.1121
*: p≤0.1, **: p<0.05, ***: p<0.01. LLCI: lower level confidence interval, ULCI: upper-level confidence interval.
Se: errors. PERI: perceived risk, OPPR: opportunity risk, LEVR: leverage risk, FINFS: borrowing sources, INFD:
informal debt, LEVE: financial leverage.
4.6.4 Robustness check using the t-test and propensity score matching approach
The key finding of this chapter is a significantly positive relationship of perceived risk to the
use of informal debt after controlling for six demographics (gender, age, education, marital
status, income, and financial literacy). Perceived risk is coded as a dummy variable; 0 when
the perceived risk is less than the Mean, and 1 when the perceived risk is higher than the Mean.
Each group has these six control variables. This chapter first applies the two-sample t-test to
examine whether these six demographics between the two groups are equal. The t-test is also
outlined in Section 3.4.3.
The t-test results with N= 420 find that the means of gender, age, education, and income
between the two groups of perceived risk are different at a significant level (p<0.1), meaning
that these control variables may be confounding variables that influence both perceived risk
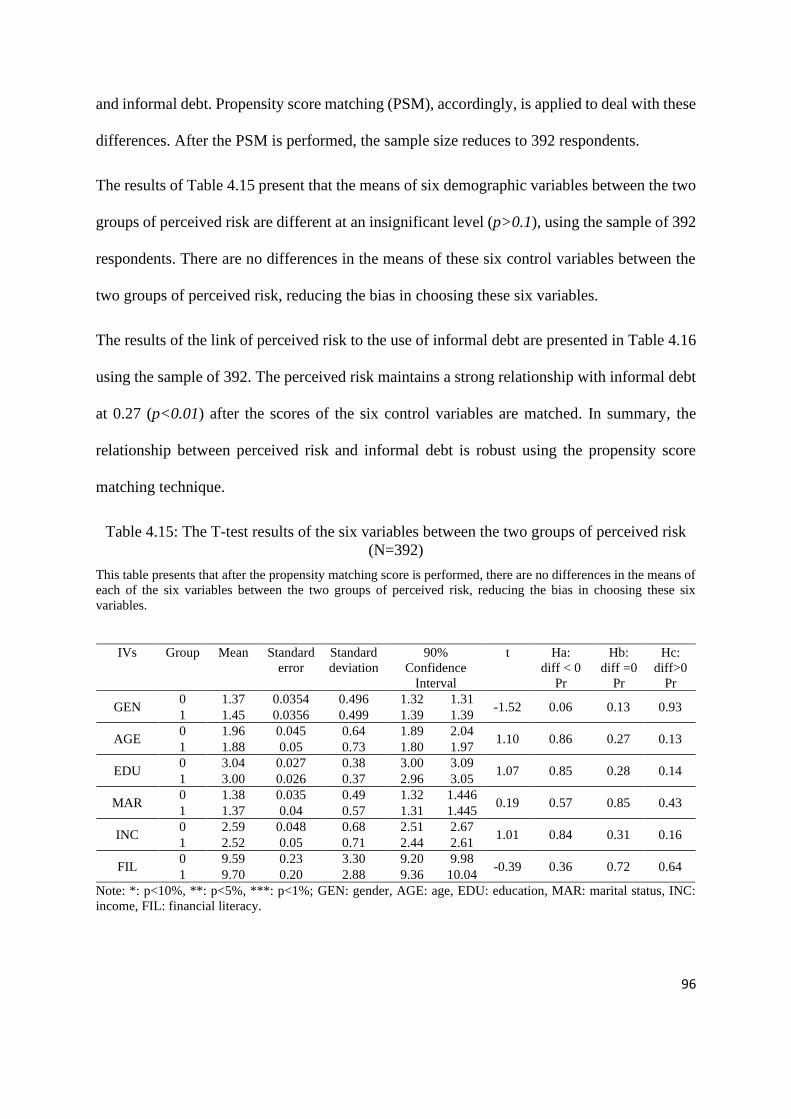
96
and informal debt. Propensity score matching (PSM), accordingly, is applied to deal with these
differences. After the PSM is performed, the sample size reduces to 392 respondents.
The results of Table 4.15 present that the means of six demographic variables between the two
groups of perceived risk are different at an insignificant level (p>0.1), using the sample of 392
respondents. There are no differences in the means of these six control variables between the
two groups of perceived risk, reducing the bias in choosing these six variables.
The results of the link of perceived risk to the use of informal debt are presented in Table 4.16
using the sample of 392. The perceived risk maintains a strong relationship with informal debt
at 0.27 (p<0.01) after the scores of the six control variables are matched. In summary, the
relationship between perceived risk and informal debt is robust using the propensity score
matching technique.
Table 4.15: The T-test results of the six variables between the two groups of perceived risk
(N=392)
This table presents that after the propensity matching score is performed, there are no differences in the means of
each of the six variables between the two groups of perceived risk, reducing the bias in choosing these six
variables.
IVs Group Mean Standard
error
Standard
deviation
90%
Confidence
Interval
t Ha:
diff < 0
Pr
Hb:
diff =0
Pr
Hc:
diff>0
Pr
GEN 0 1.37 0.0354 0.496 1.32 1.31
-1.52 0.06 0.13 0.93 1 1.45 0.0356 0.499 1.39 1.39
AGE 0 1.96 0.045 0.64 1.89 2.04
1.10 0.86 0.27 0.13 1 1.88 0.05 0.73 1.80 1.97
EDU 0 3.04 0.027 0.38 3.00 3.09
1.07 0.85 0.28 0.14 1 3.00 0.026 0.37 2.96 3.05
MAR 0 1.38 0.035 0.49 1.32 1.446
0.19 0.57 0.85 0.43 1 1.37 0.04 0.57 1.31 1.445
INC 0 2.59 0.048 0.68 2.51 2.67
1.01 0.84 0.31 0.16 1 2.52 0.05 0.71 2.44 2.61
FIL 0 9.59 0.23 3.30 9.20 9.98
-0.39 0.36 0.72 0.64 1 9.70 0.20 2.88 9.36 10.04
Note: *: p<10%, **: p<5%, ***: p<1%; GEN: gender, AGE: age, EDU: education, MAR: marital status, INC:
income, FIL: financial literacy.

97
Table 4.16: The results for the relationship between perceived risk and debt decisions
(N=392)
This table presents that perceived risk maintains a strong relationship with the use of informal debt at 0.27
(p<0.05) using the propensity score matching method.
Probit regression Number of obs = 392
Wald chi2(7) = 13.66
Prob>chi2 = 0.0576
Log pseudolikelihood = -261.47 Pseudo R2 = 0.0262
INFD Coef. Robust Std.
Err.
z p> |𝑧| [90% Conf. Interval]
PERIdummy 0.274 0.129 2.11 0.035** 0.060 0.487
GEN 0.003 0.132 0.03 0.980 -0.214 0.221
AGE 0.024 0.112 0.22 0.827 -0.160 0.209
EDU 0.038 0.172 0.22 0.824 -0.245 0.322
MAR -0.221 0.139 -1.59 0.112 -0.451 0.007
INC -0.128 0.106 -1.20 0.229 -0.302 0.046
FIL -0.039 0.022 -1.80 0.072 -0.075 -0.003
Constant 0.873 0.605 1.44 0.149 -0.122 1.868
**: p<5%, Dependent variable: INFD: informal debt. PERIdummy: perceived risk, GEN: gender, AGE: age,
EDU: education, MAR: marital status, INC: income, FIL: financial literacy.
4.6.5 Robustness check on locations selection bias and response bias
The methodology used here has been presented in Chapter 3. Briefly, this chapter examines
and concludes that locations and response bias are not related to the relationship of perceived
risk to informal debt.
This chapter also examines whether respondents’ locations dampen the association between
perceived risk and informal debt alongside other demographics such as gender, age, marital
status, education, income, and financial literacy.
The results are shown in Table 4.17, in which locations (denoted as PLACE) in both Model 1
and 2 do not relate to informal debt at a significant level (p<0.1). Locations also do not dampen
the link of perceived risk to informal debt and, as a result, this minimises the bias in location
selections.
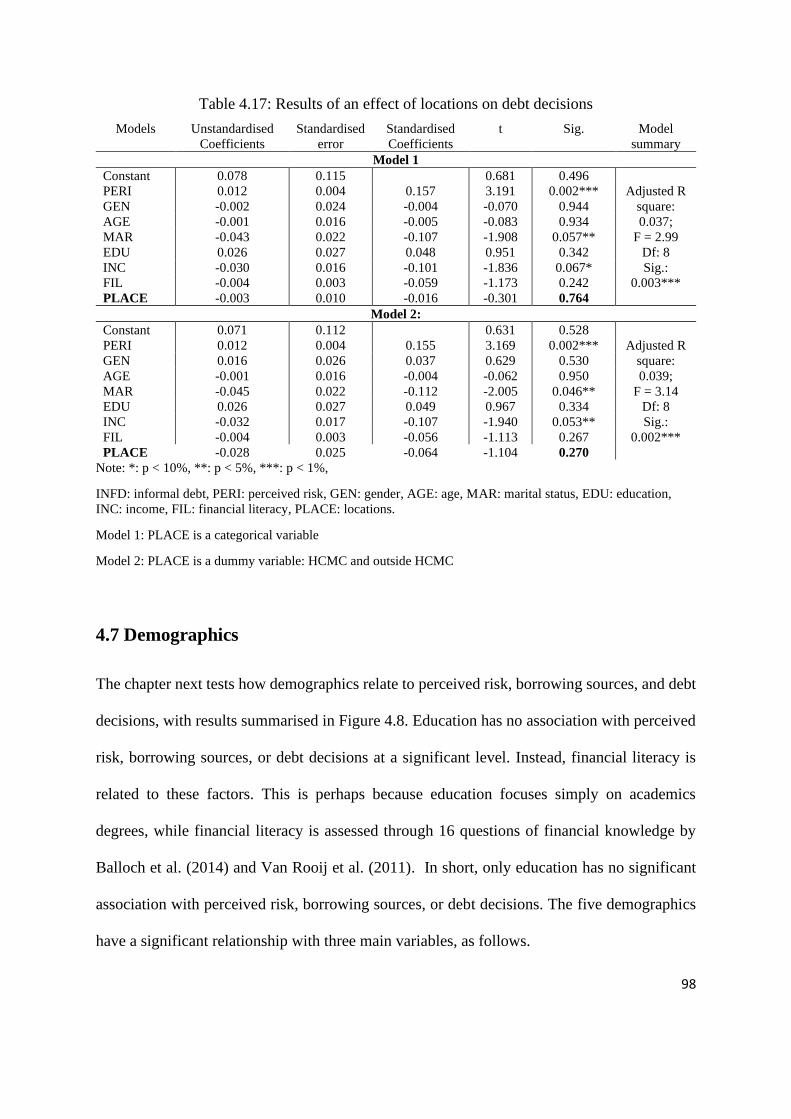
98
Table 4.17: Results of an effect of locations on debt decisions
Models Unstandardised
Coefficients
Standardised
error
Standardised
Coefficients
t Sig. Model
summary
Model 1
Constant 0.078 0.115 0.681 0.496
Adjusted R
square:
0.037;
F = 2.99
Df: 8
Sig.:
0.003***
PERI 0.012 0.004 0.157 3.191 0.002***
GEN -0.002 0.024 -0.004 -0.070 0.944
AGE -0.001 0.016 -0.005 -0.083 0.934
MAR -0.043 0.022 -0.107 -1.908 0.057**
EDU 0.026 0.027 0.048 0.951 0.342
INC -0.030 0.016 -0.101 -1.836 0.067*
FIL -0.004 0.003 -0.059 -1.173 0.242
PLACE -0.003 0.010 -0.016 -0.301 0.764
Model 2:
Constant 0.071 0.112 0.631 0.528
Adjusted R
square:
0.039;
F = 3.14
Df: 8
Sig.:
0.002***
PERI 0.012 0.004 0.155 3.169 0.002***
GEN 0.016 0.026 0.037 0.629 0.530
AGE -0.001 0.016 -0.004 -0.062 0.950
MAR -0.045 0.022 -0.112 -2.005 0.046**
EDU 0.026 0.027 0.049 0.967 0.334
INC -0.032 0.017 -0.107 -1.940 0.053**
FIL -0.004 0.003 -0.056 -1.113 0.267
PLACE -0.028 0.025 -0.064 -1.104 0.270
Note: *: p < 10%, **: p < 5%, ***: p < 1%,
INFD: informal debt, PERI: perceived risk, GEN: gender, AGE: age, MAR: marital status, EDU: education,
INC: income, FIL: financial literacy, PLACE: locations.
Model 1: PLACE is a categorical variable
Model 2: PLACE is a dummy variable: HCMC and outside HCMC
4.7 Demographics
The chapter next tests how demographics relate to perceived risk, borrowing sources, and debt
decisions, with results summarised in Figure 4.8. Education has no association with perceived
risk, borrowing sources, or debt decisions at a significant level. Instead, financial literacy is
related to these factors. This is perhaps because education focuses simply on academics
degrees, while financial literacy is assessed through 16 questions of financial knowledge by
Balloch et al. (2014) and Van Rooij et al. (2011). In short, only education has no significant
association with perceived risk, borrowing sources, or debt decisions. The five demographics
have a significant relationship with three main variables, as follows.

99
Firstly, gender positively relates to perceived risk and negatively pertains to financial leverage
among stockbrokers. This means that female investors have a higher level of risk concerns than
male investors, and female stockbrokers use a lower level of financial leverage than male
stockbrokers. This result seems consistent with prior studies in which females are more risk-
averse than males (e.g. Barber & Odean, 2001; Frijns et al., 2008; Grable, 2000; Hallahan et
al., 2003; Kannadhasan, 2015; Lucarelli & Brighetti, 2011; Tho et al., 2018; Yao et al., 2011).
Secondly, age is negatively associated with perceived risk but positively connected with
financial leverage among non-stockbrokers. That is, the older the investors are, the lower the
level of risk concerns about stock investment, and the higher the financial leverage used. This
is consistent with previous studies (Frijns et al., 2008; Grable, 2000; Pålsson, 1996; Wang &
Hanna, 1997).
Thirdly, marital status has a negative association with the use of informal debt. Marital status
also has an inverse association with informal debt among users of borrowing sources and
female investors. This indicates that married investors use a lower level of informal debt than
single investors. These results are consistent with that of Grable (2000), in which single people
take more risk than married ones.
Fourthly, income has an inverse relationship with borrowing sources and informal debt, and a
positive link with financial leverage. This means that higher-income investors tend to use fewer
borrowing sources and a lower level of informal debt but use a higher level of financial
leverage. This also reveals that higher-income investors are less likely to use informal debt but
more likely to use formal debt. This appears consistent with previous research in which higher-
income investors tend to take more risk (Grable, 2000; Hallahan et al., 2003; Hallahan, Faff,
& McKenzie, 2004; Morin & Suarez, 1983; Riley Jr & Chow, 1992; Yao et al., 2011).
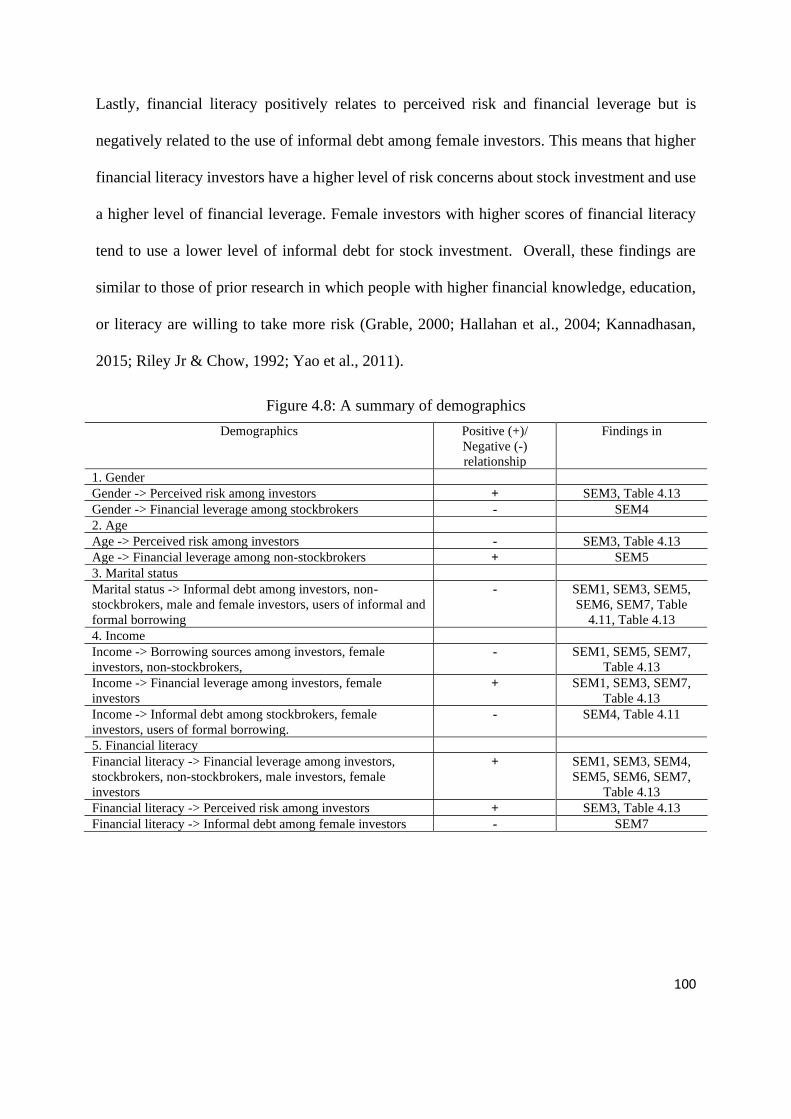
100
Lastly, financial literacy positively relates to perceived risk and financial leverage but is
negatively related to the use of informal debt among female investors. This means that higher
financial literacy investors have a higher level of risk concerns about stock investment and use
a higher level of financial leverage. Female investors with higher scores of financial literacy
tend to use a lower level of informal debt for stock investment. Overall, these findings are
similar to those of prior research in which people with higher financial knowledge, education,
or literacy are willing to take more risk (Grable, 2000; Hallahan et al., 2004; Kannadhasan,
2015; Riley Jr & Chow, 1992; Yao et al., 2011).
Figure 4.8: A summary of demographics
Demographics Positive (+)/
Negative (-)
relationship
Findings in
1. Gender
Gender -> Perceived risk among investors + SEM3, Table 4.13
Gender -> Financial leverage among stockbrokers - SEM4
2. Age
Age -> Perceived risk among investors - SEM3, Table 4.13
Age -> Financial leverage among non-stockbrokers + SEM5
3. Marital status
Marital status -> Informal debt among investors, non-
stockbrokers, male and female investors, users of informal and
formal borrowing
- SEM1, SEM3, SEM5,
SEM6, SEM7, Table
4.11, Table 4.13
4. Income
Income -> Borrowing sources among investors, female
investors, non-stockbrokers,
- SEM1, SEM5, SEM7,
Table 4.13
Income -> Financial leverage among investors, female
investors
+ SEM1, SEM3, SEM7,
Table 4.13
Income -> Informal debt among stockbrokers, female
investors, users of formal borrowing.
- SEM4, Table 4.11
5. Financial literacy
Financial literacy -> Financial leverage among investors,
stockbrokers, non-stockbrokers, male investors, female
investors
+ SEM1, SEM3, SEM4,
SEM5, SEM6, SEM7,
Table 4.13
Financial literacy -> Perceived risk among investors + SEM3, Table 4.13
Financial literacy -> Informal debt among female investors - SEM7

101
4.8 Conclusions, contributions, implications, limitations and further
research
4.8.1 Conclusions
This chapter investigates the extent to which perceived risk directly relates to borrowing
sources and debt decisions and mediates between borrowing sources and debt decisions.
Perceived risk is positively associated with borrowing sources and the use of informal debt.
Leverage risk and opportunity risk also directly relates to borrowing sources. Borrowing
sources is positively related to perceived risk and debt decisions. Perceived risk is a mediator
between borrowing sources and informal debt, and borrowing sources acts as a mediator
between perceived risk and debt decisions. These results are robust after controlling for
demographics and using additional techniques.
Perceived risk also has the strongest relationship with informal debt among non-users of formal
borrowing, followed by male investors, users of formal borrowing, stockbrokers, users of
informal borrowing, and non-stockbrokers. In addition, perceived risk inversely pertains to the
use of financial leverage among male investors.
4.8.2 Contributions and implications
This chapter provides useful insights into investors’ use of debt in the Vietnam stock market,
and the vital roles of perceived risk and borrowing sources in this use of debt. This may
generalise to other stock markets. Additionally, the concept of perceived risk derived from
consumer behaviour framework provides a better understanding of investors’ behaviour
towards debt decisions. The assumption by finance theory is that investors are only concerned
about gains or losses (financial risk) when making an investment decision. Alternatively, this
chapter finds that investors are concerned not only about financial risk but also about safety

102
risk, social risk, time risk, opportunity risk, choice risk, and leverage risk. Finally, the structural
equation models employed to detect the inter-relationship between perceived risk, borrowing
sources, and debt decisions among investors, stockbrokers, non-stockbrokers, male investors,
female investors, users of borrowing, and non-users of borrowing contribute to the finance
literature.
The results of this chapter have two implications. First is the risk concerns between investors
and consumers. When making a purchase decision, both investors and consumers are
concerned about financial loss, personal information leaked by hackers or virus, low esteem
when making a large loss, and time loss when spending much time for research on information
related to the purchase but the outcomes being not what they expect. Integrating consumer
behaviour theory into investor behaviour implies that either consumers or investors have some
similar risk concerns when making any purchase decisions despite their different preferences
for the purchase. Apart from the similarity, investors have additional risk concerns about
missing out on other financial investment opportunities, a wrong choice of stocks for
investment and stock returns are inadequate to cover their debt. Hence, these risk concerns
should be taken into account during the investment decision-making process due to the impact
on choices between informal and formal debt.
Second is the tendency of high-risk perception associated with the use of informal debt and
more borrowing sources related to the use of both informal and formal debt for stock
investment. In general, investors borrow money from parents, friends and/or brokerage firms
for stock investment having the following implications.
(i) For borrowers, they should be careful about choices of stocks for investment and monitor
the investment results frequently to execute timely adjustments in investment strategy,

103
reducing the risk of breaking private relationships with informal lenders and legal problems
with formal lenders. An additional recommendation to the borrowers is that although informal
borrowing is common in Vietnamese culture, borrowers should be aware of using money from
these sources effectively and respectfully.
(ii) For lenders, especially informal lenders, they should consider prudently about lending
money to investors because, in some instances, investors borrow money from many informal
sources, and as a result, failure in stock investment may have a negative influence on the family
life of many lenders, even spreading outside the network. To minimise the possible problems,
informal lenders should improve knowledge of stock investment to advise their borrowers on
stock investment, rather than giving money to borrowers and leaving them to make all
investment decisions themselves. Moreover, informal lenders should have good financial plans
for their family in which money should be divided into many blocks to ensure that lending
money to investors does not affect their family life.
4.8.3 Limitations and further research
This chapter has some limitations. The use of debt may be affected by investors’ payment
methods. Investors may pay interest to informal lenders, share benefits based on contributed
capital with informal lenders, or pay no interest. Differences in payment approaches may lead
to differences in the use of debt. It is also essential to examine the heterogeneity in perceived
risk, as well as debt decisions between non-payers and payers of interest. An additional possible
situation is that informal lenders may borrow money from third parties and lend investors this
borrowing. If they do so, debt problems may spread to the broader network and even the entire
community.

104
Although the findings are robust after controlling for demographic variables and using
additional techniques, this chapter finds no instrumental variables (IVs) to deal with
endogenous problems that may be a threat to inferring a causal relationship of perceived risk
to the use of informal debt. This chapter also focuses on the relationship between perceived
risk and debt decisions. Other behavioural factors, for example, risk tolerance or trust in the
stock market, should be considered because they may impact on debt decisions. Future research
should pay attention to these aspects.

105
Chapter 5 Essay Two: Risk Tolerance, Investment
Horizons and Debt Decisions14
5.1 Introduction
The main objective of this chapter is to investigate the extent to which risk tolerance directly
relates to debt decisions and mediates between investment horizons and debt decisions.
Use of debt is a contributor to the stock market and economic development as a whole
(Mohieldin & Wright, 2000; Turvey & Kong, 2010; Wu et al., 2016). The literature, however,
has paid little attention to the use of debt by investors. This chapter will investigate whether
risk tolerance is strongly related to debt decisions.
“Debt decisions” was defined in Chapter 3 as the level of debt investors use for stock
investment. “Financial leverage” is the credit investors obtain through only brokerage firms.
“Informal debt” is the credit investors obtain through family and non-family sources. A debt
decision is a risky decision no matter what kind of debt is used, informal or formal, because
users of debt may face possible insolvency if they do not manage debt well. The importance of
debt decisions in the stock market was mentioned in Chapter 1.
“Risk tolerance” is defined by Grable (2000) as “the maximum amount of uncertainty that
someone is willing to accept when making a financial decision” (p. 625). Risk tolerance lies
14 The early version of this chapter was presented at the 23rd International Congress on Modeling and Simulation
(MODSIM2019), Modeling and Simulation Society of Australia and New Zealand Inc., Australia, December
2019. https://mssanz.org.au/modsim2019/index.html
The proposal related to this chapter was presented at the 23rd New Zealand Finance Colloquium – NZFC, Lincoln
University, New Zealand, February 2019 https://nzfc.ac.nz/cfp/.
106
at the heart of the financial field because it affects a broad range of personal financial choices
(Grable & Roszkowski, 2008). The existing literature finds that risk tolerance is associated
with risky decisions (see, for example, Bailey & Kinerson, 2005; Corter & Chen, 2006; Dorn
& Huberman, 2005).
The remainder of this chapter is as follows. The literature review and hypothesis development
are presented in Section 5.2. Section 5.3 outlines the methodology. Section 5.4 reports the main
results. Section 5.5 reports the results of the additional analysis. Section 5.6 exhibits the
robustness check. Section 5.7 presents the demographics discussion. Section 5.8 ends with
conclusions, contributions, implications, limitations and further research.
5.2. Literature review and hypothesis development
5.2.1 Risk tolerance in decision-making
Risk tolerance is defined as the willingness to engage in risky activities (Grable, 2008; Okun,
1976; Weber et al., 2002). The risk tolerance of a person is described as his or her perception
of change and danger (Okun, 1976); or as “a tendency to be attracted or repelled by alternatives
that he or she perceives as more risky over alternatives perceived as less risky” (Weber &
Milliman, 1997, p. 128). Risk tolerance is sometimes referred to as “risk preference” (Grable,
2008).
There has been no research on the relationships between risk tolerance, investment horizons
and debt decisions to the best of the author’s knowledge. This chapter thus examines these
using the following hypotheses.
5.2.2 Hypothesis development
Direct relationships

107
The literature finds a higher level of risk tolerance is associated with a riskier decision. For
example, risk tolerance causes investors to hold a higher-risk investment portfolio or invest in
stocks over bonds (Bailey & Kinerson, 2005; Corter & Chen, 2006; Dorn & Huberman, 2005).
There is a possibility that higher-risk tolerance relates to the use of higher debt for stock
investment.
H5.1: The higher the level of risk tolerance, the higher the level of the financial leverage used.
H5.2: The higher the level of risk tolerance, the higher the level of the informal debt used.
Previous studies find that higher risk tolerance is associated with higher stock ownership (Cong
& Hanna, 2007; Sung & Hanna, 1998; Xiao, 1996). Between short term and long term stock
investment, short term investment (e.g. four months) has lower returns than long term
investment (e.g., 15 months ) (Gaspar, Massa, & Matos, 2005). Very short term investors, that
is, day traders, often buy and sell speculative stocks (Barber, Lee, Liu, & Odean, 2014), which
also has sub-optimal outcomes (Lo, Repin, & Steenbarger, 2005). Risk levels between short-
term and long-term stock investment remain unclear in academic research. This chapter,
therefore, argues that investing in stocks for the short-term may be riskier than investing in
stocks for the long-term, and that risk tolerance may be positively associated with the short
term over long term stock investment.
H5.3: The higher the level of risk tolerance, the higher the ratio of short-term stock investment
to long term.
Recent research, for example, Schooley & Worden (1996) find that investment in risky assets
is positively associated with risk tolerance. Markiewicz and Weber (2013) also find that day
stock trading positively relates to gambling risk propensity. Given these results, this thesis

108
argues that a shorter stock investment horizon positively relates to higher risk tolerance and the
use of higher debt, using the following hypotheses.
H5.4: The higher the ratio of short-term stock investment to long term, the higher the level of
informal debt used.
H5.5: The higher the ratio of short-term stock investment to long term, the higher the level of
financial leverage used.
H5.6: The higher the ratio of short term stock investment to long term, the higher the level of
risk tolerance.
Indirect (mediating) relationships
Previous studies find some behavioural factors as mediators in decision-making. For example,
perceived uncertainty mediates between extraversion traits and safer investment decisions
(Trang & Khuong, 2017). The mediating role of perceived uncertainty is used to account for
why a higher level of extraversion trait leads to a choice of safer investment. Performance risk
is a mediating variable between perceived quality and value (Sweeney et al., 1999). Financial
risk is a mediator between perceived sacrifice and perceived value (Agarwal & Teas, 2001).
Given this evidence, and also as hypothesised above in that investment horizons may relate to
risk tolerance, and risk tolerance may pertain to debt decisions, this chapter argues that risk
tolerance may mediate between investment horizons and debt decisions.
H5.7: Risk tolerance mediates between investment horizons and informal debt.
H5.8: Risk tolerance mediates between investment horizons and formal debt.

109
5.3 Methodology
The methodology of this section was covered in Chapter 3. This chapter thus only presents
measures of risk tolerance, investment horizons, and debt decisions, as shown in Figure 5.1.
Risk tolerance is measured by the total scores of the 13-questions developed by Grable and
Lytton (2001) and Grable and Lytton (1999). The 13-questions scale of risk tolerance has been
widely used and assessed as a highly explanatory instrument for one’s risk tolerance (e.g.
Gilliam, Chatterjee, & Grable, 2010; Grable & Joo, 2004; Grable & Lytton, 2001; Grable &
Roszkowski, 2008).
The term “investment horizons” is defined as the ratio of short-term stock investment to long
term (less than one year divided by one year or more). This is consistent with prior research
(e.g. Bebchuk & Stole, 1993; Levhari & Levy, 1977; Vives, 1995).
Figure 5.1: Measures of risk tolerance, investment horizons, and debt decisions
Risk tolerance Investment horizons Debt decisions
RITO = ∑ 𝑹𝑰𝑻𝑶𝒕𝒋=𝟏 j
RITOm = ∑ 𝑹𝑰𝑻𝑶𝒎𝒏𝒊=𝟏 i
where:
RITO : Risk tolerance
RITOm: Risk tolerance
RITOj : the score of question jth
RITOmi: low, moderate or high
scores of risk tolerance of ith
investors
j =1, t=13, i: ith investors, n=420.
SHORT = ∑ (SHORT)ni i
LONG = ∑ (LONG)ni i
SHOLO = ∑ (𝑆𝐻𝑂𝑅𝑇
𝐿𝑂𝑁𝐺)n
i i
where:
SHORT: Short-term stock
investment (less than one year)
LONG: Long-term stock
investment (one year or more)
SHOLO: the ratio of short-term
stock investment to long term
(known as investment horizons)
i: ith investors, n=420.
LEVE = ∑ (𝐿𝐸𝑉𝐸𝑖)𝐧𝐢
INFD = ∑ (𝐼𝑁𝐹𝐷𝑖)𝐧𝐢
FDINFD=∑ (𝑰𝑵𝑭𝑫 + 𝑭𝑫)𝒊𝐧𝐢
where:
LEVE: Financial leverage
INFD: Informal debt
FD: Formal debt
FDINFD: total debt
i: ith investors, n=420.

110
5.4 Main results
5.4.1 Investor characteristics and investment horizons
The investor characteristics were introduced in Chapter 3. This chapter thus only presents
investment horizons. Stock investment is divided into 60% for the short term (less than one
year) and 40% for the long term (one year or more), on average (Mean), as revealed in Table
5.1. Around 3% of investors do not invest in stocks for the short term, and about 18% of them
do not invest in stocks for the long term. This means that 97% of investors invest in stocks for
the short term, and 82% of investors invest in stocks for the long term.
Table 5.1: A summary of investment horizons
This table shows that stock investment is divided into 60% for the short term (less than 1 year) and 40% for the
long term (1 year or more), on average. Stock investment is divided into short term higher than long term.
% of the stock investment for Short term (less than one year) Long term (one year or more)
Frequency % Frequency %
0% 14 3 79 18
Between over 0% and under 50% 113 27 167 40
50% 53 13 53 13
Between over 50% and under 100% 167 40 113 27
100% 73 17 8 2
Mean 0.6 0.4
N 420 100% 420 100%
5.4.2 Levels of risk tolerance
The levels of risk tolerance are shown in Table 5.2 among non-users and users of debt, non-
stockbrokers and stockbrokers, male and female investors, and all investors. Overall, the level
of risk tolerance of users of debt is higher than that of non-users of debt. It is noted that on
average, users of debt have a higher risk tolerance than non-users of debt, no matter what kinds

111
of debt are used. This table also shows that non-stockbrokers and male investors have slightly
higher scores of risk tolerance than stockbrokers and female investors, respectively.
For the data of the 420 investors, the result indicates that among investors, 49% of investors
are classified as having a low risk tolerance, 8% as having a moderate risk tolerance, and 43%
as having a high risk tolerance. These figures are not much different from the result of prior
research. For example, Grable & Lytton (2001) finds that 27% of students and staff have a low
risk tolerance, 60% have a moderate risk tolerance, and 13% have a high risk tolerance. As a
result, investors may be higher risk tolerant than university students and staff.
Table 5.2: A summary of investors’ risk tolerance
This table shows that users of debt, non-stockbrokers, and male investors have a higher level of risk tolerance
than non-users of debt, stockbrokers, and female investors, respectively. Moreover, 49% of investors are classified
as having low risk tolerance, 8% as having a moderate risk tolerance, and 43% as having high risk tolerance.
Risk
tolerance
Non-users
of debt
Users
of debt
Non-
stock-
brokers
Stock-
brokers
Male
investors
Female
investors
All investors
Freq. %
Mean 28.55 29.58 29.47 29.28 29.41 29.39 29.40
Median 28.00 30.00 30 30 30 29 30.00
Minimum 18.00 15.00 15 15 15 15 15.00
Maximum 41.00 44.00 44 42 44 41 44.00
Std. dev. 5.12 4.52 4.83 4.36 4.8 4.39 4.64
Low 206 49
Moderate 33 8
High 181 43
N 74 346 250 170 258 162 420 100%
Note: Std. dev.: standard deviation

112
5.4.3 Test of reliability of the risk tolerance scale and correlations
The reliability coefficients (Cronbach’s alpha) of 13 items of risk tolerance is 0.618, as shown
in Table 5.3. This result indicates an acceptable internal consistency and allows this scale to be
used as a variable in a model.
Table 5.3: Results of the reliability of the 13-item risk tolerance
This table shows that the reliability of the 13-item scale of risk tolerance measured by Cronbach’s alpha is 0.618.
This means that the 13-item scale of risk tolerance has sufficient reliability to be used as an independent variable
in a model.
Scale Mean
if Item
Deleted
Scale
Variance if
Item Deleted
Corrected
Item-Total
Correlation
Cronbach's
Alpha if Item
Deleted
Cronbach’s
alpha
RITO: risk tolerance 0.618
RITO1 26.7500 19.248 0.268 0.582
RITO2 26.6548 17.845 0.319 0.569
RITO3 26.7238 19.336 0.196 0.594
RITO4 26.8762 19.407 0.204 0.593
RITO5 27.1143 19.681 0.248 0.586
RITO6 27.3024 18.799 0.267 0.581
RITO7 27.3524 18.873 0.249 0.584
RITO8 27.1286 18.198 0.306 0.573
RITO9 27.6929 18.385 0.273 0.580
RITO10 26.9167 19.623 0.147 0.604
RITO11 26.8857 18.889 0.176 0.602
RITO12 28.0524 19.754 0.358 0.578
RITO13 27.3214 18.414 0.310 0.572
Mean: 29.39; Variance: 21.5; Standard deviation: 4.64; No of item: 13
The correlations between factors are shown in Table 5.4. As guided by Hair et al. (2014), a
high correlation “as indicative of a poor correlation matrix” occurs if the variables had a partial
correlation value above 0.7 (p.102). This chapter finds that most variables have inter-
correlations at a significant level (p<0.05) and have correlation coefficients lower than 0.7.
Risk tolerance is positively correlated with financial leverage at 0.16 (p<0.01), and investment
horizons positively correlated with informal debt at 0.096 (p<0.05).

113
Table 5.4: The correlations between risk tolerance, investment horizons, and debt decisions
This table shows that most variables have inter-correlations at a significant level (p<0.05), and most pairs of variables have correlation coefficients lower than 0.7, except
risk tolerance (between RITO and RITOm) and debt decisions (between INFD and FDINFD). Risk tolerance has two measures (RITO and RITOm), and debt decisions
include informal debt (INFD) and total debt (FDINFD). This may explain why these pairs have high inter-correlations. Risk tolerance is positively correlated with financial
leverage at 0.16 (p<0.01), statistically meaning that risk tolerance increases as the use of financial leverage increases, and vice versa. Investment horizons are positively
correlated with informal debt at 0.096 (p<0.05), showing that stock investment for the short term over long term goes up as the use of informal debt goes up, and vice versa.
RITO 2 3 4 5 6 7 8 9 10 11 12 13
1.RITO 1.000
2.RITOm .786** 1.000
3.SHOLO 0.066 0.075 1.000
4.LONG 0.018 0.033 -0.384** 1.000
5.GEN 0.003 -0.027 -0.025 0.036 1.000
6.AGE 0.041 0.002 0.012 0.062 -0.197** 1.000
7.MAR 0.032 -0.009 -0.005 0.054 -0.055 0.496** 1.000
8.EDU 0.117* 0.136** 0.114* -0.046 -0.105* 0.077 0.141** 1.000
9.INC 0.142** 0.144** 0.001 0.059 -0.209** 0.374** 0.276** 0.288** 1.000
10.FIL 0.136** 0.113* 0.057 -0.089 -0.108* -0.031 -0.034 0.232** 0.126** 1.000
11.INFD -0.018 0.041 0.096* 0.037 0.049 -0.112* -0.140** -0.012 -0.096* -0.055 1.000
12.LEVE 0.160** 0.086 0.021 -0.038 -0.081 0.065 0.048 0.017 0.125* 0.174** -0.071 1.000
13.FDINFD 0.063 0.110* 0.106* 0.030 -0.002 -0.030 -0.055 -0.009 0.055 0.010 0.618** 0.287** 1.000
N 420 420 420 420 420 420 420 420 420 420 420 420 420
*. Correlation is significant at the 0.05 level (2-tailed).
**. Correlation is significant at the 0.01 level (2-tailed).
RITO (RITOm): risk tolerance, SHOLO: investment horizons, LONG: long term stock investment. GEN: gender, AGE: age, MAR: marital status, EDU: education,
INC: income, FIL: financial literacy, INFD: informal debt, LEVE: financial leverage, FDINFD: total debt
114
5.4.4 Main results and discussion
Two main structural equation models (SEMs) are developed to examine the direct and indirect
relationship between risk tolerance, investment horizons and debt decisions. SEM1 examines
the direct effect of risk tolerance on investment horizons and debt decisions. SEM2 investigates
risk tolerance as a mediator between stock investment horizons and debt decisions.
Both these SEM models include six demographics acting as control variables; gender, age,
marital status, education, income, and financial literacy; with the aim of examining whether
these control variables dampen the relationships between risk tolerance, investment horizons,
and debt decisions. The link of these control variables to risk tolerance, investment horizons,
and debt decisions is presented in Section 5.7.
The results of SEM1 are presented in Figure 5.2 and Table 5.5. Risk tolerance is significantly
related to the use of financial leverage at 0.12 (p<0.05), supporting H5.1 but is insignificantly
associated with the use of informal debt and investment horizons, which does not support H5.2
and H5.3. However, the results of SEM3 below show a significantly positive relationship of
risk tolerance to the use of informal debt and investment horizons among stockbrokers, which
partly supports H5.2 and H5.3.
Statistically, when risk tolerance increases by one standard deviation, the use of financial
leverage increases by 0.12 (p<0.05). This result is consistent with prior scholars (see, for
example, Bailey & Kinerson, 2005; Corter & Chen, 2006; Dorn & Huberman, 2005). This
means that risk tolerance can explain the use of financial leverage for stock investment in which
higher risk tolerance leads to the use of higher financial leverage. The reasons why investors
use financial leverage were presented in Section 3.6. As defined by Grable (2000), risk
tolerance refers to the willingness to take risk, and thus, risk-tolerant investors are more likely

115
to accept higher debt to achieve higher returns. They tend to invest a large amount of money
in stocks, and consequently, they would borrow money from formal lenders rather than
informal lenders because only formal lenders, i.e. brokerage firms can financially meet this
borrowing.
Investment horizons are associated with the use of informal debt at 0.1 (p<0.05), supporting
H5.4, but are not related to the use of financial leverage at a significant level (p<0.1), which
does not support H5.5. Investment horizons only explain the use of informal debt in which the
higher the level of short term over long term stock investment, the higher the level of informal
debt being used. This result adds to the literature alongside previous studies (e.g. Jordan &
Diltz, 2003; Jordan & Diltz, 2004). In general, compared to long-term stock investment (1 year
or more stock holdings), short-term stock investment (less-than-1-year stock holdings) is
positively associated with the use of informal debt. That is, short-term investors are more likely
to borrow money from parents and friends for stock investment. An outcome of this is that
short-term investors prefer buying stocks and then selling them quickly, and as a consequence,
informal borrowing is the best choice because it helps borrowers avoid wasting time on account
of complex procedures and regulations with formal borrowing, and importantly then being able
to purchase stocks in a timely manner.

116
Figure 5.2: Risk tolerance, investment horizons, and debt decisions (SEM1)
This figure shows a direct relationship of investment horizons to the use of informal debt at 0.096 (p<0.05) and
risk tolerance to the use of financial leverage at 0.12 (p<0.05).
Model fit: Chi-square: 8.292, df: 10, GFI: 0.996, TLI: 1.025, CFI: 1.000, RMSEA: 0.000.
RITO: risk tolerance, GEN: gender, AGE: age, EDU: education, MAR: marital status, INC: income, FIL:
financial literacy, SHOLO: investment horizons, INFD: informal debt, LEVE: financial leverage.
Table 5.5: Risk tolerance, short-term stock investment, and debt decisions (SEM1)
This table shows a direct association of investment horizons with the use of informal debt at 0.096 (p<0.05) and
risk tolerance with the use of financial leverage at 0.12 (p<0.05).
Direct relationships Unstandardised
Weights
Standardised
Weights S.E. C.R. P Hypotheses
SHOLO <--- RITO 0.025 0.061 0.020 1.239 0.215 H5.3
SHOLO <--- GEN -0.061 -0.016 0.197 -0.312 0.755
SHOLO <--- EDU 0.543 0.114 0.248 2.193 0.028**
SHOLO <--- AGE 0.070 0.029 0.141 0.496 0.620
SHOLO <--- MAR -0.082 -0.023 0.202 -0.404 0.686
SHOLO <--- INC -0.132 -0.053 0.140 -0.948 0.343
SHOLO <--- FIL 0.018 0.030 0.030 0.587 0.557
LEVE <--- INC 0.070 0.090 0.038 1.866 0.062*
INFD <--- MAR -0.055 -0.140 0.019 -2.900 0.004***
LEVE <--- FIL 0.028 0.151 0.009 3.128 0.002***
INFD <--- SHOLO 0.011 0.096 0.005 1.990 0.047** H5.4
INFD <--- RITO 0.000 -0.010 0.002 -0.204 0.838 H5.2
LEVE <--- RITO 0.015 0.116 0.006 2.397 0.017** H5.1
LEVE <--- SHOLO 0.001 0.004 0.015 0.084 0.933 H5.5
Note: *: p<10%, **: p<5%, ***: p<1%
RITO: risk tolerance, GEN: gender, AGE: age, EDU: education, MAR: marital status, INC: income, FIL:
financial literacy, SHOLO: investment horizons, INFD: informal debt, LEVE: financial leverage.
117
The findings of SEM2 are shown in Figure 5.3 and Table 5.6. Like SEM1, SEM2 also finds a
positive association of risk tolerance with financial leverage at 0.12 (p<0.05) (H5.1) and
investment horizons with informal debt at 0.1 (p<0.05) (H5.4), which supports H5.1 and H5.4,
as already discussed in SEM1.
The results of SEM2 do not support H5.6, H5.5, and H5.2 because it finds an insignificant
relationship of investment horizons to risk tolerance (H5.6) and to financial leverage (H5.5),
and risk tolerance to informal debt (H5.2). However, the results of SEM3 find a significantly
positive association between investment horizons and risk tolerance, and between risk
tolerance and informal debt among stockbrokers, which partly supports H5.6 and H5.2.
Overall, it is only H5.5 that the findings from SEMs do not support; that is, there is no support
found for the hypothesis that there is a relationship between investment horizons and financial
leverage.
The results of SEM2 also find no significant mediating role of risk tolerance in the relationship
between investment horizons and debt decisions, which does not support H5.7 and H5.8.
However, the results of SEM7 uncover risk tolerance as a mediator between investment
horizons and informal debt among stockbrokers, which partly supports H5.7.

118
Figure 5.3: Investment horizons, risk tolerance and debt decisions (SEM2)
This figure shows the direct relationship of investment horizons to the use of informal debt at 0.1 (p<0.05) and
risk tolerance to financial leverage at 0.12 (p<0.05). SEM2 finds no mediating role of risk tolerance in the
association between investment horizons and informal debt at a significant level (p<0.1).
Model fit: Chi-square: 8.596, df: 10, GFI: 0.996, TLI: 1.020, CFI: 1.000, RMSEA: 0.000.
SHOLO: investment horizons, RITO: risk tolerance, GEN: gender, AGE: age, EDU: education, MAR: marital
status, INC: income, FIL: financial literacy, INFD: informal debt, LEVE: financial leverage.
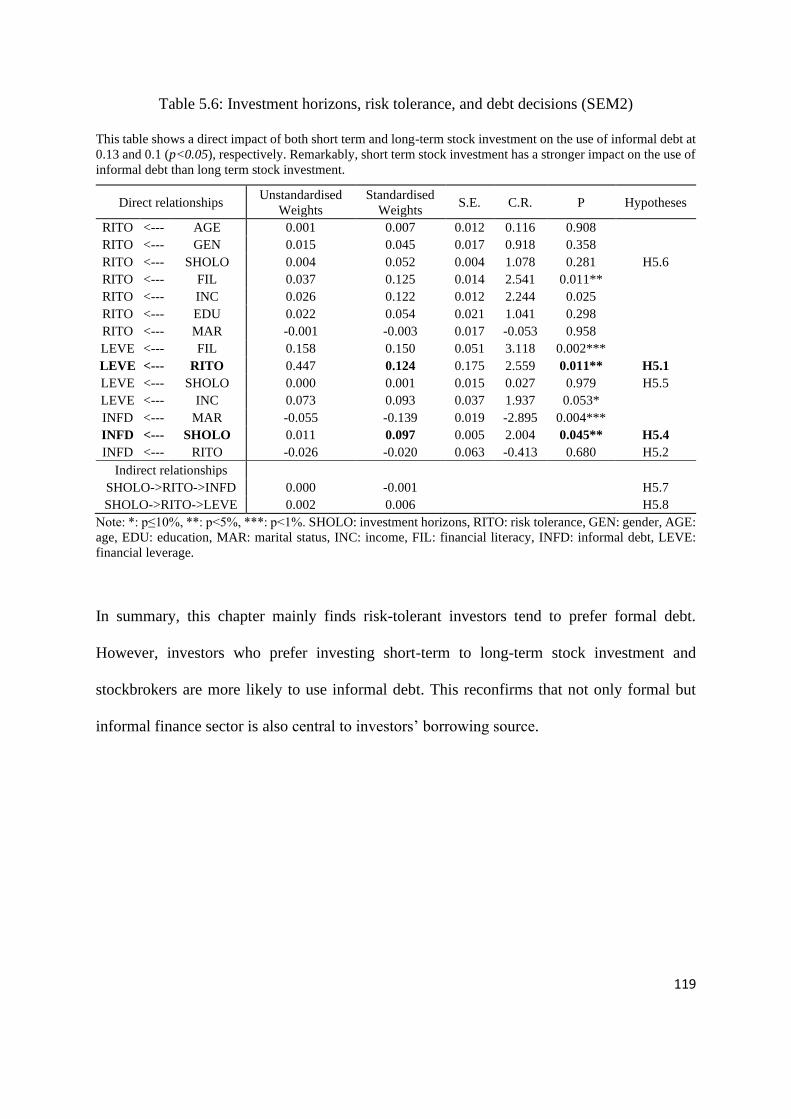
119
Table 5.6: Investment horizons, risk tolerance, and debt decisions (SEM2)
This table shows a direct impact of both short term and long-term stock investment on the use of informal debt at
0.13 and 0.1 (p<0.05), respectively. Remarkably, short term stock investment has a stronger impact on the use of
informal debt than long term stock investment.
Direct relationships Unstandardised
Weights
Standardised
Weights S.E. C.R. P Hypotheses
RITO <--- AGE 0.001 0.007 0.012 0.116 0.908
RITO <--- GEN 0.015 0.045 0.017 0.918 0.358
RITO <--- SHOLO 0.004 0.052 0.004 1.078 0.281 H5.6
RITO <--- FIL 0.037 0.125 0.014 2.541 0.011**
RITO <--- INC 0.026 0.122 0.012 2.244 0.025
RITO <--- EDU 0.022 0.054 0.021 1.041 0.298
RITO <--- MAR -0.001 -0.003 0.017 -0.053 0.958
LEVE <--- FIL 0.158 0.150 0.051 3.118 0.002***
LEVE <--- RITO 0.447 0.124 0.175 2.559 0.011** H5.1
LEVE <--- SHOLO 0.000 0.001 0.015 0.027 0.979 H5.5
LEVE <--- INC 0.073 0.093 0.037 1.937 0.053*
INFD <--- MAR -0.055 -0.139 0.019 -2.895 0.004***
INFD <--- SHOLO 0.011 0.097 0.005 2.004 0.045** H5.4
INFD <--- RITO -0.026 -0.020 0.063 -0.413 0.680 H5.2
Indirect relationships
SHOLO->RITO->INFD 0.000 -0.001 H5.7
SHOLO->RITO->LEVE 0.002 0.006 H5.8
Note: *: p≤10%, **: p<5%, ***: p<1%. SHOLO: investment horizons, RITO: risk tolerance, GEN: gender, AGE:
age, EDU: education, MAR: marital status, INC: income, FIL: financial literacy, INFD: informal debt, LEVE:
financial leverage.
In summary, this chapter mainly finds risk-tolerant investors tend to prefer formal debt.
However, investors who prefer investing short-term to long-term stock investment and
stockbrokers are more likely to use informal debt. This reconfirms that not only formal but
informal finance sector is also central to investors’ borrowing source.

120
5.5 Results of additional analysis
5.5.1 Sub-groups
The differences in the relationship between risk tolerance, investment horizons and debt
decisions are possibly different between subgroups, including stockbrokers and non-
stockbrokers, male and female investors, and users and non-users of borrowing sources.
Eight models are developed to examine this relationship. SEM3 will investigate this
relationship among stockbrokers, while SEM4 will test this relationship among non-
stockbrokers. Male and female investors will be presented in SEM5 and SEM6, respectively.
Users and non-users of borrowing sources will be tested in four models using multiple
regression techniques due to the small sample. This analysis investigates what sub-groups have
a stronger effect of risk tolerance and investment horizons in debt decisions.
The first subgroup is between stockbrokers (N=170) and non-stockbrokers (N=250).15 The
results are presented in Figure 5.4 and Table 5.7. There is a difference in the relationship
between risk tolerance, investment horizons, and debt decisions between stockbrokers and non-
stockbrokers. Namely, the risk tolerance of stockbrokers relates to investment horizons at 0.14
(p<0.1) and informal debt at 0.14 (p<0.1) in SEM3, while the risk tolerance of non-
stockbrokers is associated with financial leverage at 0.16 (p<0.05) in SEM4. Investment
horizons also pertain to informal debt at 0.17 (p<0.01) among non-stockbrokers in SEM4.
Only the results of SEM4 are consistent with SEM1. SEM3 presents new findings regarding
the significant relationship of risk tolerance to investment horizons and informal debt among
15 Non-stockbrokers (N=251) include, in descending order, other jobs (25.1%), banking officers (17.9%),
sales/marketing managers (14.7%), administrators (12%), investment officers (9.6%), business owners (4.8%),
accountants (3.9%), teachers/lecturers (3.2%), financial advisors (3.2%), find managers (2.8%), brokerage
managers (1.2%), CFOs (1.2%), and CEOs (0.4%).

121
stockbrokers. As presented above, levels of risk tolerance of non-stockbrokers are higher than
those of stockbrokers, on average. This may explain why risk-tolerant non-stockbrokers tend
to use financial leverage, while risk-tolerant stockbrokers are prone to use informal debt for
stock investment.

122
Figure 5.4: Risk tolerance, investment horizons and debt decisions between stockbrokers and non-stockbrokers
The results of SEM3 differ from those of SEM4. The risk tolerance of stockbrokers relates to investment horizons at 0.14 (p<0.1) and informal debt at 0.14 (p<0.1) in SEM3,
while the risk tolerance of non-stockbrokers is associated with financial leverage at 0.16 (p<0.05) in SEM4. Investment horizons also pertain to informal debt at 0.17 (p<0.01)
among non-stockbrokers in SEM4.
Risk tolerance, investment horizons and debt decisions among
stockbrokers (SEM3) (N=170)
Risk tolerance, investment horizons and debt decisions among non-
stockbrokers (SEM4) (N=250)
Model fit criteria: Chi-square: 8.352, Df: 9, GFI: 0.990, TLI: 1.028, CFI: 1.000,
RMSEA: 0.000.
Model fit criteria: Chi-square: 6.545, Df: 9, GFI: 0.965, TLI: 1.060, CFI: 1.000,
RMSEA: 0.031.
RITO: risk tolerance, SHOLO: stock investment horizons, GEN: gender, AGE: age, MAR: marital status, EDU: education, INC: income, FIL: financial literacy, INFD:
informal debt, LEVE: financial leverage.

123
Table 5.7: Risk tolerance, investment horizons and debt decisions between stockbrokers and non-stockbrokers
The results of SEM3 differ from those of SEM4. The risk tolerance of stockbrokers relates to investment horizons at 0.14 (p<0.1) and informal debt at 0.14 (p<0.1) in SEM3,
while the risk tolerance of non-stockbrokers is associated with financial leverage at 0.16 (p<0.05) in SEM4. Investment horizons also pertain to informal debt at 0.17 (p<0.01)
among non-stockbrokers in SEM4.
Risk tolerance, investment horizons and debt decisions among
stockbrokers (SEM3) (N=170)
Risk tolerance, investment horizons and debt decisions among non-
non-stockbrokers (SEM4) (N=250)
*: p<0.1, **: p<0.01, ***: p<0.001, RITO: risk tolerance, SHOLO: stock investment horizons, GEN: gender, AGE: age, MAR: marital status, EDU: education, INC: income,
FIL: financial literacy, INFD: informal debt, LEVE: financial leverage.
124
The second subgroup is between male (N= 258) and female investors (N=162). The results of
SEM5 focusing on male investors, and SEM6 focusing on female investors, are shown in
Figure 5.5 and Table 5.8. SEM5 shows an association of risk tolerance with financial leverage
at 0.18 (p<0.01), and investment horizons with informal debt at 0.15 (p<0.05), while SEM6
does not.
The results, in general, show that male investors’ risk tolerance and investment horizons can
explain their debt decisions, which is consistent with SEM1. In contrast, female investors’ risk
tolerance or investment horizons do not relate to their debt decisions. Female investors’
demographics which do partly account for their debt decisions are income, marital status, and
financial literacy, which are presented in Section 5.7.
The last subgroup is between users and non-users of borrowing sources, for which the data
subsets are users (N=328) and non-users of informal borrowing sources (N=92), and users
(N=78) and non-users of formal borrowing sources (N=342). Since the number of non-users of
borrowing is less than 100, in order to ensure that a model can fit with such a small sample,
this chapter applies multiple regression to test the relationship between risk tolerance,
investment horizons, and debt decisions among this subgroup.
The results of the relationship of risk tolerance and investment horizons to debt decisions
between users and non-users of borrowing sources are presented in Table 5.9. Only the risk
tolerance of users of formal borrowing sources has a significant link to financial leverage, at
0.09 (p<0.1). Also, only the investment horizons of users of borrowing sources are associated
with informal debt, at 0.13 (p<0.01). In short, risk tolerance or investment horizons can explain
debt decisions among users of borrowing sources.

125
Figure 5.5: Risk tolerance, investment horizons and debt decisions between male and female investors
This figure shows that only SEM5 finds an association of risk tolerance with financial leverage at 0.18 (p<0.01), and investment horizons with informal debt at 0.15 (p<0.05),
while SEM6 does not. This means that only male investors’ risk tolerance and investment horizons can explain their debt decisions.
Risk tolerance, investment horizons and debt decisions among male
investors (SEM5) (N=258)
Risk tolerance, investment horizons and debt decisions among female
investors (SEM6) (N=162)
Model fit criteria: Chi-square: 3.346, Df: 7, GFI: 0.997, TLI: 1.121, CFI: 1.000,
RMSEA: 0.000.
Model fit criteria: Chi-square: 4.228, Df: 7, GFI: 0.994, TLI: 1.114, CFI: 1.000,
RMSEA: 0.000.
RITO: risk tolerance, SHOLO: stock investment horizons, GEN: gender, AGE: age, MAR: marital status, EDU: education, INC: income, FIL: financial literacy, INFD:
informal debt, LEVE: financial leverage.

126
Table 5.8: Risk tolerance, investment horizons and debt decisions between male and female investors
This table presents that only SEM5 finds an association of risk tolerance with financial leverage at 0.18 (p<0.01), and investment horizons with informal debt at 0.15 (p<0.05),
while SEM6 does not. This means that only male investors’ risk tolerance and investment horizons can explain their debt decisions.
Risk tolerance, investment horizons and debt decisions among
male investors (SEM5) (N=258)
Risk tolerance, investment horizons and debt decisions among female
investors (SEM6) (N=162)
*: p<0.1, **: p<0.01, ***: p<0.001, RITO: risk tolerance, SHOLO: stock investment horizons, GEN: gender, AGE: age, MAR: marital status, EDU: education, INC: income,
FIL: financial literacy, INFD: informal debt, LEVE: financial leverage.

127
Table 5.9: Risk tolerance, investment horizons, and informal debt between users and non-
users of borrowing sources
Only the risk tolerance of users of formal borrowing has a significant link to financial leverage at 0.09 (p<0.1).
Also, only investment horizons of users of borrowing are associated with informal debt at 0.13 (p<0.01). In short,
only debtors’ risk tolerance or investment horizons can explain their debt decisions. Note: unstandardised
coefficients in the parentheses.
IVs
Informal borrowing sources Formal borrowing sources
Non-
users
Users Non-
users
Users Non-users Users Non-
users
Users
DV: INFD DV: LEVE DV: INFD DV: LEVE
RITO -0.073
(-0.089)
0.008
(0.01)
0.23**
(0.869)
0.087
(0.31)
-0.01
(-0.016)
-0.011
(-0.014)
0.15
(0.53)
0.09*
(0.28)
SHOLO -0.052
(-0.006)
0.137***
(0.014)
-0.035
(-0.012)
-0.01
(-0.003)
0.076
(0.015)
0.137**
(0.013)
0.03
(0.012)
-0.03
(-0.008)
GEN -0.001
(0.000)
0.027
(0.011)
0.04
(0.05)
-0.068
(-0.081)
0.091
(0.053)
-0.007
(-0.003)
0.03
(0.042)
-0.11**
(-0.12)
AGE -0.049
(-0.01)
-0.042
(-0.011)
-0.154
(-0.102)
0.1
(0.077)
0.047
(0.014)
-0.077
(-0.02)
-0.014
(-0.009)
0.04
(0.028)
MAR 0.059
(0.02)
-0.158**
(-0.061)
-0.031
(-0.035)
0.015
(0.017)
-0.003
(-0.002)
-0.14**
(-0.051)
-0.211
(-0.255)
0.068
(0.065)
EDU -0.045
(-0.024)
0.03
(0.02)
0.059
(0.098)
-0.11*
(-0.16)
-0.07
(-0.041)
0.034
(0.017)
-0.085
(-0.109)
-0.028
(-0.038)
INC -0.001
(0.000)
-0.03
(-0.008)
0.053
(0.043)
0.08
(0.07)
0.087
(0.035)
-0.085
(-0.021)
0.01
(0.008)
0.1*
(0.069)
FIL -0.045
(-0.017)
-0.063
(-0.023)
-0.01
(-0.01)
0.22***
(0.22)
0.091
(0.045)
-0.059
(-0.004)
-0.001
(-0.001)
0.23***
(0.21)
Adj. R2 -0.078 0.033 0.003 0.074 -0.085 0.045 -0.039 0.099
F,df 0.18,8 2.39**,8 1.03,8 4.26***,8 0.246,8 2.8***,9 0.64,8 5.7***,8
N 92 328 92 328 78 342 78 342
*: p<0.1, **: p<0.05, ***: p<0.01. IVs: independent variables, DV: dependent variables
RITO: risk tolerance, SHOLO: short-term stock investment, GEN: gender, AGE: age, MAR: marital status,
EDU: education, INC: income, FIL: financial literacy, INFD: informal debt, LEVE: financial leverage.
In summary, risk tolerance has the strongest relationship to the use of financial leverage among
non-users of informal borrowing sources, followed by male investors, non-stockbrokers, and
users of formal borrowing sources. In addition, risk tolerance also positively relates to the use
of informal debt among stockbrokers, which was above-mentioned (Section 5.4.4).
5.5.2 Mediating role of risk tolerance
This thesis develops the seventh SEM model, SEM7, to examine the mediating role of risk
tolerance. As presented above, SEM2 finds no significantly mediating role of risk tolerance in
the association of investment horizons to debt decisions among investors. This is because

128
SEM3 uncovers a significant relationship of investment horizons to risk tolerance, and risk
tolerance to informal debt among stockbrokers. SEM7, therefore, will find risk tolerance is a
mediator between investment horizons and debt decisions among stockbrokers (N=170).
The results of SEM7 are presented in Figure 5.6 and Table 5.10. Investment horizons are related
to risk tolerance at 0.14 (p<0.1), and risk tolerance to informal debt at 0.14 (p<0.1). Risk
tolerance mediates between investment horizons and informal debt at 0.021 (p<0.1).
Importantly, investment horizons are not significantly related to informal debt. Due to risk
tolerance, this relationship is significant among stockbrokers. In summary, this chapter finds
risk tolerance is not a mediator between investment horizons and debt decisions among
investors but does mediate for this relationship among stockbrokers.
Figure 5.6: Investment horizons, risk tolerance and debt decisions among stockbrokers
(N=170) (SEM7)
This figure shows an association of investment horizons with risk tolerance at 0.15 (p<0.1) and risk tolerance
with informal debt at 0.14 (p<0.1). Risk tolerance is a mediator between investment horizons and informal debt
at 0.021 (p<0.1).
Model fit: Chi-square: 7.936, df: 8, GFI: 0.991, TLI: 1.003, CFI: 1.000, RMSEA: 0.000.
SHOLO: investment horizons, RITO: risk tolerance, GEN: gender, AGE: age, EDU: education, MAR: marital
status, INC: income, FIL: financial literacy, INFD: informal debt, LEVE: financial leverage.
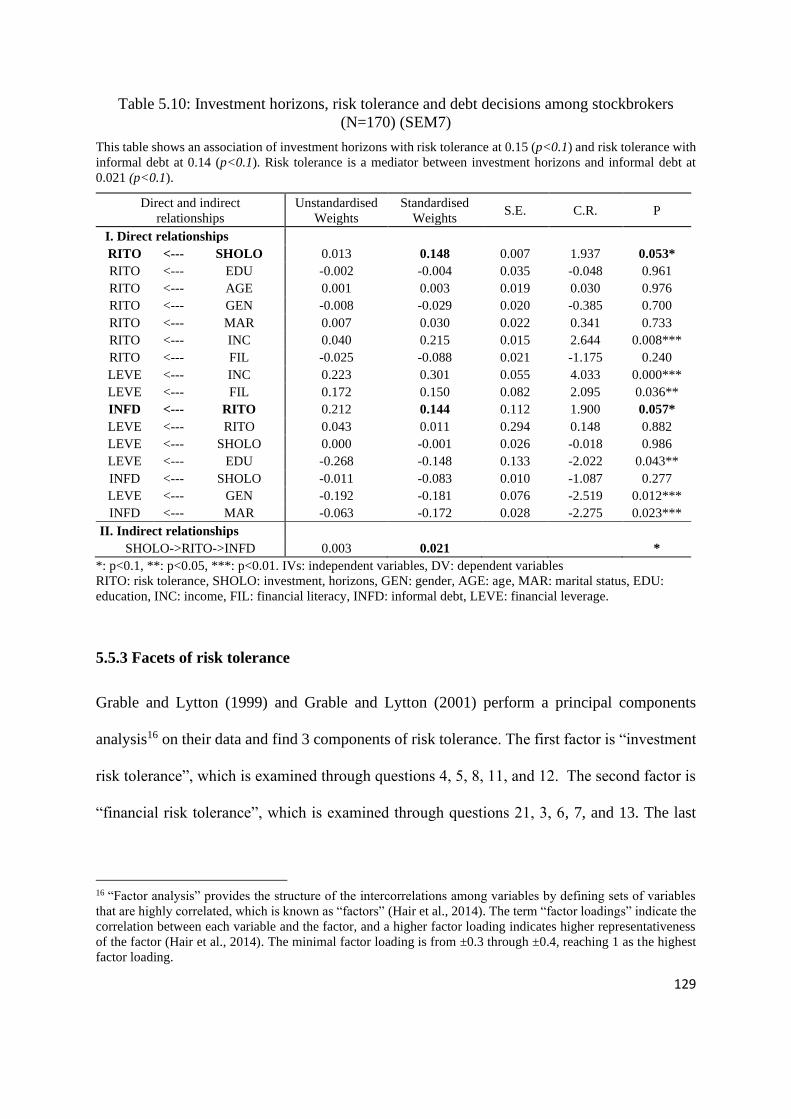
129
Table 5.10: Investment horizons, risk tolerance and debt decisions among stockbrokers
(N=170) (SEM7)
This table shows an association of investment horizons with risk tolerance at 0.15 (p<0.1) and risk tolerance with
informal debt at 0.14 (p<0.1). Risk tolerance is a mediator between investment horizons and informal debt at
0.021 (p<0.1).
Direct and indirect
relationships
Unstandardised
Weights
Standardised
Weights S.E. C.R. P
I. Direct relationships
RITO <--- SHOLO 0.013 0.148 0.007 1.937 0.053*
RITO <--- EDU -0.002 -0.004 0.035 -0.048 0.961
RITO <--- AGE 0.001 0.003 0.019 0.030 0.976
RITO <--- GEN -0.008 -0.029 0.020 -0.385 0.700
RITO <--- MAR 0.007 0.030 0.022 0.341 0.733
RITO <--- INC 0.040 0.215 0.015 2.644 0.008***
RITO <--- FIL -0.025 -0.088 0.021 -1.175 0.240
LEVE <--- INC 0.223 0.301 0.055 4.033 0.000***
LEVE <--- FIL 0.172 0.150 0.082 2.095 0.036**
INFD <--- RITO 0.212 0.144 0.112 1.900 0.057*
LEVE <--- RITO 0.043 0.011 0.294 0.148 0.882
LEVE <--- SHOLO 0.000 -0.001 0.026 -0.018 0.986
LEVE <--- EDU -0.268 -0.148 0.133 -2.022 0.043**
INFD <--- SHOLO -0.011 -0.083 0.010 -1.087 0.277
LEVE <--- GEN -0.192 -0.181 0.076 -2.519 0.012***
INFD <--- MAR -0.063 -0.172 0.028 -2.275 0.023***
II. Indirect relationships
SHOLO->RITO->INFD 0.003 0.021 *
*: p<0.1, **: p<0.05, ***: p<0.01. IVs: independent variables, DV: dependent variables
RITO: risk tolerance, SHOLO: investment, horizons, GEN: gender, AGE: age, MAR: marital status, EDU:
education, INC: income, FIL: financial literacy, INFD: informal debt, LEVE: financial leverage.
5.5.3 Facets of risk tolerance
Grable and Lytton (1999) and Grable and Lytton (2001) perform a principal components
analysis16 on their data and find 3 components of risk tolerance. The first factor is “investment
risk tolerance”, which is examined through questions 4, 5, 8, 11, and 12. The second factor is
“financial risk tolerance”, which is examined through questions 21, 3, 6, 7, and 13. The last
16 “Factor analysis” provides the structure of the intercorrelations among variables by defining sets of variables
that are highly correlated, which is known as “factors” (Hair et al., 2014). The term “factor loadings” indicate the
correlation between each variable and the factor, and a higher factor loading indicates higher representativeness
of the factor (Hair et al., 2014). The minimal factor loading is from ±0.3 through ±0.4, reaching 1 as the highest
factor loading.

130
factor is “speculative risk tolerance” comprising questions 2, 9, and 10. The 13 questions of
risk tolerance are attached at the end of this chapter.
This chapter also undertook the principal components analysis. As shown in Table 5.11 and
5.12, risk tolerance has 5 components, the eigenvalues of which are greater than 1 and explain
approximately 53% of the total variance, in comparison with the 3 components found by Grable
and Lytton (1999) and Grable and Lytton (2001). This difference may be due to the differences
between respondents (i.e., students versus investors in this chapter).
Table 5.11: Results of the total variance explained by the components of risk tolerance
This table indicates that 5 factors with eigenvalues greater than 1 account for 53.077% of the total variance of the
13 variables.
Comp-
onent
Initial Eigenvalues Extraction Sums of Squared
Loadings
Rotation Sums of Squared
Loadings
Total % of
Variance
Cumulativ
e %
Total % of
Variance
Cumulati
ve %
Total % of
Variance
Cumulative
%
1 2.395 18.421 18.421 2.395 18.421 18.421 1.591 12.239 12.239
2 1.351 10.394 28.815 1.351 10.394 28.815 1.561 12.005 24.244
3 1.093 8.406 37.22 1.093 8.406 37.22 1.436 11.048 35.292
4 1.05 8.078 45.299 1.05 8.078 45.299 1.175 9.037 44.329
5 1.011 7.779 53.077 1.011 7.779 53.077 1.137 8.749 53.077
6 0.939 7.225 60.302
7 0.889 6.842 67.144
8 0.799 6.145 73.289
9 0.793 6.099 79.388
10 0.768 5.91 85.298
11 0.666 5.124 90.422
12 0.66 5.075 95.497
13 0.585 4.503 100
Extraction Method: Principal Component Analysis. KMO and Bartlett’s Test: Kaiser-Meyer-Olkin Measure of
Sampling Adequacy: 0.713; Bartlett's Test of Sphericity: Approx. Chi-Square: 386.8, df: 78, Sig. .000

131
The results of Table 5.12 also show that some variables’ communalities are lower than 0.5, and
the Cronbach’s alpha of the 5 factors are each below 0.6, indicating that these 5 factors are not
individually strong enough to be used as distinct measures, which is consistent with the finding
of Grable and Lytton (1999), in which the Cronbach’s alpha of factors 2 and 3 are below 0.6.
Table 5.12: Five components of risk tolerance
This table shows that most loadings of each factor are highly correlated with each factor. For example, RITO09
has the loading of 0.774, indicating that the degree of correspondence between RITO09 and factor 1 is 77.4%.
Variables Cronbach
alpha (α)
Factor Communalities17
extraction
1 2 3 4 5
RITO9 0.494
0.774 0.640
RITO12 0.693 0.557
RITO3
0.478
0.742 0.625
RITO2 0.560 0.454
RITO7 0.483 0.407
RITO13 0.429 0.425
RITO6 0.385 0.257
RITO5 0.425
0.747 0.593
RITO4 0.739 0.559
RITO11 0.254
0.824 0.708
RITO8 0.517 0.480
RITO10 0.229
0.825 0.693
RITO1 0.464 0.503
RITO: risk tolerance, i: the question ith of risk tolerance
Cronbach’s alpha of risk tolerance including 13 variables: 0.618
Extraction Method: Principal Component Analysis.
Rotation Method: Varimax with Kaiser Normalization
17 Communality is defined as the total amount of variance an original variable shares with all other variables
included in the analysis (Hair et. all, 2014).

132
It is also important to note that the five factors of risk tolerance by this chapter are sub-
categories of the original three factors developed by Grable and Lytton (1999) and Grable and
Lytton (2001). Namely, as revealed in Table 5.13, investment risk tolerance is divided into two
sub-groups; risk as a level of comfort,18 and risk as a level of preferences; while in Grable and
Lytton’s studies, the two are grouped as one. Speculative risk tolerance also has two types; risk
for the choice between sure gain, and risk for the choice between sure loss; instead of the two
types being gathered into one as in the Grable and Lytton studies. In terms of financial risk
tolerance, both this chapter and Grable and Lytton’s studies have a similar result. Only question
1 in Grable and Lytton’s studies is replaced by question 2 in this chapter.
Risk tolerance, in short, has five facets instead of the three facets found by Grable and Lytton.
These are investment risk as a level of comfort, investment risk as a level of preference,
financial risk, speculative risk as a choice for a sure gain, and speculative risk as a choice for a
sure loss.
Table 5.13: Facets of risk tolerance between this chapter and Grable and Lytton’s studies
This table shows that compared with Grable and Lytton’s studies, investment risk tolerance has two sub-groups;
risk as a level of comfort, and risk as a level of preferences. Speculative risk tolerance also has two types; risk for
the choice between sure gain, and risk for the choice between sure loss. In terms of financial risk tolerance, both
this study and Grable and Lytton’s studies have a similar result, with the exception that question 1 in Grable and
Lytton’s studies is replaced by question 2 in this chapter.
Facets (Grable & Lytton, 1999, 2001) This chapter
1/ Investment risk
tolerance
RITO4, RITO5, RITO8, RITO11 and
RITO12
In terms of comfort RITO4 and RITO5
In terms of preferences RITO8 and RITO11
2/ Financial risk
tolerance
RITO1, RITO3, RITO6, RITO7 and
RITO13
RITO2, RITO3, RITO6, RITO7
and RITO13
3/ Speculative risk
tolerance
RITO2, RITO9 and RITO10
In terms of gains RITO9 and RITO12
In terms of losses RITO1 and RITO10
RITOi: the ith question of risk tolerance.
18 Grable and Lytton (1999) classified the questions of risk tolerance into eight groups, for example, the question
of “how comfortable investors are investing in shares” termed “risk as a level of comfort” (Grable & Lytton, 1999,
p. 173). This study follows the terms developed by Grable and Lytton (1999).

133
5.6 Robustness check
This chapter applies additional techniques to ensure the robustness of the results by SEMs. The
robustness check has six sections. First, risk tolerance and debt decisions have additional
measures. Second, multiple and stepwise regression testing is performed on direct
relationships. Third, Hayes and Preacher’s approach examines indirect relationships. Fourth,
the t-test and the propensity matching score examines the key result of this chapter, which is a
causal relationship of risk tolerance to debt decisions. Fifth, the instrumental variable approach
detects a causal relationship of risk tolerance to debt decisions. Lastly, the solutions reduce the
locations selection and responses biases.
5.6.1 Robustness check using additional measures
The eighth SEM model, SEM8, is developed to examine the relationship of risk tolerance to
investment horizons and debt decisions. Risk tolerance is classified as low, moderate and high
compared with Median as suggested by Grable and Lytton (1999). Debt decisions are measured
by the sum of informal and formal debt. This analysis aims to prove the robustness of results
using an alternative measure for risk tolerance and debt decisions
The results of SEM8 are presented in Figure 5.7 and Table 5.14. There is a positive link of risk
tolerance and investment horizons to debt decisions at 0.1 (p<0.05). These results are
consistent with those in SEM1 and SEM2.
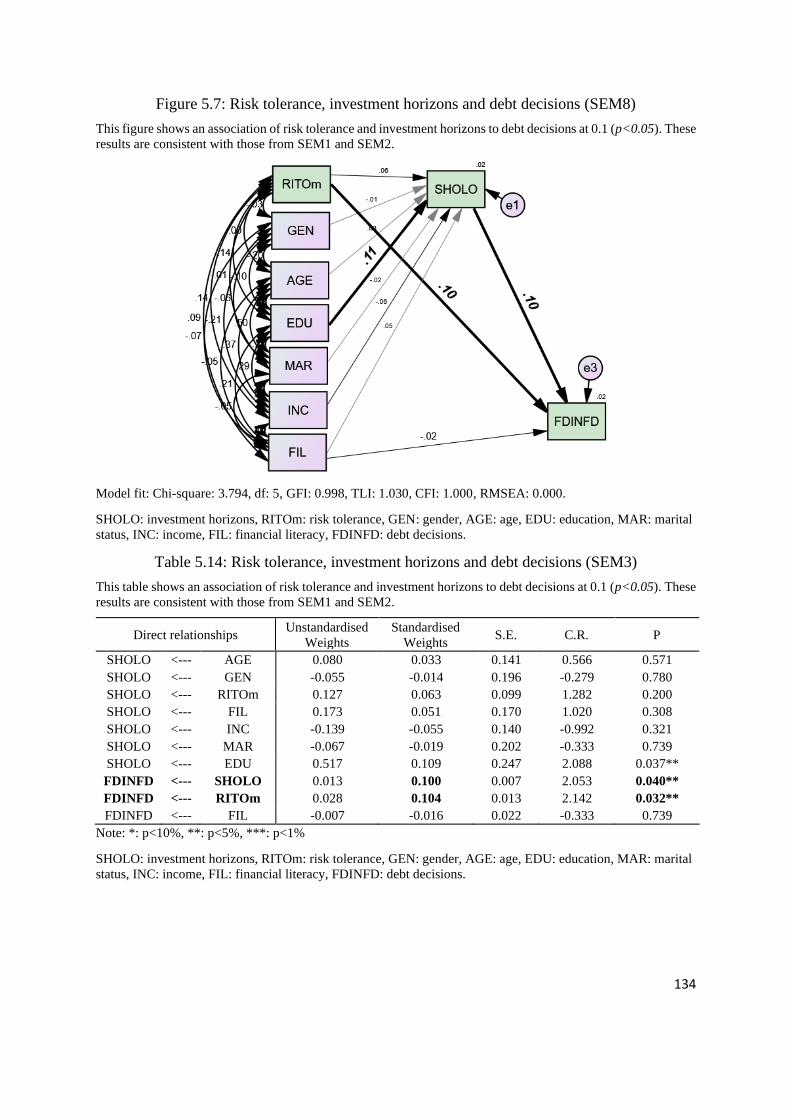
134
Figure 5.7: Risk tolerance, investment horizons and debt decisions (SEM8)
This figure shows an association of risk tolerance and investment horizons to debt decisions at 0.1 (p<0.05). These
results are consistent with those from SEM1 and SEM2.
Model fit: Chi-square: 3.794, df: 5, GFI: 0.998, TLI: 1.030, CFI: 1.000, RMSEA: 0.000.
SHOLO: investment horizons, RITOm: risk tolerance, GEN: gender, AGE: age, EDU: education, MAR: marital
status, INC: income, FIL: financial literacy, FDINFD: debt decisions.
Table 5.14: Risk tolerance, investment horizons and debt decisions (SEM3)
This table shows an association of risk tolerance and investment horizons to debt decisions at 0.1 (p<0.05). These
results are consistent with those from SEM1 and SEM2.
Direct relationships Unstandardised
Weights
Standardised
Weights S.E. C.R. P
SHOLO <--- AGE 0.080 0.033 0.141 0.566 0.571
SHOLO <--- GEN -0.055 -0.014 0.196 -0.279 0.780
SHOLO <--- RITOm 0.127 0.063 0.099 1.282 0.200
SHOLO <--- FIL 0.173 0.051 0.170 1.020 0.308
SHOLO <--- INC -0.139 -0.055 0.140 -0.992 0.321
SHOLO <--- MAR -0.067 -0.019 0.202 -0.333 0.739
SHOLO <--- EDU 0.517 0.109 0.247 2.088 0.037**
FDINFD <--- SHOLO 0.013 0.100 0.007 2.053 0.040**
FDINFD <--- RITOm 0.028 0.104 0.013 2.142 0.032**
FDINFD <--- FIL -0.007 -0.016 0.022 -0.333 0.739
Note: *: p<10%, **: p<5%, ***: p<1%
SHOLO: investment horizons, RITOm: risk tolerance, GEN: gender, AGE: age, EDU: education, MAR: marital
status, INC: income, FIL: financial literacy, FDINFD: debt decisions.

135
5.6.2 Robustness check using multiple and stepwise regressions
Table 5.15 shows six models from 1 through 3 with multiple regression, and models from 1’
through 3’ with stepwise regression. Both Models 1 and 1’ show an association of investment
horizons with informal debt at 0.099 (p<0.05) and 0.095 (p<0.05), respectively. Models 2 and
2’ find a relationship of risk tolerance to financial leverage at 0.129 (p<0.05) and 0.124
(p<0.05), respectively. Models 3 and 3’ present a significant link of risk tolerance and
investment horizons to debt decisions. These findings are consistent with those by SEM1,
SEM2 and SEM8.
Table 5.15: Robustness check on the direct relationships
Both Models 1 and 1’ show an association of investment horizons with informal debt at 0.099 (p<0.05) and 0.095
(p<0.05), respectively. Models 2 and 2’ find a relationship of risk tolerance to financial leverage at 0.129 (p<0.05)
and 0.124 (p<0.05), respectively. Models 3 and 3’ present a significant link of risk tolerance and investment
horizons to debt decisions. Note: Unstandardised coefficients are in parenthesis.
IVs DV: INFD DV: LEVE DV: FDINFD
(1) (1’) (2) (2’) (3) (3’)
RITO -0.006
(-0.008)
0.129**
(0.467)
0.124***
(0.448)
RITOm 0.098**
(0.027)
0.103**
(0.028)
SHOLO 0.099**
(0.011)
0.095**
(0.011)
0.006
(0.002)
0.105**
(0.014)
0.099**
(0.013)
GEN 0.026
(0.011)
-0.054
(-0.066)
0.006
(0.003)
AGE -0.039
(-0.01)
0.016
(0.012)
-0.031
(-0.01)
MAR -0.114**
(-0.045)
-0.14***
(-0.056)
0.028
(0.031)
-0.056
(-0.027)
EDU 0.026
(0.014)
-0.070
(-0.103)
-0.043
(0.028)
INC -0.045
(-0.013)
0.086
(0.067)
0.093*
(0.073)
0.083
(0.027)
FIL -0.065
(-0.025)
0.16***
(0.172)
0.15***
(0.158)
-0.019
(-0.009)
Adj. R2 0.02 0.024 0.048 0.051 0.03 0.017
F change
Df
2.06**
8
3.9***
2
3.6***
8
3.7*
3
2.8***
7
4.11**
2
N 420 420 420 420 420 420
Note: *: p<10%, **: p<5%, ***: p<1%, IVs: independent variables, DV: dependent variable, Models 1-3: multiple
regression. Models 1’-3’: stepwise regression. RITO: risk tolerance, SHOLO: investment horizons, GEN: gender,
AGE: age, MAR: marital status, EDU: education, INC: income, FIL: financial literacy, INFD: informal debt,
LEVE: financial leverage, FDINFD: debt decisions.

136
5.6.3 Robustness check using Hayes and Preacher’s approach
This approach by Hayes and Preacher (2010) is used to examine the mediating roles of risk
tolerance in the relationship of investment horizons to debt decisions among stockbrokers
(N=170). This method was mentioned in Section 3.4.1.
The results of Hayes and Preacher’s approach are exhibited in Table 5.16. Only risk tolerance
significantly relates to informal debt at 0.13 (p<0.1), which is consistent with the results from
SEM3 and SEM8. This approach, however, finds no significant indirect relationship of
investment horizons to informal debt through risk tolerance, which is inconsistent with SEM8.
The main cause of this inconsistency may emanate from the difference between the two
techniques, that is, SEM and Hayes and Preacher.
Table 5.16: A summary of the results using Hayes and Preacher’s approach (N=170)
This table finds a link of risk tolerance to informal debt at 0.13 (p<0.1) but an insignificant indirect relationship
of investment horizons to informal debt through risk tolerance at 0.015 (p>0.1).
IVs
Direct effect of X
on M
Direct effect of X and M on
Y (INFD)
Indirect effect of X on Y via M
Coefficient LLCI - ULCI
X: SHOLO 0.11
(0.01)
-0.06
(-0.008) 0.015
(0.002) -0.0042 - 0.043
M: RITO 0.13*
(0.19)
R2 0.013 0.02
F, df1 2.20,1 1.64, 2
N 170 170 170
Note: *: p<10%, **: p<5%, ***: p<1%, IVs: independent variables, Y: (INFD) informal debt, LL/ULCI:
lower/upper level confidence interval. RITO: risk tolerance, SHOLO: investment horizons, INFD: Informal debt.

137
5.6.4 Robustness check using the t-test and propensity score matching approach
The t-test and propensity score matching (PSM) methods are applied to examine the key
finding of the positive relationship of risk tolerance to the use of financial leverage. Risk
tolerance is a treatment with 0 coded as risk tolerance less than Mean, and 1 as risk tolerance
higher than Mean.
The t-test results (N=420) find that the means of income and financial literacy between the two
groups are significantly different (p<0.1), indicating that these variables may affect both risk
tolerance and financial leverage. As a result of this, propensity score matching is undertaken
to deal with these issues.
The number of investors after the scores matched is 336, with 168 for each group. As shown
in Table 5.17, the means of the six control variables between the two groups are insignificantly
different (p>0.1), meaning that the means of each of the control variables are equal between
the two groups of risk tolerance. This result reduces the bias in choosing these variables.
Table 5.17: The t-test results of six variables between two groups of risk tolerance (N=336)
This table presents that, after the propensity matching score is performed, there are no differences in the means of
each of the six variables between the two groups. This reduces the bias in choosing these variables.
IVs Group Mean Standard
error
Standard
deviation
90%
Confidence
Interval
t Ha:
diff < 0
Pr
Hb:
diff =0
Pr
Hc:
diff>0
Pr
GEN 0 1.38 0.04 0.49 1.30 1.45
0.89 0.81 0.37 0.18 1 1.33 0.03 0.47 1.26 1.40
AGE 0 1.98 0.06 0.81 1.85 2.10
0.75 0.77 0.45 0.22 1 1.91 0.05 0.77 1.79 2.03
EDU 0 3 0.04 0.48 2.92 3.07
0.28 0.61 0.77 0.38 1 2.98 0.02 0.24 2.95 3.02
MAR 0 1.39 0.04 0.52 1.31 1.47
0.39 0.65 0.69 0.34 1 1.36 0.04 0.57 1.28 1.45
INC 0 2.45 0.06 0.78 2.33 2.57
1.03 0.8 0.3 0.15 1 2.37 0.05 0.68 2.27 2.48
FIL 0 2.08 0.05 0.64 1.98 2.17
-0.43 0.33 0.67 0.67 1 2.11 0.04 0.58 2.02 2.19
RITOdummy: risk tolerance, IVs: independent variables, GEN: gender, AGE: age, EDU: education, MAR: marital
status, INC: income, FIL: financial literacy.
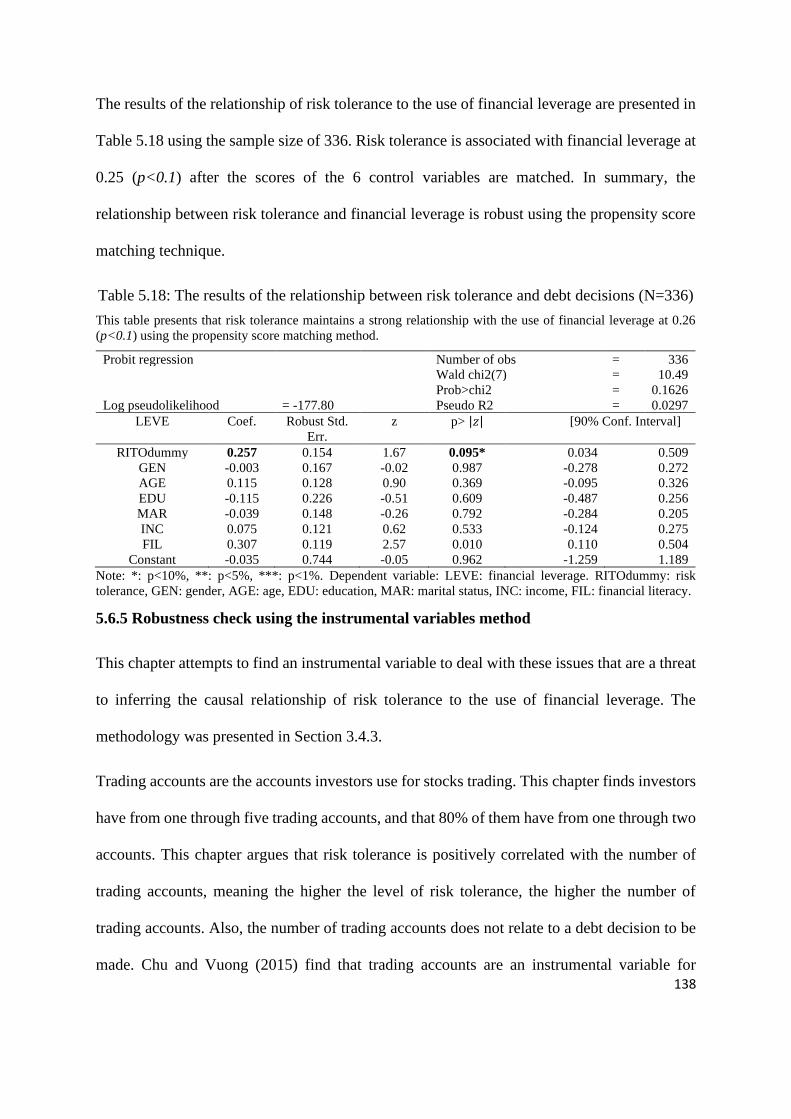
138
The results of the relationship of risk tolerance to the use of financial leverage are presented in
Table 5.18 using the sample size of 336. Risk tolerance is associated with financial leverage at
0.25 (p<0.1) after the scores of the 6 control variables are matched. In summary, the
relationship between risk tolerance and financial leverage is robust using the propensity score
matching technique.
Table 5.18: The results of the relationship between risk tolerance and debt decisions (N=336)
This table presents that risk tolerance maintains a strong relationship with the use of financial leverage at 0.26
(p<0.1) using the propensity score matching method.
Probit regression Number of obs = 336
Wald chi2(7) = 10.49
Prob>chi2 = 0.1626
Log pseudolikelihood = -177.80 Pseudo R2 = 0.0297
LEVE Coef. Robust Std.
Err.
z p> |𝑧| [90% Conf. Interval]
RITOdummy 0.257 0.154 1.67 0.095* 0.034 0.509
GEN -0.003 0.167 -0.02 0.987 -0.278 0.272
AGE 0.115 0.128 0.90 0.369 -0.095 0.326
EDU -0.115 0.226 -0.51 0.609 -0.487 0.256
MAR -0.039 0.148 -0.26 0.792 -0.284 0.205
INC 0.075 0.121 0.62 0.533 -0.124 0.275
FIL 0.307 0.119 2.57 0.010 0.110 0.504
Constant -0.035 0.744 -0.05 0.962 -1.259 1.189
Note: *: p<10%, **: p<5%, ***: p<1%. Dependent variable: LEVE: financial leverage. RITOdummy: risk
tolerance, GEN: gender, AGE: age, EDU: education, MAR: marital status, INC: income, FIL: financial literacy.
5.6.5 Robustness check using the instrumental variables method
This chapter attempts to find an instrumental variable to deal with these issues that are a threat
to inferring the causal relationship of risk tolerance to the use of financial leverage. The
methodology was presented in Section 3.4.3.
Trading accounts are the accounts investors use for stocks trading. This chapter finds investors
have from one through five trading accounts, and that 80% of them have from one through two
accounts. This chapter argues that risk tolerance is positively correlated with the number of
trading accounts, meaning the higher the level of risk tolerance, the higher the number of
trading accounts. Also, the number of trading accounts does not relate to a debt decision to be
made. Chu and Vuong (2015) find that trading accounts are an instrumental variable for

139
investment experience relating to investment decisions. Based on this evidence, trading
accounts may also be postulated as an instrumental variable for risk tolerance concerning debt
decisions.
The results of trading accounts as the instrumental variable for risk tolerance are shown in
Table 5.19. This chapter applies the IVs approach with two-stage least squares and finds that
trading accounts are highly significant in predicting the instrumented variable for risk
tolerance. Durbin Chi-squared and Wu-Hausman F also detect endogeneity at a significant
level (p<0.05), rejecting the null hypothesis of no endogeneity. This result adds to the literature
alongside Chu and Vuong (2015).
Table 5.19: The findings of an instrumental variable for risk tolerance
This table shows that trading accounts as the instrumental variable are highly significant in predicting the
instrumented variable of risk tolerance. Durbin Chi-squared and Wu-Hausman F stats also detect endogeneity at
a significant level (p<0.05), rejecting the null hypothesis of no endogeneity.
Instrumental variables (2SLS) regression Number of obs = 420
Wald chi2(7) = 19.61
Prob>chi2 = 0.0065
Pseudo R2 = .
Root MSE = 0.7547
LEVE Coef. Robust Std.
Err.
z p> |𝑧| [95% Conf. Interval]
RITO 3.466 1.370 2.53 0.011** 0.779 6.153
GEN -0.111 0.080 -1.39 0.166 -0.268 0.046
AGE 0.007 0.056 0.12 0.902 -0.102 0.116
EDU -0.175 0.103 -1.70 0.089 -0.376 0.027
MAR 0.034 0.079 0.43 0.664 -0.121 0.190
INC -0.011 0.065 -0.16 0.869 -0.138 0.117
FIL 0.060 0.084 0.71 0.475 -0.105 0.225
Constant -10.170 4.296 -2.37 0.018 -18.591 -1.749
Instrumented: RITO
Instruments: GEN AGE EDU MAR INC FIL ACC
Tests of endogeneity
Ho: variables are exogenous
Durbin (score) chi2(1) = 8.39 (p = 0.0038)***
Wu-Hausman F(1,411) = 8.377 (p = 0.0040)***
Note: *: p<10%, **: p<5%, ***: p<1%. Dependent variable: LEVE: financial leverage. RITO: risk tolerance,
GEN: gender, AGE: age, MAR: marital status, EDU: education, INC: income, FIL: financial literacy.
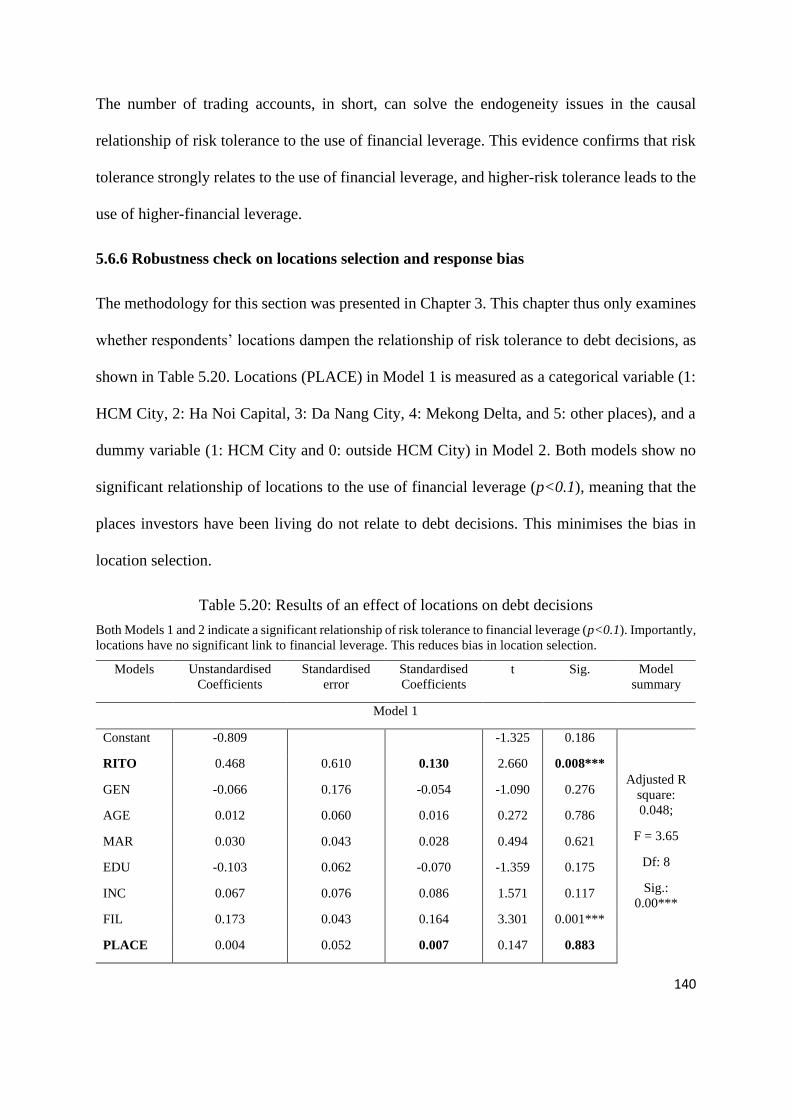
140
The number of trading accounts, in short, can solve the endogeneity issues in the causal
relationship of risk tolerance to the use of financial leverage. This evidence confirms that risk
tolerance strongly relates to the use of financial leverage, and higher-risk tolerance leads to the
use of higher-financial leverage.
5.6.6 Robustness check on locations selection and response bias
The methodology for this section was presented in Chapter 3. This chapter thus only examines
whether respondents’ locations dampen the relationship of risk tolerance to debt decisions, as
shown in Table 5.20. Locations (PLACE) in Model 1 is measured as a categorical variable (1:
HCM City, 2: Ha Noi Capital, 3: Da Nang City, 4: Mekong Delta, and 5: other places), and a
dummy variable (1: HCM City and 0: outside HCM City) in Model 2. Both models show no
significant relationship of locations to the use of financial leverage (p<0.1), meaning that the
places investors have been living do not relate to debt decisions. This minimises the bias in
location selection.
Table 5.20: Results of an effect of locations on debt decisions
Both Models 1 and 2 indicate a significant relationship of risk tolerance to financial leverage (p<0.1). Importantly,
locations have no significant link to financial leverage. This reduces bias in location selection.
Models Unstandardised
Coefficients
Standardised
error
Standardised
Coefficients
t Sig. Model
summary
Model 1
Constant -0.809 -1.325 0.186
Adjusted R
square:
0.048;
F = 3.65
Df: 8
Sig.:
0.00***
RITO 0.468 0.610 0.130 2.660 0.008***
GEN -0.066 0.176 -0.054 -1.090 0.276
AGE 0.012 0.060 0.016 0.272 0.786
MAR 0.030 0.043 0.028 0.494 0.621
EDU -0.103 0.062 -0.070 -1.359 0.175
INC 0.067 0.076 0.086 1.571 0.117
FIL 0.173 0.043 0.164 3.301 0.001***
PLACE 0.004 0.052 0.007 0.147 0.883

141
Models Unstandardised
Coefficients
Standardised
error
Standardised
Coefficients
t Sig. Model
summary
Model 2:
Constant -0.802 0.610 -1.315 0.189
Adjusted R
square:
0.048;
F = 3.65
Df: 8
Sig.:
0.000***
RITO 0.471 0.176 0.130 2.671 0.008***
GEN -0.066 0.060 -0.054 -1.095 0.274
AGE 0.012 0.043 0.016 0.280 0.780
MAR 0.031 0.062 0.028 0.509 0.611
EDU -0.103 0.076 -0.070 -1.365 0.173
INC 0.066 0.043 0.085 1.554 0.121
FIL 0.173 0.052 0.164 3.305 0.001***
PLACE -0.013 0.059 -0.011 -0.229 0.819
Dependent variable: LEVE: financial leverage, ***: p < 1%, RITO: risk tolerance, GEN: gender, AGE: age,
MAR: marital status, EDU: education, INC: income, FIL: financial literacy, PLACE: locations.
5.7 Demographics
The results of the demographics are shown in Table 5.21. This chapter finds that five out of six
demographics relates to risk tolerance, investment horizons, or debt decisions, with the
exception of age. Firstly, gender does play a role in relation to the use of financial leverage
among stockbrokers and users of formal borrowing sources. This means that female investors
tend to use a lower level of financial leverage than male investors, which is in line with prior
studies, in which females are less risk-tolerant than males (Barber & Odean, 2001; Frijns et
al., 2008; Grable, 2000; Hallahan et al., 2003; Kannadhasan, 2015; Lucarelli & Brighetti, 2011;
Yao et al., 2011).
Secondly, education has a positive association with investment horizons and risk tolerance,
meaning an increase in education levels leads to an increase in stock investment for the short
term, rather than the long term, and levels of risk tolerance. These findings seem consistent
with prior studies in which the higher the education levels, the higher the level of risk tolerance

142
(Grable, 2000; Hallahan et al., 2004; Kannadhasan, 2015; Riley Jr & Chow, 1992; Yao et al.,
2011). Education, however, has a negative relationship with the use of financial leverage
among stockbrokers and users of informal borrowing. This may be explained based on the
results of Blume and Friend (1978) in which educated heads of households are somewhat less
willing to take substantial risks and Halek and Eisenhauer (2001) who find education increases
a person’s risk aversion but also increases one’s risk-seeking based on his/her desire to control
the environment.
Thirdly, married investors may collectively have less need to use informal debt. This result
contributes to the literature alongside the result of Grable (2000), in which married people are
found to be less risk-tolerant.
Fourthly, income is positively associated with risk tolerance and financial leverage,
manifesting that higher-income investors are more willing to take on risk and use higher levels
of financial leverage. This is consistent with prior studies in which people who earn higher
income are found to take on more risk (Grable, 2000; Hallahan et al., 2003, 2004; Morin &
Suarez, 1983; Yao et al., 2011). Higher-income investors are, however, less likely to invest in
short term stocks than in long term stocks among stockbrokers and female investors. This result
adds to the literature.
Finally, financial literacy positively relates to risk tolerance and financial leverage and
negatively pertains to informal debt among female investors. This means that investors with
higher financial literacy are prone to be more risk tolerant, use higher levels of financial
leverage, and use lower levels of informal debt. This finding seems similar to that of Balloch
et al. (2014) in which people with higher stock market literacy tend to have higher risk
tolerance.

143
Table 5.21: A summary of demographics
Demographic variables Positive (+)
negative (-)
relationship
Findings in the models
1. Gender
Gender -> financial leverage among users of formal
borrowing sources
- Table 5.9
2. Education
Education -> investment horizons among investors,
stockbrokers, male investors
+ SEM1, SEM3, SEM5,
SEM8,
Education -> financial leverage among stockbrokers,
users of informal borrowing sources
- SEM3, Table 5.9
3. Marital status
Marital status -> informal debt among investors,
stockbrokers, non-stockbrokers, male investors, female
investors, users of borrowing sources.
- SEM1, SEM2, SEM3,
SEM4, SEM5, SEM6,
Table 5.9, SEM7, Table 5.15
Marital status -> investment horizons among
stockbrokers
- SEM3
4. Income
Income -> financial leverage among investors,
stockbrokers, female investors, users of formal
borrowing sources,
+ SEM1, SEM2, SEM3,
SEM6, Table 5.9, SEM7,
Table 5.15
Income -> risk tolerance among investors, stockbrokers, + SEM2, SEM7
Income -> investment horizons among stockbrokers,
female investors
- SEM3, SEM6
5. Financial literacy
Financial literacy -> financial leverage among investors,
stockbrokers, non-stockbrokers, male investors, female
investors, users of formal borrowing sources
+ SEM1, SEM2, SEM3,
SEM4, SEM5, SEM6, Table
5.9, SEM7, Table 5.15
Financial literacy -> risk tolerance among investors + SEM2
Financial literacy -> informal debt among female
investors
- SEM6

144
5.8 Conclusions, contributions, implications, limitations and further
research
5.8.1 Conclusions
This chapter investigates the extent to which risk tolerance directly relates to debt decisions
and mediates between investment horizons and debt decisions. The results indicate that risk
tolerance has a direct relationship to the use of financial leverage, while investment horizons
are related to the use of informal debt. Risk tolerance positively relates to the use of informal
debt and also mediates between investment horizons and debt decisions among stockbrokers.
The results are, in general, robust after controlling for demographics and using additional
techniques.
Risk tolerance has the strongest relationship to the use of financial leverage among non-users
of informal borrowing sources, followed by male investors, non-stockbrokers and users of
formal borrowing sources.
5.8.2 Contributions and implications
The following contributions are made by this chapter. Firstly, this chapter provides useful
insights into investors' use of debt in the Vietnam stock market and the vital roles of risk
tolerance and investment horizons in this use of debt. Secondly, the informal debt sector plays
a vital role in the Vietnam stock market, and it is also possible to generalise this importance to
other stock markets. Thirdly, the SEM models are developed to examine the inter-relationship
between risk tolerance, investment horizons and debt decisions among investors, as well as
stockbrokers, non-stockbrokers, male investors, female investors, users of borrowing and non-
users of borrowing. Lastly, “trading accounts” are found as an instrumental variable for risk

145
tolerance to solve the endogeneity problem in the relationship of risk tolerance to debt
decisions, which contribute to the finance literature.
The findings of this chapter have the following implications. First, risk tolerance is positively
associated with the use of financial leverage. Use of financial leverage for stock investment
has advantages and disadvantages. The benefit this brings to investors is to earn higher returns
or greater returns from a small equity base. However, the risks investors face are a large loss
and then legal problems if insolvency situations occur. Therefore, risk-tolerant investors should
consider prudently what stocks are financially leveraged to minimise the risks. Moreover, they
should control levels of returns expected from financial leverage by following strictly the
trading strategy of “cut losses and take profits”. That is, investors identify how much the stocks
are sold for to achieve loss-cutting or for profit-taking.
Second, short-term investors and stockbrokers tend to use informal debt for stock investment
in which informal lenders are mainly parents and friends. This implies that investors’ stock
investment may impact on the life of parents and friends. Therefore, investors should
contemplate the choices of stocks for investment and effectiveness of these stocks to avoid
harm to their family or friends. Although informal borrowing is common in Vietnamese
culture, investors should limit the amount of borrowed money from informal lenders because
this borrowing could have flow-on effects on the broader network.
Lastly, stockbrokers are more likely to borrow money from parents or friends for stock
investment, perhaps because of their social standing in stock market circles. This implies that
they may care “too much” for their reputations, leading them to ignore the possible risk to their
family or friends. Thus, stockbrokers should be careful when making decisions on informal
borrowing due to its influence on others’ lives. Importantly, they should not pay much attention

146
to the social standing while borrowing money for stock investment, leading to biases in the
decision-making process.
5.8.3 Limitations and further research
This chapter has some limitations. Firstly, the result of risk tolerance as a mediator is not robust
using Hayes and Preacher’s approach. This chapter suggests extra tests for this mediating
relationship. Secondly, as already mentioned in Chapter 4, debt decisions may be affected by
payment methods. Investors may pay interest to the informal lenders, or they share profits or
losses based on their contributed capital, or they pay no interest. A difference in payment
methods may cause heterogeneity in the use of debt. Also, debt decisions may differ between
payers and non-payers of interest. Besides, in some instances, informal lenders may borrow
money from third parties, then give these borrowings to investors. This may lead to the flow-
on effect in a broader network if investors’ stock investments encounter problems. Thirdly,
other behavioural factors, for example, trust or perceived risk, may also impact on risk
tolerance or debt decisions. All these unexplored aspects should be considered in future
research.

147
Chapter 6 Essay Three: Trust, Trading Frequency
and Debt Decisions19
6.1 Introduction
The main objective of this chapter is to investigate the extent to which trust in the stock market
is directly associated with trading frequency and debt decisions, and whether it mediates
between trading frequency and debt decisions.
“Trust” is an essential ingredient for the success of a securities market (Stout, 2009). Trust also
contributes to economic development; for example, aggregate economic activity (Knack &
Keefer, 1997), or growth rates (Zak & Knack, 2001). While there are numerous publicised
studies on the relationship between trust and stock market participation (e.g. Balloch et al.,
2014; Georgarakos & Pasini, 2011; Guiso et al., 2008), there has been no academic research
examining an association of trust with the use of informal debt for stock investment. This
chapter will investigate whether trust directly relates to debt decisions and mediates between
trading frequency and debt decisions.
This chapter, as presented in Chapter 3, defines “debt decisions” as the level of debt which
investors use for stock investment. “Financial leverage” is the credit investors obtain only
through brokerage firms. “Informal debt” is the credit investors obtain through family and non-
family sources. A debt decision is a risky decision, regardless of whether it is informal or formal
19 The early version of this chapter was presented at the International Conference on Business and Finance 2019,
University of Economics Ho Chi Minh City, Vietnam, August 2019 https://vietnam2019.sciencesconf.org/
and at the 24rd New Zealand Finance Colloquium – NZFC, Auckland University of Technology, New Zealand,
February 2020 https://www.nzfc.ac.nz/cfp/index.html

148
debt, because debtors may face insolvency or bankruptcy if their results cannot cover their debt.
The importance of debt decisions for both enterprises and individuals was discussed in Chapter
1.
“Trust” lies at the centre of our global life, in which society itself would disintegrate unless
people trust each other (Blair & Stout, 2001; Möllering, 2001). Hardin (2006) characterises
trust as the willingness to make oneself vulnerable to another under uncertain conditions. Trust
is pointless unless there is some risk of loss, as there is no trust without vulnerability (Blair &
Stout, 2001; Hardin, 2006).
The remainder of this chapter is as follows. Section 6.2 presents the literature review and
hypothesis development. Section 6.3 shows the methodology. Section 6.4 reports the main
results. Section 6.5 presents the results of the additional analysis. Section 6.6 focuses on the
robustness check. Section 6.7 presents the demographics discussion. Section 6.8 ends with
conclusions, contributions, implications, limitations and further research.
6.2 Literature review and hypothesis development
The concept of trust and trust in finance are presented in Section 2.4. While there are numerous
studies on the link between trust and investment decisions, to the author’s knowledge, there
has been no research on the relationships between trust, trading frequency and debt decisions.
This chapter examines the following hypotheses.
Direct relationships
The existing literature finds that trust in the stock market is positively associated with trading
frequency (stock market participation) (e.g. Balloch et al., 2014; Georgarakos & Pasini, 2011;
Guiso et al., 2008). Trusting people are willing to bear the risk (Ben-Ner & Putterman, 2001;

149
Cook & Cooper, 2003). Like prior studies, this chapter argues that there is a positive link
between trust and trading frequency and debt decisions.
H6.1: The higher the level of trust in the stock market, the higher the trading frequency.
H6.2: The higher the level of trust in the stock market, the higher the level of informal debt
used.
H6.3: The higher the level of trust in the stock market, the higher the level of financial leverage
used.
Investors who trade excessively hold riskier investment portfolios (Barber & Odean, 2000,
2001; Frijns et al., 2008; Glaser & Weber, 2007; Grable, 2000; Hallahan et al., 2003; Nofsinger,
2008; Odean, 1999). In this chapter, it is argued that investors who trade more often may use
higher debt for stock investment, under the following hypotheses:
H6.4: The higher the trading frequency, the higher the level of informal debt used.
H6.5: The higher the trading frequency, the higher the level of financial leverage used.
Li, Turmunkh, and Wakker (2019) define trust as a decision made under ambiguity. A trust
decision is a risky decision because trust givers (those who trust someone else) may have
adverse results if their trust is misplaced, and thus, a higher trading frequency may lead to a
higher level of trust.
H6.6: The higher the trading frequency, the higher the trust in the stock market.
Indirect relationships
Prior studies find trust in the stock market relates to trading frequency, and trading frequency
is associated with risky decisions (Balloch et al., 2014; Barber & Odean, 2000, 2001; Frijns et
al., 2008; Georgarakos & Pasini, 2011; Glaser & Weber, 2007; Grable, 2000; Guiso et al.,

150
2008; Hallahan et al., 2003; Nofsinger, 2008; Odean, 1999). Hence, this chapter argues that
trading frequency mediates between trust and debt decisions.
H6.7: Trading frequency mediates between trust and the use of informal debt.
H6.8: Trading frequency mediates between trust and the use of financial leverage.
This chapter also argues that trading frequency may relate to trust in the stock market, and trust
in the stock market is associated with debt decisions. Hence, trust in the stock market is possibly
a mediator between trading frequency and debt decisions.
H6.9: Trust mediates between trading frequency and the use of informal debt.
H6.10: Trust mediates between trading frequency and the use of financial leverage.
6.3 Methodology
The methodology for this section was presented in Chapter 3. Debt decisions and six control
variables were presented in Section 3.6. This chapter thus only presents measures of trust in
the stock market, trading frequency, and debt decisions, as shown in Figure 6.1.
Trust in the stock market, known as “overall trust”, is measured by the sum of the scores of six
facets; trust in stockbrokers, websites of financial investment, brokerage firms, listed firms,
friends or relatives who are working for brokerage firms (abbreviated to trust in friends), and
the stock exchanges. This measure of trust is based on prior studies (e.g. Balloch et al., 2014;
Georgarakos & Pasini, 2011; Guiso et al., 2008). Trading frequency is measured by how often
investors trade in stocks, which is in line with previous research (for example, Graham,
Harvey, & Huang (2009). Lastly, debt decisions have two measures; informal debt, and
financial leverage. As already mentioned in Chapter 3, informal debt is credit obtained by

151
investors through informal lenders, while financial leverage is credit obtained by investors
through formal lenders (i.e. brokerage firms).
Figure 6.1: Measures of trust, trading frequency and debt decisions
Trust Trading frequency Debt decisions
TRUS= 𝟏
𝒎 ∑ (𝒏
𝒊 SHBRi+ WEBSi + BFRMi
+
LICOi + FRENi
+ EXCHi )
where:
SHBR : trust in stockbrokers
WEBS : trust in websites of financial investment
BFRM : trust in brokerage firms
LICO : trust in listed firms
FREN : trust in friends or relatives who are
working for brokerage firms
EXCH : trust in the stock exchange(s)
TRUS : overall trust; n=420, m=6
TRAD =∑ 𝑇𝑅𝐴𝐷𝑛𝑖 i
where:
TRADi: the level of trading
frequency of ith investor
TRAD: trading frequency.
n=420
LEVE = ∑ (𝐿𝐸𝑉𝐸𝑖)𝐧𝐢
INFD = ∑ (𝐼𝑁𝐹𝐷𝑖)𝐧𝐢
where:
LEVE: Financial leverage
INFD: Informal debt
i: ith investors, n=420.
Note: debt over total
assets.
6.4. Main results and discussion
The investor characteristics were demonstrated in Section 3.5. This chapter describes investors’
overall trust and its facets, the reliability of the scale of trust, correlations between variables,
and main results by SEMs. The description of trading frequency and debt decisions was
presented in Sections 3.5 and 3.6.
6.4.1 Levels of trust
The levels of trust (overall) among users and non-users of debt, non-stockbrokers and
stockbrokers, male and female investors, and all investors are shown in Table 6.1. Most
investors (60%) have a higher level of trust than the average, indicating most investors have,
in general, high levels of trust in the stock market.

152
The average trust (mean) of users of debt is higher than that of non-users of debt. Stockbrokers
and female investors have a higher level of trust than non-stockbrokers and male investors,
respectively.
Table 6.1: A summary of trust between groups
Overall
Trust
Non-users
of debt
Users
of debt
Non-
stock-
brokers
Stock-
brokers
Male
investors
Female
investors
All investors
Freq. %
Mean 18.57 19.16 18.91 19.28 19.057 19.062 19.06
Median 19 19 19 19 19 19 19
Mode 19 18 18 18 18 18 18
Std. dev. 3.6 3.4 3.65 3.10 3.46 3.43 3.44
Minimum 8 5 5 6 5 6 5
Maximum 29 28 29 26 29 25 29
Low trust 168 40
High trust 252 60
N 75 345 250 170 259 161 420 100%
Table 6.2 presents the extent to which investors trust stockbrokers, websites, brokerage firms,
listed firms, friends who work for securities companies, and stock exchanges. Among them,
investors have the highest level of trust in the listed firms (49%), followed by trust in the stock
exchange (42%), brokerage firms (37%), websites and friends (36%), and stockbrokers (30%).
In general, most investors have a level of trust between moderate and high.
Table 6.2: A summary of six facets of trust
This table indicates investors have the highest level of trust in the listed firms (49%), followed by trust in the
stock exchange (42%), brokerage firms (37%), websites and friends (36%), and stockbrokers (30%).
Six facets of trust Do not trust Neutral Trust Do not have this one
Freq. % Freq. % Freq. % Freq. %
1. Trust in stockbrokers 24 1.70 206 49.0 126 30.0 64 15.2
2. Trust in websites 58 13.8 245 58.4 122 36.2
3. Trust in brokerage firms 39 9.30 222 52.9 156 37.1
4. Trust in listed firms 29 6.90 185 44.0 206 49.0
5. Trust in friends* 36 8.60 201 47.9 152 36.2 31 7.4
6. Trust in stock exchanges 42 10.0 189 45.0 178 42.4
Note: *: Trust in friends or relatives who are working for brokerage firms.
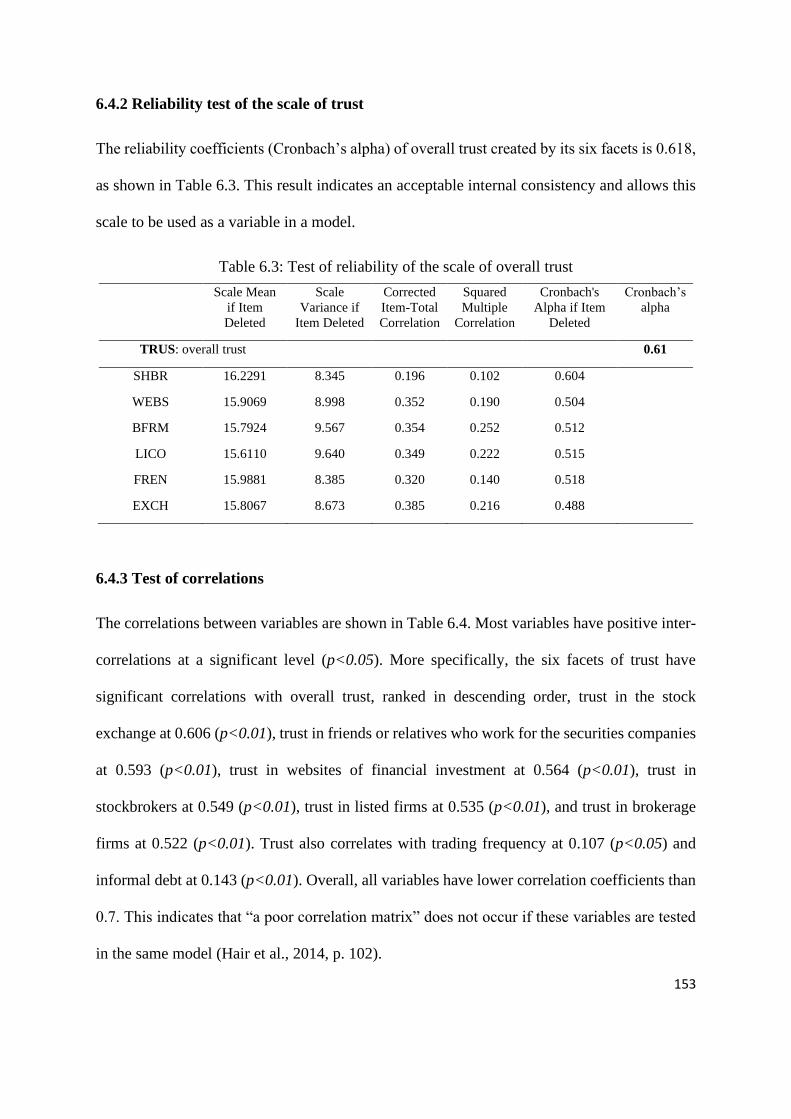
153
6.4.2 Reliability test of the scale of trust
The reliability coefficients (Cronbach’s alpha) of overall trust created by its six facets is 0.618,
as shown in Table 6.3. This result indicates an acceptable internal consistency and allows this
scale to be used as a variable in a model.
Table 6.3: Test of reliability of the scale of overall trust
Scale Mean
if Item
Deleted
Scale
Variance if
Item Deleted
Corrected
Item-Total
Correlation
Squared
Multiple
Correlation
Cronbach's
Alpha if Item
Deleted
Cronbach’s
alpha
TRUS: overall trust 0.61
SHBR 16.2291 8.345 0.196 0.102 0.604
WEBS 15.9069 8.998 0.352 0.190 0.504
BFRM 15.7924 9.567 0.354 0.252 0.512
LICO 15.6110 9.640 0.349 0.222 0.515
FREN 15.9881 8.385 0.320 0.140 0.518
EXCH 15.8067 8.673 0.385 0.216 0.488
6.4.3 Test of correlations
The correlations between variables are shown in Table 6.4. Most variables have positive inter-
correlations at a significant level (p<0.05). More specifically, the six facets of trust have
significant correlations with overall trust, ranked in descending order, trust in the stock
exchange at 0.606 (p<0.01), trust in friends or relatives who work for the securities companies
at 0.593 (p<0.01), trust in websites of financial investment at 0.564 (p<0.01), trust in
stockbrokers at 0.549 (p<0.01), trust in listed firms at 0.535 (p<0.01), and trust in brokerage
firms at 0.522 (p<0.01). Trust also correlates with trading frequency at 0.107 (p<0.05) and
informal debt at 0.143 (p<0.01). Overall, all variables have lower correlation coefficients than
0.7. This indicates that “a poor correlation matrix” does not occur if these variables are tested
in the same model (Hair et al., 2014, p. 102).

154
Table 6.4: The correlations between trust, trading frequency and debt decisions
Most variables have positive inter-correlations at a significant level (p<0.05). Trust in stock exchange had the highest correlation coefficient with overall trust at 0.606 (p<0.01).
Overall trust correlated with trading frequency at 0.107 (p<0.01), and informal debt at 0.143 (p<0.01). Trading frequency correlated with financial leverage at 0.122 (p<0.01).
SHBR WEBS BFRM LICO FREN EXCH TRUS TRAD INFD LEVE GEN AGE MAR EDU INC FIL
SHBR 1.000
WEBS 0.103* 1.000
BFRM 0.039 0.385** 1.000
LICO 0.021 0.250** 0.378** 1.000
FREN 0.309** 0.131** 0.073 0.149** 1.000
EXCH 0.073 0.285** 0.322** 0.371** 0.209** 1.000
TRUS 0.549** 0.564** 0.522** 0.535** 0.593** 0.606** 1.000
TRAD 0.073 0.011 0.071 0.032 0.061 0.092 0.107* 1.000
INFD 0.119* 0.054 0.099* 0.038 0.108* 0.059 0.143** -0.066 1.000
LEVE 0.068 0.005 -0.015 -0.004 0.010 -0.002 0.033 0.122* -0.063 1.000
GEN 0.019 0.022 0.004 -0.114* 0.123* -0.115* -0.002 0.064 0.047 -0.073 1.000
AGE -0.032 -0.136** -0.058 0.012 -0.025 -0.051 -0.090 -0.068 -0.109* 0.060 -0.194** 1.000
MAR -0.005 -0.112* -0.040 0.015 -0.001 -0.065 -0.055 0.004 -0.136** 0.048 -0.052 0.475** 1.000
EDU -0.028 0.025 0.089 0.090 0.046 0.054 0.083 0.016 0.003 0.043 -0.085 0.072 0.123* 1.000
INC -0.055 -0.036 -0.017 0.150** 0.038 0.105* 0.048 0.037 -0.087 0.134** -0.198** 0.368** 0.258** 0.322** 1.000
FIL 0.041 0.089 0.061 0.144** 0.032 0.200** 0.173** 0.147** -0.044 0.172** -0.097* -0.040 -0.031 0.253** 0.137** 1.000
N 420 420 420 420 420 420 420 420 420 420 420 420 420 420 420 420
*. Correlation is significant at the 0.05 level (2-tailed).
**. Correlation is significant at the 0.01 level (2-tailed).
TRUS: overall trust, SHBR: trust in stockbrokers, WEBS: trust in websites of financial investment, BFRM: trust in brokerage firms, LICO: trust in listed firms, FREN: trust in friends
or relatives working for brokerage firms, EXCH: trust in the stock exchange, TRAD: trading frequency, INFD: informal debt, LEVE: financial leverage. GEN: gender, AGE: age, MAR:
marital status, EDU: education, INC: income, FIL: financial literacy.

155
6.4.4 Results of main SEM models and discussion
Two structural equation models (SEM1 and SEM2) are developed with six control variables
(gender, age, marital status, education levels, investment experience, and financial literacy).
SEM1 examines the direct impact of trust on trading frequency, trading frequency on debt
decisions, and both trust and trading frequency on debt decisions. SEM2 examines the direct
effect of trading frequency on trust, trust on debt decisions, and both trading frequency and
trust on debt decisions. SEM1 also examines trading frequency as a mediator between trust and
debt decisions, and SEM2 investigates trust as a mediator between trading frequency and debt
decisions. Demographics found by the SEM models are presented in Section 6.7.
The results of SEM1 are shown in Figure 6.2 and Table 6.5. SEM1 finds a direct relationship
of trust (overall) to the trading frequency with a standardised coefficient of 0.102 (p<0.05), in
support of H6.1. Statistically, when trust increases by 1 standard deviation, trading frequency
increases by 0.1. This result is consistent with prior studies (for example, Balloch et al., 2014;
Georgarakos & Pasini, 2011; Guiso et al., 2008). In general, investors who trust the stock
market tend to trade frequently. Investors trust many parties such as stockbrokers, websites on
financial investment, brokerage firms, listed companies, friends who are working for brokerage
firms and stock exchanges. These parties hold a belief and have a given reputation to investors.
Therefore, when these parties advise investors on stock investment, investors feel more
confident to engage in the stock market.
Trust is also related to informal debt at 0.145 (p<0.01), supporting H6.2. Trust, however, has
no significant association with the use of financial leverage, which does not support H6.3.
Trusting investors tend to use informal debt for stock investment. There is a possibility that
trusting investors may rely on the advice by trust parties to make investing decisions, rather

156
than they themselves making decisions, leading them to feel safer with informal borrowing.
Importantly, they would minimise legal issues if the stock investment failed.
Trading frequency is associated with the use of financial leverage at 0.02 (p<0.05), in support
of H6.5, but has no significant link to the use of informal debt, which does not support H6.4.
The reasons for the use of debt are presented in Chapter 3 – Section 3.6.3. Frequent traders
tend to use financial leverage rather than informal debt for stock investment. Frequent traders
are associated with risk-taking behaviour (Barber & Odean, 2000, 2001), leading them to use
financial leverage in an attempt to achieve high returns from a small equity outlay. In addition,
they may borrow a large amount of money for stock investment for which only formal lenders,
i.e. brokerage firms can financially meet this borrowing.
The results of SEM1 also indicate that trading frequency is a mediator between trust and
financial leverage at 0.01 (p<0.05), supporting H6.8. Trading frequency, however,
insignificantly mediates between trust and informal debt, which does not support H6.7. This
mediating role of trading frequency accounts for why a higher level of trust leads to a higher
level of financial leverage. Noticeably, trust has no significant link to the use of financial
leverage. Thanks to trading frequency, trust relates to the use of financial leverage.

157
Figure 6.2: Trust, trading frequency and debt decisions (SEM1)
This figure shows a significant positive link of trust to trading frequency, trust to informal debt, and trading
frequency to financial leverage. Trading frequency significantly mediates between trust and financial leverage.
Model fit criteria: Chi-square: 10.105, Df: 13, GFI: 0.995, TLI: 1.031, CFI: 1.000, RMSEA: 0.000
TRUS: overall trust, GEN: gender, AGE: age, EDU: education, MAR: marital status, INC: income, FIL: financial
literacy, TRAD: trading frequency, INFD: informal debt, LEVE: financial leverage.
Table 6.5: Trust, trading frequency and debt decisions (SEM1)
This table indicates a significant direct relationship of trust to the trading frequency and informal debt, and trading
frequency to financial leverage. Trading frequency mediates between trust and financial leverage significantly.
Relationships Unstandardised
Weights
Standardised
Weights S.E. C.R. P
Hypotheses
I. Direct relationship
TRAD <--- TRUS 0.038 0.098 0.019 2.022 0.043** H6.1
TRAD <--- EDU 0.022 0.007 0.149 0.146 0.884
TRAD <--- GEN 0.189 0.07 0.133 1.422 0.155
TRAD <--- AGE -0.09 -0.055 0.081 -1.11 0.267
INFD <--- TRAD -0.012 -0.071 0.008 -1.487 0.137 H6.4
LEVE <--- TRUS -0.002 -0.009 0.008 -0.184 0.854 H6.3
INFD <--- TRUS 0.009 0.146 0.003 3.045 0.002*** H6.2
INFD <--- MAR -0.053 -0.134 0.019 -2.807 0.005***
LEVE <--- INC 0.103 0.129 0.038 2.682 0.007***
LEVE <--- FIL 0.028 0.147 0.009 3.034 0.002***
LEVE <--- TRAD 0.05 0.11 0.022 2.308 0.021** H6.5
II. Indirect relationship
TRUS->TRAD->INFD 0.000 -0.007 H6.7
TRUS->TRAD->LEVE 0.002 0.011 ** H6.8
Note: *: p<0.1, **: p<0.05, ***: p<0.01
TRUS: overall trust, GEN: gender, AGE: age, EDU: education, MAR: marital status, INC: income, FIL: financial
literacy, TRAD: trading frequency, INFD: informal debt, LEVE: financial leverage.

158
The results of SEM2 are presented in Figure 6.3 and Table 6.6. SEM2 finds a direct association
of trading frequency with trust at 0.09 (p<0.1), in support of H6.6. This result adds to the
literature alongside prior studies (e.g., Corritore, Kracher, & Wiedenbeck, 2003; Kwon & Suh,
2004).
Like SEM1, SEM2 also uncovers a link of trust to informal debt at 0.146 (p<0.01), supporting
H6.2, and trading frequency to financial leverage at 0.11 (p<0.05), in support of H6.4. These
hypotheses were presented in SEM1.
The results of SEM2 also find trust as a mediator between trading frequency and informal debt
at 0.013 (p<0.1), supporting H6.9. Trust, however, insignificantly mediates between trading
frequency and financial leverage, which does not support H6.10. More importantly, trading
frequency has no significant link to the use of informal debt. Thanks to trust, trading frequency
relates to the use of informal debt. The mediating role of trust accounts for why a higher level
of trading frequency leads to the use of higher informal debt.
Figure 6.3: Trading frequency, trust and debt decisions (SEM2)
This figure shows a significant direct link of trading frequency on trust and financial leverage and trust on informal
debt. Trust mediates between the trading frequency and informal debt significantly.
Model fit criteria: Chi-square: 7.119, Df: 12, GFI: 0.997, TLI: 1.056, CFI: 1.000, RMSEA: 0.000
TRUS: overall trust, GEN: gender, AGE: age, EDU: education, MAR: marital status, INC: income, FIL: financial
literacy, TRAD: trading frequency, INFD: informal debt, LEVE: financial leverage.

159
Table 6.6: Trading frequency, trust and debt decisions (SEM2)
This table indicates trading frequency directly relates to trust, informal debt and financial leverage, and trust has
a direct link to informal debt at a significant level. Trust significantly mediates between trading frequency and
informal debt.
Relationships Unstandardised
Weights
Standardised
Weights S.E. C.R. P
Hypotheses
I. Direct relationship
TRUS <--- TRAD 0.224 0.086 0.126 1.772 0.076* H6.6
TRUS <--- EDU 0.293 0.037 0.396 0.738 0.46
TRUS <--- GEN -0.051 -0.007 0.345 -0.147 0.883
TRUS <--- AGE -0.321 -0.075 0.21 -1.532 0.125
TRUS <--- FIL 0.143 0.133 0.054 2.647 0.008***
INFD <--- TRUS 0.009 0.146 0.003 3.047 0.002*** H6.2
LEVE <--- TRAD 0.05 0.11 0.022 2.301 0.021** H6.4
INFD <--- TRAD -0.012 -0.071 0.008 -1.487 0.137 H6.5
INFD <--- MAR -0.053 -0.134 0.019 -2.81 0.005***
LEVE <--- INC 0.103 0.128 0.038 2.682 0.007***
LEVE <--- FIL 0.028 0.147 0.009 3.023 0.003***
LEVE <--- TRUS -0.002 -0.009 0.008 -0.184 0.854 H6.3
II. Indirect impact
TRAD->TRUS->INFD 0.002 0.013 * H6.9
TRAD->TRUS->LEVE 0.000 -0.001 H6.10
Note: *: p<0.1, **: p<0.05, ***: p<0.01
TRUS: overall trust, GEN: gender, AGE: age, EDU: education, MAR: marital status, INC: income, FIL: financial
literacy, TRAD: trading frequency, INFD: informal debt, LEVE: financial leverage.
In summary, based on SEMs’ results, as presented above, trusting investors tend to prefer
informal debt, while investors who trade frequently are more likely to use formal debt for stock
investment. This reemphasises that informal and formal finance sectors are the important
sources for stock market investors.
6.5. Results of additional analysis
This chapter further analyses what facets of trust relate to debt decisions and find a difference
in the relationship of trust and trading frequency to debt decisions between non-stockbrokers
and stockbrokers, male and female investors, and non-users and users of borrowing sources.
These analyses aim at exploring what facets of trust relate to debt decisions and find that who
and what investors trust has the strongest relationship to debt decisions.

160
6.5.1 Results of six facets of trust
The third SEM model, SEM3 is developed to examine the relationship between the facets of
trust, trading frequency and debt decisions. Trust has six facets, including trust in share brokers,
trust in websites of financial investment, trust in brokerage firms, trust in listed companies,
trust in friends, and trust in the stock exchange. As presented above, 64 out of 420 investors do
not have any stockbrokers (about 15%), and 31 out of 420 investors do not have any friends or
relatives who are working for brokerage firms (around 7%). Due to this inconsistency in levels
of trust, these 6 facets of trust should each be deemed to be categorical variables.
The results of SEM3 are indicated in Figure 6.4 and Table 6.7; both trusts in stockbrokers and
brokerage firms have a connection with informal debt at 0.1 (p<0.1). Trading frequency also
pertains to financial leverage at 0.12 (p<0.05), which is consistent with SEM1 and SEM2. Not
only does overall trust, but trust in stockbrokers and brokerage firms also strongly relates to
the use of informal debt.

161
Figure 6.4: Six facets of trust, trading frequency and debt decisions (SEM3)
This figure indicates both trusts in stockbrokers and brokerage firms has a relationship on informal debt at 0.1
(p<0.1). Trading frequency also affects financial leverage at 0.12 (p<0.05).
Model fit criteria: Chi-square: 6.280, Df: 7, GFI: 0.997, TLI: 1.013, CFI: 1.000, RMSEA: 0.000
SHBR: trust in stockbrokers, WEBS: trust in websites of financial investment, LICO: trust in listed firms, FREN:
trust in friends or relatives who are working for brokerage firms, EXCH: trust in the stock exchange, BFRM: trust
in brokerage firms, TRAD: trading frequency, INFD: informal debt, LEVE: financial leverage.
Table 6.7: The results of six facets of trust, trading frequency, and debt decisions (SEM3)
This table presents both trusts in stockbrokers and brokerage firms have an impact on informal debt at 0.1 (p<0.1).
Trading frequency also affects financial leverage at 0.12 (p<0.05).
Direct relationships Unstandardised
Weights
Standardised
Weights S.E. C.R. P
TRAD <--- LICO 0.015 0.009 0.089 0.171 0.864
TRAD <--- WEBS -0.022 -0.016 0.072 -0.311 0.756
TRAD <--- SHBR 0.077 0.081 0.049 1.576 0.115
TRAD <--- FREN 0.055 0.048 0.059 0.921 0.357
INFD <--- SHBR 0.015 0.099 0.008 1.952 0.051*
INFD <--- FREN 0.014 0.075 0.01 1.458 0.145
INFD <--- WEBS -0.001 -0.005 0.012 -0.09 0.928
INFD <--- BFRM 0.027 0.098 0.016 1.758 0.079*
INFD <--- LICO -0.005 -0.016 0.016 -0.297 0.767
INFD <--- EXCH 0.004 0.017 0.012 0.316 0.752
INFD <--- TRAD -0.013 -0.077 0.008 -1.602 0.109
LEVE <--- TRAD 0.052 0.115 0.022 2.371 0.018**
LEVE <--- SHBR 0.024 0.057 0.021 1.165 0.244
LEVE <--- WEBS 0 -0.001 0.031 -0.014 0.989
Note: *: p<0.1, **: p<0.05, ***: p<0.01
SHBR: trust in stockbrokers, WEBS: trust in websites of financial investment, LICO: trust in listed firms, FREN:
trust in friends or relatives who are working for brokerage firms, EXCH: trust in the stock exchange, BFRM: trust
in brokerage firms, TRAD: trading frequency, INFD: informal debt, LEVE: financial leverage.

162
6.5.2 Results of subgroup analysis
The first subgroup analysis is between stockbrokers (N=170) and non-stockbrokers (N=250).20
Among stockbrokers, only 13.5% have no stockbrokers themselves, meaning that most
stockbrokers (86.5%) have other stockbrokers. This indicates that most individual investors
have stockbrokers, no matter who they are, stockbrokers or non-stockbrokers.
The results of SEM4 and SEM5 are presented in Figure 6.5 and Table 6.8. Both SEM4 and
SEM5 find a relationship of trust (overall) to the use of informal debt at 0.13 (p<0.1) and 0.16
(p<0.1), respectively. SEM4 also uncovers a link from the trust to trading frequency among
stockbrokers at 0.135 (p<0.1), while SEM5 does not. SEM5 detects an association of trading
frequency with financial leverage among non-stockbrokers at 0.1 (p<0.1), whereas SEM4 does
not. In general, trust has a strong relationship with the use of informal debt among all investors,
stockbrokers and non-stockbrokers.
The second subgroup analysis is between male (N=260) and female (N=160) investors. The
results are shown in Figure 6.6 and Table 6.9. SEM6 indicates an association of trust with
informal debt at 0.22 (p<0.01), and trading frequency with financial leverage at 0.12 (p<0.05)
among male investors, while SEM7 does not. Overall, between male and female investors, only
male investors’ trust significantly relates to the use of informal debt.
20 Non-stockbrokers (60%) includes, ranked in descending order, other careers (15.4%), banking officers (10.7%),
sales/marketing managers (8.8%), administrative officer/manager (7.1%), investment officers (5.5%), business
owners (2.9%), accountants (2%), teachers/lecturers (2%), financial advisors (2%), fund managers (1.7%), CFOs
(1%), brokerage managers (0.7%), and CEOs (0.2%).
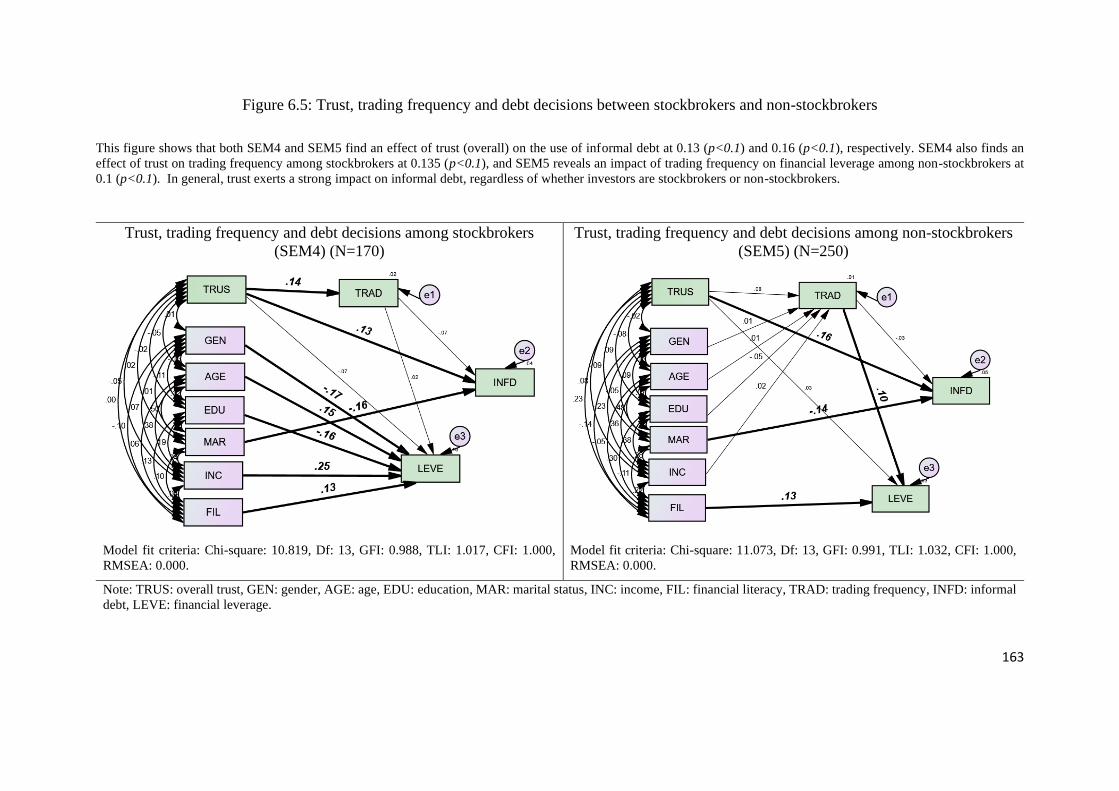
163
Figure 6.5: Trust, trading frequency and debt decisions between stockbrokers and non-stockbrokers
This figure shows that both SEM4 and SEM5 find an effect of trust (overall) on the use of informal debt at 0.13 (p<0.1) and 0.16 (p<0.1), respectively. SEM4 also finds an
effect of trust on trading frequency among stockbrokers at 0.135 (p<0.1), and SEM5 reveals an impact of trading frequency on financial leverage among non-stockbrokers at
0.1 (p<0.1). In general, trust exerts a strong impact on informal debt, regardless of whether investors are stockbrokers or non-stockbrokers.
Trust, trading frequency and debt decisions among stockbrokers
(SEM4) (N=170)
Trust, trading frequency and debt decisions among non-stockbrokers
(SEM5) (N=250)
Model fit criteria: Chi-square: 10.819, Df: 13, GFI: 0.988, TLI: 1.017, CFI: 1.000,
RMSEA: 0.000.
Model fit criteria: Chi-square: 11.073, Df: 13, GFI: 0.991, TLI: 1.032, CFI: 1.000,
RMSEA: 0.000.
Note: TRUS: overall trust, GEN: gender, AGE: age, EDU: education, MAR: marital status, INC: income, FIL: financial literacy, TRAD: trading frequency, INFD: informal
debt, LEVE: financial leverage.
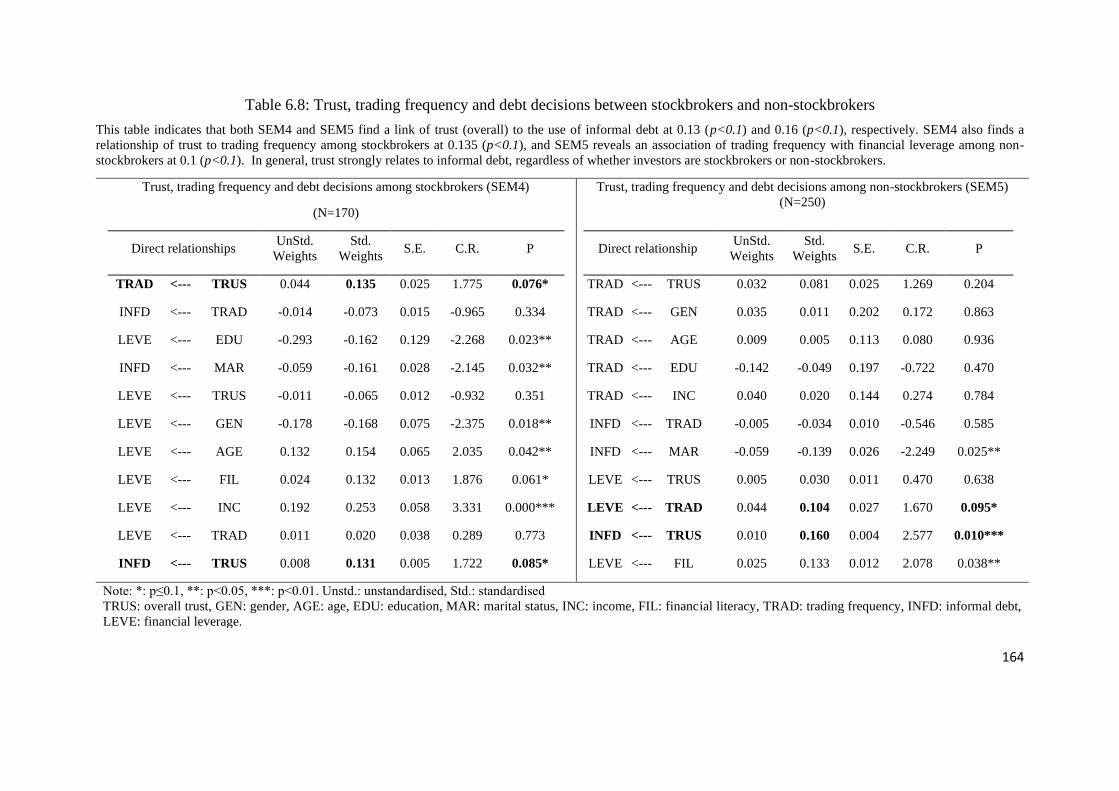
164
Table 6.8: Trust, trading frequency and debt decisions between stockbrokers and non-stockbrokers
This table indicates that both SEM4 and SEM5 find a link of trust (overall) to the use of informal debt at 0.13 (p<0.1) and 0.16 (p<0.1), respectively. SEM4 also finds a
relationship of trust to trading frequency among stockbrokers at 0.135 (p<0.1), and SEM5 reveals an association of trading frequency with financial leverage among non-
stockbrokers at 0.1 (p<0.1). In general, trust strongly relates to informal debt, regardless of whether investors are stockbrokers or non-stockbrokers.
Trust, trading frequency and debt decisions among stockbrokers (SEM4)
(N=170)
Trust, trading frequency and debt decisions among non-stockbrokers (SEM5)
(N=250)
Direct relationships UnStd.
Weights
Std.
Weights S.E. C.R. P
TRAD <--- TRUS 0.044 0.135 0.025 1.775 0.076*
INFD <--- TRAD -0.014 -0.073 0.015 -0.965 0.334
LEVE <--- EDU -0.293 -0.162 0.129 -2.268 0.023**
INFD <--- MAR -0.059 -0.161 0.028 -2.145 0.032**
LEVE <--- TRUS -0.011 -0.065 0.012 -0.932 0.351
LEVE <--- GEN -0.178 -0.168 0.075 -2.375 0.018**
LEVE <--- AGE 0.132 0.154 0.065 2.035 0.042**
LEVE <--- FIL 0.024 0.132 0.013 1.876 0.061*
LEVE <--- INC 0.192 0.253 0.058 3.331 0.000***
LEVE <--- TRAD 0.011 0.020 0.038 0.289 0.773
INFD <--- TRUS 0.008 0.131 0.005 1.722 0.085*
Direct relationship UnStd.
Weights
Std.
Weights S.E. C.R. P
TRAD <--- TRUS 0.032 0.081 0.025 1.269 0.204
TRAD <--- GEN 0.035 0.011 0.202 0.172 0.863
TRAD <--- AGE 0.009 0.005 0.113 0.080 0.936
TRAD <--- EDU -0.142 -0.049 0.197 -0.722 0.470
TRAD <--- INC 0.040 0.020 0.144 0.274 0.784
INFD <--- TRAD -0.005 -0.034 0.010 -0.546 0.585
INFD <--- MAR -0.059 -0.139 0.026 -2.249 0.025**
LEVE <--- TRUS 0.005 0.030 0.011 0.470 0.638
LEVE <--- TRAD 0.044 0.104 0.027 1.670 0.095*
INFD <--- TRUS 0.010 0.160 0.004 2.577 0.010***
LEVE <--- FIL 0.025 0.133 0.012 2.078 0.038**
Note: *: p≤0.1, **: p<0.05, ***: p<0.01. Unstd.: unstandardised, Std.: standardised
TRUS: overall trust, GEN: gender, AGE: age, EDU: education, MAR: marital status, INC: income, FIL: financial literacy, TRAD: trading frequency, INFD: informal debt,
LEVE: financial leverage.

165
Figure 6.6: Trust, trading frequency and debt decisions between male and female investors
This figure presents that SEM6 finds a link of trust to informal debt at 0.22 (p<0.01) and trading frequency to financial leverage at 0.12 (p<0.05) among male investors. By
contrast, the results of SEM7 finds no relationship of trust to informal debt among female investors. Overall, between male and female investors, only male investors’ trust is
found to have a link to their use of informal debt at a significant level (p<0.1).
Trust, trading frequency and debt decisions among male investors
(SEM6) (N=260)
Trust, trading frequency and debt decisions among female investors
(SEM7) (N=160)
Model fit criteria: Chi-square: 5.258, Df: 10, GFI: 0.986, TLI: 1.107, CFI: 1.000,
RMSEA: 0.000.
Model fit criteria: Chi-square: 5.746, Df: 10, GFI: 0.992, TLI: 1.119, CFI: 1.000,
RMSEA: 0.000.
Note: TRUS: overall trust, GEN: gender, AGE: age, EDU: education, MAR: marital status, INC: income, FIL: financial literacy, TRAD: trading frequency, INFD: informal
debt, LEVE: financial leverage.

166
Table 6.9: Trust, trading frequency and debt decisions between male and female investors
This table shows that SEM5 finds an association of trust with informal debt at 0.22 (p<0.01) and trading frequency with financial leverage at 0.12 (p<0.05) among male
investors. By contrast, the results of SEM6 find no significant link of trust to informal debt among female investors. Overall, between male and female investors, only male
investors’ trust is found to have a relationship to their use of informal debt at a significant level (p<0.1).
Trust, trading frequency and debt decisions among male investors (SEM6)
(N=260)
Trust, trading frequency and debt decisions among female investors (SEM7)
(N=160)
Direct impact UnStd.
Weights
Std.
Weights S.E. C.R. P
TRAD <--- TRUS 0.026 0.068 0.024 1.086 0.278
TRAD <--- AGE -0.038 -0.024 0.115 -0.331 0.741
TRAD <--- EDU -0.063 -0.023 0.181 -0.349 0.727
TRAD <--- MAR 0.063 0.026 0.169 0.374 0.708
TRAD <--- FIL 0.050 0.122 0.027 1.865 0.062*
TRAD <--- INC -0.011 -0.006 0.127 -0.090 0.928
LEVE <--- TRUS -0.012 -0.071 0.010 -1.166 0.244
LEVE <--- TRAD 0.055 0.123 0.028 2.015 0.044**
LEVE <--- FIL 0.036 0.196 0.011 3.191 0.001***
INFD <--- TRAD -0.009 -0.055 0.010 -0.910 0.363
INFD <--- TRUS 0.013 0.217 0.004 3.566 0.000***
Direct impact UnStd.
Weights
Std.
Weights S.E. C.R. P
TRAD <--- TRUS 0.048 0.122 0.031 1.529 0.126
TRAD <--- AGE -0.185 -0.104 0.139 -1.334 0.182
TRAD <--- FIL 0.017 0.041 0.033 0.517 0.605
LEVE <--- TRAD 0.047 0.103 0.035 1.337 0.181
INFD <--- TRAD -0.016 -0.093 0.013 -1.200 0.230
INFD <--- TRUS 0.006 0.087 0.005 1.100 0.272
LEVE <--- FIL 0.019 0.102 0.015 1.285 0.199
LEVE <--- INC 0.172 0.214 0.065 2.663 0.008***
INFD <--- MAR -0.075 -0.179 0.032 -2.330 0.020**
INFD <--- FIL -0.010 -0.142 0.005 -1.808 0.071*
LEVE <--- EDU -0.148 -0.079 0.154 -0.961 0.337
Note: *: p≤0.1, **: p<0.05, ***: p<0.01. Unstd.: unstandardised, Std.: standardised
TRUS: overall trust, GEN: gender, AGE: age, EDU: education, MAR: marital status, INC: income, FIL: financial literacy, TRAD: trading frequency, INFD: informal debt,
LEVE: financial leverage.

167
The third subgroup analysis is between users and non-users of borrowing sources; users
(N=328) and non-users (N=92) of informal borrowing sources, and users (N=342) and non-
users (N=78) of formal borrowing sources. The number of investors who do not borrow money
from informal or formal borrowing sources is less than 100. This chapter applies the multiple
regression to ensure a model fit, and then to examine the differences in the relationship of trust
and trading frequency to debt decisions between these groups.
Eight models are developed to examine this relationship. Model 5a and 5b will examine the
relationship of trust and trading frequency with informal debt, while Model 6a and 6b will test
this relationship with financial leverage among users and non-users of informal borrowing
sources, respectively. Model 7a and 7b will also test this relationship with informal debt, while
Model 8a and 8b will investigate this relationship with financial leverage among users and non-
users of formal borrowing sources, respectively.
The results are presented in Table 6.10. Both models 5b and 6b find a link of trust to informal
debt at 0.193 (p<0.01), and trading frequency to financial leverage at 0.09 (p<0.1) among users
of informal borrowing sources. Both models 7b and 8b also reveal a connection between trust
and informal debt at 0.17 (p<0.01), and trading frequency to financial leverage at 0.1 (p<0.1)
among users of formal borrowing sources.
The results, in short, indicate that between users and non-users of borrowing sources, only trust
(and trading frequency) of users of borrowing sources have a significant relationship with
informal debt (and financial leverage).
In summary, between subgroups, trust has the strongest relationship to the use of informal debt
among male investors, followed by users of informal borrowing, users of formal borrowing,
non-stockbrokers, and stockbrokers. Trust has no significant association with the use of

168
informal debt among female investors. Alternatively, some demographics of female investors;
marital status, income, and financial literacy; are associated with the use of informal debt.
These demographics are presented in Section 6.7.
Table 6.10: Trust, trading frequency and debt decisions between users and non-users of
borrowing sources
This table shows that both models 5b and 6b find a link of trust to informal debt at 0.193 (p<0.01), and trading
frequency to financial leverage at 0.09 (p<0.1) among users of informal borrowing sources. Both models 7b and
8b reveal the association of trust with informal debt at 0.17 (p<0.01) and trading frequency with financial
leverage at 0.1 (p<0.1) among users of formal borrowing sources. The results, in short, indicate that between
users and non-users of borrowing sources, only trust (and trading frequency) of users of borrowing sources
relate to their informal debt (and financial leverage). Note. Unstandardised coefficients in the parenthesis.
IVs DV: INFD DV: LEVE DV: INFD DV: LEVE
NINFS
(5a)
INFS
(5b)
NINFS
(6a)
INFS
(6b)
NFS
(7a)
FS
(7b)
NFS
(8a)
FS
(8b)
TRUS -0.006
(0.000)
0.193***
(0.012)
0.04
(0.007)
-0.014
(-0.003)
0.093
(0.007)
0.174***
(0.01)
-0.09
(-0.019)
0.018
(0.003)
TRAD -0.101
(-0.018)
-0.049
(-0.008)
0.154
(0.071)
0.094*
(0.042)
-0.034
(-0.006)
-0.073
(-0.012)
0.145
(0.07)
0.104*
(0.046)
GEN 0.119
(0.057)
0.006
(0.002)
-0.183
(-0.228)
-0.004
(-0.005)
0.137
(0.062)
0.005
(0.002)
-0.116
(-0.139)
-0.018
(-0.022)
AGE 0.119
(0.034)
-0.057
(-0.015)
-0.035
(-0.027)
0.014
(0.011)
-0.018
(-0.005)
-0.034
(-0.009)
0.009
(0.007)
0.021
(0.016)
MAR -0.147
(-0.061)
-0.102
(-0.04)
-0.008
(-0.009)
0.028
(0.031)
-0.245*
(-0.108)
-0.072
(-0.028)
-0.087
(-0.102)
0.025
(0.027)
EDU -0.056
(-0.046)
0.062
(0.028)
-0.041
(-0.088)
-0.047
(-0.06)
0.055
(0.027)
0.032
(0.016)
-0.03
(-0.039)
-0.055
(-0.076)
INC -0.015
(-0.005)
-0.067
(-0.018)
0.047
(0.041)
0.138**
(0.109)
-0.229*
(-0.07)
-0.001
(0.000)
0.039
(0.032)
0.157**
(0.127)
FIL 0.114
(0.008)
-0.110*
(-0.007)
-0.036
(-0.007)
0.205***
(0.038)
0.072
(0.005)
-0.123**
(-0.008)
0.273
(0.048)
0.12**
(0.023)
Adjust R2 -0.042 0.058 -0.032 0.057 0.109 0.029 0.022 0.038
F, df 0.543,8 3.5, 8*** 0.65,8 3.5,8*** 2.17,8** 2.3,8** 1.22,8 2.7,8***
N 92 328 92 328 78 342 78 342
Note: *: p≤0.1, **: p<0.05, ***: p<0.01. Unstd.: unstandardised, Std.: standardised
TRUS: overall trust, GEN: gender, AGE: age, EDU: education, MAR: marital status, INC: income, FIL:
financial literacy, TRAD: trading frequency, INFD: informal debt, LEVE: financial leverage.
6.6 Robustness check
This chapter applies additional techniques to ensure the robustness of the results from the
SEMs. The robustness check has six sections. First, debt decisions have additional measures.
Second, multiple and stepwise regression test the direct relationships. Third, Hayes and
Preacher’s approach examines indirect relationships. Fourth, the t-test and the propensity

169
matching score examines the key result of this chapter: a causal relationship of trust to debt
decisions. Lastly, solutions reduce the locations selection and responses biases.
6.6.1 Robustness check using additional measures
The eighth SEM model, SEM8, is developed to test the relationship between trust, trading
frequency and debt decisions using additional measures. Debt decisions are measured by the
sum of informal and formal debt. This analysis aims to examine whether the results are robust
using an alternative measure for debt decisions
The results of SEM8 are presented in Figure 6.7 and Table 6.11. There is a positive link of
trading frequency to trust (overall) at 0.09 (p<0.1) and trust to debt decisions at 0.14 (p<0.01).
Trust is also a mediator between trading frequency and debt decisions at 0.01 (p<0.1). These
results are consistent with those from SEM2. In short, the relationship of trust to debt decisions
are robust using an additional measure for debt decisions.
Figure 6.7: Trading frequency, trust and debt decisions (SEM8)
This figure shows an association of trading frequency with trust at 0.09 (p<0.1), and trust with debt decisions at
0.14 (p<0.01). Trust is a mediator between trading frequency and debt decisions. These results are consistent with
those from SEM2.
Model fit criteria: Chi-square: 4.147, Df: 6, GFI: 0.998, TLI: 1.037, CFI: 1.000, RMSEA: 0.000
TRUS: overall trust, GEN: gender, AGE: age, EDU: education, MAR: marital status, INC: income, FIL: financial
literacy, TRAD: trading frequency, FDINFD: total debt.

170
Table 6.11: Trading frequency, trust and debt decisions (SEM8)
This table presents a link of trading frequency to trust at 0.09 (p<0.1), and trust to debt decisions at 0.14 (p<0.01).
Trust is a mediator between trading frequency and debt decisions at 0.01 (p<0.1). These results are consistent
with those from SEM2.
Relationships Unstandardised
Weights
Standardised
Weights S.E. C.R. P
I. Direct relationships
TRUS <--- TRAD 0.224 0.086 0.126 1.774 0.076*
TRUS <--- EDU 0.250 0.031 0.413 0.607 0.544
TRUS <--- GEN -0.026 -0.004 0.348 -0.076 0.940
TRUS <--- AGE -0.323 -0.076 0.251 -1.289 0.197
TRUS <--- MAR -0.120 -0.019 0.354 -0.337 0.736
TRUS <--- INC 0.128 0.028 0.256 0.502 0.615
TRUS <--- FIL 0.140 0.130 0.054 2.582 0.010
FDINFD <--- TRUS 0.011 0.139 0.004 2.865 0.004***
FDINFD <--- TRAD -0.011 -0.055 0.010 -1.141 0.254
II. Indirect relationships
TRAD->TRUS->FDINFD 0.002 0.012 *
Note: *: p≤0.1, **: p<0.05, ***: p<0.01. Unstd.: unstandardised, Std.: standardised
TRUS: overall trust, GEN: gender, AGE: age, EDU: education, MAR: marital status, INC: income, FIL:
financial literacy, TRAD: trading frequency, FDINFD: total debt.
6.6.2 Robustness check using multiple and stepwise regression
The results from multiple regression using the models 1a to 4a, and stepwise regression using
the models 1b to 4b, are presented in Table 6.12. The results show significant links of trust to
informal debt (Models 1a and 1b), trading frequency to financial leverage (Models 2a and 2b),
trust to trading frequency (Models 3a and 3b), and trading frequency on trust (Models 4a and
4b). Overall, the results of both techniques are consistent with the SEM findings.

171
Table 6.12: Results of direct relationships between multiple and stepwise regression
This table shows the effect of trust on informal debt (in Models 1a and 1b), trading frequency on financial leverage
(in Models 2a and 2b), trust on trading frequency (in Models 3a and 3b), and trading frequency on trust (Models
4a and 4b) at a significant level (p<0.1). Unstandardised coefficients are in the parentheses.
Variables DV: INFD DV: LEVE DV: TRAD DV: TRUS
(1a) (1b) (2a) (2b) (3a) (3b) (4a) (4b)
TRUS 0.154***
(0.01)
0.139***
(0.009)
-0.006
(-0.001)
0.087*
(0.033)
0.09*
(0.035)
TRAD -0.071
(-0.011)
0.114**
(0.052)
0.109**
(0.05)
0.086*
(0.224)
0.09*
(0.234)
GEN 0.028
(0.012)
-0.043
(-0.052)
0.078
(0.209)
0.089*
(0.238)
-0.004
(-0.026)
AGE -0.024
(-0.006)
0.017
(0.013)
-0.067
(-0.109)
-0.076
(-0.323)
MAR -0.113*
(-0.045)
-0.133***
(-0.053)
0.009
(0.01)
0.028
(0.068)
-0.019
(-0.120)
EDU 0.044
(0.022)
-0.039
(-0.055)
-0.019
(-0.059)
0.031
(0.250)
INC -0.057
(-0.017)
0.122**
(0.098)
0.128***
(0.103)
0.01
(0.017)
0.028
(0.128)
FIL -0.068
(-0.005)
0.154***
(0.029)
0.146***
(0.027)
0.089*
(0.037)
0.087*
(0.036)
0.13***
(0.140)
0.145***
(0.156)
Adjust R2 0.036 0.034 0.042 0.05 0.011 0.017 0.022 0.027
F,
df
2.97,
8***
8.481,
2***
3.318,
8***
8.366,
3**
1.681,
7
3.47, 3** 2.366,
7**
6.794,
2***
N 420 420 420 420 420 420 420 420
*: p<0.1, **: p<0.01, ***: p<0.001. (1a) -> (4a): multiple regression, (1b) -> (4b): stepwise regression. TRUS:
overall trust, TRAD: trading frequency, INFD: Informal debt, LEVE: financial leverage, GEN: gender, AGE: age,
MAR: marital status, EDU: education, INC: income, FIL: financial literacy.
6.6.3 Robustness check using the Hayes and Preacher’s approach
This approach by Hayes and Preacher (2010) was presented in Section 3.4.1. The results using
Hayes and Preacher’s approach are displayed in Table 6.13. Namely, Model 1 indicates a

172
significant relationship between trading frequency and trust, and trust and informal debt, and
as a result, trust significantly mediates between trading frequency and informal debt. Model 2
reveals a link between trust and the trading frequency, and trading frequency and financial
leverage, and as a consequence, trading frequency significantly mediates between trust and
financial leverage. These findings, using Hayes and Preacher’s approach are consistent with
those of SEM1 and SEM2 and show that trust and trading frequency are mediators.
Table 6.13: Results of the relationships using Hayes and Preacher’s approach
This table shows mediating roles of trust and trading frequency for other factors in debt decisions. Model 1
indicates a significant link of trading frequency to trust, trust to informal debt, and as a result, trust significantly
mediates between trading frequency and informal debt. Model 2 reveals a significant relationship of trust to the
trading frequency and trading frequency to financial leverage, and as a consequence, trading frequency
significantly mediates between trust and financial leverage.
IVs
Model 1:
TRAD (X) -> TRUS (M) -> INFD (Y)
Model 2:
TRUS (X) -> TRAD (M) -> LEVE (Y)
TRUS INFD Indirect effect
of TRAD on
INFD via TRUS
TRAD LEVE Indirect effect of
TRUS on LEVE
via TRAD
Constant 17.97*** 0.03 3.25*** 0.715***
TRAD 0.103**
(0.269)
-0.07
(-0.011)
0.119**
(0.054)
0.012*
(0.002)
TRUS 0.15***
(0.009)
0.016*
(0.012)
0.103**
(0.04)
0.015
(0.003)
R square 0.01 0.02 0.01 0.015
F 4.508** 5.59*** 4.508** 3.129**
Df1-df2 1-418 2-417 1-418 2-417
LLCI-ULCI 0.0024 - 0.0320 0.0012- 0.0283
Note: *: p<10%, **: p<5%, ***: p<1%. TRUS: overall trust, TRAD: trading frequency, INFD: Informal debt,
LEVE: financial leverage. A relationship is assessed as significance (p<0.1) if zero does not include between
LLCI and ULCI

173
6.6.4 Robustness check using the T-test method
The key finding of this chapter is a significantly positive relationship of trust to the use of
informal debt after controlling for six demographics (gender, age, education, marital status,
income, and financial literacy). This chapter applies the two-sample t-test to examine whether
the means of these six demographics are equal between two groups of trust. The t-test is
presented in Section 3.4.3.
The results are presented in Table 6.14 and 6.15. Trust is coded as a dummy variable: 0 as trust
less than Mean; and 1 as trust higher than Mean. The means of each of the six demographics
between the two groups of trust is insignificantly different (p>0.1), accepting the null
hypothesis of no differences in means between two groups of trust. This reduces the selection
bias in the six demographics as the control variables in a model between trust and informal
debt.
Table 6.14: The t-test results of six control variables between two groups of trust (N=420)
This table presents that the means of the six control variables between two groups of trust are insignificantly
different (p>0.1). This indicates no differences in each of the six variables between the two groups of trust.
IVs Group Mean Standard
error
Standard
deviation
90%
Confidence
Interval
t Ha:
diff < 0
Pr
Hb:
diff =0
Pr
Hc:
diff>0
Pr
GEN 0 1.39 0.03 0.49 1.33 1.44
0.19 0.57 0.84 0.42 1 1.38 0.034 0.48 1.32 1.43
AGE 0 2.03 0.05 0.78 1.94 2.11
0.14 0.55 0.88 0.44 1 2.02 0.06 0.83 1.92 2.12
EDU 0 3.02 0.03 0.49 2.96 3.07
-0.91 0.18 0.36 0.81 1 3.06 0.02 0.34 3.02 3.10
MAR 0 1.41 0.03 0.52 1.34 1.46
0.22 0.59 0.81 0.40 1 1.39 0.04 0.55 1.33 1.46
INC 0 2.54 0.05 0.73 2.45 2.62
-1.18 0.12 0.23 0.88 1 2.62 0.053 0.74 2.53 2.71
FIL 0 9.38 0.23 3.43 9.00 9.76
-1.58 0.05 0.16 0.94 1 9.87 0.21 2.88 9.53 10.21
Dependent variable: TRUSdummy: overall trust, IVs: independent variables, GEN: gender, AGE: age, EDU:
education, MAR: marital status, INC: income, FIL: financial literacy.
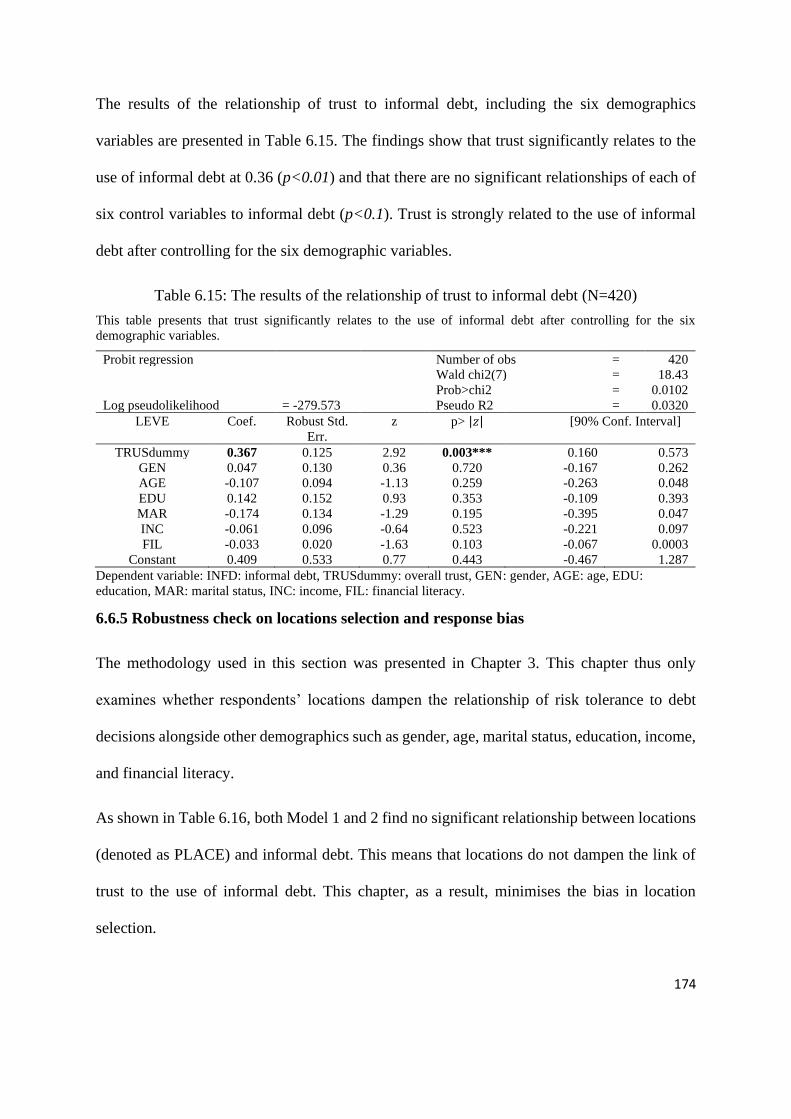
174
The results of the relationship of trust to informal debt, including the six demographics
variables are presented in Table 6.15. The findings show that trust significantly relates to the
use of informal debt at 0.36 (p<0.01) and that there are no significant relationships of each of
six control variables to informal debt (p<0.1). Trust is strongly related to the use of informal
debt after controlling for the six demographic variables.
Table 6.15: The results of the relationship of trust to informal debt (N=420)
This table presents that trust significantly relates to the use of informal debt after controlling for the six
demographic variables.
Probit regression Number of obs = 420
Wald chi2(7) = 18.43
Prob>chi2 = 0.0102
Log pseudolikelihood = -279.573 Pseudo R2 = 0.0320
LEVE Coef. Robust Std.
Err.
z p> |𝑧| [90% Conf. Interval]
TRUSdummy 0.367 0.125 2.92 0.003*** 0.160 0.573
GEN 0.047 0.130 0.36 0.720 -0.167 0.262
AGE -0.107 0.094 -1.13 0.259 -0.263 0.048
EDU 0.142 0.152 0.93 0.353 -0.109 0.393
MAR -0.174 0.134 -1.29 0.195 -0.395 0.047
INC -0.061 0.096 -0.64 0.523 -0.221 0.097
FIL -0.033 0.020 -1.63 0.103 -0.067 0.0003
Constant 0.409 0.533 0.77 0.443 -0.467 1.287
Dependent variable: INFD: informal debt, TRUSdummy: overall trust, GEN: gender, AGE: age, EDU:
education, MAR: marital status, INC: income, FIL: financial literacy.
6.6.5 Robustness check on locations selection and response bias
The methodology used in this section was presented in Chapter 3. This chapter thus only
examines whether respondents’ locations dampen the relationship of risk tolerance to debt
decisions alongside other demographics such as gender, age, marital status, education, income,
and financial literacy.
As shown in Table 6.16, both Model 1 and 2 find no significant relationship between locations
(denoted as PLACE) and informal debt. This means that locations do not dampen the link of
trust to the use of informal debt. This chapter, as a result, minimises the bias in location
selection.

175
Table 6.16: Results of an effect of locations on debt decisions
Both Models 1 and 2 indicate a strong relationship of trust (overall) to informal debt at a significant level (p<0.1)
after controlling for seven demographics. Both Models 1 and 2 find no links of locations to the use of informal
debt at a significant level (p<0.1). This means that locations do not dampen the relationship of trust to informal
debt.
Models Unstandardised
Coefficients
Standardised
error
Standardised
Coefficients
t Sig. Model
summary
Model 1
Constant 0.069 0.104 0.665 0.507
Adjusted R
square:
0.032;
F = 2.75
Df: 8
Sig.:
0.006***
TRUS 0.009 0.003 0.150 3.067 0.002***
GEN 0.010 0.022 0.024 0.478 0.633
AGE -0.005 0.016 -0.020 -0.337 0.736
MAR -0.046 0.022 -0.116 -2.078 0.038
EDU 0.021 0.026 0.043 0.822 0.412
INC -0.017 0.016 -0.059 -1.066 0.287
FIL -0.005 0.003 -0.073 -1.448 0.148
PLACE 0.006 0.009 0.032 0.659 0.511
Model 2:
Constant 0.097 0.104 0.932 0.352
Adjusted R
square:
0.036;
F = 2.97
Df: 8
Sig.:
0.003***
TRUS 0.009 0.003 0.151 3.093 0.002***
GEN 0.011 0.022 0.025 0.501 0.617
AGE -0.005 0.016 -0.020 -0.339 0.735
MAR -0.045 0.022 -0.112 -2.013 0.045**
EDU 0.020 0.026 0.041 0.784 0.434
INC -0.018 0.016 -0.061 -1.102 0.271
FIL -0.005 0.003 -0.070 -1.391 0.165
PLACE -0.031 0.021 -0.071 -1.465 0.144
Dependent variable: INFD, *: p < 10%, **: p < 5%, ***: p < 1%
INFD: informal debt, TRUS: trust (overall), GEN: gender, AGE: age, MAR: marital status, EDU: education,
INC: income, FIL: financial literacy, PLACE: locations.
Model 1: PLACE is a categorical variable
Model 2: PLACE is a dummy variable: HCMC and outside HCMC

176
6.7 Demographics
Six investor characteristics; gender, age, education, marital status, income, and financial
literacy; are found to affect trust, trading frequency, and debt decisions, as shown in Figure 6.8.
Firstly, gender positively impacts on trading frequency among investors and negatively affects
financial leverage among stockbrokers. Female investors trade stocks more often than male
investors, and female stockbrokers use lower levels of financial leverage than male
stockbrokers. In general, this result seems to be consistent with prior studies (Barber & Odean,
2001; Frijns et al., 2008; Grable, 2000; Hallahan et al., 2003; Kannadhasan, 2015; Lucarelli &
Brighetti, 2011; Yao et al., 2011) in which females take less risk than males.
Secondly, age has a positive impact on financial leverage among stockbrokers. That is, the
older they are, the higher the level of financial leverage used. This finding is similar to prior
research (see, for example, Frijns et al., 2008; Grable, 2000; Pålsson, 1996; Wang & Hanna,
1997).
Thirdly, education is inversely associated with the use of financial leverage among
stockbrokers. Higher education leads to a lower level of financial leverage. This result is
inconsistent with previous studies (see, for example, Grable, 2000; Hallahan et al., 2004;
Kannadhasan, 2015; Riley Jr & Chow, 1992; Yao et al., 2011) in which the higher the level of
education, the higher the risk-taking. This chapter, however, has a similar finding to Blume
and Friend (1978) who argue that higher-educated individuals are somewhat less risk-taking.

177
Figure 6.8: A summary of six demographics
Demographics Positive (+),
negative (-)
Models
1. Gender
Gender -> Trading frequency among investors + Table 6.12
Gender -> financial leverage
(stockbrokers)
- SEM4
2. Age
Age -> financial leverage
(stockbrokers)
+ SEM4
3. Education
Education -> financial leverage
(stockbrokers)
- SEM4
4. Marital status
Marital status -> Informal debt
(all investors, stockbrokers, non-stockbrokers, female
investors, non-users of formal borrowing sources
-
SEM1, SEM2, SEM4, SEM5,
SEM7, Table 6.10, Table 6.12
5. Income
Income -> Financial leverage
(all investors, stockbrokers, female investors,
users of borrowing sources)
+ SEM1, SEM2, SEM4, SEM7,
Table 6.10, Table 6.12
Income -> Informal debt
(non-users of formal borrowing sources) - Table 6.10
6. Financial literacy
Financial literacy -> Financial leverage
(all investors, male investors, stockbrokers, non-
stockbrokers, users of borrowing sources, female investors)
+ SEM1, SEM2, SEM4, SEM5,
SEM6, Table 6.10, Table 6.12
Financial literacy -> Trading frequency among investors,
male investors + SEM6, Table 6.12,
Financial literacy -> Trust among investors + SEM2, SEM8, Table 6.12
Financial literacy -> Informal debt
(female investors, users of borrowing sources) - SEM7, Table 6.10

178
Fourthly, marital status has a negative influence on informal debt among investors,
stockbrokers, non-stockbrokers, and female investors. Married investors use lower levels of
informal debt than single investors. These findings are in line with those of prior studies in
which married people take less risk than single people (e.g. Cohn, Lewellen, Lease, &
Schlarbaum, 1975; Dohmen et al., 2011; Roussanov & Savor, 2014).
Fifthly, income positively affects financial leverage among investors, stockbrokers, female
investors and users of informal borrowing sources, and negatively impacts informal debt use
among non-users of formal borrowing sources. In general, a higher income causes a higher
level of financial leverage use and a lower level of informal debt use. This result is similar to
those of previous studies in which people having higher income tend to take more risk (see, for
example, Grable, 2000; Hallahan et al., 2003, 2004; Morin & Suarez, 1983; Riley Jr & Chow,
1992; Yao et al., 2011).
Lastly, financial literacy has a positive impact on financial leverage, trading frequency and
trust among investors, and a negative effect on informal debt among female investors and users
of borrowing sources, in general. That is a higher level of financial literacy results in a higher
level of financial leverage use, a higher level of trading frequency, a higher level of trust, and
a lower level of informal debt use. These results appear consistent with those of prior studies
in which people with a high level of stock market literacy tend to participate in the stock market
more frequently and take more risk (see, for example, Lusardi & Mitchelli, 2007; Lusardi &
Tufano, 2015; Van Rooij et al., 2011).
179
6.8 Conclusions, contributions, implications, limitations and further
research
6.8.1 Conclusions
This chapter investigates the extent to which trust in the stock market directly relates to trading
frequency and debt decisions and mediates between trading frequency and debt decisions. The
results show a significantly positive relationship between trust and trading frequency and the
use of informal debt. Trust in stockbrokers and brokerage firms is directly related to the use of
informal debt. Trading frequency is also positively associated with trust in the stock market
and the use of financial leverage. Trust is a mediator between trading frequency and informal
debt, and trading frequency acts as a mediator between trust and financial leverage. The results
are robust after controlling for demographics and using additional techniques.
6.8.2 Contributions and implications
This chapter provides useful insights into investors’ use of debt in the Vietnam stock market,
and the vital roles of trust in the stock market and trading frequency in this use of debt. The
informal debt sector also plays a vital role in the Vietnam stock market, and the importance of
this result can be generalised to other stock markets. The SEM models are developed to
examine the inter-relationship between trust in the stock market, trading frequency and debt
decisions among investors, stockbrokers, non-stockbrokers, male investors, female investors,
users of borrowing and non-users of borrowing, which all contribute to the literature in finance.
The results of this chapter have the following implications. First, investors trust many parties
such as stockbrokers, websites of financial investment, brokerage firms, listed companies,
friends who are working for brokerage firms and stock exchanges. Trust is related to
vulnerability (Blair & Stout, 2001), leading investors to be vulnerable if their trust is misplaced.

180
To reduce mistrust, investors should consider the levels of trust in the parties and assess when
and what situations they should trust, especially, they should evaluate the reliability of the
advice by the parties.
Second, higher trust is associated with trading more frequently. It is noted that excessive
trading is a proxy for overconfidence and that overconfident investors tend to think that they
are better than they actually are (Barber & Odean, 2000, 2001), leading them to earn suboptimal
returns. Therefore, trusting investors should control the levels of trading frequency to avoid
overconfidence in investment decisions, which often leads to poor outcomes.
Third, higher trust is associated with higher levels of informal debt use. There are two
implications to this. First is for trusting investors in which they may think that borrowing from
parents and friends makes it safer to engage in stock investment. However, this choice might
affect parents and friends’ lives if the stock investment is not successful. Trusting investors,
therefore, should be careful about choices of stocks for investment and importantly, they should
evaluate the effectiveness and trends of the stocks to reduce the possible risk to informal
lenders. Second is for informal lenders in that they may face difficulties with their lending. For
example, they may bring financial hardship to their family if the investors they lend to meet
with failure in their stock investments. To reduce the risk to the family, informal lenders should
not leave all financial decisions to investors. Alternatively, informal lenders should improve
knowledge of stock investment to advise investors on how to invest in stocks effectively, or at
least informal lenders may monitor their money alongside investors.
Finally, trading frequency is positively related to the use of financial leverage. This implies
that frequent traders prefer financial leverage for stock investment. A major reason for the use
of financial leverage could be to try to earn high returns from a small equity outlay. In practice,

181
returns on equity (ROE) or returns on assets (ROA) are the key financial ratios to assess
performances for both individual and institutional investors. Using financial leverage
effectively can help investors earn high returns from a small equity outlay, but investors may
face bankruptcy if the investment fails. Frequent traders, thus, should balance the ratios
between equity and leverage so as to reduce the possible risk of bankruptcy if stock prices go
down.
6.8.3 Limitations and further research
Despite great efforts, this chapter has not still found an instrumental variable for trust to deal
with the endogenous problem that may be a threat to inferring a causal relationship of trust to
the use of informal debt. Further research should consider this. Besides, the key focus of this
chapter is on the relationship of trust to debt decisions. Other behavioural factors; for example,
perceived risk or risk tolerance; may affect debt decisions.
Debt decisions may be affected by payment methods, as already mentioned in Chapter 4 and
5. Investors may pay interest or distribute returns from stock investments to informal lenders.
Therefore, a difference in payment methods may cause heterogeneity in debt decisions.
Investors may also pay without interest to informal lenders. This may lead to differences in a
debt decision to be made between payers and non-payers of interest. In some instances,
informal lenders borrow money from third parties, then lend investors this money. This may
adversely affect a broader network if investors’ stock investments fail. These unexplored
aspects should be considered in future research.

182
Chapter 7 Conclusions
Introduction to this chapter
This thesis mainly examines the relationships between debt decisions and three behavioural
factors’ being perceived risk of stock investment, financial risk tolerance, and trust in the stock
market. The results find perceived risk and trust positively relate to the use of informal debt,
and risk tolerance is positively associated with the use of financial leverage. These behavioural
factors also act as mediators for other factors in debt decisions. This chapter presents the
significant findings, contributions, implications and recommendations of the three essays, and
suggests further areas for research.
7.1 Major findings
The findings of Essay One respond to the primary research question in Chapter 1, being what
role does perceived risk play in debt decisions? The finding is that perceived risk is positively
associated with the use of informal debt and mediates between borrowing sources and the use
of informal debt.
The results are summarised in Figure 7.1. Essay One finds that perceived risk positively relates
to borrowing sources and the use of informal debt. Besides this, borrowing sources are
positively associated with perceived risk and the use of debt. Perceived risk also mediates
between borrowing sources and informal debt and borrowing sources act as a mediator between
perceived risk and debt decisions. These findings are robust after controlling for six
demographic variables and using additional techniques.

183
Figure 7.1: A summary of the findings of Essay One
Hypotheses Findings supported
H4.1 The higher the level of perceived risk, the higher the number of borrowing
sources used.
Yes
H4.2 The higher the level of perceived risk, the higher the level of informal debt
used
Yes
H4.3 The higher the level of perceived risk, the higher the level of financial
leverage used.
No
H4.4 The higher the number of borrowing sources, the higher the level of perceived
risk.
Yes
H4.5 The higher the number of borrowing sources, the higher the level of informal
debt used.
Yes
H4.6 The higher the number of borrowing sources, the higher the level of financial
leverage used.
Yes
H4.7 Perceived risk mediates between borrowing sources and informal debt Yes
H4.8 Perceived risk mediates between borrowing sources and financial leverage No
H4.9 Borrowing sources mediates between perceived risk (opportunity risk and
leverage risk) and informal debt
Yes
H4.10 Borrowing sources mediates between perceived risk (opportunity risk and
leverage risk) and financial leverage
Yes
The findings of Essay Two respond to the primary research question of what role does risk
tolerance play in debt decisions? The answer is that risk tolerance positively relates to financial
leverage and mediates between investment horizons and informal debt.21
The results are summarised in Figure 7.2. This essay finds that risk tolerance is positively
associated with the use of financial leverage, and investment horizons have a positive
relationship with the use of informal debt. Risk tolerance also mediates between investment
horizons and financial leverage. Most findings are robust after controlling for demographics
and using additional techniques.
21 The mediating role of risk tolerance in the relationship between investment horizons and debt decisions is only
found among stockbrokers.

184
Figure 7.2: A summary of the findings of Essay Two
Hypotheses Supported
H5.1 The higher the level of risk tolerance, the higher the level of financial
leverage used.
Yes
H5.2 The higher the level of risk tolerance, the higher the level of informal debt
used.
No
H5.3 The higher the level of risk tolerance, the higher the stock investment for the
short term over the long term.
No
H5.4 The higher the stock investment for the short term over the long term, the
higher the level of informal debt used.
Yes
H5.5 The higher the stock investment for the short term over the long term, the
higher the level of financial leverage used.
No
H5.6 The higher the stock investment for the short term over the long term, the
higher the level of risk tolerance.
Yes
H5.7 Risk tolerance as a mediator between investment horizons and informal debt Yes – among
stockbrokers
H5.8 Risk tolerance as a mediator between investment horizons and financial
leverage
No
The findings of Essay Three, as summarised in Figure 7.3, respond to the primary research
question of what role does trust in the stock market play in debt decisions? The answer is that
trust has a positive relationship with the use of informal debt and mediates between trading
frequency and informal debt.
This essay finds trust in the stock market (overall) positively pertains to the trading frequency
and the use of informal debt. Trading frequency is positively associated with the use of debt.
Trust also mediates between trading frequency and the use of informal debt, and trading
frequency as a mediator between trust and debt decisions. The findings are robust after
controlling for demographics and using additional techniques.

185
Figure 7.3: A summary of the findings of Essay Three
Hypotheses Supported
H6.1 The higher the level of trust in the stock market, the higher the level of trading
frequency.
Yes
H6.2 The higher the level of trust in the stock market, the higher the level of informal
debt used.
Yes
H6.3 The higher the level of trust in the stock market, the higher the level of financial
leverage used.
No
H6.4 The higher the level of trading frequency, the higher the level of financial leverage
used.
Yes
H6.5 The higher the level of trading frequency, the higher the level of informal debt
used.
Yes
H6.6 The higher the level of trading frequency, the higher the level of trust in the stock
market.
Yes
H6.7 Trading frequency mediates between trust and informal debt Yes
H6.8 Trading frequency mediates between trust and financial leverage Yes
H6.9 Trust mediates between trading frequency and informal debt Yes
H6.10 Trust mediates between trading frequency and financial leverage No
7.2 Contributions
This thesis makes the following contributions for academics and practitioners. Firstly, this
thesis provides useful insights into Vietnamese investors’ debt decisions and three key
behavioural factors related to the use of debt in the Vietnam stock markets. That is, the
perceived risk of stock investment and trust in the stock market can account for the use of
informal debt, and risk tolerance can explain the use of financial leverage for stock investment.
These findings may be generalised to other stock markets.
Secondly, the concept of perceived risk examined within the consumer behavioural framework
contributes to a better understanding of investors’ perceived risk and its relationship with debt
decisions and is a novel contribution. Numerous studies in finance (e.g. Kahneman & Tversky,
1979; Nofsinger, 2008; Thaler & Johnson, 1990), find that investors are only concerned about
financial risk. However, this thesis finds that, with stock investing, investors have more aspects

186
of risk concern than only financial risk. The additional concerns are information safety (safety
risk), time waste (time risk), social standing (social risk), wrong choices among stocks (choice
risk), missing out on other financial opportunities (opportunity risk), and debt problems
(leverage risk).
Lastly, the structural equation models (SEM) developed in this thesis to examine direct and
indirect relationships between perceived risk, risk tolerance, trust, and debt decisions are an
additional contribution to the current methodology in finance. SEM techniques are widely
applied in consumer behaviour, but little utilised in finance. The advantage of SEM compared
to the traditional techniques; for example, multiple regression with fixed effect and the random
effect; is that SEM can test the relationships between multiple independent and dependent
variables in a model.
7.3 Implications and recommendations
The results of this thesis have nine implications, as presented in chapter 4,5 and 6. First, a major
finding is that perceived risk of stock investment directly relates to the use of informal debt,
while risk tolerance is associated with the use of financial leverage. Although perceived risk
and risk tolerance both refer to the subjective risk attitudes, risk tolerance, shaped through the
13-item scale developed by Grable and Lytton (1999), is more prone to personality traits,
whereas risk perception is more inclined to be a subjective judgement, that is, how to think and
feel about the risks (Renner, Gamp, Schmälzle, & Schupp, 2015). Therefore, the findings of
this thesis imply that the subjective judgement about risk and personality traits toward risk may
work differently in regard to the choice of borrowing, either formal or informal.
Second, when making a purchase decision, both investors and consumers are concerned about
financial loss, safety loss (i.e. personal information leaked by hackers or virus), social loss (i.e.

187
holding low esteem when making a large loss), and time loss (i.e. spending much time on
looking for information, but the outcomes being not what are expected). This implies that these
four risk concerns are the general risk concerns for people who make purchase decisions
despite their different preferences for the purchase. However, buyers need to be aware that the
more the concerns about these types of risk, the more the borrowing is from informal lenders.
For investors who borrow money for stock investment, they should be careful about their
choices of stocks for investment and monitor the investment results frequently to execute a
timely adjustment in their investment strategy, reducing the risk of breaking private
relationships with informal lenders and legal problems with formal lenders. Besides, although
informal borrowing is common in Vietnamese culture, borrowers should be aware of using
money from these sources effectively and respectfully.
For lenders, especially informal lenders, they should consider prudently about lending money
to investors because, in some instances, investors borrow money from many informal sources,
and as a result, failure in stock investment may impact on the family life of many lenders, even
spreading out to a larger network. To minimise the possible problems, informal lenders should
improve knowledge of stock investment to advise their borrowers on the stock investment,
rather than giving money to borrowers and leaving them to make all investment decisions
themselves. Moreover, informal lenders should have good financial plans for their family in
which money should be divided into many alternative uses to ensure that lending money to
investors does not affect their family life.
Third, risk tolerance is positively associated with the use of financial leverage. Use of financial
leverage for stock investment has advantages and disadvantages. The benefits this brings for
investors are to hopefully earn higher returns or larger returns from a small equity outlay.

188
However, the risks investors face are a large loss and then legal problems if insolvency occurs.
Therefore, risk-tolerant investors should consider prudently which stocks to financially
leverage to minimise the risks. Moreover, they should control levels of returns expected from
financial leverage by following strictly the trading strategy of “cut losses and take profits”.
That is, investors identify the parameters in which stocks are sold for loss-cutting or profit-
taking.
Short-term investors and stockbrokers tend to use informal debt for stock investment in which
informal lenders are mainly parents and friends. This implies that investors’ stock investment
may impact on the life of parents and friends. Therefore, investors should contemplate the
choices of stocks for investment and effectiveness of these investments to avoid harm to their
family or friends. Although informal borrowing is common in Vietnamese culture, investors
should limit the amount of money borrowed from informal lenders because this borrowing
could have flow-on effects on the broader network.
Fourth, stockbrokers are more likely to borrow money from parents or friends for stock
investment, perhaps because of their social standing in stock market cycles. This implies that
they may care “too much” for their reputations, leading them to ignore the possible risk to their
family or friends. Thus, stockbrokers should be careful when making decisions on informal
borrowing due to its influence on others’ lives. Importantly, they should not pay much attention
to the social standing while borrowing money for stock investment, leading to biases in the
decision-making process.
Fifth, trust is also associated with the use of informal debt. Investors highly trust many parties,
ranked in descending order, listed firms, stock exchanges, brokerage firms, friends or relatives
who are working for securities companies, websites of financial investment, and stockbrokers.
189
This thesis, hence, draws attention to the trustworthiness of these trust parties for investors,
particularly stock market corporations and policymakers. This is because, if trust in the stock
market is misplaced, this problem may spread to a wider network.
Sixth, investors trust many parties such as stockbrokers, websites of financial investment,
brokerage firms, listed companies, friends who are working for brokerage firms and stock
exchanges. Trust is related to vulnerability (Blair & Stout, 2001), leading investors to be
vulnerable if their trust is misplaced. To reduce mistrust, investors should consider the levels
of trust in the parties and assess when and what situations they should trust, especially, they
should evaluate the reliability of the advice by the parties.
Seventh, higher trust is associated with trading more frequently. It is noted that excessive
trading is a proxy for overconfidence and that overconfident investors tend to think that they
are better than they actually have (Barber & Odean, 2000, 2001), leading them to earn
suboptimal returns. Therefore, trusting investors should control the levels of trading frequency
to avoid overconfidence in investment decisions, which can result in poor outcomes.
Eighth, higher trust is associated with higher levels of informal debt use. There are two
implications to this. First is for trusting investors in which they may think that borrowing from
parents and friends makes stock investment safer. However, this choice might affect parents
and friends’ lives if the stock investment was not successful. Trusting investors, therefore,
should be careful about choices of stocks for investment and importantly, should evaluate the
effectiveness and trends of the stocks to reduce the possible risk to informal lenders. Second is
for the informal lenders themselves in that they may face difficulties with their lending, for
example, putting financial pressure on their families if the investors they lend to failure in their
stock investment. To reduce the risk to the family, informal lenders should not leave all

190
financial decisions to investors. Alternatively, informal lenders should improve knowledge of
stock investment to advise investors on how to invest in stocks effectively, or at least informal
lenders may monitor the investments they are exposed to alongside investors.
Finally, trading frequency is positively related to the use of financial leverage. This implies
that frequent traders prefer financial leverage for stock investment. The likely main cause for
the use of financial leverage is to earn higher returns from a small equity outlay. In practice,
returns on equity (ROE) or returns on assets (ROA) are the key financial ratios to assess
performance for both individual and institutional investors. Using financial leverage effectively
helps investors to earn higher returns from a small equity outlay, but can lead to investors
facing bankruptcy. Frequent traders, thus, should balance the ratios between equity and
leverage so as to reduce the possible risk if stock prices go down.
7.4 Further areas of research
This thesis has the following limitations. Although the findings of a relationship between
perceived risk and informal debt are robust after controlling for demographic variables and
using additional techniques, this thesis finds no instrumental variables (IVs) to deal with
endogenous problems that may be a threat to inferring a causal relationship of perceived risk
to the use of informal debt. This thesis also focuses on the relationship between perceived risk
and debt decisions. Other behavioural factors, for example, risk tolerance or trust in the stock
market, should be considered because they may impact on debt decisions. Future research
should pay attention to these aspects.
Next, the result of risk tolerance as a mediator is not robust using Hayes and Preacher’s
approach. This study suggests extra tests for this mediating relationship. Secondly, as already
mentioned, debt decisions may be affected by payment methods. Investors may pay interest to

191
the informal lenders, or they share profits or losses based on their contributed capital, or they
pay no interest. A difference in payment methods may cause heterogeneity in the use of debt.
Also, debt decisions may differ between payers and non-payers of interest. Besides, in some
instances, informal lenders may borrow money from third parties, then give these borrowings
to investors. This may lead to the flow-on effect to a broader network if investors’ stock
investments encounter problems. Thirdly, other behavioural factors, for example, trust or
perceived risk, may also impact on risk tolerance or debt decisions. All these unexplored
aspects should be considered in future research.
This thesis has not found an instrumental variable for trust to deal with the endogenous problem
that may be a threat to inferring a causal relationship of trust to the use of informal debt. Further
research should consider this. Besides, the key focus is on the relationship of trust (or perceived
risk and risk tolerance) with debt decisions. Other behavioural biases, including herding
behaviour, representativeness, mental accounting and anchor bias, should be considered as the
antecedents of debt decisions.
Lastly, an unexplored aspect pertains to investors’ payment methods, which may affect debt
decisions. Investors may pay interest or dividend returns on the contributed capital to informal
lenders. A difference in payment methods may lead to heterogeneity in the level of debt used.
There may also be a difference in the use of debt between payers and non-payers of interest.
Moreover, in some instances, informal lenders (to investors) may borrow money from third
parties, and then lend investors this borrowing. This means that the credit that investors obtain
through informal lenders may not be the informal lenders’ own money. This could magnify the
flow-on effect in a broader network if investors’ stock investment fails. Future research could
address this issue.

192
References:
Ackert, L. F. (2014). Traditional and behavioral finance. Investor Behavior: The Psychology
of Financial Planning and Investing, 25-41.
https://doi.org/10.1002/9781118813454.ch2
Agarwal, S., & Teas, R. K. (2001). Perceived value: Mediating role of perceived risk. Journal
of Marketing theory and Practice, 9(4), 1-14.
https://doi.org/10.1080/10696679.2001.11501899
Alden, D. L., Stayman, D. M., & Hoyer, W. D. (1994). Evaluation strategies of American and
Thai consumers. Psychology & Marketing, 11(2), 145-161.
Alhakami, A. S., & Slovic, P. (1994). A psychological study of the inverse relationship between
perceived risk and perceived benefit. Risk Analysis, 14(6), 1085-1096.
https://doi.org/10.1111/j.1539-6924.1994.tb00080.x
Armstrong, J. S., & Overton, T. S. (1977). Estimating nonresponse bias in mail surveys.
Journal of Marketing Research, 14(3), 396-402.
https://doi.org/10.1177/002224377701400320
Bailey, J. J., & Kinerson, C. (2005). Regret avoidance and risk tolerance. Journal of Financial
Counseling and Planning, 16(1), 23-28.
Balloch, A., Nicolae, A., & Philip, D. (2014). Stock market literacy, trust, and participation.
Review of Finance, 19(5), 1925-1963. https://doi.org/10.1093/rof/rfu040
Baomoi. (2016, Jan 11). Nhà đầu tư cá nhân chiếm đến 99% trên thị trường chứng khoán.
Retrieved from http://www.baomoi.com/nha-dau-tu-ca-nhan-chiem-den-99-tren-thi-
truong-chung-khoan/c/18421199.epi
Barbalet, J. (2009). A characterization of trust, and its consequences. Theory and Society,
38(4), 367-382. https://doi.org/10.1007/s11186-009-9087-3
Barber, B. M., Lee, Y.-T., Liu, Y.-J., & Odean, T. (2014). The cross-section of speculator skill:
Evidence from day trading. Journal of Financial Markets, 18, 1-24.
https://doi.org/10.1016/j.finmar.2013.05.006
Barber, B. M., & Odean, T. (2000). Trading is hazardous to your wealth: The common stock
investment performance of individual investors. The Journal of Finance, 55(2), 773-
806. https://doi.org/10.1111/0022-1082.00226
Barber, B. M., & Odean, T. (2001). Boys will be boys: Gender, overconfidence, and common
stock investment. The Quarterly Journal of Economics, 116(1), 261-292.
https://doi.org/10.1162/003355301556400
Barber, B. M., & Odean, T. (2013). The behavior of individual investors. In Handbook of the
economics of finance (Vol. 2, pp. 1533-1570). New York, NY: Elsevier.
https://doi.org/10.1016/B978-0-44-459406-8.00022-6
Barberis, N., & Huang, M. (2001). Mental accounting, loss aversion, and individual stock
returns. The Journal of Finance, 56(4), 1247-1292. 10.1111/0022-1082.00367
Barberis, N., & Thaler, R. (2003). A survey of behavioral finance. Handbook of the Economics
of Finance, 1, 1053-1128.
193
Barslund, M., & Tarp, F. (2008). Formal and informal rural credit in four provinces of Vietnam.
The Journal of Development Studies, 44(4), 485-503.
https://doi.org/10.1080/00220380801980798
Bauer, R. A. (1960). Consumer behavior as risk taking. In R. S. Hancock (Ed.), Dynamic
marketing for a changing world, 389-398. Proceedings of the 43rd Conference of the
American Marketing Association.
Bebchuk, L. A., & Stole, L. A. (1993). Do short‐term objectives lead to under‐or
overinvestment in long‐term projects? The Journal of Finance, 48(2), 719-729.
https://doi.org/10.1111/j.1540-6261.1993.tb04735.x
Bélanger, F., & Carter, L. (2008). Trust and risk in e-government adoption. The Journal of
Strategic Information Systems, 17(2), 165-176.
Ben-Ner, A., & Putterman, L. (2001). Trusting and trustworthiness. Boston University Law
Review, 81(3), 523-551.
Berkelaar, A., & Kouwenberg, R. (2009). From boom ‘til bust: how loss aversion affects asset
prices. Journal of Banking & Finance, 33(6), 1005-1013.
doi:https://doi.org/10.1016/j.jbankfin.2008.10.019
Bikas, E., Jurevičienė, D., Dubinskas, P., & Novickytė, L. (2013). Behavioural finance: The
emergence and development trends. Procedia-social and behavioral sciences, 82, 870-
876. doi:https://doi.org/10.1016/j.sbspro.2013.06.363
Blair, M. M., & Stout, L. A. (2001). Trust, trustworthiness, and the behavioral foundations of
corporate law. University of Pennsylvania Law Review, 149(6), 1735-1810.
https://www.jstor.org/stable/3312898
Bloomfield R. (2010) behavioural finance. In: Durlauf S.N., Blume L.E. (eds) Behavioural
and Experimental Economics. The New Palgrave Economics Collection. Palgrave
Macmillan, London. https://doi.org/10.1057/9780230280786_5
Blume, M. E., & Friend, I. (1978). The changing role of the individual investor: A twentieth
century fund report. Malabar, FL: Krieger Publishing Company.
Brabazon, T. (2000). Behavioural Finance: A new sunrise or a false dawn. Paper presented at
the CoIL Summer School 2000, University of Limerick.
Byrne, K. (2005). How do consumers evaluate risk in financial products? Journal of Financial
Services Marketing, 10(1), 21-36. DOI:
https://link.springer.com/article/10.1057/palgrave.fsm.4770171
Chandavarkar, A. G. (1985). The informal financial sector in developing countries: Analysis,
evidence and policy implications. Paper presented at the South East Asian Central
Banks (SEACEN) Research and Training Centre, Yogyakarta, Indonesia. 20-22
November.
Chen, G., Kim, K. A., Nofsinger, J. R., & Rui, O. M. (2007). Trading performance, disposition
effect, overconfidence, representativeness bias, and experience of emerging market
investors. Journal of behavioral decision making, 20(4), 425-451.
doi:https://doi.org/10.1002/bdm.561

194
Chu, N. M. N., & Vuong, V. T. (2015). Sử dụng hồi quy với biến công cụ để tìm hiểu các yếu
tố chi phối quyết định đầu tư của nhà đầu tư chứng khoán Việt Nam. Tạp chí Phát triển
& Hội nhập, 25(35), 14-23.
Cohn, R. A., Lewellen, W. G., Lease, R. C., & Schlarbaum, G. G. (1975). Individual investor
risk aversion and investment portfolio composition. The Journal of Finance, 30(2),
605-620. https://doi.org/10.1111/j.1540-6261.1975.tb01834.x
Cong, W., & Hanna, S. D. (2007). The risk tolerance and stock ownership of business owning
households. Journal of Financial Counseling and Planning, 18(2), 3-18.
Cook, K. S. (2001). Trust in society. New York, NY: Russell Sage Foundation.
Cook, K. S., & Cooper, R. M. (2003). Experimental studies of cooperation, trust, and social
exchange. In W. Ostrom E., J.M. (Ed.), Trust and reciprocity: Interdisclpinary lessons
from experimental research (Vol. 6, pp. 209-244). New York, NY: Russell Sage
Foundation.
Corritore, C. L., Kracher, B., & Wiedenbeck, S. (2003). On-line trust: concepts, evolving
themes, a model. International Journal of Human-computer Studies, 58(6), 737-758.
https://doi.org/10.1016/S1071-5819(03)00041-7
Corter, J. E., & Chen, Y.-J. (2006). Do investment risk tolerance attitudes predict portfolio
risk? Journal of Business and Psychology, 20(3), 369-381.
https://doi.org/10.1007/s10869-005-9010-5
Cunningham, M. S. (1967). The major dimensions of perceived risk. Risk taking and
Information Handling in Consumer Behavior, 1, 82-108.
Cuong, P. K., & Jian, Z. (2014). Factors influencing individual investors’ behavior: An
empirical study of the Vietnamese stock market. American Journal of Business and
Management, 3(2), 77-94.
De Bondt, W. F., & Thaler, R. H. (1995). Financial decision-making in markets and firms: A
behavioral perspective. Handbooks in Operations Research and Management Science,
9, 385-410. https://doi.org/10.1016/S0927-0507(05)80057-X
Deering, B. J., & Jacoby, J. (1972). Risk enhancement and risk reduction as strategies for
handling perceived risk. ACR Special Volumes
Diacon, S., & Ennew, C. (2001). Consumer perceptions of financial risk. The Geneva Papers
on Risk and Insurance. Issues and Practice, 26(3), 389-409.
Diagne, A. (1999). Determinants of household access to and participation in formal and
informal credit markets in Malawi. Food Consumption and Nutrition Division (FCND)
discussion paper 67, IFPRI, Washington.
Diamond, A., & Sekhon, J. S. (2013). Genetic matching for estimating causal effects: A general
multivariate matching method for achieving balance in observational studies. Review
of Economics and Statistics, 95(3), 932-945. https://doi.org/10.1162/REST_a_00318
Dohmen, T., Falk, A., Huffman, D., Sunde, U., Schupp, J., & Wagner, G. G. (2011). Individual
risk attitudes: Measurement, determinants, and behavioral consequences. Journal of the
European Economic Association, 9(3), 522-550. https://doi.org/10.1111/j.1542-
4774.2011.01015.x

195
Dorn, D., & Huberman, G. (2005). Talk and action: What individual investors say and what
they do. Review of Finance, 9(4), 437-481. https://doi.org/10.1007/s10679-005-4997-z
Dowling, G. R., & Staelin, R. (1994). A model of perceived risk and intended risk-handling
activity. Journal of Consumer Research, 21(1), 119-134.
https://doi.org/10.1086/209386
Easley, D., & Yang, L. (2015). Loss aversion, survival and asset prices. Journal of economic
theory, 160, 494-516. doi:https://doi.org/10.1016/j.jet.2015.08.013
Edwards, W. (1954). The theory of decision making. Psychological Bulletin, 51(4), 380-417.
http://dx.doi.org/10.1037/h0053870
Edwards, W. (1961). Behavioral decision theory. Annual Review of Psychology, 12(1), 473-
498.
Fama, E. F. (1991). Efficient capital markets: II. The Journal of Finance, 46(5), 1575-1617.
ttps://doi.org/10.1111/j.1540-6261.1991.tb04636.x
Fogel, S. O. C., & Berry, T. (2006). The disposition effect and individual investor decisions:
The roles of regret and counterfactual alternatives. The Journal of Behavioral Finance,
7(2), 107-116. http://dx.doi.org/10.1207/s15427579jpfm0702_5
Frijns, B., Koellen, E., & Lehnert, T. (2008). On the determinants of portfolio choice. Journal
of Economic Behavior & Organization, 66(2), 373-386.
https://doi.org/10.1016/j.jebo.2006.04.004
Furnham, A. (1986). Response bias, social desirability and dissimulation. Personality and
Individual Differences, 7(3), 385-400. https://doi.org/10.1016/0191-8869(86)90014-0
Ganzach, Y. (2000). Judging risk and return of financial assets. Organizational Behavior and
Human Decision Processes, 83(2), 353-370. https://doi.org/10.1006/obhd.2000.2914
Gaspar, J.-M., Massa, M., & Matos, P. (2005). Shareholder investment horizons and the market
for corporate control. Journal of Financial Economics, 76(1), 135-165.
Georgarakos, D., & Pasini, G. (2011). Trust, sociability, and stock market participation. Review
of Finance, 15(4), 693-725. https://doi.org/10.1093/rof/rfr028
Germidis, D. A., Kessler, D., & Meghir, R. (1991). Financial systems and development: What
role for the formal and informal financial sectors? Paris, France: OECD.
Ghate, P. (1992). Informal finance: Some findings from Asia. Oxford, UK: Oxford University
Press.
Gilbert, D. (2009). Stumbling on happiness. New York, NY: Vintage Canada.
Gilliam, J., Chatterjee, S., & Grable, J. E. (2010). Measuring the perception of financial risk
tolerance: A tale of two measures. Journal of Financial Counseling and Planning,
21(2), 30-43.
Gilovich, T. (1991). How we know what isn't so: The fallibility of human reason in everyday
life. New York, NY: Free Press.
Glaser, M., & Weber, M. (2007). Overconfidence and trading volume. The Geneva Risk and
Insurance Review, 32(1), 1-36. https://doi.org/10.1007/s10713-007-0003-3

196
Grable, J. E. (2000). Financial risk tolerance and additional factors that affect risk taking in
everyday money matters. Journal of Business and Psychology, 14(4), 625-630.
https://doi.org/10.1023/A:1022994314982
Grable, J. E. (2008). Risk tolerance. In J. J. Xiao (Ed.), Handbook of consumer finance
research, 3-19. New York, NY: Springer-Verlag.
Grable, J. E., & Joo, S.-H. (2004). Environmental and biophysical factors associated with
financial risk tolerance. Journal of Financial Counseling and Planning, 15(1), 73-82.
Grable, J. E., & Lytton, R. H. (1999). Financial risk tolerance revisited: The development of a
risk assessment instrument. Financial Services Review, 8(3), 163-181.
https://doi.org/10.1016/S1057-0810(99)00041-4
Grable, J. E., & Lytton, R. H. (2001). Assessing the concurrent validity of the SCF risk
tolerance question. Journal of Financial Counseling and Planning, 12(2), 43-53.
Grable, J. E., & Roszkowski, M. J. (2008). The influence of mood on the willingness to take
financial risks. Journal of Risk Research, 11(7), 905-923.
Graham, J. R., Harvey, C. R., & Huang, H. (2009). Investor competence, trading frequency,
and home bias. Management Science, 55(7), 1094-1106.
https://doi.org/10.1287/mnsc.1090.1009
Guérin, I., d'Espallier, B., & Venkatasubramanian, G. (2013). Debt in rural South India:
Fragmentation, social regulation and discrimination. The Journal of Development
Studies, 49(9), 1155-1171. https://doi.org/10.1080/00220388.2012.720365
Guirkinger, C. (2008). Understanding the coexistence of formal and informal credit markets in
Piura, Peru. World Development, 36(8), 1436-1452.
https://doi.org/10.1016/j.worlddev.2007.07.002
Guiso, L., Sapienza, P., & Zingales, L. (2008). Trusting the stock market. The Journal of
Finance, 63(6), 2557-2600. https://doi.org/10.1111/j.1540-6261.2008.01408.x
Hair, J., Black, W., Babin, B. J., & Anderson, R. (2014). Multivariate data analysis (7th ed.)
Harlow, UK: Pearson Education Limited.
Halek, M., & Eisenhauer, J. G. (2001). Demography of risk aversion. Journal of Risk and
Insurance, 68(1), 1-24. https://www.jstor.org/stable/2678130
Hallahan, T., Faff, R., & McKenzie, M. (2003). An exploratory investigation of the relation
between risk tolerance scores and demographic characteristics. Journal of
Multinational Financial Management, 13(4), 483-502. https://doi.org/10.1016/S1042-
444X(03)00022-7
Hallahan, T., Faff, R., & McKenzie, M. (2004). An empirical investigation of personal
financial risk tolerance. Financial Services Review, 13(1), 57-78.
Hansson, S. O. (1994). Decision theory - A brief introduction. [reference needs to be completed
- you need to provide enough detial that someone can find the book]
Hardin, R. (2001). Conceptions and explanations of trust. In K. S. Cook (Ed.), Trust in Society
(Vol. II, pp. 3-39): New York, NY: Russell Sage Foundation.
Hardin, R. (2006). Trust. Cambridge, UK: Polity.

197
Hayes, A. F. (2017). Introduction to mediation, moderation, and conditional process analysis:
A regression-based approach. New York, NY: Guilford Publications.
Hayes, A. F., & Preacher, K. J. (2010). Quantifying and testing indirect effects in simple
mediation models when the constituent paths are nonlinear. Multivariate Behavioral
Research, 45(4), 627-660.
Heidhues, P., & Kőszegi, B. (2010). Exploiting Naïvete about Self-Control in the Credit
Market. American Economic Review, 100(5), 2279-2303. doi:10.1257/aer.100.5.2279
Hickson, L., & Khemka, I. (2014). The psychology of decision making. International Review
of Research in Developmental Disabilities, 47, 185-229. https://doi.org/10.1016/B978-
0-12-800278-0.00006-3
Ho, D. E., Imai, K., King, G., & Stuart, E. A. (2007). Matching as nonparametric preprocessing
for reducing model dependence in parametric causal inference. Political Analysis,
15(3), 199-236. https://doi.org/10.1093/pan/mpl013
Hoch, S. J., & Loewenstein, G. F. (1991). Time-inconsistent preferences and consumer self-
control. Journal of Consumer Research, 17(4), 492-507.
https://doi.org/10.1086/208573
Horton, R. L. (1976). The structure of perceived risk: Some further progress. Journal of the
Academy of Marketing Science, 4(3), 694-706.
Hoyer, W. D., MacInnis, D. J., & Pieters, R. (2016). Consumer behavior: Nelson Education.
Huberman, G. (2001). Familiarity breeds investment. The Review of Financial Studies, 14(3),
659-680. https://doi.org/10.1093/rfs/14.3.659
Hunt, S. D. (2002). Foundations of marketing theory: Toward a general theory of marketing.
Armonk, NY: ME Sharpe.
Jacoby, J., & Kaplan, L. B. (1972). The components of perceived risk. Paper presented at the
The Third Annual Conference of the Association for Consumer Research, Chicago, IL.
Jordan, D. J., & Diltz, J. D. (2003). The profitability of day traders. Financial Analysts Journal,
59(6), 85-94. https://doi.org/10.2469/faj.v59.n6.2578
Jordan, D. J., & Diltz, J. D. (2004). Day traders and the disposition effect. The Journal of
Behavioral Finance, 5(4), 192-200. https://doi.org/10.1207/s15427579jpfm0504_2
Kahneman, D., & Riepe, M. W. (1998). Aspects of investor psychology. The Journal of
Portfolio Management, 24(4), 52-65. 10.3905/jpm.1998.409643
Kahneman, D., & Tversky, A. (1972). Subjective probability: A judgment of
representativeness. Cognitive Psychology, 3(3), 430-454.
Kahneman, D., & Tversky, A. (1979). Prospect theory: An analysis of decision under risk.
Econometrica: Journal of the Econometric Society, 47(2), 263-291.
https://doi.org/10.1142/9789814417358_0006
Kaniel, R., Liu, S., Saar, G., & Titman, S. (2012). Individual investor trading and return
patterns around earnings announcements. The Journal of Finance, 67(2), 639-680.
https://doi.org/10.1111/j.1540-6261.2012.01727.x

198
Kannadhasan, M. (2015). Retail investors' financial risk tolerance and their risk-taking
behaviour: The role of demographics as differentiating and classifying factors. IIMB
Management Review, 27(3), 175-184. https://doi.org/10.1016/j.iimb.2015.06.004
Kim, K. A., & Nofsinger, J. R. (2003). The behavior and performance of individual investors
in Japan. Pacific Basin Finance Journal, 11(1), 1-22.
Knack, S., & Keefer, P. (1997). Does social capital have an economic payoff? A cross-country
investigation. The Quarterly Journal of Economics, 112(4), 1251-1288.
https://doi.org/10.1162/003355300555475
Krejcie, R. V., & Morgan, D. W. (1970). Determining sample size for research activities.
Educational and Psychological Measurement, 30(3), 607-610.
https://doi.org/10.1177/001316447003000308
Krumpal, I. (2013). Determinants of social desirability bias in sensitive surveys: A literature
review. Quality & Quantity, 47(4), 2025-2047. https://doi.org/10.1007/s11135-011-
9640-9
Kwon, I. W. G., & Suh, T. (2004). Factors affecting the level of trust and commitment in supply
chain relationships. Journal of Supply Chain Management, 40(1), 4-14.
https://doi.org/10.1111/j.1745-493X.2004.tb00165.x
Landman, J. (1993). Regret: The persistence of the possible. Oxford, UK: Oxford University
Press.
Lepley, W. M. (1963). “The Maturity of the Chances”: A Gambler's Fallacy. The Journal of
Psychology, 56(1), 69-72. 10.1080/00223980.1963.9923699
Levhari, D., & Levy, H. (1977). The capital asset pricing model and the investment horizon.
The Review of Economics and Statistics, 92-104. https://www.jstor.org/stable/1924908
Li, C., Turmunkh, U., & Wakker, P. P. (2019). Trust as a decision under ambiguity.
Experimental Economics, 22(1), 51-75.
Lintner, J. (1965). The valuation of risk assets and the selection of risky investments. Stock
Portfolios and Capital Budgets, 47(1), 13-37.
Lo, A. W., Repin, D. V., & Steenbarger, B. N. (2005). Fear and greed in financial markets: A
clinical study of day-traders. American Economic Review, 95(2), 352-359.
10.1257/000282805774670095
Lucarelli, C., & Brighetti, G. (2011). Errors in individual risk tolerance. In P. Molyneux (Ed.),
Bank Strategy, Governance and Ratings (pp. 157-193). London, UK: Palgrave
Macmillan..
Luong, P., & Ha, T. (2011). Behavioral factors influencing individual investor's decision
making and performance. Survey of the Ho Chi Minh Stock Exchange, Umea School of
Business Spring semester.
Lusardi, A. (1999). Information, expectations, and savings for retirement. In H. Aaron,
Behavioral Dimensions of Retirement Economics (pp. 81-155). Washington, DC:
Brookings Institution and Russell Sage Foundation.

199
Lusardi, A., & Mitchelli, O. S. (2007). Financial literacy and retirement preparedness:
Evidence and implications for financial education. Business economics, 42(1), 35-44.
https://doi.org/10.2145/20070104
Lusardi, A., & Tufano, P. (2015). Debt literacy, financial experiences, and
overindebtedness. Journal of Pension Economics & Finance, 14(4), 332-368.
https://doi.org/10.1017/S1474747215000232
MacGregor, D. G., Slovic, P., Berry, M., & Evensky, H. (1999). Perception of financial risk:
A survey study of advisors and planners. Journal of Financial Planning, 12(8), 68-86.
MacKinnon, D. P., Fairchild, A. J., & Fritz, M. S. (2007). Mediation analysis. Annual Review
of Psychology, 58, 593-614.
Markiewicz, Ł., & Weber, E. U. (2013). DOSPERT's gambling risk-taking propensity scale
predicts excessive stock trading. Journal of Behavioral Finance, 14(1), 65-78.
https://doi.org/10.1080/15427560.2013.762000
Markowitz, H. (1952). Portfolio selection. The Journal of Finance, 7(1), 77-91.
10.1111/j.1540-6261.1952.tb01525.x
Menezes, C. F., & Auten, G. E. (1978). The theory of optimal saving decisions under income
risk. International Economic Review, 253-258. https://www.jstor.org/stable/2526409
Merkle, C. (2017). Financial overconfidence over time: Foresight, hindsight, and insight of
investors. Journal of Banking & Finance, 84, 68-87.
doi:https://doi.org/10.1016/j.jbankfin.2017.07.009
Miller, M. H., & Modigliani, F. (1961). Dividend policy, growth, and the valuation of shares.
The Journal of Business, 34(4), 411-433.
Mitchell, V.-W. (1999). Consumer perceived risk: conceptualisations and models. European
Journal of Marketing, 33(1/2), 163-195.
http://dx.doi.org/10.1108/03090569910249229
Mohieldin, M. S., & Wright, P. W. (2000). Formal and informal credit markets in Egypt.
Economic Development and Cultural Change, 48(3), 657-670.
Möllering, G. (2001). The nature of trust: From Georg Simmel to a theory of expectation,
interpretation and suspension. Sociology, 35(2), 403-420.
https://doi.org/10.1017/S0038038501000190
Moore, D. A., & Healy, P. J. (2008). The trouble with overconfidence. Psychological Review,
115(2), 502-517. http://dx.doi.org/10.1037/0033-295X.115.2.502
Morin, R. A., & Suarez, A. F. (1983). Risk aversion revisited. The Journal of Finance, 38(4),
1201-1216. https://doi.org/10.1111/j.1540-6261.1983.tb02291.x
Mossin, J. (1966). Equilibrium in a capital asset market. Econometrica: Journal of the
Econometric Society, 34(4), 768-783.
Ngo, T. P. L. (2018, November 14). The Vietnamese stock exchange continues its remarkable
ascent. World Finance. Retrieved from https://www.worldfinance.com/wealth-
management/the-vietnamese-stock-market-continues-its-ascent

200
Ngoc, L. T. B. (2014). Behavior pattern of individual investors in stock market. International
Journal of Business and Management, 9(1), 1-16.
http://dx.doi.org/10.5539/ijbm.v9n1p1
Nguyen, D., & Pham, M. (2018). Search-based sentiment and stock market reactions: An
empirical evidence in Vietnam. Journal of Asian Finance, Economics and Business,
5(4), 45-56. http://db.koreascholar.com/article.aspx?code=359871
Nguyen, V. C. (2008). Is a governmental micro‐credit program for the poor really pro‐poor?
Evidence from Vietnam. The Developing Economies, 46(2), 151-187.
https://doi.org/10.1111/j.1746-1049.2008.00061.x
Nguyen, V. C., & Berg, v. d. M. (2014). Informal credit, usury, or support? A case study for
Vietnam. The Developing Economies, 52(2), 154-178.
https://doi.org/10.1111/deve.12042
Nofsinger, J. R. (2008). The psychology of investing (3rd ed.). Upper Saddle River, NJ: Pearson
Prentice Hall.
Odean, T. (1998). Volume, volatility, price, and profit when all traders are above average. The
Journal of Finance, 53(6), 1887-1934. 10.1111/0022-1082.00078
Odean, T. (1999). Do investors trade too much? The American Economic Review, 89(5), 1279-
1298. 10.1257/aer.89.5.1279
Okun, M. A. (1976). Adult age and cautiousness in decision. Human Development, 19(4), 220-
233.
Pålsson, A.-M. (1996). Does the degree of relative risk aversion vary with household
characteristics? Journal of Economic Psychology, 17(6), 771-787.
https://doi.org/10.1016/S0167-4870(96)00039-6
Papies, D., Ebbes, P., & Van Heerde, H. J. (2017). Addressing endogeneity in marketing
models. In P. Leeflang, J. Wieringa, T. Bijmolt, & K. Pauwels (Eds.), Advanced
methods for modeling markets (pp. 581-627). New York, NY: Springer.
https://doi.org/10.1007/978-3-319-53469-5_18
Pearl, J. (1998). Graphs, causality, and structural equation models. Sociological Methods &
Research, 27(2), 226-284. https://doi.org/10.1177/0049124198027002004
Peter, J. P., & Ryan, M. J. (1976). An investigation of perceived risk at the brand level. Journal
of Marketing Research, 13(2), 184-188. 10.2307/3150856
Peter, J. P., & Tarpey Sr, L. X. (1975). A comparative analysis of three consumer decision
strategies. Journal of Consumer Research, 2(1), 29-37.
Phan, C., & Zhou, J. (2014). Vietnamese individual investors’ behavior in the stock market:
An exploratory study. Research Journal of Social Science & Management, 3(12), 46-
54.
Phung, T. M. T. (2015). Behavioral factors affecting investment decision-making. The case of
Ho Chi Minh Stock Exchange (HOSE), Vietnam. Journal of Transportation Science
and Techonology, 14, 106-110.
Pixley, J. (2004). Emotions in finance: Distrust and uncertainty in global markets. Cambridge,
UK: Cambridge University Press.

201
Platteau, J. P. (1994). Behind the market stage where real societies exist‐part I: The role of
public and private order institutions. The Journal of Development Studies, 30(3), 533-
577. https://doi.org/10.1080/00220389408422328
Pompian, M. (2006). Behavioral finance and wealth management: How to build optimal
portfolios for private clients: John Wiley & Sons, Inc.
https://doi.org/10.1002/9781119202400.ch8
Pompian, M. (2012a). Behavioral Finance and Investor Types: Managing Behavior to Make
Better Investment Decisions. Hoboken, NJ: John Wiley & Sons.
Pompian, M. (2012b). Self-control bias. In M. Pompian, Behavioral finance and wealth
management: How to build investment strategies that account for investor biases.
Hoboken, NJ: John Wiley & Sons. https://doi.org/10.1002/9781119202400.ch19
Rau, H. A. (2014). The disposition effect and loss aversion: Do gender differences matter?
Economics Letters, 123(1), 33-36. doi:https://doi.org/10.1016/j.econlet.2014.01.020
Renner, B., Gamp, M., Schmälzle, R., & Schupp, H. T. (2015). Health risk perception. In J. D.
Wright (Ed.), International encyclopedia of the social and behavioral sciences. (pp.
702-709). Amsterdam, Holland: Elsevier. https://dx.doi.org/10.1016/B978-0-08-
097086-8.14138-8
Ricciardi, V. (2008). The psychology of risk: The behavioral finance perspective. In V.
Ricciardi (Ed.), Handbook Of finance (Vol. 2, pp. 85-111). Wiley Online Library.
https://doi.org/10.1002/9780470404324.hof002010
Riley Jr, W. B., & Chow, K. V. (1992). Asset allocation and individual risk aversion. Financial
Analysts Journal, 48(6), 32-37. https://www.jstor.org/stable/4479593
Ritter, J. R. (2003). Behavioral finance. Pacific-Basin Finance Journal, 11(4), 429-437.
https://doi.org/10.1016/S0927-538X(03)00048-9
Rosenbaum, P. R., & Rubin, D. B. (1983). The central role of the propensity score in
observational studies for causal effects. Biometrika, 70(1), 41-55.
https://doi.org/10.1093/biomet/70.1.41
Roussanov, N., & Savor, P. (2014). Marriage and managers' attitudes to risk. Management
Science, 60(10), 2496-2508. https://doi.org/10.1287/mnsc.2014.1926
Schneier, B. (2006). Beyond fear: Thinking sensibly about security in an uncertain world.
Berlin, Germany: Springer Science & Business Media.
Schooley, D. K., & Worden, D. D. (1996). Risk aversion measures: Comparing attitudes and
asset allocation. Financial Services Review, 5(2), 87-99.
Sedgwick, J., & Pokorny, M. (2010). Consumers as risk takers: Evidence from the film industry
during the 1930s. Business History, 52(1), 74-99.
https://doi.org/10.1080/00076790903469620
Shapiro, S. (2012). The grammar of trust. In J. Pixley (Ed.), New perspectives on emotions in
finance: The sociology of confidence, fear and betrayal (pp. 99-118). England:
Routledge.
Sharpe, W. F. (1964). Capital asset prices: A theory of market equilibrium under conditions of
risk. The Journal of Finance, 19(3), 425-442.

202
Shefrin, H. (2001). Do investors expect higher returns from safer stocks than from riskier
stocks? The Journal of Psychology and Financial Markets, 2(4), 176-181.
https://doi.org/10.1207/S15327760JPFM0204_1
Shefrin, H. (2002). Beyond greed and fear: Understanding behavioral finance and the
psychology of investing. Oxford University Press on Demand.
https://www.oxfordscholarship.com/view/10.1093/0195161211.001.0001/acprof-
9780195161212
Shefrin, H., & Statman, M. (1985). The disposition to sell winners too early and ride losers too
long: Theory and evidence. The Journal of Finance, 40(3), 777-790. 10.1111/j.1540-
6261.1985.tb05002.x
Simon, H. A. (1955). A behavioral model of rational choice. The Quarterly Journal of
Economics, 69(1), 99-118. https://doi.org/10.2307/1884852
Simon, H. A. (1978). Rationality as process and as product of thought. The American Economic
Review, 68(2), 1-16.
Slovic, P., Fischhoff, B., & Lichtenstein, S. (1977). Behavioral decision theory. Annual Review
of Psychology, 28(1), 1-39. http://dx.doi.org/10.1146/annurev.ps.28.020177.000245
Statman, M. (2005). Normal investors, then and now. Financial Analysts Journal, 61(2), 31-
37. https://doi.org/10.2469/faj.v61.n2.2713
Stone, R. N., & Winter, F. W. (1987). Risk: Is it still uncertainty times consequences. Paper
presented at the Proceedings of the American Marketing Association.
Stout, L. A. (2009). Trust behavior: The essential foundation of securities markets. In H. K.
Baker, & J. R. Nofsinger (Eds.), Behavioral finance: Investors, corporations, and
markets (pp. 513-522). Hoboken, NJ: John Wiley & Sons, Inc.
Strahilevitz, M. A., Odean, T., & Barber, B. M. (2011). Once burned, twice shy: How naïve
learning, counterfactuals, and regret affect the repurchase of stocks previously sold.
Journal of marketing research, 48(SPL), S102-S120.
doi:https://doi.org/10.1509/jmkr.48.SPL.S102
Strömbäck, C., Lind, T., Skagerlund, K., Västfjäll, D., & Tinghög, G. (2017). Does self-control
predict financial behavior and financial well-being? Journal of Behavioral and
Experimental Finance, 14, 30-38.
Sung, J., & Hanna, S. D. (1998). The spouse effect on participation and investment decisions
for retirement funds. Journal of Financial Counseling and Planning, 9(2), 47-58.
Sweeney, J. C., Soutar, G. N., & Johnson, L. W. (1999). The role of perceived risk in the
quality-value relationship: A study in a retail environment. Journal of Retailing, 75(1),
77-105. https://doi.org/10.1016/S0022-4359(99)80005-0
Tanomchat, W., & Sampattavanija, S. (2018). Dependence of informal interest rates and level
of lenders’ influence in the informal loan market in Thailand. International Advances
in Economic Research, 24(1), 47-63. https://doi.org/10.1007/s11294-018-9672-1
Thaler, R. H. (1999). Mental accounting matters. Journal of Behavioral Decision Making,
12(3), 183-206. https://doi.org/10.1002/(SICI)1099-0771(199909)12:3<183::AID-
BDM318>3.0.CO;2-F

203
Thaler, R. H., & Johnson, E. J. (1990). Gambling with the house money and trying to break
even: The effects of prior outcomes on risky choice. Management Science, 36(6), 643-
660.
Thaler, R. H., & Shefrin, H. M. (1981). An economic theory of self-control. Journal of Political
Economy, 89(2), 392-406.
Tho, N. H., Trang, P. T. M., & Van Hoa, N. (2018). Avoidance of risk, ambiguity and
uncertainty in investment choices. Asian Journal of Scientific Research, 11(4), 522-
531. https://doi.org/10.3923/AJSR.2018.522.531
Todd, P. M., & Gigerenzer, G. (2003). Bounding rationality to the world. Journal of Economic
Psychology, 24(2), 143-165. https://doi.org/10.1016/S0167-4870(02)00200-3
Ton, H. T. H., & Dao, T. K. (2014). The effects of psychology on individual investors'
behaviors: Evidence from the Vietnam Stock Exchange. Journal of Management and
Sustainability, 4(3), 125-134.
Trang, P. T. M., & Khuong, M. N. (2017). Personality traits, perceived risk, uncertainty, and
investment performance in Vietnam. Global Business and Finance Review, 22, 67-79.
Http://dx.doi.org/10.17549/gbfr.2017.22.1.67
Trang, P. T. M., & Tho, N. H. (2017). Perceived risk, investment performance and intentions
in emerging stock markets. International Journal of Economics and Financial Issues,
7(1), 269-278. http://dergipark.gov.tr/ijefi/issue/32002/353185
Turvey, C. G., & Kong, R. (2010). Informal lending amongst friends and relatives: Can
microcredit compete in rural China? China Economic Review, 21(4), 544-556.
Tversky, A., & Kahneman, D. (1971). Belief in the law of small numbers. Psychological
Bulletin, 76(2), 105-110.
Tversky, A., & Kahneman, D. (1973). Availability: A heuristic for judging frequency and
probability. Cognitive Psychology, 5(2), 207-232.
Tversky, A., & Kahneman, D. (1974). Judgment under uncertainty: Heuristics and biases.
Science, 185(4157), 1124-1131. 10.1126/science.185.4157.1124
Tversky, A., & Kahneman, D. (1975). Judgment under uncertainty: Heuristics and biases. In
D. Wendt, & C. Vlek (Eds.), Utility, probability, and human decision making (pp. 141-
162). Dordrecht, Germany: Springer.
Tversky, A., & Kahneman, D. (1981). The framing of decisions and the psychology of choice.
Science, 211(4481), 453-458. 10.1126/science.7455683
Van de Ven, A. H. (1986). Central problems in the management of innovation. Management
Science, 32(5), 590-607.
Van Rooij, M., Lusardi, A., & Alessie, R. (2011). Financial literacy and stock market
participation. Journal of Financial Economics, 101(2), 449-472.
https://doi.org/10.1016/j.jfineco.2011.03.006
Vives, X. (1995). Short-term investment and the informational efficiency of the market. The
Review of Financial Studies, 8(1), 125-160. https://doi.org/10.1093/rfs/8.1.125
Von Neumann, J., & Morgenstern, O. (1944). Theory of games and economic behavior.
Princeton, NJ: Princeton University Press.
204
Wang, H., & Hanna, S. D. (1997). Does risk tolerance decrease with age? Journal of Financial
Counseling and Planning, 8(2), 27-32.
Waweru, N. M., Munyoki, E., & Uliana, E. (2008). The effects of behavioural factors in
investment decision-making: A survey of institutional investors operating at the Nairobi
Stock Exchange. International Journal of Business and Emerging Markets, 1(1), 24-
41. doi:http://dx.doi.org/10.1504/IJBEM.2008.019243
Weber, E. U., Blais, A. R., & Betz, N. E. (2002). A domain‐specific risk‐attitude scale:
Measuring risk perceptions and risk behaviors. Journal of Behavioral Decision Making,
15(4), 263-290. 10.1002/bdm.414
Weber, E. U., & Milliman, R. A. (1997). Perceived risk attitudes: Relating risk perception to
risky choice. Management Science, 43(2), 123-144.
Wu, J., Si, S., & Wu, X. (2016). Entrepreneurial finance and innovation: Informal debt as an
empirical case. Strategic Entrepreneurship Journal, 10(3), 257-273.
Xiao, J. J. (1996). Effects of family income and life cycle stages on financial asset ownership.
Journal of Financial Counseling and Planning, 7, 21-30.
Yao, R., Sharpe, D. L., & Wang, F. (2011). Decomposing the age effect on risk tolerance. The
Journal of Socio-Economics, 40(6), 879-887.
https://doi.org/10.1016/j.socec.2011.08.023
Zak, P. J., & Knack, S. (2001). Trust and growth. The Economic Journal, 111(470), 295-321.
https://doi.org/10.1111/1468-0297.00609
Zeller, M. (1994). Determinants of credit rationing: A study of informal lenders and formal
credit groups in Madagascar. World Development, 22(12), 1895-1907.
https://doi.org/10.1016/0305-750X(94)90181-3
Zikmund, W. G., Babin, B. J., Carr, J. C., & Griffin, M. (2013). Business research methods.
San Francisco, CA: Cengage Learning.

205
Appendix 1 – Consent form and Questionnaire – English version
CONSENT FORM
TITLE OF STUDY:
THE EFFECT OF PERCEIVED RISK, RISK TOLERANCE AND TRUST ON DEBT DECISIONS
PRINCIPAL INVESTIGATOR:
Name : Trang Phung
Department : School of Economics and Finance
Address :
Massey University Manawatū, Private Bag 11 222
Palmerston North 4442, New Zealand
Phone : 0274745308
Email : [email protected]
PURPOSE OF STUDY
You are being asked to take part in a research study. Before you decide to participate in this study, it is important
that you understand why the research is being done and what it will involve. Please read the following information
carefully. Please ask the researcher if there is anything that is not clear or if you need more information. The
purpose of this study is to find out the effects of individual investors’ risk perception of investing in stocks, risk
tolerance, and trust in the stock market on their debt decisions.
STUDY PROCEDURES AND RISKS IF ANY
The survey should only take about 45 minutes of your time. All responses will remain anonymous, and you are
free to opt out at any time. You may decline to answer any or all questions and you may terminate your
involvement at any time if you choose.
CONFIDENTIALITY
Your responses to this survey will be anonymous. Please do not write any identifying
information on your survey. Every effort will be made by the researcher to preserve your
confidentiality including the following:
- Assigning code names/numbers for participants that will be used on all research notes and documents
- Keeping notes and any other identifying participant information in a locked file cabinet in the personal possession
of the researcher.
Participant data will be kept confidential except in cases where the researcher is legally obligated to report specific
incidents. These incidents include, but may not be limited to, incidents of abuse and suicide risk.

206
This project has been reviewed and approved by the Massey University Human Ethics Committee: Southern B,
Application 19/07. If you have any concerns about the conduct of this research, please contact Dr Rochelle
Stewart-Withers, Chair, Massey University Human Ethics Committee: Southern B, telephone 06 356 9099 x
83657, email [email protected]
VOLUNTARY PARTICIPATION
Your participation in this study is voluntary. It is up to you to decide whether or not to take part in this study. If
you decide to take part in this study, you will be asked to sign a consent form.
After you sign the consent form, you are still free to withdraw at any time (e.g. two weeks after taking part in the
data collection) and without giving a reason. Withdrawing from this study will not affect the relationship you
have, if any, with the researcher. If you withdraw from the study before data collection is completed, your data
will be returned to you or destroyed.
CONSENT
I have read and I understand the provided information and have had the opportunity to ask
questions. I understand that my participation is voluntary and that I am free to withdraw at any time, without
giving a reason and without cost. I understand that I will be given a copy of this consent form. I voluntarily agree
to take part in this study.
Participant's signature ______________________________ Date __________
Investigator's signature _____________________________ Date __________

207
A questionnaire on the effect of perceived risk, risk tolerance and trust on debt
decisions
1/ Thinking about your typical share investment portfolio, how do you divide your portfolio into the short-term
and long-term investment?
Typical share investment Proportion (%) of portfolio
Short-term investment (less than 1 year)
Long-term investment (1 year or more)
Total 100%
2/ Thinking about your short-term investment, how do you divide your short-term investment that depends on
trading time?
Short-term share investment
Proportion (%) of short-term
investment
1 month or less
Between more than 1 month and 3 months
Between more than 3 months and 6 months
Between more than 6 months and less than 1 year
Total 100%
3/ Thinking about borrowing from family sources such as parents, a spouse, sisters, brothers, relatives, to invest
in shares (you can choose more than 1 answer):
□ 1. Parents.
□ 2. Grandparents.
□ 3. Brothers/sisters.
□ 4. Parents in law.
□ 5. Brothers/sisters in law.
□ 6. Cousins/nieces/nephews.
□ 7. Husband/wife.
□ 8. Other family sources: ……….
□ 9. I do not borrow from any family sources.
4/ If you have from two family sources, please choose ONE you use most:
1 2 3 4 5 6 7 8
Parents Grand-
parents
Brother
/sisters
Parents
in law
Brothers/
sisters in
law
Cousins/
nieces/
nephews
Husband
/wife
Other
family
sources
5/ Borrowing from non-family sources such as friends, teachers, co-workers, ... (you can choose more than 1
answer):
□ 1. Friends
□ 2. Girlfriends/boyfriends/partners
□ 3. Teachers/lecturers
□ 4. Colleagues/co-workers
□ 5. Bosses/managers
□ 6. Business partners
□ 7. Neighbours
□ 8. Other non-family sources: ……….
□ 9. I do not borrow from any non-family sources.

208
6/ If you have from two sources, please choose ONE you use most
1 2 3 4 5 6 7 8
Friends Girl/boyfrie
nds/
boyfriends/
partners
Teachers/
Lecturers
Colleagues/
co-workers
Bosses/
Managers
Business
partners
Neighbors
Other non-
family
sources
7/ Borrowing from formal sources such as banks, credit institutions, brokerage firms, (you can choose more than
1 answer):
□ 1. Banks
□ 2. Credit institutions
□ 3. Brokerage firms
□ 4. Other formal sources: …………………
□ 5. I do not borrow from any formal sources.
8/If you have from two sources, please choose ONE you use most:
1 2 3 4
Banks Credit institutions Brokerage firms Other formal sources
9/ Thinking about the total money for stock investment, how would you divide this amount between the
borrowing and your own money?
The total money for stock investment: %
Borrowing from informal sources
Borrowing from formal sources
My equity
Total 100%
10/ Supposing that a share has the highest financial leverage in accordance with the brokerage firms’ rules, if
you would like to buy this share, what financial leverage ratios do you often use?
□ do not leverage
□ less than 20%
□ 20% to less than 30%
□ 30% to less than 50%
□ Use the highest lending ratio
11a/ How concerned are you about your confidential information being leaked to others if you trade shares
online or you ask someone else (e.g. brokers, individuals or institutions) to trade for you?
(1: not at all concerned, 2: slightly concerned, 3: somewhat concerned, 4: moderately concerned, 5: extremely
concerned).
1 2 3 4 5
11b/ How important is it to you if your confidential information is leaked to others?
(1: not at all important, 2: slightly important, 3: somewhat important, 4: moderately important, 5: extremely
important).
1 2 3 4 5
12a/ How concerned are you about a negative impact of this loss on your social standing if you make a large
loss in share investments?
1 2 3 4 5
12b/ How important is it to you if you are held in lower esteem due to your large loss in share investment?
1 2 3 4 5
13a/ How concerned are you about missing out on other financial investment opportunities if you used all the
money for share investments?
1 2 3 4 5
13b/ How important is it to you if you miss out on other financial investment opportunities?
1 2 3 4 5

209
14a/ How concerned are you about spending a lot of time on share investment and the results are not what you
expect?
1 2 3 4 5
14b/ How important is it to you If you spend a lot of time on share investment and the results are not what you
expect?
1 2 3 4 5
15a/ How concerned are you about your wrong choices when choosing shares for your portfolio?
1 2 3 4 5
15b/ How important is it to you if you make a wrong decision on choosing shares for your portfolio?
1 2 3 4 5
For those who borrow to invest in shares:
16a/ How concerned are you about your investment returns being inadequate to cover your loan interest and
principal at maturity?
1 2 3 4 5
16b/ How important is it to you if your investment results cannot cover your debt?
1 2 3 4 5
17a/ What ratios of loss over equity below make you concerned?
□ ≤ 10%
□ > 10% to 20%
□ > 20% to 30%
□ > 30% to 50%
□ > 50%
17b/ What ratios of loss over equity are important to you?
□ ≤ 10%
□ > 10% to 20%
□ > 20% to 30%
□ > 30% to 50%
□ > 50%
18/ Suppose you had 100 million VND in a savings account and the interest rate was 2% per year. After 1 year,
how much do you think you would have in this account if you left the money to grow?
(i) More than VND 102 million;
(ii) Exactly VND 102 million;
(iii) Less than VND 102 million;
(iv) I don’t know.
19/ Suppose you had 100 million VND in a savings account and the interest rate is 20% per year and you never
withdraw money or interest payments. After 5 years, how much would you have in this account in total?
(i) More than VND 20 million;
(ii) Exactly VND 20 million;
(iii) Less than VND 20 million;
(iv) I don’t know.
20/ Imagine that the interest rate on your savings account was 1% per year and inflation was 2% per year. After
1 year, how much would you be able to buy with the money in this account?
(i) More than today;
(ii) Exactly the same;
(iii) Less than today;
(iv) I don’t know.
21/ Assume Peter inherits VND 10,000 million today and John inherits 10,000 million 3 years from now. Who
is richer because of the inheritance? (note: other factors do not mention)
(i) Peter;
(ii) John;
(iii) They are equally rich;
(iv) I don’t know.

210
22/ Suppose that in the year 2020, your income has doubled, and the price of all goods has also doubled. In
2020, how much will you be able to buy with your income? (note: other factors are not considered)?
(i) More than today;
(ii) The same;
(iii) Less than today;
(iv) I don’t know.
23/ Which of the following statements describes the main function of the share market?
(i) The share market helps to predict share earnings;
(ii) The share market results in an increase in the price of shares;
(iii) The share market brings people who want to buy shares together with those who want to sell shares;
(iv) None of the above;
(v) I don’t know.
24/ If somebody buys the share of firm B in the share market:
(i) He owns part of firm B;
(ii) He has lent money to firm B
(iii) He is liable for firm B’s debts;
(iv) None of the above;
(v) I don’t know.
25/ If somebody buys a bond of firm B:
(i) He owns a part of firm B;
(ii) He has lent money to firm B;
(iii) He is liable for firm B’s debts;
(iv) None of the above;
(v) I don’t know.
26/ If the interest rate falls, what should happen to bond prices of bondholders?
(i) Rise;
(ii) Fall;
(iii) Stay the same;
(iv) None of the above;
(v) I don’t know.
27/ Normally, which asset displays the highest fluctuations over time?
(i) Savings accounts;
(ii) Bonds;
(iii) Shares;
(iv) I don’t know.
28/ Which of the following statements is correct?
(i) Once one invests in a mutual fund, one cannot withdraw the money in the first year;
(ii) Mutual funds can invest in several assets, for example invest in both stocks and bonds; (iii) Mutual
funds pay a guaranteed rate of return which depends on their past performance;
(iii) None of the above;
(iv) Don’t Know.
29/ Buying a company stock usually provides a safer return than a stock mutual fund.
(i) True;
(ii) False;
(iii) Don’t Know.
30/ Shares are normally riskier than bonds.
(i) True;
(ii) False;
(iii) Don’t Know.

211
31/ Considering a long time period (for example 10 or 20 years), which asset normally gives the highest return?
(i) Savings accounts;
(ii) Bonds;
(iii) Shares;
(iv) Don’t Know.
32/ When an investor spreads his money among different assets, does the risk of losing money:
(i) Increase;
(ii) Decrease;
(iii) Stay the same;
(iv) Don’t Know.
33/ If you buya10-year bond, it means you cannot sell it after 5 years without incurring a major penalty.
(i) True;
(ii) False;
(iii) Don’t know.
34/ In general, how would you describe yourself in share investment?
a/ A real gambler
b/ Willing to take risks after completing adequate research
c/ Cautious
d/ A real risk avoider
35/ You are on a TV game show and can choose one of the following. Which would you take?
a/ VND 1 million in cash.
b/ A 50% chance at winning VND 5 million.
c/ A 30% chance at winning VND 10 million.
d/ A 5% chance at winning VND 100 million.
36/ You have just finished saving for a “once-in-a-lifetime” vacation, but you have not yet paid. Three weeks
before you plan to leave, you lose your job. You would:
a/ Cancel the vacation
b/ Take a much more modest vacation
c/ Go as scheduled, reasoning that you need the time to prepare for a job search
d/ Extend your vacation, because this might be your last chance to go vacation.
37/ If you unexpectedly received VND 200 million to invest, what would you do?
a/ Deposit it in a bank account.
b/ Invest it in bond mutual funds.
c/ Invest it in shares or share mutual funds.
38/ In terms of experience, how comfortable are you investing in shares or share mutual funds?
a/ Not at all comfortable
b/ Somewhat comfortable
c/ Very comfortable
39/ When you think of the word “risk” which of the following words comes to mind first?
a/ Loss of money
b/ Uncertainty
c/ Opportunity
d/ Thrill
40/ Experts agree that government bonds should be relatively safe. Most of your investment assets are now in
high interest government bonds. What would you do?
a/ Hold the bonds
b/ Sell the bonds, put half the proceeds into money market account, and the other half into other assets
c/ Sell the bonds and put the total proceeds into other assets
d/ Sell the bonds, put all the money into other assets, and borrow additional money to buy more

212
41/ Given the best and worst case returns of the four investment choices below, which would you prefer?
a/ The best case: gain (+) VND 200 million; The worst case: loss (-) VND 0.
b/ The best case: gain (+) VND 800 million; The worst case: loss (-) VND 200 million.
c/ The best case: gain (+) 2,600 million VND; The worst case: loss (-) VND 800 million.
d/ The best case: gain (+) 4,800 million VND; The worst case: loss (-) VND 2,400 million.
42/ In addition to whatever you own, you have been given VND 1 billion. You are now asked to choose
between:
a/ A sure gain of VND 500 million.
b/ A 50% chance to gain 1 billion and a 50% chance to gain nothing.
43/ In addition to whatever you own, you have been given VND 1 billion. You are now asked to choose
between:
a/ A sure loss of VND 500 million.
b/ A 50% chance to lose VND 1 billion and a 50% chance to lose nothing.
44/ Suppose a relative left you an inheritance of VND 1 billion, stipulating in the will that you invest ALL the
money in ONE of the following choices. Which one would you select?
a/ A savings account or money market mutual fund
b/ A mutual fund that owns shares and bonds
c/ A portfolio of 15 common shares
d/ Commodities like gold, silver, and oil
45/ If you had to invest VND 20 billion, which of the following investment choices would you find most
appealing?
a/ 60% in low-risk investment 30% in medium-risk investment 10% in high-risk investments.
b/ 30% in low-risk investment 40% in medium-risk investment 30% in high-risk investments
46/ Your trusted friend and neighbour, an experienced geologist, is putting together a group of investors to fund
an exploratory gold mining venture. The venture could pay back 50 to 100 times the investment if successful. If
the mine is a bust, the entire investment is worthless. Your friend estimates the chance of success is only 20%. If
you had VND 1 billion, how much would you invest?
a/ Nothing
b/ 10% - <30%
c/ 30% - < 60%
d/ > 60%
47/ How much do you trust stockbroker(s)? (1: do not trust at all, 2: do not trust, 3: neutral, 4: trust, 5:
completely trust)
1 2 3 4 5 0: I don’t have one
48/ How much do you trust websites of financial investment, e.g. cafef.vn, vietstock, cophieu68.com?
1 2 3 4 5
49/ How much do you trust brokerage firm(s)?
1 2 3 4 5
50/ How much do you trust listed companies that you invest in?
1 2 3 4 5
51/ How much do you trust your friends or relatives’ advice, who are working for brokerage firms?
1 2 3 4 5 0: I don’t have one
52/ How much do you trust the stock exchange where you invest?
1 2 3 4 5

213
PERSONAL INFORMATION:
1/ Gender: □ Male □ Female □ unspecified
2/ What is your age-range:
□ < 25 years old
□ 25 – 35
□ 36 – 45
□ 46-55
□ 56 or more
3/ Marital status:
□ Single
□ Married
□ Divorced
□ Widowed
4/ How many children do you have?
□ 0
□ 1
□ 2
□ 3
□ 4 or more
5/ What place do you live in?
□ 1. District ……….Ho Chi Minh City
□ 2. District ………Ha Noi capital
□ 3. District ………Da Nang City
□ 4. Mekong delta
□ 5. Other:
6/ How many properties do you have in total?
□ 0
□ 1
□ 2
□ 3
□ 4 or more
7/ Which best describes your highest formal educational qualification?
□ Secondary school degree or less
□ High school degree
□ Bachelor’s degree
□ Postgraduate qualification or more
8/ On average, how much income (VND) per month do you receive from your work?
□ 0
□ less than 10 million
□ 10 million – 50 million
□ more than 50 million – 100 million
□ more than 100 million
9/ Apart from your work income, how much other income (e.g. rental income, investment, business) per month
do you receive?
□ 0
□ less than 10 million
□ 10 million – 50 million
□ more than 50 million – 100 million
□ more than 100 million

214
10/ Do you (or have you in the past) described yourself as the main income earner in your household?
□ Yes □ No
11/ When it comes to financial decision-making, what role would you play?
□ I am the main financial decision-maker
□ I share the financial decision-making
□ I have limited input, someone else makes the financial decisions.
12/ What is your main field of occupation?
□ 1. Fund manager
□ 2. Broker-dealer
□ 3. Brokerage manager/director
□ 4. Financial advisor
□ 5. Banking officer
□ 6. Business owner
□ 7. CEO (Chief executive officer)
□ 8. CFO (Chief financial officer)/ Chief Accountant
□ 9. Investment officer
□ 10. Accountant
□ 11. Administrative officer/manager
□ 12. Sale/Marketing officer/manager
□ 13. Teacher/lecturer
□ 14. Other: …….
13/ What is your parents’ occupation:
□1. Businessman/woman/investor
□2. Teacher/lecturer
□3. Farmer/Agricultural filed
□4. Retiree
□5. Other: …… .
□6. Died
14/ Do your parents or siblings purchase shares? □Yes □ No
15/ How many years of work experience do you have?
□ < 3 years
□ 3 - 5 years
□ more than 5 - 10 years
□ more than 10 to 20 years
□ more than 20 years
16/ How many years of share investment experience do you have?
□ < 3 years
□ 3 - 5 years
□ more than 5 - 10 years
□ more than 10 to 20 years
□ more than 20 years
17/ What kinds of share prices (VND) do you purchase most?
□ Less than 10,000
□ 10,000 – 20,000
□ more than 20,000 - 50,000
□ more than 50,000 – 100,000
□ more than 100,000

215
18/ How many trading accounts do you have?
□ 1
□ 2
□ 3
□ 4
□ 5 or more
19/ In general, how often do you trade shares?
□ At least once a day
□ 1 to 6 times/week
□ 1 to 3 times/month
□ 1 to 2 times/quarter
□ 1 to 3 times/year
□ Less than once a year
20/. The total own money (equity) (VND) that you have used for share investment since last year
a) < 200 million
b) 200 million to 500 million
c) 501 million to 1 billion
d) more than 1billion to 3 billion
e) more than 3 billion
Thank you very much

216
Appendix 2: Consent form and Questionnaire - Vietnamese version
GIẤY CHẤP THUẬN
TIÊU ĐỀ NGHIÊN CỨU:
ẢNH HƯỞNG CỦA NHẬN THỨC RỦI RO, CHẤP NHẬN RỦI RO VÀ NIỀM TIN VÀO THỊ TRƯỜNG
CHỨNG KHOÁN TRONG QUYẾT ĐỊNH SỬ DỤNG NỢ
NGHIÊN CỨU SINH:
Họ và tên : Phùng Thái Minh Trang
Khoa : Kinh tế - Tài chính
Địa chỉ : Trường Đại Học Massey, Manawatū
Private Bag 11 222
Palmerston North 4442, New Zealand.
Điện thoại : +64274745308
Email : [email protected]
MỤC ĐÍCH CỦA NGHIÊN CỨU
Bạn đang được yêu cầu tham gia vào nghiên cứu này. Trước khi bạn quyết định tham gia, điều quan trọng là bạn
hiểu lý do tại sao nghiên cứu đang được thực hiện và những gì sẽ liên quan. Xin hãy đọc thông tin sau đây một
cách cẩn thận. Vui lòng hỏi nhà nghiên cứu nếu có bất cứ điều gì không rõ ràng hoặc nếu bạn cần thêm thông
tin. Mục đích của nghiên cứu này là khám phá sự ảnh hưởng của nhận thức rủi ro của các nhà đầu tư cá nhân khi
đầu tư vào cổ phiếu, sự chấp nhận rủi ro, và sự tin tưởng vào thị trường chứng khoán đối với các quyết định nợ
của họ.
THỦ TỤC NGHIÊN CỨU VÀ RỦI RO NẾU CÓ
Cuộc khảo sát mất khoảng 45 phút. Bạn có thể từ chối trả lời bất kỳ hoặc tất cả các câu hỏi và có thể chấm dứt
sự tham gia bất cứ lúc nào bạn muốn.
BẢO MẬT
Tất cả các câu trả lời của bạn được bảo mật. Xin vui lòng không viết bất kỳ thông tin nhận dạng về khảo sát của
bạn. Để lưu giữ và bảo mật câu trả lời của bạn, Nhà nghiên cứu thực hiện:
- Đánh số thứ tự người tham gia trên tất cả các ghi chú và tài liệu nghiên cứu của người trả lời đó.
- Lưu giữ tất cả các chi tiết và bất kỳ các thông tin nhận dạng của người tham gia trong tủ két có khoá của nhà
nghiên cứu này.
Dữ liệu của người tham gia sẽ được giữ bí mật trừ trường hợp nhà nghiên cứu có nghĩa vụ pháp lý báo cáo các
sự cố cụ thể. Những sự cố này bao gồm, nhưng có thể không giới hạn ở các sự cố lạm dụng và nguy cơ tự tử.
Bảng câu hỏi này đã được xem xét và chấp thuận của trường Đại Học Massey, Hội đồng Đánh Giá Về Đạo Đức
Con Người: Miền Nam B, đơn số SOB 19/07.

217
Nếu bạn có bất kỳ mối quan tâm về việc quản lý đề tài nghiên cứu này, xin vui lòng liên hệ với tiến sĩ Rochelle
Stewart-Withers, chủ tịch hội đồng, đại học Massey, Hội đồng Đánh Giá Về Đạo Đức Con Người: Miền Nam B,
điện thoại 06 356 9099 x 83657, email [email protected]
THAM GIA TỰ NGUYỆN
Bạn tự nguyện tham gia vào nghiên cứu này. Nếu bạn quyết định tham gia vào nghiên cứu này, bạn sẽ được yêu
cầu ký vào một mẫu đơn đồng ý. Sau khi bạn ký vào mẫu đồng ý, bạn vẫn có thể rút lui bất cứ lúc nào (ví dụ:
hai tuần sau khi tham gia thu thập dữ liệu) và không cần đưa ra lý do. Rút khỏi nghiên cứu này sẽ không ảnh
hưởng đến mối quan hệ bạn (nếu có) với nhà nghiên cứu. Nếu bạn rút khỏi nghiên cứu trước khi dữ liệu hoàn
tất, dữ liệu của bạn sẽ được trả về cho bạn hoặc bị hủy.
ĐỒNG Ý
Tôi đã đọc và tôi hiểu các thông tin được cung cấp. Tôi hiểu rằng sự tham gia của tôi là tự nguyện và tôi có thể
rút lui bất cứ lúc nào mà không cần đưa ra lý do và không mất phí. Tôi hiểu rằng tôi sẽ được cung cấp một bản
sao của mẫu chấp thuận này và tự nguyện đồng ý tham gia vào nghiên cứu này.
Người tham gia ký tên ____________________________ Ngày __________
Người điều tra ký tên ____________________________ Ngày __________

218
BẢNG CÂU HỎI
1/ Nghĩ về danh mục đầu tư cổ phiếu của anh/chị, Anh/chị phân bổ danh mục đầu tư cổ phiếu ngắn hạn và dài
hạn như thế nào?
Danh mục đầu tư cổ phiếu Tỷ lệ phân bổ (%)
Đầu tư ngắn hạn (dưới 1 năm)
Đầu tư dài hạn (từ 1 năm trở lên)
Tổng cộng 100%
2/ Nghĩ về đầu tư cổ phiếu ngắn hạn của anh/chị, Anh/chị phân bổ danh mục đầu tư cổ phiếu ngắn hạn theo thời
gian như thế nào?
Đầu tư ngắn hạn Tỷ lệ phân bổ (%)
Dưới 1 tháng
Trên 1 tháng đến 3 tháng
Trên 3 tháng đến 6 tháng
Trên 6 tháng đến dưới 1 năm
Tổng cộng 100%
3/ Nghĩ về nguồn tiền cá nhân từ gia đình như ba mẹ, vợ chồng, anh chị, họ hàng, …., mà Anh/Chị mượn hoặc
vay để đầu tư cổ phiếu (Anh/Chị có thể chọn nhiều nguồn):
□ 1. Ba mẹ ruột.
□ 2. Ông bà ngoại/nội.
□ 3. Anh/chị/em ruột.
□ 4. Ba mẹ chồng/vợ.
□ 5. Anh/chị/em chồng/vợ.
□ 6. Anh/chị/em họ và cháu ruột/chồng/vợ.
□ 7. Chồng/vợ.
□ 8. Nguồn gia đình khác: ……….
□ 9. Tôi không mượn nguồn gia đình.
4/ Nếu Anh/Chị mượn hoặc vay từ hai nguồn (gia đình) trở lên, vui lòng chọn MỘT nguồn mà Anh/Chị sử dụng
nhiều nhất?
1 2 3 4 5 6 7 8
Ba mẹ
ruột
Ông bà
ngoại/nội
Anh/chị/
em ruột
Ba mẹ
chồng/
vợ
Anh/chị/em
chồng/vợ
Anh/chị/em
họ và cháu
ruột/chồng/vợ
Chồng/vợ Nguồn gia
đình khác
5/ Nguồn tiền cá nhân ngoài gia đình như từ bạn bè, thầy cô, đồng nghiệp mà Anh/Chị mượn hoặc vay để đầu tư
cổ phiếu (Anh/Chị có thể chọn nhiều nguồn):
□ 1. Bạn bè
□ 2. Bạn gái/bạn trai
□ 3. Cô giáo/Thầy giáo
□ 4. Đồng nghiệp
□ 5. Cấp trên
□ 6. Đối tác làm ăn
□ 7. Hàng xóm
□ 8. Nguồn ngoài gia đình khác: ………..
□ 9. Tôi không mượn nguồn ngoài gia đình.
6/ Nếu Anh/Chị mượn hoặc vay từ hai nguồn (ngoài gia đình) trở lên, vui lòng chọn MỘT nguồn mà Anh/Chị
sử dụng nhiều nhất?
1 2 3 4 5 6 7 8
Bạn
bè
Bạn
gái/bạn trai
Cô giáo/Thầy
giáo
Đồng
nghiệp
Cấp
trên
Hàng xóm Đối tác làm
ăn
Nguồn ngoài
gia đình khác

219
7/ Nguồn tiền từ tổ chức như ngân hàng, tổ chức tín dụng, công ty chứng khoán mà Anh/Chị vay để đầu tư cổ
phiếu (Anh/Chị có thể chọn nhiều nguồn):
□ 1.Ngân hàng
□ 2.Tổ chức tín dụng
□ 3.Công ty chứng khoán
□ 4.Nguồn khác từ bên ngoài: …………………
□ 5.Tôi không mượn từ nguồn tổ chức.
8/ Nếu Anh/Chị mượn hoặc vay từ hai nguồn (tổ chức) trở lên, vui lòng chọn MỘT nguồn mà Anh/Chị sử dụng
nhiều nhất?
1 2 3 4
Ngân
hàng
Tổ chức tín
dụng
Công ty chứng
khoán
Nguồn khác từ
bên ngoài
9/ Nghĩ về tổng số tiền trong danh mục đầu tư cổ phiếu, Anh/Chị sử dụng bao nhiêu nợ và bao nhiêu vốn tự có?
Tổng số tiền trong danh mục đầu tư cổ phiếu từ: %
Vay cá nhân
Vay tổ chức
Vốn tự có
Tổng cộng 100%
10/ Khi Anh/Chị đầu tư cổ phiếu, tỷ lệ đòn bẩy Anh/Chị sử dụng là:
□ Không sử dụng đòn bẩy
□ Dưới 20% mức ký quỹ theo quy định
□ 20% đến dưới 30% mức ký quỹ theo quy định
□ 30% đến dưới 50% mức ký quỹ theo quy định
□ Sử dụng tối đa mức ký quỹ theo quy định
11a/ Mức độ lo lắng về thông tin cá nhân của Anh/Chị có thể bị rò rỉ khi sử dụng trực tuyến (online), ủy quyền
cho môi giới hoặc nhờ cá nhân (tổ chức) giao dịch giúp?
(1: Hoàn toàn không lo lắng, 2: Không lo lắng, 3: Bình thường, 4: Lo lắng, 5: Rất lo lắng)
1 2 3 4 5
11b/ Mức độ quan trọng nếu thông tin cá nhân của Anh/Chị bị rò rỉ?
(1: Hoàn toàn không quan trọng, 2: Không quan trọng, 3: Bình thường, 4: Quan trọng, 5: Rất quan trọng)
1 2 3 4 5
12a/ Mức độ lo lắng về sự thất bại có thể ảnh hưởng đến vị trí xã hội của Anh/Chị nếu Anh/Chị đầu tư chứng
khoán bị thất bại (thua lỗ)?
1 2 3 4 5
12b/ Mức độ quan trọng nếu việc đầu tư chứng khoán bị thất bại (thua lỗ) ảnh hưởng đến vị trí xã hội của
Anh/Chị?
1 2 3 4 5
13a/ Mức độ lo lắng về việc mất cơ hội đầu tư tài chính khác nếu Anh/Chị sử dụng toàn bộ tiền của Anh/Chị
cho việc đầu tư cổ phiếu?
1 2 3 4 5
13b/ Mức độ quan trọng nếu Anh/Chị bị mất cơ hội đầu tư tài chính khác?
1 2 3 4 5
14a/ Mức độ lo lắng về việc Anh/Chị dành quá nhiều thời gian cho việc đầu tư cổ phiếu và kết quả không như
mong đợi?
1 2 3 4 5
14b/ Mức độ quan trọng nếu Anh/Chị dành quá nhiều thời gian cho việc đầu tư cổ phiếu và kết quả không như
mong đợi?
1 2 3 4 5
15a/ Mức độ lo lắng của Anh/Chị về việc quyết định lựa chọn các cổ phiếu khi lựa chọn cổ phiếu cho danh mục
đầu tư?
1 2 3 4 5
15b/ Mức độ quan trọng nếu Anh/Chị quyết định sai trong việc lựa chọn các cổ phiếu cho danh mục đầu tư?
1 2 3 4 5

220
16a/ Mức độ lo lắng của Anh/Chị về việc kết quả đầu tư cổ phiếu không thể trả được lãi vay và các khoản tiền
vay?
1 2 3 4 5
16b/ Mức độ quan trọng nếu Anh/Chị không thể trả được lãi vay và các khoản vay?
1 2 3 4 5
17a/ Tỷ lệ lỗ so với vốn nào dưới đây khiến Anh/Chị lo lắng nếu đầu tư cổ phiếu bị lỗ?
□ ≤ 10%
□ > 10% to 20%
□ > 20% to 30%
□ > 30% to 50%
□ > 50%
17b/ Tỷ lệ lỗ so với vốn nào dưới đây khiến Anh/Chị cảm thấy quan trọng?
□ ≤ 10%
□ > 10% to 20%
□ > 20% to 30%
□ > 30% to 50%
□ > 50%
18/ Giả sử Anh/Chị có 100 triệu VND trong tài khoản tiết kiệm và lãi suất là 2%/năm. Sau 1 năm, Anh/Chị nghĩ
có bao nhiêu tiền VND trong tài khoản này nếu Anh/Chị không rút ra?
(i) Lớn hơn 102 triệu VND
(ii) 102 triệu VND
(iii) Nhỏ hơn 102 triệu VND
(iv) Không biết
19/ Giả sử Anh/Chị có 100 triệu VND trong tài khoản tiết kiệm và lãi suất là 20%/năm và Anh/Chị không rút số
tiền này ra hoặc lãi suất tiền gửi. Sau 5 năm, Anh/Chị có tổng cộng bao nhiêu tiền VND trong tài khoản?
(i) Lớn hơn 200 triệu VND
(ii) 200 triệu VND
(iii) Nhỏ hơn 200 triệu VND
(iv) Không biết
20/ Giả sử rằng lãi suất của tài khoản tiết kiệm của Anh/Chị là 1%/năm và lạm phát là 2%/năm. Sau 1 năm,
Anh/Chị có thể mua được bao nhiêu hàng hóa với số tiền trong tài khoản này?
(i ) Lớn hơn hôm nay
(ii) Bằng hôm nay
(iii) Thấp hơn hôm nay
(iv) Không biết.
21/ Giả sử hôm nay Nam thừa kế 10,000 triệu VND và Khoa sẽ thừa kế 10 tỷ VND sau 3 năm. Ai giàu hơn bởi
vì sự thừa kế này? (Các yếu tố khác không thay đổi)
(i) Nam
(ii) Khoa
(iii) Cả hai đều giàu bằng nhau
(iv) Không biết
22/ Giả sử rằng năm 2020, thu nhập của Anh/Chị tăng gấp đôi và giá của tất cả hàng hóa cũng tăng gấp đôi.
Trong năm 2020, Anh/Chị sẽ mua được bao nhiêu hàng hóa với mức thu nhập này?
(i ) Lớn hơn hôm nay
(ii) Bằng hôm nay
(iii) Thấp hơn hôm nay
(iv) Không biết.

221
23/ Câu nào sau đây mô tả chức năng chính của thị trường chứng khoán?
(i) Thị trường chứng khoán giúp dự đoán lợi nhuận cổ phiếu;
(ii) Thị trường chứng khoán dẫn đến sự tăng giá của cổ phiếu;
(iii) Thị trường chứng khoán mang mọi người muốn mua cổ phiếu và mọi người muốn bán cổ phiếu lại với
nhau;
(iv) Không câu nào ở trên đúng;
(v) Không biết.
24/ Nếu một người nào đó mua cổ phiếu của công ty B:
(i) Người này sở hữu một phần của công ty B;
(ii) Người này cho công ty B mượn tiền;
(iii) Người này nợ tiền của công ty B;
(iv) Không câu nào ở trên đúng;
(v) Không biết.
25/ Nếu một người nào đó mua trái phiếu của công ty B
(i) Người này sở hữu một phần của công ty B;
(ii) Người này cho công ty B mượn tiền;
(iii) Người này nợ tiền của công ty B;
(iv) Không câu nào ở trên đúng;
(v) Không biết.
26/ Nếu lãi suất giảm, điều gì xảy đến với giá trái phiếu của Anh/Chị đang nắm giữ?
(i) Tăng; (ii) Giảm; (iii) Vẫn giữ nguyên; (iv) Không câu nào ở trên đúng;
(v) Không biết.
27/ Thông thường, đầu tư nào hiển thị sự biến động cao nhất theo thời gian?
(i) Tiền tiết kiệm;
(ii) Trái phiếu;
(iii) Cổ phiếu;
(iv) Không biết.
28/ Câu nào sau đây là đúng?
(i) Khi một người đầu tư vào công ty quản lý quỹ, người này không thể rút tiền trong năm đầu tiên.
(ii) Công ty quỹ có thể đầu tư vào một vài tài sản, ví dụ, đầu tư vào cổ phiếu và trái phiếu;
(iii) Công ty quỹ trả lãi suất bảo đảm tùy thuộc vào năng lực quá khứ của công ty;
(iv) Không câu nào ở trên đúng;
(v) Không biết.
29/ Mua một cổ phiếu của công ty niêm yết thường an toàn hơn mua một chứng chỉ quỹ
(i) Đúng; (ii) Sai; (iii) Không biết.
30/ Cổ phiếu thường rủi ro hơn trái phiếu.
(i) Đúng; (ii) Sai; (iii) Không biết.
31/ Xem xét một thời gian dài (ví dụ 10 hoặc 20 năm), tài sản nào thường có lợi nhuận cao nhất? (Các yếu tố
khác không thay đổi)
(i) Tài khoản tiết kiệm; (ii) Trái phiếu; (iii) Cổ phiếu; (iv) Không biết.
32/ Khi một nhà đầu tư phân bổ tiền đầu tư vào các loại tài sản khác nhau, rủi ro về mất tiền:
(i) Tăng; (ii) Giảm; (iii) Giữ nguyên; (iv) Không biết.
33/ Nếu Anh/Chị mua một trái phiếu 10 năm, điều này có nghĩa là Anh/Chị thể bán nó sau 5 năm mà không bị
phạt nặng.
(i) Đúng; (ii) Sai; (iii) Không biết.

222
34/ Nhìn chung, Anh/Chị mô tả về Anh/Chị như là một người như thế nào trong đầu tư cổ phiếu?
a/ Như một người chơi bài chuyên nghiệp.
b/ Sẵn sàng chấp nhận rủi ro sau khi hoàn thành nghiên cứu thông tin đầy đủ.
c/ Dè dặt.
d/ Một người tránh rủi ro thực sự.
35/ Anh/Chị tham gia trò chơi trên truyền hình (ti vi) và có thể chọn lựa một trong các trường hợp sau đây.
Anh/Chị sẽ chọn cái nào?
a/ 1 triệu VND tiền mặt.
b/ 50% cơ hội để thắng 5 triệu VND.
c/ 30% cơ hội để thắng 10 triệu VND.
d/ 5% cơ hội để thắng 100 triệu VND.
36/ Anh/Chị vừa hoàn thành tiết kiệm cho một kỳ nghỉ "một lần trong đời" nhưng Anh/Chị chưa thực hiện. Ba
tuần trước khi Anh/Chị định rời đi, Anh/Chị mất việc. Anh/Chị sẽ:
a) Hủy bỏ kỳ nghỉ này.
b) Tham gia một kỳ nghỉ vừa phải (rẻ) hơn nhiều kỳ nghỉ này.
c) Vẫn theo đúng tiến độ, bởi vì Anh/Chị cần thời gian để chuẩn bị tìm việc.
d) Kéo dài kỳ nghỉ của Anh/Chị, bởi vì đây có thể là cơ hội đi nghỉ của Anh/Chị.
37/ Nếu Anh/Chị bất ngờ nhận được 200 triệu VND để đầu tư, Anh/Chị sẽ làm gì?
a) Gửi tiền vào tài khoản ngân hàng.
b) Đầu tư trái phiếu.
c) Đầu tư cổ phiếu.
38/ Xét về kinh nghiệm, mức độ thoải mái của Anh/Chị khi đầu tư vào cổ phiếu như thế nào?
a) Hoàn toàn không thoải mái.
b) Hơi thoải mái.
c) Rất thoải mái.
39/ Khi Anh/Chị nghĩ về từ "rủi ro", những từ nào sau đây xuất hiện trong tâm trí của Anh/Chị đầu tiên?
a) Mất tiền
b) Không chắc chắn
c) Cơ hội
d) Rất hào hứng.
40/ Các chuyên gia đồng ý rằng trái phiếu chính phủ tương đối an toàn hơn tất cả các tài sản khác, hiện nay
Anh/Chi đang sở hữu trái phiếu này, Anh/Chị sẽ làm gì?
a) Giữ các trái phiếu này.
b) Bán các trái phiếu này, dùng một nửa số tiền đã bán để đầu tư thị trường tiền tệ, và một nửa số tiền còn lại
đầu tư vào các loại tài sản khác.
c) Bán các trái phiếu này và dùng tất cả số tiền thu được để đầu tư các loại tài sản khác.
d) Bán trái phiếu, dùng tất cả số tiền thu được để đầu tư các loại tài sản khác trên, và mượn thêm tiền để mua
thêm.
41/ Dựa vào kết quả đầu tư: tốt nhất (thu được) và xấu nhất (mất/lỗ) của 4 lựa chọn đầu tư dưới đây, Anh/Chị sẽ
thích trường hợp nào hơn?
a /Trường hợp tốt nhất: thu được (+) 200 triệu VND; Trường hợp xấu nhất: mất (-) 0VND .
b) Trường hợp tốt nhất: + 800 triệu VND; Trường hợp xấu nhất: - 200 triệu VND.
c) Trường hợp tốt nhất: + 2,600 triệu VND; Trường hợp xấu nhất: - 800 triệu VND.
d) Trường hợp tốt nhất: + 4,800 triệu VND; Trường hợp xấu nhất: - 2,400 triệu VND.

223
42/ Ngoài những gì Anh/Chị đang sở hữu, Anh/Chị được tặng thêm 1,000,000,000 VND. Bây giờ Anh/Chị được
yêu cầu chọn giữa:
a) Lợi nhuận chắc chắn là 500,000,000 VND.
b) Có 50% cơ hội kiếm được 1,000,000,000 VND và 50% cơ hội không đạt được gì.
43/ Anh/Chị được yêu cầu chọn giữa:
a) Chắc chắn bị mất 500,000,000 VND.
b) Có 50% cơ hội bị mất 1,000,000,000 VND và 50% cơ hội không mất gì cả.
44/ Giả sử một người họ hàng để lại cho Anh/Chị một khoản thừa kế là 1 tỉ VND, quy định trong bản di chúc rằng
Anh/Chị đầu tư TẤT CẢ số tiền vào MỘT trong các lựa chọn sau đây. Anh/Chị sẽ chọn cái nào?
a) Tài khoản tiết kiệm hoặc quỹ tương trợ trên thị trường tiền tệ
b) Quỹ tương trợ mà nó sở hữu cổ phiếu và trái phiếu
c) Danh mục 15 cổ phiếu phổ thông
d) Hàng hóa như vàng, bạc, và dầu.
45/ Nếu Anh/Chị phải đầu tư 20 tỉ VND, những lựa chọn đầu tư nào sau đây mà Anh/Chị cảm thấy hấp dẫn
nhất?
a/ 60% đầu tư với rủi ro thấp, 30% đầu tư với rủi ro trung bình, 10% đầu tư với rủi ro cao.
b/ 30% đầu tư với rủi ro thấp, 40% đầu tư với rủi ro trung bình, 30% đầu tư với rủi ro cao.
46/ Người bạn và người hàng xóm đáng tin cậy của Anh/Chị, một nhà địa chất có kinh nghiệm, đang tập hợp một
nhóm các nhà đầu tư để đầu tư vào một công ty liên doanh thăm dò khai thác vàng. Công ty liên doanh này có thể
trả 50 đến 100 lần số tiền đã đầu tư nếu thành công. Nếu thất bại, toàn bộ đầu tư bị mất. Bạn của Anh/Chị ước
tính cơ hội thành công chỉ là 20%. Nếu Anh/Chị có 1 tỹ VND, Anh/Chị sẽ đầu tư bao nhiều:
a) Không đầu tư;
b) Đầu tư 10% - < 30%;
c) Đầu tư 30% - <60%;
d) Đầu tư >60%.
47/ Nghĩ về các mối liên hệ trong quá trình đầu tư cổ phiếu, mức độ tin tưởng của Anh/Chị vào người môi giới
chứng khoán? (1: Hoàn toàn không tin tưởng, 2: Không tin tưởng, 3: Trung lập, 4: Tin tưởng, 5: Hoàn toàn tin
tưởng).
1 2 3 4 5 0: Tôi không có người môi giới
48/ Mức độ tin tưởng của Anh/Chị vào trang điện tử về thông tin tài chính như cafef.vn, vietstock,
cophieu68.com, ...
1 2 3 4 5
49/ Mức độ tin tưởng của Anh/Chị vào các công ty chứng khoán?
1 2 3 4 5
50/ Mức độ tin tưởng của Anh/Chị vào các công ty niêm yết mà Anh/Chị đang đầu tư?
1 2 3 4 5
51/ Mức độ tin tưởng của Anh/Chị vào sự tư vấn của bạn bè hoặc người thân đang làm ở các công ty chứng
khoán?
1 2 3 4 5 0: không có người nào như vậy
52/ Mức độ tin tưởng của Anh/Chị vào thị trường chứng khoán mà Anh/Chị đang giao dịch?
1 2 3 4 5

224
THÔNG TIN CÁ NHÂN:
1/ Giới tính: □ Nam □ Nữ □ Không xác định
2/ Tuổi của Anh/Chị:
□1. dưới 25
□2. 25 – 35
□3. 36 – 45
□4. 46-55
□5. trên 55
3/ Tình trạng hôn nhân:
□1. Độc thân
□2. Kết hôn
□3. Ly dị
□4. Góa
4/ Anh/Chị có bao nhiêu con?
□ 0 □ 1 □ 2 □ 3 □ 4 trở lên
5/ Anh/Chị sống ở đâu?
□1. Quận: …………………, TP Hồ Chí Minh.
□2. Quận: …………………, Hà Nội
□3. Quận: …………………, Đà Nẵng.
□4. Đồng Bằng Sông Cửu Long
□5. Khác:
6/ Anh/Chị có tổng cộng bao nhiêu bất động sản (nhà và đất)?
□ 0 □ 1 □ 2 □ 3 □ 4 trở lên
7/ Trình độ học vấn:
□1. Trung học cơ sở hoặc thấp hơn
□2. Trung học phổ thông
□3. Đại học/Cao đẳng
□4. Thạc sĩ hoặc hơn
8/ Thu nhập (VND) bình quân mỗi tháng từ công việc chính?
□ 0
□ 1 đến dưới 10 triệu
□ 10 triệu đến 50 triệu
□ trên 50 triệu đến 100 triệu
□ trên 100 triệu
9/ Ngoài thu nhập chính, thu nhập khác (ví dụ: thu nhập cho thuê, đầu tư, kinh doanh, …) của Anh/Chị mỗi
tháng?
□ 0
□ 1 đến dưới 10 triệu
□ 10 triệu đến 50 triệu
□ trên 50 triệu đến 100 triệu
□ trên 100 triệu
10/ Anh/Chị có phải là (hoặc đã từng là) lao động chính trong gia đình?
□ Đúng □ Không
11/ Vai trò của Anh/Chị trong các quyết định tài chính?
□1. Tôi là người ra quyết định tài chính chính.
□2. Tôi thường kết hợp với người khác đưa ra quyết định tài chính.
□3. Tôi không đưa ra quyết định.

225
12/ Lĩnh vực nghề nghiệp chính của Anh/Chị là gì?
□1. Quản lý quỹ đầu tư
□2. Người môi giới
□3. Giám đốc / Giám đốc môi giới
□4. Cố vấn tài chính
□5. Nhân viên ngân hàng
□6. Chủ doanh nghiệp
□7. Giám đốc điều hành
□8. Giám đốc tài chính / Kế toán trưởng
□9. Chuyên viên đầu tư
□10. Kế toán
□11. Nhân viên hành chính
□12. Nhân viên bán hàng / tiếp thị
□13. Giáo viên / giảng viên
□14. Khác: …… ..
13/ Nghề nghiệp chính của Ba hoặc Mẹ của Anh Chị là?
□1. Doanh nghiệp/Nhà đầu tư
□2. Giáo viên / giảng viên
□3. Nông nghiệp
□4. Hưu trí
□5. Khác: …… ..
□6. Mất
14/ Ba Mẹ hoặc anh chị em của Anh Chị có mua cổ phiếu không?
□ Có □ Không
15/ Kinh nghiệm làm việc:
□ < 3 năm
□ 3 đến 5 năm
□ trên 5 đến 10 năm
□ trên 10 đến 20 năm
□ trên 20 năm
16/ Anh/Chị có bao nhiêu năm kinh nghiệm đầu tư cổ phiếu?
□ <3 năm
□ 3 đến 5 năm
□ trên 5 đến 10 năm
□ trên 10 đến 20 năm
□ trên 20 năm
17/ Anh/Chị mua loại cổ phiếu (VND) nào nhiều nhất?
□ Thấp hơn 10.000 đồng
□ 10.000 đến 20.000 đồng
□ Trên 20.000 đến 50.000 đồng
□ Trên 50.000 đến 100.000 đồng
□ Trên 100.000 đồng
18/ Anh/Chị có bao nhiêu tài khoản giao dịch?
□ 1 □ 2 □ 3 □4 □ từ 5 trở lên
19/ Số lần giao dịch cổ phiếu của Anh/Chị?
□ Ít nhất một lần một ngày
□ 1 đến 6 lần/tuần
□ 1 đến 3 lần/tháng
□ 1 đến 2 lần/quý
□ 1 đến 3 lần/năm
□ Ít hơn một năm một lần
20/ Tổng số tiền (vốn sở hữu) của Anh/Chị dùng để đầu tư cổ phiếu trong năm (VND)
□ <200 triệu
□ 200 triệu đến 500 triệu
□ 501 triệu đến 1 tỷ
□ trên 1 tỷ đến 3 tỷ
□ trên 3 tỷ.
Cảm ơn Anh/Chị rất nhiều

226