Development of a process to manufacture PEGylated orally bioavailable insulin
Upload
khangminh22Category
view
2download
0
American University in Cairo American University in Cairo
AUC Knowledge Fountain AUC Knowledge Fountain
Theses and Dissertations
2-1-2020
PEGylated chitosan / doxorubicin nanoparticles and conjugated PEGylated chitosan / doxorubicin nanoparticles and conjugated
with monoclonal antibodies for breast cancer therapy with monoclonal antibodies for breast cancer therapy
Omar Helmi Zidan
Follow this and additional works at: https://fount.aucegypt.edu/etds
Recommended Citation Recommended Citation
APA Citation Zidan, O. (2020).PEGylated chitosan / doxorubicin nanoparticles and conjugated with monoclonal antibodies for breast cancer therapy [Master’s thesis, the American University in Cairo]. AUC Knowledge Fountain. https://fount.aucegypt.edu/etds/848
MLA Citation Zidan, Omar Helmi. PEGylated chitosan / doxorubicin nanoparticles and conjugated with monoclonal antibodies for breast cancer therapy. 2020. American University in Cairo, Master's thesis. AUC Knowledge Fountain. https://fount.aucegypt.edu/etds/848
This Thesis is brought to you for free and open access by AUC Knowledge Fountain. It has been accepted for inclusion in Theses and Dissertations by an authorized administrator of AUC Knowledge Fountain. For more information, please contact [email protected].

i
School of Sciences and Engineering
PEGylated Chitosan / Doxorubicin Nanoparticles
and conjugated with Monoclonal Antibodies for Breast
Cancer Therapy
A Thesis Submitted to
The Nanotechnology Master's Program
In partial fulfilment of the requirements for
The degree of Master of Science
By:
Omar Helmi Zidan
Under the supervision of:
Dr. Wael Mamdouh
Associate Professor, Department of Chemistry, The American University in
Cairo
18th December, 2019

ii
The American University in Cairo
PEGylated Chitosan / Doxorubicin Nanoparticles
and conjugated with Monoclonal Antibodies for Breast Cancer Therapy
A Thesis Submitted by
Omar Helmi Zidan
To the Nanotechnology Graduate Program
18th December 2019
In partial fulfillment of the requirements for
The degree of Master of Science
Has been approved by
Thesis Committee Supervisor/Chair
_______________________________________________
Affiliation ______________________________________
Thesis Committee Reader/Examiner
______________________________________________
Affiliation _____________________________________
Thesis Committee Reader/Examiner
______________________________________________
Affiliation ______________________________________
Thesis Committee Reader/External Examiner
_______________________________________
Affiliation_______________________________________
________________ _____________ _________________ _______________
Dept. Chair/Director Date Dean Date

iii
Acknowledgement
I would like than to God for giving me the opportunity to accomplish this work with unlimited
amounts of blessings. Right now, it’s good moments to thank all people who helped me a lot
with guidance and advices. I have received a lot of support and motivation. First and foremost,
I deeply thank my beloved supervisor Dr. Wael Mamdouh for his great patience and support.
I relay appreciate everything he has done for me; I have learnt a lot from him. He has a lot of
contribution to my career life whether inside or outside the AUC. He was always available
during his supervision and he gave me and my colleagues a lot of his time. I would like, also,
to thank all professors in the chemistry department. I have worked as TA with most of them
and I have learnt a lot from all of them; Dr. Adham Ramadan, Dr. Hassan Azzazy, Dr. Anwar
Abdel Nasser, Dr Hatem Talima, Dr. Mohamed Farag, Dr, Shahinaz Abdelrahman, Dr Nahed
Yakoub and Dr Tamer shoeib
Special thanks to my family members who did a lot for me. Of course, It’s hard to put into
words exactly how grateful I am for all your help and support. Special thanks to my father, my
mother, my sister, my brothers and my dear lovely nephews and nieces. Special thanks to all
my dearest colleagues in the AUC for their unlimited support and their help in the lab; Yasmin
el Kashef, Jailan Essam, Sarar Omar, Fatma El Shishiny, Amro Sheta, Sherif Galal,
Mariam Gamal, Khadija sadek, Mohga Essam, Nouran Sharaf, Hend El Khouly, James
Kegere, Ahmed Emad I need also to thank my dear friends who left the AUC Marwan Rezk,
Ahmed Baracat, RashaEssam, Omar Hamed, Sherouk Nasrat, Mona Tarek. I never forget
times we spent together, and I wish you the best in your lives.
I would like to extend my sincere to my dear technicians and all people in the chemistry
department; Mr. Mahmoud Abdel Moezz, Ahmed Momaia, Samir Shamma and Mr.
Emad Rafat and Hend Mashhour. Their help is really appreciated, and I can’t forget many
days they have a great contribution and facilitated many experiments in my research work.

iv
Abstract
The potential of nanobiomedical field for developing a promising therapeutic nano-sized drug
delivery system is seen to be a great pharmaceutical trend for encapsulation and release of
various antineoplastic drugs. In this context, the current work is targeting preparation of
biodegradable chitosan nanoparticles (CSNP) that have been intended for selective and
sustained release of doxorubicin (DOX) within breast tumor microenvironment. Surface
modification of these CSNP with Polyethylene glycol (PEG) was performed in order for
enhancing its blood circulation time without being opsonized or captured by immunogenic
reticuloendothelial system (RES). PEG has maintained high particles stability profile and
enhanced its surface positive charge for the sake of intracellular attachment via electrostatic
attachment with negatively charged tumor cell membrane. Advanced tumor selectivity has
been achieved through functionalization of two different types of breast cancer specific
monoclonal antibodies (mAb); anti-human mammaglobin (Anti-hMAM) and anti-human
epidermal growth factor (Anti-HER2) in two different separate nano formulations. This
functionalization has the potential of evading systemic side effects of parenteral free DOX and
promoting cancerous endocytosis through receptor mediated interaction. In-vitro cytotoxicity
effects of PEGylated DOX loaded CSNP, free DOX, Anti-HER2 PEGylated DOX loaded
CSNP and Anti-hMAM PEGylated DOX loaded CSNP were tested against breast cancer cell
line (MCF7) and normal fibroblast cell line (L929). Notably, Anti-hMAM PEGylated DOX
loaded CSNP and Anti-HER2 PEGylated DOX loaded CSNP formulations were the most
cytotoxic against MCF7 cancer cells than L929 normal cells compared to free DOX.
Confirmatory bright filed images of the two cell lines have exhibited cancerous cellular damage
after 24 hours exposure time to these nano formulations. Finally, we believe that dose
dependent system toxicity of freely ingested DOX can be hindered with such targeted nano
formulated drug delivery system.
Scheme 1: Graphical diagram of DOX encapsulation and release within tumor cell
v
Table of Contents:
Acknowledgement ................................................................................................................... iii
Abstract .................................................................................................................................... iv
List of Abbreviations .............................................................................................................. vii
List of Figures .........................................................................................................................viii
List of Tables ........................................................................................................................... xii
Thesis scope and objectives ...................................................................................................... 1
Chapter 1: Introduction and Literature Review .................................................................. 4
1.1.Cancer ................................................................................................................................. 5
1.2. Breast Cancer ..................................................................................................................... 7
1.3. Types of Breast Cancer ...................................................................................................... 8
1.3.1. Pre-Invasive Breast Cancer .............................................................................. 8
1.3.1.1. Ductal Carcinoma In-Situe (DCIS) ..................................................... 9
1.3.1.2. Lobular Carcinoma In-Situe (LCIS) ................................................... 9
1.3.2. Invasive Breast Cancer .......................................................................... 10
1.3.2.1. Invasive Ductal Carcinoma ..................................................... 11
1.3.2.2. Invasive Lobular Carcinoma ................................................... 11
1.3.3. Molecular subtypes of Breast Cancer ..................................................... 11
1.3.3.1. Estrogen Receptor mediated Breast Cancer ............................ 12
1.3.3.2. Progesterone Receptor mediated Breast Cancer ..................... 13
1.3.3.3. Human Epidermal Growth factor receptors Breast Cancer ... 13
1.3.4. Triple Negative Breast Cancer ............................................................... 15
1.4. Pathological Stages of Breast Cancer ................................................................... 17
1.5. Breast Cancer Current Therapy ........................................................................................ 19
1.5.1. Surgery ........................................................................................................... 19
1.5.2. 1.5.2. Radiotherapy ........................................................................................ 20
1.5.3. 1.5.3. Hormonal Therapy .............................................................................. 22
1.5.4. 1.5.4. Chemotherapy ...................................................................................... 23
1.5.4.1. Doxorubicin ..................................................................................... 24
1.5.4.2. Mechanism of Action of Doxorubicin ............................................. 25
1.5.4.2.1. Limitations of Doxorubicin ........................................... 27
1.6. Targeted Drug Delivery System ........................................................................... 29
1.7. Nanotechnology................................................................................................................ 29
1.8. Nanotechnology Enhanced pH Manipulation ............................................................. 31
1.9.Nanotechnology Enhanced Surface Charge Manipulation .................................... 33
1.10. Nanotechnology Enhanced Biomarker Attachment......................................... 33
1.10.1. Passive Targeting .......................................................................................... 34
1.10.2. Active Targeting ............................................................................................ 34
1.11.Nanotechnology Enhanced Prolonged Biological Circulation .............................. 36
1.12.Chitosan as Nanoparticle Platform ........................................................................ 36
1.13.Polyethylene Glycol ............................................................................................... 39
1.14.Anti-Human Mammaglobin Antibody ................................................................... 40
vi
Chapter 2: Material and Methods ........................................................................................ 42
2.1. Materials ................................................................................................................... 43
2.2. Preparation of chitosan nanoparticles ....................................................................... 43
2.3. Stability of chitosan nanoparticles ............................................................................ 46
2.4. Coating of chitosan nanoparticles with PEG ............................................................ 46
2.5.Encapsulation of doxorubicin into PEGylated CSNP ................................................ 46
2.6.Conjugation of monoclonal Antibodies .................................................................... 52
2.7.Characterization of nanoparticles ............................................................................. 53
2.7.1. Dynamic light scattering .............................................................................. 53
2.7.2. Electrophoretic Light Scattering .................................................................. 53
2.7.3. Fourier Transmission Infra-Red Spectroscopy ............................................ 54
2.7.4. X-Ray Diffraction ........................................................................................ 54
2.7.5. Scanning Electron Microscope .................................................................... 54
2.7.6. Transmission Electron Microscope.............................................................. 55
2.7.7. Ultra-Violet / Visible light Spectroscopy .................................................... 55
2.8. Drug Loading, Release Profile, Swelling test and Stability of nanoparticles ........... 55
2.8.1. Drug Loading......................................................................................................... 55
2.8.2. Swelling Test .......................................................................................................... 56
2.8.3. Stability of Nanoparticles ....................................................................................... 56
2.8.4. Drug Release Profile ............................................................................................... 57
2.9. Cell Culture Analysis Profile .................................................................................... 57
2.9.1. Cell line Maintenance ............................................................................................. 57
2.9.2. Direct Cytotoxicity ................................................................................................. 57
2.10. Theoretical Background ................................................................................... 58
Chapter 3: Results and Discussion ....................................................................................... 70
3.1. Preparation of CSNP ............................................................................................ 71
3.1.1. Ionotropic gelation ................................................................................. 71
3.1.2. Factors affecting size of CSNP .............................................................. 72
3.1.3. Stability of the selected CSNP ............................................................... 79
3.2. PEGylation of CSNP ............................................................................................ 76
3.3. Encapsulation of Doxorubicin .............................................................................. 81
3.3.1. Standard Curve of Doxorubicin ............................................................. 81
3.3.2. Doxorubicin loading capacity and encapsulation efficiency ................. 82
3.3.3. UV-VIS of Doxorubicin loaded PEGylated CSNP ............................... 84
3.3.4. FTIR Analysis ........................................................................................ 85
3.3.5. Swelling studies of DOX loaded PEGylated CSNP .............................. 87
3.3.6. In-Vitro Release Profile ......................................................................... 88
3.3.7. In-Vitro Release Kinetics ....................................................................... 90
3.4. Functionalization of monoclonal antibodies ......................................................... 91
3.5. Cytotoxicity Analysis............................................................................................ 94
3.6 Size Increment Profile .......................................................................................... 102
Appendix (Supporting Information) ................................................................................. 104
Chapter 4: Conclusion and Future Perspectives................................................................... 119
References: ........................................................................................................................... 122

vii
List of Abbreviations
Anti-HER2: Anti-Human Epidermal Growth Factor Receptor antibody
Anti-hMAM: Anti-Mammaglobin antibody
Cs: Chitosan
CSNP: Chitosan Nanoparticles
DLS: Dynamic Light Scattering
DOX: Doxorubicin
EDC: 1-Ethyl-3- (3-Dimethylaminoprobyl) Carbodiimide
EE: Encapsulation Efficiency
EPR: Enhanced Permeability Retention
FTIR: Fourier Transmission Infra-Red Spectroscopy
HNMR: Proton Nuclear Magnetic resonance
IPN: Inter Penetrating Network
LC: Loading Capacity
mAb: Monoclonal Antibody
PBS: Phosphate Buffer Solution
PDI: Poly Dispersity Index
PEG: Polyethylene Glycol
RES: Reticuloendothelial System
SEM: Scanning electron microscope
TEM: Transmission Electron Microscope
TPP: Tri-Poly Phosphate
UV-VIS: Ultraviolet-Visible Spectroscopy
XRD: X-ray Diffraction
Z average: Zeta potential average

viii
List of Figures:
Chapter 1:
Scheme 1: Graphical diagram of DOX encapsulation and release within tumor cell ............ iv
Scheme 2: Full schematic diagram of different work activities in this study ......................... 3
Figure 1.1: Initiation of cancerous tumor by the action of genetic alteration that results from
various environmental factors. ................................................................................................. 5
Figure 1.2: The angiogenesis pathway of a cancerous tumor with overexperession of VEGF
glycoprotein results in initiation of new microblood vessels that feed and carry nutrients and
oxygen to tumor area so that, the tumor cells can divide and grow easily ............................... 6
Figure 1.3: (A) Total cancer prevalence rate in 2018 including various types of cancer with
various physiological sites in human body, with total estimated number of 18,078,957 cancer
patients. (B) estimated rate of death cases because of cancer all ages and all types in by the end
of 2018 that reached around 9.6 million worldwide ................................................................. 7
Figure 1.4: (A) Different types of cancer with variable death rates including breast cancer
(6.6%) death rate in 2018, (B) the incidence rate of Breast cancer in different world zones for
2018 ........................................................................................................................................... 7
Figure 1.5: Schematic representation of breast tissue anatomy ............................................... 8
Figure 1.6: Schematic illustration of ductal carcinoma in situ ................................................ 9
Figure 1.7: Schematic illustration of lobular carcinoma in situ (LCIS) ................................ 10
Figure 1.8: The difference between invasive tumor (A), and non- invasive or in-situ tumor (B)
.................................................................................................................................................. 10
Figure 1.9: Illustrative figure shows the difference between invasive ductal carcinoma and
invasive lobular carcinoma ..................................................................................................... 11
Figure 1.10: Three basic types of receptors within breast tumor cell .................................... 12
Figure 1.11: The effect of anti-estrogenic drug Tamoxifen up on placebo and tamoxifen
treated breast cancer patients ................................................................................................... 12
Figure 1.12: The anti-progesterone action with a breast cell mediated progesterone ............ 13
Figure 1.13: Difference between HER2 positive and HER2 negative breast tumor cell ....... 14
Figure 1.14: HER2 signaling pathway with a cascade manner that ultimately target the final
breast tumorigenesis pathway ................................................................................................. 14
Figure 1.15: The Incidence rates of molecular types of breast cancer (A) and subtypes of
TNBC (B) ................................................................................................................................ 15
Figure 1.16: Pathogenesis of breast cancer including both molecular and histologic types . 16

ix
Figure 1.17: (A) Removal of sentinel lymph nodes with blue colored drainage, (B) removal of
axillary lymph nodes ............................................................................................................... 19
Figure 1.18: Different types of radiation therapy based on the affected area and the conducted
surgery ..................................................................................................................................... 21
Figure 1.19: Different Toxicity and severity rates with different breast sized patients ......... 21
Figure 1.20: (A) Radiotherapy related breast skin fibrosis, (B) Moist desquamation of a
radiotherapy affected breast .................................................................................................... 22
Figure 1.21: Inhibition of estrogen action through Hormonal therapy .................................. 23
Figure 1.22: (A) Chemical formula of DOX, (B) DOX bacterial strain of Streptomyces
Peucetius ................................................................................................................................. 25
Figure 1.23: Programmed cell death of cancerous cell with DOX (anthracycline) ............... 26
Figure 1.24: Simplified illustration of a nano-based drug delivery system ............................ 29
Figure 1.25: Nanometer scale with relative sizes of various biological objects .................... 30
Figure 1.26: TEM images of various shapes of nanostructures; (A) nanoparticles, (B)
nanocubes and (C)
Nanorods-shapes ..................................................................................................................... 30
Figure 1.27: Five routes of administration for nano based drug delivery systems ................. 31
Figure 1.28: Schematic representation of mitochondrial phosphorylation and glycolysis .... 32
Figure 1.29: pH dependency scale relative to cancerous tumor size ..................................... 32
Figure 1.30: Electrostatic interaction between nanoparticles (+ve) and cancerous cell wall (-
ve) has developed
instant drug release (192) ......................................................................................................... 33
Figure 1.31: Schematic illustration that differentiate between active (A) and passive
targeting (B) ............................................................................................................................ 34
Figure 1.32: preparation of chitosan by deacetylation of chitin ............................................ 37
Figure 1.33: chemical formula of Sodium tripolyphosphate ................................................. 39
Figure 1.34: Chemical structure of polyethylene glycol ........................................................ 40
Chapter 2:
Figure 2.1: Cross-linked chitosan with TPP .......................................................................... 44
Figure 2.2: General scheme for preparation of CS NPs ......................................................... 45
Figure 2.3: General scheme for preparation of PEGylated CS NPs ...................................... 48
Figure 2.4: Chemical scheme for preparation of PEGylated cross-linked CS NPs ............... 49
Figure 2.5: illustrative scheme for encapsulation of DOX inside PEGylated CS NPs ........... 51
Figure 2.6: Systematic setup of the basic principle for dynamic light scattering with
detecting different
scattering angles of the laser beam ......................................................................................... 58

x
Figure 2.7: Illustrative description of different components of dynamic light scattering
instrument ............................................................................................................................... 59
Figure 2.8: Schematic diagram showing the principle of electrophoretic light scattering with
a multiple layer of
illustrative charged layers (A), and the shape of the sample cell kit (B) ................................ 60
Figure 2.9: schematic representation of the FTIR working principle .................................... 61
Figure 2.10: illustrative scheme of X-ray diffraction with diffraction angle θ (Bragg’s law)
.................................................................................................................................................. 62
Figure 2.11: X-ray beam bombarding the Inner shell electrons ............................................ 63
Figure 2.12: The electronic excitation by absorbing high energy UV light spectrum ........... 64
Figure 2.13: The transmittance of UV light beam through a sample ..................................... 65
Figure 2.14: schematic representation of UV-VIS spectrometer principle ............................ 66
Figure 2.15: Multi pin sample’s holder carrying different aluminum foils with spread
samples for TEM imaging
procedure ................................................................................................................................. 67
Figure 2.16: Illustrative description of SEM unite with variable .......................................... 68
Figure 2.17: Schematic representation of the different components of TEM ....................... 69
Chapter 3:
Figure 3.1: Effect of processing pH (A) and deacetylation degree (B) of CS on the size of
CSNP........................................................................................................................................ 72
Figure 3.2: Effect of TPP concentration on the final size of CSNP ....................................... 74
Figure 3.3: Stability profile of the selected CSNP sample; S8 for three weeks at pH 7.4 ..... 75
Figure 3.4: stability profile of PEGylated and non-Pegylated CSNP ..................................... 77
Figure 3.5: XRD pattern of Chitosan powder, CSNP and PEGylated CSNP ......................... 79
Figure 3.6: TEM image of Pegylated CSNP (B and D), non-PEGylated CSNP (A and C) and
schematic
illustration of the PEG layer that surround CSNP (E) ............................................................. 81
Figure 3.7: standard calibration curve of DOX in PBS .......................................................... 82
Figure 3.8: TEM images of DOX loaded PEGylated CSNP (A, B), and schematic diagram of
DOX loaded
Figure 3.9: UV-Vis spectra of DOX loaded CSNP, non-loaded CSNP and free DOX .......... 84
Figure 3.10: FTIR spectrum of CS powder, CSNP, DOX, Pegylated CSNP and DOX loaded
PEGylated CSNP ..................................................................................................................... 85
Figure 3.11: TEM images of DOX loaded PEGylated CSNP at pH 7.4 (a), pH 6.5 (b) after
24 hrs incubation and schematic illustration of the difference between non-swelled (pH7.4)
and swelled nanoparticles (pH 6.6) (c)
.................................................................................................................................................. 86
Figure 3.12: DOX release profile of PEGylated DOX loaded CSNP at pH 6.6 and pH 7.4 .. 87
Figure 3.13: Illustrative diagram of DOX release mechanism .............................................. 88

xi
Figure 3.14: Schematic illustration of the final mAb functionalized DOX loaded PEGylated
CSNP........................................................................................................................................ 89
Figure 3.15: TEM images of Anti-hMAM DOX loaded PEGylated CSNP (A, B) and Anti-
HER2 DOX loaded PEGylated CSNP (C, D) .......................................................................... 91
Figure 3.16: HNMR spectrum of Anti-hMAM / DOX loaded PEGylated CSNP (A) and
Anti-HER2 / DOX loaded PEGylated CSNP (B) .................................................................... 92
Figure 3.17: FTIR spectrum of mAbs /DOX loaded PEGylated CSNP and non-
functionalized DOX loaded PEGylated CSNPs ...................................................................... 93
Figure 3.18: Colorimetric MTT assay of DOX loaded PEGylated CSNP (1.25, 2.5, 5 and 10
Ug/ml) (A), Free DOX concentrations (1.25, 2.5, 5 and 1 Ug/ml) (B) and Anti-HER2 and
Anti-hMAM functionalized DOX loaded PEGylated CSNP. ................................................. 94
Figure 3.19: Bright field images of L929 cells with white arrows referring to living cells (A),
and MCF7 cells with white arrows referring to dead cells (B) after exposure to DOX –
PEGylated CSNP (0.5 Ug/ml) ................................................................................................. 95
Figure 3.20: Bright field images of L929 cells with white arrows referring to dead cells (A),
and MCF7 cells with white arrows referring to living cells (B), after exposure to Free DOX
.................................................................................................................................................. 97
Figure 3.21: Bright field images of L929 cell line with white arrows referring to living cells
(A), and MCF7 cell line with white arrows referring to dead cells (B) cells after exposure to
Anti-HER2 functionalized DOX loaded PEGylated CSNP..................................................... 98
Figure 3.22: Bright field images of L929 cells with white arrows referring to living cells (A)
and MCF7 with white arrows referring to dead cells (B) cells after exposure to Anti-hMAM
functionalized DOX loaded PEGylated CSNP ........................................................................ 99
Figure 3.23: TEM images and the relevant DLS histograms of non-PEGylated CSNP (A, B)
and PEGylated
................................................................................................................................................ 100
Figure 3.24: TEM images and their relevant DLS histograms of DOX loaded PEGylated
CSNP (E, F), Anti-HER2 DOX loaded PEGylated CSNP (G, H), and Anti-hMAM DOX
loaded PEGylated CSNP (I, J)
................................................................................................................................................ 102

xii
List of Tables
Chapter 1:
Table1.1: Various subcategories of TNBC with their relative genetic characteristic behaviors
.................................................................................................................................................. 15
Table 1.2: TNM grading system for different stages of breast cancer ................................... 17
Table 1.3: Five years survival rates of different stages of breast cancer ............................... 19
Table 1.4: Various adverse effects of using chemotherapy after one-month treatment ........ 24
Table 1.5: Examples of generic pharmaceutical market products (147, 148) ......................... 26
Table 1.6: Drug-drug interaction with resulted adverse reactions of doxorubicin vs some
frequently
administered types of drugs for a cancer patient ..................................................................... 28
Table 1.7: Example of different nanostructured drug delivery formulas that are assisted with
various
biological targeting moieties. .................................................................................................. 35
Table 1.8: Some CSNP formulations used for breast cancer drug delivery .......................... 38
Chapter 2:
Table 2.1: Optimum conditions for the applied factors in preparation of CS NPs ................ 45
Table 2.2: Sample variations relative to the polymeric concentrations of PEG while keeping
TPP and Cs concentrations fixed ............................................................................................ 47
Table 2.3: Sample variation relative to DOX concentrations while keeping the polymeric
concentrations for Cs, TPP and PEG fixed. ............................................................................. 50
Table 2.4: comparison between TEM and SEM .................................................................... 69
Chapter 3:
Table 3.1: Variation of sample formulas according to chitosan and TPP concentrations ...... 71
Table 3.2: Particle size and distribution of different samples with various concentrations of
TPP and chitosan polymer ...................................................................................................... 72
Table 3.3: Size, PDI and zeta potential of PEGylated CSNPs ................................................ 76
Table 3.4: DLS analysis of DOX loaded and unloaded CSNP ............................................... 83
Table 3.5: Resulted LC% and EE% of different DOX-PEGylated CSNP at different drug
concentrations .......................................................................................................................... 83

xiii
Table 3.6: Release kinetics of the released DOX according to different systems equations
with various resulted values .................................................................................................... 90


1
Thesis Scope and Objectives

2
Thesis Scope and Objectives:
The current study is an indicative attempt to apply readily available and naturally existent
polymers; chitosan (CS), in order to enhance the pharmacotherapeutic efficacy of an anti-
cancer drug; Doxorubicin (DOX) and its smart delivery system against breast cancer cell line.
The main objective here is to design a nano-formulation platform that will be able to travel
inside the human physiological blood circulatory system. This circulatory journey is oriented
to be from a certain site of administration till reaching the selected site of action by the aid of
cell specific ligand(s) known as smart antibodies. This partially invasive drug delivery system
aims to deliver, localize, and prolong the release of the loaded DOX. Besides, it is an efficient
system to minimize the undesirable immunogenic uptake of this entire therapeutic platform by
the effect of mono-nuclear phagocyte system (MPS) that is known, also, as reticuloendothelial
system (RES). Thereby, facilitating the accumulation of effective doses of DOX within the
tumor environment without harming the other non-cancerous organs. Thus, minimizing its
severe side effects like heart failure, bone marrow suppression, mucositis and alopecia (1).
The referred nanoparticles conjugated system will be based on a biodegradable and
biocompatible polymeric chitosan nanoparticles (CSNP) which will be functionalized with
Polyethylene Glycol (PEG), DOX and biological marker(s) over the different chapters and
activities of this study. In activity 1, the CSNP will be prepared within a bottom-up approach
using ionotropic gelation method (2). The resultant nanoparticles will be characterized using
different characterization analysis in order to confirm the consistency of their crosslinking,
size, shape, distribution, morphology and surface charge. Various characterization techniques
have been exploited for this purpose such as Dynamic Light Scattering (DLS), Scanning
Electron Microscopy (SEM), Transmission Electron Microscopy (TEM), X-Ray Diffraction
(XRD), Ultraviolet-Visible spectrophotometry (UV-VIS) and Infrared spectroscopy using
Fourier Transform Infrared Spectroscopy (FTIR). In Activity 2, the prepared CSNPs have been
loaded with a polymeric Polyethylene Glycol (PEG). The main purpose behind adding this
polymer has been to ensure a prolonged and extended circulation of the nanoparticles till
reaching the breast tumor area without being uptake by RES. These PEGylated CSNP have
been characterized, also, using the same characterization analysis as activity 1. (3)

3
Encapsulation of DOX inside the PEGylated CSNP has been done as the third activity. This
step has been done with very minute concentrations of DOX. These minute concentrations
have been tested in terms of encapsulation efficiency (EE%), loading capacity (LC%) and cell
cytotoxicity. The dye compound 3-(4,5-Dimethylthiazol-2-yl)-2,5-diphenyltetrazolium
bromidefor colorimetric assay (MTT assay) has been an indicative test of the most effective
DOX concentration that can kill the highest percentage of MCF-7 breast tumor cells (3). The
concentration of choice has been tested for the drug release behavior in order to monitor and
expect its behavior inside the tumor microenvironment. Besides cell cytotoxicity test, this
activity has been characterized also with FTIR, TEM, Zeta-sizer, Zeta potential and UV-Vis
spectroscopy. These characterization analyses have confirmed the successful encapsulation
and stability of DOX inside the PEGylated CSNP. Achieving such dose reduction with
maintaining good stability of this nano-formula in normal saline pH is an outstanding step for
obtaining efficient delivery process of highly effective doses of DOX. Therefore, the
integration of such multidisciplinary nanosystem into pharmaceutical DOX drug delivery
process has empowered its activity against breast tumor cells.
Scheme 2: Full schematic diagram of different work activities in this study

4
Chapter 1
General Introduction
&
Literature Review

5
1.1. Cancer
For many decades, cancer has been recognized as one of the top unresolved threatening health
problems that represents the second leading cause of death worldwide according to some
contemporary reports by World Health Organization (WHO). Typically, cancer can start within
any organ in the body at any time for many identified and unidentified etiologies as shown in
Figure (1.1) (4). The main problem with cancer is the fast cellular growth of a group of mutated
cells that are known as tumor cells. Basically, Cancer starts with one normal healthy cell that
develops a damage or unexpected change in its Deoxyribonucleic Acid (DNA) molecule. This
change, which may be inherited or developed by many factors such as radiation, oxidative
stress, infection, smoking and hormonal disturbances can cause gene mutation and rather
interfere with the normal cell division instructions. Therefore, it turns from a normal cell to a
cancerous cell that grows out of control. Tumor is developed when this cancer cell continues
to grow and divide.
Figure 1.1: Initiation of cancerous tumor by the action of genetic alteration that results from various
environmental factors. (5)

6
Tumor cells don’t have any specific physiological function in the human body, and they can
easily avoid the immune system. Besides, they ignore the physiological signals that aim to
control or stop cell division. The tumor grows and gets bigger by the flood of oxygen and
different types of nutrients using blood supply through cancerous angiogenesis formation as
illustrated in Figure (1.2) (6).
Figure 1.2: The angiogenesis pathway of a cancerous tumor with overexperession of VEGF glycoprotein results
in initiation of new microblood vessels that feed and carry nutrients and oxygen to tumor area so that, the tumor
cells can divide and grow easily (7)
The increased numbers of cancer diseased cases worldwide are tremendously growing every
day, the mortality rate at 2018 has been 9.6 million deaths (5). In Aisa, the highest mortality
rate, the estimated number of death cases has been more than 5 million. While the remaining
amount of death cases has been localized in different areas worldwide including Europe,
Africa, Oceania and North America as shown in Figure (1.3) (B). On the other hand, the
estimated economic expenses that has been accompanied with cancer treatment in US is about
$1,16 Trillion per year. Besides, more than 300,000 new cancer cases among the age of 0-19
years are being annually diagnosed. Therefore, it has been proposed by some WHO guidelines
that patient awareness and early screening of a tumor can improve the treatment access (8).

7
(A) (B)
Figure 1.3: (A) Total cancer prevalence rate in 2018 including various types of cancer with various
physiological sites in human body, with total estimated number of 18,078,957 cancer patients. (B) estimated rate
of death cases because of cancer all ages and all types in by the end of 2018 that reached around 9.6 million
worldwide (8)
1.2. Breast cancer
Breast cancer is the highest comon cancer type within female population, and it has been ranked
worldwide as one of the top leading causes of high death rates among the same demographic
population section. Being one of the top international public health issues over the century,
breast cancer has a direct influence on different dimensions of human lives including
physiological, psychological, mental and social aspects. Meanwhile, it has an incidence rate of
more than 2.1 million new cases every year as shown in Figure (1.3 A). In 2018, the mortality
rates of breast cancer have been 627,000 deaths as shown in Figure (1.4 A).
(A) (B)
Figure 1.4: (A) Different types of cancer with variable death rates including breast cancer (6.6%) death rate in
2018, (B) the incidence rate of Breast cancer in different world zones for 2018 (8)
8
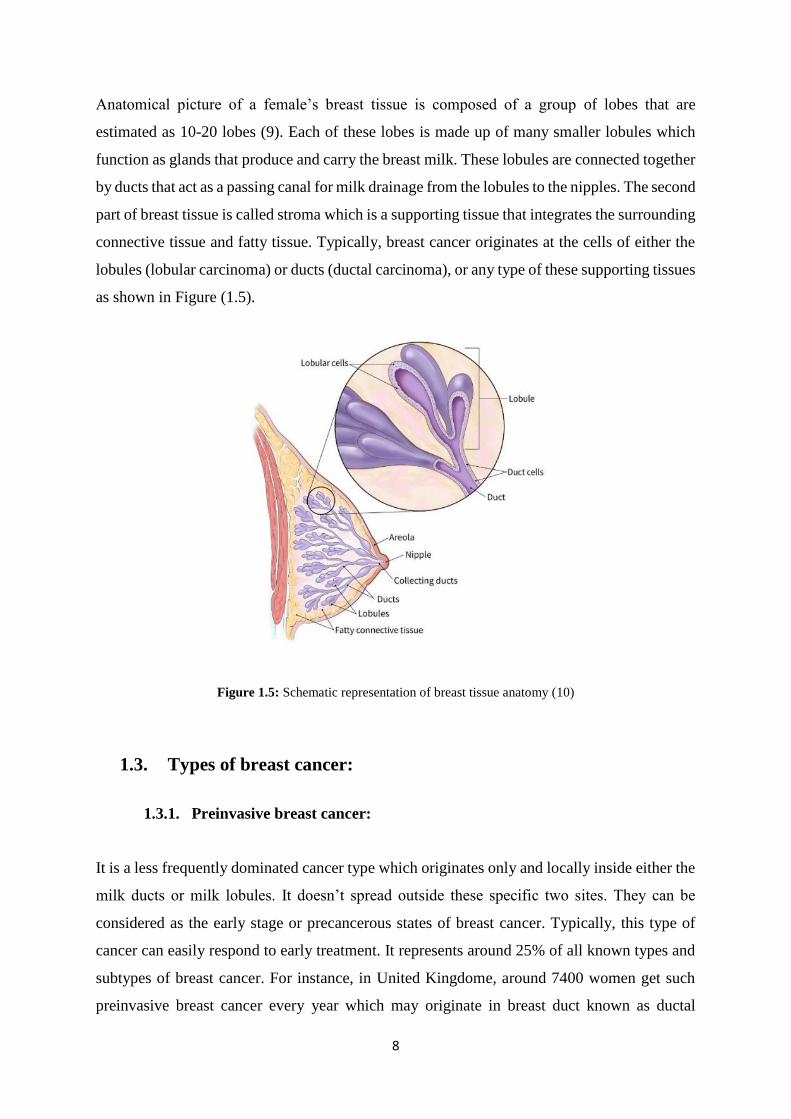
Anatomical picture of a female’s breast tissue is composed of a group of lobes that are
estimated as 10-20 lobes (9). Each of these lobes is made up of many smaller lobules which
function as glands that produce and carry the breast milk. These lobules are connected together
by ducts that act as a passing canal for milk drainage from the lobules to the nipples. The second
part of breast tissue is called stroma which is a supporting tissue that integrates the surrounding
connective tissue and fatty tissue. Typically, breast cancer originates at the cells of either the
lobules (lobular carcinoma) or ducts (ductal carcinoma), or any type of these supporting tissues
as shown in Figure (1.5).
Figure 1.5: Schematic representation of breast tissue anatomy (10)
1.3. Types of breast cancer:
1.3.1. Preinvasive breast cancer:
It is a less frequently dominated cancer type which originates only and locally inside either the
milk ducts or milk lobules. It doesn’t spread outside these specific two sites. They can be
considered as the early stage or precancerous states of breast cancer. Typically, this type of
cancer can easily respond to early treatment. It represents around 25% of all known types and
subtypes of breast cancer. For instance, in United Kingdome, around 7400 women get such
preinvasive breast cancer every year which may originate in breast duct known as ductal

9
carcinoma in situ (DCIS), or in breast lobule known as lobular carcinoma in situ (LCIS) (11).
A Full detailed description of the different types of breast cancer is illustrated in Figure (1.16).
1.3.1.1. Ductal Carcinoma in Situ (DCIS):
Ductal carcinoma can be diagnosed as cancerous cells that grow locally inside the walls of
ducts and don’t invade the external surrounding breast tissues. Approximately, all women with
such type of tumor can be cured easily and the early detection of such type is, also, another
helpful factor for efficient treatment. Because such tumor type is confined locally within the
ductal tissue only, DCIS is also known as intraductal or non-invasive cancer. It is not a life-
threatening subtype, but in rare cases it can develop a more sever invasive type. Usually,
women develop such breast cancer subtype after the age of 48 yrs (12). DCIS can be
subcategorized into three types; low grade, intermediate grade and high grade. The last two
types can be screened as a thick mass accompanied with some nipple discharge.
Figure 1.6: Schematic illustration of ductal carcinoma in situ (13)
1.3.1.2. Lobular Carcinoma in Situ (LCIS):
This type of cancer tumor is another confined and localized tumor. The cells grow exclusively
inside the lining lobules only without harming the adjacent walls and tissues or cells. Although
it is physiologically confined, it can however be diagnosed hardly using such advanced
screening as mammograms. Some studies have proposed that such type may not be considered
as a real type of breast cancer, but they consider it as a marker for future tumor. It is detected
as a change in the cellular structure in a biopsied tissue. It differs from DCIS as if it was left
without treatment, it won’t proceed to such aggressive invasive subtype (13, 14).

10
Figure 1.7: Schematic illustration of lobular carcinoma in situ (LCIS) (13)
1.3.2. Invasive breast cancer:
This is a non-confined breast cancer tumor in which the cells are growing out of control and
spread outside the ductal and lobular tissues. The tumor grows outside the confined areas as
shown in figure (1.8) (A). It represents around 75% of breast cancer tumor types and has been
estimated that the US is developing 180,000 invasive breast cancer cases every year (14). The
majority of this number is diagnosed with invasive ductal carcinoma. It can affect women
population randomly at any stage of their ages. Besides, invasive breast cancer can affect men
population as well.
(A) (B)
Figure 1.8: The difference between invasive tumor (A), and non- invasive or in-situ tumor (B) (15)
11
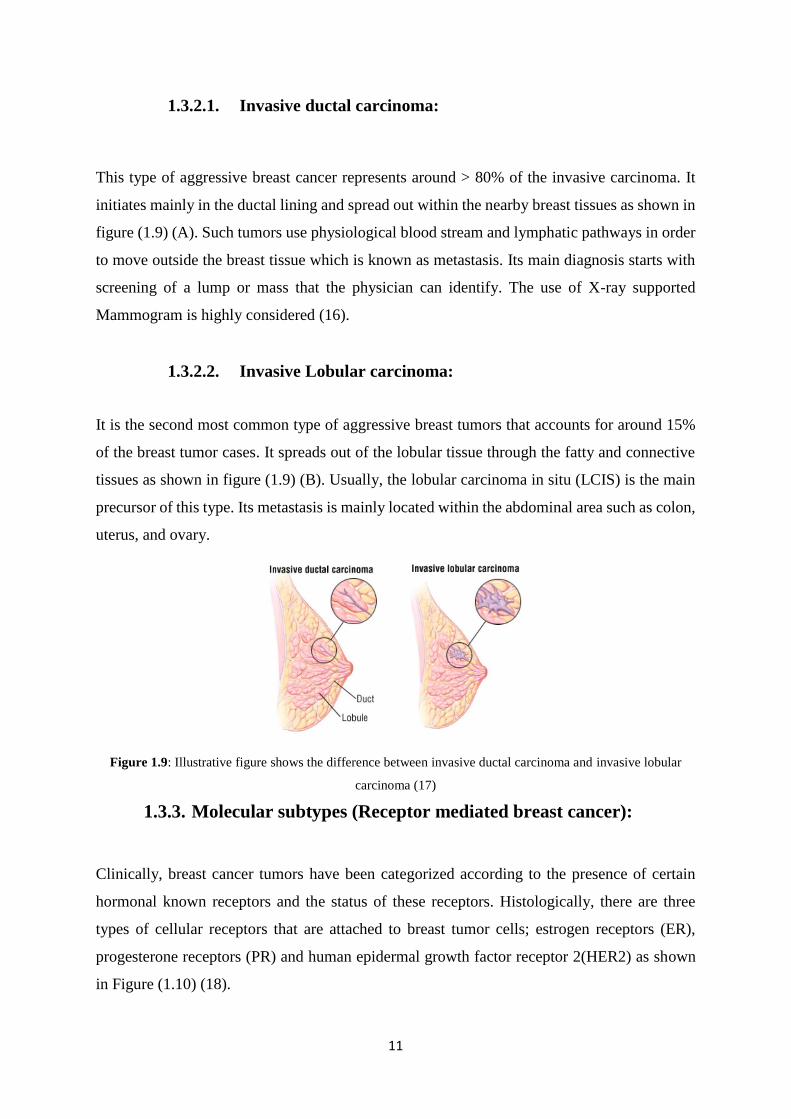
1.3.2.1. Invasive ductal carcinoma:
This type of aggressive breast cancer represents around > 80% of the invasive carcinoma. It
initiates mainly in the ductal lining and spread out within the nearby breast tissues as shown in
figure (1.9) (A). Such tumors use physiological blood stream and lymphatic pathways in order
to move outside the breast tissue which is known as metastasis. Its main diagnosis starts with
screening of a lump or mass that the physician can identify. The use of X-ray supported
Mammogram is highly considered (16).
1.3.2.2. Invasive Lobular carcinoma:
It is the second most common type of aggressive breast tumors that accounts for around 15%
of the breast tumor cases. It spreads out of the lobular tissue through the fatty and connective
tissues as shown in figure (1.9) (B). Usually, the lobular carcinoma in situ (LCIS) is the main
precursor of this type. Its metastasis is mainly located within the abdominal area such as colon,
uterus, and ovary.
Figure 1.9: Illustrative figure shows the difference between invasive ductal carcinoma and invasive lobular
carcinoma (17)
1.3.3. Molecular subtypes (Receptor mediated breast cancer):
Clinically, breast cancer tumors have been categorized according to the presence of certain
hormonal known receptors and the status of these receptors. Histologically, there are three
types of cellular receptors that are attached to breast tumor cells; estrogen receptors (ER),
progesterone receptors (PR) and human epidermal growth factor receptor 2(HER2) as shown
in Figure (1.10) (18).

12
Figure 1.10: Three basic types of receptors within breast tumor cell (19)
1.3.3.1. Estrogen receptor mediated breast cancer:
Around 65 % of breast cancer tumors are estrogen receptors positive (ER+) meaning that these
tumor cells have estrogen receptors in the outer surface of their cellular membranes.
Physiologically, estrogen receptors are functioning as stabilizers for the effect of the
endogenous estrogen and, in some cases, responding to other therapeutic agents (20). Only 15-
20 % are considered to be estrogen receptors negative (ER-). This type of breast cancer is
riskier than ER+. Patients with ER+ tumors are typically treated with hormonal therapy,
immunotherapy and/or chemotherapy. They respond well to such types of therapies as shown
in Figure (1.11).
Figure 1.11: The effect of anti-estrogenic drug Tamoxifen up on placebo and tamoxifen treated breast cancer
patients. (21)

13
1.3.3.2. Progesterone receptor mediated breast cancer:
Progesterone (PR) is one of the endogenous steroidal hormones that is involved in different
physiological processes such as embryogenesis, pregnancy and menstruation cycles. It has
been stated that progesterone is involved, also, in breast cancer tumor progress.
Physiologically, PR is functioning as an activator for rapid activation of protein kinase that is
involved in some modification processes of proteins. Additionally, it acts as a mediator for
signals transduction pathways within the breast tissues. Therefore, it has been found that the
presence of such PR receptors can play a role with the development, growth and even the
treatment of the breast cancer. Likewise, in ER mediated tumors, some patients have been
found to efficiently respond to hormonal treatment. Those are patients with PR+, respond to
anti-progesterone drugs as shown in Figure (1.12) While others with PR- don’t respond well
to hormonal therapy and they respond, majorly, to chemotherapy and immunotherapy (22).
Figure 1.12: The anti-progesterone action with a breast cell mediated progesterone (23)
1.3.3.3. human epidermal growth factor receptor 2(HER2) breast cancer:
HER2 is an over expressed oncogene that is naturally existent on the external surface of normal
breast and tumor breast cells. Normally, in a healthy woman, HER2 is responsible for cell
growth, division and self-repair. Basically, HER2 has been discovered during early 1980s, and
it has been stated to be one of the key factors that participate in the development of breast tumor
within 15 – 20 % of the total patient population. This oncogene is responsible for encoding
various types of fundamental proteins that are responsible for maintaining persistent tumors

14
growth. The overexpression of HER2 gene in breast cancer patients is originated by its cellular
mutation related over amplification, and this results in initiation of too many HER2 receptors
as shown in figure 1.13. Theses receptors are responsible for uncontrolled growth and division
of tumor cells (24).
Figure 1.13: Difference between HER2 positive and HER2 negative breast tumor cell (25)
HER2 (+ve) tumor cells provide their own tumor growth through a proliferative, angiogenic
and cell progressive pathway as shown in figure (1.14). This pathway is enzymatic based
network that is supported with many different signals that develop a cascade manner which
ends up with uncontrolled growth of the tumor (26).
Figure 1.14: HER2 signaling pathway with a cascade manner that ultimately target the final breast
tumorigenesis (26)

15
1.3.4. Triple Negative Breast Cancer (TNBC):
This is a major heterogeneous challenging aggressive type of breast carcinoma that occurs in
young women. TNBC is mainly characterized by the absence of the most important three types
of receptors that feed the tumor cells; ER, PR and HER2 receptors. This represents a distinct
challenge in front of so many trials for controlling the growth of such type. The distinct
aggressive nature associated with this type is related to the lack of targeted therapy besides its
critical pathological nature. It has been estimated that TNBC represent around 20% of all
worldwide invasive breast cancer patients as shown in figure (1.15) (A) (27).
(A) (B)
Figure 1.15: The Incidence rates of molecular types of breast cancer (A) and subtypes of TNBC (B) (28)
TNBC has many different molecular subtypes as shown in Figure (1.15) (B) and Table (1.1);
Luminal A, Luminal B, Immunomodulatory (IM), mesenchymal stem-like (MSL),
mesenchymal (M), basal like 1 and 2 (BL1, BL2), luminal androgen receptors (LAR) and
normal tumors (29). The molecular profile for TNBC entails that the majority of infected
patients are basal like category. This category is characterized by overexpression of CK5 and
CK14 genes, which are used immunohistochemically for diagnosis of solid breast carcinomas
like intraductal papilloma with usual ductal hyperplasia (IPUDH).
Table1.1: Various subcategories of TNBC with their relative genetic characteristic behaviors (30)

16
Figure 1.16: Pathogenesis of breast cancer including both molecular and histologic types (31)

17
1.4. Stages of breast cancer:
Many worldwide health and treatment organizations that are concerned with the global public
health have proposed and classified different stages of breast cancer according to many factors.
For instance, size of the tumor, hormonal receptors overexpression, type of the tumor, how
deep the tumor is within the healthy unaffected breast tissues, metastatic tendency to nearby
organs and spreading to the nearby lymph nodes. However, the most often applied system for
staging has been the American Joint Committee on Cancer (AJCC) (32). This system is called
TNM system that stands for (Tumor Node Metastasis), and it classifies breast cancer according
to two main sub-classifications; clinical and pathological (Table 1.2)
Table 1.2: TNM grading system for different stages of breast cancer (33)
TNM Description Stage patients (%)
Tumor (T)
T0 Tumor is not formed 0 NA
T1 Tumor < 2 cm 1 6.8%
T2 Tumor (2 cm – 5 cm) 2 19.7%
T3 Tumor ≥ 5 cm 3 28.4%
T4 Tumor of any size 4 45.4%
Lymph node (N)
N0 No tumor in lymph nodes 0 20.9%
N1 Non movable tumor 1 24.9%
N2 Movable Tumor 2 31.7%
N3 Tumor in 4 – 10 lymph
nodes
3 22.5%
N4 NA 4 NA
Metastasis (M)
M0 No metastasis 0,1,2,3 83%
M1 Distant metastasis 4 17%

18
o Stage 0:
This is the earliest stage of breast cancer that is characterized by a noninvasive nature of
the tumor, and sometimes called in-situ carcinoma. The cancerous and non-cancerous cells
are separated from each other and there is no evidence of any cancerous invasion. The
prognosis and treatment possibilities in this stage are high, since there are separate
boundaries between the growing cancerous cells and healthy cells. DCIS can be considered
as example of such stage.
o Stage 1:
This is the secondary stage that provides a descriptive picture of invasive carcinoma.
Sometimes microscopic examination of such invasion is a rigid evidence of this clinical
grade. Through this examination, physicians can define the general size of the tumor and
the involvement of the nearby lymph nodes. Some studies differentiate between stage 1A
and 1B (33). In stage 1A, the tumor’s size can reach 2 cm while keeping the adjacent lymph
nodes unaffected. While in stage 1B, the tumor’s size may reach 0.2 mm while the adjacent
lymph nodes are affected and involved in the tumor growth.
o Stage 2:
The size of the tumor in this stage is < 5 cm and having the adjacent lymph nodes affected
with the tumor. Likewise, stage 1, this stage is classified into two sub classes; 2A which
has a tumor growing in the axillary or sentinel lymph nodes, while the breast tissue has no
tumor. On the other hand, in 2B subclass, the tumor is large and reaches to 5 cm, though it
doesn’t reach the adjacent lymph nodes.
o Stage 3:
This is one of the advanced stages of breast tumor in which the axillary lymph nodes are
highly involved with having a large tumor size of 5 cm. It can be sub-classified into three
stages; A, B and C. Breast tumor of stage 3A, tumor is found to be between 5 – 9 axillary
lymph nodes. In stage 3B, Tumor is found in 9 axillary or sentinel lymph nodes. This type
is called inflammatory breast cancer since it has a swelling of the affected skin area. In
stage 3C, tumor is found in more than 10 lymph nodes.
o Stage 4:
This stage of breast cancer is known as metastasis, and characterized by the spread of tumor
cells to the nearby organs including distant organs such as liver, bone, colon and brain and

19
distant lymph nodes. Physicians may call this tumor type ‘De Novo” and it has some
possibility at this stage that the tumor is a recurrence of a previous breast cancer.
Table 1.3: Five years survival rates of different stages of breast cancer (34)
Stage Description 5 years
survival rate
Stages 0 and 1 Primary diagnosed cancer (high curability rate) 90 %
Stage 2 Early stage breast tumor (intermediate curability rate) 70%
Stage 3 Advanced carcinoma (augmented therapy is required) 48%
Stage 4 Late stage metastatic breast carcinoma (very low
curability rate)
20%
1.5. Breast cancer current therapy:
1.5.1. Surgery
Surgery is the main traditional management strategy that has a prominent role in evading breast
tumor. This strategy is prioritized over many other treatment techniques for those patients
whose tumors are localized and did not metastasize to further areas of the nearby body organs
(35). Additionally, surgery is highly considered, also, for such patients who are at late complex
stages of breast cancer. In these stages, the removal of axillary or sentinel lymph nodes and
other breast lesions are the main targets for performing a surgery as showed in Figure (1.17).
(A) (B)
Figure 1.17: (A) Removal of sentinel lymph nodes with blue colored drainage, (B) removal of axillary lymph
nodes (35)

20
o Mastectomy:
This is one of the well-known breast surgeries that entails the removal of the whole breast
tissue including the outer skin tissue and axillary lymph nodes. According to many studies,
this is one of the options that are offered for early stages patients such as primary stages;
1,2 and 3 and non-invasive DCIS and LCIS patients. Some preventive procedures, also,
may recommend such surgery for patients who are believed to be at high risk of having
later breast carcinoma (36).
o Lumpectomy:
It is a partial surgical procedure that is less inclusive than mastectomy. It entails the removal
of a benign part of the breast. In other words, lumpectomy is a partial mastectomy that is
highly recommended for patents whose malignant tumors are surrounded by healthy non-
cancerous tissues including lymph nodes. Notably, most surgeons and patients as well
recommend lumpectomy than mastectomy owing to their high concern with losing breast-
based asexuality (37).
1.5.2. Radiotherapy:
It is one of the highly considered treatment methodologies that proved its effectiveness in
evading and control many breasts malignant tumors’ growth. Radiotherapy could be a
completely curative treatment for some breast cancer cases. A combination therapy that
combines radiotherapy with many other therapeutic techniques may enhance the survival
benefits in many breast carcinomas. Wang et al has recently conducted a rigid conclusion of
minimizing the breast tumor recurrence rates of 50% within 10 years survivals when radiation
therapy has been combined with breast tumor surgery (38). Moreover, the death rate, also, has
been decreased by 20% for 15 years.

21
Figure 1.18: Different types of radiation therapy based on the affected area and the conducted surgery (39)
Clinically, many randomized and retrospective studies have reviewed the acute and chronic
toxicity profiles associated with adjuvant radiotherapy on breast cancer patients. The size of
the breast is a one indicative factor that may enhance or diminish the radiotherapy toxicity as
shown in figure (1.19).
Figure 1.19: Different Toxicity and severity rates with different breast sized patients (40)
Harsolia et al. has demonstrated a strong relationship between the breast edema, dermatitis and
chronic hyperpigmentation relative to the intensity of the breast size. Besides, Shah et al. has
concluded the same sever rates of these aforementioned adverse effects. Moist desquamation,
subcutaneous fibrosis and breast shrinkage have been reported by Pignol et al. for 5 years
simple radiation therapy as shown in Figure (1.20) (41).

22
(A) (B)
Figure 1.20: (A) Radiotherapy related breast skin fibrosis, (B) Moist desquamation of a radiotherapy affected
breast (42)
1.5.3. Hormonal therapy:
In premenopausal patients, the prevention of estrogen action is achieved through two major
techniques; ovarian ablation or the use of therapeutic estrogen analogues such as Luteinizing
hormone releasing hormone (LHRH) like goserelin (Zoladex©). In the same context, selective
estrogen receptor modulators (SERM), like tamoxifen and raloxifene, is frequently used as
adjuvant treatment for ovarian cancer and breast cancer. It has been reported by a collaborative
study that tamoxifen has shown a significant reduction of the tumor recurrence rate by 74%, it
could also minimize the death rate by 26% (43). Another adjuvant hormonal treatment that has
attracted some oncological interest is selective estrogen receptor degrader (SERD) like
fulvestrant. This type of therapy is used to damage or degrade the estrogen receptors. It is often
applied for post-menopausal women and sometimes it can be combined with goserelin in order
for augmenting their antagonizing effect against breast tumor.
Postmenopausal breast cancer patients, who represents quiet higher rates than premenopausal
patients, have 80% of their breast tumors ER+. Physiologically, estrogen in postmenopausal
women is produced in minute quantities through some organs such as breast tissues, liver and
adrenal glands. That is because their ovaries are no longer producing sufficient estrogen. It has
been shown according to Czick et al. that some hormonal treatment, such as tamoxifen and
aromatase inhibitors (AIs), can effectively stop the conversion of androgens hormones to
estrogens through inhibition of the aromatase enzyme as shown in Figure (1.21) (44).

23
Figure 1.21: Inhibition of estrogen action through Hormonal therapy (45)
1.5.4. Chemotherapy:
Anthracyclines (a subcategory of chemotherapy) has been reported by many studies as the most
potent class of chemotherapeutics that can interfere with such enzymatic associated cell growth
(46). The initiation of redox reactions by anthracyclines has a powerful role on generating
reactive oxygen species (ROS). These ROS causes oxidative stress and cancerous cell death.
In the same context, anthracyclines interfere with topoisomerase II enzyme whom inhibition
arrest the cancerous cell growth. Therefore, the use of chemotherapy is highly recommended
in sever cancer types, such as TNBC and HER2+, including stages 3and 4. These late stages
have characteristic inclusion of metastasis and lymphatic carcinomas with independence of
size of the tumor, patient age and nodal status (47).
On the other hand, having various therapeutic alternatives is always recommended owing the
wide adverse effects that can be clinically decisive in shifting between different treatment
options. Chemotherapy has been listed by WHO as one of the top recommended treatment
plans of breast carcinoma. Chemotherapy has been reported as a source of generating ROS,
this caused a programed cardiotoxicity for patients who receive various chemotherapeutic
agents. It’s been for many years with a great conflict of the imbalance between the risks and
24
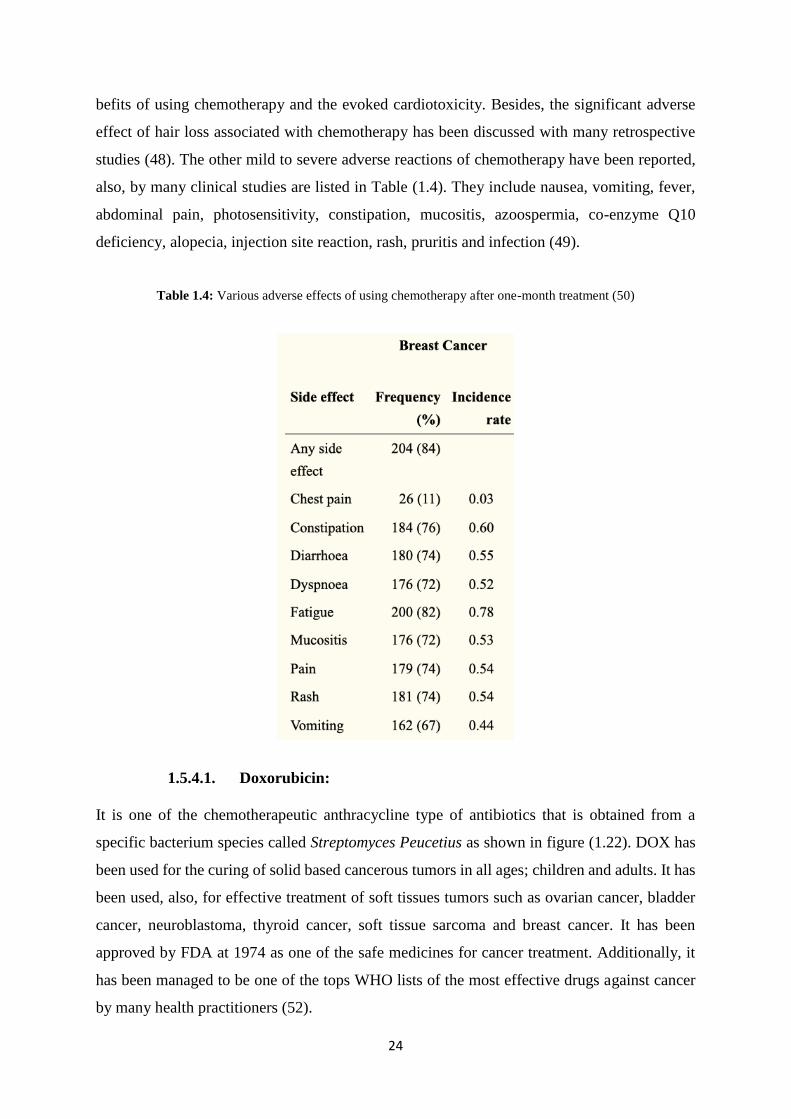
befits of using chemotherapy and the evoked cardiotoxicity. Besides, the significant adverse
effect of hair loss associated with chemotherapy has been discussed with many retrospective
studies (48). The other mild to severe adverse reactions of chemotherapy have been reported,
also, by many clinical studies are listed in Table (1.4). They include nausea, vomiting, fever,
abdominal pain, photosensitivity, constipation, mucositis, azoospermia, co-enzyme Q10
deficiency, alopecia, injection site reaction, rash, pruritis and infection (49).
Table 1.4: Various adverse effects of using chemotherapy after one-month treatment (50)
1.5.4.1. Doxorubicin:
It is one of the chemotherapeutic anthracycline type of antibiotics that is obtained from a
specific bacterium species called Streptomyces Peucetius as shown in figure (1.22). DOX has
been used for the curing of solid based cancerous tumors in all ages; children and adults. It has
been used, also, for effective treatment of soft tissues tumors such as ovarian cancer, bladder
cancer, neuroblastoma, thyroid cancer, soft tissue sarcoma and breast cancer. It has been
approved by FDA at 1974 as one of the safe medicines for cancer treatment. Additionally, it
has been managed to be one of the tops WHO lists of the most effective drugs against cancer
by many health practitioners (52).

25
(A) (B)
Figure 1.22: (A) Chemical formula of DOX, (B) DOX bacterial strain of Streptomyces Peucetius (51)
1.5.4.2. Mechanism of action of DOX:
DOX have been elucidated with its intense ability to confine and limit the cancerous tumor’s
growth with various modes of actions.
o First, generating stressful ROSs. DOX and anthracyclines, in general, contain
hydroxyquinone which is chelating structure for elements like iron. By the aid of some
mitochondrial mediators such as NADH dehydrogenase and cytochrome P450
reductase, iron-DOX complex enhances the conversion of electrons from glutathione
to oxygen and its derivatives. This results in accumulation of ROS and production of
free radicals as shown in Figure (1.23) (53).
o Hydroxyl radicals, single oxygen, superoxide ions and hydrogen peroxide are
accumulated inside the cell and can’t be detoxified. This causes DNA damage and
gradually trigger cancerous cell apoptosis. The cell membrane lipids are exposed to
peroxidation, and this causes rabid destruction of cell membrane. Loss of energy and
activated lipid metabolism are other findings for such the oxidative stresses (54).

26
Figure 1.23: Programmed cell death of cancerous cell with DOX (anthracycline) (54)
o Second, it interferes with the actions of Topoisomerase-II (TOP II) enzyme which is
fundamental enzyme for the completion of DNA structural stabilization. Therefore,
DOX arrests the relegation of the small DNA breaks and, thereby, block the cellular
growth. Then, finally, it enhances gradual apoptosis.
o Third, DOX has an intercalation activity between the double helical base pairs of the
cancerous DNA. Therefore, it interferes with the synthesis of DNA and RNA, and this
in turn inhibit cancerous cell division (55)
o Finally, it has been reported by Chapner et al. that DOX interferes with the function of
vascular nitric oxide synthase, thus disrupt the vascular tone of the angiogenic blood
vessels that transfer blood and nutrients to the tumor area (56). It is effective, also, to
kill the disseminated cancerous cells that are resistant to hormonal therapy or are
metastatic. Various generic pharmaceutical products are listed in table (1.5).
Table 1.5: Examples of generic pharmaceutical market products (57, 58)
Generic drug Conc. Administration company Year
Adriamycin® 2mg/mL Intravenous West-Ward Pharmaceutical
Corps
1996
DOX HCL® 2mg/mL Intravenous Fresenius Kabi 2000

27
DOX HCL® 2mg/mL Intravenous Pfizer Inc. 2011
DOX HCL® 2mg/mL Intravenous Sun Pharmaceuticals 2012
DOX HCL® 2mg/mL Intravenous Actavis Pharma 2014
DOX HCL® 2mg/mL Intravenous Athenex Pharmaceutical
Division
2017
DOX HCL® 2mg/mL Intravenous Dr. Reddy's Laboratories Inc
2018
1.5.4.2.1. Limitations of non-targeted DOX:
The main hindrance to DOX clinical anticancerous application has been its non-selective
pharmacological activity against healthy and tumor cells. This poor selectivity generates dose
dependent toxicity and severe side effects within normal cells. One of the widely conducted
sever toxicity is its known intense cardiotoxicity. The second considerable hindrance is the
elevated levels of DOX cellular resistance. These two main reasons besides many other adverse
drug reactions are the top restricting clinical effects that cause treatment failure (59).
It has been reported that 11% of patients receiving DOX are experiencing these adverse
reactions within the first few days of treatment. Furthermore, Oikonomou et al. has reported
that cardiac arrhythmias have been manifested in 26% of DOX receiving breast cancer patients
during the first 5 years of treatment. Another clinical study, Luu et al., has revealed a 50%
mortality within the first year of DOX administration being manifested with acute
cardiotoxicity and congestive heart failure (CHF) (60). Some other drug-drug interactions are
summarized in table (1.6).
Another drawback for the conventional use of DOX is the elevated drug resistance levels owing
to the multiple frequent dosing system. The severity and clinical grade of the tumor are the two
main reasons for such multiple doses. This elevated resistance is associated with many reasons;
first, the overexpression of multiple drug resistance -1 gene (MDR1) and multi drug resistance
protein (MRP). Second, impaired DNA repairing, which improve the tumor cell apoptotic
resistance. Third, mutation and enzymatic degradations of Topoisomerase II, which change the
expression level of topoisomerase II. Finally, alteration of the cellular membrane fatty acid
composition that deteriorate some cellular repair mechanisms (61).

28
Table 1.6: Drug-drug interaction with resulted adverse reactions of doxorubicin vs some frequently administered types of drugs for a cancer patient
Co-administered drug Drug-drug interaction Mechanism Solution Ref.
N-nitrosouria
(streptozocine)
Increased DOX toxicity and
bone marrow suppression
Prolong the half-life elimination
of DOX
Decreased doses of DOX (62)
Digoxin Decreased blood serum level of
digoxin
Reduced intestinal absorption of
digoxin
Changing the does regimen of
digoxin
(63)
Quinolone antibiotics I. Increased DOX toxicity
II. Decreased antibacterial
activity of quinolones
I. Inhibited cytochrome P450
3A4 and cytochrome P450
1A2; responsible for dox
metabolism
II. Decreased systemic
absorption of quinolones
Caution and dose monitoring (64, 65)
Cyclophosphamide Added cardiotoxicity Reduced metabolism of DOX Avoided (66)
Barbiturates
(phenobarbital)
Decreased DOX efficacy increased plasma clearance of
DOX
One of them should be stopped
based on a risk-benefit ratio
evaluation.
(67)
Cyclosporine Increased DOX related
cardiotoxixity with a high
serum level of more than 50%
Cyclosporines interfere with P-
glycoprotein and reduce DOX
metabolism by reducing CYT
P450 enzyme.
Caution with regular checking (68)
Antiviral (stavudine and
zidovudine)
Minimize the antiviral activity Decreased intracellular
activation
Avoided (69)

29
1.6. Targeted drug delivery:
In the same sense and over the past decade, researchers have combined the use of
pharmaceutical sciences to nanoscience as a trial for achieving highly effective targeting
treatment. This combination has brought different optimized formulas for the targeted delivery
of wide variety of components such as proteins, antibodies, narrow therapeutic indices drugs,
poorly water-soluble drugs, organic based drugs and polymeric drugs. Besides, the implication
of nanoscience has provided as new controlled release drug delivery systems which is
therapeutically outstanding and cost effective as well. Nanoparticles could effectively prove its
durability and efficacy as a successful nano-based platform for the synthesis of promising
anticancer treatment. The scientific concept behind this system is shown in Figure (1.24). The
nanoparticles act as a protective carrier that carries an entrapped drug. This drug, whether water
soluble or insoluble, is carried either inside it or upon the particle’s surface. The loaded amount
of drug is released in a controllable manner over certain time. The nanoparticle is marked with
certain biological marker in order for targeted and specific delivery of the entrapped drug. This
biological marker can be antibody, protein or DNA molecule (70).
Figure 1.24: Simplified illustration of a nano-based drug delivery system (70)
1.7. Nanotechnology:
Nanotechnology has been shown to the light of medicinal and bio-medicinal applications for
many years. It could open the door in front of fabrication of various nanosized material
formulations that have been used within many various applications. Various Nano formulated
shaped material have been reported in many studies including dendrimers, polymeric
nanoparticles, quantum dots, core-shell nanoparticles and carbon nanotubes (figure 1.25). All
these nano- formulations have been fabricated with high control over their chemical, electrical,
physical and biological safety applications (71). Generally, a material within the nanoscale

30
behave as if it is completely new material in terms of optical, magnetic, chemical and physical
performance, especially when its intended application is size dependent.
Figure 1.25: Nanometer scale with relative sizes of various biological objects (72)
Synthesis of nanoparticles can be engineered for performing various surface and core
modifications within the nanoparticles. Two main approaches for manufacturing nanoparticles;
bottom-up and top-down approaches. During both methodologies, nanoparticles can be
conjugated with different types of ligands including functional chemical groups, biological
molecules, permeation enhancers, targeting moieties, magnetic dyes or surface cross-linkers.
Furthermore, the beauty of nanotechnology, in general, is that there is a good control over the
resulted final geometrical shape of the nanostructure. For instance, nano-rod, nano-spheres,
nano-cubes, nanofibers and nanowires as shown in Figure (1.26).
(A) (B) (C)
Figure 1.26: TEM images of various shapes of nanostructures; (A) nanoparticles, (B) nanocubes and (C)
nanorods (73)

31
Biologically, nanotechnology develop another spectacular manipulation of some serious
specifications such as stability in different pH, surface charges, and drug release. These
properties are extremely critical whenever the intended application has been biological or
therapeutic. Therefore, there are five available routes of administration for any nano-based
structures as illustrated in Figure (1.27). That is because there are many variables included to
affect the intended nanoparticles such as immune response, enhanced permeability retention
(EPR), lymphatic drainage and the pH of the diseased or affected organ area. All these factors
can strengthen or weaken the pharmacological action of the loaded drug. Breast cancer has
some characteristic pathological features for which nanotechnology can be a considerable
solution for such problematic issues.
Figure 1.27: Five routes of administration for nano based drug delivery systems
1.8. Nanotechnology enhanced pH manipulation:
First, breast tumor environment is generally acidic in nature. Some reports have reported that
the microenvironment of the breast tumor is ranging between pH (6.5 – 6.9). While the normal
blood stream pH value is neutral to slightly alkaline; ranging between pH=7.2 – 7.5 (75). The
reason for this pH difference is known as Warburg effect (76). This phenomenon differentiates
between healthy and cancerous cells. Normally, mitochondrial phosphorylation is the main
source of energy for the cell to obtain ATP. While cancerous cell uses metabolic glycolysis to
obtain its energy. This glycolysis ends up with accumulated levels of pyruvate and lactate. This

32
occurs within anerobic conditions that are attained by the action of tumor acidosis which
minimize the amount of oxygen that is required for keeping the organ area healthy as shown in
Figure (1.28).
Figure 1.28: Schematic representation of mitochondrial phosphorylation and glycolysis (78)
Furthermore, DOX has been reported by Fukamachi et al. as one of the chemotherapeutic drugs
whose therapeutic efficacy is not changed between the acidic and alkaline environments.
Indeed, it rather showed more cytotoxic efficacy within highly acidic and larger tumor sizes
than smaller less acidic. These results are agreed, also, with Hiroshi et al. (79). In other words,
the larger the tumor size, the higher therapeutic efficacy that DOX has Figure (1.29).
Figure 1.29: pH dependency scale relative to cancerous tumor size (79)

33
1.9. Nanotechnology enhanced surface charge manipulation:
Second, and on the same context, cancerous cell membrane of the tumor cell is negatively
charged. That is because the accumulated lactate anions tend to remove the positive ions and
leaving the cancerous cell membrane with negative charges. The poor blood perfusion is a
supporting factor for this cellular reaction. Therefore, the fabricated nanoparticles that are
intended to work in such environment should have certain specifications. They are preferred to
have a net positive charge upon their surfaces, so that an electrostatic interaction can maximize
the internalization rate of the positively charged nanoparticles. Besides, it has been developed
by Osaka et al. that the accumulation rates of nanoparticles would be greater when electrostatic
interaction between the nanoparticles and cancer cell membrane takes place. This would
provide better drug diffusion with a controlled release behavior as shown in Figure (1.30) (80).
Figure 1.30: Electrostatic interaction between nanoparticles (+ve) and cancerous cell wall (-ve) has developed
instant drug release (80)
1.10. Nanotechnology enhanced biomarker attachment:
One of the main effective advantages that entails the great role of nanotechnology in
therapeutics is the ability of attaching targeting moieties to the surfaces of the drug carriers.
These moieties are acting as a guiding monitor that direct the nanoparticle or nanocarrier from
the site of drug introduction to the site of action which is breast area. Attaching such targeting
moiety has been a great next step for a new era in designing effective drug delivery systems.
Nanotechnology enables many researchers to conduct various types of biomarker attached
nano-formulations that are directed for the treatment of various diseases. Some examples for
various nano-based drug delivery systems are shown in Table (1.7). The guidance of such nano
formulations is going to be routed in one of two targeting pathways; active and passive
targeting Figure (1.31) (81).

34
1.10.1. Passive targeting:
Passive targeting entails the accumulation of the injected nano formulations within the tumor
tissue with enhanced extravasation out of the tumor. Theses targeted nano formulations could
efficiently penetrate the tumor through some factors such as their small nano-size, leaky
vasculature, disorganized permeable blood vessels. The main reasons for such leaky nature of
these blood vessels are hypoxia, inflammation and lack of nutrients due to high metabolic rate.
This leakage tendency is referred as enhance permeability retention (EPR). Within these leaky
permeable vessels, larger pores are formulated and allow transfer of particles with size up to
400 nm (82). Some studies have assumed a much broader range of these pores’ sizes of (380 –
780) nm (53).
1.10.2. Active targeting:
Active targeting is highly efficient ligand-receptor interaction that promote a targeted and
precise drug release within the tumor environment. This interaction is taken place between the
overexpressed surface epitopes of the tumor cell and the attached ligand biomarkers. It is more
efficient than passive targeting (83). The entrapped drug is guaranteed to be released and
diffuse inside the cell with active targeting. Once the ligand receptor conjugation takes place,
plasma membrane close so that an internalization endosome is formulated.
Figure 1.31: Schematic illustration that differentiate between active (A) and passive targeting (B) (84)

35
Table 1.7: Example of different nanostructured drug delivery formulas that are assisted with various biological targeting moieties.
Nanostructure Monitored
disease
Targeting
moiety
Target Entrapped drug Mode of
action
Ref.
Multiwalled carbon
nanotube
Colon cancer Hyaloronic acid CD44 receptors that are over expressed on
colon tumor cells
Gemcitabine
(chemotherapeutic
anticancer)
(Gemzar ®)
Intracellular (85)
Liposomes
Non-small
cell lung
tumor
GE11 peptide Epidermal growth factor receptors
(EGFRs)
DOX
(chemotherapeutic
anticancer)
Intracellular (86)
Dendrimers
Ovarian
cancer
Primary antibody
(mAbK1)
Mesothelin, a glycosyl-
phosphatidyl inositol (GPI) protein
Paclitaxel
(chemotherapeutic
anticancer)
Intracellular (87)
Polymeric micelles
Pancreatic
cancer
anti-tissue factor
(TF) antibody
(clone 1894
Pancreatic overexpressed tissue factors
antigen receptors.
Oxaliplatin (platinum
derived
chemotherapy)
(Eloxatin ®)
Intracellular (88)

36
1.11. Nanotechnology enhanced prolonged biological circulation:
One of the critical factors that affect the therapeutic efficacy of the intended Nano formulated
drug is its rapid biological clearance. During this biological journey, this nano-formulation
encounter many biological defending mechanisms that slow down their migration and, in turns,
speed up their elimination through lymphatic drainage. Immunologic reticuloendothelial
system (RES) and mononuclear phagocyte system (MPS) are phagocytic systems that is
majorly existent in the liver (89). This system is capable of capturing the nanocarrier and
deteriorate its action through immunological phagocytosis.
Generally, in order for a drug carrier to be therapeutically effective, it must have some criteria
available upon its biological ingestion. It must be (1) non captured and escape from the RES
and MPS, (2) of high stability profile along over its biological journey till reaching the tumor
area, (3) circulate freely within the systemic blood circulation without being encountered by
various immunological responses and (4) accumulate within the tumor area so that a
therapeutic concentration of the drug is released (90). For this purpose, some polymers are
being suggested to be used so that we ensure high versatility and solubility of the nanocarrier.
Hao et al. have suggested the use of polyethylene glycol (PEG) and poly (lactic co-glycolic
acid) (PLGA) as hydrophobic co polymers in order for solubilization of water insoluble drugs.
Owing to the biological performance, this study has reported the preference of coated
nanoparticles than uncoated nanoparticles. Another study, Nadeem et al., has developed the
use of poly-vinyl alcohol (PVA) as a coating material for iron oxide nanoparticles-based drug
delivery system (91).
1.12. Chitosan as a nanoparticle platform:
CS has been therapeutically used as a polymer based nano drug platform (s) for the delivery of
various drug types that are intended for the treatment of many diseases like breast cancer.
Different nano-formulations of CS have been suggested to be used for such biomedical
application such as CS nanoparticles, nano fibers, nanoliposomes and nanogels (92). CS
possesses a prolonged circulation behavior and low immune clearance rates. Besies, it has what
is called shielding effect against RES system that retard its detection (93). Furthermore, CS has
the ability to efficiently penetrate the tight junction of the epithelial membranes, therefore, it
has an improved permeation through this junction.

37
Chitosan nanoparticles (CSNP) have been used as a successful drug carrier of many anticancer
agents for breast cancer therapy. Many studies have conducted a better antitumor activity for
CSNP loaded with various anticancer drugs compared to these free unloaded drugs. Table (1.8)
is showing the potential of some CSNP to be used as efficient drug delivery systems in breast
cancer therapy. CSNP can be synthesized with many applicable preparation techniques such as
ionotropic gelation, emulsification-crosslinking, co-precipitation, reverse micellization,
microemulsion, desolation, solvent evaporation and coacervation (94).
Figure 1.32: preparation of CS by deacetylation of chitin (95)
Ionotropic gelation is a simple and direct preparation technique that allow synthesis of
crosslinked CSNP within aqueous conditions. It represents an electrostatic bridging between
positively charged CS (through amine NH2 group) and negatively charged polyanionic polymer
such as tripolyphosphate (TPP), genipen and glutraldehyde. The result of such bridging is
formation of a complex gel like structure that represent crosslinked CSNP. Therefore,
ionotropic gelation is more preferred than other techniques. Besides, it doesn’t require the use
of extensive preparation conditions such as high-tech procedures and the burdens of using
organic solvents (96).
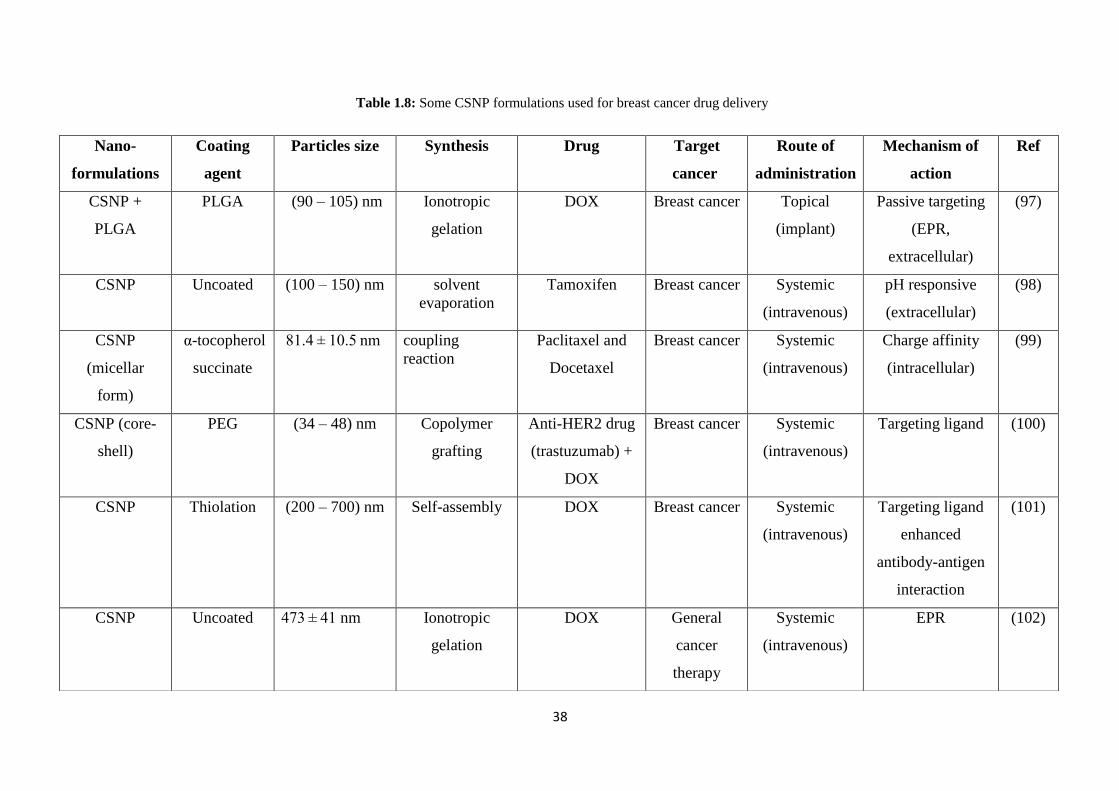
38
Table 1.8: Some CSNP formulations used for breast cancer drug delivery
Nano-
formulations
Coating
agent
Particles size Synthesis Drug Target
cancer
Route of
administration
Mechanism of
action
Ref
CSNP +
PLGA
PLGA (90 – 105) nm Ionotropic
gelation
DOX Breast cancer Topical
(implant)
Passive targeting
(EPR,
extracellular)
(97)
CSNP Uncoated (100 – 150) nm solvent
evaporation
Tamoxifen Breast cancer Systemic
(intravenous)
pH responsive
(extracellular)
(98)
CSNP
(micellar
form)
α-tocopherol
succinate
81.4 ± 10.5 nm
coupling
reaction
Paclitaxel and
Docetaxel
Breast cancer Systemic
(intravenous)
Charge affinity
(intracellular)
(99)
CSNP (core-
shell)
PEG (34 – 48) nm Copolymer
grafting
Anti-HER2 drug
(trastuzumab) +
DOX
Breast cancer Systemic
(intravenous)
Targeting ligand (100)
CSNP Thiolation (200 – 700) nm Self-assembly DOX Breast cancer Systemic
(intravenous)
Targeting ligand
enhanced
antibody-antigen
interaction
(101)
CSNP Uncoated 473 ± 41 nm
Ionotropic
gelation
DOX General
cancer
therapy
Systemic
(intravenous)
EPR (102)

39
TPP has been shown to be more biologically safe than other polyanionic gelation polymers as a
cross-linker for synthesizing CSNP. It is one of the considerable factors that influence many
specifications of the resulted nanoparticulate system such as size average, surface charge, and
particles distribution (see appendix SI). Moreover, the mixing technique of TPP into acidic CS
aqueous solution affect these parameters as well. For instance, dropwise addition, one-shot
addition and dilution techniques are three different mixing procedures that lead to variation of size,
distribution and potential of the resulted CSNP (103).
Figure 1.33: chemical formula of Sodium tripolyphosphate (104)
1.13. Polyethylene glycol (PEG):
PEG is a synthetic hydrophilic based polymer that has been used in numerous pharmacotherapeutic
applications such as wound dressing and drug delivery. It has unique chemical properties such as
biocompatibility, solubility, neutrality, non-irritating and odorless. It is composed of a linear chain
of polyether with hydrophilic terminal groups of OHs as shown in figure (1.34). This hydroxyl
group is responsible for its hydrophilicity, and it acts as electron donor. This electronic donation
is responsible for many chemical characteristics of PEG including its good compatibility with
organic solvents through weak hydrogen bonding interaction. This allow rapid release of the
entrapped pharmaceutical drug. PEG has low melting temperature and fast solidification rate;
therefore, it can be used preparation of chemical and organic dispersions (105). It has been
approved as biodegradable polymer with non-immunogenicity and nonantigenicity effect for safe
biological applications by FDA (106). For these reasons, it is widely used as encapsulating or
coating agents with various nanoparticles-based drug delivery systems

40
Figure 1.34: Chemical structure of polyethylene glycol (107)
1.14. Anti-Mammaglobin antibody (Anti-hMAM):
MAM has been demonstrated as a protein-based biomarker antigen that is overexpressed on the
cellular surfaces of all breast tumor cancer types. Many studies have encountered the analysis of
MAM as breast cancer biomarker. The results recommend the independent use of MAM as a
diagnostic and therapeutic biomarker. These promising results have put MAM as one of the
targeting ligands that entails an antigen-antibody interaction upon the membrane surface of breast
tumor cells (108).
In this context, in breast tumor cells, the membrane associated MAM interaction can play a very
important role in designing an actively targeting drug delivery system for minimizing the growth
of such tumor tissue. By conjugating MAM to a nanoparticulate carrier that entrap antineoplastic
drug will promote its therapeutic activity within the acidic based microenvironment of breast tumor
area (109). This open the door in front of nanoscience and biopharmaceutical science for
improving new methodologies of breast cancer curing. However, the number of reports that have
been conducted on the use of this biomarker for active targeted breast cancer drug delivery systems
are yet low. The potential of anticipated frequent application of such biomarker is still growing.
Lian et al. has conducted a nano-based drug delivery of doxorubicin to the breast tumor area. Anti-
hMAM has been used as a specific targeting ligand for specific targeting of breast tumor tissue
(110). The results of this study came promising with efficient specific membrane targeting and
functional drug carrying signaling system.
MAM has been discovered first in 1994 by Watson-Fleming within breast tissue cells. They could
identify MAM-A and MAM-B. The overexpression of MAM-A receptors is restricted to breast

41
cancer patients only, while MAM-B is related to various tumor organs such as ovary, thyroid,
uterus and breast (110, 111). Leygue et al. has experimentally concluded the diagnostic capability
of MAM-A for diagnosis of breast cancer in a clinical study. The study has applied reverse
transcriptase polymerase chain reaction (RT-PCR) to test the over-expression of the MAM-A
coding RNA in 20 breast tumor affected females with advanced lymph nodes tumors. The results
have confirmed its over expression with a recommendation of using MAM-A as a diagnostic target
in breast cancer.

42
Chapter 2
Materials & Methods

43
2.1 Materials:
The materials used for the current experimental work were purchased from different local and
international sources. CS polymer of low molecular weight (LMW) with 89.9% deacetylation
degree and 65 cp viscosity was purchased from Priemex ehf, Chitoclear®, Iceland. Polyethylene
glycol (PEG), acetic acid 100%, potassium bromide (KBr) (FTIR grade, ≥99% trace metals basis),
and Dulbecco’s modified Eagle’s medium (DMEM), were purchased from Sigma Aldrich, Germany.
DEMEM reagent was supplemented with 4500 mg/L glucose, L-glutamine, sodium pyruvate,
sodium bicarbonate, 10% FBS, and 5% penicillin/streptomycin. Anhydrous sodium tri-poly
phosphate (TPP) (technical grade 85%) was purchased from Sigma Aldrich®, Missouri, USA.
Doxorubicin hydrochloride (molecular weight of 579.96 g/mol) was purchased from Sigma
Aldrich®, Switzerland (Suisse). Anti HER2 and anti Mammoglobin antibodies (originated from
rabbit source) were purchased from Sigma Aldrich®, Steinheim, Germany. Phosphate buffered
saline (PBS) was purchased from BioWhittaker® Reagents, Lonza, Walkersville, USA. For
cleaning and sterilization purposes, acetone and Ethanol 99.9% were purchased from Medical Pure
Life®, Europe and Alamia®. Egypt, respectively. 1-Ethyle-3-(3-dimethylaminopropyl)
carbodiimide (EDC) was purchased from Sigma Aldrich®, Switzerland (Suisse). MTT reagent, 3-
[4,5-dimethyl-2-thiazolyl]-2,5-diphenyl-2H-tetrazolium bromide and dimethyl sulfoxide (DMSO),
were purchased from Serva Electrophoresis, Heidelberg, Germany. Fetal bovine serum (FBS),
Trypsin EDTA, Penicillin/Streptomycin, were obtained from Lonza, Switzerland. CO2 incubator
(Heracell incubator, Thermo Scientific, USA). Most of the other aforementioned chemicals and
materials were stored in a well-controlled storage conditions including ventilation, humidity and
temperature.
2.2. Preparation of Chitosan nanoparticles (CSNPs):
Chitosan nanoparticles (CSNPs) have been fabricated using Ionotropic gelation technique as
referred by many different studies with some modifications including various processing factors
as described in the supporting information appendix; part 1 (SI.1) (112). Ionotropic gelation
method is a soft and straightforward technique in which CS NPs can simply be formulated via
electrostatic interaction between acidic phase and alkaline phase. In other words, whitish clouds

44
of nanoparticles were spontaneously prepared upon addition of TPP (alkaline phase) as a
negatively charged cross-linking agent, to the positively charged poly-cationic chitosan solutions
(acidic phase) as shown in Figure (2.1). Various concentrations of acidic chitosan solutions
(0.05%, 0.25%, 0.5% and 1%) were used against various concentrations of TPP aqueous solution
(0.1%, 0.4%, 0.5% and 0.7%) as illustrated in the appendix (SI.2.1). The chitosan acidic solution
and TPP solution were filtered first with syringe filters of 0.4 and 0.2 µm pores sized filters
respectively before the crosslinking addition (113).
Figure 2.1: Cross-linked CS with TPP (113)
TPP was dropped to chitosan acidic solution in a dropwise manner within a moderate stirring
speed. The mixture was left for proper mixing while keeping the applied mixing technique, time
and rate within acceptable ranges Figure (2.2). The stirring time was adjusted to 30 min with low
stirring speed of 250 rpm at room temperature. By comparing various mixing techniques such as
hand stirring, magnetic stirring, homogenization or sonication, the magnetic stirring was

45
efficiently applied over other stated methods. It is simple and possesses a strong effect on reducing
the sizes of CS NPs (114).
Figure 2.2: General scheme for preparation of CS NPs
In order for ensuring high stability of the formulated CS NPs, some factors such as polymers’
concentrations, pH, molecular weights of chitosan, stirring time and stirring speed were studied in
a more detailed manner as shown in the appendix (SI.2). All these factors have a direct influence
on size, particle charge and stability of the resulted nano-system. Each factor was experimented
and studied independently, and the resulted recommended parameters that were applied for our
current study are listed in Table (2.1).
Table 2.1: Optimum conditions for the applied factors in preparation of CS NPs
Preparation Factors Applied parameters
Molecular weight of chitosan Low molecular weight chitosan, DA 89.9%
Concentration of chitosan 1% Acetic acid aqueous solution (1%)
Concentration of TPP 0.4% Aqueous solution
pH 5
Stirring time 30 minutes
Stirring speed 250 RPM
Temperature Ambient room temperature
46
The resulted samples of the synthesized CS NPs were representing a mélange of various
concentrations of chitosan and TPP (see the appendix, SI.2 and Table S2). After successful
formation of whitish clouds of nanoparticles, the mixtures were centrifuged for 30 min at 10,000
rpm. These specific centrifugation parameters were enough to separate the formulated
nanoparticles (115). The resulted biphasic system, after centrifugation, was divided into two parts
as shown in the appendix (SI.1.3 and table 1). The first part was the supernatant, which was
discarded since it contained the unreacted polymers and acetic acid residues. The second part
separated nanoparticles pellet was re-suspended in fresh distilled water to be washed from any
excess un-reacted chitosan and TPP. The washing process was done twice at 10 min centrifuging
time at 5000 rpm, and this part was divided according to the sampling process for further
characterization experiments (116).
2.3. Stability of CS NPs:
Stability of the formulated CS NPs as a candidate for the following anticancer tests was crucial
step. For investigating the stability of the surface of the resulted nanoparticles, their mean particles
diameter size, surface zeta potential and poly distribution index (PDI) were analyzed by using
Malvern Zeta sizer (NANO ZS, Malvern, UK) (see appendix SI.3, and Table 6) (117). An
indicative stability profile was developed, and the samples were incubated in fresh distilled water
with pH of 7.2 for three weeks at room temperature, and the required data of the size, distribution
and surface zeta potential were collected over this stated period.
2.4. Coating of CS NPs with Polyethylene Glycol (PEG):
CS NPs showed different stability profiles with different conditions, resulted in some variations
for successful delivery of the entrapped material inside these nanoparticles. Some specifications
within the physical or chemical structure of the resulted CS NPs could be modified or tailored so
that they could fit within the desired intended application. For instance, the poor water solubility
of sole chitosan in water revealed some drawbacks with some chitosan-based drug delivery
systems of some hydrophilic drugs (118). Increasing hydrophilicity of CS NPs and enhancing the

47
stability of an entrapped hydrophilic drug are two examples of specific properties that could be,
fortunately, modified with a hydrophilic polymer like polyethylene glycol (PEG) (119). The
modification adjusted by grafting this copolymer to the basic structure of CS NPs was reported in
the literature as successful platform of maintaining high nanoparticles’ stability. This process is
known as “PEGylation” and the resulted PEGylated CS NPs are called “stealth” (120).
Table 2.2: Sample variations relative to the polymeric concentrations of PEG while keeping TPP and Cs
concentrations fixed
Sample Cs (%) TPP (%) PEG (%)
1 0.4 1 5 10
1 √ √ √
2 √ √ √
3 √ √ √
PEGylated CS NPs were prepared following Calvo et al. with some modifications (121, 122). This
aims to provide high particles stability profile and enhance application durability on the final
selected PEG concentration. Three different aqueous solutions of PEG (1%, 5% and 10%) were
prepared as shown in table 2.2 by using a simple stirring speed around 500 rpm for 30 min at room
temperature. All other preparation parameters were kept constant, so that the optimal functioning
conditions can provide a sole explanation of the physical and chemical properties of the resulted
nanoparticles. After dissolving PEG in distilled water, we could identify three different PEG
concentrations whose viscosities varied according to the weighted amount of PEG powder. The
dissolution of PEG didn’t require addition of any excipients like acetic acid or any additives. That’s
because it is readily water-soluble polymer and has an FDA (Food and Drug Administration)
approval for safe pharmaceutical and food applications (123).

48
Figure 2.3: General scheme for preparation of PEGylated CS NPs
The three aforementioned prepared PEG concentrations were added drop-wisely to the chitosan
acidic solution (CS 1%). Then, the three mixtures were left for mixing for 30 min with stirring
speed of 250 rpm. This provided three homogenous mixtures of both polymers; chitosan and PEG.
The PEGylated CS NPs were formulated upon drop wise addition of TPP solution to chitosan
acidic solutions containing the previously stated PEG concentrations as shown in Figure (2.3) and
(2.4). Ionotropic gelation process started upon cross-linking of PEGylated chitosan solutions with
the polyanion TPP. This process took place immediately, and the three mixtures were left on the
magnetic stirrers for 30 min at low stirring speed of 250 rpm at the ambient temperature. Then, the
PEGylated CS NPs were centrifuged and separated from the excess unreacted chitosan, TPP, PEG
and acetic acid residues. The separation was performed by centrifuging at 10,000 rpm for 30 min
at 24°C using HERMILE Labotechnik 36 HK centrifuge (Germany) (see Appendix SI.4.4). The
resulted pellet of PEGylated CS NPs was later divided into three parts like those non-PEGylated
CS NPs that were discussed in the appendix (SI. 1.3 and table 1) (124).

49
Figure 2.4: Chemical scheme for preparation of PEGylated cross-linked CS NPs (112)
Some vital parameters were identified such as size, external morphology, surface zeta potential
and PDI of the resulted PEGylated CS NPs. The effect of various concentrations of PEG on these
parameters was analyzed. It was confirmed that change in PEG concentration could affect such
parameters of these nanoparticles. This was confirmed before by some previously published
reports (125). The effects of PEGylation process on the external positive amino groups and hence
the stability of PEGylated CSNPs were studied also in accordance with another previously
published study (112).
2.5. Encapsulation of Doxorubicin (DOX) within CS NPs:
The capability of PEGylated CS NPs to effectively entrap anticancer DOX drug was evaluated in
this phase. After successful preparation of stable, biologically durable and biocompatible
PEGylated CS NPs, we have studied different protocols that were intended for prosperous
encapsulation of a hydrophilic drug inside the core of PEGylated CS NPs’ structure (127). These

50
protocols have identified the use of different drugs including DOX. PEGylated CS NPs were the
same nanostructured matrix that was used as the platform to deliver these drugs. This study is
mainly dependent on the efficient use and modification of DOX’s pharmacological action. Many
reasons that were related to the physical and chemical properties of the intended drugs were
analyzed for the specific use of DOX over other anticancer drugs as will be discussed in more
details in the next chapter (128).
Integrating DOX within such nan-formulation was expected to provide many effective
pharmacological and non-pharmacological indications over sole non encapsulated DOX.
Furthermore, PEGylated CS NPs were expected to entrap such hydrophilic DOX and travel inside
the bloodstream without leaking the loaded drug or being captured by the immunologic responding
reticuloendothelial system (129). All preparation parameters were fixed in order to investigate the
effect of different concentrations of DOX (table 2.3) on the encapsulation efficiency. Additionally,
the preparation procedure was performed in light protected environment due to the photo-
degradation nature of DOX (130).
Table 2.3: Sample variation relative to DOX concentrations while keeping the polymeric concentrations for Cs,
TPP and PEG fixed.
Sample Cs (%) TPP (%) PEG (%) DOX (µg/ml)
1 0.4 5 1.25 2.5 5 10
1 √ √ √ √
2 √ √ √ √
3 √ √ √ √
4 √ √ √ √
After dissolving PEG in acidic chitosan solution, it was left to be mixed for 30 min as shown in
Figure (2.5) with stirring speed of 250 rpm. DOX was added to the CS-PEG mixture while
maintaining light protective performing conditions. Four different concentrations of DOX were
used; 1.25 µg/mL, 2.5 µg/mL, 5 µg/mL and 10 µg/ml. Four different drug concentrations were
obtained by the end of this step. The color of the four solutions were varied with red color intensity
according to their corresponding concentration. The drug-copolymers were left for homogenous

51
mixing in order to achieve complete chemical interaction between the positive amino NH2 group
of DOX and negative polyanion of TPP, likewise the noncovalent encapsulation between DOX
and of CS / PEG polymers. They were left for 1 hour within a mild stirring speed of 250 rpm. This
period of time was quiet enough to allow efficient interaction capability between DOX, TPP and
the polymers.
Figure 2.5: illustrative scheme for encapsulation of DOX inside PEGylated CS NPs
Finally, the polyanion TPP was added to the four solutions in order to allow sufficient cross-linking
between DOX and the other polymers. The solutions were kept mixing under mild stirring
conditions within a speed 250 rpm for 30 min. The formation of white turbid clouds inside the
three solutions appeared instantaneously upon drop-wise addition of TPP under these mild stirring
conditions. These whitish clouds, simply, represent aggregates of DOX loaded PEGylated CS NPs.
These clouds were kept in light protected conditions to avoid photo-degradation of any remaining
DOX.
The formulated CS NPs were directly separated by using centrifuging parameters at 10,000 rpm
for 30 min using HERMLE Labotechnic 36 HK (Germany) in order to be ready for further analysis
and testing. The sedimented NPs required considerable multiple washing in order to ensure
collecting pure DOX loaded CS NPs without any residue or unreacted chemicals. The unused
supernatant was analyzed each time for measuring the amount of non-encapsulated DOX. CARY
500 SCAN varian (Hi-tech, NJ, USA) UV-VIS spectrophotometer was used for characterizing the

52
presence of DOX in the produced supernatants. The instrumental response for the supernatant at
each round was plotted against the previously and basically issued regression equation of
calibration curve of DOX.
The fresh isolated pellets of DOX loaded CS NPs were divided into two main parts. The first part
had vigorous mixing or redispersion of these formulated nanoparticles in a fresh media, like
distilled water, using ultrasonic probe sonicator; Ploytron (Thermo Fisher, USA). The applied
sonication parameters were 50% Amplitude for 3-5 min. The sonicated part of NPs was, then,
diluted with distilled water so as to provide a liquid nano-system with a concentration of 1mg/ml.
This DOX loaded CS NPs suspension was characterized later for particles’ surface morphology,
shape, size, distribution and zeta potential using TEM and DLS. The second part was characterized
for the chemical interaction between DOX with the applied polymers using FTIR (Thermo Fisher
Scientific Nicolet 380 Spectrophotometer, USA). For this purpose, the second part of the NPs
pellet was freeze-dried using BIOBASE freeze drier (Jinan, China) (see appendix SI 4.2).
2.6. Conjugation of Monoclonal Antibodies (mAbs):
Attaching biological ligands to the surfaces of the nanoparticles was expected in enhance the
specificity and sensitivity of the entire nanocarrier. Anti-Human Epidermal Growth Factor
Receptors (Anti-HER2) and Anti Human Mammaglobin antibody (Anti-hMAM) have been
suggested to be used as the targeting moieties. Such conjugation my promote the cancerous
endocytosis and cancerous sell uptake. In turn, it may minimize the normal cells attachment. This
has been expected to decrease the systemic adverse drug reactions that are of the entrapped DOX
drug and minimize its oxidative cardiotoxicity. The conjugation of the mAbs has been done
according to collected procedure using some previous reports (130, 131).
In this sense, after selecting the nano-formula with 5 Ug/ml Loaded DOX, the nanoparticles have
been freeze dried. EDC has been used to activate the COOH gp on the surfaces of DOX loaded
PEGylated CSNP. After around 15 minutes slight mixing, centrifugation of the solution has
resulted in a pellet of nanoparticles that have activated COOH group on the surface. BPS has been
used for washing the nanoparticles to remove the excess EDC. On the other side, mAbs has been

53
shacked with micropipette and then was introduced to the nanoparticles mixed with EDC. EDC is
extremely hygroscopic; therefore, its storage should be highly considered (132).
Then mAbs have been mixed to the COOH activated nanoparticles. They have been left on the
orbital shaker with slight speed of 150 RPM for 2 hours. Then the two samples with two separates
different mAbs have been centrifuged at 20,000 RPM for 30 minutes. Then PBS has been used for
washing for 2 times at least with 5 minutes centrifuging at 8000 RPM. The resulted pellet has
been resuspended in fresh PBS with slight shaking in order to resuspend the nanoparticles with
surface conjugated mAbs. The ratios between the chemicals were different. For instance, the ratio
between EDC to the nanoparticles was 5:1 and the ratio between nanoparticles and mAbs was
1:50. HNMR spectrum and FTIR spectrum have been conducted to ensure the surface conjugation
of these mAbs. Besides, TEM imaging have been conducted as well in order for confirming the
surface decoration and spherical shape of the resulted nano-systems.
Degree of substitution (DS) = 𝑀𝑜𝑑(COOH)
𝑇𝑜𝑡 (COOH) × 100 ……. Eq. (2.1) (246)
2.7. Characterization of CSNPs, PEGylated CSNPs and DOX loaded
PEGylated CSNPs:
2.7.1. Dynamic light scattering (DLS):
The main application of criteria of the NPs were the smallest size, least aggregation tendency and
smallest PDI value as measured by Dynamic light scattering (DLS) enhanced Zeta sizer
instrument. The concentration of all different samples was kept constant at 1mg/ml.
2.7.2. Electrophoretic light scattering:
In the current study, we mainly used zeta potential analysis during different phases of the study in
order for investigating the surface charges of the resulted CS NPs, PEGylated CS NPs and DOX
loaded CSNPs. Any variation in the surface zeta potential indicated a change in the surface
structure, which was a good indicator of surface attachment and hence the charge density would

54
be affected with that attachment and the stability rate of the prepared NPs. The higher the value of
zeta potential, whether positive or negative, the higher the tendency of the colloidal dispersion to
resist particles attraction or aggregation. The information obtained from zeta potential analysis
have had a good directionality of which sample will be more stable and more efficient to be a
platform for DOX drug delivery.
2.7.3. Fourier transform Infrared (FTIR) spectroscopy:
FTIR spectroscopy was applied using FTIR (Thermo Fisher Scientific, Nicolet 380)
spectrophotometer to develop a graphical fingerprint of the chemical structures of the control
nanoparticulate samples (CS, TPP and PEG), to be compared with the prepared nano-formulations
including CS NPs, PEGylated CS NPs and DOX loaded CS NPs. The samples were lyophilized
for at least 72 hours under -60 C temperature. Then KBr was used with all samples to prepare the
sample pellet. KBr was lyophilized first in order not to affect the sample absorbance since KBr is
optically transparent, and acts as inactive sample carrier within the IR region (133).
2.7.4. X-Ray Diffraction Spectroscopy:
XRD spectroscopy analysis were carried out using Bruker D8 (MS, USA) in order to investigate
the internal crystalline structures of all samples including the cross-linked CS NPs, and PEGylated
CS NPs. The linkage of some polymers like TPP and PEG would provide some effect on the entire
crystalline structure of CS. Therefore, the entrapment efficiency of these polymers would be shown
with XRD analysis.
2.7.5. Scanning Electron Microscopy (SEM):
The particle’s morphology and size of the produced NPs with attachment of PEG were
characterized by using SEM. The primary characterization of CSNP and PEGylated CSNP was
done with an oven dried sample. These samples were diluted as 1mg/mL, and then moved to a
spread aluminum sheet, over which it was dried at 60C temperature for 10 min. After drying, the
sample was gold sputtered for 15 min so that the surface of the sample become conductive and,
hence, interact with the bombarded electrons and also to enhance the resolution and quality of the
images.

55
2.7.6. Transmission Electron Microscopy (TEM):
TEM analysis were performed using Ultra-High Resolution schotty Transmission Electron
Microscope SU 7000. The preparation of TEM sample was done with diluting the prepared
solutions to 0.02 mg/mL. Three different types of samples; CS NPs, PEGylated CS NPs and DOX
loaded PEGylated CS NPs were prepared. The provided information by TEM images was related
to the morphology, topography, size and particle distribution was helpful to show the successful
attachment of PEG and DOX. One drop of the diluted sample was dried and dyed with
phosphotungestin dye to keep the surface of the nanoparticles conductive; and therefore, the
electrons can be captured easily resulting in better image resolution.
2.7.7. UV-Vis Spectroscopy:
UV-Vis spectroscopy analysis were performed using CARY500 SCAN Varian UV-VIS
spectrometer (Hi-tech, NJ, USA) for different characterizations analysis that were related to DOX
concentrations. First, a calibration curve of 6 different concentration of DOX aqueous solution
using deionized water was plotted. Then, the absorbance of the unloaded free DOX that was
measured in the supernatant of DOX loaded CSNP preparation was determined at wavelength of
480 nm using clear quartz processing cell. This allowed the determination of the loading capacity
of such NPs relative to very minute concentrations of DOX that were reaching few micro liters.
Besides, the release profile of DOX loaded CS NPs has been detected with the same UV
spectrophotometer. PEGylated CS NPs was used as a black. The scattering of UV-Vis light beam
that was done by such PEGylated CSNP solution was excluded. Moreover, the UV-Vis absorption
of many different samples with various concentrations that were related to various time slots were
analyzed in order to reveal the releasing behavior of the nano formulations.
2.8. Drug Loading, Release Profile and Stability of NPs:
2.8.1. Drug loading:
Loading of DOX to PEGylated CS NPs was performed using different weights of DOX; 0.125 mg,
0.25 mg, 0.5 mg and 1 mg in order to define the most suitable drug concentration that could achieve
the best loading capacity. DOX loaded PEGylated CS NPs were dissolved in PBS medium and
kept on stirrer for 24 hours at 100 rpm. This was done within light protected environment under

56
ambient temperature. Thereafter, the DOX loaded NPs were centrifuged at 20,000 RPM for 30
min under 4 ºC temperature. The concentration of free DOX drug in the supernatant layer was
detected using UV-Vis spectroscopic analysis at wavelength of 482 nm. Drug loading capacity has
been detected using the given equation (Eq. 2.2).
Loading capacity (LC%) = (𝑇𝑜𝑡𝑎𝑙 𝑑𝑟𝑢𝑔 𝑎𝑑𝑑𝑒𝑑−𝑑𝑟𝑢𝑔 𝑖𝑛 𝑠𝑢𝑝𝑒𝑟𝑛𝑎𝑡𝑎𝑛𝑡)
𝑊𝑒𝑖𝑔ℎ𝑡 𝑜𝑓 𝑛𝑎𝑛𝑜𝑝𝑎𝑟𝑡𝑖𝑐𝑙𝑒𝑠 × 100 …... Eq. (2.2) (134)
Encapsulation efficiency =(𝑇𝑜𝑡𝑎𝑙 𝑑𝑟𝑢𝑔 𝑎𝑑𝑑𝑒𝑑−𝑑𝑟𝑢𝑔 𝑖𝑛 𝑠𝑢𝑝𝑒𝑟𝑛𝑎𝑡𝑎𝑛𝑡)
𝑇𝑜𝑡𝑎𝑙 𝑑𝑟𝑢𝑔 𝑎𝑑𝑑𝑒𝑑 × 100 …….Eq. (2.3) (134)
2.8.2. Swelling test:
CSNP has been shown by many studies to have a swelling tendency which may differ according
to the pH of the dispersive media (135). Swelling test in the current study has been performed in
order to assess the influence of various pH levels on the swelling of the DOX loaded PEGylated
CSNP and predict their effect on the entrapped drug. Therefore, swelling indices have been
calculated for the nanoparticles in two different pH media; 6.6 and 7.4. These two specific pH
media are two model values that are related to the breast tumor pH and normal blood pH levels
respectively (136). Swelling index has been obtained using the given equation Eq. (2.4), where Sw
is the swelling of the nanoparticles after time t, Wo is the weight of nanoparticles before incubation
or in a dry form and Wt is the weight of nanoparticles after time t or after incubation time.
% Sw =Wt −W0
W0 × 100 ……. Eq. )2.4) (137)
2.8.3. Stability of DOX PEGylated CS NPs:
The highest LC% of DOX was determined from the previous experiments. Thereafter, the stability
profile of the highest DOX loaded sample was investigated. The stability of the samples was
confirmed after incubation in BPS of pH 7.4 for two weeks at 37 ºC. UV-Vis spectroscopy was
applied to detect the release profile of DOX by measuring its concentration at wavelength of 480
nm.

57
2.8.4. Drug Release Profile:
Release profile of the highest DOX loaded PEGylated CS NPs was studied. The sample was tested
in two different pH media. The first one mimicking the normal blood circulatory pH 7.4, while the
second one was mimicking the tumor microenvironment pH 6.6. The samples were kept inside the
incubator for around 72 hours at 37 ºC temperature. Within various time intervals, the
concentration of the released DOX was determined by using UV-Vis spectroscopy as well at
wavelength of 480 nm. The applied time slots were (1, 3, 6, 9, 12, 18. 24, 36, 48 and 72) hours.
Re-compensation for the withdrawn amount with another fresh media was carried out.
2.9. Cell culture analysis:
2.9.1. Cell line maintenance:
The anticancer activity of the fabricated CS NPs, CS NPs-PEG, and CS NPs/DOX was analysed
in-vitro against human isolated breast cancer cell line (MCF-7) and a normal mouse fibroblast cell
line (L929). The cell lines were propagated as a monolayer separately in DMEM. They were
passaged three times per week in 75 cm2 cell culture flasks and safely incubated at 37°C in 5%
CO2 incubator. Regular cell detachment was proceeded before passaging times and the specified
MTT assays using trypsin (0.25%) containing 0.1% EDTA. Trypan blue has been applied in cell
counting using hemocytometer.
2.9.2. Direct Cytotoxicity (MTT assay):
The anticancer property of DOX before and after encapsulation inside CS NPs against MCF-7
cells and the cyto-compatibility of fabricated samples against L-929 cells were investigated based
on ISO10993-5 standard procedure (138). Colorimetric 3-(4,5-Dimethylthiazol-2-yl)-2,5-
diphenyltetrazolium bromide dye analysis (MTT cell viability analysis) has been used to detect the
viability profile of both types of cells with 24 hrs incubation in a 96 well plate. In order to attain a
semi-confluent cell growth after 24 hrs; MCF-7 cells seeded at density of 25 × 103 cells/well, while
L-929 cells seeded at density of 3 × 10³ cells/ well in 96 well plate. Following that, a direct addition
of 50 ul/well from previously prepared serial dilutions of CS NPs, CS NPs-PEG, and CS NPs/DOX
(1.25, 2.5, 5 and 10) µg/ mL. After 24 hrs, MTT reagent has been used to replace the media with
1 mg/ml conc. The replacing volume was 100 µl that has been incubated for 4 hours. PBS was
used for washing and removal of MTT medium. This washing process was done tow times. 100

58
µl of 100% DMSO was applied in order to dissolve insoluble Formazan crystalline products, that
are expected to be cytotoxic and damaging to the cells. A microplate reader (SPECTROstar Nano,
BMG LABTECH, Germany) has been used at Abs of 570 nm to detect the cell viability. Control
sample has showed 100% viability, while the viability of the remaining wells has been identified
using Eq. (2.5)
Cell Viability Rate =Sample ABS
Control ABS × 100 ……. Eq. (2.5) (139)
2.10. Theoretical background:
2.10.1. Zeta-Sizer and Zeta-Potential (MALVERN) :
This is a main dual systematic instrument that includes both dynamic light scattering (DLS) that
is used to assess the nanoparticle’s sizes and distribution, and electrophoretic light scattering (ELS)
that is used to determine the surface charge of a particles within a solution medium.
Figure 2.6: Systematic setup of the basic principle for dynamic light scattering with detecting different scattering
angles of the laser beam (140)
The basic principle of DLS is simple as a monochromatic laser beam is directed towards the sample
cuvette. When the incident laser beam illuminates the particles in the cuvette, it gets scattered in
all directions. A photon detector is used to receive the scattered light beam at a certain scattering
angle . In another words, when the particles scatter the laser beam, they provide information about
their size, motion and distribution. Physically, the scattering is related to the hydrodynamic radius

59
(Rh) of the particles (141). The correlation of the laser scattering intensity is done through software
analysis or the digital correlator as shown in the DLS scheme in Figure (2.7).
Figure 2.7: Illustrative description of different components of dynamic light scattering instrument (141)
By defining the diffusion parameters from Eq. (2.6), we can calculate the hydrodynamic radius Rh
that corresponds to the particles size. D represents diffusion coefficient, kB represents Boltzmann
constant, while T is the temperature and n is the sample viscosity of the sample. By defining such
parameters, we can calculate the. The concentration of the sample should be very low, because
this equation is valid for single scattered light. When sample’s concentration is too high, multiple
scattering occur and this equation become invalid.
……… Eq. (2.6) (143)
The surface charge of any nanoparticle is a key indicator of the aggregation or stability tendency.
Zeta potential represent the electro-kinetic potential of nanoparticles or any other particles in
general within a colloidal system. The higher the charge value on the particles surface, the more
stability suspension or colloidal system.
The electrophoretic light scattering instrument is processing with an electric field is applied the
sample cell. This electric filed cause the particles to move because of the interaction between them.
Through this interaction between the particles and the applied field, they acquire some charge.
This charge affects the speed and direction of particles movement. Besides, the strength of the

60
applied electrical field and the nature of the colloidal medium are two important factors also that
affect them (144).
(A) (B)
Figure 2.8: Schematic diagram showing the principle of electrophoretic light scattering with a multiple layer of
illustrative charged layers (A), and the shape of the sample cell kit (B) (144)
2.10.2. Fourier Transform Infrared (FTIR) Spectroscopy:
It is one of the well-known analytical techniques that is mainly used to characterize various
materials types including organic, in-organic and polymeric chemical materials. The change in the
surface structure or surface functional group(s) can be monitored and analyzed by FTIR. This
allow us to understand the significant change of the physico-chemical properties of the material
after addition of certain polymer or chemical substance to the surface or the core of the main
material. Besides, the durability and structural stability of a material can be another feature that
can be easily monitored through FTIR (145).
Some characteristic structural moieties of a chemical material can be represented in a specific
pattern within a certain range of infra-red absorbance value. Analytically, the ability of these
moieties to absorb the incident infra-red spectrum in the range of 400 to 4000 provide a graphical
analysis of the chemical information of the applied sample. through FTIR, we can also release a
chemical comparison between the polymerized material and the original or the standard ones
through the intensity, position and behavior of the absorption peaks. It can be used, also, to identify
material’s decomposition, oxidation, deterioration or any undesired contaminants. Therefore,

61
FTIR can provide a rigid justification that supports a successful change in the chemical and
physical properties of the applied material (146).
Figure 2.9: schematic representation of the FTIR working principle (147)
The working principle of FTIR is mainly focusing on the interaction between the sample material
and a light source within the infrared region in a surrounding electromagnetic field. Once the
sample disc is subjected to the IR light, it absorbs the light and get excited. The inner structural
molecules are excited also and moving to a higher vibrational level at a certain frequency. The
energy difference between the ground energy level and excitation level is basically equal to the
light energy that the molecules have absorbed.
Light is sent to the sample through an instrumental device called interferometer. The IR radiation
is sent to the sample material through a beam splitter. As a result, the radiation light is divided into
two halves. The first one is going to a fixed mirror, while the second half is going to a continuously
moving mirror. Then the two split beams recombine again at the detector and pass through the
sample again. In this case, the sample absorb all characteristic wavelengths, in an interference
pattern, from the interferogram. The energy variation is detected through the detector which read
it versus time. Through Fourier Transform mathematical technique, a software generated
procedure provides a relationship between time and frequency. This relationship is identified later

62
with against referenced libraries that develop the spectrum information of the sample that is
considered as a fingerprint for such specific material (148).
2.10.3. X-ray diffraction:
X-ray diffraction is advanced new characterization techniques that is used to analyze a crystalline
material and studying its atomic spacing as well. Besides three-dimension structural analysis, XRD
is efficient also to study a unit cell dimensions. XRD is mainly based on the interaction between
X-rays and a crystalline sample. the main source of X-rays emission is a cathode ray tube that is
directed to the sample with a monochromatic radiation pattern. When the X-rays hit the powdered
sample, it diffracts with a diffraction angle (149). This constructive interference and the
relationship between the angle of diffraction and the electromagnetic radiation wavelength is
expressed as Bragg’s law that is shown in (figure 2.10) and Eq.2.
nλ=2d sin θ. …… Eq. (2.7) (150)
Where θ is the scattering angle or the angle between the incident X-ray beam and the lattice plane,
is the wavelength of the incident electromagnetic waves, d is the interplanar distance (Figure
2.10). n represents the positive integer factor or the order of reflection.
Figure 2.10: illustrative scheme of X-ray diffraction with diffraction angle θ (Bragg’s law) (151)
The X-ray cathode tube produces an X-ray beam by heating the filament of the tube that produces
a series of electrons. These electrons are directed towards the sample material and accelerated by

63
applying voltage. These electrons are going to bombard the sample and expel its inner shell
electrons as shown in (figure 2.11). In order to do that, the incident electrons must have sufficient
high energy. By dislodging the inner shell electrons, X-ray is emitted. A crystal monochromator
is used to produce monochromatic rays. As the sample and X-ray detector are rotated, the
diffracted emissions are recorded by the processing detector. When the dimensional arrangement
of the incident rays satisfies Bragg’s law, the detector record the signal and convert it to
mathematical counts that is illustrated through a computer monitor (152).
Figure 2.11: X-ray beam bombarding the Inner shell electrons (152)
2.10.4. Ultra-Violet / Visible Spectroscopy:
UV-Vis spectroscopy is a frequently used characterization analyses that mainly target the optical
properties of different samples. Through this analysis technique, we can develop qualitative and
quantitative analysis, detect the presence of undesired impurities and detect the presence or
absence of certain compositional functional groups. Generally, the electromagnetic spectrum of
sunlight consists of a range of radiation regions including the UV-Vis region which is located at
the range of 210-900 nm. The interaction of the sample to light in this region is the principle
source of UV-Vis spectroscopic analysis. When light hit the sample’s molecules, the atomic
electronic transition takes place immediately between different energy levels or, typically, from
the higher occupied molecular orbital (HUMO) or ground state to lower unoccupied molecular
orbital (LUMO) or excited state as shown in (figure 2.12). This intermolecular transition is
accompanied by absorption of electromagnetic radiation in this region.

64
Figure 2.12: The electronic excitation by absorbing high energy UV light spectrum (153)
HUMO and LUMO orbitals are called also bonding shells and antibonding shells, and the
difference between them is known as band gap. In order for absorption to take place, the UV light
photons must have energy amount that matches to this band gap. In this concern, different
molecules will definitely have different band gap energies and, therefore, will have different
absorption spectra. Once the sample was hit with a beam of UV light, it absorbs part of it and the
intensity of the released beam will exponentially decreased as shown in (figure 2.13) and
absorbance equation Eq. (6). However, the transmittance has the same relationship between the
incident light (Iº) and the transmitted light (I), but absorbance is the counteractive principle of
transmittance.
𝑇 = 𝐼/𝐼° …….. Eq. (2.8) (154)
𝐴 = log 10 𝐼°
𝐼 ……… Eq. (2.9) (154)

65
Figure 2.13: The transmittance of UV light beam through a sample (154)
UV-VIS spectroscopy is mainly based on the ability of measuring the spectrum of a certain sample
containing chromophore or light absorbing molecules. This allow us to obtain a graphical
relationship between the wavelength or frequency at which light is absorbed, and the absorption
rate that is detected by the amount of chromophore exist in the sample. therefore, the higher the
amount of this chromophore in the applied sample, the more dense the amount of the absorbed
light. This relationship reveals another direct relationship between the sample concentration and
wavelength or frequency of the emitted UV light. Beer’s Lambart law has exploited this optical
relationship in order to develop a linear relationship between concentration and absorbance as
shown in Eq (7).
𝐴 = ℰ 𝑐 𝑙 ……… Eq. (2.10) (155)
A: the absorbance
ℰ: absorption coefficient
c: molar concentration of the solute
l: path length
This equation (Beer’s Lambart law) can be used analytically to relates the concentration of a
substance in a sample to the color intensity of the same sample. when we have large number of
samples and different concentration in each sample, we can use the developed linear relationship
that this law provides. However, we need first to issue a calibration curve. This calibration or

66
regression curve is based on plotting 3 to 4 concentrations of the sample and getting their
corresponding absorbance values. This plot will work as a reference from which we can obtain the
concentration of any unknown concentration of the same sample (155).
Figure 2.14: schematic representation of UV-VIS spectrometer principle (154)
2.10.5. Scanning Electron Microscopy (SEM):
SEM is a powerful and reliable analysis techniques that is used for imaging samples. This
technique is much advanced than simple light microscope since it uses electrons to image the
sample unlike light microscope that use light. The wavelength of electrons is much smaller than
that of light, therefore the magnification and resolution of SEM is more preferred than traditional
light microscope. SEM provides such electron-oriented magnification through the use of a set of
coils that scan the electrons bombarded from the sample (156).
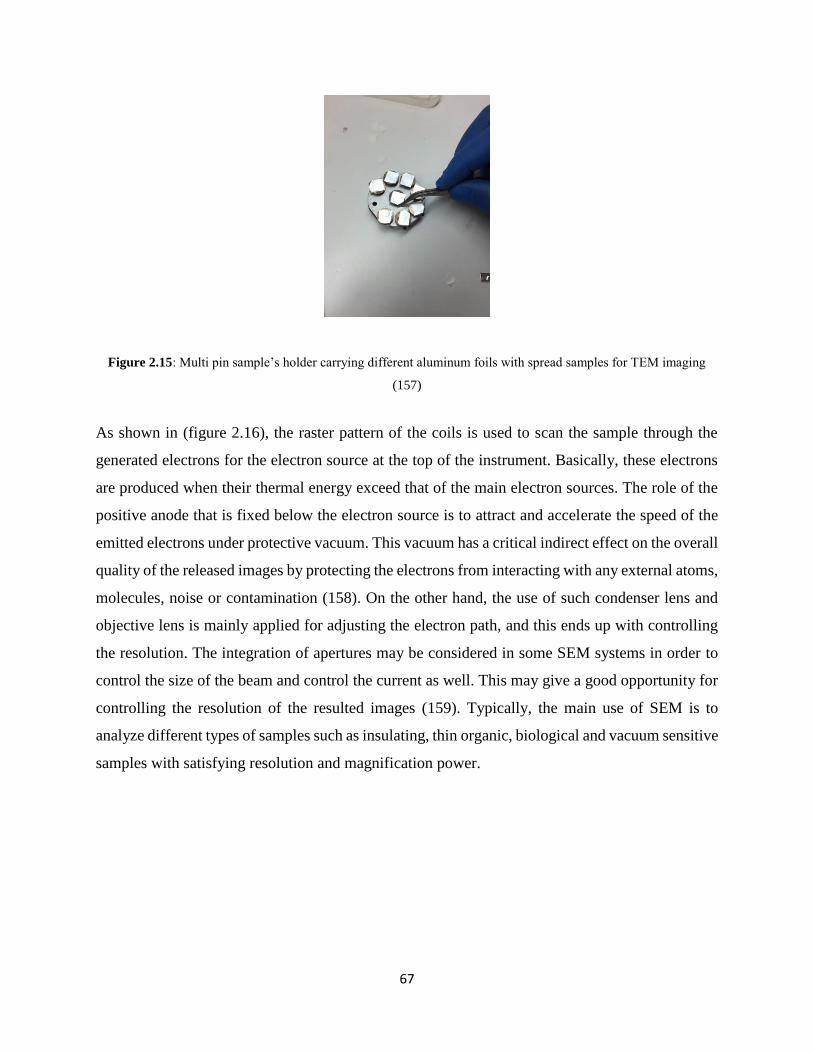
67
Figure 2.15: Multi pin sample’s holder carrying different aluminum foils with spread samples for TEM imaging
(157)
As shown in (figure 2.16), the raster pattern of the coils is used to scan the sample through the
generated electrons for the electron source at the top of the instrument. Basically, these electrons
are produced when their thermal energy exceed that of the main electron sources. The role of the
positive anode that is fixed below the electron source is to attract and accelerate the speed of the
emitted electrons under protective vacuum. This vacuum has a critical indirect effect on the overall
quality of the released images by protecting the electrons from interacting with any external atoms,
molecules, noise or contamination (158). On the other hand, the use of such condenser lens and
objective lens is mainly applied for adjusting the electron path, and this ends up with controlling
the resolution. The integration of apertures may be considered in some SEM systems in order to
control the size of the beam and control the current as well. This may give a good opportunity for
controlling the resolution of the resulted images (159). Typically, the main use of SEM is to
analyze different types of samples such as insulating, thin organic, biological and vacuum sensitive
samples with satisfying resolution and magnification power.

68
Figure 2.16: Illustrative description of SEM unite with variable (160)
2.10.6. Transmission Electron Microscopy (TEM):
TEM is a powerful and versatile tool for imaging of many different types of samples. It is widely
used in biological fields, forensic analysis, material sciences, medical and nanotechnology
applications. The main use of TEM is to provide some information about the crystalline structure,
size, particles distribution, morphological, chemical structure, structural defects and topographical
properties. Similar to SEM, the source of these information is basically dependent on the
interaction of the sample to a very high energy electron beam that is much stronger than SEM. The
electron beam is accelerated with applying voltage approximately more than 200Kv. The electrons
are accelerated to a very high speed near the speed of light. While the wavelength of the electrons
in the electron beam is million times shorter than normal electromagnetic wavelength of light, the
spatial resolution and magnification quality of TEM images is much higher than normal light
microscopy (161).
TEM is operated in a similar process to the simple light microscope. However, TEM uses a stream
of electrons produced by an electron gun (figure 2.17) instead of using light source. The electron
beam is directed towards the sample in a very high speed that is enough to pass through the sample.
A primary condenser lens is used to focus the emitted electrons into a thin and coherent electron
beam. Once the electrons could pass through the sample, they are scattered. These scattered
electrons are then focused by an electromagnetic lens called objective lens. This lens focuses the
received electrons into an image that is transmitted through a projector lens. This projector lens is

69
used mainly to expand the electron beam into a monitor or camera supported projector so that the
image is seen by the user (162).
Figure 2.17: Schematic representation of the different components of TEM (163)
Table 2.4: comparison between TEM and SEM (162-164)
Item TEM SEM
Sample Very thin Thick and conductive
Resolution Very high, ~ 0.5 Aº High, ~ 0.5 nm
Electron beam Pass through the sample Surface analysis
Sample preparation Extensive Simple
Surface modification Dyeing Gold sputtering
Voltage Very high Medium

70
Chapter 3
Results and Discussion
Synthesis and Characterization of
PEGylated Chitosan /
Doxorubicin Nanoparticles
and Conjugated with Monoclonal
Antibodies for Breast Cancer Therapy

71
3.1. Preparation of CSNP:
In order to successfully prepare a conjugated drug delivery system that is effective against breast
cancer, CSNP have been used to encapsulate anticancer drug like DOX, and the nano-system was
further conjugated with monoclonal antibodies. Several parameters have been considered and
found to have considerable effects on the preparation of the final formulations such as: particles
size, size distribution, surface charge, stability in different pH media, surface functionalization,
physiological circulation time, biocompatibility, biodegradability, swelling matrix, and drug
diffusion rate. Ionotropic gelation method was used to prepare CSNP due to its efficiency and the
resulted high particles’ stability for longer periods (165).
3.1.1. Ionotropic Gelation:
As shown in Table (3.1), the integration of different concentrations of CS polymer and TPP, as a
cross-linker, for preparation of CSNP. TPP has been shown to be biologically safe, non-toxic and
non-carcinogenic owing to its hydrolyzed phosphate ions (166). The resulted CSNP in Table (3.2)
had various sizes and PDI values. Moreover, the final appearance of the formulated CSNP was
slightly different from each other. Some samples have shown whitish uniform colloidal systems
of suspended CSNP. While others have shown high tendencies of particles aggregation with
whitish turbid solution (112).
Table 3.1: Variation of sample formulas according to chitosan and TPP concentrations
TPP conc
(%)
Chitosan concentration (%)
0.05 0.1 0.5 1
0.1 S1 S2 S3 S4
0.3 S5 S6 S7 S8
0.5 S9 S10 S11 S12
0.7 S13 S14 S15 S16
The polymeric matrix of CSNP, by ionic gelation technique, is controlled and tunable through an
electrostatic interaction between (+vely) charged NH2+ from CS and (-vely) charged polyanions
from TPP (166). This gelling formation interaction has been found to be affected by the

72
concentrations of the two polymers, and the resulted particles sizes are, also, affected as shown in
Table (3.2).
Table 3.2: Particle size and distribution of different samples with various concentrations of TPP and chitosan
By demonstrating all of these previous results, sample 8 has been the sample of choice. It has
demonstrated the smallest size with acceptable poly dispersity index. The applied CS:TPP ratio has
been close to 3:1. The size of this sample has been 190 ± 5.6 with a good particle’s distribution of PDI
0.51 ± 0.002. Biologically, this size can develop many pharmacokinetic and therapeutic benefits
compared to larger sized drug carriers (112). Many factors have been shown to affect the size and PDI
of the resulted CSNP such as processing pH and deacetylation degree of CS (167). Therefore, the effect
of these parameters has been explored on this sample.
3.1.2. Factors affecting size of CSNP:
Figure 3.1: Effect of processing pH (A) and deacetylation degree (B) of CS on the size of CSNP
Sample Particle size (nm) PDI S1 3668.6 ± 967.6 0.31 ± 0.17 S2 4986 ± 1300 0.64 ± 0.07 S3 1607 ± 63.66 0.43 ± 0.01 S4 518.76 ± 28.28 0.86 ± 0.05 S5 1594.5 ± 195.8 0.86 ± 0.02 S6 3894 ± 376.7 0.69 ± 0.26 S7 1582.5 ± 228.3 1.37 ± 0.36 S8 190 ± 5.6 0.15 ± 0.02 S9 1979.5 ± 64.3 0.22 ± 0.05 S10 1895 ± 161.3 0.41 ± 0.07 S11 678.66 ± 15.02 0.85 ± 0.06 S12 690.9 ± 28.42 0.24 ± 0.02 S13 5645.3 ± 685.5 0.45 ± 0.11 S14 2362 ± 678.34 0.24 ± 0.06 S15 2265.6 ± 141.78 1.33 ± 0.31 S16 1300.6 ± 664.8 0.66 ± 0.32
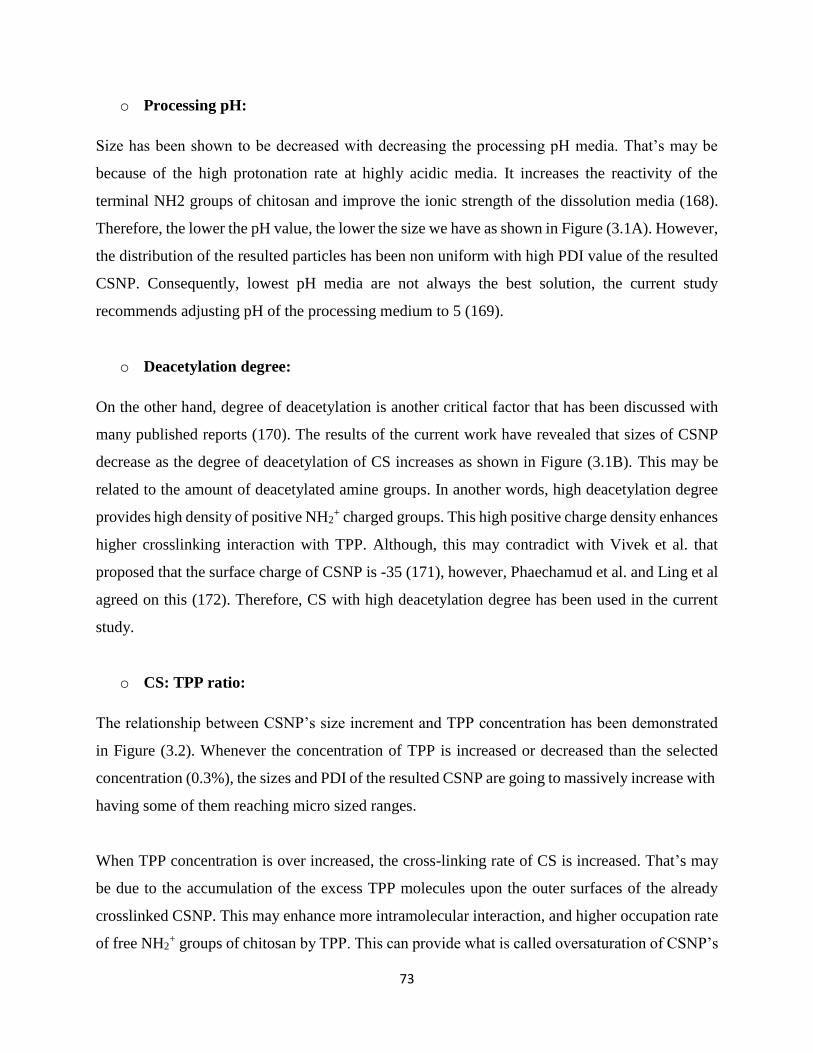
73
o Processing pH:
Size has been shown to be decreased with decreasing the processing pH media. That’s may be
because of the high protonation rate at highly acidic media. It increases the reactivity of the
terminal NH2 groups of chitosan and improve the ionic strength of the dissolution media (168).
Therefore, the lower the pH value, the lower the size we have as shown in Figure (3.1A). However,
the distribution of the resulted particles has been non uniform with high PDI value of the resulted
CSNP. Consequently, lowest pH media are not always the best solution, the current study
recommends adjusting pH of the processing medium to 5 (169).
o Deacetylation degree:
On the other hand, degree of deacetylation is another critical factor that has been discussed with
many published reports (170). The results of the current work have revealed that sizes of CSNP
decrease as the degree of deacetylation of CS increases as shown in Figure (3.1B). This may be
related to the amount of deacetylated amine groups. In another words, high deacetylation degree
provides high density of positive NH2+ charged groups. This high positive charge density enhances
higher crosslinking interaction with TPP. Although, this may contradict with Vivek et al. that
proposed that the surface charge of CSNP is -35 (171), however, Phaechamud et al. and Ling et al
agreed on this (172). Therefore, CS with high deacetylation degree has been used in the current
study.
o CS: TPP ratio:
The relationship between CSNP’s size increment and TPP concentration has been demonstrated
in Figure (3.2). Whenever the concentration of TPP is increased or decreased than the selected
concentration (0.3%), the sizes and PDI of the resulted CSNP are going to massively increase with
having some of them reaching micro sized ranges.
When TPP concentration is over increased, the cross-linking rate of CS is increased. That’s may
be due to the accumulation of the excess TPP molecules upon the outer surfaces of the already
crosslinked CSNP. This may enhance more intramolecular interaction, and higher occupation rate
of free NH2+ groups of chitosan by TPP. This can provide what is called oversaturation of CSNP’s

74
surface and become more reactive to proceed another cross-linking process. Therefore, the size
becomes greater
Figure 3.2: Effect of TPP concentration on the final size of CSNP
On the other side, at very lower TPP concentrations, the size of the crosslinked CSNP tends to
increase, and whitish turbid clouds are seen in the preparation media. At very high conc of CS
relative to lower TPP, neutralization of the protonated cationic NH2+ groups of CS by TPP is
decreased, and this led to higher sedimentation rate of chitosan polymer, especially, when chitosan
acidic solution is rich with acetic acid (113, 173). Therefore, the current work may conclude that
there is an optimum ration of CS: TPP which is expected to be near 3:1 (168).
3.1.3. Stability of the selected CSNP sample:
Surface charge of CSNP is a remarkable factor that is considered as an indicative factor of the
particle’s stability and their tendency to form aggregates. The colloidal suspending appearance of
CSNP is highly affected by the charge on their surfaces. This charge is influenced by the same
previous parameters (174, 175). In order to make sure of the surface stability of the selected CSNP
sample; S8, a three weeks stability profile has been developed as shown in Figure (3.3).

75
Figure 3.3: Stability profile of the selected CSNP sample; S8 for three weeks at pH 7.4
Furthermore, size stability profile has been confirmed with calculating size increment percentage,
which is an indication of size variation along the stability period of time. It has been calculated
according to the given equation (Eq.3.1). Owing to the high charge surface positive zeta potential
value of the selected CSNP sample with Zeta value of 42.8 mEv, the particles have been shown to
have a small size increment percentage as 8.9%. That because of a direct relationship between
having high zeta potential value and showing a good stability profile for longer time (166).
Size increment % =Size at the biginning −Size after 22 days
Size at the beginning × 100 ……. Eq. (166)
Finally, the size of the developed CSNP as drug carrier is a substantial factor that needs to be
studied very well before drug encapsulation or PEGylation process. This has a strong influence on
the efficiency of the developed drug delivery system. As the size of the nanoparticles decreases,
the drug cellular uptake increases. Besides, a direct relationship between nanoparticle size and
pharmacokinetic drug distribution is considered. Nanoparticles’ sizes below 100 nm have 6-fold
more cellular uptake rate than micro sized particles (177). Furthermore, CSNP within a size range
less than 200 nm provided more potent dosage forms than larger micro range particles. The
advantages of nanoparticles in this size ranges are enhanced muco-adhesion, biocompatibility,

76
increased therapeutic index, enhanced stability and less carcinogenicity. This has been consistent
with Pawar et al, that could achieve > 95% drug entrapment efficiency within a size range (100 –
200) nm (178). Therefore, the recommended size of the prepared CSNP in the current study has
been less than 200 nm.
3.2. PEGylation of CSNP:
Coating of the prepared CSNP’s surface with PEG has been reported in many studies showing
high NP surface stability and solubilization. The increased blood circulation time and
immunological RES resistance of CSNP that are coated with PEG is a guiding factor for seeking
PEGylation process. PEG aims to protect CSNP by blocking their surface positive charges that
can be included in the opsonization process by RES (179, 180).
Table 3.3: Size, PDI and zeta potential of PEGylated CSNPs
Samples Size PDI Zeta Pot.
Control (CSNP) 192 ± 4.1 0.19 ± 0.01 +43 ev ± 0.4
CSNP-PEG 1% 175 ±4.8 0.25 ± 0.03 + 41.8 ev ± 0.6
CSNP-PEG 5% 169 ± 5.8 0.15 ±0.01 + 35.6 ev ± 1.1
CSNP-PEG 10% 173 ± 2.9 0.21 ± 0.02 + 39 ev± 1.2
Table (3.3) provides the results of PEGylation process using various concentrations of PEG; 1%,
5% and 10%. The resulted PEGylated CSNP have had various sizes, PDI and zeta potential values.
The surprising observation about the PEGylated CSNP is that their sizes were found to be smaller
than those free non-PEGylated CSNP by 8.7%, 12% and 9.8% respectively. This can be
demonstrated by the effect of PEG surface brushes acting as colloidal stabilizer on CSNP surfaces.
Moreover, the polymeric layer of PEG has provided “stearic stability” upon conjugation to the
surface of CSNP. This has affected their size, PDI and surface zeta potential values (181).
PEG forms an internal structural network with chitosan which is known as semi interpenetrating
network (IPN) (112). This network has been proposed to be formulated during crosslinking of
chitosan. It can increase the stabilization and compactness of the surfaces of CSNP. Therefore,

77
their sizes and surfaces charges decrease after PEGylation. Besides, zeta potential value of CSNP
has decreased because of the attribution of blocking surface terminal NH2+ groups of chitosan and,
thereby, decreasing their zeta potential values (182).
The recommended PEG surface coverage with PEG conjugation has been attributed to 5% PEG
concentration. The resulted nanoparticles have had lower size than 1% and 10% PEG
concentrations. Besides, the particles distribution and surface charge values of the selected PEG
concentration have pointed out its tendency to be stable. Assuming that further increase in PEG
concentration can destabilize the nanoparticles due to the repulsive behaviors of the neighboring
PEG chains (183). Further stability profile of the three PEG concentrations has been conducted in
the current study as illustrated in Figure (3.4). PEGylated CSNP that have 5% PEG has been the
most stable as referred by the blue arrow. While those with 10% PEG and 1% PEG were less
stable.
Figure 3.4: stability profile of PEGylated and non-Pegylated CSNP
Basically, it is very rational to give high concern to surface stability issue of the PEGylated CSNP.
Verreechia et al. has indicated its pharmacokinetic preference towards PEGylated CSNP with

78
stable surface conjugated PEG. The study has reported that PEGylated CSNP have higher blood
plasma level with lower hepatic execration rates compared to non-PEGylated ones (184).
The developed system in the current work tend to be positively charged, that aims to enhance its
later electrostatic interaction to further tumor cells in the coming stages of the study. Generally,
positive nano-carrier systems are not biologically favored, because they are easy to be captured by
phagocytes and RES. Besides, they initiate electrostatic interaction with negative blood proteins
(185). Furthermore, thrombogenic embolization and blood hemolysis are two adverse reactions
that are expected to be initiated by positive systems.
Therefore, grafting PEG can promote the biological safety and circulatory retention time of CSNP
without casing such toxic adverse blood reactions. Furthermore, PEGylation improves the
uniqueness of CSNP as an ideal nano carrier for later chemotherapeutic DOX encapsulation
process. For instance, Clin et al. has reported higher liposomal accumulation of PEGylated DOX
liposomes within a tumor area than non-PEGylated ones (186). This may affect the cancerous
cellular drug uptake.

79
Figure 3.5: XRD pattern of Chitosan powder, CSNP and PEGylated CSNP
The conjugation reaction or PEGylation of CSNP could be confirmed through XRD patterns of
CS, CSNP, PEG, PEGylated CSNP as shown in Figure (3.5). Basically, this conjugation has been
formulated between the amino group NH2+ group from chitosan and C-O-C of PEG (187). This is
in agreement with Calvo et al. that assumes, also, inter and intra molecular H-bonding between CS
and PEG (112). The patterns show some representative peaks which indicates the crystalline
behaviors of the tested structures. Chitosan powder, for instance, has two characteristic peaks at
the angles of 21º and 10º as shown in the diffractogram, this demonstrated a high degree of
crystallinity (188).
On the other side, the diffractogram of CSNP shows no peaks, which is an indication of the
destroyed crystalline structure of chitosan by TPP entry. This is related to the amorphous structure
of CSNP which is composed of dense of cross linked counterions (188). In the diffractogram of

80
PEGylated CSNP, the peak at 2θ of 10 º has been diminished. This is related to the decreased
crystallinity of CSNP by the entry of PEG. The pattern of PEG has surpassed that of chitosan with
its characteristic peaks at 19.12 º and 23.1 º, and this resulted in peaks shifting (189). Therefore,
there is a good evidence for the efficient PEGylation of CSNP.
CSNP could maintain their spherical morphological shape after grafting of PEG on their surfaces.
The PEGylation layer have demonstrated a brush like structure that surrounded CSNP. This has
been confirmed with TEM pictures of both PEGylated; Figure (3.2 B and D) and non-PEGylated
CSNP; Figure (3.6 A and C).
B A

81
Figure 3.6: TEM image of Pegylated CSNP (B and D), non-PEGylated CSNP (A and C) and schematic illustration
of the PEG layer that surround CSNP (E)
3.3. Encapsulation of Doxorubicin:
Doxorubicin has been selected as effective chemotherapeutic agent against all different types of
breast cancer including both solid and soft tumors (190). DOX has been encapsulated successfully
within the PEGylated CSNP via a pre-crosslinking entrapment. In other words, DOX has been
introduced into CS-PEG solution before drop wise addition of TPP solution. Achieving good
encapsulation with lower drug leakage has been fairly expected by the presence of PEG stabilizer.
This enhances initiation of intramolecular hydrogen bonding between DOX and the reacting
polymers (191).
Slight mixing has been required besides pH adjustment from 5 to 6.5. This is assumed to enhance
the entrapment of DOX inside the polymeric matrix. Both factors; the deprotonation pka of
chitosan at 6.6, besides the hydrophilic nature of DOX promote more intracellular hydrogen
interactions (192). Coinciding with that, PEG brushes are being maintained in order for enhancing
the system biocompatibility (193). Non-covalent interaction is therapeutically more preferred than
covenant entrapment (194). covalent interaction in a biological drug delivery system is more
difficult to manage or predict
3.3.1. DOX Standard Curve:
Experimentally, variable concentrations of DOX have been fed in order to evaluate the highest
loading and entrapment content of DOX; 1.25 µg/mL, 2.5 µg/mL, 5 µg/mL and 10 µg/mL. This
has required a prior quantification of DOX, that has been issued by plotting its calibration curve.
E

82
UV-VIS spectrophotometer has been used to detect the absorbance values of the prepared known
concentrations of DOX. The plotted concentrations have been as following; 1 µg/mL, 10 µg/mL,
30 µg/mL, 50 µg/mL, 70 µg/mL and 90 µg/mL. The linear pattern of the graph has been translated
into a fitting regression equation as shown in Figure (3.3) and Eq 3.2.
Y= 8.05 X – 0.0245 ……. Eq. (3.2)
Figure 3.7: standard calibration curve of DOX in PBS
3.3.2. DOX Loading Capacity (LC%) and Encapsulation Efficiency (EE%):
On the other hand, the resulted DOX loaded PEGylated CSNP have been analyzed with DLS in
order for detecting the modification effect of DOX entrapment on the size, PDI and zeta potential
values of the nanoparticles. Table (3.4) shows the results of all prepared formulations. The sizes
of the resulted formulations have been slightly smaller than the PEGylated CSNP. Besides, the
surface net charge values have been slightly lower also. Based on this two information, this slight
change in size and surface charge may be attributed to the entrapped amount of DOX (97).

83
Table 3.4: DLS analysis of DOX loaded and unloaded CSNP
Nano-formulation Size PDI Zeta Pot.
CSNP 195.4 ± 3.8 0.22 ± 0.005 + 42.5 mV± 1.3
CSNP - PEG 188.6 ± 0.5 0.19 ± 0.002 + 38.4 mV± 3.8
CSNP- PEG - DOX 1.25 µg/ml
mg
177.8 ± 2.6 0.18 ± 0.002 + 35 mV ± 1.6
CSNP-PEG - DOX 2.45 µg/ml 180.6 ± 4.3 0.20 ± 0.008 + 33.4 mV ± 0.9
CSNP-PEG – DOX 5 µg/ml 178.5 ± 4.7 0.21 ± 0.006 + 34.6 mV ± 2.6
CSNP-PEG – DOX 10 µg/ml 176 ± 5.7 0.22 ± 0.005 + 33.6 mV± 3.59
The LC% and EE% are two main important parameters that define the efficacy of the entire drug
delivery nano-carrier system. The results are given in averages of triplicate experimented values.
As showed in Table (3.5), the LC% and EE% are independent from each other. They continued to
increase gradually with increasing the fed DOX concentration, till certain concentration (10 µg/ml)
then decreased. At this point the internal chitosan network has been saturated with DOX, besides,
the drug has reached its saturation solubility (102). Therefore, higher drug concentrations are
expected to be eluted in the loading supernatant media (196).
Table 3.5: Resulted LC% and EE% of different DOX-PEGylated CSNP at different drug concentrations
Drug formula LC% EE%
1.25 µg/ml 0. 033 % 71.44 %
2.45 µg/ml 0.08 % 77.5 %
5 µg/ml 0.114 % 80.4 %
10 µg/ml 0. 09 % 78.5 %
The potentials of PEGylated CSNP to load such DOX concentrations are proposed to be dependent
on its internal spacing structure besides capillary forces (197). When the initial fed DOX,
concentrations have been compared to the calculated loaded amounts, 5 Ug/ml concentration has
been selected as the highest LC% and EE%, for the following experiments (101, 198).
Furthermore, the cell viability tests have confirmed the lowest viable rate of breast tumor cells
(MCF-7) with 24 hours incubation after ingestion of 5 µg/ml nano-drug formulation using 96 well
plate. This will be discussed in more details in cell cytotoxicity part. The selected sample of DOX
conjugated to CSNP has been confirmed with spherical morphology through TEM images as
shown in Figure (3.8).

84
Figure 3.8: TEM images of DOX loaded PEGylated CSNP (A, B), and schematic diagram of DOX loaded
PEGylated CSNP
3.3.3. UV-VIS spectrum of DOX loaded PEGylated CSNP:
In order to confirm the efficiency of the prepared nano-system to effectively encapsulate DOX,
the UV-Vis spectra of free DOX, unloaded CSNP and DOX loaded PEGylated CSNP are shown
in Figure (3.9). The nano particulate samples have been incubated in slightly acidic pH media for
24 hours in the ambient conditions before centrifuging. Then, the resultant supernatant has been
matched to the UV spectrum of free DOX which has a characteristic absorption peak at wavelength
of (481 nm) (199). The unloaded CSNP have revealed a broad absorption band at the area of 200-
300 nm. This band is thought to be related to C=O group.
63 nm
DOX
C

85
Figure 3.9: UV-Vis spectra of DOX loaded CSNP, non-loaded CSNP and free DOX
While the supernatant of DOX loaded PEGylated CSNP showed stronger peak on the spectrum
with a characteristic peak at 480 nm wavelength, which is thought to be related to DOX. In fact,
CSNP has a characteristic swelling behavior that can be generally noted in acidic pH media. That’s
because the amino group related pKa value of chitosan is around 6.5. Therefore, the crosslinked
framework of CSNP start degrading in this acidic pH. The protonated NH2 groups of CSNP in
acidic pH enhances its solubility. This can improve the release of the entrapped DOX (200).
3.3.4. FTIR Spectroscopy analysis:
FTIR spectroscopy tests of CS powder, CSNP, DOX, PEGylated CSNP and DOX loaded
PEGylated CSNP are shown in Figure (3.10). In chitosan powder, broad and strong peak at 3446
cm-1 might be related to O-H stretching mode. This peak has been shifted to lower wavenumber at
3422.3 cm-1 and 3411 cm-1 in CSNP and PEGylated CSNP respectively. This probably means that
the more polymeric cross linkage with TPP and PEG, the lower peak shifting wavenumber. This
refer to the enhancement of H-bonding in the two nano formulations (201). Therefore, the bonds
in PEGylated CSNP is stronger than those in CSNP (96).

86
Figure 3.10: FTIR spectrum of CS powder, CSNP, DOX, Pegylated CSNP and DOX loaded PEGylated CSNP
The peak at 1600 cm-1 in chitosan represents bending vibration amide I bond N-H. In CSNP, it has
been shifted to 1540 cm-1. Likewise, the peak at 1650 cm-1 amide II stretching in chitosan powder
has been shifted to 1612 cm-1 in nanoparticulate systems. This supports the assumption of
successful TPP crosslinking of CSNP (202). Amide III bond peak of N-O has appeared in
PEGylated CSNP at 1380 cm-1 region. (131). Furthermore, a characteristic P=O peak has been
observed at 1155 cm-1 region of the formulated nanoparticulate systems, this peak can be related
to the linkage between NH2 of chitosan and phosphoric of TPP.
A peak at 2888.3 cm-1 wavenumber has appeared in PEGylated CSNP can be attributed to -CH2
stretching vibration. This may enhance the assumption of successful PEGylation of CSNP (204).
Another PEGylation specific peak is vibrational C-O-C peak that appeared with high intensity at
1101 cm-1 (205). After introduction of DOX to the system, two characteristic peaks at 1590 cm-1
and 1651 cm-1 have appeared in the IR spectrum compared to the spectrum of free DOX. These
two peaks are assumed to be related to stretching C=C of DOX inside the PEGylated CSNP matrix.
Moreover, OH stretching band has been shifted to 3430 cm-1 with more intensity and broader

87
appearance, which may represent increased strength of its hydrogen bonding $. Another peak at
1021.3 in PEGylated DOX loaded CSNP may refer to C—O (25).
3.3.5. Swelling Studies of DOX loaded PEGylated CSNP
After 24 hours of incubation, the samples have been weighed and their swelling indices have been
determined in two different pH media; 6.6 and 7.4. DOX loaded PEGylated CSNP have had higher
tendency for swelling at acidic 6.5 pH media than slightly neutral 7.4 pH. Swelling indices at 6.6
pH and 7.4 pH were 62.5 % and 7.89 % respectively. The difference in swelling behavior has been
investigated, also, with a TEM image as shown in Figure (3.11). The nanoparticles in 7.4 pH could
maintain their polymeric spherical shapes as referred by the blue arrows. While in 6.6 pH, the
polymeric matrix of the nanoparticles has been destroyed (206).
Figure 3.11: TEM images of DOX loaded PEGylated CSNP at pH 7.4 (a), pH 6.5 (b) after 24 hrs incubation and
schematic illustration of the difference between non-swelled (pH7.4) and swelled nanoparticles (pH 6.6) (c)
(c)

88
There is relationship between having high swelling rate and release of the entrapped drug from
CSNP, which may be due to the pores formed in the matrix network of the nanosystems. Swelling
has been shown to be affected by some parameters such temperature, swelling time, crosslinking
degree and pH. By maintaining all these parameters fixed and changing the pH of the media, the
effect of pH has been demonstrated. This variation between pH 6.6 and pH 7.4 may be related to
the hydrophilicity of CSNP and its polymeric chains. The presence of some active groups such as
—COOH, —OH and NH2 — may have another contribution (206).
Besides, the protonation of chitosan (pKa 6.6) at lower pH levels is increasing and its positive
amino groups induce its swelling. While at higher pH levels, chitosan is less protonated and
uncharged, thus its swelling and solubility decrease (207). Another rationale is that, in higher pH
levels, water tend to form a hydrogen bonds with functional active groups such as —COOH, —
OH and NH2 —groups. These H-bonds tend to fill the spaces inside the nano matrix and, hence,
minimize swelling. Furthermore, the rheological behavior of DOX loaded CSNP and sizes of
counter anions at these pH levels are participating in this swelling behavior (208). In conclusion,
DOX loaded CSNP demonstrates a pH dependent swelling, and this has a direct effect on the
release of the entrapped drug.
3.3.6. In-vitro Release Profile:
Figure 3.12: DOX release profile of PEGylated DOX loaded CSNP at pH 6.6 and pH 7.4

89
The in-vitro release behavior in our study has exhibited a selective pH dependent DOX release
rate. This has been investigated with two aforementioned pH levels; 7.4 and 6.6, that mimic the
physiological and cancerous conditions at 37°C as shown in Figure (3.12). The retention of DOX
inside PEGylated CSNP should be equilibrated between its stability in normal noncancerous
environment versus its targeted release at cancerous acidic conditions (209). In nanosystems, the
release profile can be demonstrated in three main phases; desorption, swelling then erosion as
shown in Figure (3.13). The In-vitro release behavior of DOX loaded nano-system in acidic 6.6
pH has showed basic burst release that has been followed by controlled release of DOX. The burst
release has been related to the diffusion of DOX out of the nano matrices. This is known as burst
effect that entails a combination of polymeric CSNP degradation and drug desorption (210).
Figure 3.13: Illustrative diagram of DOX release mechanism
The burst release of DOX has been identified during the first 3 hours with around 45% at pH 6.6
as shown in Figure (3.12). While less than 14% of the drug has been released at the pH 7.4. This
can be a good predicting indication of the polymeric stability in normal blood pH compared to
acidic tumor environment. This can be related to the pH media in a way that the protonation of the
amino NH2 groups of both CS and DOX is increasing in acidic media compared to neutral one.
Such protonation can be a main causative factor for the polymeric diffusion and erosion as we

90
mentioned before. After 3 hours of burst drug release, the drug has exhibited a slow sustained
release over 72 hours incubation time. This controlled release may be related to simultaneous
occurrence of minute molecules diffusion and the degradation of the remaining polymeric
structures (97). Our results suggest that DOX release is affected with pH level of the ingestion
media. The drug release rate has decreased by increasing the processing pH of the media. The
breast tumor environment is acidic because of the high anerobic glycolysis that enhance the acidity
levels. Besides, the endocytosis uptake pathway of DOX loaded PEGylated CSNP is expected at
such slightly acidic pH levels; however, it has been reported that its release decreases with
extremely acidic conditions (211). The massive oxidative stress at the tumor area enhances such
extreme acidity. Therefore, it is assumed that the tumor pH is a preferable media for the
nanoparticles to release the entrapped DOX compared to normal physiological conditions.
3.3.7. In-vitro release kinetics:
The releasing kinetics of DOX loaded PEGylated CSNP have been demonstrated in order to
predict physiological performance of the released drug. The relationship between the drug
concentration and release rate has been described with different mathematical models; Zero-order,
First order, Hixson crowell, Higuchi and Korsemeyer Peppas (212). According to the results, DOX
release may fit with Higuch model at the acidic 6.6 pH. This system hypothesized that DOX
particles are smaller than the nano-system thickness Additionally, this model entails that the
release rate is related to the pH and the nano carrier matrix has a good solubility rate. On the other
side, at pH 7.4, the release rate follows Korsemeyer Peppas model that assume one dimensional
drug release relative to the drug dosage form (213).
Table 3.6: Release kinetics of the released DOX according to different systems equations

91
3.4. Functionalization of Monoclonal Antibodies:
Figure 3.14: Schematic illustration of the final mAb functionalized DOX loaded PEGylated CSNP
The attachment of mAb to the surface of DOX loaded PEGylated CSNP has been suggested for
enhancing the intracellular uptake and endocytosis. This may be achieved through specific surface
receptors attachment of mAb to cancer cells. The functionalization of Anti-HER2 (Anti Human
Epidermal Growth Factor II) mAb and Anti-hMAM (Anti Human Mammaglobin) mAb to the
surfaces of the nanoparticles has slightly increased their sizes as shown by the TEM images in
Figure (3.14) and (3.15).
Each mAb has been immobilized to the surface of the nanoparticles separately by EDC
crosslinking. Supported activation of COOH terminal groups on the PEGylated surfaces of DOX
loaded CSNP has prepared the surface of these nanoparticles for further attachments of the mAbs.
In other words, this may facilitate the entry of mAb for successful surface conjugation. Therefore,
ratio between EDC to the mAbs was 5:1. This may increase the opportunities of surface satisfaction
of the nanoparticles with the antibodies separately. This could be confirmed with FTIR spectrum.
Furthermore, the size of the nanoparticles is greater than the mAbs, therefore the ratio of
nanoparticles to the mAbs was high (214).
The presence of PEG layer besides a stronger EDC supported linkage, may together help the
nanocarriers to proceed their way without detachment of the surface mAbs (146). This is from a

92
biological point of view. Furthermore, high consideration has been given to the use of PBS for
frequent washing in order to eliminate the presence of the unfavorable attached EDC molecules.
This may grasp further circulating molecules (216).
Figure 3.15: TEM images of Anti-hMAM DOX loaded PEGylated CSNP (A, B) and Anti-HER2 DOX loaded
PEGylated CSNP (C, D)
In order to explore the surface chemistry of the particles surfaces that are functionalized with
mAbs, HNMR spectrum has been conducted as shown in Figure (3.16). Peaks at 2.4, 2.6 and 2.7
ppm are responding of H protons of CH2 groups of mAb functionalized nanoparticles. Besides, the
appearance of triplicate peaks at 3.2 and 3.3 ppm are representing amino NH2 groups, which may

93
confirm the conjugation of the antibodies to the PEGylated surface. The increased amount of
nitrogen within the surface of nanoparticles can be illustrated with the increased immobilization
of the mAbs. Moreover, FTIR spectrum has been conducted as well, and it confirm this assumption
of surface coverage with mAbs related NH2 groups (217).
Figure 3.16: HNMR spectrum of Anti-hMAM / DOX loaded PEGylated CSNP (A) and Anti-HER2 / DOX loaded
PEGylated CSNP (B)

94
The FTIR spectrum of Anti-HER2 DOX loaded PEGylated CSNP and Anti-hMAM DOX loaded
PEGylated CSNP has been explored to define the change in the absorption peaks relative the non-
functionalized DOX loaded PEGylated CSNP. This is shown in Figure (3.17). The shifting of OH
peak from 3430 cm-1 to 3300 is an indication of the pronounced COOH group to the surface of the
CSNP. Moreover, the increased intensity of the peak at 1600 cm-1 can be attributed to the increased
surface coverage with NH2 groups. These groups may be related to the immobilized mAbs (216).
The disappearance of the characteristic peak of PEG at 1094 cm-1 indicates, also, the conjugation
of the mAbs to the surfaces.
Figure 3.17: FTIR spectrum of mAbs /DOX loaded PEGylated CSNP and non-functionalized DOX loaded
PEGylated CSNPs
3.5. Cytotoxicity Analysis:
The cytotoxic effect of different nano-formulated systems on MCF7 cells have been more
prominent than various free DOX drug concentrations. L929 cells were less responsive to the
different nano-formulations as shown in Figure (3.18) (102).
Tra
nsm
itta
nce
(%
)
Wavenumber (cm-1)

95
Figure 3.18: Colorimetric MTT assay of DOX loaded PEGylated CSNP (1.25, 2.5, 5 and 10 Ug/ml) (A), Free DOX
concentrations (1.25, 2.5, 5 and 1 Ug/ml) (B) and Anti-HER2 and Anti-hMAM functionalized DOX loaded
PEGylated CSNP.
A
B
C

96
Various nano-formulations have been screened including unloaded CSNP, PEGylated CSNP,
DOX loaded PEGylated CSNP (variable concentrations), free DOX, Anti-HER2 functionalized
PEGylated DOX loaded CSNP and Anti hMAM functionalized PEGylated DOX loaded CSNP.
The cytotoxicity results suggest that nanoformulated DOX systems have shown greater toxicity on
cancerous MCF7 cells. As shown in Figure (3.14A), PEGylated DOX loaded CSNP with drug
concentrations of 1.25, 2.5, 5 and 10 µg/ml could achieve MCF7 cell viability rates of 24.7± 4.2
%, 18.66 ±2.3%, 14.98± 1.5% and 39.44± 3.1% respectively. Normal L929 cells have been less
affected by these nano-formulated drug concentrations and less responsive to the released drug,
although both types of cells had identical same incubation conditions of time, type of media and
drug interval concentrations. The released drug could achieve successful endocytosis in case of
MCF7 and killed more than 50% of the seeded cells. (130).
The nanoparticles encapsulating 5 µg/ml DOX has shown the highest cytotoxicity effect with
14.89% viable MCF7 cells. Le et al. has reported the minimal cytotoxic effect of the released DOX
when the drug concentration is increasing than proposed concentrations in this study (218). On the
other hand, the effect of the same 5Ug/ml nano-DOX formula on normal L929 has been the least
compared with other concentrations. This may put some confirmatory assets on its therapeutic
durability and biological safety (102).
Free DOX concentrations have demonstrated higher viability rates of MCF7 cells with 30 ± 1.98%,
34 ± 1.45%, 38 ± 4.31% and 45 ± 2.21% viability rates for similar free drug concentrations of the
nano formulated DOX. Therefore, their cytotoxic effect on cancerous cells is lower than nano
DOX formulations. We have demonstrated their partial dose dependent cytotoxicity on MCF7 and
L929. The most efficient free DOX concentration could revel around 30 ± 1.98 % viability rate.
While in nano formulated DOX, the lowest viability rate has been 14.89 ± 1.5%. This suggests a
good indication that our PEGylated CSNP system has improved the cellular uptake and
intracellular delivery of DOX with one-time higher rate, under the same exposure time relative to
free DOX (53). Confirmatory bright filed images of MCF7 and L929 after exposure to different
drug formulations are shown in Figures (3.19) -(3.22).

97
Figure 3.19: Bright field images of L929 cells with white arrows referring to living cells (A), and MCF7 cells with
white arrows referring to dead cells (B) after exposure to DOX – PEGylated CSNP (0.5 µg/ml)

98
Figure 3.20: Bright field images of L929 cells with white arrows referring to dead cells (A), and MCF7 cells with
white arrows referring to living cells (B), after exposure to Free DOX

99
Figure 3.21: Bright field images of L929 cell line with white arrows referring to living cells (A), and MCF7 cell line
with white arrows referring to dead cells (B) cells after exposure to Anti-HER2 functionalized DOX loaded
PEGylated CSNP

100
Figure 3.22: Bright field images of L929 cells with white arrows referring to living cells (A) and MCF7 with white
arrows referring to dead cells (B) cells after exposure to Anti-hMAM functionalized DOX loaded PEGylated CSNP
101
Functionalization of monoclonal antibodies to the surfaces of DOX loaded PEGylated CSNP as a
targeting moiety was assumed to be a productive therapeutic conjugate in terms of cancer cell
cytotoxicity. This has empowered the cellular uptake and cell viability rates of these nano
formulations. In this sense, Anti HER2 and Anti hMAM antibodies have been used for
functionalization of DOX loaded PEGylated CSNP separately. This could enhance the tumor cell
susceptibility and higher intracellular accumulation of the released DOX. Our results have showed
the potential of the nano formulated DOX functionalized with these monoclonal antibodies to
increase its cytotoxic effect in MCF7 three times as free DOX, while maintaining higher viability
rates of normal L929 cells (131).
Anti-HER2 and Anti-hMAM functionalized nano formulations have shown MCF7 viability rates
of 1.79 ± 0.06% and 2.99 ± 0.023% respectively. While Normal L929 have been less responsive
and less affected by the same formulations. This may be a good marking point that MCF7 are more
affected by these antibodies functionalized nano formulations, while normal L929 cells are less
susceptible and less affected. Specific antigen-antibody mediated drug accumulation my
developed more efficient cellular endocytosis and, hence, higher drug efficacy on MCF7. On the
other hand, L929 normal cells lack such tumor cell specific receptors like HER2, for instance.
Therefore, such intracellular drug uptake is not expected, and receptor mediated coupling
mechanism hiders drug release or accumulation with normal cells (219). The bright field images
of the cells after identical exposure to antibodies functionalized DOX loaded PEGylated CSNP
have demonstrated the viability profile. The difference in cellular shape and uniformity responses
of both types of cells may exhibit their different susceptibilities.
The MTT test has been performed in CO2 incubator under processing temperature of 37 °C. The
temperature has been proposed to affect the intracellular action of DOX and affect its diffusion. In
this sense, Miller’s law of diffusion entails a strong relationship between the temperature and drug
diffusion rates (220). Therefore, the diffusion and cytotoxicity profiles of all our experimented
formulations, including loaded and unloaded DOX, are less likely to be affected by this
relationship. That’s because the experimental processing temperature was 37°C, which is higher
than the intermolecular self-aggregation temperature of DOX. In this temperature, intermolecular

102
π – interaction may be formulated specially less than 4°C, which minimize the diffusion of DOX.
However, our study has been performed at physiological 37°C temperature (221).
3.6. Size increment profile:
Over the different activities of our study, variable sizes of CSNP have been obtained. The size
increment over all the activities didn’t exceed 10%. This is a good indication for the surface
stability. The size increment after PEGylation of CSNP, encapsulation of DOX to PEGylated
CSNP, functionalization of Anti-HER2 to DOX loaded PEGylated CSNP and Functionalization
of Anti-hMAM to DOX loaded PEGylated CSNP have been 10%, 7.23%, 4.3% and 4.72% (222).
Figure 3.23: TEM images and the relevant DLS histograms of non-PEGylated CSNP (A, B) and
PEGylated CSNP (C, D)

103
Figure 3.24: TEM images and their relevant DLS histograms of DOX loaded PEGylated CSNP (E, F), Anti-
HER2 DOX loaded PEGylated CSNP (G, H), and Anti-hMAM DOX loaded PEGylated CSNP (I, J)

104
Appendix
(supporting Information)

105
Supporting Information:
SI. 1. Synthesis of chitosan nanoparticles.
SI. 1.1. Dissolving Chitosan:
Chitosan acidic solution has been prepared simply through dissolving LMW chitosan powder with
different weights including 1 gm, 0.5 gm, 0.25 gm and 0.05 gm in 1% acetic acid. The pH has
been adjusted to 5.0 using 0.1N NaOH. These prepared solutions have been left to be mixed and
dissolve for 24 hours under magnetic stirring at 750 RPM within the ambient temperature. The
resulted four solutions have showed different viscosities and some dissolved traces have been
removed out using 0.4 Um syringe filter mesh. All preparation parameters and conditions have
been controlled within this step-in order to obtain homogenous chitosan acidic solutions. The
stirring beakers have been covered with protective par-film sheets in order for avoiding the
entrance of any contaminants, and suitable sizes of magnetic bars have been used for the mixing
process.
SI. 1.2. Dissolving Sodium tri-polyphosphate:
Sodium tri-polyphosphate is a chemical cross linker that has been used in this work in order to
induce the ionic gelation process through which, chitosan nanoparticles would be formulated. TPP
has been dissolved in purified distilled water within four different concentrations; 0.1%, 0.4%,
0.5% and 0.7%. Suitable sizes of magnetic bars have been used for stirring process. The solutions
have been rapidly mixed within 35 minutes at 500 RPM within the ambient conditions.
SI. 1.3. Preparation of Crosslinked chitosan nanoparticles:
After formation of homogenous chitosan and TPP solutions, they have been mixed together.
Whitish clouds of chitosan nanoparticles have been spontaneously formed upon addition of the
two polymers together. In order for separating these nanoparticles, we have applied efficient
centrifuging forces. Therefore, the reacted polymers part, that formulated crosslinked chitosan
nanoparticles, could be separated from the unreacted eluted polymers. The resulted pellet of

106
chitosan nanoparticles has been used for further investigative characterization techniques. For this
purpose, the pellet has been divided into three sections as shown in figure SI. 1 and table SI. 1.
Table SI. 1: variable conditions for characterizing chitosan nanoparticles
Nanoparticles pellet Action Characterization Purpose
First part (minor) Oven drying Scanning electron microscopy (SEM),
Second part (moderate) Sonication + dilution
(distilled water)
Dynamic light scattering (DLS), Ultraviolet-Visible
spectrophotometry (UV-VIS) and Transmission electron
microscopy (TEM)
Third part (major) Freeze drying Fourier transmission infra-red spectroscopy (FTIR), X-ray
Diffraction (XRD)
Figure SI. 1: Divided pellet undergoes further investigation techniques with a prior sample preparation technique
such as oven drying, freeze drying and resuspending in distilled water.
SI. 2. Factors affecting chitosan nanoparticles:
The morphological chemical properties of chitosan nanoparticles are significantly affected with
various parameters and factors. This is a part of the reason of why chitosan is a remarkable
biopolymer and possess attractive advantages for various biological and non-biological
applications. Changing some parameters such as polymers concentration, mixing rate and mixing
time can obviously change the size and shape of the formulated nanoparticles. It has a simple

107
analogy like tailoring a specific nano-carrier or nanosystem with providing certain specific resulted
features and properties, by playing with these stated parameters.
SI. 2.1. Effect of polymers concentrations:
The particle size, shape, distribution and surface charge of the prepared chitosan nanoparticles can
be influenced by the concentrations of chitosan and TPP. In order to investigate this influence,
various concentrations of both polymers have been applied with keeping all other preparation
parameters constant. Identical volumes of both polymer solutions have been applied, while their
concentrations have been varied. Four different concentrations of chitosan acidic solutions have
been used; 0.05%, 0.25%, 0.5% and 1% (w/v).
On the other hand, sodium tri-poly phosphate concentrations were 0.1%, 0.4%, 0.5% and 0.7%
(w/v). Sixteen samples of whitish clouds of chitosan nanoparticles have been formulated up on
drop wise addition of sodium tri-polyphosphate to chitosan acidic solutions with a dropping
syringe. Based on the number of concentrations of both polymers, the optimization of the
nanoparticles has taken place in a quadruple manner as shown in table 2.
Table SI. 2: General scheme for the applied polymers concentrations; Cs and TPP
Sample Cs (w/v) % TPP (w/v) % 0.05 0.1 0.5 1 0.1 0.4 0.5 0.7
1
2
3
4
5
6
7
8
9
10
11

108
12
13
14
15
16
The mixture of chitosan solution and TPP has been left for mixing on the magnetic stirring under
the previously stated preparation parameters in terms of mild speed and time within protected
ambient conditions. The resulted sixteen samples of chitosan nanoparticles have been visually
analyzed as turbid suspensions of undissolved white clouds of nanoparticles. After using particles
size analyzer which has been based on dynamic light scattering physical principle (Malvern
Zetasizer®), sample 8 has been the sample of choice in terms of size and distribution.
SI. 2.2. The effect of Stirring speed:
Another significant factor that has a direct influence on the resulted chitosan nanoparticles is
related to the identified mixing technique. Stirring speed has been reported to directly affect the
NP’s size and distribution (223). Although it has reported by Oliviera et. al., that stirring time and
speed have low influence on the size and distribution of the formulated nanoparticles (224). We
have investigated that this contradict with our study. Four main different stirring speeds have been
investigated and analyzed to produce various sizes and distributions; (250, 500, 750 and 1000)
RPM. All other parameters have been constant including polymers concentrations. The sample of
choice, sample 8, has been investigated in these four different stirring speeds as shown in table 2.
Table SI. 3: Various stirring speed provide variation of Cs nanoparticle’s size and distribution.
Stirring speed Particle size PDI
250 RPM 182 ± 5.3 0.37 ± 0.004
500 RPM 345.9 ± 1.3 0.517 ± 0.003
750 RPM 357.2 ± 4.45 0.512 ± 0.041
1000 RPM 391.4 ± 2.2 0.491 ± 0.007
SI. 2.3. The effect of stirring time:

109
Stirring time is one of the main influential factors that affect the size and distribution uniformity
of the formulated chitosan nanoparticles. In order to investigate that notion, we have performed
this preparation procedure with keeping all other preparation factors constant. The polymers
concentrations, stirring speeds and temperature have been kept constant with changing the
performing stirring time. The influence of changing stirring time on particle size and distribution
has been studied with three different time slots; (15, 30 and 60) minutes as shown in figure 3.
According to the resulted smallest particles sizes and smallest PDI, the optimized procedure has
been selected. (225, 226)
Table SI. 4: Variation of the stirring time provides variation of particles size and distribution.
Stirring time Particle size PDI
15 min 245 ± 7.6 0.67 ± 0.004
30 min 182.2 ± 5.45 0.304 ± 0.009
60 min 209.3 ± 25.45 0.609 ± 0.082
SI. 2.4. The effect of chitosan molecular weight:
Molecular weight of raw chitosan powder is another effective factor that influence the size of the
resulted chitosan nanoparticles (227). It has been reported by many studies that there is a direct
relationship between the molecular weight of chitosan relative to particles size and distribution of
the resulted chitosan nanoparticles (228). Considerably, the effect of varying the molecular
weights of chitosan on the resulted nanoparticles has been studied with holding the initial chitosan
and TPP constant. The molecular weights of chitosan have been changed within three different
preparations; Low molecular weight chitosan (LMWC), medium molecular weight chitosan
(MMWC) and high molecular weight chitosan (HMWC). However, all other preparation
parameters and factors have been kept constant, and the optimized molecular weight has been
selected based on the resulted particle size and distribution.
Table SI. 5: Variation of chitosan molecular weight provides variation of particles size and distribution

110
Chitosan Molecular weight Degree of Deacetylation particles size PDI
LMWC (110) 89.9 % 187 ± 2.7 0.282 ± 0.015
MMWC (400) 84.8 % 357 ± 80.5 0.81 ± 0.14
HMWC (800) 76 % 444.2 ± 106.9 0.52 ± 0.07
SI. 2.5. The effect of pH:
The external morphology mean sizes and uniform distribution of chitosan nanoparticles can be
affected by different pH of chitosan solution. The relation between the crosslinking process of
chitosan/TPP and changing the pH of chitosan solution has been reported by some studies (229).
For investigating this effect, we have adjusted the pH of chitosan solution from 2.6 to 5.5 (2.6, 3.1,
3.5, 4.5, 5 and 5.5). The protonation degree of chitosan polymer can greatly control the cross-
linking process of CSNP. On the other hand, this protonation degree can be affected with chitosan
solution pH, therefore we need to investigate this factor and whether it needs to be controlled
within specific range that doesn’t harm the intended physiological environment in which the
nanoparticle would deliver certain drug or not.
Table SI. 6: various processing pH provide variation of particles size and distribution
pH Size PDI
5.5 196 ± 4.1 0.42 ± 0.06
5 182 ±3.7 0.22 ± 0.005
4.5 180.8 ± 4.4 0.34 ± 0.003
3.5 162 ± 4.6 0.35 ± 0.008
3.1 147 ±1.9 0.41 ± 0.05
2.6 136 ± 6.1 0.47 ± 0.005
SI. 3. Stability of chitosan nanoparticles:
Throughout all the optimization procedure and manipulation of the different preparation factors of
the resulted chitosan nanoparticles, we could identify the optimum procedure through which we
can obtain chitosan nanoparticles with satisfying physical and chemical properties. The main
characteristic features of the nano-system that we have investigated are particle size, poly
distribution and zeta potential value as shown in table 6.

111
Table SI. 7: Stability profile for the prepared chitosan nanoparticles along over three weeks
Zeta potential is an indicative parameter to the surface charge and hence the aggregation tendency
or size stability in the intended suspending medium as shown in table 7 (230). This is a very
important parameter whenever the formulated nano-system would be intended to be injected in a
biological tissue within biomedical applications. In other words, the size stability of the in-vivo
colloidal nanoparticles system can be assessed with zeta potential value.
Table SI. 8: Various ranges of Zeta potential values with their corresponding aggregation tendencies (231)
Time Particle size PDI
1 day 183.7 ± 5.8 0.20
2 days 187 ± 3.9 0192
4 days 187.6 ± 4.6 0.223
6 days 195 ± 2.12 0.253
8 days 198.5 ± 3.5 0.262
10 days 193.4 ± 6.1 0.292
12 days 184.5 ± 5.7 0.239
14 days 192.2 ± 8.4 0.209
16 days 200.1 ± 2.1 0.190
18 days 196 ± 3.4 0.242
20 days 204.4 ± 4.6 0.240
22 days 201.1 ± 5.2 0.189

112
SI. 4. Theoretical and Instrumental background:
SI. 4.1. Ultrasonic Probe Sonicator (Polytron, Thermo-fisher:
Ultrasonic probe sonicator is an instrument that is used for mixing and extraction of various
chemical or polymeric compounds. This device is working by generating powerful energy in the
form of sound waves that are enough to agitate or suspend micro and nano sized particles in a
solution (232). These sound waves are ultrasonic waves (frequency > 20 kHz). They provide rapid
and violent vibration of the probe tip, and this creates a kind of cavitation that collapse within the
solution or medium as shown in (Figure 2).
Figure SI. 2: controlled compression and expansion energy that bring particles to larger sizes which later
breakdown into much smaller ones (232)
This cavitation intensity is controlled by the setting agitation time and amplitude settings. It creates
what is called cavitation bubbles that grow in size until it reaches a critical size that can
aggressively disrupt the intermolecular covalent bonding of the applied medium as shown in
(figure 2). Therefore, the greater the frequency, the stronger the waves, the higher cavitation
intensity and hence the stronger particles agitation. It has been recommended by many studies that
ultrasonic probe sonicator is a recommended high-speed mixing technique and put it as the first
technique of choice for mixing (233)

113
Ultrasonic probe sonicator is mainly composed of three main parts; generator, converter and probe
tip (figure 3). Generator is the processing unite through which, we can control the sonication
parameters. It provides high voltage pulses of electrical energy that is produced basically form
normal alternating current and convert into such powerful pulses through that generator unite
(234).
Figure SI. 3: The three main Instrumental parts of a Probe-Sonicator (234)
Converter is a piezoelectric unite of the ultrasonic instrument. It is typically controlled through the
high voltage pulses that are created by the generator. These pulses provide such enough powerful
energy at a certain un-fluctuated frequency of 20 kHz. The main function of the converter is to
convert the produced electrical energy into mechanical energy. Therefor there is a high voltage
cable that connect between the converter and the generator. The outer shape of converter, as shown
in figure X, is cylindrical. The third part of the ultrasonic sonicator is the probe or horn. This the
instrumental part of the device the is put in direct contact to the applied sample. It has threaded
ends whose longitudinal tip expands and contract during processing (235).
SI. 4.2. Freeze drying (BIOBASE, Jinan, China):
Freeze drying is a dehydration process or removal of solvent and it is called also lyophilization. It
is a frequently used technique in many pharmaceutical industries, different scientific laboratories
and food industries. Basically, freeze drying is applied for drying heat labile samples so that it
becomes more stable in a powdered form without presence of moisture any solvent after being
frozen (236). Samples like proteins, tissues, plasma, dead cells and pharmaceuticals are extremely
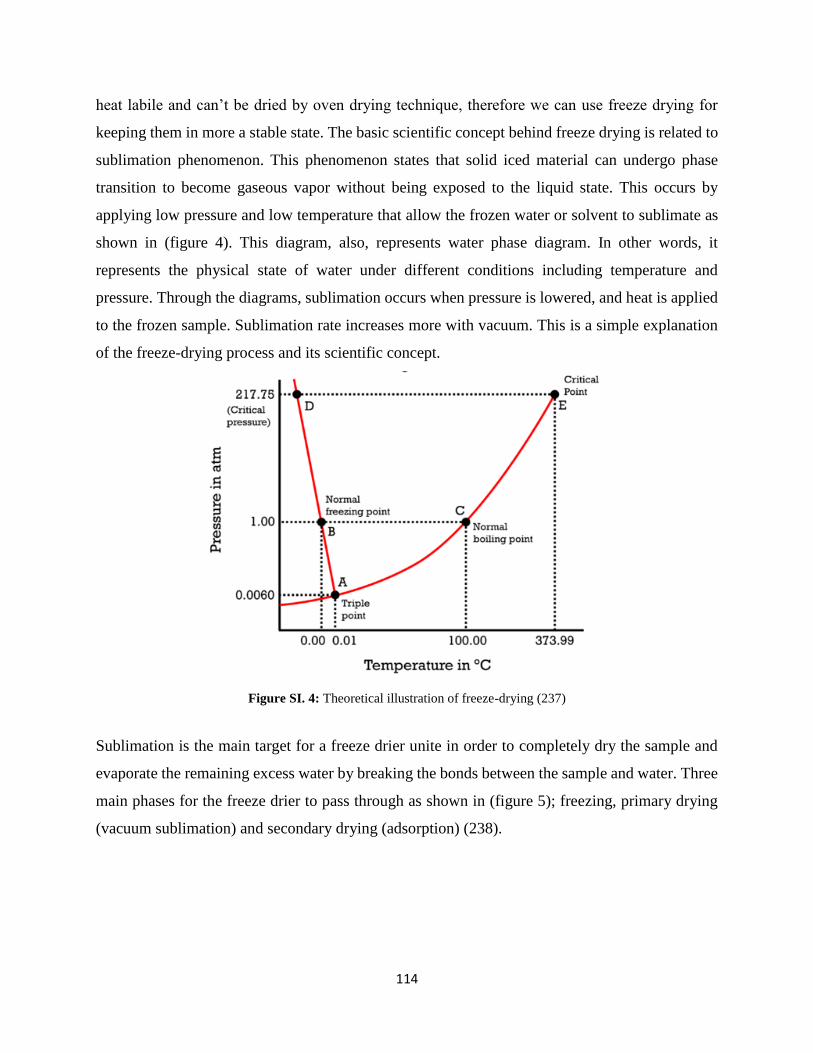
114
heat labile and can’t be dried by oven drying technique, therefore we can use freeze drying for
keeping them in more a stable state. The basic scientific concept behind freeze drying is related to
sublimation phenomenon. This phenomenon states that solid iced material can undergo phase
transition to become gaseous vapor without being exposed to the liquid state. This occurs by
applying low pressure and low temperature that allow the frozen water or solvent to sublimate as
shown in (figure 4). This diagram, also, represents water phase diagram. In other words, it
represents the physical state of water under different conditions including temperature and
pressure. Through the diagrams, sublimation occurs when pressure is lowered, and heat is applied
to the frozen sample. Sublimation rate increases more with vacuum. This is a simple explanation
of the freeze-drying process and its scientific concept.
Figure SI. 4: Theoretical illustration of freeze-drying (237)
Sublimation is the main target for a freeze drier unite in order to completely dry the sample and
evaporate the remaining excess water by breaking the bonds between the sample and water. Three
main phases for the freeze drier to pass through as shown in (figure 5); freezing, primary drying
(vacuum sublimation) and secondary drying (adsorption) (238).

115
Figure SI. 5: Graphical illustration for different stages of freeze-drying process (238)
SI. 4.2.1. Freezing:
In this phase, the sample is completely frozen in a vial that is done by freezer or even a chilled
bath. The sample is cooled down to reach below the triple point in order to ensure that the sample
will not undergo melting but rater with expose to sublimation.
SI. 4.2.2. Primary drying (vacuum sublimation):
This is the stage in which around 95% of the entire drying process takes place. The application of
vacuum in this stage is a reason of rapid sublimation. It is a slow phase in which preassure is
lowerd and moderate heat is applied because excessive heat may cause breakdown or change in
the structure of the sample. The released water vapor is condensed and solidified within the
condenser.
SI. 4.2.3. secondary drying:
It is called, also, adsorption phase in which the ionic bonds between water and the applied material
is broken and removed. This breakage is owing to the increased temperature in the freeze drier to
a degree higher than the primary drying phase so that the remaining 1-5 % of the residual moisture
is removed. The dried samples can be preserved within dry un-moisturized environment such as
silica jar or refrigerator so that they can be prepared for later phases of the study.
The main purpose of using freeze drier during the current study has been to provide a stable form
of free unloaded CSNP, PEGylated CSNP and DOX loaded CSNP. The dried forms of these
nanoparticles have been used for further characterization analytical techniques such as FTIR and

116
XRD. Additionally, these dried forms have had more stability profile and longer shelf life as a
powered form. They can be used anytime with a definite amount of micro and milligrams of the
nanoparticles. During drug loading and release studies, we have used to weigh certain amppunts
of nanoparticles in order to investigate some critical analytical tests such as release, loading and
cell viability percentages.
SI. 4.3. Magnetic stirrer (ISG®, China)
It is a laboratory device that is frequently used in most chemistry, physic and biology laboratories
for mixing of different fluids. It is a simple device in which a magnetic bar is allowed to stir at the
bottom of certain sample as shown in figure 6 This rotating bar is stirring within a rotating
magnetic field. The sited bar is immersed inside the vessel of liquid sample, and it must be of
suitable size relative to the applied vessel.
Figure 6: Magnetic stirrers (239)
In case of glass vessel, it can be broken if the size of the stirring bar is quite large and strong.
Another important factor that affect the stirring process is the viscosity of the liquid. When the
applied liquid has high volum or high viscosity, additional mechanical stirring is required. The
main controllers with magnetic stirrer device are rotating speed, that is defined as round per minute
(RPM), time that is defined in minutes and temperature, that is defined by Celsius C (240). The
size of the stirring bar is another considerable factor that variably affect mixing process. As shown
in figure 7, there is a variety of sizes and shapes of the used magnetic bars. The selection of a
specific size or shape is basically related to the purpose of mixing process and the size of the
container in which we perform mixing of the sample.

117
Figure 7: Different shapes of magnetic mixing bars (241)
SI. 4.4. Centrifugator (HERMLE Labotechnik 36 HK, Germany)
Centrifugation is one of the fast separation techniques that involves sedimentation of suspended
particles to the base of a liquid medium. This sedimentation can take place naturally without any
external interference, but this may take very long time. Many factors affect the particles
sedimentation or separation including particles shape, density and size, in addition to the viscosity
and temperature of the suspending medium. it has wide application in most biological and chemical
experiments such as DNA separation and proteins purification (242).
It is a simple instrument in which the sample is placed in a vessel called centrifuging tube. This
tube is allowed to rotate in a rotor whose speed is adjusted before the sedimentation process. As
the rotor speed gets higher, a centrifugal force is moved and each particle in the medium will sense
that force as shown in (figure 8). This result in immediate sedimentation of these particles. The
sedimentation rate is directly proportional to the difference between the density of the medium and
the density of its suspended particles. Additionally, the viscosity and some other physical and
chemical properties influence the sedimentation rate. If we fixed the viscosity of the medium and
centrifugal forces, the molecular weight of the dissolved particles will be directly proportional to
the sedimentation rate (243).

118
Figure 8: Illustrative description of centrifuging process (244)
SI. 4.5. Oven drying (TITANOX, Italy):
Drying by oven is the process of removing any solvent that is mixed with the applied sample, and
this sample must be non-heat labile in order to avoid its destruction. It is applicable in small scales
like laboratories and larger industrial scale as well. The main purpose of oven drying remains the
same at both scales is to remove the mixed solvent and avoiding moisture. It is completely made
of stainless steel and have a key and lock door as shown in (figure 9). During our experiment,
drying oven has been used to dry PEGylated and non-PEGylated chitosan nanoparticles so as to
be ready for SEM analysis. Each sample has been spreaded over an aluminum foil that has been
fixed on a simple watch glass, then entered to the oven that has been adjusted at 60C for 10
minutes in order to evaporate the solvent. In few times, the drying oven has been used to sterilize
and dry the applicable used glassware. (245)

119
Chapter 4
Conclusion and Future
Perspectives
Figure 5.5: Microscopic images

120
Conclusion:
The current study has developed a therapeutic assumption of developing a selective targeted drug
delivery system for the treatment of breast cancer. The proposed system has intended chitosan
nanoparticles in order to entrap DOX inside, with maintaining the external surface of the
nanoparticles decorated with PEG polymer. In order to enhance its specificity and sensitivity, the
nano-system has been functionalized with two different types of breast cancer specific monoclonal
antibodies; Anti-HER2 and Anti-hMAM. Along over the study, some characterization techniques
have been applied as confirmatory procedure to ensure the durability of the final therapeutic cargo.
Examples of which, DLS, TEM, XRD, FTIR, UV-VIS and HNMR. In this sense, primary size
adjustment of blank unloaded CSNP has been performed to put some control over the size, surface
charges and stability in different pH media. Then PEG has been grafted on the external surface of
CSNP in order to enhance its stability against immunogenic responses and prevent its lymphatic
uptake or RES uptake. Three PEG concentrations have been demonstrated; 5% PEG had higher
stability compared with other proposed concentrations with the lowest particle size. This is because
the final size of the nano-system has been supposed to be less than 200 nm. That is because the
RES capturing size limit is known to be hindered for size range less than 200nm. After confirming
stability of the PEGylated CSNP and its size stability below that RES opsonization range, DOX
has been encapsulated in different concentrations with various nano-formulations. 5Ug/ml
concentration formula has been the most effective one in terms of loading capacity and surface
stability. Therefore, it has been selected for the functionalization of mAbs. Each one of the mAbs
has been functionalized separately; having two final types of nano-functionalized formulations.
The cytotoxicity analysis has been conducted against MCF7 breast cancer cells and L929
fibroblasts has been conducted. Various nano-formulations have been tested against the effect of
free DOX on the same two types of cells with maintaining fixed temperature, drug concentration
and incubation period. The Anti-HER2 and Anti-hMAM functionalization could promote the
MCF7 cytotoxicity, with achieving less than 3% cell viability. While, L929 cells were less reactive
and less responsive than MCF7. Therefore, the assumption of encapsulating DOX into a selective
targeted nano-system has enhanced its in-vitro therapeutic effect with promoted cancer cell
endocytosis. Bright filed images have exhibited cancerous and normal cell responses to the
developed formulations. Therefore, the current study recommend the application of polymeric
PEGylated chitosan nanocarrier with mAbs functionalization as a novel therapeutic system for

121
selective release of the entrapped DOX. This may provide one of the nanoscience based biomedical
solutions for breast cancer treatment.
Future Perspectives:
During this study, some tests and experiments were required to be implemented in order to give a
clear understanding of the structural and therapeutic efficiency of the developed nano-
formulations. The structural stability of the developed nano-formulations can be empowered with
the following:
o Body fluid analysis me give a better prediction of the biological behavior of the developed
formulation. This will detect the efficacy of some parameters that have been already tested
in this study. Particles stability along over the its site of introduction till reaching its site of
action can be demonstrated with this test. Besides, the convenience of the nanoparticles’
sizes developed in this study can be confirmed with this test.
o Animal testing may improve the pharmacokinetic and pharmacodynamic profiles of the
developed nano-formulations. Detecting some parameters such as plasma level and
elimination rate of the injected drug may promote a better understanding about the assigned
dose of the final drug. Besides, monitoring In-vivo blood release of the drug can be another
confirmatory procedure that is achieved with such animal testing. It illustrates a clear
relationship between the release rate and different pH leves.

122
References
Figure 5.5: Microscopic images

123
(1) Thirumaran, R.; Prendergast, G. C.; Gilman, P. B. Chapter 7 - Cytotoxic Chemotherapy in Clinical
Treatment of Cancer. In Cancer Immunotherapy; Prendergast, G. C., Jaffee, E. M., Eds.; Academic Press:
Burlington, 2007; pp 101–116. https://doi.org/10.1016/B978-012372551-6/50071-7.
(2) Desai, K. G. Chitosan Nanoparticles Prepared by Ionotropic Gelation: An Overview of Recent
158. –(2), 107 33 ,2016 Crit Rev Ther Drug Carrier Syst Advances.
.https://doi.org/10.1615/CritRevTherDrugCarrierSyst.2016014850
(3) Grela, E.; Kozłowska, J.; Grabowiecka, A. Current Methodology of MTT Assay in Bacteria – A
Review. Acta Histochemica 2018, 120 (4), 303–311. https://doi.org/10.1016/j.acthis.2018.03.007.
(4) Hess, J. M.; Bernards, A.; Kim, J.; Miller, M.; Taylor-Weiner, A.; Haradhvala, N. J.; Lawrence, M. S.;
301.e14. -(3), 288 36 ,2019 Cancer Cell Getz, G. Passenger Hotspot Mutations in Cancer.
.https://doi.org/10.1016/j.ccell.2019.08.002
(5) Vicente-Dueñas, C.; Hauer, J.; Cobaleda, C.; Borkhardt, A.; Sánchez-García, I. Epigenetic Priming in
.https://doi.org/10.1016/j.trecan.2018.04.007417. –(6), 408 4 ,2018 Trends in Cancer Cancer Initiation.
(6) Grela, E.; Kozłowska, J.; Grabowiecka, A. Current Methodology of MTT Assay in Bacteria – A
.https://doi.org/10.1016/j.acthis.2018.03.007311. –(4), 303 120 ,2018 Acta Histochemica Review.
(7) Angiogenesis Inhibitors https://lungevity.org/for-patients-caregivers/lung-cancer-101/treatment-
options/angiogenesis-inhibitors (accessed Dec 14, 2019).
(8) Cancer today http://gco.iarc.fr/today/home (accessed Dec 14, 2019).
(9) Nakajima, H.; Imanishi, N.; Aiso, S. Facial Artery in the Upper Lip and Nose: Anatomy and a Clinical
861. –(3), 855 109 ,2002 Plastic and Reconstructive Surgery Application:
.00003-200203000-https://doi.org/10.1097/00006534
(10) If You Have Breast Cancer | What To Do When You Get Breast Cancer
https://www.cancer.org/cancer/breast-cancer/if-you-have-breast-cancer.html (accessed Dec 14, 2019).
(11) Primary Breast Cancer - Breast Cancer Care https://breastcancernow.org/information-support/facing-
breast-cancer/diagnosed-breast-cancer/primary-breast-cancer (accessed Dec 14, 2019).
(12) Seniski, G. G.; Camargo, A. A.; Ierardi, D. F.; Ramos, E. A.; Grochoski, M.; Ribeiro, E. S.; Cavalli,
I. J.; Pedrosa, F. O.; de Souza, E. M.; Zanata, S. M.; et al. ADAM33 Gene Silencing by Promoter
Hypermethylation as a Molecular Marker in Breast Invasive Lobular Carcinoma. BMC Cancer 2009, 9,
.80-9-2407-https://doi.org/10.1186/1471. 80
(13) Hopkins Doctors Challenge Routine Testing for Breast Cancer | Cancer
https://www.labroots.com/trending/cancer/3779/hopkins-doctors-challenge-routine-testing-breast-cancer
(accessed Dec 14, 2019).

124
(14) Unsoy, G.; Khodadust, R.; Yalcin, S.; Mutlu, P.; Gunduz, U. Synthesis of Doxorubicin Loaded
Magnetic Chitosan Nanoparticles for PH Responsive Targeted Drug Delivery. Eur J Pharm Sci 2014, 62,
.https://doi.org/10.1016/j.ejps.2014.05.021. 250–243
(15) DCIS (Ductal Carcinoma In Situ) Explained - Breast Cancer Care
https://breastcancernow.org/information-support/facing-breast-cancer/diagnosed-breast-cancer/primary-
breast-cancer/ductal-carcinoma-in-situ-dcis (accessed Dec 14, 2019).
(16) Alkabban, F. M.; Ferguson, T. Cancer, Breast. In StatPearls; StatPearls Publishing: Treasure Island
(FL), 2019.
(17) Publishing, H. H. Breast Cancer https://www.health.harvard.edu/a_to_z/breast-cancer-a-to-z
(accessed Dec 14, 2019).
(18) Wang, X. Chapter 30 - Explore Genomic Profiles for Triple-Negative Breast Cancer to Discover
440. –; pp 4232019; Dammacco, F., Silvestris, F., Eds.; Academic Press, Oncogenomics Drug Targets. In
.2-9.00030-811785-12-0-https://doi.org/10.1016/B978
(19) Understanding TNBC http://triplesteptowardthecure.org/understanding.php (accessed Dec 14, 2019).
(20) Brufsky, A. M.; Dickler, M. N. Estrogen Receptor-Positive Breast Cancer: Exploiting Signaling
539. –(5), 528 23 ,2018 Oncologist Pathways Implicated in Endocrine Resistance.
.0423-https://doi.org/10.1634/theoncologist.2017
(21) King, M. C.; Wieand, S.; Hale, K.; Lee, M.; Walsh, T.; Owens, K.; Tait, J.; Ford, L.; Dunn, B. K.;
Costantino, J.; et al. Tamoxifen and Breast Cancer Incidence among Women with Inherited Mutations in
BRCA1 and BRCA2: National Surgical Adjuvant Breast and Bowel Project (NSABP-P1) Breast Cancer
.https://doi.org/10.1001/jama.286.18.22512256. –(18), 2251 286 ,2001 JAMA Prevention Trial.
(22) Kariagina, A.; Aupperlee, M. D.; Haslam, S. Z. Progesterone Receptor Isoform Functions in Normal
Breast Development and Breast Cancer. Crit Rev Eukaryot Gene Expr 2008, 18 (1), 11–33.
(23) Johnston, S.; Pippen, J.; Pivot, X.; Lichinitser, M.; Sadeghi, S.; Dieras, V.; Gomez, H. L.; Romieu,
G.; Manikhas, A.; Kennedy, M. J.; et al. Lapatinib Combined With Letrozole Versus Letrozole and
Placebo As First-Line Therapy for Postmenopausal Hormone Receptor–Positive Metastatic Breast
.https://doi.org/10.1200/JCO.2009.23.37345546. –(33), 553827 ,2009 JCO Cancer.
(24) Furrer, D.; Paquet, C.; Jacob, S.; Diorio, C. The Human Epidermal Growth Factor Receptor 2
(HER2) as a Prognostic and Predictive Biomarker: Molecular Insights into HER2 Activation and
.i.org/10.5772/intechopen.78271https://do. 2018 Cancer Prognosis Diagnostic Implications.
(25) Anti-HER2 therapies http://www.rkefford.com.au/anti-her2-therapies.html (accessed Dec 14, 2019).
(26) Feng, Y.; Spezia, M.; Huang, S.; Yuan, C.; Zeng, Z.; Zhang, L.; Ji, X.; Liu, W.; Huang, B.; Luo, W.;
et al. Breast Cancer Development and Progression: Risk Factors, Cancer Stem Cells, Signaling Pathways,
Genomics, and Molecular Pathogenesis. Genes Dis 2018, 5 (2), 77–106.
https://doi.org/10.1016/j.gendis.2018.05.001.

125
(27) Aysola, K.; Desai, A.; Welch, C.; Xu, J.; Qin, Y.; Reddy, V.; Matthews, R.; Owens, C.; Okoli, J.;
Beech, D. J.; et al. Triple Negative Breast Cancer – An Overview. Hereditary Genet 2013, 2013 (Suppl
2). https://doi.org/10.4172/2161-1041.S2-001.
(28) Berrocal, J. K. Current Approaches to Triple-Negative Breast Cancer. American Journal of
Hematology / Oncology® 2017, 13 (6).
(29) Perou, C. M. Molecular Stratification of Triple-Negative Breast Cancers. The
Oncologist 2011, 16(Supplement 1), 61–70. https://doi.org/10.1634/theoncologist.2011-S1-61.
(30) Troester, M. A.; Herschkowitz, J. I.; Oh, D. S.; He, X.; Hoadley, K. A.; Barbier, C. S.; Perou, C. M.
Gene Expression Patterns Associated with P53 Status in Breast Cancer. BMC Cancer 2006, 6, 276.
https://doi.org/10.1186/1471-2407-6-276.
(31) Breast cancer | McMaster Pathophysiology Review http://www.pathophys.org/breast-cancer/
(accessed Dec 14, 2019).
(32) Stages of Breast Cancer | Understand Breast Cancer Staging https://www.cancer.org/cancer/breast-
cancer/understanding-a-breast-cancer-diagnosis/stages-of-breast-cancer.html (accessed Dec 14, 2019).
(33) Weledji, E. P.; Tambe, J. Breast Cancer Detection and Screening. Med Clin Rev 2018, 04 (02).
https://doi.org/10.21767/2471-299X.1000071.
(34) Breast Cancer Survival: Statistics and Facts https://www.healthline.com/health/breast-
cancer/survival-facts-statistics (accessed Dec 14, 2019).
(35) Ellis, M. J.; Suman, V. J.; Hoog, J.; Goncalves, R.; Sanati, S.; Creighton, C. J.; DeSchryver, K.;
Crouch, E.; Brink, A.; Watson, M.; et al. Ki67 Proliferation Index as a Tool for Chemotherapy Decisions
During and After Neoadjuvant Aromatase Inhibitor Treatment of Breast Cancer: Results From the
American College of Surgeons Oncology Group Z1031 Trial (Alliance). J. Clin. Oncol. 2017, 35 (10),
1061–1069. https://doi.org/10.1200/JCO.2016.69.4406.
(36) Koçan, S.; Gürsoy, A. Body Image of Women with Breast Cancer After Mastectomy: A Qualitative
Research. J Breast Health 2016, 12 (4), 145–150. https://doi.org/10.5152/tjbh.2016.2913.
(37) Keskin, G.; Gumus, A. B. Turkish Hysterectomy and Mastectomy Patients - Depression, Body
Image, Sexual Problems and Spouse Relationships. Asian Pac. J. Cancer Prev. 2011, 12 (2), 425–432.
(38) Wang, X.; Xu, L.; Yin, Z.; Wang, D.; Wang, Q.; Xu, K.; Zhao, J.; Zhao, L.; Yuan, Z.; Wang, P.
Locoregional Recurrence-Associated Factors and Risk-Adapted Postmastectomy Radiotherapy for Breast
Cancer Staged in CT1-2N0-1 after Neoadjuvant Chemotherapy. Cancer Manag Res 2018, 10, 4105–
4112. https://doi.org/10.2147/CMAR.S173628.
(39) Radiation Therapy Options for Breast Cancer Treatment https://www.verywellhealth.com/breast-
cancer-radiation-methods-430554 (accessed Dec 14, 2019).

126
(40) Ratosa, I.; Jenko, A.; Oblak, I. Breast Size Impact on Adjuvant Radiotherapy Adverse Effects and
Dose Parameters in Treatment Planning. Radiol Oncol 2018, 52 (3), 233–244.
https://doi.org/10.2478/raon-2018-0026.
(41) Pignol, J.-P.; Truong, P.; Rakovitch, E.; Sattler, M. G.; Whelan, T. J.; Olivotto, I. A. Ten Years
Results of the Canadian Breast Intensity Modulated Radiation Therapy (IMRT) Randomized Controlled
Trial. Radiotherapy and Oncology 2016, 121 (3), 414–419. https://doi.org/10.1016/j.radonc.2016.08.021.
(42) Munshi, A.; Kakkar, S.; Budrukkar, A.; Jalali, R. Unusual Intensification of Skin Reactions by
Chloroquine Use during Breast Radiotherapy. Acta Oncol 2008, 47 (2), 318–319.
https://doi.org/10.1080/02841860701491058.
(43) Early Breast Cancer Trialists’ Collaborative Group (EBCTCG). Effects of Chemotherapy and
Hormonal Therapy for Early Breast Cancer on Recurrence and 15-Year Survival: An Overview of the
-6736(05)66544-https://doi.org/10.1016/S01401717. –(9472), 1687 365 ,2005 Lancet Randomised Trials.
.0
(44) Cuzick, J.; Sestak, I.; Baum, M.; Buzdar, A.; Howell, A.; Dowsett, M.; Forbes, J. F.; ATAC/LATTE
investigators. Effect of Anastrozole and Tamoxifen as Adjuvant Treatment for Early-Stage Breast Cancer:
10-Year Analysis of the ATAC Trial. Lancet Oncol. 2010, 11 (12), 1135–1141.
https://doi.org/10.1016/S1470-2045(10)70257-6.
(45) Hayashi, S.; Kimura, M. Mechanisms of Hormonal Therapy Resistance in Breast Cancer. Int. J. Clin.
Oncol.2015, 20 (2), 262–267. https://doi.org/10.1007/s10147-015-0788-5.
(46) O’Shaughnessy, J.; Miles, D.; Vukelja, S.; Moiseyenko, V.; Ayoub, J.-P.; Cervantes, G.; Fumoleau,
P.; Jones, S.; Lui, W.-Y.; Mauriac, L.; et al. Superior Survival with Capecitabine plus Docetaxel
Combination Therapy in Anthracycline-Pretreated Patients with Advanced Breast Cancer: Phase III Trial
Results. J. Clin. Oncol.2002, 20 (12), 2812–2823. https://doi.org/10.1200/JCO.2002.09.002.
(47) Early Breast Cancer Trialists’ Collaborative Group (EBCTCG); Peto, R.; Davies, C.; Godwin, J.;
Gray, R.; Pan, H. C.; Clarke, M.; Cutter, D.; Darby, S.; McGale, P.; et al. Comparisons between Different
Polychemotherapy Regimens for Early Breast Cancer: Meta-Analyses of Long-Term Outcome among
100,000 Women in 123 Randomised Trials. Lancet 2012, 379 (9814), 432–444.
https://doi.org/10.1016/S0140-6736(11)61625-5.
(48) McGowan, J. V.; Chung, R.; Maulik, A.; Piotrowska, I.; Walker, J. M.; Yellon, D. M. Anthracycline
Chemotherapy and Cardiotoxicity. Cardiovasc Drugs Ther 2017, 31 (1), 63–75.
https://doi.org/10.1007/s10557-016-6711-0.
(49) Venkatesh, P.; Kasi, A. Anthracyclines. In StatPearls; StatPearls Publishing: Treasure Island (FL),
2019.
(50) Pearce, A.; Haas, M.; Viney, R.; Pearson, S.-A.; Haywood, P.; Brown, C.; Ward, R. Incidence and
Severity of Self-Reported Chemotherapy Side Effects in Routine Care: A Prospective Cohort
Study. PLoS One 2017, 12(10). https://doi.org/10.1371/journal.pone.0184360.
(51) Doxorubicin. Wikipedia; 2019.
.

127
(52) Yu, A. F.; Chan, A. T.; Steingart, R. M. Cardiac Magnetic Resonance and Cardio-Oncology: Does
T2 Signal the End of Anthracycline Cardiotoxicity? J. Am. Coll. Cardiol. 2019, 73 (7), 792–794.
https://doi.org/10.1016/j.jacc.2018.11.045.
(53) Akbarzadeh, A.; Samiei, M.; Joo, S. W.; Anzaby, M.; Hanifehpour, Y.; Nasrabadi, H. T.; Davaran,
S. Synthesis, Characterization and in Vitro Studies of Doxorubicin-Loaded Magnetic Nanoparticles
Grafted to Smart Copolymers on A549 Lung Cancer Cell Line. J Nanobiotechnology 2012, 10, 46.
https://doi.org/10.1186/1477-3155-10-46.
(54) McGowan, J. V.; Chung, R.; Maulik, A.; Piotrowska, I.; Walker, J. M.; Yellon, D. M. Anthracycline
Chemotherapy and Cardiotoxicity. Cardiovasc Drugs Ther 2017, 31 (1), 63–75.
https://doi.org/10.1007/s10557-016-6711-0.
(55) Cai, F.; Luis, M. A. F.; Lin, X.; Wang, M.; Cai, L.; Cen, C.; Biskup, E. Anthracycline-Induced
Cardiotoxicity in the Chemotherapy Treatment of Breast Cancer: Preventive Strategies and
Treatment. Mol Clin Oncol 2019, 11 (1), 15–23. https://doi.org/10.3892/mco.2019.1854.
(56) Burney, I. Cancer Chemotherapy and Biotherapy. Sultan Qaboos Univ Med J 2011, 11 (3), 424–425.
(57) Doxorubicin https://www.drugbank.ca/drugs/DB00997 (accessed Dec 14, 2019).
(58) Doxorubicin Solution for Injection - Summary of Product Characteristics (SmPC) - (emc)
https://www.medicines.org.uk/emc/product/6184/smpc (accessed Dec 14, 2019).
(59) Gewirtz, D. A. A Critical Evaluation of the Mechanisms of Action Proposed for the Antitumor
Effects of the Anthracycline Antibiotics Adriamycin and Daunorubicin. Biochem.
Pharmacol. 1999, 57 (7), 727–741. https://doi.org/10.1016/s0006-2952(98)00307-4.
(60) Luu, A. Z.; Chowdhury, B.; Al-Omran, M.; Teoh, H.; Hess, D. A.; Verma, S. Role of Endothelium
in Doxorubicin-Induced Cardiomyopathy. JACC Basic Transl Sci 2018, 3 (6), 861–870.
https://doi.org/10.1016/j.jacbts.2018.06.005.
(61) Chun, K.-H.; Park, J. H.; Fan, S. Predicting and Overcoming Chemotherapeutic Resistance in Breast
Cancer. Adv. Exp. Med. Biol. 2017, 1026, 59–104. https://doi.org/10.1007/978-981-10-6020-5_4.
(62) Zanosar (Streptozocin): Uses, Dosage, Side Effects, Interactions, Warning
https://www.rxlist.com/zanosar-drug.htm (accessed Dec 14, 2019).
(63) Kuhlmann, J.; Zilly, W.; Wilke, J. Effects of Cytostatic Drugs on Plasma Level and Renal Excretion
of Beta-Acetyldigoxin. Clin. Pharmacol. Ther. 1981, 30 (4), 518–527.
https://doi.org/10.1038/clpt.1981.197.
(64) Effect of Ciprofloxacin on the Plasma Concentration of Doxorubicin, Following Acute and Chronic
Dose Protocol in Sprague Dawley Rats - SciAlert Responsive Version
https://scialert.net/fulltextmobile/?doi=ijp.2014.69.77 (accessed Dec 14, 2019).
https://doi.org/10.3923/ijp.2014.69.77.
(65) van Leeuwen, R. W. F.; Swart, E. L.; Boven, E.; Boom, F. A.; Schuitenmaker, M. G.; Hugtenburg, J.
G. Potential Drug Interactions in Cancer Therapy: A Prevalence Study Using an Advanced Screening
Method. Ann Oncol 2011, 22 (10), 2334–2341. https://doi.org/10.1093/annonc/mdq761.

128
(66) Dodion, P.; Akman, S. R.; Tamburini, J. M.; Riggs, C. E.; Colvin, O. M.; Bachur, N. R. Interactions
between Cyclophosphamide and Doxorubicin Metabolism in Rats. II. Effect of Cyclophosphamide on the
Aldoketoreductase System. J. Pharmacol. Exp. Ther. 1986, 237 (1), 271–274.
(67) Doxorubicin - an overview | ScienceDirect Topics https://www.sciencedirect.com/topics/medicine-
and-dentistry/doxorubicin (accessed Dec 14, 2019).
(68) Rushing, D. A.; Raber, S. R.; Rodvold, K. A.; Piscitelli, S. C.; Plank, G. S.; Tewksbury, D. A. The
Effects of Cyclosporine on the Pharmacokinetics of Doxorubicin in Patients with Small Cell Lung
Cancer. Cancer1994, 74 (3), 834–841. https://doi.org/10.1002/1097-0142(19940801)74:3<834::aid-
cncr2820740308>3.0.co;2-9.
(69) Singh, N. K.; Singh, S. K.; Dash, D.; Das Purkayastha, B. P.; Roy, J. K.; Maiti, P. Nanostructure
Controlled Anti-Cancer Drug Delivery Using Poly(ε-Caprolactone) Based Nanohybrids. J. Mater.
Chem. 2012, 22 (34), 17853. https://doi.org/10.1039/c2jm32340k.
(70) Rapoport, N.; Gao, Z.; Kennedy, A. Multifunctional Nanoparticles for Combining Ultrasonic Tumor
Imaging and Targeted Chemotherapy. J. Natl. Cancer Inst. 2007, 99 (14), 1095–1106.
https://doi.org/10.1093/jnci/djm043.
(71) Khodadust, R.; Unsoy, G.; Yalcın, S.; Gunduz, G.; Gunduz, U. PAMAM Dendrimer-Coated Iron
Oxide Nanoparticles: Synthesis and Characterization of Different Generations. J Nanopart
Res 2013, 15 (3), 1488. https://doi.org/10.1007/s11051-013-1488-6.
(72) Size-Comparison-Bio-Nanoparticles Nanometer Scale Comparison Nanoparticle Size Comparison
Nanotechnology Chart Ruler. Wich Research Lab, 2017.
(73) Shah, M. Gold Nanoparticles: Various Methods of Synthesis and Antibacterial Applications. Front
Biosci2014, 19 (8), 1320. https://doi.org/10.2741/4284.
(74) Rügheimer, L.; Hansell, P.; Wolgast, M. Determination of the Charge of the Plasma Proteins and
Consequent Donnan Equilibrium across the Capillary Barriers in the Rat Microvasculature. Acta
.1716.2008.01893.x-https://doi.org/10.1111/j.1748339. –(4), 335194 ,2008 Physiologica
(75) Gatenby, R. A.; Gillies, R. J. Why Do Cancers Have High Aerobic Glycolysis? Nat. Rev.
Cancer 2004, 4 (11), 891–899. https://doi.org/10.1038/nrc1478.
(76) Potter, M.; Newport, E.; Morten, K. J. The Warburg Effect: 80 Years On. Biochem Soc
Trans 2016, 44 (5), 1499–1505. https://doi.org/10.1042/BST20160094.
(77) Nagpal, K.; Singh, S. K.; Mishra, D. N. Chitosan Nanoparticles: A Promising System in Novel Drug
Delivery. Chem. Pharm. Bull. 2010, 58 (11), 1423–1430. https://doi.org/10.1248/cpb.58.1423.
(78) Vander Heiden, M. G.; Cantley, L. C.; Thompson, C. B. Understanding the Warburg Effect: The
Metabolic Requirements of Cell Proliferation. Science 2009, 324 (5930), 1029–1033.
https://doi.org/10.1126/science.1160809.
129
(79) Chen, B.; Le, W.; Wang, Y.; Li, Z.; Wang, D.; Ren, L.; Lin, L.; Cui, S.; Hu, J. J.; Hu, Y.; et al.
Targeting Negative Surface Charges of Cancer Cells by Multifunctional
Nanoprobes. Theranostics 2016, 6 (11), 1887–1898. https://doi.org/10.7150/thno.16358.
(80) Osaka, T.; Nakanishi, T.; Shanmugam, S.; Takahama, S.; Zhang, H. Effect of Surface Charge of
Magnetite Nanoparticles on Their Internalization into Breast Cancer and Umbilical Vein Endothelial
Cells. Colloids Surf B Biointerfaces 2009, 71 (2), 325–330.
https://doi.org/10.1016/j.colsurfb.2009.03.004.
(81) Dadwal, A.; Baldi, A.; Narang, R. K. Nanoparticles as Carriers for Drug Delivery in
Cancer. Artificial Cells, Nanomedicine, and Biotechnology 2018, 46 (sup2), 295–305.
https://doi.org/10.1080/21691401.2018.1457039.
(82) Nanoparticles as a Drug Delivery System http://www.medscape.com/viewarticle/770397 (accessed
Dec 14, 2019).
(83) Bae, Y. H.; Park, K. Targeted Drug Delivery to Tumors: Myths, Reality and Possibility. Journal of
Controlled Release 2011, 153 (3), 198–205. https://doi.org/10.1016/j.jconrel.2011.06.001.
(84) Nanoparticles as a Drug Delivery System http://www.medscape.com/viewarticle/770397 (accessed
Dec 14, 2019).
(85) Prajapati, S. K.; Jain, A.; Shrivastava, C.; Jain, A. K. Hyaluronic Acid Conjugated Multi-Walled
Carbon Nanotubes for Colon Cancer Targeting. International Journal of Biological
Macromolecules 2019, 123, 691–703. https://doi.org/10.1016/j.ijbiomac.2018.11.116.
(86) Cheng, L.; Huang, F.-Z.; Cheng, L.-F.; Zhu, Y.-Q.; Hu, Q.; Li, L.; Wei, L.; Chen, D.-W. GE11-
Modified Liposomes for Non-Small Cell Lung Cancer Targeting: Preparation, Ex Vitro and in Vivo
Evaluation. Int J Nanomedicine 2014, 9, 921–935. https://doi.org/10.2147/IJN.S53310.
(87) Jain, N. K.; Tare, M. S.; Mishra, V.; Tripathi, P. K. The Development, Characterization and in Vivo
Anti-Ovarian Cancer Activity of Poly(Propylene Imine) (PPI)-Antibody Conjugates Containing
Encapsulated Paclitaxel. Nanomedicine: Nanotechnology, Biology and Medicine 2015, 11 (1), 207–218.
https://doi.org/10.1016/j.nano.2014.09.006.
(88) Ahn, J.; Miura, Y.; Yamada, N.; Chida, T.; Liu, X.; Kim, A.; Sato, R.; Tsumura, R.; Koga, Y.;
Yasunaga, M.; et al. Antibody Fragment-Conjugated Polymeric Micelles Incorporating Platinum Drugs
for Targeted Therapy of Pancreatic Cancer. Biomaterials 2015, 39, 23–30.
https://doi.org/10.1016/j.biomaterials.2014.10.069.
(89) Baas, J.; Senninger, N.; Elser, H. [The reticuloendothelial system. An overview of function,
pathology and recent methods of measurement]. Z Gastroenterol 1994, 32 (2), 117–123.
(90) Attia, M. F.; Anton, N.; Wallyn, J.; Omran, Z.; Vandamme, T. F. An Overview of Active and
Passive Targeting Strategies to Improve the Nanocarriers Efficiency to Tumour Sites. Journal of
Pharmacy and Pharmacology 2019, 71 (8), 1185–1198. https://doi.org/10.1111/jphp.13098.
(91) Nadeem, M.; Ahmad, M.; Akhtar, M. S.; Shaari, A.; Riaz, S.; Naseem, S.; Masood, M.; Saeed, M.
A. Magnetic Properties of Polyvinyl Alcohol and Doxorubicine Loaded Iron Oxide Nanoparticles for
Anticancer Drug Delivery Applications. PLoS One 2016, 11 (6).
https://doi.org/10.1371/journal.pone.0158084.
130
(92) Guo, H.; Li, F.; Qiu, H.; Zheng, Q.; Yang, C.; Tang, C.; Hou, Y. Chitosan-Based Nanogel Enhances
Chemotherapeutic Efficacy of 10-Hydroxycamptothecin against Human Breast Cancer Cells
https://www.hindawi.com/journals/ijps/2019/1914976/ (accessed Dec 14, 2019).
https://doi.org/10.1155/2019/1914976.
(93) Kirpotin, D. B.; Drummond, D. C.; Shao, Y.; Shalaby, M. R.; Hong, K.; Nielsen, U. B.; Marks, J. D.;
Benz, C. C.; Park, J. W. Antibody Targeting of Long-Circulating Lipidic Nanoparticles Does Not
Increase Tumor Localization but Does Increase Internalization in Animal Models. Cancer
Res. 2006, 66 (13), 6732–6740. https://doi.org/10.1158/0008-5472.CAN-05-4199.
(94) Grenha, A. Chitosan Nanoparticles: A Survey of Preparation Methods. J Drug Target 2012, 20 (4),
291–300. https://doi.org/10.3109/1061186X.2011.654121.
(95) Campos, E. V. R.; Oliveira, J. L.; Fraceto, L. F. Poly(Ethylene Glycol) and Cyclodextrin-Grafted
Chitosan: From Methodologies to Preparation and Potential Biotechnological Applications. Front
Chem 2017, 5. https://doi.org/10.3389/fchem.2017.00093.
(96) Anand, M.; Sathyapriya, P.; Maruthupandy, M.; Hameedha Beevi, A. Synthesis of Chitosan
Nanoparticles by TPP and Their Potential Mosquito Larvicidal Application. Frontiers in Laboratory
Medicine 2018, 2 (2), 72–78. https://doi.org/10.1016/j.flm.2018.07.003.
(97) Kefayat, A.; Vaezifar, S. Biodegradable PLGA Implants Containing Doxorubicin-Loaded Chitosan
Nanoparticles for Treatment of Breast Tumor-Bearing Mice. International Journal of Biological
Macromolecules 2019, 136, 48–56. https://doi.org/10.1016/j.ijbiomac.2019.06.055.
(98) Vivek, R.; Nipun Babu, V.; Thangam, R.; Subramanian, K. S.; Kannan, S. PH-Responsive Drug
Delivery of Chitosan Nanoparticles as Tamoxifen Carriers for Effective Anti-Tumor Activity in Breast
Cancer Cells. Colloids and Surfaces B: Biointerfaces 2013, 111, 117–123.
https://doi.org/10.1016/j.colsurfb.2013.05.018.
(99) Liang, N.; Sun, S.; Hong, J.; Tian, J.; Fang, L.; Cui, F. In Vivo Pharmacokinetics, Biodistribution
and Antitumor Effect of Paclitaxel-Loaded Micelles Based on α-Tocopherol Succinate-Modified
Chitosan. Drug Delivery 2016, 23 (8), 2651–2660. https://doi.org/10.3109/10717544.2015.1045103.
(100) Naruphontjirakul, P.; Viravaidya-Pasuwat, K. Development of Anti-HER2-Targeted Doxorubicin–
Core-Shell Chitosan Nanoparticles for the Treatment of Human Breast Cancer. Int J
Nanomedicine 2019, 14, 4105–4121. https://doi.org/10.2147/IJN.S198552.
(101) Yousefpour, P.; Atyabi, F.; Vasheghani-Farahani, E.; Movahedi, A.-A. M.; Dinarvand, R. Targeted
Delivery of Doxorubicin-Utilizing Chitosan Nanoparticles Surface-Functionalized with Anti-Her2
Trastuzumab. Int J Nanomedicine 2011, 6, 1977–1990. https://doi.org/10.2147/IJN.S21523.
(102) Souto, G. D.; Farhane, Z.; Casey, A.; Efeoglu, E.; McIntyre, J.; Byrne, H. J. Evaluation of
Cytotoxicity Profile and Intracellular Localisation of Doxorubicin-Loaded Chitosan Nanoparticles. Anal
Bioanal Chem2016, 408 (20), 5443–5455. https://doi.org/10.1007/s00216-016-9641-6.
(103) Sawtarie, N.; Cai, Y.; Lapitsky, Y. Preparation of Chitosan/Tripolyphosphate Nanoparticles with
Highly Tunable Size and Low Polydispersity. Colloids and Surfaces B: Biointerfaces 2017, 157, 110–
117. https://doi.org/10.1016/j.colsurfb.2017.05.055.

131
(104) Sodium Triphosphate. Wikipedia; 2019.
(105) Polyethylene Glycol - an overview | ScienceDirect Topics
https://www.sciencedirect.com/topics/neuroscience/polyethylene-glycol (accessed Dec 14, 2019).
(106) Alconcel, S. N. S.; Baas, A. S.; Maynard, H. D. FDA-Approved Poly(Ethylene Glycol)–Protein
Conjugate Drugs. Polym. Chem. 2011, 2 (7), 1442–1448. https://doi.org/10.1039/C1PY00034A.
(107) Foster, L. J. R. Biosynthesis, Properties and Potential of Natural-Synthetic Hybrids of
Polyhydroxyalkanoates and Polyethylene Glycols. Appl. Microbiol. Biotechnol. 2007, 75 (6), 1241–1247.
https://doi.org/10.1007/s00253-007-0976-y.
(108) Chivukula, M.; Dabbs, D. J. Chapter 21 - Immunocytology. In Diagnostic Immunohistochemistry
(Third Edition); Dabbs, D. J., Ed.; W.B. Saunders: Philadelphia, 2011; pp 890–918.
https://doi.org/10.1016/B978-1-4160-5766-6.00025-X.
(109) Watson, M. A.; Dintzis, S.; Darrow, C. M.; Voss, L. E.; DiPersio, J.; Jensen, R.; Fleming, T. P.
Mammaglobin Expression in Primary, Metastatic, and Occult Breast Cancer. Cancer Res. 1999, 59 (13),
3028–3031.
(110) Zuo, L.; Li, L.; Wang, Q.; Fleming, T. P.; You, S. Mammaglobin as a Potential Molecular Target
for Breast Cancer Drug Delivery. Cancer Cell International 2009, 9 (1), 8. https://doi.org/10.1186/1475-
2867-9-8.
(111) Leygue, E.; Snell, L.; Dotzlaw, H.; Hole, K.; Troup, S.; Hiller-Hitchcock, T.; Murphy, L. C.;
Watson, P. H. Mammaglobin, a Potential Marker of Breast Cancer Nodal Metastasis. J.
Pathol. 1999, 189 (1), 28–33. https://doi.org/10.1002/(SICI)1096-9896(199909)189:1<28::AID-
PATH389>3.0.CO;2-H.
(112) Calvo, P.; Remuñán‐López, C.; Vila‐Jato, J. L.; Alonso, M. J. Novel Hydrophilic Chitosan-
Polyethylene Oxide Nanoparticles as Protein Carriers. Journal of Applied Polymer Science 1997, 63 (1),
125–132. https://doi.org/10.1002/(SICI)1097-4628(19970103)63:1<125::AID-APP13>3.0.CO;2-4.
(113) Sreekumar, S.; Goycoolea, F. M.; Moerschbacher, B. M.; Rivera-Rodriguez, G. R. Parameters
Influencing the Size of Chitosan-TPP Nano- and Microparticles. Sci Rep 2018, 8.
https://doi.org/10.1038/s41598-018-23064-4.
(114) Sharma, D.; Maheshwari, D.; Philip, G.; Rana, R.; Bhatia, S.; Singh, M.; Gabrani, R.; Sharma, S.
K.; Ali, J.; Sharma, R. K.; et al. Formulation and Optimization of Polymeric Nanoparticles for Intranasal
Delivery of Lorazepam Using Box-Behnken Design: In Vitro and In Vivo Evaluation
https://www.hindawi.com/journals/bmri/2014/156010/ (accessed Dec 14, 2019).
https://doi.org/10.1155/2014/156010.
(115) Robertson, J. D.; Rizzello, L.; Avila-Olias, M.; Gaitzsch, J.; Contini, C.; Magoń, M. S.; Renshaw,
S. A.; Battaglia, G. Purification of Nanoparticles by Size and Shape. Scientific Reports 2016, 6 (1), 1–9.
https://doi.org/10.1038/srep27494.

132
(116) Masarudin, M. J.; Cutts, S. M.; Evison, B. J.; Phillips, D. R.; Pigram, P. J. Factors determining the
stability, size distribution, and cellular accumulation of small, monodisperse chitosan nanoparticles as
-C]14te vectors for anticancer drug delivery: application to the passive encapsulation of [candida
doxorubicin https://www.dovepress.com/factors-determining-the-stability-size-distribution-and-cellular-
accum-peer-reviewed-fulltext-article-NSA (accessed Dec 14, 2019).
https://doi.org/10.2147/NSA.S91785.
(117) Smith, M. C.; Crist, R. M.; Clogston, J. D.; McNeil, S. E. Zeta Potential: A Case Study of Cationic,
Anionic, and Neutral Liposomes. Anal Bioanal Chem 2017, 409 (24), 5779–5787.
https://doi.org/10.1007/s00216-017-0527-z.
(118) Babu, A.; Ramesh, R. Multifaceted Applications of Chitosan in Cancer Drug Delivery and
Therapy. Mar Drugs 2017, 15 (4). https://doi.org/10.3390/md15040096.
(119) Quiñones, J. P.; Peniche, H.; Peniche, C. Chitosan Based Self-Assembled Nanoparticles in Drug
Delivery. Polymers (Basel) 2018, 10 (3). https://doi.org/10.3390/polym10030235.
(120) Yu, S.; Xu, X.; Feng, J.; Liu, M.; Hu, K. Chitosan and Chitosan Coating Nanoparticles for the
Treatment of Brain Disease. International Journal of Pharmaceutics 2019, 560, 282–293.
https://doi.org/10.1016/j.ijpharm.2019.02.012.
(121) Calvo, P.; Remuñan-López, C.; Vila-Jato, J. L.; Alonso, M. J. Chitosan and Chitosan/Ethylene
Oxide-Propylene Oxide Block Copolymer Nanoparticles as Novel Carriers for Proteins and
Vaccines. Pharm Res1997, 14 (10), 1431–1436. https://doi.org/10.1023/A:1012128907225.
(122) Zhang, X. G.; Teng, D. Y.; Wu, Z. M.; Wang, X.; Wang, Z.; Yu, D. M.; Li, C. X. PEG-Grafted
Chitosan Nanoparticles as an Injectable Carrier for Sustained Protein Release. J Mater Sci Mater
Med 2008, 19 (12), 3525–3533. https://doi.org/10.1007/s10856-008-3500-8.
(123) Alconcel, S. N. S.; Baas, A. S.; Maynard, H. D. FDA-Approved Poly(Ethylene Glycol)–Protein
Conjugate Drugs. Polym. Chem. 2011, 2 (7), 1442–1448. https://doi.org/10.1039/C1PY00034A.
(124) Jokerst, J. V.; Lobovkina, T.; Zare, R. N.; Gambhir, S. S. Nanoparticle PEGylation for Imaging and
Therapy. Nanomedicine (Lond) 2011, 6 (4), 715–728. https://doi.org/10.2217/nnm.11.19.
(125) Jayaraman, M. S.; Bharali, D. J.; Sudha, T.; Mousa, S. A. Nano Chitosan Peptide as a Potential
Therapeutic Carrier for Retinal Delivery to Treat Age-Related Macular Degeneration. Mol Vis 2012, 18,
2300–2308.
(126) Doustgani, A.; Farahani, E. V.; Imani, M.; Doulabi, A. H. Dexamethasone Sodium Phosphate
Release from Chitosan Nanoparticles Prepared by Ionic Gelation Method. j coll sci
biotechnol 2012, 1 (1), 42–50. https://doi.org/10.1166/jcsb.2012.1009.
(127) Zhang, X.; Zhang, H.; Wu, Z.; Wang, Z.; Niu, H.; Li, C. Nasal Absorption Enhancement of Insulin
Using PEG-Grafted Chitosan Nanoparticles. Eur J Pharm Biopharm 2008, 68 (3), 526–534.
https://doi.org/10.1016/j.ejpb.2007.08.009.

133
(128) Kobayashi, H. Cancer Chemotherapy Specific to Acidic Nests. Cancers 2017, 9 (12), 36.
https://doi.org/10.3390/cancers9040036.
(129) Campos, E. V. R.; Oliveira, J. L.; Fraceto, L. F. Poly(Ethylene Glycol) and Cyclodextrin-Grafted
Chitosan: From Methodologies to Preparation and Potential Biotechnological Applications. Front
Chem 2017, 5, 93. https://doi.org/10.3389/fchem.2017.00093.
(130) Malhotra, M.; Lane, C.; Tomaro-Duchesneau, C.; Saha, S.; Prakash, S. A Novel Method for
Synthesizing PEGylated Chitosan Nanoparticles: Strategy, Preparation, and in Vitro Analysis. Int J
Nanomedicine 2011, 6, 485–494. https://doi.org/10.2147/IJN.S17190.
(131) Dziawer, Ł.; Majkowska-Pilip, A.; Gaweł, D.; Godlewska, M.; Pruszyński, M.; Jastrzębski, J.; Wąs,
B.; Bilewicz, A. Trastuzumab-Modified Gold Nanoparticles Labeled with 211At as a Prospective Tool for
Local Treatment of HER2-Positive Breast Cancer. Nanomaterials (Basel) 2019, 9 (4).
https://doi.org/10.3390/nano9040632.
(132) Fischer, M. J. E. Amine Coupling Through EDC/NHS: A Practical Approach. In Surface Plasmon
Resonance: Methods and Protocols; Mol, N. J., Fischer, M. J. E., Eds.; Methods in Molecular Biology;
Humana Press: Totowa, NJ, 2010; pp 55–73. https://doi.org/10.1007/978-1-60761-670-2_3.
(133) Chen, Y.; Furmann, A.; Mastalerz, M.; Schimmelmann, A. Quantitative Analysis of Shales by KBr-
FTIR and Micro-FTIR. Fuel 2014, 116, 538–549. https://doi.org/10.1016/j.fuel.2013.08.052.
(134) Piacentini, E. Encapsulation Efficiency. In Encyclopedia of Membranes; Drioli, E., Giorno, L.,
Eds.; Springer: Berlin, Heidelberg, 2016; pp 706–707. https://doi.org/10.1007/978-3-662-44324-8_1945.
(135) Ostrowska-Czubenko, J.; Pieróg, M.; Gierszewska-Drużyńska, M. Equilibrium Swelling Behavior
of Crosslinked Chitosan Hydrogels. Polish Journal of Applied Chemistry 2011, No. Vol. 55, nr 2, 49–56.
(136) Wu, W.; Luo, L.; Wang, Y.; Wu, Q.; Dai, H.-B.; Li, J.-S.; Durkan, C.; Wang, N.; Wang, G.-X.
Endogenous PH-Responsive Nanoparticles with Programmable Size Changes for Targeted Tumor
3058. –(11), 3038 8 ,2018 Theranostics g Applications.Therapy and Imagin
.https://doi.org/10.7150/thno.23459
(137) Swelling Ratio - an overview | ScienceDirect Topics
https://www.sciencedirect.com/topics/engineering/swelling-ratio (accessed Dec 14, 2019).
(138) 14:00-17:00. ISO 10993-5:2009
http://www.iso.org/cms/render/live/en/sites/isoorg/contents/data/standard/03/64/36406.html (accessed
Dec 14, 2019).
(139) Cell Viability - an overview | ScienceDirect Topics
https://www.sciencedirect.com/topics/neuroscience/cell-viability (accessed Dec 14, 2019).
(140) The principles of dynamic light scattering :: Anton Paar Wiki https://wiki.anton-paar.com/en/the-
principles-of-dynamic-light-scattering/ (accessed Dec 14, 2019).
(141) Dynamic Light Scattering - an overview | ScienceDirect Topics
https://www.sciencedirect.com/topics/biochemistry-genetics-and-molecular-biology/dynamic-light-
scattering (accessed Dec 14, 2019).

134
(142) Chapter 10 - Microfluidic Methods for Measuring Zeta Potential. In Interface Science and
Technology; Li, D., Ed.; Electrokinetics in Microfluidics; Elsevier, 2004; Vol. 2, pp 617–640.
https://doi.org/10.1016/S1573-4285(04)80032-2.
(143) Selvamani, V. Chapter 15 - Stability Studies on Nanomaterials Used in Drugs. In Characterization
and Biology of Nanomaterials for Drug Delivery; Mohapatra, S. S., Ranjan, S., Dasgupta, N., Mishra, R.
K., Thomas, S., Eds.; Micro and Nano Technologies; Elsevier, 2019; pp 425–444.
https://doi.org/10.1016/B978-0-12-814031-4.00015-5.
(144) Zeta potential measurement principle (Laser Doppler Electrophoresis)
https://researchpark.spbu.ru/en/olmiv-metods-eng/920-olmiv-zeta-eng (accessed Dec 14, 2019).
(145) Mohamed, M. A.; Jaafar, J.; Ismail, A. F.; Othman, M. H. D.; Rahman, M. A. Chapter 1 - Fourier
Transform Infrared (FTIR) Spectroscopy. In Membrane Characterization; Hilal, N., Ismail, A. F.,
Matsuura, T., Oatley-Radcliffe, D., Eds.; Elsevier, 2017; pp 3–29. https://doi.org/10.1016/B978-0-444-
63776-5.00001-2.
(146) Sindhu, R.; Binod, P.; Pandey, A. Chapter 17 - Microbial Poly-3-Hydroxybutyrate and Related
Copolymers. In Industrial Biorefineries & White Biotechnology; Pandey, A., Höfer, R., Taherzadeh, M.,
Nampoothiri, K. M., Larroche, C., Eds.; Elsevier: Amsterdam, 2015; pp 575–605.
https://doi.org/10.1016/B978-0-444-63453-5.00019-7.
(147) FTIR instrumentation and theory https://chemistry.oregonstate.edu/courses/ch361-
464/ch362/irinstrs.htm (accessed Dec 14, 2019).
(148) Structural Analysis of Merino Wool, Pashmina And Angora Fibers Using Analytical Instruments
Like Scanning Electron Microscope And Infra-Red Spectroscopy | Infrared Spectroscopy | Scanning
Electron Microscope https://www.scribd.com/document/357954955/Structural-Analysis-Of-Merino-
Wool-Pashmina-And-Angora-Fibers-Using-Analytical-Instruments-Like-Scanning-Electron-Microscope-
And-Infra-Red-Spectrosco (accessed Dec 14, 2019).
(149) X-Ray Diffraction - an overview | ScienceDirect Topics
https://www.sciencedirect.com/topics/materials-science/x-ray-diffraction (accessed Dec 14, 2019).
(150) X-ray Powder Diffraction (XRD)
https://serc.carleton.edu/research_education/geochemsheets/techniques/XRD.html (accessed Dec 14,
2019).
(151) X-ray diffraction | Clays and Minerals https://www.claysandminerals.com/equipment/xrd (accessed
Dec 14, 2019).
(152) Potential valorization of by-product materials from oil palm: A review of alternative and sustainable
carbon sources for carbon-based nanomaterials synthesis :: BioResources
https://bioresources.cnr.ncsu.edu/ (accessed Dec 14, 2019).
(153) Spectrophotometer-WINCOM COMPANY LTD
http://www.chinawincom.com/Spectrophotometer.html?gclid=Cj0KCQiArdLvBRCrARIsAGhB_sz4OJR
CpMvqcC36D41aHgdqnQW-OMAcUSlIl_ySlJ5lPvEhYc06BOAaAnJfEALw_wcB (accessed Dec 14,
2019).
(154) Beer Lambert Law | Transmittance & Absorbance. Edinburgh Instruments.

135
(155) UV-Visible Spectroscopy
https://www2.chemistry.msu.edu/faculty/reusch/VirtTxtJml/Spectrpy/UV-Vis/uvspec.htm (accessed Dec
14, 2019).
(156) Dong, Y.; Ng, W. K.; Shen, S.; Kim, S.; Tan, R. B. H. Scalable Ionic Gelation Synthesis of
Chitosan Nanoparticles for Drug Delivery in Static Mixers. Carbohydr Polym 2013, 94 (2), 940–945.
https://doi.org/10.1016/j.carbpol.2013.02.013.
(157) Sreekumar, S.; Goycoolea, F. M.; Moerschbacher, B. M.; Rivera-Rodriguez, G. R. Parameters
Influencing the Size of Chitosan-TPP Nano- and Microparticles. Scientific Reports 2018, 8 (1), 1–11.
https://doi.org/10.1038/s41598-018-23064-4.
(158) The Applications and Practical Uses of Scanning Electron Microscopes
https://www.atascientific.com.au/sem-imaging-applications-practical-uses-scanning-electron-
microscopes/ (accessed Dec 14, 2019).
(159) Scanning Electron Microscopy - an overview | ScienceDirect Topics
https://www.sciencedirect.com/topics/neuroscience/scanning-electron-microscopy (accessed Dec 14,
2019).
(160) Inkson, B. J. 2 - Scanning Electron Microscopy (SEM) and Transmission Electron Microscopy
(TEM) for Materials Characterization. In Materials Characterization Using Nondestructive Evaluation
(NDE) Methods; Hübschen, G., Altpeter, I., Tschuncky, R., Herrmann, H.-G., Eds.; Woodhead
Publishing, 2016; pp 17–43. https://doi.org/10.1016/B978-0-08-100040-3.00002-X.
(161) Su, D. Advanced Electron Microscopy Characterization of Nanomaterials for Catalysis. Green
Energy & Environment 2017, 2 (2), 70–83. https://doi.org/10.1016/j.gee.2017.02.001.
(162) Tang, C. Y.; Yang, Z. Chapter 8 - Transmission Electron Microscopy (TEM). In Membrane
Characterization; Hilal, N., Ismail, A. F., Matsuura, T., Oatley-Radcliffe, D., Eds.; Elsevier, 2017; pp
145–159. https://doi.org/10.1016/B978-0-444-63776-5.00008-5.
(163) Rizvi, S. A. A.; Saleh, A. M. Applications of Nanoparticle Systems in Drug Delivery
Technology. Saudi Pharm J 2018, 26 (1), 64–70. https://doi.org/10.1016/j.jsps.2017.10.012.
(164) Harris, J. R. Transmission Electron Microscopy in Molecular Structural Biology: A Historical
Survey. Archives of Biochemistry and Biophysics 2015, 581, 3–18.
https://doi.org/10.1016/j.abb.2014.11.011.
(165) Koukaras, E. N.; Papadimitriou, S. A.; Bikiaris, D. N.; Froudakis, G. E. Insight on the Formation
of Chitosan Nanoparticles through Ionotropic Gelation with Tripolyphosphate. Mol. Pharm. 2012, 9 (10),
2856–2862. https://doi.org/10.1021/mp300162j.
(166) Al-nemrawi, N. K.; Alsharif, S. S. M.; Dave, R. H. PREPARATION OF CHITOSAN-TPP
NANOPARTICLES: THE INFLUENCE OF CHITOSAN POLYMERIC PROPERTIES AND

136
FORMULATION VARIABLES. Int J App Pharm 2018, 10 (5), 60.
https://doi.org/10.22159/ijap.2018v10i5.26375.
(167) Karimi, M.; Avci, P.; Ahi, M.; Gazori, T.; Hamblin, M. R.; Naderi-Manesh, H. Evaluation of
Chitosan-Tripolyphosphate Nanoparticles as a p-ShRNA Delivery Vector: Formulation, Optimization and
Cellular Uptake Study. J Nanopharm Drug Deliv 2013, 1 (3), 266–278.
https://doi.org/10.1166/jnd.2013.1027.
(168) Jonassen, H.; Kjøniksen, A.-L.; Hiorth, M. Stability of Chitosan Nanoparticles Cross-Linked with
Tripolyphosphate. Biomacromolecules 2012, 13 (11), 3747–3756. https://doi.org/10.1021/bm301207a.
(169) Jonassen, H.; Kjøniksen, A.-L.; Hiorth, M. Effects of Ionic Strength on the Size and Compactness
of Chitosan Nanoparticles. Colloid Polym Sci 2012, 290 (10), 919–929. https://doi.org/10.1007/s00396-
012-2604-3.
(170) Alsarra, I. A.; Betigeri, S. S.; Zhang, H.; Evans, B. A.; Neau, S. H. Molecular Weight and Degree
of Deacetylation Effects on Lipase-Loaded Chitosan Bead Characteristics. Biomaterials 2002, 23 (17),
3637–3644. https://doi.org/10.1016/S0142-9612(02)00096-0.
(171) Vivek, R.; Nipun Babu, V.; Thangam, R.; Subramanian, K. S.; Kannan, S. PH-Responsive Drug
Delivery of Chitosan Nanoparticles as Tamoxifen Carriers for Effective Anti-Tumor Activity in Breast
Cancer Cells. Colloids and Surfaces B: Biointerfaces 2013, 111, 117–123.
https://doi.org/10.1016/j.colsurfb.2013.05.018.
(172) Ing, L. Y.; Zin, N. M.; Sarwar, A.; Katas, H. Antifungal Activity of Chitosan Nanoparticles and
Correlation with Their Physical Properties. Int J Biomater 2012, 2012.
https://doi.org/10.1155/2012/632698.
(173) Koukaras, E. N.; Papadimitriou, S. A.; Bikiaris, D. N.; Froudakis, G. E. Insight on the Formation of
Chitosan Nanoparticles through Ionotropic Gelation with Tripolyphosphate. Mol.
Pharmaceutics 2012, 9 (10), 2856–2862. https://doi.org/10.1021/mp300162j.
(174) Paliwal, R.; Paliwal, S. R.; Agrawal, G. P.; Vyas, S. P. Chitosan Nanoconstructs for Improved Oral
Delivery of Low Molecular Weight Heparin: In Vitro and in Vivo Evaluation. Int J Pharm 2012, 422 (1–
2), 179–184. https://doi.org/10.1016/j.ijpharm.2011.10.048.
(175) Zhu, W.; Wu, Y.; Wang, S.; Li, W.; Li, X.; Chen, J.; Wang, Z.; Tian, H. Organic D-A-π-A Solar
Cell Sensitizers with Improved Stability and Spectral Response. Advanced Functional
Materials 2011, 21 (4), 756–763. https://doi.org/10.1002/adfm.201001801.
(176) Rizvi, S. A. A.; Saleh, A. M. Applications of Nanoparticle Systems in Drug Delivery
Technology. Saudi Pharm J 2018, 26 (1), 64–70. https://doi.org/10.1016/j.jsps.2017.10.012.
(177) Desai, M. P.; Labhasetwar, V.; Walter, E.; Levy, R. J.; Amidon, G. L. The Mechanism of Uptake of
Biodegradable Microparticles in Caco-2 Cells Is Size Dependent. Pharm. Res. 1997, 14 (11), 1568–1573.
https://doi.org/10.1023/a:1012126301290.
(178) Pawar, D.; Jaganathan, K. S. Mucoadhesive Glycol Chitosan Nanoparticles for Intranasal Delivery
of Hepatitis B Vaccine: Enhancement of Mucosal and Systemic Immune Response. Drug
Delivery 2016, 23 (1), 185–194. https://doi.org/10.3109/10717544.2014.908427.

137
(179) Fischer, D.; Li, Y.; Ahlemeyer, B.; Krieglstein, J.; Kissel, T. In Vitro Cytotoxicity Testing of
Polycations: Influence of Polymer Structure on Cell Viability and Hemolysis. Biomaterials 2003, 24 (7),
1121–1131. https://doi.org/10.1016/S0142-9612(02)00445-3.
(180) Zhang, X. G.; Teng, D. Y.; Wu, Z. M.; Wang, X.; Wang, Z.; Yu, D. M.; Li, C. X. PEG-Grafted
Chitosan Nanoparticles as an Injectable Carrier for Sustained Protein Release. J Mater Sci: Mater
Med 2008, 19 (12), 3525–3533. https://doi.org/10.1007/s10856-008-3500-8.
(181) Luangtana-anan, M.; Limmatvapirat, S.; Nunthanid, J.; Chalongsuk, R.; Yamamoto, K.
Polyethylene Glycol on Stability of Chitosan Microparticulate Carrier for Protein. AAPS
PharmSciTech 2010, 11 (3), 1376–1382. https://doi.org/10.1208/s12249-010-9512-y.
(182) Wix, L. The Intern Studio: A Pilot Study. Art Therapy 1995, 12 (3), 175–178.
https://doi.org/10.1080/07421656.1995.10759155.
(183) Amoozgar, Z.; Yeo, Y. Recent Advances in Stealth Coating of Nanoparticle Drug Delivery
Systems. Wiley Interdiscip Rev Nanomed Nanobiotechnol 2012, 4 (2), 219–233.
https://doi.org/10.1002/wnan.1157.
(184) Verrecchia, T.; Spenlehauer, G.; Bazile, D. V.; Murry-Brelier, A.; Archimbaud, Y.; Veillard, M.
Non-Stealth (Poly(Lactic Acid/Albumin)) and Stealth (Poly(Lactic Acid-Polyethylene Glycol))
Nanoparticles as Injectable Drug Carriers. Journal of Controlled Release 1995, 36 (1), 49–61.
https://doi.org/10.1016/0168-3659(95)00053-B.
(185) Termsarasab, U.; Yoon, I.-S.; Park, J.-H.; Moon, H. T.; Cho, H.-J.; Kim, D.-D. Polyethylene
Glycol-Modified Arachidyl Chitosan-Based Nanoparticles for Prolonged Blood Circulation of
Doxorubicin. Int J Pharm 2014, 464 (1–2), 127–134. https://doi.org/10.1016/j.ijpharm.2014.01.015.
(186) Hong, R. L.; Huang, C. J.; Tseng, Y. L.; Pang, V. F.; Chen, S. T.; Liu, J. J.; Chang, F. H. Direct
Comparison of Liposomal Doxorubicin with or without Polyethylene Glycol Coating in C-26 Tumor-
Bearing Mice: Is Surface Coating with Polyethylene Glycol Beneficial? Clin. Cancer Res. 1999, 5 (11),
3645–3652.
(187) Zhao, X.; Du, P.; Liu, P. Preparation of Aggregation-Resistant Biocompatible Superparamagnetic
Noncovalent Hybrid Multilayer Hollow Microspheres for Controlled Drug Release. Mol.
Pharm. 2012, 9(11), 3330–3339. https://doi.org/10.1021/mp300363g.
(188) Qi, L.; Xu, Z.; Jiang, X.; Hu, C.; Zou, X. Preparation and Antibacterial Activity of Chitosan
Nanoparticles. Carbohydr. Res. 2004, 339 (16), 2693–2700. https://doi.org/10.1016/j.carres.2004.09.007.
(189) Ahmad, M. B.; Tay, M. Y.; Shameli, K.; Hussein, M. Z.; Lim, J. J. Green Synthesis and
Characterization of Silver/Chitosan/Polyethylene Glycol Nanocomposites without Any Reducing
Agent. Int J Mol Sci 2011, 12(8), 4872–4884. https://doi.org/10.3390/ijms12084872.
(190) Lankelma, J.; Dekker, H.; Luque, R. F.; Luykx, S.; Hoekman, K.; Valk, P. van der; Diest, P. J. van;
Pinedo, H. M. Doxorubicin Gradients in Human Breast Cancer. Clin Cancer Res 1999, 5 (7), 1703–1707.

138
(191) Doane, T.; Burda, C. Nanoparticle Mediated Non-Covalent Drug Delivery. Adv Drug Deliv
Rev 2013, 65 (5), 607–621. https://doi.org/10.1016/j.addr.2012.05.012.
(192) Zhao, X.; Yao, Y.; Tian, K.; Zhou, T.; Jia, X.; Li, J.; Liu, P. Leakage-Free DOX/PEGylated
Chitosan Micelles Fabricated via Facile One-Step Assembly for Tumor Intracellular PH-Triggered
Release. European Journal of Pharmaceutics and Biopharmaceutics 2016, 108, 91–99.
https://doi.org/10.1016/j.ejpb.2016.08.018.
(193) Wen, H.; Dong, C.; Dong, H.; Shen, A.; Xia, W.; Cai, X.; Song, Y.; Li, X.; Li, Y.; Shi, D.
Engineered Redox-Responsive PEG Detachment Mechanism in PEGylated Nano-Graphene Oxide for
Intracellular Drug Delivery. Small 2012, 8 (5), 760–769. https://doi.org/10.1002/smll.201101613.
(194) Kohay, H.; Sarisozen, C.; Sawant, R.; Jhaveri, A.; Torchilin, V. P.; Mishael, Y. G. PEG-PE/Clay
Composite Carriers for Doxorubicin: Effect of Composite Structure on Release, Cell Interaction and
Cytotoxicity. Acta Biomater 2017, 55, 443–454. https://doi.org/10.1016/j.actbio.2017.04.008.
(195) Janes, K. A.; Fresneau, M. P.; Marazuela, A.; Fabra, A.; Alonso, M. J. Chitosan Nanoparticles as
Delivery Systems for Doxorubicin. J Control Release 2001, 73 (2–3), 255–267.
https://doi.org/10.1016/s0168-3659(01)00294-2.
(196) Son, Y. J.; Jang, J.-S.; Cho, Y. W.; Chung, H.; Park, R.-W.; Kwon, I. C.; Kim, I.-S.; Park, J. Y.;
Seo, S. B.; Park, C. R.; et al. Biodistribution and Anti-Tumor Efficacy of Doxorubicin Loaded Glycol-
Chitosan Nanoaggregates by EPR Effect. J Control Release 2003, 91 (1–2), 135–145.
https://doi.org/10.1016/s0168-3659(03)00231-1.
(197) Wang, J. J.; Zeng, Z. W.; Xiao, R. Z.; Xie, T.; Zhou, G. L.; Zhan, X. R.; Wang, S. L. Recent
Advances of Chitosan Nanoparticles as Drug Carriers. Int J Nanomedicine 2011, 6, 765–774.
https://doi.org/10.2147/IJN.S17296.
(198) Soares, P. I. P.; Sousa, A. I.; Silva, J. C.; Ferreira, I. M. M.; Novo, C. M. M.; Borges, J. P.
Chitosan-Based Nanoparticles as Drug Delivery Systems for Doxorubicin: Optimization and
Modelling. Carbohydrate Polymers 2016, 147, 304–312. https://doi.org/10.1016/j.carbpol.2016.03.028.
(199) Gnapareddy, B.; Reddy Dugasani, S.; Ha, T.; Paulson, B.; Hwang, T.; Kim, T.; Hoon Kim, J.; Oh,
K.; Park, S. H. Chemical and Physical Characteristics of Doxorubicin Hydrochloride Drug-Doped
Salmon DNA Thin Films. Sci Rep 2015, 5. https://doi.org/10.1038/srep12722.
(200) Sobhani, Z.; Mohammadi Samani, S.; Montaseri, H.; Khezri, E. Nanoparticles of Chitosan Loaded
432. –(3), 427 7 ,2017 Adv Pharm Bull Antimicrobial Activity.Ciprofloxacin: Fabrication and
..org/10.15171/apb.2017.051https://doi
(201) Infrared Spectroscopy http://www.umsl.edu/~orglab/documents/IR/IR2.html (accessed Dec 14,
2019).
(202) Núñez-Corrales, S.; Vega-Baudrit, J.; Porras-Gómez, M.; García, F.; Madrigal-Carballo, S.
Evaluation of the Synergistic Effect of EDTA-Functionalized Chitosan Nanoparticles on Imipenem
Delivery in Pseudomonas Aeruginosa Carbapenem-Resistant Strain AG1. Journal of Biomaterials and
Nanobiotechnology 2018, 9 (1), 720–726. https://doi.org/10.4236/jbnb.2018.91006.

139
(203) Kammoun, M.; Haddar, M.; Kallel, T. K.; Dammak, M.; Sayari, A. Biological Properties and
Biodegradation Studies of Chitosan Biofilms Plasticized with PEG and Glycerol. International Journal of
Biological Macromolecules 2013, 62, 433–438. https://doi.org/10.1016/j.ijbiomac.2013.09.025.
(204) Sarwar, M. S.; Ghaffar, A.; Islam, A.; Yasmin, F.; Oluz, Z.; Tuncel, E.; Duran, H.; Qaiser, A. A.
Controlled Drug Release Behavior of Metformin Hydrogen Chloride from Biodegradable Films Based on
Chitosan/Poly(Ethylene Glycol) Methyl Ether Blend. Arabian Journal of Chemistry 2017.
https://doi.org/10.1016/j.arabjc.2017.05.005.
(205) Long, G.; Yang, X.; Zhang, Y.; Pu, J.; Liu, L.; Liu, H.; Li, Y.; Liao, F. Facile One-Step Coating
Approach to Magnetic Submicron Particles with Poly(Ethylene Glycol) Coats and Abundant Accessible
Carboxyl Groups. Int J Nanomedicine 2013, 8, 791–807. https://doi.org/10.2147/IJN.S41411.
(206) Mohamed, H. N.; Mustafa, S.; Fitrianto, A.; Abd Manap, Y. Development of Alginate – Gum
Arabic Beads for Targeted Delivery of Protein. Journal of Biomolecular Research and
Therapeutics 2017, 3, 486–508.
(207) Hamdine, M.; Heuzey, M.-C.; Bégin, A. Effect of Organic and Inorganic Acids on Concentrated
Chitosan Solutions and Gels. Int. J. Biol. Macromol. 2005, 37 (3), 134–142.
https://doi.org/10.1016/j.ijbiomac.2005.09.009.
(208) Berth, G.; Dautzenberg, H. The Degree of Acetylation of Chitosans and Its Effect on the Chain
Conformation in Aqueous Solution. Carbohydrate Polymers 2002, 47 (1), 39–51.
https://doi.org/10.1016/S0144-8617(00)00343-X.
(209) Berx, G.; Cleton‐Jansen, A. M.; Nollet, F.; Leeuw, W. J. de; Vijver, M. van de; Cornelisse, C.; Roy,
F. van. E‐cadherin Is a Tumour/Invasion Suppressor Gene Mutated in Human Lobular Breast
Cancers. The EMBO Journal 1995, 14 (24), 6107–6115. https://doi.org/10.1002/j.1460-
2075.1995.tb00301.x.
(210) Yuan, Z.; Ye, Y.; Gao, F.; Yuan, H.; Lan, M.; Lou, K.; Wang, W. Chitosan-Graft-β-Cyclodextrin
Nanoparticles as a Carrier for Controlled Drug Release. Int J Pharm 2013, 446 (1–2), 191–198.
https://doi.org/10.1016/j.ijpharm.2013.02.024.
(211) Mellman, I.; Yarden, Y. Endocytosis and Cancer. Cold Spring Harb Perspect Biol 2013, 5 (12),
a016949. https://doi.org/10.1101/cshperspect.a016949.
(212) Mircioiu, C.; Voicu, V.; Anuta, V.; Tudose, A.; Celia, C.; Paolino, D.; Fresta, M.; Sandulovici, R.;
Mircioiu, I. Mathematical Modeling of Release Kinetics from Supramolecular Drug Delivery
Systems. Pharmaceutics2019, 11 (3). https://doi.org/10.3390/pharmaceutics11030140.
(213) Ahnfelt, E.; Sjögren, E.; Hansson, P.; Lennernäs, H. In Vitro Release Mechanisms of Doxorubicin
From a Clinical Bead Drug-Delivery System. Journal of Pharmaceutical Sciences 2016, 105 (11), 3387–
3398. https://doi.org/10.1016/j.xphs.2016.08.011.
(214) Thierry, B.; Al-Ejeh, F.; Brown, M. P.; Majewski, P.; Griesser, H. J. Immunotargeting of
Functional Nanoparticles for MRI Detection of Apoptotic Tumor Cells. Adv. Mater.
Weinheim 2009, 21 (5), 541–545. https://doi.org/10.1002/adma.200800998.

140
(215) Zdyrko, B.; Varshney, S. K.; Luzinov, I. Effect of Molecular Weight on Synthesis and Surface
Morphology of High-Density Poly(Ethylene Glycol) Grafted Layers. Langmuir 2004, 20 (16), 6727–
6735. https://doi.org/10.1021/la049359h.
(216) Thierry, B.; Kurkuri, M.; Shi, J. Y.; Lwin, L. E. M. P.; Palms, D. Herceptin Functionalized
Microfluidic Polydimethylsiloxane Devices for the Capture of Human Epidermal Growth Factor Receptor
2 Positive Circulating Breast Cancer Cells. Biomicrofluidics 2010, 4 (3).
https://doi.org/10.1063/1.3480573.
(217) Kumar Mehata, A.; Bharti, S.; Singh, P.; Viswanadh, M. K.; Kumari, L.; Agrawal, P.; Singh, S.;
Koch, B.; Muthu, M. S. Trastuzumab Decorated TPGS-g-Chitosan Nanoparticles for Targeted Breast
Cancer Therapy. Colloids Surf B Biointerfaces 2019, 173, 366–377.
https://doi.org/10.1016/j.colsurfb.2018.10.007.
(218) Le, X. F.; McWatters, A.; Wiener, J.; Wu, J. Y.; Mills, G. B.; Bast, R. C. Anti-HER2 Antibody and
Heregulin Suppress Growth of HER2-Overexpressing Human Breast Cancer Cells through Different
Mechanisms. Clin. Cancer Res. 2000, 6 (1), 260–270.
(219) Decuzzi, P.; Ferrari, M. The Role of Specific and Non-Specific Interactions in Receptor-Mediated
Endocytosis of Nanoparticles. Biomaterials 2007, 28 (18), 2915–2922.
https://doi.org/10.1016/j.biomaterials.2007.02.013.
(220) Coglitore, D.; Edwardson, S. P.; Macko, P.; Patterson, E. A.; Whelan, M. Transition from
Fractional to Classical Stokes–Einstein Behaviour in Simple Fluids. R Soc Open Sci 2017, 4 (12).
https://doi.org/10.1098/rsos.170507.
(221) Strømhaug, P. E.; Berg, T. O.; Gjøen, T.; Seglen, P. O. Differences between Fluid-Phase
Endocytosis (Pinocytosis) and Receptor-Mediated Endocytosis in Isolated Rat Hepatocytes. Eur. J. Cell
Biol. 1997, 73 (1), 28–39.
(222) Wang, Y.; Liu, P.; Du, J.; Sun, Y.; Li, F.; Duan, Y. Targeted SiRNA Delivery by Anti-HER2
Antibody-Modified Nanoparticles of MPEG-Chitosan Diblock Copolymer. J Biomater Sci Polym
Ed 2013, 24 (10), 1219–1232. https://doi.org/10.1080/09205063.2012.745716.
(223) De Jong, W. H.; Borm, P. J. Drug Delivery and Nanoparticles: Applications and Hazards. Int J
Nanomedicine2008, 3 (2), 133–149.
(224) Ríos-Osuna, L. A.; Licea-Claverie, A.; Paraguay-Delgado, F.; Cortez-Lemus, N. A. Synthesis of
Poly(styrene-acrylates-acrylic acid) Microspheres and Their Chemical Composition towards Colloidal
Crystal Films https://www.hindawi.com/journals/ijps/2016/4527526/ref/ (accessed Dec 15, 2019).
https://doi.org/10.1155/2016/4527526.
(225) Debnath, S. K.; Saisivam, S.; Debanth, M.; Omri, A. Development and Evaluation of Chitosan
Nanoparticles Based Dry Powder Inhalation Formulations of Prothionamide. PLoS One 2018, 13 (1).
https://doi.org/10.1371/journal.pone.0190976.
(226) Luo, Y.; Zhang, B.; Cheng, W.-H.; Wang, Q. Preparation, Characterization and Evaluation of
Selenite-Loaded Chitosan/TPP Nanoparticles with or without Zein Coating. Carbohydrate
Polymers 2010, 82 (3), 942–951. https://doi.org/10.1016/j.carbpol.2010.06.029.

141
(227) Yang, H.-C.; Hon, M.-H. The Effect of the Molecular Weight of Chitosan Nanoparticles and Its
Application on Drug Delivery. Microchemical Journal 2009, 92 (1), 87–91.
https://doi.org/10.1016/j.microc.2009.02.001.
(228) Mohammadi, A.; Hashemi, M.; Masoud Hosseini, S. Effect of Chitosan Molecular Weight as Micro
and Nanoparticles on Antibacterial Activity against Some Soft Rot Pathogenic Bacteria. LWT - Food
Science and Technology 2016, 71, 347–355. https://doi.org/10.1016/j.lwt.2016.04.010.
(229) Fan, W.; Yan, W.; Xu, Z.; Ni, H. Formation Mechanism of Monodisperse, Low Molecular Weight
Chitosan Nanoparticles by Ionic Gelation Technique. Colloids and Surfaces B: Biointerfaces 2012, 90,
21–27. https://doi.org/10.1016/j.colsurfb.2011.09.042.
(230) Sharma, D.; Maheshwari, D.; Philip, G.; Rana, R.; Bhatia, S.; Singh, M.; Gabrani, R.; Sharma, S.
K.; Ali, J.; Sharma, R. K.; et al. Formulation and Optimization of Polymeric Nanoparticles for Intranasal
Delivery of Lorazepam Using Box-Behnken Design: In Vitro and in Vivo Evaluation. Biomed Res
Int 2014, 2014, 156010. https://doi.org/10.1155/2014/156010.
.org/contents/[email protected]:uZ0soqWw@11/Introduction (accessed https://cnxOpenStax CNX )231(
Dec 15, 2019).
(232) Thanu, D. P. R.; Zhao, M.; Han, Z.; Keswani, M. Chapter 1 - Fundamentals and Applications of
Sonic Technology. In Developments in Surface Contamination and Cleaning: Applications of Cleaning
Techniques; Kohli, R., Mittal, K. L., Eds.; Elsevier, 2019; pp 1–48. https://doi.org/10.1016/B978-0-12-
815577-6.00001-3.
(233) Gedanken, A. Ultrasonic Processing to Produce Nanoparticles. In Encyclopedia of Materials:
Science and Technology; Buschow, K. H. J., Cahn, R. W., Flemings, M. C., Ilschner, B., Kramer, E. J.,
Mahajan, S., Veyssière, P., Eds.; Elsevier: Oxford, 2001; pp 9450–9456. https://doi.org/10.1016/B0-08-
043152-6/01708-3.
(234) Untitled https://www.fishersci.com/us/en/browse/90180023/sonicators (accessed Dec 15, 2019).
(235) Sonication - an overview | ScienceDirect Topics
https://www.sciencedirect.com/topics/engineering/sonication (accessed Dec 15, 2019).
(236) Freeze-Drying - an overview | ScienceDirect Topics
https://www.sciencedirect.com/topics/neuroscience/freeze-drying (accessed Dec 15, 2019).
(237) Phase Diagram for Water | Chemistry for Non-Majors
https://courses.lumenlearning.com/cheminter/chapter/phase-diagram-for-water/ (accessed Dec 15, 2019).
(238) What Is Freeze Drying? How Does It Work? Millrock Technology, Inc. Millrock Technology, Inc.
(239) Magnetic Stirrer - an overview | ScienceDirect Topics
https://www.sciencedirect.com/topics/engineering/magnetic-stirrer (accessed Dec 15, 2019).
(240) Magnetic Stirrer - an overview | ScienceDirect Topics
https://www.sciencedirect.com/topics/engineering/magnetic-stirrer (accessed Dec 15, 2019).
(241) Magnetic Stirrer - an overview | ScienceDirect Topics
https://www.sciencedirect.com/topics/engineering/magnetic-stirrer (accessed Dec 15, 2019).

142
(242) Centrifugation - an overview | ScienceDirect Topics
https://www.sciencedirect.com/topics/biochemistry-genetics-and-molecular-biology/centrifugation
(accessed Dec 15, 2019).
(243) Stephenson, F. H. Chapter 12 - Centrifugation. In Calculations for Molecular Biology and
Biotechnology (Third Edition); Stephenson, F. H., Ed.; Academic Press: Boston, 2016; pp 431–438.
https://doi.org/10.1016/B978-0-12-802211-5.00012-6.
(244) Centrifugation Theory https://www.fishersci.se/se/en/scientific-products/centrifuge-
guide/centrifugation-theory.html (accessed Dec 15, 2019).
(245) Bagchi, S. K.; Rao, P. S.; Mallick, N. Development of an Oven Drying Protocol to Improve
Biodiesel Production for an Indigenous Chlorophycean Microalga Scenedesmus Sp. Bioresource
.https://doi.org/10.1016/j.biortech.2014.12.092213. –, 207180 ,2015 Technology
(246) Sehgal, D.; Vijay, I. K. A Method for the High Efficiency of Water-Soluble Carbodiimide-
Mediated Amidation. Analytical Biochemistry 1994, 218 (1), 87–91.
https://doi.org/10.1006/abio.1994.1144
Copyright © 2022 FDOKUMEN