Effect of chitosan type on protein and water recovery efficiency from surimi wash water treated with...
7
Effect of chitosan type on protein and water recovery efficiency from surimi wash water treated with chitosan–alginate complexes Singgih Wibowo a , Gonzalo Velazquez a,b,1 , Vivek Savant a , J. Antonio Torres a, * a Food Process Engineering Group, Department of Food Science and Technology, Oregon State University, 100 Wiegand Hall, Corvallis, OR 97331-6602, USA b Department of Food Science and Technology, U.A.M. Reynosa-Aztla ´ n, Universidad Auto ´ noma de Tamaulipas, A.P.1015, Reynosa, Tam. 88700, Mexico Received 19 October 2005; accepted 6 February 2006 Available online 31 March 2006 Abstract Previous research has shown that soluble protein recovery by chitosan (Chi) complexes with polyanions such as alginate (Alg) is more effective than using chitosan alone. In this study, Chi–Alg complexes were used to recover soluble proteins from surimi wash water (SWW) slightly acidified to pH 6. Six Chi samples differing in molecular weight (MW) and degree of deacetylation (DD) were used at 20, 40 and 100 mg/L SWW Chi–Alg complexes prepared with a Chi:Alg mixing ratio previously optimized (MR = 0.2). FTIR analysis of the solids recovered revealed the three characteristic amide bands observed in the same region for untreated SWW confirming protein adsorption by Chi–Alg. The superior effectiveness of Chi complexes was confirmed but differences among chitosan types could not be correlated to MW and DD. Experimental Chi samples with 94%, 93%, 75% and 93% DD and 22, 47, 225 and 3404 · 10 3 Da, respectively, showed 73–76% protein adsorption while a commercial chitosan sample with 84% DD and 3832 · 10 3 Da had 74–83% protein adsorp- tion. An experimental chitosan, SY-1000 with 94% DD and 1.5 · 10 6 Da, showed the highest protein adsorption (79–86%) and turbidity reduction (85–92%) when used at 20 mg/L SWW. Ó 2006 Published by Elsevier Ltd. Keywords: Chitosan; Alginate; Surimi; Turbidity; Flocculation 1. Introduction Chitosan (Chi), a partially N-deacetylated product of chitin carrying positive charges, is an important natural biopolymer due to its biocompatibility and biodegradabil- ity (Ohkawa et al., 2000; Peter, 1995; Henriksen et al., 1993) and broad applications in waste water treatment (Wibowo et al., 2004; Savant and Torres, 2000; Torres et al., 1998; Peter, 1995; Mireles-DeWitt, 1994; Mireles et al., 1992), chemical industries (Chen, 1999), biomedical and pharmaceutical applications (Wang et al., 2001; Lee et al., 2001; Chen, 1999; Lian et al., 1998), agriculture and biotechnology (Peter, 1995). Previous studies have shown that Chi can flocculate suspended solids in cheese whey (Savant, 2001; Savant and Torres, 2000; Bough, 1976), poultry wash water (Bough et al., 1975), tofu whey (Jun et al., 1994), vegetable processing (Bough, 1975) and surimi wash water (Wibowo et al., 2004; Savant, 2001). The positive charges on chitosan can also participate in ionic interactions, particularly with polyanions such as alginate, carrageenan and pectin. The complexes formed by electrostatic interaction between COO or SO 3 and NH þ 3 (Illum, 1998) have been proposed for the recovery of suspended solids from aqueous food processing streams (Savant, 2001; Savant and Torres, 2000; Torres et al., 1998; Mireles-DeWitt, 1994; Mireles et al., 1992) that can be used for animal feed (Wibowo et al., 2005). Chitin source, and the processing conditions into chito- san, affect the type of chitosan obtained and determine the molecular weight (MW) and degree of deacetylation (DD), 0960-8524/$ - see front matter Ó 2006 Published by Elsevier Ltd. doi:10.1016/j.biortech.2006.02.014 * Corresponding author. Tel.: +1 541 737 4757; fax: +1 541 737 6174. E-mail address: [email protected] (J.A. Torres). 1 USA mail address: 501 N. Bridge St #374, Hidalgo, TX 78557. Bioresource Technology 98 (2007) 539–545
-
Upload
independent -
Category
Documents
-
view
3 -
download
0
Transcript of Effect of chitosan type on protein and water recovery efficiency from surimi wash water treated with...

Bioresource Technology 98 (2007) 539–545
Effect of chitosan type on protein and water recovery efficiencyfrom surimi wash water treated with chitosan–alginate complexes
Singgih Wibowo a, Gonzalo Velazquez a,b,1, Vivek Savant a, J. Antonio Torres a,*
a Food Process Engineering Group, Department of Food Science and Technology, Oregon State University,
100 Wiegand Hall, Corvallis, OR 97331-6602, USAb Department of Food Science and Technology, U.A.M. Reynosa-Aztlan, Universidad Autonoma de Tamaulipas,
A.P.1015, Reynosa, Tam. 88700, Mexico
Received 19 October 2005; accepted 6 February 2006Available online 31 March 2006
Abstract
Previous research has shown that soluble protein recovery by chitosan (Chi) complexes with polyanions such as alginate (Alg) is moreeffective than using chitosan alone. In this study, Chi–Alg complexes were used to recover soluble proteins from surimi wash water(SWW) slightly acidified to pH 6. Six Chi samples differing in molecular weight (MW) and degree of deacetylation (DD) were usedat 20, 40 and 100 mg/L SWW Chi–Alg complexes prepared with a Chi:Alg mixing ratio previously optimized (MR = 0.2). FTIR analysisof the solids recovered revealed the three characteristic amide bands observed in the same region for untreated SWW confirming proteinadsorption by Chi–Alg. The superior effectiveness of Chi complexes was confirmed but differences among chitosan types could not becorrelated to MW and DD. Experimental Chi samples with 94%, 93%, 75% and 93% DD and 22, 47, 225 and 3404 · 103 Da, respectively,showed 73–76% protein adsorption while a commercial chitosan sample with 84% DD and 3832 · 103 Da had 74–83% protein adsorp-tion. An experimental chitosan, SY-1000 with 94% DD and 1.5 · 106 Da, showed the highest protein adsorption (79–86%) and turbidityreduction (85–92%) when used at 20 mg/L SWW.� 2006 Published by Elsevier Ltd.
Keywords: Chitosan; Alginate; Surimi; Turbidity; Flocculation
1. Introduction
Chitosan (Chi), a partially N-deacetylated product ofchitin carrying positive charges, is an important naturalbiopolymer due to its biocompatibility and biodegradabil-ity (Ohkawa et al., 2000; Peter, 1995; Henriksen et al.,1993) and broad applications in waste water treatment(Wibowo et al., 2004; Savant and Torres, 2000; Torreset al., 1998; Peter, 1995; Mireles-DeWitt, 1994; Mireleset al., 1992), chemical industries (Chen, 1999), biomedicaland pharmaceutical applications (Wang et al., 2001; Leeet al., 2001; Chen, 1999; Lian et al., 1998), agricultureand biotechnology (Peter, 1995). Previous studies have
0960-8524/$ - see front matter � 2006 Published by Elsevier Ltd.
doi:10.1016/j.biortech.2006.02.014
* Corresponding author. Tel.: +1 541 737 4757; fax: +1 541 737 6174.E-mail address: [email protected] (J.A. Torres).
1 USA mail address: 501 N. Bridge St #374, Hidalgo, TX 78557.
shown that Chi can flocculate suspended solids in cheesewhey (Savant, 2001; Savant and Torres, 2000; Bough,1976), poultry wash water (Bough et al., 1975), tofu whey(Jun et al., 1994), vegetable processing (Bough, 1975) andsurimi wash water (Wibowo et al., 2004; Savant, 2001).The positive charges on chitosan can also participate inionic interactions, particularly with polyanions such asalginate, carrageenan and pectin. The complexes formedby electrostatic interaction between COO� or SO�3 andNHþ3 (Illum, 1998) have been proposed for the recoveryof suspended solids from aqueous food processing streams(Savant, 2001; Savant and Torres, 2000; Torres et al., 1998;Mireles-DeWitt, 1994; Mireles et al., 1992) that can be usedfor animal feed (Wibowo et al., 2005).
Chitin source, and the processing conditions into chito-san, affect the type of chitosan obtained and determine themolecular weight (MW) and degree of deacetylation (DD),

Table 1Chitosan sample specification
Chitosan samplea Viscosity (cP) MWb DD (%)
SY 20 20 22,300 94SY 40 40 47,000 93SY 171 171.6 225,000 75SY 1000 1000 1,495,000 94SY 2150 2150 3,404,000 93CHI-84c 2400d 3,832,000 84
a Moon (2000).b Calculated using K = 1.81 · 10�3 cm3/g and a = 0.93 (No et al., 2000).c Commercial sample, Vanson Chemicals.d Data provided by manufacturer.
540 S. Wibowo et al. / Bioresource Technology 98 (2007) 539–545
the latter representing the proportion of deacetylated units,i.e., the level of free amine active groups present on chito-san (No et al., 2000; Domard, 1999; Chen, 1999; Chinaditet al., 1999; Lian et al., 1998). An advantage of chitosan isthat it can be dissolved in diluted acetic acid (Muzzarelli,1977) and its free amine groups can participate in chemicalreactions including those of complexation with other poly-mers. DD values range from 56% to 99% with an averageof 80% depending on the crustacean species and pre-paration method used (No et al., 2000; No and Meyers,1995). Methods reported for the determination of DDvalues include the ninhydrin test, linear potentiometrictitration, near-infrared spectroscopy, nuclear magnetic res-onance spectroscopy, infrared spectroscopy, and first deriv-ative UV-spectrophotometry (Muzzarelli and Rocchetti,1985; Fernandez-Kim, 2004).
Chitosan complexes with polyanions including alginate,pectin, carrageenan (Torres et al., 1998; Savant and Torres,1998; Mireles-DeWitt, 1994; Mireles et al., 1992) and poly-acrylic acid (Lee et al., 1999; Chavasit and Torres, 1990;Chavasit et al., 1988) have been studied for their potentialuse in food processing applications. A chitosan–alginatecomplex (Chi–Alg) tested for treating SWW yielded ahigher turbidity reduction and protein adsorption thanusing chitosan alone (Savant and Torres, 2003; Wibowoet al., 2005). DD and MW affect chitosan solubility andits electrostatic interaction with other molecules (Domard,1999). Protein recovery from aqueous processing streamsby Chi–Alg complexes, proposed to occur by mechanicalentrapment and electrostatic interaction with the complex(Savant, 2001), may also be affected. Higher DD indicatesa chitosan with more positively charged groups availablefor ionic interactions and thus for the recovery of solubleproteins. However, it is possible that only a small numberof amine groups are involved in protein recovery and thusa high DD value may not be necessary for effective proteincoagulation. It is also possible that a higher MW chitosanmay augment mechanical entrapment opportunities, againenhancing the effectiveness of the Chi–Alg complex. There-fore, selecting chitosan for the recovery of soluble proteinson the basis of MW and DD could be a means to improvethe efficacy of the coagulation by Chi–Alg complexes ofsoluble proteins contained in surimi wash water (SWW).The objective of this work was to determine the influenceof MW and DD of chitosan on the adsorption efficiencyof proteins from SWW using one commercial and fiveexperimental chitosan samples.
2. Methods
2.1. Materials
SWW obtained from Pacific whiting (Merluccius produc-
tus) processing was collected from a commercial plant(Pacific Surimi Joint Venture L.L.C., Warrenton, OR) atthe rotary stage used to remove solid fish waste (Morrisseyet al., 2000) and transported frozen to Corvallis, OR. Sor-
bitol (1%) was added as a cryoprotectant to prevent low-temperature damage to SWW proteins. The frozen SWWwas stored at �39 �C until used for protein recovery testsfollowing the procedures described below. Prior to floccu-lation, the SWW was thawed overnight at 4 �C and thencentrifuged for 20 min at 3100G and 4 �C to remove insol-uble solids. The supernatant was then adjusted to pH 6using 1 M HCl and labeled SWW.
Five chitosan samples varying in MW and DD obtainedfrom Sunchon National University (Chonnam, Korea) anda sample (CHI-84) from Vanson Chemicals (Redmond,WA) were used to prepare 1% stock solutions in 1 M aceticacid (Table 1). Food grade alginate (Kelgin� MV, KelcoCo., San Diego, CA) was used to prepare a 1% stock solu-tion in deionized water. The chitosan and alginate stocksolutions were further diluted to 0.2% and 0.4% for proteinrecovery studies. Final concentrations of the Chi–Alg com-plexes were 20, 40 and 100 mg/L SWW.
2.2. Protein flocculation
The soluble protein remaining in the pH adjusted super-natant was recovered according to previously publishedmethods (Wibowo et al., 2004; Savant and Torres, 2003;Wibowo, 2003) described briefly herein. They were per-formed in a 50 mL Erlenmeyer flask using 24.75 mL ofSWW and 250 lL of chitosan and alginate solutions addedindividually at 0.2 mixing ratio (MR). Chi or Chi–Alg com-plexes were used at 20, 40 and 100 mg/L SWW. Alg alonehas been shown to be less effective than Chi or Chi–Algcomplexes and was not included in the experimental design(Savant, 2001). Untreated SWW was used as a control. Allsamples were agitated for 5 min at 130 rpm and 20 �C usingan environmental shaker (New Brunswick Scientific Inc.,New Brunswick, NJ) and allowed to stand at room temper-ature for 1 h. The solids were recovered by 20 min centri-fugation at 3100G and 4 �C, freeze dried and stored at�39 �C for further analysis. The supernatant was collectedfor turbidity determinations and protein analysis using themodified Folin method read at 750 nm (Lowry et al., 1951).Protein recovery was expressed as percentage of proteinremoved. Turbidity measurements were performed usinga DRT 100B HF Instruments Turbidimeter (Fort Meyers,FL) with an EPA approved turbidity-free 0.02 NTU

Table 2Effect of chitosan type, concentration and complexation with alginate onthe SWW protein recovery percentage
mg/L (a) SY-20 (b) SY-40
Chi–Alg Chi Chi–Alg Chi
20 73.2 ± 0.2Aa 67.4 ± 2.1Ab 74 ± 1.1Aa 60.1 ± 0.3Ab
40 73.1 ± 0.9Aa 68.4 ± 2.1Ab 74 ± 0.6Aa 58.2 ± 0.5Ab
100 74.9 ± 0.8Ba 68.3 ± 0.1Ab 75.6 ± 0.8Aa 58.3 ± 0.7Ab
(c) SY-171 (d) SY-1000
Chi–Alg Chi Chi–Alg Chi
20 74.6 ± 1.9Aa 69.9 ± 1.7Ab 86 ± 6.7Aa 70.5 ± 0.7Ab
40 75.4 ± 0.0Aa 65.4 ± 1.2Ab 80.4 ± 0.5Aa 70 ± 0.9Ab
100 75.7 ± 0.6Aa 69.9 ± 1.0Ab 78.8 ± 0.7Ba 71.2 ± 1.9Ab
(e) SY-1500 (f) CHI-84
Chi–Alg Chi Chi–Alg Chi
20 73.3 ± 1.5Aa 61.5 ± 1.4Ab 73.9 ± 0.4Aa 46.4 ± 0.6Ab
40 73.7 ± 0.6Aa 62.1 ± 0.4Ab 75.6 ± 1.5Aa 50.2 ± 0.0Bb
100 74.1 ± 0.1Aa 62.8 ± 2.1Ab 82.6 ± 0.5Ba 75.9 ± 0.6Ca
a,b Means within same row without common superscript are different(p < 0.05).A,B,C Means within same column without common superscript are different(p < 0.05).
S. Wibowo et al. / Bioresource Technology 98 (2007) 539–545 541
internal standard and a hydrazine sulfate-hexamethylenetetramine standard of 40 NTU (EPA/600/4-79/020). Treat-ment effectiveness was expressed as percentage of turbidityreduction.
2.3. FTIR analysis
FTIR analysis was used to investigate protein adsorptiononto the various Chi–Alg complexes. A 1% sample in KBr ofuntreated SWW solids, or of solids adsorbed on Chi–Alg orChi alone, was ground to a fine powder using a pestle andmortar. The KBr pellet obtained by compression in a minipress pellet maker (Model 14-385-851, Fisher Scientific,New Brunswick, NJ) was scanned 64 times in the 400–4000 cm�1 range with resolution 8 (Nicolet 5PC FTIR Spec-trophotometer, Madison, WI). Deconvolution analysis andarea calculation of selected spectra regions were performedusing the software AAnalyzer� Ver 1.02. This software hasbeen developed for photoemission and infrared data analy-sis (Velazquez et al., 2003; Herrera-Gomez et al., 2000). Indeconvolution, shared parameters among various curves,such as peak width and position, were optimized simulta-neously. The advantage of simultaneous multiple-curve fit-ting is that the components for which a particular peak isimportant, participate to a greater extent in the definitionof the parameters corresponding to that peak.
2.4. Statistical analysis
ANOVA with factorial analysis was used to analyze thedata at the level of 95% significance using S-PLUS 2000(Prof. Rel. 1, S-PLUS Lucent Technology, Inc., Seattle,WA). The ‘‘Best-fast’’ method, available in this softwarepackage to explore several standard statistical tools at thesame time to determine the smallest statistical critical dif-ference, was employed for multiple mean comparisons.
3. Results and discussion
3.1. Protein adsorption and turbidity reduction
At the three Chi–Alg concentrations tested, 20, 40 and100 mg/L SWW, the complex with all chitosan types hada significantly higher (p < 0.05) protein adsorption thanChi alone with a single test condition exception for CHI-84 at 100 mg/L (Table 2). These results are in accordancewith previous studies using only commercial chitosan,CHI-84, in which the same trend was observed in the treat-ment of Cheddar cheese whey (Savant and Torres, 2000)and SWW (Savant, 2001; Wibowo et al., 2004). At 20and 40 mg/L SWW, Chi–Alg concentration showed no sig-nificant (p < 0.05) effect on protein adsorption. Increasingconcentration to 100 mg/L SWW caused a significant effect(p < 0.05) only on samples SY-20, SY-1000 and CHI-84(Table 2).
Flocculation with the complex of SY-1000 at 20 mg/LSWW resulted in higher protein adsorption (86 ± 6.7%)
when compared to all other types of chitosan at the sameconcentration. However, protein adsorption floccu-lated with SY-1000 tended to be lower as concentrationincreased while for CHI-84 it tended to be higher as theconcentration increased yielding values at 100 mg/LSWW equivalent to SY-1000 at 20 mg/L SWW (Table 3).The complex concentration effect on turbidity reductionwas not significant (p > 0.05) except for SY-1000 whenincreasing from 40 to 100 mg/L SWW, and although therewere differences among some of the chitosan types (Table3), the differences were not consistent with those observedin protein adsorption.
The MW and DD of the chitosan used in this studyvaried from 22 · 103 to 3800 · 103 Da and from 75% to94%, respectively, and were expected to influence proteinadsorption from SWW by Chi–Alg complexes. At the sameconcentration, no differences (p > 0.05) were observed onprotein adsorption amongst SY-20, SY-40, SY-171 andSY-2150 while SY-1000 and CHI-84 were significantly dif-ferent at some concentrations as shown in Table 3. Thisbehavior cannot be explained on the basis of DD becauseSY-20, SY-40, SY-1000 and SY-2150 had similar DD val-ues (93–94%) but differed widely in protein adsorption andto a lesser extent in turbidity reduction. In addition, the10-fold difference in MW between samples SY-20, SY-40and SY-171 from 22.3 · 103 to 225 · 103 Da had no effecton SWW protein adsorption when compared at the sameconcentration. At 20 mg/L, values for SY-1000 with1495 · 103 Da were significantly higher, then decreasedfor SY-2150 with 3404 · 103 Da and CHI-84 with3832 · 103 Da. At the higher concentrations, an even moreerratic behavior was observed (Table 3).

Table 3Effect of chitosan type and complex concentration on the percentage of SWW protein recovery and turbidity reduction by chitosan–alginate (Chi–Alg)complexes prepared at a 0.2 mixing ratio
SY-20 SY-40 SY-171 SY-1000 SY-2150 CHI-84
MW (·103 Da) 22.3 47 225 1495 3404 3832DD (%) 94 93 75 94 93 84
Chi–Alg (mg/L) Protein recovery percentage*
20 73.2a 74.0ab 74.6ab 86.0e 73.3ab 73.9ab
(0.2) (1.1) (1.9) (6.7) (1.5) (0.4)40 73.1a 74.0ab 75.4abc 80.4cd 73.7ab 75.6abc
(0.9) (0.6) (0.0) (0.5) (0.6) (1.5)100 74.9abc 75.6abc 75.7abc 78.8bcd 74.1ab 82.6de
(0.8) (0.8) (0.6) (0.7) (0.1) (0.5)
Chi–Alg (mg/L) Turbidity reduction percentage*
20 85.5ab 92.8de 92.3cde 92.4cde 90.4abcde 95.7e
(0.8) (0.2) (0.4) (3.6) (1.0) (0.4)40 86.3abc 93.3de 91.7bcde 87.8abcd 90.3abcde 95.0e
(0.4) (3.4) (0.5) (1.7) (1.8) (1.5)100 87.7abcd 95.7e 93.1de 84.9a 90.8abcde 92.9de
(1.8) (1.2) (0.5) (2.8) (5.4) (1.5)
* Protein adsorption or turbidity reduction determination means for triplicate samples obtained from the same SWW treated with chitosan–alginate(Chi–Alg) complexes with the same lower case letter (p > 0.05) are not statistically different. Values in parenthesis are standard deviation.
542 S. Wibowo et al. / Bioresource Technology 98 (2007) 539–545
3.2. FTIR analysis
Similar IR spectra were obtained for untreated SWWsolids and for protein adsorbed on Chi or Chi–Alg com-plexes irrespective of chitosan type and for flocculation
500 1000 1500 2000
Wavenumb
(a)
(b)
(c)
(d)
(e)(f)
(g)
A
Amide I
Amide II
Amide III
Fig. 1. FTIR spectra for (a) untreated SWW protein, (b, e) SWW protein recov40 mg/L, (d, g) same for 20 mg/L. Note: spectra shown in (b)–(e) is for treatmentypes.
with 20, 40 or 100 mg/L SWW of Chi alone or Chi–Algcomplexes. The FTIR spectra of untreated SWW solidsand those recovered with chitosan type CHI-84 shows thetypical behavior found in this study (Fig. 1). Consistentwith previous results (Savant, 2001; Savant and Torres,
2500 3000 3500 4000
er (cm-1)
B
ered using 100 mg/L SWW of Chi or Chi–Alg, respectively, (c, f) same forts with chitosan type CHI-84 and typical of those observed for all chitosan
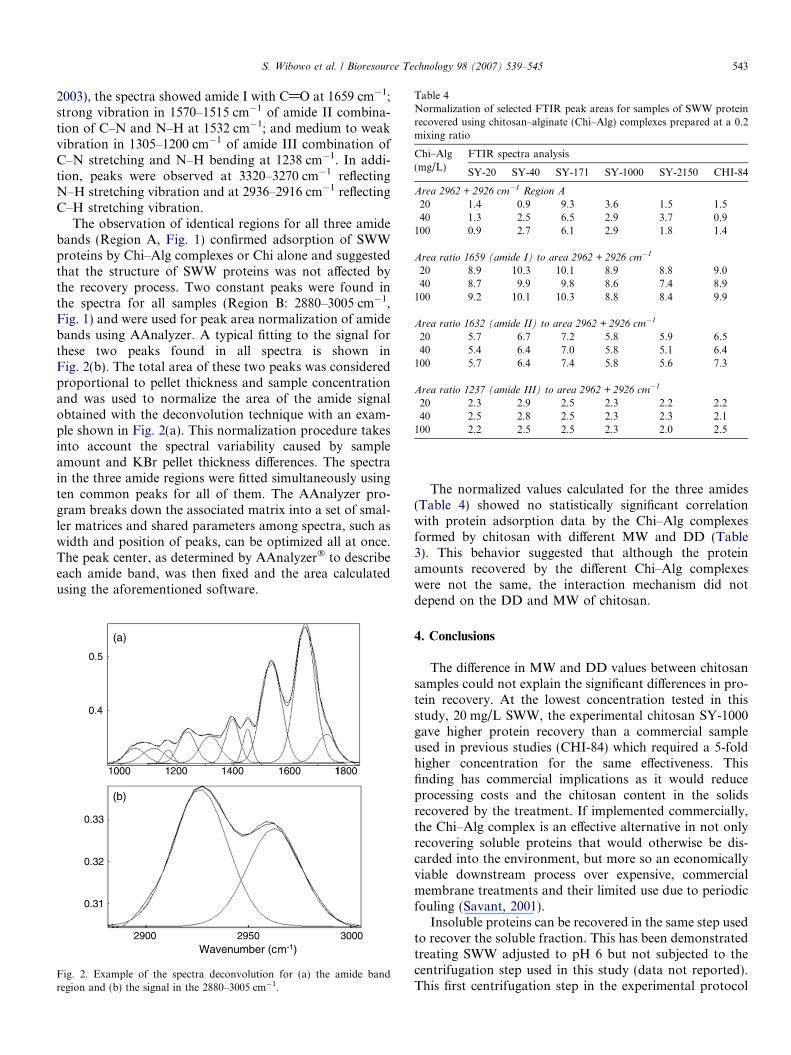
Table 4Normalization of selected FTIR peak areas for samples of SWW proteinrecovered using chitosan–alginate (Chi–Alg) complexes prepared at a 0.2mixing ratio
Chi–Alg(mg/L)
FTIR spectra analysis
SY-20 SY-40 SY-171 SY-1000 SY-2150 CHI-84
Area 2962 + 2926 cm�1 Region A
20 1.4 0.9 9.3 3.6 1.5 1.540 1.3 2.5 6.5 2.9 3.7 0.9
100 0.9 2.7 6.1 2.9 1.8 1.4
Area ratio 1659 (amide I) to area 2962 + 2926 cm�1
20 8.9 10.3 10.1 8.9 8.8 9.040 8.7 9.9 9.8 8.6 7.4 8.9
100 9.2 10.1 10.3 8.8 8.4 9.9
Area ratio 1632 (amide II) to area 2962 + 2926 cm�1
20 5.7 6.7 7.2 5.8 5.9 6.540 5.4 6.4 7.0 5.8 5.1 6.4
100 5.7 6.4 7.4 5.8 5.6 7.3
Area ratio 1237 (amide III) to area 2962 + 2926 cm�1
20 2.3 2.9 2.5 2.3 2.2 2.240 2.5 2.8 2.5 2.3 2.3 2.1
100 2.2 2.5 2.5 2.3 2.0 2.5
S. Wibowo et al. / Bioresource Technology 98 (2007) 539–545 543
2003), the spectra showed amide I with C@O at 1659 cm�1;strong vibration in 1570–1515 cm�1 of amide II combina-tion of C–N and N–H at 1532 cm�1; and medium to weakvibration in 1305–1200 cm�1 of amide III combination ofC–N stretching and N–H bending at 1238 cm�1. In addi-tion, peaks were observed at 3320–3270 cm�1 reflectingN–H stretching vibration and at 2936–2916 cm�1 reflectingC–H stretching vibration.
The observation of identical regions for all three amidebands (Region A, Fig. 1) confirmed adsorption of SWWproteins by Chi–Alg complexes or Chi alone and suggestedthat the structure of SWW proteins was not affected bythe recovery process. Two constant peaks were found inthe spectra for all samples (Region B: 2880–3005 cm�1,Fig. 1) and were used for peak area normalization of amidebands using AAnalyzer. A typical fitting to the signal forthese two peaks found in all spectra is shown inFig. 2(b). The total area of these two peaks was consideredproportional to pellet thickness and sample concentrationand was used to normalize the area of the amide signalobtained with the deconvolution technique with an exam-ple shown in Fig. 2(a). This normalization procedure takesinto account the spectral variability caused by sampleamount and KBr pellet thickness differences. The spectrain the three amide regions were fitted simultaneously usingten common peaks for all of them. The AAnalyzer pro-gram breaks down the associated matrix into a set of smal-ler matrices and shared parameters among spectra, such aswidth and position of peaks, can be optimized all at once.The peak center, as determined by AAnalyzer� to describeeach amide band, was then fixed and the area calculatedusing the aforementioned software.
1400 18001000
0.4
0.5
16001200 1
2950 30002900
0.31
0.32
0.33
Wavenumber (cm-1)
(b)
(a)
Fig. 2. Example of the spectra deconvolution for (a) the amide bandregion and (b) the signal in the 2880–3005 cm�1.
The normalized values calculated for the three amides(Table 4) showed no statistically significant correlationwith protein adsorption data by the Chi–Alg complexesformed by chitosan with different MW and DD (Table3). This behavior suggested that although the proteinamounts recovered by the different Chi–Alg complexeswere not the same, the interaction mechanism did notdepend on the DD and MW of chitosan.
4. Conclusions
The difference in MW and DD values between chitosansamples could not explain the significant differences in pro-tein recovery. At the lowest concentration tested in thisstudy, 20 mg/L SWW, the experimental chitosan SY-1000gave higher protein recovery than a commercial sampleused in previous studies (CHI-84) which required a 5-foldhigher concentration for the same effectiveness. Thisfinding has commercial implications as it would reduceprocessing costs and the chitosan content in the solidsrecovered by the treatment. If implemented commercially,the Chi–Alg complex is an effective alternative in not onlyrecovering soluble proteins that would otherwise be dis-carded into the environment, but more so an economicallyviable downstream process over expensive, commercialmembrane treatments and their limited use due to periodicfouling (Savant, 2001).
Insoluble proteins can be recovered in the same step usedto recover the soluble fraction. This has been demonstratedtreating SWW adjusted to pH 6 but not subjected to thecentrifugation step used in this study (data not reported).This first centrifugation step in the experimental protocol

544 S. Wibowo et al. / Bioresource Technology 98 (2007) 539–545
used in this study was necessary to demonstrate that theChi–Alg complex removed the soluble fraction, a seriouschallenge to surimi processors.
Acknowledgements
The authors would like to thank Dr. Il-Shik Moon (26),Department of Chemical Engineering, College of Engineer-ing, Sun Chon National University for providing experi-mental chitosan samples. This work was supported byGrant No. NA 16RG 1039 (Project No. R/SF-29) fromthe National Oceanic and Atmospheric Administration tothe Oregon State University Sea Grant College Program,and from appropriations made by the Oregon StateLegislature. Financial assistance was provided to AuthorWibowo by the Participatory Development of AgriculturalTechnology Project (PAATP, ADB Loan No. 1526 INO)of the Agency for Agricultural Research and Development(AARD), the Government of Indonesia. Thanks also toDr. Christine Pastorek in the OSU Chem. Dept. for assis-tance with FTIR analysis and Dr. Alberto Herrera-Gomez (CINVESTAV-Queretaro, Mexico) for the use ofthe deconvolution software. A free copy of AAnalyzer(Register Number 03-1999-051710412300, Mexico) can berequested at [email protected] or downloaded fromhttp://qro.cinvestav.mx/~aanalyzer.
References
Bough, W.A., 1975. Reduction of suspended solids in vegetable canningwaste effluents by coagulation with chitosan. J. Food. Sci. 40, 297–301.
Bough, W.A., 1976. Chitosan—a polymer from seafood waste, for use intreatment of food processing wastes and activated sludge. Process.Biochem. 11, 13–16.
Bough, W.A., Shewfelt, A.L., Salter, W.L., 1975. Use of chitosan for thereduction and recovery of solids in poultry processing waste effluents(feed supplements). Poultry Sci. 54, 992–1000.
Chavasit, V., Torres, J.A., 1990. Chitosan-polyacrylic acid: mechanism ofcomplex formation and potential industrial applications. Biotechnol.Prog. 6, 2–6.
Chavasit, V., Kienzle-Sterzer, C., Torres, J.A., 1988. Formation andcharacterization of an insoluble polyelectrolyte complex: chitosan-polyacrylic acid. Polym. Bull. 19, 223–230.
Chen, R.H., 1999. Manipulation and application of chain flexibility ofchitosan. In: Chen, R.H., Chen, H. (Eds.), Advances in Chitin Science,vol. 3. Rita Advertising Co., Ltd., Taiwan, ROC, pp. 39–46.
Chinadit, U., Wanichpongpan, P., How, N.C., Steven, W.F., Chandrkra-chang, S., 1999. Chemical deacetylation of shrimp chitin in differentconditions. In: Chen, R.H., Chen, H. (Eds.), Advances inChitin Science, vol. 3. Rita Advertising Co., Ltd., Taiwan, ROC, pp.165–168.
Domard, A., 1999. Physicochemical properties of chitinous materials. In:Chen, R.H., Chen, H. (Eds.), Advances in Chitin Science, vol. 3. RitaAdvertising Co., Ltd., Taiwan, ROC, pp. 24–38.
Fernandez-Kim, S.-O., 2004. Physicochemical and Functional Propertiesof Crawfish Chitosan as Affected by Different Processing Protocols.Master Thesis, Louisiana State University, USA.
Henriksen, I., Skaugrud, Ø., Karlsen, J., 1993. Use of chitosan andchitosan malate as an excipient in wet granulation of three watersoluble drugs. Int. J. Pharmaceutics 98 (1–3), 181–188.
Herrera-Gomez, A., Pianetta, P., Marshall, D., Nelson, E., Spicer, W.E.,2000. Geometrical structure of the 1/2-ML (2 · 1) and 1/3-ML (2 · 3)Ba/Si(001) interfaces. Phys. Rev. B 61, 12988–12991.
Illum, L., 1998. Chitosan and its use as a pharmaceutical excipient.Pharm. Res. 15, 1326–1331.
Jun, H.K., Kim, J.S., No, H.K., Meyers, S.P., 1994. Chitosan as acoagulant for recovery of proteinaceous solids from tofu wastewater.J. Agric. Food. Chem. 42, 1834–1838.
Lee, J.W., Kim, S.Y., Kim, S.S., Lee, Y.M., Lee, K.H., Kim, S.J., 1999.Synthesis and characteristics of interpenetrating polymer networkhydrogel composed of chitosan and poly(acrylic acid). J. Appl. Polym.Sci. 73, 113–120.
Lee, M., Nah, J.W., Kwon, Y., Koh, J.J., Ko, K.S., Kim, S.W., 2001.Water-soluble and low molecular weight chitosan-based plasmid DNAdelivery. Pharm. Res. 18, 427–431.
Lian, G.M., Chen, K.L., Chan, K.C., 1998. Effect of high molecularweight chitosan on nutrient digestibility, blood lipids and fecalcontents in rats. In: Advances in Chitin Science, Proceedings of the3rd Asia-Pacific Chitin and Chitosan Symposium, Keelung, Taiwan,pp. 299–306.
Lowry, O.H., Rosebrough, N.J., Farr, A.L., Randall, R.J., 1951. Proteinmeasurement with the Folin phenol reagent. J. Biol. Chem. 193, 265–275.
Mireles, C., Martino, M., Bouzas, J., Torres, J.A., 1992. Complexformation of chitosan and naturally occurring polyanions. In: Brine,C.J., Sanford, P.A., Zikakis, J.P. (Eds.), Advances in Chitin andChitosan. Elsevier Applied Science, New York, pp. 506–515.
Mireles-DeWitt, C.A., 1994. Complex Mechanism of Chitosan andNaturally Occurring Polyanions. Master Thesis, Oregon State Uni-versity, USA.
Moon, I.S., 2000. Personal communication. Dept. of ChemicalEngineering, College of Engineering, Sun Chon National University,Korea.
Morrissey, M.T., Park, J.W., Huang, L., 2000. Surimi processing waste: itscontrol and utilization. In: Park, J.W. (Ed.), Surimi and SurimiSeafood. Marcel Dekker, Inc., New York, NY, pp. 127–166.
Muzzarelli, R.A.A., 1977. Chitin. Pergamon Press Ltd., Great Britain,pp. 89–93.
Muzzarelli, R.A.A., Rocchetti, R., 1985. Determination of the degree ofacetylation of chitosans by first derivative ultraviolet spectrophoto-metry. Carbohydr. Polym. 5, 461–472.
No, H.K., Meyers, S.P., 1995. Preparation and characterization of chitinand chitosan—a review. J. Aquat. Food Prod. Technol. 4 (2), 27–52.
No, H.K., Lee, K.S., Meyers, S.P., 2000. Correlation between physico-chemical characteristics and binding capacities of chitosan products.J. Food Sci. 65, 1134–1137.
Ohkawa, K., Yamada, M., Nishida, A., Nishi, N., Yamamoto, H., 2000.Biodegradation of chitosan-gellan and poly(L-lysine)-gellan polyioncomplex fibers by pure culture of soil filamentous fungi. J. Polym. Env.8, 59–66.
Peter, M.G., 1995. Applications and environmental aspects of chitin andchitosan. J. Macromol. Sci. Pure Appl. Chem. 32, 629–641.
Savant, V.D., 2001. Protein Adsorption on Citosan–Polyanion Com-plexes: Application to Aqueous Food Processing Wastes. PhD Thesis,Oregon State University, USA.
Savant, V.D., Torres, J.A., 1998. Infrared analysis of chitosan–polyanionnetworks. Abstract 77-B 37. Annual meeting of the Inst. of FoodTechnologists, Atlanta, GA.
Savant, V.D., Torres, J.A., 2000. Chitosan based coagulating agents fortreatment of Cheddar cheese whey. Biotechnol. Prog. 16, 1091–1097.
Savant, V.D., Torres, J.A., 2003. Fourier transform infrared analysis ofchitosan based coagulating agents for treatment of surimi waste water.J. Food. Technol. 1 (2), 23–28.
Torres, J.A., Mireles, C., Savant, V.D., 1998. Two food applications ofbiopolymers: edible coatings controlling microbial surface spoilage andchitosan use to recover proteins from aqueous processing wastes. In:Imam, S.H., Greene, R.V., Zaidi, B.R. (Eds.), Biopolymers: Utilizing

S. Wibowo et al. / Bioresource Technology 98 (2007) 539–545 545
Nature’s Advanced Materials, American Chemical Society SymposiumSeries, No. 723. ACS Publications, Washington, DC, pp. 248–282.
Velazquez, G., Herrera-Gomez, A., Martin-Polo, M.O., 2003. Identifica-tion of bound water through infrared spectroscopy in methylcellulose.J. Food Eng. 59, 79–84.
Wang, H., Fang, Y.E., Yan, Y., 2001. Surface modification of chitosanmembranes by alkane vapor plasma. J. Mater. Chem. 11, 1374–1377.
Wibowo, S., 2003. Effect of the Molecular Weight and Degree ofDeacetylation of Chitosan and Nutritional Evaluation of SolidRecovered from Surimi Processing Plant. PhD Thesis, Oregon StateUniversity, USA.
Wibowo, S., Velazquez, G., Savant, V., Torres, J.A., 2004. Surimi washwater treatment for protein recovery: effect of chitosan–alginatecomplex concentration and treatment time on protein adsorption.Bioresour. Technol. 96, 665–671.
Wibowo, S., Savant, V., Cherian, G., Savage, T.F., Torres, J.A., 2005.Evaluation as a feed ingredient of surimi wash water protein recoveredusing a chitosan–alginate complex. J. Aquat. Food Prod. Technol. 14(1), 55–72.