Aloe vera gel alleviates cardiotoxicity in streptozocin?induced ...

Pectins from Aloe Vera: Extraction and Production of Gels forRegenerative Medicine
Roberta Gentilini,1 Sabrina Bozzini,1,2 Fabiola Munarin,1,2 Paola Petrini,1,2 Livia Visai,2,3,4
Maria Cristina Tanzi1,2
1Laboratorio di Biomateriali, Dipartimento di Chimica, Materiali e Ingegneria Chimica, ‘G. Natta’, Politecnico di Milano,P.zza Leonardo da Vinci 32, 20133 Milano, Italy2Unit�a di Ricerca del Consorzio Interuniversitario Nazionale Per la Scienza e Tecnologia dei Materiali (INSTM), Italy3Department. of Molecular Medicine, Center for Tissue Engineering (C.I.T.), Universit�a di Pavia, Pavia, Italy4Salvatore Maugeri Foundation, IRCCS, Pavia, ItalyCorrespondence to: R. Gentilini (E - mail: [email protected])
ABSTRACT: Extraction, purification, and gel preparation of Aloe Vera pectin and the evaluation of the biocompatibility of the pectin
gels were studied, considering as end use as implantable materials for regenerative medicine. A. Vera was chosen as source of pectin,
as this pectin was described to possess high molecular weight and a low degree of esterification. As the properties of pectins are
strictly dependent upon the extraction methods in combination with the natural source, the extraction method was modified in order
to optimize the yield of the final product, its purity, the duration of the process and the selection of non-toxic chemical reagents.
Changing the experimental conditions resulted in four different extraction processes and products with different physical and chemi-
cal characteristics. The optimal extraction resulted to be the process: with enzimatic deactivation by microwave and the use of sodium
citrate as chelating agent the molecular weight of the pectin extracted was estimated to be 118 kDa and the 2.93% esterification
degree. Cytocompatibility of pectin gels, prepared by ionotropic gelation, showing an improved cell adhesion if compared to commer-
cial pectin. The results suggest that the extracted A. Vera pectins possess interesting properties to be exploited for the production of
mechanically stable gels by ionotropic gelation and high rhamnose content matrices for application in regenerative medicine. VC 2013
Wiley Periodicals, Inc. J. Appl. Polym. Sci. 000: 000–000, 2013
KEYWORDS: biomaterials; biosynthesis of polymers; gels; polyelectrolytes
Received 20 May 2013; accepted 15 July 2013; Published online 00 Month 2013DOI: 10.1002/app.39760
INTRODUCTION
Aloe Vera (Aloe barbadensis Miller) belongs to the Liliace family
and it is mainly used for medical, cosmetic, pharmaceutical and
food purposes. In the last decade, the modern science is validat-
ing the healing properties of the constituents found in A. Vera.
Nowadays, it is well known that A. Vera pulp, as component of
ointments and lotions, has several important therapeutic prop-
erties for wound healing,1 anti-inflammatory treatments,1 ther-
mal injury healing,2 and immunomodulation against infection.3
Aloe-based products for internal use are promising also for the
treatment of coughs, diabetes, cancer, immune-system deficits,
and many other conditions.4–6 A. Vera gel is also extensively
employed in the food industry because of its regenerating and
anti-inflammatory properties.7
A. Vera has elongated and pointed leaves consisting primarily of
two parts, an outer green rind that includes the vascular bun-
dles, and the inner pulp. The A. Vera pulp is a hydrocolloid
mainly composed of 98.5% of water and of 1.5% of several
components such as vitamins, minerals, enzymes, organic acids,
monosaccharides (including glucomannan, galactose, xylose,
arabinose), and polysaccharides, such as celluloses, hemicellulo-
ses, and pectins, which compose the cell wall.4
Pectins are biocompatible and versatile polysaccharides (Figure 1)
recently used in pharmaceutical applications as drug delivery sys-
tems8,9 and in biomedical field as coatings of different biomateri-
als.10–13
Pectin from the cell walls of A. Vera shows specific characteristics
that can be considered appealing for biomedical applications,
Present address: Politecnico di Milano, P.zza Leonardo da Vinci, 32 - 20133 Milano, Italia
VC 2013 Wiley Periodicals, Inc.
WWW.MATERIALSVIEWS.COM WILEYONLINELIBRARY.COM/APP J. APPL. POLYM. SCI. 2013, DOI: 10.1002/APP.39760 1

such as the great amount of rhamnose, at least two times higher
than that in commercially available pectins, the high content of
galacturonic acid (approximately 90% of the whole molecule)
with a low Degree of Esterification (DE < 50%).14 The branched
rhamnose-rich regions of pectin chains seem to improve the
molecular interactions between cells and the polysaccharide, while
the branched hairy regions promote the formation of entangled
structures, which may enhance the immobilization of healing
agents.10 Furthermore, the high content of galacturonic acid and
the low DE promote the availability of COO2 groups, involved
in the gelling process.15
Pectin characteristics change in relation to the plant species
from which it is extracted, however, pectins with different pro-
prieties can derive from the same plant and even from the same
cell wall.16 In addition, the extraction processes can modify the
pectin characteristics, and in particular the molecular weight:
extractions at room temperature result in pectin with high
molecular weight but low yield, whereas extractions at higher
temperatures (over 80� C) lead to a lower molecular weight
pectins, but with an increase in yield.14
Recently, the studies of our group were focused on different
uses of pectin with the aim to obtain scaffolds, injectable gels,
microspheres, and other systems in the perspective to use this
interesting polysaccharide for regenerative medicine applica-
tions.17–19 The gained experience and knowledge allowed study-
ing the optimization of the extraction process of the Aloe
pectin.
Pectin can be extracted from different sources (i.e. oranges,
apples, sunflowers, pumpkins) with different methods, including
the use of chelating agents, acids (like HCl) at high tempera-
tures to increase the yield, bases (as NaOH) that, however, cause
extensive degradation, or specific expensive enzymes (including
arabinase, galactanase, polygalacturonase, and rhamnogalatturo-
nase).20–23
The extraction procedure was developed according to the proto-
cols found in the literature for the extraction of pectin from dif-
ferent sources.20,22,24,25 This procedure was optimized by
introducing a microwave pretreatment, to preserve the quality
of the extracted pectin in terms of molecular mass and intrinsic
viscosity,26 and a pulp treatment with sodium citrate as a che-
lating agent, to limit the decrease of molecular weight of the
extracts when operating in biocompatible conditions.27 The
extraction of Aloe pectins with the chelating agent ethylenedia-
minetetraacetic acid (EDTA), able to bind to the calcium ions
of pectin chains, thus promoting pectin dissolution in water,
was found to be highly efficient with a yield higher than 50%
(w/w), with a galacturonic acid content of 70% (w/w).14 How-
ever, EDTA has some limitations because of its cytotoxicity for
biomedical application purposes.
In this work, for the first time at the best of our knowledge,
pectin extraction from A. Vera was optimized to prepare A. vera
pectin gels and assess their cytocompatibility.
EXPERIMENTAL
Fresh leaves of A. Vera, kindly provided by Farmacia Ambreck
(Milano, Italy), came from a controlled growing condition plan-
tation in Israel. The A. Vera leaves had a pH of 4.65, with a loss
on drying of 4.2 g/100 g and a content of moulds and yeast less
than 10 per 1 g. The leaves were purchased at Aloe Vera House
in the Moshav of Ein Yahav. The green rind of the fresh leaves
was removed and the clear pulp was washed in distilled water
for 30 minutes (10% (w/v)) to remove the anthraquinone-rich
sap.
Swelling and Stability of A. Vera Pulp
The clear pulp was characterized by evaluating the water uptake
and weight loss after freeze-drying for 24 h at 250�C (LIO-5P,
5pascal srl). The swelling rate of the freeze-dried was investi-
gated upon immersion of the samples (n 5 3) in 15 mL of
Phosphate Buffered Saline (PBS, P4417 Sigma Aldrich) up to 24
h at 37�C. At each time-point, the samples were wiped with fil-
ter paper to remove the excess liquid and weighed.
The water uptake (WU%) was determined according to the fol-
lowing equation:
WU%5Wt 2W0
W0
3100 (1)
where Wt is the wet weight at the time point t and W0 is the
initial weight of the samples.
The stability (WL%) of freeze-dried samples was determined by
measuring the weight loss up to 14 days in PBS, accordingly to
the following equation:
WL%5W02Wf
W0
3100 (2)
where Wf is the final dry weight and W0 is the initial weight of
the samples.
Ruthenium Red Assay
Samples of the inner gel from three leaves were stained with
ruthenium red (84 071-5G, Sigma, Italy) to selectively detect
pectin distribution within the cell walls. Transverse and longitu-
dinal sections obtained from the pulp were immersed in 0.2%
(w/v) ruthenium red solution (1 g of aloe gel in 10 mL of
Figure 1. Selected regions of pectins: a backbone of 1,4-linked a-D-galac-
turonic acid, which represents the smooth region and contains a variable
number of methyl ester groups and a hairy region consists of
rhamnogalacturonan-I and rhamnogalacturonan-II, branched polysaccha-
rides containing blocks of neutral monosaccharidic units, galactose, and
rhamnose.51 [Color figure can be viewed in the online issue, which is
available at wileyonlinelibrary.com.]
ARTICLE
2 J. APPL. POLYM. SCI. 2013, DOI: 10.1002/APP.39760 WILEYONLINELIBRARY.COM/APP
ruthenium red solution) for 15 min at room temperature, keep-
ing the solution under stirring to allow the penetration of the
dye. Then, the samples were washed in distilled water and
observed under a stereomicroscope (Nikon SMZ1000, WD 70,
Japan). The presence of pectin was detected by red coloring of
the pulp.
Extraction of Aloe Pectin
E1 Process. Briefly, the first process (E1) started with a separa-
tion with ethanol (02860 Sigma Aldrich) of Alcohol Insoluble
Residues (AIRs) which include pectin. To this aim, the inner gel
of Aloe was sliced and treated in 90% (v/v) boiling ethanol, at
70�C for 30 min [20% (wpulp/vethanol)]. The residue was then
washed for 10 min in 50 mL of ethanol [96% (v/v)]. After cool-
ing, the residue was separated from the extract by filtration on
sintered glass funnel. AIRs (1 g) were dispersed in 30 mL of 50
mM HCl (35328 Sigma, pH 5 2.9) and treated at 80�C for 1 h.
The cooled extract was separated from the residue by filtration
on sintered glass funnel. The pH of the extract was adjusted to
5.5 with 1M NaOH (S90637-369 Sigma). The product was then
extensively dialyzed against deionized water at 4�C using a
membrane with a molecular cut of 3500 Da (Spectra/PorVR Dial-
ysis membrane, Spectrumlabs), which allowed to remove the
salts present in the solution and to retain a pectin- rich solution
inside the membrane Finally, the freeze-drying of the final prod-
uct was performed, as described before.
E2 Extraction. E2 followed the procedure for E1 extraction, but
the isolation process was changed from freeze-drying to precipi-
tation into isopropyl alcohol [96% (v/v), 278475 Sigma] and
then the obtained product was centrifuged (ALC, 4236 Centri-
fuge, 2000 rpm for 1 minute).
E3 Extraction. E3 procedure followed that of E2 extraction, but
a microwave pretreatment was added. Pulp samples were
immersed in deionized water and heated at 400 W for 10 min
in a microwave oven (Clatronic MWG 737) before the AIRs
separation. To improve protein solubility, the volume of ethanol
for separation of AIRs was varied from 90% (v/v) to 70% (v/v).
E4 Extraction. E4 procedure followed that of E3 extraction,
but, instead of using HCl solution, the AIRs were dispersed in
a 50 mM sodium citrate solution (71404 Sigma) (0.5% w/v)
and treated at 70�C for 2 h. In these conditions, the dialysis
time was extended from 12 to 24 h to allow the removal of
the salts.
Analysis of Extracted Pectin
Pectin Yield. The yield of the AIRs after ethanol treatment,
compared to the fresh pulp weight, was estimated by the follow-
ing equation:
AIR yield5ðgðdry AIRsÞ=gðfresh pulpÞÞ100 (3)
The yield of the extracted pectins from the dry AIRs weight was
calculated as follows:
Pectin yieldAIRs5ðgðextracted pectinÞ=gðdry AIRsÞÞ100; (4)
Finally, the pectin yield compared to the initial dry pulp was
estimated as follows:
Pectin yieldPULP5ðgðextracted pectinÞ=gðdry pulpÞÞ100 (5)
FT-IR Analysis. The extracted pectin samples were character-
ized by FT-IR spectroscopy (Nicolet 6700, Thermo Electron
Corporation) by use of a single-bounce Attenuated Total Reflec-
tance (ATR) accessory equipped with a ZnSe crystal. Spectra of
dried samples were acquired at a resolution of 4 cm21 (region
of 4000–700 cm21) using the OMNIC software. In order to
quantify the presence of esterified carboxylic groups and of the
carboxylate anions, the areas of the bands at 1745 and 1630
cm21 were recorded by the use of the built-in software of the
FT-IR instrument. The limits of the band at 1745 cm21 were
set from 1800 and 1690 cm21 and those of the band at 1630
cm21 from 1690 and 1530 cm21. The area peaks were then nor-
malized versus the area of the CH stretching at 2900 cm21 (lim-
its set from 3000 and 2830 cm21).
Low methoxyl (LM) commercial pectin from citrus fruits
(CU701, DE 5 42%, Herbstreit & Fox Neuenbuerg), was used
for comparison purposes.
Molecular Weight Evaluation by Intrinsic Viscosity. The
intrinsic viscosity [g] of the extracted pectin samples was meas-
ured using an Ostwald viscometer. The measurements were
made at a temperature of 24�C 6 1�C. Pectin powders were
dissolved in 0.1M NaCl (13423 Sigma) with five different con-
centrations (2, 1.33, 1, 0.8, 0.67 mg/mL); for all solutions, the
efflux time was measured. Intrinsic viscosity [g] was determined
by Mark–Howkin–Sakurada equation:
½g�5K3Ma (6)
where K 5 9.55 3 1024, a 5 0.73.28
Measure of the Degree of Esterification. The colorimetric
method of McReady29 was used to quantitatively evaluate the
ester groups on pectin structure. The carboxylic acids deriva-
tives, such as the esters, react in the presence of hydroxylamine
to form hydroxamic acid complex that produces red/purple ions
with Iron (III). In short, 1 mL of a 1% (w/v) aqueous solution
of pectin was added to 1 mL of 13.9% (w/v) hydroxylamine
solution (379921-5G Sigma) and to 1 mL of 3.5M NaOH. The
resulting solution was left under stirring for 2 min, then 1 mL
of 4.1M HCl (37% 25148 Sigma) was added, followed by 1 mL
of 0.74M ferric chloride (FeCl3, 157740 Sigma) solution in 0.1N
HCl. A yellow-orange color was developed in the sample solu-
tions, and the absorbance of the chromophore was measured at
520 nm by UV spectroscopy (6705 UV/Vis Spectrophotometer,
Jenway). Before each acquisition, a spectrum of the blank solu-
tion containing all the reagents, pectin excluded, was acquired.
To evaluate the pectin degree of esterification, the absorbance of
the blank solution at 520 nm was subtracted to the absorbance
of the unknown sample at the same wavelength.
The measured absorbance was fitted in a calibration curve pre-
viously developed18 to obtain the degree of esterification.
Gelling Behavior of the Extracted Pectin
Pectin gels were produced by using the pectin powder extracted
from the E4 process. Before the assessment of the cytocompati-
bility tests, the pectin powder was disinfected with ethanol (5
mL of ethanol solution for 10 mg of pectin powder). In short,
ARTICLE
WWW.MATERIALSVIEWS.COM WILEYONLINELIBRARY.COM/APP J. APPL. POLYM. SCI. 2013, DOI: 10.1002/APP.39760 3

the pectin powder was suspended in ethanol solution (96% v/v)
for 1 h under vigorous stirring. The ethanol solution was
changed every 15 min. Then the powder was dried under a lam-
inar flow hood until complete alcohol evaporation. The pectin
powder was employed for producing gels with Ca11 ions using
the ionotropic method.18 In details, 1 mL of 2% (w/v) pectin
aqueous solution was put in each well of a 48-multiwell plate.
The well plate was left overnight at 230�C, then 1 mL of 1.6%
(w/v) aqueous solution of calcium chloride (CaCl2, C1016
Sigma) was added, and the multiwell plates were left at 4�Covernight to allow the formation of homogeneous gel networks.
Subsequently, the CaCl2 solution in excess was discarded, and
the gels were washed three times with 1 mL of distilled water,
with changes of water every 10 min. All steps were performed
in a laminar flow box.
Swelling and Stability Pectin Gels
The swelling and the stability of pectin gels were investigate
upon immersion of the samples (n 5 3) in 15 mL of PBS up to
24 h at 37�C. The water uptake (WU%) and the weight loss
(WL%) were determined according to the eq. (1) and (2).
Cytocompatibility of Pectin Gels
The cytocompatibility of the disinfected gels was tested in vitro,
using the osteosarcoma cell line SAOS-2 (American Type Cul-
ture Collection, Rockville, MD) by a direct contact test. Briefly,
SAOS-2 cells were collected from a stock culture by trypsiniza-
tion and seeded onto multiwell tissue culture plates (TCPS)
with a cell density of 1 * 106 cells/mlgel. The cells were fed with
culture medium (McCoy’s 5A, Lonza) supplemented with 10%
FBS and incubated at 37�C in a 5% CO2 atmosphere. After the
incubation time (24 h), the cell viability was evaluated by the
MTT test. MTT assay is based on the use of the MTT tetrazo-
lium salt [3-(4,5-dimethylthiazol-2-yl)-2,5-diphenyl tetrazolium
bromide)] that is reduced to a purple insoluble formazan prod-
uct in living cells by mitochondrial succinate dehydrogenase.
The cells and MTT solution (5 mgMTT/1,5 mLPBS) were incubated
at 37�C for 3 h. At the end of the incubation period, the MTT
solution was removed and replaced with 0.5 mL/well of isopropa-
nol in 0.04N HCl. The wells were stirred for 5 min until the
color was uniform and the absorbance was evaluated at 595 nm.
The analyses were performed in triplicate, using cells seeded on a
TCPS as a control. All data were analyzed with one-way analysis
of variance (Anova) test with Bonferroni post-hoc analysis.
A Pvalue < 0.0001 was assumed as statistically significant.
RESULTS AND DISCUSSION
Before pulp characterization and pectin extraction, A. Vera pulp
underwent a purification step by deionized water washing at
room temperature for 30 minutes. The water treatment effec-
tively removed anthraquinones present in the exudate.30 Previ-
ous studies reported that the anthraquinone-rich exudate is
toxic to epithelial tissue cells, causing hypersensitivity skin reac-
tions, and produces undesirable effects to the intestine, causing
an inflammatory response of the mucous membranes.30
Swelling and Stability of Lyophilized Pulp Samples
The swelling curves of Aloe pulp samples showed that after 5
minutes a mean plateau value of 5000% was reached (data not
shown). The samples retrieved the entire amount of water that they
lost during the lyophilization (about 98% of the whole pulp). The
weight loss of lyophilized Aloe pulp samples was slightly increasing
with time, reaching 25% of weight loss in 14 days.
Pectin Staining in A. Vera Pulp
The presence of pectin in the cell walls of Aloe pulp was con-
firmed by clear pulp ruthenium red staining. The cell walls, rich
in pectin, acquired a pink/red color, whereas the inner parts,
mainly composed of water, did not absorb the color (Figure 2).
Pectin was extracted from the inner gel of A. Vera leaves by the
procedure described in the scheme of Figure 3. The experimen-
tal parameters were varied to optimize the yield of the extracted
product, leading to four different extraction processes (E1, E2,
E3, E4).
Changing the experimental conditions resulted in four different
extraction processes and in four extraction products with differ-
ent physico-chemical characteristics, as shown in Table I.
Optimization of the Extraction Process (E1)
To develop a method able to profitably extract pectin from A.
Vera leaves, various procedures described in the literature22,24,31
for pectin extraction from different sources have been considered.
Figure 2. Optical microscope images of the pulp before (A) and after (B) ruthenium red staining: the red staining of pectin (B) shows the typical honey-
comb structure of the plant cell walls. The inner zone remained transparent to the dye. [Color figure can be viewed in the online issue, which is available
at wileyonlinelibrary.com.]
ARTICLE
4 J. APPL. POLYM. SCI. 2013, DOI: 10.1002/APP.39760 WILEYONLINELIBRARY.COM/APP

The extraction in severe acidic conditions allows obtaining a
high amount of pectin from the hydrolysis of insoluble proto-
pectin, formed by the combination of the pectin molecules with
the cellulose.32 However, acidic extractions lead to great
amounts of effluents that needed to be removed.22
The initial extraction method (E1), which involved the AIRs
separation in ethanol 90% (v/v), AIRs treatment in HCl solu-
tion and freeze-drying, led to a pectin with a high DE%
(77.41%).
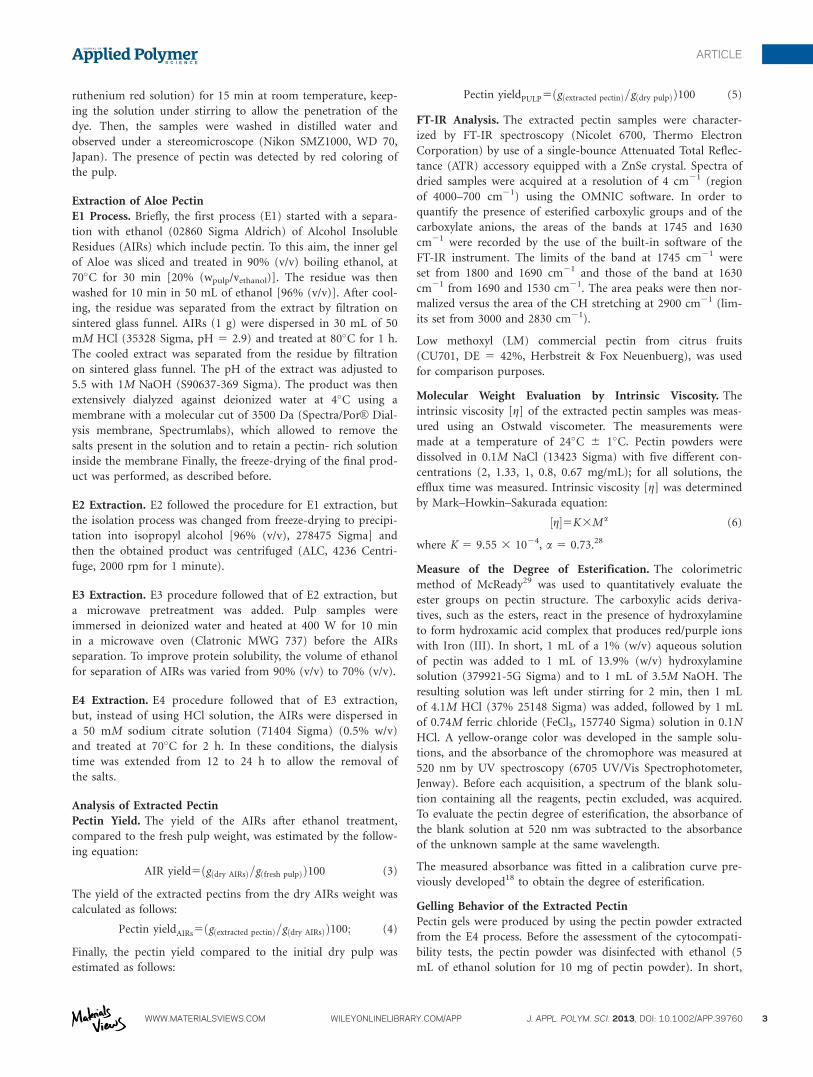
The chemical structure of the extracted pectins was evaluated
by FTIR spectroscopy (Figure 4). The IR absorption in the O-H
region is because of the inter- and intramolecular hydrogen
bonding of the galacturonic acid chain.33 In E1 spectrum, the
peak at 1745 cm21, associated to the C5O stretching vibration
of methyl esterified groups and COOH groups, and the peak of
the asymmetric carboxylate ion stretching band (COO2) at
1630 cm21 showed similar patterns to the corresponding peaks
of the commercial pectin (Figure 4).
In spite of the high methoxy content detected by UV measure-
ments, the A/B peak area ratio of E1 extract was comparable to
that of the commercial low-methoxy pectin (Table I). As the
band at 1745 cm21 is the sum of the contribution of both de-
esterified, not salified, COOH and the COOR, the variation of
this ratio cannot be considered a robust tool for the evaluation
of the de-esterification when the differences in intensity are
small.34
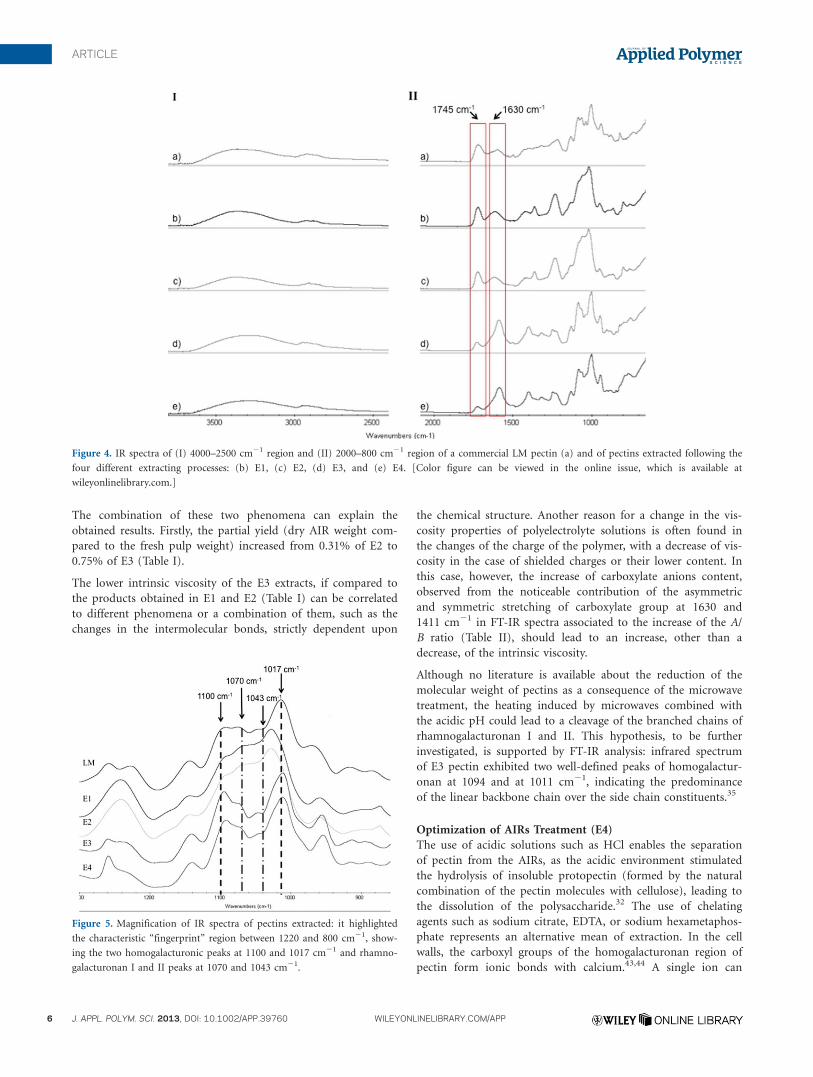
In the finger print region, the spectrum showed typical bands
of homogalacturonans between 1200–1000 cm21 (C-O stretch-
ing at 1100 cm21 and C-C stretching at 1017 cm21) and the
bands typical of the different monosaccharidic residues present
in the branched regions (1070-1043 cm21) indicating the pres-
ence of the branching composed of rhamnagalactoronan regions
(Figure 5).35
The extracted pectin did not allow forming ionotropic gels. The
process required long times and an extensive step of purifica-
tion, therefore it was gradually changed to optimize the aspects
concerning both the procedure of extraction and the quality of
the final product.
Optimization of Isolation of Pectin (E2)
Following extraction, pectin samples can be obtained by removing
other compounds (i.e. free sugars, salts) by washing the precipitate
with different concentrations of alcohol.36 In E2 extraction, the
precipitation in isopropanol, instead of lyophilization, allowed a
reduction of the duration of the whole process from days to few
hours. Furthermore, the precipitation in alcohol such as isopropa-
nol increases pectin purity by removing alcoholic soluble salts and
neutral sugars present in the cell walls.36–39
The introduced changes of the extraction process did not pro-
vide substantial physico-chemical differences detectable by FT-
IR analysis in the E2 product (Figures 4 and 5), although minor
differences can be observed in the intrinsic viscosity and degree
of esterification (Table I).
Optimization of AIRs Separation (E3)
Pectin yield can be improved by a microwave pretreatment that
inhibits the activity of pectin-esterase enzymes, which induce the
depolymerization of the polysaccharide before the extraction.26
For this reasons, a microwave pretreatment was introduced in E3.
On the other side, the rate of the depolymerization by acidic
hydrolysis is known to increase with temperature and degree of
esterification40 and occurs at faster rates than neutral polysac-
charides in the acid pH range41 as in A. Vera.42
Figure 3. Scheme of the procedure optimization from extraction E1 to E4.
Table I. DE%, Intrinsic Viscosity, Molecular Weight, and Yields of the Four Different Extraction Procedures
Sample DE % gi (mL/g) MW (kDa) AIR yield (%) Pectin yieldAIRs (%) Pectin yieldPULP (%)
E1 77.41 386.29 87.30 0.34 4.20 0.95
E2 68.00 257.58 50.10 0.31 1.84 0.38
E3 22.41 197.52 34.80 0.75 0.79 0.45
E4 2.93 481.14 117.93 0.69 5.77 2.64
ARTICLE
WWW.MATERIALSVIEWS.COM WILEYONLINELIBRARY.COM/APP J. APPL. POLYM. SCI. 2013, DOI: 10.1002/APP.39760 5
The combination of these two phenomena can explain the
obtained results. Firstly, the partial yield (dry AIR weight com-
pared to the fresh pulp weight) increased from 0.31% of E2 to
0.75% of E3 (Table I).
The lower intrinsic viscosity of the E3 extracts, if compared to
the products obtained in E1 and E2 (Table I) can be correlated
to different phenomena or a combination of them, such as the
changes in the intermolecular bonds, strictly dependent upon
the chemical structure. Another reason for a change in the vis-
cosity properties of polyelectrolyte solutions is often found in
the changes of the charge of the polymer, with a decrease of vis-
cosity in the case of shielded charges or their lower content. In
this case, however, the increase of carboxylate anions content,
observed from the noticeable contribution of the asymmetric
and symmetric stretching of carboxylate group at 1630 and
1411 cm21 in FT-IR spectra associated to the increase of the A/
B ratio (Table II), should lead to an increase, other than a
decrease, of the intrinsic viscosity.
Although no literature is available about the reduction of the
molecular weight of pectins as a consequence of the microwave
treatment, the heating induced by microwaves combined with
the acidic pH could lead to a cleavage of the branched chains of
rhamnogalacturonan I and II. This hypothesis, to be further
investigated, is supported by FT-IR analysis: infrared spectrum
of E3 pectin exhibited two well-defined peaks of homogalactur-
onan at 1094 and at 1011 cm21, indicating the predominance
of the linear backbone chain over the side chain constituents.35
Optimization of AIRs Treatment (E4)
The use of acidic solutions such as HCl enables the separation
of pectin from the AIRs, as the acidic environment stimulated
the hydrolysis of insoluble protopectin (formed by the natural
combination of the pectin molecules with cellulose), leading to
the dissolution of the polysaccharide.32 The use of chelating
agents such as sodium citrate, EDTA, or sodium hexametaphos-
phate represents an alternative mean of extraction. In the cell
walls, the carboxyl groups of the homogalacturonan region of
pectin form ionic bonds with calcium.43,44 A single ion can
Figure 5. Magnification of IR spectra of pectins extracted: it highlighted
the characteristic “fingerprint” region between 1220 and 800 cm21, show-
ing the two homogalacturonic peaks at 1100 and 1017 cm21 and rhamno-
galacturonan I and II peaks at 1070 and 1043 cm21.
Figure 4. IR spectra of (I) 4000–2500 cm21 region and (II) 2000–800 cm21 region of a commercial LM pectin (a) and of pectins extracted following the
four different extracting processes: (b) E1, (c) E2, (d) E3, and (e) E4. [Color figure can be viewed in the online issue, which is available at
wileyonlinelibrary.com.]
ARTICLE
6 J. APPL. POLYM. SCI. 2013, DOI: 10.1002/APP.39760 WILEYONLINELIBRARY.COM/APP

bind two chains of pectin, creating a highly connected, interwo-
ven and insoluble structure. When complexing agents bind to
the calcium ions of AIRs, ionic bonds are broken and pectin
becomes soluble in an aqueous solution. The use of sodium
citrate as a sequestering agent, compared to other chelating
agents, allows obtaining a final product free of amounts of toxic
effluents that require treatment of purification before the in
vitro tests for cytocompatibility.27
In E4, sodium citrate treatment was introduced instead of the
HCl process.
The FT-IR analysis, performed on the product of the E4 extrac-
tion, was comparable to E3 extract, but with an evident pres-
ence of bands attributed to sodium citrate. Therefore, it was
necessary to purify the extracts through ethanol washing (40%
v/v), and to extend the dialysis time to remove the excess of
sodium citrate (data not shown). The peak areas of carbonyl
and carboxylate (Table II) showed that the contribution of car-
boxylate group was strongly increased in the case of E4 extract
(Table II). The low degree of esterification was confirmed by
UV measurements of DE% (Table I), indicating lower DE% for
this sample if compared to the commercial analyzed one.
The sodium citrate treatment had a double effect on the
extracts: firstly, a significant increase of the yield of pectin
extracted with sodium citrate was observed if compared to the
yield of HCl treatment (increase of pectin yield of 14 %, see the
values of pectin yieldAIRs in Table I); then the extracts had a
lower DE% because of the higher pH of the treatment solution
(pH 7.6 of sodium citrate solution compared to pH 2.9 of HCl
solution) that led to a partial pectin de-esterification, as
reported in literature.45
The procedure developed for extract E4 led to pectin with high
molecular weight, as estimated by viscometry (Table I). Intrinsic
viscosity is a characteristic of macromolecules and is a key
property characterizing the frictional contributions of polymers
in dilute solutions. For molecules which can exist with a variety
of molecular weights, the relation between intrinsic viscosity
and molecular weight is one of the most important properties
[see eq. (1)]. Gelling abilities of pectins are related very closely
to molecular weight (MW): a higher MW allows to form stron-
ger and more entangled gel, as this polymer property is a direct
indication of the number of reactive sites available for complex-
ation.46,47 However, there are several correlated factors (i.e.
molar mass, polymer/solvent interactions and charge on the
macromolecules48) that influence the intrinsic viscosity of a pec-
tin diluted in a solution; hence, more studies have to be per-
formed to explain the correlation between the intrinsic viscosity
and the molecular weight of extracted pectins.
In the present work, the product obtained by extraction with
sodium citrate (E4) showed the lowest degree of esterification
and the highest MW, therefore it was selected for the produc-
tion of gels for growth/delivery of cells.
Gelling Evaluation of E4 Pectin
To evaluate the gelling ability of E4 extracts, the gels were
obtained by crosslinking with Ca21 ions, using CaCl2 solution
(Figure 6).
Swelling Studies. The time dependence of swelling of the
obtained gels is shown in Figure 7. The swelling behavior in
PBS of E4 pectin gels was compared to the one of commercial
LM pectin gels. The rate of swelling is influenced by the dimen-
sions of the gel network affecting the rate at which water can
diffuse into the polymer network. The swelling of Aloe pectin
gels reached a value of about 2500% within 1 h and it retained
this value up to 24 h of incubation. On the other hand, LM
Table II. Ratio of Ester Carboxyl and Carbonyl Ion Peak Area to CH Peak
Area of Pectin Samples
Sample
COO-R peakarea/CH peakarea (A)
COO2 peakarea/CH peakarea (B) Ratio B/A
LM pectin 1.49 1.45 0.97
E1 2.44 2.39 0.98
E2 2.36 2.12 0.89
E3 9.60 87.81 9.15
E4 1.67 35.00 20.95
Figure 6. (A) Aloe Vera pulp wash, (B) pectin obtained by E4 extraction, and (C) pectin gel obtained by ionic interaction with Ca21. [Color figure can
be viewed in the online issue, which is available at wileyonlinelibrary.com.]
ARTICLE
WWW.MATERIALSVIEWS.COM WILEYONLINELIBRARY.COM/APP J. APPL. POLYM. SCI. 2013, DOI: 10.1002/APP.39760 7

pectin gels reached a plateau of 1000% after 1 h and their
weight was retained up to 24 h. LM pectin gels showed lower
uptake, probably because of their cross-linked and entangled
networks, that resulted in a lower swelling if compared to Aloe
pectin gels. These data clearly demonstrated different structural
characteristic of the two pectins.
Stability Studies. Pectin gels lost approximately 15% of their
initial weight after 24 h of immersion in PBS, and then retained
their weight up to 14 days (end of the experiment, data not
shown).
The stability in PBS of Aloe pectin gels is significantly different
than the stability of gels prepared with commercially available
pectin. In fact, previous studies showed that pectin gels dis-
solved after few hours of incubation in PBS.18 Different hypoth-
eses could be made to explain the rapidly degradation occurred
during the first 24 h. The fast weight loss of the initial stage of
incubation could be related to a partial release of the residual
citrate in the extracted pectin; the purification process by etha-
nol washing and the extension of the dialysis time may have to
be optimized to exclude the presence of the salt. Furthermore,
the initial weight loss could be because of the release of non-
crosslinked pectin inside the network of the gel or to the degra-
dation of the pectin chains that can be enhanced at 37�C. All of
these phenomena could be possible and further investigations
have to be performed.
Cytocompatibility Tests. To investigate the suitability of Aloe
pectin gels for application in regenerative medicine, cytocom-
patibility tests were assessed in vitro by seeding and culturing
human cell line onto the gels and evaluating the number of via-
ble cells by MTT test. The viability of SAOS-2 cells seeded onto
Aloe pectin samples, measured 24 h after cell seeding resulted
similar (86%) to that of cells seeded on TCPS control plates
(assumed 100%), indicating that cells were alive and proliferat-
ing. Cell viability on commercial LM pectin gels were lower
(17%) than that on TCPS control (Figure 8). As SAOS-2 cells
need to adhere for proliferation, these results indicate an
improved adhesion onto Aloe pectin gels. Enzymatically cleaved
oligosaccharides from pectin branched regions were used as
coatings for different substrates. They are described to promote
osteoblasts adhesion, e.g. SAOS-249 and MC3T3 cell line.50
Thus, it could be hypothesized that the different monosacchari-
dic residues in the branched regions caused an improved cellu-
lar adhesion onto the Aloe pectin gel. This can be considered
indirectly giving information on the extracted pectin structure.
CONCLUSIONS
In this work we developed a novel process for pectin extraction
starting from a nonconventional pectin source, A. Vera leaves.
Although the A. Vera pulp is mainly composed of water (98.5%
on the whole) in this work we prove that A. Vera pectin can be
extracted with an easy and low-cost process. In particular, the
optimization of the extraction process led to a fair yield of puri-
fied pectin, which has interesting gelling proprieties because of
a low degree of esterification and high molecular weight.
In the present study, we put forward that the way of extraction
influences the chemical composition and macromolecular features
of pectins, in terms of DE%, molecular weight, structural charac-
teristics, and ability to form gel. The use of calcium chelating
agents, used in the E4 extraction pectin gels, demonstrated an
improved cytocompatibility compared to commercial LM pectin
gels. These results underline the potentiality of the Aloe pectin to
be used as a biomaterial suitable for the production of matrices
and gels for regenerative medicine applications.
ACKNOWLEDGMENTS
Authors wish to acknowledge Farmacia Ambreck (Milan, Italy) for
kindly providing Aloe Vera leaves used in this work and Herbstreit
& Fox Neuenbuerg (Germany) for kindly providing commercial
pectins used as control purpose. This work was partially supported
by MIUR, PRIN 2010-2011 prot. 2010 FPTBSH to P. Petrini.
REFERENCES
1. Davis, R. H.; Leitner, M. G.; Russo, J. M.; Byrne, M. E. J.
Am. Podiatr. Med. Assoc. 1989, 79, 559.
2. Rodriguezbigas, M.; Cruz, N. I.; Suarez, A. Plast. Reconstr.
Surg. 1988, 81, 386.
Figure 7. Swelling behavior of E4-Aloe pectin gels in PBS at 37�C up to
24 hours compared to commercial LM pectin.
Figure 8. Cell viability on Aloe pectin and LM pectin gels. Data are com-
pared with the control tissue culture polystyrene (TCPS) wells. Each bar
represents the mean 6 SD of three experiments. ***Statistical significance
between LM pectin and TCPS (P < 0.0001) and ###statistical significance
between LM pectin and Aloe pectin (P < 0.0001)
ARTICLE
8 J. APPL. POLYM. SCI. 2013, DOI: 10.1002/APP.39760 WILEYONLINELIBRARY.COM/APP

3. Chandu, A. N.; Santhosh, C.; Bhattacharjee, C.; Debnath, S.;
Kannan, K. K. Int. J. Appl. Biol. Pharm. Techonol. 2011, 2, 19.
4. Hamman, J. H. Molecules 2008, 13, 1599.
5. Li, J.; Zhang, Y.; Liu, X. in Bioinformatics and Biomedical
Engineering, (iCBBE) 2011 5th International Conference on,
2011, p 1.
6. Rajasekaran, S.; Ravi, K.; Sivagnanam, K.; Subramanian, S.
Clin. Exp. Pharmacol. Physiol. 2006, 33, 232.
7. Hu, Y.; Xu, J.; Hu, Q. J. Agric. Food Chem. 2003, 51, 7788.
8. Liu, L. S.; Fishman, M. L.; Hicks, K. B. Cellulose 2007, 14,
15.
9. Sriamornsak, P. Expert Opin. Drug Deliv. 2011, 8, 1009.
10. Kokkonen, H. E.; Ilvesaro, J. M.; Morra, M.; Schols, H. A.;
Tuukkanen, J. Biomacromolecules 2007, 8, 509.
11. Bussy, C.; Verhoef, R.; Haeger, A.; Morra, M.; Duval, J. L.;
Vigneron, P.; Bensoussan, A.; Velzenberger, E.; Cascardo, G.;
Cassinelli, C.; Schols, H.; Knox, J. P.; Nagel, M. D. J. Biomed.
Mater. Res. A, 86A, 597.
12. Liu, L. S.; Won, Y. J.; Cooke, P. H.; Coffin, D. R.; Fishman,
M. L.; Hicks, K. B.; Ma, P. X. Biomaterials 2004, 25, 3201.
13. Coimbra, P.; Ferreira, P.; de Sousa, H. C.; Batista, P.;
Rodrigues, M. A.; Corriea, I. J.; Gil, M. H. Int. J. Biol. Mac-
romol. 2011, 48, 112.
14. Ni, Y.; Yates, K. M.; Zarzycki, R. Carrington Laboratories,
Inc., Irving, Texas, US Patent, 1999.
15. McConaughy, S. D.; Stroud, P. A.; Boudreaux, B.; Hester, R.
D.; McCormick, C. L. Biomacromolecules 2008, 9, 472.
16. Voragen, A. G. J.; Pilnik, W.; Thibault, J. F.; Axelos, M. A.
V.; Renard, C. M. G. C., Eds. Pectins; Marcel Dekker: New
York, 1996.
17. Munarin, F.; Guerreiro, S. G.; Grellier, M. A.; Tanzi, M. C.;
Barbosa, M. A.; Petrini, P.; Granja, P. L. Biomacromolecules
2011, 12, 568.
18. Munarin, F.; Petrini, P.; Tanzi, M. C.; Barbosa, M. A.;
Granja, P. L. Soft Matter 2012, 8, 4731.
19. Munarin, F.; Petrini, P.; Bozzini, S.; Tanzi, M. C. J. Appl.
Biomater. Funct. Mater. 2012, 10, e67.
20. Kurita, O.; Fujiwara, T.; Yamazaki, E. Carbohydr. Polym.
2008, 74, 725.
21. Liu, Y.; Shi, J.; Langrish, T. A. G. Chem. Eng. J. 2006, 120,
203.
22. Panouille, M.; Thibault, J. F.; Bonnin, E. J. Agric. Food
Chem. 2006, 54, 8926.
23. Iglesias, M. T.; Lozano, J. E. J. Food Eng. 2004, 62, 215.
24. Zykwinska, A.; Boiffard, M. H.; Kontkanen, H.; Buchert, J.;
Thibault, J. F.; Bonnin, E. J. Agric. Food Chem. 2008, 56,
8926.
25. Singthong, J.; Ningsanond, S.; Cui, S. W.; Douglas Goff, H.
Food Hydrocoll. 2005, 19, 793.
26. Kratchanova, M.; Pavlova, E.; Panchev, I. Carbohydr. Polym.
2004, 56, 181.
27. Machado-Silveiro, L. F.; Gonzalez-Lopez, S.; Gonzalez-
Rodriguez, M. P. Int. Endod. J. 2004, 37, 365.
28. Anger, H.; Berth, G. Carbohydr. Polym. 1986, 6, 193.
29. McCready, R. M.; Reeve, R. M. Agric. Food Chem. 1955, 3,
260.
30. McAnalley, B. H.. Carrington Laboratories, Inc.: Irving,
Texas, 1990.
31. Levigne, S.; Ralet, M. C.; Thibault, J. F. Carbohydr. Polym.
2002, 49, 145.
32. Yeoh, S.; Shi, J.; Langrish, T. A. G. Desalination 2008, 218,
229.
33. Gnanasambandam, R.; Proctor, A. Food Chem. 2000, 68,
327.
34. Fellah, A.; Anjukandi, P.; Waterland, M. R.; Williams, M. A.
K. Carbohydr. Polym. 2009, 78, 847.
35. Kacurakova, M.; Capek, P.; Sasinkova, V.; Wellner, N.;
Ebringerova, A. Carbohydr. Polym. 2000, 43, 195.
36. Garna, H.; Mabon, N.; Robert, C.; Cornet, C.; Nott, K.;
Legros, H.; Wathelet, B.; Paquot, M. J. Food Sci. 2007, 72,
C001.
37. Gusek, T. W.; Zullo, L.; Eyal, A. M. US Patent, 2009.
38. Crandall, P. G.; Braddock, R. J.; Rouse, A. H. Proceedings of
the Florida State Horticultural Society, 1978, p 109.
39. Liu, L.; Cao, J.; Huang, J.; Cai, Y. R.; Yao, J. M. Bioresour.
Technol. 2010, 101, 3268.
40. Munarin, F.; Bozzini, S.; Visai, L.; Tanzi, M. C.; Petrini, P.;
Food Hydrocoll. 2013, 31, 74.
41. Krall, S. M.; McFeeters, R. F. J. Agric. Food Chem. 1998, 46,
1311.
42. Zapata, P. J.; Navarro, D.; Guillen, F.; Castillo, S.; Martinez-
Romero, D.; Valero, D.; Serrano, M. Ind. Crops Prod. 2013,
42, 223.
43. Habibi, Y.; Heyraud, A.; Mahrouz, M.; Vignon, M. R. Car-
bohydr. Res. 2004, 339, 1119.
44. Yapo, B. M.; Robert, C.; Etienne, I.; Wathelet, B.; Paquot,
M. Food Chem. 2007, 100, 1356.
45. Joye, D. D.; Luzio, G. A. Carbohydr. Polym. 2000, 43, 337.
46. Vandeventerschriemer, W. H.; Pilnik, W. Acta Aliment. 1987,
16, 143.
47. Christensen, P. E. Food Res. 1954, 19, 163.
48. Yoo, S. H.; Fishman, M. L.; Hotchkiss, A. T.; Lee, H. G.
Food Hydrocoll. 2006, 20, 62.
49. Gurzawska, K.; Svava, R.; Syberg, S.; Yu, Y. H.; Haugshoj, K.
B.; Damager, I.; Ulvskov, P.; Christensen, L. H.; Gotfredsen,
K.; Jorgensen, N. R. J. Biomed. Mater. Res. A 2012, 100A,
654.
50. Kokkonen, H.; Cassinelli, C.; Verhoef, R.; Morra, M.; Schols,
H. A.; Tuukkanen, J. Biomacromolecules 2008, 9, 2369.
51. Munarin, F.; Tanzi, M. C.; Petrini, P.; Int. J. Biol. Macromol.
2012, 51, 681.
ARTICLE
WWW.MATERIALSVIEWS.COM WILEYONLINELIBRARY.COM/APP J. APPL. POLYM. SCI. 2013, DOI: 10.1002/APP.39760 9
Copyright © 2022 FDOKUMEN