


(PDF) Trace analysis of mefenamic acid in Human serum and ...
38
Author's Accepted Manuscript Trace analysis of mefenamic acid in Human serum and pharmaceutical wastewater samples after pre- concentration with Ni�Al layered double Hydro- xide nano-particles Hossein Abdolmohammad-Zadeh, Fatemeh Morshedzadeh, Elaheh Rahimpour PII: S2095-1779(14)00041-0 DOI: http://dx.doi.org/10.1016/j.jpha.2014.04.003 Reference: JPHA218 To appear in: Journal of Pharmaceutical Analysis Received date: 1 January 2014 Revised date: 12 April 2014 Accepted date: 25 April 2014 Cite this article as: Hossein Abdolmohammad-Zadeh, Fatemeh Morshedzadeh, Elaheh Rahimpour, Trace analysis of mefenamic acid in Human serum and pharmaceutical wastewater samples after pre-concentration with Ni�Al layered double Hydroxide nano- particles, Journal of Pharmaceutical Analysis, http://dx.doi.org/10.1016/j. jpha.2014.04.003 This is a PDF file of an unedited manuscript that has been accepted for publication. As a service to our customers we are providing this early version of the manuscript. The manuscript will undergo copyediting, typesetting, and review of the resulting galley proof before it is published in its final citable form. Please note that during the production process errors may be discovered which could affect the content, and all legal disclaimers that apply to the journal pertain. www.elsevier.com/locate/jpa www.sciencedirect.com
-
Upload
khangminh22 -
Category
Documents
-
view
3 -
download
0
Transcript of (PDF) Trace analysis of mefenamic acid in Human serum and ...
Author's Accepted Manuscript
Trace analysis of mefenamic acid in Human serumand pharmaceutical wastewater samples after pre-concentration with Ni�Al layered double Hydro-xide nano-particles
Hossein Abdolmohammad-Zadeh, FatemehMorshedzadeh, Elaheh Rahimpour
PII: S2095-1779(14)00041-0DOI: http://dx.doi.org/10.1016/j.jpha.2014.04.003Reference: JPHA218
To appear in: Journal of Pharmaceutical Analysis
Received date: 1 January 2014Revised date: 12 April 2014Accepted date: 25 April 2014
Cite this article as: Hossein Abdolmohammad-Zadeh, Fatemeh Morshedzadeh, ElahehRahimpour, Trace analysis of mefenamic acid in Human serum and pharmaceuticalwastewater samples after pre-concentration with Ni�Al layered double Hydroxide nano-particles, Journal of Pharmaceutical Analysis, http://dx.doi.org/10.1016/j.jpha.2014.04.003
This is a PDF file of an unedited manuscript that has been accepted for publication. As aservice to our customers we are providing this early version of the manuscript. Themanuscript will undergo copyediting, typesetting, and review of the resulting galley proofbefore it is published in its final citable form. Please note that during the production processerrors may be discovered which could affect the content, and all legal disclaimers that applyto the journal pertain.
www.elsevier.com/locate/jpa
www.sciencedirect.com

1
Trace analysis of mefenamic acid in human serum and
pharmaceutical wastewater samples after pre-concentration with
Ni Al layered double hydroxide nano-particles
Hossein Abdolmohammad-Zadeha*, Fatemeh Morshedzadehb, Elaheh Rahimpoura
aDepartment of Chemistry, Faculty of Sciences, Azarbaijan Shadid Madani University,
35 Km Tabriz-Marageh Road, P.O. Box 53714-161, Tabriz, Iran
bDepartment of Chemistry, Payame Nour University of Tabriz, P.O. Box 19395-3697,
Tabriz, Iran
Running title:
“Extraction of mefenamic acid by Ni Al layered double hydroxide”
* Corresponding author. Tel.: +98 4124327500, Fax: +98 4124327541.
E-mail addresses: [email protected], [email protected]

2
Abstract
In this work, the nickel–aluminum layered double hydroxide (Ni-Al LDH) with nitrate
interlayer anion was synthesized and used as a solid phase extraction sorbent for the selective
separation and pre-concentration of mefenamic acid prior to quantification by UV detection at
λmax= 286 nm. Extraction procedure is based on the adsorption of mefenamate anions on the Ni–
Al(NO3−) LDH and/or their exchange with LDH interlayer NO3
− anions. The effect of several
parameters such as cations and interlayer anions type in LDH structure, pH, sample flow rate,
elution conditions, amount of nano-sorbent and co-existing ions on the extraction were
investigated and optimized. Under the optimum conditions, the calibration graph was linear
within the range 2–1000 µg/L with a correlation coefficient of 0.9995. The limit of detection and
relative standard deviation were 0.6 µg/L and 0.84 % (30 µg/L, n= 6), respectively. The
presented method was successfully applied to the determination of mefenamic acid in human
serum and pharmaceutical wastewater samples.
Keywords: Mefenamic acid; Solid phase extraction; Nano-sorbent, Nickel-aluminum layered
double hydroxide; Ultraviolet spectroscopy
3
1. Introduction
Mefenamic acid (MFA, 2-(2,3-dimethyl phenyl) aminobenzoic acid) is a prevailing non-
steroidal anti-inflammatory drug that used as potent analgesic and anti-inflammatory agents in
the treatment of several pathologies such as osteoarthritis, nonarticular rheumatism, sport injuries
and other painful musculoskeletal illnesses [1,2]. Overdoses of mefenamic acid produce toxic
metabolite accumulation that cause nausea, vomiting and occasionally bloody diarrhea [1]. On
the other hand, MFA is a diphenylamine derivative pollutant and the third compound on the
European Union list of priority pollutants [3]. Many studies have revealed that MFA cannot be
effectively removed by conventional sewage treatment plants and that it has been detected at
trace level in the effluent of wastewater treatment plants [4-7]. Due to vital importance and
widespread use of MFA, the need for the development of simple and sensitive analytical
methods for trace analysis of drug is increasing.
So far, various analytical methods regarding MFA determination in pharmaceutical
formulations and biological fluids have been published in literature. Some reported methods are
spectrophotometry [8–11], fluorimetry [12–14], potentiometry [15–18], chromatography [19–
23], chemiluminescence [24,25] and capillary electromigration [26,27]. However, to determine
the trace levels of drug, spectrophotometry may be used, especially in combination with
extraction for separation of special purpose component from main admixture. Solid-phase
extraction (SPE) techniques have recently been among the most popular separation methods for
the enrichment of analytes prior to their determination. The basic principle of SPE is the pre-
concentration and purification of analytes from solution by sorption on a solid sorbent [28]. SPE
has several advantages over other techniques, such as low cost, low consumption of organic
solvents, high enrichment factor, high recovery, safety with respect to hazardous samples and the

4
ability of combination with different detection techniques in the form of on-line or off-line mode
[29]. Recently, nano-meter sized materials have been used as sorbents in SPE procedures.
Layered double hydroxides (LDHs) are a class of synthetic ionic inorganic compounds with
a similar structure to clays and with the general formula of [M2+1−xM3+
x (OH)2]x+[An−x/n·
mH2O]x−, where M2+ is a divalent metal ion like Zn, Mg, Cu, Co or Ni, M3+ is a trivalent metal
ion like Al, Fe or Cr, x is the ratio of M3+/(M2++M3+) and An– is a n-valent anion [30]. The layer
structure of LDHs is based on that of brucite [Mg(OH)2], which is typically associated with small
polarizing cations and polarizable anions. Their structure is based on a series of layers, where a
divalent metal cation is located in the center of octahedron, and two-dimensional infinite layers
are formed by edge-sharing of octahedral. The partial substitution of divalent cations by trivalent
ones generates a positives charge on the layers that is balanced by anions or molecules of
solvent. Interlayer anions can be exchanged with various kinds of inorganic or organic anions by
ion exchange reaction or surface adsorption [31,32]. Scheme 1 shows ion exchange mechanism
of mefenamate anions, as organic anions, with the interlayer anions in a LDH structure.
In the present work, a simple SPE system based on Ni-Al(NO3–) LDH was developed for
the separation and pre-concentration of MFA prior to determination by spectrophotometry. To
the best of knowledge, there is no report concerning the application of the LDHs in SPE of MFA.
The effect of various experimental parameters on the extraction efficiency of MFA was
investigated and the presented method was successfully used for trace analysis of MFA in
various real samples.
5
(Scheme 1 here)
2. Experimental
2.1. Apparatus and instruments
The UV–Vis absorption spectra and intensity measurements are recorded on a 1601 PC UV–
Vis spectrophotometer (Shimadzu, Japan). A 2 mL polypropylene cartridge (30 mm×7 mm i.d.)
(Shafa Co. Iran) containing 250 mg of Ni-Al(NO3−) LDH with cotton-fitted ends is used to
extraction of the analyte. A vacuum pump model DV-85N-250 (Platinum Co., USA) is used for
controlling the flow rate of solution throughout the column.
In order to obtain better insight into the structural properties of LDH, XRD data were
collected on a Brucker-D8 advance X-ray powder diffractometer using CuKα radiation source (λ=
0.154 nm) operating at 40 kV and 30 mA. The patterns were recorded at 2θ from 2 º to 70º at
room temperature. Also, Fourier transform infrared (FT-IR) spectra (4000–400 cm−1) were
recorded using a Shimadzu FT-IR Spectrometer, model 8400 (Japan). The samples were mixed
with KBr with a sample/KBr weight ratio of 1/100 and pressed into a disk. Morphological
characterization of the synthesized Ni-Al(NO3−) LDH was performed using a scanning electron
microscope (SEM) model Hitachi S 4160 and a transmission electron microscope (TEM) model
PHILIPS SM10. A centrifuge (Shimifann CE. 86) with a relative centrifugal force of 2810 g
(4000 rpm) was used to accelerate the phase separation. The pH was adjusted using a Motrohm
pH-meter (model 827, Switzerland) with a precision of ±0.01. An electrical furnace (Exciton
Co., Iran) with an accuracy of ±1 °C was applied to control the temperature in LDH synthesis
process.

6
2.2. Standard solutions and reagents
All the chemicals were of analytical-grade and all solutions were prepared with high purity
deionized water (Shahid Ghazi Co., Tabriz, Iran). A 1000 mg/L stock solution of mefenamic acid
was prepared by dissolving appropriate amount of reagent in deionized water. Working standard
solutions were prepared daily by suitable stepwise dilution of the stock solutions with deionized
water and shaking them just prior to use. All salts used for the interference study, NaOH, NaCl,
and LDH precursors i.e., purified nickel nitrate hexahydrate (Ni(NO3)2·6H2O, 99%) and
aluminum nitrate nonahydrate (Al(NO3)3·9H2O, 99%) were purchased from Merck (Darmstadt,
Germany). All the plastic and glassware was properly aged in 15 % (v/v) nitric acid at least
overnight, and subsequently washed three times with deionized water prior to use.
2.3. Preparation of nickel-aluminum layered double hydroxide
The Ni–Al(NO3−) LDH was prepared by co-precipitation method with controlled pH, and
followed by hydrothermal treatment according to our previous work [33] with some
modifications. 0.581 g Ni(NO3)2. 6H2O and 0.375 g Al(NO3)3.9H2O were dissolved in 30 mL
deionized water under vigorous stirring at room temperature. The pH of the reaction mixture was
adjusted to 9.6 by the addition of 1 M NaOH solution. The reaction continued for another 30 min
under nitrogen protection. Then, the obtained slurry was subjected to hydrothermal treatment at a
constant temperature of 90 °C for about 24 h. The obtained product was separated by
centrifugation at 4000 rpm for 10 min, washed several times with deionized water and dried at
60 °C.

7
2.4. Column preparation
The column is prepared by introducing 250 mg of synthesized nano-sorbent into a 2 mL
polypropylene cartridge. The ends of the column were plugged with a small portion of cotton
wool to retain the nano-sorbent in the column. Before loading the sample, 2.5 mL of 1 M NaOH
solution was passed through the column to clean it. Then, the column was conditioned by
passing 5 mL of deionized water prior to each use.
2.5. Sample preparation
2.5.1. Wastewater
The wastewater samples were collected in pre-washed (with detergent, deionized water,
dilute HNO3 and deionized water, respectively) polyethylene bottles from different effluents of
Zahravi Pharmaceutical Manufactory (Tabriz, Iran). These samples were filtered through Black
band filter paper and centrifuged to remove any suspended particulate. Then, aliquots of 200 mL
from samples were analyzed within 24 h of collection without previous treatment.
2.5.2. Human serum
Human blood samples were obtained from healthy volunteer and patients’ ones that
consumed the mefenamic acid at Ali-Nasab hospital (Tabriz, Iran). To prepare serum samples,
they were drawn into the test tube, centrifuged at 3000 rpm for 10 min and then allowed to stand
at 4 ºC until the phase separation was done. The serum samples were kept in a freezer (−80 ºC)
until analysis. A 500 μL of each serum sample was transferred into a 25 mL volumetric flask and

8
diluted to the mark with deionized water. Finally, the concentration of mefenamic acid in the
obtained sample solution was determined as described in “General procedure” section.
2.6. General procedure
An aliquot of 200 mL from aqueous standard or sample solution containing MFA (pH 7) in
the range of 2–1000 µg/L was passed through the Ni–Al(NO3−) LDH nano-sorbent in a column
at a flow rate of 2 mL min−1. After sample loading, 2.5 mL of 1 M NaOH solution was used for
the elution of the retained analyte from the column. The concentration of the mefenamic acid is
subsequently determined spectrophotometrically by measuring the absorbance of the solution at
λ= 286 nm.
3. Results and discussion
3.1. Selection of layered double hydroxide
The charge density and anion exchange capacity of the LDHs were controlled by varying the
type of di- and trivalent cations and their ratios in the LDH structure. The nature of the layer
cations can be changed among wide possible selection (almost restricted by size and charge), and
because of weak LDHs interlayer bonding, the nature of interlayer anions can be also freely
selected [34]. Therefore, seven LDHs with different cations i.e., Zn2+, Ni2+, Mg2+, Al3+ and Fe3+
and same interlayer anion (nitrate) were synthesized and used as nano-sorbents in SPE of MFA.
The results are displayed in Fig. 1A. As it can be seen, the best recovery is achieved in the case
of Ni Al LDH with 1:1 Ni2+: Al3+ molar ratio. The type of interlayer anion is important and can
be affected the retention efficiency of analytes. Therefore, three Ni Al LDHs with different

9
interlayer anions such as SO42–, NO3
– and CO32– were synthesized and tested for SPE of MFA.
As shown in Fig. 1B, the highest recovery was obtained in the case of NO3– interlayer anion. So,
Ni Al(NO3−) LDH was used as a nano-sorbent in further SPE experiments.
(Figures 1A and 1B here)
3.2. Characterization of nano-sorbent
The powder X ray diffraction (XRD) is a very powerful technique for characterizing the
structure of materials. Fig. 2A shows XRD pattern of the Ni Al(NO3−) LDH nano-sorbent. It can
be seen that the synthesized LDH have the characteristic structure of hydrotalcite-like
compounds. This fact is verified by existing the characteristic reflection peaks of (0 0 3), (0 0 6),
(0 0 9) planes and the typical doublet of (1 1 0) – (1 1 3) planes in XRD pattern of the LDH. The
Fourier transform infrared (FT-IR) spectrum which used for identifying the nature and symmetry
of interlayer anions and the presence of impurity phases was included in Fig. 2B. The broad band
around 3517 cm−1 can be assigned to the stretching vibration of the hydroxyl groups of LDH
layers and interlayer water molecules. Also, the weak band at 1766 cm−1 is due to the bending
mode of interlayer water molecules and the band with maximum peak at 1379 cm−1 is belong to
stretching vibration of NO3− ions intercalated in the interlayer gallery. Finally, bands at lower
wavenumbers (400–800) are due to vibrational modes of M–O, M–O–M, and O–M–O species.
The scanning electron microscopy (SEM) was employed to explore the morphology of the nano-
sorbent. SEM image of Ni Al(NO3−) LDH (Fig. 2C) shows an aggregate due to the collection of
crystallites as small pseudo-hexagonal platelets after thermally treated at 90 °C for about 24 h.
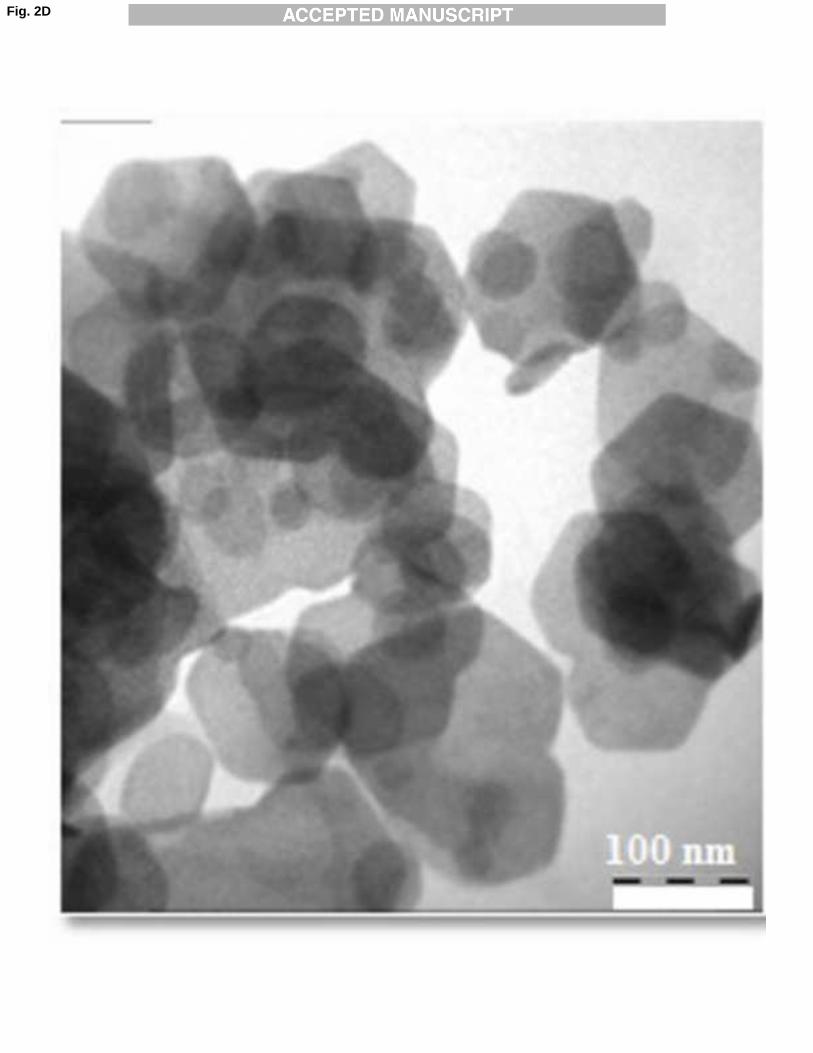
The approximate sizes of the particles fall in the 10–60 nm range. Transmission electron
microscopy was also employed to explore the morphology and distribution pattern of the nano-
structured Ni Al(NO3−) LDH in a colloidal suspension. As can be seen from Fig. 2D, the
10
particles are all generally hexagonal plate-like in shape forming a roughly mono-dispersed
suspension.
(Figures 2A, 2B, 2C and 2D here)
3.3. Optimization of solid phase extraction conditions
3.3.1. Effect of pH
The effect of pH was studied as a first important factor for the quantitative measurement of
analyte. The retention of analyte by nano-sorbent depends on the pH at which electrostatic
interactions between LDH layers and analyte was facilitated. The influence of pH on the analyte
recovery was tested over the pH range 4.0–12.0. The resulting solutions’ pH(s) were adjusted
with minimal volume of diluted HNO3 and/or NaOH solutions. The results illustrated in Fig. 3
show that the highest recovery could be achieved in the pH range of 6–9. For pH values below 6,
significant fractions of mefenamate ion (pKa= 4.2) changes to the corresponding protonated form
which is not intercalated into the LDH gallery by ion exchanging. Also, at pH above 9.0, an
increase in the concentration of the competing OH− anions might is responsible for the observed
decrease in the recovery. Therefore, pH 7 was chosen as optimum value.
(Fig. 3 here)
3.3.2. Effect of the nano-sorbent amount
To test the effect of the nano-sorbent amount on the quantitative extraction of MFA, the
extraction is conducted by varying the amounts of the Ni Al(NO3−) LDH from 50 to 500 mg. As
shown in Fig. 4, the recovery of MFA was not affected by the nano-sorbent amount in the range
between 200 and 500 mg. Consequently, 250 mg of the nano-sorbent were used in all further
experiments.
11
(Fig. 4 here)
3.3.3. Optimization of elution conditions
In order to choose the best reagent for stripping of the retained mefenamate ions on Ni Al
(NO3−) LDH, various eluent such as NaOH, NaCl, NaF, NaBr and Na2CO3 were tested. Among
these reagents, NaOH solution provides the highest recovery (Fig. 5A). The concentration of the
NaOH solution was also investigated in the range of 0.5−3.0 M. Based on the obtained results, 1
M NaOH was sufficient for complete elution of the retained analyte on the nano-sorbent. The
volume of eluent is important for obtaining the high enrichment factor. So, the effect of elution
volume on the analyte recovery was studied in the range between 0.5 and 3.5 mL. As shown in
Fig. 5B, the minimum volume of NaOH required for the quantitative elution was 2.5 mL. As a
result, 2.5 mL of 1 M NaOH was employed as eluent in further experiments.
(Figures 5A and 5B here)
3.3.4. Effect of sample loading flow rate
The sample flow rate through the packed column is a very important parameter, since the
retention of analyte on the sorbent depends on the flow rate of sample solution. In fact, the
sample flow rate not only affects the retention of analyte but also is one of the variables that
controls the analysis time. The influence of the sample loading rate on the recovery was
investigated between 0.5 and 4.5 mL/min. Fig. 6 shows that the sample solution flow rate in the
interval 0.5−2.5 mL/min had no significant influence on the recovery of MFA. However, at flow
rates higher than 2.5 mL/min the recovery of the analyte reduced. Thus, all subsequent
experiments were performed at a sample flow rate of 2.0 mL/min.

12
(Fig. 6 here)
3.3.5. Sorption capacity
To determine the sorption capacity, 250 mg of the nano-sorbent was added to 10.0 mL of
solution containing 70 mg/L of MFA. The mixture was then magnetically stirred for 60 min and
the supernatant separated by a filter paper. Loaded MFA in the LDH nano-particles was stripped
with 2.5 mL of 1.0 M NaOH and concentration of the analyte was then determined
spectrophotometrically after appropriate dilution. As a result, capacity of the Ni Al(NO3−) LDH
for MFA was found to be 30.0 mg/g.
3.3.6. Reusability of the nano-sorbent
The potential regeneration and stability of the nano-sorbent were investigated. The column
packed with 250 mg sorbent was rinsed with 2.5 mL of 1.0 M NaOH and 5.0 mL deionized
water, respectively, before application in the next one. After at least 250 times of recycling, there
was no obvious decrease in the recovery of the analyte. In fact, this is one of the advantages of
the LDHs as solid phase extraction sorbents.
3.4. Study of interferences
The influence of some potentially interfering ions on the determination of 60 µg/L MFA
using the developed method was investigated. The tolerable limit was defined as the highest
amount of interfering ion that produced an error not exceeding ±5%. The obtained results are
given in Table 1. It can be seen that most of examined ions did not interfere with the extraction
and determination of mefenamic acid. Additionally, the influence of frequently encountered
excipients and additives on the determination of 60 µg/L MFA was studied by adding different

13
amounts of possible interferents to sample. No interference was observed from the presence of
lactose, glucose, citrate, saccharose, starch, talk and stearate in the ratios commonly used in
pharmaceutical preparations.
(Table 1 here)
3.5. Method validation and analysis of real samples
In the optimum conditions, a calibration curve was plotted for MFA by using a series of
standard solutions. The linear concentration range was between 2.0 and 1000.0 µg/L, with a
correlation coefficient of 0.9995. The regression equation was ΔA= 0.031 C + 0.011, where ΔA is
the blank-corrected absorbance intensity and C is the concentration of MFA in µg/L,
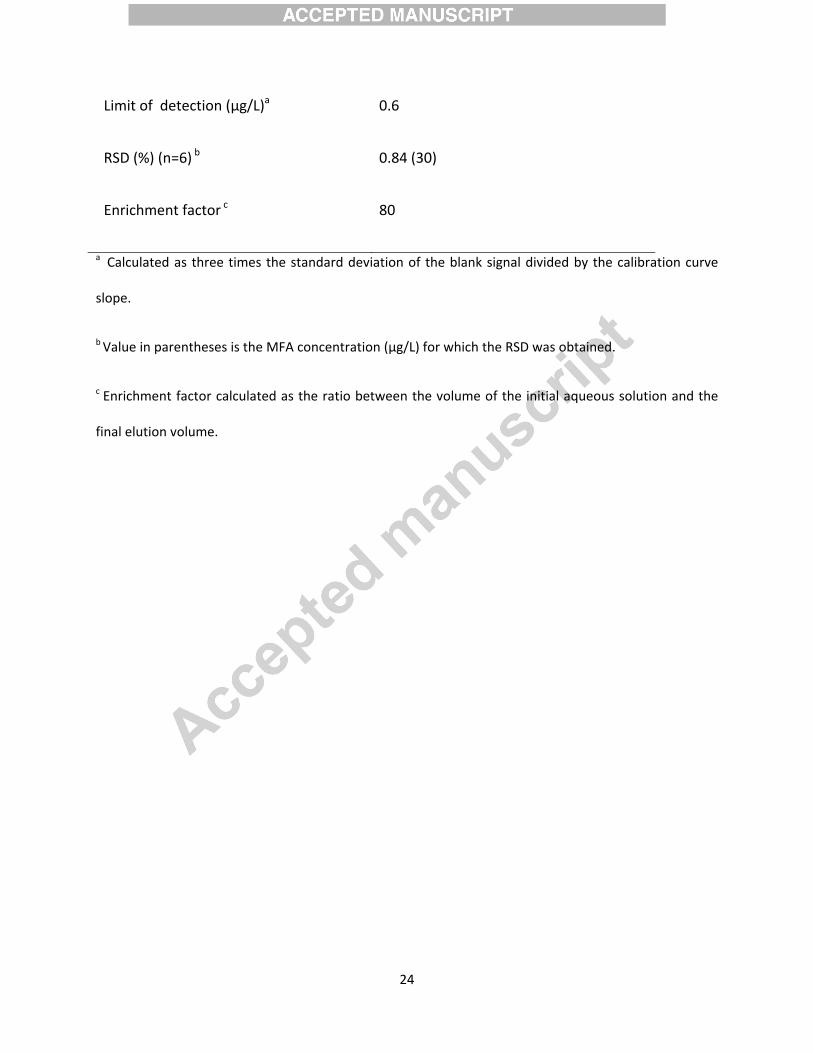
respectively. The limit of detection (LOD) and limit of quantification (LOQ), defined as 3 Sb/m,
and 10 Sb/m (where Sb is the standard deviation of the blank and m is the slope of the calibration
curve) were 0.6 µg/L and 2.0 µg/L, respectively. The relative standard deviation (RSD) resulting
from the analysis of 6 replicates of 200 mL solution containing 30 µg/L of MFA was 0.84%. The
enrichment factor, defined as the ratio between the volume of the initial aqueous solution and the
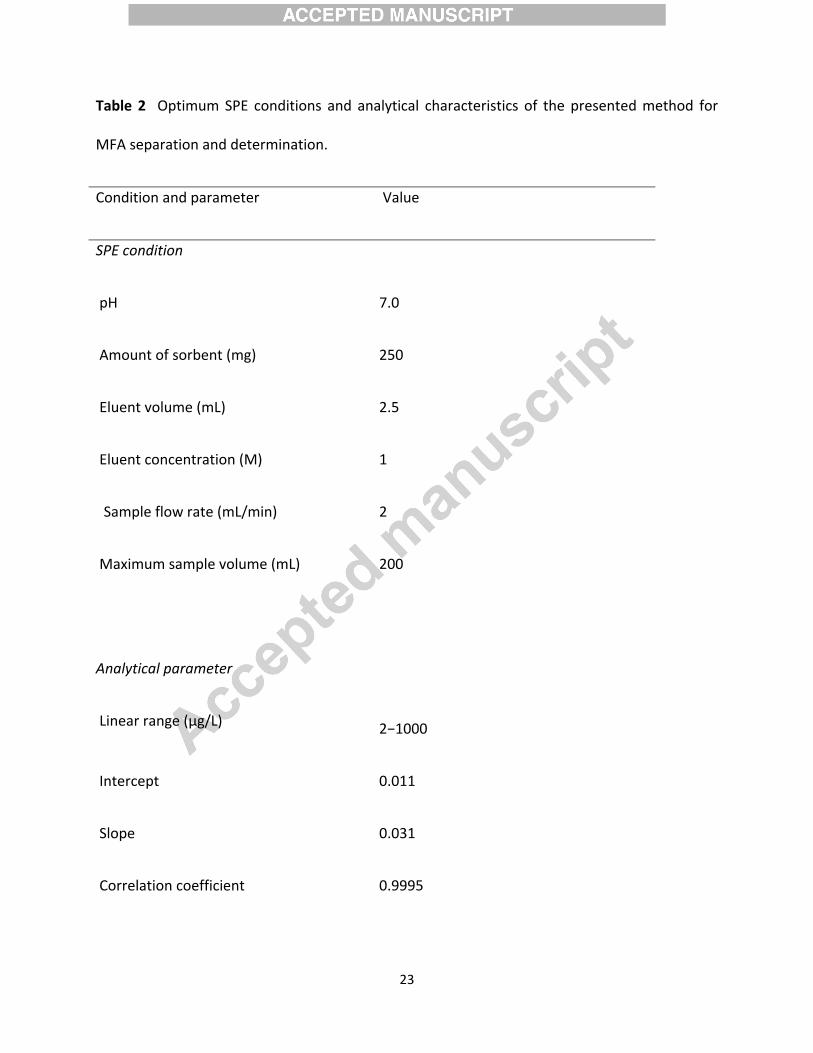
final elution volume, was 80. The optimum experimental conditions and analytical
characteristics of the presented method are summarized in Table 2.
To explore the reliability of the method, the presented method has been successfully applied
to determine MFA in pharmaceutical wastewaters and human serum samples. The results are
given in Table 3. The accuracy of the established procedure was verified by the analysis of the
samples spiked with different levels of the known amount of MFA prior to preparation and
analysis according to the general procedure. The obtained relative recoveries between 94.7 and
104.0 % were confirmed the accuracy of the presented method. In addition, the presented method

14
was successfully applied to the analysis of MFA in its pharmaceutical dosage form (250 mg per
capsule). It was found that the MFA content measured by the presented method (252.3± 3.4) is in
good agreement with those obtained by the standard method [35] (250.8± 2.6), which involves
the direct titration of MFA with NaOH in an ethanolic medium. Statistical analysis [36] of the
results using the Student t-test showed no significant difference at 95% confidence level between
the performance of the two methods as regard accuracy and precision.
(Tables 2 and 3 here)
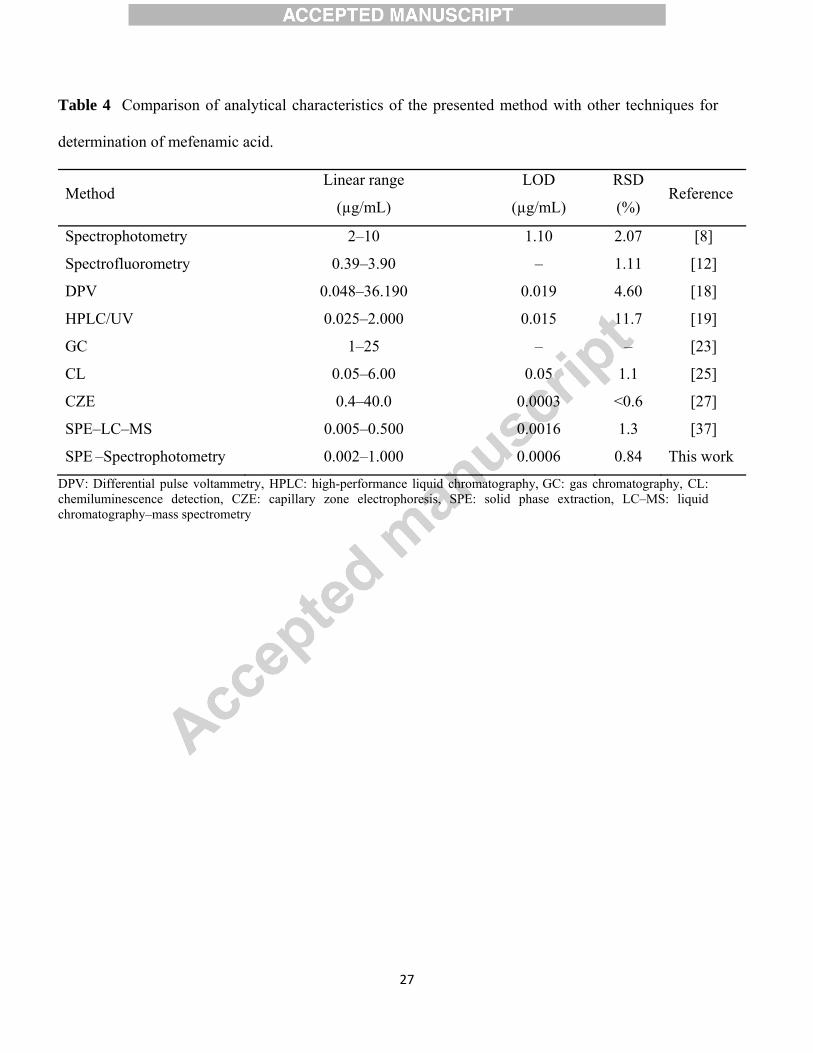
3.6. Comparison with other methods
A comparison of analytical features of the presented method with those of some previously
reported methods for MFA determination is shown in Table 4. The results indicate that LOD and
RSD of the developed method are better than or comparable with most of the other methods. The
presented method shows good accuracy and repeatability for determination of MFA in
pharmaceutical formulation, pharmaceutical wastewater and serum samples.
(Table 4 here)
4. Conclusions
Layered double hydroxides can be regarded as a class of materials that are simple to
synthesize in the laboratory. In this study, Ni-Al(NO3–) LDH was employed as a nano-sorbent
for the separation and pre-concentration of MFA prior to determination by spectrophotometry. It
was found that Ni-Al(NO3–) LDH showed a good adsorption capacity for MFA, and the retained
analyte can be easily stripped with NaOH solution. This method is simple, accurate with good
recovery and low detection limit, repeatable and matrix-independent at the low levels. The
presented method, which greatly improves the enrichment factor, can be applied for the

15
determination of MFA in various samples with complicated matrices involving pharmaceutical
wastewaters and biological samples. Moreover, the method represents a low cost, sensitive and
environment-friendly technique in the area of pharmaceutical monitoring that can be
recommended for the routine analysis of the MFA in quality control laboratories.

16
Acknowledgment
The financial support from the Research Council of Azarbaijan Shahid Madani University
(ASMU, Iran) is gratefully acknowledged.
References
[1] O. Drzyzga, Diphenylamine and derivatives in the environment: a review, Chemosphere 53
(2003) 809–818.
[2] K. Parfitt, W. Martindale, The Complete Drug Reference, Pharmaceutical Press, London,
1999.
[3] D.N. Bateman, Non-steroidal anti-inflammatory drugs, Medicine 40 (2012) 140–143.
[4] B. Soulet, A. Tauxe, J. Tarradellas, Analysis of acidic drugs in Swiss wastewaters, Int. J.
Environ. Anal. Chem. 82 (2002) 659–667.
[5] M.J. Hilton, K.V. Thomas, Determination of selected human pharmaceutical compounds in
effluent and surface water samples by high-performance liquid chromatography-
electrospray tandem mass spectrometry, J. Chromatogr. A 1015 (2003) 129–141.
[6] A. Tauxe-Wuersch, L.F. De Alencastro, D. Grandjean, J. Tarradellas, Occurrence of several
acidic drugs in sewage treatment plants in Switzerland and risk assessment, Water Res. 39
(2005) 1761–1772.
[7] P.H. Roberts, K.V. Thomas, The occurrence of selected pharmaceuticals in wastewater
effluent and surface waters of the lower Tyne catchment, Sci. Total Environ. 356 (2006)
143–153.

17
[8] E. Dinç, C. Yücesoy, F. Onur, Simultaneous spectrophotometric determination of mefenamic
acid and paracetamol in a pharmaceutical preparation using ratio spectra derivative
spectrophotometry and chemometric methods, J. Pharm. Biomed. Anal. 28 (2002) 1091–
1100.
[9] A. Kumar, S. Panghal, S. Mallapur, R. Kumar, A. Singh, Spectrophotometric methods for
simultaneous estimation of mefenamic acid and tizanidine in tablets, Asian J. Chem. 21
(2009) 4314–4320.
[10] N.A. Alarfaj, S.A. Altamini, L.Z. Almarshady, Spectrophotometric determination of
mefenamic acid in pharmaceutical preparations, Asian J. Chem. 21 (2009) 217–226.
[11] I. Zheltvay, O. Zheltvay, V. Antonovich, The extraction of aromatic carboxylic acids by the
copper complex with Curtis macrocyclic tetramine and its utilization for photometric
determination of non-steroidal antiimflammatory drugs, Acta Pol. Pharm. 68 (2011) 629–
635.
[12] S.M. Sabry, Determination of flufenamic and mefenamic acids in pharmaceutical
preparations using organized media, Anal. Chim. Acta 367 (1998) 41–53.
[13] M.I. Albero, C. Sanchez-Pedreño, M.S. Garcia, Flow-injection spectrofluorimetric
determination of flufenamic and mefenamic acid in pharmaceuticals, J. Pharm. Biomed.
Anal. 13 (1995) 1113–1117.
[14] T. Pérez-Ruiz, C. Martínez-Lozano, V. Tomás, J. Carpena, Analysis of binary mixtures of
flufenamic, meclofenamic and mefenamic acids by derivative synchronous fluorescence
spectrometry, Talanta 47 (1998) 537–545.
[15] Z. Kormosh, O. Matviychuk, Potentiometric determination of mefenamic acid in
pharmaceutical formulation by membrane sensor based on ion-pair with basic dye,
Chinese Chem. Lett. 24 (2013) 315–317.

18
[16] A.O. Santini, H.R. Pezza, L. Pezza, Development of a potentiometric mefenamate ion
sensor for the determination of mefenamic acid in pharmaceuticals and human blood
serum, Sens. Actuators B 128 (2007) 117–123.
[17] L. Liu, J. Song, Voltammetric determination of mefenamic acid at lanthanum hydroxide
nanowires modified carbon paste electrodes, Anal. Biochem. 354 (2006) 22–27.
[18] M. Hasanzadeh, N. Shadjou, L. Saghatforoush, J. Ezzati, Preparation of a new
electrochemical sensor based on iron (III) complexes modified carbon paste electrode for
simultaneous determination of mefenamic acid and indomethacin, Colloids Surf. B
Biointerface 92 (2012) 91–97.
[19] M.R. Rouini, A. Asadipour, Y.H. Ardakani, F. Aghdasi, Liquid chromatography method for
determination of mefenamic acid in human serum, J. Chromatogr. B 800 (2004) 189–192.
[20] I. Niopas, K. Mamzoridi, Determination of indomethacin and mefenamic acid in plasma by
high-performance liquid chromatography, J. Chromatogr. B 656 (1994) 447–450.
[21] A.N. Maliye, S.G. Walode, A.V. Kasture, S.G. Wadokar, Simultaneous estimation of
mefenamic acid and drotaverine hydrochloride in tablets by high performance thin layer
chromatography, Asian J. Chem. 18 (2006) 667–672.
[22] R. Ankam, K. Mukkanti, S. Durgaprasad, P.V.L. Naidu, Simultaneous determination of
drotaverine hydrochloride and mefenamic acid by isocratic RP-HPLC method, Asian J.
Chem. 22 (2010) 3629–3634.
[23] L. J. Dusci, L.P. HacKett, Gas- liquid chromatographic determination of mefenamic acid in
human serum, J. Chromatogr. 161 (1978) 340–342.
[24] E.G. Zisimopoulos, G.Z. Tsogas, D.L. Giokas, N.I. Kapakoglou, A.G. Vlessidis, Indirect
chemiluminescence-based detection of mefenamic acid in pharmaceutical formulations by
flow injection analysis and effect of gold nanocatalysts, Talanta 79 (2009) 893–899.
19
[25] F.A. Aly, S.A. Al-tamimi, A.A. Alwarthan, Determination of flufenamic acid and
mefenamic acid in pharmaceutical preparations and biological fluids using flow injection
analysis with tris (2,2 -bipyridyl) ruthenium (II) chemiluminescence detection, Anal.
Chim. Acta 416 (2000) 87–96.
[26] M. Polášek, M. Pospíšilová, M. Urbánek, Capillary isotachophoretic determination of
flufenamic , mefenamic , niflumic and tolfenamic acid in pharmaceuticals, J. Pharm.
Biomed. Anal. 23 (2000) 135–142.
[27] T. Pérez-Ruiz, C. Martínez-Lozano, A. Sanz, E. Bravo, Determination of flufenamic ,
meclofenamic and mefenamic acids by capillary electrophoresis using b-cyclodextrin, J.
Chromatogr. B 708 (1998) 249–256.
[28] A.M. Sastre. M. Aguilar, J.L. Cortina, Analytical application of solvent extraction, in: G.R.
Choppin, J. Rydberg, M. Cox, C. Musikas (Ed.), Solvent Extraction Principles and
Practice, Taylor and Francis e-library, New York, 2005, p. 566.
[29] M. Żwir-Ferenc, A. Biziuk, Solid phase extraction technique–trends, opportunities and
applications, Pol. J. Environ. Stud. 15 (2006) 677–690.
[30] D.G. Evans, R.C.T. Slade, Structural aspects of layered double hydroxides, in: X. Duan,
D.G. Evans (Ed.), Layered Double Hydroxides, Springer, Berlin, Germany, 2006, pp. 1–5.
[31] P.S. Braterman, Z.P. Xu, F. Yarberry, Layered double hydroxides (LDHs), in: S.M.
Auerbach, K.A. Carrado, P.K. Dutta, (Ed.), Handbook of Layered Materials, Marcel Dekker,
Inc., New York, 2004, pp. 373–474.
[32] C. Aprile, H. Garcia, P. Pescarmona, synthesis and characterization of supported chiral
catalysts, in: F.G.M. Gruttadauria (Ed.), Catalytic Methods in Asymmetric Synthesis:
Advanced Materials, Techniques, and Applications, John Wiley and Sons, New Jersy,
2011, pp. 177–208.

20
[33] H. Abdolmohammad-Zadeh, A. Jouyban, R. Amini, G.H. Sadeghi, Nickel-aluminum
layered double hydroxide as a nano-sorbent for the solid phase extraction of selenium, and
its determination by continuous flow HG-AAS, Microchim. Acta. 180 (2013) 619–626.
[34] P. Benito, F.M. Labajos, V. Rives, Microwave-assisted synthesis of layered double
hydroxides, in: R.W. Buckley (Ed.), Solid state chemistry research trends, Nova Science,
New York, 2007, p. 175.
[35] The British Pharmacopoeia, Her Majesty’s Stationery Office, London, 1998.
[36] J. C. Miller, J. N. Miller, Statistics for Analytical Chemistry; Wiley, New York, 1984.
[37] F.F. Al-Qaim, M.P. Abdullah, M.R. Othman, J. Latip, W.M. Afiq, Development of
analytical method for determination of some pharmaceuticals in surface water, Trop. J.
Pharm. Res. 12 (2013) 609–616.

21
Scheme captions
Scheme 1: Ion exchange mechanism of mefenamate anions with the interlayer anions in a LDH
structure.
Figure captions
Fig. 1: Effect of (A) LDH type with the same interlayer anion, and (B) interlayer anion type
between the hydroxide layers in Ni–Al LDH nano-sorbent, on the retention of MFA.
Fig. 2: (A) XRD pattern, (B) FT–IR spectrum, (C) SEM image and (D) TEM image of Ni–
Al(NO3−) LDH.
Fig. 3: Effect of sample pH on the retention of MFA on the Ni–Al(NO3−) LDH nano-sorbent.
Fig. 4: Effect of the Ni–Al(NO3−) LDH amount on the retention of MFA.
Fig. 5: Effect of (A) type of eluent and (B) eluent volume on the elution of mefenamate ions
from the Ni–Al(NO3−) LDH nano-sorbent.
Fig. 6: Effect of sample loading flow rate on the retention of MFA on the Ni–Al(NO3−) LDH
nano-sorbent.

22
Table 1 Tolerance limits of interfering ions in the determination of 60 µg/L of mefenamic acid.
Coexisting ion Foreign ion to analyte ratio
Na+, K+ , Ca2+, Mg2+, Fe2+, Ni2+, Cu2+, Zn2+, Co2+,
Al3+, Cr3+, Fe3+
1000:1
SO42−, CH3COO
−, NO3− 500:1
H2PO4− , HPO4
2−, Br− 200:1
F−, CO32−, Cl− 50:1
23
Table 2 Optimum SPE conditions and analytical characteristics of the presented method for
MFA separation and determination.
Condition and parameter Value
SPE condition
pH 7.0
Amount of sorbent (mg) 250
Eluent volume (mL) 2.5
Eluent concentration (M) 1
Sample flow rate (mL/min) 2
Maximum sample volume (mL) 200
Analytical parameter
Linear range (μg/L) 2−1000
Intercept 0.011
Slope 0.031
Correlation coefficient 0.9995
24
Limit of detection (μg/L)a 0.6
RSD (%) (n=6) b 0.84 (30)
Enrichment factor c 80
a Calculated as three times the standard deviation of the blank signal divided by the calibration curve
slope.
b Value in parentheses is the MFA concentration (µg/L) for which the RSD was obtained.
c Enrichment factor calculated as the ratio between the volume of the initial aqueous solution and the
final elution volume.

25
Table 3 Determination of MFA in real samples (results of recoveries of spiked samples analysis).
Recovery (%)Found MFA (μg/L) Added MFA (μg/L)Samples
Wastewater samplesa
−135.0 ± 3.1 −Sample 1
101.6262.0 ± 2.0 125
−135.0 ± 3.1 −Sample 2
104.0265.0 ± 3.2 125
−121.0 ± 2.6 −Sample 3
100.8247.0 ± 4.5 125
−160.0 ± 2.6 −Sample 4
103.2289.0 ± 2.4 125
Serum samplesb
−51.3 ± 0.3 −Sample 1

26
103.4103.0 ± 0.3 50
102.7154.0 ± 1.0 100
−45.3 ± 0.6 −Sample 2
96.893.7 ± 1.7 50
94.7140.0 ± 1.9 100
−−−Control samplec
97.248.6 ± 1.1 50
99.099.0 ± 2.1 100
a Collocated from different effluents of Zahravi Pharmaceutical Manufactory, Tabriz, Iran.
b Obtained from Ali‐Nasab hospital, Tabriz, Iran (added and found MFA concentration units are (mg/L).
c Healthy volunteer.
27
Table 4 Comparison of analytical characteristics of the presented method with other techniques for
determination of mefenamic acid.
Method Linear range
(µg/mL)
LOD
(µg/mL)
RSD
(%) Reference
Spectrophotometry 2–10 1.10 2.07 [8]
Spectrofluorometry 0.39–3.90 – 1.11 [12]
DPV 0.048–36.190 0.019 4.60 [18]
HPLC/UV 0.025–2.000 0.015 11.7 [19]
GC 1–25 – – [23]
CL 0.05–6.00 0.05 1.1 [25]
CZE 0.4–40.0 0.0003 <0.6 [27]
SPE–LC–MS 0.005–0.500 0.0016 1.3 [37]
SPE –Spectrophotometry 0.002–1.000 0.0006 0.84 This work
DPV: Differential pulse voltammetry, HPLC: high-performance liquid chromatography, GC: gas chromatography, CL: chemiluminescence detection, CZE: capillary zone electrophoresis, SPE: solid phase extraction, LC–MS: liquid chromatography–mass spectrometry