HEALTH-RELATED MONITORING OF TRACE ELEMENT ...
224
IAEA-TECDOC-330 HEALTH-RELATED MONITORING OF TRACE ELEMENT POLLUTANTS USING NUCLEAR TECHNIQUES RESULTS OF CO-ORDINATED RESEARCH PROGRAMMES ON NUCLEAR METHODS FOR HEALTH-RELATED MONITORING OF TRACE ELEMENT POLLUTANTS AND HEALTH-RELATED ENVIRONMENTAL RESEARCH USING NUCLEAR TECHNIQUES A TECHNICAL DOCUMENT ISSUED BY THE INTERNATIONAL ATOMIC ENERGY AGENCY, VIENNA, 1985
-
Upload
khangminh22 -
Category
Documents
-
view
1 -
download
0
Transcript of HEALTH-RELATED MONITORING OF TRACE ELEMENT ...

IAEA-TECDOC-330
HEALTH-RELATED MONITORINGOF TRACE ELEMENT POLLUTANTS
USING NUCLEAR TECHNIQUESRESULTS OF CO-ORDINATED RESEARCH PROGRAMMES
ON NUCLEAR METHODS FOR HEALTH-RELATED MONITORINGOF TRACE ELEMENT POLLUTANTS
ANDHEALTH-RELATED ENVIRONMENTAL RESEARCH
USING NUCLEAR TECHNIQUES
A TECHNICAL DOCUMENT ISSUED BY THEINTERNATIONAL ATOMIC ENERGY AGENCY, VIENNA, 1985

HEALTH-RELATED MONITORING OF TRACE ELEMENT POLLUTANTSUSING NUCLEAR TECHNIQUES
IAEA, VIENNA, 1985IAEA-TECDOC-330
Printed by the IAEA in AustriaMarch 1985

PLEASE BE AWARE THATALL OF THE MISSING PAGES IN THIS DOCUMENT
WERE ORIGINALLY BLANK

The IAEA does not maintain stocks of reports in this series. However,microfiche copies of these reports can be obtained from
INIS ClearinghouseInternational Atomic Energy AgencyWagramerstrasse 5P.O. Box 100A-1400 Vienna, Austria
Orders should be accompanied by prepayment of Austrian Schillings 80.00in the form of a cheque or in the form of IAEA microfiche service couponswhich may be ordered separately from the INIS Clearinghouse.

FOREWORD
In recent years there has been a considerable growth of interest inproblems of environmental pollution from industrial and agriculturalsubstances, and the harmful impact of such pollution on human health.
In 1977 the Agency created a special sub-programme on "Health-Related Environmental Research". The main purpose of this sub-programmeis to promote the application of nuclear methods for assessing thecontamination of man by environmental pollutants such as toxic heavymetals.
The following two Co-ordinated Research Programmes (CRPs) wereorganized concurrently by the Agency on this subject, and were finallyphased out at the end of March 1984.
(I) CRP on Nuclear Methods for Health-Related Monitoring of TraceElement Pollutants, and
(II) CRP on Health-Related Environmental Research Using NuclearTechniques (RCA Regional Project).
During the lifetime of these programmes, 31 different institutesfrom 29 countries have participated in them, 19 with research contractsand 12 with research agreements.
The elements of primary interest in these programmes were mercury,cadmium, arsenic, lead, selenium, copper and zinc. Several environmentalsamples such as hair, food and water were analysed. The main analyticalmethods used were instrumental neutron activation analysis (INAA),radiochemical neutron activation analysis (RNAA), X-ray fluorescencespectrometry (XRF), proton-induced X-ray emission spectrometry (PIXE) andatomic absorption spectrometry (AAS). In order to check the reliabilityof the analytical methods used in the participating laboratories,intercomparison studies were organized by the Agency. Animal experimentsusing radiotracer were also included in one of the programmes.
The final reports or abstracts (in the case of already publishedpapers) submitted by the participants, as well as summary reports of bothCo-ordinated Research Programmes, are compiled in this publication inorder that they may be available to all interested persons.
EDITORIAL NOTE
In preparing this material for the press, staff of the International Atomic Energy Agencyhave mounted and paginated the original manuscripts as submitted by the authors and givensome attention to the presentation.
The views expressed in the papers, the statements made and the general style adopted arethe responsibility of the named authors. The views do not necessarily reflect those of the govern-ments of the Member States or organizations under whose auspices the manuscripts were produced.
The use in this book of particular designations of countries or territories does not imply anyjudgement by the publisher, the IAEA, as to the legal status of such countries or territories, oftheir authorities and institutions or of the delimitation of their boundaries.
The mention of specific companies or of their products or brand names does not imply anyendorsement or recommendation on the part of the IAEA.
Authors are themselves responsible for obtaining the necessary permission to reproducecopyright material from other sources.
CONTENTS
CO-ORDINATED RESEARCH PROGRAMME ON NUCLEAR METHODS FORHEALTH-RELATED MONITORING OF TRACE ELEMENT POLLUTANTS (Part I)
Analysis of pollutants in human scalp hair in Cairo ........................................................ 9M.F. Abdel-Wahab, W.A. Abdulla, S.M. Rashid, A. Yousef
Investigation of content of essential elements in human tissues in connection withvarious diseases ............................................................................................................ 15D. Apostolov
Correlation of trace metals in hair and nails .................................................................... 21/. Benischek-Huber, F. Benischek
Human scalp hair as an epidemiologic monitor of environmental exposure to elementalpollutants .................................................................................................................... 33A. Chatt, M. Saf/ad, K.N. DeSilva, C.A. Secord
Hair and nails as monitors of external trace element burdens ............................................ 51H.A. Das
Development of health-related analytical techniques ........................................................ 53G. Deconninck, F. Bodart
Concentrations of heavy metals in human blood in relation to their respectiveatmospheric levels ........................................................................................................ 59H. Ghafourian, H. Rahimi, I. Bayat, K. Shahisavandi, P. Nejad-Tolami
Health-related monitoring of trace elements by PIXE ........................................................ 67A.A. Katsanos, H. Hadjiantoniou, N. Panayiotakis, M. Tzoumezi
Significance of elemental deposition in hair to internal contamination ............................ 71W.E. Kollmer
Emploi de l'analyse par activation instrumentale à l'étude de la contamination del'homme et de son milieu environnant par les éléments toxiques à l'état de trace ........... 79B.M. Lumu, M.D. Tshiashala
Métal analyses of hair and urine and their use as epidemiological indices ofenvironmental pollution ................................................................................................ 93/. Matsubara
Neutron activation analysis of hair elements. Influence of residence, occupation, andhealth status ................................................................................................................ 95S. Niese, W. Wiesener
PIXE elemental analysis of environmental and biological samples .................................... 109A.S. Paschoa, G.B. Baptista, C. V. Barros Leite, E.G. Montenegro, G.M. Mauricio,
Y.B. Lerner, P.P. IsslerElemental analysis of hair samples using energy dispersive X-ray fluorescence and atomic
absorption spectroscopy ................................................................................................ 123A.A. Yousif, A.M. Elhindi, M.A.H. Eltayeb, A.S. Hassan
Summary Report (I) ........................................................................................................ 131List of Participants ............................................................................................................ 135

RCA REGIONAL CO-ORDINATED RESEARCH PROGRAMME ON HEALTH-RELATED ENVIRONMENTAL RESEARCH USING NUCLEAR TECHNIQUES(PartH)
Determination of mercury and other toxic elements in fish and foodstuffs usingdestructive neutron activation analysis ........................................................................ 141/. Bay at, N.D. Raufl, M. Nejat
Neutron activation analysis in the monitoring of health-related trace elementpollutants .................................................................................................................... 147S. Gangadharan, J. Arunachalam, K.R. Bhat, S. Yegnasubramanian
Trace metal pollutants in Filipino human head hair ........................................................ 155P.A. Kapauan, I.L. Beitran, C.C. Cruz
Studies of trace element pollutants in biological and environmental materials ................ 157A.H. Khan, S.K. Biswas
Trace element analysis of human head hair by neutron activation technique .................... 169N.B. Kim, H.W. Chung, K.Y. Lee
Baseline study of pesticide residues and toxic contaminants in environmental samplesin Thailand by neutron activation technique ................................................................ 175S. Mongkolphantha, M. Dejkumhang, S. Nouchpramool, S. Chuinta,W. Wimolwattanaphunt, N. Leelhaphunt
Trace elements in animals and foodstuffs ........................................................................ 187S. Ohno, M. Yamada, H. Tsukagoshi, S. Hatakeyama
Measurement of trace elements in human head hair, tobacco, coal and food articles ofPakistan ........................................................................................................................ 195I.H. Qureshi, M.S. Chaudhry, S. Ahmad, A. Mannan
Scalp hair as an indicator of environmental pollution in Malaysia .................................... 205S. Sarmani, T. Koshy, Z. Zakaria
Sample preparation techniques for (p, X) spectrometry .................................................... 211N.E. Whitehead
A study of trace element concentrations in human hair of the inhabitants of theJakarta City ................................................................................................................ 219S. Yatim
Summary Report (II) ........................................................................................................ 229List of Participants ............................................................................................................ 233
Parti
CO-ORDINATED RESEARCH PROGRAMME ONNUCLEAR METHODS FOR HEALTH-RELATED MONITORING
OF TRACE ELEMENT POLLUTANTS
ANALYSIS OF POLLUTANTS IN HUMAN SCALP HAIR IN CAIRO
M.F. ABDEL-WAHAB, W.A. ABDULLA, S.M. RASHID, A. YOUSEFRadioisotope Department,Atomic Energy Establishment and ADCO,Cairo, Egypt
Abstract
Scalp hair, urine and blood samples from volunteers selected fromdifferent areas surrounding Cairo were collected for study by neutronactivation analysis (NAA) and conventional methods.
The results for 14 elements in hair show some variation between thedifferent regions. Qualitatively there is a slight difference ofabundance of the investigated elements. Broadly speaking the presence ofmajor elements is dominant. No relationship was observed between theelemental composition of hair and urine.
1. INTRODUCTION
Recently enormous advances have been seen in the scope of traceelement analysis providing reliable data for biological systems. Themost important techniques now used are radioactivation analysis incombination with gamma spectrometry and atomic absorption spectrometry(1, 2). Among the samples analysed for pollution studies are nails,scalp hair, blood, urine and drinking water (3, 4, 5). Some investiga-tors have claimed that concentrations of trace elements in hair and nailmay differ with respect to non-essential elements, due to differences intrace element intake, dietary habits and drug abuse (5). Other authorsclaimed that such differences stem from the geographical location,environmental conditions, race and age of the subjects (6).
2. EXPERIMENTAL
2.1. Collection of hairSmall plastic bags were used to collect about 5 g of hair from each
volunteer and the collection was carried out at random from subjectsliving in the above-mentioned areas. From each area about 60 sampleswere collected from subjects of different age and occupation.2.2. Preparation of samples for irradiation
Washing of hair was done for decontamination purposes. A weighedamount of hair was taken for serial washing, starting with pure distilledwater, then 0.1 N HNO3 and finally with detergent and distilled water.The samples were dried in an oven for 15 min at 70°C; 5 mg amounts wereplaced in special plastic containers and irradiated at a flux density of
m~2s-l in the Cairo 2MW research reactor for 48 hrs. The

samples were then left to cool for 3 days to remove short-lived radio-nuclides and then subjected to counting. Replicate samples were treatedsimilarly and sent to be irradiated in the Bandung Triga type 1MW reactorfor further confirmation (7). The results were evaluated collectively asshown in table 1.
Table 1 Elements Traced in Human Scalp Hair Samples in CairoInhabitants, Expressed in U6/6 Dry Hair Samples asMean Value
Element
AsCdCoCrFFeSbCsIMnMoSeZnSc
Province
HeliopolisNasr CityCairo Indus-trial areaGizaGizaSporadicUpper EgyptAlexandriaPort SaidGizaCairo CityIndustrialSporadicGiza
Highaverage0.8
1080 . 0250.01.20.5
150.0510.0280.017.06.10.168.0
180.040.0
Province
GizaCairo Ind.HeliopolisGizaSporadicPort SaidAlexandriaCairo CityUpper EgyptAlexandriaGizaHeliopolisNasr CitySporadic
Lowaverage0.1
120.1110.00.20.05
50.058.056.07.02.20.082.0
30.012.0
2.3. Medical examinationFor the medical examination, special medical sheets were prepared.
A summary of the data is presented in table 3. Samples of urine werecollected over 24 hours. Full reports were prepared for each individual.The data collected are summarized in table 2. This work is still goingon. Further data will be published in a second report.3. RESULTS
The following tables summarize the data obtained from volunteersselected at random from five areas in Cairo and its surroundings.Interpretation of the data was done on the basis of group analyses.Fig. 1. shows the location of the sampling areas.
The urine samples were collected from the same subjects and reportsfor 24 hrs are tabulated in table 2. Medical examination as well asclinical medical sheets are also described in table 3. The haemoglobinpercent of each volunteer was determined using the spectrophotometrictechnique. The total blood counts for both red and white corpuscles werealso determined and are reported in the same tables.
10

Table 2 List of Investigation of Urine and Blood Samples
Name
H.S.Gh.gA.M.A.K.E.S.F.A.H.F.M.E.M.I.R.M.A.E.A.R.W.A.A.S.E.N.A.N.A.M.F.M.S.Y.I.I.S.I.K.H.S.
Sex
MMMMMMMMMMFMMFFFMMM
Colour
yellowamberyelloworangeamberyelloworangeyelloworangewateryyelloworangeyellowyellowyellowyellloworangeyellowyellow
Volumein ml
1001204080190801301001002001601101305048586878100
Sp . Rf .
1029. 102810251026103510261027102510311017103110321019103410311028102610311026
Odour
aromaromaromaromsweetaromsweetaromammonputrifaromaromaromaromaromaromaromaromarom
UrineAppear-ance Sed
clearclearturbid +clearclear +clearturbidclear -turbid +turbid +clearclearturbid +turbid +clearclearclearturbid +clear -
pH Alb Suear
6 - -6.25.95.7 - +6.1 - +5.1 4-
6.1 - +5 — —5.45.46.35.16.0 -7.0 +6.85.8 - +6.15.4 +
5.1 nil
K.B. Bile Blood
» _ —
- - -traces
- nil+ - nil- - ++ - nil- - traces
absent- - traces
nil- nil
- - traces- - traces
- nil_- - -_ __ _ _
Micro-scopical
oxalateox.ur.uratescastcast, ox.RBC.ur.cast.ur.ox.ur.P04,ur.P04,pusoxalateur.ox.cast, RBCRBC , ox .pusur.ox.ox. RBC sox.urateox.urate
RBCinmill
5.14.14.85.34.55.15.14.64.54.34.64.85.14.74.85.04.25.16.1
Hb %
939593100951009898100100898396981001009298100
WBC
3600420054006300620054005200620056006500450065005400540060004500620070006500
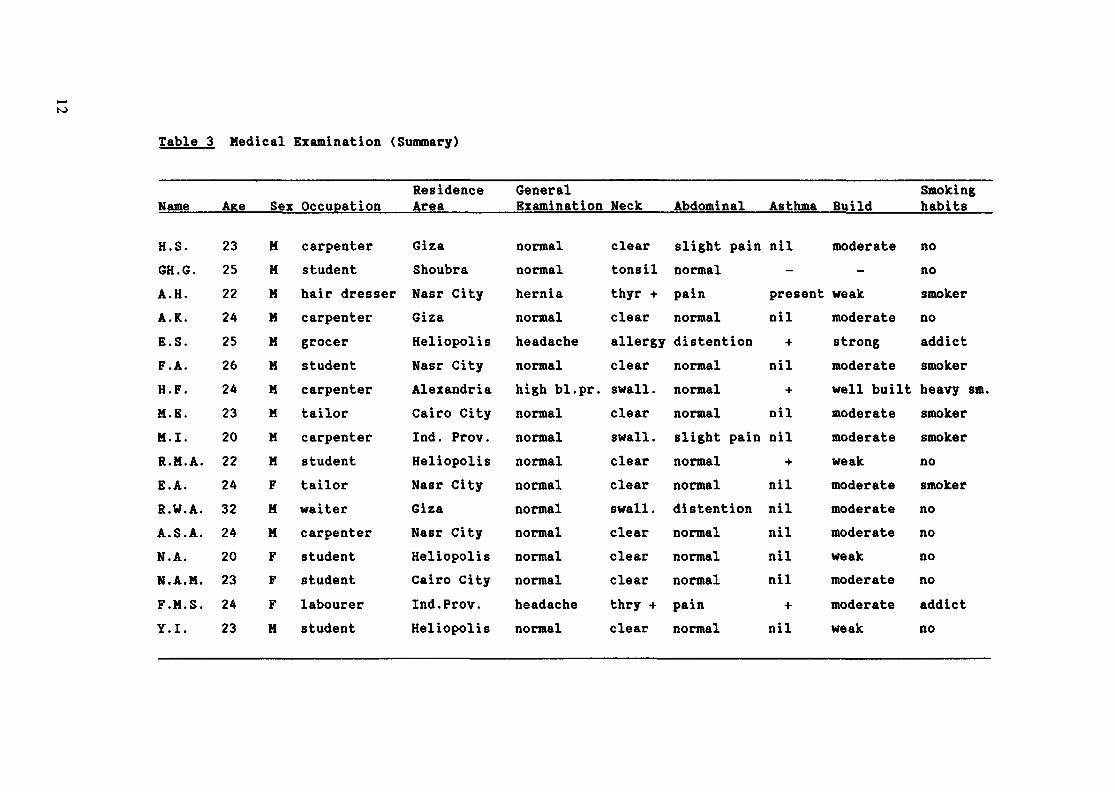
Table 3 Medical Examination (Summary)
Name
H.S.6H.G.A.H.A.K.E.S.F.A.H.F.M.E.M.I.R.M.A.E.A.R.W.A.A. S.A.N.A.U.A.M.F.M.S.Y.I.
ARC
2325222425262423202224322420232423
Sex
MMMMMMMMMMFMMFFFM
Occupation
carpenterstudenthair dressercarpentergrocerstudentcarpentertailorcarpenterstudenttailorwaitercarpenterstudentstudentlabourerstudent
ResidenceArea
GizaShoubraNasr CityGizaHeliopolisNasr CityAlexandriaCairo CityInd. Prov.HeliopolisNasr CityGizaNasr CityHeliopolisCairo CityInd. Prov.Heliopolis
GeneralExamination
normalnormalhernianormalheadachenormalhigh bl.pr.normalnormalnormalnormalnormalnormalnormalnormalheadachenormal
Neck
cleartonsilthyr +clearallergyclearswall .clearswall .clearclearswall.clearclearclearthry +clear
Abdominal
slight painnormalpainnormaldistentionnormalnormalnormalslight painnormalnormaldistentionnormalnormalnormalpainnormal
Asthma
nil-
presentnil+
nil+
nilnil+
nilnilnilnilnil+
nil
Build
moderate-
weakmoderatestrongmoderatewell builtmoderatemoderateweakmoderatemoderatemoderateweakmoderatemoderateweak
Smokinghabits
nonosmokernoaddictsmokerheavy sm.smokersmokernosmokernonononoaddictno

CAIRO IWD S
Alexandria
Fig. i
4. DISCUSSION
A comparison of hair samples obtained from different locations inCairo and its surrounding shows that elemental concentrations vary littlebetween the different locations.
In this study, washing of hair by a standard method has been adoptedfor all the investigated samples. Thus, the concentration of each of the14 elements is thought to reflect the actual composition. Previousauthors have claimed that trace elements can be easily washed out of hairor incorporated into it during washing (1). To avoid such errors, allhair samples have been treated similarly using reference untreatedsamples. Our controls revealed no differences caused by washing, eitherqualitatively or quantitatively.
13

5. CONCLUSIONS
Inter-regional differences in the elemental composition of hairsamples included in this study are mostly insignificant. For example,samples analysed to-date showed the presence of Cr, Mo, Sb and Cd at moreor less similar concentrations. Sc, Co, Fe, Hn, Se and Zn are essentialelements and, on the whole, minimum variations are seen in these elementsamong different regions. There is however a steady increase in the valueof F from south to north. This observation may be explained according tothe expected halogen increase in coastal areas. The iodine values behavesimilarly, but with some big differences moving from desert areas to thecoast. Inhabitants of Alexandria and Port Said do not suffer from iodinedeficiency goitre, a phenomenon known to happen in oases west of Cairo
6. ACKNOWLEDGEMENT
The senior author wishes to thank the IAEA for its support underresearch contract 3003/RB. Thanks are also due to AEE in Cairo forirradiation facilities and continuous support.
The senior author also wishes to acknowledge the help of the PAIRBATAN of Bandung, Indonesia, for RNAA of some samples, and the Arab DrugCompany (ADCO) for sampling and analysis of body fluids. Thanks are alsodue to ECN in Petten for their invaluable help and generosity during themeeting of May 1983.
REFERENCES
1. KASPEREK K., IYENGAR G.V. and FEINENDEGEN L.E.: The Science of theTotal Environment, 22 149-168 (1982)
2. PANKHURST C. and PATE B.D.: Reviews in Analytical Chemistry Vol. IV,No. 2 and 3, Freund Publishing Co., Tel Aviv (1979)
3. FITE L.E., WAINERDI R.E. and YULE H.P.: Proc. International Conf. onModern Trends in Activation Analysis, NBS, Gaithersburg, Maryland,Vol. II, P. 147-153 (1965)
4. MARTIN G.M.: Nature 202 903-904 (1964)
5. DURUM W.H. and HEM J.D.: N.Y. Acad. Sei. 199-26 (1972)6. AAL H.A., SOLIMAN A.A., EL-MAHDY H. and SAEEI L.E.: Acta Dermat.
Venereol. (Sweden) 65 55 (1976)7. IYENGAR G.V.: The Science of the Total Environment 19 105-109
(1981), and IYENGAR G.V. Anal. Chem. 54 554a-560a (1982)8. ABDEL-WAHAB M.F., MEGAHED Y.M.: Isotopenpraxis 10 55-58 (1974).
14

INVESTIGATION OF CONTENT OF ESSENTIALELEMENTS IN HUMAN TISSUES IN CONNECTIONWITH VARIOUS DISEASES
D. APOSTOLOVInstitute of Nuclear Research and
Nuclear Energy,Sofia, Bulgaria
Abstract
The content of some trace elements in animal and humanorgans was determined, and their relation to biological ac-tivity in general and hypertonia and cancer in particular wasstudied. The following aspects of the present investigationare worth pointing out: (a) determination of "normal" elementconcentrations in organs and deviations therefrom in rats(V/istar) after thymectomy as a function of age; (b) determin-ation of "normal" concentrations of trace elements in humantissues taken from organs of individuals without clinicalpathology. Liver, kidney, heart, small and large intestinesof rats from different age groups were analyzed: (a) healthyrats, age 3,6,9 and 12 months; (b) thymectomized at 3-month-age rats, 6,9 and 12 months old. The concentrations of 5elements were considered. It was established that the concen-tration variations in kidney follow the change of blood pres-sure, and those in heart and liver follow the rate of changeof blood pressure. A decrease of the concentrations of ele-ments studied in organs at 3 months after thyraectomy and ageneral tenedency to increasing after that age can be notic-ed.
1. INTRODUCTIONThe investigations being carried out in the NAA Group
at the Institute of Nuclear Research and Nuclear Energy,Bulgarian Academy of Sciences, Sofia, aim at studying theinterconnection between trace elements and the most wide-spread diseases of today, the hypertonia and the cancer.
Since human materials are, as a rule, not readilyavailable for analysis, our investigations are centredaround laboratory animals used as models. The work on thepresent project encompasses two main aspects: (a) determin-ation of trace elements in organs of laboratory animals(r::ice and rats) with and without pathological changes, (b)determination of these elements' content in the organs ofpersons without clinically-noticeable disease symptoms.
Although the presence of microelements in living or-ganisms is well known, their role and functions are stillthe subject of intensive investigations. The comparativestudy of element composition in organs of healthy and sickanimals contributes to the clarification of the problem.
15

Published data exist on the participation of certain elementsin the processes which take place in an organism affected bycardio-vaccular diseases. A risk factor in similar diseases isthe hypertonia.
On the other hand, the thymus is one of the little studiedglands; not much is known about its functions as a regulatorof endocrinic processes. In addition, literature data indicatethat the thymus has an influence on the blood pressure. The re-moval of thymus (thymectomy) leads to the appearance of a num-ber of pathologic phenomena. One of those is the hypertonicreaction, i.e. the rise of the blood pressure.2. GOALS, SCOPE, TECHNIQUES
The present investigation aims at:- defining the normal concentrations of certain elements
in the organs of laboratory animals (rats) and their age-de-pendent alterations,- defining the concentrations of the same elements in thy-mectomized animals (thymus removed),- establishing the deviations from the normal after a thy-mectomy had been effected,- seeking for a correlation between the deviations result-ing after the thymectomy and the hypertonic reaction.
140 male rats of the \7istar breed in the age of 3,6,9and 12 months were investigated, 60 of those v/ere subjectedto thymectomy at the age of 3 months. During the whole ex-periment the rats obtained standard bricketted food. The ex-periment was carried out as follows:
- analysis of 3-nonth old rats;- analysis of healthy 6-month old rats;- analysis of 6-month old rats whose thymus was removed
three months before;- parallel analysis of healthy 9- onth old rats and such
thyr.iectomized six months before;- parallel analysis of healthy 12-month old rats and of
such thymectomized nine months before.Liver, kidney, heart, intestines and rectum were anal-
yzed. The animals v/ere slain at the age indicated, the organswere extracted, purified from fat and multiply washed in bi-distilled water. The organs of 20 rats were mixed to form asample representative of the respective age. All the samplesunderwent horuogenization and v/ere freeze-dried. Up to theirradiation they v/ere kept in well closed glass vessels.
The instruments employed v/ere made from titanium,stainless steel and teflon, they were cleaned by means ofacids, bidistilled v/ater and alcohol. The same procedurewas applied to the vessels where the samples v/ere kept andto the irradiation ampules.
The irradiation was carried out in plythene and quartzampules. Two irradiation regimes were selected:1 i-iin» td« 2 min, tm= 5 min,
= 1 min, td» 2h, tm« 5 min.
16
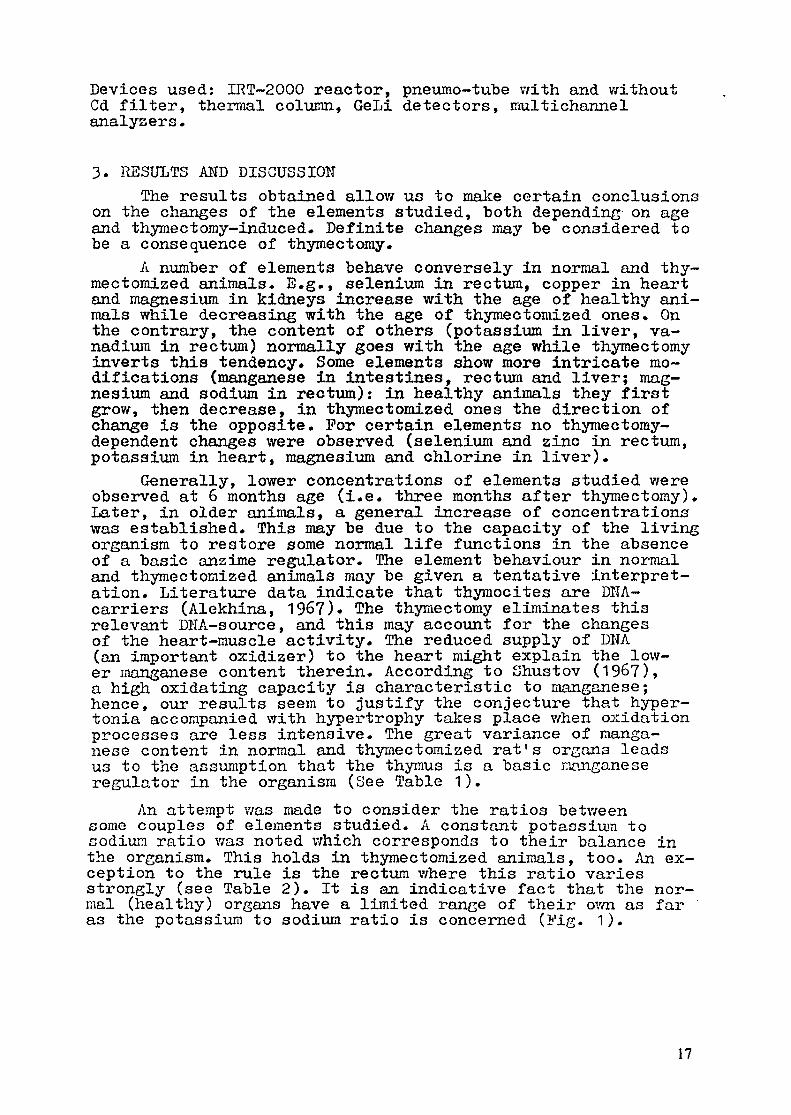
Devices used: IRT-2000 reactor, pneumo-tube with and withoutCd filter, thermal column, GeLi detectors, multichannelanalysers.
3. RESULTS AND DISCUSSIONThe results obtained allow us to make certain conclusions
on the changes of the elements studied, both depending on ageand thymectomy-induced. Definite changes may be considered tobe a consequence of thymectomy.
A number of elements behave conversely in normal and thy-mectomized animals. E.g., selenium in rectum, copper in heartand magnesium in kidneys increase with the age of healthy ani-mals while decreasing with the age of thymectomized ones. Onthe contrary, the content of others (potassium in liver, va-nadium in rectum) normally goes with the age while thymectomyinverts this tendency. Some elements show more intricate mo-difications (manganese in intestines, rectum and liver; mag-nesium and sodium in rectum): in healthy animals they firstgrow, then decrease, in thymectomized ones the direction ofchange is the opposite. For certain elements no thymectoray-dependent changes were observed (selenium and zinc in rectum,potassium in heart, magnesium and chlorine in liver).
Generally, lower concentrations of elements studied wereobserved at 6 months age (i.e. three months after thymectomy).Later, in older animals, a general increase of concentrationswas established. This may be due to the capacity of the livingorganism to restore some normal life functions in the absenceof a basic anaime regulator. The element behaviour in normaland thymectomized animals may be given a tentative interpret-ation. Literature data indicate that thymocites are D1TA-carriers (Alekhina, 1967). The thymectomy eliminates thisrelevant DITA-source, and this may account for the changesof the heart-muscle activity. The reduced supply of D1TA(an important oxidizer) to the heart might explain the low-er manganese content therein. According to Shustov (1967),a high oxidating capacity is characteristic to manganese;hence, our results seem to justify the conjecture that hyper-tonia accompanied with hypertrophy takes place when oxidationprocesses are less intensive. The great variance of manga-nese content in normal and thymectomized rat's organs leadsus to the assumption that the thymus is a basic manganeseregulator in the organism (See Table 1).
An attempt was made to consider the ratios betweensome couples of elements studied. A constant potassium tosodium, ratio was noted which corresponds to their balance inthe organism. This holds in thymectomized animals, too. An ex-ception to the rule is the rectum where this ratio variesstrongly (see Table 2). It is an indicative fact that the nor-mal (healthy) organs have a limited range of their own as faras the potassium to sodium ratio is concerned (Fig. 1).
17

TABLE 1. MANGANESE CONTENT IN RAT'S ORGANS, PPM
Organ Age, months
Smallintes-tines
Largeintes-tines
Liver
Heart
Kidney
3691236912369123691236912
9.Normal0 +
10.8 ±8.4.11.15.19.5.10.15.12.8.2.4.3.2.4.7.7.4.
316796958786982496
±i+++±±-±
++++t+++
0.0.0.0.1.0.0.0.
1.0.0.0.0.0.0.0.0.0.0.0.
53513622744558216621
Thymectomized
6.7.8.
8.
10.
9.6.8.
2.
2 io i3 i
2 ±-
1 i
5 -2 i8 i
3 i
0.0.0.
0.
0.
0.0.0.
0.
334
6
5
464
3less than 1.42.
4.4.
o ±
2 i4 i
3.5 i
0.
0.1.0.
3
455
TABLE 2.
age
36912
largenorm.
3.82.11.96.9
intest.thym.
3.2
2.2
smallnorm.
3.32.72.42.7
ointest.thym.
2.9
2.4
r g a nliver
mrm. "thym.
5.65.4 4.15.3 5.14.8 3.9
kidney heart7*Kt^iï-> thym » TyynrivTfaytr^
1111
.7
.8
.6
.4
1.71.81.4
3223
.3
.7
.5
.1
4.33.43.7
An interesting conclusion which may be drawn out of thecorrelations considered is the existence of definite regul-arity between changes in kidneys and the blood pressure (Fig.2). As to heart and liver, it v/as established that these or-gans react to the speed of blood pressure change after thyrae-ctoiiiy (Fig. 3). Investigations of rats with innate (genetic)hypertonia were also carried out to compare the two sorts ofhypertonic reactions. Since the elements studied showed dif-ferent behaviour, it may be concluded that these two sorts ofreactions go different ways. Unfortunately, only 12-month oldanimals were available for this study.
18

20-co
Io
age trajectories•—«-• - normal rats
O—«-O - thymectomized rats
liver
10-
k/dney
K/Na
Fig. 1
iri P[mm Hg)
3- -170
-150
1-
-13C
O—O |r| for kidney
H———————»12 AGE [month]
Fig. 2
19

[mm Hg/month]
---- bl.press.change rate
O—O |r| for heart
| r| for liver
12 AGE [month]
Pig. 3
4. CONCLUSIVE 1USÎ.ÎARKSIn our view, to explain both the processes which take
place in the organism after thymectomy and the role of elementsstudied in these processes, the study of element ratios andthe changes therein are of definite interest. To pursue thisgoal, it would be essential to broaden the faction of elementsdetermined and to concentrate on their changes shortly afterthymectomy when pathology is most acute. A subject of furtherstudies would be thymosin-injected thynectoraized rats at dif-ferent post-thyrnectouiy stages. Also, it would be of interestto carry on the comparative investigation of the two groupsof animals (thynectomized and spontaneous hypertensive) for abetter parallel between the two kinds of hypertonic reactions.
REFERS1IC3S1. UND3RY/OOD E.J: Trace elements in human and animal nutrition,
Academic Press, Uew York, 19772. KEMILJWA Z: Thymus, I.Iedicine Publishing House, Sofia (in
Bulgarian), 1979.3. OKAL'IOTO K: Jap.Circ.J., 27, (1.980) 282 .4. ITOZDRUHHIA L: Biological role of trace elements in animal's
organisms, lîauka, Moscow (in Russian), 1977.
20

CORRELATION OF TRACE METALS INHAIR AND NAILS
I. BENISCHEK-HUBER, F. BENISCHEKInstitut für Isotopenanwendung,Forschungszentrum Seibersdorf,Seibersdorf, Austria
Abstract
Correlation of Cd, Cu, Hg, Pb and Zn was studied in 35Ohair and nail samples of 12 persons. Determination was per-formed by atomic absorption spectrometry. Cd, Pb and Hg concen-trations are fluctuating significantly in the specimens. Corre-lation was found for these elements in hair and finger nailsand for Pb in hair and toe nails. Zn and Cu are more stable,the ratios of contents in corresponding samples are within asmall range.
1. INTRODUCTIONHair has been extensively described to be a good indicator
for exposure to toxic elements. For some toxic and essentialelements a proven clinical significance based on hair concen-trations was found. Recommendations have been reported concer-ning standardization of hair analysis [1]. To study the signi-ficance of hair analysis for body burden the levels of traceelements have been compared with those in blood and urin [2-5].By means of radiotracers the deposition of some of the toxicelements in hair and organs was studied in animals [6-7].
Until now, only a few papers are dealing with analysis ofnails [8-12]. Therefore, a comparison of the levels of sometoxic and essential elements in hair, finger and toe nails wasplanned to get more information about trace metal amounts innails, the fluctuations in these specimens and the inter-relations between hair and nails. The growing rate of hair is1 - 1 . 5 cm/month, while growth of finger and toe nails isabout 3 mm resp. O.8 mm/month only [13]. If sampling is per-formed from all fingers resp. toes 1 to 2 months periods arenecessary to get the next toe nail sample . For hair analysisit is suggested to use only the first 2.5 - 5 cm of recentgrowth. Nail clippings are comparable to the distal ends oflong hair.
For this long term correlation study hair and nail sampleswere collected from 12 persons several times. Fluctuations oftrace metal contens in the specimens were presumed. Therefore,it was expected to achieve more information about correlationof these materials by repeated sampling from a small groupthan from a large number of samples from different persons. Forall members of the group environmental exposure during workinghours is low. About half of the group is living in rural, halfof them in an urban region. Persons working in laboratories,
21
workshops, physicists and an electronics engineer were selectedfor the group^ For some of them generally or occasionallyincreased levels of the analytes had been expected due tohandling materials containing the elements of interest.
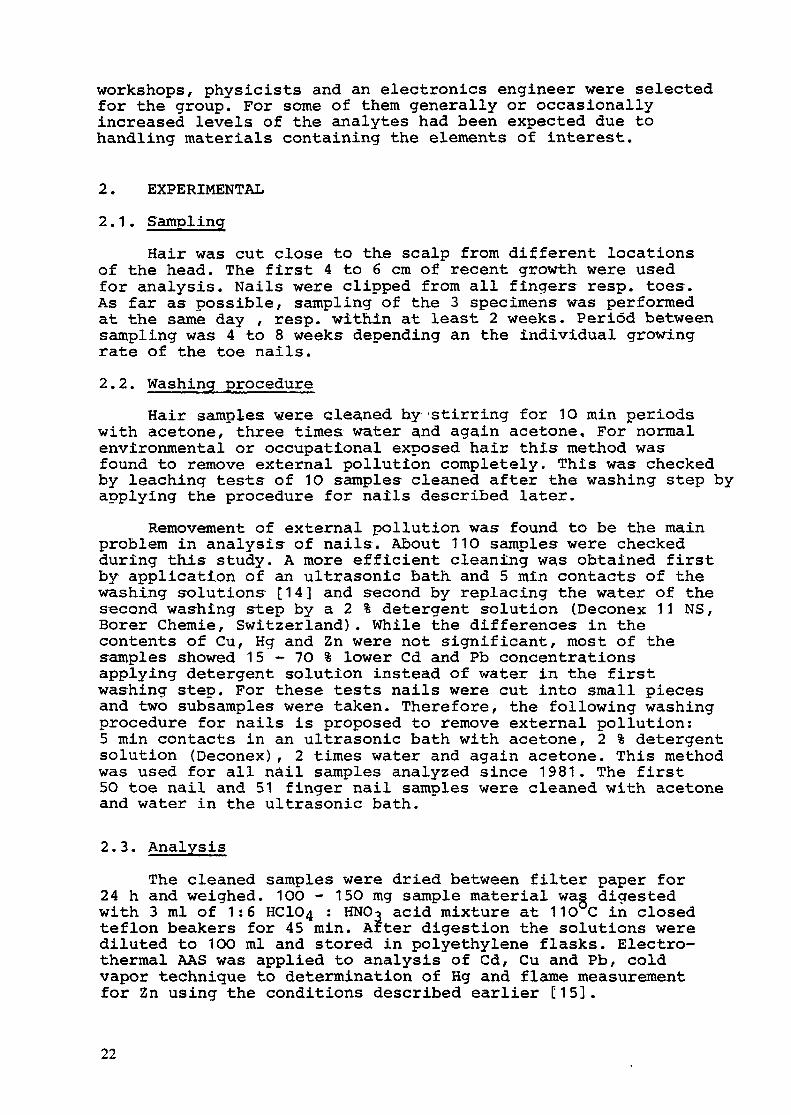
2. EXPERIMENTAL2.1. Sampling
Hair was cut close to the scalp from different locationsof the head. The first 4 to 6 cm of recent growth were usedfor analysis. Nails were clipped from all fingers resp. toes.As far as possible, sampling of the 3 specimens was performedat the same day , resp. within at least 2 weeks. Period betweensampling was 4 to 8 weeks depending an the individual growingrate of the toe nails.2.2. Washing procedure
Hair samples were alea,ned by'Stirring for 1Q min periodswith acetone, three times water and again acetone. For normalenvironmental or occupational exposed hair this method wasfound to remove external pollution completely. This was checkedby leaching tests of 10 samples cleaned after the washing step byapplying the procedure for nails described later.
Removement of external pollution was found to be the mainproblem in analysis of nails. About 110 samples were checkedduring this study. A more efficient cleaning was obtained firstby application of an ultrasonic bath and 5 min contacts of thewashing solutions [14] and second by replacing the water of thesecond washing step by a 2 % detergent solution CDeconex 11 NS,Borer Chemie, Switzerland). While the differences in thecontents of Cu, Hg and Zn were not significant, most of thesamples showed 15 - 7O % lower Cd and Pb concentrationsapplying detergent solution instead of water in the firstwashing step. For these tests nails were cut into small piecesand two subsamples were taken. Therefore, the following washingprocedure for nails is proposed to remove external pollution:5 min contacts in an ultrasonic bath with acetone, 2 % detergentsolution (Deconex), 2 times water and again acetone. This methodwas used for all nail samples analyzed since 1981. The first5O toe nail and 51 finger nail samples were cleaned with acetoneand water in the ultrasonic bath.
2.3. AnalysisThe cleaned samples were dried between filter paper for
24 h and weighed. 1OO - 150 mg sample material was digestedwith 3 ml of 1:6 HC1O4 : HNOo acid mixture at 11O C in closedteflon beakers for 45 rain. After digestion the solutions werediluted to 100 ml and stored in polyethylene flasks. Electro-thermal AAS was applied to analysis of Cd, Cu and Pb, coldvapor technique to determination of Hg and flame measurementfor Zn using the conditions described earlier [15].
22
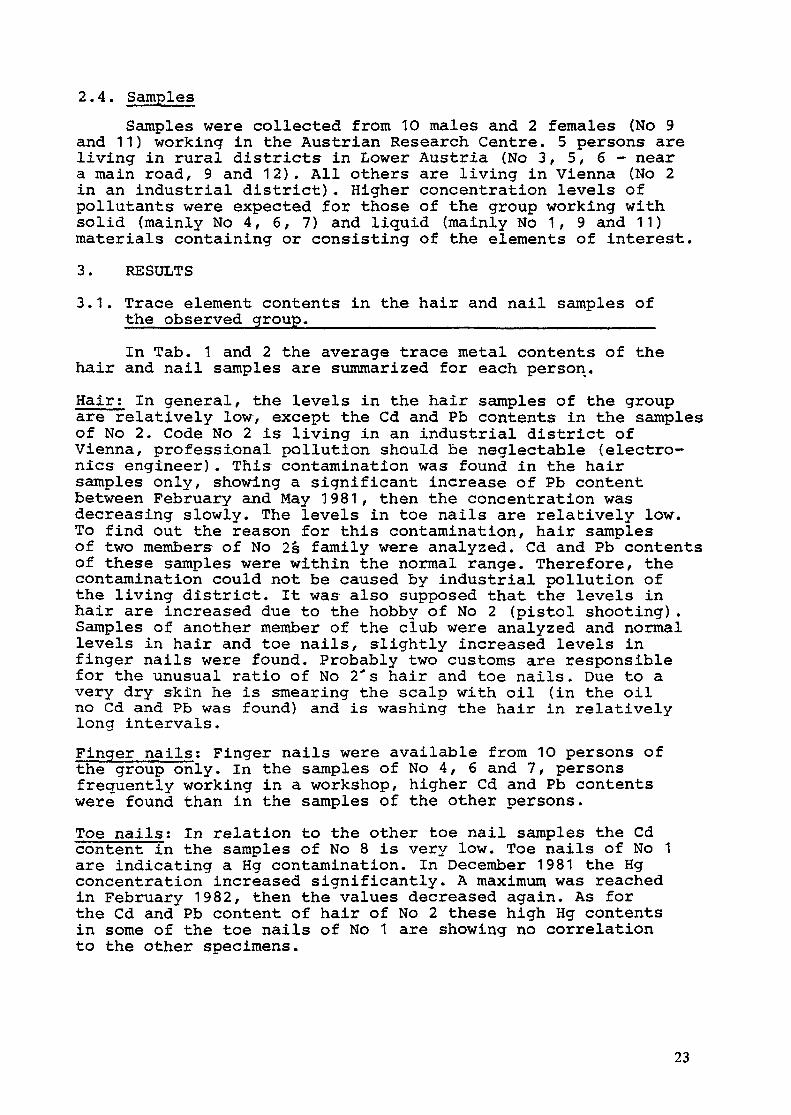
2.4. SamplesSamples were collected from 1O males and 2 females (No 9
and 11) working in the Austrian Research Centre. 5 persons areliving in rural districts in Lower Austria (No 3 , 5 , 6 — neara main road, 9 and 12). All others are living in Vienna (No 2in an industrial district). Higher concentration levels ofpollutants were expected for those of the group working withsolid (mainly No 4, 6, 7) and liquid (mainly No 1, 9 and 11)materials containing or consisting of the elements of interest.3. RESULTS3.1. Trace element contents in the hair and nail samples of
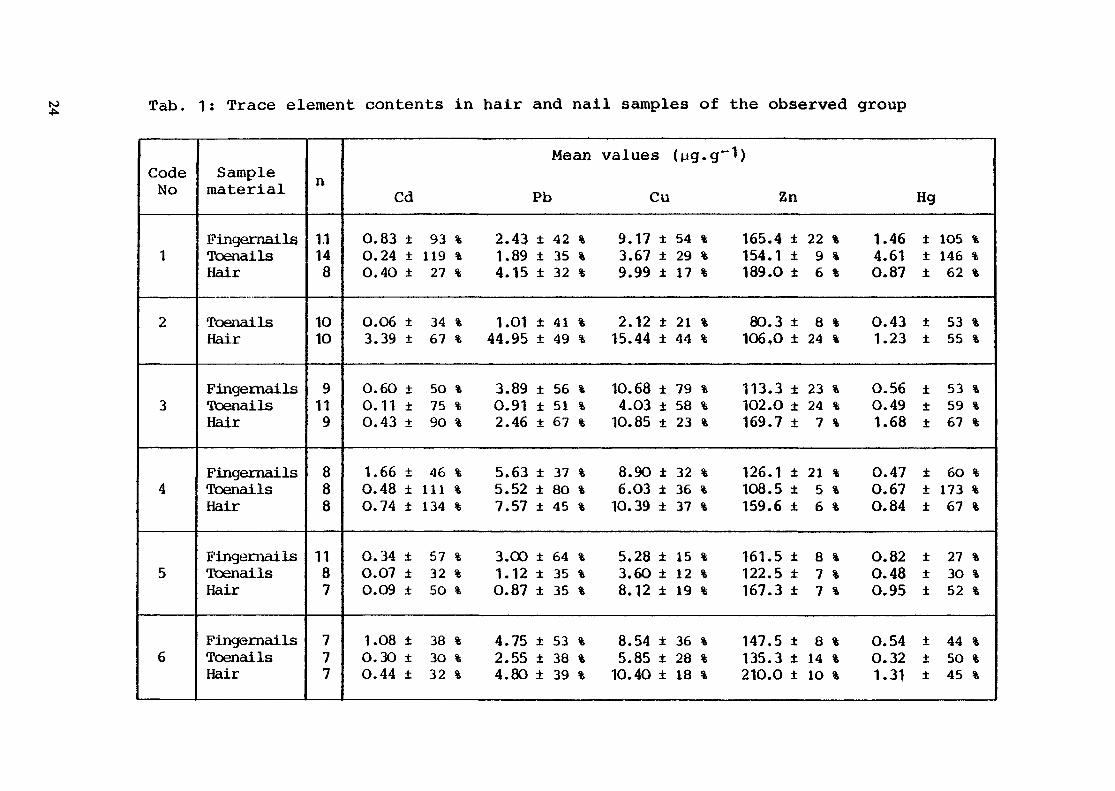
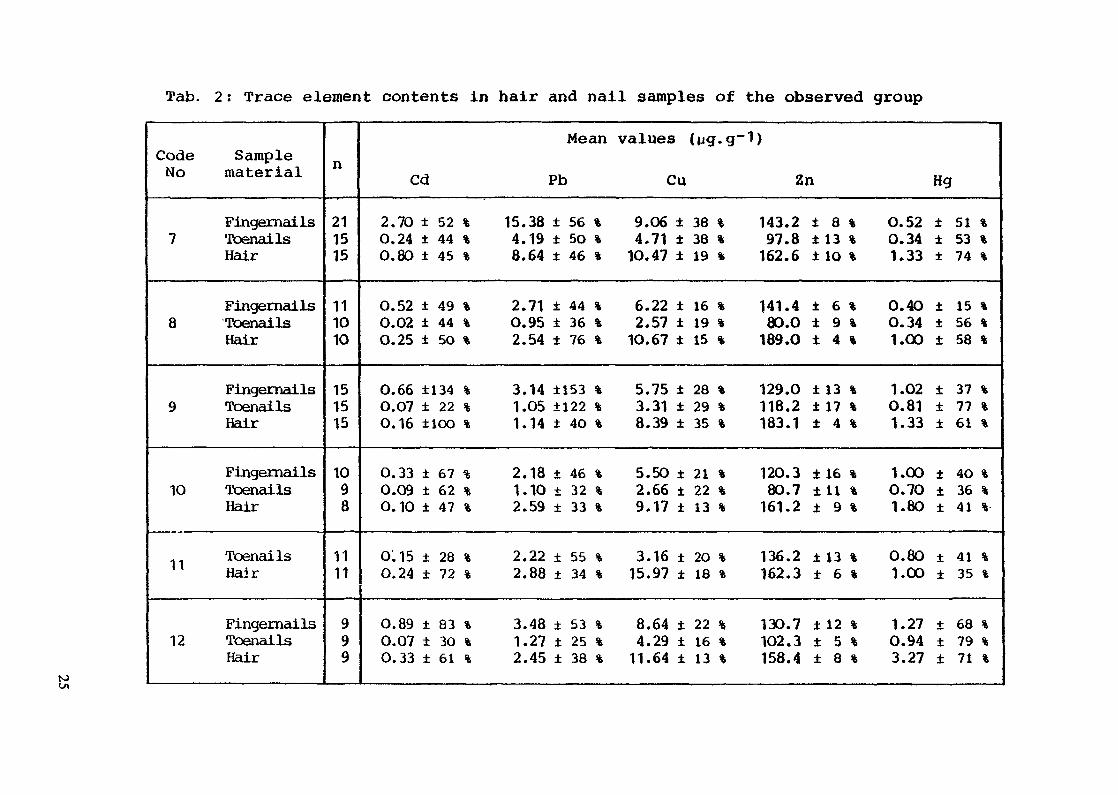
the observed group._____________________________In Tab. 1 and 2 the average trace metal contents of the
hair and nail samples are summarized for each person.Hair; In general, the levels in the hair samples of the groupare relatively low, except the Cd and Pb contents in the samplesof No 2. Code No 2 is living in an industrial district ofVienna, professional pollution should be neglectable (electro-nics engineer). This contamination was found in the hairsamples only, showing a significant increase of Pb contentbetween February and May 1981, then the concentration wasdecreasing slowly. The levels in toe nails are relatively low.To find out the reason for this contamination, hair samplesof two members of No 2s family were analyzed. Cd and Pb contentsof these samples were within the normal range. Therefore, thecontamination could not be caused by industrial pollution ofthe living district. It was also supposed that the levels inhair are increased due to the hobby of No 2 (pistol shooting).Samples of another member of the club were analyzed and normallevels in hair and toe nails, slightly increased levels infinger nails were found. Probably two customs are responsiblefor the unusual ratio of No 2"s hair and toe nails. Due to avery dry skin he is smearing the scalp with oil (in the oilno Cd and Pb was found) and is washing the hair in relativelylong intervals.Finger nails; Finger nails were available from 1O persons ofthe group only. In the samples of No 4, 6 and 7, personsfrequently working in a workshop, higher Cd and Pb contentswere found than in the samples of the other persons.Toe nails; In relation to the other toe nail samples the Cdcontent in the samples of No 8 is very low. Toe nails of No 1are indicating a Hg contamination. In December 1981 the Hgconcentration increased significantly. A maximum was reachedin February 1982, then the values decreased again. As forthe Cd and Pb content of hair of No 2 these high Hg contentsin some of the toe nails of No 1 are showing no correlationto the other specimens.
23
to Tab. 1: Trace element contents in hair and nail samples of the observed group
CodeNo
1
2
3
4
5
6
Samplematerial
FingernailsToanailsHair
ToenailsHair
FingernailsToenailsHair
FingernailsToenailsHair
FingernailsToenailsHair
FingernailsToenailsHair
n
1.1148
1010
9119
888
1187
777
Mean values (ug.g~^)
Cd Pb Cu Zn Hg
O.83 ± 93 % 2.43 ± 42 % 9.17 ± 54 % 165.4 ± 22 % 1.46 ± 1O5 %O.24 ± 119 % 1.89 ± 35 % 3.67 ± 29 % 154.1 ± 9 % 4.61 ± 146 %O.4O ± 27 % 4.15 ± 32 % 9.99 ± 17 % 189 .0 ± 6 % O.87 ± 62 %
O.O6 ± 34 % 1.O1 ± 41 % 2.12 ± 21 % 8O.3 ± 8 % O.43 ± 53 %3.39 ± 67 % 44.95 ± 49 % 15.44 ± 44 % 1O6,O ± 24 % 1.23 ± 55 %
O.6O ± 50 % 3.89 ± 56 % 10.68 ± 79 % 113.3 ± 23 % O.56 ± 53 %0.11 ± 75 % O.91 ± 51 % 4.O3 ± 58 % 1O2.O ± 24 % O.49 ± 59 %O.43 ± 90 % 2.46 ± 67 % 10.85 ± 23 % 169.7 ± 7 % 1.68 ± 67 %
1.66 ± 46 % 5.63 ± 37 % 8.9O ± 32 % 126.1 ± 21 % O.47 ± 6O %O.48 ± 111 % 5.52 ± 80 % 6.O3 ± 36 % 1O8.5 ± 5 % O.67 ± 173 %O.74 ± 134 % 7.57 ± 45 % 1O.39 ± 37 % 159.6 ± 6 % O.84 ± 67 %
O.34 ± 57 % 3.00 ± 64 % 5.28 ± 15 % 161.5 ± 8 % O.82 ± 27 %O.O7 ± 32 % 1.12 ± 35 % 3.6O ± 12 % 122.5 ± 7 % O.48 ± 3O %O.O9 ± 50 % O.87 ± 35 % 8.12 ± 19 % 167.3 ± 7 % O.95 ± 52 %
1.O8 ± 38 % 4.75 ± 53 % 8.54 ± 36 % 147.5 ± 8 % O.54 ± 44 %O.3O ± 30 % 2.55 ± 38 % 5.85 ± 28 % 135.3 ± 14 % O.32 ± 5O %O.44 ± 32 % 4.8O ± 39 % 10.4O ± 18 % 21O.O ± 1O % 1.31 ± 45 %
Tab. 2 : Trace element contents in hair and nail samples of the observed group
CodeNo
7
8
9
10
11
12
Samplematerial
FingernailsToenailsHair
FingernailsToenailsHair
FingernailsToenailsHair
FingernailsToenailsHair
ToenailsHair
FingernailsToenailsHair
n
211515
111010
151515
1098
1111
999
Mean values (ug.g~1)
Cd Pb Cu 2n Hg
2.7O ± 52 % 15.38 ± 56 % 9.O6 ± 38 % 143.2 ± 8 % O.52 ± 51 %O.24 ± 44 % 4.19 ± 50 % 4.71 ± 38 % 97.8 ± 13 % O.34 ± 53 %O.80 ± 45 % 8.64 ± 46 % 1O.47 ± 19 % 162.6 ± 1Q % 1.33 ± 74 %
O.52 ± 49 % 2.71 ± 44 % 6.22 ± 16 % 141.4 ± 6 % O.4O ± 15 %O.02 ± 44 % O.95 ± 36 % 2.57 ± 19 % 8O.O ± 9 % O.34 ± 56 %O.25 ± 50 % 2.54 ± 76 % 1O.67 ± 15 % 189.O t 4 % 1.00 ± 58 %
O.66 ±134 % 3.14 ±153 % 5.75 ± 28 % 129.O ± 13 % 1.O2 ± 37 %O.07 ± 22 % 1.O5 ±122 % 3.31 ± 29 % 118.2 ± 17 % O.81 ± 77 %O.16 ±100 % 1.14 ± 40 % 8.39 ± 35 % 183.1 ± 4 % 1.33 ± 61 %
O.33 ± 67 % 2.18 ± 46 % 5.5O ± 21 % 12O.3 ± 16 % 1.ÛO ± 4O %O.O9 ± 62 % 1.10 ± 32 % 2.66 ± 22 % 8O.7 ± 11 % O.7O ± 36 %O.1O ± 47 % 2.59 ± 33 % 9.17 ± 13 % 161.2 ± 9 % 1.8O ± 41 %
O:15 ± 28 % 2.22 ± 55 % 3.16 ± 2O % 136.2 ± 13 % O.8O ± 41 %O.24 ± 72 % 2.88 ± 34 % 15.97 ± 18 % 162.3 ± 6 % 1.00 ± 35 %
O.89 ± 83 % 3.48 ± 53 % 8.64 ± 22 % 13O.7 ± 12 % 1.27 ± 68 %O.07 ± 30 % 1.27 ± 25 % 4.29 ± 16 % 1O2.3 ± 5 % O.94 ± 79 %O.33 ± 61 % 2.45 ± 38 % 11.64 ± 13 % 158.4 ± 8 % 3.27 ± 71 %
tol/l

3»2. Fluctuation of trace element contents in hair and nailswithin the observation period.__________________________
Fluctuations of trace metal contents were found in hair andnails of all persons of the group. For some elements and someof the observed persons these variations are very high. InTab 1 and 2 the relative standard deviations are listedin addition to the average trace metal concentrations. Pre-cision of the analysis including measurement errors in thechemical preparation of the samples is in the range of±2% to ±8% [15] and is less influencing these results. Znand Cu contents in hair and nails of the group were relativelystable. Higher Cu fluctuations were found in two cases only, thefinger nails of No 1 and finger and toe nails of No 3. Bothpersons are often handling Cu metal. Wide variations in Cd, Pband Hg concentrations.Were found in samples of the -personsworking in the laboratory (No 1, 9) and in the workshop (No 4).3.3. Ratio of trace metal contents in hair and nails3.3.1 Ratio of the average contents. Comparing the average
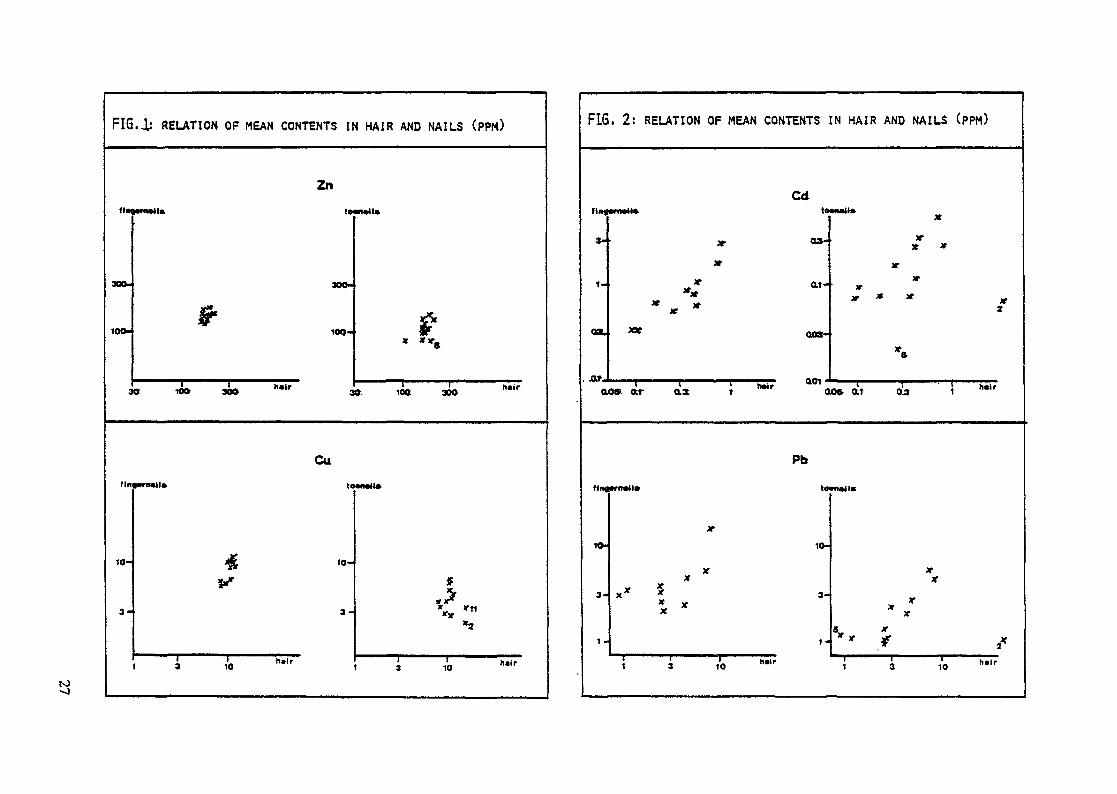
contents of trace metals in hair, finger and toe nailsof each of the 12 persons the following results were obtained:Cd, Pb, Cu, Zn, Hg in fingernails > toe nailsCd, Pb, Cu, Zn, Hg in hair > toe nailsCu, Zn, Hg in hair > finger nailsCd in hair < finger nailsPb + in hair ~ finger nails+in average this ratio is about 1. For the observed personsratios of 0.3 - 1.7 were found.
Except the unusual ratio of Hg in nails of No 1, only therelation of the Pb concentration in the hair and toe nails ofNo 5 are not fitting in these results. Among the persons of thegroup significant differences for the ratios were found mainlyfor the Cd and Pb ratio of hair and toe nails of No 2 and theCd and Zn ratios of hair and toe nails of No 8. In relation tothe Zn concentrations in these hair samples, the contents inthe toe nail samples are relatively low. This could beinfluenced by a mycosis of the toe nails. Fig. 1 to Fig. 3present the relations of the mean concentrations in the speci-mens of each person. Unusual ratios are marked by the code No.
26
to
FIG.i RELATION OF MEAN CONTENTS IN HAIR AND NAILS (PPM)
Znfin
300-
100-
:
•mail» t«
300-
100-
M»<l»
-ft
0 10» 3ÔO "*tr 3O 100 300 "•""
Cu
fli*
1O-
3-
(•mail* to
"& 10~
5-*
3-
mnil»
*
*a
1 3 10 "•" 3 10 "•"•
FIG, 2: RELATION OF MEAN CONTENTS IN HAIR AND NAILS (PPM>
Cdtin,
3-
1-
03.
a
•rrwtl» to
^^ 02*
»
** ai-** X? *
^ * OO3Ï—
•Mil»
jT *if
** * * *
2
*•
o» ar ax i ao» at 0.3 1
Pb
fl«(
1O-
3-
1 -
•rmtl* tw
jr10-
XX
X* $ 3-
1-
*n*ll*
ifif
XX
** r f f
I 3 10 "•" 5 3 10 h"r
In general, a trend was found that a decrease or increasein trace element contents in hair is often reflected by nailstoo. But there are also results like Hg and Pb in samples ofNo 1 and No 2 which are not indicating any relation betweencorresponding hair and nail samples. Moreover, in thecalculation of the average ratios of contents in hair andcorresponding nail samples (Tab. 3) high relative standarddeviations were obtained in some cases. The deviations from theaverage values of the ratios are within a small range for Zn(6 values are out of ± 5O%) and for Cu (more than 80% of theratios are within ± 10O%). For Gd, Pb and Hg, only 40% to 65%of the values are within ± 100%.
To- judge the correlation between hair and nails astatistical evaluation of the correlation coefficient wascarried out. Partly, the results were not meeting the termsfor a Gaussian distribution. Therefore, the Spearman rankcorrelation coefficients were calculated. For the pollutantsa correlation was obtained between hair and finger nails(Cd: 0.5, Pb: 0.47, Hg: O.29) and finger and toe nails(Cd: 0.45, Pb: 0.65, Hg: 0.36), while hair and toe nails areshowing a correlation for Pb only (Pb: 0.44). This result couldnot be influenced by replacement of outliers by 4 Ç boundaryvalues.4. SUMMARY
Cd, Cu, Hg, Pb and Zn contents were analyzed in 35O hairand nail samples of 12 persons by atomic absorption spectro—metry. While removement of external pollution from hair wasdone with acetone and water, for nails a more efficientcleaning with acetone, detergent and water in an ultrasonicbath had to be applied.
In average, contents of these analytes were found to behigher in hair and finger nails than in toe nails. Comparinghair and finger nails, higher Cu, Hg and Zn contents wereobtained in hair and higher Cd concentrations in finger nails.Pb levels were similar in these two materials.
Cd, Hg and Pb concentrations were fluctuating inspecimens- of a person, while Zn and Cu were more stable. Intwo cases a contamination was reflected only by hair (Pb)resp. nails (Hg). Therefore, the relations of the mean valuesfor these elements were significantly different to those ofthe others of the group. For one person an outlying Cd ratio,for another person unusual Pb and Zn ratios were found in thecontents of hair and toe nails. For corresponding hair andnail samples the ratios of Zn and Cu contents are within asmall range. Correlation was found for Cd, Pb and Hg betweenhair and finger nails and for Pb in hair and toe nails. ForCd and Hg in hair and toe nails the correlation coefficientswere 0.25.
In spite of the trend of nails to reflect often increasedor decreased trace metal levels in hair, hair can be consideredto be a more reliable indicator for uptake of pollutants.
29
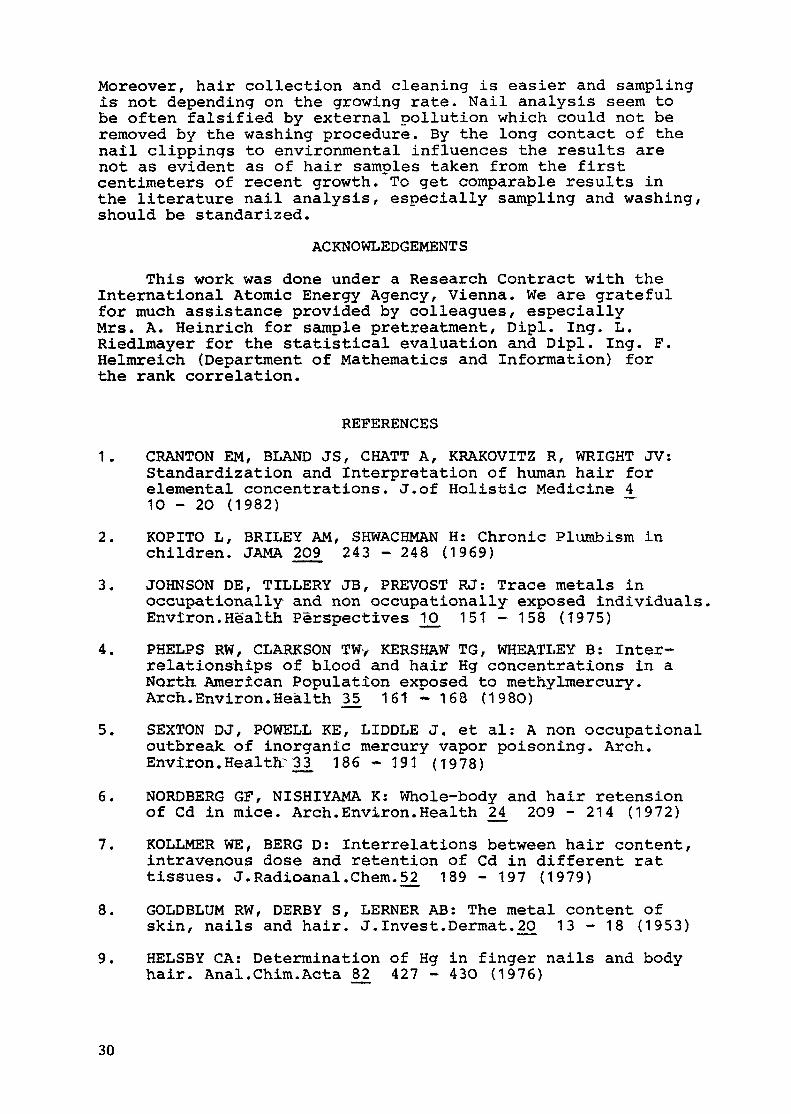
Moreover/ hair collection and cleaning is easier and samplingis not depending on the growing rate. Nail analysis seem tobe often falsified by external pollution which could not beremoved by the washing procedure. By the long contact of thenail clippings to environmental influences the results arenot as evident as of hair samples taken from the firstcentimeters of recent growth. To get comparable results inthe literature nail analysis, especially sampling and washing,should be standarized.
ACKNOWLEDGEMENTSThis work was done under a Research Contract with the
International Atomic Energy Agency, Vienna. We are gratefulfor much assistance provided by colleagues, especiallyMrs. A. Heinrich for sample pretreatment, Dipl. Ing. L.Riedlmayer for the statistical evaluation and Dipl. Ing. F.Helmreich (Department of Mathematics and Information) forthe rank correlation.
REFERENCES
1. CRANTON EM, BLAND JS, CHATT A, KRAKOVITZ R, WRIGHT JV:Standardization and Interpretation of human hair forelemental concentrations. J.of Holistic Medicine 4^10 - 20 (1982)
2. KOPITO L, BRILEY AM, SHWACHMAN H: Chronic Plumbism inchildren. JAMA 209 243 - 248 (1969)
3. JOHNSON DE, TILLERY JB, PREVOST RJ: Trace metals inoccupâtionally and non occupâtionally exposed individuals.Environ.Health Perspectives 10 15t - 158 U975)
4. PHELPS RW, CLARKSON TW>- KERSHAW TG, WHEATLEY B: Inter-relationships of blood and hair Hg concentrations in aNorth. American Population exposed to methyImercury.Arch..Environ.Health ,35_ 161-168 (1980)
5. SEXTON DJ, POWELL KE, LIDDLE J. et al: A non occupationaloutbreak of inorganic mercury vapor poisoning. Arch.Environ.Healtïr33_ 186 - 191 (1978)
6. NORDBERG GF, NISHIYAMA K: Whole-body and hair retensionof Cd in mice. Arch.Environ.Health 24 2O9 - 214 (1972)
7. KOLLMER WE, BERG D: Interrelations between hair content,intravenous dose and retention of Cd in different rattissues. J.Radioanal.Chem.52^ 189 - 197 (1979)
8. GOLDBLUM RW, DERBY S, LERNER AB: The metal content ofskin, nails and hair. J.Invest.Dermat._20 1 3 - 1 8 (1953)
9. HELSBY CA: Determination of Hg in finger nails and bodyhair. Anal.Chim.Acta 82 427 - 43O (1976)
30

10. OTHAM I, SPYROU NM: Elemental concentration in hair andnail from a selected population group in the Machakosdistrict of Kenya. IAEA-SM-227/33 (1978)
11. HARRISON WW, CLEMENA GG: Survey analysis of traceelements in human finger nails by spare source massspectrometry. Clin.Chim.Acta 36 485 - 492 (1972)
12. BANK HL, ROBSON J, BIGELOW JB, MORRISON J, SPELL LH,KANTOR R: Preparation of finger nails for trace elementanalysis. Clin.Chim.Acta 116 179 - 19O (1981)
13. HOPPS HC: The biologic bases for using hair and nail foranalyses of trace elements. The Science of the TotalEnvironment !_. 71-89 (1977)
14. HUBER I, BENISCHEK F: Analysis of trace metals in humanhair and nails by atomic absorption spectrometry II.OEFZS BER. No A026O
15. BAGLIANO G, BENISCHEK F, HUBER I: A rapid and simplemethod for the determination of trace metals in hairsamples by atomic absorption spectrometry. Anal.Chim.Acta123 45 - 56 (1981)
31
HUMAN SCALP HAIR AS AN EPIDEMIOLOGIC MONITOROF ENVIRONMENTAL EXPOSURE TO ELEMENTAL POLLUTANTS
A. CHATT*, M. SAJJAD, K.N. DeSILVA, C.A. SECORDTrace Analysis Research Centre,Department of Chemistry,Dalhousie University,Halifax, Nova Scotia, Canada
Abstract
The suitability of using scalp hair as an epidemiologicalmon i to r of e n v i r o n m e n t a l exposure is being e v a l u a t e d .Ins t rumenta l neutron activation analysis (INAA) methods usingshort-lived nuclides have been developed for s imultaneousmul t ie lement determinations in scalp hair . Graphite fu rnaceatomic absorption spectrometry (GFAAS) method has been used formeasuring Pb and Cd. Precision and accuracy of the methods havebeen evaluated by analyzing standard reference mate r ia l s andIAEA Intercomparison Hai r Sample HH-1. A detailed study ondifferent hair washing methods has been done and reported here.The effect of exogenous contaminants from shampoo on levels ofcertain elements has been studied. Variation of trace elementlevels along the longitudinal segments of hair strands has beeninvestigated. The methodologies have been applied to screenpopulation groups exposed to environmental arsenic and to studytrichothiodystrophy.
1. INTRODUCTION
D u r i n g the past 20 years or so va r i ous types of indus t ryhave become operat ional a round the wor ld - new processes andchemicals have been invented, and both their products and wasteshave been discharged to the envi ronment - to atmosphere ,biosphere and hydrosphere. Many of these chemicals are known tocontain toxic elements and other hazardous substances which aref i nd ing their ways to the central f i g u r e of env i ronmen ta lpol lu t ion problems - man h imse l f . Toxic elements , e i theringested or inhaled, from the environment can be translocated toscalp hair . The interest in hai r trace element levels isevident from more than 500 papers published in open literatureon this subject.
Scalp h a i r is be ing r e c o g n i z e d as a t i s sue w h i c hincorporates elements into i ts s t ruc tu re du r ing the g rowthprocess, a f t e r which i t becomes separated f r o m cont inua lmetabol ic ac t iv i ty of the body (1). It is a stable mate r ia lwhich is painlessly removed, genera l ly discarded, read i lycollected, convenient ly t ranspor ted and easily preserved .
Two whom all correspondence should be addressed.
33
Levels of most toxic elements in scalp hair are at least anorder of magn i tude higher than that found in other tissues andbody f l u i d s ; consequent ly , ha i r samples of lower mass can beanalyzed with better precision and accuracy. Less interferencesare a l so e n c o u n t e r e d in most ha i r e l e m e n t a l m e a s u r e m e n ttechniques. Obviously, there are many advantages in using scalphair as an indicator for screening population groups exposed toenv i ronmen ta l pol lutants . Such usage of scalp hair is, ofcourse, not f ree f rom opposing viewpoints. In this regard, twomost c o m m o n l y r e f e r r e d i t ems a re : (a ) s e p a r a t i o n o fendogenously deposited elements from exogenous contaminants inh a i r ; and (b) a b i l i t y of h a i r to r e f l e c t dose - responserelationship. While we have attempted to resolve the first itemby developing hair washing methods and comparing va r iousavailable methods, the second item needs to be fur ther evaluatedby using animal models and/or autopsy samples.
Dur ing the tenure of this co-ordinated research p rogram(CRP) o rganized by the In te rna t iona l Atomic Energy Agency( I A E A ) , we have c o n c e n t r a t e d ou r e f f o r t s ( a ) t o d e v e l o pins t rumenta l neu t ron ac t iva t ion analysis (NAA) methods usingshort- to medium-l ived nucl ides and graphi te f u r n a c e atomicabsorpt ion spectrometry (GFAAS) methods for Cd and Pb; (b) toevaluate the quality (precision, accuracy and detection limit)of analyt ica l data by ana lyz ing the IAEA Intercompa-rison Hai rsample and severa l other s tandard re fe rence mater ia l s ; (c) tocompare ava i lab le ha i r washing methods using in-house hairs tandards; (d) to examine the e f fec t iveness of the washingmethods by applying them to hair samples which have been treatedwith contaminants; (e) to study the variation of trace elementsalong the longi tud ina l segments of ha i r strands; and (f) toapply these methods for analyzing hair samples collected from apopulat ion g roup exposed to env i ronmen ta l arsenic and f r o mindividuals with neuroectodermal symptom complex.
2. DEVELOPMENT OF ANALYTICAL METHODS
Neutron activation analysis methods have been developed forthe simultaneous determination of multielement concentrations inhuman scalp hair . Levels of Cd and Pb in ha i r have been measuredusing atomic absorption spectrometry.
2.1 instrumental neutron activation analysis (INAA)
There are several elements which give long-lived (half-l ife65 d) nuclides on thermal and resonance neutron activation. Thesensitive detection of these nuclides normally require lengthyi r rad ia t ion , decay, and count ing periods. Some of theseelements can also be determined through short-lived isomers ofthe long-l ived nuc l ides and th rough a l te rna te short- l ivednuclides. At least 38 elements are known to produce both short-and long-lived neutron activation products (2). The applicationof short-lived nuclides in routine measurements can reduce totalanalysis t ime and provide super ior detection l imits in manycases. The objective of this study was to develop INAA methodsf o r t h e s i m u l t a n e o u s d e t e r m i n a t i o n s o f m u l t i e l e m e n tconcentration in human scalp hair using short- and medium-livednuclides.
34

INAA methods based on the principles of convent ional one-shot i r radia t ion as wel l as cyclic act ivat ion were developed.The cyclic activation technique involves the Irradiation of asample for a short t ime, t r a n s f e r r i n g it qu i ck ly to a detectorcount ing the induced activities and repeating the processseveral times. During the early stages of our investigation onshort-lived nuclides, a cyclic INAA (CINAA) method consisting ofmanual t r a n s f e r of a sample was developed (3,4). A pneumatic,automated rapid t r ans f e r sample recycling system was laterdesigned (5) and subsequently improved (3 ,4 ,6) . A computerprogram was developed to theoret ica l ly ca lcula te the opt imumtiming parameters for s imul taneously de termining a number ofshort-l ived nucl ides (7). A method was also developed tocorrect for coincidence losses in high count rate gamma-rayspectrometry (4,8).
The INAA methods were applied to human scalp hair . Thenuclear data for the elements detected in hair are shown inTable 1. The timing parameters used and nuclides detected wereas follows:of 10 s, and
(A) irradiation
52V;139Ba,5 2
counting2 Oo 1 2 8T•I ,
(B)
V and7 6As, 1 9 8
Ca/69mZn.
F,= 1066Cu,(C)
time27Mg,min,
1 2 8I ,16
tc = 3000 sAu, 8 2Br and 1 2 2Sb;
for75SellomAg, --and 65Zn.
time (t.) of 30• ) of 20 s for?Mn, 2*Na, 86mRb,5 min, and t„ =27Mg,h, td •and 0»
s,1 1 0(td)
5 6 Mn, z= 2 d, and t
decay timeA g , 2 0 A l , 8 0 B r 746^Sc, 77inSe and5 min for 28A1,
37S, 51Ti, 2 3 9 U ,= 3000 s for
B a , 6 0Co, 5 C r ,t,51
= 16 h,5 9Fe,
= 213 H g ,
d, and1 I f ° L a ,
Table I. NUCLEAR DATA FOR ELEMENTS DETECTED BY INAA
Element
AgAlAsAuBaBrCaClCoCrCuFFeHgIKLaMgMnHaRbSSbScSeTiUVZn
Nuclide
110Ag28A176As'"Au"äßa80Br"9Ca'"Cl60CO5 1er66Cu20p5'Fe203Hg128!**2K
"">La"MgS«Mn2*Na
BSmjy-,"S!22Sb'•Smsc77mge5'Ti239052V652n
Half -life Photopeak used,keV
24.4 s2.24 min
26.3 h2.7 d
82.9 min17.6 min8.72 min37.3 min5.27 a27.7 d5 . 1 min11.2 s44.6 d46.8 d25 min12.4 h40.3 h9.46 min2.58 h15.0 h1.02 min5 . 1 min2.68 d18.7 s17.4 s5 . 8 min
23.5 min3.76 min
244 d
6581779559412166617308416421332320
1039163310992794431525487101418111369556310256414216232074
14341115
35

2.2 graphite furnace atomic absorption spectrometry (GFAAS)Concentrations of Pb and Cd were measured using a GFAAS
method. A Perkin-Elmer model 403 atomic absorption spectrometerin conjunction with a Perkin-Elmer HGA 2200 graphite furnace andautosampler AS-1 was used for this purpose.
The hair samples were digested in a TEFLON bomb at about 100°C for 16h in 2mL ULTREX concentrated nitric acid. The volume
was then made up to lOmL with Super-Q water. The experimentalconditions for the analyses of Pb and Cd by GFAAS are given inTable 2.
Table 2. EXPERIMENTAL CONDITIONS FOR ANALYSIS OF CADMIUMAND LEAD BY GFAAS.
Parameters Cadmium Leadtime temp.,°C time temp.,°C
DryingCharringAtomizing
20 s10 s4.5 3
903002200
20 3IS sS s
1004002200
WavelengthSlit widthFlow timeGas supplyGasLinear range
227.6 ran43 norm40argonDL - 5 ppb
282.53
nm
3 norm30
argonDL - 10 ppb
DL - detection limit
3. EVALUATION OF PRECISION AND ACCURACYPrecision and accuracy of the INAA and GFAAS methods were
evaluated by analyzing replicate samples, in-house hairstandards, standard reference materials (SRM), certifiedreference materials (CRM), and intercomparison samples. The SRMincluded the National Bureau of Standards (NBS) Bovine Liver(both 1577 and 1577a), Oyster Tissue, Orchard Leaves, Spinach,Tomato Leaves, Pine Needles and Citurs Leaves. Several CRMsupplied by the IAEA were analyzed; these included AnimalMuscle, Animal Bone, Fish Solubles and Milk Powder. The IAEAIntercomparison Hair Sample HH-1 (1980) was also analyzed by theINAA and GFAAS methods, and the results are presented in Table3. Most of our results agree very well with those reported byM'Baku and Parr (9). The causes for apparent deviations of Au,Cu and Na concentrations are not fully known at this stage. Itshould, however, be pointed out that we have measured the Culevel of HH-1 as 10.6±1.0 ppm in recent experiments.
The GFAAS result of 2.6±0.3 ppm Pb compares favorably withthat of 2.73 ppm in HH-1 reported by M'Baku and Parr (9). OurCd value of 0.177±0.02 ppm by GFAAS is, however, lower than thecertified value of 0.26 ppm. On the other hand, the Cd content
36

Table 3. ELEMENTAL CONTENT OF IAEA INTERCOMPARISON RUN HH-1 (I960)
Element Individual Determinations'1
AgAlAsAu*BaCaClCoCuFHgIKMnNaS°SbSeZn
10.125.80.0520.1502.355020705.769.48701.7124.2100.92
23.24.340.0280.331.74
20.206.60.0530.1627.550019955.797.510001.7722.9101.224.64.200.0250.36178
30.186.50.0590.1553.554020105.938.58401.8123.790.5923.14.240.0270.27176
40.136.20.0520.1548.154819405.7610.49701.7424.8110.8623.44.000.0240.27178
50.077.10.0530.1544.455520305.918.08001.80
23. B
90.5223.44.000.0260.23176
60.156.90.0540.1572.655019506.087.38901.7624.380.98
23.24.250.0250.28179
Average *r.s.d.0
0.16*0.046.5*0.50.054*0.003,0.155*0.004*4.7*2.5540*202000*505.87*0.138.5±1.2d900*851.77*0.0424.0*0.710*10.85*0.2523.5*0.64.22*0.110.026*0.0010.29*0.05177*2
IAEAv.alue"
_-
0.0530.025
_52222705.9710.2
-1.70-«.
0.8512.64.90.0310.35174
"All values are in ppra except otherwise mentioned
see text for detailsin ppb
of NBS SRM-1577 Bovine Liver of 0.278±0.03 ppm measured in ourlaboratory agrees well with the value of 0.27±0.04 certified bythe NBS, indicating the reliability of the GFAAS method for Cd.
4. CALCULATION OF DETECTION LIMITS
There are various methods to calculate limits of detectionin INAA. We have used the method prescribed by Currie (10) forcalculating critical limit (L/-.), qualitative detection limit(LD) and quantitative determination limit (L/J for severalelements in IAEA Intercomparison Run HH-1 hair sample. Theselimits are presented in Table 4. Almost all elements measuredin HH-1 were above their respective LD values. The limits couldbe further improved by using a neutron flux higher than that wasavailable for the present study, viz. 5 x 10¹¹ n cm-2 s 1.However, this may not be necessary.
5. COMPARISON OF HAIR WASHING METHODSSince hair is inherently an oily tissue which is being
constantly exposed to exogenous contaminants, any trace elementanalysis must take into account the possibility that what ismeasured may not all be elements deposited internally in hairtissue during the growth process within the hair scalp follicle.For this reason various hair washing procedures have been usedin order to remove exogenous contaminants. IAEA has recommendeda washing method of 10 min contacts with 25 mL portions ofacetone, water, water, water and acetone, successively (11).However, different washing procedures are still being usedcontroversy continues to brew.
and
37

Table 4. DETECTION LIMITS OF ELEMENTS IN IAEA INTERCOMPARISONRUN HH-1 (1980)
Element
AgAlAsAuBaBrCaClCoCuFFeHgIKMgMnNaS,%SbScSeVZn
Criticallimit, LC
0.0650.810.0239.9 x lu"11
3.60.0772860.0471.911350.100.138470.372.00.140.0220.00160.0780.0321.7
QualitativeDetectionLimit, LD
0.141.60.0462.0 x 10"3
7.60.16
52130.0973.823730.200.2616950.754.10.280.0450.00340.160.0653.5
QuantitativeDeterminationLimit, L..
0.545.20.156.3 x 10
230.50
210410.3512100250
0.680.84
533102.4131.140.140.0120.560.2112
All values are in ppm except for S which is in %
The purpose of this study was to investigate the effect ofwashing hair with ethylenediaminetetraacetic acid (EDTA), sodiumdodecyl sulphate (SDS, an ionic detergent), Triton X-100 (TR, anon-ionic detergent), acetone, ether, ethanol, water,hydrochloric acid and sodium hydroxide on different elementscommonly found in hair. The results of these washing methodswere compared with that of IAEA. The efficacy of the suggestedwashing procedures in removing external contaminants due to theusage of certain shampoos was also studied. Details of theresults will be published separately (12); the highlights of theinvestigation are described below.5.1 Preparation of in-house hair standards
In order to compare different washing methods using ahomogeneous hair sample, it was necessary to prepare about 50gof a hair standard. For this purpose, hair samples from twomales were collected over a period of one year. None of thesepersons used any special hair treatment except ordinary shampoo;and they are normal healthy males residing in Halifax, NS,Canada, and working as academics.
The samples were first cut to small sections (0.5-0.7 cm)and homogenized thoroughly without treating them with any washsolution (even water). They were designated as "Stock A" and"Stock B" in-house hair standards.
Six samples of each of the hair standards were analyzed byboth INAA and GFAAS methods for 18 elements. The results arepresented in Table 5. It appears that both the standards arefairly homogeneous with respect to the elements measured.
38

Table 5. ELEMENTAL CONTENT OF UNWASHED IN-HOUSE HAIR STANDARDS
Element Content"Stock "A" Stock "B"
AlASAu
BrCaClCoCuHgIMnNaPfeS£SbSeVZn
23.812.60.276±0.0150.015±0.00114.710.772008±543251156.70±1.6421.4±1.352.3610.190.27±0.0360.98±0.08156±64.9410.394.4310.20.30210.091.2110.150.17±0.0122015.6
24.2±2.50.10210.0190.12+0.0083.32±0.191000i31318+13
12.912.62.4610.130.40t0.040.69*0.051041174.5710.684.2010.180.26010.080.9210.130.2010.02156111
"All values are in ppm except otherwise noted; average of sixdeterminations.
fcin %
5.2 General procedureThe following reagents were selected as wash solutions:
deionized water, acetone, ether, hexane, ethanol, 1% SDS, 1% TR,1% disodium EDTA, 0.1M HC1 and 0.1M NaOH. The volume of thewashing reagent used was 20mL each time. Approximately 250 mgof the hair standards were placed with the wash solution in a75mL polyethylene beaker and shaken in a wrist action shaker.The samples washed with detergents were further rinsed withwater to remove sud. Each sample was subdivided and analysed byboth INAA and GFAAS.5.3 Comparison o_£ pre- and post-irradiation washings
The extent of variation caused by different washing methodswas studed by washing the in-house hair standards before andafter irradiations. The hair samples were washed for 5, 10, 15min, 1 and 24 h before the irradiation, and for 1, 3, 5, 15 min,1 and 24 h after the irradiation. Only the nuclides with half-lives greater than 10 h (viz. those of Au, Br, Co, Hg, Na andZn) were measured in post-irradiated and washed samples due tothe time required to process the samples.
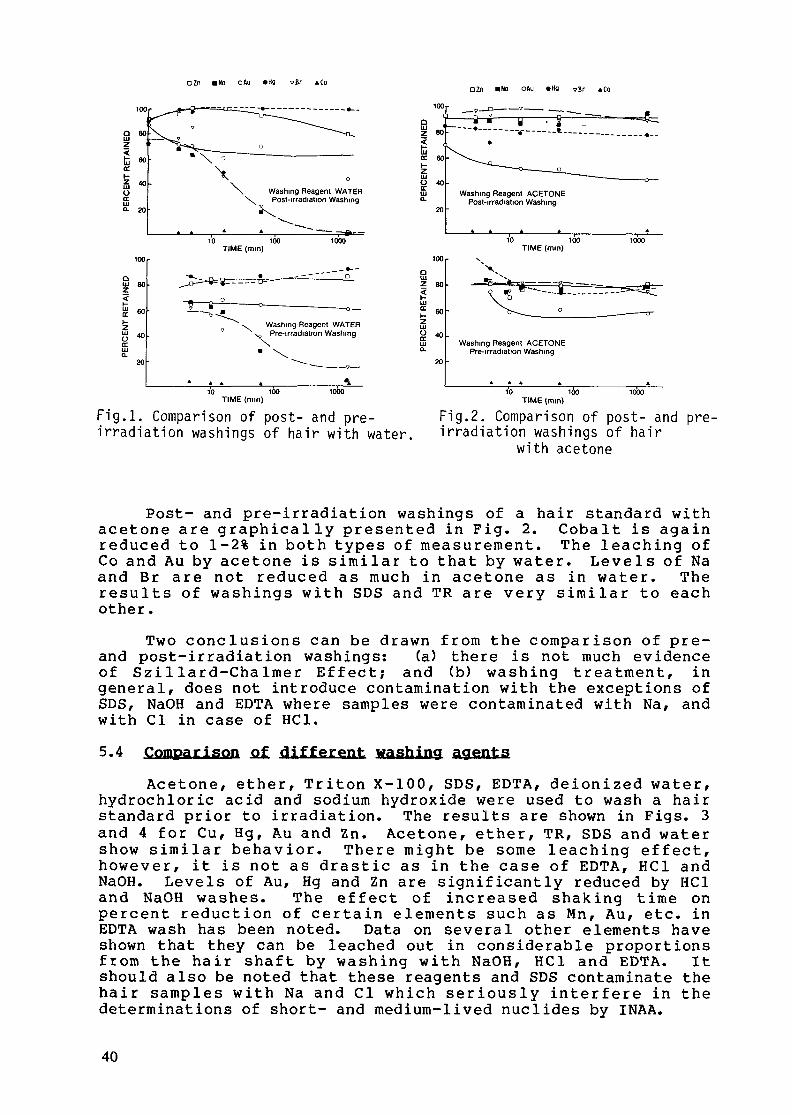
The results for post- and pre-irradiation washings of hairwith water are shown in Fig. 1. Zinc and Hg are not effected bywashing compared to the extent Au, Br, Co and Na are. In post-irradiation washing 80-90% Zn and 80-100% Hg are retained while80-85% Zn and 80-90% Hg are held back in pre-irradiationwashing. Cobalt is reduced to less than 2% in both washings.The degrés of removal of Na and Br depends very much on theshaking time.
39
t: 60
iu *°OocÏ 20
Washing Reagent WATERPost-irradiation Washing
10 100TIME (mm)
1000
>. Washing Reagent WATER^ Pre-irradiation WashingN
TIME (mm)
Fig.l. Comparison of post- and pre-irradiation washings of hair with water,
DZn mua oAu »Hg vBr AGO
QHJ ' ~'z
Washing Reagent ACETONEPost-irradiation Washing
2Z 80
O 40
10 100TIME (mm)
Washing Reagent ACETONEPre-irradiation Washing
10 100TIME (mm)
1000
Fig.2. Comparison of post- and pre-irradiation washings of hairwith acetone
Post- and pre-irradiation washings of a hair standard withacetone are graphically presented in Fig. 2. Cobalt is againreduced to 1-2% in both types of measurement. The leaching ofCo and Au by acetone is similar to that by water. Levels of Naand Br are not reduced as much in acetone as in water. Theresults of washings with SDS and TR are very similar to eachother.
Two conclusions can be drawn from the comparison of pre-and post-irradiation washings: (a) there is not much evidenceof Szillard-Chalmer Effect; and (b) washing treatment, ingeneral, does not introduce contamination with the exceptions ofSDS, NaOH and EDTA where samples were contaminated with Na, andwith Cl in case of HC1.5.4 Comparison of different washing agents
Acetone, ether, Triton X-100, SDS, EDTA, deionized water,hydrochloric acid and sodium hydroxide were used to wash a hairstandard prior to irradiation. The results are shown in Figs. 3and 4 for Cu, Hg, Au and Zn. Acetone, ether, TR, SDS and watershow similar behavior. There might be some leaching effect,however, it is not as drastic as in the case of EDTA, HC1 andNaOH. Levels of Au, Hg and Zn are significantly reduced by HC1and NaOH washes. The effect of increased shaking time onpercent reduction of certain elements such as Mn, Au, etc. inEDTA wash has been noted. Data on several other elements haveshown that they can be leached out in considerable proportionsfrom the hair shaft by washing with NaOH, HC1 and EDTA. Itshould also be noted that these reagents and SDS contaminate thehair samples with Na and Cl which seriously interfere in thedeterminations of short- and medium-lived nuclides by INAA.
40

• tu OH9
ACETONE SOS
10 100 1000 10 100 1000 10 100 1000 Ï O Î O Ô Ï O O OTIME (min)
8 100 **TEH - E?-T* NaOH
IU
à: 20
ïo ïoo ïoôô Ï5 ïïô ï<5x> Ï5 îoo ïoôô îo ïïo îoôbTIME (min)
Fig.3. Effects of different washingagents and time on Cu and Hg contentof hair.
oAu *Zn
10 100 1000Q TIME (min)
Z ,00 *ATEB
g8 -OC 20
TRITON X-100 SDS
.*î-
~ Î O Ï O Ô Ï Ï O O Ï O Ï O Ô Ï Î Ô Ô 10 100 lOOO
EOTA NaOH MCI
10 100 1000TIME (min)
10 100 1000 10 100 1000 10 100 1000
Fig.4. Effects of different washingagents and time on Au and In contentof hair.
It is clear f rom the resul ts obtained in this study thattwo factors are mainly responsible for the leaching of elementsf r o m hair strands, and these are (a) washing agent and (b) timeof contact. In order to get reproducible results , the washingreagen t and contact t ime m u s t be se lected such that theelemental concentration reaches a constant value, i.e. fur therw a s h i n g s shou ld not change the concen t ra t ins of a l l theelements. Since d i f f e r e n t elements are a f f ec t ed by var iousreagents to dif ferent degrees, reproducible multielement hairl eve l s can be ob ta ined by shor t w a s h i n g p e r i o d s w i t h acombination of different reagents. The following combination ofwashing reagents were selected for f u r t h e r studies: (a)acetone, wa te r , water , water , acetone (the IAEA p r o c e d u r e ) ; (b)ether , wate r , acetone (E-W-A) ; (c) Tr i ton X-100, water , water(TR) ; (d) SDS, water , wter (SDS) ; (e) a lcohol , water , hexane (A-
W-H); and (f) alcohol, ether, water (A-E-W).
41
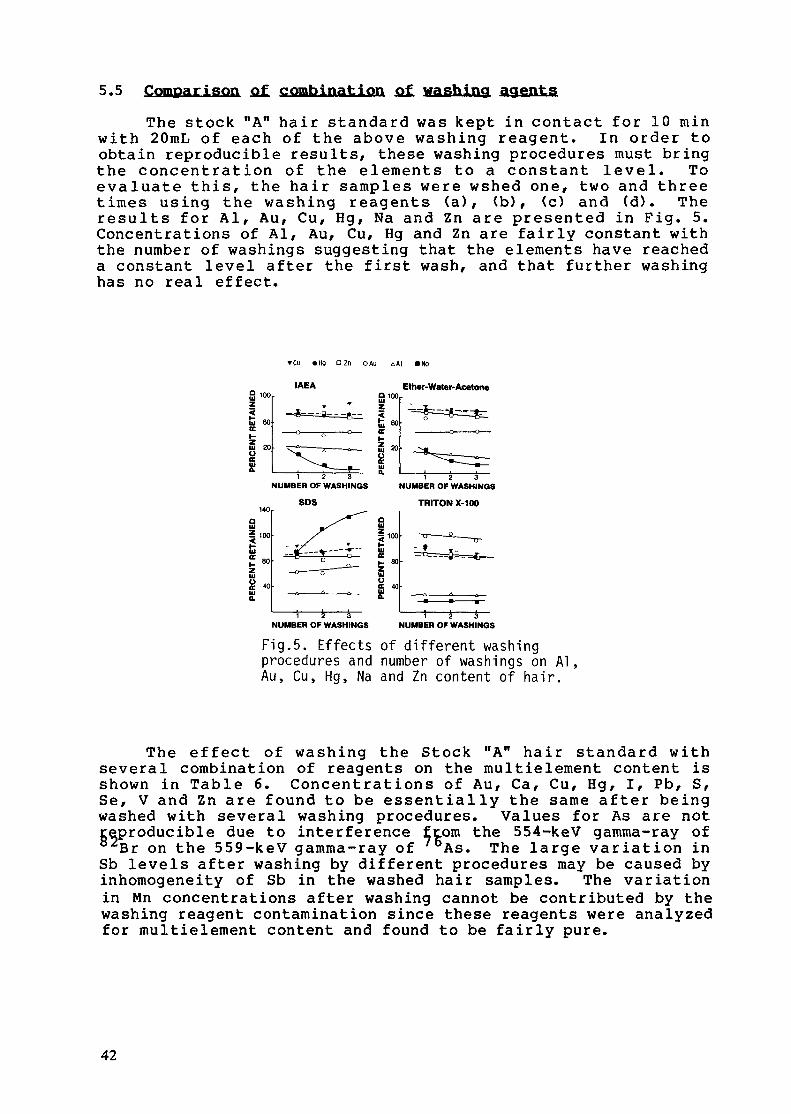
5.5 Comparison of combination of washing agentsThe stock "A" hair standard was kept in contact for 10 min
with 20mL of each of the above washing reagent. In order toobtain reproducible results, these washing procedures must bringthe concentration of the elements to a constant level. Toevaluate this, the hair samples were wshed one, two and threetimes using the washing reagents (a), (b), (c) and (d). Theresults for Al, Au, Cu, Hg, Na and Zn are presented in Fig. 5.Concentrations of Al, Au, Cu, Hg and Zn are fairly constant withthe number of washings suggesting that the elements have reacheda constant level after the first wash, and that further washinghas no real effect.
»Hg OZn oAu C.KI
r IAEA0100
i.IL
Ö2 20
: 100
;
; 80
! 40
-4- 3
Ether-Water-Acetone
1 2 3NUMBER OF WASHINGS
SDS
1 2 3NUMBER OF WASHINGS
TRITON X-100
NUMBER OF WASHINGS
Fig. 5. Effectsprocedures andAu, Cu, Hg, Na
i r 3NUMBER OF WASHINGS
of different washingnumber of washings on Al,and In content of hair.
The e f fec t of washing the Stock "A" hair standard wi thseveral combination of reagents on the multielement content isshown in Table 6. Concentrat ions of Au, Ça, Cu, Hg, I, Pb, S,Se, V and Zn are found to be essentially the same a f t e r beingwashed with several washing procedures. Values for As are notreproducible due to interference Çtoro the 554-keV gamma-ray of82Br on the 559-keV gamma-ray of As. The large var ia t ion inSb levels after washing by different procedures may be caused byinhomogeneity of Sb in the washed hair samples. The variationin Mn concentrations after washing cannot be contributed by thewashing reagent contamination since these reagents were analyzedfor multielement content and found to be fair ly pure.
42

Table 6. COMPARISON OF DIFFERENT WASHING METHODS USING STOCK "A" HAIR STANDARD
Element
AlAsAuBrCaClCoCuHgIMnNa
"èS*SbSeVZn
Unwashed
23.8±2.60.276±0.015O.OlStO.OOl14.7tO.7720081543251156. 70H.6421.411.352.3610.190.2710.0360.9810.08156164.9410.394.4310.20.30210.091.2110.150.1710.0122015.6
IAEA
9.3410.290.03110.010.00910.00016.6310.581715163155170.12810.0219.9311.062.3710.190.2610.0371.2910.124417.80.37510.044.3210.180.2610.111.0310.230.11510.0220917.3
Content"SDS
6.2110.730.04410.020.008010.00015.4810.3415321491411300. 1110. 0120.612.62.3210.220.26410.031.7610.031661160.43610.044.510.130.2310.111.0810.200.08010.01319715.3
TRITON-X
7.8010.830.02010.010.009810.00155.2410.3315751551241230.11910.0422.2411.92.2110.200.28710.0182.7010.4028.712.10.40710.044.4810.090.07810.020.9810.230.1010.01720713.3
E-H-A
6.9910.750.07210.020.009610.0039.1310.3216681362001180.12710.00321.512.752.4010.220.25210.041.8010.5466160.48910.054.4510.240.2610.111.0110.130.11010.00621719.2
All values are in ppm except otherwise noted} average of six determinations.6in%
5.6 Effect of changing the order of reagents in a. washingprocedure
Hair strands, when washed with water, are known to swell toa certain degree. This swell ing might a f fec t the rate ofremoval of contaminants during the washing process. In order toevaluate this ef fec t , hair samples were washed wi th the E-W-Aprocedure according to the following scheme: (i) ether-water-acetone; (ii) ether-acetone-water? and ( i i i) water-ether-acetone. The results reveal that there is no difference in theelemental content (with the exception of Mn) of the hairstandard no mat ter which order is used as long as the samereagents and contact times are involved. It can the re fore beconcluded that swell ing of hair by water does not a f f ec t thecontamination removal efficiency of the washing procedure.
5.7 Comparison of hair-wash solution shaking techniques
In the past, hair samples were generally washed using wristaction shakers. With the avai labi l i ty of ul t rasonic baths, afew w o r k e r s have used them possibly th ink ing that these bathsmay be superior to wris t action shakers in removing looselyattached dust particles in hair strands.
The effect of different shaking techniques on the efficacyof a g iven washing procedure was evaluated in this study.Samples of the Stock "A" hair standard were washed by the IAEAwashing procedure using a wrist action shaker and an ultrasonicbath, and then the mul t ie lement content of the samples weredetermined using the INAA and GFAAS methods. The results arepresen ted in Table 7. E s s e n t i a l l y the same e l e m e n t a lconcentrations were obtained using the two shaking techniques.
43

Table 7. COMPARISON OP TWO WASHING TECHNIQUES USING THE STOCK "A" HAIRSTANDARD AND IAEA HASHING METHOD
Element
AlAsAuBrCaCuHgIMnNaP£Sb
SbSeVZn
Unwashed
23.812.60.276±0.0150.015*0.00114.7*0.772008±5421.4tl.352.36±0.190.27*0.0360.98*0.08156164.9410.394.43*0.200.302*0.091.21 ±0.150.17*0.01220*5.6
Ultrasonic
12.5*1.60.035*0.010.012*0.0027.37*0.791787*4121.7*1.632.0010.140.2810.0163.17*0.1244.2*3.450.377*0.044.3610.970.11710.0031.1410.240.11610.006203*5.7
WristAction
9.3410.290.031*0.010.009*0.0016.63*0.581715*6319.9311.062.3710.190.26*0.0370.29*0.1243.9*7.80.37510.044.3210.840.26*0.111.03*0.230.11510.0220917.3
Identical shaking time used; average of sic determinations.
Exceptions to this conclusion were Al, Mn and Sb, of which thevariations in Mn and Sb have been described above. The reasonfor the d i f f e r e n c e in Al levels is not clear at this stage.
5.8 Effect af shampoo on trace element content fif
The object ive of this study was to compare some of thewashing methods for removing exogenous contaminants deposted onhair strands by the usage of shampoo. Preliminary results werepresented in the f i r s t research progress report (13) and in athesis (14). Trace element concentrations of 23 commonly usedshampoos were determined by INAA. The "Head & Shoulders" and"Dan Gard" shampoos were found to contain 3.9 and 1.1 mgZn/g ,and "Selsun Blue" had 3.9 mgSe/g of shampoo. Detai led studieson the e f f ec t of these shampoos on the hair Zn and Se content,and the e f f i c i e n c y of the washing methods to remove them f r o mhair were carried out. Results obtained are br ief ly describedbelow.
Five percent solutions of the "Head & Shoulders", "DanGard", "Selsun Blue" and "Old Spice" (which has a very low metalc o n t e n t ) shampoos w e r e p r e p a r e d . Each h a i r s amp le wasseparately dipped in a shampoo solution (lOmL) for 10 min. Thesamples were f i l tered and washed with deionized water until theyw e r e f r e e f r o m suds. These exposed samples were then washedwith various washing procedures and analyzed by INAA.
The h a i r sample t r e a t e d w i t h "Se lsun B lue" had 183%increased Se content. After washing it with various washprocedures , the Se content was not reduced to that of theuntrea ted level and remained high. It appears that Se f rom"Selsun Blue" is i r r eve r s ib ly adsorbed on the hair strand andcannot be completely removed by any of the washing proceduresused in this study.
44

The Zn concentration of the hair sample dipped in 5% "Head& Shoulders" shampoo solution increased, slightly by 22%, afterrinsing with water. Only when the samples were washed with SDS,the Zn levels were reduced back to those of the untreatedsamples. The IAEA washing procedure gave a 13% increase in Znlevels.
In order to evaluate the e f f i c i ency of the IAEA and SDSwashing p rocedures for removing Cu, Hg and Zn, 50 yg/mL ofthese elements were added to a 5% solution of the "Old Spice"shampoo. The standard hair samples were dipped in this solutionfor 10 min , and then r insed wi th water to remove suds pr ior towashing them by the IAEA and SDS procedures . The added Cu andZn were completely removed by both the above procedures.However , Hg could not be removed by either of the washingprocedures.
It can be concluded f r o m the above resu l t s that most of theelements exogenously deposited by shampoos can be quantitativelyremoved by both the IAEA and SDS washing procedures w i th theexceptions of Se and Hg. Ex t reme caut ion must be exercised inin terpre t ing hair Se levels where a person uses Se-containingshampoo; however , this is not a ser ious handicap since suchpersons can be easily identified by f i l l ing up a well-designedquestionnaire. Although it appears that Hg can be irreversiblyadsorbed by keratin, no shampoo containing detectable amounts ofHg has yet been found indicating that the increase in hair Hglevels from the usage of shampoo is highly unlikely. However,the s i tuat ion could be qui te d i f f e r e n t where a person isoccupationally exposed to high atmospheric Hg levels.
6. APPLICATION OF HAIR TRACE ELEMENT DATA
A number of hai r samples w e r e ana lyzed by INAA over thelast few years for a number of purposes. The applicationsinclude env i ronmenta l and occupat ional exposures, suspectedpoisoning cases, hai r disease, and basel ine level studies. Acouple of applications are described below.
Scalp hair samples f r o m the residents of W a v e r l e y , NovaScot ia , C a n a d a , w e r e a n a l y z e d f o r A s l e v e l s i n a nepidemiological survey. Samples of water from several wells inthe Waverley area were found to contain high amounts of As whichmight have come from the leaching of arsenopyrite ores. Hair Asconcentrations were determined by INAA in an attempt to measurethe body burden of As arising from dr inking As-contaminated wellwater . The resul ts of this survey are shown in Table 8.Approximately 58% of the individuals tested had more than 1 ppmand about 37% had more than 2 ppm As in hair . It appears thateven m o d e s t e l e v a t i o n s in h a i r As o v e r 1 ppm can causeelectromyographic abnormalities. Intakes of As estimated fromthe concentration of contaminated well water suggested that a 1g accumula t i ve As intake wou ld lead to a 2 ppm hair As level .(Ref. 64 in Ref. 15).
45

Table 8. ARSENIC CONTENT OF HAIR FROM WAVERLEY,NOVA SCOTIA RESIDENTS
Table 9. COMPARISON OF ELEMENTAL CONTENT OF NORMAL ANDSULFUR-DEFICIENT HAIR (TRICHOTHIODYSTROPHY)
Range,
>0.5 -1.0 -1.5 -2.0 -2.5 -3.0 -3.5 -4.0 -4.5 -5.0 -5.5 -6.0 -
>
ppm
0.51.01.52.02.53.03.54.04.55.05.56.06.56.5
Distribution, %
33.38.348.34
12.512.54.17004.178.34004.174.17
Element
AgAlA3AuBaBrCa t*Cl6CoCrCuFeHgIKLaMgMnNa&Rb
- S*SbScSeZn
Normal Hair
1.2320.621.259.417.5L901.090.080.401674540.280.2634600.073522.90.3013.33.460.250.0230.1595
Content"Sulfur-deficient
Hair
0.3510.650.514.923.45100.8130.210.75138530.250.2826200.0782152.00.3431.61.290.120.00980.2198
All concentrations are in ppra except those of Cl, Na and S.Concentrations are expressed in percentages.
Trichothiodystrophy, or sulphur-deficient britt le hair, wassuggested (16) as a c l in ical m a r k e r for a "neuroec todermalsymptom complex that u s u a l l y f ea tu r e s mental and physicalre tarda t ion and may also include nai l dystrophy, l amel l a richthyosis, ocular displasia, dental caries, and decreasedfertility". Hair samples from a normal boy and a patient of thesame age suffer ing f rom trichothiodystrophy (both are from thesame t o w n ) w e r e a n a l y z e d f o r t r a c e e l e m e n t s (Tab le 9 ) .Concentrations of several elements including Ca, Cu, Fe, Mg andS were found to d i f fe r significantly in these two hair samples.A m i n o acid a n a l y s e s o f h a i r and f i n g e r n a i l s a l so showedconsiderable differences (16).
7. ELEMENTAL CONTENT OF LONGITUDINAL SECTIONS OF HAIR STRANDS
Since scalp hair is a progressively growing tissue and thegrowth rate is f a i r l y constant at about 1.1±0.2 cm per month(17), sectioning of hair strands prior to analysis can provideinformat ion on the var ia t ion in body metal content over theperiod of time encompassed by the entire hair length, typically16-18 months. It has also been suggested that sweat cantranslocate elements from root to the distal end along the hairshaft. In order to examine the fate of trace elements along theshaft, a hair sample was cut into 4 cm sections and analyzed byINAA. The results are presented in Table 10. Several t rendscan be identified. Further research in this area is being done.
46
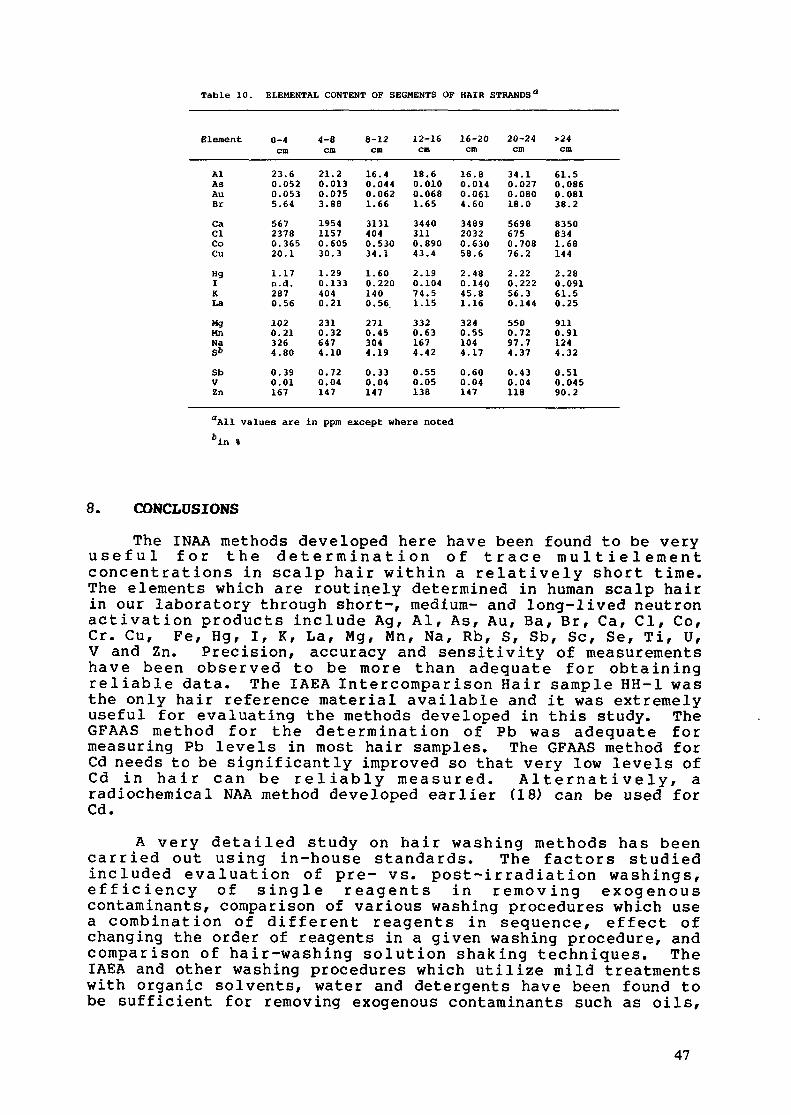
Table 10. ELEMENTAL CONTENT OF SEGMENTS OF HAIR STRANDS"
Element
AlAsAuBrCaClCoCuHgIKLaMgMnNaSb
SbVZn
0-4cm
23.60.0520.0535.6456723780.36520.11.17n.d.2870.561020.213264.800.390.01167
4-8cm
21.20.0130.0753.88195411570.60530.31.290.1334040.212310.326474.100.720.04147
8-12cm
16.40.0440.0621.6631314040.53034.11.600.2201400.56.2710.453044.190.330.04147
12-16cm
18.60.0100.0681.6534403110.89043.42.190.10474.51.153320.631674.420.550.05138
16-20cm
16.80.0140.0614.60348920320.63058.62.480.14045.81.163240.551044.170.600.04147
20-24cm
34.10.0270.08018.056986750.70876.22.220.22256.30.1445500.7297.74.370.430.04118
>24cm
61.50.0860.08138.283508341.681442.280.09161.50.259110.911244.320.510.04590.2
aAll values are in ppra except where noted
8. CONCLUSIONS
The INAA methods developed here have been found to be veryuseful for the determination of trace multielementconcentrations in scalp hair within a relatively short time.The elements which are routinely determined in human scalp hairin our laboratory through short-, medium- and long-lived neutronactivation products include Ag, Al, As, Au, Ba, Br, Ca, Cl, Co,Cr. Cu, Fe, Hg, I, K, La, Mg, Mn, Na, Rb, S, Sb, Se, Se, Ti, U,V and Zn. Precision, accuracy and sensitivity of measurementshave been observed to be more than adequate for obtainingreliable data. The IAEA Intercomparison Hair sample HH-1 wasthe only hair reference material available and it was extremelyuseful for evaluating the methods developed in this study. TheGFAAS method for the determination of Pb was adequate formeasuring Pb levels in most hair samples. The GFAAS method forCd needs to be significantly improved so that very low levels ofCd in hair can be reliably measured. Alternatively, aradiochemical NAA method developed earlier (18) can be used forCd.
A very detailed study on hair washing methods has beencarried out using in-house standards. The factors studiedincluded evaluation of pre- vs. post-irradiation washings,efficiency of single reagents in removing exogenouscontaminants, comparison of various washing procedures which usea combination of different reagents in sequence, effect ofchanging the order of reagents in a given washing procedure, andcomparison of hair-washing solution shaking techniques. TheIAEA and other washing procedures which utilize mild treatmentswith organic solvents, water and detergents have been found tobe sufficient for removing exogenous contaminants such as oils,
47

laquers, loose dust particles, etc. More severe treatments withEDTA, NaOH and HC1 have been observed to leach significantamounts of trace elements from hair with increasing times aswell as number of washings. The effect of usage certainmedicated shampoos containing large quantities of Se and Zn hasbeen investigated. Most of the elements exogenously deposted byshampoos can be quantitatively removed by the IAEA and SDSwashing procedures with the exception of Se. It has also beenobserved that externally applied Hg cannot be removed from hairby any of the available washng procedures.
A study on the variation of trace element content along thelongitudinal sections of hair strands has shown some interestingtrends. Further research needs to be done in this area. Wehave applied hair trace element data to few areas and foundscalp hair to be a useful screening tissue for assessingcommunity exposure to environmental inorganic pollutants.
9. FUTURE RESEARCH
Our future work on hair will include (a) study on dose-response relationship using animal models and/or autopsysamples; (b) refinement of the GFAAS method for Cd and Ni; and(c) completion of a book on hair trace elements. Other on-goingresearch projects of environmental health interest in ourlaboratory include (a) studies on leaching of sewage sludge; (b)transfer of pollutants among the different environmentalcompartments; (c) protein-bound trace elements in biomédicalsamples; (d) occupational health parameters; (e) speciation ofradionuclides; and (f) quality of drinking water with respect totrace toxic elements and their species.
This research was financially supported by a research operatinggrant from the Natural Sciences and Engineering Research Councilof Canada.
REFERENCES
HOPPS, H. C.: The biological bases for using hair and nailfor analysis of trace elements. Sei. Total Environ. 7(1977) 71-89.TOUT, R. E., CHATT, A.: A critical evaluation of short-lived and long-lived neutron activation products for traceelement determinations. Anal. Chim. Acta, 118 (1980) 341-358.DESILVA, K. N., CHATT, A.: A method to improve precisionand detection limits for measuring trace elements throughshort-lived nuclides. J. Trace & Microprobe Tech., 1 (1983)307-337.DESILVA, K. N.: A correction method for coincidence lossesin neutron activation analysis with short-lived nuclides.Ph.D. Thesis, Dalhousie University, Halifax, N.S., Canada,(1981) 1-224.
48
5. CHATT f A.r DESILVA, K. N., HOLZBECHER, J., STUART, D. C.fTOUT, R. E. f R Y A N , D. E. : Cyc l i c n e u t r o n a c t i v a t i o nanalysis of biological and me ta l lu rg i ca l samples. Can. J.Chem., 59 (1981) 1660-1664.
6. CHATT, A, DESILVA, K. N., TOUT, R. E.: Cyclic ins t rumenta lneu t ron act ivat ion analysis of trace elements. Proc. 1st.A n n u a l C o n f e r e n c e o f C a n a d i a n N u c l e a r Socie ty , W.Paskievici, Ed., l (1980) 337-343.
7. TOUT, R. E., CHATT, A.: The e f fec t of sample m a t r i x onselection of optimum timing parameters in cyclic neut ronactivation analysis. Anal. Chim. Acta, 133 (1981) 409-419.
8. DESILVA, K. N., CHATT, A.: Development of a method tocorrect for coincidence losses in high count rate gamma-rayspectrometry. Proc. 2nd. Annual Conference of CanadianNuclear Society, 2 (1981) 328-334.
9. M ' B a k u , S. B., PARR, R. M.: Inter laboratory study of t raceand other elements in the IAEA Powdered Human Hair ReferenceMaterial, HH-1. J. Radioanal. Chem., 69 (1982) 171-180.
10. C U R R I E , L. A.: L i m i t s for q u a l i t a t i v e de tec t ion andquantitative determination: Application to radiochemistry.Anal. Chem., 40 (1968) 586-593.
11. R Y A B U K H I N , Yu. S.: Act ivat ion analysis of ha i r as anindicator of contamination of man by env i ronmenta l traceelement pollutants. In ternat ional Atomic Energy Agency,Vienna, Austria, IAEA/RL/50 (1978) 1-134.
12. SAJJAD, M., CHATT, A.: Sorption and desorption behaviour ofexogenous contaminants onto human scalp hair . Sei. TotalEnviron., submitted.
13. CHATT, A., DESILVA, K. N., ROBICHEAU, M. L., SECORD, C. A.:H u m a n s c a l p h a i r a s a n e p i d e m i o l o g i c m o n i t o r o fenvironmental exposure to elemental pollutants. ResearchP r o g r e s s Repor t f o r t h e F i r s t R e s e a r c h C o - o r d i n a t i o nMeet ing, Co-ordinated Research Programme on the Nuc lea rMethods for Hea l th Related Moni to r ing of Trace ElementPollutants (IAEA), Namur, Belgium, (1981) 1-16.
14. ROBICHEAU, M. L.: Determinat ion of selenium in ha i r andshampoo by neutron activation analysis. B.Sc. Thesis,Dalhousie University, Halifax, N.S. , v^anada, (1981) 1-29.
15. CHATT, A., SECORD, C. A., TIEFENBACH, B., JERVIS, R. E.:Scalp h a i r as a m o n i t o r of c o m m u n i t y e x p o s u r e toenvironmental pollutants, in Hair, Trace Elements and HumanI l l ne s , A. C. B r o w n and R. G. C r o u n s e , Eds . , P r a e g e rScientific, NY, USA, (1980) 46-73.
16. PRICE, V. H., O D O M , R. B., WARD, W. H., JONES, F. T.:Trichothiodystrophy. Arch. Dermatol., 116 (1980) 1375-1384.
17. SAITOH, M., U Z U K A , M., S A K A M O T O , M., K O B O R I , T. : inAdvances in Biology of Skin, 5 (1967) 183- .
18. J E R V I S , R. E., T I E F E N B A C H , B., CHATTOPADHYAY, A.:Determinat ion of trace cadmium in biological mater ia l s byneut ron and photon activation analyses. Can. J. Chem., 52(1974) 3008-3020.
49

HAIR AND NAILS AS MONITORS OF EXTERNALTRACE ELEMENT BURDENS
Chief InvestigatorH.A. DASNetherlands Energy Research Foundation (ECN),Petten, Netherlands
The work done under this contract is described in detail intechnical reports already published by ECN. Only the titles andabstracts are reproduced below.
The full length report is available directly from Dr. H.A. Das.
(I) Instrumental Neutron Activation Analysis ofHuman Hair and Related Radiotracer Experiments onWashing and Leaching
H. A Das*, M. Dejkumhang***, R.M.F. Herber**,D. Hoede*, H.A. Van der Sloot*
* Netherlands Energy Research Foundation,Petten
** Coronel Laboratory of the University of Amsterdam,Amsterdam, Netherlands
*** On leave from the Office of Atomic Energy for Peace,Bangkok, Thailand
AbstractThis text summarizes the work done under the IAEA-contract 2440/RB.
- The aim was to develop a fast and reliable system for thedetermination of trace elements in human head hair by instrumentalneutron activation analysis (INAA) and radiotracer washingexperiments.
- The standardized procedure for INAA was applied to hair samplescollected by the Coronel Laboratory of the University of Amsterdam.The correlation between trace element contents is considered.
CONCLUSIONThe elements N, Na, P, Cl, K, Cr, to, Fe, Co, Cu, Zn, As, Br, Ag,Sb, I, La, Eu, Au and Hg may be determined by INAA.The routine programme based on simultaneous irradiation of manysamples for 12 h at a flux density of S'lO- cmT s"-'- yields Na,Cr, Fe, Co, Cu, Zn, Br, Ag, Sb, La, Au and Hg.
- The elements Na, K and Br are easily washed out. They should beavoided if INAA is to be applied as a tool for discrimination. Theymay, however, be used to characterize the sample by their elution-curves.
- The most promising elements for discrimination seem to be Fe, Co,Ag, Cd and Au.
- There exists a similarity between the elution of trace elements fromhair and nails.(ECN-107, 1981)
51
(II) Determination of Arsenic, Selenium and Antimony byNeutron Activation Analysis.Application to Hair Samples
H.A. Das, D. Hoede, B.J.T. Nieuwendijk, H.A. Van der Sloot,G.J.A. Teunissen, J.R.W. Woittiez
Netherlands Energy Research Foundation,Petten,
Netherlands
Abstract
A fast rabbit system for instrumental activation analysis withreactor neutrons is described. Its use in the determination ofselenium in hair is discussed.A survey is given of the correction factors which are inherent tothe use of short-lived radionuclides.An alternative to INAA is NAA based on the separation of arsenic,selenium and antimony by hydride evaporation and absorption onactive carbon.Data for some Standard Reference Materials are given.This work was done under research contract 2440/RI/RB with the IAEA.
(ECN-131, 1983)
52
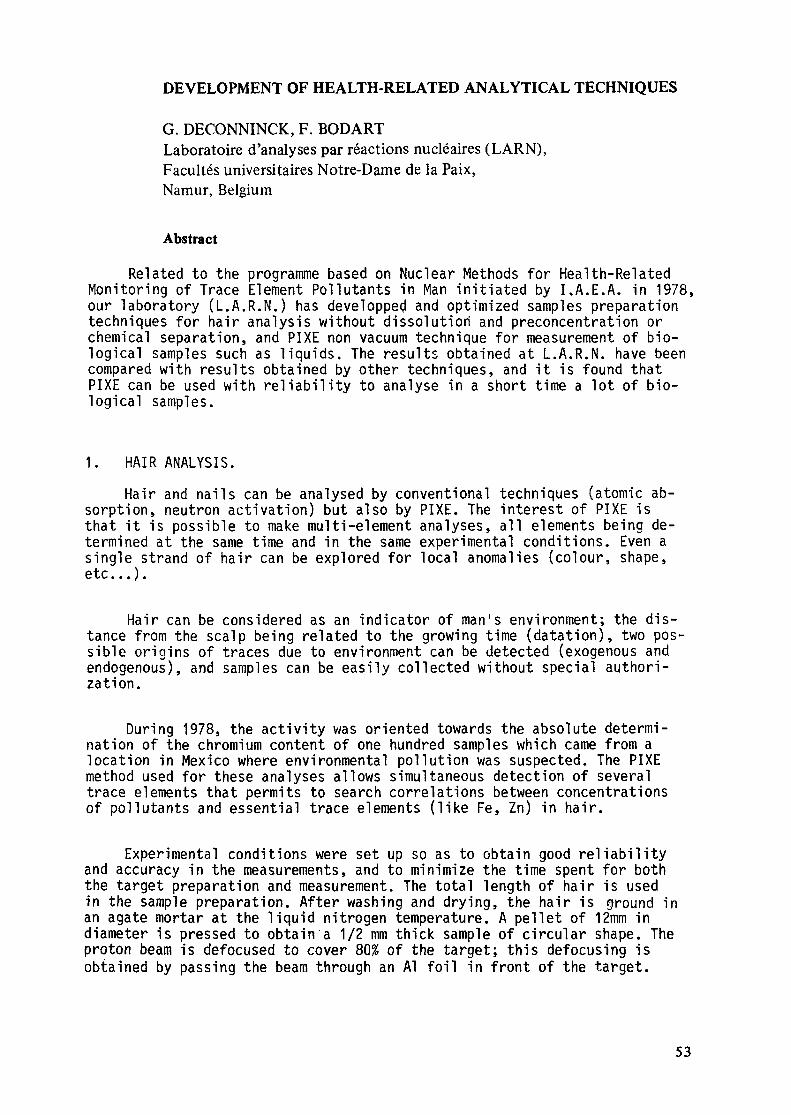
DEVELOPMENT OF HEALTH-RELATED ANALYTICAL TECHNIQUES
G. DECONNINCK, F. BODARTLaboratoire d'analyses par réactions nucléaires (LARN),Facultés universitaires Notre-Dame de la Paix,Namur, Belgium
Abstract
Related to the programme based on Nuclear Methods for Health-RelatedMonitoring of Trace Element Pollutants in Man initiated by I.A.E.A. in 1978,our laboratory (L.A.R.N.) has developped and optimized samples preparationtechniques for hair analysis without dissolution and preconcentration orchemical separation, and PIXE non vacuum technique for measurement of bio-logical samples such as liquids. The results obtained at L.A.R.N. have beencompared with results obtained by other techniques, and it is found thatPIXE can be used with reliability to analyse in a short time a lot of bio-logical samples.
1. HAIR ANALYSIS.Hair and nails can be analysed by conventional techniques (atomic ab-sorption, neutron activation) but also by PIXE. The interest of PIXE is
that it is possible to make multi-element analyses, all elements being de-termined at the same time and in the same experimental conditions. Even asingle strand of hair can be explored for local anomalies (colour, shape,etc.. J.
Hair can be considered as an indicator of man's environment; the dis-tance from the scalp being related to the growing time (datation), two pos-sible origins of traces due to environment can be detected (exogenous andendogenous), and samples can be easily collected without special authori-zation.
During 1978, the activity was oriented towards the absolute determi-nation of the chromium content of one hundred samples which came from alocation in Mexico where environmental pollution was suspected. The PIXEmethod used for these analyses allows simultaneous detection of severaltrace elements that permits to search correlations between concentrationsof pollutants and essential trace elements (like Fe, Zn) in hair.
Experimental conditions were set up so as to obtain good reliabilityand accuracy in the measurements, and to minimize the time spent for boththe target preparation and measurement. The total length of hair is usedin the sample preparation. After washing and drying, the hair is ground inan agate mortar at the liquid nitrogen temperature. A pellet of 12mm indiameter is pressed to obtain a 1/2 mm thick sample of circular shape. Theproton beam is defocused to cover 80% of the target; this defocusing isobtained by passing the beam through an Al foil in front of the target.
53
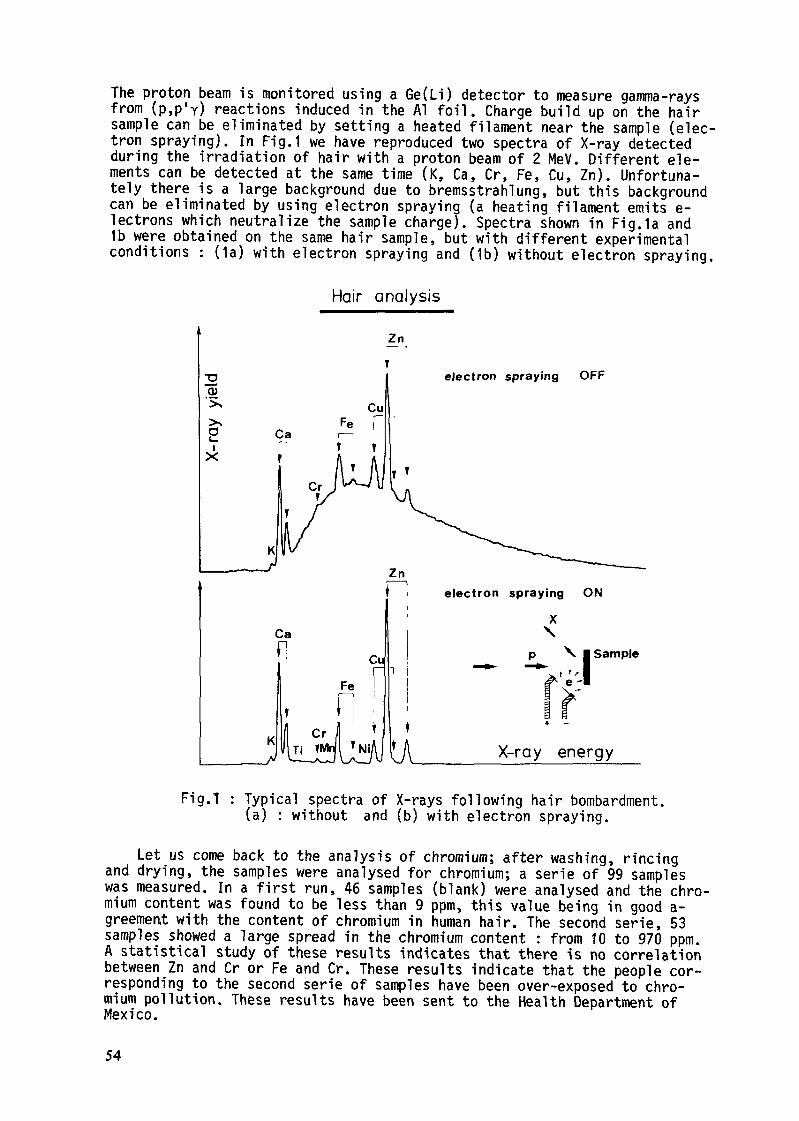
The proton beam is monitored using a Ge(Li) detector to measure gamma-raysfrom (p.p'y) reactions induced in the Al foil. Charge build up on the hairsample can be eliminated by setting a heated filament near the sample (elec-tron spraying). In Fig.1 we have reproduced two spectra of X-ray detectedduring the irradiation of hair with a proton beam of 2 MeV. Different ele-ments can be detected at the same time (K, Ca, Cr, Fe, Cu, Zn). Unfortuna-tely there is a large background due to bremsstrahlung, but this backgroundcan be eliminated by using electron spraying (a heating filament emits e-lectrons which neutralize the sample charge). Spectra shown in Fig.la and1b were obtained on the same hair sample, but with different experimentalconditions : (1a) with electron spraying and (1b) without electron spraying.
Hair analysisZn
electron spraying OFF
electron spraying ON
p \ • Sample
X-ray energy
Fig.T : Typical spectra of X-rays following hair bombardment,(a) : without and (b) with electron spraying.
Let us come back to the analysis of chromium; after washing, rincingand drying, the samples were analysed for chromium; a série of 99 sampleswas measured. In a first run, 46 samples (blank) were analysed and the chro-mium content was found to be less than 9 ppm, this value being in good a-greemeat with the content of chromium in human hair. The second série, 53samples showed a large spread in the chromium content : from 10 to 970 ppm.A statistical study of these results indicates that there is no correlationbetween Zn and Cr or Fe and Cr. These results indicate that the people cor-responding to the second série of samples have been over-exposed to chro-mium pollution. These results have been sent to the Health Department ofMexico.
54
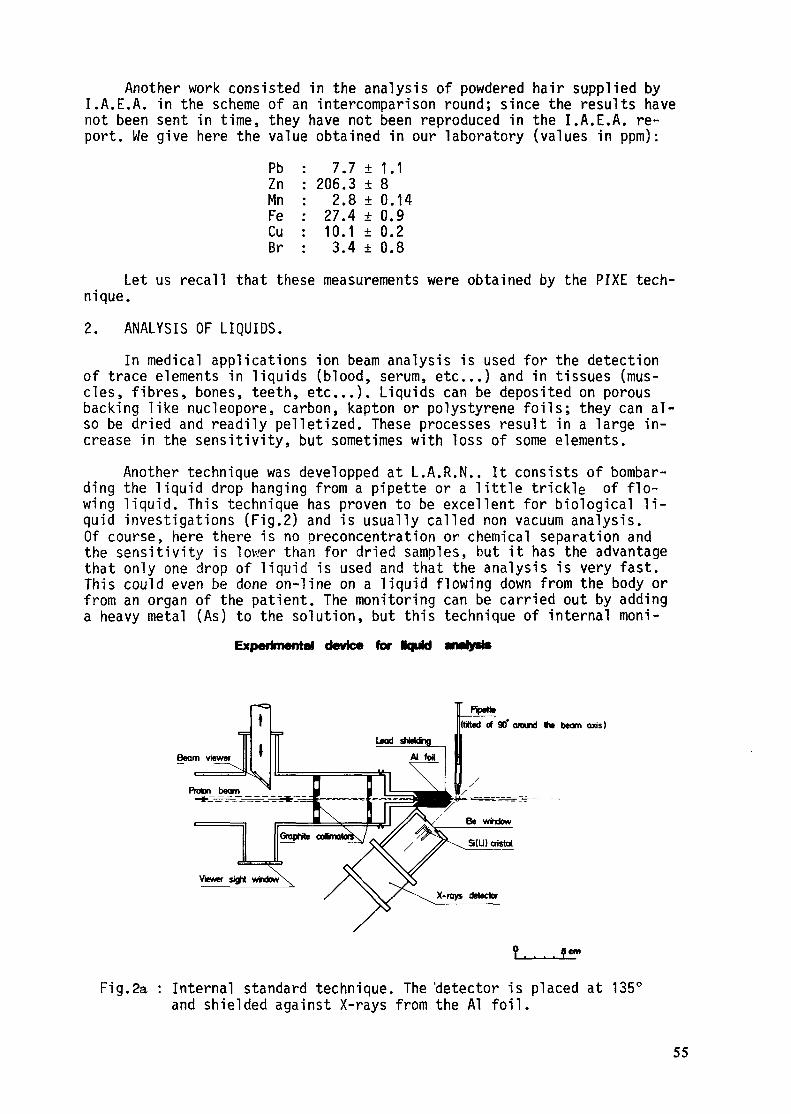
Another work consisted in the analysis of powdered hair supplied byI.A.E.A. in the scheme of an intercomparison round; since the results havenot been sent in time, they have not been reproduced in the I.A.E.A. re-port. We give here the value obtained in our laboratory (values in ppm):
PbZnMnFeCuBr
7.7 ±2062.827.410
3 ±
1 ±
1.180.140.90.2
3.4 ± 0.8Let us recall that these measurements were obtained by the PIXE tech-
nique.2. ANALYSIS OF LIQUIDS.
In medical applications ion beam analysis is used for the detectionof trace elements in liquids (blood, serum, etc...) and in tissues (mus-cles, fibres, bones, teeth, etc...). Liquids can be deposited on porousbacking like nucleopore, carbon, kapton or polystyrene foils; they can al-so be dried and readily pelletized. These processes result in a large in-crease in the sensitivity, but sometimes with loss of some elements.
Another technique was developped at L.A.R.N.. It consists of bombar-ding the liquid drop hanging from a pipette or a little trickle of flo-wing liquid. This technique has proven to be excellent for biological li-quid investigations (Fig.2) and is usually called non vacuum analysis.Of course, here there is no preconcentration or chemical separation andthe sensitivity is lower than for dried samples, but it has the advantagethat only one drop of liquid is used and that the analysis is very fast.This could even be done on-line on a liquid flowing down from the body orfrom an organ of the patient. The monitoring can be carried out by addinga heavy metal (As) to the solution, but this technique of internal moni-
Experimental device for Iquid analyct*
Beam viewer
Pip««»Mtod ft 90* around tw beam axis)
Fig.2a : Internal standard technique. The 'detector is placed at 135'and shielded against X-rays from the Al foil.
55

Experimental device for non vacuum analysis
Sample position
Fig.2b : External standard technique. Measurements are normalized on theradiation emitted by Argon of the air.
a) X-ray spectrum from plasmatic albuminCu
Cu 19 ppmNi <1 ppmFe <1 ppmZn <1 ppm
X-ray <n«gy!k<VI
b)X-ray spectrum from placental albuminCu
Cu 9 ppmFe 2 ppmNi 15 ppmZn < I ppm
X-rajr
Fig.3 :Single drop spectraof two different al-bumins. The quantita-tive determinationswere made by the ad-dition of a smallquantity of As solu-tion. The bremsstrah-lung amplitude alsoprovides a good refe-rence.
56

toring can be replaced by a simpler one which consists in counting X-raysfrom the beam exit window (a melt foil) or sometimes X-rays from the Ar-gon present in air between the window and the sample. This technique hasbeen widely used at L.A.R.N. for the analysis of a number of liquids.Measurements are rapid and can be repeated on a large number of samples.150 albumins from placental and plasmatic origins were analysed in this way(Fig.3). This work was undertaken since these albumins are used in thetreatment of cancer; -albumin is a protein component of human serum playingthe role of keeping the blood volume constant and maintaining the osmoticpressure in the blood vessels. This is why heavy elements present in albu-min are of great importance; as seen above, they can modify the osmotic ca-pability of the membranes. The results obtained at L.A.R.N. have been com-pared with the results from Atomic Absorption measurements and the techni-que is found to be extremely reliable.
CONCLUSIONS.In conclusion, the programme initiated by I.A.E.A. on Nuclear Methods
for Health-Related Monitoring of Trace Element Pollutants has stimulatedthe activity in this field and has allowed our laboratory to develop someaspects of this technique.REFERENCES.1. G.DECONNINCK, F.BODART and E.DEMOULIN. "Comparison between PIXE and
Flame Spectroscopy for trace analysis in human albumins". Nuclear Ins-truments and Methods, 181 (1981), 259-261.
2. G.DECONNINCK. "The use of ion beam analysis in biological sciences".Nuclear Instruments and Methods, 191 (1981), 543-550.3. F.BODART, G.DECONNINCK and J.MENGEOT. "C/N ratio determination in bio-
logical samples by deuteron induced nuclear reactions". InternationalSymposium on nuclear activation techniques in the life sciences, Vienna,IAEA-SM 227/98 (1978).
4. G.DECONNINCK, F.BODART. "New developments in non vacuum analysis".Nuclear Instruments and Methods, 149, (1978), 609-614.
57

CONCENTRATIONS OF HEAVY METALS IN HUMAN BLOOD INRELATION TO THEIR RESPECTIVE ATMOSPHERIC LEVELS
H. GHAFOURIAN, H. RAHIMI, I. BAYATK. SHANISAVANDI, P. NEJAD-TOLAMINuclear Research Centre,Atomic Energy Organization of Iran,Teheran, Iran
Abstract
Air samples from five different monitoring stations around the cityof Teheran were collected at different seasons, time (day and night) andunder different weather conditions (clear or rainy days). The mainelements measured in this work were Pb, Cr, Se, As, Mn and Sb.
Air and blood samples from the non-polluted city of Manjil werecompared with those of Teheran. 300 blood samples from Teheran and 30samples from Manjil were studied.1. INTRODUCTION
If heavy metals such as Pb, Cd, Hg and As enter into theenvironment, severe health effects can occur when the concentrations aremore than the permitted levels advised by pathologists (1). In general,every poisonous material entering the body is taken up by tissues whichhave similar chemical properties.
The following steps are of interest with respect to poison enteringthe body.1. Exposure and penetration.2. Distribution and translocation.3. Biotransformation and metabolism.4. Deposition and metabolism.5. Excretion and elimination.
The absorbed foreign material is transported to different tissues,mainly bones, lipids and brain, and then deposited there (2).
Lead is one of the main toxic elements which enters into theenvironment by means of combustion of fuel from motor vehicles. Byinhalation, consumption of food or drinking water, or even in some casesby absorption through the skin, it finally finds its way into the blood.
About 95% of the absorbed lead is bound to haemoglobin, a small partis bound to plasma proteins, and the rest is thought to be deposited inother parts of the body (3).
There have been many investigations concerning lead and therelationship between its levels in blood and the environment. In 1976,Goldsmith and Hexter (4) established a relationship between lead in airand blood samples collected in some parts of the United States. However,in 1969, Stopps (5) made a large survey of blood samples from inhabitantsof remote villages in Brazil and factory workers in big cities in the
59

Table 1- Mean concentration of elements In several samplingstations 1n Tehran during Spring and Simmer.
Location
Element
PbZnSbMnSetrAs
Stl stz st3 st4 st5Concentration n^r/m3
480±50380±1830±6100+1160±440±350±7
500+66580+2030+4110+870±650±560+2
670+80400HOO90+16140±10100±990±8100+9
630+90580+5070±12230+15120+8200±1090+9
850±1001090+20090+10160±1080+5150+1370+4
St
st.stc
LocationThe North of Tehran
The East of Tehran
The West of Tehran
The Centre of Tehran
The South of Tehran
Table 2- Mean concentration of elements in several sampling Table 3- Mean concentration of elements instations in Tehran during Autumn and winter. Manjil during Spring and Summer.
Location
Element
Pb
Zn
Sb
Mn
Se
Cr
As
St, st2 st3 st4 st5Concentration ngr/m
360±40
230+25
10±1
80±7
40+3
50+8
40+5
550+53
510+30
20+3
100±7
60±5
20+1
40+8
420±38
200+14
10±2
180+12
70±2
80+11
70+3
580+29
330+18
50±7
130±9
40+4
28+3
10±2
700+90
700+70
80±6
120±4
50+5
60±7
90+8
Element
Pb
Zn
Sb
Mn
Se
Cr
As
Concentration ngr/m3
40±3
43±2
9±1
n±z7+0.9
8+1.5
11±1
60
United Stabes; the concentrations of lead were found to be very similarin each group. His results were attributed to some factors(contamination) existing in remote villages of Brazil. In our work, theresults were very similar to those of Goldsmith and Hexter (4) andStopps (5), i.e. regarding air and water. At this point we wereencouraged to investigate another factor, i.e. water contamination. Thiswas one of the most important factors in this study.2. EXPERIMENTAL PROCEDURE
2.1. Air samplingAir samples were collected by means of suction pumps with a maximum
flow-rate of 100 liters per minute. Various types of filters have beenrecommended for this purpose; in our work millipore EHMP 04700filters (6) were used. All samplings were at a height of 2 m aboveground level (the maximum height of a person) using an air volume of72 m3. Monitoring station were installed at the Nuclear ResearchCentre and four other locations in Teheran.2.2. Method of measurement
Materials collected on the filters was dissolved in super-purenitric acid and analysed by electrothermal atomic absorption spectrometry(AAS). High precision was obtained down to the Ug/lcg range. With thismethod Pb, Zn, Mn, Cr, Se, As and Sb were quantitatively measured. Theresults are given in tables 1, 2 and 3.2.3. Preparation of blood for analysts
Elements in human blood were studied after extraction with asuitable complexing agent. For the best yield, various complexing agentsand solvents were investigated with the help of neutron activationanalysis (NAA).
An investigation of different complexing agents, i.e. EDTA, oxine,dithizone and ammonium pyrolidine dithiocarbamide (APDC) showed that ADPCis the most suitable one for this purpose (Table 5). To 5 ml of blood, 5ml of N-butylacetate treated with a 3 % solution of each complexing agentwere added prior to measurement by AAS.
Different concentrations of ADPC i.e. 0.5, 1, 2, 3, 4 and 5 %, wereinvestigated in this work. The most suitable concentration of ADPC wasfound to be 3% (Table 6).
Different solvents such as CHC13, CC14, C6H6, (C2H5)20,and 0(^2^2 were used with ADPC as a complexing agent and the amountof lead in each sample was measured. The most suitable solvent for thiswork was found to be N-butylacetate (NBA) (see table 4).
The yield of vanadium was measured as follows. 5 ml of blood weretreated with 1 ml of a 10 ppm vanadium solution and mixed with a 3% APDCsolution and 5 ml of NBA. After a complete extraction, vanadium wasmeasured by NAA. The same procedure was carried out with vanadiumconcentrations of 20 and 30 ppm. The average yield was found to be 84%.
61
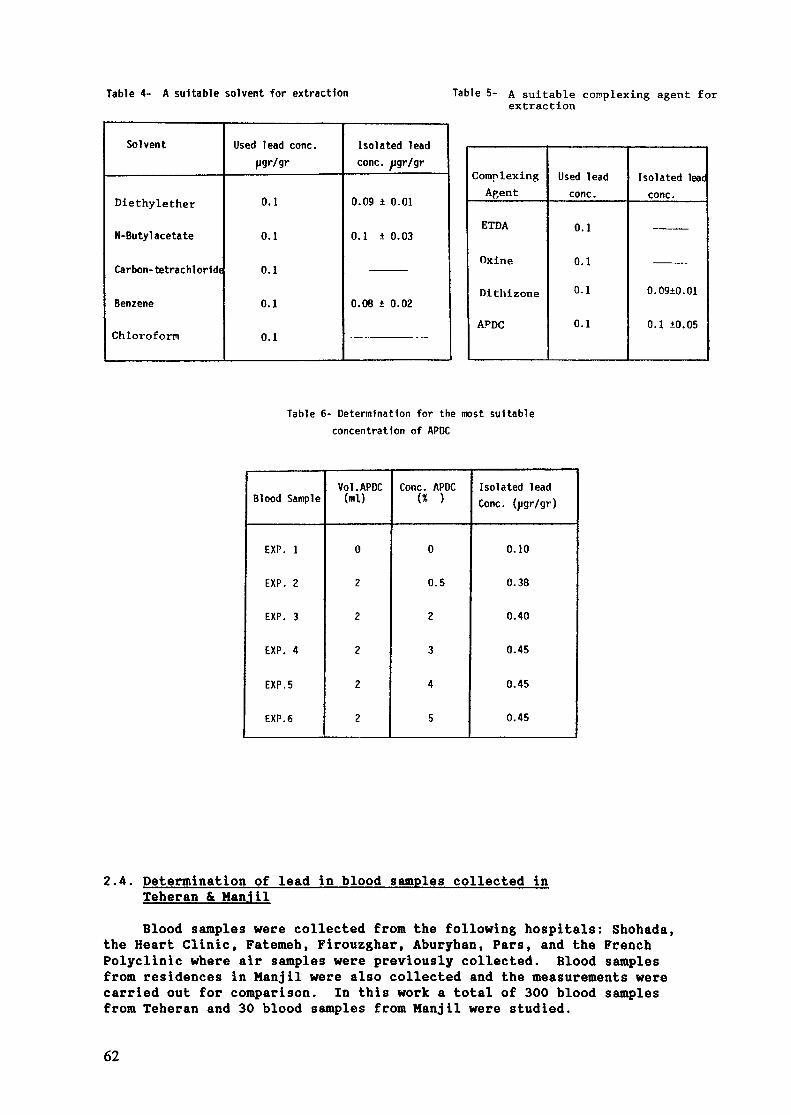
Table 4- A suitable solvent for extraction Table 5- A suitable corcplexing agent forextraction
Solvent
Diethylether
N-Butyl acetate
Carbon-tetrachloHd«
Benzene
Chloroform
Used lead cone.Jigr/gr
0.1
0.1
0.1
0.1
0.1
Isolated leadcone, jigr/gr
0.09 ± 0.01
0.1 ± 0.03
0.08 ± 0.02
ComnlexingAßen t
ETDA
Oxine
Dithizone
APDC
Used leadcone.
0.1
0.1
0.1
0.1
Isolated leadcone.
0.09±0.01
0.1 ±0.05
Table 6- Determination for the most suitableconcentration of APDC
Blood Sample
EXP. 1
EXP. Z
EXP. 3
EXP. 4
EXP. 5
EXP. 6
Vol. APDC(ml)
0
2
2
2
2
2
Cone. APDC(* )
0
0.5
2
3
4
5
Isolated leadCone, (jigr/gr)
0.10
0.38
0.40
0.45
0.45
0.45
2.4. Determination of lead in blood samples collected inTeheran & Manj11
Blood samples were collected from the following hospitals: Shohada,the Heart Clinic, Fatemeh, Firouzghar, Aburyhan, Pars, and the FrenchPolyclinic where air samples were previously collected. Blood samplesfrom residences in Manjil were also collected and the measurements werecarried out for comparison. In this work a total of 300 blood samplesfrom Teheran and 30 blood samples from Manjil were studied.
62
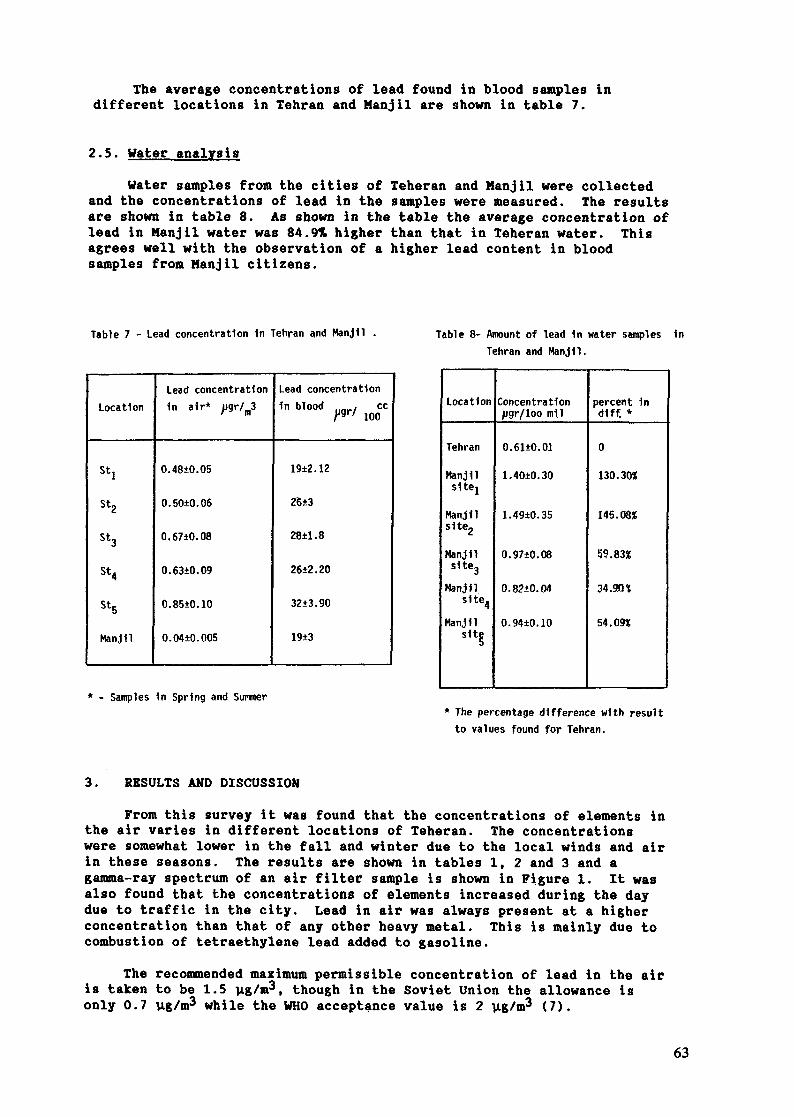
The average concentrations of lead found in blood samples indifferent locations in Tehran and Manj11 are shown in table 7.
2.5. Water analysisWater samples from the cities of Teheran and Manjil were collected
and the concentrations of lead in the samples were measured. The resultsare shown in table 8. As shown in the table the average concentration oflead in Manjil water was 84.9% higher than that in Teheran water. Thisagrees well with the observation of a higher lead content in bloodsamples from Manjil citizens.
Table 7 - Lead concentration In Tehran and Manjil . Table 8- Amount of lead In water samples InTehran and Hanjll.
Location
Stlst2st3st4st5Manjil
Lead concentration1n air* /igr/m3
0.48+0.05
0.50±0.06
0.67±0.08
0.63+0.09
0.85+0.10
0.04+0.005
Lead concentration1n blood „„, cc/igr/ 100
19±2.12
2643
28±1.8
26±2.20
32±3.90
19+3
Location
Tehran
Manjilsltej
Manjils1te2
Manjils1te3
ManjilSlte4
Manjilsite
Concentrationjigr/loo mil
0.61±0.01
1.40±0.30
1.49±0.35
0.97±0.08
0.82+0.04
0.94±0.10
percent 1ndlff. *
0
130.30«
145.08%
59.83%
34.30'«
54.09%
* - Samples In Spring and Summer* The percentage difference with resultto values found for Tehran.
3. RESULTS AMD DISCUSSION
From this survey it was found that the concentrations of elements inthe air varies in different locations of Teheran. The concentrationswere somewhat lower in the fall and winter due to the local winds and airin these seasons. The results are shown in tables 1, 2 and 3 and agamma-ray spectrum of an air filter sample is shown in Figure 1. It wasalso found that the concentrations of elements increased during the daydue to traffic in the city. Lead in air was always present at a higherconcentration than that of any other heavy metal. This is mainly due tocombustion of tetraethylene lead added to gasoline.
The recommended maximum permissible concentration of lead in the airis taken to be 1.5 vig/m3, though in the Soviet Union the allowance isonly 0.7 ug/m3 while the WHO acceptance value is 2 îig/m3 (7).
63
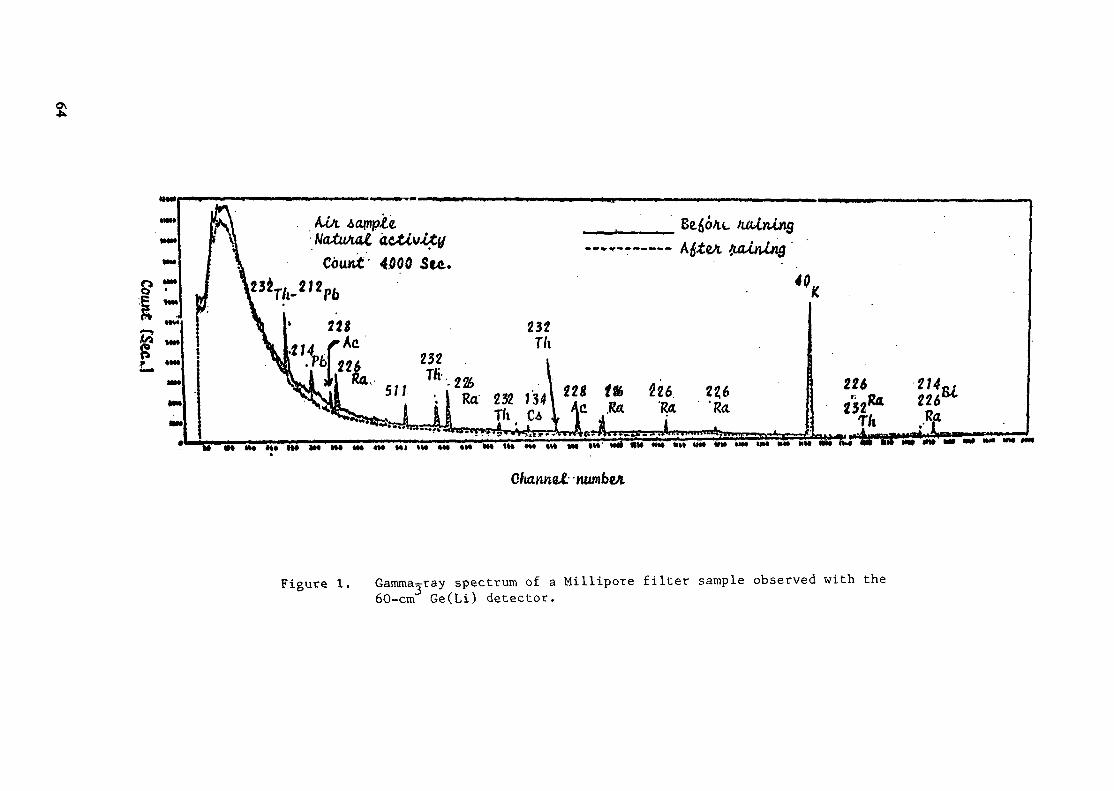
iio
s-o<UP(U«i,0oQ
.
4-1l—
l•r-4oP.
S14-1 O
O
4J
6 2
3
4J
P
0)4J
"OÜd) x-^CL, -H05
J
Ë
Ê
(0 O
U \D
00•r-lb-.
i i i i.
i i i ! i i i
Count. f5eft..J
64
Table 7 shows that the concentration of lead in the air is relatedto that found in blood samples. The average concentration of lead foundin blood samples in Teheran was 26+4.7 vig/100 ml, which is similar tothat in Manjil, 19+3 ug/100 ml. The concentrations of lead in the airin Teheran (0.62+0.14 vig/m3) and in Manjil (0.04+0,005 ug/m3)show a big difference. No relationship can be observed between the leadconcentrations of blood and air in both cities. This suggests thatanother factor such as water should be considered.
Table 8 shows that the average concentration of lead in Manjil waterwas obviously higher than that in Teheran. This may explain why theaverage amount of lead in blood from Manjil is not lower than that forTeheran.4. NEEDS FOR FUTURE RESEARCH
To obtain better results the following points should be considered.More samples of both blood and air are necessary for the determination oflead and other heavy elements in order to know the relationship betweentheir concentrations in these samples. Other factors such as age, sex,smoking habit, weight etc., also need to be considered.
REFERENCES
1. HABIBI, K.: Characterization of participate matter in vehicleexhaust. Environ. Sei. Technol. 7.223-234 (1973).
2. SANAI, G.H.: Industrial Toxicology. Teheran Univ. 1 (1979).3. RASHTTSCHI, E.: Thesis. Univ. of Teheran, Faculty of Science
1 10-25 (1977).4. GOLDSMITH, J.R., HEXTER, A.C.: Science 158 132-134 (1967).
5. STOPPS, G.J.: Air Pollution. Control Assoc. 19 719 (1969).6. RICHARD, D., KENNETH, A. TAHN: Evaluation of filter material and
impaction surface for non-destructive neutron activation analysisof aerosols. Univ. of Michigan 6 441-448 (1972).
7. RAHIMI, H., et al: Air pollution. Technical Report, Atomic EnergyOrganization of Iran 7. 1-15 (1982).
65
HEALTH RELATED MONITORING OF TRACE ELEMENTS BY PIXE
A.A. KATSANOS, A. HADJIANTONIOU, N. PANAYIOTAKIS,M. TZOUMEZITandem Accelerator Laboratory,Nuclear Research Centre "Demokritos",Attiki, Athens, Greece
Abstract
Trace element concentrations were studied in human blood serum, hairand skin by PIXE analysis« Variations in the concentrations of someelements were observed in cases of health disorders, and hair appeared tobe the best easily accessible monitor for trace elements.
1. INTRODUCTION
The subject of this project was the analysis of trace elements inhuman tissues and fluids by PIXE in order to:
- establish fast and reliable analysis procedures for the varioustypes of human tissues and fluids, with external beam PIXE,
- establish the "normal" levels of trace elements for the Greekpopulation,
- investigate any possible correlations between changes in elementalconcentrations and health disorders, and
- search and examine meaningful trace element monitoring proceduresfor health related problems.
2. EXPERIMENTAL PROCEDURE AND RESULTS
2.1. The PIXE analysisThe Proton Induced X-ray Emission (PIXE) method with external
was used for the elemental analysis of the samples. Theanalysis was performed at the Tandem Accelerator Laboratory of the NRCDEMOKRITOS. The PIXE set-up with the external beam which was firstsuccessfully developed in this laboratory is described in refs 3-5. Athin kapton foil (1.2 mg/cm2) was used as an exit window for the 2.5MeV protons. The external beam technique is most suitable for theanalysis of thick uniform samples in the form of pellets. The pelletswere placed at 45 degrees relative to the incoming beam. Each sample wasirradiated for about 5 min, and the total proton current (of the order of50 nA) was integrated at the target and window together, as described inref 5. A Ge(in) detector with working resolution of about 180 eV wasused, together with the associated standard electronics for amplification,pile-up rejection and pulse-height analysis.
The elements that could usually be detected were K, Ca, Cr, Mn, Fe,Ni, Cu, Zn, Br, Rb, Sr and Pb. The detection limit for each of them wasof the order of 0.1 ppm for serum, 1 ppm for hair and about 0.3 ppm forskin.
67
2.2. Analysis of human blood serumBlood serum samples from more than 100 persons belonging to
different groups were collected and analysed. Each sample of about 1 mlwas freeze-dried, powdered, and about 30 mg of the powder was pressedinto a pellet of 7 mm diameter for irradiation with protons.
The observed concentration values of the various elements forhealthy people were all within the limits reported in the literature forpeople in other countries. We have observed, however, certain variationsin the elemental concentrations between the different groups, such ashigher values for the Pb and Br content in the samples collected frompeople living in Athens relative to the ones from the rural areas, ordifferences in the K content between the male and the female subjects.
Blood serum samples were also analysed for three groups of peoplewith skin diseases (two types of skin tumors and psoriasis) as well asfor a group of welders suspected to have lead poisoning. There was noindication of any systematic differences in the blood of these groupsfrom "normal", although distinct abnormalities have been observed in thetrace elements of other tissues of these people, as will be discussedbelow.
2.3 Analysis of skin samplesThe skin samples were freeze-dried, powdered and pressed into
pellets for the FIXE irradiations. Affected and healthy skin samples(along with blood serum samples) were analysed from 41 patients sufferingfrom epitheliomas and from 6 psoriatic patients.
For the healthy skin one could make the following comments on theresults:
- people from rural areas appear to have drier skin,- the contents of Cu, Pb and especially of Br is higher in Athens
than in rural areas.
Significant differences were found in the comparison between theconcentrations in the epitheliomas and the healthy samples. Theconcentrations of K, Fe, Cu, Zn and Rb appear to be much higher in theepitheliomas, while the Br concentration is lower and shows markedvariations. The elements Ca and Pb show no variations. No significantdifferences were observed, on the other hand, in a similar comparison forthe psoriatic patients.
The concentrations of all elements measured in the blood serum forthese people were found to be normal, as mentioned before.
2.4 Analysis of hair samplesEmphasis was given to the analysis of human hair samples, as they
were expected to be good and easily accessible specimens for traceelement monitoring. Nails were also considered for this purpose, but itwas concluded they are more susceptible to contamination, and therefore aless valuable organ for monitoring.
68
Considerable difficulties were encountered In the process oftransforming the hair samples into powder form. Partial burning couldgive results only at high temperatures (above 400 degrees) at which highlosses of trace elements are expected. An attempt was made to usemortars from porcelain or agate to grind the hair samples to powder inthe presence of liquid nitrogen. The results of this attempt wereencouraging, but the powder was not homogeneous, and the analysis showedthe presence of some contamination. The use of a commercial freezer/millgave good results in transforming the samples into powder, but heavycontamination was introduced by the metallic parts of the grinding vialsand the magnetic impactors. This problem was solved by constructingplastic vials, and replacing the Impactors with others covered withteflon.
After the establishment and thorough testing of the procedure, hairand serum samples from 45 persons were analysed. The results justifiedour efforts for the cases of suspected lead contamination. Practicallyall samples of 16 people working in cable welding showed high leadlevels, varying between 14 and 136 ppm with an average of 62 ppm,compared to the "normal" population average of 9 ppm. The lead level inthe blood serum was normal for all of them.
Suspecting possible external contamination of the hair samplesmentioned above, due to the nature of the work of these people, we calledback six of the welders and collected head and public hair from each ofthem this time, and analysed them again. The lead content was high forboth types of samples, although not the same in the two samples, probablydue to the different growth rates.
For this group of 6 people the blood was tested for increasedstrippled cells, which is the characteristic finding in the case of leadexcess. The results were negative for all of them.
3. CONCLUSIONS
The trace elements of the various tissues and fluids arecharacteristic, and in most cases of health disorders they appear tochange their concentrations. Even if the cause of these changes Is notyet understood in most cases, it is an indication which can be used formonitoring the health condition of the living beings.
Blood serum does not appear to be a good monitor, perhaps because ofthe fast changes that It undergoes. Of the other easily accessibleorgans, hair appears to be a good tissue to analyse for trace elements,but a more extended study is probably needed of the significance of highand low levels, and for understanding their changes connected to specifichealth disorders.
69

REFERENCES
1. KATSANOS, A.A.: X-ray methods, "Elemental Analysis of BiologicalMaterials", IAEA Technical Report Series No. 197 231-251 (1980).
2. CAHILL, T.A.: Proton microprobes and particle-induced X-rayanalytical systems, Annual Review of Nuclear and Particle Sciences_30 211-252 (1980).
3. KATSANOS, A.A., XENOULIS, A., HADJIANTONIOU, A., and FINK, R.W.,:Nucl. Instr. Meth. 137 119 (1976).
4. KATSANOS, A.A., and HADJIANTONIOU, A.: Nucl. Instr. Meth. 149 469(1978).
5. KHAN, A.H., KHALIQUZZAMAN, M., HUSAIN, M., ABDULLAH, M., andKATSANOS, A.A.: Nucl. Instr. Meth. 165 253 (1979).
70
SIGNIFICANCE OF ELEMENTAL DEPOSITION IN HAIR TOINTERNAL CONTAMINATION
W.E. KOLLMERGesellschaft für Strahlen- und Umweltforschung mbH,Neuherberg, Federal Republic of Germany
Abstract
In standardized animal experiments the deposition of Cd, Hg and Asin anaphase hair was studied. Due to rates of endogenous transfer observedhair analysis is considered less suitable as an indicator of endogenous"contamination" in the case of Cd than in Hg and As. Studies of the in-fluence of a mild washing procedure recommended by IAEA/RL/U1H on anaphasehair loaded with Cd or Hg demonstrated a heavy impact of washing on Cd butno influence on Hg.
1. OBJECTIVES, MATERIAL AND METHOD
In the programme of 1981-1983 the findings of our previous contractwhere we had used single injections of radioactive Cd-109 were supple-mented by animal experiments using chronic feeding at different levels forprolonged periods of time. This resembles more closely the situation of achronic exposure in man. The animal species, the method of inducing newhair growth and the sampling was the same as before. A detailed descrip-tion is given in (1) and (2). In the same animal modell experiments weredone with radioactive Hg-203 (3) which was administered as a single doseby stomach tube in order to study the endogenous deposition only.
A further series of experiments was started on As in hair. These weredone with single i.m. injections of stable ASpO_ and with single doses ofAs?0_ administered by stomach tube. The analysis was by NAA including astep of chemical separation. Furthermore the impact of a mild washing pro-cedure recommended in IAEA/RL/U1H was studied on Cd (Mand on Hg. Whereasin the Cd study the impact on the endogenous and the exogenous componentwere considered by using radioactive Cd-109 as a single dose as well asstable CdCl in the drinking water and by the use of animals housed in con-ventional cages and in metabolic cages » in the Hg experiment only the im-pact on the endogenous component was studied following a single dose ofHg-203 (as HgCl2) administered by stomach tube.
2. DETAILED DESCRIPTION OF THE STUDIES
This is given in the publications (1-5) as far as the studies on Cdand Hg are concerned. The main experiments on As are not yet finished.Therefore only preliminary information on some parameters is given in thefollowing paragraph.
71
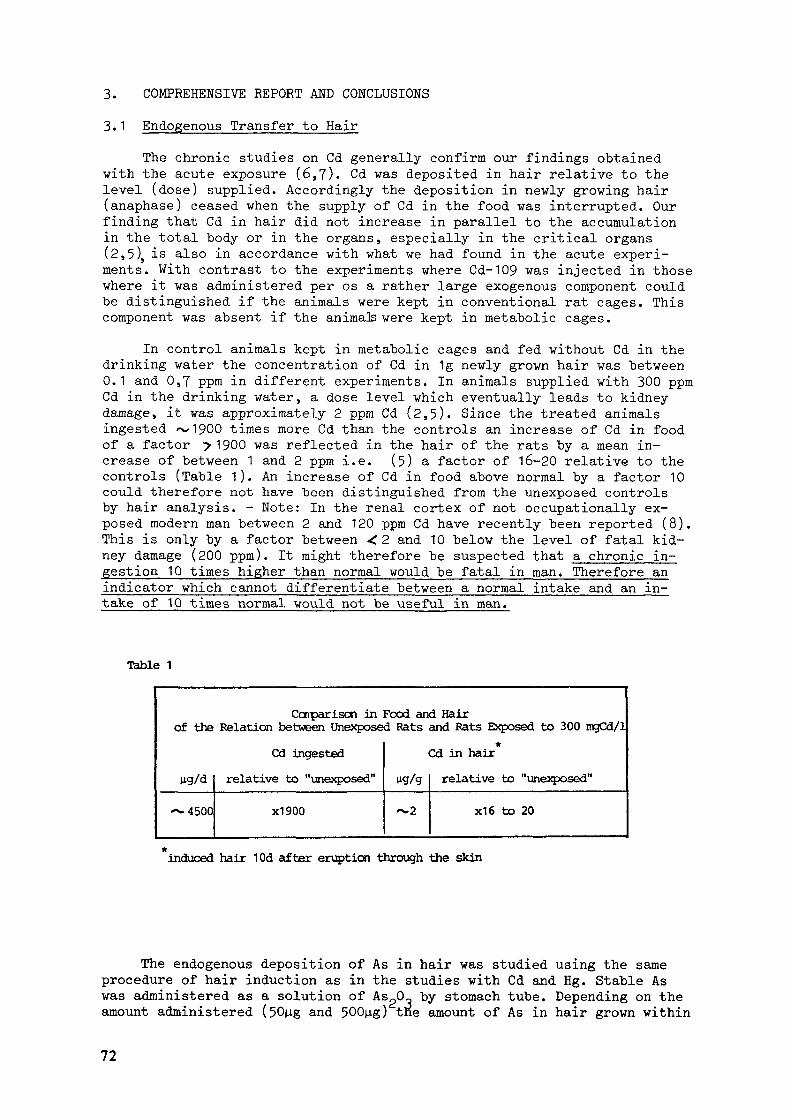
3. COMPREHENSIVE REPORT AND CONCLUSIONS
3.1 Endogenous Transfer to HairThe chronic studies on Cd generally confirm our findings obtained
with the acute exposure (6,7). Cd was deposited in hair relative to thelevel (dose) supplied. Accordingly the deposition in newly growing hair(anaphase) ceased when the supply of Cd in the food was interrupted. Ourfinding that Cd in hair did not increase in parallel to the accumulationin the total body or in the organs, especially in the critical organs(2,5), is also in accordance with what we had found in the acute experi-ments. With contrast to the experiments where Cd-109 was injected in thosewhere it was administered per os a rather large exogenous component couldbe distinguished if the animals were kept in conventional rat cages. Thiscomponent was absent if the animais were kept in metabolic cages.
In control animals kept in metabolic cages and fed without Cd in thedrinking water the concentration of Cd in 1g newly grown hair was between0.1 and 0,7 ppm in different experiments. In animals supplied with 300 ppmCd in the drinking water, a dose level which eventually leads to kidneydamage, it was approximately 2 ppm Cd (2,5). Since the treated animalsingested ~1900 times more Cd than the controls an increase of Cd in foodof a factor 71900 was reflected in the hair of the rats by a mean in-crease of between 1 and 2 ppm i.e. (5) a factor of 16-20 relative to thecontrols (Table 1). An increase of Cd in food above normal by a factor 10could therefore not have been distinguished from the unexposed controlsby hair analysis. - Note: In the renal cortex of not occupâtionally ex-posed modern man between 2 and 120 ppm Cd have recently been reported (8).This is only by a factor between ^ 2 and 10 below the level of fatal kid-ney damage (200 ppm). It might therefore be suspected that a chronic in-gestion 10 times higher than normal would be fatal in man. Therefore anindicator which cannot differentiate between a normal intake and an in-take of 10 times normal would not be useful in man.
Table 1
Conparison in Food and Hairof the Relation between Unexposed Rats and Rats Exposed to 300 rogCd/1
Cd ingestedtig/d relative to "unexposed"
•4500 X1900
Cd in hairng/g relative to "unexposed"
x16 to 20
induced hair 10d after eruption through the skin
The endogenous deposition of As in hair was studied using the sameprocedure of hair induction as in the studies with Cd and Hg. Stable Aswas administered as a solution of As20_ by stomach tube. Depending on theamount administered (50ug and 500p,g) tne amount of As in hair grown within
72
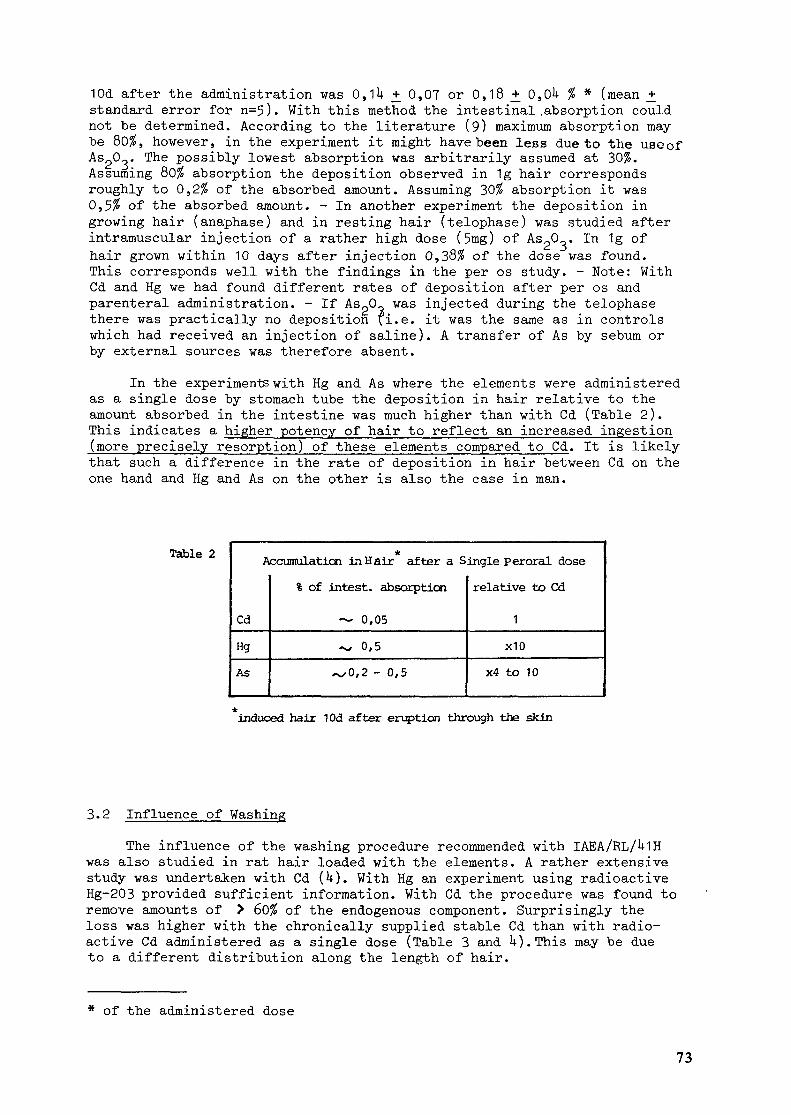
10d after the administration was 0,1 U +_ 0,OT or 0,18 ± 0,OU % * (mean _+standard error for n=5). With this method the intestinal .absorption couldnot be determined. According to the literature (9) maximum absorption maybe 80$, however, in the experiment it might have been less due to the use ofASpO„. The possibly lowest absorption was arbitrarily assumed at 30%.Assuming 80% absorption the deposition observed in 1g hair correspondsroughly to 0,2$ of the absorbed amount. Assuming 30$ absorption it was0,5$ of the absorbed amount. - In another experiment the deposition ingrowing hair (anaphase) and in resting hair (telophase) was studied afterintramuscular injection of a rather high dose (5mg) of ASpO_. In 1g ofhair grown within 10 days after injection 0,38$ of the dose was found.This corresponds well with the findings in the per os study. - Note: WithCd and Hg we had found different rates of deposition after per os andparenteral administration. - If As?0,. was injected during the telophasethere was practically no deposition fi.e. it was the same as in controlswhich had received an injection of saline). A transfer of As by sebum orby external sources was therefore absent.
In the expérimente with Hg and As where the elements were administeredas a single dose by stomach tube the deposition in hair relative to theamount absorbed in the intestine was much higher than with Cd (Table 2).This indicates a higher potency of hair to reflect an increased ingestion(more precisely résorption) of these elements compared to Cd. It is likelythat such a difference in the rate of deposition in hair between Cd on theone hand and Hg and As on the other is also the case in man.
Table 2 A
CdHgAs
*ccumoLation in H air after a S% of intest, absorption
~ 0,05^ 0,5~sO,2 - 0,5
ingle Peroral doserelative to Cd
1x10
x4 to 10
induced hair 10d after eruption through the skin
3.2 Influence of WashingThe influence of the washing procedure recommended with IAEA/RL/U1H
was also studied in rat hair loaded with the elements. A rather extensivestudy was undertaken with Cd (U). With Hg an experiment using radioactiveHg-203 provided sufficient information. With Cd the procedure was found toremove amounts of > 60% of the endogenous component. Surprisingly theloss was higher with the chronically supplied stable Cd than with radio-active Cd administered as a single dose (Table 3 and U).This may be dueto a different distribution along the length of hair.
* of the administered dose
73

Table 3:
Loss of Stable Cd in Hair Subjected to Washing(% Loss per g)
mechanical agitation
by ultrasound
InMetabolicCages
97 + 1 (1%)n = 10
99+1 (1%)n = 10
InConventional
Cages
88+2 (2%)n = 8
77+ (8%)n = 7
Significance(2P)
<0.001
<0.001
* mean + standard error (relative standard error)n = pairs of subsamples
Table 4 :
Loss of Radioactivity in Hair Subjected toWashing Using Ultrasound as a Means of Agitation
In Metabolic Cages(% loss per g Hair)
x 64sx 6sx (%) 9
n 10
In Conventional .Cages(% loss per g Hair)
x 70sic 2sx {%) 3
With Hg a vashing experiment was only done using hair which containedradioactive Hg-203 from a single dose administered by stomach tube. Inthis case the washing procedure had no influence on the Hg-203 in the hair.This is in accordance with the findings of Das et al. (8) in human hair.It is noteworthy that in our experiment the Hg-203 was of endogenous ori-gin, whereas in the human hair analysed by Das et al. the origin may havebeen endogenous and/or exogenous. The different impact of washing on Cdand Hg is not only of importance with respect to analytical practice butmay also indicate a differencein the chemical binding.
74
i*. APPLICABILITY OF THE FINDINGS
Based on these findings it may be recommended in applications ofhair analysis not to take low levels of Cd in hair as necessarily indi-cating a low (or no) internal exposure, especially if the hair sample waswashed (by a method similar or more aggressive than the one recommendedby IAEA).
At the other hand based on our findings it seems very unlikely thatthe résorption of a substantial amount of (inorganic) Hg is not reflectedby an elevated deposition of Hg in hair growing at the time of résorption.
5. RELEVANCE OF THE WORK TO THE NEEDS OF THE PARTICIPANTS COUNTRY
The results are relevant with respect to the application of hair ana-lysis as a tool for assessing the exposure of man (and animals) to Cd, Hgand As irrespective of the area or the country. Such assessment of expo-sure is of special interest to countries where these elements are mined,milled, refined or technically used to a large extent or where conta-mination of food may occur.
6. NEEDS FOR FURTHER RESEARCH6.1 The same experimental procedure which has been used to compare Cd,Hgand As should be employed to evaluate and compare the relative signifi-cance of hair analysis for the assessment of internal exposure (deficiency,adequacy or excess) of the most important toxic and essential elements andtheir different forms of chemical binding .6.2 Our findings on the impact of washing on Cd in hair are partiallycontradictory to some other investigators using human hair of unexposedindividuals and other washing methods. A study on the influence of theIAEA recommended procedure on human hair, possibly taken from a person whohad been internally contaminated could close the gap between experimentand practice. This should be done by an investigator with practice inwork with human hair.6.3 Further studies on the influence of this washing procedure on otherelements under the same experimental standards (induced hair from rats)might be very useful to evaluate the influence of mild washing on theendogenous component of other elements in hair.This ultimately may leadto recommendations concerning the use of preanalytical washing with ana-lysis of specific elements. Studies with some elements are already underway in our laboratory.6.h Rat hair is morphologically and chemically very similar to humanhair but the rates of transfer of elements into or onto the matrix maypossibly be different in some cases. Therefore the very detailed and sta-tistically well based data obtained from the well controlled experimentswith rats should somehow be linked to the situation in humans. A firstapproximation may be obtained by studies in monkeys. One such study wasoriginally part of our program 1982. It had to be postponed due to cuttingsin technical personal.
15
6.5 In the further future it may be an interesting subject of animal ex-periments to find out if there is a change in the rate of element depo-sition in hair under pathological conditions due to toxicity or deficiencyof the respective elements. Another similar question which might be re-solved by animal experiments is: Do changes in supply of other elementsinterfere (+or-) with the deposition of an element in hair?
REFERENCES
1. KOLLMER, W.E.: in J.McC. Howell, et al. Eds., Trace ElementMetabolism in Man and Animals, Australian Academy of Science,Canberra, 433-436, (1981).
2. KOLLMER, W.E.: Sei. Tot. Environ. 25., 41-51, U982)
3. BERG, D. and KOLLMER, W.E.: in P. Schramel und Brätter, AnalyticalChemistry in Biology and Medicine (1983).
4. KOLLMER, W.E.: Sei. Tot. Environ, in print (1983).
5. KOLLMER, W.E.: Proc. Int. Conf. Heavy Metals in the Environment,Heidelberg, Sept. (1983).
6. DRASCH, G.: An increase of Cd body burden for this century - aninvestigation on human tissues, Sei. Tot. Environ., 26. 111-119.
7. DAS, H.A., DEKUMHANG, M., HERBER, R.F.M., HOEDE, D., van derSLOOT, H.A.: ECN-107 (1981).
8. FOWLER, B.A. et al., in Fridberg et al. (Eds.) Handbook on theToxicology of Metals, Elsevier/North Holland, Amsterdam, 299,(1979).
FURTHER LITERATURE
1. AMIN-ZAKI L., ELAHSSANI S., MAJEED M.A., CLARKSON T.W., DOHERTY R.A.,GREENWOOD, M.A., GIOVANOLI-JAKUBCZAK T.: Am.J.Dis.Child. 130,1070-1076 (1976)
2. ANKE M., RISCH M.: Haaranalyse und Spurenelementstatus. VEB GustavFischer Verlag Jena, (1979)
3. M'BAKU S.B. PARR R.M.: Interlaboratory study of trace and otherelements in the I.A.E.A. powdered human hair reference material,HH-1. 6th Int.Conf. Modern Trends in Activation Analysis
h. BATE L.C.: Adsorption and elution of trace elements on human hair.Int.J.Appl.Radiât. J_7, 417-^23 (1966)
5. BATE L.C., DYER F.F.: Trace elements in human hair. Nucleonics 23,7 -81 (1965)
6. BRANCATO D.J., PICCHIONI A.L., CHIN L.: Cadmium levels in hair andother tissues during continuous cadmium intake. J.Toxicol.Environ.Health 22, 351-359 (1976)
76
T. CHITTLEBOROUGH G., STEEL B.J.: Is human hair a dosimeter for endo-genous zinc and other trace elements. Sei.Total Environ. 15» 25~35(1980)
8. CLARKSON T.W., LAMAN AMIN-ZAKI, SA DOUN Al-TIKRITI K.: An outbreakof methylmercury poising due to consumption of contamined grain.Fed.Proc. 35_, 2395-2399 (1979)
9. FRIBERG L., NORDBERG G.F., VOUK V.B.: Handbook on the Toxicolgy ofMetals. Elsevier, Amsterdam 365~366 (1979)
10. GIOVANOLI-JAKUBCZAK T., BERG G.G.: Arch.Environ.Health 2_5_, hk3~^9(19710
11. GROSS S.B., YEAGER D.W., MIDDENDORF M.S.: Cadmium in liver, kidneyand hair of human, fetal through old age. J.Toxicol.Environ.Health2, 153-167 (1976)
12. HAMMER D.J., FINKLEA J.F., HENDRICKS R.H. SHY C.M., HORTON R.J.M.:Hair trace metal levels and environmental exposure. Am.J.Epidemiol.£3, 8U-92 (1971)
13. HARRISON W.W., YURACHEK J.P., BENSON O.A.: The determination of traceelements in human hair by absorption spectroscopy. Clin.Chem.Acta 2383-91 (1969)
1U. HUEL G., BOUDENE C., IBREHIM M.A.: Cadmium and lead content ofmaternal and newborn hair. Relationship to parity, birth weight, andhypertension. Arch.Environ.Health _3_6_, 221-227 (1981)
15. I.A.E.A.: Activation analysis of hair as an indicator of contamina-tion of man by environmental trace element poolutants. I.A.E.A.Re-port 76-11303, 10 (1977)
16. IMAHORI A., FUKUSHIMA I., SHIOBARA S., YANAGIDA Y., TOMURA K.:Multielement neutron activation analysis of human scalp hair. Alocal population survey in the Tokyo Metropolitan. Area.J.Radioanal.Chem. _5_2, 167~180 (1979)
17. Jervis R.E., TIEFENBACH B., CHATTOPADHYAY A.: Scalp hair as a monitorof population exposure to environmental pollutants. J.Radioanal.Chem.31, 751-760 (1977)
18. JOHNSON E.: Quantitative studies of hair growth in the albino rat.I. Normal males and females . J.Endocrin. 16, 337-350 (1958)
19. KOLLMER W.E.: Critical evaluation of the significance of internalversus external exposure on cadmium content of the hair of the la-boratory rat. In: J.McC. Howell, J.M. Gawthorne and C.L.White (Eds.)Trace Element Metabolism in Man and Animals, Australian Academy ofScience, Canberra 433- 36 (1981)
20. MARTIN G.M.: Copper content of hair and nails of normal individualsand patients with hepatoleuticular degeneration. Nature 202, 903-90H(1964)
21. MONTAGNA W.: The structure and function of skin. Academic Press,New York (1962)
77

22. NISHIYAMA K., NORDBERG G. F.: Adsorption and elution of Cd on hair.Arch. Environ. Health 2£, 92-96 (1972)
23. OLERU H.G.: Kidney, liver, hair and lungs as indicator of cadmiumadsorption. Amer.Ind.Hyg.Assoc. J. 37, 617-621 (1976)
2U. OLERU H.G.: Epidemiological implications of environmental cadmiumI. Probable utility of human hair for occupational trace metal scree-ning. Amer.Ind.Hyg.Assoc.J. 36, 229 (1975)
25. PANKHURST C.A. , PATE B.D.: Trace elements in hair. Rev. Anal. Chem. IV111-235 (1979)
26. PETERING H.G. , YEAGER D.W., WITHERUP S.O.: Trace metal content in hair.II Cadmium and lead of human hair in relation to age and sex. Arch.Environ. Health 27 327-330 (1973)
27. PILLAY K.K.S., KUIS R.L.: The potentials and limitations of usingneutron activation analysis data on human hair as a forensic evidence.J. Radioanal. Chem. _U3 1*61-V78 (1978)
28. ROBINSON J.W. , WEISS S.: The direct determination of cadmium in hairusing carbon-bed atomic absorption spectroscopy. Daily rate of lossof cadmium in hair, urine and sweat. J. Environ. Sei. Health A 15,663-697 (1980)
29. ROSMANITH J. , EINBRODT H.J., GORDON Th.: Beziehungen zwischen Blei-und Zinkniederschlägen und den Schwermetallgehalten (Pb,Zn,Cd) imBlut, Urin und in den Haaren bei Kindern. Zentralbl.Bakteriol. Para-sit enkd. Infekt ionskr.Hyg. Abt.I: Orig., Bl6l. 125-136 (1975)
30. SCHROEDER H.A., NASON A. P. : Trace metals in human hair. J. Invest.Dermatol. _5_3, 71-78 (1969)
31. AL-SHAHRISTANI H., AL-HADDAD I.K. : Mercury content of hair from nor-mal and poisoned persons. J. Radioanal. Chem. 15 59~70 (1973)
32. AL-SHAHRISTANI H. , SHIHAB K. , AL-HADDAD I.K. : Conf. on Intoxicationdue to alkylmercury treated seed. Seed. Bull. WHO 53, Suppl., Geneva
33. AL-SHAHRISTANI H. , SHIHAB K. : Variation of biological half-life ofmethylmercury in man. Arch. Environ. Health _g_8_, 3^2-3UU (197*0
3k. TAKEUCHI T., HAYASHI T., TAKADA J. , KOYAMA M. : Survey pf trace ele-ments in hair of normal Japanese. IAEA-SM-227 (1978)
35. TSUCHIYA K. : Cadmium studies in Japan. Elsevier, Amsterdam p.UO(1978)
78

EMPLOI DE L'ANALYSE PAR ACTIVATION INSTRUMENTALEA L'ETUDE DE LA CONTAMINATION DE L'HOMME ET DESON MILIEU ENVIRONNNANT PAR LES ELEMENTS TOXIQUESA L'ETAT DE TRACE
B.M. LUMU, M.D. TSHIASHALACentre régional d'études nucléaires de Kinshasa,Laboratoire d'analyse par activation,Kinshasa, Zaire
Abstract
Trace element contents are determined in human hair and in some environ-mentals samples such as vegetables and river waters pathways throughwhich these elements are incomporated in human body, and in atmosphericdust, probable source of external contamination. 26 elements are determi-ned in hairs, 11 in foodstuffs, 16 in river waters and 19 in atmosphericdust, using instrumental neutron activation analysis. The Hg and I contentsin hairs are too higher due to the use of antiseptic soaps containing 3 %of mercur iodide.
RésuméLes teneurs des traces métalliques sont déterminées dans les cheveux etdans Quelques composants de l'environnement tels que : les légumes et leseaux des rivières voies d'accès de ces éléments dans l'organisme humain,ainsi que dans les poussières atmosphériques source de contaminationexterne. 26 éléments sont déterminés dans les chevexox, 11 dans les légumes16 dans les eaiox des rivières, et 19 dans les poussières atmosphériques,par analyse par activation instrumentale ; les teneurs en Hg et I sonttrès élevées dans les cheveux, à cause de l'emploi des savons antisepti-ques contenant 3 % d'iodure de mercure.
1.- INTRODUCTION
Les sciences de l'environnement connaissent à l'heureactuelle un regain d'intérêt. Cet intérêt est justifié en partie parl'inquiétude survenant de la pollution et la dégradation de la naturepar l'activité humaine.
En effet, les déchets domestiques et industriels sontdéversés dans la nature et vont perturber l'équilibre naturel existant.
79
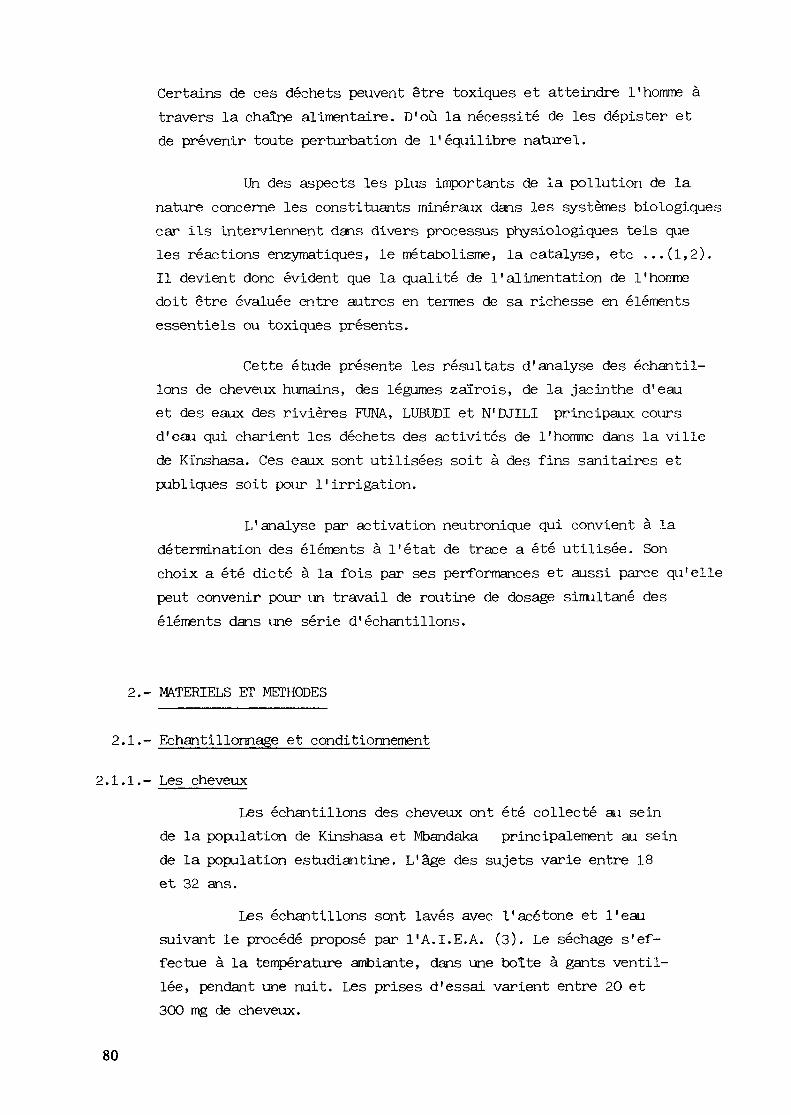
Certains de ces déchets peuvent être toxiques et atteindre l'homme àtravers la chaîne alimentaire. D'où la nécessité de les dépister etde prévenir toute perturbation de l'équilibre naturel.
Un des aspects les plus importants de la pollution de lanature concerne les constituants minéraux dans les systèmes biologiquescar ils interviennent dans divers processus physiologiques tels queles réactions enzymatiques, le métabolisme, la catalyse, etc ...(1,2).Il devient donc évident que la qualité de l'alimentation de l'hommedoit être évaluée entre autres en termes de sa richesse en élémentsessentiels ou toxiques présents.
Cette étude présente les résultats d'analyse des échantil-lons de cheveux humains, des légumes zaïrois, de la jacinthe d'eauet des eaux des rivières FUNA, LUBUDI et N'DJILI principaux coursd'eau qiai charient les déchets des activités de l'homme dans la villede Kinshasa. Ces eaux sont utilisées soit à des fins sanitaires etpubliques soit pour l'irrigation.
L'analyse par activation neutronique qui convient à ladétermination des éléments à l'état de trace a été utilisée. Sonchoix a été dicté à la fois par ses performances et aussi parce qu'ellepeut convenir pour un travail de routine de dosage simultané deséléments dans une série d'échantillons.
2.- MATERIELS ET METHODES
2.1.- Echantillonnage et conditionnement
2.1.1.- Les cheveuxLes échantillons des cheveux ont été collecté ai sein
de la population de Kinshasa et Mbandaka principalement au seinde la population estudiantine. L'âge des sujets varie entre 18et 32 ans.
Les échantillons sont lavés avec l'acétone et l'eausuivant le procédé proposé par l'A.I.E.A. (3). Le séchage s'ef-fectue à la température ambiante, dans une boîte à gants ventil-lée, pendant une nuit. Les prises d'essai varient entre 20 et300 mg de cheveux.
80

2.1.2.- Les légumes et jacinthes d'eauLes légumes analysés sont achetés sur le marché de
Kinshasa. Après avoir écarté les parties non comestibles, leséchantillons sont lavés à l'eau distillée plusieurs fois. Ilssont sèches à l'étuve à 85° G jusqu'à poids constant, et sontensuite moulus au moulinex électrique. La poudre obtenue estpassée au tamis de 0,16 mm de diamètre.Avant chaque analyse, la poudre est laissée à l'étuve à 85° Cpendant 24 heures (4). Les prises d'essai sont d'environ 500 mgde matières sèches. Les prélèvements de la jacinthe d'eau ontlieu à trois endroits différents du fleuve Zaïre(MALUKU, NDOLO et GOMBE) à Kinshasa.
2.1.3.- Les eaux des rivièresLes échantillons d'eau analysés sont prélevés à 50 cm
de profondeur dans les rivières LUBUDI, FUNA et N'DJILI.L'échantillonnage est effectué dans les flacons en polyethylenenettoyés au préalable avec l'acide-nitrique concentré et l'eaude robinet et rincés avec l'eau distillée et l'eau à analyser.Les formes insolubles sont éliminées par filtration sur verrefritte JENA n° 2. Le filtrat est acidifié avec l'acide nitriquepurifié pour éviter d'éventuelles modifications physico-chimiques(5-7). Une partie de l'échantillon est évaporée à l'étuve à 85°Cpour des longues durées d'irradiation.
2.1.4.- Les poussières atmosphériquesLes poussières atmosphériques sont recueillies sur
les filtres des climatiseurs de 0,5 nrn de diamètre. Les points deprélèvements d'échantillons choisis sont les suivants :
A.- KINGABWA, Zone industrielle, à l'Est de la ville ;B.- La Cité de la Radio et de la Télévision, au Centre de
la ville ;C.- Le Centre Météorologique de Binza, à l'Ouest de la ville ;D.- Le Campus Universitaire de Kinshasa, au Sud de la ville.
Pour disposer d'échantillons homogènes, les poussièresrecueillies sont traitées mécaniquement à l'aide d'un tamis ennylon dont les pores ont 250 microns de diamètre. Des prisesd'essai sont d'environ 100 mg de poussière.
81
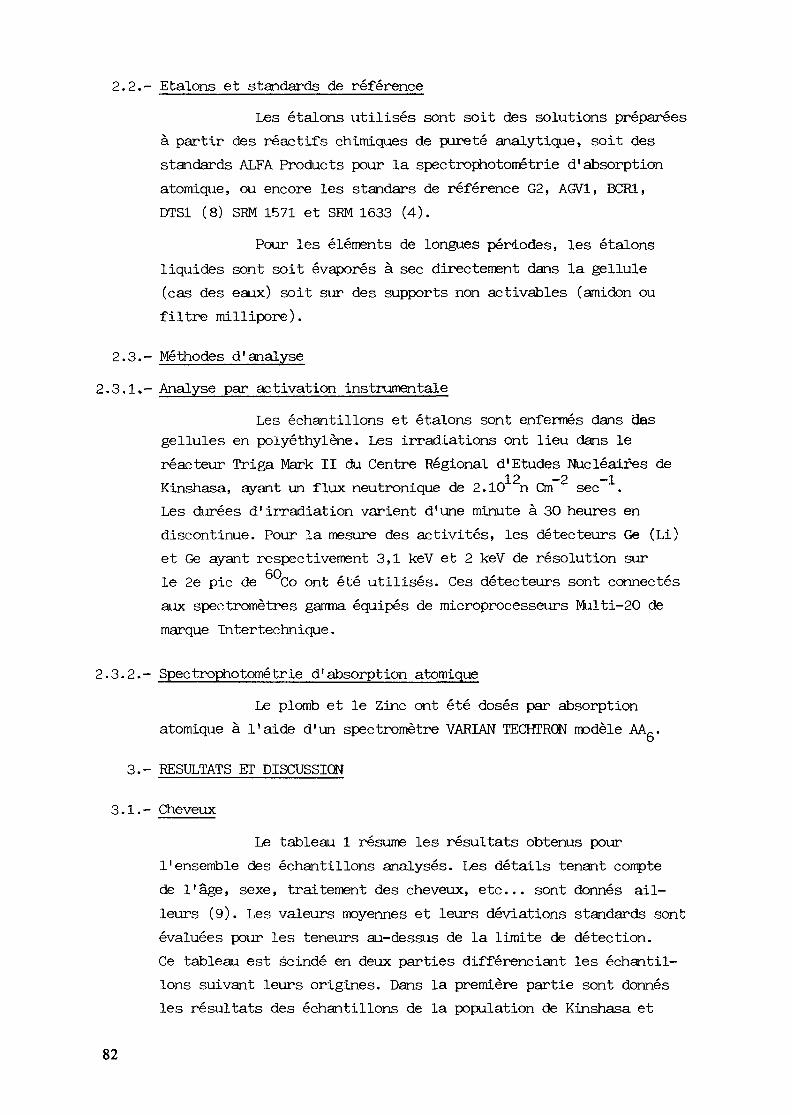
2.2.- Etalons et standards de référenceLes étalons utilisés sont soit des solutions préparées
à partir des réactifs chimiques de pureté analytique, soit desstandards ALFA Products pour la spectrophotome trie d'absorptionatomique, ou encore les standars de référence G2, AGV1, BCR1,DTS1 (8) SRM 1571 et SEM 1633 (4).
Pour les éléments de longues périodes, les étalonsliquides sont soit évaporés à sec directement dans la gellule(cas des eaux) soit sur des supports non activables (amidon oufiltre millipore).
2.3.- Méthodes d'analyse
2.3..1.- Analyse par activation instrumentaleLes échantillons et étalons sont enfermés dans das
gellules en polyethylene. Les irradiations ont lieu dans leréacteur Triga Mark II du Centre Régional d'Etudes Nucléaires de
12 -2 -1Kinshasa, ayant un flux neutronique de 2.1O n Cm secLes durées d'irradiation varient d'une minute à 30 heures endiscontinue. Pour la mesure des activités, les détecteurs Ge (Li)et Ge ayant respectivement 3,1 keV et 2 keV de résolution surle 2e pic de Co ont été utilisés. Ces détecteurs sont connectésaux spectromètrès gamma équipés de microprocesseurs Multi-20 demarque Intertechnique.
2.3.2.- Spectrophotometrie d'absorption atomiqueLe plomb et le Zinc ont été dosés par absorption
atomique à l'aide d'un spectromètre VARIAN TECHTRON modèle AA.~.b3.- RESULTATS ET DISCUSSION
3.1.- CheveuxLe tableau 1 résume les résultats obtenus pour
l'ensemble des échantillons analysés. Les détails tenant comptede l'âge, sexe, traitement des cheveux, etc... sont donnés ail-leurs (9). Les valeurs moyennes et leurs déviations standards sontévaluées pour les teneurs au-dessus de la limite de détection.Ce tableau est scindé en deux parties différenciant les échantil-lons suivant leurs origines. Dans la première partie sont donnésles résultats des échantillons de la population de Kinshasa et
82
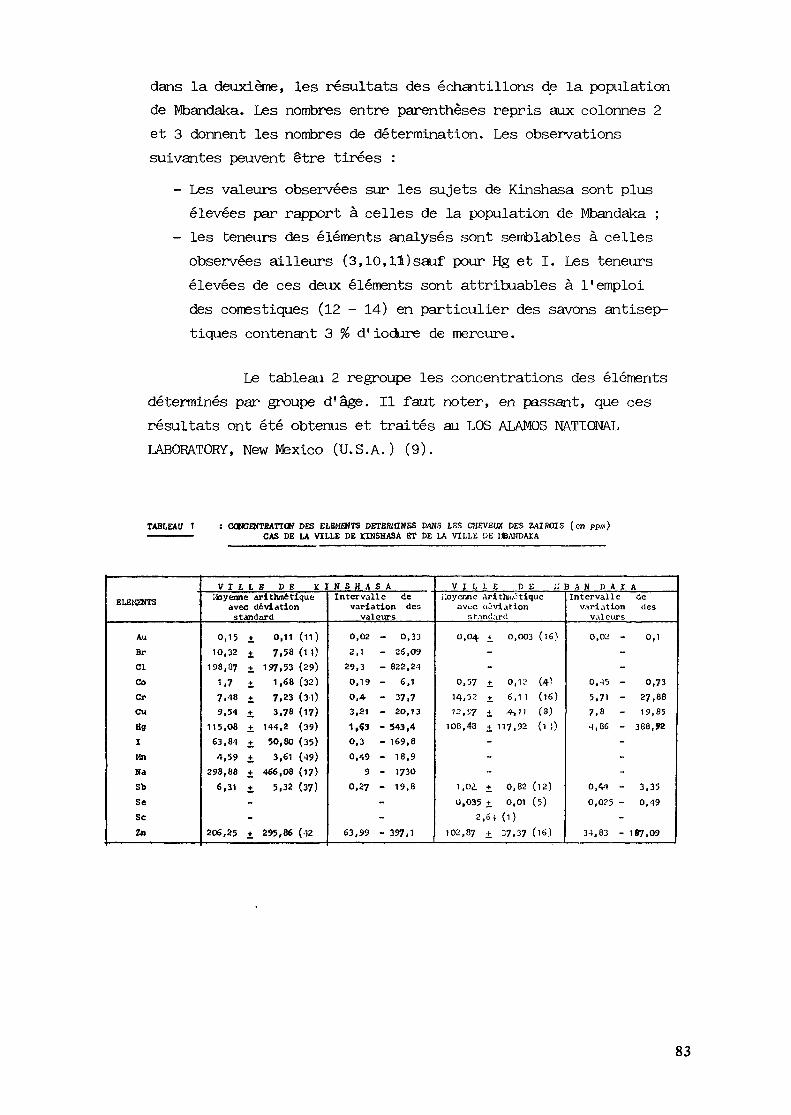
dans la deuxième, les résultats des échantillons de la populationde Mbandaka. Les nombres entre parenthèses repris aux colonnes 2et 3 donnent les nombres de détermination. Les observationssuivantes peuvent être tirées :
- Les valeurs observées sur les sujets de Kinshasa sont plusélevées par rapport à celles de la population de Mbandaka ;
- les teneurs des éléments analysés sont semblables à cellesobservées ailleurs (3,10,11)sauf pour Hg et I. Les teneursélevées de ces deux éléments sont attribuables à l'emploides comestiques (12 - 14) en particulier des savons antisep-tiques contenant 3 % d1iodure de mercure.
Le tableau 2 regroupe les concentrations des élémentsdéterminés par groupe d'âge. Il faut noter, en passant, que cesrésultats ont été obtenus et traités au LOS ALAMOS NATIONALLABORATORY, New IVfexico (U.S.A.) (9).
TABLEAU 1 : CONCENTRATION DES ELEMaiTS DETERMINES »ANS LES CHEVEUX DES ZAÏROIS (en ppm)CAS DE LA VILLE DE KINSHASA ET DE LA VILLE DE 18ANDAXA
ELEMENTS
Au
BrClCoCrCuHgI1«!
NaSbSeSeZa
V I L L E D E K I N S H A S AMayenne arithmétique
avec déviationstandard
0,15 + 0,11 (1l)10,32 + 7,58 (1 })
138,87 + 197,53 (29)1,7 + 1,68 (32)7,48 ± 7.23 (3-1)9,54 + 3.78 (17)
115,08 i 144,2 (39)63,81 + 50,80 (35)4,59 i 3,61 (49)
298,88 i 4ß6,08 (l?)6,31 i 5,32 (37)
--
206,25 i 295,86 (-12
Intervalle devariation des
val eurs
0,02 - 0,332,1 - 26,09
29,3 - 822,240.19 - 6,1
0,4 - 37,73,21 - 20,13
1,«3 - 543,4O,3 - 169,80,19 - 18,9
9 - 17300,27 - 19,8
--
63,99 - 397,1
V I L L E D E ; ; B A N D A r AKoyenne Arithn.ô tique
avec uiviationr, t.imî.ird
0,04 H_ 0,003 (16)
--
0,57 i 0,12 (4^14,52 ± 6,1 1 (16)12, y? + 4-.11 (8)
108,48 +_ 117,92 (i ',)---
1,0i ± 0,82 (12)
0,035 i 0,01 (5)2,6* (1)
102,87 ± 37,37 (16)
Intervalle devariation des
val eurs
0,02 - 0,1
--
0.-45 - 0,735,71 - 27,887,8 - 19,85-1,86 - 388, »2
---
0,4-1 - 3,350,0?5 - 0,49
-3-),83 - 1B7.09
83

Tableau 2 Concentration des éléments déterminés dans les cheveux pargroupes d'âges (en ppm). Caa dg^Ia vlll*^ de^ jCjnshasa.
ELEMENT . 19A.(7) . 2GA (11)
NaM«AlClKÇaTiVHnCu
BrSrIB«
DySeCrTeCoZn
SeAgSbCs
CeHgTh
8.21-3112.8-160
49.2-630
39-150
44012-1630
0.041-43
0.09-1.14.7-8.5.017-15
.33-44
7.1
9-150
7-850.40-0.80
0.0062-0.024
0.33-1.4
45-3800.072-0.22
130-220
0.53-31
<1.0
0.210.051-0.13
1.9
0.79-340
0.051-0.11
3.2-500
63-600
27.0-600
21-1220190- 32O
280-36409.2-44
0.083-0.861.4-8.7
7.6-20
0.71-80
8.0-41.0
2-95
13-20
0.027
0.0015-0.060
0.32-1.3
32-250
0.11-0.21
91-2500.26-130
2.3
0.14
.04-0.08
<0.39
8.0-1120
0.084-0.09
r 22A (4)
18.3-93.8
75-156
142-480
64-720
120
393-110O
9.4-510.22-80
1.4-6.8
13-16
1.6-6.6
7.0
4-310
6-310
1.30.010-0.050
0.38-1.8
71-320
0.11-0.25
97-170O. 27-25
< 0.9
0.26O.O92
< 0.30
1.2-6000.037-0.08
. ?3A (-1)
12.3-520
8O-410
120-320
87-270
268
274-?970
36.6-S4
0.20-0.76
3.O-19
10-180.6-2.2
12
13O-480
20-380
1.1-7.0
O.OO86-0.04'
0.22-1.3
70-250
0.17-0.32
86-160
26-61
<1.0
0.23-0.38
0.034
0.54
260-540
0.055-0.09
24A (4) (
5.30-44
67-180
69-106
19-650
112
334-187O
8.00.11-0.251.6-5.8
6.0-16
0.98-16
5
3-110
9-62
0.41-2.8
0.004O-0.025
0.52-4.0
33-10O
O.O9O-0.38
120-150
0.44-110
t. 1.0
0.29
O.036
0.46
4.3-1050
0.050
TABLEAU 3 : TENEURS MIHIIIALE.HAXIIIALE ET IIOYEKIIE DES ELEilEHTS DUT2EiH:ES DAI'S LES EAUX DESElVIERES FU1IA, I,UBUDI ET UDJILI (en 1113/1 )
ELEMENTS
AlAu
Br(ug/L)ClPeIKMnNaSb(ug/l)Sc(ug/l)V (us/1)CrCuZn
^(ug/l)
RIV
MinÎMun
0,230,002
0,10
12,30
0,740,02
3,32
0,01
8,300,090,30-
0,02
0,050,24-
1ERE pyMaximum
5,260,02
76,00
69,985,730,168,600,08
26,390,790,51-
0,080,12
0,25
-
IA
Moyenne
2,56
0,01422,56
37.872,450,074,090,04
14,360,240,425,920,050,08
0,25-
RIVIERE I.IJQI
ttini,,iu).i
5,960,002
0,22
29,62
1 ,04
0,174,480,03
17,650,240,731,41---
0,09
liaxi. UM
14,360,014,83
56,0412,890,358,180,08
23,082,082,68
4,43---
0,34
DT
llQY^*^0
12,46
0,0172,12
41 ,12
8,21
0,26
6,390,05
20,371,16
1,762,94--
-0,18
HTVTEIÎE IID.1
Kirli 1-Ll
0,2^
0,001
0,25
4,302,100,06
2,510,01
3,10
0,050,191 ,080,01-
0,82
-
Mcixi i'ir.1
6,700,071,99
49,12
5,660,62
7,210,048,65
45,970,8?2,910,04-
1 ,26
-
TT.T
. flay p ine—
3,070,0191 ,06
18,943,070,24
4,58
0,035,62
12,12
0,461.760,02-
1 ,04_..
84
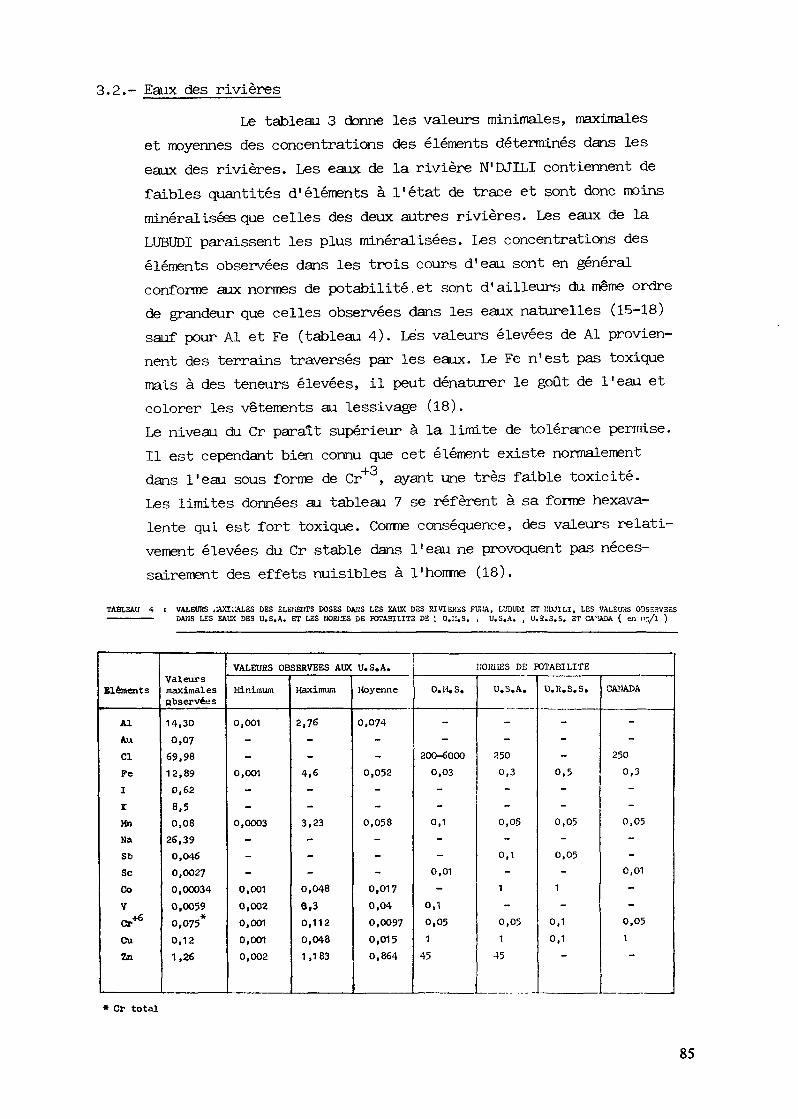
3.2.- Eaix des rivièresLe tableau 3 donne les valeurs minimales, maximales
et moyennes des concentrations des éléments déterminés dans leseaux des rivières. Les eaux de la rivière N'DJILI contiennent defaibles quantités d'éléments à l'état de trace et sont donc moinsminéralisées que celles des deux autres rivières. Les eaux de laLUBUDI paraissent les plus minéralisées. Les concentrations deséléments observées dans les trois cours d'eau sont en généralconforme aux normes de potabilité.et sont d'ailleurs du même ordrede grandeur que celles observées dans les eaux naturelles (15-18)sauf pour Al et Fe (tableau 4). Lés valeurs élevées de Al provien-nent des terrains traversés par les eaux. Le Fe n'est pas toxiquemais à des teneurs élevées, il peut dénaturer le goût de l'eau etcolorer les vêtements au lessivage (18).Le niveau du Cr paraît supérieur à la limite de tolérance permise.Il est cependant bien connu que cet élément existe normalement
i Odans l'eau sous forme de Cr , ayant une très faible toxicité.Les limites données au tableau 7 se réfèrent à sa forme hexava-lente qui est fort toxique. Comme conséquence, des valeurs relati-vement élevées du Cr stable dans l'eau ne provoquent pas néces-sairement des effets nuisibles à l'homme (18).
TABLEAU 4 I VALEURS ,HXI;ALES DES ELEliEHTS DOSES DAMS LES EAUX DES SIV1ERES FUÎiA, LUBUDI ET ÜDJILI, LES VALEURS ODSr.SVEES———————— DANS LES EAUX DES U.S.A. ET LES [10RI2S DE POTABILITE DE \ 0.;i.S. , U.S.A. , U.S.3.S. ET CA'ÎADA ( en 113/1 )
Eléments
AlAuClFeIrMnNaSbSeCoVCr*
CuZn
ValeursmaximalesObservées
14,300,07
69,9812,890,628,50,08
26,390,046
0,00270,000340,00590,075*0,121,26
VALEURS OBSERVEES AUX U.S.A.
Minimum
0,001--
0,001
--
0,0003
-
-
-
0,0010,0020,001
0,0010,002
Maximum
2,76--
4,6--
3,23
---
0,0480,30,112
0,0481,183
Moyenne
0,074--
0,052-
-0,058---
0,0170,040,00970,0150,864
HORIIES DE POTABILITE
O.H.S.
-
-
200-60000,03--
0,1
--
0,01
-0,10,051
45
U.S.A.
-
-
250
0,3
-
-0,05-
0,1
-1
0,051
45
U.R.S.S.
---
0.5--
0,05-
0,05-
1
0,1
0,1
CANADA
-
-
250
0,3
-
-
0,05--
0,01
-
0,051
* Cr total
85
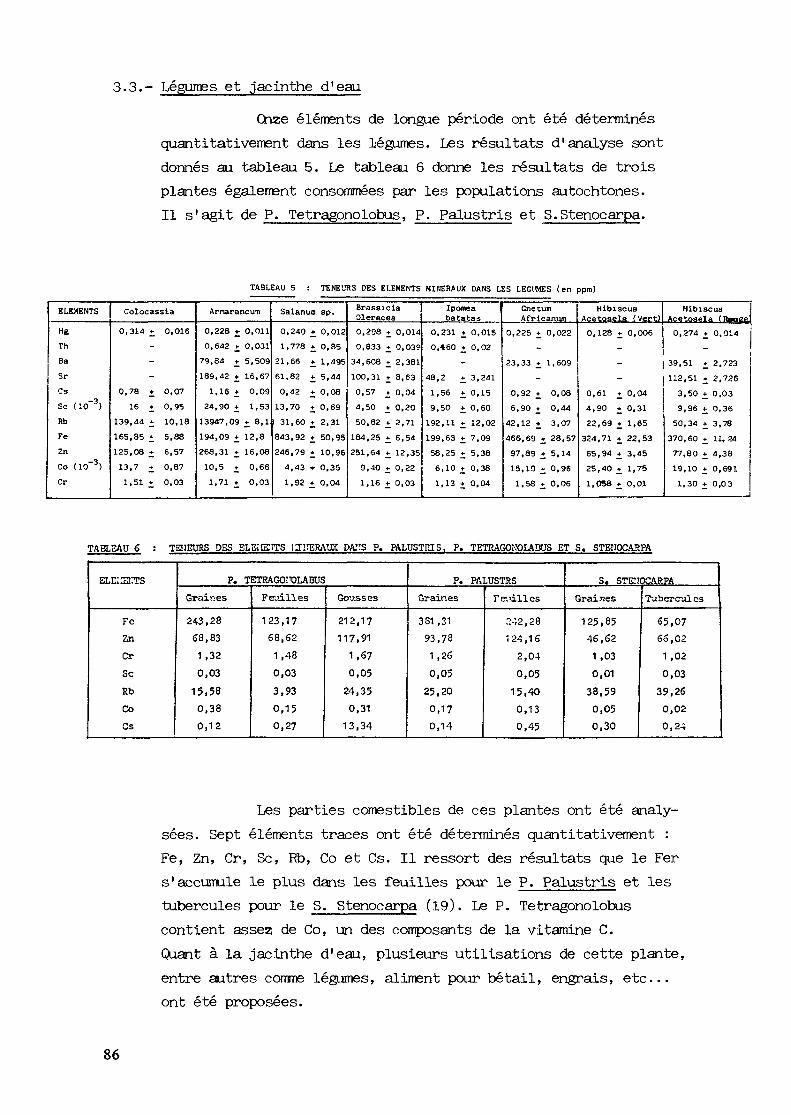
3.3.- Légumes et jacinthe d'eauOnze éléments de longue période ont été déterminés
quantitativement dans les légumes. Les résultats d'analyse sontdonnés au tableau 5. Le tableau 6 donne les résultats de troisplantes également consommées par les populations autochtones.Il s'agit de P. Tetragonolobus, P. Palustris et S.Stenocarpa.
TABLEAU 5 TENE'JRS DES ELEMENTS MINEWUX DANS LES LECIWES (en ppm)
ELEMENTS
HgThBaSrCsSe (10"3)RbFeZnCo (10~3)Cr
Colocassla0,314 ^ 0,016
---
0,78 + 0,0716 * 0,95
139,44 * 10,18165,85 * 5,38125,08 * 6,5713,7 ^ 0,871,51 * 0,03
ArnarancuTi0,228 + 0,0110,642 i 0,03179,84 + 5,509189,42 t 16,67
1,16 i 0,0924,90 + 1,5313947,09 * 8,1194,09 *. 12,8268,31 i 16,0810,5 + 0,661,71 ± 0,03
Salanua) sp.0,240 t 0,0121,778 * 0,85
21,66 ± 1,49561,82 i 5,440,42 + 0,0813,70 + 0,6931,60 * 2,31843,92 <• 50,95246,79 » 10,964,43 » 0,351,92 i 0,04
Brass ic laOleracea0,298 + 0,0140,833 «• 0,03934,608 t 2,381100,31 t 8,630,57 j. 0,044,50 + 0,2050,82 ± 2,71184,25 * 6,54251,64 i 12,359,40 » 0,221,16 * 0,03
Ipomeabatatas
0,231 + 0,0150,*60 + 0,02
-48,2 + 3,2411,56 i 0,159,50 + 0,60192,11 * 12,02199,63 + 7,0958,25 * 5,386,10 + 0,381,13 + 0,04
GnecumAfricanum
0,225 + 0,022_
23,33 * 1,609-
0,92 + 0,086,90 + 0,4442,12 + 3,07466,69 + 28,5797,89 + 5,1415,10 + 0,961,58 * 0,06
HibiscusAq^tosela ( yert)0,128 i 0,006
_--
0,61 * 0,04—4,90 * 0,3122,69 i 1,65324,71 * 22,5365,94 3,4525,40 i 1,751,058 i 0,01
HibiscusAcetoselâ f^png^0,274 * 0,014
_
39,51 + 2,723112,51 2,7263,50 i 0,039,96 t 0,3650,34 + 3,78370,60 * 11, 2477,80 * 4,3819,10 + 0,6911,30 * 0,03
TABLEAU 6 TRIEURS DES BLSErrS 1IIIERAIK PA!:S P. PALUSTRIS. P. TETRAGOKOLADUS ET S. STETTOCASPA
ELCHCTS
FcZnCrSeRbCoCs
P. TETRAGOTOLABUS
Graines
243,28
68,831,320,03
15,580,380,12
Feuilles
123,1758,621 ,480,033,930,150,2?
Gousses
212,17117,91
1,6?0,05
24,350,31
13,34
P. PALUSTRSGraines
381 ,3193,781 ,260,05
25,20
0,170,14
T édiles
2-',2,28124,16
2,040,05
15,400,130,45
S. STEOCARPAGraines
125,8546,62
1 ,030,01
38,59
0,050,30
Tubercules
65,0765,02
1,020,03
39,260,020,24
Les parties comestibles de ces plantes ont été analy-sées. Sept éléments traces ont été déterminés quantitativement :Fe, Zn, Cr, Se, Rb, Co et Cs. Il ressort des résultats que le Fers'accumule le plus dans les feuilles pour le P. Palustris et lestubercules pour le S. Stenocarpa (19). Le P. Tetragonolobuscontient assez de Co, un des composants de la vitamine C.Qaant à la jacinthe d'eau, plusieurs utilisations de cette plante,entre autres comme légumes, aliment pour bétail, engrais, etc...ont été proposées.
86
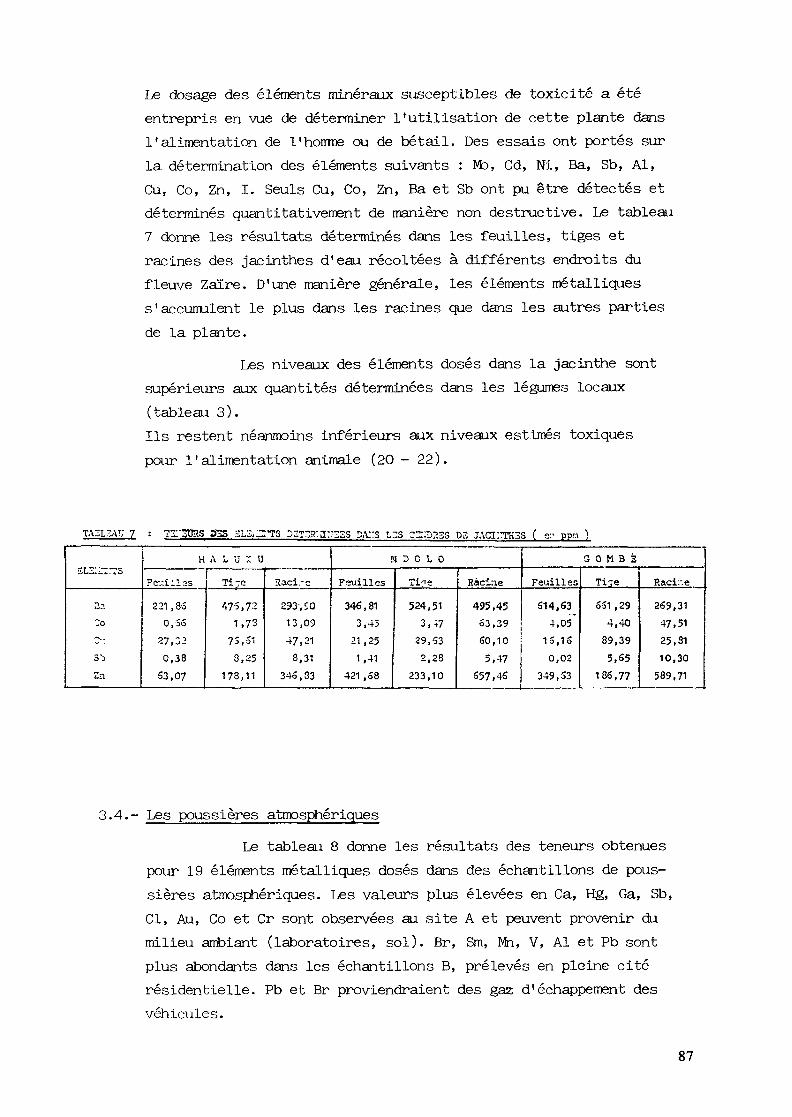
Le dosage des éléments minéraux susceptibles de toxicité a étéentrepris en vue de déterminer l'utilisation de cette plante dansl'alimentation de l'homme ou de bétail. Des essais ont portés surla détermination des éléments suivants : MD, Cd, Ni, Ba, Sb, Al,Cu, Co, Zn, I. Seuls Cu, Co, Zn, Ba et Sb ont pu être détectés etdéterminés quantitativement de manière non destructive. Le tableau7 donne les résultats déterminés dans les feuilles, tiges etracines des jacinthes d'eau récoltées à différents endroits dufleuve Zaïre. D'une manière générale, les éléments métalliquess'accumulent le plus dans les racines que dans les autres partiesde la plante.
Les niveaux des éléments dosés dans la jacinthe sontsupérieurs aux quantités déterminées dans les légumes locaux(tableau 3).Ils restent néanmoins inférieurs aux niveaux estimés toxiquespour l'alimentation animale (20 - 22).
TA3L3AT; 7 gas :-:LS,:Z:TS 3STSg:i:r
SLzi^rrs
2?.-0
^v.
3 "3
Za
HAL u :<: uFeuilles
221 , 850,55
27, 3>0,38
53,07
Ti-re
475,721,73
73,513,25
178,11
3aci.-e
293, £013,0947,21
8,31345,33
M D C L 0
Feuilles
346,813,43
21,251,41
421,58
ïi"e
524,513, +7
29,532,23
233,10
Racine
495,4553,3950,105,47
557, 46
————————————————————————— .G 0 M B 3
Feuilles
514,634,05
15,150,02
349,53
Ti^e
551 , 294,40
89,395.S5
186,77
Racit-.e
269,3147,5125,3110,30
589,71
3.4.- Les poussières atmosphériquesLe tableau 8 donne les résultats des teneurs obtenues
pour 19 éléments métalliques dosés dans des échantillons de pous-sières atmosphériques. Les valeurs plus élevées en Ça, Pig, Ga, Sb,Cl, Au, Co et Cr sont observées au site A et peuvent provenir dumilieu ambiant (laboratoires, sol). Br, Sm, Mn, V, Al et Pb sontplus abondants dans les échantillons B, prélevés en pleine citérésidentielle. Pb et Br proviendraient des gaz d'échappement desvéhicules.
87
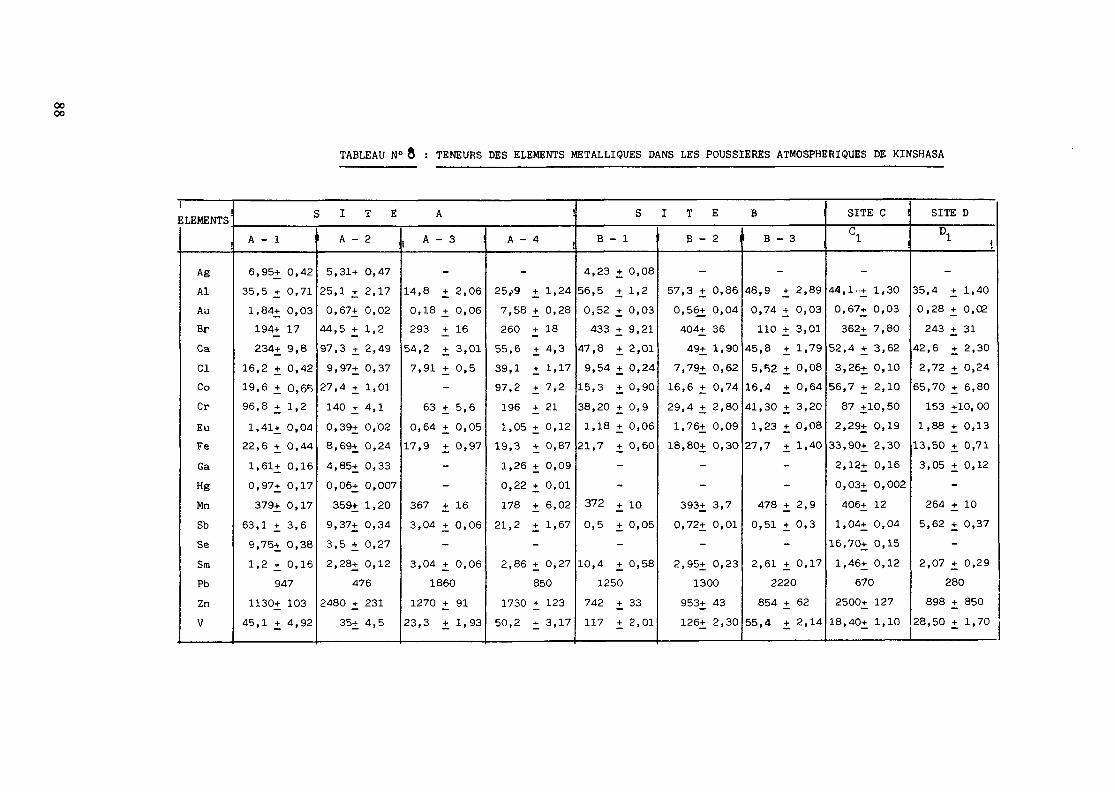
XWcoufelO)
co§o.g§EH3WgÖl
IX•z.s
n£MMUEHMKl
mHHM<WHMW
ELEMENTS
—
cTiHCOnwCQ<-iiWst<CO<(M1<i-<1<
Oc
\l
O
ST
O
O
C
O
rH
CM
C
^
Cn
O
st o
co CM
oo o
,-H r-,
rn co
CM
o p-
i-
IO
CO
CM
O<
OO
OO
O
1-4
O
O
00
rH
+ |
+|
+|
+1
+1
+1
"+I
+|
+1
+1
1
+1
+1
1
+1
00
+|
+1
co
co
CM
O
co co
o in
T C
M
r* coo
st
CM
SJ
CO
Cs
-C
"*
mC
Ol
fï
O
(Q
<0
O
Cn
in
in o
CM CM
in ,_,
co co
in CM
oo
CO
St
«3 .H
C
M
CMO
cO
OC
MO
OO
Cn
Ot
OO
s
f in
C
M
OC
OO
CO
'O
i-
l'
-l
in
r-
IC
Or
HO
O
rH
rH
P
- iH
i-
HO
C^
CO
OC
MO
OC
MO
Oi
-H
OO
O
rH
iH
l +|
+| +|
+1 +1
+1 +1
+1 +1
+1 +1
+1 +1 +1
+1 r- +1
+1.
t- C
M
<û
c
nO
CM
CO
(O
st
O<
D<
OO
Oi
-4
io
co
st
cM
p-
t~
-c
vi
cn
i-
io
oo
r-
-s
t o
t„
„o
o-
»*
co
«-
--
sf
--
- in
-
st O
C
M
CO
O
C
VJ C
O
CM
O
tH
<O
iH
C
M
CO
st in
in co
H
rHc
nc
Ot
Hc
no
o^
to
co
o r-
'JC
OO
OC
^O
'O
Cv
JO
'ï
O)
CO
H
i-H
CM
OC
Or
HO
OC
OO
tH
C\
JO
O
IO
C\1
+ 1
+
| +
1
+1
+
1
+1
+
1
+1
+
1
1
1
+1
+
11
+
1
C\j
+|
+|
•tfO
C
\J
OC
O
OO
.H
r
HC
XJ
^t
cn
t^
rH
CO
iT
'^
co
oj
t^
c--in
1
0
ini
co
o in
in<
Or
Hr
Ht~
o c
\i in
r r
.-i ^
ro in
ID-Ï
oc
vi
^r
oo
o
rn c
o o
ooo C
Dc
or
vc
oo
co
c-
-o
CM
co
OO
CO
t-
fO
OC
MO
O
CO
O
OO
^f
CM
1 +
1 +
1 +
1 +
1 +
1 +
1 +
1 +
1 +
1 1
1 +
1 +
11
+1
CO
+
| +
|<
O'
^ O
>
O>
(D
O
CO
CV
J i
ni
HC
Ol
Dr
om
o*
ït
i-«
3^
fc
--
co
o>
r-
en
mc
\j
f-O
C
^t
OC
B^
lC
O
O
CM
in
r-i C
M
|H
co c
o.-
i.-c
'tfo coo
in oo
i-iO
C\
JO
CM
OC
\1
CT
)O
1O
<U
O
in
O
Oi
HO
OJ
CM
OO
OO
O
iH
O
O
CO
CM
+ 1
+
1
+1
+1
+1
+1
+1
+1
+1
+1
1
1
+1
+1
1
+1
0
+|
+1
CO C
M
CO
**
O
CO
C
Mc
Min
inc
oc
oin
co
c\jtH
t~-
c\
im
^r
rn
cM
t^<
T<
oo
r-
cn
mo
Oi
Hr
H
co
o o
f- in
in *r
H co
CM
rH^
CO
r~
- C
MC
~C
T>
iH
CM
t-
~ C
-~ I
s-C
MO
J C
OH
CM
i
HC
OO
OO
<£
i C
M
'CO
iH.
.C
O-
--
I-
I-
--
--
- -
CM
-r
HO
r-
l<
iH
t~
C\
IO
OO
Ot
Oi
H
OO
rH
CO
+ 1 +1
+1 +1
+1 +1
+1 +1
+1 +1
+1 +1
+11 +1 oo
+| +|
1 C
O
in «
3 C
SJ
(DO
Wi
nO
CO
rH
CM
lD
OC
OC
MC
MO
OC
M
CO
C
OC
M-
, .
io
>.
..
cn
«-
--
f~
- -
r^
-i
nt
^C
\J
in
Cn
C^
rH
rH
CJ
>i
HO
rH
iH
C
M
t-
HO
CM in
co cn
rn CM
in
lO
tO
r-
t in
c^
aj
<D
c
oO
OO
in
tO
OC
T)
O
O
CD
,.
(£
,.
.
..
«
(O
« .
rH
-c
jO
iH
co
o m
oo
MO
o
en »
Hl
+1 +
1 +1 +
1 +1 l
+|
+|
+1
l l
+|
+|i
+| g
+1 +
1oo
rH
co
^r
^r
^r
rn
oc
OiH
co
cM
cn
(O
ioc
n t-
o
o
r-
co
K*
sO
)«
*>
»»
^3
*.
«
CM
-S
t O
C
M
^
f>-
Ot-
CO
CO
C
O
rH
CO
rH
in
H
CM
t^t
^t
^C
VI
O)
t^ 1
-4 C
M'
ÏC
OO
O'
îr
^C
M^
•r
HO
CM
'J
CO
Or
HO
CM
CO
OC
MC
OC
MH
rH
in
OC
MO
^I
CM
Oi
H'
ÏO
OO
Or
HO
OO
lO
CM
t
ï +1 +1 +1 +1 +1 +1 +1 +1 +1 +1 +1 $
+1 +1 +1 ^ +1 +1
co
iH
iD
in
co
o)
<a
-o
co
to
co
oi
nc
oi
r>
cM
o
co
in
in
o^
tt
^o
t^
-r
HO
co
^o
CD
CO
CM
sr
CM i
cn
cvi
c\j
CV
IrH
CO
C
MlT
T
tl
ut
-^
c^
DO
'0
C
VI
sf
t^ O
O
Os
tl
OC
MO
St
'-
li
Hi
-l
tO
CO
iH
CO
O)
o"
o"
o*
rH
Cn
OO
rH
o
"o
C3
OO
CÖ
'o
Ot
^i
H'
«T
j;i +i 41 41 4« +i +i +i +i +i +1 +i £
+i 51 +i % a
1 +l
cn
in
co
cn
co
cv
jc
DC
Os
ti
Oi
oc
nr
^r
Hr
^c
vj
co
in<
om
iH
tD
cn
cO
tH
cM
i-
io
co
cn
^ r-im
co in
in cn
cvj to
*î
oD
rH
pt
i<
di
-i
Of
H
30
)r
tM
Cü
(U
Ej
ac
<<
<P
QÜ
OO
O
wc
nü
3;
Sc
ow
co
a,
ts
i>
88
Le site D, situé presqu'à la périphérie contient des teneurs trèsfaibles en éléments métalliques.Les valeurs observées dans nos échantillons sont voisines de cellesobservées dans l'échantillon de poussière atmosphérique deMilan (23) sauf pour le Hg (23, 2 ppm), Zh (7434 ppm), V (1990 ppm),Pb (5540), Mi (1274).Eu paraît plus élevé dans nos échantillons (0,5 ppm dans 1'échantil-lons de Milan).
4.- CONCLUSIONS ET PERSPECTIVES
L'analyse par activation instrumentale montre qu'ilest possible de déterminer simultanément un grand nombre d'élémentsmétalliques, dans un délai relativement raisonable, dans unevariété de substances. Les éléments déterminés en routine dans lessubstances biologiques, comprennent Al, Au, Ba, Br, Ça, Cl, Co, Cr,Cu, Fe, Hg, I, K, La, Mg, Nà, Rb, Sb, Se, V et Zn. Des procédésde séparation radiochimiques doivent être développés pour le dosaged'autres éléments intéressants tels que As, Cd, Ni, etc...D'autres méthodes d'analyses telles que la spectrophotometried'absorption atomique, la fluorescence-X, etc... doivent égalementêtre développées.
Les résultats obtenus pour les légunres sont exploitésdans une étude beaucoup plus approfondie qui a pour objectifl'étude de la valeur nutritive des graines et tubercules, la déter-mination des substances antinutritionnelles et la promotion del'utilisation de ces graines et tubercules dans les habitudesalimentaires de la population en vue de combattre la malnutritionprotéine-calorique (19).
Quant à la jacinthe d'eau (Eichornia crassipes) lesrésultats obtenus sont exploités dans la fabrication des alimentspour bétail en particulier les porcs et la volaille (2l).
Les teneurs élevées en Hg et I ne reflètent pas lesteneurs naturelles de ces éléments dans les cheveux des sujetsZaïrois normaux.Il faudra dans l'avenir étudier le mode d'absorption de ceséléments sur les cheveux et le procédé adéquat pour l'éliminationdes contaminations externes dues à l'emploi des comestiques. La
89
collecte d'ion grand nombre d'échantillons représentatifs de toutesles couches, l'échantillonnage des cheveux à différents endroitsde la tête d'un même sujet, l'analyse des étalons standards deréférence, la poursuite du contrôle de la qualité des eaux et desaliments et l'étude de la pollution atmosphérique, conduiront àdes conclusions plus adéquates.L'analyse des sérums sanguins permettra d'élucider les effetsd'absorption par l'organisme humain de Hg et I dus aux comestiques.
B I B L I O G R A P H I E
1.- lyengar G.V. : presanpling factors in the elemental composition ofbiological systems. Anal, Chem. 54 (1982) 554 A.
2.- lyengar G.V. : Problems in trace element analysis of biologicalsystems, 4th International Conference on Trace Element Metabolism inMan and Animals, May 11 - 15, 1981, Perth, Australia.
3.- I.A.E.A., Activation Analysis of Hair as an indicator of Contaminar-tion of Man by environmental Trace Element Polluants, ReportIAEA/RL/50, Vienna (1978) (Unpriced document, to be continuallyxapdated).
4.- N.B.S., Special Publication 260, Standard Reference Materials : 1973Catalog, U.S. Dept. of Commerce, National Bureau of Standards(1973).
5.- Schelens R., Multielement analysis of river water, N.B.S. Specialpublication 464 (1976) 113.
6.- Erasmus C.S., J. Sargeant, Sellschop J.P.F., ÏA/ATTERSON J.I.W.Multielement analysis of Air and water polluants in gold mines bythermal and epithermal neutron activation.N.B.S. Special publication 464 (1976) 129.
7.- Robertson D.E., Adsorption of trace elements in Sea water on variouscontainer surfaces. Anal. Chim. Acta 42 (1968) 533.
8.- Flanagan F.J., US Geological Survey Standards First compilationof data for the new US. G.S. rocks. Geochim. et Cosmochim.Acta 33 (1969) 81.
9.- Lumu B.M., Tshiashala M.D., Emploi de l'analyse par activation àl'étude de la contamination de l'homme et de son environnement parles éléments toxiques à l'état de trace.
90
10.- A.I.E.A., Nuclear Activation Techniques in the Life Science 1978(Proc. symp. Vienna 1978) AIEA, Vienna 1978.
11.- Comeilis R., Is it possible to indentify individual by neutronactivation analysis of hair ? Médecine, Science and Law 12(1972) 188.
12.- Gordus A.A., Factors affecting the trace metal content of humanhair, Proceeding Second International Forensic Activation AnalysisConference, Glasgow 1972 ; J. Radional. chem. 15 (1973) 229.
13.- Gordus A.A., Wysocki C.M., Mäher C.C. and Wieland R.C., Traceelement content of human scalp hair, Proceeding Conference onNuclear Methods in Environmental Research, Missouri Univ. (1974).
14.- Gordus A.A., Wysocki C.M., Mäher C.C. and Wieland R.C., Traceelement content of hair ; variation along strands and as a functionof hair wash frequency, Proceeding 2nd NSF-RANN Trace contaminantsConference, Asiloman, California (1974).
15.- Kopp J.F., Krone R.C., Trace elements in water of the U.S.A five year summary of trace metals in rivers and lakes of the U.S.(October 1, 1962 - September 30, 1967) U.S. Dept of the Interior,Federal Water Pollution Control Administration.
16.- Lieser K.N. ; Neitzert V., Determination of trace elements in waterby non-destructive neutron activation, J. Radional.chem. 31 (1976) 397.
17.- Segallen P., Le fer dans les sols, Office de la Recherche Scienti-fique et Technique d'Outre-Mer (ORSTOM) Paris 1964,
18.- Clémente G.F., Mastinu G.G. Trace element concentrations in someItalian underground waters, determined by neutron activationanalysis. Proc. of Symposium, Otaniemi, 27 - 31 August 1973,I.A.E.A., 1974 p. 213.
19.- Onyembe P.M.L., Paulus J.J., Mukienga K., Kembola K., Study of thefood value of Psophorcarpus palustris Desvaux.Zaîrian Journal of Nuclear Sciences - Revue Zaïroise des SciencesNucléaires, Vol. I n° 2 (1980) pp. 51 - 64.
20.- Allaway H.W. The trace elements in biological systems, traceanalysis, physical methods, pp. 88, G.M. Msrrison Ed. Inter Se.Publ. 1965.
21.- Onyembe P.M.L., Kembola K., Wakenge B., Etude de la jacinthe d'eau(Eichomia Grassipes R.P. Reiner). I. Valeur nutritive.Revue Zaïroise des Sciences Nucléaires, Vol. 2, n° l - 2 (1981)pp. 59-69.
91

22.- Tshiashala M.D,, Lumu B.M. et al., la jacinthe d'eau : compositionminérale quantitative des éléments majeurs - Note technique(C.R.E.N.-K), 1977.
23.- Girardi F., Accuracy of chemical analysis of aribome particulates-Results of an intercomparison exercice, Accuracy in trace analysis :sampling, sample handling, Analysis, N.B.S. special publication 422.(1976) pp. 173 - 188.
92

METAL ANALYSES OF HAIR AND URINE AND THEIR USEAS EPIDEMIOLOGICAL INDICES OF ENVIRONMENTAL POLLUTION
Chief Investigator:J. MATSUBARAUniversity of Tokyo,Tokyo,Japan
The work done under this contract will be published in the openliterature. Only the titles and abstracts are reproduced below.
The full length report is available directly from Dr. Matsubara.
(I) The Significance of Elemental Analysis of Hair as Means ofDetection of Environmental Pollution
J. Matsubara*, K. Machida*** Department of Epidemiology, Faculty of Medicine,
University of Tokyo, Bunkyo, Tokyo
** Department of Public Health and Hygienics,Oita Medical College, Hazama-machi, Oita
Japan
Abstract
Correlation of metal concentration in hair with those in thecritical organs was investigated by tracer studies using ^OSgg^75Se, 109Cd and 65Zn in mice. The accumulation of these elementsin organs of the mouse including hair during acute contamination wasconfirmed. While reported results of metal concentrations in criticalorgans and hair were compiled and compared, these studies led to thefollowing conclusions.
Hair was found to be a reasonable indicator to verify thecontamination by mercury and chromium as these elements are readilydeposited into hair and stay comparatively long time. The time dependentshifts of zinc and selenium in hair reflected their kinetics in the wholebody, though their concentrations in hair were not higher than those inother organs. Hair was found to be a poor indicator in case of cadmium,as the concentration of cadmium in hair was not parallel to that in thecritical organs of the same mouse.
93

(II) Effect of Millimolar Level of Calcium Intake on Calcium,Phosphorus and Cadmium Content in Rats
K. Machida*"1", J. Matsubara**, K. Sugawara*
* Department of Public Health, Faculty of Medicine,Oita Medical College,Hazama-machi, Oita
* Environmental Health Science Division,National Institute for Environmental Studies (NIES)
**Department of Epidemiology, Faculty of Medicine,University of Tokyo, TokyoJapan
AbstractThe effect of millimolar level of Ca administration through drinking
water that is 1/75 of the Ca requirement on rats of SPF Fisher strainchronically fed with low calcium diet was demonstrated by the alerationof organ distribution of Ca, P and Cd. Livers, kidneys, femurs, hairsand feces were collected from each animal with or without Cdadministration about 600 days after the initiation of the experiment.Calcium, phosphorus and cadmium in each sample were analyzed byinductively coupled plasma spectroscopy and flameless atomic absorptionspectrophotometry. The administration of millimolar level of Ca led toincrease of Ca accumulation in liver and bone, and decrease of Ca inkidney, serum and hair among females. It seems to indicate a stimulativerole of small amount of Ca to prevent the loss of Ca from the skeletonsto outside the body among females irrespective of Cd administration.(Nutrition Reports International to be published in 1984)
94
NEUTRON ACTIVATION ANALYSIS OF HAIR ELEMENTS.INFLUENCE OF RESIDENCE, OCCUPATION AND HEALTH STATUS
S. NIESE, W. WIESENERCentral Institute of Nuclear Research, Rossendorf,Dresden, German Democratic Republic
Abstract
26 trace elements are determined in human head hair byn.a.a. in combination with a.aoS. and a.e.s. Mean values ob-tained are compared with literature data«. For selected ele-ments the influence of age in the first years of life, of re-sidence, professional burden, hormons, and diseases was stud-ied»
1. INTRODUCTION
The investigation of the concentration of essential andtoxic trace elements in human head hair was focussed on nor-mal values, professional burden with toxic elements and in-fluence on health.
The determination of normal values demonstrates the pos-sibilities of the methods and allows the comparison with datafound in the literature. If the values determined are higheror lower than the mean values of the literature, we can lookfor regionally extended sources of food contamination or adeficiency of essential elementso The need of high qualitynormal values has been formulated by the Advisory GroupMeeting "Applications of nuclear methods in environmentalresearch"[1].
The investigation into the influence of professionalburden by toxic elements allows us to develop methods formonitoring individual burdenc
According to a proposal by MOEPERT and BALDAUF [2] we hadstarted our investigations with a study about the influenceof mammary carcinoma on the trace element content of human headhair«, Our work was done in co-operation with physicians who
95

know very well the state of health of the people from whom theycollect the samples«
2 » METHODS
2ol. Neutron activation analysisThe samples were collected and cleaned according to the
IAEA-recommendation [3], irradiated in the core of the Rossen-dorf Research Reactor and measured with the help of a Ge(Li)-
20spectrometer. For the activation of short-lived nuclides F,77mSe, 110Ag, 28Al, 128I, 38C1 the samples are irradiated withinfoils and containers of polyethylene in the pneumatic tubesystem. Experimental details of the analysis are published [4],
Our results of the analysis of the standard referencematerial HH-1/IAEA are shown in table 1,
Table 1: Analysis of SRM HH-1/IAEA, (ppm)
Element
FMnCrCoCu
N
33453
A.M.
12700.8000276.749.61
S«D.
700.120.0600220.26
Element
ZnSeIAu
N
6542
A.M.
174.80,37
28.30.0164
S.D.
6.50.021.40.0013
2.2 Comparison between n.a.a., a.a.s , and a.e.s.For a.a.s. samples (100-1000 mg) are ashed in open air
at 820°K, dissolved in 0.1 N HC1, diluted1, and measured withan atomic absorption spectrometer type AAS IN (Carl Zeiss,CJena) using an acetylene-air flame.
For a.e.s. the samples (50 mg) are dry ashed on carbonpowder and the measurements are performed with a carbon arcusing a quartz crystal spectrometer type Q 24 (Carl Zeiss,Oena) with registration on photoplates.
96
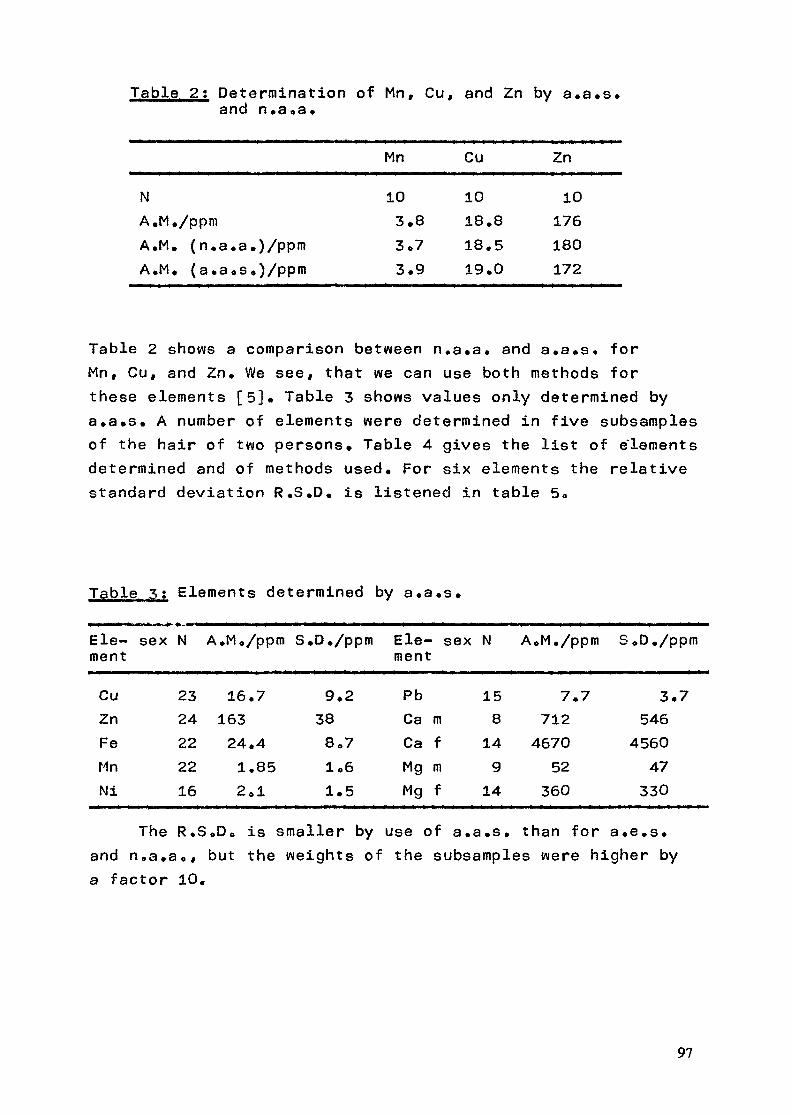
Tab 1ft 2t: Determination of Mn, Cu, and Zn by a.a.s.and n.a.a.
NA.M./ppmA.M. (n.a.aA.M. (a.a.s
.)/ppm,)/ppm
Mn
103.83.73.9
Cu
1018.818.519.0
Zn
10176180172
Table 2 shows a comparison between n.a.a. and a.a.s. forMn, Cuf and Zn. We see, that we can use both methods forthese elements [5]. Table 3 shows values only determined bya.a.s. A number of elements were determined in five subsamplesof the hair of two persons. Table 4 gives the list of elementsdetermined and of methods used. For six elements the relativestandard deviation R.S.D. is listened in table 5o
Table 5 : Elements determined by a.a.s.
Ele- sex N A.M./ppmment
CuZnFeMnNi
2324222216
161632412
.7
.4
.85
.1
S.D./ppm
938811
.2
0706.5
Ele- sex Nment
PbCaCaMgMg
mfmf
15814914
A.M./ppm
7.7712467052360
S.D./ppm
3.7546456047330
The R.S.Do is smaller by use of a.a.s. than for a.e.s.and n.a.a., but the weights of the subsamples were higher bya factor 10.
97
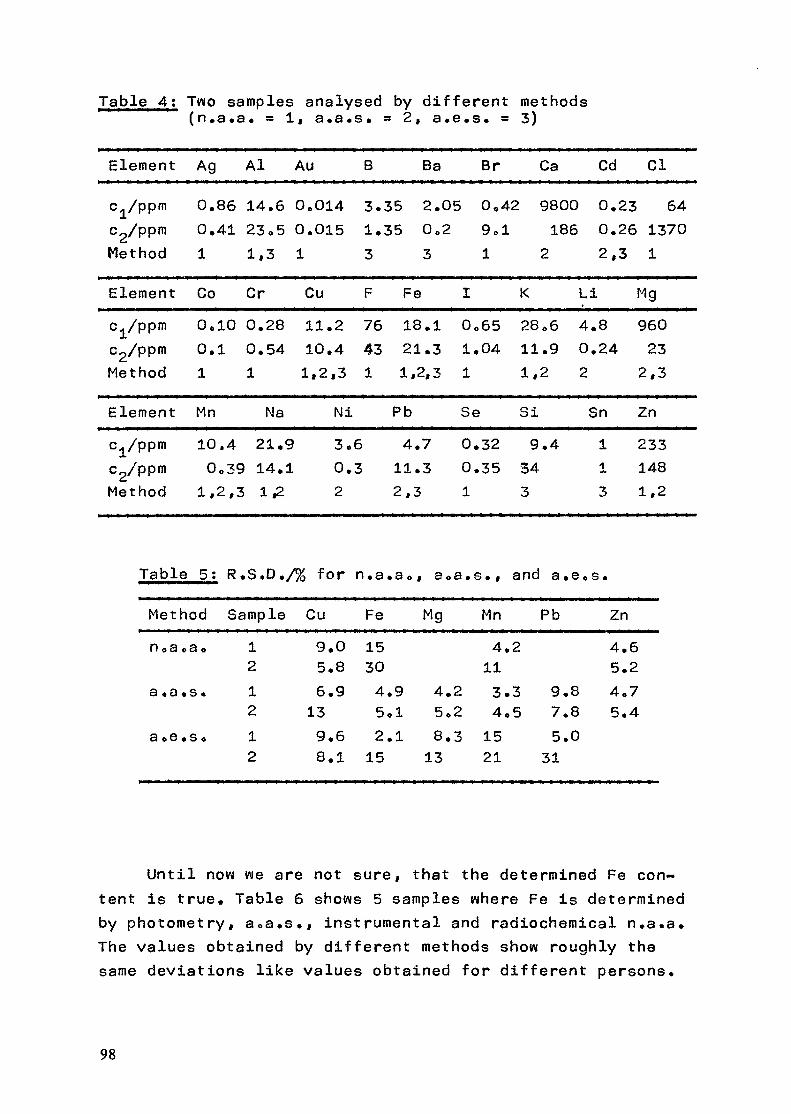
Table 4; Two samples analysed by different methods(n.a.a. = 1, a.a.s. = 2, a.e.s. = 3)
Element
c±/ppmc2/ppmMethod
Elementc±/ppmc2/ppmMethod
ElementCl/ppmc2/ppmMethod
Ag0.0.1CoOo
0.1
Mn1001,
Al
86 14.641 23 o 5
1,3
Cr10 0.281 0.54
1
Na,4 21.9039 14.12,3 1,2
Au
0„0140.0151
Cu11.210.41.2,3
Ni3«0.2
B
3.1.3
F
76431
63
3535
Fe1821
Ba
2.Oo
3
.1
.31.2,3
Pb4.11.2,3
73
052
IOo
1.1
Se0.0.1
Br
0.901
6504
3235
421
K28111,
Si9343
Ca Cd
9800 0.186 0.2 2,
Li06 4.8.9 0.242 2
Sn.4 1
13
Cl
23 6426 13703 1
Mg960232,3
Zn2331481.2
Table 5; R.S.D./% for n.a.a«., aoa.s., and a.e.s.
Methodn»a o3o
a.a.s.
a 06 .s.
Sample121212
Cu9.05.86.9139.68.1
Fe15304.95ol2.115
Mg
4.25.28.313
Mn4.2113.34.51521
Pb
9,87.85.0
31
Zn4.65.24.75.4
Until now we are not sure, that the determined Fe con-tent is true. Table 6 shows 5 samples where Fe is determinedby photometry, a0a.s., instrumental and radiochemical n»a.a.The values obtained by different methods show roughly thesame deviations like values obtained for different persons.
98

Table 6: Determination of iron in the hair of five persons" " " " " " b y different methods (ppm)
Sample
12345
A.M.
photom-etry
18.622.716.4Ilo238.621.5
a .a »s »
15.515.811.219.725.417.5
instru-mentaln .a »a •18.826.114.827.025.422.4
radio-chemicaln.a «a .
Ilo626.77.919.219.717.0
A.M.
16.123.912.619.327.319.7
3. RESULTS AND DISCUSSIONS3.1 Norma1 values
Values obtained by n.a.a. for normal persons were sum-marized in [4] and compared with the median M of the meanvalues from the literature [6] and with the geometric meanG.M. of the values determined by TAKEUCHI et al. [7], Until1980 most of the selenium values found in the literature werehigher than our values«. We found a remarkably low-standarddeviation, therefore we assume that our values reflect theminimum for good health. PARTSCHEFELD (cit0 by ANKE and RISCH[8]) detected some locations in the GoD.R«, with a deficiency ofSe in the hair of cows.Low selenium concentrations in humanhead hair were also found by CIGNA ROSSI et al. [9] in anarea of Amiata mountains in Italy and by OBRUSNIK and BENCKO[10].
3.2 Hair of childrenThe concentrations of Cu> Zn and Au in the hair of new-born
children are shown in table 8. The content of Cu and itsstandard deviation is lower than the corresponding values foradults.
99

Table 7: Comparison of determined contents with data from the" " l i t e r a t u r e , G.M./ppm, M/ppm [6]
Element
FAlClCrMnFeCoCuZnSeAgIAu
n.a.a. G.O.R.[4]
5417.78900.541.34200.38
11.71510.310.240.940.019
n0a«a. Oapan[7]
103000.56Oo48280.041
11.11760.70.280.430.011
n.a «a .[6]
4.51775
3.151.47330.4517.8166
1.952o281.020.071
3 * 3 * S * r /" ia.e.s. [6]
16o8
0.771.07220.2114.4164
1.0
Table 8: Concentration of Cu (ppm), Zn (ppm) , and Au (ppb)in the head hair of 20 male andchildren from Dena [11]
Ele-mentCu
Zn
Au
Sex
mfmfmf
A.M.
8.557«69
204220
8,558.57
S.D.
3.081.1142806.26.0
G.M.
8.257.62
2012106.66.8
A. S.O.
1.161.11Iol5
1.262.001.97
21 female new-born
M.
7o787.40
19219368
Range
6. 7. -21. 36.1. -10. 9144-338151-456
2-212-25
100
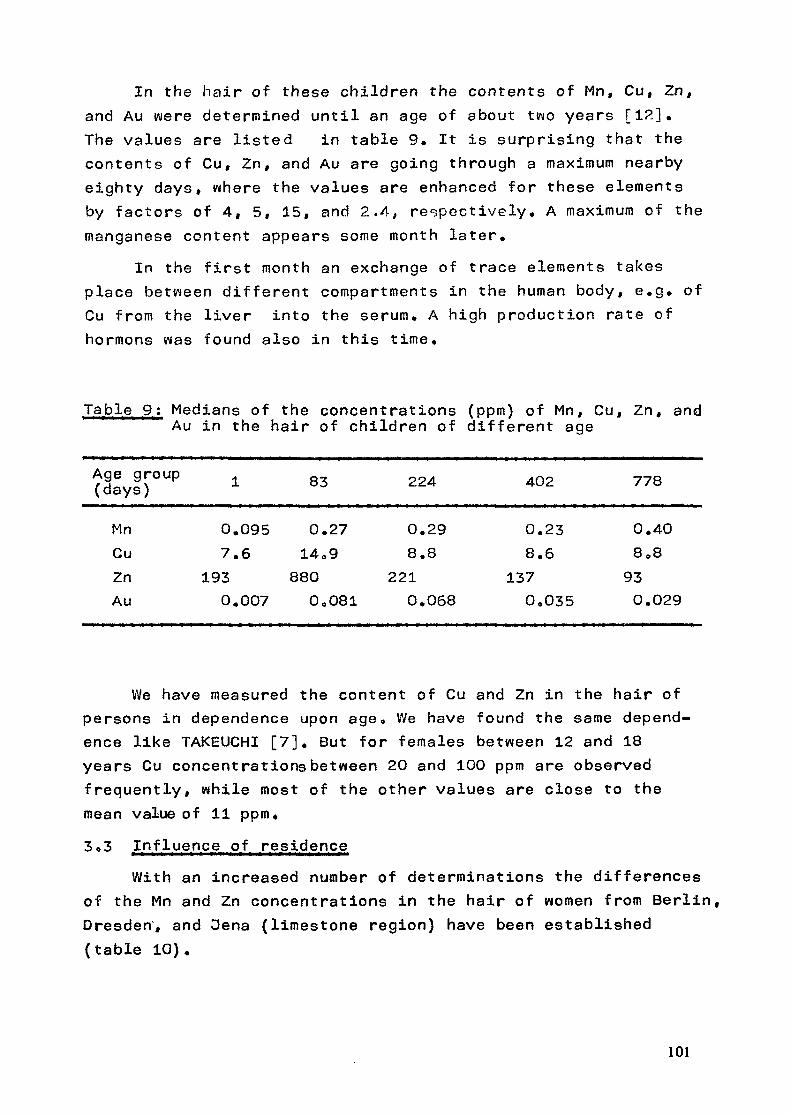
In the hair of these children the contents of Mnf Cu, Zn,and Au were determined until an age of about two years [I?.]«The values are listed in table 9. It is surprising that thecontents of Cu, Zn, and Au are going through a maximum nearbyeighty days, where the values are enhanced for these elementsby factors of 4, 5, 15, and 2.4, respectively. A maximum of themanganese content appears some month later.
In the first month an exchange of trace elements takesplace between different compartments in the human body, e.g. ofCu from the liver into the serum. A high production rate ofhormons was found also in this time.
Table 9: Medians of the concentrations (ppm) of Mn, Cu, Zn, andAu
Age group(days)
MnCuZnAu
in the hair of children of different age
1
0.0957.6
1930.007
83
0.2714.9880
0.081
224
0.298.8
2210.068
402
0.238.6
1370.035
778
0.408.8930.029
We have measured the content of Cu and Zn in the hair ofpersons in dependence upon age«, We have found the same depend-ence like TAKEUCHI [7]. But for females between 12 and 18years Cu concentrations between 20 and 100 ppm are observedfrequently, while most of the other values are close to themean value of 11 ppm.3«3 Influence of residence
With an increased number of determinations the differencesof the Mn and Zn concentrations in the hair of women from Berlin,Dresden, and Oena (limestone region) have been established(table 10).
101

Table 10: Regional influence on the Mn and Zn concen-tration (ppm) in the hair of women, takingno contraceptive
Berlin Oena Dresden
Mn 1.34 0.39 2.00Zn 130 197 157
3.4 Medical application of trac^ elementsThe gold content of serum, liver and hair of persons
being treated with Sanocrysin (sodium gold thiosulfate) forrheumatoid arthritis was determined [13,14], One week afterthe application of 35 mg Au the gold concentration in serumamounts to about 5 ppm. In liver samples up to 300 ppm weredetermined. In the hair 0.44 f 1.74 ppm (range 0.21 - 1.3 ppm.
Table rl 1 ; Se content (ppm) in the hair of normal and diseasedpersons
Group(Sex)
Normal (m)Euthr.goitre (m)Normal (f)Euthr.goitre (f)Hyper-thyroidism
MammarycarcinomaCervixcarcinoma
N
30
426
28
6
17
8
A.M.
0.36
00
0
0
0
0
.40
.30
.42
.40
.30
.36
S.D.
0.08
0.090.07
0.07
0.09
0.09
0.14
G
0
00
0
0
0
0
.M.
.35
.39
.29
.42
.39
.26
.34
S
1
11
1
1
1
1
.D.
.24
• 23.31
.20
.26
.74
.44
numberstated0.1 -0.21
2
03
0
0
5
0
of casesrange0.22 -0.46
25
323
21
5
11
6
in0.47-1.00
3
10
7
1
1
2
102
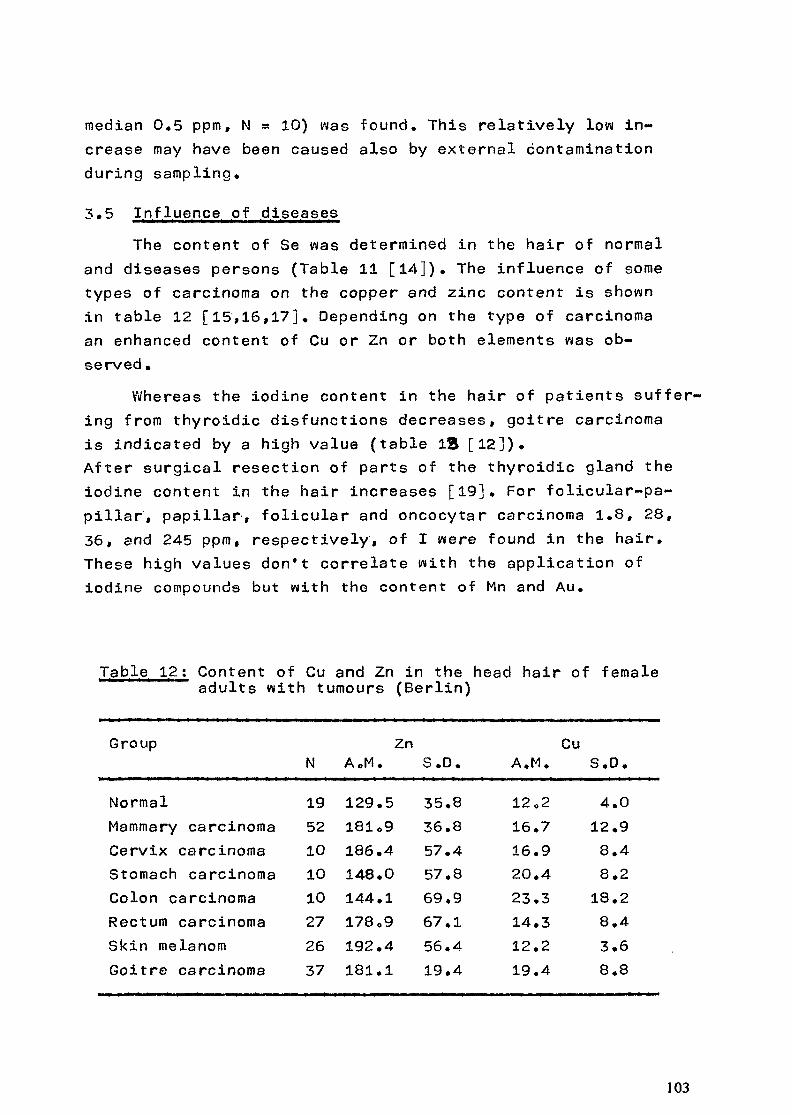
median 0.5 ppm, N = 10) was found. This relatively low in-crease may have been caused also by external contaminationduring sampling.
3.5 Influence^ ofr d±seasesThe content of Se was determined in the hair of normal
and diseases persons (Table 11 [14]). The influence of sometypes of carcinoma on the copper and zinc content is shownin table 12 [15,16,17]. Depending on the type of carcinomaan enhanced content of Cu or Zn or both elements was ob-served.
Whereas the iodine content in the hair of patients suffer-ing from thyroidic disfunctions decreases, goitre carcinomais indicated by a high value (table IB [12]).After surgical resection of parts of the thyroidic gland theiodine content in the hair increases [19]. For folicular-pa-pillar, papillar, folicular and oncocytar carcinoma 1.8, 28,36, and 245 ppm, respectively, of I were found in the hair.These high values don't correlate with the application ofiodine compounds but with the content of Mn and Au.
Table 12; Content of Cu and Zn in the head hair of female' a d u l t s with tumours (Berlin)
Group Zn CuN AoM. S.D. A.M. S.D.
NormalMammary carcinomaCervix carcinomaStomach carcinomaColon carcinomaRectum carcinomaSkin melanomGoitre carcinoma
1952101010272637
129.5181 o9186.4148.0144.1178o9192.4181.1
35.836.857.457.869.967.156.419.4
120216.716.920.423.314.312.219.4
4.012.98.48.218.28.43.68.8
103
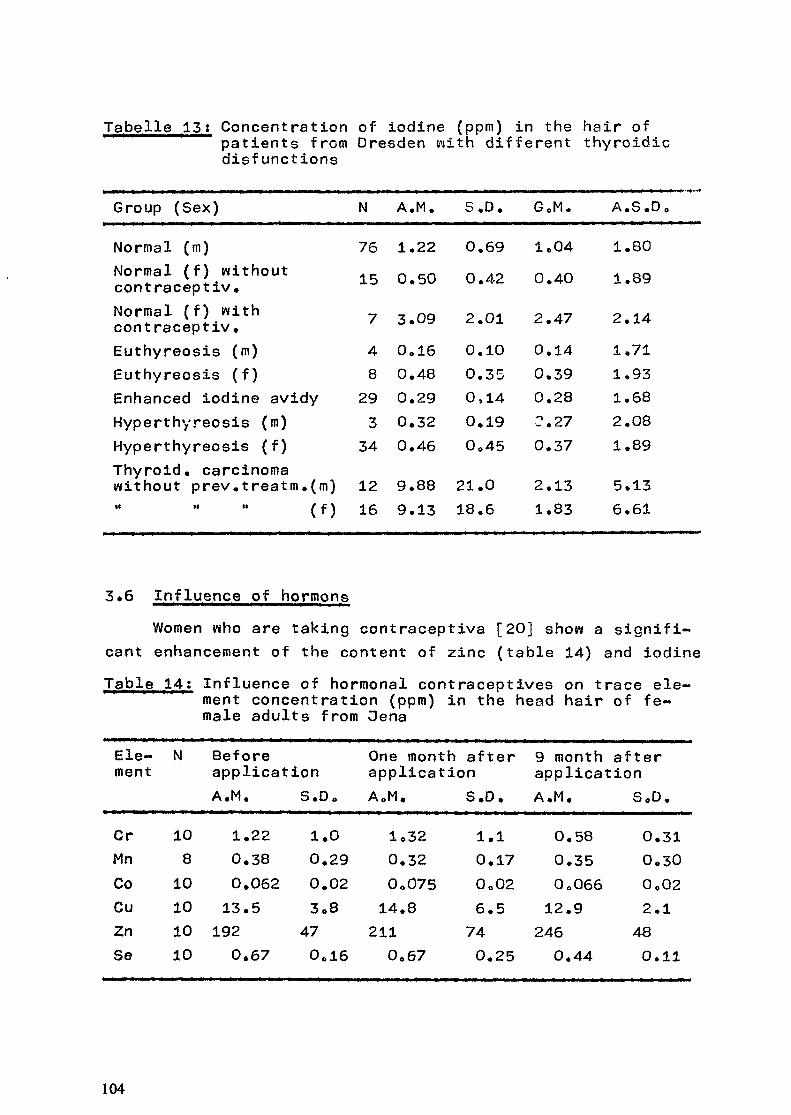
Trabel.le 1J3: Concentration of iodine (ppm) in the hair of1 1 1 1 "~" patients from Dresden with different thyroidicdisfunctions
Group (Sex)
Normal (m)Normal (f) withoutcontraceptiv.Normal (f) withcontraceptiv.Euthyreosis (m)Euthyreosis (f)Enhanced iodine avidyHyperthyreosis (m)Hyperthyreosis (f)Thyroid, carcinomawithout prev.treatm.(m)
(f)
N
7615
74829334
1216
A.M.
1.220.50
3.090.160.480.290.320.46
9.889.13
S.D.
0.690.42
2.010.100.350,140.190045
21.018.6
G.M.
Io040.40
2.470.140.390.280.270.37
2.131.83
A.S.Do
1.801.89
2.141.711.931.682.081.89
5.136.61
3.6 Influence pf_ hormoneWomen who are taking contraceptiva [20] show a signifi-
cant enhancement of the content of zinc (table 14) and iodineTa.ble, 14: Influence of hormonal contraceptives on trace ele-''-"'-' ment concentration (ppm) in the head hair of fe-
male adults from OenaEle-ment
CrMnCoCuZnSe
N
10810101010
BeforeapplicationA.M.
1.220.380.06213.5192
0.67
S.De
1.00.290.023o847O016
One month afterapplicationAoM.
Io320.320.07514.8211
0,67
S.D.
1.10.1700026.5740.25
9 month afterapplicationA.M.
0.580.3500066
12.92460.44
S.D.
0.310.300.022.1480.11
104
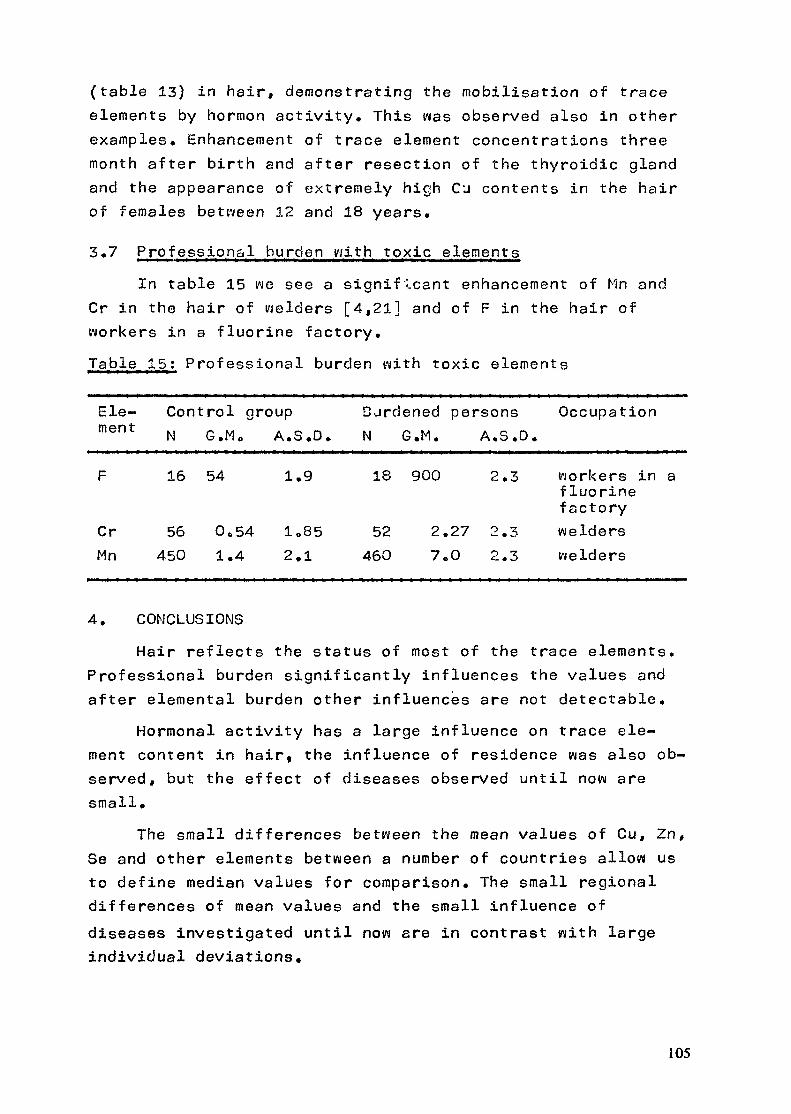
(table 13) in hair, demonstrating the mobilisation of traceelements by hormon activity» This was observed also in otherexamples» Enhancement of trace element concentrations threemonth after birth and after resection of the thyroidic glandand the appearance of extremely high Cu contents in the hairof females between 12 and 18 years»
3 »7 P ro f ess io na 1 burden wi t h toxic eernen tsIn table 15 we see a significant enhancement of Mn and
Cr in the hair of welders [4,21] and of F in the hair ofworkers in a fluorine factory.Ja,b. l e_ .1_5 : Professional burden with toxic elements
Ele- Control groupment N G.M0 A.S.D.
Burdened persons OccupationN G.M. A.S.D.
16 54 1.9 18 900 2.3 workers in afluorinefactory
CrMn
56450
Oo541.4
Io852.1
52460
2.27700
2.32.3
welderswelders
4. CONCLUSIONSHair reflects the status of most of the trace elements.
Professional burden significantly influences the values andafter elemental burden other influences are not detectable.
Hormonal activity has a large influence on trace ele-ment content in hair, the influence of residence was also ob-served, but the effect of diseases observed until now aresmall.
The small differences between the mean values of Cu, Zn,Se and other elements between a number of countries allow usto define median values for comparison. The small regionaldifferences of mean values and the small influence ofdiseases investigated until now are in contrast with largeindividual deviations.
105
5. NEEDS FOR FURTHER RESEARCHThe reasons for the large individual deviations are un-
known until now«. We propose to check the healthy peoplewhich show extreme contents of trace elements and to publishcase reports for this persons» The investigation of drinkingwater and of feed especially for these persons should be in-cluded in the programme«
REFERENCES1. IAEA: Advisory group meeting. Application of nuclear
methods in environmental research» Vienna, 22 - 26March 1976
2. VVIESENER W, NIESE S, MOEPERT S, BALDAUF K: Neutronenakti-vierungsanalytische Bestimmung von Kupfer, Zink, Manganund Gold im menschlichen Haar und Zehnagel« Radiobiol.Radiother. 5 625 - 637 (1974)
3. RYABUKHIN YuS: Activation Analysis of hair as an indi-cator of contamination of man by environmental trace ele-ment pollutants. Report IAEA/RL/50 (1978)
4. WIESENER W, GOERNER W, NIESE S, BALDAUF K, GRUND W,HENNIG M, MENDE T: Neutronenaktivierungsanalytische Be-stimmung von Spurenelementen im menschlichen Kopfhaar.Isotopenpraxis 17, 278 - 282 (1981)
5. V/IESENER W, SCHAEFER U: Vergleich der Ergebnisse durchNeutronenaktivierungsanalyse und Atomabsorptionsspektro-metrie bestimmter Spurenelemente im menschlichen Kopf-haar. Zbl. Pharm. 121 459 - 463 (1982)
6. IYENGAR GV, KOLLMER WE, BOWEN H3Mi The elemental compo-sition of human tissues and body fluids. Verlag Chemie.Weinheim, New York (1978)
7. TAKEUCHI T, HAYASHI T, TAKADA 0, HAYASHI Y, KOYAMA M,KOZUKA H, TSUOI H, KUSAKA Y, OHMORI S, SHINOGI M,AOKI A, KATAYAMA K, TOMIYAMA T: Variation of elementalconcentration in hair of Japanese in terms of age, sexand hair treatment. 3. Radioanal. Chem. 70 29 - 55(1982)
106

8. ANKE M, RISCH M: Haaranalyse und Spurenelementstatus.VEB Gustav Fischer Verlag. Oena (1979)
9. CIGNA ROSSI L. CLEMENTE GF, SANTARONI G: Mercury andselenium distribution on a defined area and its popu-lation. Arch. Env. Health 31, 160 - (1976)
10. OBRUSNIK 3, BENCKO V: INAA study on trace elements inhair of three selected population groups in Czechoslo-vakia. Radiochem. Radioanal. Letters 3j3 189 - 196(1979)
11 o KAUF E, WIESENER W. SANDER I: Der Gehalt der Spurenele-mente Zn, Cu, Mn, Au im Haar von 41 Oenaer Neugeborenen.Zbl. Pharm. 121 437 - 442 (1982)
12. KAUF E, WIESENER W, NIESE S: Der Zink-, Kupfer-, Mangan-und Goldgehalt des Haares in den ersten Lebensjahren.Vortrag 3. Tagung Nukleare Analysenverfahren 11» -15.4.1983. Dresden
13o GEIDEL Hf WIESENER W: Serumgoldspiegelbestimmungen beiSanocrysintherapae. Dt„ Gesundh.-Wesen 33 448 - 453(1978)
14. WIESENER W, GOERNER W, NIESE S: Changes in trace ele-ment concentration in hair and other organs in relationto disease and metal burden. Nuclear Activation Tech-niques in Life Sciences 1978, IAEA-SM-227/73 307 - 320
15. BALDAUF K, WIESENER W, SCHICKE B: Zum Wert der Spuren-elementbestimmung in der Früherkennung bösartiger Ge-schwülste. Zbl. Pharm. 121 417 - 421 (1982)
16o BALDAUF K, SCHICKE B, WIESENER W: Bedeutung der Spuren-elementbestimmung für Screening-Untersuchungen beiMalignomen. 3. Tagung Nukleare Analysenverfahren11» - 15,4<,1983. Dresden
17. WIESENER W, BALDAUF K, SCHICKE B: Zum Wert der Zn- undCu-Bestimmung bei malignen Schilddrüsenerkrankungen.Z. ärztl. Fortbild. 76 17-19 (1982)
18. MENDE T, WIESENER W, GOERNER W: Dodbestimmung im Haarmit Hilfe der NAA bei Patienten mit verschiedenen Schild-drüsenerkrankungen. Radiolo-diagn«, 2:3 80-82 (1982)
107
19. MENDE T, WIESONER W. GOERNER W, FRANKE WG, DOMSCHKE S:Spurenelementkonzentration im Haar bei Patienten mitSchilddrüsenerkrankungen. 3. Tagung Nukleare Analysen-verfahren 11. - 15.4al983o Dresden
20. KLINGER G, WIESENER W, DAWCZYNSKI H: Zum Einfluß hormona-ler Kontrazeptive auf den Spurenelementgehalt des Kopf-haares. Dt. Gesundh.-Wesen .36 1740 - 1742 (1981)
21. GRUND W, SCHNEIDER WO, WIESENER W: Scalp hair manganesecontent of metal arc welders in relation to exposureProc. 2nd Inten1980« BruxellesProc« 2n Intern, Congress on Toxicology, 6-11 Duly
108

FIXE ELEMENTAL ANALYSIS OFENVIRONMENTAL AND BIOLOGICAL SAMPLES *
A.S. PASCHOA, G.B. BAPTISTA, C.V. BARROS LEITE,E.G. MONTENEGRO, G.M. MAURICIO, Y.B. LERNER, P.P. ISSLERDepto. de Fisica,Pontificia Universidade Catôlica do Rio de Janeiro (PUC/RJ),Rio de Janeiro, Brasil
AbstractA PIXE (Particle Induced X-ray Emission) analytical
system was implemented at the Physics Department of thePontificia Universidade Catolica do Rio de Janeiro (POC/RJ)and used in projects involving the analyses of environmentaland biological samples. This report describes the PIXEanalytical system at PUC/RJ and summarizes the work done underIAEA Research Contract I2553/R2/RB.
1. INTRODUCTION
A PIXE (Particle Induced X-ray Emission) system for ele-mental analysis, based on the method suggested by Johansson etal. [1], was developed at (PUC/RJ), Depto. de Fisica, in 1976[2-4]. The PIXE system was implemented by taking advantage ofan extant 4.5 MV Van de Graaff accelerator and a home-builtscattering chamber initially designed to measure L x-ray crosssections of heavy elements such as Au, Tl, Pb, Bi, Th, and U15],
Following the calibration of the PIXE system implanted atPUC/RJ, a theoretical discussion of the uncertainties asso-ciated with the non-uniformity of the particle beam and thenon-homogeneity of the target sample was undertaken, and aproton beam diffusing system was inserted in the beam path toimprove the beam profile for PIXE analysis [6,7]. A number ofelemental analyses of environmental and biological samplesfrom several origins have been made since the inception of thePIXE system at PUC/RJ [4,8-11]. The experimental arrangementfor PIXE analysis at PUC/RJ has been described in detailedelsewhere with schematic views of the accelerator andperipheral equipment [4,8,12].
2. APPLICATIONS OF PIXE AT PUC/RJ
2.1 Elemental concentrations in aerosolsThe first application of the PIXE system implemented at
PUC/RJ was made by analyzing aerosol samples collected dailyat approximately 7 PM for a 21-day period in a. highly popu-
* This report summarizes the work done at PUC/RJ under theIAEA Research Contract t 2553/R2/RB.
109
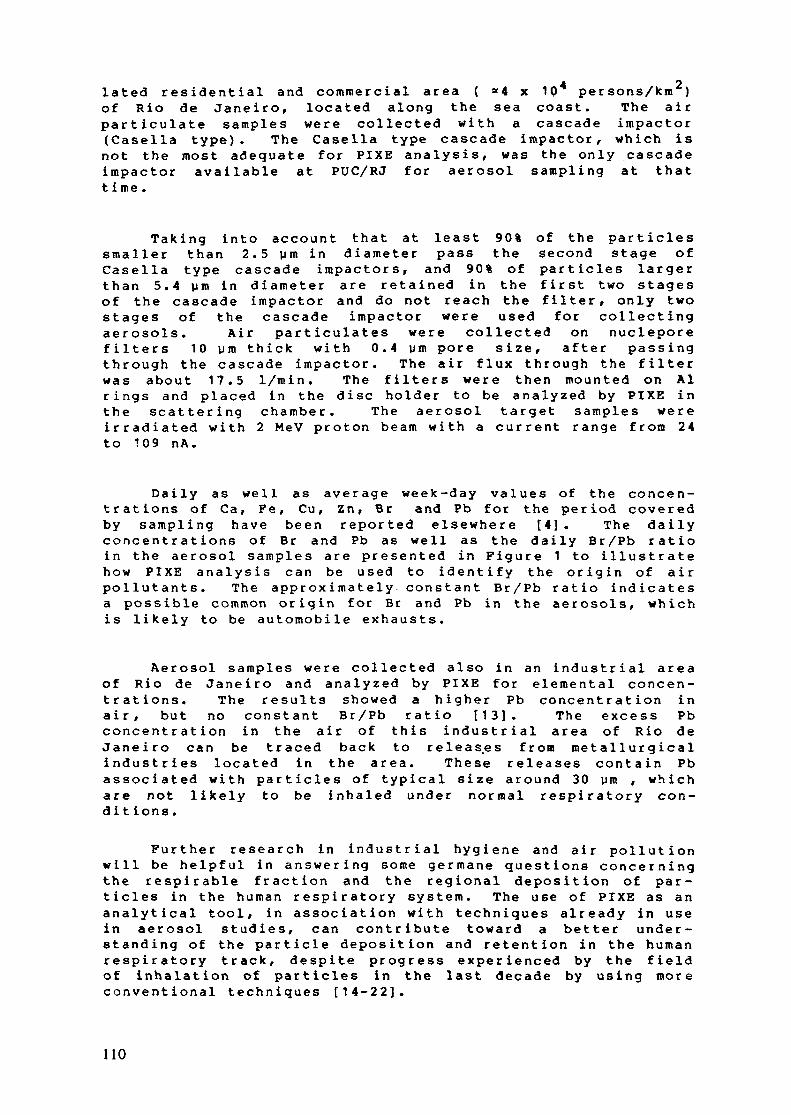
4 2lated residential and commercial area ( =4 x 10 persons/km )of Rio de Janeiro, located along the sea coast. The airparticulate samples were collected with a cascade impactor(Casella type). The Casella type cascade impactor, which isnot the most adequate for PIXE analysis, was the only cascadeimpactor available at PUC/RJ for aerosol sampling at thattime.
Taking into account that at least 90% of the particlessmaller than 2.5 pm in diameter pass the second stage ofCasella type cascade impactors, and 90% of particles largerthan 5.4 pm in diameter are retained in the first two stagesof the cascade impactor and do not reach the filter, only twostages of the cascade impactor were used for collectingaerosols. Air particulates were collected on nucleporefilters 10 pm thick with 0.4 pm pore size, after passingthrough the cascade impactor. The air flux through the filterwas about 17.5 1/min. The filters were then mounted on Alrings and placed in the disc holder to be analyzed by PIXE inthe scattering chamber. The aerosol target samples wereirradiated with 2 MeV proton beam with a current range from 24to 109 nA.
Daily as well as average week-day values of the concen-trations of Ca, Pe, Cu, Zn, Br and Pb for the period coveredby sampling have been reported elsewhere [4], The dailyconcentrations of Br and Pb as well as the daily Br/Pb ratioin the aerosol samples are presented in Figure 1 to illustratehow PIXE analysis can be used to identify the origin of airpollutants. The approximately constant Br/Pb ratio indicatesa possible common origin for Br and Pb in the aerosols, whichis likely to be automobile exhausts.
Aerosol samples were collected also in an industrial areaof Rio de Janeiro and analyzed by PIXE for elemental concen-trations. The results showed a higher Pb concentration inair, but no constant Br/Pb ratio [13]. The excess Pbconcentration in the air of this industrial area of Rio deJaneiro can be traced back to releas.es from metallurgicalindustries located in the area. These releases contain Pbassociated with particles of typical size around 30 pm , whichare not likely to be inhaled under normal respiratory con-di t ions.
Further research in industrial hygiene and air pollutionwill be helpful in answering some germane questions concerningthe respirable fraction and the regional deposition of par-ticles in the human respiratory system. The use of PIXE as ananalytical tool, in association with techniques already in usein aerosol studies, can contribute toward a better under-standing of the particle deposition and retention in the humanrespiratory track, despite progress experienced by the fieldof inhalation of particles in the last decade by using moreconventional techniques [14-22].
110
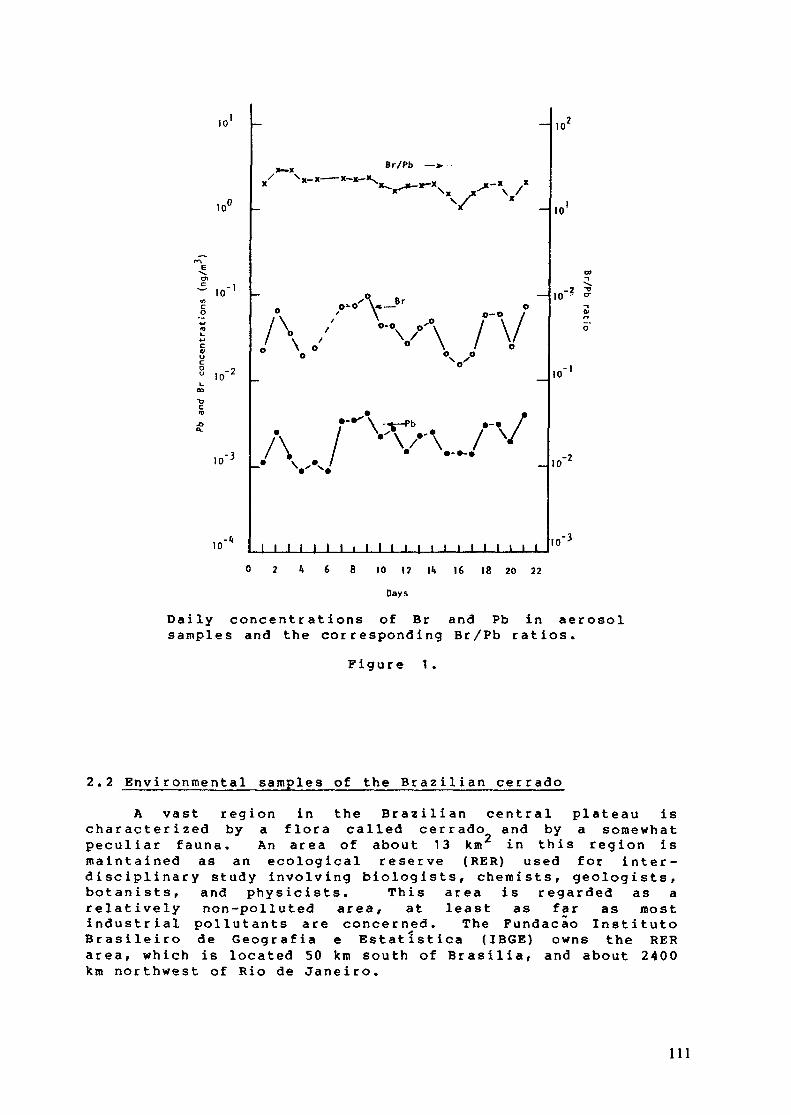
10
10
~ .o"
Ou io~
10-3
10-*"
Br/Pb ~* "
V"
v oo-o /\ /vV
1 1 1 1 1 1 1 1 1 1
,o
.0
10 - v-\<u
.o-2
-3
0 2 l( 6 8 10 12 Id 16 18 20 22
Days
D a i l y c o n c e n t r a t i o n s of Br and Pb in aerosolsamples and the co r re spond ing Br/Pb ra t ios .
F i g u r e 1 .
2•2 Environmental samples of the Brazilian cerradoA vast region in the Brazilian central plateau is
characterized by a flora called cerrado and by a somewhatpeculiar fauna. An area of about 13 km in this region ismaintained as an ecological reserve (RER) used for inter-disciplinary study involving biologists, chemists, geologists,botanists, and physicists. This area is regarded as arelatively non-polluted area, at least as far as mostindustrial pollutants are concerned. The Fundacao InstituteBrasileiro de Geografia e Estatlstica (IBGE) owns the RERarea, which is located 50 km south of Brasilia, and about 2400km northwest of Rio de Janeiro.
Ill

The PIXE technique was used as an analytical tool todetermine the metal concentrations in samples of soils andparticulate matter suspended in natural springs and rainwatercollected in the RER area. The relative concentrations of K,Ca, Zn, Cr , Cu, Ni and Ti to Fe were determined in theseenvironmental samples as well as the time variations of thoserelative concentrations occurring in suspended matter found inrainwater collected in the RER area.
The results of the determinations of the concentrationsof each of the above mentioned elements relative to Fe in theenvironmental samples of the Brazilian cerrado were presentedand discussed elsewhere 19]. The most interesting resultsfrom the PIXE analysis of environmental samples collected inthe RER area were the following:
(i) confirmation of the well known property that low calciumsoils tend to have relatively high concentrations ofheavy metals;
(ii) observation of the high relative concentration (7.5 -22%) of the Ti/Fe ratio in the soils of the area; and
(iii) observation of seasonal variations in the Zn/Fe, Cr/Ferand Cu/Fe ratios found in suspended matter in rainwatercollected in the RER area.
2.3 PIXE analysis of human hair and nailsHuman hair was chosen for the first attempt to make a
quantitative PIXE elemental analysis of a biological sample inBrazil. The choice was made under the belief that hair couldplay an important role in monitoring the contamination ofhuman beings exposed to environmental pollutants.
Two independent approaches were used for sample targetpreparation for PIXE analysis of scalp hair. First, eighthair strands of nearly circular cross section were mounted onan aluminum frame without any previous treatment other thanthe standard cleaning procedures for conventional hairanalysis. Since hair is a poor electrical conductor, anaccumulation of positive charges from absorbed protons occursduring irradiation. The resulting discharge produces a whitebackground radiation which interferes with the detection ofcharacteristic x-rays emitted from the target sample made ofhair strands. This interference was avoided by spraying thetarget sample, while being irradiated, with electrons releasedfrom a thin aluminum film placed on the collimator near thetarget. Figure 2 shows two spectra which illustrate theeffect of spraying electrons on a target sample made of hairstrands while being irradiated by 2 MeV protons.
A second method of hair target preparation consists inlabelling the samples internally with strontium, as suggestedby Whitehead [23]. Hair samples were prepared by dissolving 60
112
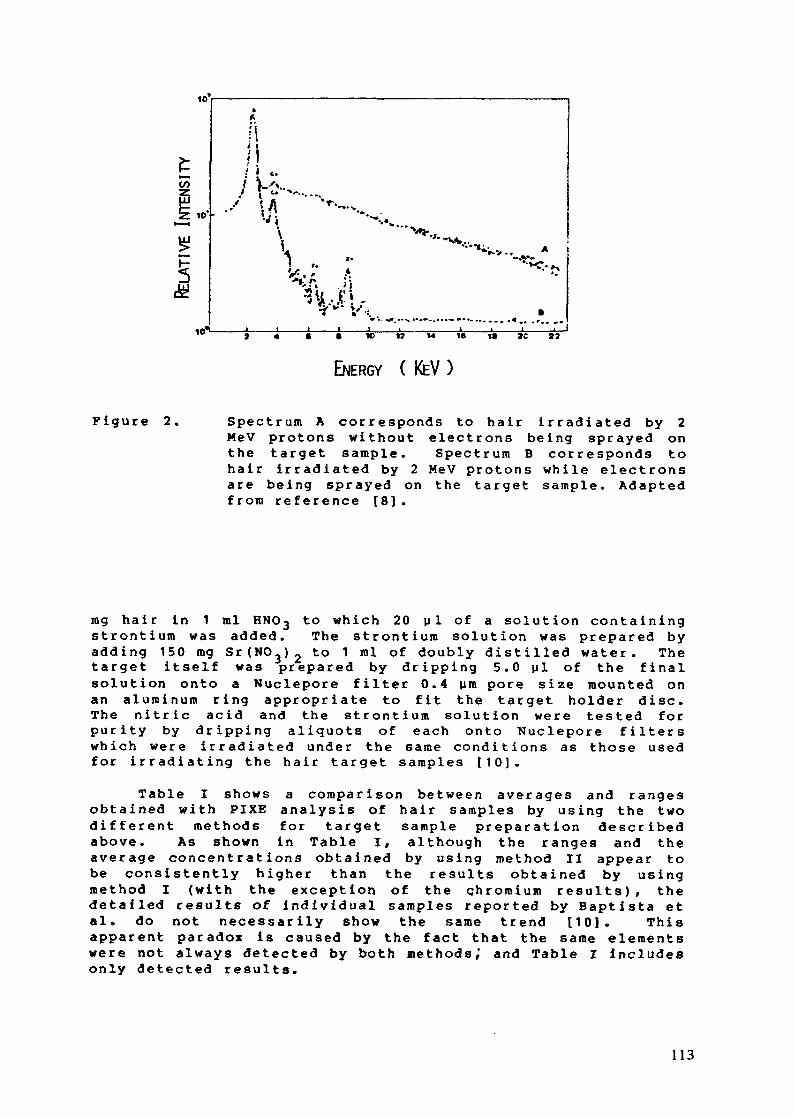
10
10
«d-
nf).' i
Ï
*•«*•-,.
M*$V- ;/..«—a- 16 1« 30 »3
ENERGY ( KeV )Figure 2. Spectrum A corresponds to hair irradiated by 2
MeV protons without electrons being sprayed onthe target sample. Spectrum B corresponds tohair irradiated by 2 MeV protons while electronsare being sprayed on the target sample. Adaptedfrom reference [8].
rag hair in 1 ml HN03 to which 20 yl of a solution containingstrontium was added. The strontium solution was prepared byadding 150 mg Sr(NO,)2 to 1 ml of doubly distilled water. Thetarget itself was prepared by dripping 5.0 yl of the finalsolution onto a Nuclepore filter 0.4 ym pore size mounted onan aluminum ring appropriate to fit the target holder disc.The nitric acid and the strontium solution were tested forpurity by dripping aliquots of each onto Nuclepore filterswhich were irradiated under the same conditions as those usedfor irradiating the hair target samples [10],
Table I shows a comparison between averages and rangesobtained with PIXE analysis of hair samples by using the twodifferent methods for target sample preparation describedabove. As shown in Table I, although the ranges and theaverage concentrations obtained by using method II appear tobe consistently higher than the results obtained by usingmethod I (with the exception of the chromium results), thedetailed results of individual samples reported by Baptista etal. do not necessarily show the same trend [10]. Thisapparent paradox is caused by the fact that the same elementswere not always detected by both methods,' and Table I includesonly detected results.
113
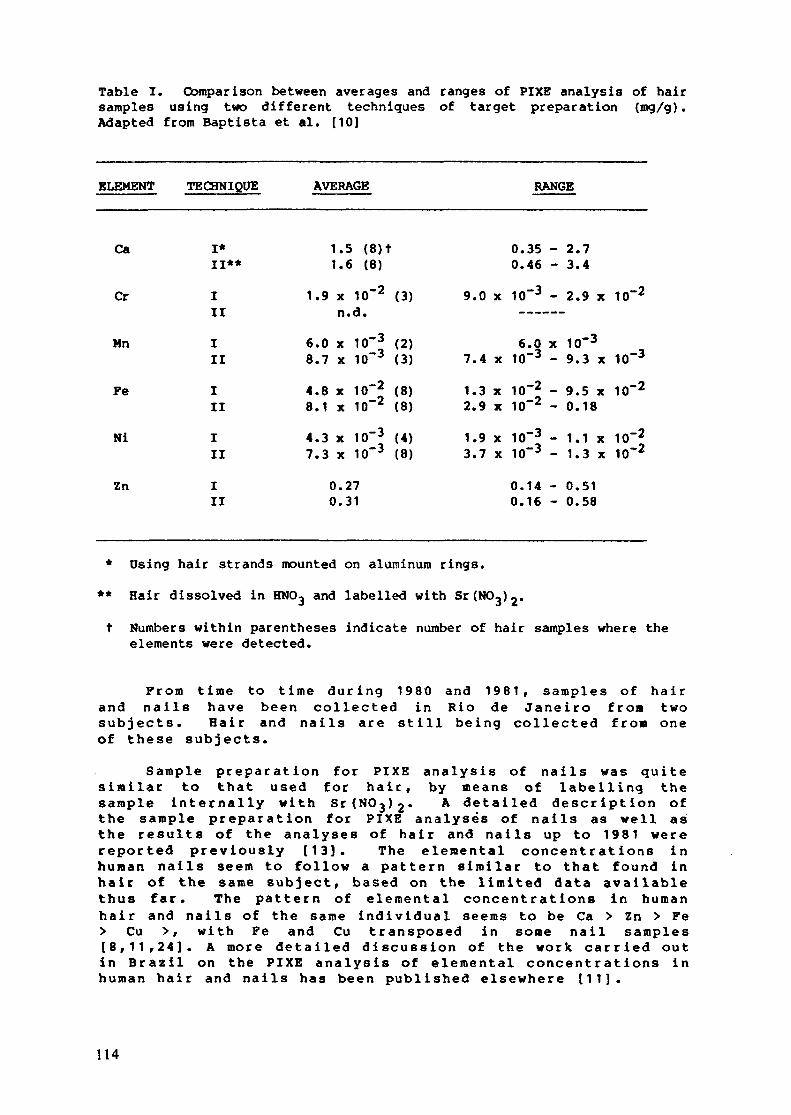
Table I. Comparison between averages and ranges of PIXE analysis of hairsamples using two different techniques of target preparation (mg/g).Adapted from Baptista et al. [10]
ELEMENT TECHNIQUE AVERAGE RANGE
Ca I*II**
Cr III
Mn III
Fe III
Ni III
Zn III
1.5 (8)t1.6 (8)
1.
6.8.
4.8.4.7.
9
078133
x 10n.d.x 10x 10x 10x 10x 10x 10
0.270.31
-2
-3-3
-2-2-3-3
(3)
(2)(3)(8)(8)(4)(8)
0.0.
9.0 x 10
67.4 x 10
1.3 x 102.9 x 101.9 x 103.7 x 10
0.0.
35 -46 --3 _
ig»-2 _-2
-3 _-3
14 -16 -
2.3.
2.
109.
9.0.1.1.0.0.
749 x
-33 x5 x18
1 x3 x
5158
IQ"2
io-3IQ'2
10l210 2
* using hair strands mounted on aluminum rings.
** Hair dissolved in HNO3 and labelled with Sr(NO3)2.
t Numbers within parentheses indicate number of hair samples where theelements were detected.
From t ime to t ime d u r i n g 1980 and 1981, samples of ha i rand nai ls have been collected in Rio de Jane i ro f roa twosubjec ts . H a i r and nails are still be ing collected f ro« oneof these subjects .
Sample p r e p a r a t i o n for P I X E analysis of na i l s was qu i t es imilar to that used for h a i r , by means of labell ing thesample i n t e r n a l l y wi th S r ( N O 3 ) 2 - A deta i led descr ip t ion ofthe sample p r e p a r a t i o n for PIXE analyses of nai ls as well asthe resul ts of the analyses of ha i r and nai ls up to 1981 werereported prev ious ly [13]. The elemental concent ra t ions inh u m a n nails seem to follow a p a t t e r n s imi la r to that found inhai r of the same subject , based on the l imited data avai lablethus f a r . The pa t t e rn of e lementa l concentra t ions in h u m a nha i r and nails of the same i n d i v i d u a l seems to be Ca > Zn > Fe> Cu >, wi th Fe and Cu transposed in some nai l samples[ 8 , 1 1 , 2 4 ] . A more de ta i l ed discuss ion of the work ca r r i ed outin B r a z i l on the PIXE analys is of e lemental concen t ra t ions inh u m a n ha i r and nai ls has been published elsewhere 111].
114
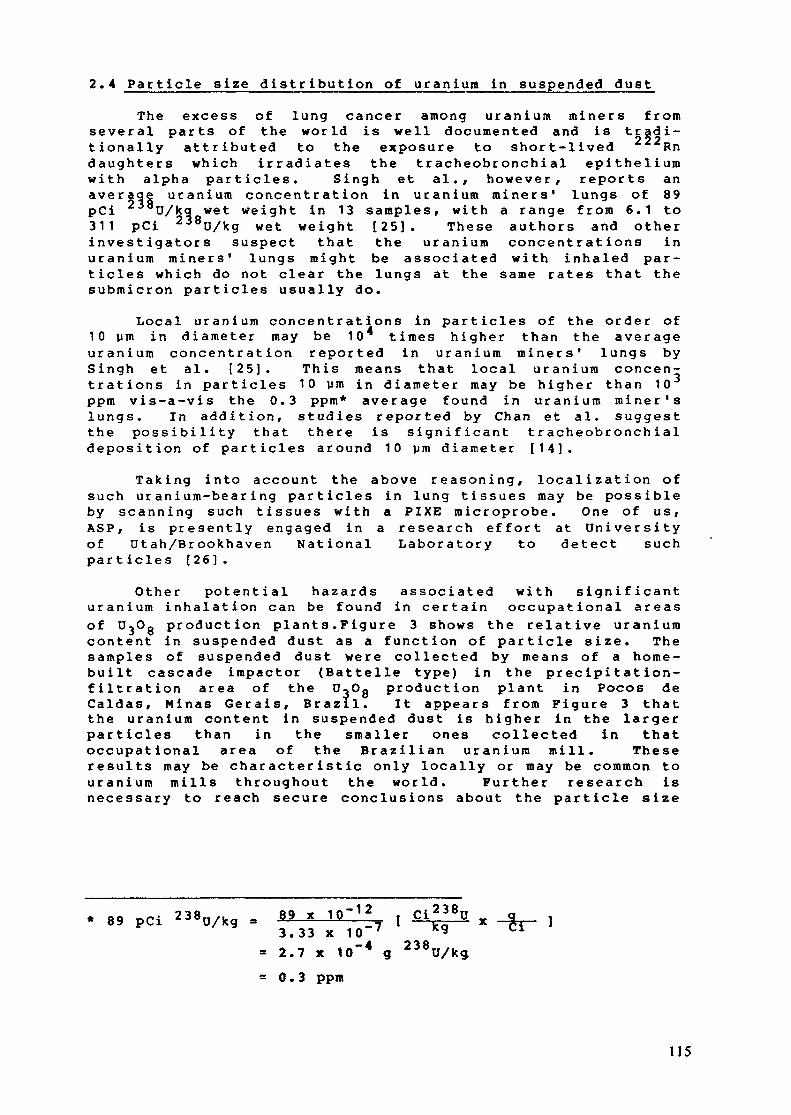
2.4 Particle size distribution of uranium in suspended dustThe excess of lung cancer among uranium miners from
several parts of the world is well documented and is tradi-tionally attributed to the exposure to short-lived Rndaughters which irradiates the tracheobronchial epitheliumwith alpha particles. Singh et al., however, reports anaverage uranium concentration in uranium miners' lungs of 89pCi U/kq wet weight in 13 samples, with a range from 6.1 to311 pCi 238U/kg wet weight [25]. These authors and otherinvestigators suspect that the uranium concentrations inuranium miners' lungs might be associated with inhaled par-ticles which do not clear the lungs at the same rates that thesubmicron particles usually do.
Local uranium concentrations in particles of the order of10 i»m in diameter may be 10 times higher than the averageuranium concentration reported in uranium miners' lungs bySingh et al. [25]. This means that local uranium concen-trations in particles 10 pm in diameter may be higher than 10ppm vis-a-vis the 0.3 ppm* average found in uranium miner'slungs. In addition, studies reported by Chan et al. suggestthe possibility that there is significant tracheobronchialdeposition of particles around 10 pm diameter [14].
Taking into account the above reasoning, localization ofsuch uranium-bearing particles in lung tissues may be possibleby scanning such tissues with a FIXE microprobe. One of us,ASP, is presently engaged in a research effort at universityof Utah/Brookhaven National Laboratory to detect suchparticles [26].
Other potential hazards associated with significanturanium inhalation can be found in certain occupational areasof DjOg production plant s.Figure 3 shows the relative uraniumcontent in suspended dust as a function of particle size. Thesamples of suspended dust were collected by means of a home-built cascade impactor (Battelle type) in the precipitation-filtration area of the O^Og production plant in Pocos deCaldas, Minas Gérais, Brazil. It appears from Figure 3 thatthe uranium content in suspended dust is higher in the largerparticles than in the smaller ones collected in thatoccupational area of the Brazilian uranium mill. Theseresults may be characteristic only locally or may be common touranium mills throughout the world. Further research isnecessary to reach secure conclusions about the particle size
* 89 pCi 238ü/kg = 89 x 10~12 r Ci238U3.33 x IQ'7 **
A t R2.7 x 10 * g ZJÖU/kg.-fr-
- 0.3 ppm
115
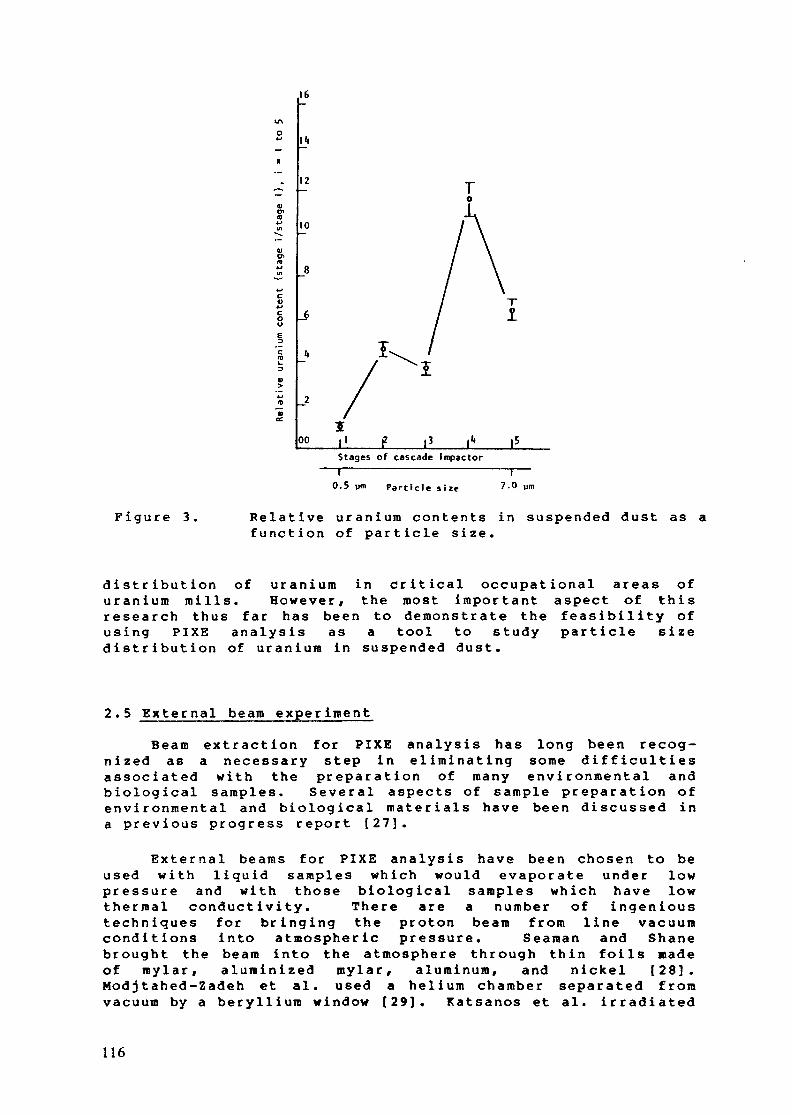
12
10
_6
00Stages of cascade Impactor
0.5 vm Particle sizeI
7.0
Figure 3. Relative uranium contents in suspended dust as afunction of particle size.
distribution of uranium in critical occupational areas ofuranium mills. However, the most important aspect of thisresearch thus far has been to demonstrate the feasibility ofusing PIXE analysis as a tool to study particle sizedistribution of uranium in suspended dust.
2.5 External beam experimentBeam extraction for PIXE analysis has long been recog-
nized as a necessary step in eliminating some difficultiesassociated with the preparation of many environmental andbiological samples. Several aspects of sample preparation ofenvironmental and biological materials have been discussed ina previous progress report [27].
External beams for PIXE analysis have been chosen to beused with liquid samples which would evaporate under lowpressure and with those biological samples which have lowthermal conductivity. There are a number of ingenioustechniques for bringing the proton beam from line vacuumconditions into atmospheric pressure. Seaman and Shanebrought the beam into the atmosphere through thin foils madeof mylar, aluminized mylar, aluminum, and nickel [28].Modjtahed-Zadeh et al. used a helium chamber separated fromvacuum by a beryllium window [29]. Katsanos et al. irradiated
116

liquid samples in air by bringing the beam to non-vacuumconditions through a 7.6 pm beryllium foil [30]. Deconninckextracted a bean 1 mm in diameter and 50 nA of currentintensity through a 2.3 mg/cm aluminum window to irradiateliquid samples [31]. Shroy et al. used a windowless exit portto bring the beam to atmospheric conditions by using pinholeswith apertures from 100 down to 12.5 ym in diameter, anddifferential pumping [32].
Some very interesting papers dealing with applications ofexternal beams have been presented in the second PIXEconference held in Lund/ although the advantages anddisadvantages of using an external beam vis-a-vis theirradiation of samples in vacuum were not discussed* at thatConference. There is an obvious simplification in samplepreparation procedures by extracting the beam for PIXEanalysis. However, inherent problems associated with beamextraction techniques remain to be solved. The accuratemeasurement of beam intensity in air is one of theseproblems. An effort was initiated at PUC/RJ to detect andmeasure the beam intensity of a proton beam extracted to theair.
A detailed description of the experimental arrangementmounted at PUC/RJ to extract and detect the proton beam in theair was presented in the last progress report, which includeda schematic view of the sliding current integrator used todetermine the external beam current at the target sample site[33]. A 2 MeV proton beam was extracted through an aluminumwindow 12.5 ym thick. The beam current in the air wasdetected by an electronically insulated metallic disk actingas a Faraday cup. The electrical pulses generated by theprotons striking the aluminum disk were digitized andintegrated. According to a number of measurements made of theexternal to internal integrated proton beam current, 27 ± 8%of the beam crosses the aluminum window placed at the end ofthe beam line and reaches a target sample placed in the air8.0 cm away. This method of detecting and measuring theintensity of the internal beam current has the advantage ofindicating with a certain degree of accuracy the proton beamcurrent actually reaching the target sample.
The external beam can also be easily monitored by thedetection of either the characteristic x-ray peak of argonpresent in the air irradiated by the external beam beforereaching the target sample, or of one or more gamma raysproduced by nuclear reactions which occur in the aluminumwindow and surrounding materials likely to be reached by thebeam. However, the addition of a gamma ray detector near theend of the beam line is necessary in the latter case, as shownby Deconninck [34]. The detection of argon characteristic x-rays to monitor the external beam may be made in some caseswith the same Si(Li) detector used to obtain x-ray spectrafrom irradiated target samples. However, the low energy (2.96KeV) of the argon K x-ray peak associated with the timevariations of the argon concentration in air make the use ofthis technique to monitor the external beam difficult underthe usually uncontrolled atmospheres found in acceleratorlaboratories which are involved in PIXE analysis only part-time.
117

External Irradiation with currents up to 100 nA wereperformed in the preliminary experiments. Several envi-ronmental and biological samples were irradiated by theexternal proton beam implemented at PDC/RJ. However, thecalibration procedures were interrupted because modificationshad to be made in the accelerator for other experiments. Theexperiments necessary to calibrate the external beam of thePIXE system at PUC/RJ are relatively simple compared to thosealready undertaken, and it is expected they can be reinitiatedin the near future. When the external beam is finallyoperational for quantitative PIXE analyses, the results thenobtained by irradiating IAEA standards and reference materialssuch as human hair (HH-1), animal bone ashes (H-5), driedplankton (MA-A1), and dried fish (MA-A2) will be used tocompare results obtained under vacuum and non-vacuumconditions. Analytical results of the IAEA referencematerials HH-1, MA-A1, and MA-A2 obtained under vacuumconditions have been reported earlier [12,27]. A series ofanalyses of HH-1 was included in an IAEA intercorapar isonexercise. Participation in future IAEA intercomparisonexercises using H-5 and other reference materials is expectedto include results to be obtained with the external beam.3. CONCLUSIONS
The main conclusions to be drafted from this report canbe listed as follows:(i) PIXE analysis of environmental samples have beensuccessfully undertaken in a series of projects.
(ii) Sample preparation procedures have been improved toallow PIXE elemental analysis of biological samples such ashair and nails.
(iii) A proton beam was extracted to the air, and a device todetect and integrate the external current reaching thetarget sample was developed to facilitate PIXE analysis ofliquids and biological materials with low thermalconductivity.
(iv) A project is underway to establish, via PIXE analysis,the particle size distribution of uranium in suspended dustin critical occupational areas of a uranium mill.
(v) The IAEA Research Contract No. 2553/R2/RB has helped toestablish a reliable system for PIXE analysis ofenvironmental and biological samples at PUC/RJ, but futuresupport from IAEA will be welcome to maintain thefeasibility of this PIXE system.
118
4. ACKNOWLEDGEMENT
The authors wish to register that they are indebted tomany individuals who helped in diverse phases of this project.Special credits are due to the staff and* graduate students atthe Laboratorio F. X. Roser, Depto. de FÎsica, PITC/RJ fortheir aid throughout the years.
The Brazilian agencies Com is s'a o Nacional de EnergiaNuclear (CNEN), Conselho de Desenvolvimento Cientifico eTecnologico (CNPq), and Financiadora de Estudos e Projetos(FINEP) sponsored this work in conjunction with the IAEA.
One of us, ASP, is particularly grateful to the directorand administrative staff of the University of Utah, Divisionof Radiobiology, where this report was typed and printed.
REFERENCES
1. JOHANSSON TB, AKSELSSON R, JOHANSSON, SAE: X-rayanalysis: Elemental trace analysis at the 10 glevel. Nucl. Instr. and Meth. 84 141-143 (1970)
2. MONTENEGRO EC: Pontifîcia Universidade Catolica do Riode Janeiro, Tese do Mestrado, (1977)
3. MARGULIS W: Pontifîcia Unversidade Catolica do Rio deJaneiro, Tese de Mestrado, (1977)
4. PASCROA AS, MONTENEGRO EC, MARGULIS W, DE PINHO AG,BARROS LEITE CV, BAPTISTA GB: PIXE elemental analysisof air particulates and a geochemical referencesample. Nuclear Methods in Environmental and EnergyResearch (Proc. Int. Conf., Columbia, Missouri, 1977),James R. Vogt, editor, CONF. 771072, Department ofEnergy, USA, 21-48 (1977)
5. BARROS LEITE CV, CASTRO FARIA NV, DE PINHO AG : L-subshell ionization of Au, Tl, Pb, Bi, Th, and U byprotons. Phys Rev. AI 5 943-955 (1977)
6. MONTENEGRO EC, BAPTISTA GB, PASCHOA AS, BARROS LEITECV: Uncertainties in elemental quantitative analysis byPIXE. Nucl. Instr. and Meth. 159 153-156 (1979)
7. MONTENEGRO EC, BAPTISTA GB, BARROS LEITE CV, DE PINHOAG, PASCHOA AS: Study of a proton beam diffusing systemfor PIXE analysis. Nucl. Instr. and Meth. 164 231-234(1979)
8. DE PINHO AG, MONTENEGRO EC, BARROS LEITE CV, BAPTISTAGB, PASCHOA AS: Potencialidades e possîveis aplicacôesde um novo método analitico (PIXE). An. Acad. Brasil.Cienc. 51 336-393 (1979)
119
9. PASCHOA AS, BAPTISTA GB, MONTENEGRO EC, BARROS LEITE CV,COLLEN TL: Elemental analysis by PIXE of environmentalsamples of the Brazilian cerrado. Nuclear Methods inEnvironmental and Energy Research (Proc. Int. Conf.,Columbia, Missouri, 1980), James R. Vogt, editor,.CONF.-800433, Department of Energy, USA, 147-158 (1980)
10. BAPTISTA GB, MONTENEGRO EC, PASCHOA AS, BARROS LEITECV: Analysis of trace elements in human hair by PIXE.Nucl. Instr. and Meth. 181 263-267 (1981)
11. PASCHOA AS, BAPTISTA GB, MAURICIO GM, BARROS LEITE CV,ISSLER PF: PIXE analysis of elemental concentrations inhuman hair and nails . Presented at the 3rdInternational Conference on Particle-Induced X-RayEmission (PIXE) and Its Analytical Applications,Heidelberg, July 18-22, 1983. To be published in Nucl.Instr. and Meth. (Feb. 1984).
12. PASCHOA AS, BAPTISTA GB, BARROS LEITE CV, MONTENEGRO EC,MAURICIO GM: PIXE elemental analysis of environmentaland biological samples. Progress Report presented atthe First IAEA-RCM/CRP on Nuclear Methods for Health-Related Monitoring of Trace Element Pollutants, Namur,Belgium, Aug. 31-Sept. 4, 1981, 19 pp. (1981)
13. BAPTISTA GB, MÜLLER A, PASCHOA AS: Unpublished (1981)
14. CHAN TL, LIPPMANN M: Experimental measurements andempirical modelling of the regional deposition ofinhaled particles in humans. Am. Ind. Hyg. Assoc. J. 41399-409 (1980)
15. STUART BO: Deposition of inhaled aerosols. Arch. Int.Med. 131 60-73 (1973)
16. DAVIES CN: Deposition of inhaled particles in man.Chera. Ind. 441-444 (June 1, 1974)
17. MORROW PE: Theoretical and experimental models for dustdeposition and retention in man. Rev. Environ. Health _1_186-212 (1974)
18. YEH HC, PHALEN RF, RAABE OG : Factors influencing thedeposition of inhaled particles. Environ. HealthPerspect. 15 147-156 (1976)
19. LIPPMANN M: Regional deposition of particles in thehuman respiratory tract. Handbook of Physiology--Reaction of Environmental Agents,' D.H.K. Lee et al.,editors. The American Physiological Society, Bethesda,213-232 (1977)
20. YEH HC, SCHUM GM : Models of human lung airways andtheir application to inhaled particle deposition. Bull.Math. Biol. 42 461-480 (1980)
120

21. STAHLHOFEN W, GEBHART J, HEYDER J: Experimentaldetermination of the regional deposition of aerosolparticles in the human respiratory tract. Am. Ind. Hyg.Assoc. J. 41 385-398a (1980)
22. BOHMING DE, ATKINS HL, COHN SH: Long term particleclearance in man: normal and impaired. InhaledParticle, (Proc. Int. Symp. Cardiff, Wales, 1980), W.H.Walton, editor, Unwin Brothers, Surrey, (1981)
23. WHITEHEAD NE: Methods of hair analysis by (p,x). Nucl.Instr. and Meth. 164 381-388 (1979)
24. MADRICIO GM: Pontifîcia Universidade Catolica do Rio deJaneiro, Tese de Mestrado (1982)
25. SINGH NP, WRENN ME, ARCHER VE, SACCOMANNO G: Ü-238, Ü-234 and Th-230 in uranium miners' lungs. RadiationHazards in Mining: Control, Measurement, and MedicalAspects (Proc. Int. Conf., Golden, Colorado, 1981),Manuel Gomez, editor, Society of Mining Engineers, NewYork, 236-239 (1982)
26. PASCHOA AS, WRENN ME, MILLER SC, JONES KW, CHOLEWA M,HANSON AL: MicroPIXE as a tool to search for uranium-bearing particles in lung tissue. Neurotoxicology _4_,205-210 (1983)
27. PASCHOA AS, BAPTISTA GB, MAURICIO GM, BARROS LEITE CV,MONTENEGRO EC: PIXE elemental analysis of environmentaland biological samples. Progress Report to the IAEA/CRPon Nuclear Methods in Health-related Monitoring of TraceElement Pollutants, Reasearch Contract No. 2553/R1/RB,12 pp. (May 1982)
28. SEAMAN GG, SHANE KC: Trace element analysis by x-rayfluorescence with an external proton beam. Nucl. Inst.and Meth. 126 473-474 (1975)
29. MODJTAHED-ZADEH R, RASTEGAR B, GALLAMNN A, GUILLAUME G,JUNDT F: Analyse sous helium par la technique defluorescence x induite par protons. Nucl. Instr. andMeth- 131 563-565 (1975)
30. KATSANOS AA, XENOOLIS A, HADJANTONIOO A, FINK RW: Anexternal beam technique for protoh-induced x-ray emis-sion analysis. Nucl. Instr. and Meth. 137' 119-124(1976)
31. DECONNINCK G: Trace element analysis in liquids byproton x-ray emission. Nucl. Instr. and Meth. 142 275-284 (1977)
32. SHROY RE, KRANER HW, JONES KW: Proton microbrobe withwindowless-exit port. Nucl. Instr. and Meth. 157 163-168 (1978)
121

33. PASCHOA AS, BAPTISTA GB, HARROS LEITE CV: PIXBelemental analysis of environmental and biologicalsamples. Progress Report to the IAEA/CRP on NuclearMethods in Health-related Monitoring of Trace ElementPollutants, Research Contract No. 2553/R2/RB, 12 pp.(January 1983)
34. DECONNINCK 6: Non-vacuum analysis. Rapport LARN 762,Facultés Universitaires Notre Dame de la Paix, Naraur,Belgium, 10 pp. (1976)
122
ELEMENTAL ANALYSIS OF HAIR SAMPLES USINGENERGY DISPERSIVE X-RAY FLUORESCENCE ANDATOMIC ABSORPTION SPECTROSCOPY
A.A. YOUSIF, A.M. ELHINDI*, M.A.H. ELTAYEB,A.S.HASSANResearch Division, Sudan Atomic Energy Commission,Khartoum
* National Health Laboratory, Khartoum
Sudan
Abstract
Elemental analysis of hair samples was performed using energy dispersive X-rayfluorescence. The ion exchange preconcentration technique was employed. Thecapacity of the exchanger used-cellulose hyphan at different pH was investiga-ted to determine the optimum pH for the resin. The capacity of the resin totake up elements of interest from mixed solutions was also analysed using atomicabsorption spectroscopy.
1. INTRODUCTIONThe radioisotope energy dispersive X-ray fluorscence (EDXRF) is anuseful
technique for multi-element analysis of samples. The sensitivity of the methodfor the different elements of the periodic table depends on the excitationsource used. This technique is widely used for the analysis of solid samples.An attempt to analyse hair samples quantitatively using bulk material was not
successful due to the difficulty in incorporating standards in the solid form.Quantitative analysis of liquid samples also proved to be not successful dueto lack of sensitivity.Different preconcentration techniques to present the liquid sample in a more
dense form and hence improve the sensitivity are applied to energy dispersiveX-ray fluorscence when liquid samples are to be analysed (1) . The ion exchangerpreconcentration technique was chosen here and was found to be strongly pHdependntLieser et at (2) have used the EDXRF method for the analysis of water. They
used cellulose hyphan ion exchanger for the preconcentration of the watersamples. The water passed through a snail column filled with 1-2 g of cellul-ose substituted with hyphan as a group of high selectivity, eluted afterwardswith a small amount of hydrochloric acid, shaken with 0.1 g of cellulose hyphanfor 30 minutes while the pH was slowly adjusted to 7 with soduim hydroxide andfiltered in a spectrocup to form a thin layer sample.
In this study we have used a modified Lieser method. The procedure hasbeen simplified and an infinitly thick sample was used for EDXRF analysis.Sodium hydroxide and buffer solutions (acitic acid sodium acetate) were bothused for the adjustment of the pH.
Atonic absorption spectroscopy was used here to establish the capacity of theresin and for the analysis of hair samples from normal and polluted groups.
123
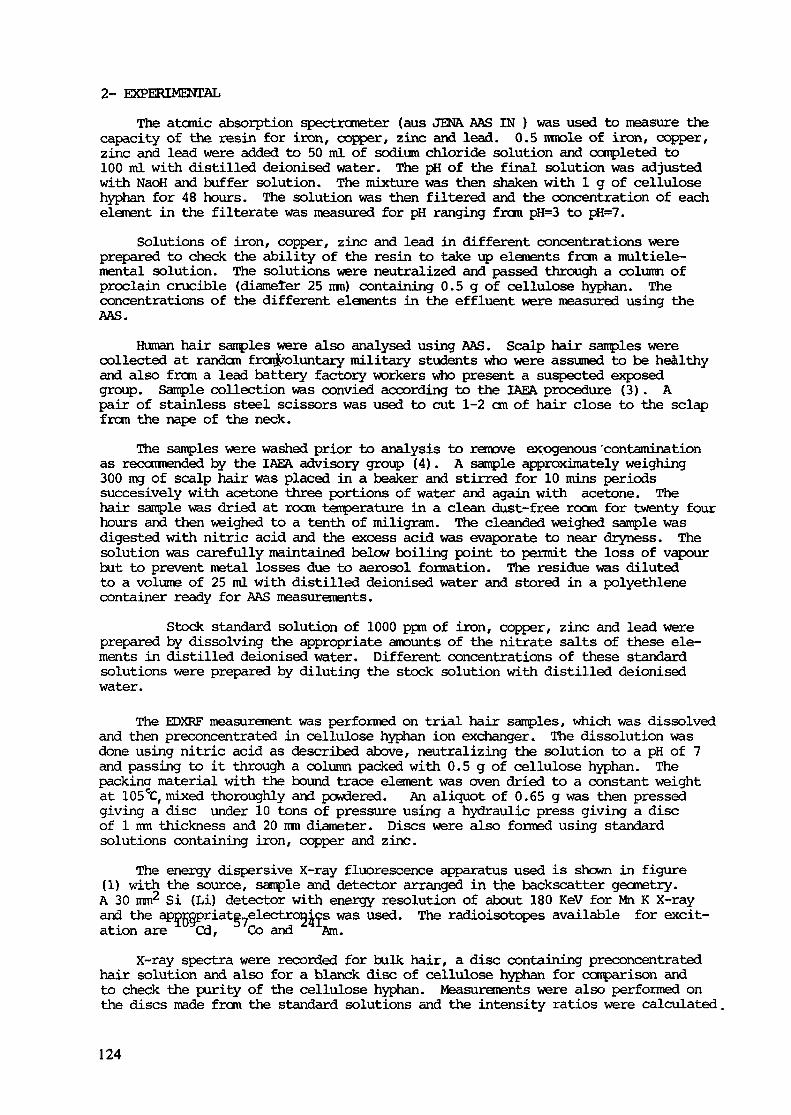
2- EXPERIMENTALThe atonic absorption spectrometer (aus JENA AAS IN ) was used to measure the
capacity of the resin for iron, copper, zinc and lead. 0.5 rnnole of iron, copper,zinc and lead were added to 50 ml of sodium chloride solution and completed to100 ml with distilled deionised water. The pH of the final solution was adjustedwith NaoH and buffer solution. The mixture was then shaken with l g of cellulosehyphan for 48 hours. The solution was then filtered and the concentration of eachelement in the filterate was measured for pH ranging from pH=3 to pH=7.
Solutions of iron, copper, zinc and lead in different concentrations wereprepared to check the ability of the resin to take up elements from a multiele-mental solution. The solutions were neutralized and passed through a column ofproclain crucible (diameter 25 mm) containing 0.5 g of cellulose hyphan. Theconcentrations of the different elements in the effluent were measured using theAAS.
Human hair samples were also analysed using AAS. Scalp hair samples werecollected at random fromVoluntary military students who were assumed to be healthyand also from a lead battery factory workers who present a suspected exposedgroup. Sample collection was convied according to the IAEA procedure (3). Apair of stainless steel scissors was used to cut 1-2 cm of hair close to the sclapfrom the nape of the neck.
The samples were washed prior to analysis to remove exogenous 'contaminationas recommended by the IAEA advisory group (4). A sample approximately weighing300 mg of scalp hair was placed in a beaker and stirred for 10 mins periodssuccesively with acetone three portions of water and again with acetone. Thehair sample was dried at room temperature in a clean dust-free room for twenty fourhours and then weighed to a tenth of miligram. The cleanded weighed sample wasdigested with nitric acid and the excess acid was evaporate to near dryness. Thesolution was carefully maintained below boiling point to permit the loss of vapourbut to prevent metal losses due to aerosol formation. The residue was dilutedto a volume of 25 ml with distilled deionised water and stored in a polyethlenecontainer ready for AAS measurements.
Stock standard solution of 1000 ppm of iron, copper, zinc and lead wereprepared by dissolving the appropriate amounts of the nitrate salts of these ele-ments in distilled deionised water. Different concentrations of these standardsolutions were prepared by diluting the stock solution with distilled deionisedwater.
The EDXRF measurement was performed on trial hair samples, which was dissolvedand then preconcentrated in cellulose hyphan ion exchanger. The dissolution wasdone using nitric acid as described above, neutralizing the solution to a pH of 7and passing to it through a column packed with 0.5 g of cellulose hyphan. Thepackina material with the bound trace element was oven dried to a constant weightat 105CC, mixed thoroughly and powdered. An aliquot of 0.65 g was then pressedgiving a disc under 10 tons of pressure using a hydraulic press giving a discof 1 mm thickness and 20 mm diameter. Discs were also formed using standardsolutions containing iron, copper and zinc.
The energy dispersive X-ray fluorescence apparatus used is shown in figure(1) with the source, sample and detector arranged in the backscatter geometry.A 30 mm2 Si (Li) detector with energy resolution of about 180 KeV for Mn K X-rayand the appropriate-electronics was used. The radioisotopes available for excit-ation are luyCd, Co and XArn.
X-ray spectra were recorded for bulk hair, a disc containing preconcentratedhair solution and also for a blanck disc of cellulose hyphan for comparison andto check the purity of the cellulose hyphan. Measurements were also performed onthe discs made from the standard solutions and the intensity ratios were calculated
124
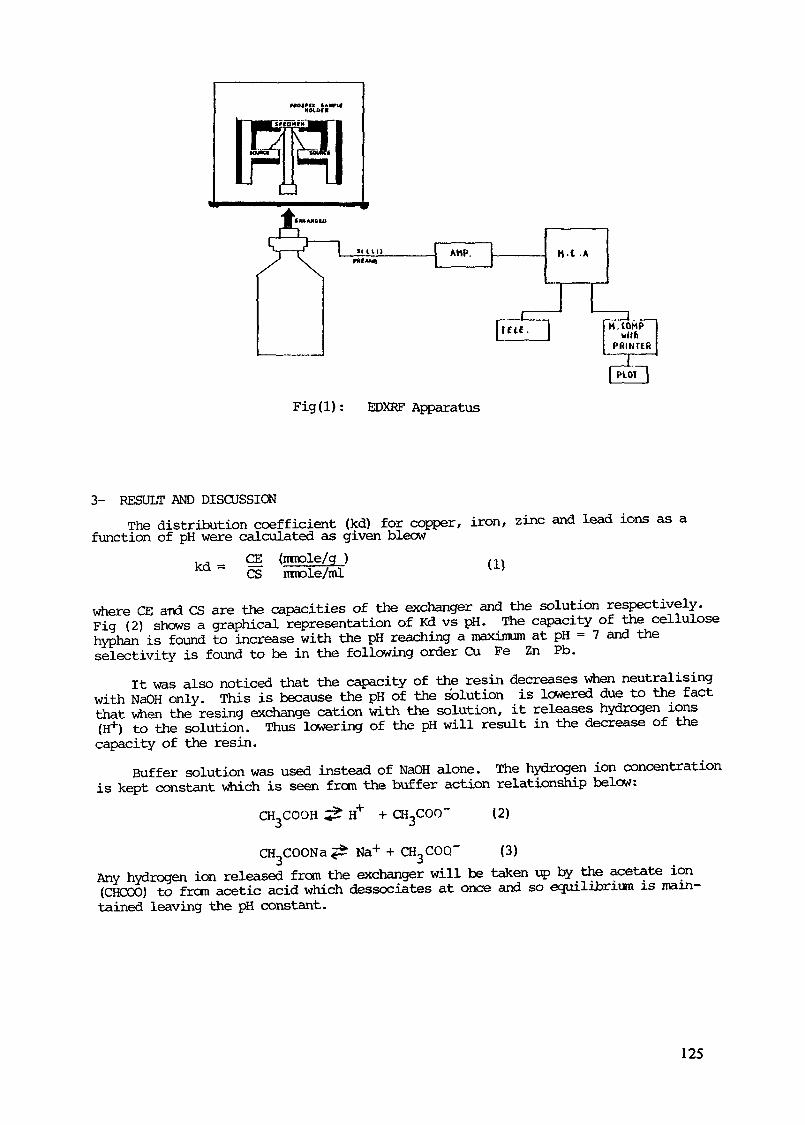
MI «M«
Fig(l): EDXRF Apparatus
3- RESULT AND DISCUSSIONThe distribution coefficient (kd) for copper, iron, zinc and lead ions as a
function of pH were calculated as given bleowCE (mmole/g )Ka ~ CS nnole/ml (1)
where CE ard CS are the capacities of the exchanger and the solution respectively.Fig (2) shows a graphical representation of Kd vs pH. The capacity of the cellulosehyphan is found to increase with the pH reaching a maximum at pH - 7 and theselectivity is found to be in the following order Cu Fe Zn Pb.
It was also noticed that the capacity of the resin decreases when neutralisingwith NaOH only. This is because the pH of the solution is lowered due to the factthat when the resing exchange cation with the solution, it releases hydrogen ions(H+) to the solution. Thus lowering of the pH will result in the decrease of thecapacity of the resin.
Buffer solution was used instead of NaOH alone. The hydrogen ion concentrationis kept constant which is seen from the buffer action relationship below:
CH3COOH H + CH-jCOO"
Na
(2)
(3)Any hydrogen ion released from the exchanger will be taken up by the acetate ion(CHCOO) to fron acetic acid which dessociates at once and so equilibrium is main-tained leaving the pH constant.
125

Log Kd
AGRAPHIC REPRESENTATION OF LOO DISTRIBUTION COEFFICIENT VS PH
PH
Fig (2): Graphic representation of distribution coefficient VS pH
Good binding capacities have been reported for CA-hyphan for some elements(5), however, the binding capacities for copper, iron, zinc and lead were checked.Table (1) shows the atomic absorption studies for the different elements and thefigures in brackets are the maximum concentrations of the elements taken complet-ely by the resin.
The result of the elemental analysis of 20 hair samples analysed by AAS ispresented in table (2). The range of elemental content in the control group werefound to be (in ppm) : Zn (18-218) , Fe (21-198) , Cu (4-23) and lead (25-65) . Onthe other hand, the range of values for the suspected exposed group was found tobe Zn (23-144) , Fe (23-288) , Cu (10-26) and lead (320-2505).
While there is clear overlap in the concentration of Zn, Fe and Cu in thecontrol and the exposed group, there is marked increase in the concentration oflead in the exposed group.
Only a qualitative EDXRF study was done. The blank disc from the CA-hyphanwas used for the background subtraction using the intensity ratio method to corr-ect for matrix effects. The cellulose is quoted (5) to have Br, Cu, Cr, Fe andZn as incepient impurities. Fig (3) the X-ray spectra for the clean dried mater-ial compared with the preconcentrated sample disc to check qualitatively thebinding capability of the CA-hyphan and the blank disc using 10 cd as he exci-tation source and a recording time of 5000 seconds. It shows that the traceanalysis of several elements is feasible. From the results of measurements ofstandard solutions, the slope for the caliration curve for Fe, Cu and Zn are shownin Fig (4).
126

TABLE I
Binding Capacity Measurement
BindingElement Initial solution concentration Effluent concentration capacity____________________P8/g ____ ___ ug/8 %
Cu (72) - 100
Fe 288 68 76(192)
Zn 144 32 78(64)
Pb 1800 590 57(800)
Table (2)Atomic Absorption Studies of, Hair Samples
(a) Control groupSample No12345678910
Zn78.5218.372.2131.3143.481.218.4156.792.064.8
Fe41.6135.459.641.6177.020.8197.9-72.9250.0
Cu12.123.413.63.815.19.86.021.57.06.3
Pb25.029.538.364.751.464.745.063.061.058.0
(b) Exposed group
Sample No
12345678910
Zn
118.578.9109.076.323.0144.0112.090.064.0-
Fe
114.5186.585.983.323.3288.0160.081.045.0115.0
Cu
14.521.326.124.9-11.024.010.0--
Pb
712755109111232505590460320--
127

a)
b)
c)
Fig (3): X-ray spectra ofa) preconcentrated hair extra tb) bulk hairc) blanck disc of CA-hyphan
128
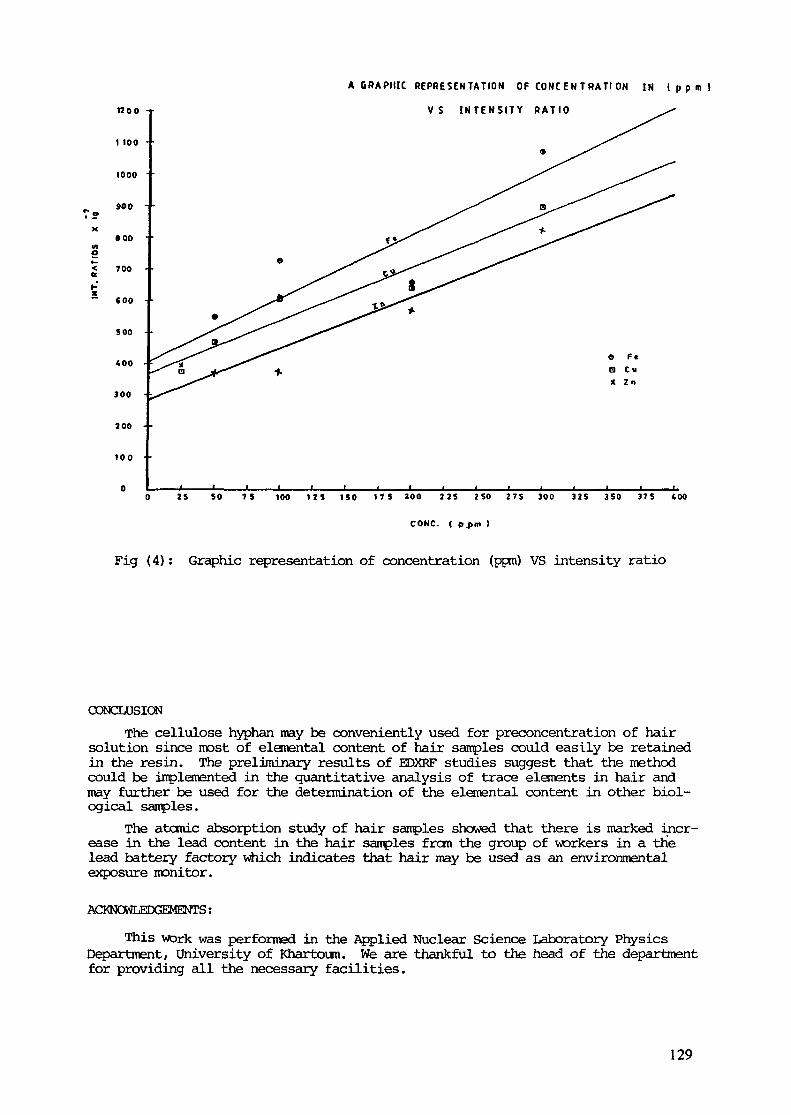
I —X
1200
1 100
1000
900 • •
• 00
< 700
COO
S 00
«00
300
200 -
t o o
A G R A P H I C R E P R E S E N T A T I O N O F CONC E N T R A T I O N I N I p p m )
V S I N T E N S I T Y R A T I O
e Fta cu* Zn
0 25 SO 75 100 US ISO I7S 200 22S 2 SO 275 300 J2S 350 375 «00
CONC. ( p.pin )
Fig (4): Graphic representation of concentration (ppm) VS intensity ratio
CONCLUSIONThe cellulose hyphan may be conveniently used for preconcentration of hair
solution since most of elemental content of hair samples could easily be retainedin the resin. The preliminary results of EDXRF studies suggest that the methodcould be implemented in the quantitative analysis of trace elements in hair andmay further be used for the determination of the elemental content in other biol-ogical samples.
The atomic absorption study of hair samples showed that there is marked incr-ease in the lead content in the hair samples from the group of workers in a thelead battery factory which indicates that hair may be used as an environmentalexposure monitor.
AŒNOWLE3DGEMENTS :
This work was performed in the Applied Nuclear Science Laboratory PhysicsDepartment, university of Khartoum. We are thankful to the head of the departmentfor providing all the necessary facilities.
129
REFERENCES
(1) VALKOVIC V: Sample preparation techniques in trace elementanalysis by X-ray emission spectroscopy. IAEA-TECDOC, 300(1984)
(2) LIESER KH, BREIWIESERE, BURBA P, ROBER M and SPATZ R: Multi-element trace analysis of solid and liquid samples by X-rayfluorscence. Microchimica Acta (Wien) 1 363-373 ( 1978 )
(3) GUIM VP and HOSTE J: International Symposium on NuclearActivitation Techniques in the Life Science, Vienna. IAEA,SM-227 1102 ( 1978 )
(4) RAYABUKLIN YS, Report IAEA/EL/41H,8(1977)(5) RIEDEL ED HAEN: Ion exchanger for analysis, Hannover, West Germany
130

Summary Report ( 1 )
CO-ORDINATED RESEARCH PROGRAMME ONNUCLEAR METHODS FOR HEALTH-RELATED MONITORINGOF TRACE ELEMENT POLLUTANTS
INTRODUCTION
This Co-ordinated Research Programme <CRP) was initiated in 1979 asan extension of an earlier CRP on Nuclear-Based Methods for the Analysisof Pollutants in Human Hair.
The primary aims of this CRP were to develop and test nucleartechniques for a health-related monitoring system which would work as asequence of the following operations:
1) Analysis of scalp hair for primary screening-out of groups andindividuals with increased levels of trace elements;
2) Elucidation of the nature of contamination (internal, external,etc.) in these groups or individuals by analysing;
a) their hair and nails as well as single hairs along theirlength and cross section
b) their blood and its componentsc) their excretad) any other tissues which can be analysed in vivo
3) Search for sources of the contamination by analyzing inhaledair, drinking water and food, and by performing tracer experiments ifnecessary.
During the lifetime of this programme, 19 different institutes from17 countries participated in it, 11 with research contracts and 8 withresearch agreements. Total Agency support for the programme in the formof research contracts amounted to about US$ 110,000. The total costs,including those covered by the institutes themselves, are estimated to beof the order of US$ 800,000.
The first meeting of the contract and agreement holders in this CRPwas held in Namur, Belgium, in September 1981, and the second and finalmeeting took place in Petten, The Netherlands, in Hay 1983.RESULTS AND CONCLUSIONS
The main analytical methods used in this CRP were instrumentalneutron activation analysis and radiochemical neutron activationanalysis. Together with instrumental methods, neutron activationanalysis now covers some 30 elements in most environmental samples. Forthe determination of many trace elements of biological interest byneutron activation analysis, radiochemical separations are necessary inorder to achieve the sensitivity required (more correctly, to reduce theactivity of other interfering activation products). However, particularlyin such applications, neutron activation analysis now has to compete with
131
a number of conventional analytical techniques (e.g. atomic absorptionspectroscopy and polarography) which not only have sufficient sensitivityand specificity but can also deal with a large throughput of samples.For these reasons, radiochemical neutron activation analysis iseconomically competitive only if it can be used routinely on a relativelylarge scale. Single element separation techniques are at a disadvantageunless they are very simple and can be applied quickly. Mutlielementseparation techniques are generally to be preferred provided that theelements of interest can be resolved satisfactorily by means of gamma-rayspectrometry.
The other analytical techniques such as proton-induced X-rayemission spectrometry, X-ray fluorescence spectrometry and graphitefurnace atomic absorption spectrometry were also used in this programme.Also included were radiotracer experiments with laboratory animals. Thisstudy brought more insight into the mechanisms of trace element depositionin hair and internal organs. The analytical methods developed by theparticipants were found to be very useful for single and multielementdetermination of trace concentrations in hair and other matrices. Theprecision and sensitivity of the measurements were found to be generallysatisfactory. However, there is still concern about the accuracy. Thedestruction technique influences AAS. For INAA this could be a matter ofthe standards used while in the case of PIXE there are the matrix effectsto be considered. For PIXB methods there are also the problemsassociated with infinitely thin and infinitely thick targets. Theparticipants agreed therefore that the accuracy of the methods usedshould be routinely checked by analysing various suitable certified andother standard reference materials.
In connection with this CRP and another related environmental healthresearch project, a powdered hair reference material (HH-1) was preparedand issued in 1980 for an intercomparison study of trace and otherelements. All the participants in the present CRP and several otherinterested laboratories (totalling altogether over 100 institutes) weresent this intercomparison sample. Results were received from 70laboratories altogether for more than 40 elements. Details werepublished by M'Baku and Parr (J. Radioanalytical Chemistry 69 (1982)171). It was noted that the results of the intercomparison weresufficiently consistent and that certified concentration values could bederived for about 20 elements, including most of the important toxic andessential trace elements, although the 95% confidence intervals of theoverall mean values were somewhat wide with the exception of a fewelements (Co, Cu, Hg, Se and Zn). This clearly indicates that there is aneed for more research.
The participants regretted that the HH-1 reference material was nolonger available after completion of the intercomparison. Therefore,they strongly felt that another hair reference material should be madeavailable in larger bulk for an eventual certification of a few elements.The participants unanimously agreed that there is a justified need forsuch a reference material based on hair. This is because (1) hairmineral analysis is increasingly proposed as a method for the assessmentof human contamination with environmental mineral pollutants and as adiagnostic tool for uncovering mineral deficiencies and related healthdisturbances, and (2) a reference material based on hair would help thoselaboratories involved in this field of research with analytical qualitycontrol aimed at improving reliability (accuracy and precision) of theirmethods.
132

The washing method used prior to analysis is a critical step in hairtrace mineral analysis. The participants mainly used th'e IAEA recommendedmethod. In addition to this, other washing procedures were also tested.A very detailed study on this point was carried out in Canada using humanscalp hair. Important factors investigated included, among other things,pre-versus post-irradiation washings, efficiency of a single reagent inremoving exogenously deposited contaminants, comparison of variouswashing procedures which use a combination of different reagents insequence, etc. The IAEA and other hair washing methods that utilise mildtreatments with organic solvents, water and detergents were found to beeffective for removing exogenous contaminants such as oils, lacquers andloose dust particles. More severe treatments with sodium hydroxide,chlorhydric acid and strong chelating agents such as EDTA, were found toleach significant amounts of trace elements from hair with increasingtime and number of washings. The effect of usage of certain medicatedshampoos containing large quantities of certain trace elements such asselenium and zinc was also investigated. Most of the elements externallydeposited by shampoos can be removed by the washing method recommended byIAEA with the exception of selenium. It was also observed that externallydeposited mercury could not be removed by any of the hair washing methodspresently available. A radiotracer study conducted in the FederalRepublic of Germany with laboratory rats gave somewhat differentresults. The mild washing procedure recommended by IAEA was shown toleach significant amounts of internally deposited arsenic and cadmiumfrom growing hair of laboratory rats, whereas no loss was observed formercury as reported by the Canadian study.
The suitability of hair trace mineral analysis as a means forepidemiological monitoring of environmental exposure was evaluated.Overall, results obtained during this programme lend further support tothe body of evidence that hair elemental analysis is a suitable methodfor screening population groups for community exposure to environmentalinorganic pollutants. Nails were found to be less reliable. However,uncertainty still remains as to the meaningful interpretation of hairelemental analysis data in cases involving environmental exposure ofindividual subjects. This is mainly due to a lack of knowledge about thequantitative relationships, if any, between hair mineral contents andinternal concentrations.
A study was carried out in the Federal Republic of Germany toinvestigate the practical question as to whether hair trace mineralcontent reflects the body intake and the internal body mineral status.Radiotracer techniques were used to study the distribution in laboratoryanimals of arsenic, cadmium and inorganic mercury. Results obtainedindicated that hair is not, at least for laboratory rats, a goodindicator of internal arsenic, cadmium and inorganic mercury. It wasconcluded that more research was needed on the relationships between hairmineral content and the internal body mineral status.
In order to study the above-mentioned problem, a new Co-ordinatedResearch Programme was initiated by the Agency in 1983. This newprogramme is restricted to the topics of (1) analysis of hair andinternal organs (autopsy samples), <2) studies in experimental animals ofmineral distribution in the body, and (3) development of metabolic modelsto describe the relationship between mineral levels in hair and internalbody burdens.
A body of data was generated during this programme on several toxicand potentially toxic trace elements in human specimens, some environ-
133

mental media (air and water) and a number of diet items. Overall, theresults indicated that the contamination with elements surveyed was low,although a few cases of relatively high levels were observed for lead andmercury.
It was also agreed by the participants that the development in thecountries concerned, of analytical capability for assessing toxic sub-stances of environmental and occupational significance, is of significantvalue to the countries concerned. Moreover, the verification that thepollution is absent (or below levels that give rise to concern) is worthyof support by the Agency.
134

LIST OF PARTICIPANTS
CO-ORDINATED RESEARCH PROGRAMME ON NUCLEAR METHODSFOR HEALTH-RELATED MONITORING OF TRACE ELEMENT POLLUTANTS
Abdel-Wahab, M.F.
Apostolov, D.
Benischek-Huber, I.
Chatt, A.
Das, H.A.
Deconninck, G.
*Fukushima, I.
Ghafourian, H.
Middle Eastern Regional RadioisotopeCentre for the Arab Countries
Sh. Malaeb El Gamaa, DokkiCairoEGYPT
Institute of Nuclear Research andNuclear Energy
Boul. Lenin 721184 SofiaBULGARIA
Oesterr. ForschungszentrumSeibersdorf GmbH
Institut fuer IsotopenanwendungA-2444 SeibersdorfAUSTRIADalhousie UniversityTrace Analysis Research CentreLife Sciences BuildingHalifaxNova Scotia B3H 4J1CANADANetherlands Energy Research Foundation ECNWesterduinweg 31755 ZG PettenNETHERLANDS
Laboratoire d'Analyses par RéactionsNucléaires
Facultés UniversitairesNotre-Dame de la Paix22, Rue MuzetB-5000 NamurBELGIUMDepartment of Public HealthJuntendo UniversitySchool of MedicineHongo 2-chome, Bunkyo-kuTokyoJAPAN
Nuclear Research CentreAtomic Energy Organisation of IranP.O. Box 11365-8486TeheranIRAN
*No report submitted for this TECDOC
135
*Houtman, J.P.W.
Katsanos, A.A.
Kollmer, W.E.
*Lenihan, J.M.A.
Lumu, B.M.
Interuniversitair Reactor InstituutMekelweg 152629 JB DelftNETHERLANDS
Dept. of PhysicsNuclear Research Centre "Demokritos"Aghia ParaskeviAttikiGREECE
Gesellschaft fuer Strahlen- undUmweltforschung mbH
Ingolstaedter Landstrasse lD-8042 NeuherbergPost OberschleissheimFEDERAL REPUBLIC OF GERMANY
West of Scotland Health BoardsDept. of Clinical Physics andBioengineering
1 West Graham StreetGlasgow G4 9LFUNITED KINGDOM
Centre Regional d'Etudes Nucléaires CRENB.P. 868Kinshasa XIZAIRE
*Malenchenko, A.F.
Matsubara, J.
Niese, S.
Paschoa, A.S.
*Schweikert, E.A.
Nuclear Energy Institute of theByelorussian "Radioecology" LaboratoryAcademy of SciencesMinskSosny 220361USSR
Department of EpidemiologyFaculty of MedicineUniversity of TokyoBunkyo-ku, TokyoJAPANCentral Institute of Nuclear ResearchGDR-8051 DresdenP.O.Box 19GERMAN DEMOCRATIC REPUBLIC
Pontificia Universidade CatolicaDeptdo. FisicaCX. Postal 3807120000 Rio de Janeiro, RJ 22453BRAZIL
Centre for Trace CharacterizationTexas A&M UniversityCollege StationTexas 77843USA
136
Yousif, A.A. Sudan Atomic Energy CommissionP.O. Box 3001KhartoumSUDAN
IAEA SECRETARIAT Division of Life SciencesIAEAP.O. Box 100A-1400 ViennaAustria
M'Baku, S.B.(Project Officer: 1978 - 1983)Parr, R.M.(Project Officer: 1983)Muramatsu, Y.(Project Officer: 1983 - 1984)
137

Part II
RCA REGIONAL CO-ORDINATED RESEARCH PROGRAMME ONHEALTH-RELATED ENVIRONMENTAL RESEARCH
USING NUCLEAR TECHNIQUES

DETERMINATION OF MERCURY AND OTHER TOXICELEMENTS IN FISH AND FOODSTUFFS USINGDESTRUCTIVE NEUTRON ACTIVATION ANALYSIS
I. BAYAT, N.D. RAUFI, M. NEJATNuclear Research Centre,Atomic Energy Organization of Iran,Teheran, Islamic Republic of Iran
AbstractConcentrations of mercury in fish, serum, rice and tobacco collected
from Iran were measured by radiochemical neutron activation analysis(RKAA). The average mercury contents in white Caspian fish were 21.6 ppbfor male and 8.9 ppb for female, respectively. No significant mercurycontamination was found in the biological samples analysed in this study.1. INTRODUCTION
In recent years, the toxicity of mercury compounds in general andmethyl mercury in particular has become quite well known. Methyl mercuryhas a great tendency to deposit in fat tissues of man and animalsincluding fish. Mercury can cause paralysis at high doses. Thiscompound also causes nerve damage and distortion of chromosomes and mayact as a carcinogen. Therefore, a regular checking of mercury compoundsin waste material from indstrial processes is of considerable importancefor public health.
A considerable amount of work has been devoted to the development ofanalytical methods for mercury including activation analysis and atomicabsorption spectrometry (1-3). The extremely high toxicity of mercurialcompounds makes it necessary to use very sensitive methods of analysis.For the analysis of fish samples from the Caspian Sea from northern partsof Iran, where in many cases the mercury content is at the ppb level,activation analysis provides a suitable method due to its highsensitivity and relative freedom from contamination problems.
Several non-destructive methods of activation analysis for thedetermination of trace elements in foodstuffs have been published.Foodstuffs and other biological samples usually contain much sodium,potassium, phosphorus and bromine, and the activation products of theseelements generally dominate the gamma spectrum to such an extent thatthe determination of most other elements is impossible by purelyinstrumental means. One great advantage of the destructive method usedin this work is the separation of interfering radionuclides such as24Na, 42K, 82Br, 32P and 75Se applied after irradiation of thesamples. The gamma spectra of -' Hg and 203Hg are otherwise obscuredby the Compton background resulting from the high activity of 24Na.Furthermore, 75Se is known as a strongly interfering element having a§amma-ray energy around 0.28 Mev, close to that of the only gamma-ray of03Hg (1).
In this work, thermal neutron activation analysis with radiochemicalprocessing has been applied for the determination of Hg in fish andcaviar from the Caspian Sea coast of northern Iran. A part of this workhas been allocated to investigate mercury in some oriental tobaccos fromnorthern regions of Iran. The main purpose of this studv was to examine
141

whether pesticides and environmental conditions influence the mercurycontent of tobacco. Details of this investigation relating to thedetermination of bromine have been published elsewhere.
2. EXPERIMENTAL
Homogenized samples (150-200 mg), together with standard samples oforchard leaves or bovine liver from the US National Bureau of Standards,were sealed in quartz ampoules and irradiated for 30 hours at a thermalneutron flux density of 6xlOl2n.cm~2s-l in the nuclear reactor ofthe Nuclear Research Centre, Teheran. After a decay period of two daysthe separation of mercury was performed. The ampoules were dipped intoliquid nitrogen to reduce the pressure of gas formed during irradiationof the samples and broken inside a piece of polyethylene tubingcontaining a mixture of concentrated HN03/H2S(>4 (9:1). Thecontents of the tubing were transferred to a siliconized apparatusdescribed by Bethge (4) and rinsed twice with 5 ml of concentratedHNÛ3/H2S04. At this point the solution was refluxed twice at300°C with a trap containing 2N NaOH mounted at the too of thecondenser to avoid the escape of any volatiles, i.e. *2Br> To the coldrefluxed solution a mixture of 5 ml 70% HC1<>4 and 0.5 g glycine in 5 mlH2Û was added. At about 120°C, due to the reducing action of theglycine and the HC1 produced from HCIO^, HgCl2 is formed in thissolution. By distillation of the mixture at 250°C, chloride andbromide of mercury and gold are quantitatively separated. Water is addedto the distillate to obtain a volume of 200 ml.
Isotopic exchange is used to remove some elements in both distillateand residue fractions. Clean copper foil placed in the distillate willtake up mercury and gold thus leaving bromine in the distillatesolution. The foils were then sealed individually in very thinpolyethylene sheets and were used for counting. Generally, the recoveryof mercury was about 93+1 %. A number of factors determine the optimumconditions for the isotopic exchange reaction (5). Fig. 1 shows theeffect of altering the volume of solution, pH and time of isotopicexchange. The optimum conditions were applied for all mercuryseparations.
The samples and standards were counted in fixed geometries with atrapezoidal Ge(Li) detector coupled to a multi-channel analyzer. Thedetector has an active volume of 40 cm3 and a resolution of 2.98 keVfor the 1.33 MeV photopeak of 60Co.
The overall detection limit of the method is 10~9g mercury in100-150 tag of sample.
142
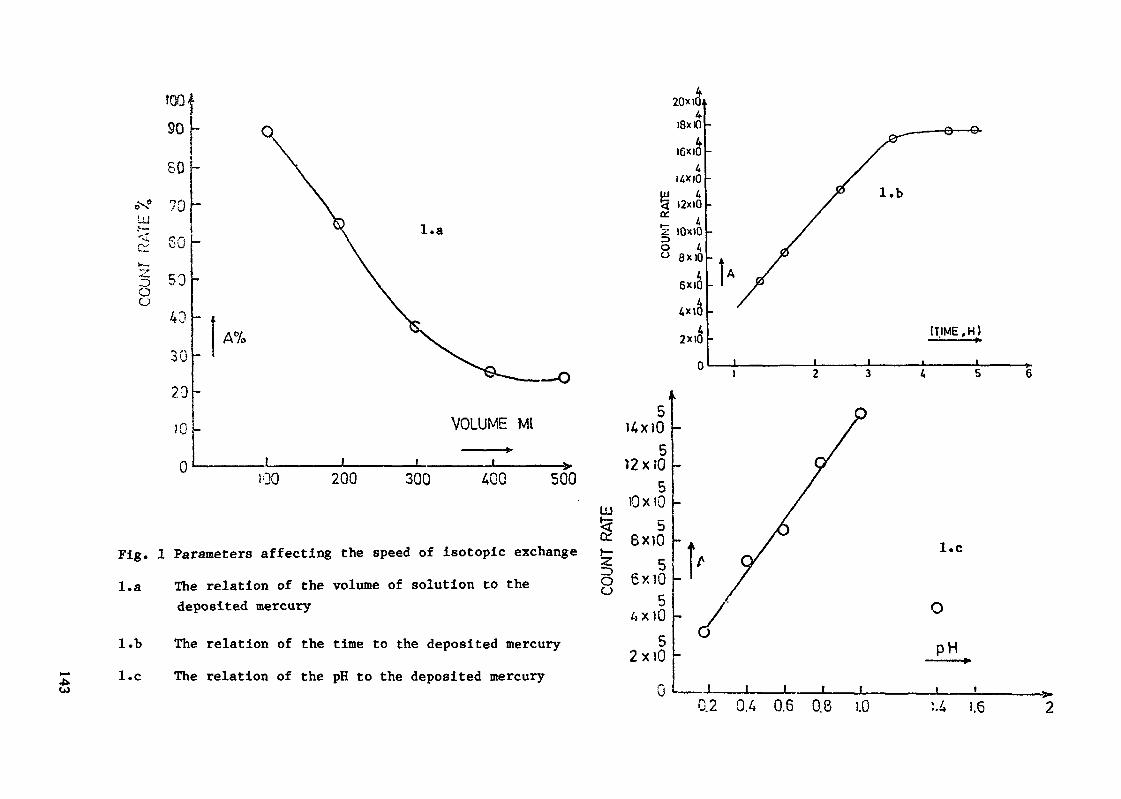
UJ
•——rOao
100-90h8070 u
50h40
3020IQ
0
A%
)00 200
l.a
VOLUME Ml
300 400 500
Fig. l Parameters affecting the speed of isotopic exchangel.a The relation of the volume of solution to the
deposited mercury
l.b The relation of the time to the deposited mercuryl.c The relation of the pH to the deposited mercury
D.2 0.4 0.6 0.8 5.0 U 1.6
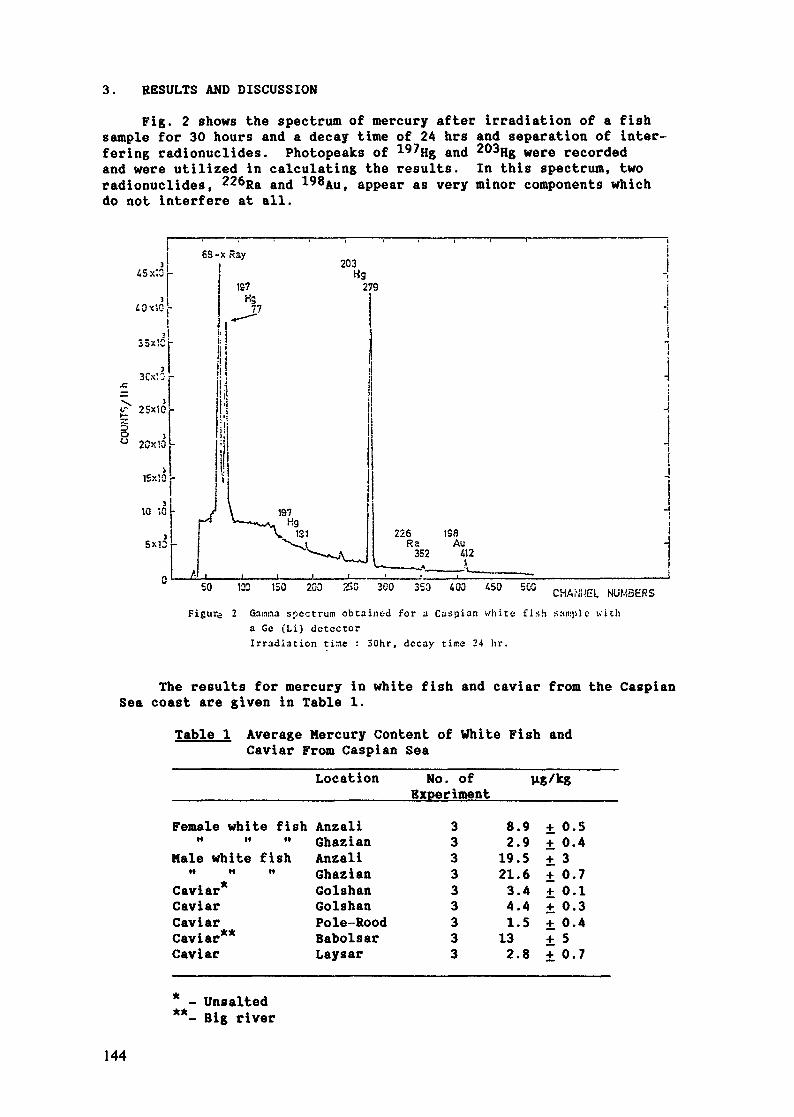
3. RESULTS AND DISCUSSION
Fig. 2 shows the spectrum of mercury after irradiation of a fishsample for 30 hours and a decay time of 24 hrs and separation of inter-fering radionuclides. Photopeaks of l Hg aiuj 203{jg Were recordedand were utilized in calculating the results. In this spectrum, tworadionuclides, 226ga an<j 198AUj appear as very minor components whichdo not interfere at all.
fi-f-
io
3 1ôS-x Ray
203
"7tOxIOJ-
\,'l !
-5X"* - i
3
j
25xiO
20x10
Ha1S7 279
K77•* "
. !'
-
'
ISXÏÔ -
,
10 ÎC
J5x10
;3i
»f \ «7
H ^- —— . «3\ 131
X-—— A^,\_^
-_ij«
-i-ii-i
226 ISflRa Au -:
352 4121 [
f. 1 . , 1 • , ^-f-— —— —••» — - ————^ cft i-vi icn ir.ri ocn inn -sco /m /.cr^ cm"'v "vv J-u HUU ""u "wu CHArHJEL NUMBERS
Figure 2 Garana spectrum obtained for a Caspian white fish sample witha Go (Li) detectorIrradiation tine : 30hr, decay time 24 hr.
The results for mercury in white fish and caviar from the CaspianSea coast are given in Table 1.
Table 1 Average Mercury Content of White Fish andCaviar From Caspian Sea
Location No. of Ug/kgExperiment
Female white fishK » »Male white fish» n »Caviar*CaviarCaviarCaviar**Caviar
* - Unsalted**- Big river
AnzaliGhazianAnzaliGhazianGolshanGolshanPole-RoodBabolsarLaysar
333333333
8.92.919.521.63.44.41.5132.8
+ 0.5+ 0.4+ 3± 0.7+ 0.1± 0.3+ 0.4+ 5± 0.7
144

From a survey of over 40 samples of white Caspian fish studied inthis work the average mercury content was found to be 2-1.6 ppb for maleand 8.9 ppb for female white fish; results for caviar were variable.The amount of mercury in male fish was much higher than in female fish.This is due to the living habits of male white fish which usually swim inupper reaches of the river where industrial wastes are more frequent.However, a comparison between the results obtained in this work and thoseobtained by others in Europe (5,6,7,8) shows much lower concentrations ofmercury in Caspian fish. Population density and industrial activitiesare known to be the main factors affecting contamination of rivers, andhence leading to higher concentrations of mercury in related samples.For Iranian caviar, this is the first such report on mercury analysiswhich showed that the levels are far below those permitted by the WorldHealth Organization (9).
The mercury contents of some other biological specimens have beenmeasured by the same procedure. The results are shown in Table 2. Table3 shows the results for mercury in various types of tobacco from thenorthern region of Iran. All results for either sprayed (methylbromide)or non-sprayed tobacco indicate that the mercury contents are below thepermissible value (about 0.5 ug/g).
Table 2 Mercury Content of Some Biological MaterialsBiological Material No. of Average_______________determinations______UK/kg______Serum of cancerousblood No. 1 3 9.3 + 2.2
No. 2 3 2.48 + 1.32No. 3 3 141.25 ± 11.25No. 4 3 20.97 + 2.78
Rice before beingcooked (10) 3 14.7+0.7
Rice after beingcooked 3 12.15 + 2.2
Table 3 Concentrations of Mercury in Different Gradesof Iranian Tobaccos
Growing Place
GilanGilanMasendaranMasendaranMasendaranGorganGorganKhoiKhoiKhoiUromiehUromieh
Brand
VirginiaVirginia*TikolakTrabusanBasmaTrabusanBasmaTikolak*BasmaBasma*BasmaBasma*
ConcentrationUK /kg15.3 + 514.5 + 252.9 + 98.3 + 0.114.8 + 216.0 + 310.2 + 119.9 + 520.1 + 915.5 + 515.8 ± 511.5 ± 4
Note: All samples were sprayed withmethylbromide except those indicated by
145

REFERENCES
1) ROHDE H., Report KFK-2201, Aug. (1975)
2) SCHELENZ R., BAYAT I., and FISCHER E., Report BFE—1976-3
3) ABEDINZADEH Z. and BAYAT I., Radiochem. Radioanal. Letters,25(4), 217 (1976)
4) BETHGE P.O., Anal. Chia. Acta., 10, 317 (1954)5) SCHELENZ R. and DIEHL J.F., Z. Anal. Chem. , 93, 265 (1973)6) OLMZE I. and ARAS N.K., Radiochem. Radioanal. Letters,
22(1), 19 (1975)7) DIEHL J.F, SCHELENZ R., Medizin und Ernährung, 11, 241 (1971)8) RUF H., ROHDE H., Z. Anal. Chem., 116. 236 (1973)9) Trace Elements in Human Nutrition, World Health Organization,
Geneva, Tech. Rep. Ser. 532 (1973).10) ABEDINZADEH Z., OWLYA A., and RAFII H., Radiochem. Radioanal.
Lett. 32, 315 (1978)
146

NEUTRON ACTIVATION ANALYSIS IN THE MONITORING OFHEALTH-RELATED TRACE ELEMENT POLLUTANTS
S. GANGADHARAN, J. ARUNACHALAM, K.R. BHAT,S. YEGNASUBRAMANIANAnalytical Chemistry Division,Bhabha Atomic Research Centre,Trombay, Bombay, India
AbstractThe development and validation of methodology to
determine trace elements in hair is described. The potentialrole of hair as a first level monitor in a multilevel schemeof monitoring exposure to inorganic pollutants is demonstra-ted« The application of mathematical methods in enhancing theinformation content of analytical data is illustrated throughthe pattern recoanition approach»
1. INTRODUCTION
The rapid developments in industrialisation and theincreasing awareness for the need to preserve the quality ofthe environment have created an apparent dichotomy« Analyticalchemistry bridges those two seemingly opposing streams andnuclear methods have made significant contributions in analy-tical chemistry. The expanding knowledge of the role of theelements (metals) in living systems has increased the needfor the detection and monitoring of their concentration levelsin and around man to establish ^normal* levels and to evolvestandards and regulations.
The work described here summarises the results of aprogram to help establish the usefulness of hair as an indi-cator of environmental exposure; the program spanned tworesearch contracts (1810/RB and 2606/RBÎ lasting six yearsduring 1976-1984,2. HUMAN HEAD HAIR
Our view of the role of hair as an indicator ofenvironmental exposure is depicted in Fig. 1. In connectionwith our earlier work^*' on hair for forensic purposes,washing with ether was standardised. However/ since the(2)washing procedure recommended was different, detailedinvestigations were carried out on the effect of differentwashing procedures, in particular comparing the effect ofwashing with ether and with acetone, water (3 times), acetone,The analytical methodology followed<3' was validated throughthe analysis of certified materials and participation inintercomparison exercises.
147

FIG. 1ANTHROPOGENIC SOURCES
POLLUTION
PLANTS ANIMALS
-MAN-tl
ENVIRONMENTAL EXPOSURE
IIBODY BURDEN
CORRELATIONS
ANALYSEFHER
HAIR
OTHER TISSUESCRITICAL ORGANS
\
SAMPLEANALYSIS
\
POPULATION/STUDY
CORRELATIONENVIRONMENTALPARAMETERS
NORMAL/ABUNDANCE LEVEL
-INTERNAL'vs.
EXTERNAL
2,1 Student Populati onScalp hair samples from nationwide student population
were collected, washed and analysed by ÏNAA for 21 elementstNa, el, K, Sct Crt Mn, Fe, Co, Cu, Zn, As, Se, Br, Rb, Ag,Cd, Sb, 1, La, Ce, Auï'. A secondary standard of hair wasdeveloped and characterised during the course of thisprogram for use as a multielement comparator* Analysis ofthe results using pattern recognition (PR) techniques showedstatistically significant separations between male and female,vegetarian (a group, rather unique to this region) and non-vegetarian besides different geographical locations. Thesefindings were presented at the IAEA symposium on NuclearActivation Techniques in Life Sciences'*'02.2 Bombay General Population
Following the countrywide population study, albeiton a small scale, scalp hair samples were collected from thegeneral population in metropolitan Bombay area and wereanalysed by INAA» The differentiation by acre group was clear.
148

PR analysis of the results gave an excellent example of therole of feature selection; principal component analysis (PCA)using data on ten of the elements did not show any separa-tion of samples belonging to an industrial area from thosebelonging to normal residential areas. A Fisher discriminantanalysis (PDA) of the data showed only four elements (Cr,Mn, As, Cd) to have good discriminatory power and a PCAusing these four elements produced a very effective separa-tion of the industrial area from rest of the metropolis« Theseresults have been published^),3. ANALYSIS OF HAIR AND BLOOD SAMPLES FROM PERSONS
SUFFERING FROM CARDIOVASCULAR DISORDER
Samples of blood and hair from thirteen subjects withknown cardiovascular disorder and from ten 'normal* subjectswere collected under the guidance of medical personnel. Thehair samples were collected from five or six differentpositions of the head and washed before irradiation. Theblood samples were collected using fresh disposable plasticsyringes ana were lyophilised prior to irradiation.
The mean values for the elements determined aresummarised in Tables I and II. The pairwise correlationsamong trace elements in blood and hair are given in
Table IMean values of Trace Elements In Hair
(ppm)Element Normal Pathological
BrCoCrCuFeKMnSbSeZn
6.10.03-12.365131.20.200.82127
1.90.08I.I16.0-17.02.00.270.34129
Table 2Mean values of Trace Elements In (Whole)Blood (ppm, ug/g of lyophylised blood)
Element Normal Pathological
CoCrFeSbSeZn
0.101.3624200. II0.6724
0.060.4920850.100.8525
149
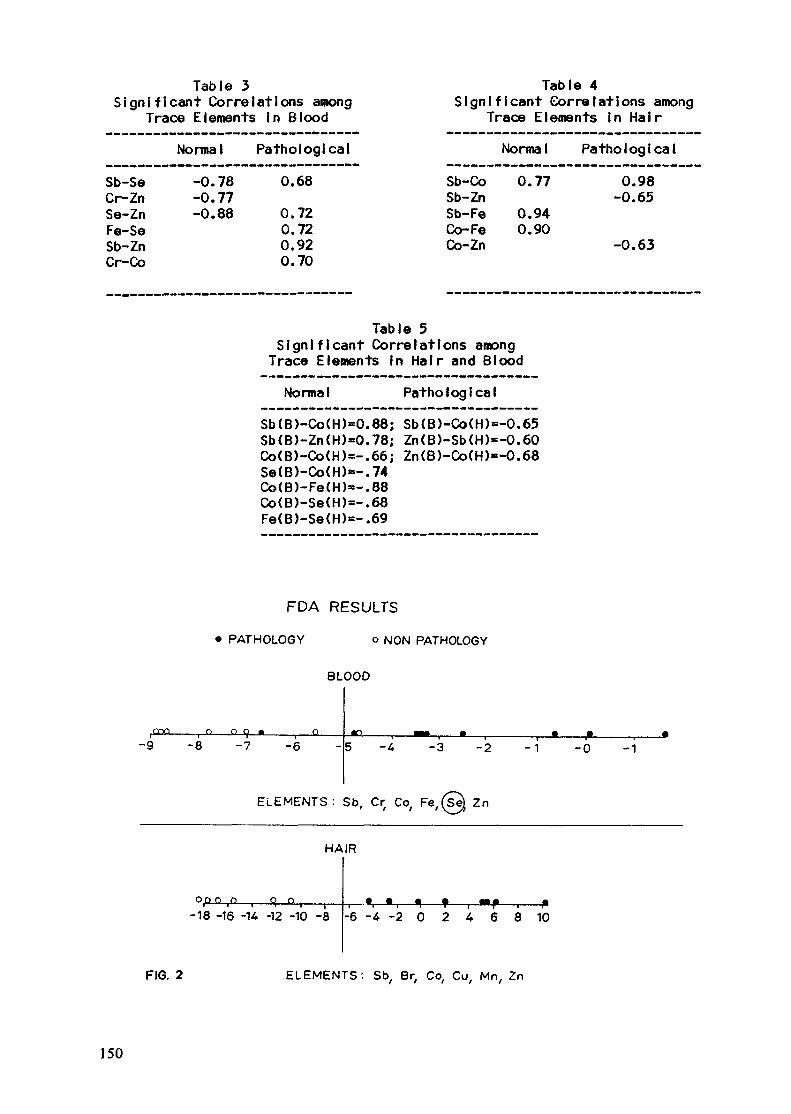
Table 3Significant Correlations among
Trace Elements in Blood
Sb-SeCr-ZnSe-ZnFe-SeSb-ZnCr-Co
Normal
-0.78-0.77-0.88
Pathological
0.68
0.720.720.920.70
Table 4Significant Correlations among
Trace Elements in HairNormal Pathological
Sb-CoSb-ZnSb-FeCo-FeCo-Zn
0.77
0.940.90
0.98-0.65
-0.63
Table 5Significant Correlations amongTrace Elements in Hair and BloodNormal Pathological
Sb(B)-Co(H)=0.88; Sb(B)-Co(H)=-0.65Sb(B)-Zn(H)»0.78; Zn(B)-Sb(H)«-0.60Co(B)-Co(H)=-.66; Zn(B)-Co(H)»-0.68Se(B)-Co(H)=-.74Co(B)-Fe(H)=-.88Co(B)-Se(H)=-.68Fe(B)-Se(H)=-.69
PDA RESULTS
PATHOLOGY o NON PATHOLOGY
BLOOD
ono n o <>
-9 -8 -7 -6 -3 -2 -1 -0 -1
ELEMENTS: Sb, Cr Co, Fe,(Se} Zn
HAIR
ODD n
-18-16 -14. -12 -10 -8 -6 -4 -2 0 2 4 6 8 10
FIG. 2 ELEMENTS'. Sb, Br, Co, Cu, Mn, Zn
150

Tables III and IV, while the correlation of elements inblood with those in hair are given in Table V. The correla-tion coefficients are significant at 5%. PDA of the traceelement data for blood and hair for the two groups ofsubjects is given in Fig.2. While the two groups are welldifferentiated, a few features are noteworthy» (i) thediscriminant coefficients indicate that only Se providesthe discrimination between the two groups based on resultsfor blood* (ii> hair seems to provide better discriminationbetween the two groups, with all the elements considered,except Mn and Zn, having significant values for discriminantcoefficients, (iii) pooling of blood and hair data does notdiscriminate the two groups04, ANALYSIS OP HAIR SAMPLES PROM WOMEN USING COPPER IUD*S
Hair and blood samples from women using copper IUDcontraceptives and also from women not using the device wereanalysed for copper« The results from the analysis of bloodhave been publishedl*>)0 Hair samples from some of thesubjects using IUDs were sectioned to correspond to the timeof insertion of the device so that the section of hair presentat the time of insertion will serve as additional control.The mean value for the controls is 12«4 + 5,2 ppm (n « 28)and that for the persons using IUDs is if. 2 + 3.8 ppm(n » 29), The inference that there is no significantlyhigher values of copper in subjects using the device is inagreement with that drawn from the results on the analysisof blood. In view of the advantage of having the built-incontrol and the 'cumulative nature* of the concentration inhair as compared to the * temporal nature' in blood, the hairdata would be expected to be very useful.50 INTERPRETATION OF DATA
The primary objectives of the analysis of the datafor studies in environmental exposure should be (i) toclassify the population into groups based on the attributesstudied on them, (ii) to establish causative features thatare responsible for the grouping/discrimination observed,and (iii) to extract the sources in the environment and path-ways to the system.
(7 8ÎPattern recognition ' offers a powerful tool inthe processing of the data for these objectives. The PRmethods developed and applied in this laboratory arediscussed elsewhere (9*1"' in which both spectral and non-spectral data have been processed to extract significant(chemical! information. Suffice it to say that this PRapproach provides an insight into the processes and stepsthat are otherwise not discernible. Using a combinationof the different PR techniques and applying the spirit ofchemical mass balance, so successfully applied'11' to theanalysis of data on air filters, it is expected (12) thatit would be possible to identify the sources and apportiontheir contributions to the total exposure. With regard tohair, in particular, sectional analysis and analysis ofother body hair can help establish^13^ the internal or
151
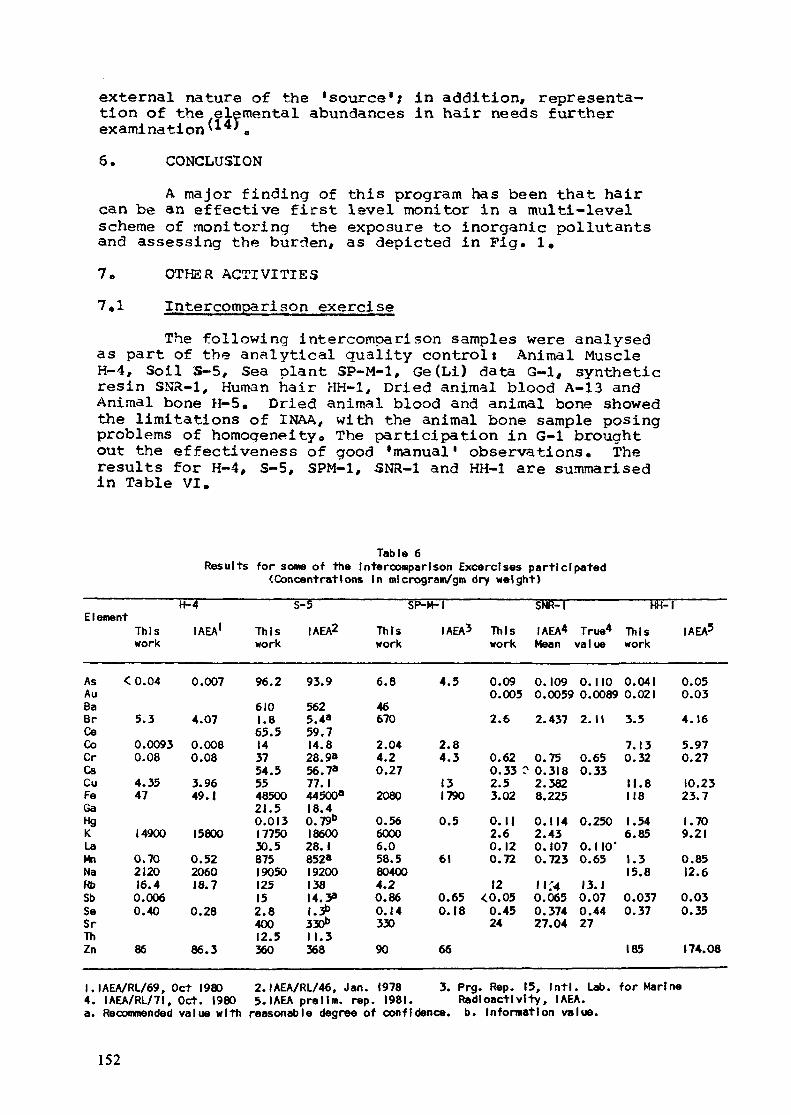
external nature of the 'source1; in addition, representa-tion of the elemental abundances in hair needs furtherexamination^*' 06. CONCLUSION
A major finding of this program has been that haircan be an effective first level monitor in a multi-levelscheme of monitoring the exposure to inorganic pollutantsand assessing the burden, as depicted in Pig. 1.7. OTHER ACTIVITIES
7«! Intercomparison exerciseThe following intercomparison samples were analysed
as part of the analytical quality control t Animal MuscleH-4, Soil S-5, Sea plant SP-M-1, Ge(Li) data G-l, syntheticresin SNA-1, Human hair HH-1, Dried animal blood A-13 andAnimal bone H-5, Dried animal blood and animal bone showedthe limitations of INAA, with the animal bone sample posingproblems of homogeneity« The participation in G-l broughtout the effectiveness of good 'manual' observations« Theresults for H-4, S-5, SPM-1, SNR-1 and HH-1 are summarisedin Table VI.
Tab I« 6Results for some of the Intercomparison Exceed ses participated
(Concentrations in m! crogram/gm dry weight)
H-4Element
This IAEA1
work
AsAuBaBrCeCoCrCsCuFeGaHgKLaMnNaRbSbSeSrThZn
<0.04
5.3
0.00930.08
4.3547
14900
0.70212016.40.0060.40
86
0.007
4.07
0.0080.08
3.9649.1
15800
0.52206018.7
0.28
86.3
S-5
This IAEA2
work
96.2
6101.865.5143754.5554850021.50.0131775030.587519050125152.840012.5360
93.9
5625.4a
59.714.828.9»56.7»77.1445008
18.40.79b
1860028.1852»19200138u. y|.3b330b
11.3368
SP-M-I
This IAEA3work
6.8
46670
2.044.20.27
2080
0.5660006.058.5804004.20.860.14330
90
4.5
2.84.3
131790
0.5
61
0.650.18
66
Thiswork
0.090.005
2.6
0.620.33 ?2.53.02
0. II2.60.120.72
12<0.05
0.4524
SNR-I
IAEA* True4
Mean value
0.1090.0059
2.437
0.750.3182.3828.225
0.1142.430.1070.723
1 1'40.0650.37427.04
0. 1100.0089
2.11
0.650.33
0.250
0. 1 10*0.65
13.10.070.4427
HH-1
This IAEA5
work
0.0410.021
3.5
7.130.32
11.8118
1.546.85
1.315.8
0.0370.37
185
0.050.03
4.16
5.970.27
10.2323.7
1.709.21
0.8512.6
0.030.35
174.08
I.IAEA/RL/69, Oct 1980 2. IAEA/RL/46, Jan. 1978 3. Prg. Rep. 15, Intl. Lab. for Marine4. IAEA/RL/71, Oct. 1980 5. IAEA prelim, rep. 1981. Radioactivity, IAEA,a. Recommended value with reasonable degree of confidence, b. Information value.
152
7.2 Prolect NewsletterSeveral issues of Project Newsletter were brought out
during the course of the programme which served as aneffective channel of communication.
8. REFERENCES
1. Gangadharan, S., Lakshmi, V.V., Sankar Das, M,, ActivationAnalysis of Hair for Forensic Applications, Jour. Ind. AcadoForens, Sei., 11(1) 18-21 (1972).
2. Activation Analysis of Hair as an indicator of Contamina-tion of man by environmental trace element pollutants,IAEA/RI/50 Oct. 1978.
3* Gangadharan, S., Yegnasubramanian, S«, Elemental Character-isation through instrumental neutron activation. Jour.Radioanal. Chem, 42, 455-462(1978).
4» Arunachalam, J., Gangadharan, S., Yegnasubramanian, S.,Elemental data on human hair sampled from Indian StudentPopulation and their interpretation for studies in envi-ronmental exposure, IAEA Symposium on Nuclear ActivationTechniques in Life Sciences, Vienna, 1978, Proceedings,STI/PUB/492, 499-513 (19 9).
5. Bhat, K«R., Arunachalam, J», Yegnasubramanian, S.,Gangadharan, S., Trace Elements in Hair and EnvironmentalExposure, Sei. Tot. Environ., 22, 169-178(1932).
6. lyer, R.K., Krishnamoorthy, K.R., Soonawala, R.P., CopperConcentrations in the blood of women using Copper lUD's,Proceedings, Nuclear Chemistry and RadiochemistrySymposium, Varanasi 1981, pp 252-257.
7. Jurs, P.C., Isenhour, T.L., Chemical Application ofPattern Recognition, Wiley Interscience, N.Y0, 1975«
8. Kowalski, B.R., Chemometries, Fundamental Reviews/Anal. Chem,, 52, 112R (1980).
9. Arunachalam, J., Gangadharan, S., Forensic Applicationsof Pattern Recognition, Jour. Ind. Acad. Forens. Sei»,20(2> 54-64 (1981).
10. Arunachalam, J., Gangadharan, S., Feature Extractionfrom Spectral and other data by the principal compo-nents and discriminant function techniques. Anal. Chim»Acta (in. press) .
11. Aerosols: Anthropogenic and Natural, Sources and Transport,Proc. Annals. N.Y. Acad. Sei», 333 (1980), Eds. Kneip,T.J. and Lioy, D.J.
153

12. Gangadharan, S., Bio-monitoring of exposure to environ«mental pollutants - population studies, IAEA AdvisoryGroup Meeting on Nuclear Techniques in EnvironmentalHealth Studies of Mineral Pollutants, Athens,(Sept.1982)
13. Gangadharan, S., Lakshmi, V.V., Sanlcar Das, M., Growthof hair and trace element profile: A study by sectionalanalysis. Jour. Radioanal. Chem. 15, 287-304 (1973).
14. Gangadharan, S., Sankar Das, M., Hair as an indicatorof environmental exposure, IAEA Advisory Group Meetingon Application of Nuclear Methods in EnvironmentalResearch, Vienna (1976) 0
154
TRACE METAL POLLUTANTS INFILIPINO HUMAN HEAD HAIR
P.A. KAPUAN, I.L. BELTRAN, C.C. CRUZPhilippine Atomic Energy Commission,Diliman, Quezon City, Philippines
The full length report is available directly from Dr. P.A. Kapauan.
AbstractHair samples from residents of different geographical locations in
the Philippines were analyzed for lead and cadmium by differential pulseanodic stripping voltammetry and for mercury by cold vapour atomicabosorption spectrophotometry. Baseline values of these elements in hairwere obtained for the different regions and for the total populationsampled.
(The Philippine Journal of Science Vol.Ill, (1982), 145)
* The work done under this contract is already published. Only thetitle and abstract are reproduced here.
155

STUDIES OF TRACE ELEMENT POLLUTANTS INBIOLOGICAL AND ENVIRONMENTAL MATERIALS
A.H. KHAN, S.K. BISWASAtomic Energy Centre,Dacca, Bangladesh
Abstract
The analytical capabilities based on the principles of particle-induced X-rayemission (PIXE)and atomic absorption spectroscopy (AAS), so far developed to studythe trace element composition of different biological and environmental specimens,are reported here. Using these methods, some baseline studies have been performedon human blood, hair, nail, water, air particulates, etc. In this report, a briefaccount of this research is presented and the need for future research in the relatedarea is discussed.
1. INTRODUCTION
The pollution of the biosphere by heavy metals is a global concern of the presenttime. Realizing the untoward effects of heavy metal contamination on human life, theInternational Atomic Energy Agency (IAEA) started the programme on Health-relatedEnvironmental Research using Nuclear Techniques, for the purpose of establishing theanalytical competence more of general kinds for environmental research in each of thelaboratories concerned and to demonstrate its applicability in baseline studies.
The Bangladesh Atomic Energy Commission (BAEC) participated in the aboveprogramme within the framework of the Regional Cooperation Agreement (RCA) forSouth East Asia, under the research contract 2536/RB (Dec., 1979 to July, 1983).The present report contains the account of the work carried out under the programmealong with a discussion on the need for further research in the field of trace elementanalysis of environmental materials including food items. Appendix I contains the listof publications from the work completed under the programme.
2. EX PERIMENTAL WORK
The basic object of the experimental work carried out under the programme wasto establish the PIXE method and to develop one of its variants for trace elementanalysis in biological and environmental materials and to validate it by analysingstandard reference materials. The other aspect of the experimental work was to establishAAS method for trace analysis in all areas of interest including the validation of thePIXE methods developed for the same purpose. The following is a summary of theseinvestigations.
157
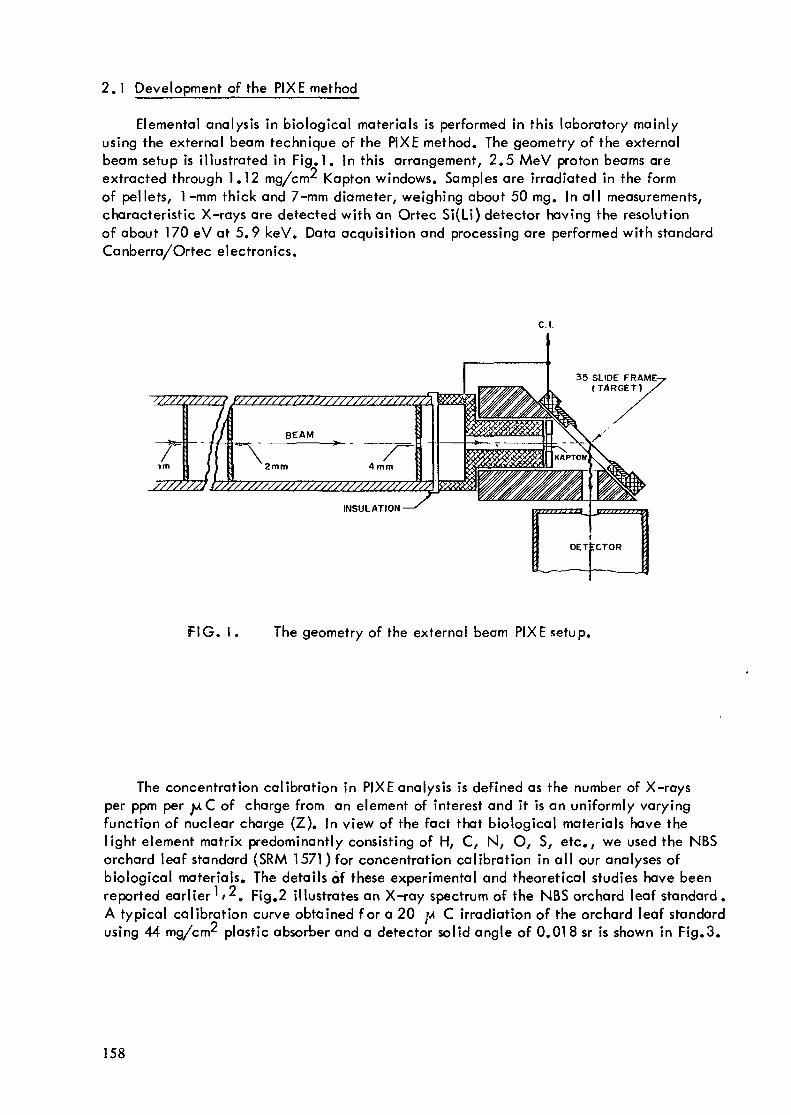
2.1 Development of the FIXE method
Elemental analysis in biological materials is performed in this laboratory mainlyusing the external beam technique of the PIXE method. The geometry of the externalbeam setup is illustrated in Fig.l. In this arrangement, 2.5 MeV proton beams areextracted through 1.12 mg/crrr Kapton windows. Samples are irradiated in the formof pellets, 1-mm thick and 7-mm diameter, weighing about 50 mg. In all measurements,characteristic X-rays are detected with an Ortec Si(Li) detector having the resolutionof about 170 eV at 5.9 keV. Data acquisition and processing are performed with standardCanberra/Ortec electronics.
C.I.
FIG. 1. The geometry of the external beam PIXE setup.
The concentration calibration in PIXE analysis is defined as the number of X-raysper ppm per jU.C of charge from an element of interest and it is an uniformly varyingfunction of nuclear charge (Z). In view of the fact that biological materials have thelight element matrix predominantly consisting of H, C, N, O, S, etc., we used the NBSorchard leaf standard (SRM 1571 ) for concentration calibration In all our analyses ofbiological materials. The details of these experimental and theoretical studies have beenreported earlier ' /^. Fig.2 illustrates an X-ray spectrum of the NBS orchard leaf standard .A typical calibration curve obtained for a 20 p C irradiation of the orchard leaf standardusing 44 mg/crrn plastic absorber and a detector solid angle of 0.018 sr is shown in Fig.3.
158

105
Ul
X
ceUJa.
»-
Oo
I01
10°
0 NBS ORCHARD LEAVES E = 2 0 M e V Q^ZQßC0 V
ri ELEMENT
* •' 1 kt " : Co.-. .• „ Mn
rn'. • c ' Cu
JL! 1 _ Zn. • pi j AS•• • !2 Br
• ' -".. ' *• + Rb
"..'., J ' / -a * ' - . * . o ^ 5?- Pb
V • * "V!': : > :v >. \ ^ + ~
- A '...' •, i ' in 1 a .* vy ; ! » T { 5 f' '-.-'.-:• •,-' -. ? - ; r l
—— 1 —— 1 1 ———— 1 ———— 1 —— 1 , 12 4 8 1 2 | 6
CONC(PPM)
|-47±003(%)
2-O9±003(%)91 ± Of
30O± 2OI2±l25± 3I4± 2
(10)I2t 137t 145 "*" 3
:
-— — •• - -•-•
20X-RAY ENERGY (keV)
FIG. 2. A P1XE spectrum of the NBS orchard leaf standard (SRM 1571 ).
159
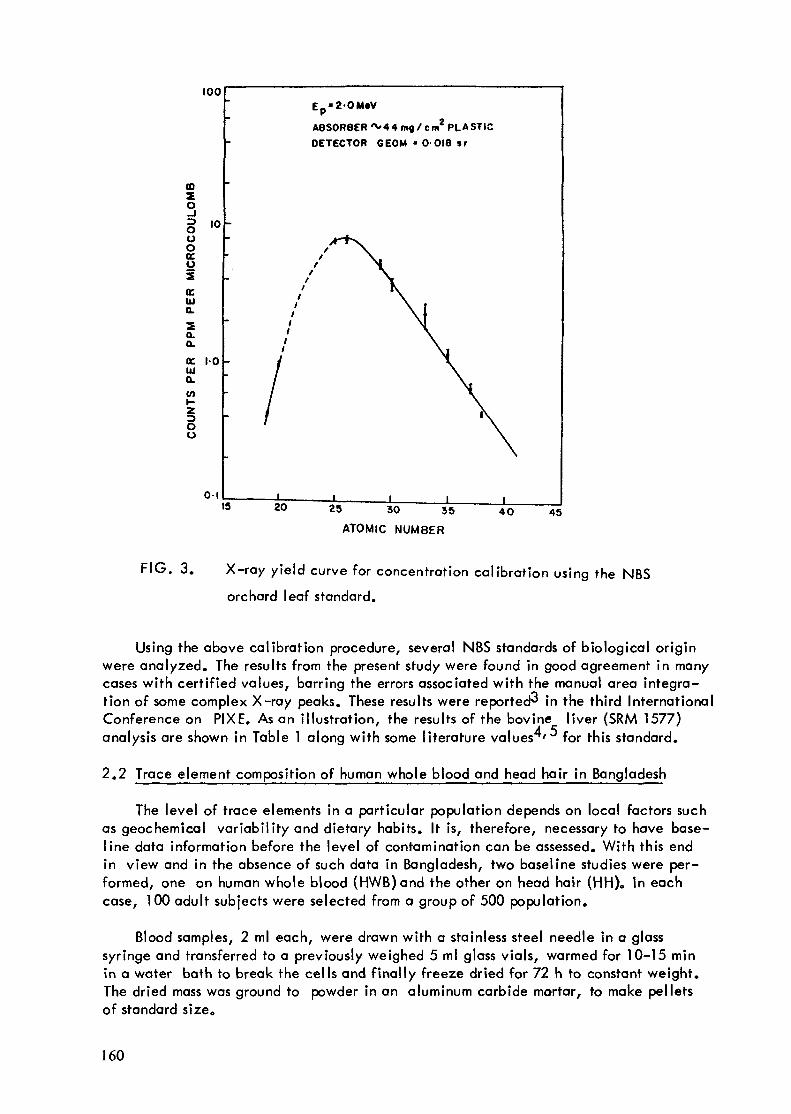
100
mZO
oooKO1(C.UJo.20.o.ocUJQ.WI-zoo
to
l-o
o-i
Ep-2'OMtV
ABSORBER ^44 m«/cm2 PUASTICDETECTOR GEOM • 0-018 s r
19_L JL
5 30 35
ATOMIC NUMBER40 45
FIG. 3. X-ray yield curve for concentration calibration using the NBS
orchard leaf standard.
Using the above calibration procedure, several NBS standards of biological originwere analyzed. The results from the present study were found in good agreement in manycases with certified values, barring the errors associated with the manual area integra-tion of some complex X-ray peaks. These results were reported^ in the third InternationalConference on PIXE. As an illustration, the results of the bovine liver (SRM 1577)analysis are shown in Table 1 along with some literature values ' for this standard.
2.2 Trace element composition of human whole blood and head hair in Bangladesh
The level of trace elements in a particular population depends on local factors suchas geochemical variability and dietary habits. It is, therefore, necessary to have base-line data information before the level of contamination can be assessed. With this endin view and in the absence of such data in Bangladesh, two baseline studies were per-formed, one on human whole blood (HWB)and the other on head hair (HH). In eachcase, 1 00 adult subjects were selected from a group of 500 population.
Blood samples, 2 ml each, were drawn with a stainless steel needle in a glasssyringe and transferred to a previously weighed 5 ml glass vials, warmed for 10-15 minin a water bath to break the cells and finally freeze dried for 72 h to constant weight.The dried mass was ground to powder in an aluminum carbide mortar, to make pelletsof standard size0
160
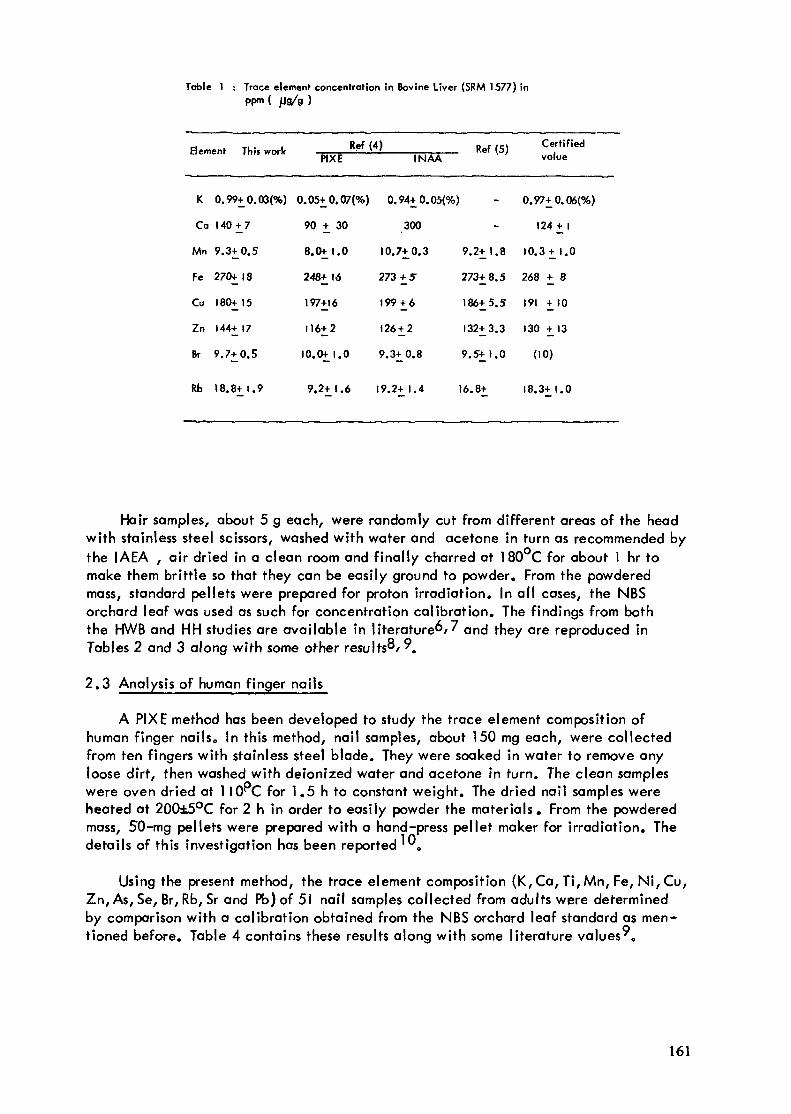
Table 1 : Trace element concentration in Bovine Liver (SRM 1577) inppm (
,«,.„, VM «.-,5,
K 0.99+0.03(%)
Ca 1 40 + 7
Mn 9.3+0.5
Fe 270+18
Cu 180+15
Zn 144+17
Br 9.7+0.5
0.05+0.07(%)
90 + 30
8.0+1.0
248+ 16
197+16
116+2
10.0+ 1.0
0.94+0.
300
10.7+0.3
273+5
199 + 6
126+2
9.3+ 0.8
05(%)
-
9.2+1.8
273+8.5
186+5.5
132+3.3
9.5+ 1.0
0.97+0.06(%)
1 2 4 + 1
10.3 +1.0
268 + 8
19l + 10
130 + 13
(10)
Rb 18.8+1.9 9.2+1.6 19.2+1.4 16.8+ 18.3+1.0
Hair samples, about- 5 g each, were randomly cut from different areas of the headwith stainless steel scissors, washed with water and acetone in turn as recommended bythe IAEA , air dried in a clean room and finally charred at 1 80 C for about 1 hr tomake them brittle so that they can be easily ground to powder. From the powderedmass, standard pellets were prepared for proton irradiation. In all cases, the NBSorchard leaf was used as such for concentration calibration. The findings from boththe HWB and HH studies are available in literatures/7 anc| j-ney are reproduced inTables 2 and 3 along with some other results^/?.
2.3 Analysis of human finger nails
A FIX E method has been developed to study the trace element composition ofhuman finger nails. In this method, nail samples, about 150 mg each, were collectedfrom ten fingers with stainless steel blade. They were soaked in water to remove anyloose dirt, then washed with deionized water and acetone in turn. The clean sampleswere oven dried at 1 lO^C for 1.5 h to constant weight. The dried nail samples wereheated at 200±5°C for 2 h in order to easily powder the materials. From the powderedmass, 50-mg pellets were prepared with a hand-press pellet maker for irradiation. Thedetails of this investigation has been reported .
Using the present method, the trace element composition (K,Ca, Ti,Mn, Fe, Ni,Cu,Zn, As, Se, Br, Rb, Sr and Pb) of 51 nail samples collected from adults were determinedby comparison with a calibration obtained from the NBS orchard leaf standard as men-tioned before. Table 4 contains these results along with some literature values'»
161
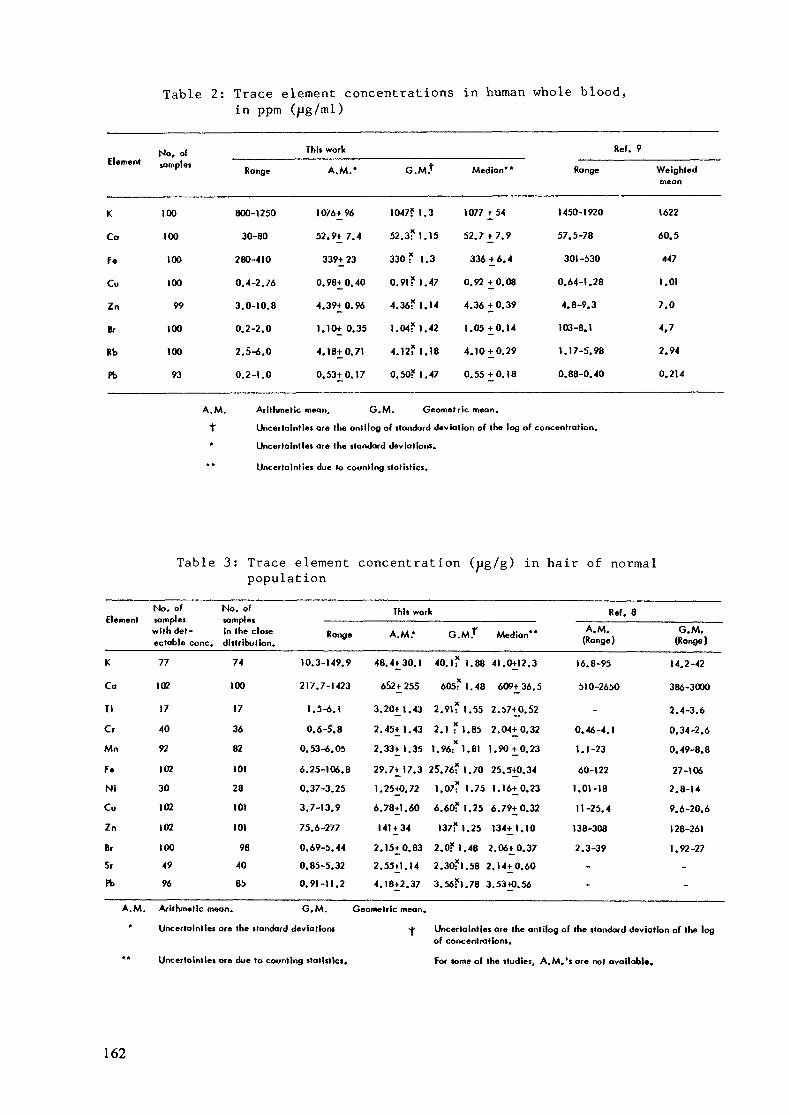
Table 2: Trace element concentrations in human whole blood,in ppm (ug/ml)
Element
K
Co
Fe
Cu
Zn
Br
Rb
Fb
No, ofsamples „r Range
100 800-1250
100 30-80
100 280-410
100 0.4-2.76
99 3.0-10.8
100 0.2-2.0
100 2.5-6.0
93 0.2-1.0
A.M. Arithmetic
This work
A.M.*
1076^96
52.9+ 7.4
339+23
0.98+0.40
4.39+0.96
1.10+0.35
4.18+0.71
0.53+0.17
mean.
G-M.1"
1047? 1.3
52.3? 1.15
330? 1.3
0.91? 1.47
4.36? 1.14
1.04? 1.42
4.12? 1.18
0.50? 1.47
Median**
1077 + 54
52.7 + 7.9
336 + 6.4
0.92 + 0.08
4.36 + 0.39
1.05 + 0.14
4.10 + 0.29
0.55 + 0.18
Ref.
Range
1450-1920
57.5-78
301 -530
0.64-1.28
4.8-9.3
103-8.1
1.1 7-5.98
0.88-0.40
9
Weightedmeon
1622
60.5
447
1.01
7.0
4,7
2.94
0.214
G.M. Geometric mean.
*f Uncertainties are the antilog of standard deviation of the log of concentration.
Uncertainties are the standard deviations.
Uncertainties due to counting statistics.
Table 3: Trace element concentration (jig/g) in hair of normalpopulation
No. of No. ofElement samples samples
with det- In the closeectable cone, distribution.
K
Co
Ti
Cr
Mn
Fe
Ni
Cu
Zn
Br
Sr
Pb
77
102
17
40
92
102
30
102
102
100
49
96
74
100
17
36
82
101
28
101
101
98
40
85
This work
Range
10.3-149.9
217.7-1423
1.3-6.1
0.6-5.8
0.53-6.05
6.25-106.8
0.37-3.25
3.7-13.9
75.6-277
0.69-5.44
0.85-5.32
0.91-11.2
A.M.*
48.4+30.1
652+255
3.20+J.43
2.45+1.43
2.33+ 1.35
29.7+17.3
1.25+0.72
6.78+1.60
141 + 34
2.15+0.83
2.55+1.14
4.18+2.37
G.
40.1?
M.f
1.88
605? 1 . 48
2.9»?
2.1?X
1.96:
25.76?
1.07?
6.60?
137?
2.0? i
2.30?
3.56?
U55
1.85
1.81
1.70
1.75
1.25
1.25
1.48
1.58
1.78
Median**
41.0+12.3
609+36.5
2.57+0.52
2.04+0.32
1.90 + 0.23
25.3+0.34
1.16+0.23
6.79+0.32
134+ 1.10
2.06+0.37
2.14+0.60
3.53+0.56
Ref. 8
A.M.(Range }
16.8-95
5)0-2650
-
0.46-4.1
1.1-23
60-122
1.01-18
11-25.4
138-308
2.3-39
-
-
G.M.(Range)
14.2-42
386-3000
2.4-3.6
0.34-2.6
0.49-8.8
27-106
2.8-14
9.6-20.6
1 28-261
1.92-27
-
-
A.M. Arithmetic mean. G.M. Geometric mean.
Uncertainties ore the standard deviations
Uncertainties are due to counting statistics.
Uncertainties are the antilog of the standard deviation of the logof concentrations.
For some of the studies, A.M.'s are not available.
162
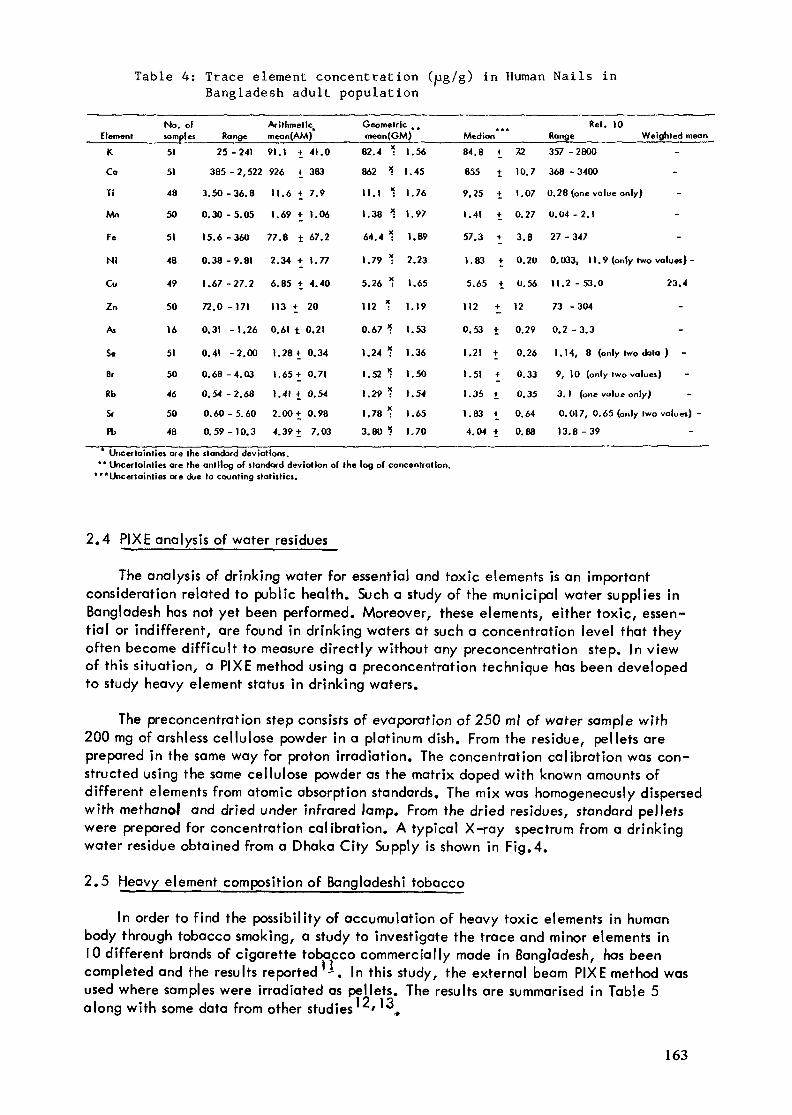
Table 4: Trace element concentration (ug/g) in Human Nails inBangladesh adult population
Element
K
Co
Ti
Mn
Fe
N!
Cu
Zn
As
Se
Br
Rb
Sr
Pb
No. ofsompl es Ra
51
51
48
50
51
48
49
50
16
51
50
46
50
48
25
385 -
3.50-
0.30 -
15.6 -
0.38 -
1.67 -
72.0 -
0.31 -
0.41 -
0.68 -
0.54 -
0.60-
0.59 -
nge
-241
2,522
36.8
5.05
360
9.81
27.2
171
1.26
2.00
4.03
2.68
5.60
10.3
Arithmetic,meon(AM)
91.1 +
926 +
11.6 +
1.69 +
77.8 ±
2.34 +
6.85 +
113 +
0.61 t
1.28 +
1.65 +
1.41 +
2.00 +
4.39 +
41.0
383
7.9
1.06
67.2
1.77
4.40
20
0.21
0.34
0.71
0.54
0.98
7.03
Geometric , ,mean(GM)
82.4 1
862 1
II. 1 1
1.38 1
64.41
1.79 1
5.26 1
112 1
0.67 *
1.24 *
1.52 1
1.29 *
1.781
3.80 1
1.56
1.45
1.76
1.97
t.89
2.23
1.65
1.1»
1.53
1.36
1.50
1.54
1.65
1.70
Median
84.8 +
855 t
9,25 +
1.41 +
57.3 +
1.83 +
5.65 t
112 +
0.53 +
1.21 +
1.51 +
1.35 +
1.83 <_
4.04 +
Ref. 10Range Weighted mean
72
10.7
1.07
0.27
3.8
0.20
Ü.56
12
0.29
0.26
0.33
0.35
0.64
0.88
357
368
0.28
-2800
-3400
(one value only)
0.04-2.1
27 -•347
0.033, 11.9 (only two values) -
11.2 - 53.0 23.4
73
0.2
-304
-3.3
1.14, 8 (only two dato ) -
9,
3.
0.
13
10 (only two values)
1 (one value only)
01 7, 0. 65 (only two values) -
.8-39
Uncertainties ore the standard deviations.'* Uncertainties are the anlilog of standard deviation of the log of concentration.
"'Uncertainties are due to counting statistics.
2.4 PIXE analysis of water residues
The anal/sis of drinking warer for essential and toxic elements is an importantconsideration related to public health. Such a study of the municipal water supplies inBangladesh has not yet been performed. Moreover, these elements, either toxic, essen-tial or indifferent, are found in drinking waters at such a concentration level that theyoften become difficult to measure directly without any preconcentration step. In viewof this situation, a PIXE method using a preconcentration technique has been developedto study heavy element status in drinking waters.
The preconcentration step consists of evaporation of 250 ml of water sample with200 mg of arshless cellulose powder in a platinum dish. From the residue, pellets areprepared in the same way for proton irradiation. The concentration calibration was con-structed using the same cellulose powder as the matrix doped with known amounts ofdifferent elements from atomic absorption standards. The mix was homogeneously dispersedwith methanol and dried under infrared lamp. From the dried residues, standard pelletswere prepared for concentration calibration. A typical X-ray spectrum from a drinkingwater residue obtained from a Dhaka City Supply is shown in Fig.4.
2.5 Heavy element composition of Bangladeshi tobacco
In order to find the possibility of accumulation of heavy toxic elements in humanbody through tobacco smoking, a study to investigate the trace and minor elements in10 different brands of cigarette tobacco commercially made in Bangladesh, has beencompleted and the results reported •*. In this study, the external beam PIXE method wasused where samples were irradiated as pellets. The results are summarised in Table 5along with some data from other studies '*' ^
163
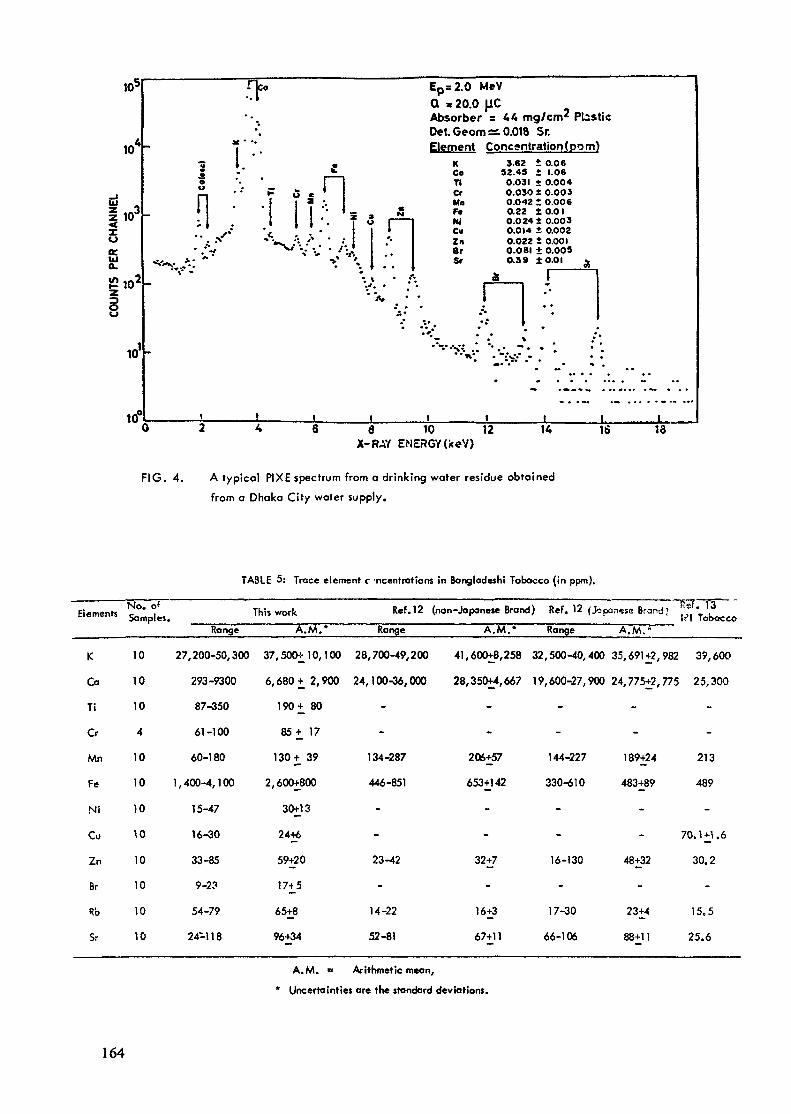
to:
10
,
I10uK
10'
§10
to°
Ep=2.0 MeVQ - 20.0 |JCAbsorber = 44 mg/cm2 PlasticDel. Geom sz. 0.018 Sr.Element Concgntration(pom)
u
0.. •-..
n .KCoTiCrMaF«WCuZn8rSr
3.62 ± O.0652.49 * 1.06
O.O3I ± 0.004O.030 ± O.003O.O42 î O.O060.22 t 0.010.0 24 i 0.0030.014 ± 0.0020.022 t O.OOIO.OBI t 0.009O.39 ±0.01
r
JL
FIG. 4.
a 10 12X-RAY ENERGY (keV)
14 13
A typical FIXE spectrum from a drinking water residue obtained
from a Dhaka City water supply.
TABLE 5: Trace element r -ncentrotions in Bangladeshi Tobacco (in ppm).
Elements
K
Co
Ti
Cr
Mn
Fe
Ni
Cu
Zn
Br
Rb
Sr
No. of T, .,. i This workSamples.
10
10
10
4
10
10
10
10
10
10
10
10
Range
27,200-50,300
293-9300
87-350
61-100
60-180
1 , 400-4, 1 00
15-47
16-30
33-85
9-2?
54-79
24-1 1 8
A.M.*
37,500+10,100
6,680+ 2,900
190+ 80
8 5 + 1 7
130+ 39
2,600+800
30+13
24+6
59+20
17+5
65+8
96+34
Ref. 12 (non-Japonese Brand) Ref. 12 (Jopanese Brand; ° ' I3IPI Tobacco
Range
28,700-49,200
24,100-36,000
-
-
134-287
446-851
-
-
23-42
-
14-22
52-81
A.M.*
41,600+8,258
28,350+4,667
-
-
206+57
653+142
-
-
32+7
-
16+3
67+11
Range
32,500-40,400
19,600-27,900
-
-
144-227
330-610
-
-
16-130
-
17-30
66-106
A.M.-"
35,691+2,
24,775+2,
-
-
189+24
483+89
-
-
48+32
-
23+4
88+11
982 39, 600
775 25,300
-
-
213
489
-
70.1+1.6
30.2
-
15.5
25.6
A.M. = Arithmetic mean,
* Uncertainties are the standard deviations.
164
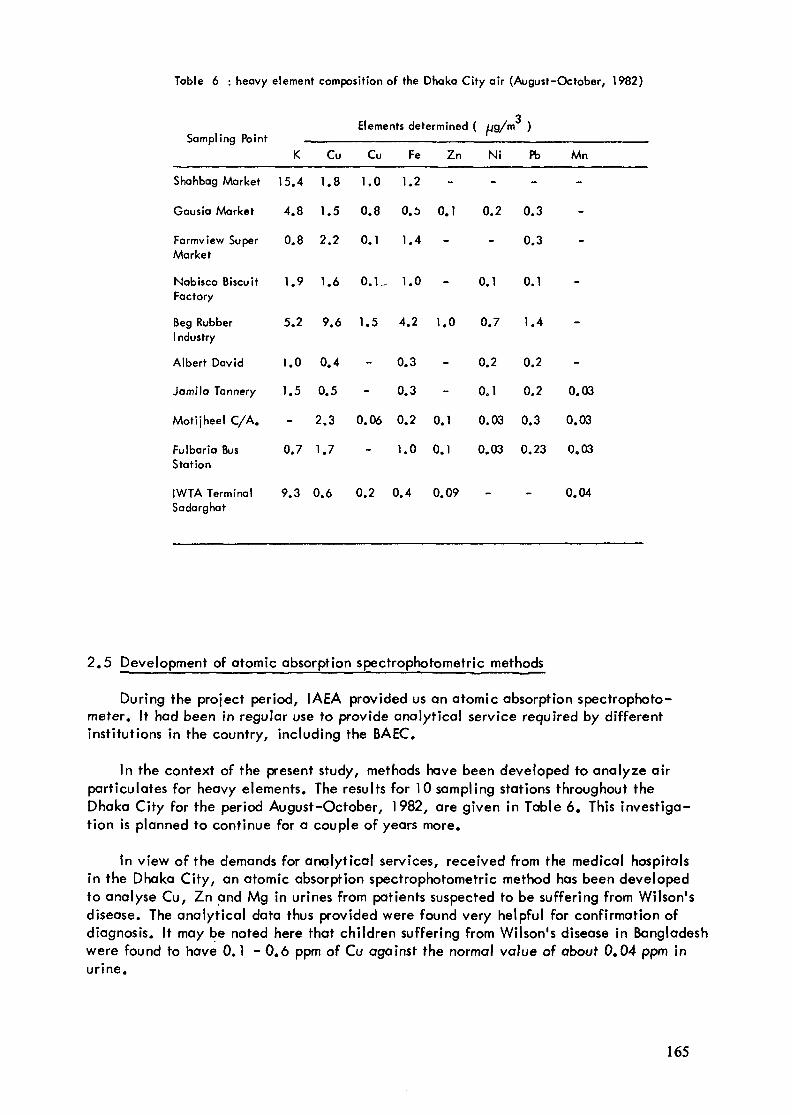
Table 6 : heavy element composition of the Dhaka City air (August-October, 1982)
3Elements determined ( ug/m )
Sampling Point ___________________________________________K Cu Cu Fe Zn Ni Pb Mn
Shahbag Market 15.4 1.8 1.0 1.2 -
Gausia Market 4.8 1.5 0.8 0.5 0.1 0.2 0.3
Farmview Super 0.8 2.2 0.1 1.4 - 0.3Market
Nabisco Biscuit 1.9 1.6 0.1, 1.0 - 0.1 0.1Factory
Beg Rubber 5.2 9.6 1.5 4.2 1.0 0.7 1.4Industry
Albert David 1.0 0.4 - 0.3 - 0.2 0.2
Jomilo Tannery 1.5 0.5 - 0.3 - 0.1 0.2 0.03
Motijheel C/A. - 2.3 0.06 0.2 0.1 0.03 0.3 0.03
Fulbaria Bus 0.7 1.7 - 1.0 0.1 0.03 0.23 0.03Station
IWTA Terminal 9.3 0.6 0.2 0.4 0.09 - - 0.04Sadarghat
2.5 Development of atomic absorption spectrophotomet r i c methods
During the project period, IAEA provided us an atomic absorption spectrophoto-meter. It had been in regular use to provide analytical service required by differentinstitutions in the country, including the BAEC.
In the context of the present study, methods have been developed to analyze airparticulates for heavy elements. The results for 10 sampling stations throughout theDhaka City for the period August-October, 1982, are given in Table 6. This investiga-tion is planned to continue for a couple of years more.
In view of the demands for analytical services, received from the medical hospitalsin the Dhaka City, an atomic absorption spectrophotometric method has been developedto analyse Cu, Zn and Mg in urines from patients suspected to be suffering from Wilson'sdisease. The analytical data thus provided were found very helpful for confirmation ofdiagnosis. It may be noted here that children suffering from Wilson's disease in Bangladeshwere found to have 0.1 - 0.6 ppm of Cu against the normal value of about 0.04 ppm inurine.
165
2„6 Intercom par ison programme of the IAEA
During the lifetime of the project, two intercomparison studies were conducted bythe Agency; one on human head hair (HH-1 ) and the other on a set of five IAEA and NBSreference materials (IAEA/RCA/RUN-1 ). This laboratory participated in both the studiesand performed the analysis using PIXE and AAS methods. These studies in fact have beenvery helpful in assessing our analytical competence in trace analysis. The experiencegained through this study would be of immense benefit in planning future measurementsmore cautiously where necessary.
3. FUTURE WORK PLAN
The future work plan of this laboratory in heavy trace metal analysis is to generallyimprove the accuracy and the precision of the methods already developed, by analyzingmore reference materials expected through the Agency and to develop more analyticalcompetence in the following areas of interest :
Study of the levels of nutritional and toxic elements in commonly consumed fooditems in Bangladesh, particularly fish.
Systematic analysis of aerosols collected from work environments as well as openatmosphere.
Study of the level of Cd and Se in surface waters in Bangladesh.
Metabolic aspects of trace elements in humans and animals.
ACKNOWLEDGEMENTS
We are very much thankful to the IAEA for providing us technical assistancein support of the work reported here and also for helping us in procuring valuableitems required by this research. The authors record with gratitude the cooperationreceived during the course of this work from the members of the Chemistry, Experi-mental Physics, Technical Physics, Electronics and the General Services and Engg«Divisions of the AECD. The continued interest of Dr. Anwar Hossain, Chairman,BAEC and Dr. M.A. Rab Mol la, Director, AECD, in this research has always beenvery inspiring.
REFERENCE
1. Khan, A.H., Khaliquzzaman, M., Husain, M., Abdullah, M.,Katsanos, A.A.: Nucl.Instr. and Meth., 169 253(1979)
2. Khaliquzzaman, M., Zaman, M.B., Khan, A.H.: Nucl.Instr.and Meth.181 209-215 (1981)
3. Biswas, S.K., Khaliquzzaman, M., Islam, M.M., Khan, A.H.:Nucl.Instr. and Meth. 1984 (in press)
4. Maenhault, W. , Reudel, Rinswelt Van., H.A., Cafmeyer, , J." : .Nucl.Instr. and Meth., 168 557 (1980)
166
5. Campbell, J.L.: IEEE Trans.Nucl.Sei. 2£ 1363 (1979)
6. Khan, A.H., Khaliquzzaman, M., Zaman, M.B., Husain, M.,Abdullah, M., Akhter, S.: J.Radioanal.Chem. 5]_ 157-167 (1980)
7. Husain, M., Khaliquzzaman, M., Abdullah, M., Ahmed, I.,Khan, A.H. : Int. J.Appl .Rad. Isotopes, 3_1 527-534 (1980)
8. "Activation Analysis of Hair as an Indicator of Contaminationof Man by Environmental Trace Element Pollutants", ReportIAEA/R1/50, 1978
9. lyengar, G.V., Kollmer, W.E., Bowen, H.J.M.: 'The ElementalComposition of Human Tissues and Body Fluids;1 Verlag Chemie,Weinheim, New York, 1978
10. Biswas, S.K., Abdullah, M., Akhter, S., Tarafdar, S.A.,Khaliquzzaman, M., Khan, A.H.: J.Radioanal.Chem. (in press)
11. Hadi, D.A., Ali, M., Biswas, S.K., Islam, M.M., Khan, A.H.:Int.J.Appl.Rad.Isotopes (in press)
12. Sato, N., Kato, T., Suzuki, N.: J.Radioanal.Chem. 36 221 (1977)
13. (a) Nadkarni, R.A., Morrison, G.H.: Anal.Chem., 45 1957 (1973)(b) Nadkarni, R.A., Morrison, G.H.: Anal.Chem., 45 1504 (1972)
167
TRACE ELEMENT ANALYSIS OF HUMAN HEADHAIR BY NEUTRON ACTIVATION TECHNIQUE
N.B. KIM, H.W. CHUNG, K.Y. LEE,Korea Advanced Energy Research Institute,Seoul, Republic of Korea
Abstract28 elements in reference hair sample (HH-1) and 44 hair samples of Seoul,
Korea have been analyzed by instrumental neutron activation analysis. Theanalytical results of reference sample are good agreed with those of IAEAreport within 10% deviation except those of some elements. For the 44 hairsamples of Seoul, the range of content of each element is fallen in +3o fromhis mean value if rejecting one or two of the highest data.
1. INTRODUCTION
In the problem of pollution of the biosphere, man himself undoubtedlyoccupies the central position as a target. However, it would be a real dis-aster if man himself became contaminated to levels giving rise to harmfulsomatic or genetic effects. It is therefore an urgent problem to determinethe initial levels of trace elements in man and the extent of his contamina-tion in areas where these elements are expected to show anomalous concentra-tions. As it is impossible to determine the trace elements composition ofthe whole body, human head hair is regarded as an indicator of the degree ofcontamination of man by pollutants.
For national scale survey of the degree of contamination of man, itwould be ideal to have a random sampling of the entire population with allpossible epidemiological characteristics such as age, sex, place, socio-eco-nomic status, cultural background and etc. But it is very difficult and tre-mendous work to cover entire population with all epidemiological characteris-tics. Furthermore, our traditional old custom makes it more difficult topersuade rural peoples to obtain hair samples from them.
Fortunately, we take advantage of our unique recruiting system whichall recruits from all over the country must have their hair cut in the re-cruit training center. The recruit population covers all provinces of ourcountry. But due to their uniform sex and age, it covers only limited epi-demiological characteristics. On the other hand, the fact that all recruitsare healthy enough to be recruited and have same sex of male and age of 22years old is very advantageous to compare geographical differences.
2. EXPERIMENTAL
2.1. Collection and pretreatment of sample : 44 hair samples were collectedfrom the recruits of Seoul, Korea together with the answers to questionaire.
169
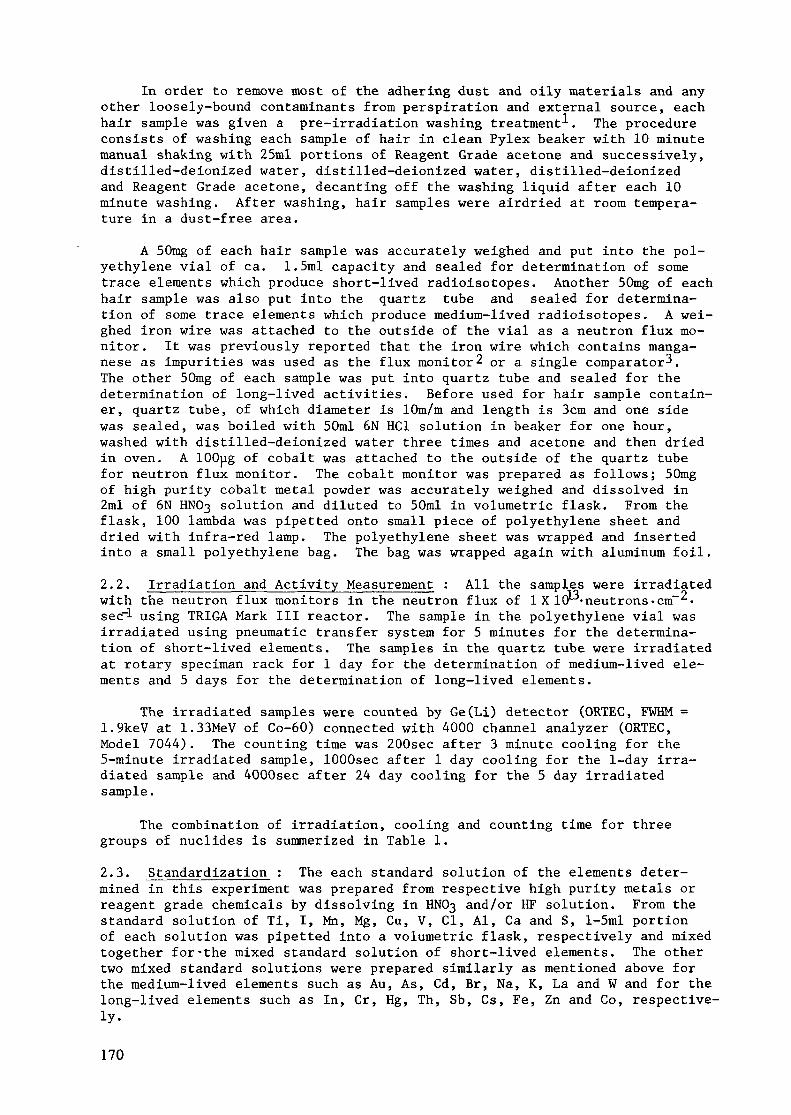
In order to remove most of the adhering dust and oily materials and anyother loosely-bound contaminants from perspiration and external source, eachhair sample was given a pre-irradiation washing treatment^. The procedureconsists of washing each sample of hair in clean Pylex beaker with 10 minutemanual shaking with 25ml portions of Reagent Grade acetone and successively,distilled-deionized water, distilled-deionized water, distilled-deionizedand Reagent Grade acetone, decanting off the washing liquid after each 10minute washing. After washing, hair samples were airdried at room tempera-ture in a dust-free area.
A 50mg of each hair sample was accurately weighed and put into the pol-yethylene vial of ca. 1.5ml capacity and sealed for determination of sometrace elements which produce short-lived radioisotopes. Another 50mg of eachhair sample was also put into the quartz tube and sealed for determina-tion of some trace elements which produce medium-lived radioisotopes. A wei-ghed iron wire was attached to the outside of the vial as a neutron flux mo-nitor. It was previously reported that the iron wire which contains manga-nese as impurities was used as the flux monitor2 or a single comparator^.The other 50mg of each sample was put into quartz tube and sealed for thedetermination of long-lived activities. Before used for hair sample contain-er, quartz tube, of which diameter is lOm/m and length is 3cm and one sidewas sealed, was boiled with 50ml 6N HC1 solution in beaker for one hour,washed with distilled-deionized water three times and acetone and then driedin oven. A lOOug of cobalt was attached to the outside of the quartz tubefor neutron flux monitor. The cobalt monitor was prepared as follows; 50mgof high purity cobalt metal powder was accurately weighed and dissolved in2ml of 6N HNOß solution and diluted to 50ml in volumetric flask. From theflask, 100 lambda was pipetted onto small piece of polyethylene sheet anddried with infra-red lamp. The polyethylene sheet was wrapped and insertedinto a small polyethylene bag. The bag was wrapped again with aluminum foil.
2.2. Irradiation and Activity Measurement : All the samples were irradiatedwith the neutron flux monitors in the neutron flux of 1XICP-neutrons-cm~ •sec~l using TRIGA Mark III reactor. The sample in the polyethylene vial wasirradiated using pneumatic transfer system for 5 minutes for the determina-tion of short-lived elements. The samples in the quartz tube were irradiatedat rotary speciman rack for 1 day for the determination of medium-lived ele-ments and 5 days for the determination of long-lived elements.
The irradiated samples were counted by Ge(Li) detector (ORTEC, FWHM =1.9keV at 1.33MeV of Co-60) connected with 4000 channel analyzer (ORTEC,Model 7044). The counting time was 200sec after 3 minute cooling for the5-minute irradiated sample, 1000sec after 1 day cooling for the 1-day irra-diated sample and 4000sec after 24 day cooling for the 5 day irradiatedsample.
The combination of irradiation, cooling and counting time for threegroups of nuclides is summerized in Table 1.2.3. Standardization : The each standard solution of the elements deter-mined in this experiment was prepared from respective high purity metals orreagent grade chemicals by dissolving in HNOß and/or HF solution. From thestandard solution of Ti, I, Mn, Mg, Cu, V, Cl, AI, Ca and S, l-5ml portionof each solution was pipetted into a volumetric flask, respectively and mixedtogether for-the mixed standard solution of short-lived elements. The othertwo mixed standard solutions were prepared similarly as mentioned above forthe medium-lived elements such as Au, As, Cd, Br, Na, K, La and W and for thelong-lived elements such as In, Cr, Hg, Th, Sb, Cs, Fe, Zn and Co, respective-ly.
170

Table 1. Combination of irradiation, cooling and counting times for thethree groups of nuclides analyzed at present work.
Group of nuclide
Short-lived;51Ti, 128I, 56Mn, 27Mg,66Cu, 52V, 38C1, 28A1,
Medium-lived;198Au, 76As, 115n>In(Cd) ,
187W.
Long-lived;114mlnj 51Cr> 203Hg)233Pa(Th), 124Sb, 134Cs,59Fe, 65Zn, 60Co
Irradiationtime
5 min
lOh/d X 1
lOh/d X 5
Coolingtime
3 min
1 day
3 week
Countingtime
200sec
1,000sec
4,000sec
For short-lived nuclides, about 2ml of the mixed solution was pipettedinto the polyethylene vial of 3ml capacity and Fe wire was attached on theoutside of the vial. The vial was irradiated for 5 minutes and cooled for3 minutes. Then, the vial was opened and 1ml of the solution was pipettedinto a new vial. The r-ray spectrum was applied for the activity of eachnuclide. The irradiated iron-wire was measured with the analyzer under the0.847 MeV peak of %Wn which is originated from the manganese impurity. Theactivity of each standard element was normalized with the activity of manga-nese monitor. From each mixed standard solution of the medium-lived elementsand the long-lived elements, 2ml was pipetted into quartz tube and irradiatedwith Co monitor for 1 day and 5 days, respectively. After cooling the samplesfor appropriate times, each gamma-ray spectrum was applied for the activitiesof nuclides. The activity of each standard elements was also normalized withthe activity of Co monitor.
2.4. Analysis of Hair Samples : The reference hair sample(HH-1) was analyzed7 times as mentioned above and the analytical result is shown in Table 2.Among the collected hair samples in Korea, 44 samples in Seoul were analyzedfor short-lived, medium-lived and long-lived elements and the results areshown in Table 3.
171

N> Table 2. Analytical result of reference hair sample, HH-1, (ppm)
Element
TiI
MnMgCuV
AlClCaS
AuAsCdBrWNaKLaInCrHgThSbCsSnFeZnCo
Analytical Results
3.81 3.28 2.57 2.91 3.58 3.32 4.4062.0 59.8 63.4 51.9 52.8 52.7 58.71.21 0.832 1.17 1.13 0.973 0.980 1:01102 101 132 92.7 108 104 79.622.0 15.5 14.2 18.6 17.9 16.0 19.10.129 0.161 0.179 0.105 0.104 0.119 0.09907.10 6.16 5.98 4.45 6.55 4.67 5.132530 2220 2800 2650 2400 2490 2570735 730 839 815 607 698 706
48100 61900 64400 68700 56900 48900 613000.0210 0.0350 0.0284 0.0303 0.0332 0.0240 0.02730.0513 0.0630 0.0521 0.0438 0.0473 0.0557 0.04790.310 328 247 236 268 231 2574.07 3.19 3.67 4.53 4.88 3.80 3.67
0.0373 0.0146 0.0216 0.0117 0.0438 0.0270 0.021110.8 10.3 12.9 12.8 13.2 11.8 12.68.41 7.31 9.10 8.37 6.93 7.43 8.87
0.0121 0.0144 0.0110 0.00903 0.00869 0.0130 0.01440.36 0.61 0.54 0.42 0.39 0.47 0.470.247 0.231 0.208 0.284 0.231 0.287 0.2640.990 1.47 2.84 2.21 1.36 1.73 1.200.11 0.079 0.081 0.10 0.14 0.10 0.10
0.0215 0.0228 0.0271 0.0364 0.0338 0.0372 0.03680.51 0.78 0.94 0.67 0.55 0.77 0.84190 250 240 180 180 210 21028.8 20.7 25.6 27.3 21.4 28.1 27.6142 153 143 174 183 167 1566.03 6.12 5.74 5.43 6.41 6.37 5.94
Aver age (^1 a)
3.41 + 0.5557.3 ± 4.41.04 ± 0.12103 ± 1517.6 ± 2.40.128 + 0.0285.72 + 0.922520 ± 170733 ± 72
58600 ± 72000.0285 ± 0.00460.0516 ± 0.00590.268 ± 0.0343.97 ± 0.53
0.0253 ± 0.010812.1 + 1.08.06 ± 0.77
0.0118 ± 0.00220.466 ± 0.08050.250 ± 0.0271.69 ± 0.600.101 ± 0.0190.0308 ± 0.00630.723 ± 0.144209 ± 2625.6 ± 3.0158 ± 146.01 ± 0.32
Data from IAEA
20.25 ± 8.910.85 ± 0.2562.01 ± 0.5810.23 ± 3.170.14 ± 0.155.50 ± 2.58
2265.29 ± 478.28522.03 ± 160.2248707 ± 1500.03 ± 0.010.05 ± 0.020.26 ± 0.134.16 ± 2.0912.64 ± 4.779.21 ± 5.150.01 ± 0.0
0.27 ± 0.161.7 ± 0.240.03 ± 0.01
23.7 ± 9.7174.09 ± 31.585.97 ± 1.21
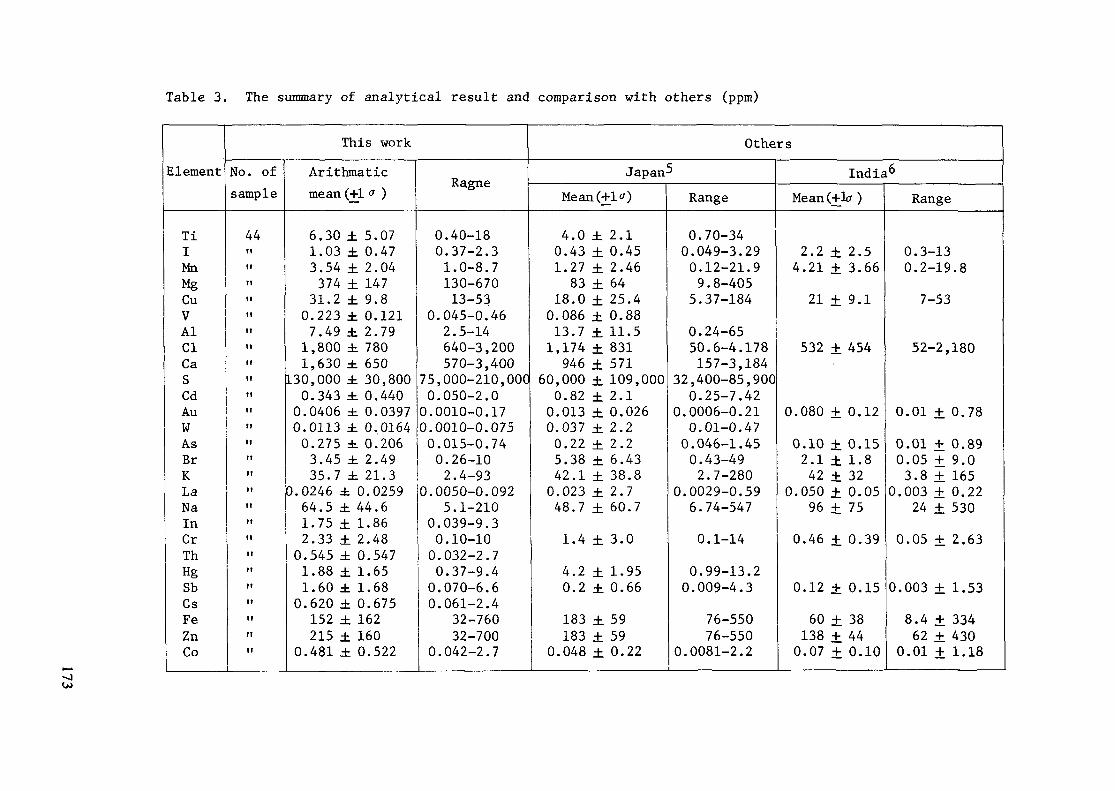
Table 3. The summary of analytical result and comparison with others (ppm)
Element
TiIMnMgCuVAlClCaSCdAuWAsBrKLaNaInCrThHgSbCsFeZnCo
This workNo. ofsample
44MnnnMnnitittinnitunntinnnnnitnnit
Arithmaticmean (+1 " )
6.30 ± 5.071.03 ± 0.473.54 ± 2.04374 ± 147
31.2 ± 9.80.223 ± 0.1217.49 ± 2.79
1,800 ± 7801,630 ± 650
130,000 ± 30,8000.343 ± 0.4400.0406 ± 0.03970.0113 ± 0.01640.275 ± 0.2063.45 ± 2.49
Ragne
0.40-180.37-2.31.0-8.7130-67013-53
0.045-0.462.5-14640-3,200570-3,400
75,000-210,0000.050-2.00.0010-0.170.0010-0.0750.015-0.740.26-10
35.7 ± 21.3 2.4-930.0246 ± 0.0259
64.5 ± 44.61.75 ± 1.862.33 ± 2.480.545 ± 0.5471.88 ± 1.651.60 ± 1.680.620 ± 0.675152 ± 162215 ± 160
0.481 ± 0.522
0.0050-0.0925.1-210
0.039-9.30.10-100.032-2.70.37-9.40.070-6.60.061-2.4
32-76032-700
0.042-2.7
OthersJapan^
Mean(+l<>)
4.0 ± 2.10.43 ± 0.451.27 ± 2.4683 ± 64
18.0 ± 25.40.086 ± 0.8813.7 ± 11.5
1,174 + 831946 ± 571
60,000 ± 109,0000.82 ± 2.1
0.013 ± 0.0260.037 ± 2.20.22 ± 2.25.38 ± 6.4342.1 ± 38.80.023 ± 2.748.7 ± 60.7
1.4 ± 3.04.2 ± 1.950.2 ± 0.66
183 ± 59183 ± 59
0.048 ± 0.22
Range
0.70-340.049-3.290.12-21.99.8-4055.37-184
0.24-6550.6-4.178157-3,184
32,400-85,9000.25-7.42
0.0006-0.210.01-0.470.046-1.450.43-492.7-280
0.0029-0.596.74-5470.1-14
0.99-13.20.009-4.3
76-55076-550
0.0081-2.2
India6Mean (+lrf )
2.2 + 2.54.21 ± 3.66
21 ± 9.1
532 ± 454
0.080 ± 0.12
0.10 ± 0.152.1 ± 1.842 ± 32
0.050 ± 0.0596 + 75
0.46 ± 0.39
0.12 ± 0.1560 ± 38138 + 44
0.07 + 0.10
Range
0.3-130.2-19.8
7-53
52-2,180
0.01 + 0.78
0.01 + 0.890.05 + 9.03.8 ± 165
0.003 ± 0.2224 ± 530
0.05 ± 2.63
0.003 ± 1.538.4 ± 33462 + 430
0.01 ± 1.18

3. RESULTS AND DISCUSSION
The hair sample analyzed in this work were collected from young men livedin Seoul and 10cm long from scalp. It is also well known that the growth rateof adult hair is 1cm per month or 12cm per year. The analytical results ofthis work, therefore, should reflect the normal values of trace element con-centration in hairs of Seoulite at present.
When the present method was applied to the reference hair sample(HH-1)as shown in Table 2, the analytical results of 28 elements were good agreedwith the those of IAEA report7 within 10% deviation except I, Mg, Cu, Ca andS, while the contents of these elements are higher than those of IAEA report.The deviation between the two results were 20% for S, 40% for Ca, 60% for Cuand 300% for I.
As shown in Table 3, most of the ranges of the trace element concentra-tions in hair of Seoulite are fallen in +3<* from their arithmatic means ex-cept S, Cd, Au, W, In, Th, Hg, Fe and Co. The range of these elements arealso fallen in +3 a from their means, if one or two of the highest raw dataare rejected for the calculation of their means and ranges.
Sulfur is the richest one among trace elements in hair and it's concen-tration is known to be 4.1% or 41000ppm by a IAEA publication . But it'sconcentration in our data is 131000ppm and about three times higher than thevalue by the IAEA publication. The reason of such a high concentration ofsulfur is not explained at present.
It is noted that the analytical results of hair samples of Seoul obtainedin this work are comparable with the corresponding values of other countriesgiven by others as shown in Table 3, Comparing with the results of Japan,these two data are similar about the elements of Ti, Cl, As, Br, K, La, Na,Cr, Fe and Zn> while our data are higher 2 or 3 times than the data of Japanabout the elements of I, Mn, Mg, Cu, V, Ca and S and our data are lower thanthe data of Japan about other elements. But, in case of the elements of Sband Co, our data are much higher by factor of 8-10 than the data of Japan.Otherwise, comparing with data of India, our data are much similar with thedata of India than those of Japan.
REFERENCES
1) "Activation Analysis of Hair as an Indicator of Contamination of Man byEnvironmental Trace Element Pollutants", IAEA/RL/50, IAEA, 1978
2) M. Sankar Das, W. I. Kirn and C. Lee, Int. J. Appl. Radiation and Isoto-pes, 20_, 746 (1969)
3) C. Lee, Y. C. Yim and K. S. Chung, J, Korean Nuclear Soc., 4_, 83 (1972)4) "Toxic Trace Metals in Mammalian Hair and Nails", EPA, EPA-600/4-79-049,
U.S.A., 1979.5) A. Imahori, et. al., J. Radioanalytical ehem., 52, 167 (1979)6) Private Communication from S. Gangadahran, India, 1981.7) Private Communication from IAEA, 1981.
174

BASELINE STUDY OF PESTICIDE RESIDUES ANDTOXIC CONTAMINANTS IN ENVIRONMENTAL SAMPLES INTHAILAND BY NEUTRON ACTIVATION TECHNIQUE
S. MONGKOLPHANTHA, M. DEJKUMHANG, S. NOUCHPRAMOOL,S. CHUINTA, W. WIMOLWATTANAPHUNT, N. LEELHAPHUNTOffice of Atomic Energy for Peace,Bangkok, Thailand
Abstract
The technique of neutron activation, both instrumental and radio-chemical, is used for the investigation of pesticide residues and contami-nants, viz. Hg, Set As, Cd, Cu, Br, Co and Zn in rice and marine fish inThailand. More than 500 samples of 6 species including squid of fishcaught from polluted and non (less)-polluted areas in Thai waters, and of17 varieties of non-glutinous rice and 6 varieties of glutinous rice ofboth brown and milled collected from 21 different rice experiment stationsthroughout the Kingdom are analyzed« The results of this study positivelyindicate that there are no contamination in fish and rice in Thailand.Additionally, the baseline concentration of studies trace toxic elementsis established.
1. INTRODUCTION
The research on the investigation of trace toxic elements both fromthe residues of (inorganic) pesticides and contaminants in variousenvironmental matrices in Thailand using nuclear based techniques, mostlyneutron activation analysis (NAA) has been carried out at the Office ofAtomic Energy for Peace (OAEP) since 1972. The elements under the investiga-tion were As, Br, Cd, Co, Hg and Zn in numerous varieties of samples, e.g.3owen's kale (1), indigenous vegetables and fruits (2), brown and milledglutinous and non-glutinous rice around Thailand (3), marine fish frompolluted and non-polluted areas in the Gulf of Thailand (4). Unfortunately,no conclusions could be drawn since the baseline levels of such elementswere not known in Thailand.
As generally recognized that the baseline concentration is extremelyessential for indicating of pollution problems. Additionally, Thailand isalso wellknown as one among the agricultjiral countries and exporters of thenumbers of agricultural products. It is, therefore, the purpose of thisstudy to apply the technique of NAA to the establishment of the baselinelevels of trace toxic elements.from both residues of pesticides andcontaminants by multi-elements determination of As, Br, Cd, Co, Cu, Hg, Seand Zn both instrumentally and radiochemically in marine fish and ricewhich are the staple food of Thai's people. It is strongly believed thatthis study will consequently be a great help for Thailand's economic inview of quality assurance of our trade as well as the health and welfareof her people.
The work had been performed during April 1977 - October 1981 withcollaboration with Department of Agriculture and Fishery Department,Thailand.
175
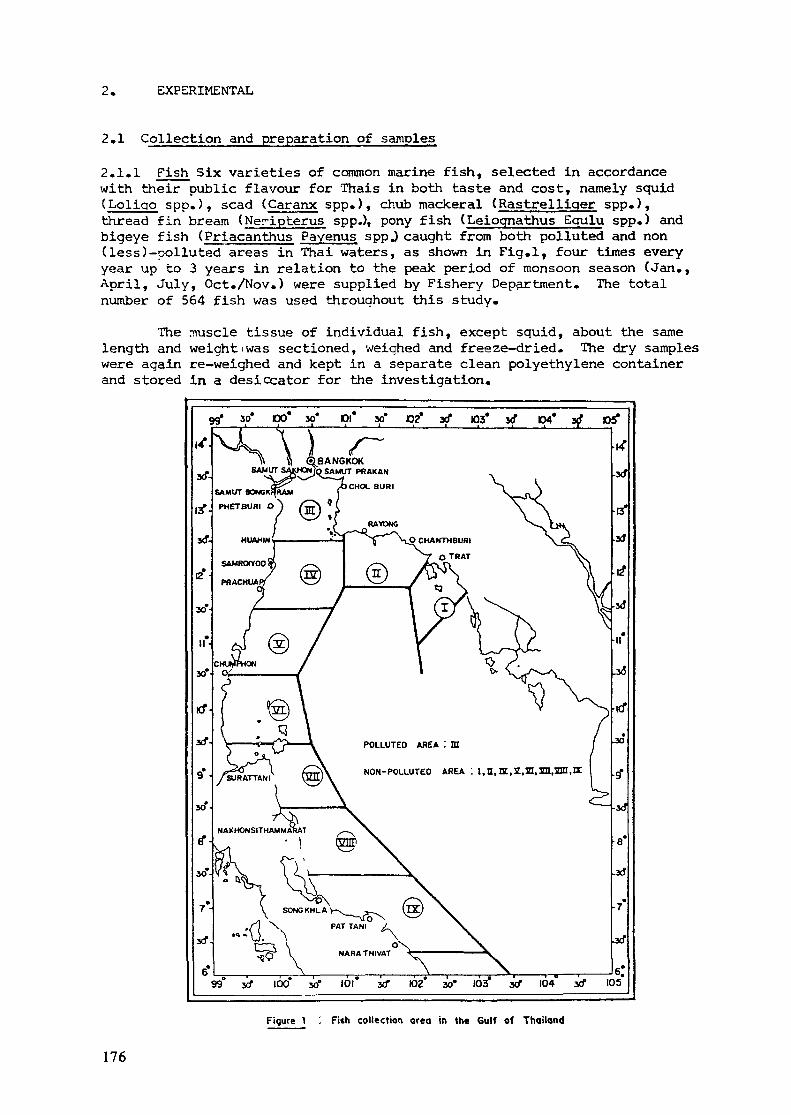
2. EXPERIMENTAL
2.1 Collection and preparation of samples
2.1.1 Fish Six varieties of common marine fish, selected in accordancewith their public flavour for Thais in both taste and cost, namely squid(Loliqo spp.), scad (Caranx spp.), chub mackeral (Rastrelliqer spp.),thread fin bream (Ner-ipterus spp.), pony fish (Leioqnathus Equlu spp.) andbigeye fish (Priacanthus Payenus sppJ caught from both polluted and non(less)-Dolluted areas in Thai waters, as shown in Fig.l, four times everyyear up to 3 years in relation to the peak period of monsoon season (Jan.,April, July, Oct./Nov.) were supplied by Fishery Department. The totalnumber of 564 fish was used throughout this study.
The muscle tissue of individual fish, except squid, about the samelength and weightiwas sectioned, weighed and freeze-dried. The dry sampleswere again re-weighed and kept in a separate clean polyethylene containerand stored in a desiccator for the investigation.
9g» y* 00* 39' PI* y* 02* yf 103* yf D4* yf
I/.rrf
rf
POLLUTED AREA '. m
NON-POLLUTED AREA : I, u, IZ.Z.H,SH.SIII.Œ
99° yf 100* yf 101* jcf 102° 30* 103* yf 104 3d" 105°
Figure 1 '. Fish collection area in the Gulf of Thailand
176

2.1.2 Rice Seventeen varieties of non-glutinous rice and six varieties ofglutinous rice collected from 21 different rice experiment station 'throughout the Kingdom were kindly provided by the Department of Agriculture.The paddy about 1 kg in weight, was previously husked and divided into twoportions. The first portion was the brown rice. The second portion wasmilled and polished and named the milled rice. Individual brown and milledrice was separately kept in a clean polyethylene container for furtheranalyses.
2.2 Neutron irradiationSamples and standards were irradiated simultaneously in a selected
facility, either in a rotary speciman rack "Lazy Susan" or special designwet tube in the Thai Research Reactor-1/ Modification 1 (TRR-l/M-1) whichhas Triga Mark III core, mormally operating at 1 MW and has been routinelya - ™e lsotopes 70As'82Br'Co, Cu, Hg, Se and Zn were chosen for thisinvestigation. The detail of this irradiation was also described in Table 1
TABLE 1. SURVEY OF IRRADIATION DETAIL IN THE TRR-l/M-1(THAI RESEARCH REACTOR-1 /MODIFICATION 1)
Element
Hg, Se
As, Cd,Cu,Zn
Br, Co,Zn
Facility
Wet tube
LazySusan
LazySusan
Thermalneutronfluxn/cm -sec1011
3xl012
3X10¹²
Timeof
Irradiation
2 months
5 days(~25 hrs)
5 days( 25 hrs)
Container
quartz capsules(1.9 cm i.dx8,5 cm)in aluminiumcontainer (5.0 cmi.d.x!9.5 cm)sample inaluminium foil,standard in quartzampoule (0.9 cmi.dx? cm) bothpacked inaluminium container(2.5 cm i.dxlO.5 cm)polyethylenecapsules (1.0 cmi.dxl.5 cm) inaluminium container(2.5 cm i.dxlO.5 cm)
Remark
10 samplesand 2 mixedstandards inone container
4 samples andone mixedstandard inone container
2.2.1 Instrumental analysis After neutron irradiation, the samples andstandards were thennmeasured after-a coaling time of 5-7 days for_ Brand 1-2 month for Co and Zn respectively with using a 26 cm Ge(Li)detector with a energy resolution of 2.2 keV for the 1333 keV gamma caysof Co connected to either a 4096 channel analyzer with mini computer(ORTEC Model 7032) or a 1024 channel analyzer (Tracor Northern* TN-1706).The areas-under the photopeaks-corresponding to the X -ray of Sr at777 keV, uCo at 1333 keV and Zn at 1116 keV of samples and standardswere compared.
177

2.2.2 Radiochemical analysis With the limitation of the present availablefacility, As, Cd, Cu, Hg and Se could not be determined instrumentally.Additionally, the determination procedures for As, Cd, Cu and Hg which werepreviously developed and employed in our laboratory and was describedelsewhere' (1-4) were quite satisfactory but it was time consuming. It wasnot quite the proper technique to handle the large number of samples.Consequently, the direct combustion technique described by Rook (5) and theion-exchange technique described by Morrison and Potter (6) were modifiedand employed for the investigation of Hg, Se; As, Cu, Cd, Zn respectively.
3. RESULTS AND DISCUSSION
The reliability test with using Bowen's Kale and Bovine liver (SRM1577) of NBS as indicated in Table 2 was shown quite satisfactory. Thelimit of detection forJBr, Co, Zn ClNAA)i As, Cu» Cd, Hg and Se (RNAA) asobtained was 10~ , 10~ , 10 ; 10 , 10 , 4xlO~3, 10 , 9x10~5 mg/kgrespectively. Additionally, numerous standard reference materials anddummy samples were frequently used for quality control of the analyticalresults.
TABLE 2. THE RELIABILITY TEST OF THE ELEMENT DETERMINED WITH USINGSTANDARD REFERENCE MATERIAL
Element
AsCd-HgSe3r
Co
Zn-
Sowen' s KaleCertified value
0.129 +. 0.023
0.746 +. 0.2370.1663+0.02350.120 +. 0.020725.62 +, 1.50
0.0585+. 0.008
32.74 +. 2.66
—— —— . , —— .. tresult of thisinvestigation0.1128 JK 0.0107
0.7355 jf 0.08070.1850 +. 0.0103
-24.50 +_ 2.0
0.056 i 0.00731.83 i 0.51
Bovine Liver (SRM 1577)Certified value
0.055**0.27 .+ 0,04
0.016+0.0021.1 +, 0.1
---
•result of thisinves tigation0.07-60 ± 0.0080
0.2722 ± 0.01660.0167 +. 0.0011.0103 +. 0.0347
-
--
• at least three sets of the investigation•• not yet certified
In order to correct for flux gradients in the irradiation position,a flux monitor, normally, a copper disc was used throughout the study.
The chemical 'yield of used separation procedures, which was previouslytested with using the appropriate radio-tracer s ,for Cd, Cu, Hg, Se was about100% and for As was 65%.
178
3.1 Pish
The total number of 147, 81, 208 and 120 samples of-six varieties ofcommon marine fish caught from both polluted and non-polluted areas wasinvestigated for Hg, Se; As, Cd; Br; Co and Zn respectively and the summaryin concentration ranges, averages and.(proposed) baseline of elementsdetermined was presented in Table 3. The results up to present, as indicatedin Table 4, showed no significant difference in concentration of elements infish caught from both polluted and non-polluted areas. Additionally, incomparison with values reported by FAD/WHO in 1972 (7) and others as citedin Table 5, the result of this study indicated much lower in concentration.Consequently, it could be stated that there is no identification of pollutionof the elements surveyed in Thai waters.
Since area III is the estuary of the main rivers of Thailand, it isconsidered the only polluted area in the Gulf of Thailand, In accordancewith Holden (8), only muscle tissue was used to represent the edible part.
Apart from this work, the research on the investigation of trace toxicelements with 'particular attention to As, Cd, Cr, Hg, Pb, Se etc. in surfacewater, sediment, plankton, shellfish etc, is planned to be carried out atthis office. The main objective is to study the uptake and the correlationof thus trace toxic elements-in environmental matrices.
3.2 Rice
Large number of samples of non-glutinous and glutinous rice wasinvestigated for As, Cd, Cu; Hg, Se; "Br, Co and Zn and the summary inconcentration ranges, averages and (proposed) baseline of elementsdetermined was presented in Table 6, In comparison with the results of theother investigators, as indicated in Table 7, the result of this studywas- within that range. Consequently it can be concluded that there is nocontamination in Thai rice .
Since brown rice is still favourably consumed by some countrymen invarious parts of the country, and a rice bran which is left over frommilling brown rice is also used for chicken, duck and pig feeding in Thailand,the investigation for such elements is essential.
It is our intention to study the in put of elements determined. Thecorrelating samples, viz. planted soil, before and after harvesting, everybatches ~of used fertilizers and pesticides were collected for investigation.It is expected that the results could be published in internation journal ina .very near future.
179
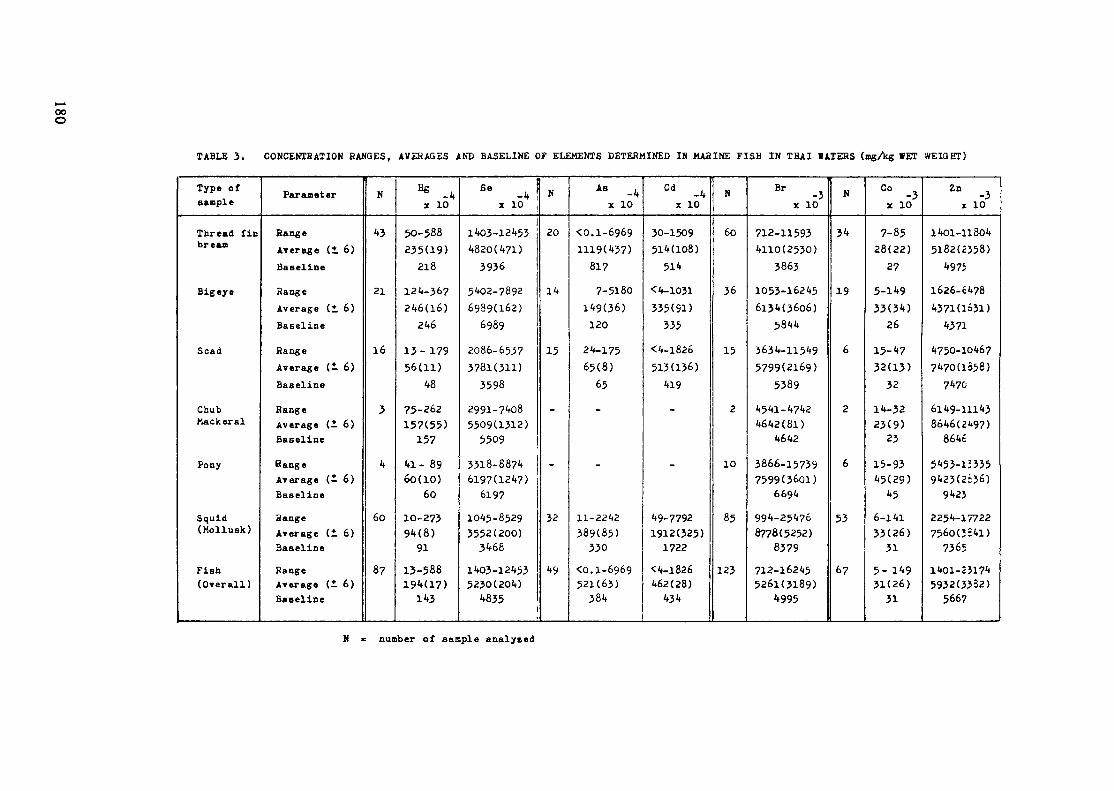
ooo
TABLE 3. CONCENTRATION RANGES, AVERAGES AND BASELINE OF ELEMENTS DETERMINED IH MARINE FISH IN THAI «ATEHS (mgAg WET WEIGHT)
Type ofsample
Thread finbreajB
Big eye
Scad
ChubMacker al
Pony
Squid(Mollusk)
Fish(Overall)
Parameter
RangeAverage (+ 6)Baseline
RangeAverage (± 6)Baseline
RangeAverage (1 6)
Baseline
RangeAverage (± 6)Baseline
RangeAverage (1 6)Baseline
RangeAverage (1 6)Baseline
RangeAverage (± 6)Baseline
N
43
21
16
3
4
60
87
* -4x 10
50-588
235(19)218
124-367246(16)
246
13- 17956(11)
48
75-262157(55)
157
41- 8960(10)
60
10-27394(8)
91
13-588194(1?)
143
58 -Jx 10
1403-124534820(471)
3936
5402-78926989(162)
6989
2086-65373781(311)
3598
2991-74085509(1312)
5509
3318-88746197(1247)
6197
1045-85293552(200)
3468
1403-124535230(204)
4835.
N
20
14
15
_
-
32
49
-4x 10
<o. 1-69691119(437)
817
7-5180149(36)120
24-17565(8)
65
_
-
11-2242
389(85)330
<o. 1-6969521(63)
384
Cd -4x 10
30-1509514(108)
514
<4-1031335(91)
335
<4-l82o513(136)
419
_
_
49-77921912(325)
1722
<4-l826462(28)
434
N
60
36
15
2
10
85
123
Br -3x 10
712-115934110(2530)
3863
1053-162456134(3606)
5844
3634-115495799(2169)
5389
4541-47424642(81)
4642
3866-157397599(3601)
6694
994-254768778(5252)
8379
712-162455261(3189)
4995
N
34
19
6
2
6
53
67
C° -3x 10
7-8528(22)
27
5-14933(34)
26
15-4732(13)
32
14-3223(9)
23
15-9345(29)
45
6-14133(26)
31
5- 14931(26)
31
20 -3x 10
1401-118045182(2358)
4975
1626-É4784371(1=31)
4371
4750-1046?7470(1958)
7470
6149-111438646(2t97)
864£
5453-153359423(2:36)
9423
2254-177227560(3:41)
7365
1401-231745932(3332)
566?
N «= number of sample analysed
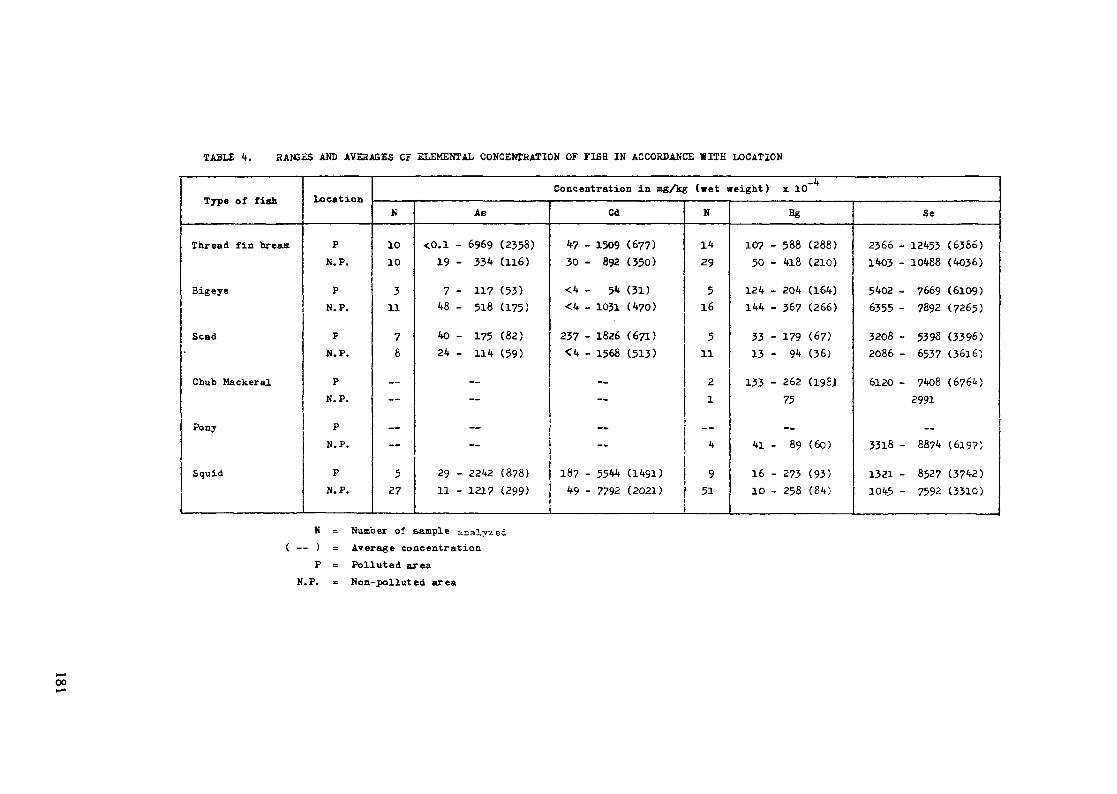
TABLE 4. HANSES AND AVERAGES CF ELEMENTAL CONCENTRATION Of FISH IN ACCORDANCE WITH LOCATION
Type of fish
Thread fin bream
Bigeye
Scad
Chub Mackeral
Pony
Squid
Location
PN. P.
P
N. P.
F
N. P.
PN. P.
P
N. P.
P
N. P.
_^Concentration in mg/kg (wet weight) x 10
N
10
10
311
78
——
——
527
Ae
<0.1 - 6969 (2358)19 - 334 (116)
7 - 117 (53)48 - 518 (175)
40 - 175 (82)24 - 114 (59)
«—
——
29 - 2242 (878)11 - 121? (299)
Cd
47 - 1509 (67?)30 - 892 (350)
<4 - 54 (31)<4 - 1031 (4?0)
237 - 1826 (671)<4 - 1568 (513)
——
~
187 - 5544 (1491)49 - 7792 (2021)
N
1429
516
511
2
1
—it
951
Hg
10? - 588 (288)50 - 4l8 (210)
124 - 204 (164)144 _ 367 (266)
33 - 179 (6?)13 - 94 (36)
133 - 262 (196J75
-.4l - 89 (60)
16 - 273 (93)10 - 258 (84)
Se
2366 - 12453 (6386)1403 - 10488 (4036)
5402 - 7669 (6109)6355 - 7892 (7265)
3208 - 5398 (3396)2086 - 6537 (3öl6)
6120 - 7408 (6764)2991
3318 - 8874 (6197)
1321 - 8527 (3742)1045 - 7592 (3310)
N = Number of sample analyzed( — ) = Average concentration
P = Polluted areaN.P. = Non-polluted area
00
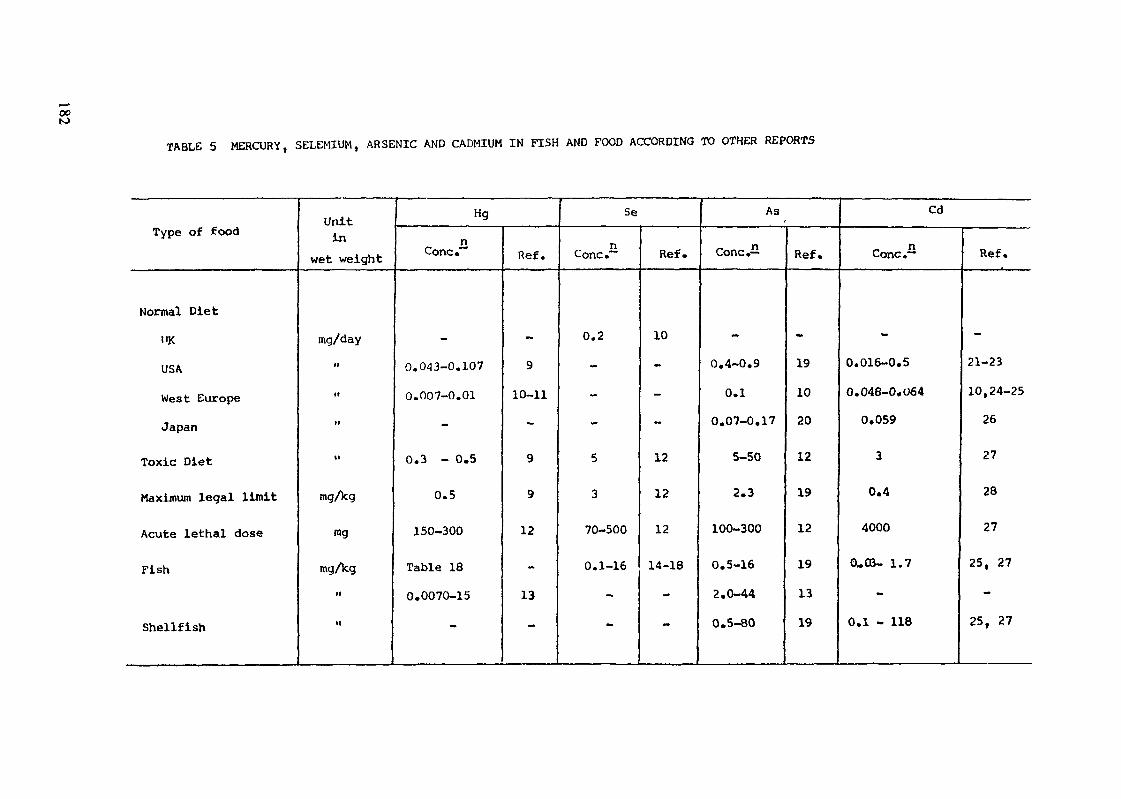
00N)
TABLE 5 MERCURY, SELEMIUM, ARSENIC AND CADMIUM IN FISH AND FOOD ACCORDING TO OTHER REPORTS
Type of food
Normal Diet"KUSA
West Europe
Japan
Toxic Diet
Maximum legal limit
Acute lethal dose
Fish
Shellfish
Unitin
wet weight
mg/dayuuM
M
mg/kg
mg
mg/kgKu
Hg
nConc."~
-0.043-0.107
0.007-0.01
-
0.3 - 0.5
0.5
150-300
Table 180.0070-15
-
Ref.
-9
10-11-
9
9
12
-
13-
Se
Conc.~
0.2---
S
3
70-500
0.1-16
-
—
Ref.
10
---
12
12
12
14-18•4
"*
As
Conc.£
-0.4-0.9
0.10.07-0.17
5-50
2.3
100-300
0.5-16
2.0-44
0.5-80
Ref.
-19
1020
12
19
12
19
13
19
Cd
Cone.—
-0.016-0.5
0.048-0.064
0.059
3
0.4
4000
0*03- 1.7
-0.1 - 118
Ref.
-21-23
10,24-25
26
27
28
27
25, 27
-25, 27
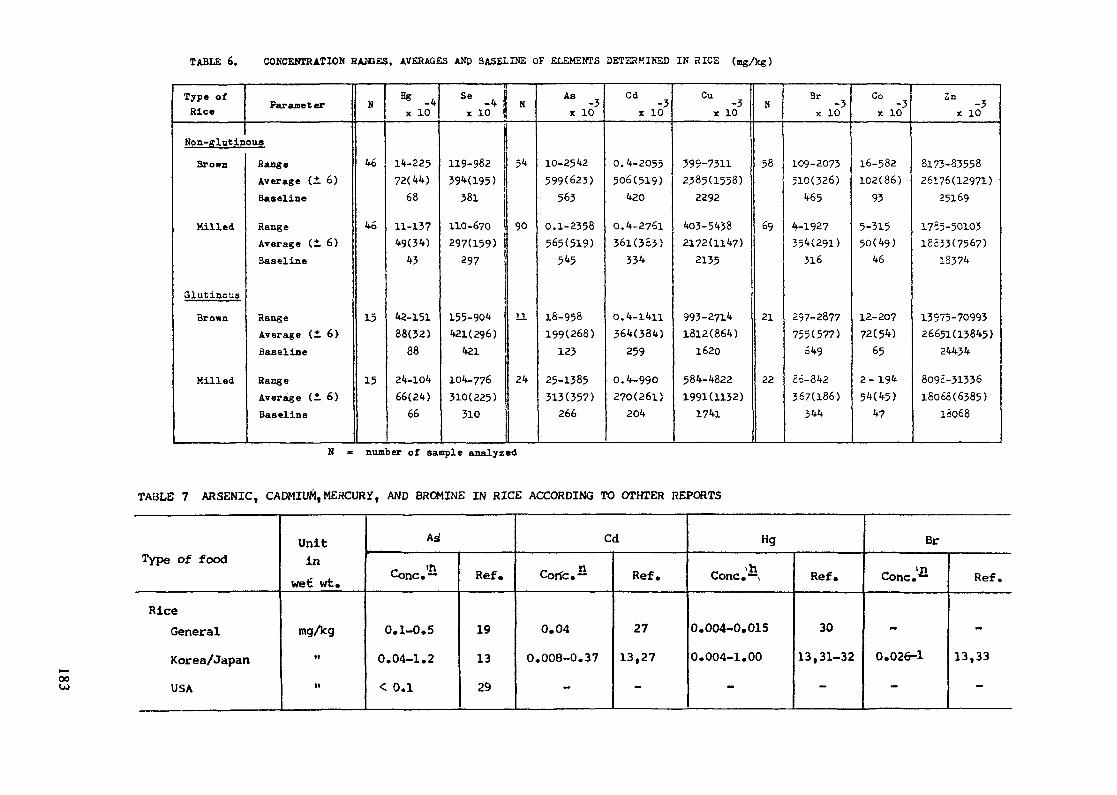
TABLE 6. CONCENTRATION HASHES, AVERAGES AND BASELINE OF ELEMENTS DETERMINED IN RICE (mg/kg)
Type ofRice
Non-Klutin
Brown
Milled
Glutinous
Brown
Milled
Parameter
ous
RangeAverage ( ± 6 )Baseline
RangeAverage (.— 6)Baseline
RangeAverage (1 6)Baseline
RangeAverage (± 6)Baseline
N
46
46
15
15
85 -4x 10
14-22572(44)
68
11-13749(34)
43
42-15188(32)
88
24-10466(24)
66
——————— _ ———Se , 8-4 1 Nx 10 J
119-982394(195)
381
110-670297(159)
297
155-904421(296)
421
104-776310(225)
310
54
90
11
24
A8 -3x 10
10-2542
599(623)563
0.1-2358565(519)
545
18-958199(268)
123
25-1385313(357)
266
Cd
x 10
0.4-2055506(519)
420
0.4-2761361(353)
33^
0.4-1411364(334)
259
0.4-990270(261)
204
CU -3x 10
399-73112385(1558)
2292
403-54382172(114?)
2135
993-27141812(864)
1620
584-48221991(1132)
1741
N
58
69
21
22
3r -3x 10
109-2073510(326)
465
4-1927354(291)
316
257-2877755(577)
549
êé-842367(186)
344
Cox 10
16-582102(86)
93
5-31550(49)
46
12-20772(54)
65
2- 19454(45)
i*7
ZD -3x 10
8173-8355826176(12971)
25169
1765-50103l££33(7567)
18374
13975-70993266=1(13845)
24434
809C-3133618060(6385)
1Î068
number of sample analyzed
TABLE 7 ARSENIC, CADMIUM,MEHCURY, AND BROMINE IN RICE ACCORDING TO OTHTER REPORTS
Type of food
RiceGeneralKorea/JapanUSA
Unitin
we€ wt.
mqAgIf
M
A4
r lnCone,—
0.1-0.50.04-1.2< 0.1
Ref.
19
1329
Cd
Corfc.-
0.040.008-0.37
-
Ref.
27
13,27
-
Hg
Cone.— *
0.004-0.0150.004-1.00
-
Ref.
3013,31-32
-
Br
Cone.'*
-0.026-1
-
Ref.
-
13,33—00
OJ
4. ACKNOWLEDGEMENTS
The authors are indebted to the IAEA for its partial support of thiswork through Research Contract No.2224/RB (1978-1981) and TechnicalAssistance Project No. THA/5/021. They are also grateful for their counter-parts from Marine Fisheries Division, Department of Fisheries and RiceDivision, Department ~of Agriculture, of Ministry of Agriculture and Co-operative of Thailand for providing fish and rice. They also wish to expresstheir special sincere appreciation to Mr.S.P.Kasemsanta, the former SecretaryGeneral of OA£P and currently ,a Project Co-ordinator, UNDP/IAEA RegionalIndustrial Project, Dr. S.B. M Baku, the former IAEA project Officer of thiscontract, Dri H.A. Das, the.Agency's expert under THA/5/021, for theirvaluable suggestions, comments and strongly support regarding this work.
REFERENCES
1. MONGKOLPHANTHA, S., KARASUDDHI, P., YAMKATE, P.,SERICHAREONSATIT, N., SATSANGUAN, F: The determination of traceelements in a standard Kale sample by neutron activationtechnique. Thai AEC-69, 1-14 (1973)
2. KONGKOLPHANTHA, S., KARASUDDHI, P., YAMKATE, P.,SERICHAREONSATIT, N: The determination of pesticide residuesin local vegetables by means of neutron activation technique.OAEP-81, 1-21 (1975)
3. MONGKOLPHANTHA, S., LEELHAPHUNT, N., YAMKATE, P.,NOUCHPRAMOOL,, S., RAJATAT1BODEE, V., KARASUDDHI, P.,POOKAMANA, P., KONGSEREE, Ngî A preliminary study of tracetoxic elements in various species of rice in Thailand by neutronactivation technique. OAEP-91, 1-39 (1979) (In Thai).
4. MONGKOLPHANTHA, S., YA.MKATE, P., RAJATATIBODEE, V.,KARASUDDHI, P., KANASVETA, D., WONGRATANA, T: The preliminarystudy of the concentration of mercury, bromine, cobalt and zinc insome common marine fish in polluted and non-polluted areas in theGulf of Thailand. OAEP-86, 1-23 (1978) (In Thai)
5. ROOK, H.L: Rapid quantitative separation for the determination ofselenium using neutron activation analysis. Anal. Chem. 44, _7,1276-1278 (1972)
6. KXDRRISON, G.H., POTTER, N.M: Multielement neutron activationanalysis of biological material using chemical groups separationand high resolution gamma spectrometry. Anal. Chem. 44, 4^839-842 (1972)
7. Report of FAD/WHO: Summary of some current permissible levels ofmercury in fish. FAD/F/7/180/2 (1972)
8. HOLDEN, A.V.: Present levels of mercury in man and hisenvironment» Tech. Report Series No.137, 143-165, IAEA, Vienna(1972)
9. D' ITRI, F.M: The environmental mercury problem. Chem. Rubber Co.(1972)
184

10. HAMILTON, E., MINSKIT K.J: Sei. Total. Envir. .1, 395(1973)
11. MINISTRY OF AGRICULTURE: Fisheries and Food, Survey of mercury infood, H.M.S.O (1971)
12. BOWEN, H.J.M: Trace element in Biochemistry Acad.Press (1966)
13. LEE, R., KIM, Y.3., KIM, N.B: Determination of pesticideresidues and contaminants in rish and rice in Korea. Privatecommunication (1973)
14. MORRIS, V.C., LEVANDER, O.A: J.Nutrit„100, 1383 (1970)
15. OELSCHLAGER, W., MENKE, K.H: ERNAHRUNGSWISS ZEIT 2» 208, 216(1969)
16. SCHROEDER, H.A., FROST, D.V., 3ALASSA, J.J: Essential tracemetals in man : Selenium. J.Chron. Dis. 23, 227-243 (1970)
17. LUNDE, G: J.Sci. Food. Agric. 21, 242 (1978)
18. SANDHOLM, M., OKSANEN, H.E., PERSONEN, L: Limnol Oceanog.18,496 (1978)
19. SCHROEDER, H.A., BALASSA, J.J.: Abnormal trace metals in man:Arsenic. J. ChronJ3is.l9, 85-106 (1966)
20. NAKAO, M.: Osaka Shiritsu Daigaku, 9., 541 (1960)21. HAHN, H.K.J., SULLIVAN, J.L., 3LOTCKY, A.J., ARSENAULT, L.J.,
MAY, A.D: Radiochemical separation and determination of cadniumfrom biological materials by solvent extraction. RadiochemicalActa, Band 13,-Helf: 55-56 (1970)
22. DAS, H.A.: /The determination of bromine in wheat flour and breadby neutron activation analysis. £CN-106t 1-11, (1969)
23. FRIBERG, L., PISCATOR, M., NORDBERG, G: Cadmium in theenvironment. Chem. Rubber Co.(1971)
24. LINNMANN, L, et.al: Arch. Envir. Health _27, 45 (1973)25. MINISTRY OF AGRICULTURE: Fisheries and food, Survey of cadmium
in food, 1-31, H.M.S.O (1973)
26. YAMAGATA, N., SHIGEMATSU, I: Bull. Inct. Publ. Health. 9., 1(1970)
27. SCHROEDER, H.A., MASON, A.D., TIPTON, J.H., BALASSA, J.J:Essential trace metals in man: Zinc relation to environmentalcadmium. J. Chron. Dis. 20, 179-210 (1967)
28. W.H.O.: Tech. Report 505 (1972)29. WILLIAM, A., ROYSTOî;,F., LOUIS, A., JOHN, A: The
instrumental determination of fifteen elements in plant tissue byneutron activation analysis, 177-183 (1969) In De Voe, J.R (ed.)Modern Trend in Activation Analysis vol. r, N3S, Dept. of Commerce,Wash .D.C.
185
30. SMART, N.A., HILL, A.R.C: Pesticide residues in food stuffs inGreat 3ritain-merdury residue in rice. J.Sci. Food Agric.l9_, 315(1968)
31. KIM, M.K., WOO, K.D., HAN, SS., LEE, S.H., Do, U.H: NongsaSihom Yougu Pogo, 12, 55 (1969)
32. GOTO, T., SATO, A.J: Japan Soc. Food Nutrit. 49, 793 (1966)33. KUSAKA, Y.t ŒEN, P.Y., TSUJI, H., IMAI, Si Radioisotopes
(Tokyo), 16, 526 (1967).
186

TRACE ELEMENTS IN ANIMALS AND FOODSTUFFS
S. OHNONational Institute of Radiological Sciences,Chiba-shi
M. YAMADA, H. TSUKAGOSHI, S. HATAKEYAMATokyo Médical and Dental University,TokyoJapan
AbstractIn order to obtain information on pollution levels in the environment,
some trace elements in biological materials were determined by neutronactivation analysis, flameless atomic absorption spectrometry andinductively-coupled plasma atomic emission spectrometry.
For estimating the radiation dose to the thyroid in man, and in orderto study the relationship between radioiodine and stable iodine,measurements were made of iodine in cow's milk from Japan by neutronactivation analysis (NAA).
In this paper, data for iodine in cow's milk, as well as some othertrace elements such as aluminium, cobalt, copper, iron, manganese, zinc andmercury are presented.
1. INTRODUCTION
Trace substances, including harmful ones such as mercury, lead,arsenic and organo-halogens, are continuously taken up by the human bodythrough foodstuffs, drinks and ambient air. It is important to be aware ofthe levels of trace and toxicological elements in animals and foodstuffsbecause, from such data, one can predict the levels of these pollutants inman and his environment. Therefore, much data concerned with pollutants inmany environmental and biological samples have, up to the present, beenreported by many investigators in the field of environmental research.
The present authors also feel that it is of paramount importance toinvestigate the relationship between radioactive and non-radioactiveelements in foodstuffs and environmental and biological samples. In thisconnection, iodine, bromine and chlorine in cow's milk from Japan weresimultaneously determined by radiochemical NAA.
Several other trace and toxicological elements were determined inanimals and human bones and dairy products by flameless atomic absorptionspectrometry (AAS) and inductively-coupled plasma atomic emissionspectrometry (ICP-AES).
In addition, in order to find out whether there are any correlationsbetween trace elements in human organs and hair, an analysis of some traceelements in human liver, brain and hair was carried out by means offlameless AAS and ICP-AES.
187

In this report, the analytical results for trace elements aresummarized. Simultaneously, the necessity of checking the analyticalperformance of each laboratory is more and more widely recognized; thereforea large volume of powdered reference hair was prepared and was checked forhomogeneity by the three analytical methods mentioned above.2. EXPERIMENTAL
2.1. Determination of iodine, bromine and chlorine in cow's milk2.1.1. Collection of cow's milk samples: samples were collected from
commercial stores near Chiba, eastern area of Japan and Hokkaido.2.1.2. Irradiation: irradiation was carried out with a Van de Graaff
accelerator for one hour, as already reported in réf. 1.2.1.3. Radiochemical procedure: radiochemical separation for the
determination of iodine, bromine and chlorine was carried out as reported inréf. 1. The separation of 80Br, 82Br and 38C1 from the irradiatedsamples was mainly performed by an anion exchange method.
2.1.4. Activity measurement: the radiochemical purity of the separatedf 80Br> 82Br an(j 38ci was checked by gamma-ray spectrometry and
by following the decay curves by beta counting with a GM counter.2.1.5. Results and discussion: the amounts of iodine, bromine and
chlorine in cow's milk samples were simultaneously determined by RNAA andthe results are given in Table 1. The accuracy of the procedure was checkedby the standard additions method. For example, it can be seen that theaverage precision is about + 5% for an iodine concentration of 0.045 ppm andthe limits of detection for iodine with the proposed method by gamma-rayspectrometry and beta-counting are 10 and 15 U8» respectively.
It seems that the proposed method is simple and rapid for thedetermination of halogens in a large volume of liquid sample. By thismethod, the determination of sub-micro amounts of halogens in the samplescan easily be achieved without any other chemical procedure.
From the data in Table 1, it can be seen that the seasonalvariation in the amounts of iodine in cow's milk from Japan is correlatedwith that of bromine and, at the same time, that of chlorine tends toincrease from month to month. The biological half-life of iodine can beestimated from the equation.
Y = 110.5 - 13.2 X
where Y = amount of iodine in milk (ug/L) and X = month. The baselinelevel of iodine in cow's milk can also be determined as about 60 ppm.
2.2. Determination of trace elements in Japanese dairy products and in bovineand human bone
2.2.1. Analytical technique: instrumental neutron activation analysis(INAA).
2.2.2. Sample collection: samples were collected from several areas ofJapan as shown in Table II.
188

Table I. Iodine, bromine and chlorine content in cow's milk (in ppm)
LocationIwateit
11"nit11i1
'
NaganoShimooateShizuokaSayamaChoshiKushiroAsahikawaObihiroNaganoShimodateShizLOOSayamaChoshiKushiroAsahikawaObihiroKyotoKanagaiaKobeNaganohaganoShimodateShimodateShizuokaShizuokaSayamaSayamaChoshi.ChoshiKushiroKushiroAsahikasaAsahikawaObihiroObihiroNaganoShimodateShizuokaSayamaChoshikushiroAsahikawaObihiro
MonthJan.Feb.Mar.Apr.MayJim.Jul.Aug.Sept.Oct.Nov.Dec.Jan.ii
1fit*
Apr.tiunn11itn
Jun.11"
Oct.1111
11
"11IItf1111II1111II11If
Nov.11ii1i'i
Iodine0.1170.1260.1460.0890.0890.0780.0580.0690.0740.0490.0470.0880.1180.1000.1170.1280.0690.1070.1360.0930.0880.1140.0930.0930.1090.0540.0410.0560.1750.1600.3160.1130.0990.0800.0750.0720.0580.0930.1030.1170.0870.0700.0680.0660.0740.0700.0990.1000.0880.0940.1280.1190.0840.0780.089
Bromine20.725.627.810.18.99.110.16.39.524.121.816.48.719.118.709.109.1014.4015.0014.807.8411.805.6014.8011.8021.6013.3017.605.7496.4585.6677.978.3116.8016.909.098.6618.5016.1010.909.7218.8019.9017.6020.6020.7017.609.9615.1010.5017.7013.8011.4015.9027.60
Chlorine256.1254.6287.0190.8348.4384.2224.0359.8266.7629.4627.2662.7281.6298.3298.3487.0356.1286.9346.2296.1255.8119.1259.7301.6315.2410.4297.2317.4139.1155.3137.1298.5266.8273.0308.6312.4285.8321.2317.8524.0321.7357.1299.3820.8527.4319.5623.2300.7299.1288.1310.7341.6411.2366.8311.9
189
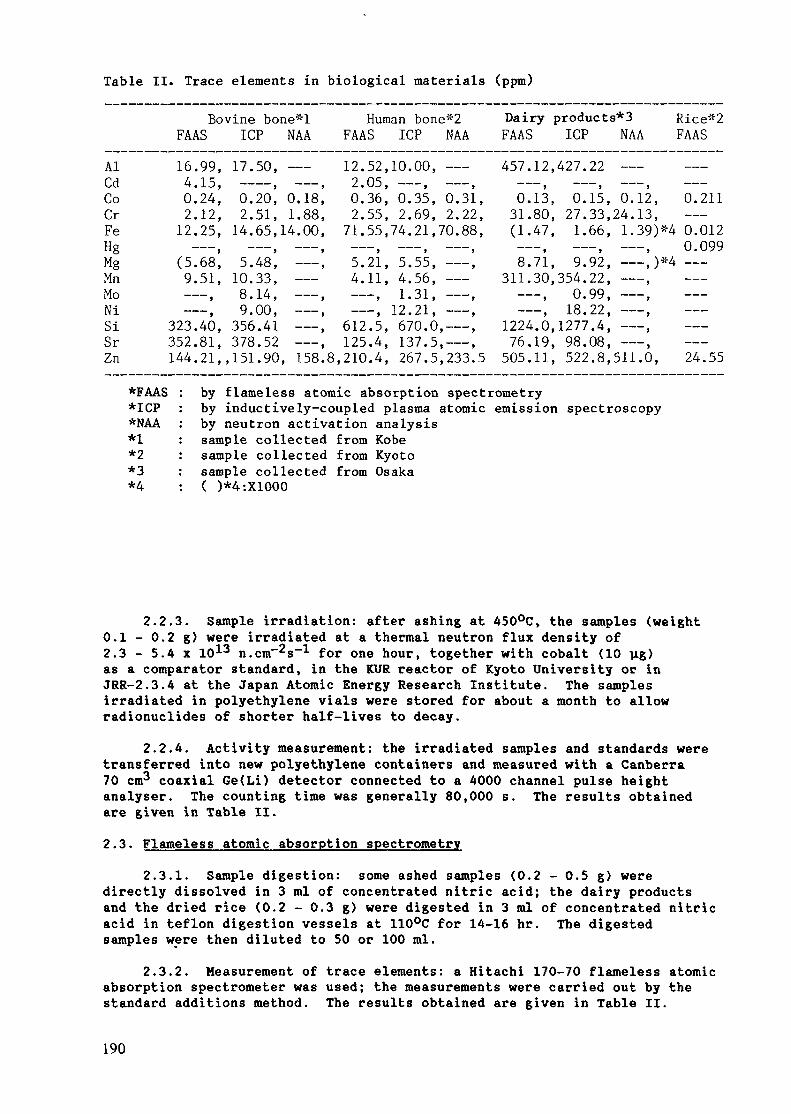
Table II. Trace elements in biological materials (ppm)
Bovine bone*lFAAS ICP NAA
Human bone*2FAAS ICP NAA
Dairy products*3 Rice*2FAAS ICP NAA FAAS
AlCdCoCrFeHgMgMnMoNiSiSrZn
16.99, 17.50, ——4.15, ——, ——,0.24, 0.20, 0.18,2.12, 2.51, 1.88,12.25, 14.65,14.00,
12.52,10.00, ——9 OS __ ——e. .U-J , , ,0.36, 0.35, 0.31,2.55, 2.69, 2.22,71.55,74.21,70.88,
457.12,427.22 ——0.211
(5.68, 5.48,9.51, 10.33,——, 8.14,
9.00,323.40, 356.41352.81, 378.52
5.21, 5.55, ——,4.11, 4.56, ——
-, ——, 1.31, ——,-, ——, 12.21, ——,-, 612.5, 670.0,——,-, 125.4, 137.5,——,
144.21,,151.90, 158.8,210.4, 267.5,233.5
0.13, 0.15, 0.12,31.80, 27.33,24.13,(1.47, 1.66, 1.39)*4 0.012
——, ——, 0.0998.71, 9.92, ——,)*4 ——
311.30,354.22, ——,——, 0.99, ——,——, 18.22, ——,
1224.0,1277.4, ——,76.19, 98.08, ——,505.11, 522.8,511.0, 24.55
*FAAS*ICP*NAA*1*2*3*4
by flameless atomic absorption spectrometryby inductively-coupled plasma atomic emission spectroscopyby neutron activation analysissample collected from Kobesample collected from Kyotosample collected from Osaka( )*4:X1000
2.2.3. Sample irradiation: after ashing at 450°C, the samples (weight0.1 - 0.2 g) were irradiated at a thermal neutron flux density of2.3 - 5.4 x 10¹³ n.cnT s"1 for one hour, together with cobalt (10 ng)as a comparator standard, in the KUR reactor of Kyoto University or inJRR-2.3.4 at the Japan Atomic Energy Research Institute. The samplesirradiated in polyethylene vials were stored for about a month to allowradionuclides of shorter half-lives to decay.
2.2.4. Activity measurement: the irradiated samples and standards weretransferred into new polyethylene containers and measured with a Canberra70 cm3 coaxial Ge(Li) detector connected to a 4000 channel pulse heightanalyser. The counting time was generally 80,000 s. The results obtainedare given in Table II.2.3. Flameless atomic absorption spectrometry
2.3.1. Sample digestion: some ashed samples (0.2 - 0.5 g} weredirectly dissolved in 3 ml of concentrated nitric acid; the dairy productsand the dried rice (0.2 - 0.3 g) were digested in 3 ml of concentrated nitricacid in teflon digestion vessels at 110°C for 14-16 hr. The digestedsamples were then diluted to 50 or 100 ml.
2.3.2. Measurement of trace elements: a Hitachi 170-70 flameless atomicabsorption spectrometer was used; the measurements were carried out by thestandard additions method. The results obtained are given in Table II.
190
2.4. Inductively-coupled plasma atomic emission spectroscopy2.4.1. Instrumentation: a Hitachi super scan 306 (electroatomizer,
power supply/controller etc.) was used.2.4.2. Elements determined: the elements for which the original
multielement cassette was aligned, and the current list of elements andwavelength are: Al (309.27 nm), Co (228.80 mo), Cr (205.55 nm), Cu (324.75run), Fe (238.20 nm), Mg (279.55 nm), Mn (257.61 nm), Si (251.61 nm), Sr(407.77 nm) and Zn (213.85 nm). High purity stock solutions of standardswere prepared in the laboratory. The determinations were made by thestandard additions method. The details will be published elsewhere. Theresults obtained are given in Table II.
2.5. Preparation of reference powdered hair2.5.1. Sample collection: scalp hair samples (about 3 cm from the end
of scalp hair) were collected from about 400 healthy Japanese students withsimilar dietary habits.
2.5.2. Preparation method for powdered hair samples: powdered hairsamples were made by two methods. After washing by the IAEA's recommendedmethod [2], (1) an agate ball mill (250 ml volume) with electricallycontrolled rotating speed and time was used to prepare large volume samples,and (2) a self-made machine constructed from an old fashioned loud-speaker,as vibrator, combined with a teflon container (100 ml) and a teflon coatedsteel ball was used to prepare small volume samples (less than 100 mg).
2.5.3. Homogeneity test for the prepared powdered hair samples:homogeneity testing was carried out by NAA, flameless AAS and ICP-AES forCo, Zn, Hg, Fe, Pb, Cd etc. The results obtained are given in Table III. Atest for statistical outliers was applied using the Dixon method.
2.6. Trace elements in human tissues2.6.1. Sample collection: samples were obtained from subjects with
diseases such as stomach and liver cancer.2.6.2. Elements determined: elements such as Cu, Mn, Al, Zn, etc. were
determined by AAS and ICP-AES. The results obtained are given in Table IV.
191
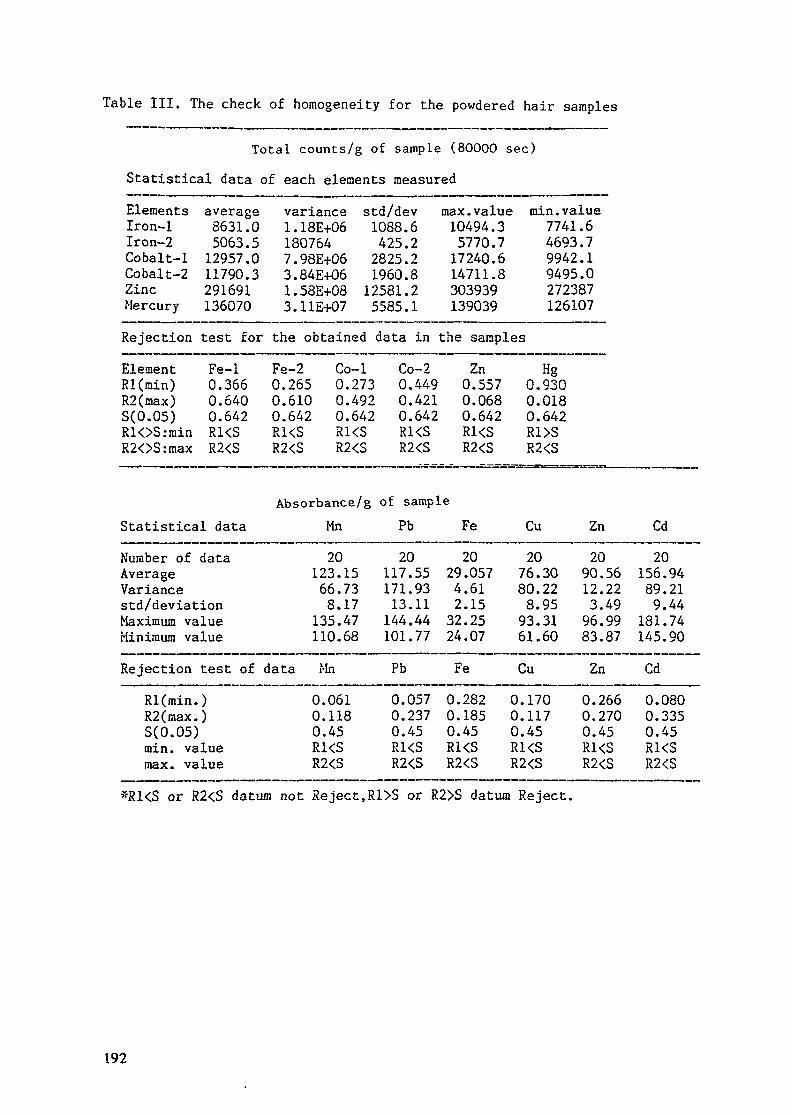
Table III. The check of homogeneity for the powdered hair samples
Total counts/g of sample (80000 sec)Statistical data of each elements measuredElementsIron-1Iron-2Cobalt-1Cobalt-2ZincMercury
average8631.05063.512957.011790.3291691136070
variance1 . 18E+061807647.98E+063.84E+061.58E+083.11E+07
std/dev1088.6425.22825.21960.812581.25585.1
max. value10494.35770.717240.614711.8303939139039
min. value7741.64693.79942.19495.0272387126107
Rejection test for the obtained data in the samplesElementRl(min)R2(max)S(0.05)RIOSiminR2OS:max
Fe-10.3660.6400.642RKSR2<S
Fe-20.2650.6100.642RKSR2<S
Co-10.2730.4920.642RKSR2<S
Co-20.4490.4210.642RKSR2<S
Zn0.5570.0680.642RKSR2<S
Hg0.9300.0180.642R1>SR2<S
Statistical dataNumber of dataAverageVariancestd/deviationMaximum valueMinimum valueRejection test of data Mn
Absorbance/g of sampleMn Pb Fe Cu Zn Cd
.a 20123.1566.73
L 8.17! 135.47• 110.68
20117.55171.9313.11144.44101.77
2029.0574.612.1532.2524.07
2076.3080.228.9593.3161.60
2090.5612.223.4996.9983.87
20156.9489.219.44
181.74145.90
Rl(min.)R2(max.)3(0.05)min. valuemax. value
0.0610.1180.45RKSR2<S
Fe0.2820.1850.45RKSR2<S
Cu0.1700.1170.45RKSR2<S
Zn Cd0.2660.2700.45RKSR2<S
0.0800.3350.45RKSR2<S
*RKS or R2<S datum not Reject,R1>S or R2>S datum Reject.
192

Table IV. Some elements in brain tissues
Copper content in brain tissues
Sample SA-569 KA-455 RK-565 KA-445 KA-444 SA-5949"o. ug/gran sample26 3.321 3.655578492774325.954367i09
No. of dataAverageVariancestd/devMax. valueKin. value
203.0062.5091.5845.9040.3459
202.5671.6031.2665.3510.345
211.4740.9980.9993,4520.3458
213.6582.0281.4247.2941.717
212.0030.6550.8094.0490.819
214.1145.7042.38813.7192.111
Aluminum concentration in brain tissues (ppn)Sample Ko. SA-569 KA-455 RN-565 KA-445 KA-444 SA-5949
2627
No. of dataaveragevariancestd/dev.max. valuemin. value
1.24011.031
211.5100.0380.1942.0041.318
1.5631.620
211.0432E-030.0471.2070.980
fSl — 3.—-SÄ.— — VS
1.270——
211.0838E-030.0901.3030.935
.•SnWMMMMM
1.0174.195
211.4470.6290.7934.5930.981
1.2363.553
211.6930.2180.4672.5240.324
1.3122.961
211.6150.2660.5163.1751.096
uer^jcAjiMi
Manganese concentration in brain tissues (ppra)sample Ko. SA-569 KA-455 RN-565 KA-444 KA-445 SA-5949
2627
No. of dataaveragevariancestd.devmax. valueain. value
3.04181.3282211.29700.80360.89643.74110.4755
4.45904.4264210.57310.13790.43351.72820. 1264
1.4924
200.56220.03340.18301.00600.3269
3.42260.6748210.47S10.06480.25461.31580.1869
3.9959 1.1360.1377 8.84921 210.6126 0.54470.1149 0.05940.3391 0.24381.4327 1.14300.2357 0.2470
Iron concentration in brain tissue (ppm)Sample No. SA-569 KA-455 RN-565 KA-445 KA-444 SA-5949
2627
No. of dataaveragevariancestd/devmax. valuemin. value
246.564193.63221
206.55813341.3115.504544.86890.835
47.7861389.6402188.7303258.7257.085212.99618.811
132.175230.89320132.48710056.7100.283499.78633.423
143.80482.7932197.1107301.4985.448387.8079.039
57.321213.9292199.8656858.0582.813338.11420.039
40.672321.2762158.0391183.1834.397175.76622.511
Zinc concentration in brain tissue (ppm)Sample No. SA-569 KA-455 RK-565 KA-445 KA-444 SA-5949
2627
Ko. of dataAverageVarianceStd/dev.Max. valueMin. value•26:liver»27:hair
11.3.
i 2110.28.5.24.4.
saraplsample
185962
444204311404012e
13.17.2110.23.4.21.4.
347101
309305828525422
8
211305213
.754
0.385.936.562.102.016
12.59.219.29.5.21.3.
123639
742211405347494
6.13.218.10.3.13.2.
996447
117638262433694
3.681501.1002110.50914.9843.87124.0095.125
193
3. DISCUSSION
This work has shown that, despite such analytical problems as matrixeffects, interferences, etc., flameless AAS and ICP-AES, like NAA, areextremely suitable tools for the precise and rapid determination of traceelements in biological materials. New information on the occurrence oftrace elements in biological materials can be obtained by these analyticalmethods.
Baseline data on trace elements, as exemplified by the data in TablesII and III, is essential for environmental pollution studies in Japan. FromTable III it can be concluded that the powdered hair samples described inthis report are suitable for analytical quality control, and also that humanhair may be used to test for diseases such as Minamata or Wilson's diseasein human health-related environmental research.
From the data reported in section 2.6 it appears that trace elementsare not homogeneously distributed within a single organ. The trace elementsconcentrations in single samples were normalized to the respective meanconcentration value for the whole organ. One brain sample of 0.25 - 2 g wetweight is not representative of the mean value of the whole organ. Fromthese data, the relationships between trace element concentrations inindividual organs and disease cannot yet be explained.
ACKNOWLEDGEMENTS
The authors thank Mr. S. Shibata of the National Institute ofRadiological Sciences and Mr. K. Sasajima of the Research Reactor Instituteof Kyoto University for their assistance in the experimental work, and Mr.S. Ikeda of the Scientific Instrument Centre of the Nissei Sangyo Co. Ltd.for providing the Hitachi Inductively Coupled Plasma Emission Spectrometerused in this investigation.
REFERENCES
Ohno, S., Analyst 105 (1980) 246International Atomic Energy Agency, Report of the Advisory Group on theApplications of Nuclear Methods in Environmental Research, InternalDocument, IAEA/AG-53, Vienna 1976
194

MEASUREMENT OF TRACE ELEMENTS IN HUMAN HEAD HAIR,TOBACCO, COAL AND FOOD ARTICLES OF PAKISTAN
I.H. QURESHI, M.S. CHAUDHRY, S. AHMAD, A. MANNANNuclear Chemistry Division,Pakistan Institute of Nuclear Science and Technology,Rawalpindi, Pakistan
Abstract
Increasing contamination of biosphere with toxic elementsmay affect human health as these elements can enter human bodythrough food chain. Therefore the levels of these elementsshould be monitored in the atmosphere, food articles, bodytissues and fluids. In Pakistan studies were carried out onthe measurement of certain toxic and other elements in humanhead hair, cigarette tobacco, tea leave, coal and food articlesto establish base line levels.
1. INTRODUCTION
Ever increasing release of foreign chemicals into the en-vironment from various activities of man is polluting the bio-sphere with toxic elements. These pollutants find their wayto human body through food chain, water and atmosphere and mayaccumulate in the vital organs. The exposure of human body toabnormal concentrations of toxic elements may adversly affecthuman health as these can interfere in the normal biochemicalfunctions. Therefore it is important to monitor the levels oftoxic elements in human tissues and body fluids as well as infood articles and other environmental samples of interest.Such studies will help in establishing the base line levels oftoxic elements in various body organs and food articles.
In view of the effect of environmental pollution on humanhelath, IAEA in 1978 initiated an RCA project on "Health relatedenvironmental research using nuclear techniques", Pakistan,alongwith other countries of the region, is participating inthis project under a Research Agreement No.2370/CF. During thelast four years we have pursued studies on the measurement ofcertain essential and toxic trace elements in human head hair,cigaratte tobacco, tea leaves, coal, and certain vegetables.
2. EXPERIMENTAL PROCEDURE
Instrumental Neutron activation analysis technique wasemployed for the analysis of these materials. Optimum condi-tions for obtaining interference free photopeaks of the desiredelements were determined by variation of irradiation and cool-ing times followed by high resolution gamma-ray spectrometry ofthe irradiated sample. The elements were usually divided intothree groups. The first group containing Na, K a-nd Mn was
195
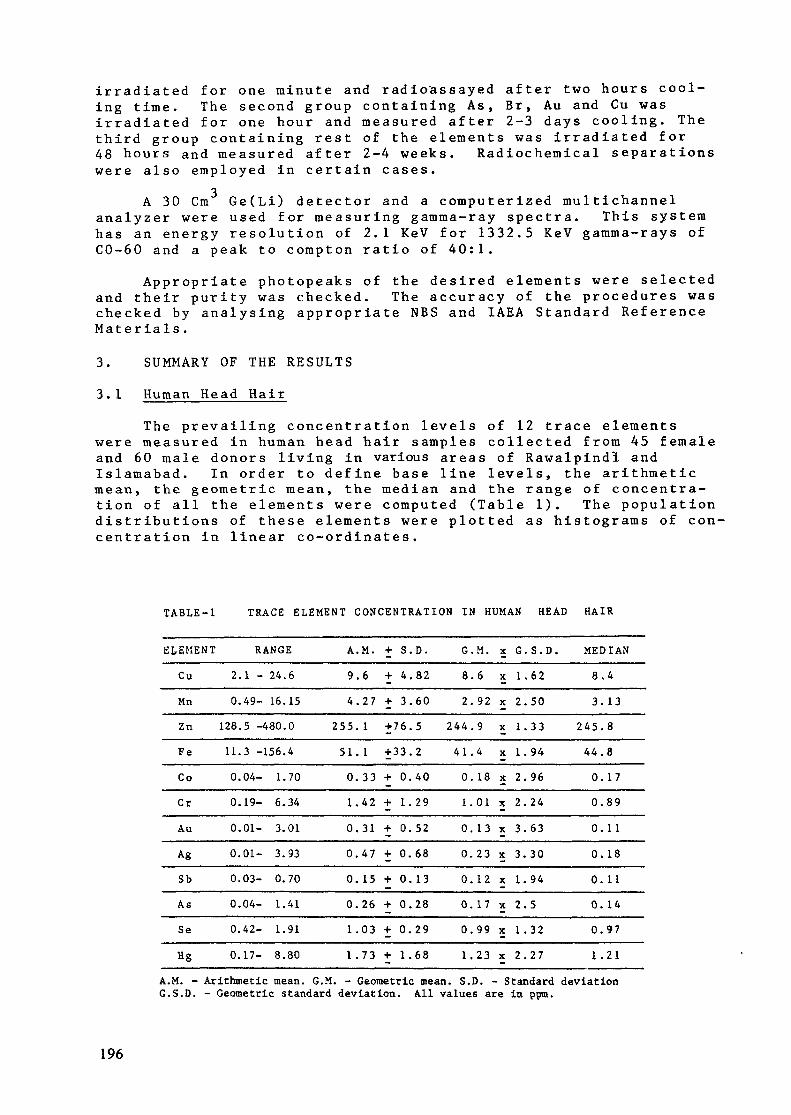
irradiated for one minute and radioassayed after two hours cool-ing time. The second group containing As, Br, Au and Cu wasirradiated for one hour and measured after 2-3 days cooling. Thethird group containing rest of the elements was irradiated for48 hours and measured after 2-4 weeks. Radiochemical separationswere also employed in certain cases.
3A 30 Cm Ge(Li) detector and a computerized multichannelanalyzer were used for measuring gamma-ray spectra. This systemhas an energy resolution of 2.1 KeV for 1332.5 KeV gamma-rays ofCO-60 and a peak to compton ratio of 40:1.
Appropriate photopeaks of the desired elements were selectedand their purity was checked. The accuracy of the procedures waschecked by analysing appropriate NBS and IAEA Standard ReferenceMaterials.
3. SUMMARY OF THE RESULTS
3.1 Human Head HairThe prevailing concentration levels of 12 trace elements
were measured in human head hair samples collected from 45 femaleand 60 male donors living in various areas of Rawalpindi andIslamabad. In order to define base line levels, the arithmeticmean, the geometric mean, the median and the range of concentra-tion of all the elements were computed (Table 1). The populationdistributions of these elements were plotted as histograms of con-centration in linear co-ordinates.
TABLE-1 TRACE E L E M E N T C O N C E N T R A T I O N IN HUMAN HEAD HAIR
E L E M E N T
Cu
Mn
Zn
Fe
Co
Cr
Au
Ag
Sb
As
Se
Hg
2.
0.
128.
11.
0.
0.
0.
0.
0.
0.
0.
0.
RANGE
1 - 24.
49- 16.
5 -480.
3 -156.
04- 1.
19- 6.
01- 3.
01- 3.
03- 0.
04- 1.
42- 1.
17- 8.
6
15
0
4
70
34
01
93
70
41
91
80
A.
9.
4.
255.
51.
0.
1.
0.
0.
0.
0.
1.1.
M. + S
6 + 4
27 + 3
1 +76
1 +33
33 + 0
42 + 1
31 + 0
47 + 0
1 5 + 0
26 + 0
03 + 0
73 + 1
. D .
.82
.60
.5
.2
.40
. 2 9
.52
.68
. 13
.28
.29
.68
G.
8.
2.
2 4 4 .
41.
0.
1.
0.
0.
0.
0.
0.
1.
M.
6
92
9
4
18
01
13
23
12
17
99
23
x G.
x 1.
x 2.
x 1.
x 1.
x 2.
x 2.
x 3.
x 3.
x 1.
x 2.
x 1.
x 2.
S . D .
62
50
33
94
96
24
63
30
94
5
32
27
M E D I A N
8.
3.
245 .
44.
0.
0.
0.
0.
0.
0.
0.
1.
4
13
8
8
17
89
1 1
18
11
14
97
21
A.M. - Arithmetic mean. G.M. - Geometric mean. S.D. - Standard deviationG.S.D. - Geometrie standard deviation. All values are in ppra.
196
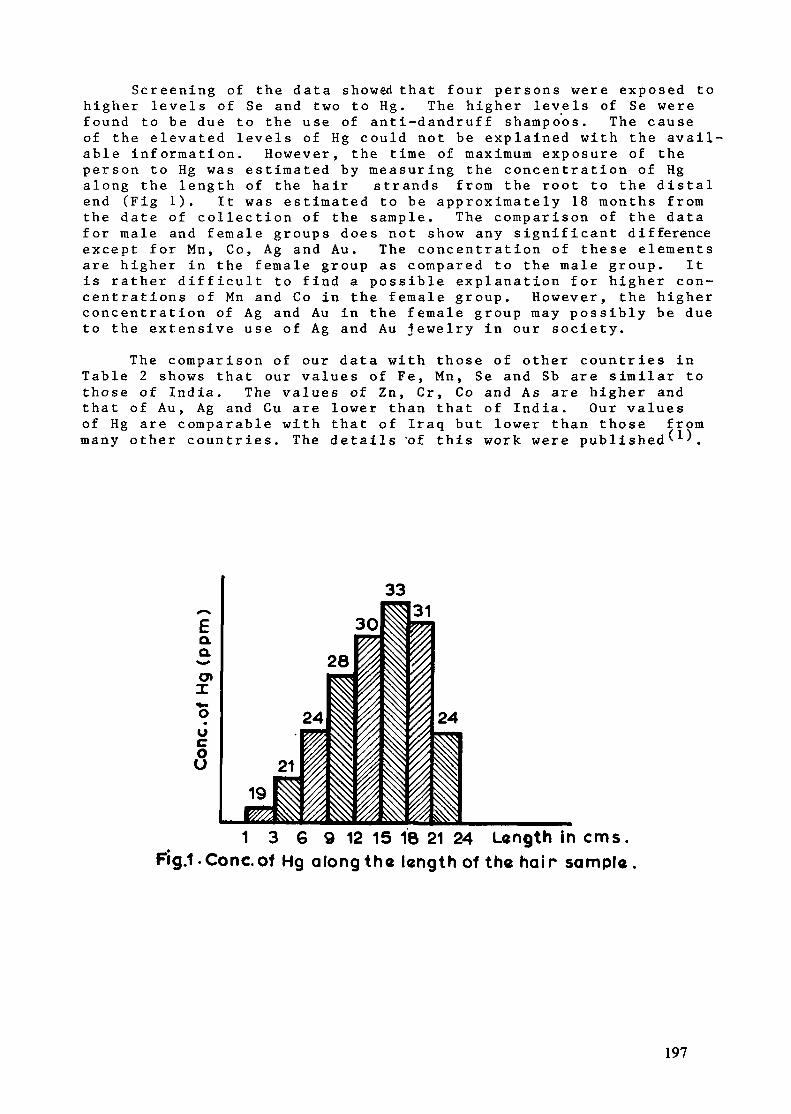
Screening of the data showed that four persons were exposed tohigher levels of Se and two to Hg. The higher levels of Se werefound to be due to the use of anti-dandruff shampoos. The causeof the elevated levels of Hg could not be explained with the avail-able information. However, the time of maximum exposure of theperson to Hg was estimated by measuring the concentration of Hgalong the length of the hair ßtrands from the root to the distalend (Fig 1). It was estimated to be approximately 18 months fromthe date of collection of the sample. The comparison of the datafor male and female groups does not show any significant differenceexcept for Mn, Co, Ag and Au. The concentration of these elementsare higher in the female group as compared to the male group. Itis rather difficult to find a possible explanation for higher con-centrations of Mn and Co in the female group. However, the higherconcentration of Ag and Au in the female group may possibly be dueto the extensive use of Ag and Au jewelry in our society.
The comparison of our data with those of other countries inTable 2 shows that our values of Fe, Mn, Se and Sb are similar tothose of India. The values of Zn, Cr, Co and As are higher andthat of Au, Ag and Cu are lower than that of India. Our valuesof Hg are comparable with that of Iraq but lower than those frommany other countries. The details "of this work were published' '.
1 3 6 9 12 15 18 21 24 Length in cms.Fig.LConc.of Hg along the length of the hair sample .
197
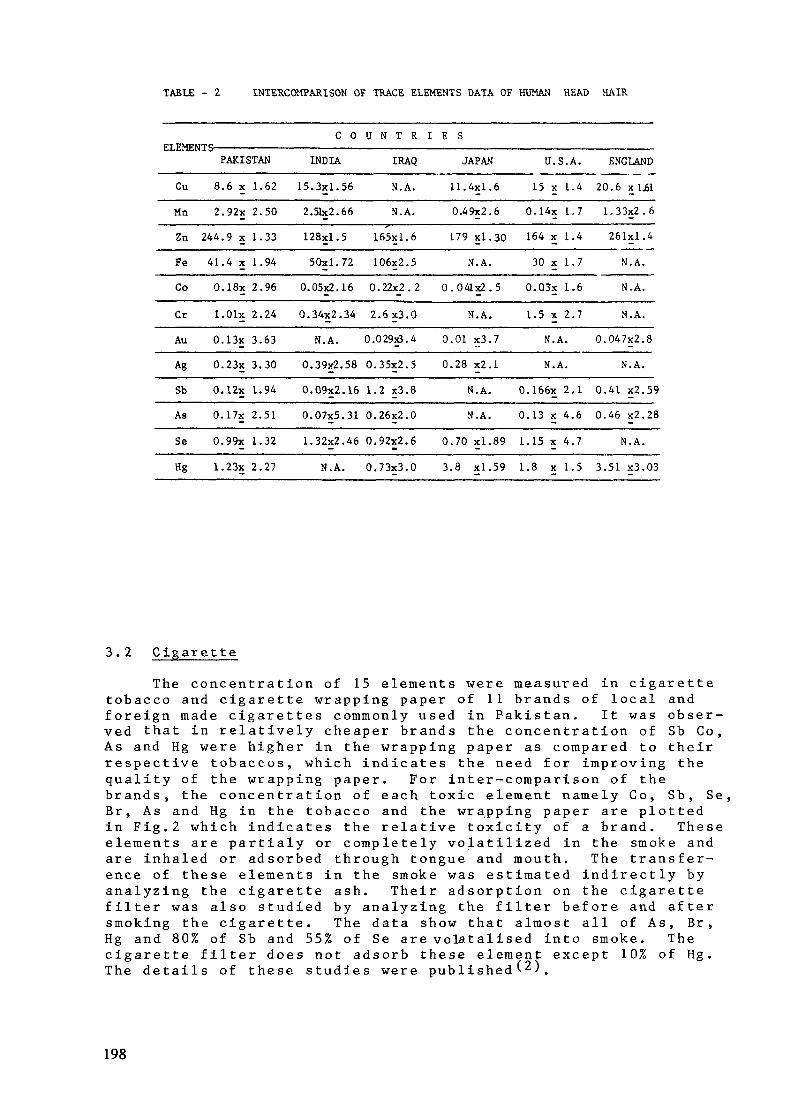
TABLE - 2 INTERCOMPARISON OF TRACE ELEMENTS DATA OF HUMAN HEAD HAIR
ELEME
Cu
Mn
Zn
Fe
Co
Cr
Au
Ag
Sb
As
Se
Hg
NTS— - - -PAKISTAN
8.
2.
244.
41.
0.
1.
0.
0.
0.
0.
0.
1.
6 x
92x
9 x
4 x
I8x
Olx
13x
23x
12x
17x
99x
23x
1.62
2.50
1.33
1.94
2.96
2.24
3.63
3.30
1.94
2.51
1.32
2.27
C
INDIA
15.3x1.
2.51x2.
128x1.
50x1.
0.05x2.
0.34x2.
H.A.
0.39x2
0.09x2
0.07x5
1.32x2
N.A
0 U N T R 1
IRAQ
56
66
5
72
16
,34
.58
.16
.31
.46
•
N.A.
N.A.
165x1
106x2
0.22x_2
2.6x3
0.029x3
0.35x2
1.2 x3
0.26x2
0,92x2
0.73x3
.6
.5
.2
.0
.4
.5
.8
.0
.6
.0
: E sJAPAN
11.4x1.6
0.49x2.6
179 xl.30
N.A.
0.041x2.5
S.A.
0.01 x3.7
0.28 x2.1
N.A.
N.A.
0.70 xl.89
3.8 xl.59
U.S
15 x
0.14x
164 x
30 x
O.Q3x
1.5 x
N . A
.A.
1.4
1.7
1.4
1.7
1.6
2.7
••
N.A.
0.166x
0.13 x
1.15 x
1.8 x
2.1
4.6
4.7
1.5
ENGLAND
20.6 x 1,61
1.33x2. 6
261x1.4
N.A.
N.A.
S.A.
0.047x2.8
N.A.
0.41 x2.59
0.46 x2.28
N.A.
3.51 x3.03
3. 2 CigaretteThe concentration of 15 elements were measured in cigarette
tobacco and cigarette wrapping paper of 11 brands of local andforeign made cigarettes commonly used in Pakistan. It was obser-ved that in relatively cheaper brands the concentration of Sb Co,As and Hg were higher in the wrapping paper as compared to theirrespective tobaccos, which indicates the need for improving thequality of the wrapping paper. For inter-comparison of thebrands, the concentration of each toxic element namely Co, Sb, Se,Br, As and Hg in the tobacco and the wrapping paper are plottedin Fig.2 which indicates the relative toxicity of a brand. Theseelements are partialy or completely volatilized in the smoke andare inhaled or adsorbed through tongue and mouth. The transfer-ence of these elements in the smoke was estimated indirectly byanalyzing the cigarette ash. Their adsorption on the cigarettefilter was also studied by analyzing the filter before and aftersmoking the cigarette. The data show that almost all of As, Br,Hg and 80% of Sb and 55% of Se are volatalised into smoke. Thecigarette filter does not adsorb these element except 10% of Hg.The details of these studies were published^).
198

Hgx5BP/3O
As
Co
4 3 2 1. Concentration (ppm)
1 2 3 4Concentration (ppm)
Fig. 2. Dlstri bution of toxic elements in various brandsof cigarette (1.11)
3.3 Tea
The concentration of 19 trace elements in tea leaves ofthree commonly used brands were measured and the data were com-pared with the reported values of some of these elements in teafrom Iran and Japan. The transference of certain toxic andother elements into the drinkable liquid portion was also studiedby brewing or boiling 2g of tea leaves in 100 ml of water for2 min. The transference of As, Hg, Se, Sb and Br into the con-sumable portion was found to be 80%, 19%, 17%, 35% and 75%respectively in the brewing process and 100%, 34%, 56%, 29% and93% respectively in the boiling process. These studies indicatethat transference of most of the toxic elements studied aregreater in boiling process as compared to brewing of tea. Thedaily intake of these elements through tea was calculated assum-
199
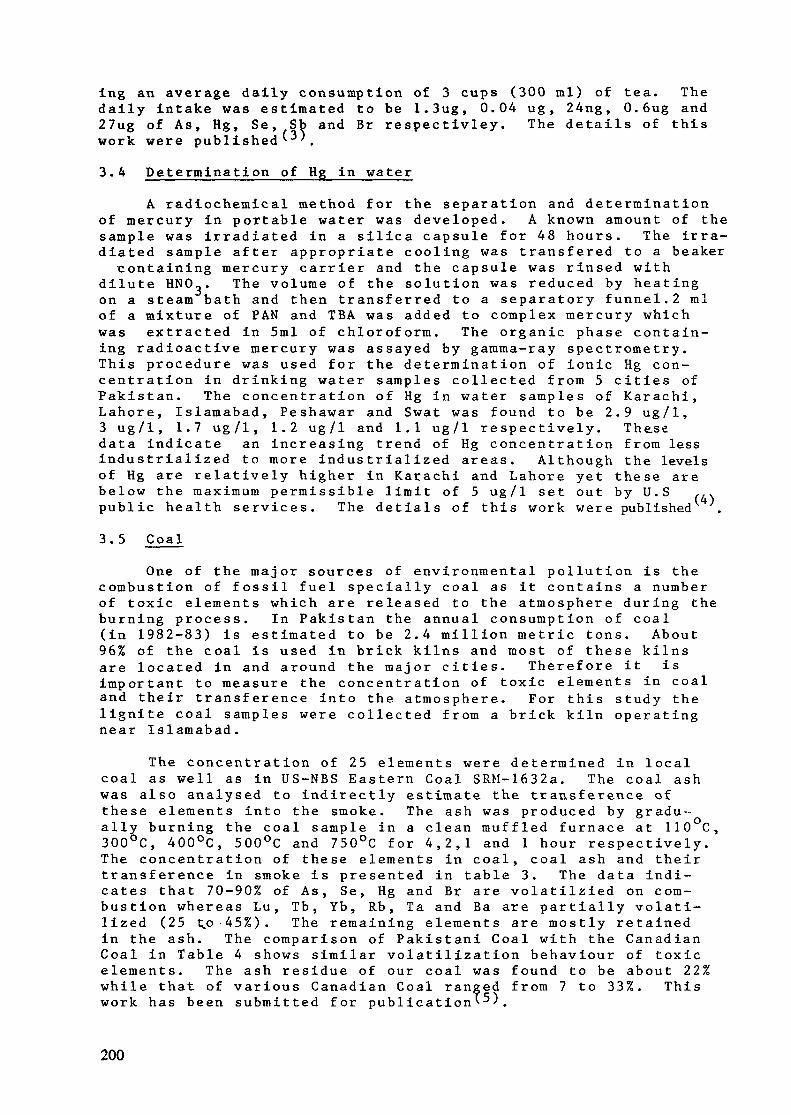
ing an average daily consumption of 3 cups (300 ml) of tea. Thedaily intake was estimated to be 1.3ug, 0.04 ug , 24ng, 0.6ug and27ug of As, Hg, Se, Sb and Br respectivley. The details of thiswork were published^ '.3.4 Determination of Hg in water
A radiochemical method for the separation and determinationof mercury in portable water was developed. A known amount of thesample was irradiated in a silica capsule for 48 hours. The irra-diated sample after appropriate cooling was transfered to a beakercontaining mercury carrier and the capsule was rinsed with
dilute HNO,. The volume of the solution was reduced by heatingon a steam bath and then transferred to a separatory funnel.2 mlof a mixture of PAN and TBA was added to complex mercury whichwas extracted in 5ml of chloroform. The organic phase contain-ing radioactive mercury was assayed by gamma-ray spectrometry.This procedure was used for the determination of ionic Hg con-centration in drinking water samples collected from 5 cities ofPakistan. The concentration of Hg in water samples of Karachi,Lahore, Islamabad, Peshawar and Swat was found to be 2.9 ug/1,3 ug/1, 1.7 ug/1, 1.2 ug/1 and 1.1 ug/1 respectively. Thesedata indicate an increasing trend of Hg concentration from lessindustrialized to more industrialized areas. Although the levelsof Hg are relatively higher in Karachi and Lahore yet these arebelow the maximum permissible limit of 5 ug/1 set out by U.S .,,,public health services. The detials of this work were published .3.5 Coal
One of the major sources of environmental pollution is thecombustion of fossil fuel specially coal as it contains a numberof toxic elements which are released to the atmosphere during theburning process. In Pakistan the annual consumption of coal(in 1982-83) is estimated to be 2.4 million metric tons. About96% of the coal is used in brick kilns and most of these kilnsare located in and around the major cities. Therefore it isimportant to measure the concentration of toxic elements in coaland their transference into the atmosphere. For this study thelignite coal samples were collected from a brick kiln operatingnear Islamabad.
The concentration of 25 elements were determined in localcoal as well as in US-NBS Eastern Coal SRM-1632a. The coal ashwas also analysed to indirectly estimate the transference ofthese elements into the smoke. The ash was produced by gradu-ally burning the coal sample in a clean muffled furnace at 110 C,300°C, 400°C, 500°C and 750°C for 4,2,1 and 1 hour respectively.The concentration of these elements in coal, coal ash and theirtransference in smoke is presented in table 3. The data indi-cates that 70-90% of As, Se, Hg and Br are volatilzied on com-bustion whereas Lu, Tb, Yb, Rb, Ta and Ba are partially volati-lized (25 t^o 45%). The remaining elements are mostly retainedin the ash. The comparison of Pakistani Coal with the CanadianCoal in Table 4 shows similar volatilization behaviour of toxicelements. The ash residue of our coal was found to be about 22%while that of various Canadian Coal ranged from 7 to 33%. Thiswork has been submitted for publication^) .
200
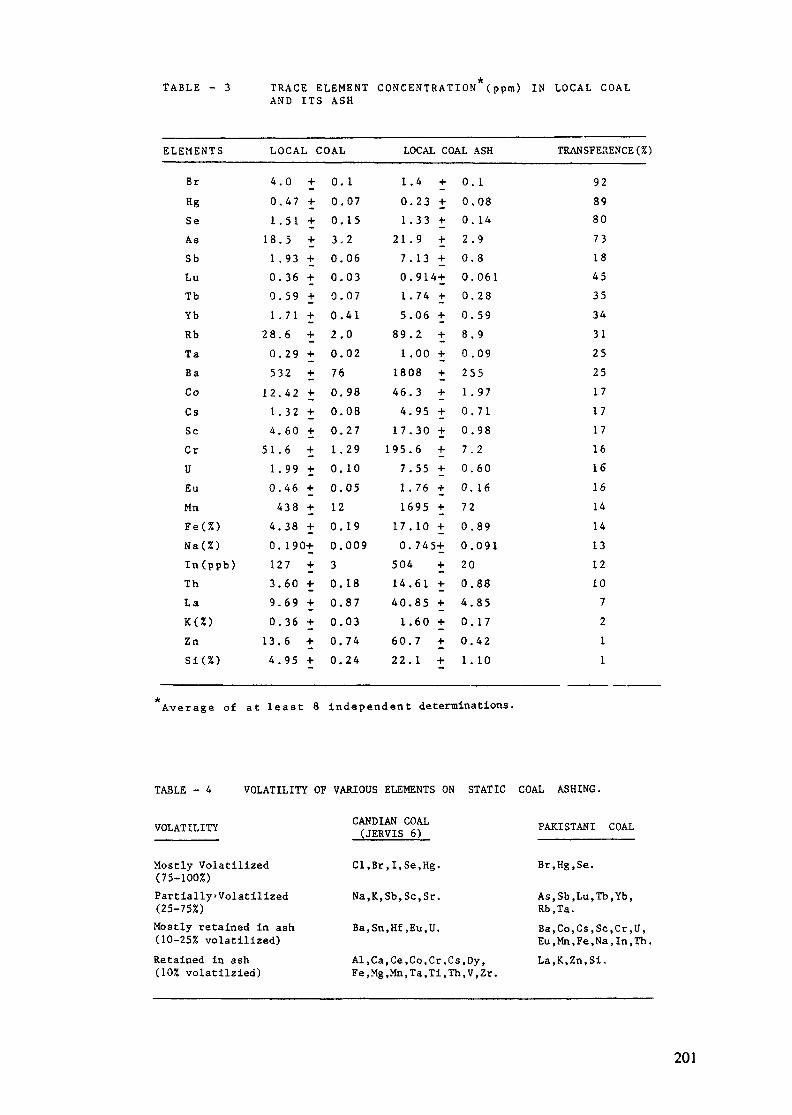
T A B L E - 3 TRACE E L E M E N T C O N C E N T R A T I O N ( p p m ) IN LOCAL COALAND ITS ASH
E L E M E N T S
Br
HgSeAsSbLuTb
YbRb
TaBaCo
CsSeCr
UEu
MnF e ( % )N a ( % )In (ppb)ThLaK ( % )
ZnS i ( % )
Average of
TABLE - 4
VOLATILITY
LOCAL COAL
4.0 +
0 . 4 7 +
1.51 +18.5 +
1 .93 +0 .36 +0 . 5 9 +1 .71 +
28 .6 +
0 .29 +532 +
1 2 . 4 2 +1 .32 +4 . 6 0 +
51.6 +
1 .99 +0 .46 +
438 +4.38 +0. 190+127 +3.60 +9 . 6 9 +0 .36 +
13.6 +4 . 9 5 +
at least 8
VOLATILITY OF
0. 1
0 . 0 70.153 . 20 .060.030 . 0 70 .412 . 00 .02760.980.080.271.290. 100.05120.190 .00930.180.870.030 .740 . 2 4
LOCAL COAL ASH
1.4 +
0 .23 +1.33 +
2 1 . 9 +7 .13 +0 .914+1.74 +
5.06 +89 .2 +
1,00 +1808 +
46 .3 +4 . 9 5 +
17.30 +195.6 +
7 .55 +1. 76 +1695 +
17.10 +0 .745+
504 +14.61 +40.85 +
1.60 +60.7 +22 .1 +
0.1
0.080. 14
2 . 90.80.0610 . 2 8
0 . 5 98 , 90 . 0 9
2551 .970 . 7 10 .987 . 20 . 6 0
0,16
72
0 .890.091200.884.850. 170 . 4 21. 10
TRANSFERENCE (%)
928980
7318453534
3125
2517
17171616
1614
14
131210
7
21
1
independent determinations.
VARIOUS ELEMENTS ON STATIC
CANDI AN COAL(JERVIS 6)
COAL ASHING.
PAKISTANI COAL
Mostly Volatilized(75-100%)PartiallyVolatilized(25-75%)Mostly retained in ash(10-25% volatilized)
Retained in ash(10% volatilzied)
Cl,Br,I ,Se,Hg.
Na,K,Sb,Sc,Sr.
Ba.Sn.Hf,Eu,U.
Al ,Ca,Ce,Co,Cr ,Cs ,Dy,Fe,Mg,Mn,Ta,Ti,Th,V,Zr.
Br.Hg.Se.
As,Sb,Lu,Tb,Yb,Rb.Ta.Ba ,Co ,Cs ,Sc ,Cr ,U ,Eu,Mn,Fe,Na,In,Th.La,K,Zn,Si.
201
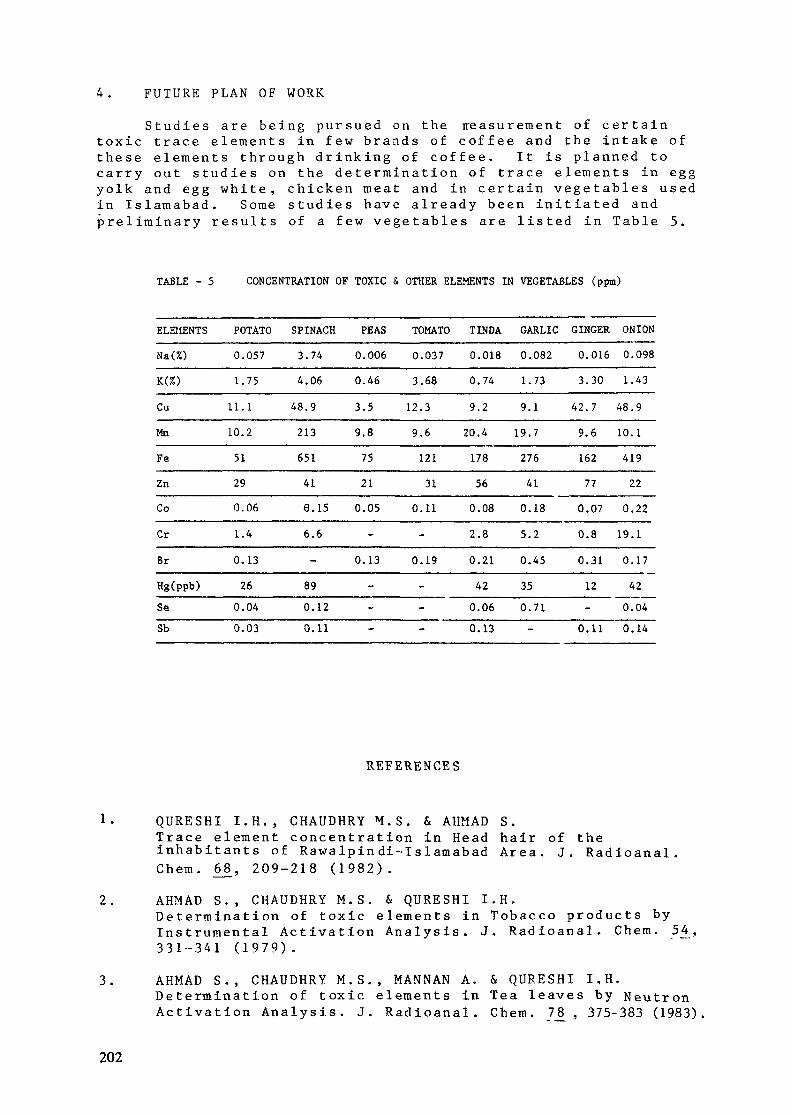
4. FUTURE PLAN OF WORK
Studies are being pursued on the ire a su r em en t of certaintoxic trace elements in few brands of coffee and the intake ofthese elements through drinking of coffee. It is planned tocarry out studies on the determination of trace elements in eggyolk and egg white, chicken meat and in certain vegetables usedin Islamabad. Some studies have already been initiated andpreliminary results of a few vegetables are listed in Table 5.
TABLE - 5 CONCENTRATION OF TOXIC & OTHER ELEMENTS IN VEGETABLES (ppm)
ELEMENTS
Na(%)K(%)
CuMnFeZnCoCr
BrHg(ppb)SeSb
POTATO0.0571.75
11.110.251290.06
1.4
0.1326
0.040.03
SPINACH3.744.06
48.9213651418.15
6.6-890.120.11
PEAS0.0060.46
3.59.87521
0.05-
0.13---
TOMATO0.0373.68
12.39.612131
0.11-
0.19---
TINDA0.0180.74
9.220.417856
0.082.8
0.2142
0.060.13
GARLIC0.0821.73
9.119.727641
0.185.2
0.45350.71-
GINGER0.0163.30
42.79.616277
0.070.8
0.3112-
0.11
ONION0.0981.43
48.910.141922
0.2219.1
0.1742
0.040.14
REFERENCES
1. QURESHI I.H., CHAUDHRY M.S. & AHMAD S.Trace element concentration in Head hair of theinhabitants of Rawalpindi-Islamabad Area. J. Radioanal.Chem. 68, 209-218 (1982).
2. AHMAD S., CHAUDHRY M.S. & QURESHI I.H.Determination of toxic elements in Tobacco products byInstrumental Activation Analysis. J. Radioanal. Chem, 54,331-341(1979).
3. AHMAD S., CHAUDHRY M.S., MANNAN A. & QURESHI I,H.Determination of toxic elements in Tea leaves by NeutronActivation Analysis. J. Radioanal. Chem. 78 , 375-383 (1983)
202

4. AHMAD S., CHAUDHRY M.S. & QURESHI I.E.A Radiochetnical technique for the determination of mercuryin drinking water. Radiochim Acta _30, 117-119 (1982).
5. CHAUDHRY M.S., AHMAD S., MANNAN A. & QURESHI I.H.Instrumental Neutron Activation Analysis of Toxic elementsin Coal and their transference into Environment. J.Radioanal.Chem. 83, (1984) (in press).
6. JERVIS R.E., RICHARD HO K.L., TIEFENBACH B.Trace impur i t i e s in Canadian o i l -sands , Coa l s and P e t r o l e u mp r o d u c t s and their f a t e du r ing e x t r a c t i o n , u p - g r a d i n g andcombus t ion . J. Radioanal. Chem. 71, 225-241 (1982).
7. QURESHI I.E., Determination of trace elements in StandardReference Materials by Neutron Activation Analysis.Report No.NBS(G)-88, (1974).
203
SCALP HAIR AS AN INDICATOR OFENVIRONMENTAL POLLUTION IN MALAYSIA
S. SARMANI, T. KOSHY, Z. ZAKARIANuclear Science Department,National University of Malaysia,Bangi, Selangor, Malaysia
Abstract
The concentration of trace elements such as As, Br, Co, Cr,Fe, Hg, Sb, Se and Zn in the hair of the two population groupsliving in different regions of Malaysia were analysed byInstrumental Neutron Activation Analysis. The results for allelements analysed, except mercury, do not differ significantlyfrom reported values for other region of the world. Mercuryfrom the urban sample is about twice the concentration of therural sample.
1. INTRODUCTION
In recent years, the determination of trace element levelsin human scalp hair has become popular for monitoring environmen-tal exposures,evaluating heavy metal poisoning, assessingnutritional status, and diagnosing diseases [1-10]. Hair ofnormal, healthy individuals generally contain each traceelement within a well-defined range of concentration. Markeddeviations from the values indicate physiological or environmen-tal disorder. Unlike other tissues, hair is a metabolic endproduct that incorporates trace elements into its structureduring its growth.
During the growth phase of a hair, matrix cells of thehair follicle show intense metabolic activity and produce hairat a rate of approximately 0.4 mm per day. Developing hair isexposed to the metabolic environment for a relatively shortperiod of time. As a growing hair approaches the skin surface,its outer layers become hardened and relatively impermeable,thereby sealing in metabolic products accumulated during itsformation. The trace element composition of the hair reflectsthe composition of the medium from which it was formed. In thisway, hair provides a historical record of trace elementsassimilated from the environment.
There is still a lack of information on the variabilityof trace element concentrations in hair as a function of variouslocal factors in population groups not exposed to abnormalenvironmental pollution. A knowledge of the natural levels oftrace elements in hair and other tissues is very importantfor assesing the degree of human contamination in areas wherethese elements are expected to show anomalous concentrations.
With these considerations in mind a study on selectedpopulation groups within Malaysia was started to assess thevariability of the concentrations of trace elements in thehair of a normal population as a function of geographical and
205
economic factors. Trace elements such as As, Br, Co, Cr, Fe,Hg, Sb, Se and Zn were analysed in the hair samples of twopopulation groups living in different regions of Malaysia. Allanalyses were carried out using instrumental neutron activationanalysis.2. MATERIALS AND METHODS2.1. Sample Collection
Hair sampels were obtained from donors residing in KualaLumpur, Petaling Jaya and Sepang districts. Kuala Lumpur, thecapital city of Malaysia has a population of more than onemillion whilst Petaling Jaya has a population of approximately100,000. Both cities are situated in the Kelang Valley, thelargest industrial, business and commercial centre in Malaysia.Sepang is an agricultural area on the west coast of Selangor.
A total of 35 hair samples were collected. Each sampleapproximately 1000 mg was clipped from 10 places from the headscalp with a pair of stainless steel scissors. Each sample isgiven a code number and particulars of the donor such as placeof residence, ethnic group, age and sex were recorded.2.2. Sample Preparation
About 400 mg aliquot of each hair sample was cut to alength of 2mm to 5mm and washed in a conical flask with distilledwater (50 ml), acetone (50 ml) followed by distilled water (2 x50 ml) and acetone (2 x 50 ml). The samples were later driedin an oven at 30°C for 20 hours.
About 100 mg of hair sample together with standard referencematerials and blanks were irradiated in the PUSPATI TRIGA MARK IIreactor for 8 hours at a flux of 2.5 x 1o'*n cm~2 s~1.2.3 Measurement of Activities
The gamma-ray acitivities of the samples were measured bya high resolution spectrometer consisting of ORTEC HyperpureGermanium detector with a sensitive volume of 78 cm3, FHHM 1.80keV at 1322.4 keV. The multi-channel analyser used was CANBERRAmodel series 85 with 4096 channels. The activation spectrum ofeach sample was plotted by HP-7470A graphic plotter. Gamma-raypeak intensities were printed out by TELETYPE 43 line printer.
3. RESULTS AND DISCUSSION
Results of the analyses are presented in Table 1 and Table2. To ascertain the analytical procedure used, standard referencematerials such as SOIL-5, SL-1, NBS/SRM-1633 were analysed andthe precision for all elements of interest are in the region of87 - 95%.
The arithmetic mean values for the concentration of all theelements studied, except Hg, do not differ significantly fromreported values for other regions of the world [10]. The Hglevel is quite high compared to 1.4 ± 2.1 in Iraq [11] or4.2 ± 1.95 in Japan [12]. The mercury contamination source isnot yet established.
206

TABLE 1 ; Trace Element Hair Concentration in35 Samples Collected from Selangor
Element
AsBrCoCrFeHgSbSeZn
Mean
0.64 ± 0.548.9 ± 6.60.08 ± 0.041.34 ± 0.94
65 ± 31, 7.43 ± 4.450.31 ± 0.210.57 ± 0.16
189 ± 88
Median
0.526.220.070.95577.250.210.54
166
TABLE 2; Trace Element Contents of the TwoPopulation Groups
Element
AsBrCoCrFeHgSbSeZn
RURALMean
0.27 ± 0.238.3 ± 5.60.13 ± 0.040.78 ± 0.30
84 ± 314.34 ± 2.340.37 ± 0.190.5 ± 0.12
192 ± 105
Median0.156.030.120.74844.240.340.55
168
URBANMean
0.83 ± 0.569.1 ± 7.00.06 ± 0.021.63 ± 1.03
52 ± 238.98 ± 4.510.27 ± 0.210.58 ± 0.18187 ± 83
Median0.706.220.071.36
478.360.190.53
166
207
4. CONCLUSIONIt was found that samples from rural areas contain a higher
concentration of Co*4 Fe,whereas samples from urban areas containa higher concentration of As, Cr and Hg. The concentrationsfor other elements analysed are more or less the same. As(0.70 ppm) in the urban sample is about 5 times the value ofthose found in other countries. Hg from the urban sample isabout twice the concentration of the rural sample. The Hgconcentration from the two samples is higher compared to thosereported by other countries.
During the contract period competence in analyticaltechnique based on INAA has been developed. Trace elementanalysis in hair can be carried out on a routine basis and weare quite confident of the results. The INAA technique can beapplied to other kinds of environmental samples and it iscomplementary to Atomic Absorption Spectrometry currently usedwidely by analytical laboratories in the country. We are nowplanning to use the neutron activation analysis technique foranalysis of trace elements in foodstuffs . such as rice, fish,meat and vegetables, as past of the Food Contamination AnalysisProgramme organised by the Health Authority of Malaysia. Thisparticular programme will be supported by our institute,PUSPATI and hopefully financial grant will be obtained from theIAEA.
The contract on the research coordinated project will cometo an end on 31st March 1984. However, this project will beextended in our institute and future work will include study ofthe variability of trace elements in hair samples from Malay,Chinese and Indian communities.ACKNOWLEDGEMENT
This project was supported by IAEA under contract No.2713/Rl/RB and Universiti Kebangsaan Malaysia. The servicesprovided by Tun Ismail Atomic Research Centre (PUSPATI) isgreatly appreciated.
6. REFERENCES
1. Al-Shahristani, H. and Al-Haddad, Mercury content of hairfrom normal and poisoned persons, J. Radioanal, Chem. 15,59-70 (1973).
2. Chuang, L.S and Emery, J.F. Hair as an indicator of envi-ronmental exposure in Hong Kong. J. Radioanal Chem, 45,169-180 (1978).
3. Gangadharan, S., Trace elements in hair and environmentalexposure, J. Sei. Tot. Env. 22, 169-178 (1982).
4. Jervis, R.E., Scalp hair as a monitor of population expo-sure to environmental pollutants, J. Radioanal. Chem.37, 751-760 (1977) .
5. Jervis, R.E., Crm Zn, Hg and Se levels of diabetic patientshair, in Chromium in Nutrition and Metabolism Elsevier,Holland. 69-78 (1979).
208
6. Quereshi, I.H., Trace elements concentration in head hairof the inhabitants of the Rawalpindi-Islamabad Area,J. Radioanal. Chem. 68, 209-218 (1982).
7. Takeuchi, T., Variation of elemental concentration in hairof the Japanese in terms of Age, Sex and hair treatments,J. Radioanal. Chem. 70, 29-55 (1982).
8. Chatt, A., Roberts, T.M., Jervis, R.E., Scalp hair as amonitor of community exposure to lead, Arch. Env. Health35, 226-236 (1977).
9. International Atomic Energy Agency, Activation Analysisof hair as an indicator of contamination of man byenvironmental trace element pollutants, Report IAEA/RL/50,Vienna (1978).
10. Clémente, G.F., Trace element composition of hair in theItalian population, Proc. Nuclear Activation Techniquesin the Life Sciences, 527-543, (1978).
11. Al-Shahristani, H., Distribution and significance of traceelement pollutants in hair of the Iraqi Populations, idem,pp 515-525.
12. Imahori, A., A study of trace element concentration inhuman hair of some local populations of Japan, idem,pp 563-751.
209
SAMPLE PREPARATION TECHNIQUES FOR (p, X) SPECTROMETRY
N.B. WHITEHEADDepartment of Scientific and Industrial Research,Institute of Nuclear Sciences,Lower Hutt, New Zealand
Abstract
Samples are ashed at low temperature, using oxygen plasma; a rotaryevaporator, and freeze drying speeded up the ashing. The new design ofapparatus manufactured was only 10 watt but was as efficient as a 200watt commercial machine; a circuit diagram is included. Samples of hairand biopsy samples of skin were analysed by the technique.
A wool standard was prepared for interlaboratory comparison exercises.It was based on New Zealand merino sheep wool and was 2.9 kg in weight. Awashing protocol was developed, which preserves most of the trace elementcontent. The wool was ground in liquid nitrogen using a plastic pestleand beaker, driven by a rotary drill press.
1. INTRODUCTIONAlthough (p,X) analysis using thick targets, is quite possible,
analysis using thin targets avoids the problems of calculating crosssections for proton absorption, and absorption of the resultant x-raysbefore they reach the detector. It may be possible also to prepare thetarget so that most of the matrix is removed, and concentrate elements ofinterest.2. METHODS OF REDUCING ORGANIC CONTENT & SOLUBILISING2.1 Solution by alkali
This is not useful since the sample weight increases (1).2.2 Dry oxidation
This type of ashing is usually done at temperatures of 500-600°C andoften leads to the volatilisation and loss of elements such as halogens,lead, cadmium, and mercury, (2).2.3 Wet oxidation
For the (p»X) technique a major difficulty is that few thin backingswill maintain their integrity with the strong acids used. Even Kapton, atough polyimide cannot withstand either perchloric or sulphuric acids.
Attempts to use nitric acid/hydrogen peroxide to wet-ash hairadded many trace elements to the sample from the glass by leaching, andin addition the weight of the ashed hair was equivalent to about 25% ofthe fresh weight. This was shown to be due to oxidation of the sulphur inthe hair, to sulphate, rather than being lost as sulphur dioxide. Thismeant that little was gained by the oxidation for the purposes of (p,X)spectrometry which is improved in sensitivity most when the ash percentage isleast.
211

2.4 Plasma ashingIn this method, oxygen is ionised by a radiofrequency source, and
passed at low pressure over the sample to be ashed. Even at low temperatures(generally less than 100°C) the sample is oxidised, but a method to trapvolatiles must still be included (3,4).
A commercial LFE-301 asher loaned us by the D.S.I.R. Soil Bureau was200 watt. Ashing to constant weight usually took 24-36 hours for most samples.Following that, the samples were dissolved in concentrated cold nitric acid.Reproducibility was as bad as +100% for the subsequent analysis for samplesdried on Kapton. This was due to microscopic insoluble residues.
Mr J. Patterson of Chemistry Division constructed an improved plasmaasher. This asher puts the sample in a tube right inside the radio-frequency coils, so that the oxygen ions are created almost in the sampleitself. In the top of the tube is a cold finger, cooled by water, on whichsome products of the ashing collect. After ashing, some concentrated nitricacid is added and the ash and acid refluxed for one minute.
For replicate hair specimens the reproducibility was equal to the bestrecorded in the literature (+10%). Interestingly the ash percentage was muchhigher - 3% compared with 0.5% for the LFE asher. Reproducibility with thenew asher was better for other samples also.
The equipment was reconfigured so that the ashing chamber was a glasstest tube with ground glass joint to fit on a Buchi rotary evaporator. Theangle was kept very shallow, so that the sample tumbled readily. Some tubeswere also made with internal ridges to aid in mixing the samples. LFE asher,rotary evaporator and manual vibrator gave half value times for weightdecrease of IAEA animal blood of 27,7 and 1.8 hours. Manual vibration wasbest.
The ashing of Bowen's Kale was partially improved by freeze-drying itwhich perhaps burst open cells and exposed more surfaces for oxidation.
An asher along the lines of Mr Patterson's was made with improvedcircuitry. A circuit diagram is attached (see appendix). This wasdesigned and made by Mr P.Pohl of this institute.
It is obvious that the plasma ashing system needs a lot moreinvestigation. At the moment the speed of ashing is very sampledependent, and some samples yield high ash percentages, and take much timeto ash, and give analyses very erratic in their reproducibility.
The original work of Gleit and Holland (5) gave ash was in all casessoluble in acid without residue, but they do not report on reproducibilityof ashing.2.5 Oxygen flask ashing
This good method burns the sample in an enclosed quartz flash withoxygen, and a cold finger to trap volatiles, (6).
212
3. ANALYSIS OF SAMPLES3.1 Intercomparison samples
To the ash 0.25 ml of Aristar nitric acid was added and a smallcoverglass with water placed over the top. The vial was gently heateduntil the nitric acid just boiled and reflux was continued for about oneminute. Each vial solution was analysed in duplicate. 5-microlitre wastaken and dried on Kapton and irradiated with 2.5 MeV protons from a Van deGraaff accelerator. Uniformity of beam was ensured by using a protonmicroprobe and scanning the spot over the sample. Scanning of the beamwas such that the dried sample spot was eventually completely covered by themicroprobe beam to avoid problems due to inhomogeneity in the dried samplespot. X-ray spectra were taken with a Si(Li) detector.
One plant material ash contained significant calcuium sulphate andrequired dilution to dissolve it.
Another type of sample would not completely dissolve in the nitricacid until some HC1 was also added. Microprobe analysis showed this tohave been due to formation of ferric phosphate which is not soluble in nitricacid alone.
For many of the samples the +10% reproducibility criteria arbitrarily setwas not met for many of the analyses meaning that further work on sampleprepartion is required.3.2 Biopsy samples of skin
These were taken from edges of wounds resulting from surgery. Thecollaborator in this programme was Dr Andre van Rij of Otago Medical SchoolDunedin, and it was an attempt to examine whether the zinc levels in healingtissues varied and whether other trace elements also varied.
Sample weights varied from 1 mg to 300 mg with a mean of 75 mg andstandard deviation of 86 mg.The results showed great variations in trace elements content between
samples meaning other studies are needed, with many samples from the samepiece of tissue to establish natural variations with location. The methodis well suited to analysis of these very small tissue fragments.3.3 Comparison of (p,X) analysis of thin & thick targets
The main advantage of using thin targets for analysis is the lack ofcorrections required. However it is obvious that the method hasironically, limitations which are still matrix dependent! It is much harderto prepare a concentrated homogeneous solution than one would imagine, andthis may explain some of the rather erratic results obtained via theatomic absorption spectroscopy technique in the experience of the Agencywhen interlaboratory comparison exercises are organised.
The thick target analysis technique, suffers from problems ofcorrections, inhomogeneity, and changing geometry. The first is alreadymentioned - some of the parameters used have several percent error on them,which limits accuracy.
213
The second is a property of the sample, and may be quite severe forbiological samples. The actual weight of sample analysed cannot be morethan about l mg at the usual energies of a small Van de 'Graaff accelerator.This limitation is quite severe. One is asking that the homogeneity of anenvironmental solid sample be guaranteed to better than +10% on a scale of 1mg. This is probably impossible without sample pretreatment and verydifficult even with it.
The third problem may arise if the analysis is done in a vacuum.Volatilisation of elements is quite possible and will change the geometryof analysis and introduce further imprecision. This can be avoided if theanalysis is performed in air, using an external proton beam.All in all, for bulk analysis, (p,X) spectrometry is not optimum as atechnique, but still has a strong potential for spatial analysis on a smallscale, and for microanalysis.
4. PREPARATION OF WOOL STANDARDI have attempted to prepare a trace element standard based on NewZealand sheep wool.I used merino wool, which is fine in texture. A merino fleece stillattached to the hide was obtained by courtesy of the Min-istry of Agriculture
and Fisheries from their research station at Tara Hills near Omarama in theSouth Island.4.1 Cleaning
In this case the wool was cut off the hide with a serrated glass knifeand before cleaning weighed 4.8 kg.
I attempted merely to degrease wool to a standard similar to that ofthe commercial scourers. That is remove 20% of the starting weight, ofwhich 16% is grease and 5% suint. It was not possible to follow the standardI.A.E.A. protocol for hair (Ryabukhin (7)) since the grease is not verysoluble in the solvents suggested.
The wool was lightly pummelled for 15 seconds with minimum volume ofStoddart's solvent in borosilicate beakers using a large polyethylenepiston, shown to be free of significant trace elements by (X,X')spectrometry and then for a similar time with distilled water (for each oftwo rinses). This gave a dry yield of about 70% of the initial weight.4.2 Carding
Commercial wool, is already cleaned and carded. However analysisshowed a large proportion of the trace elements was removed and in additionalthough the homogeneity was excellent for copper and zinc, it was +38% foriron. It seems that such wool is dangerous to use for a standard for traceelements. Carding of the merino fleece was still needed.
X-ray fluorescence analysis of a number of polypropylene combs ofclear or tortoiseshell appearance showed that some were very low in traceelements and very suitable for carding wool.
214

4.3 PulverisationThe traditional way of doing this is percussion under liquid nitrogen.
A number of systems were tried; Waring Blendor, ultrasonication, manualgrinding, electromagnetic vibration using a loudspeaker coil, pneumaticvibration, and mechanical vibration, but all gave very low yields.By far the best solution proved to be a semi-manual one. A low-trace-
element polyethylene pestle was used in a rotary drill press as a sourceof rotary power, and the wool sample was frozen in a Nalgene (polymethylpen-tene) beaker (also very low in trace elements). The beaker was well insulatedwith polystyrene foam in a rigid enclosure, and manually moved against theridged pestle to grind the wool, 75 g an hour of a ground wool could beroutinely produced.
It appears that a better solution than any of the above may exist(pers. comm. R. Parr, IEAE). A teflon analogue of the commercial equipmentfor grinding rocks between cylindrical steel concentric rings which isrotated eccentrically has been made by the NBS in the USA, Its output isapparently an order of magnitude greater than the best mentioned above.4.4 Homogeneity testing
Homogeneity testing via (X,X') spectrometry, and neutron activationanalysis showed reproducibility at the 150 mg level for Fe was +8.6% and forZn was +2.4%. For Cobalt and silver the figure was +10%.4.5 Adequacy of sheep wool as a trace element standard
The three kilo sample, may be adequate for use as such a standard, asshown by the analyses so far. However future changes would be necessary, sincemicroscopic examination showed the presence of residual dirt. The onlysolution, more rigorous cleaning, will also remove trace elements.
What are the relative advantages and disadvantages of sheep wool andhair for trace elements?
I think the wool, being a commercial product is probably available mucheasier in very large quantities. However the well known heterogeneity ofhuman head hair is probably also found for sheep wool. In addition theinitial dirtiness of sheep wool can only be described as high, It isthoroughly cleaned commercially, but sheep are in a much less controlledenvironment than humans and it is possible that heterogeneity will begreater. More research is needed to settle this point. It has alreadybeen shown that a standard of sufficient homogeneity can be produced fromhair (standard HH-1) but that is not yet clear for wool. This means thatthere is slightly more risk involved in attempts to work with wool.
Either type of standard sample is a good one for analysis because bothhave potentially a low ash weight, and this is useful for those analysts whoare using destructive techniques.
A final advantage of either type of material which has not beenexploited yet, is that both materials are weak ion exchangers. It istherefore possible to adsorb trace elements onto them from solution. Ifthere is some specific element which is difficult to analyse a semi-artificial standard could be made up, rather like the ion-exchange beadsalready used by the agency.
215

(0+"•c=3Oo
Energy
FIGURE I - (XX1) SPECTRUM OF WOOL.Mo ANODE USED.
5. RECOMMENDATIONS5.1 Low temperature ashing be used for sample preparation in (p,X) spectro-metry, but more research be devoted to best means of doing this forvegetable tissues.5.2 Sheep wool be further investigated for preparation of a trace elementstandard, with special attention to heterogeneity problems.5.3 Consideration be given to the preparation of a trace elementstandard based either on wool or hair, but containing trace elementsadsorbed from solution.5.4 Further research be done on using (p,X) spectrometry for analysisof very small samples, such as biopsy tissues.6. ACKNOWLEDGEMENTS
I have been helped substantially by many members of the Electronicssection of this institute, by Mr Ken Marment, and Mr Matthew Connorbesides those mentioned in the text.
REFERENCES1. Kaplan P.D.; Blackstone, M.; Richdale N.: Direct determination ofcadmium, nickel and zinc in rat lungs. Arch. Envir. Health. 27 387-9,(1973).2. Clegg, M.S.; Keen C.L.; Loennerdal, B.; Hurley, L.S.: Influence ofashing techniques on the analysis of trace elements in biologicalsamples. II Dry ashing. Biol. Trace El. Res. 3 237-44 (1981).3. Imai, S.: Loss of the elements in low temperature plasma ashing.Bunseki Kagaku 27(10) 611-5 (1978).
216

4. Maenhaut, W.; De Reu, L.; Vandenhaute, J.: Sample preparationin PIXE analysis of biological materials. Trans. Am. Nucl. Soc.41 212-4 (1982).5. Gleit, C.E.; Holland, W.D.: Use of electrically excited oxygen forthe low temperature decomposition of organic substances. Anal. Chem.34 1454-7 (1962).6. Williams, E.T.; Finston, H.L.: PIXE as an analytical tool: Anexternal-beam system in helium and the role of sample preparation.IEEE Trans. Nucl. Sei. NS28(2) 1382-5 (1981).7. Ryabukhin, Y.S.: Nuclear-based methods for the analysis of traceelement pollutants in human hair. J. Radioanal. Chem. 60(1) 7-30 (1980).
APPENDIX - P. Pohl
27 MHz Power Source -The circuit presented produces some 10 watts of 27 MHz power
into a 50 a load.TR1 operates as an oscillator whose frequency is determined by
a 3rd overtone 27 MHz crystal.TR2 amplifies the 27 MHz to a power level of about 1 watt.TR3 further amplifies this to the required level of about
10 watts.Load impedance mismatch is sensed and displayed on "Forward Power1
and 'Reflected Power' meters. Excessive load mismatches (resulting inhigh reflected power readings) are used to decrease the gain of TR3 bychanging its bias condition - Note (1): this is to prevent destruction ofTR3 by accidental shorting/disconnection of the load.
Components -
Conventional except for:
TR3 : Power MOSFET : Siliconix VN98AJ or similar.Coils .-Amidon Associates.Crystal :27 MHz 3rd overtone : exact frequency depending on local
authorized frequency.
Note (1): Siliconix application note AN80-6.
217
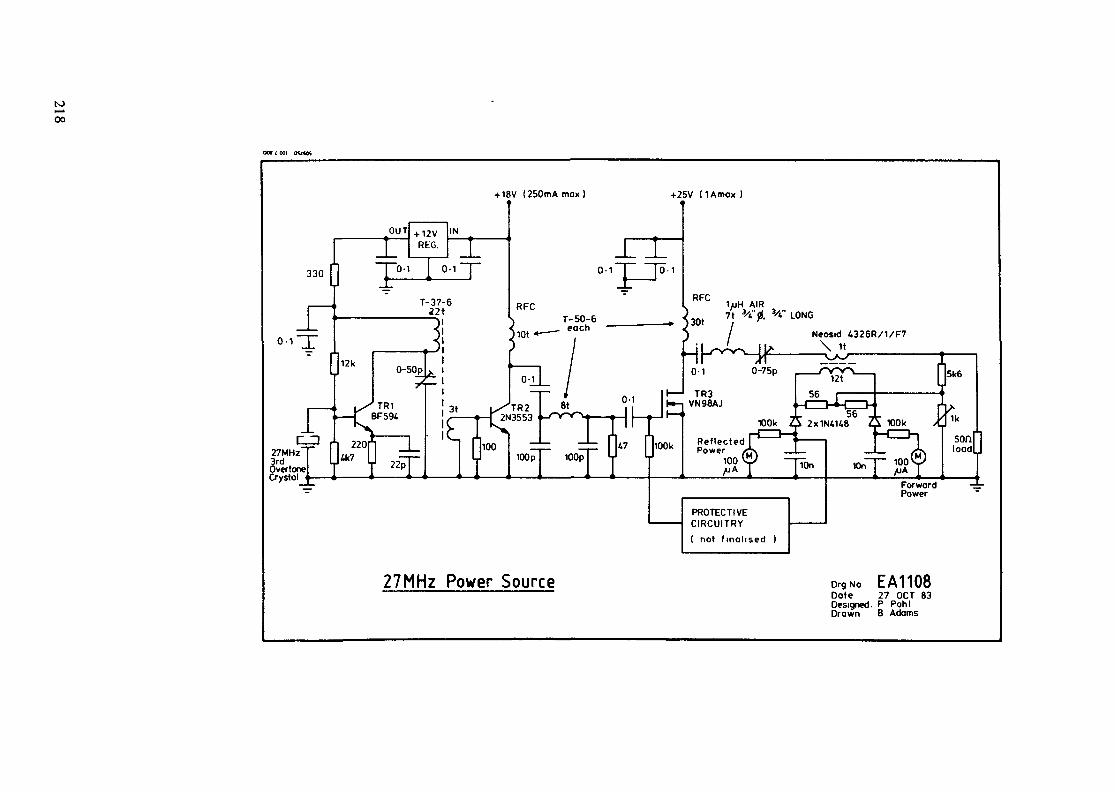
toH—
oo
out t doi raw
+ 18V (250mA max)
330
RFC
+25V IIAmox )
1/uH AIR7t 3/i'd. *i" LONG
/ Neosid 4326R/1/F7
HK^SP—^0-1 0-75p
TR3VN98AJ
rystol
100k A 2x1N4U8 2X 100k
PROTECTIVECIRCUITRY( not finalised
27MHz Power Source DrgNo EA1108Date 27 OCT 83Designed. P PohlDrawn B Adams

A STUDY OF TRACE ELEMENT CONCENTRATIONSIN HUMAN HAIR OF THE INHABITANTS OF THEJAKARTA CITY
S. YATIMCentre for the Application of Isotopes and Radiation,Jakarta Selatan, Indonesia
Abstract
A STUDY OF TRACE ELEMENT CONCENTRATIONS IN HUMAN HAIR OF THE INHABITANTSOF THE JAKARTA CITY. By applying instrumental neutron activation analysis,a study was carried out to investigate the concentration of the elements :Au, Br, Co, Cr, Fe, Hg, Sb, Se and Zn in human hair samples of the inha-bitants of the Jakarta City. A total of 263 samples, consisting of 177 malesand 86 females of the age between 10 and 60 years, have been collected fromthe donors in various residential district. The concentration ranges, themedian, the average concentration and the frequency distribution of each ele-ment found in the samples are reported in discussed. The results showed thatexcept for Co, Se and Zn, the concentration of the other elements were compa-rable to the reported values from other regions of the world. Co and Se werefound to be higher and Zn was lower. The study of Hg in hair samples of thedentist and in hair of the population suspected to be contaminated with Hgfrom industrial effluents were also done. The results showed that Hg in hairof dentist was 4-5 times higher than in the population suspected to be conta-minated with Hg. The arithmetic mean for Hg in this population was A.68 +_4.66 for males and 5.03 4.51 for females.1. INTRODUCTION
In the last ten years there has been an increasing growth of industrialactivity and more extensive use of chemicals in the Jakarta area. Theseactivities indicate an ever increasing quatities of toxic element releasedinto the environment. In the long term period the quantity of these elementscan reach a concentration level that can create a problem to the population.
To be able to judge whether the population has been exposed to theabnormal quantities of environmental pollutants it is essential to establishthe normal concentration of trace elements in the population. Hair,as a minororgan by which many metals are excreated, can be used as an indicator oftoxic elements in the body. In 1976, the IAEA Advisory Group suggested thatone of the first step in approaching the problem of man's contamination tothe environmental pollutants Is by analysing the content of trace elements inhair samples, collected in a statistical random fashion througout the popula-tion of each country (1). Many authors have determined the trace elementcontent in hair samples from different region world to find out the nor-mal level of the element in the population studied or the extend of his con-tamination in areas where the population is exposed to contaminated food,water, or occupational and other causes of exposure. The compilation of theconcentration of the elements reported by the authors from different regionsof the world has been prepared by the IAEA (2) and U.S. EPA (3).
In participating the IAEA programme on Health Related EnvironmentalResearch Using Nuclear Techniques, a study was carried out to find the con-centration of several trace elements in hair samples of the inhabitants ofthe Jakarta city, using instrumental neutron activation analysis. The purpo-
219

se of this study was to find the present level of the elements : Au, Br, Co,Cr, Fe, Hg, Sb, Se and Zn in the population of the Jakarta city. Instrumen-tal neutron activation analysis was also used to determine the concentrationof Hg in hair of the dentist and in hair samples of the population living innorthern part of the Jakarta, along the region of Jakarta bay. The Jakartabay is polluted with industrial effluents and most of the population l i v i n gin this area are local fishermen and they are suspected to be exposed withHg through consumption of fish and seafood contaminated with Hg. The purpo-se of this work was to find the extent of Hg contamination in the two expo-sure groups.2. EXPERIMENTAL2.1 Samples
•
Sampling of hair from the population of the Jakarta city was carriedout within 3 months in September - November 1980. During this samplingperiod , a total of 263 samples, consisting of 177 males and 86 females ofthe age between 10 and 60 years , were collected from donors in various resi-dential district of Jakarta. The number of donors obtained from variousresidential district and the age distribution of the samples are given inFigure 1 and 2. 153
10
5040
10
Number of male anddonors obtained inadministrativeJakarta
fema1eeachregions of
FIGURE 1.
10 20 30 40 SO 60age group (years)
The age groupsdistribution ofthe samples
FIGURE 2.
Samples of hair from the population living in the contaminated area ofJakarta bay was done by Centre for Ecological Study, National Institute forHealth Research and Development from the total about 200 samples collected,78 of them consisting of 26 males and 52 females were selected so as torepresent the population in the viewpoints of the resident time and thequantity of seafood consumed.
The hair samples of the dentist were collected during sampling periodin October 1982. During this sampling period, a total of 62 samples, consis-ting 3^ males and 28 females of different age, were collected from the den-
220
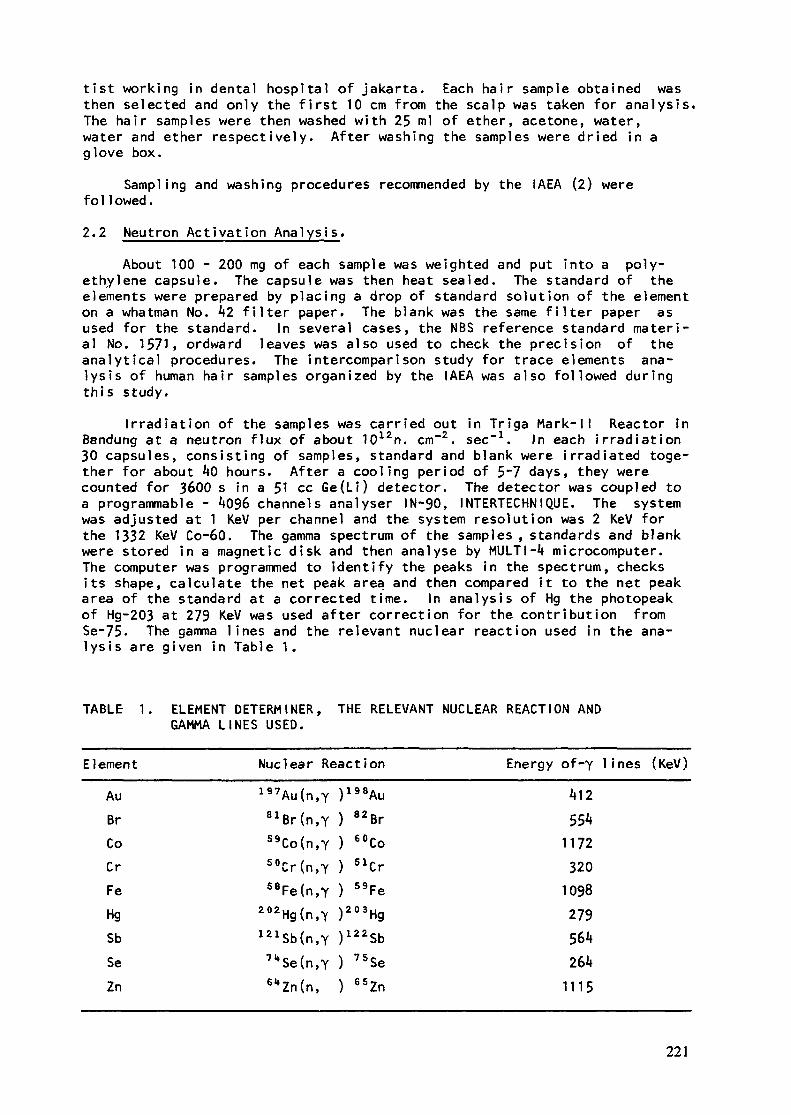
tist working in dental hospital of Jakarta. Each hair sample obtained wasthen selected and only the first 10 cm from the scalp was taken for analysis.The hair samples were then washed with 25 ml of ether, acetone, water,water and ether respectively. After washing the samples were dried in aglove box.
Sampling and washing procedures recommended by the IAEA (2) werefo11 owed.2.2 Neutron Activation Analysis.
About 100 - 200 mg of each sample was weighted and put into a poly-ethylene capsule. The capsule was then heat sealed. The standard of theelements were prepared by placing a drop of standard solution of the elementon a whatman No. 42 filter paper. The blank was the same filter paper asused for the standard. In several cases, the NBS reference standard materi-al No. 1571, ordward leaves was also used to check the precision of theanalytical procedures. The intercomparison study for trace elements ana-lysis of human hair samples organized by the IAEA was also followed duringthis study.
Irradiation of the samples was carried out in Triga Mark-11 Reactor inBandung at a neutron flux of about 10 n. cm" . sec-2 .-1 In each irradiation30 capsules, consisting of samples, standard and blank were irradiated toge-ther for about 40 hours. After a cooling period of 5"7 days, they werecounted for 3600 s în a 51 ce Ge(Lî) detector. The detector was coupled toa programmable - 4096 channels analyser IN-90, INTERTECHNIQUE. The systemwas adjusted at 1 KeV per channel and the system resolution was 2 KeV forthe 1332 KeV Co-60. The gamma spectrum of the samples , standards and blankwere stored in a magnetic disk and then analyse by MULTI-4 microcomputer.The computer was programmed to identify the peaks in the spectrum, checksits shape, calculate the net peak area and then compared it to the net peakarea of the standard at a corrected time. In analysis of Hg the photopeakof Hg-203 at 279 KeV was used after correction for the contribution fromSe-75. The gamma lines and the relevant nuclear reaction used in the ana-lysis are given in Table 1.
TABLE 1. ELEMENT DETERMINER, THE RELEVANT NUCLEAR REACTION ANDGAMMA LINES USED.
ElementAuBrCoCrFeHgSbSeZn
Nuclear Reaction197Au(n,Y )198Au81Br(n,Y ) 82BrS9Co(n,Y ) 60Cos°Cr(n,Y ) 51Cr58Fe(n,Y ) 59Fe
202Hg(n,Y )203Hg121Sb(n,Y )122Sb74Se(n,Y ) 75Se6*Zn(n, ) 65Zn
Energy of~Y lines (KeV)412554
1172320
1098279564264
1115
221
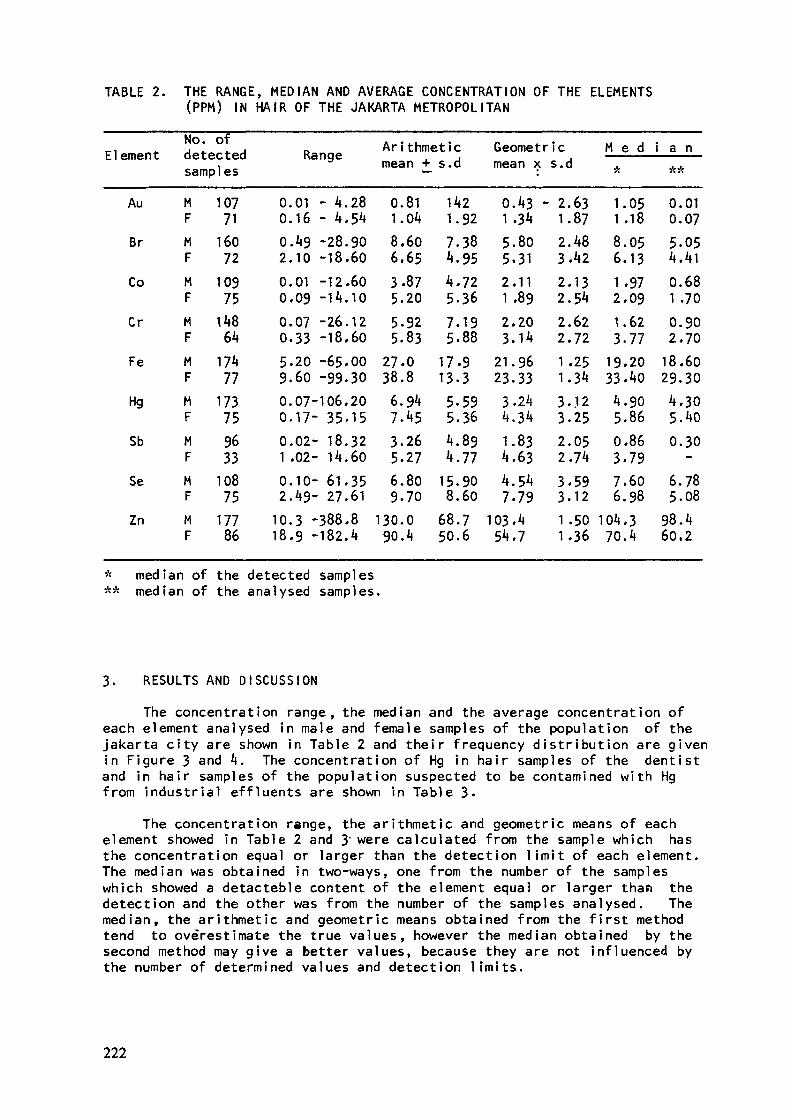
TABLE 2. THE RANGE, MED I A N AND AVERAGE CONCENTRATION OF THE ELEMENTS(PPM) IN HAIR OF THE JAKARTA METROPOLITAN
Elément
Au
Br
Co
Cr
Fe
Hg
Sb
Se
Zn
No. ofdetectedsamples
MFMF
MF
MF
MFMF
MFMFMF
10771
16072
10975
1486k
*7k77
173759633
10875
17786
000200
00
59000102
1018
Range
. 0 1 - 4
.16 - k.49 -28.10 -18.01 -12.09 -14.07 -26•33 -18.20 -65.60 -99.07-106.17- 35.02- 18.02- 14.10- 61.49- 27.3 -388.9 -182
Ari thmet i cmean +_ s.d
.28
.54• 90.60.60.10.12.60.00.30.20.15.32.60.35.61.8.4
0.811 .048.606.653-875.205-925.83
27.038.8
6.947.453.265.276.809.70
130.090.4
1421.927.384.954.725.367.195.88
17.913-3
5.595.364.894.77
15.908.60
68.750.6
Geometricmean x s.d
0.431.345.805.312.111 .892.203.14
21.9623.33
3.244.341.834.634.547.79
103.454.7
- 2.631.872.483.422.132.542.622.72
1.251.343. .123.252.052.743.593.121 .501 .36
M e dA
1.051 .188.056.131.972.091.623.77
19.2033.40
4.905.860.863.797.606.98
104.370.4
i a n**
0.010.075.054.410.681 .700.902.70
18.6029.30
4,305.400.30
6.785.08
98.460.2
* median of the detected samples** median of the analysed samples.
3. RESULTS AND DISCUSSION
The concentration range, the median and the average concentration ofeach element analysed in male and female samples of the population of theJakarta city are shown in Table 2 and their frequency d i s t r i b u t i o n are givenin Figure 3 and 4. The concentration of Hg in hair samples of the dentistand in hair samples of the population suspected to be contamined with Hgfrom industrial effluents are shown in Table 3«
The concentration range, the arithmetic and geometric means of eachelement showed in Table 2 and 3" were calculated from the sample which hasthe concentration equal or larger than the detection l i m i t of each element.The median was obtained in two-ways, one from the number of the sampleswhich showed a detacteble content of the element equal or larger than thedetection and the other was from the number of the samples analysed. Themedian, the arithmetic and geometric means obtained from the first methodtend to overestimate the true values, however the median obtained by thesecond method may give a better values, because they are not influenced bythe number of determined values and detection l i m i t s .
222
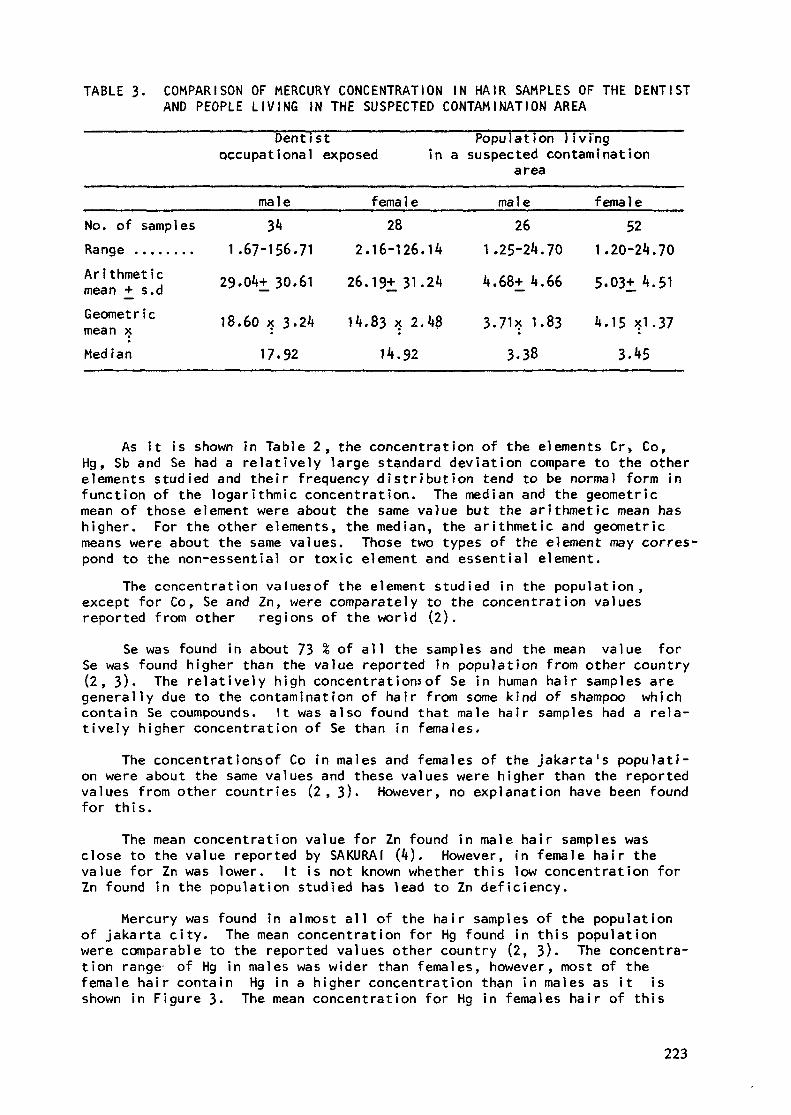
TABLE 3. COMPARISON OF MERCURY CONCENTRATION IN HAIR SAMPLES OF THE DENTISTAND PEOPLE LIVING IN THE SUSPECTED CONTAMINATION AREA
Dentistoccupational exposed
Population livi'ngin a suspected contamination
area
No. of samplesRange ........Arithmeticmean + s.dGeometricmean xMedian
male34
1 .67-156.7129. Qk+_ 30.61
18.60 x 3.2417.92
f ema 1 e28
2.16-126.1426.19+. 31.24
14.83 x 2.48•
14.92
male26
1 .25-24.704.68+4.66
3.71x 1.833.38
female52
1.20-24.705.03i4.51
4.15 *1.373.1»5
As it is shown in Table 2, the concentration of the elements Cr> Co,Hg, Sb and Se had a relatively large standard deviation compare to the otherelements studied and their frequency distribution tend to be normal form infunction of the logarithmic concentration. The median and the geometricmean of those element were about the same value but the arithmetic mean hashigher. For the other elements, the median, the arithmetic and geometricmeans were about the same values. Those two types of the element may corres-pond to the non-essential or toxic element and essential element.
The concentration valuesof the element studied in the population,except for Co, Se and Zn, were comparately to the concentration valuesreported from other regions of the world (2).
Se was found in about 73 % of all the samples and the mean value forSe was found higher than the value reported in population from other country(2, 3)- The relatively high concentrations of Se in human hair samples aregenerally due to the contamination of hair from some kind of shampoo whichcontain Se coumpounds. It was also found that male hair samples had a rela-tively higher concentration of Se than in females.
The concentrât ions of Co in males and females of the Jakarta's populati-on were about the same values and these values were higher than the reportedvalues from other countries (2, 3). However, no explanation have been foundfor this.
The mean concentration value for Zn found in male hair samples wasclose to the value reported by SAKURAI (4). However, in female hair thevalue for Zn was lower. It is not known whether this low concentration forZn found in the population studied has lead to Zn deficiency.
Mercury was found in almost all of the hair samples of the populationof Jakarta city. The mean concentration for Hg found in this populationwere comparable to the reported values other country (2, 3). The concentra-tion range of Hg in males was wider than females, however, most of thefemale hair contain Hg in a higher concentration than in males as it isshown in Figure 3- The mean concentration for Hg in females hair of this
223
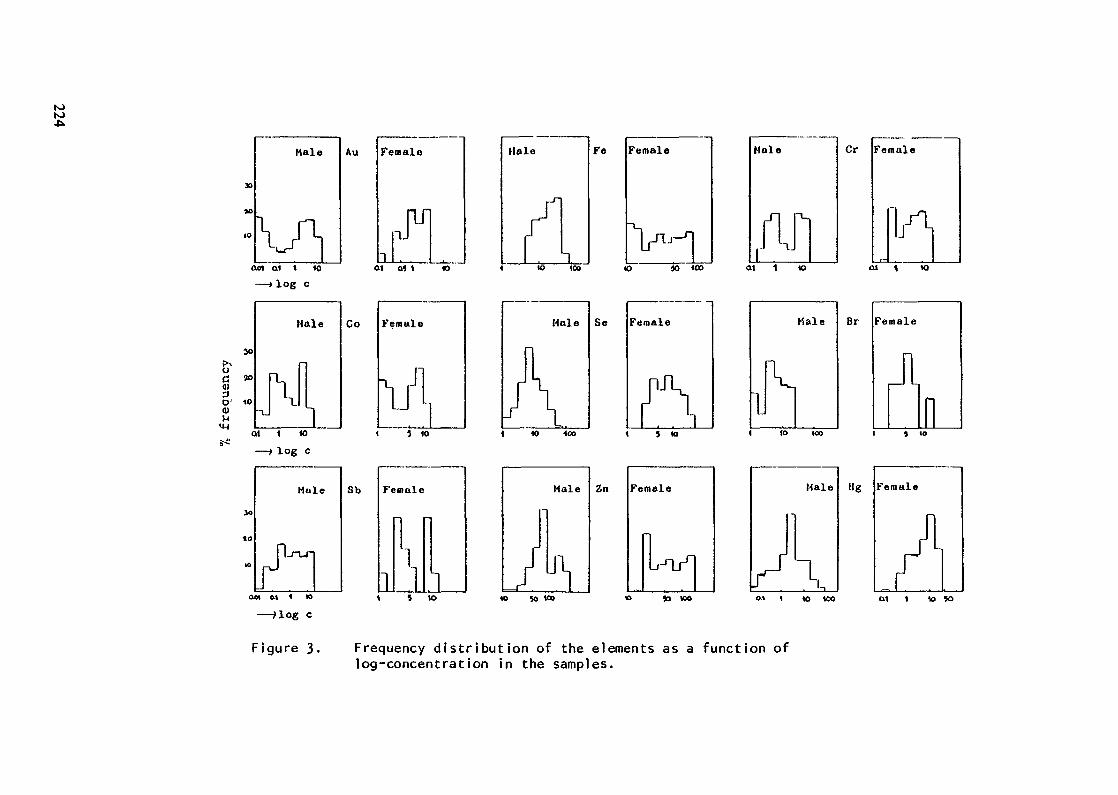
toNi
Halo Fe
10 50 103 » jo wo
to 400 tO » 100 Oll 1 «O
o.i i 10 100 ai 1 10 so
Figure 3- Frequency distribution of the elements as a function oflog-concentration in the samples.
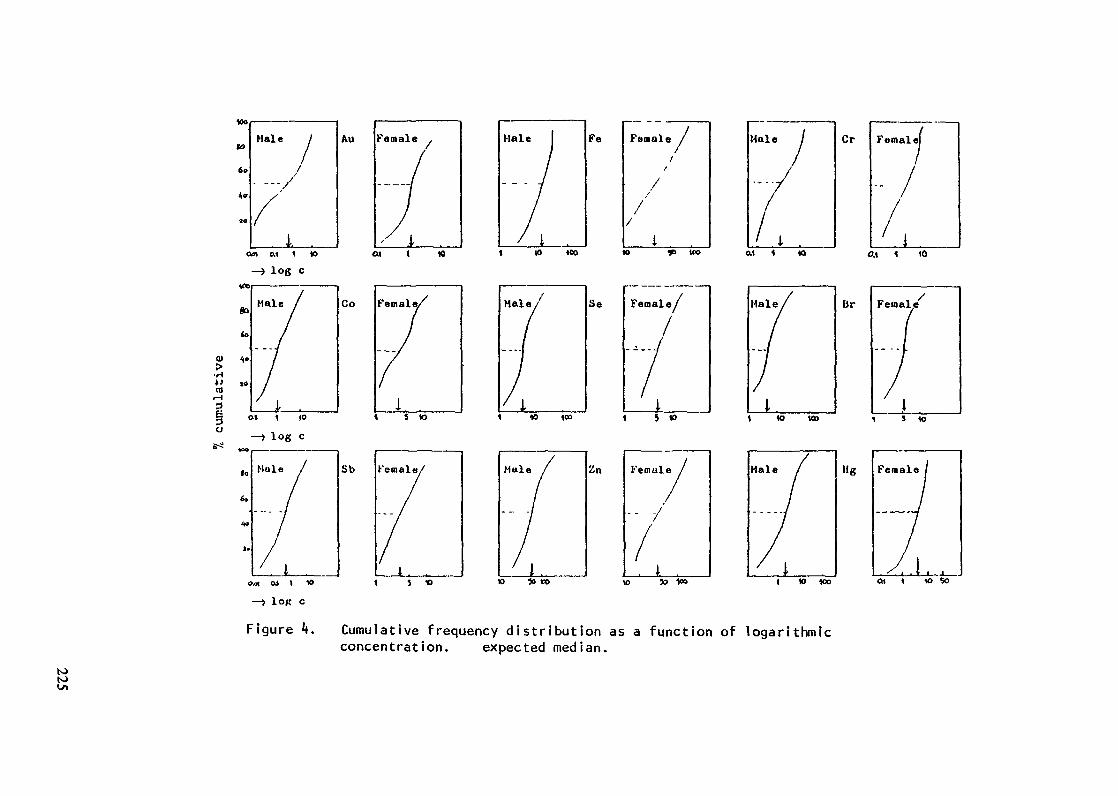
•rl»J
o^
Male
i .t 10 ICO 10 50 «O (XI 1 »O
Female
Female/
/
1 5 »
Zn Female
. iw> to *»
Male Cr Female}
/
0.\ 1 10
Feinal,
s 10
Female
1 « wo eu i «> 5o
Figure J». Cumulative frequency distribution as a function of logarithmicconcentration. expected median.
Si
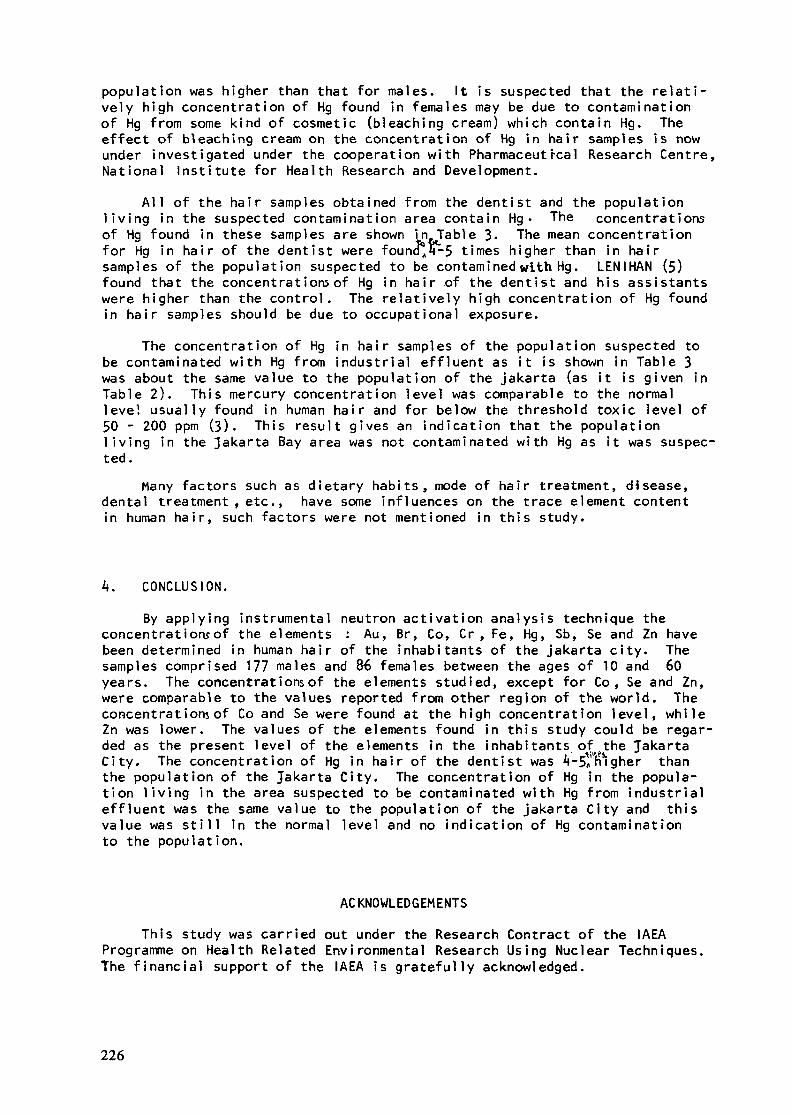
population was higher than that for males. It is suspected that the relati-vely high concentration of Hg found in females may be due to contaminationof Hg from some kind of cosmetic (bleaching cream) which contain Hg. Theeffect of bleaching cream on the concentration of Hg in hair samples is nowunder investigated under the cooperation with Pharmaceutical Research Centre,National Institute for Health Research and Development.
All of the hair samples obtained from the dentist and the populationl i v i n g in the suspected contamination area contain Hg • The concentrationsof Hg found in these samples are shown in^Table 3« The mean concentrationfor Hg in hair of the dentist were found^A-5 times higher than in hairsamples of the population suspected to be contarnined with Hg. LENIHAN (5)found that the concentrations of Hg in hair .of the dentist and his assistantswere higher than the control. The relatively high concentration of Hg foundin hair samples should be due to occupational exposure.
The concentration of Hg in hair samples of the population suspected tobe contaminated with Hg from industrial effluent as it is shown in Table 3was about the same value to the population of the Jakarta (as it is given inTable 2). This mercury concentration level was comparable to the normallevel usually found in human hair and for below the threshold toxic level of50 - 200 ppm (3). This result gives an indication that the populationl i v i n g in the Jakarta Bay area was not contaminated with Hg as it was suspec-ted.
Many factors such as dietary habits, mode of hair treatment, disease,dental treatment , etc., have some influences on the trace element contentin human hair, such factors were not mentioned in this study.
A. CONCLUSION.By applying instrumental neutron activation analysis technique the
concentrations of the elements : Au, Br, Co, Cr , Fe, Hg, Sb, Se and Zn havebeen determined in human hair of the inhabitants of the Jakarta city. Thesamples comprised 177 males and 86 females between the ages of 10 and 60years. The concentrât ions of the elements studied, except for Co, Se and Zn,were comparable to the values reported from other region of the world. Theconcentrations of Co and Se were found at the high concentration level, whileZn was lower. The values of the elements found in this study could be regar-ded as the present level of the elements in the inhabitants ofw the JakartaCity. The concentration of Hg in hair of the dentist was J»-5*higher thanthe population of the Jakarta City. The concentration of Hg in the popula-tion living in the area suspected to be contaminated with Hg from industrialeffluent was the same value to the population of the Jakarta City and thisvalue was s t i l l in the normal level and no indication of Hg contaminationto the population.
ACKNOWLEDGEMENTSThis study was carried out under the Research Contract of the IAEA
Programme on Health Related Environmental Research Using Nuclear Techniques.The financial support of the IAEA is gratefully acknowledged.
226

REFERENCES1. INTERNATIONAL ATOMIC ENERGY AGENCY, Report of the Advisory Group on
the Application of Nuclear Methods in Environmental Research, InternalDocument, IAEA/AG-53, Vienna (1976)
2 INTERNATIONAL ATOMIC ENERGY AGENCY, Activation Analysis of Hair as anindicator of contamination of Man by Environmental Pollutants, ReportIAEA/RL/50, Vienna (1978)
3. DALE W. JENKINS, Toxic Trace Metals in Mammalian Hair and Nails, theEnvironmental Monitoring and Support Laboratory - Las Vegas, U.S.Environmental Protection Agency, EPA-600 A-79-0^9, Las Vegas (1979)
it. S. SAKURAI , H. TSUNODA, M. TERAI, M. YUKAWA, K. TOMURA andM. Suzuki YASUMOTO, A study of trace element concentration in humanhair of some local population in Japan; Inhabitants of Japanese ruralarea, Nuclear Activation Techniques in the Life Sciences (Proc. of asymposium , Vienna, 1978), IAEA, Vienna, 573-580 (1979)
5. J. M. A. LEN!H\N, H. SMITH and W. HARVEY, Mercury hazard in dentalpractice : assesment and control by activation analysis, NuclearActivation Techniques in the life Sciences (Proc. of a symposium, BL6D,1972), IAEA, Vienna, 195-203 (1972).
227
Summary Report (II)
RCA REGIONAL CO-ORDINATED RESEARCH PROGRAMME ON HEALTHRELATED ENVIRONMENTAL RESEARCH USING NUCLEAR TECHNIQUES
INTRODUCTION
This programme was started by the Agency in 1978 for the purpose ofpromoting applications of nuclear-based analytical techniques in health-related environmental research. The original work-scope foresaw theestablishment of a monitoring system for screening population groups bymeans of hair analysis, with emphasis on the toxic heavy metals As, Cd,Hg, Pb and Se. Subsequently, in 1980, the work-scope was revised toemphasize the establishment of analytical competence for more generalkinds of environmental research (not only hair analysis) in each of thelaboratories concerned and its demonstration by application in pilotstudies, including the measurement of baseline values (e.g. in hair,tissues and food).
The programme was organized by the Agency within the framework ofthe Regional Co-operation Agreement for South East Asia (RCA). NewZealand was included in the programme at a time when that country wasexpected to join RCA. Iran was also included, though not an RCA country,because of the similarity of the work being carried out by the participantfrom that country.
During the lifetime of this programme, 12 different institutes from12 countries have participated in it, 8 with research contracts and 4with research agreements. Total Agency support for the programme to-datein the form of research contracts has amounted to about US$ 100,000. Thetotal costs, including those covered by the institutes themselves, areestimated to be of the order of US$ 600,000.
The first meeting of the programme was held in Bangkok, Thailand, in1978, the second meeting was held in Bombay, India, in 1981, while thethird and final meeting took place in Bangi/Kuala Lumpur, Malaysia, inNovember 1983.RESULTS AND CONCLUSIONS
All participants agreed that the research programme as a whole can,with some qualifications, be regarded as a success. They felt that ithad given a strong impetus to areas of research that otherwise might havenot been supported in their countries; many of these areas are nowregarded to be of great potential importance. In all countries of theregion there has in recent years been a considerable growth of interestin problems of environmental contamination with heavy metals such as Hg,Cd, As and Pb, and in many of these countries public interest groups andenvironmental lobbies are now very active. Many of the presentparticipants in the programme can quote examples where their work hasenabled the authorities to disprove claims about possibly injuriouslevels of toxic substances in the environment, e.g. of mercury in fish.In all such cases it was shown that environmental contamination was, ifanything, lower than in many industrialized countries, and was in anycase below levels that might be a cause for concern. The main benefitsof the programme, however, are not so tangible but are long-term in
229
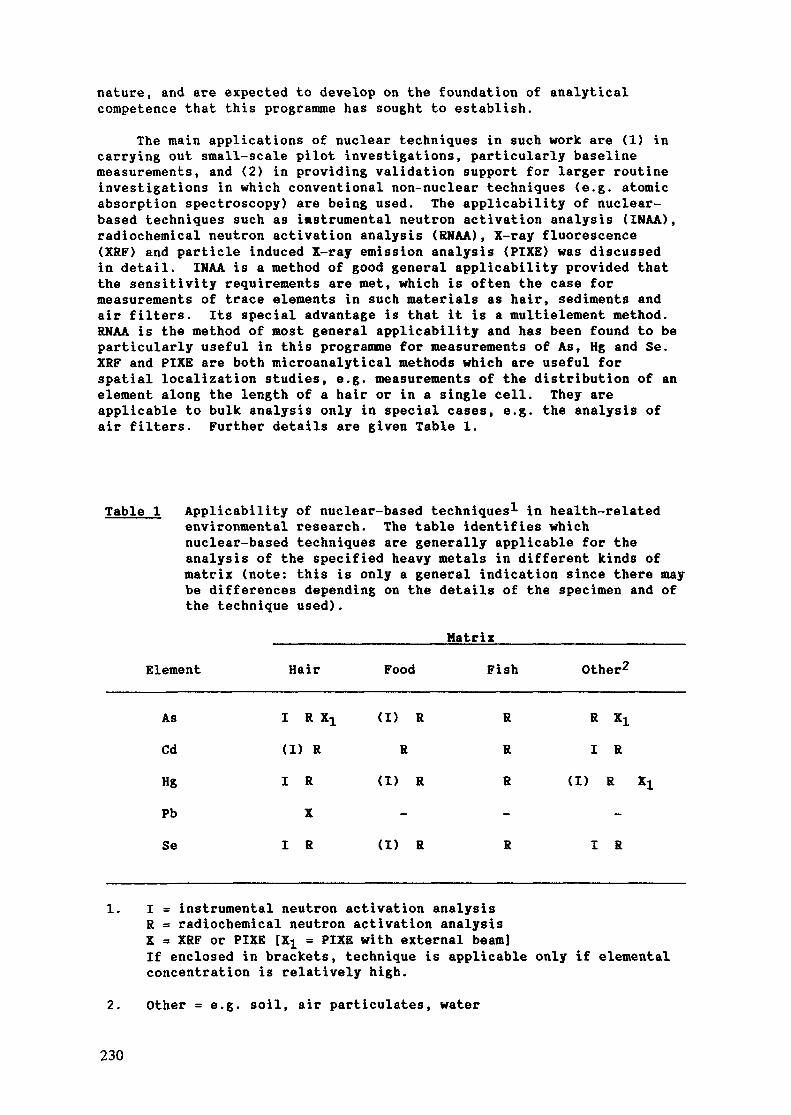
nature, and are expected to develop on the foundation of analyticalcompetence that this programme has sought to establish.
The main applications of nuclear techniques in such work are (1) incarrying out small-scale pilot investigations, particularly baselinemeasurements, and (2) in providing validation support for larger routineinvestigations in which conventional non-nuclear techniques (e.g. atomicabsorption spectroscopy) are being used. The applicability of nuclear-based techniques such as instrumental neutron activation analysis (INAA),radiochemical neutron activation analysis (RNAA), X-ray fluorescence(XRF) and particle induced X-ray emission analysis (PIXE) was discussedin detail. INAA is a method of good general applicability provided thatthe sensitivity requirements are met, which is often the case formeasurements of trace elements in such materials as hair, sediments andair filters. Its special advantage is that it is a multielement method.RNAA is the method of most general applicability and has been found to beparticularly useful in this programme for measurements of As, Hg and Se.XRF and PIXE are both microanalytical methods which are useful forspatial localization studies, e.g. measurements of the distribution of anelement along the length of a hair or in a single cell. They areapplicable to bulk analysis only in special cases, e.g. the analysis ofair filters. Further details are given Table 1.
Table 1 Applicability of nuclear-based techniques1 in health-relatedenvironmental research. The table identifies whichnuclear-based techniques are generally applicable for theanalysis of the specified heavy metals in different kinds ofmatrix (note: this is only a general indication since there maybe differences depending on the details of the specimen and ofthe technique used).
________________Matrix__________________Element Hair Food Fish Other2
As I R Xa (I) R R R Xt
Cd (DR R R I R
Hg I R (DR R (D R XxPb XSe I R (DR R I R
1. I = instrumental neutron activation analysisR = radiochemical neutron activation analysisX = XRF or PIXE [Xt = PIXE with external beam]If enclosed in brackets, technique is applicable only if elementalconcentration is relatively high.
2. Other = e.g. soil, air particulates, water
230

The analysis of hair has featured prominently in this programmeto-date, and has generally been found to be useful as a "first level"monitor of environmental contamination. For example, if theconcentration of a trace element in a specimenjjf human hair is withinthe normal range, then this is a reliable indication that contaminationis absent. If, on the other hand, the concentration is elevated, thenthis is not necessarily a proof of significant contamination but ratheran indication that other kinds of detailed investigation (generally muchmore difficult) should be carried out, e.g. of levels in blood andurine. Concentrations of trace elements in hair are known to be affectedby external factors such as shampoo use (containing Se) or localmedicines (containing Hg).
The results of the intercomparison organized by the Agency in1982/83 indicate that most of the participating laboratories still needto do additional work for at least some of the elements of interest inorder to achieve satisfactory accuracy and precision. However, some oftheir difficulties certainly stem from the fact that the choice ofintercomparison materials was not ideal. Some of the elements ofinterest were present only at a very low concentrations in the materialsprovided, and some were not even certified. Although the coordinatedresearch programme is now officially at an end, all participants agreedto do further work to improve their analytical capabilities. To this enda new quality control exercise is being organized by the Agency, using asintercomparison materials (1) human hair (from S. Ohno), (2) wool (fromN.E. Whibehead), (3) a geological material, and (4) a biological material.
With reference to the human hair reference material prepared by S.Ohno and the wool reference material prepared by N.E. Whitehead, it wasagreed that these are insufficient in quantity to justify the furtherwork that would be necessary before they could be issued as primaryreference standards. However, they will certainly be useful for thepurposes mentioned in the preceding paragraph, as well as for use byindividual laboratories as internal quality control standards. Theoriginators of these materials agreed to make them available for thesepurposes.
The need was also confirmed by the participants for a new primaryhair standard to replace the human hair reference material HH-1 that isno longer available. This should be prepared in sufficient amount(>20kg) to guarantee its availability over a period of several years tothe many laboratories (>100) on a worldwide basis that are known to beengaged in work on trace elements in hair. The Agency was stronglyrecommended to make arrangements for the preparation of such a material.
As for the future, all the participants intend to carry on withvarious kinds of health-related environmental research, and would begrateful for further support from the Agency under its research contractprogramme, either within the EGA framework, or as part of a globalcoordinated research programme. The main topic of current interest tomost of them concerns toxic heavy elements in food. A proposal wasdeveloped for a new programme on this subject having to do with themonitoring of compliance with national and international regulations onthe maximum permissible concentrations of toxic elements in humanfoodstuffs. The main purpose of this programme would be to developnuclear analytical techniques that could be used to provide validationsupport for routine monitoring programmes, or directly in small-scalepilot investigations. The participants requested the Agency to develop a
231

more detailed proposal along these lines, possibly with the help ofconsultants, with a view to implementing it in the form of a newcoordinated research programme as soon as possible.
The participants also identified a need on the part of the RCAcountries for more training in nuclear analytical techniques as appliedin health-related environmental research. The Agency was requested toinclude a proposal for such a course in its plans for 1985.
A further topic of interest to many of the participants concernssimple methods for database management and mathematical methods for theinterpretation of analytical data obtained from monitoring programmes(e.g. in the present case, of data obtained from the monitoring of toxicheavy elements in foodstuffs and human tissues). Questions arise as tohow such data should be evaluated and reported (e.g. the use of means,medians, ranges, and percent!les, and the application of tests for thesignificance of differences between several data sets). The Agency wasrequested to explore to what extent it can develop specific programmes inthese areas with a view to including this topic in future trainingcourses and offering advice to participants in coordinated researchprogrammes.
232
LIST OF PARTICIPANTS
RCA REGIONAL CO-ORDINATED RESEARCH PROGRAMME ONHEALTH-RELATED ENVIRONMENTAL RESEARCH USING NUCLEAR TECHNIQUE
Bayat, I.
Gangadharan, S.
Rapuan, F.A.S.
Khan, A.M.
Kirn, N.B.
*Kwok, San-Fong
Mongkolphantha, S.
Ohno, S.
Nuclear Research CentreAtomic Energy Organization of IranP.O.Box 11365-8486TeheranIRAN
Analytical Chemistry DivisionBhabha Atomic Research CentreTrombayBombay 400 085INDIA
Philippine Atomic Energy CommissionDon Mariano Marcos AvenueDiliman, Quezon CityP.O. Box 932ManilaPHILIPPINES
Experimental Physics DivisionAtomic Energy CentreP.O.Box 164RamnaDaccaBANGLADESH
Division of Nuclear Reactor ChemistryKorea Advanced Energy Research InstituteP.O. Box 7Cheong RyangSeoulKOREADept. of Scientific ServicesOutram RoadSingapore 0316SINGAPORE
Office of Atomic Energy For PeaceThanon Vibhavadee RangsitBangkhenBangkok-10900THAILAND
Division of Environmental HealthNational Institute of Radiological Sciences9-1, 4-ChomeAnagawa, Chiba-shiJAPAN
*No report submitted for this TECDOC
233

Sartnani, Suleiman
Wh ibehead, N . E .
Yatim, Sofyan
TechnologyNuclear Chemistry DivisionP.O. NiloreRawalpindiPAKISTAN
Department of Nuclear ScienceNational University of MalaysiaBangiSelangorMALAYSIA
Dept of Scientific & Industrial ResearchInstitute of Nuclear SciencesPrivate BagLower HuttNEW ZEALAND
National Atomic Energy AgencyPasar Jumat Research CentreP.O.Box 2Kebayoran LamaJakarta SelatanINDONESIA
IAEA SECRETARIAT Division of Life SciencesIAEAP.O. Box 100A-1400 ViennaAustria
M'Baku, S.B.(Project Officer: 1978 - 1983)
Parr, R.M.(Project Officer: 1983)Muramatsu, Y.(Project Officer: 1983 - 1984)
234
HOW TO ORDER IAEA PUBLICATIONSAn exclusive sales agent for IAEA publications, to whom all orders
and inquiries should be addressed, has been appointedin the following country:
UNITED STATES OF AMERICA UNIPUB, P.O. Box 433, Murray Hill Station, New York, NY 10157
In the following countries IAEA publications may be purchased from thesales agents or booksellers listed or through yourmajor local booksellers. Payment can be made in localcurrency or with UNESCO coupons.
ARGENTINA
AUSTRALIABELGIUM
CHILE
CZECHOSLOVAKIA
FRANCE
HUNGARY
INDIA
ISRAEL
ITALY
JAPANNETHERLANDS
PAKISTANPOLAND
ROMANIASOUTH AFRICA
SPAIN
SWEDEN
UNITED KINGDOM
U.S.S.R.YUGOSLAVIA
Comisiôn Nacional de Energi'a Atômica, Avenida del Libertador 8250,RA-1429 Buenos AiresHunter Publications, 58 A Gipps Street, Collingwood, Victoria 3066Service Courrier UNESCO, 202, Avenue du Roi, B-1060 BrusselsComisiôn Chilena de Energia Nuclear, Venta de PublicacionesAmunategui 95, Casilla 188-D, SantiagoS.N.T.L., Mikulandska 4, CS-116 86 Praha 1Alfa, Publishers, Hurbanovo némestie 3, CS-815 89 BratislavaOffice International de Documentation et Librairie, 48, rue Gay-Lussac,F-75240 Paris Cedex 05Kultura, Hungarian Foreign Trading CompanyP.O. Box 149, H-1389 Budapest 62Oxford Book and Stationery Co., 17, Park Street, Calcutta-700016Oxford Book and Stationery Co., Scindia House, New Delhi-110 001Heiliger and Co., Ltd., Scientific and Medical Books, 3, Nathan StraussStreet, Jerusalem 94227LibreriaScientifica, Dott. Lucio de Biasio "aeiou".Via Meravigli 16, 1-20123 MilanMaruzen Company, Ltd., P.O. Box 5050, 100-31 Tokyo InternationalMartinus Nijhoff B.V., Booksellers, Lange Voorhout 9-11, P.O. Box 269,NL-2501 The HagueMirza Book Agency, 65, Shahrah Quaid-e-Azam, P.O. Box 729, Lahore 3Ars Polona-Ruch, Centrala Handlu Zagranicznego,Krakowskie Przedmiescie 7, PL-00-068 Warsawllexim, P.O. Box 136-137, BucarestVan Schaik Bookstore (Pty) Ltd.,P.O. Box 724, Pretoria 0001Di'az de Santos, Lagasca 95, E-28006 MadridDi'az de Santos, Balmes 417, E-08022 BarcelonaAB Fritzes Kungl. Hovbokhandel, Fredsgatan 2, P.O. Box 16356,S-103 27 StockholmHer Majesty's Stationery Office, Publications Centre, Agency Section51 Nine Elms Lane, London SW8 5DRMezhdunarodnaya Kniga, Smolenskaya-Sennaya 32-34, Moscow G-200Jugoslovenska Knjiga, Terazije 27, P.O. Box 36, YU-11001 Belgrade
Orders from countries where sales agents have not yet been appointed andrequests for information should be addressed directly to:Division of PublicationsInternational Atomic Energy AgencyWagramerstrasse 5, P.O. Box 100, A-1400 Vienna, Austria