S.TR.E.A.M., system for trace element assessment with mosses. An equation to estimate mercury...
8
S.TR.E.A.M., system for trace element assessment with mosses. An equation to estimate mercury concentration in freshwaters Mattia Cesa a, * , Alesssandro Bizzotto b , Claudio Ferraro b , Flaminio Fumagalli a , Pier Luigi Nimis a a Department of Life Sciences, University of Trieste, via Giorgieri 10, I-34127 Trieste, Italy b A.R.P.A.V., via Cereria 15, I-36061 Bassano del Grappa (VI), Italy article info Article history: Received 21 July 2008 Received in revised form 3 January 2009 Accepted 23 January 2009 Available online 27 February 2009 Keywords: Biomonitor Bryophytes Heavy metals Pollution Stream abstract Hundred experiments of Hg bioaccumulation with the aquatic moss Rhynchostegium riparioides (Hedw.) C.E.O. Jensen transplanted under laboratory conditions were carried out with the aim of (1) measuring the metal uptake at increasing water concentrations (0.25–128 lg Hg 2+ L 1 ) and increasing exposure time (24–189 h), (2) studying the influence of pH (6.3–8.5) and water concentration of Na (3– 114 mg L 1 ), Ca (62–125 mg L 1 ) and Mg (13–54 mg L 1 ) on the metal uptake, (3) achieving a database for mathematical and statistical elaborations, and, (4) producing an equation modelling the uptake. A lin- ear uptake was observed for water concentrations 64 lg Hg 2+ L 1 , while a saturation curve was observed at higher concentrations. Uptake followed a 3-stage trend for increasing exposure times: a phase of rapid accumulation (4–5 d), followed by an equilibrium plateau (2–3 d) and then by a second accumulation phase. The factor influence study revealed that variations in pH or water concentration of alkaline metals, within the range of typical values in freshwaters of NE Italy, did not produce significant differences (p > 0.05) in the Hg uptake ratio (0.496 10 5 6 Bio Accumulation Factor 6 1.73 10 5 ). From a database of 28 Hg concentrations in mosses exposed to 0.25–4 lg Hg 2+ L 1 for 24–114 h, a mathematical equation was produced, to assess Hg micro-contamination in water. The difference between predicted and real concentration was generally included in the range ± 50%. Ó 2009 Elsevier Ltd. All rights reserved. 1. Introduction In the last 35 years, aquatic mosses and liverworts have been widely employed as biomonitors of trace element pollution in freshwaters (Whitton, 2003), due to their ability of accumulating large amounts of trace elements like heavy metals (Empain, 1973; Wehr and Whitton, 1983; Mouvet, 1986; Lopez and Carballeira, 1993; Carballeira and Lopez, 1997; García et al., 2000; Yurukova and Gecheva, 2004) and radionuclides (Vray et al., 1992; Mersch and Kass, 1994; Beaugelin-Seiller et al., 1995). These plants are sup- plied with anionic chemical groups on the cell wall, which act as non-selective binding (or exchange) sites for micronutrients and elements in the cationic form (Clymo, 1963; Pickering and Puia, 1969; Haseloff and Winkler, 1980; Breuer and Melzer, 1990; Brown and Bates, 1990). In the short term (a few hours or days after the water contamination has started), uptake occurs with passive, rapid and reversible mechanisms of adsorption, which involve the extra- cellular compartment and are mainly dependent on the exposure time and the concentration in water (Mouvet, 1985; Kelly et al., 1987; Brown and Wells, 1990; Mouvet and Claveri, 1999). These properties are exploited in the transfer technique called ‘‘moss bags”, which consists of transplanting a moss from a relatively unpolluted spring to the survey area by using a net or other perme- able supports. Transplanted mosses are considered among the best tools for trace element assessment in freshwaters (Mouvet, 1986; Kelly et al., 1987; Mersch and Claveri, 1998) and were successfully used to monitor both chronic and intermittent pollution (Siebert et al., 1996; Mersch and Reichard, 1998; Rasmussen and Andersen, 1999; Lee et al., 2002; Yurukova and Gecheva, 2003). Several works focused on the processes of trace element up- take/release by the cells of mosses and liverworts, both under lab- oratory conditions (Mouvet et al., 1985; Mersch et al., 1993b; Claveri and Mouvet, 1995; Claveri et al., 1995; Carballeira et al., 1998; Gagnon et al., 1998; Cenci, 2000; Martinez et al., 2003; Nuñez et al., 2004; Bleuel et al., 2005; Davies, 2007) and in the field (Mouvet, 1984; Wehr et al., 1987; Martinez et al., 1993; Mersch et al., 1993a; Bruns et al.,1995, 1997; Vàzquez et al., 2000; Carbal- leira et al., 2001; Figueira and Ribeiro, 2005). These studies shed light on the role of several factors: Chemical (water hardness, salinity, pH, concentration of cations, anions or chelating agents); the increase in water concentration of cationic species generally induces competition among trace metals and the other cations for the binding sites during the adsorption phase. 0045-6535/$ - see front matter Ó 2009 Elsevier Ltd. All rights reserved. doi:10.1016/j.chemosphere.2009.01.074 * Corresponding author. Tel.: +39 040 558 3884; fax: +39 040 568855. E-mail address: [email protected] (M. Cesa). Chemosphere 75 (2009) 858–865 Contents lists available at ScienceDirect Chemosphere journal homepage: www.elsevier.com/locate/chemosphere
-
Upload
independent -
Category
Documents
-
view
0 -
download
0
Transcript of S.TR.E.A.M., system for trace element assessment with mosses. An equation to estimate mercury...
Chemosphere 75 (2009) 858–865
Contents lists available at ScienceDirect
Chemosphere
journal homepage: www.elsevier .com/locate /chemosphere
S.TR.E.A.M., system for trace element assessment with mosses. An equationto estimate mercury concentration in freshwaters
Mattia Cesa a,*, Alesssandro Bizzotto b, Claudio Ferraro b, Flaminio Fumagalli a, Pier Luigi Nimis a
a Department of Life Sciences, University of Trieste, via Giorgieri 10, I-34127 Trieste, Italyb A.R.P.A.V., via Cereria 15, I-36061 Bassano del Grappa (VI), Italy
a r t i c l e i n f o
Article history:Received 21 July 2008Received in revised form 3 January 2009Accepted 23 January 2009Available online 27 February 2009
Keywords:BiomonitorBryophytesHeavy metalsPollutionStream
0045-6535/$ - see front matter � 2009 Elsevier Ltd. Adoi:10.1016/j.chemosphere.2009.01.074
* Corresponding author. Tel.: +39 040 558 3884; faE-mail address: [email protected] (M. Cesa).
a b s t r a c t
Hundred experiments of Hg bioaccumulation with the aquatic moss Rhynchostegium riparioides (Hedw.)C.E.O. Jensen transplanted under laboratory conditions were carried out with the aim of (1) measuringthe metal uptake at increasing water concentrations (0.25–128 lg Hg2+ L�1) and increasing exposuretime (24–189 h), (2) studying the influence of pH (6.3–8.5) and water concentration of Na (3–114 mg L�1), Ca (62–125 mg L�1) and Mg (13–54 mg L�1) on the metal uptake, (3) achieving a databasefor mathematical and statistical elaborations, and, (4) producing an equation modelling the uptake. A lin-ear uptake was observed for water concentrations 64 lg Hg2+ L�1, while a saturation curve was observedat higher concentrations. Uptake followed a 3-stage trend for increasing exposure times: a phase of rapidaccumulation (4–5 d), followed by an equilibrium plateau (2–3 d) and then by a second accumulationphase. The factor influence study revealed that variations in pH or water concentration of alkaline metals,within the range of typical values in freshwaters of NE Italy, did not produce significant differences(p > 0.05) in the Hg uptake ratio (0.496 � 105
6 Bio Accumulation Factor 6 1.73 � 105). From a databaseof 28 Hg concentrations in mosses exposed to 0.25–4 lg Hg2+ L�1 for 24–114 h, a mathematical equationwas produced, to assess Hg micro-contamination in water. The difference between predicted and realconcentration was generally included in the range ± 50%.
� 2009 Elsevier Ltd. All rights reserved.
1. Introduction
In the last 35 years, aquatic mosses and liverworts have beenwidely employed as biomonitors of trace element pollution infreshwaters (Whitton, 2003), due to their ability of accumulatinglarge amounts of trace elements like heavy metals (Empain, 1973;Wehr and Whitton, 1983; Mouvet, 1986; Lopez and Carballeira,1993; Carballeira and Lopez, 1997; García et al., 2000; Yurukovaand Gecheva, 2004) and radionuclides (Vray et al., 1992; Merschand Kass, 1994; Beaugelin-Seiller et al., 1995). These plants are sup-plied with anionic chemical groups on the cell wall, which act asnon-selective binding (or exchange) sites for micronutrients andelements in the cationic form (Clymo, 1963; Pickering and Puia,1969; Haseloff and Winkler, 1980; Breuer and Melzer, 1990; Brownand Bates, 1990). In the short term (a few hours or days after thewater contamination has started), uptake occurs with passive, rapidand reversible mechanisms of adsorption, which involve the extra-cellular compartment and are mainly dependent on the exposuretime and the concentration in water (Mouvet, 1985; Kelly et al.,1987; Brown and Wells, 1990; Mouvet and Claveri, 1999). Theseproperties are exploited in the transfer technique called ‘‘moss
ll rights reserved.
x: +39 040 568855.
bags”, which consists of transplanting a moss from a relativelyunpolluted spring to the survey area by using a net or other perme-able supports. Transplanted mosses are considered among the besttools for trace element assessment in freshwaters (Mouvet, 1986;Kelly et al., 1987; Mersch and Claveri, 1998) and were successfullyused to monitor both chronic and intermittent pollution (Siebertet al., 1996; Mersch and Reichard, 1998; Rasmussen and Andersen,1999; Lee et al., 2002; Yurukova and Gecheva, 2003).
Several works focused on the processes of trace element up-take/release by the cells of mosses and liverworts, both under lab-oratory conditions (Mouvet et al., 1985; Mersch et al., 1993b;Claveri and Mouvet, 1995; Claveri et al., 1995; Carballeira et al.,1998; Gagnon et al., 1998; Cenci, 2000; Martinez et al., 2003;Nuñez et al., 2004; Bleuel et al., 2005; Davies, 2007) and in the field(Mouvet, 1984; Wehr et al., 1987; Martinez et al., 1993; Merschet al., 1993a; Bruns et al.,1995, 1997; Vàzquez et al., 2000; Carbal-leira et al., 2001; Figueira and Ribeiro, 2005). These studies shedlight on the role of several factors:
� Chemical (water hardness, salinity, pH, concentration of cations,anions or chelating agents); the increase in water concentrationof cationic species generally induces competition among tracemetals and the other cations for the binding sites during theadsorption phase.
M. Cesa et al. / Chemosphere 75 (2009) 858–865 859
� Physical (time, temperature, UVB radiation); these variablesmight influence both the adsorption kinetics and the active pro-cesses of bioaccumulation (absorption).
� Physiological, involved in trans-membrane transport, intracellu-lar storage and detoxification processes.
Some authors tried to model the 2-compartment exchangekinetics in Scapania undulata, Fontinalis antipyretica and Fissidenspolyphyllus exposed to 1–200 lg L�1 of bivalent Cd, Co, Cu, Ni, Pbor Zn for 60 min (Vàzquez et al., 1999) and in Rhynchostegium ripa-rioides exposed to 1–5 mg L�1 of Zn2+ for 144 h (Martins andBoaventura, 2002) or to 42-342 lg L�1 of Cu2+ for 1–168 h (Claveriet al., 1994) under laboratory conditions. The former authors evendeveloped a methodology for the assessment of accidental Cu pol-lution using R. riparioides: thanks to specific sampling strategiesand calculations, the mathematical model would be able to predictthe most probable scenarios which have caused the pollutionevent. To our knowledge, this work is unique of its kind, since mossbags provide more than a simple indication, as a biomonitor shoulddo, but also data comparable to instrumental measures in water(retrospective assessment).
Within the three-years Project ‘‘Vicenza Moss Bags” (Cesa,2008) we wanted to test this particular ability of aquatic mossesin NE Italy, a region characterised by an intense development ofindustrial and urban areas. Serious environmental problems derivefrom dispersed and not-censed wastes of trace elements, whichhave often caused freshwater, soil, and water-table pollution. Thespatial and temporal pattern of such events, otherwise not detect-able by sporadic analyses on water samples, was described by theuse of moss bags (Cesa et al., 2006).
Among the 11 trace elements we studied under laboratory con-ditions during a recent experiment (Al, As, Cd, Cr, Cu, Fe, Hg, Mn,Ni, Pb and Zn; Cesa et al., 2008), mercury presented the best qual-ifications for providing an uptake model similar to that of Claveriet al. (1994):
� It shows one of the highest uptake ratios: the Bio ConcentrationFactor – BCF – of Hg in R. riparioides exposed to 0.04 lM for 7 dreached 105 (together with Cr), unlike those of other elements,which ranged from 102 and 104.
� The final Hg concentration in R. riparioides exposed to 0.04–4 lM for 7 d was only slightly influenced by trace element inter-actions: mosses were exposed to different concentrations of 11trace elements, according to a saturated fractional factorialdesign, with the aim of measuring the main effects and first-order interactions of influent factors. The multiple regressionmodel showed that interactions among elements exist andinduce both antagonism and synergism, but the effects on Cdand Hg accumulation are relatively weak.
Apart from these technical aspects, Hg plays a particularly rele-vant role as a pollutant: it may cause serious and non-reversiblediseases to animal and human beings, especially through the bio-magnification of the methylated form (Brambati, 1997; Clarckson,1997; Morel et al., 1998). Furthermore, Hg concentrations in fresh-waters are often below the instrumental detection limits, leadingto latent micro-contamination of rivers and soils.
To our knowledge, no laboratory studies on Hg uptake in aqua-tic bryophytes appear in the European literature, excepting a bioas-say carried out in Poland (Samecka-Cymerman and Kempers,1995), which aimed at evaluating the lethal effects of mercury inthe liverwort Scapania undulata. Authors also measured the finalconcentration in bryophytes after a 14 d exposure to solutions con-taining 64, 128, 256, 512, 1024 lg Hg2+ L�1, and observed thataccumulation rate (1) could considerably change, depending onthe population the liverworts were chosen from, and (2) could in-
crease in dead plants, probably resulting from the degeneration ofthe plasmalemma exposing new exchange sites. Unfortunately, re-sults cannot be compared to those of our studies, since S. undulatashowed a BCF (�103) much lower than R. riparioides (�105) did, theexposure time was considerably longer and bryophytes were notcollected from a single place.
The present study aimed at modelling the uptake of Hg in mossbags of R. riparioides at the typical water conditions of rivers in NEItaly. In particular, we aimed at:
(1) Measuring the uptake at increasing concentrations in water(with special regard for those below the commonest instru-mental detection limits) and increasing exposure time.
(2) Studying the influence of pH and Na, Ca and Mg concentra-tions on uptake.
(3) Achieving a database for mathematical and statisticalelaborations.
(4) Producing an equation able to estimate the mean concentra-tion of Hg in the water during biomonitoring surveys
2. Material and methods
Submerged tufts of Rhynchostegium riparioides (Hedw.) C.E.O.Jensen (= Platyhypnidium riparioides (Hedw.) Dixon) were collectedfrom the uncontaminated springs of River Meschio (Province ofTreviso), from a site where water is always running and deep en-ough to ensure the total immersion throughout the year (Wehret al., 1983; Kelly et al., 1987; Mersch and Claveri, 1998). The mossbranches were rinsed in the water of the spring, to remove organicparticles, mud and sand, and then homogenised. Moss bags con-taining 20–30 g of moist material and made of a plastic net(4 mm holes) were transported to the laboratory for experimenta-tion within a few hours. Some chemical–physical parameters (notthe water temperature) have been monthly measured by the localEnvironmental Agency in 2006: pH 7.7 ± 0.2, conductivity245 ± 9 lS cm�1, dissolved Na 0.89 ± 0.37 mg L�1, K 0.42 ± 0.13mg L�1, Ca 50.6 ± 15.9 mg L�1, Mg 5.27 ± 2.50 mg L�1 (mean ± st.dev.).
2.1. Experimental design
4 work sessions were carried out at the A.R.P.A.V. laboratory ofBassano del Grappa (Province of Vicenza):
1. Forty preliminary observations (from November 2006 to Janu-ary 2007) on Hg uptake at increasing water concentrations(0.25–128 lg Hg2+ L�1) and increasing exposure time (26–168 h).
2. A factor influence study (55 experiments, from March 2007 toSeptember 2007) for the main chemical variables supposed toaffect uptake within the first 5 d: pH (6.3–8.5) and water con-centration of Na (5, 50, 100 mg L�1), Ca (65, 130 mg L�1) andMg (15, 45 mg L�1).
3. Five final experiments (December 2007) under the best condi-tions tested (0.25–4 lg Hg2+ L�1 in water, 24–120 h of expo-sure) to achieve a database.
4. Data elaboration to produce the uptake equation.
2.2. Experimental apparatus
The experimental apparatus is a water flow system, a crystalaquarium with five independent basins (25 � 50 � 40 cm), whichreceives a continuous input of non chlorinated tap water
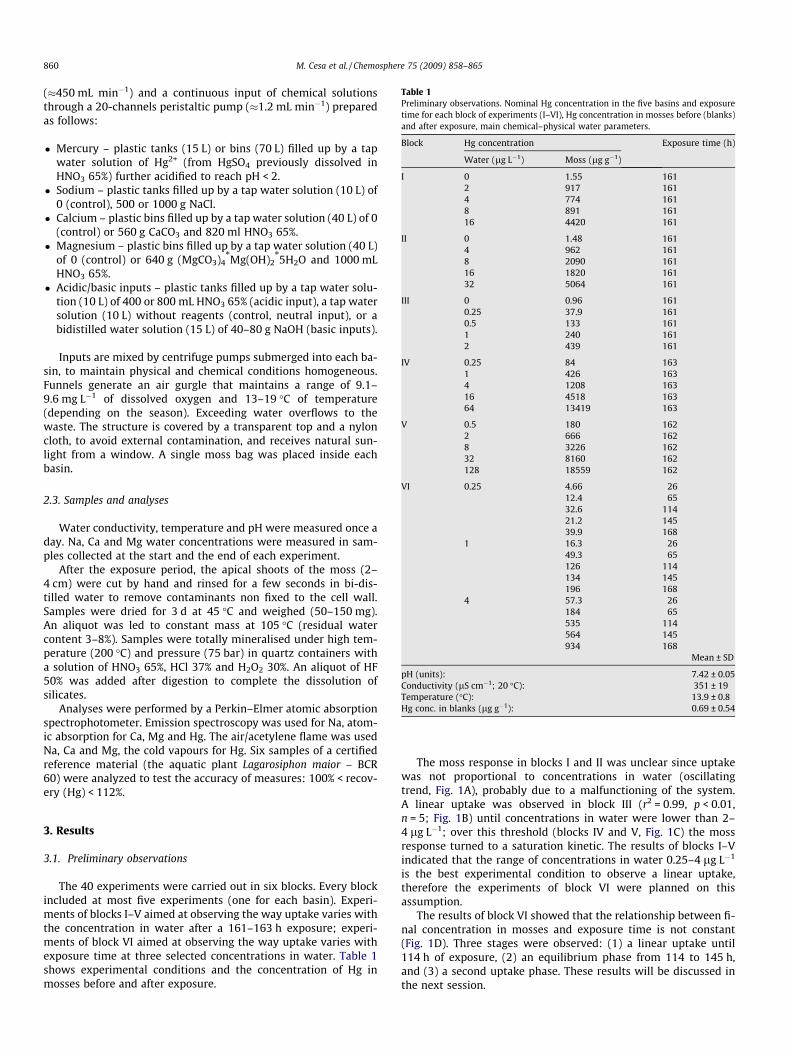
Table 1Preliminary observations. Nominal Hg concentration in the five basins and exposuretime for each block of experiments (I–VI), Hg concentration in mosses before (blanks)and after exposure, main chemical–physical water parameters.
Block Hg concentration Exposure time (h)
Water (lg L�1) Moss (lg g�1)
I 0 1.55 1612 917 1614 774 1618 891 16116 4420 161
II 0 1.48 1614 962 1618 2090 16116 1820 16132 5064 161
III 0 0.96 1610.25 37.9 1610.5 133 1611 240 1612 439 161
IV 0.25 84 1631 426 1634 1208 16316 4518 16364 13419 163
V 0.5 180 1622 666 1628 3226 16232 8160 162128 18559 162
VI 0.25 4.66 2612.4 6532.6 11421.2 14539.9 168
1 16.3 2649.3 65126 114134 145196 168
4 57.3 26184 65535 114564 145934 168
Mean ± SD
pH (units): 7.42 ± 0.05Conductivity (lS cm�1; 20 �C): 351 ± 19Temperature (�C): 13.9 ± 0.8Hg conc. in blanks (lg g�1): 0.69 ± 0.54
860 M. Cesa et al. / Chemosphere 75 (2009) 858–865
(�450 mL min�1) and a continuous input of chemical solutionsthrough a 20-channels peristaltic pump (�1.2 mL min�1) preparedas follows:
� Mercury – plastic tanks (15 L) or bins (70 L) filled up by a tapwater solution of Hg2+ (from HgSO4 previously dissolved inHNO3 65%) further acidified to reach pH < 2.
� Sodium – plastic tanks filled up by a tap water solution (10 L) of0 (control), 500 or 1000 g NaCl.
� Calcium – plastic bins filled up by a tap water solution (40 L) of 0(control) or 560 g CaCO3 and 820 ml HNO3 65%.
� Magnesium – plastic bins filled up by a tap water solution (40 L)of 0 (control) or 640 g (MgCO3)4
*Mg(OH)2*5H2O and 1000 mL
HNO3 65%.� Acidic/basic inputs – plastic tanks filled up by a tap water solu-
tion (10 L) of 400 or 800 mL HNO3 65% (acidic input), a tap watersolution (10 L) without reagents (control, neutral input), or abidistilled water solution (15 L) of 40–80 g NaOH (basic inputs).
Inputs are mixed by centrifuge pumps submerged into each ba-sin, to maintain physical and chemical conditions homogeneous.Funnels generate an air gurgle that maintains a range of 9.1–9.6 mg L�1 of dissolved oxygen and 13–19 �C of temperature(depending on the season). Exceeding water overflows to thewaste. The structure is covered by a transparent top and a nyloncloth, to avoid external contamination, and receives natural sun-light from a window. A single moss bag was placed inside eachbasin.
2.3. Samples and analyses
Water conductivity, temperature and pH were measured once aday. Na, Ca and Mg water concentrations were measured in sam-ples collected at the start and the end of each experiment.
After the exposure period, the apical shoots of the moss (2–4 cm) were cut by hand and rinsed for a few seconds in bi-dis-tilled water to remove contaminants non fixed to the cell wall.Samples were dried for 3 d at 45 �C and weighed (50–150 mg).An aliquot was led to constant mass at 105 �C (residual watercontent 3–8%). Samples were totally mineralised under high tem-perature (200 �C) and pressure (75 bar) in quartz containers witha solution of HNO3 65%, HCl 37% and H2O2 30%. An aliquot of HF50% was added after digestion to complete the dissolution ofsilicates.
Analyses were performed by a Perkin–Elmer atomic absorptionspectrophotometer. Emission spectroscopy was used for Na, atom-ic absorption for Ca, Mg and Hg. The air/acetylene flame was usedNa, Ca and Mg, the cold vapours for Hg. Six samples of a certifiedreference material (the aquatic plant Lagarosiphon maior – BCR60) were analyzed to test the accuracy of measures: 100% < recov-ery (Hg) < 112%.
3. Results
3.1. Preliminary observations
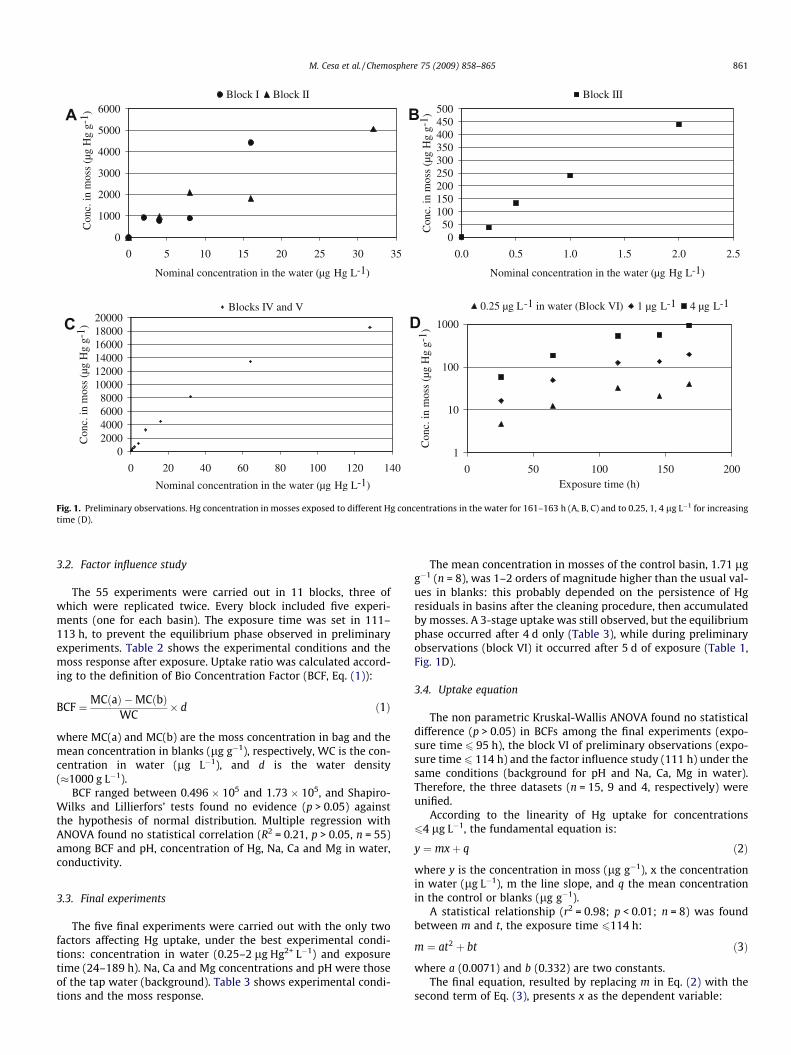
The 40 experiments were carried out in six blocks. Every blockincluded at most five experiments (one for each basin). Experi-ments of blocks I–V aimed at observing the way uptake varies withthe concentration in water after a 161–163 h exposure; experi-ments of block VI aimed at observing the way uptake varies withexposure time at three selected concentrations in water. Table 1shows experimental conditions and the concentration of Hg inmosses before and after exposure.
The moss response in blocks I and II was unclear since uptakewas not proportional to concentrations in water (oscillatingtrend, Fig. 1A), probably due to a malfunctioning of the system.A linear uptake was observed in block III (r2 = 0.99, p < 0.01,n = 5; Fig. 1B) until concentrations in water were lower than 2–4 lg L�1; over this threshold (blocks IV and V, Fig. 1C) the mossresponse turned to a saturation kinetic. The results of blocks I–Vindicated that the range of concentrations in water 0.25–4 lg L�1
is the best experimental condition to observe a linear uptake,therefore the experiments of block VI were planned on thisassumption.
The results of block VI showed that the relationship between fi-nal concentration in mosses and exposure time is not constant(Fig. 1D). Three stages were observed: (1) a linear uptake until114 h of exposure, (2) an equilibrium phase from 114 to 145 h,and (3) a second uptake phase. These results will be discussed inthe next session.
0
1000
2000
3000
4000
5000
6000
0 5 10 15 20 25 30 35
Nominal concentration in the water (µg Hg L-1)
Con
c. in
mos
s (µ
g H
g g-
1 )Block I Block II
050
100150200250300350400450500
0.0 0.5 1.0 1.5 2.0 2.5
Nominal concentration in the water (µg Hg L-1)
Con
c. in
mos
s (µ
g H
g g-
1 )
Block III
02000400060008000
100001200014000160001800020000
0 20 40 60 80 100 120 140
Nominal concentration in the water (µg Hg L-1)
Con
c. in
mos
s (µ
g H
g g-
1 )
Blocks IV and V
1
10
100
1000
0 50 100 150 200Exposure time (h)
Con
c. in
mos
s (µ
g H
g g-
1 )
0.25 µg L-1 in water (Block VI) 1 µg L-1 4 µg L-1
A B
C D
Fig. 1. Preliminary observations. Hg concentration in mosses exposed to different Hg concentrations in the water for 161–163 h (A, B, C) and to 0.25, 1, 4 lg L�1 for increasingtime (D).
M. Cesa et al. / Chemosphere 75 (2009) 858–865 861
3.2. Factor influence study
The 55 experiments were carried out in 11 blocks, three ofwhich were replicated twice. Every block included five experi-ments (one for each basin). The exposure time was set in 111–113 h, to prevent the equilibrium phase observed in preliminaryexperiments. Table 2 shows the experimental conditions and themoss response after exposure. Uptake ratio was calculated accord-ing to the definition of Bio Concentration Factor (BCF, Eq. (1)):
BCF ¼ MCðaÞ �MCðbÞWC
� d ð1Þ
where MC(a) and MC(b) are the moss concentration in bag and themean concentration in blanks (lg g�1), respectively, WC is the con-centration in water (lg L�1), and d is the water density(�1000 g L�1).
BCF ranged between 0.496 � 105 and 1.73 � 105, and Shapiro-Wilks and Lillierfors’ tests found no evidence (p > 0.05) againstthe hypothesis of normal distribution. Multiple regression withANOVA found no statistical correlation (R2 = 0.21, p > 0.05, n = 55)among BCF and pH, concentration of Hg, Na, Ca and Mg in water,conductivity.
3.3. Final experiments
The five final experiments were carried out with the only twofactors affecting Hg uptake, under the best experimental condi-tions: concentration in water (0.25–2 lg Hg2+ L�1) and exposuretime (24–189 h). Na, Ca and Mg concentrations and pH were thoseof the tap water (background). Table 3 shows experimental condi-tions and the moss response.
The mean concentration in mosses of the control basin, 1.71 lgg�1 (n = 8), was 1–2 orders of magnitude higher than the usual val-ues in blanks: this probably depended on the persistence of Hgresiduals in basins after the cleaning procedure, then accumulatedby mosses. A 3-stage uptake was still observed, but the equilibriumphase occurred after 4 d only (Table 3), while during preliminaryobservations (block VI) it occurred after 5 d of exposure (Table 1,Fig. 1D).
3.4. Uptake equation
The non parametric Kruskal-Wallis ANOVA found no statisticaldifference (p > 0.05) in BCFs among the final experiments (expo-sure time 6 95 h), the block VI of preliminary observations (expo-sure time 6 114 h) and the factor influence study (111 h) under thesame conditions (background for pH and Na, Ca, Mg in water).Therefore, the three datasets (n = 15, 9 and 4, respectively) wereunified.
According to the linearity of Hg uptake for concentrations64 lg L�1, the fundamental equation is:
y ¼ mxþ q ð2Þ
where y is the concentration in moss (lg g�1), x the concentrationin water (lg L�1), m the line slope, and q the mean concentrationin the control or blanks (lg g�1).
A statistical relationship (r2 = 0.98; p < 0.01; n = 8) was foundbetween m and t, the exposure time 6114 h:
m ¼ at2 þ bt ð3Þ
where a (0.0071) and b (0.332) are two constants.The final equation, resulted by replacing m in Eq. (2) with the
second term of Eq. (3), presents x as the dependent variable:
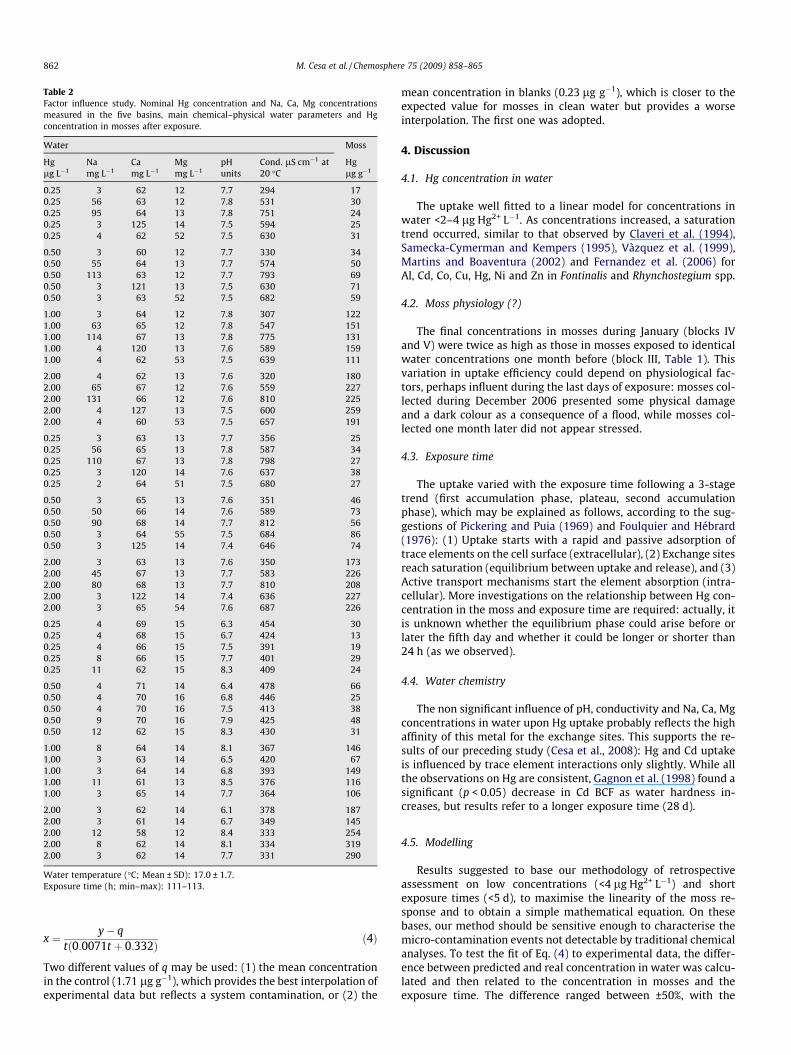
Table 2Factor influence study. Nominal Hg concentration and Na, Ca, Mg concentrationsmeasured in the five basins, main chemical–physical water parameters and Hgconcentration in mosses after exposure.
Water Moss
Hglg L�1
Namg L�1
Camg L�1
Mgmg L�1
pHunits
Cond. lS cm�1 at20 �C
Hglg g�1
0.25 3 62 12 7.7 294 170.25 56 63 12 7.8 531 300.25 95 64 13 7.8 751 240.25 3 125 14 7.5 594 250.25 4 62 52 7.5 630 31
0.50 3 60 12 7.7 330 340.50 55 64 13 7.7 574 500.50 113 63 12 7.7 793 690.50 3 121 13 7.5 630 710.50 3 63 52 7.5 682 59
1.00 3 64 12 7.8 307 1221.00 63 65 12 7.8 547 1511.00 114 67 13 7.8 775 1311.00 4 120 13 7.6 589 1591.00 4 62 53 7.5 639 111
2.00 4 62 13 7.6 320 1802.00 65 67 12 7.6 559 2272.00 131 66 12 7.6 810 2252.00 4 127 13 7.5 600 2592.00 4 60 53 7.5 657 191
0.25 3 63 13 7.7 356 250.25 56 65 13 7.8 587 340.25 110 67 13 7.8 798 270.25 3 120 14 7.6 637 380.25 2 64 51 7.5 680 27
0.50 3 65 13 7.6 351 460.50 50 66 14 7.6 589 730.50 90 68 14 7.7 812 560.50 3 64 55 7.5 684 860.50 3 125 14 7.4 646 74
2.00 3 63 13 7.6 350 1732.00 45 67 13 7.7 583 2262.00 80 68 13 7.7 810 2082.00 3 122 14 7.4 636 2272.00 3 65 54 7.6 687 226
0.25 4 69 15 6.3 454 300.25 4 68 15 6.7 424 130.25 4 66 15 7.5 391 190.25 8 66 15 7.7 401 290.25 11 62 15 8.3 409 24
0.50 4 71 14 6.4 478 660.50 4 70 16 6.8 446 250.50 4 70 16 7.5 413 380.50 9 70 16 7.9 425 480.50 12 62 15 8.3 430 31
1.00 8 64 14 8.1 367 1461.00 3 63 14 6.5 420 671.00 3 64 14 6.8 393 1491.00 11 61 13 8.5 376 1161.00 3 65 14 7.7 364 106
2.00 3 62 14 6.1 378 1872.00 3 61 14 6.7 349 1452.00 12 58 12 8.4 333 2542.00 8 62 14 8.1 334 3192.00 3 62 14 7.7 331 290
Water temperature (�C; Mean ± SD): 17.0 ± 1.7.Exposure time (h; min–max): 111–113.
862 M. Cesa et al. / Chemosphere 75 (2009) 858–865
x ¼ y� qtð0:0071t þ 0:332Þ ð4Þ
Two different values of q may be used: (1) the mean concentrationin the control (1.71 lg g�1), which provides the best interpolation ofexperimental data but reflects a system contamination, or (2) the
mean concentration in blanks (0.23 lg g�1), which is closer to theexpected value for mosses in clean water but provides a worseinterpolation. The first one was adopted.
4. Discussion
4.1. Hg concentration in water
The uptake well fitted to a linear model for concentrations inwater <2–4 lg Hg2+ L�1. As concentrations increased, a saturationtrend occurred, similar to that observed by Claveri et al. (1994),Samecka-Cymerman and Kempers (1995), Vàzquez et al. (1999),Martins and Boaventura (2002) and Fernandez et al. (2006) forAl, Cd, Co, Cu, Hg, Ni and Zn in Fontinalis and Rhynchostegium spp.
4.2. Moss physiology (?)
The final concentrations in mosses during January (blocks IVand V) were twice as high as those in mosses exposed to identicalwater concentrations one month before (block III, Table 1). Thisvariation in uptake efficiency could depend on physiological fac-tors, perhaps influent during the last days of exposure: mosses col-lected during December 2006 presented some physical damageand a dark colour as a consequence of a flood, while mosses col-lected one month later did not appear stressed.
4.3. Exposure time
The uptake varied with the exposure time following a 3-stagetrend (first accumulation phase, plateau, second accumulationphase), which may be explained as follows, according to the sug-gestions of Pickering and Puia (1969) and Foulquier and Hébrard(1976): (1) Uptake starts with a rapid and passive adsorption oftrace elements on the cell surface (extracellular), (2) Exchange sitesreach saturation (equilibrium between uptake and release), and (3)Active transport mechanisms start the element absorption (intra-cellular). More investigations on the relationship between Hg con-centration in the moss and exposure time are required: actually, itis unknown whether the equilibrium phase could arise before orlater the fifth day and whether it could be longer or shorter than24 h (as we observed).
4.4. Water chemistry
The non significant influence of pH, conductivity and Na, Ca, Mgconcentrations in water upon Hg uptake probably reflects the highaffinity of this metal for the exchange sites. This supports the re-sults of our preceding study (Cesa et al., 2008): Hg and Cd uptakeis influenced by trace element interactions only slightly. While allthe observations on Hg are consistent, Gagnon et al. (1998) found asignificant (p < 0.05) decrease in Cd BCF as water hardness in-creases, but results refer to a longer exposure time (28 d).
4.5. Modelling
Results suggested to base our methodology of retrospectiveassessment on low concentrations (<4 lg Hg2+ L�1) and shortexposure times (<5 d), to maximise the linearity of the moss re-sponse and to obtain a simple mathematical equation. On thesebases, our method should be sensitive enough to characterise themicro-contamination events not detectable by traditional chemicalanalyses. To test the fit of Eq. (4) to experimental data, the differ-ence between predicted and real concentration in water was calcu-lated and then related to the concentration in mosses and theexposure time. The difference ranged between ±50%, with the
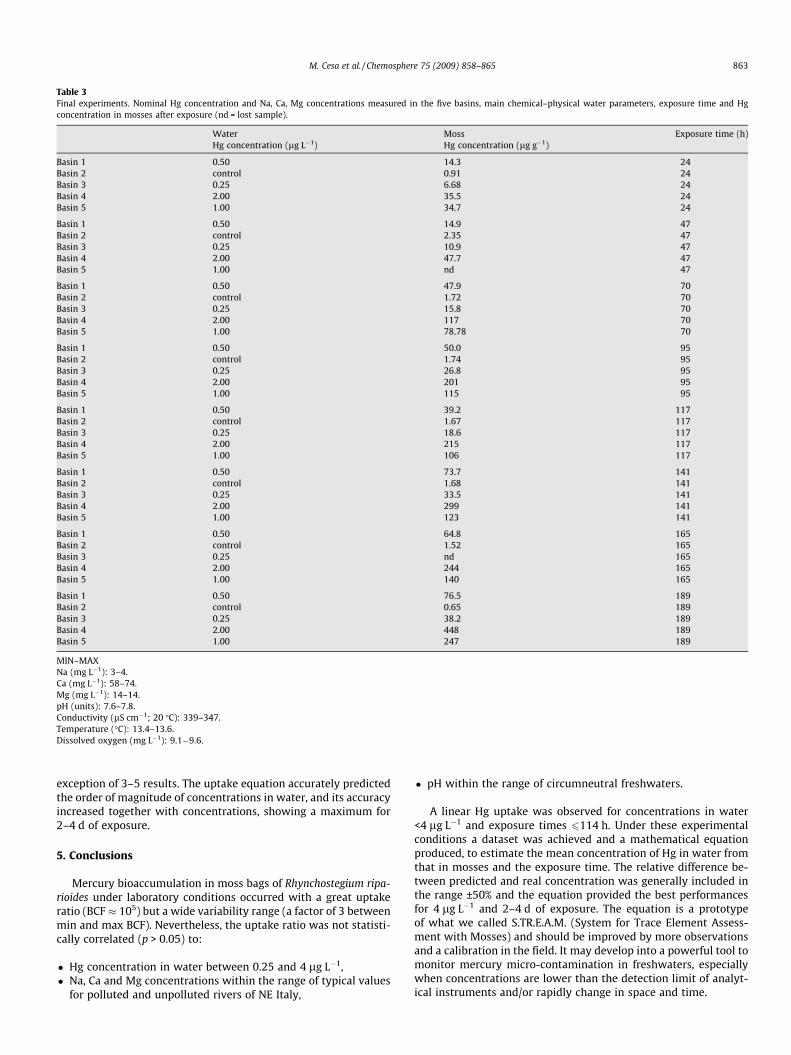
Table 3Final experiments. Nominal Hg concentration and Na, Ca, Mg concentrations measured in the five basins, main chemical–physical water parameters, exposure time and Hgconcentration in mosses after exposure (nd = lost sample).
Water Moss Exposure time (h)Hg concentration (lg L�1) Hg concentration (lg g�1)
Basin 1 0.50 14.3 24Basin 2 control 0.91 24Basin 3 0.25 6.68 24Basin 4 2.00 35.5 24Basin 5 1.00 34.7 24
Basin 1 0.50 14.9 47Basin 2 control 2.35 47Basin 3 0.25 10.9 47Basin 4 2.00 47.7 47Basin 5 1.00 nd 47
Basin 1 0.50 47.9 70Basin 2 control 1.72 70Basin 3 0.25 15.8 70Basin 4 2.00 117 70Basin 5 1.00 78.78 70
Basin 1 0.50 50.0 95Basin 2 control 1.74 95Basin 3 0.25 26.8 95Basin 4 2.00 201 95Basin 5 1.00 115 95
Basin 1 0.50 39.2 117Basin 2 control 1.67 117Basin 3 0.25 18.6 117Basin 4 2.00 215 117Basin 5 1.00 106 117
Basin 1 0.50 73.7 141Basin 2 control 1.68 141Basin 3 0.25 33.5 141Basin 4 2.00 299 141Basin 5 1.00 123 141
Basin 1 0.50 64.8 165Basin 2 control 1.52 165Basin 3 0.25 nd 165Basin 4 2.00 244 165Basin 5 1.00 140 165
Basin 1 0.50 76.5 189Basin 2 control 0.65 189Basin 3 0.25 38.2 189Basin 4 2.00 448 189Basin 5 1.00 247 189
MIN–MAXNa (mg L�1): 3–4.Ca (mg L�1): 58–74.Mg (mg L�1): 14–14.pH (units): 7.6–7.8.Conductivity (lS cm�1; 20 �C): 339–347.Temperature (�C): 13.4–13.6.Dissolved oxygen (mg L�1): 9.1�9.6.
M. Cesa et al. / Chemosphere 75 (2009) 858–865 863
exception of 3–5 results. The uptake equation accurately predictedthe order of magnitude of concentrations in water, and its accuracyincreased together with concentrations, showing a maximum for2–4 d of exposure.
5. Conclusions
Mercury bioaccumulation in moss bags of Rhynchostegium ripa-rioides under laboratory conditions occurred with a great uptakeratio (BCF � 105) but a wide variability range (a factor of 3 betweenmin and max BCF). Nevertheless, the uptake ratio was not statisti-cally correlated (p > 0.05) to:
� Hg concentration in water between 0.25 and 4 lg L�1,� Na, Ca and Mg concentrations within the range of typical values
for polluted and unpolluted rivers of NE Italy,
� pH within the range of circumneutral freshwaters.
A linear Hg uptake was observed for concentrations in water<4 lg L�1 and exposure times 6114 h. Under these experimentalconditions a dataset was achieved and a mathematical equationproduced, to estimate the mean concentration of Hg in water fromthat in mosses and the exposure time. The relative difference be-tween predicted and real concentration was generally included inthe range ±50% and the equation provided the best performancesfor 4 lg L�1 and 2–4 d of exposure. The equation is a prototypeof what we called S.TR.E.A.M. (System for Trace Element Assess-ment with Mosses) and should be improved by more observationsand a calibration in the field. It may develop into a powerful tool tomonitor mercury micro-contamination in freshwaters, especiallywhen concentrations are lower than the detection limit of analyt-ical instruments and/or rapidly change in space and time.
864 M. Cesa et al. / Chemosphere 75 (2009) 858–865
Acknowledgements
We are grateful to the Province of Vicenza, ATO Bacchiglioneand ATO Brenta for funding. This work has been possible thanksto the availability, efficiency and specialization of the ARPAV labo-ratory of Bassano del Grappa and its personnel. A particular thankto Dr. Marcello Volpe who provided us the peristaltic pump and toDr. Stefano Covelli for suggestions. The statistical calculations wereperformed using OpenStat (an open source software created byWilliam G. Miller, 2007).
References
Beaugelin-Seiller, K., Baudin, J.P., Casellas, C., 1995. Experimental study of theeffects of various factors on the uptake of Co-60 by freshwater mosses. Arch.Environ. Con. Tox. 28, 125–133.
Bleuel, C., Wesenberg, D., Sutter, K., Miersch, J., Braha, B., Bärlocher, F., Krauss, G.J.,2005. The use of the aquatic moss Fontinalis antipyretica L. ex Hedw. as abioindicator for heavy metals 3. Cd2+ accumulation capacities and biochemicalstress response of two Fontinalis species. Sci. Total Environ. 345, 13–21.
Brambati, A., 1997. Metalli Pesanti Nelle Lagune Di Marano E Grado. Piano Di StudiFinalizzato All’Accertamento Della Presenza Di Eventuali Sostanze PersistentiNelle Lagune Di Grado E Marano E Al Loro Risanamento. Regione AutonomaFriuli-Venezia Giulia, Direzione Regionale dell’Ambiente, Servizio dell’Idraulica,Trieste, 174 pp.
Breuer, K., Melzer, A., 1990. Heavy metal accumulation (lead and cadmium) and ionexchange in three species of Sphagnaceae. I. Main principles of heavy metalaccumulation in Sphagnaceae. Oecologia 82, 461–467.
Brown, D.H., Bates, J.W., 1990. Bryophytes and nutrient cycling. Bot. J. Linn. Soc. 104,129–147.
Brown, D.H., Wells, J.M., 1990. The extracellular and intracellular uptake ofinorganic chemicals by bryophytes. In: Zinsmeister, H.D., Mues, R. (Eds.),Bryophytes: Their Chemistry and Chemical Taxonomy. Clarendon Press, Oxford,pp. 299–318.
Bruns, I., Friese, K., Markert, B., Krauss, G.J., 1997. The use of Fontinalis antipyretica L.ex Hedw. as a bioindicator for heavy metals. 2. Heavy metal accumulation andphysiological reaction of Fontinalis antipyretica L. ex Hedw. in activebiomonitoring in the River Elbe. Sci. Total Environ. 204, 161–176.
Bruns, I., Siebert, A., Baumbach, R., Miersch, J., Günther, D., Markert, B., Krauß, G.J.,1995. Analysis of heavy metals and sulphur-rich compounds in the water mossFontinalis antipyretica L. ex Hedw. Fresen. J. Anal. Chem. 353, 101–104.
Carballeira, A., Lopez, J., 1997. Physiological and statistical methods to identifybackground levels of metals in aquatic bryophytes: dependence on lithology. J.Environ. Qual. 26, 980–988.
Carballeira, A., Diaz, S., Vàzquez, M.D., Lòpez, J., 1998. Inertia and resilience in theresponse of the aquatic bryophyte Fontinalis antipyretica Hedw. to thermalstress. Arch. Environ. Con. Tox. 34, 343–349.
Carballeira, A., Vàzquez, M.D., Lòpez, J., 2001. Biomonitoring of sporadicacidification of rivers on the basis of release of preloaded cadmium from theaquatic bryophyte Fontinalis antipyretica Hedw. Environ. Pollut. 111, 95–106.
Cenci, R.M., 2000. The use of aquatic moss (Fontinalis antipyretica) as monitor ofcontamination in standing and running waters: limits and advantages. J.Limnol. 60, 53–61.
Cesa, M., 2008. Biomonitoraggio Di Elementi In Traccia Nei Corsi D’Acqua DellaProvincia Di Vicenza Tramite ‘‘Moss Bags”: Aspetti Metodologici E Applicativi.Ph.D. thesis, University of Trieste, 198 pp.
Cesa, M., Bizzotto, A., Ferraro, C., Fumagalli, F., Nimis, P.L., 2006. Assessment ofintermittent trace element pollution by moss bags. Environ. Pollut. 144, 886–892.
Cesa, M., Campisi, B., Bizzotto, A., Ferraro, C., Fumagalli, F., Nimis, P.L., 2008. A factorinfluence study of trace element bioaccumulation in moss bags. Arch. Environ.Con. Tox. 55, 386–396.
Clarckson, T.W., 1997. The toxicology of mercury. Crit. Rev. Clin. Lab. Sci. 34, 369–403.
Claveri, B., Mouvet, C., 1995. Temperature effects on copper uptake and CO2
assimilation by the aquatic moss Rhynchostegium riparioides. Arch. Environ. Con.Tox. 28, 314–320.
Claveri, B., Guérold, F., Pihan, J.C., 1995. Use of transplanted mosses andautochthonous liverworts to monitor trace metals in acidic and non-acidicheadwater streams (Vosges mountains, France). Sci. Total Environ. 175, 235–244.
Claveri, B., Morhain, E., Mouvet, C., 1994. A methodology for assessment ofaccidental copper pollution using the aquatic moss Rhynchostegium riparioides.Chemosphere 28, 2001–2010.
Clymo, R.S., 1963. Ion exchange in Sphagnum and its relation to bog ecology. Ann.Bot. 27, 309–324.
Davies, T.D., 2007. Sulphate toxicity to the aquatic moss, Fontinalis antipyretica.Chemosphere 66, 444–451.
Empain, A., 1973. Les bryophytes aquatiques utilisés comme traceurs de lacontamination en métaux lourds des eaux douces. Mem. Soc. Roy. Bot. Belg.7, 141–156.
Fernandez, J.A., Vazquez, M.D., Lopez, J., Carballeira, A., 2006. Modelling the extraand intracellular uptake and discharge of heavy metals in Fontinalis antipyreticatransplanted along a heavy metal and pH contamination gradient. Environ.Pollut. 139, 21–31.
Figueira, R., Ribeiro, T., 2005. Transplants of aquatic mosses as biomonitors ofmetals released by a mine effluent. Environ. Pollut. 136, 293–301.
Foulquier, L., Hébrard, J.P., 1976. Etude expérimentale de la fixation et de lacontamination du sodium 22 par une mousse dulciaquicole Platyhypnidiumriparioides (Hedw.). Dix. Oecol. Plant. 11, 267–276.
Gagnon, C., Vaillancourt, G., Pazdernik, L., 1998. Influence of water hardness onaccumulation and elimination of cadmium in two aquatic mosses underlaboratory conditions. Arch. Environ. Con. Tox. 34, 12–20.
García, A.M.A., Martínez, A.J., Núñez, O.E., Beaucourt, N., 2000. Elementconcentrations and enrichment ratios in the aquatic moss Rhynchostegiumriparioides along the River Iregua (La Rioja, Northern Spain). Bryologist 103,518–533.
Haseloff, H.P., Winkler, S., 1980. Influence of heavy metal ions on the gas exchangeof moss. Cryptogamie Bryol. L. 1, 53–65.
Kelly, M.G., Girton, C., Whitton, B.A., 1987. Use of moss-bags for monitoring heavymetals in rivers. Water Res. 21, 1429–1435.
Lee, J., Johnson-Green, P., Lee, E.J., 2002. Chemical analysis of transplanted aquaticmosses and aquatic environment during a fish kill on the Chungnang River,Seoul, Korea. Korean J. Biol. Sci. 6, 215–219.
Lopez, J., Carballeira, A., 1993. Interspecific differences in metal bioaccumulationand plant-water concentration ratios in five aquatic bryophytes. Hydrobiologia263, 95–107.
Martinez, A.J., Nuñez, O.E., Beaucourt, N., Garcia, A.M.A., Tomas, R., Arroniz, M.,2003. Different physiological responses of two aquatic bryophytes to enhancedultraviolet-B radiation. J. Bryol. 25, 17–30.
Martinez, A.J., Nuñez, O.E., Sanchez, D.M., 1993. Effects of organic pollution ontransplanted aquatic bryophytes. J. Bryol. 17, 553–566.
Martins, R.J.E., Boaventura, R.A.R., 2002. Uptake and release of zinc by aquaticbryophytes (Fontinalis antipyretica L. ex Hedw). Water Res. 36, 5005–5012.
Mersch, J., Claveri, B., 1998. Les Bryophytes Aquatiques Comme Outil DeSurveillance De La Contamination Des Eaux Courantes Par Les MicropolluantsMétalliques: Modalités D’Interprétation Des Données. Etude Inter-Agences 55,France, 145 pp.
Mersch, J., Kass, M., 1994. La mousse aquatique Fontinalis antipyretica commetraceur de la contamination radioactive de la Moselle en aval de la centralenucléaire de Cattenom. B. Soc. Nat. Luxemb. 95, 109–117.
Mersch, J., Reichard, M., 1998. In situ investigation of trace metal availability inindustrial effluents using transplanted aquatic mosses. Arch. Environ. Con. Tox.34, 336–342.
Mersch, J., Guérold, F., Rousselle, P., Pihan, J.C., 1993a. Transplanted aquatic mossesfor monitoring trace metal mobilization in acidified streams of the Vosgemountains, France. B. Environ. Contam. Toxicol. 51, 255–259.
Mersch, J., Morhain, E., Mouvet, C., 1993b. Laboratory accumulation and depurationof copper and cadmium in the freshwater mussel Dreissena polymorpha and theaquatic moss Rhynchostegium riparioides. Chemosphere 27, 1475–1485.
Morel, F.M.M., Kraepiel, A.M.L., Amyot, M., 1998. The chemical cycle andbioaccumulation of mercury. Ann. Rev. Ecol. System. 29, 543–566.
Mouvet, C., 1984. Accumulation of chromium and copper by the aquatic mossFontinalis antipyretica L. ex Hedw. transplanted in a metal-contaminated river.Environ. Technol. Lett. 5, 541–548.
Mouvet, C., 1985. The use of aquatic bryophytes to monitor heavy metals pollutionof freshwaters as illustrated by case studies. Verh Internat. Verein. Limnol. 22,2420–2425.
Mouvet, C., 1986. Métaux Lourds Et Mousses Aquatiques, SynthèseMéthodologique. Université de Metz – Laboratoire d’Ecologie, rapport decontrat à l’Agence de l’Eau Rhin-Meuse et l’Agence de l’Eau Rhône-Méditerranée-Corse, France, 104 pp.
Mouvet, C., Claveri, B., 1999. Localization of copper accumulated in Rhynchostegiumriparioides using sequential chemical extraction. Aquat. Bot. 63, 1–10.
Mouvet, C., Cordebar, P., Pensel, T., Leclercq, E., Benyahia, M., Roger, P., 1985.Accumulation Et Relargage Du Plomb Et Du Zinc Par Des Mousses AquatiquesEn Milieu Naturel Et Au Laboratoire. Université de Metz – Laboratoired’Ecologie, rapport de contrat au Ministère de l’Environnement. Agence del’Eau Rhône-Méditerranée-Corse, France. p. 77.
Nuñez, O.E., Martinez, A.J., Tomàs, R., Beaucourt, N., Arròniz, C.M., 2004. Influence oftemperature on the effects of artificially enhanced UV-B radiation on aquaticbryophytes under laboratory conditions. Photosynthetica 42, 201–212.
Pickering, D.C., Puia, I.L., 1969. Mechanism for the uptake of zinc by Fontinalisantipyretica. Physiol. Plantarum 22, 653–661.
Rasmussen, G., Andersen, S., 1999. Episodic release of arsenic, copper andchromium from a wood preservation site monitored by transplanted aquaticmoss. Water Air Soil Poll. 109, 41–52.
Samecka-Cymerman, A., Kempers, A.J., 1995. Preliminary investigations into thebioaccumulation of mercury by the liverwort Scapania undulata (L.) Dum.Ecotox. Environ. Safe. 31, 57–61.
Siebert, A., Bruns, I., Krauss, G.J., Miersch, J., Markert, B., 1996. The use of aquaticmoss Fontinalis antipyretica L. ex Hedw. as a bioindicator for heavy metals. 1.Fundamental investigations into heavy metal accumulation in Fontinalisantipyretica L. ex Hedw. Sci. Total Environ. 177, 137–144.
Vàzquez, M.D., Fernàndez, J.A., Lòpez, J., Carballeira, A., 2000. Effects of water acidityand metal concentration on accumulation and within-plant distribution of

M. Cesa et al. / Chemosphere 75 (2009) 858–865 865
metals in the aquatic bryophyte Fontinalis antipyretica. Water Air Soil Pollut.120, 1–19.
Vàzquez, M.D., Lòpez, J., Carballeira, A., 1999. Uptake of heavy metals to theextracellular and intracellular compartments in three species of aquaticbryophyte. Ecotox. Environ. Safe. 44, 12–24.
Vray, F., Baudin, J.P., Svadlenkova, M., 1992. Effects of some factors on uptake andrelease of Ru-106 by a freshwater moss, Platyhypnidium riparioides. Arch.Environ. Con. Tox. 23, 190–197.
Wehr, J.D., Whitton, B.A., 1983. Accumulation of heavy metals by the aquaticmosses. 2. Rhynchostegium riparioides. Hydrobiologia 100, 261–284.
Wehr, J.D., Kelly, M.G., Whitton, B.A., 1987. Factors affecting accumulation and lossof zinc by the aquatic moss Rhynchostegium riparioides (Hedw) C. Jens. Aquat.Bot. 29, 261–274.
Wehr, J.D., Empain, A., Mouvet, C., Say, J., Whitton, B.A., 1983. Methods forprocessing aquatic mosses used as monitors of heavy metals. Wat. Res. 17, 985–992.
Whitton, B.A., 2003. Use of plants for monitoring heavy metals in freshwaters. In:Ambasht, R.S., Ambasht, N.K. (Eds.), Modern Trends in Applied Aquatic Ecology.Kluwer, pp. 43–63.
Yurukova, L.D., Gecheva, G., 2003. Active and passive biomonitoring using Fontinalisantipyretica in Maritsa River, Bulgaria. Journal of Balkan Ecology 6, 390–397.
Yurukova, L.D., Gecheva, G., 2004. Biomonitoring in Maritsa River using aquaticbryophytes. J. Environ. Protection Ecol. 5, 729–735.