(PDF) Experimental Research of High-Temperature and High ...
17
energies Article Experimental Research of High-Temperature and High-Pressure Water Jet Characteristics in ICRC Engine Relevant Conditions Zhe Kang 1, * , Zhehao Zhang 2 , Jun Deng 2 , Liguang Li 2 and Zhijun Wu 2, * 1 School of Automotive Engineering, Chongqing University, Chongqing 400044, China 2 School of Automotive Studies, Tongji University, Shanghai 201804, China; [email protected] (Z.Z.); [email protected] (J.D.); [email protected] (L.L.) * Correspondence: [email protected] (Z.K.); [email protected] (Z.W.) Received: 17 April 2019; Accepted: 7 May 2019; Published: 9 May 2019 Abstract: The internal combustion Rankine cycle (ICRC) concept provides a potential solution for future high thermal efficiency and low emission powertrains, and direct water injection (DWI) proved to be the key parameter for ICRC optimization. This paper was dedicated to investigating the fundamental mechanisms of water spray characteristics under different water injection control parameters. In order to do so, an experimental test system was carefully designed and built based on the Bosch and Schlieren methods: the Bosch method is utilized to measure the effect of injection and ambient pressure on water injection characteristics, and the Schlieren method is utilized to investigate the impact of water injection and ambient temperature on water spray and evaporation processes. The experimental results indicate that both control parameters show important effects on water injection and spray characteristics. The water injection and ambient pressure show significant impacts on steady-state flow quantity and cyclic water injection quantity, and the water injection and ambient pressure affect the evaporation ability of water vapor within the spray which leads to a different variation trend during the initial, developing, and developed water spray stages. The results of this work can be used as fundamental supplements for ICRC, steam assistant technology (SAT), and DWI-related ICEs experimental and numerical researches, and provide extra information to understand the DWI process within engine-relevant conditions. Keywords: water spray; spray characteristics; injection characteristics; Schlieren method; Bosch method; internal combustion Rankine cycle 1. Introduction As the dominant power source in automotive industry, internal combustion engines (ICEs) show tenacious vitality when facing the challenges of battery electric vehicles (BEVs) and fuel cell vehicles (FCVs) in the modern transportation sector. Compared to BEV and FCV, ICEs show superiority in driving mileage, refueling infrastructure, flexibility, and environment adaptability [1]. Although traditional ICEs suffer from relatively low tank-to-wheel efficiency and exhaust emissions [2], the accelerated evolvements of ICE electrification have paved the way for the research and development of high-efficiency and low-emission hybrid dedicated ICEs [3]. The ICEs within hybrid electric vehicles (HEVs) operated under relatively narrow working conditions compared to traditional ones [4]—this alteration brings huge benefits when facing the challenges of efficiency and emissions optimization in ICEs. On this technical basis, to further enhance the thermal efficiency of hybrid-dedicated ICEs and to eliminate the exhaust emissions thoroughly, a novel ICE concept named “internal combustion Energies 2019, 12, 1763; doi:10.3390/en12091763 www.mdpi.com/journal/energies
-
Upload
khangminh22 -
Category
Documents
-
view
3 -
download
0
Transcript of (PDF) Experimental Research of High-Temperature and High ...
energies
Article
Experimental Research of High-Temperature andHigh-Pressure Water Jet Characteristics in ICRCEngine Relevant Conditions
Zhe Kang 1,* , Zhehao Zhang 2, Jun Deng 2, Liguang Li 2 and Zhijun Wu 2,*1 School of Automotive Engineering, Chongqing University, Chongqing 400044, China2 School of Automotive Studies, Tongji University, Shanghai 201804, China; [email protected] (Z.Z.);
[email protected] (J.D.); [email protected] (L.L.)* Correspondence: [email protected] (Z.K.); [email protected] (Z.W.)
Received: 17 April 2019; Accepted: 7 May 2019; Published: 9 May 2019�����������������
Abstract: The internal combustion Rankine cycle (ICRC) concept provides a potential solution forfuture high thermal efficiency and low emission powertrains, and direct water injection (DWI)proved to be the key parameter for ICRC optimization. This paper was dedicated to investigatingthe fundamental mechanisms of water spray characteristics under different water injection controlparameters. In order to do so, an experimental test system was carefully designed and built basedon the Bosch and Schlieren methods: the Bosch method is utilized to measure the effect of injectionand ambient pressure on water injection characteristics, and the Schlieren method is utilized toinvestigate the impact of water injection and ambient temperature on water spray and evaporationprocesses. The experimental results indicate that both control parameters show important effects onwater injection and spray characteristics. The water injection and ambient pressure show significantimpacts on steady-state flow quantity and cyclic water injection quantity, and the water injectionand ambient pressure affect the evaporation ability of water vapor within the spray which leads to adifferent variation trend during the initial, developing, and developed water spray stages. The resultsof this work can be used as fundamental supplements for ICRC, steam assistant technology (SAT),and DWI-related ICEs experimental and numerical researches, and provide extra information tounderstand the DWI process within engine-relevant conditions.
Keywords: water spray; spray characteristics; injection characteristics; Schlieren method;Bosch method; internal combustion Rankine cycle
1. Introduction
As the dominant power source in automotive industry, internal combustion engines (ICEs)show tenacious vitality when facing the challenges of battery electric vehicles (BEVs) and fuelcell vehicles (FCVs) in the modern transportation sector. Compared to BEV and FCV, ICEs showsuperiority in driving mileage, refueling infrastructure, flexibility, and environment adaptability [1].Although traditional ICEs suffer from relatively low tank-to-wheel efficiency and exhaust emissions [2],the accelerated evolvements of ICE electrification have paved the way for the research and developmentof high-efficiency and low-emission hybrid dedicated ICEs [3]. The ICEs within hybrid electric vehicles(HEVs) operated under relatively narrow working conditions compared to traditional ones [4]—thisalteration brings huge benefits when facing the challenges of efficiency and emissions optimizationin ICEs.
On this technical basis, to further enhance the thermal efficiency of hybrid-dedicated ICEs andto eliminate the exhaust emissions thoroughly, a novel ICE concept named “internal combustion
Energies 2019, 12, 1763; doi:10.3390/en12091763 www.mdpi.com/journal/energies

Energies 2019, 12, 1763 2 of 17
Rankine cycle” (ICRC) can be utilized [5]. The idea of ICRC can be dated back to 1999 when there wasstrong demand from the power generation industry for high efficiency and zero emission facilities [6].The basic principle of the ICRC engine is to utilize oxygen instead of air as its intake to directlyoxidize the injected fuel: as the nitrogen is absent, the generation of nitric oxide can be fully avoided.As the oxidizer within the combustion chamber is pure oxygen, the combustion intensity within thecombustion chamber is relatively strong, in order to control and optimize the combustion process, directwater injection (DWI) is implemented to regulate the combustion process. On the other hand, the directinjected water can further absorb combustion heat and evaporate rapidly: the phase transformation ofliquid water into high-pressure steam further increases the expansion work during engine operation,and, benefitting from the above factors, the thermal efficiency of ICRC engine can be improvedsignificantly [7,8]. As well as the efficiency enhancement, the ICRC concept also contributes to thedecrement of exhaust emissions. According to the working principle of ICRC, the combustion productsin the ICRC engine are mainly carbon dioxide and steam. By utilizing a specially designed condenser,the steam is cooled to under dew point, so the carbon dioxide and water within the exhaust gasescan be easily separated. The gaseous carbon dioxide are further cooled into liquefied carbon dioxideby exchanging heat with liquefied oxygen for better storage, and water is recycled and heated byexhausted gases for less dependence in external water supply. A schematic diagram of the ICRCengine is illustrated in Figure 1. Compare to BEV and FCV, the design and implementation of the ICRCengine is based on conventional ICEs and mature technologies utilized among transportation andpower generation industries, so it is reasonable to expect lower realization difficulty and productioncost [8]. It is also reasonable to utilize the ICRC engine into HEV, especially in the range extensionelectric vehicle (REEV), because of much simpler working conditions which further decrease theimplementation difficulties of ICRC engine.
Energies 2019, 12, x FOR PEER REVIEW 2 of 17
was strong demand from the power generation industry for high efficiency and zero emission facilities [6]. The basic principle of the ICRC engine is to utilize oxygen instead of air as its intake to directly oxidize the injected fuel: as the nitrogen is absent, the generation of nitric oxide can be fully avoided. As the oxidizer within the combustion chamber is pure oxygen, the combustion intensity within the combustion chamber is relatively strong, in order to control and optimize the combustion process, direct water injection (DWI) is implemented to regulate the combustion process. On the other hand, the direct injected water can further absorb combustion heat and evaporate rapidly: the phase transformation of liquid water into high-pressure steam further increases the expansion work during engine operation, and, benefitting from the above factors, the thermal efficiency of ICRC engine can be improved significantly [7,8]. As well as the efficiency enhancement, the ICRC concept also contributes to the decrement of exhaust emissions. According to the working principle of ICRC, the combustion products in the ICRC engine are mainly carbon dioxide and steam. By utilizing a specially designed condenser, the steam is cooled to under dew point, so the carbon dioxide and water within the exhaust gases can be easily separated. The gaseous carbon dioxide are further cooled into liquefied carbon dioxide by exchanging heat with liquefied oxygen for better storage, and water is recycled and heated by exhausted gases for less dependence in external water supply. A schematic diagram of the ICRC engine is illustrated in Figure 1. Compare to BEV and FCV, the design and implementation of the ICRC engine is based on conventional ICEs and mature technologies utilized among transportation and power generation industries, so it is reasonable to expect lower realization difficulty and production cost [8]. It is also reasonable to utilize the ICRC engine into HEV, especially in the range extension electric vehicle (REEV), because of much simpler working conditions which further decrease the implementation difficulties of ICRC engine.
Figure 1. Schematic diagram of the internal combustion Rankine cycle (ICRC) engine concept [9].
Since the proposal of ICRC concept, the authors have conducted extensive works related to its theoretical and experimental researches. The theoretical thermal efficiency boundaries and its optimization direction are determined based on the establishment of theoretical thermodynamic model, the best thermal efficiency achieved in theoretical thermodynamic model is 62% [9]. The combustion and performance characteristics under different intakes of oxygen concentration [10], engine operation parameters [11], water injection strategies [12], and in-cylinder combustion feedback control [13] within spark ignition ICRC (SI-ICRC) engine were investigated, and all of these experimental results show a promising tendency of ICRC engine utilization in the modern transportation sector. Despite the proved efficiency enhancement in the SI-ICRC engine, the knocking combustion phenomenon within SI-ICRC resulted in end gas auto-ignition restraint the further
Figure 1. Schematic diagram of the internal combustion Rankine cycle (ICRC) engine concept [9].
Since the proposal of ICRC concept, the authors have conducted extensive works related toits theoretical and experimental researches. The theoretical thermal efficiency boundaries and itsoptimization direction are determined based on the establishment of theoretical thermodynamic model,the best thermal efficiency achieved in theoretical thermodynamic model is 62% [9]. The combustionand performance characteristics under different intakes of oxygen concentration [10], engine operationparameters [11], water injection strategies [12], and in-cylinder combustion feedback control [13] withinspark ignition ICRC (SI-ICRC) engine were investigated, and all of these experimental results show a
Energies 2019, 12, 1763 3 of 17
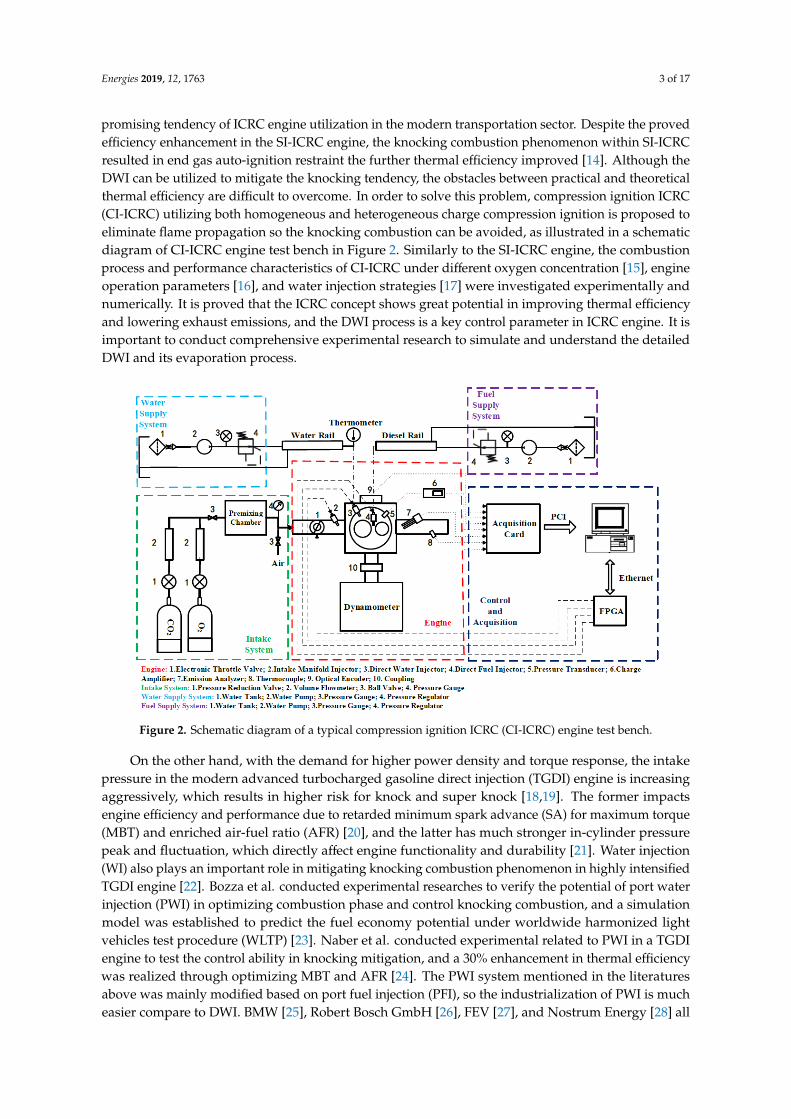
promising tendency of ICRC engine utilization in the modern transportation sector. Despite the provedefficiency enhancement in the SI-ICRC engine, the knocking combustion phenomenon within SI-ICRCresulted in end gas auto-ignition restraint the further thermal efficiency improved [14]. Although theDWI can be utilized to mitigate the knocking tendency, the obstacles between practical and theoreticalthermal efficiency are difficult to overcome. In order to solve this problem, compression ignition ICRC(CI-ICRC) utilizing both homogeneous and heterogeneous charge compression ignition is proposed toeliminate flame propagation so the knocking combustion can be avoided, as illustrated in a schematicdiagram of CI-ICRC engine test bench in Figure 2. Similarly to the SI-ICRC engine, the combustionprocess and performance characteristics of CI-ICRC under different oxygen concentration [15], engineoperation parameters [16], and water injection strategies [17] were investigated experimentally andnumerically. It is proved that the ICRC concept shows great potential in improving thermal efficiencyand lowering exhaust emissions, and the DWI process is a key control parameter in ICRC engine. It isimportant to conduct comprehensive experimental research to simulate and understand the detailedDWI and its evaporation process.
Energies 2019, 12, x FOR PEER REVIEW 3 of 17
thermal efficiency improved [14]. Although the DWI can be utilized to mitigate the knocking tendency, the obstacles between practical and theoretical thermal efficiency are difficult to overcome. In order to solve this problem, compression ignition ICRC (CI-ICRC) utilizing both homogeneous and heterogeneous charge compression ignition is proposed to eliminate flame propagation so the knocking combustion can be avoided, as illustrated in a schematic diagram of CI-ICRC engine test bench in Figure 2. Similarly to the SI-ICRC engine, the combustion process and performance characteristics of CI-ICRC under different oxygen concentration [15], engine operation parameters [16], and water injection strategies [17] were investigated experimentally and numerically. It is proved that the ICRC concept shows great potential in improving thermal efficiency and lowering exhaust emissions, and the DWI process is a key control parameter in ICRC engine. It is important to conduct comprehensive experimental research to simulate and understand the detailed DWI and its evaporation process.
Figure 2. Schematic diagram of a typical compression ignition ICRC (CI-ICRC) engine test bench.
On the other hand, with the demand for higher power density and torque response, the intake pressure in the modern advanced turbocharged gasoline direct injection (TGDI) engine is increasing aggressively, which results in higher risk for knock and super knock [18,19]. The former impacts engine efficiency and performance due to retarded minimum spark advance (SA) for maximum torque (MBT) and enriched air-fuel ratio (AFR) [20], and the latter has much stronger in-cylinder pressure peak and fluctuation, which directly affect engine functionality and durability [21]. Water injection (WI) also plays an important role in mitigating knocking combustion phenomenon in highly intensified TGDI engine [22]. Bozza et al. conducted experimental researches to verify the potential of port water injection (PWI) in optimizing combustion phase and control knocking combustion, and a simulation model was established to predict the fuel economy potential under worldwide harmonized light vehicles test procedure (WLTP) [23]. Naber et al. conducted experimental related to PWI in a TGDI engine to test the control ability in knocking mitigation, and a 30% enhancement in thermal efficiency was realized through optimizing MBT and AFR [24]. The PWI system mentioned in the literatures above was mainly modified based on port fuel injection (PFI), so the industrialization of PWI is much easier compare to DWI. BMW [25], Robert Bosch GmbH [26], FEV [27], and Nostrum Energy [28] all reported commercialized PWI products for OEM and aftermarket application. Despite the high cost performance of PWI, there are still drawbacks of PWI such as water incomplete evaporation, slower transient response, and relatively high water consumption rate [29].
Figure 2. Schematic diagram of a typical compression ignition ICRC (CI-ICRC) engine test bench.
On the other hand, with the demand for higher power density and torque response, the intakepressure in the modern advanced turbocharged gasoline direct injection (TGDI) engine is increasingaggressively, which results in higher risk for knock and super knock [18,19]. The former impactsengine efficiency and performance due to retarded minimum spark advance (SA) for maximum torque(MBT) and enriched air-fuel ratio (AFR) [20], and the latter has much stronger in-cylinder pressurepeak and fluctuation, which directly affect engine functionality and durability [21]. Water injection(WI) also plays an important role in mitigating knocking combustion phenomenon in highly intensifiedTGDI engine [22]. Bozza et al. conducted experimental researches to verify the potential of port waterinjection (PWI) in optimizing combustion phase and control knocking combustion, and a simulationmodel was established to predict the fuel economy potential under worldwide harmonized lightvehicles test procedure (WLTP) [23]. Naber et al. conducted experimental related to PWI in a TGDIengine to test the control ability in knocking mitigation, and a 30% enhancement in thermal efficiencywas realized through optimizing MBT and AFR [24]. The PWI system mentioned in the literaturesabove was mainly modified based on port fuel injection (PFI), so the industrialization of PWI is mucheasier compare to DWI. BMW [25], Robert Bosch GmbH [26], FEV [27], and Nostrum Energy [28] all
Energies 2019, 12, 1763 4 of 17
reported commercialized PWI products for OEM and aftermarket application. Despite the high costperformance of PWI, there are still drawbacks of PWI such as water incomplete evaporation, slowertransient response, and relatively high water consumption rate [29]. To overcome the above-mentionedproblems, DWI shows an irreplaceable position in WI technology for modern ICEs, and manyautomotive corporations and universities show great interests in DWI. Hoppe et al. conductedexperimental and numerical researches in DWI implementation within a TGDI engine, and an elevatedcompression ratio 13.5:1 was realized under 1 MPa indicated mean effective pressure (IMEP), which canfurther increase to 14.7 with variable valve actuation (VVA) technology [27]. The enhancement resultsunder optimum fuel consumption rate and full load condition are 3.3~3.8% and 16% with 1 L/100 kmwater consumption. The overall best brake specific fuel consumption (BSFC) achieved is 201 g/kWh [30].Bae et al. implemented DWI into a PFI gasoline engine and conducted experimental research relatedto the effect of DWI strategies under different engine operation parameters on compression ratioand fuel economy. The optimized compression ratio was increased to 13.5, and fuel economy wasenhanced around 7~17% without performance deterioration [31]. DWI also contributes to a reductionof exhaust emissions. Miyamoto et al. conducted experimental researches about DWI in an in-directinjection (IDI) diesel engine to test the NOX reduction ability [32]. Chybowski et al. presented acomprehensive overview in NOX reduction potential by using WI [33,34]. The authors also observedthis phenomenon by utilizing DWI within a diesel engine to optimize NOX emissions and performancesimultaneously [35]. Tauzia et al. also reported that particulate emission was reduced by using DWI ina diesel engine [36]. It is obvious that DWI, and especially its water injection process, plays a vital rolein the future of high efficiency and performance hybrid dedicated engines from the reported literatures,so the proposed experimental research related to direct water injection characteristics is also beneficialfor the future DWI industrialization and calibration.
There is another kind of DWI application in high efficiency ICEs field which is related tosteam assistant technology (SAT) [37]. The fundamental idea of SAT is utilizing high-pressureand -temperature steam generated through waste or combustion heat absorption by direct injectedwater—the massive expansion work enhancement during the phase transformation of water contributesto the significant thermal efficiency improvement [38]. Szybist et al. proposed a six-stroke engineconception by adding DWI into an extra stroke to recover waste heat in exhaust gases and improve fueleconomy [39]. Fu et al. also presented a similar concept to utilize DWI to establish an open steam cyclefor thermal efficiency enhancement [40]. Azmi et al. applied DWI into a hydrogen-fueled compressionignition engine to optimize the combustion process and improve engine efficiency [41]. Hewavitaraneet al. proposed a superheated liquid flash boiling (SLFB) cycle which is implemented within the engineexhaust system to recover waste heat and generate steam to increase engine efficiency [42]. It is obviousto conclude that DWI and its injection process plays a key role in SAT, and the experimental researchesin establishing knowledge about high-temperature and -pressure direct water injection characteristicsalso contribute to the fundamental researches in SAT.
Since DWI, especially high-temperature and high-pressure water jet, occupy an important place infuture extreme high-efficiency and low-emission ICEs as described above, this paper proposed to utilizeBosch method to measure and investigate the water injection characteristics under different injectionand ambient pressure which simulate the water injection process in engine-relevant conditions, and thewater spray characteristics under different injection and ambient temperature is also investigatedusing the Schlieren method within a constant volume vessel (CVV) to explore the impact effect oftemperature on water jet atomization and evaporation, besides, the experimental results provided inthis work also provide extra information for future DWI simulation in real engine working conditions.
2. Experimental Setup
The main objective of this study is to investigate the high-temperature and high-pressure waterjet characteristics under different injection and ambient conditions, the results of this study can bebeneficial in providing detailed injection and spray design or for calibrating information for ICRC
Energies 2019, 12, 1763 5 of 17
and other advanced DWI technologies in modern ICEs. An injection process test system based onthe Bosch method is utilized in order to study the effect of injection pressure and ambient pressureon high-pressure water injection characteristics, on the other hand, a CVV with Schlieren method isestablished to investigate the high-temperature water spray and evaporation process. The detailedexperimental setups for different objectivities are introduced below.
2.1. Bosch Method for High-Pressure Water Injection Characteristics Measurement
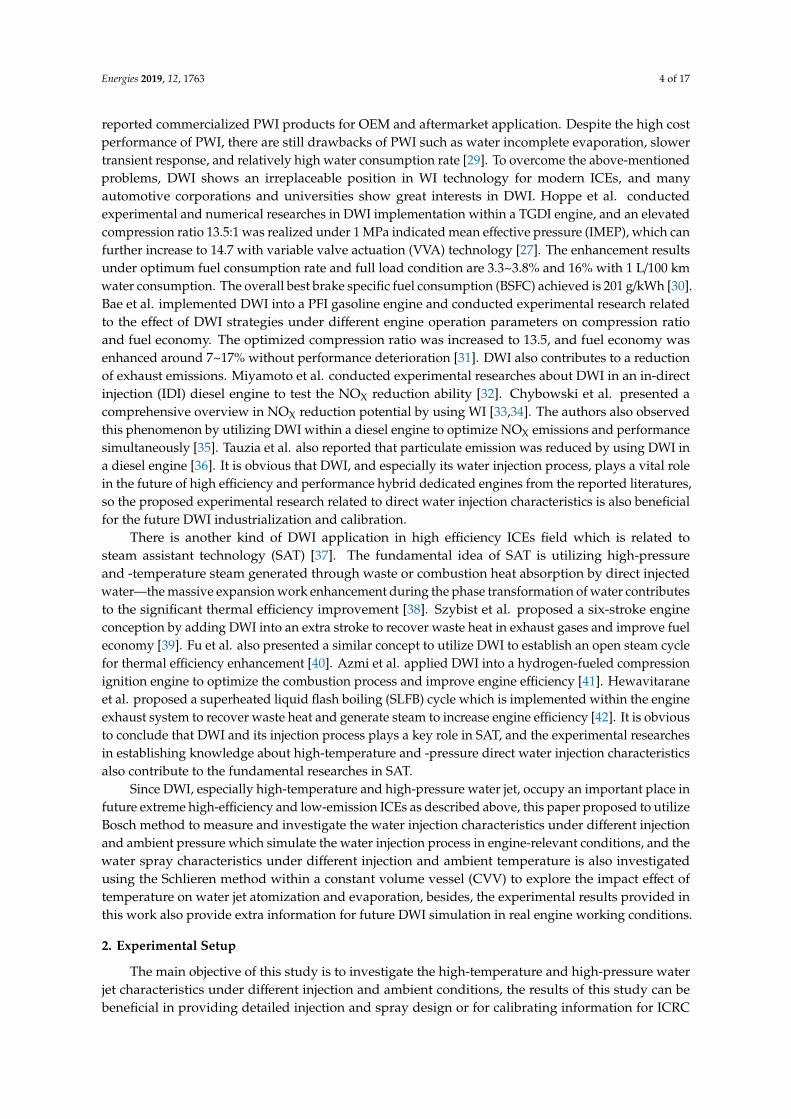
The high-pressure water injection characteristics test system based on the Bosch method is shownin Figure 3. As shown in the figure, an air-fluid booster with a compression ratio 60:1 was equippedin the system to pressurize the water to the target injection pressures up to 48 MPa, and an aircompressor with maximum 0.8 MPa high-pressure air supply was utilized to provide pressure sourcefor water pressurization. The water was stored in a water tank before entering the air-fluid boosterand a water filter is installed to prevent impurities. The pressurized water was delivered into aspecially-designed common rail with a maximum allowed pressure of 80 MPa. A heating rod coupledwith inner thermocouple was installed within the common rail to simulate the waste heat recoveryand supply extra energy to heat up the pressurized water. The highest heating temperature was fixedat 160 ◦C under continuous water injection condition. The water injector utilized during high-pressurewater injection characteristics measurement is the same one used during the ICRC engine benchtest. The water injector with 6 holes was specially-designed and manufactured by the Wuxi fuelinjection equipment research institute to ensure preferable durability and reliability during long termWI operation. The high-precision piezoelectric pressure sensor was installed on the connecting blockto measure the pressure fluctuations in the long tube during WI, a charge amplifier is used to amplifythe charge generated within the pressure sensor and transfer to data acquisition system (DAQ) fordata storage. The connecting block was utilized to connect the water injector with long tube whichprovided enough reflection time during pressure waves measurement. During the measurement ofhigh-pressure water injection characteristics, the throttle valve and back pressure valve installed at theend of the long tube was used to adjust the ambient pressure within the long tube, and also to adjustthe number of reflection waves after water injection to ensure measurement precision [43]. The controlcircuit used in the system is CompactRIO platform with cRIO-9024 real-time controller which is capableof providing a 4 GB storage and highly timed real-time operation system, cRIO-9118 FPGA back boardwith 40 MHz clock timing, which means control iteration less than 25 ns, the C series module NI-9751and NI-9205 were also used to trigger direct water injection and to collect rail pressure information.
Energies 2019, 12, x FOR PEER REVIEW 5 of 17
established to investigate the high-temperature water spray and evaporation process. The detailed experimental setups for different objectivities are introduced below.
2.1. Bosch Method for High-Pressure Water Injection Characteristics Measurement
The high-pressure water injection characteristics test system based on the Bosch method is shown in Figure 3. As shown in the figure, an air-fluid booster with a compression ratio 60:1 was equipped in the system to pressurize the water to the target injection pressures up to 48 MPa, and an air compressor with maximum 0.8 MPa high-pressure air supply was utilized to provide pressure source for water pressurization. The water was stored in a water tank before entering the air-fluid booster and a water filter is installed to prevent impurities. The pressurized water was delivered into a specially-designed common rail with a maximum allowed pressure of 80 MPa. A heating rod coupled with inner thermocouple was installed within the common rail to simulate the waste heat recovery and supply extra energy to heat up the pressurized water. The highest heating temperature was fixed at 160 °C under continuous water injection condition. The water injector utilized during high-pressure water injection characteristics measurement is the same one used during the ICRC engine bench test. The water injector with 6 holes was specially-designed and manufactured by the Wuxi fuel injection equipment research institute to ensure preferable durability and reliability during long term WI operation. The high-precision piezoelectric pressure sensor was installed on the connecting block to measure the pressure fluctuations in the long tube during WI, a charge amplifier is used to amplify the charge generated within the pressure sensor and transfer to data acquisition system (DAQ) for data storage. The connecting block was utilized to connect the water injector with long tube which provided enough reflection time during pressure waves measurement. During the measurement of high-pressure water injection characteristics, the throttle valve and back pressure valve installed at the end of the long tube was used to adjust the ambient pressure within the long tube, and also to adjust the number of reflection waves after water injection to ensure measurement precision [43]. The control circuit used in the system is CompactRIO platform with cRIO-9024 real-time controller which is capable of providing a 4 GB storage and highly timed real-time operation system, cRIO-9118 FPGA back board with 40 MHz clock timing, which means control iteration less than 25 ns, the C series module NI-9751 and NI-9205 were also used to trigger direct water injection and to collect rail pressure information.
Figure 3. Schematic of water injection characteristics test system based on the Bosch method. Figure 3. Schematic of water injection characteristics test system based on the Bosch method.

Energies 2019, 12, 1763 6 of 17
The detailed experimental conditions are presented in Table 1. During the measurement process,30 and 35 MPa water injections, pressures which represent actual ICRC working conditions, are acquiredby adjusting the air compressor outlet pressure. The water injection duration varies from 0.4 ms to3 ms and was chosen to provide sufficient information for ICRC water injector discharge coefficientcalculation and ICRC engine calibration. An ambient pressure range from 0.1 MPa to 7 MPa isestablished by adjusting the back-pressure valve. The 0.1 MPa ambient pressure stands for waterinjection quantity measurement under atmosphere condition using weighing method, which representconventional water injection quantity calibration method before engine experiment.
Table 1. Experimental conditions for high-pressure water injection characteristics measurement.
Parameter Value
Water Injection Pressure/MPa 30, 35Water Injection Duration/ms 0.4, 0.6, 0.8 1.2, 1.6, 2, 2.5, 3
Ambient Pressure/MPa 0.1, 1, 3, 5, 7Water Injection Temperature/◦C 25
The high-pressure water injection characteristics measurement based on Bosch method isdeveloped derived from the hydraulic pulse theory [44], the injection rate can be obtained fromthe manipulation below:
q =dVbdt
= Au (1)
In the Equation (1), A stands for sectional area of the long tube, u stands for the flow velocity ofwater within the long tube, and the u can be obtained from original wave data p(t):
p(t) = αρu (2)
With α stands for sound velocity within water and ρ is the density of the liquid. By combingEquations (1) and (2), the injection rate q(t) can be described as below:
q(t) = Ap(t)/αρ (3)
By simply calculation the integral of q(t), the injection quantity can be obtained where d is thediameter of the long tube:
Q =
∫ t2
t1
πd2p(t)dt4αρ
(4)
Of course, there are drawbacks in the Bosch method when measuring the high-pressure liquidinjection rate. The system errors of the pressure sensor and system design can show cumulativephenomenon that affect the measurement precision and credibility. To compensate this negative effect,a numerical integration is also added during injection rate calculation as introduced in literature [45].
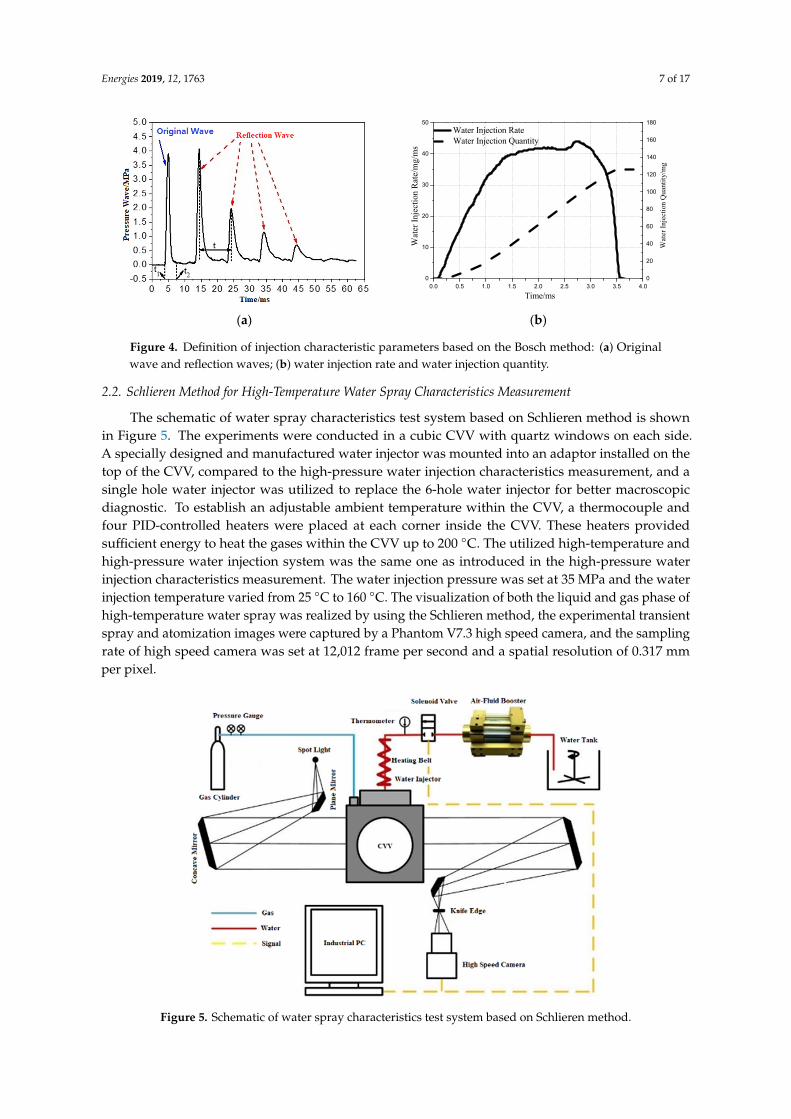
Figure 4 illustrates the definition of the injection characteristic parameters during measurement.Figure 4a is an example of original wave and reflection waves during experiment: the t1 is start oforiginal wave and t2 is end of original wave, and the t stands for the interval between two waves,while enlarging the t needs longer tube which is better for multi-injection rate measurement [46].The calculated water injection rate and water injection quantity is illustrated in Figure 4b.
Energies 2019, 12, 1763 7 of 17Energies 2019, 12, x FOR PEER REVIEW 7 of 17
(a) (b)
Figure 4. Definition of injection characteristic parameters based on the Bosch method: (a) Original wave and reflection waves; (b) water injection rate and water injection quantity.
2.2. Schlieren Method for High-Temperature Water Spray Characteristics Measurement
The schematic of water spray characteristics test system based on Schlieren method is shown in Figure 5. The experiments were conducted in a cubic CVV with quartz windows on each side. A specially designed and manufactured water injector was mounted into an adaptor installed on the top of the CVV, compared to the high-pressure water injection characteristics measurement, and a single hole water injector was utilized to replace the 6-hole water injector for better macroscopic diagnostic. To establish an adjustable ambient temperature within the CVV, a thermocouple and four PID-controlled heaters were placed at each corner inside the CVV. These heaters provided sufficient energy to heat the gases within the CVV up to 200 °C. The utilized high-temperature and high-pressure water injection system was the same one as introduced in the high-pressure water injection characteristics measurement. The water injection pressure was set at 35 MPa and the water injection temperature varied from 25 °C to 160 °C. The visualization of both the liquid and gas phase of high-temperature water spray was realized by using the Schlieren method, the experimental transient spray and atomization images were captured by a Phantom V7.3 high speed camera, and the sampling rate of high speed camera was set at 12,012 frame per second and a spatial resolution of 0.317 mm per pixel.
Figure 5. Schematic of water spray characteristics test system based on Schlieren method.
0.0 0.5 1.0 1.5 2.0 2.5 3.0 3.5 4.00
10
20
30
40
50
Wat
er In
ject
ion
Rate
/mg/
ms
Time/ms
Water Injection Rate
0
20
40
60
80
100
120
140
160
180
Water Injection Quantity
Wat
er In
ject
ion
Qua
ntity
/mg
Figure 4. Definition of injection characteristic parameters based on the Bosch method: (a) Originalwave and reflection waves; (b) water injection rate and water injection quantity.
2.2. Schlieren Method for High-Temperature Water Spray Characteristics Measurement
The schematic of water spray characteristics test system based on Schlieren method is shownin Figure 5. The experiments were conducted in a cubic CVV with quartz windows on each side.A specially designed and manufactured water injector was mounted into an adaptor installed on thetop of the CVV, compared to the high-pressure water injection characteristics measurement, and asingle hole water injector was utilized to replace the 6-hole water injector for better macroscopicdiagnostic. To establish an adjustable ambient temperature within the CVV, a thermocouple andfour PID-controlled heaters were placed at each corner inside the CVV. These heaters providedsufficient energy to heat the gases within the CVV up to 200 ◦C. The utilized high-temperature andhigh-pressure water injection system was the same one as introduced in the high-pressure waterinjection characteristics measurement. The water injection pressure was set at 35 MPa and the waterinjection temperature varied from 25 ◦C to 160 ◦C. The visualization of both the liquid and gas phase ofhigh-temperature water spray was realized by using the Schlieren method, the experimental transientspray and atomization images were captured by a Phantom V7.3 high speed camera, and the samplingrate of high speed camera was set at 12,012 frame per second and a spatial resolution of 0.317 mmper pixel.
Energies 2019, 12, x FOR PEER REVIEW 7 of 17
(a) (b)
Figure 4. Definition of injection characteristic parameters based on the Bosch method: (a) Original wave and reflection waves; (b) water injection rate and water injection quantity.
2.2. Schlieren Method for High-Temperature Water Spray Characteristics Measurement
The schematic of water spray characteristics test system based on Schlieren method is shown in Figure 5. The experiments were conducted in a cubic CVV with quartz windows on each side. A specially designed and manufactured water injector was mounted into an adaptor installed on the top of the CVV, compared to the high-pressure water injection characteristics measurement, and a single hole water injector was utilized to replace the 6-hole water injector for better macroscopic diagnostic. To establish an adjustable ambient temperature within the CVV, a thermocouple and four PID-controlled heaters were placed at each corner inside the CVV. These heaters provided sufficient energy to heat the gases within the CVV up to 200 °C. The utilized high-temperature and high-pressure water injection system was the same one as introduced in the high-pressure water injection characteristics measurement. The water injection pressure was set at 35 MPa and the water injection temperature varied from 25 °C to 160 °C. The visualization of both the liquid and gas phase of high-temperature water spray was realized by using the Schlieren method, the experimental transient spray and atomization images were captured by a Phantom V7.3 high speed camera, and the sampling rate of high speed camera was set at 12,012 frame per second and a spatial resolution of 0.317 mm per pixel.
Figure 5. Schematic of water spray characteristics test system based on Schlieren method.
0.0 0.5 1.0 1.5 2.0 2.5 3.0 3.5 4.00
10
20
30
40
50
Wat
er In
ject
ion
Rate
/mg/
ms
Time/ms
Water Injection Rate
0
20
40
60
80
100
120
140
160
180
Water Injection Quantity
Wat
er In
ject
ion
Qua
ntity
/mg
Figure 5. Schematic of water spray characteristics test system based on Schlieren method.
Energies 2019, 12, 1763 8 of 17
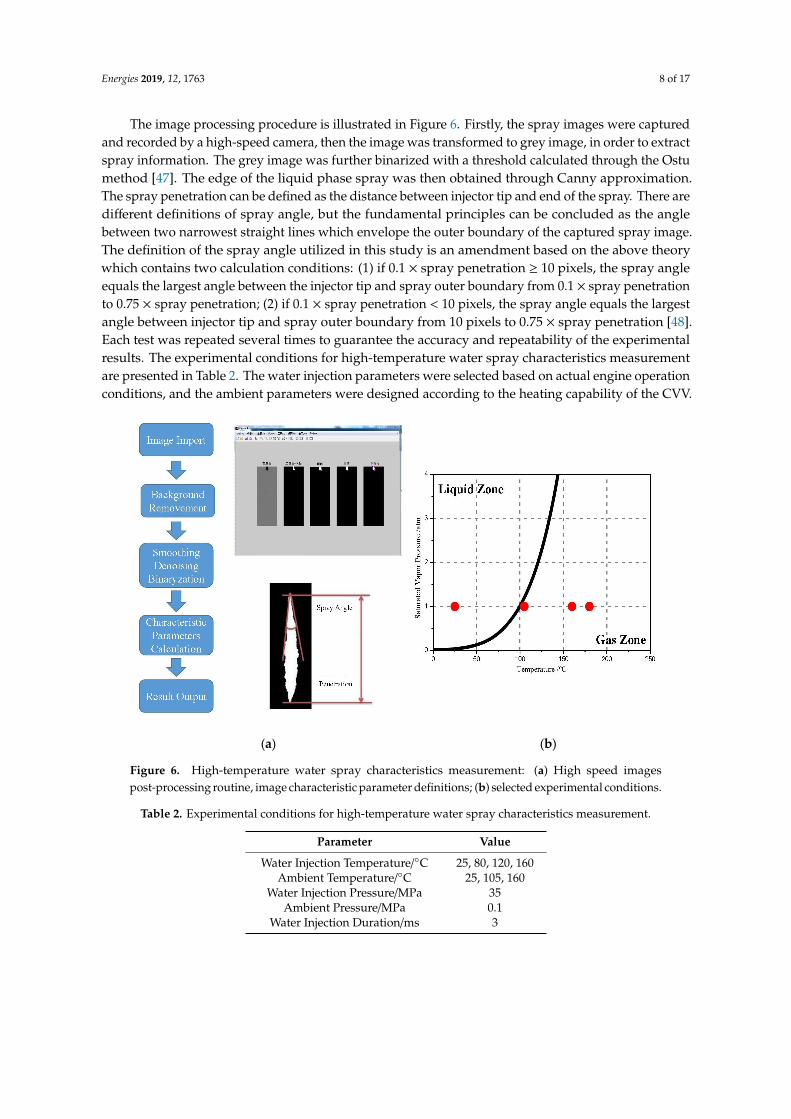
The image processing procedure is illustrated in Figure 6. Firstly, the spray images were capturedand recorded by a high-speed camera, then the image was transformed to grey image, in order to extractspray information. The grey image was further binarized with a threshold calculated through the Ostumethod [47]. The edge of the liquid phase spray was then obtained through Canny approximation.The spray penetration can be defined as the distance between injector tip and end of the spray. There aredifferent definitions of spray angle, but the fundamental principles can be concluded as the anglebetween two narrowest straight lines which envelope the outer boundary of the captured spray image.The definition of the spray angle utilized in this study is an amendment based on the above theorywhich contains two calculation conditions: (1) if 0.1 × spray penetration ≥ 10 pixels, the spray angleequals the largest angle between the injector tip and spray outer boundary from 0.1 × spray penetrationto 0.75 × spray penetration; (2) if 0.1 × spray penetration < 10 pixels, the spray angle equals the largestangle between injector tip and spray outer boundary from 10 pixels to 0.75 × spray penetration [48].Each test was repeated several times to guarantee the accuracy and repeatability of the experimentalresults. The experimental conditions for high-temperature water spray characteristics measurementare presented in Table 2. The water injection parameters were selected based on actual engine operationconditions, and the ambient parameters were designed according to the heating capability of the CVV.
Energies 2019, 12, x FOR PEER REVIEW 9 of 18
(a) (b)
Figure 6. High-temperature water spray characteristics measurement: (a) High speed images post-processing routine, image characteristic parameter definitions; (b) selected experimental conditions.
Table 2. Experimental conditions for high-temperature water spray characteristics measurement.
Parameter Value Water Injection Temperature/°C 25, 80, 120, 160
Ambient Temperature/°C 25, 105, 160 Water Injection Pressure/MPa 35
Ambient Pressure/MPa 0.1 Water Injection Duration/ms 3
Figure 6. High-temperature water spray characteristics measurement: (a) High speed imagespost-processing routine, image characteristic parameter definitions; (b) selected experimental conditions.
Table 2. Experimental conditions for high-temperature water spray characteristics measurement.
Parameter Value
Water Injection Temperature/◦C 25, 80, 120, 160Ambient Temperature/◦C 25, 105, 160
Water Injection Pressure/MPa 35Ambient Pressure/MPa 0.1
Water Injection Duration/ms 3
Energies 2019, 12, 1763 9 of 17
3. Results and Discussion
3.1. High-Pressure Water Injection Characteristics under Different Water Injection and Ambient Pressure
3.1.1. Water Injection Characteristics under Different Water Injection Pressure
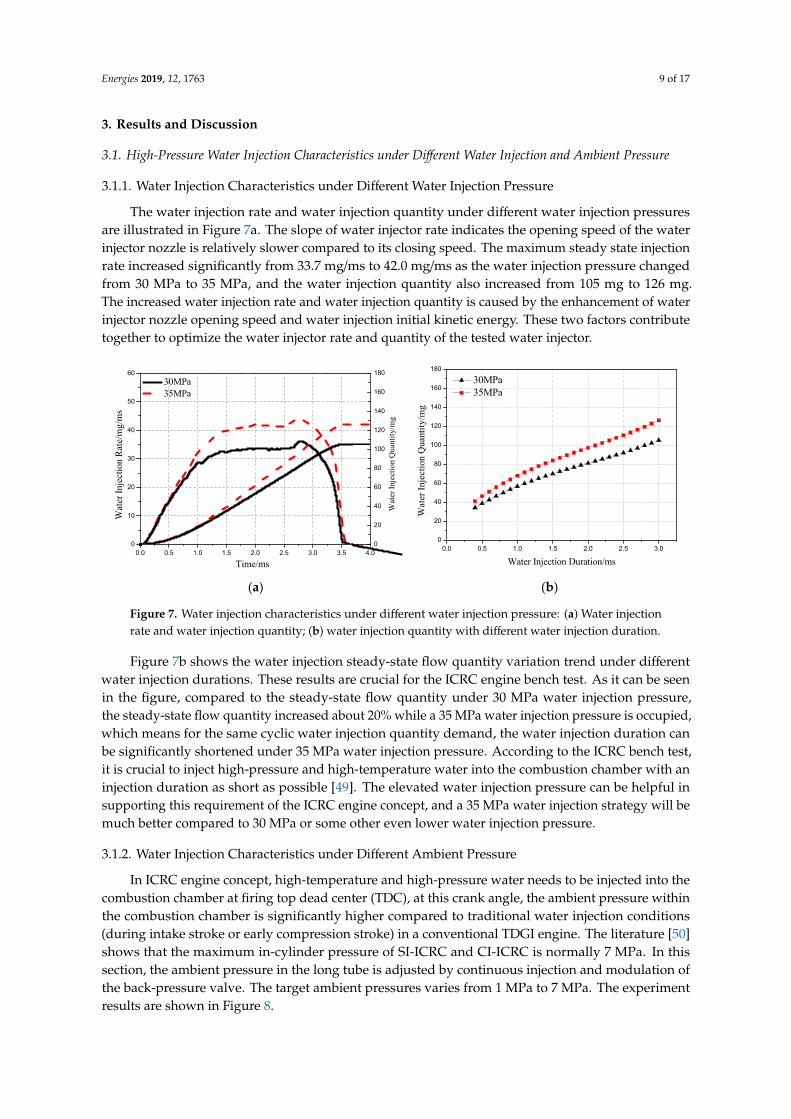
The water injection rate and water injection quantity under different water injection pressuresare illustrated in Figure 7a. The slope of water injector rate indicates the opening speed of the waterinjector nozzle is relatively slower compared to its closing speed. The maximum steady state injectionrate increased significantly from 33.7 mg/ms to 42.0 mg/ms as the water injection pressure changedfrom 30 MPa to 35 MPa, and the water injection quantity also increased from 105 mg to 126 mg.The increased water injection rate and water injection quantity is caused by the enhancement of waterinjector nozzle opening speed and water injection initial kinetic energy. These two factors contributetogether to optimize the water injector rate and quantity of the tested water injector.
Energies 2019, 12, x FOR PEER REVIEW 9 of 17
3. Results and Discussion
3.1. High-Pressure Water Injection Characteristics under Different Water Injection and Ambient Pressure
3.1.1. Water Injection Characteristics under Different Water Injection Pressure
The water injection rate and water injection quantity under different water injection pressures are illustrated in Figure 7a. The slope of water injector rate indicates the opening speed of the water injector nozzle is relatively slower compared to its closing speed. The maximum steady state injection rate increased significantly from 33.7 mg/ms to 42.0 mg/ms as the water injection pressure changed from 30 MPa to 35 MPa, and the water injection quantity also increased from 105 mg to 126 mg. The increased water injection rate and water injection quantity is caused by the enhancement of water injector nozzle opening speed and water injection initial kinetic energy. These two factors contribute together to optimize the water injector rate and quantity of the tested water injector.
(a) (b)
Figure 7. Water injection characteristics under different water injection pressure: (a) Water injection rate and water injection quantity; (b) water injection quantity with different water injection duration.
Figure 7b shows the water injection steady-state flow quantity variation trend under different water injection durations. These results are crucial for the ICRC engine bench test. As it can be seen in the figure, compared to the steady-state flow quantity under 30 MPa water injection pressure, the steady-state flow quantity increased about 20% while a 35 MPa water injection pressure is occupied, which means for the same cyclic water injection quantity demand, the water injection duration can be significantly shortened under 35 MPa water injection pressure. According to the ICRC bench test, it is crucial to inject high-pressure and high-temperature water into the combustion chamber with an injection duration as short as possible [49]. The elevated water injection pressure can be helpful in supporting this requirement of the ICRC engine concept, and a 35 MPa water injection strategy will be much better compared to 30 MPa or some other even lower water injection pressure.
3.1.2. Water Injection Characteristics Under Different Ambient Pressure
In ICRC engine concept, high-temperature and high-pressure water needs to be injected into the combustion chamber at firing top dead center (TDC), at this crank angle, the ambient pressure within the combustion chamber is significantly higher compared to traditional water injection conditions (during intake stroke or early compression stroke) in a conventional TDGI engine. The literature [50] shows that the maximum in-cylinder pressure of SI-ICRC and CI-ICRC is normally 7 MPa. In this section, the ambient pressure in the long tube is adjusted by continuous injection and modulation of the back-pressure valve. The target ambient pressures varies from 1 MPa to 7 MPa. The experiment results are shown in Figure 8.
0.0 0.5 1.0 1.5 2.0 2.5 3.0 3.5 4.00
10
20
30
40
50
60
Wat
er In
ject
ion
Rate
/mg/
ms
Time/ms
30MPa 35MPa
0
20
40
60
80
100
120
140
160
180
Wat
er In
ject
ion
Qua
ntity
/mg
0.0 0.5 1.0 1.5 2.0 2.5 3.00
20
40
60
80
100
120
140
160
180
Wat
er In
ject
ion
Qua
ntity
/mg
Water Injection Duration/ms
30MPa 35MPa
Figure 7. Water injection characteristics under different water injection pressure: (a) Water injectionrate and water injection quantity; (b) water injection quantity with different water injection duration.
Figure 7b shows the water injection steady-state flow quantity variation trend under differentwater injection durations. These results are crucial for the ICRC engine bench test. As it can be seenin the figure, compared to the steady-state flow quantity under 30 MPa water injection pressure,the steady-state flow quantity increased about 20% while a 35 MPa water injection pressure is occupied,which means for the same cyclic water injection quantity demand, the water injection duration canbe significantly shortened under 35 MPa water injection pressure. According to the ICRC bench test,it is crucial to inject high-pressure and high-temperature water into the combustion chamber with aninjection duration as short as possible [49]. The elevated water injection pressure can be helpful insupporting this requirement of the ICRC engine concept, and a 35 MPa water injection strategy will bemuch better compared to 30 MPa or some other even lower water injection pressure.
3.1.2. Water Injection Characteristics under Different Ambient Pressure
In ICRC engine concept, high-temperature and high-pressure water needs to be injected into thecombustion chamber at firing top dead center (TDC), at this crank angle, the ambient pressure withinthe combustion chamber is significantly higher compared to traditional water injection conditions(during intake stroke or early compression stroke) in a conventional TDGI engine. The literature [50]shows that the maximum in-cylinder pressure of SI-ICRC and CI-ICRC is normally 7 MPa. In thissection, the ambient pressure in the long tube is adjusted by continuous injection and modulation ofthe back-pressure valve. The target ambient pressures varies from 1 MPa to 7 MPa. The experimentresults are shown in Figure 8.
Energies 2019, 12, 1763 10 of 17
Energies 2019, 12, x FOR PEER REVIEW 10 of 17
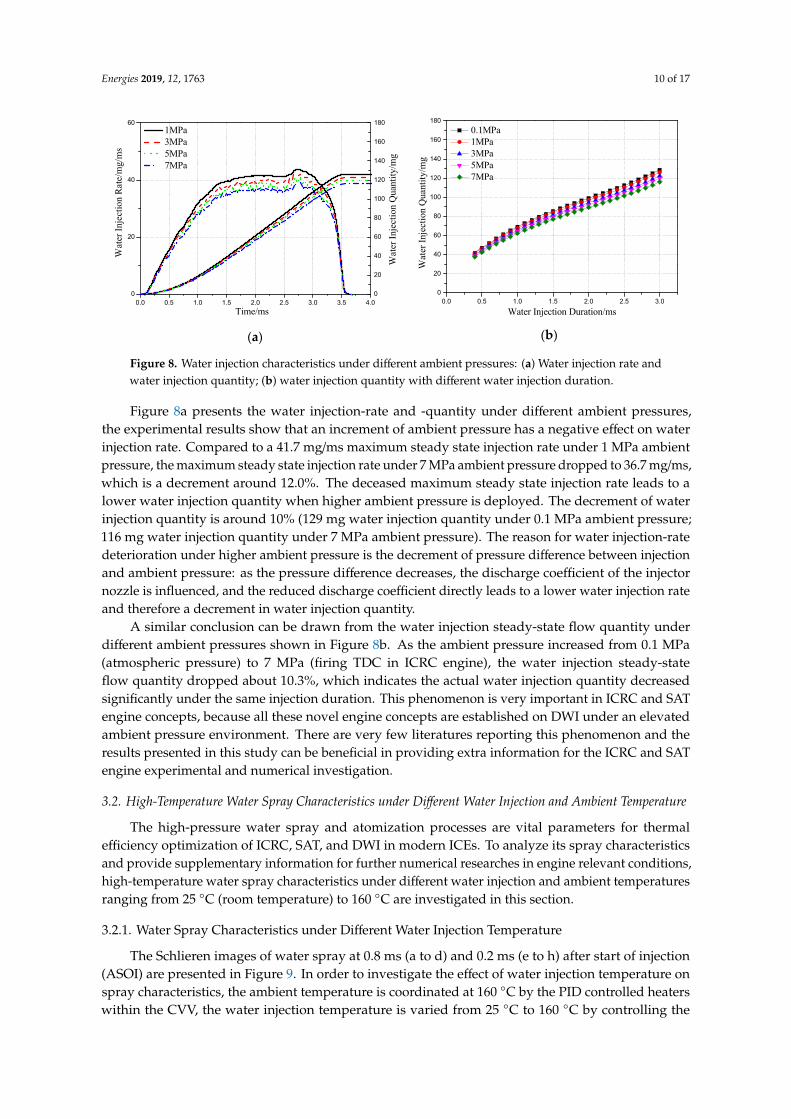
Figure 8a presents the water injection-rate and -quantity under different ambient pressures, the experimental results show that an increment of ambient pressure has a negative effect on water injection rate. Compared to a 41.7 mg/ms maximum steady state injection rate under 1 MPa ambient pressure, the maximum steady state injection rate under 7 MPa ambient pressure dropped to 36.7 mg/ms, which is a decrement around 12.0%. The deceased maximum steady state injection rate leads to a lower water injection quantity when higher ambient pressure is deployed. The decrement of water injection quantity is around 10% (129 mg water injection quantity under 0.1 MPa ambient pressure; 116 mg water injection quantity under 7 MPa ambient pressure). The reason for water injection-rate deterioration under higher ambient pressure is the decrement of pressure difference between injection and ambient pressure: as the pressure difference decreases, the discharge coefficient of the injector nozzle is influenced, and the reduced discharge coefficient directly leads to a lower water injection rate and therefore a decrement in water injection quantity.
(a) (b)
Figure 8. Water injection characteristics under different ambient pressures: (a) Water injection rate and water injection quantity; (b) water injection quantity with different water injection duration.
A similar conclusion can be drawn from the water injection steady-state flow quantity under different ambient pressures shown in Figure 8b. As the ambient pressure increased from 0.1 MPa (atmospheric pressure) to 7 MPa (firing TDC in ICRC engine), the water injection steady-state flow quantity dropped about 10.3%, which indicates the actual water injection quantity decreased significantly under the same injection duration. This phenomenon is very important in ICRC and SAT engine concepts, because all these novel engine concepts are established on DWI under an elevated ambient pressure environment. There are very few literatures reporting this phenomenon and the results presented in this study can be beneficial in providing extra information for the ICRC and SAT engine experimental and numerical investigation.
3.2. High-Temperature Water Spray Characteristics Under Different Water Injection and Ambient Temperature
The high-pressure water spray and atomization processes are vital parameters for thermal efficiency optimization of ICRC, SAT, and DWI in modern ICEs. To analyze its spray characteristics and provide supplementary information for further numerical researches in engine relevant conditions, high-temperature water spray characteristics under different water injection and ambient temperatures ranging from 25 °C (room temperature) to 160 °C are investigated in this section.
3.2.1. Water Spray Characteristics Under Different Water Injection Temperature
The Schlieren images of water spray at 0.8 ms (a to d) and 0.2 ms (e to h) after start of injection (ASOI) are presented in Figure 9. In order to investigate the effect of water injection temperature on spray characteristics, the ambient temperature is coordinated at 160 °C by the PID controlled heaters
0.0 0.5 1.0 1.5 2.0 2.5 3.0 3.5 4.00
20
40
60 1MPa 3MPa 5MPa 7MPa
Time/ms
W
ater
Inje
ctio
n Ra
te/m
g/m
s
0
20
40
60
80
100
120
140
160
180
Wat
er In
ject
ion
Qua
ntity
/mg
0.0 0.5 1.0 1.5 2.0 2.5 3.00
20
40
60
80
100
120
140
160
180
Wat
er In
ject
ion
Qua
ntity
/mg
Water Injection Duration/ms
0.1MPa 1MPa 3MPa 5MPa 7MPa
Figure 8. Water injection characteristics under different ambient pressures: (a) Water injection rate andwater injection quantity; (b) water injection quantity with different water injection duration.
Figure 8a presents the water injection-rate and -quantity under different ambient pressures,the experimental results show that an increment of ambient pressure has a negative effect on waterinjection rate. Compared to a 41.7 mg/ms maximum steady state injection rate under 1 MPa ambientpressure, the maximum steady state injection rate under 7 MPa ambient pressure dropped to 36.7 mg/ms,which is a decrement around 12.0%. The deceased maximum steady state injection rate leads to alower water injection quantity when higher ambient pressure is deployed. The decrement of waterinjection quantity is around 10% (129 mg water injection quantity under 0.1 MPa ambient pressure;116 mg water injection quantity under 7 MPa ambient pressure). The reason for water injection-ratedeterioration under higher ambient pressure is the decrement of pressure difference between injectionand ambient pressure: as the pressure difference decreases, the discharge coefficient of the injectornozzle is influenced, and the reduced discharge coefficient directly leads to a lower water injection rateand therefore a decrement in water injection quantity.
A similar conclusion can be drawn from the water injection steady-state flow quantity underdifferent ambient pressures shown in Figure 8b. As the ambient pressure increased from 0.1 MPa(atmospheric pressure) to 7 MPa (firing TDC in ICRC engine), the water injection steady-stateflow quantity dropped about 10.3%, which indicates the actual water injection quantity decreasedsignificantly under the same injection duration. This phenomenon is very important in ICRC and SATengine concepts, because all these novel engine concepts are established on DWI under an elevatedambient pressure environment. There are very few literatures reporting this phenomenon and theresults presented in this study can be beneficial in providing extra information for the ICRC and SATengine experimental and numerical investigation.
3.2. High-Temperature Water Spray Characteristics under Different Water Injection and Ambient Temperature
The high-pressure water spray and atomization processes are vital parameters for thermalefficiency optimization of ICRC, SAT, and DWI in modern ICEs. To analyze its spray characteristicsand provide supplementary information for further numerical researches in engine relevant conditions,high-temperature water spray characteristics under different water injection and ambient temperaturesranging from 25 ◦C (room temperature) to 160 ◦C are investigated in this section.
3.2.1. Water Spray Characteristics under Different Water Injection Temperature
The Schlieren images of water spray at 0.8 ms (a to d) and 0.2 ms (e to h) after start of injection(ASOI) are presented in Figure 9. In order to investigate the effect of water injection temperature onspray characteristics, the ambient temperature is coordinated at 160 ◦C by the PID controlled heaterswithin the CVV, the water injection temperature is varied from 25 ◦C to 160 ◦C by controlling the

Energies 2019, 12, 1763 11 of 17
heaters installed in the common rail. As it can be seen in the figure, the water spray penetration issignificantly shortened while the injection temperature increased from 25 ◦C to 160 ◦C. The detailedwater spray penetration data at 0.8 ms ASOI are illustrated in Figure 10a. The results show that waterspray is fully developed after 0.8 ms ASOI under all the test conditions, and the water spray penetrationunder 25 ◦C at 0.8 ms ASOI reaches 110 mm compare to 88 mm water spray penetration under 160 ◦C,which is a prominent 20% reduction. The detailed water spray angles under different water injectiontemperature are also calculated and compared. From the water spray angle results presented inFigure 10b, the water injection temperature shows little impact on the water spray angle, the waterspray angle under 25 ◦C water injection temperature at 0.8 ms ASOI is 45.3◦ and 47.4◦ under 160 ◦Cwater injection temperature, but from another perspective, the water spray angle during the initialand developing stage of the high-temperature water injection shows linear enlargement relationshipas the water injection increased. The water spray angle under 25 ◦C water injection temperature at0.2 ms ASOI is 40.6◦ and the water spray angle under 160 ◦C water injection temperature increasedsignificantly to 61.3◦, which is a 50.1% increment.
Energies 2019, 12, x FOR PEER REVIEW 11 of 17
within the CVV, the water injection temperature is varied from 25 °C to 160 °C by controlling the heaters installed in the common rail. As it can be seen in the figure, the water spray penetration is significantly shortened while the injection temperature increased from 25 °C to 160 °C. The detailed water spray penetration data at 0.8 ms ASOI are illustrated in Figure 10a. The results show that water spray is fully developed after 0.8 ms ASOI under all the test conditions, and the water spray penetration under 25 °C at 0.8 ms ASOI reaches 110 mm compare to 88 mm water spray penetration under 160 °C, which is a prominent 20% reduction. The detailed water spray angles under different water injection temperature are also calculated and compared. From the water spray angle results presented in Figure 10b, the water injection temperature shows little impact on the water spray angle, the water spray angle under 25 °C water injection temperature at 0.8 ms ASOI is 45.3° and 47.4° under 160 °C water injection temperature, but from another perspective, the water spray angle during the initial and developing stage of the high-temperature water injection shows linear enlargement relationship as the water injection increased. The water spray angle under 25 °C water injection temperature at 0.2 ms ASOI is 40.6° and the water spray angle under 160 °C water injection temperature increased significantly to 61.3°, which is a 50.1% increment.
(a) (b) (c) (d) (e) (f) (g) (h)
Figure 9. Water spray images under different water injection temperature: (a) 25 °C‒160 °C at 0.8 ms after start of injection (ASOI); (b) 80 °C‒160 °C at 0.8 ms ASOI; (c) 105 °C‒160 °C at 0.8 ms ASOI; (d) 160 °C‒160 °C at 0.8 ms ASOI; (e) 25 °C‒160 °C at 0.2 ms ASOI; (f) 80 °C‒160 °C at 0.2 ms ASOI; (g) 105 °C‒160 °C at 0.2 ms ASOI; (h) 160 °C‒160 °C at 0.2 ms ASOI.
(a)
(b)
Figure 10. Water spray characteristics under different water injection temperature: (a) Spray penetration; (b) spray angle.
0.0 0.2 0.4 0.6 0.8 1.0
0
20
40
60
80
100
120
Spra
y Pe
netra
tion/
mm
Time/ms
25℃ 80℃ 120℃ 160℃
Ambient Temperature:160℃Ambient Pressure:0.1MPa
0.2 0.4 0.6 0.80
10
20
30
40
50
60
70
80
Ambient Temperature:160℃ Ambient Pressure:0.1MPa
Spra
y A
ngle
/°
Time/ms
25℃ 80℃ 120℃ 160℃
Figure 9. Water spray images under different water injection temperature: (a) 25 ◦C–160 ◦C at 0.8 msafter start of injection (ASOI); (b) 80 ◦C–160 ◦C at 0.8 ms ASOI; (c) 105 ◦C–160 ◦C at 0.8 ms ASOI;(d) 160 ◦C–160 ◦C at 0.8 ms ASOI; (e) 25 ◦C–160 ◦C at 0.2 ms ASOI; (f) 80 ◦C–160 ◦C at 0.2 ms ASOI;(g) 105 ◦C–160 ◦C at 0.2 ms ASOI; (h) 160 ◦C–160 ◦C at 0.2 ms ASOI.
Energies 2019, 12, x FOR PEER REVIEW 11 of 17
within the CVV, the water injection temperature is varied from 25 °C to 160 °C by controlling the heaters installed in the common rail. As it can be seen in the figure, the water spray penetration is significantly shortened while the injection temperature increased from 25 °C to 160 °C. The detailed water spray penetration data at 0.8 ms ASOI are illustrated in Figure 10a. The results show that water spray is fully developed after 0.8 ms ASOI under all the test conditions, and the water spray penetration under 25 °C at 0.8 ms ASOI reaches 110 mm compare to 88 mm water spray penetration under 160 °C, which is a prominent 20% reduction. The detailed water spray angles under different water injection temperature are also calculated and compared. From the water spray angle results presented in Figure 10b, the water injection temperature shows little impact on the water spray angle, the water spray angle under 25 °C water injection temperature at 0.8 ms ASOI is 45.3° and 47.4° under 160 °C water injection temperature, but from another perspective, the water spray angle during the initial and developing stage of the high-temperature water injection shows linear enlargement relationship as the water injection increased. The water spray angle under 25 °C water injection temperature at 0.2 ms ASOI is 40.6° and the water spray angle under 160 °C water injection temperature increased significantly to 61.3°, which is a 50.1% increment.
(a) (b) (c) (d) (e) (f) (g) (h)
Figure 9. Water spray images under different water injection temperature: (a) 25 °C‒160 °C at 0.8 ms after start of injection (ASOI); (b) 80 °C‒160 °C at 0.8 ms ASOI; (c) 105 °C‒160 °C at 0.8 ms ASOI; (d) 160 °C‒160 °C at 0.8 ms ASOI; (e) 25 °C‒160 °C at 0.2 ms ASOI; (f) 80 °C‒160 °C at 0.2 ms ASOI; (g) 105 °C‒160 °C at 0.2 ms ASOI; (h) 160 °C‒160 °C at 0.2 ms ASOI.
(a)
(b)
Figure 10. Water spray characteristics under different water injection temperature: (a) Spray penetration; (b) spray angle.
0.0 0.2 0.4 0.6 0.8 1.0
0
20
40
60
80
100
120
Spra
y Pe
netra
tion/
mm
Time/ms
25℃ 80℃ 120℃ 160℃
Ambient Temperature:160℃Ambient Pressure:0.1MPa
0.2 0.4 0.6 0.80
10
20
30
40
50
60
70
80
Ambient Temperature:160℃ Ambient Pressure:0.1MPa
Spra
y A
ngle
/°
Time/ms
25℃ 80℃ 120℃ 160℃
Figure 10. Water spray characteristics under different water injection temperature: (a) Spray penetration;(b) spray angle.
Energies 2019, 12, 1763 12 of 17
The reason for water spray penetration decrement with an increasing water injection temperatureis enhanced water evaporation rate, as the temperature of water droplet carried by water sprayincreased, the evaporation rate of water droplet is enhanced which leads to smaller sauter meandiameter (SMD) and larger energy dissipation, therefore leading to a shortened spray penetration asthe water injection temperature increased.
Unlike the relatively simple effect of water injection temperature on spray penetration, the sprayangle is a selection to enhance the evaporation rate between the water injection temperature andambient temperature within the CVV. During the early stage of high-pressure water jets (e.g., 0.2 msASOI), there is relatively shorter time for the injected water spray to contact with surrounding hotair, so the evaporation rate of water droplet within spray is mainly affected by the water injectiontemperature which lead to a larger spray angle with higher water injection temperature, on the otherhand, as the water spray entering a fully developed stage (e.g., 0.8 ms ASOI), the injected waterdroplet within the spray boundary contact with the surrounding hot air directly and the ambienttemperature becomes dominant factor which influence the evaporation rate, with an unchangedambient temperature (especially temperature above boiling temperature), the spray angle within fullydeveloped waster spray remains similar even though the water injection temperature has varied.
3.2.2. Water Spray Characteristics under Different Ambient Temperature
As discussed above, the ambient temperature shows a significant effect on the water spraycharacteristics. In order to investigate the detailed effect mechanism of ambient temperature on waterspray and atomization, the macroscopic water spray images are captured by varying the temperaturesetting in the PID controlled heaters, by doing so, the ambient temperature within the CVV can be setat 25 ◦C, 105 ◦C, and 160 ◦C, and in order to eliminate the interference, the water injection temperatureis fixed at 160 ◦C.
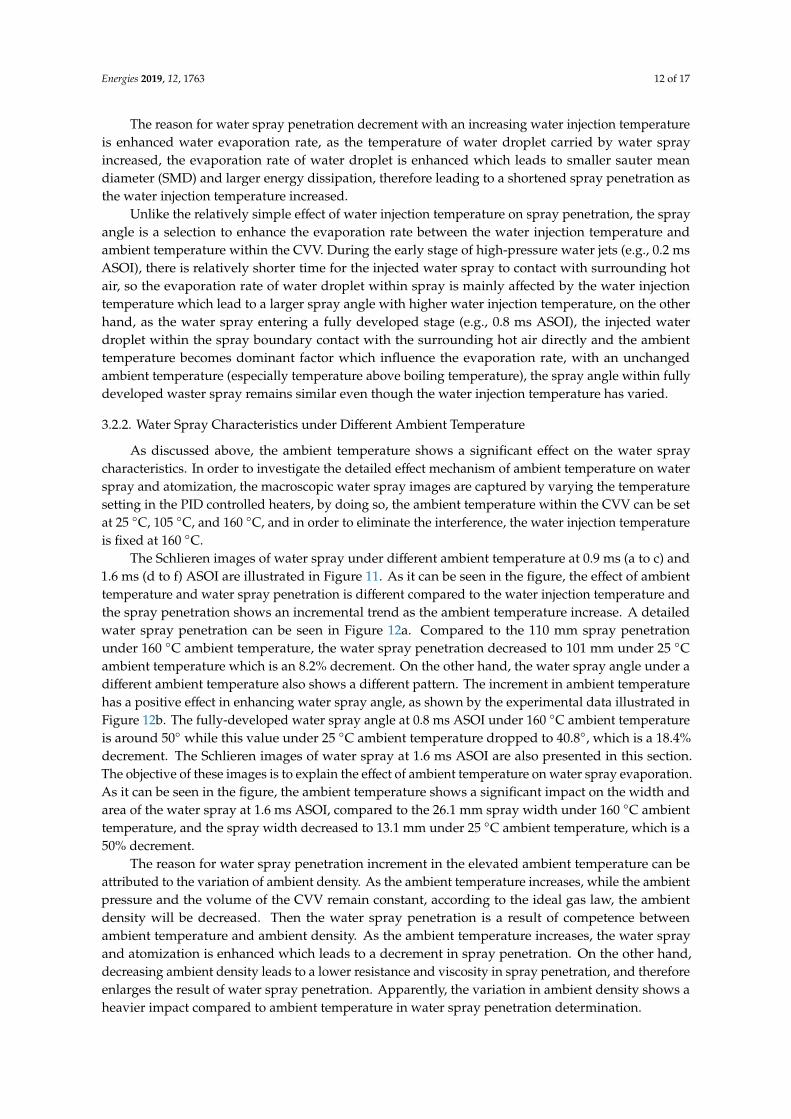
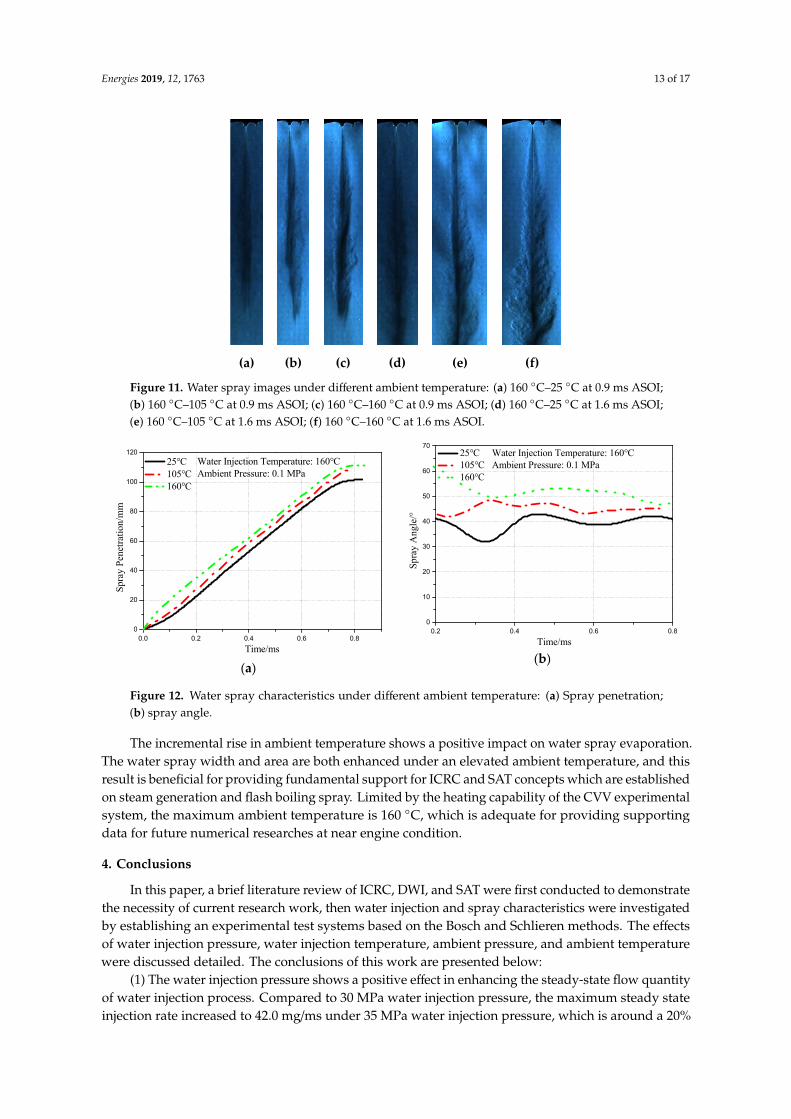
The Schlieren images of water spray under different ambient temperature at 0.9 ms (a to c) and1.6 ms (d to f) ASOI are illustrated in Figure 11. As it can be seen in the figure, the effect of ambienttemperature and water spray penetration is different compared to the water injection temperature andthe spray penetration shows an incremental trend as the ambient temperature increase. A detailedwater spray penetration can be seen in Figure 12a. Compared to the 110 mm spray penetrationunder 160 ◦C ambient temperature, the water spray penetration decreased to 101 mm under 25 ◦Cambient temperature which is an 8.2% decrement. On the other hand, the water spray angle under adifferent ambient temperature also shows a different pattern. The increment in ambient temperaturehas a positive effect in enhancing water spray angle, as shown by the experimental data illustrated inFigure 12b. The fully-developed water spray angle at 0.8 ms ASOI under 160 ◦C ambient temperatureis around 50◦ while this value under 25 ◦C ambient temperature dropped to 40.8◦, which is a 18.4%decrement. The Schlieren images of water spray at 1.6 ms ASOI are also presented in this section.The objective of these images is to explain the effect of ambient temperature on water spray evaporation.As it can be seen in the figure, the ambient temperature shows a significant impact on the width andarea of the water spray at 1.6 ms ASOI, compared to the 26.1 mm spray width under 160 ◦C ambienttemperature, and the spray width decreased to 13.1 mm under 25 ◦C ambient temperature, which is a50% decrement.
The reason for water spray penetration increment in the elevated ambient temperature can beattributed to the variation of ambient density. As the ambient temperature increases, while the ambientpressure and the volume of the CVV remain constant, according to the ideal gas law, the ambientdensity will be decreased. Then the water spray penetration is a result of competence betweenambient temperature and ambient density. As the ambient temperature increases, the water sprayand atomization is enhanced which leads to a decrement in spray penetration. On the other hand,decreasing ambient density leads to a lower resistance and viscosity in spray penetration, and thereforeenlarges the result of water spray penetration. Apparently, the variation in ambient density shows aheavier impact compared to ambient temperature in water spray penetration determination.
Energies 2019, 12, 1763 13 of 17Energies 2019, 12, x FOR PEER REVIEW 13 of 17
(a) (b) (c) (d) (e) (f)
Figure 11. Water spray images under different ambient temperature: (a) 160 °C‒25 °C at 0.9 ms ASOI; (b) 160 °C‒105 °C at 0.9 ms ASOI; (c) 160 °C‒160 °C at 0.9 ms ASOI; (d) 160 °C‒25 °C at 1.6 ms ASOI; (e) 160 °C‒105 °C at 1.6 ms ASOI; (f) 160 °C‒160 °C at 1.6 ms ASOI.
(a)
(b)
Figure 12. Water spray characteristics under different ambient temperature: (a) Spray penetration; (b) spray angle.
The reason for water spray penetration increment in the elevated ambient temperature can be attributed to the variation of ambient density. As the ambient temperature increases, while the ambient pressure and the volume of the CVV remain constant, according to the ideal gas law, the ambient density will be decreased. Then the water spray penetration is a result of competence between ambient temperature and ambient density. As the ambient temperature increases, the water spray and atomization is enhanced which leads to a decrement in spray penetration. On the other hand, decreasing ambient density leads to a lower resistance and viscosity in spray penetration, and therefore enlarges the result of water spray penetration. Apparently, the variation in ambient density shows a heavier impact compared to ambient temperature in water spray penetration determination.
The incremental rise in ambient temperature shows a positive impact on water spray evaporation. The water spray width and area are both enhanced under an elevated ambient temperature, and this result is beneficial for providing fundamental support for ICRC and SAT concepts which are established on steam generation and flash boiling spray. Limited by the heating capability of the CVV experimental system, the maximum ambient temperature is 160 °C, which is adequate for providing supporting data for future numerical researches at near engine condition.
0.0 0.2 0.4 0.6 0.80
20
40
60
80
100
120Water Injection Temperature: 160℃Ambient Pressure: 0.1 MPa
25℃ 105℃ 160℃
Spra
y Pe
netra
tion/
mm
Time/ms
0.2 0.4 0.6 0.80
10
20
30
40
50
60
70Water Injection Temperature: 160℃Ambient Pressure: 0.1 MPa
25℃ 105℃ 160℃
Spra
y A
ngle
/°
Time/ms
Figure 11. Water spray images under different ambient temperature: (a) 160 ◦C–25 ◦C at 0.9 ms ASOI;(b) 160 ◦C–105 ◦C at 0.9 ms ASOI; (c) 160 ◦C–160 ◦C at 0.9 ms ASOI; (d) 160 ◦C–25 ◦C at 1.6 ms ASOI;(e) 160 ◦C–105 ◦C at 1.6 ms ASOI; (f) 160 ◦C–160 ◦C at 1.6 ms ASOI.
Energies 2019, 12, x FOR PEER REVIEW 13 of 17
(a) (b) (c) (d) (e) (f)
Figure 11. Water spray images under different ambient temperature: (a) 160 °C‒25 °C at 0.9 ms ASOI; (b) 160 °C‒105 °C at 0.9 ms ASOI; (c) 160 °C‒160 °C at 0.9 ms ASOI; (d) 160 °C‒25 °C at 1.6 ms ASOI; (e) 160 °C‒105 °C at 1.6 ms ASOI; (f) 160 °C‒160 °C at 1.6 ms ASOI.
(a)
(b)
Figure 12. Water spray characteristics under different ambient temperature: (a) Spray penetration; (b) spray angle.
The reason for water spray penetration increment in the elevated ambient temperature can be attributed to the variation of ambient density. As the ambient temperature increases, while the ambient pressure and the volume of the CVV remain constant, according to the ideal gas law, the ambient density will be decreased. Then the water spray penetration is a result of competence between ambient temperature and ambient density. As the ambient temperature increases, the water spray and atomization is enhanced which leads to a decrement in spray penetration. On the other hand, decreasing ambient density leads to a lower resistance and viscosity in spray penetration, and therefore enlarges the result of water spray penetration. Apparently, the variation in ambient density shows a heavier impact compared to ambient temperature in water spray penetration determination.
The incremental rise in ambient temperature shows a positive impact on water spray evaporation. The water spray width and area are both enhanced under an elevated ambient temperature, and this result is beneficial for providing fundamental support for ICRC and SAT concepts which are established on steam generation and flash boiling spray. Limited by the heating capability of the CVV experimental system, the maximum ambient temperature is 160 °C, which is adequate for providing supporting data for future numerical researches at near engine condition.
0.0 0.2 0.4 0.6 0.80
20
40
60
80
100
120Water Injection Temperature: 160℃Ambient Pressure: 0.1 MPa
25℃ 105℃ 160℃
Spra
y Pe
netra
tion/
mm
Time/ms
0.2 0.4 0.6 0.80
10
20
30
40
50
60
70Water Injection Temperature: 160℃Ambient Pressure: 0.1 MPa
25℃ 105℃ 160℃
Spra
y A
ngle
/°
Time/ms
Figure 12. Water spray characteristics under different ambient temperature: (a) Spray penetration;(b) spray angle.
The incremental rise in ambient temperature shows a positive impact on water spray evaporation.The water spray width and area are both enhanced under an elevated ambient temperature, and thisresult is beneficial for providing fundamental support for ICRC and SAT concepts which are establishedon steam generation and flash boiling spray. Limited by the heating capability of the CVV experimentalsystem, the maximum ambient temperature is 160 ◦C, which is adequate for providing supportingdata for future numerical researches at near engine condition.
4. Conclusions
In this paper, a brief literature review of ICRC, DWI, and SAT were first conducted to demonstratethe necessity of current research work, then water injection and spray characteristics were investigatedby establishing an experimental test systems based on the Bosch and Schlieren methods. The effectsof water injection pressure, water injection temperature, ambient pressure, and ambient temperaturewere discussed detailed. The conclusions of this work are presented below:
(1) The water injection pressure shows a positive effect in enhancing the steady-state flow quantityof water injection process. Compared to 30 MPa water injection pressure, the maximum steady stateinjection rate increased to 42.0 mg/ms under 35 MPa water injection pressure, which is around a 20%
Energies 2019, 12, 1763 14 of 17
increment. It is beneficial in proving higher water injection pressure in ICRC and SAT concepts becausethese concepts require a water injection duration as short as possible.
(2) The increment of ambient pressure shows negative impact on steady-state flow quantityenhancement, the water injection quantity under same water injection pressure can be dropped around10.3% while the ambient pressure increased from 0.1 MPa to 7 MPa. This is an important discoverywhich is rarely reported in current literatures, as the water injection process within ICRC and SAT areoperated under elevated in-cylinder pressure, and the effect of ambient pressure on water injectioncharacteristics should be considered in experimental or numerical researches.
(3) The increment in water injection temperature shortens water spray penetration caused byan enhanced water spray evaporation rate. The reduction rate reaches 20% under the selectedexperimental conditions. The water spray angle under different water injection temperatures showscomplex variation. During the initial and developing stage of water spray, the increase in waterinjection temperature leads to a larger spray angle caused by the enhanced water spray evaporationrate itself, while within a fully developed water spray, the spray angle is mainly affected by ambienttemperature as there is sufficient time for the water droplets within the spray boundary to make contactwith the surrounding hot air directly.
(4) The elevated ambient temperature is beneficial in providing a faster water evaporation, and dueto the reduction in ambient density as the ambient temperature increases, the water spray penetrationis shortened. As a limitation of the established CVV test system, the highest ambient temperaturereached during experiment is 160 ◦C which will be further investigated in a detailed numerical CVVmodel with near-engine conditions.
The uncertainty and sensitivity analysis, high-fidelity simulations, and particle behaviors will beaddressed in future experiments by using multi-data comparisons [51], commercial computational fluiddynamics software [52], and a Malvern particle size analyzer [53] to further analyze the fundamentalmechanisms of interactions between flow, water vapor, and evaporation.
Author Contributions: The authors contribute of this research as follows: Conceptualization, Z.K. and Z.W.;Methodology, Z.K.; Software, Z.K. and Z.Z.; Investigation, Z.K. and Z.Z.; Formal analysis, Z.K. and Z.Z.; Resources,J.D., Z.W. and L.L.; Writing—original draft preparation, Z.K.; Writing—editing and review, Z.W.; Supervision,Z.W.; Project administration, J.D. and Z.W.; Funding acquisition, Z.K. and Z.W.
Funding: This research was funded by the Fundamental Research Funds for the Central Universities No.2019CDXYQC0002, National Natural Science Foundation of China No. 91441125 and Joint Fund of Researchutilizing Largescale Scientific Facilities No. U1832179.
Acknowledgments: The authors are grateful for the technical support of Huifeng Gong from the National Instituteof Advanced Industrial Science and Technology in Japan.
Conflicts of Interest: The authors declare no conflict of interest.
Nomenclature
ICE Internal combustion engineBEV Battery electric vehicleFCV Fuel cell vehicleICRC Internal combustion Rankine cycleHEV Hybrid electric vehicleREEV Range extension electric vehicleDWI Direct water injectionTGDI Turbocharge gasoline direct injectionSA Spark advanceMBT maximum torqueAFR Air-fuel ratioWI Water injection

Energies 2019, 12, 1763 15 of 17
PFI Port fuel injectionPWI Port water injectionWLTP Worldwide harmonized light vehicles test procedureOEM Original equipment manufacturerVVA Variable valve actuationSAT Steam assistant technologySLFB Superheated liquid flash boilingCVV Constant volume vesselDAQ Data acquisitionPID Proportion integration differentiationASOI After start of injectionSMD Sauter mean diameter
References
1. Kalghatgi, G. Is it really the end of internal combustion engines and petroleum in transport? Appl. Energy2018, 225, 965–974. [CrossRef]
2. Grube, T.; Stolten, D. The Impact of Drive Cycles and Auxiliary Power on Passenger Car Fuel Economy.Energies 2018, 11, 1010. [CrossRef]
3. Balluchi, A.; Benvenuti, L.; Di Benedetto, M.D.; Pinello, C.; Sangiovanni-Vincentelli, A.L. Automotive enginecontrol and hybrid systems: Challenges and opportunities. Proc. IEEE 2000, 88, 888–912. [CrossRef]
4. Zeng, X.H.; Feng, T.; Yang, N.N. Engine Operation Region Based Energy Management Strategy for theAll-Wheel-Drive Plug-in Hybrid Electric Vehicle. In Proceedings of the 14th IFToMM World Congress, Taipei,Taiwan, 25–30 October 2015; pp. 460–470.
5. Bilger, R.W.; Wu, Z. Carbon capture for automobiles using internal combustion Rankine cycle engines. J. Eng.Gas Turbines Power 2009, 131, 034502. [CrossRef]
6. Bilger, R.W. Zero Release Combustion Technologies and the Oxygen Economy. In Proceedings of the FifthInternational Conference on Technologies and Combustion for a Clean Environment, Lisbon, Portugal,12–15 July 1999; pp. 1039–1046.
7. Wu, Z.-J.; Yu, X.; Fu, L.-Z.; Deng, J.; Li, L.-G. Experimental study of the effect of water injection on the cycleperformance of an internal-combustion Rankine cycle engine. Proc. Inst. Mech. Eng. Part D J. Automob. Eng.2014, 228, 580–588. [CrossRef]
8. Yu, X.; Wu, Z.; Fu, L.; Deng, J.; Hu, Z.; Li, L. Study of Combustion Characteristics of a Quasi Internal CombustionRankine Cycle Engine; SAE Technical Paper 2013-01-2698; SAE International: Detroit, MI, USA, 2013.
9. Wu, Z.; Fu, L.; Gao, Y.; Yu, X.; Deng, J.; Li, L. Thermal efficiency boundary analysis of an internal combustionRankine cycle engine. Energy 2016, 94, 38–49. [CrossRef]
10. Fu, L.Z.; Yu, X.; Deng, J.; Wu, Z.J. Development of internal combustion Rankine cycle engine test system.Chin. Intern. Combust. Engine Eng. 2013, 6, 87–92.
11. Yu, X.; Fu, L.; Deng, J.; Wu, Z. Influence of Engine Load on Thermo Efficiency of Internal CombustionRankine Engine. J. Combust. Sci. Technol. 2014, 20, 492–497.
12. Fu, L.Z.; Wu, Z.; Li, L.; Yu, X. Effect of Water Injection Temperature on Characteristics of Combustion and Emissionsfor Internal Combustion Rankine Cycle Engine; SAE Technical Paper 2014-01-2600; SAE International: Detroit,MI, USA, 2014.
13. Kang, Z.; Wu, Z.; Fu, L.; Deng, J.; Hu, Z.; Li, L. Experimental Study of Ion Current Signals and Characteristicsin an Internal Combustion Rankine Cycle Engine Based on Water Injection. J. Eng. Gas Turbines Power 2018,140, 111506. [CrossRef]
14. Kang, Z.; Fu, L.; Deng, J. Experimental study of knock control in an internal combustion rankine cycle engine.J. Tongji Univ. Nat. Sci. 2017, 7, 1030–1036.
15. Wu, Z.; Kang, Z.; Deng, J.; Hu, Z.; Li, L. Effect of oxygen content on n-heptane auto-ignition characteristics ina HCCI engine. Appl. Energy 2016, 184, 594–604. [CrossRef]
16. Kang, Z.; Wu, Z.; Zhang, Z.; Deng, J.; Hu, Z.; Li, L. Study of the combustion characteristics of a HCCI enginecoupled with oxy-fuel combustion mode. SAE Int. J. Engines 2017, 10, 908–916. [CrossRef]
Energies 2019, 12, 1763 16 of 17
17. Kang, Z.; Chen, S.; Wu, Z.; Deng, J.; Hu, Z.; Li, L. Simulation Study of Water Injection Strategy in ImprovingCycle Efficiency Based on a Novel Compression Ignition Oxy-Fuel Combustion Engine. SAE Int. J. Engines2018, 11, 935–945. [CrossRef]
18. Wang, Z.; Liu, H.; Reitz, R.D. Knocking combustion in spark-ignition engines. Prog. Energy Combust. Sci.2017, 61, 78–112. [CrossRef]
19. Bradley, D.; Kalghatgi, G.T. Pre-ignition and super knock in turbo charged spark ignition engines. Int. J.Engine Res. 2012, 13, 399–414.
20. Xu, H.; Yao, A.; Yao, C.; Gao, J. Investigation of energy transformation and damage effect under severe knockof engines. Appl. Energy 2017, 203, 506–521. [CrossRef]
21. Wang, Z.; Qi, Y.; He, X.; Wang, J.; Shuai, S.; Law, C.K. Analysis of pre-ignition to super-knock: Hotspot-induceddeflagration to detonation. Fuel 2015, 144, 222–227. [CrossRef]
22. Boretti, A. Water injection in directly injected turbocharged spark ignition engines. Appl. Therm. Eng. 2013,52, 62–68. [CrossRef]
23. De Bellis, V.; Bozza, F.; Teodosio, L.; Valentino, G. Experimental and numerical study of the water injectionto improve the fuel economy of a small size turbocharged SI engine. SAE Int. J. Engines 2017, 10, 550–561.[CrossRef]
24. Worm, J.; Naber, J.; Duncan, J.; Barros, S.; Atkinson, W. Water injection as an enabler for increased efficiencyat high-load in a direct injected, boosted, SI engine. SAE Int. J. Engines 2017, 10, 951–958. [CrossRef]
25. Böhm, M.; Mährle, W.; Bartelt, H.C.; Rubbert, S. Functional integration of water injection into the gasolineengine. MTZ Worldw. 2016, 77, 36–41. [CrossRef]
26. Pauer, T.; Frohnmaier, M.; Walther, J.; Schenk, P.; Hettinger, A.; Kampmann, S. Optimization of gasolineengines by water injection. In Proceedings of the 37th International Vienna Motor Symposium, Vienna,Austria, 28–29 April 2016.
27. Hoppe, F.; Thewes, M.; Baumgarten, H.; Dohmen, J. Water injection for gasoline engines: Potentials,challenges, and solutions. Int. J. Engine Res. 2016, 17, 86–96. [CrossRef]
28. Atkinson, W.; Barros, S.; Piduru, N. In Cylinder NOx Emissions Control via Water Injection. In Proceedingsof the ASME 2015 Internal Combustion Engine Division Fall Technical Conference, Houston, TX, USA,8–11 November 2015; p. V002T04A008.
29. Zhu, S.; Hu, B.; Akehurst, S.; Copeland, C.; Lewis, A.; Yuan, H.; Kennedy, I.; Bernards, J.; Branney, C. A reviewof water injection applied on the internal combustion engine. Energy Convers. Manag. 2019, 184, 139–158.[CrossRef]
30. Hoppe, F.; Thewes, M.; Seibel, J.; Balazs, A.; Scharf, J. Evaluation of the Potential of Water Injection forGasoline Engines. SAE Int. J. Engines 2017, 10, 2500–2512. [CrossRef]
31. Kim, J.; Park, H.; Bae, C.; Choi, M.; Kwak, Y. Effects of water direct injection on the torque enhancement andfuel consumption reduction of a gasoline engine under high-load conditions. Int. J. Engine Res. 2016, 17,795–808. [CrossRef]
32. Miyamoto, N.; Ogawa, H.; Wang, J.; Ohashi, H. Significant NOx reductions with direct water injection intothe sub-chamber of an IDI diesel engine. SAE Trans. 1995, 104, 1085–1092.
33. Chybowski, L.; Laskowski, R.; Gawdzinska, K. An overview of systems supplying water into the combustionchamber of diesel engines to decrease the amount of nitrogen oxides in exhaust gas. J. Mar. Sci. Technol.2015, 20, 393–405. [CrossRef]
34. Laskowski, R.; Chybowski, L.; Gawdzinska, K. An engine room simulator as a tool for environmentaleducation of marine engineers. In New Contributions in Information Systems and Technologies; Springer: Cham,Switzerland, 2015; pp. 311–322.
35. Zhang, Z.; Kang, Z.; Jiang, L.; Chao, Y.; Deng, J.; Hu, Z.; Li, L.; Wu, Z. Effect of direct water injection duringcompression stroke on thermal efficiency optimization of common rail diesel engine. Energy Procedia 2017,142, 1251–1258. [CrossRef]
36. Tauzia, X.; Maiboom, A.; Shah, S.R. Experimental study of inlet manifold water injection on combustion andemissions of an automotive direct injection diesel engine. Energy 2010, 35, 3628–3639. [CrossRef]
37. Pei, P.; Lu, Y. Energy-saving technologies of the unconventional thermal cycle internal combustion engines.J. Automot. Saf. Energy 2013, 4, 1–15.
38. Osman, A. Feasibility Study of a Novel Combustion Cycle Involving Oxygen and Water; SAE Technical Paper2009-01-2808; SAE International: Detroit, MI, USA, 2009.

Energies 2019, 12, 1763 17 of 17
39. Conklin, J.C.; Szybist, J.P. A highly efficient six stroke internal combustion engine cycle with water injectionfor in-cylinder exhaust heat recovery. Energy 2010, 35, 1658–1664. [CrossRef]
40. Fu, J.; Liu, J.; Ren, C.; Wang, L.; Deng, B.; Xu, Z. An open steam power cycle used for IC engine exhaust gasenergy recovery. Energy 2012, 44, 544–554. [CrossRef]
41. Boretti, A.; Osman, A.; Aris, I. Direct injection of hydrogen, Oxygen and water in a novel two stroke engine.Int. J. Hydrogen Energy 2011, 36, 10100–10106. [CrossRef]
42. Hewavitarane, D.; Yoshiyama, S.; Wadahama, H.; Li, X. The Development of a Superheated Liquid Flash,Boiling (S.L.F.B) Engine for Waste Heat Recovery from Reciprocating Internal Combustion Engines. SAE Int.J. Engines 2014, 7, 1705–1721. [CrossRef]
43. Shen, L.; Li, F. Study on the measuring experiment for Bosch injection rate. Chin. Intern. Combust. Engine Eng.1981, 2, 9–15.
44. Bosch, W. The Fuel Rate Indicator: A New Measuring Instrument for Display of the Characteristics of IndividualInjection; SAE Technical Paper 660749; SAE International: Detroit, MI, USA, 1966.
45. Payri, R.; Rubio, F.J.S.; Gimeno, J.; Bracho, G. A new methodology for correcting the signal cumulativephenomenon on injection rate measurements. Exp. Tech. 2008, 32, 46–49. [CrossRef]
46. Zhang, Z.; Zhao, F.; Hu, Z.; Li, L. An Experimental Study of Multiple Injection Rate and Spray CharacteristicsBased on the Long Tube Method. Trans. CSICE 2012, 30, 330–335.
47. Ostu, N. A threshold selection method from gray-level histogram. IEEE Trans. Syst. Man Cybern. 1979,9, 62–66.
48. Gao, Y.; Li, L.G.; Gao, Y.; Di Huang, W.; Deng, J.; Gu, T.L. Analysis of the difference of spray angles based onvarious definitions and calculation criterions. In Proceedings of the 14th ILASS—Asia Annual Conference,Jeju Island, Korea, 21–22 October 2010.
49. Fu, L.; Wu, Z.; Yu, X.; Deng, J. Experimental study of effect of water injection strategy on combustion stabilityin internal combustion Rankine cycle engine. Chin. Intern. Combust. Engine Eng. 2014, 35, 38–45.
50. Fu, L.; Wu, Z.; Yu, X.; Deng, J.; Hu, Z.; Li, L. Experimental investigation of combustion and emissioncharacteristics for internal combustion Rankine cycle engine under different water injection laws.Energy Procedia 2015, 66, 89–92. [CrossRef]
51. Rezaeiravesh, S.; Vinuesa, R.; Liefvendahl, M.; Schlatter, P. Assessment of uncertainties in hot-wireanemometry and oil-film interferometry measurements for wall-bounded turbulent flows. Eur. J. Mech.B Fluids 2018, 72, 57–73. [CrossRef]
52. Vinuesa, R.; Hosseini, S.M.; Hanifi, A.; Henningson, D.S.; Schlatter, P. Pressure-gradient turbulent boundarylayers developing around a wing section. Flow Turbul. Combust. 2017, 99, 613–641. [CrossRef]
53. Noorani, A.; Vinuesa, R.; Brandt, L.; Schlatter, P. Aspect ratio effect on particle transport in turbulent ductflows. Phys. Fluids 2016, 28, 115103. [CrossRef]
© 2019 by the authors. Licensee MDPI, Basel, Switzerland. This article is an open accessarticle distributed under the terms and conditions of the Creative Commons Attribution(CC BY) license (http://creativecommons.org/licenses/by/4.0/).