
A six-chamber medium-to-high temperature refrigeration ...
69
i A six-chamber medium-to-high temperature refrigeration system for laboratory purposes By BELAID ASHUR BELAID Thesis submitted in fulfilment of the requirements for the degree Master of Engineering: Mechanical Engineering In the Faculty of Engineering at the Cape Peninsula University of Technology Supervisor: Mr K.E. Kanyarusoke Bellville Campus Mar 2017 CPUT copyright information The dissertation/thesis may not be published either in part (in scholarly, scientific or technical journals), or as a whole (as a monograph), unless permission has been obtained from the University.
-
Upload
khangminh22 -
Category
Documents
-
view
3 -
download
0
Transcript of A six-chamber medium-to-high temperature refrigeration ...

i
A six-chamber medium-to-high temperature refrigeration system for laboratory
purposes
By
BELAID ASHUR BELAID
Thesis submitted in fulfilment of the requirements for the degree
Master of Engineering: Mechanical Engineering
In the Faculty of Engineering at the
Cape Peninsula University of Technology
Supervisor: Mr K.E. Kanyarusoke
Bellville Campus
Mar 2017
CPUT copyright information
The dissertation/thesis may not be published either in part (in scholarly, scientific or technical journals), or as a whole (as a monograph), unless permission has been obtained from the University.

ii
DECLARATION
I, BELAID ASHUR BELAID, declare that the contents of this dissertation represent my own
unaided work, and that the dissertation has not previously been submitted for academic
examination towards any qualification. Furthermore, it represents my own opinions and
not necessarily those of the Cape Peninsula University of Technology.
Signed Date
iii
ABSTRACT
Food and water fuel and sustain life on earth. Since ancient times, their sourcing and
preservation have been very important issues to humanity. In modern times, experimentation
is a major step in analysing how cold storage problems in the medical and food science
technology fields can be addressed. For investigating spoilage of new products and/or
growth of pathogens in such cases, it is necessary to do experiments at different low
temperatures for prolonged periods and check the effects. While this can be undertaken in a
conventional two chambers fridge, it takes a long time to investigate a whole range of
feasible storage temperatures. This dissertation describes work intended to treble the
samples in such investigations and, therefore, significantly reduce the times. Six well-
insulated chambers were constructed from plastic and wood and set at different
temperatures. An ordinary deep freezer was used as the main heat sink for the chambers.
Experiments were done with different methods to get the best result for the cold air flow into
the chambers over period of eight months. The chambers temperatures were set between 0
and 15°C. It was finally established that a properly-designed six-chamber system could
successfully be added to an ordinary freezer to provide different medium-to-high refrigeration
temperatures without the use of a multi-pressure refrigeration cycle.
iv
ACKNOWLEDGEMENTS
I wish to thank and express my gratitude to:
Mr K.E Kanyarusoke and Prof. J Gryzagoridis for the supervision of this research
work. Their support, advice, guidance and constructive criticism made the completion
of this thesis possible.
The Mechanical Engineering Workshop staff and students for their practical
assistance.

v
DEDICATION
I would like to dedicate this thesis to my family and friends.

vi
TABLE OF CONTENTS
DECLARATION .......................................................................................................................... II
ABSTRACT ............................................................................................................................... III
ACKNOWLEDGEMENTS.......................................................................................................... IV
DEDICATION ............................................................................................................................. V
TABLE OF CONTENTS ............................................................................................................ VI
LIST OF FIGURES .................................................................................................................. VIII
LIST OF TABLES ....................................................................................................................... X
GLOSSARY .............................................................................................................................. XI
CHAPTER ONE .......................................................................................................................... 1
INTRODUCTION TO THE FOOD STORAGE CONCEPT........................................................... 1
1.1 BACKGROUND ................................................................................................................ 1
1.2 THE PHENOMENON ........................................................................................................ 5
1.3 PROBLEM STATEMENT ................................................................................................. 5
1.4 FINDINGS ......................................................................................................................... 8
1.5 JUSTIFICATION OF THE RESEARCH ............................................................................ 9
1.6 RESEARCH OBJECTIVES ............................................................................................... 9
1.7 METHODOLOGY.............................................................................................................. 9
1.8 ASSUMPTIONS ................................................................................................................ 9
CHAPTER TWO ....................................................................................................................... 10
LITERATURE REVIEW ............................................................................................................ 10
2.1 OUTLINE ........................................................................................................................ 10
2.2 FOOD SPOILAGE FACTORS ........................................................................................ 10
2.2.1 TEMPERATURE ............................................................................................................ 10
2.2.2 DESICCATION .............................................................................................................. 11
2.2.3 INCOMPATIBILITY ......................................................................................................... 12
2.2.4 DETERIORATION ......................................................................................................... 13
2.3 PRESERVATION ............................................................................................................ 13
2.3.1 HURDLE TECHNOLOGY ............................................................................................... 14
2.3.2 DEHYDRATION ............................................................................................................. 14
2.3.3 REFRIGERATION ......................................................................................................... 14
2.3.3.1 VAPOUR-ABSORPTION REFRIGERATION SYSTEM ................................................. 15
2.3.3.2 VAPOUR-COMPRESSION REFRIGERATION SYSTEM.............................................. 17
2.3.3.3 VAPOUR COMPRESSION-ABSORPTION REFRIGERATION SYSTEM ..................... 18

vii
CHAPTER THREE ................................................................................................................... 22
DESIGN CONCEPT.................................................................................................................. 22
3.1 PROLOGUE .................................................................................................................... 22
3.2 DESIGN CONSIDERATIONS .......................................................................................... 22
3.3 THE PROTOTYPE COMPONENTS ................................................................................ 22
3.3.1 THE TESTING CHAMBER ............................................................................................. 22
3.3.2 THE BASE ...................................................................................................................... 26
3.3.3 THE BACK SPACE COVER ........................................................................................... 26
3.4 THE DESIGN EQUATION ............................................................................................... 27
3.4.1 BASIC DATA CALCULATIONS FOR EFFECTIVE AREA FOR HEAT LOSS ................... 27
3.4.2 THE HEAT LOSS RESISTANCE CALCULATIONS ....................................................... 27
3.4.3 DEFINITIONS OF HEAT LOSS AND LOAD DETERMINANTS ....................................... 28
3.4.4.1 THE TRANSMISSION LOAD ........................................................................................ 28
3.4.4.2 THE INTERNAL LOAD ................................................................................................. 29
3.4.4.3 THE PRODUCT LOAD ................................................................................................. 30
CHAPTER FOUR ..................................................................................................................... 32
READINESS, TESTING AND OBSERVATIONS ...................................................................... 32
4.1 READINESS ................................................................................................................... 32
4.2 TESTING AND EXPERIMENTAL THE PROTOTYPE BEFORE LOADING .................... 35
4.3 OBSERVATIONS AND RESULTS OF TESTING ............................................................ 37
4.4 TESTING AFTER LOADING ........................................................................................... 38
4.5 HEAT GAINED BY THE PROTOTYPE........................................................................... 40
CHAPTER FIVE ....................................................................................................................... 41
CONCLUSION AND RECOMMENDATIONS ........................................................................... 41
5.1 CONCLUSION ................................................................................................................ 41
5.2 RECOMMENDATIONS ................................................................................................... 41
REFERENCES ......................................................................................................................... 43
APPENDICES .......................................................................................................................... 48
APPENDIX A: THE CALCULATION OF THE EFFECTIVE ARE FOR HEAT TRANSFER ........ 49
A 1 THE EFFECTIVE AREA OF THE BACK COVER ............................................................... 49
A 2 THE FRONT AREA OF THE BACK COVER ...................................................................... 49
A 3 THE EFFECTIVE HEAT TRANSFER AREA OF THE CHAMBER ...................................... 50
A 4 THE HEAT LOSS CALCULATIONS ................................................................................... 51
APPENDIX B: THE RESULTS OF THE FOUR TESTS CONDUCTED ON THE PROTOTYPE . 53
APPENDIX C: THE AIR PROPERTIES TABLE ........................................................................ 56
APPENDIX F: THE MATERIAL COST FOR CONSTRUCTION ................................................ 61

viii
LIST OF FIGURES
Figure 1.1 The ancient culture of ice storage, 1000 BC…………………. ……………. 1
Figure 1.2 Ice Harvesting in Massachusetts 1850s………….……………….………... 2
Figure 1.3 William Cullen, 1720 ………….………………………………………………. 3
Figure 1.4 Michael Faraday, 1820 ….……………………………………………………. 3
Figure 1.5 Timeline of refrigeration history ……………..……………………………….. 4
Figure 1.6 1927 witnesses the first widespread refrigerator being used……………... 5
Figure 1.7 Yearly losses in Europe, North America & Ind. Asia ………………........... 8
Figure 1.8 Yearly losses in Europe, North America & Ind. Asia ………………........... 8
Figure 2.1 Chill Damage ……………………………………………..…………………… 10
Figure 2.2 Desiccated peppers……….…………………………………………............. 12
Figure 2.3 Deterioration of pepper………………………………………….................... 13
Figure 2.4 A VARS of 2700 kW at −30 ◦C installed in a refinery in Germany……….. 15
Figure 2.5 A (VCRS) with the control devices ………………………………................. 17
Figure 3.1 The wooden outer container ………………………..……………………… 23
Figure 3.2 a The construction of the plastic box of the chamber ……………................. 23
Figure 3.2 b The chamber plastic box after assembling ….……………………………… 23
Figure 3.3 The layout of the cut and bend of the sheet metal plate ………………….. 24
Figure 3.4 The digital thermometer holder components ………………………………. 24
Figure 3.5 The door of the cooling chamber …..………………………………………. 25
Figure 3.6 The testing chamber body……………………………………………………. 25
Figure 3.7 The base …..…………………………………………………………………… 26
Figure 3.8 The back cover …………………………………….………………................ 26
Figure 3.9 The cooling cycle diagram………………..………………………................ 27
ix
Figure 3.10 The resistance equations for the chamber sides…………………………... 27
Figure 3.11 The resistance equations for the chamber door…..………………………... 28
Figure 4.1 Attaching the base with to deep freezer…………………………………….. 32
Figure 4.2 Attaching the experimental chambers, the base and the deep freezer. .…. 33
Figure 4.3 Back view illustrating the assembling of some of the outlet tubes ……….. 34
Figure 4.4 Assembling the back space cover, the chambers and the base….……… 35
Figure 4.5 The original built prototype ………………………………….………...……... 36
Figure 4.6 A graphic presentation of the first test result ……………………………… 37
Figure 4.7 A graphic presentation of the second test result……………...…………… 37
Figure 4.8 A graphic presentation of the third test result ………………………….….. 38
Figure 4.9 A graphic presentation of the loaded chambers test result ……………. 49
Figure 4.10 Heat gain by the prototype ……………………………………………….… 40
Figure A1.1 The back cover side ………………………………………………………..… 49
Figure A1.2 The back cover side with double sides self-adhesive net ………………… 49
Figure A1.3 The chamber dimensions for the effective area …………………………… 50
Figure A1.4 The chamber door dimensions diagram for the effective area ………….. 50

x
LIST OF TABLES
Table 2.1 Storage conditions for fruits and vegetable 12
Table 2.2 Incompatibilities between products 13
Table 2.3 Approximate deterioration rate of fresh product 14
Table A 1 Component properties area of the chambers 52
Table B 1 The first test result 55
Table B 2 The second test result 55
Table B 3 The third test result 56
Table B 4 The result test loading of the chambers 57
Table B 5 The result heat gain by the prototype calculations 58
Table C 1 Air properties 61
xi
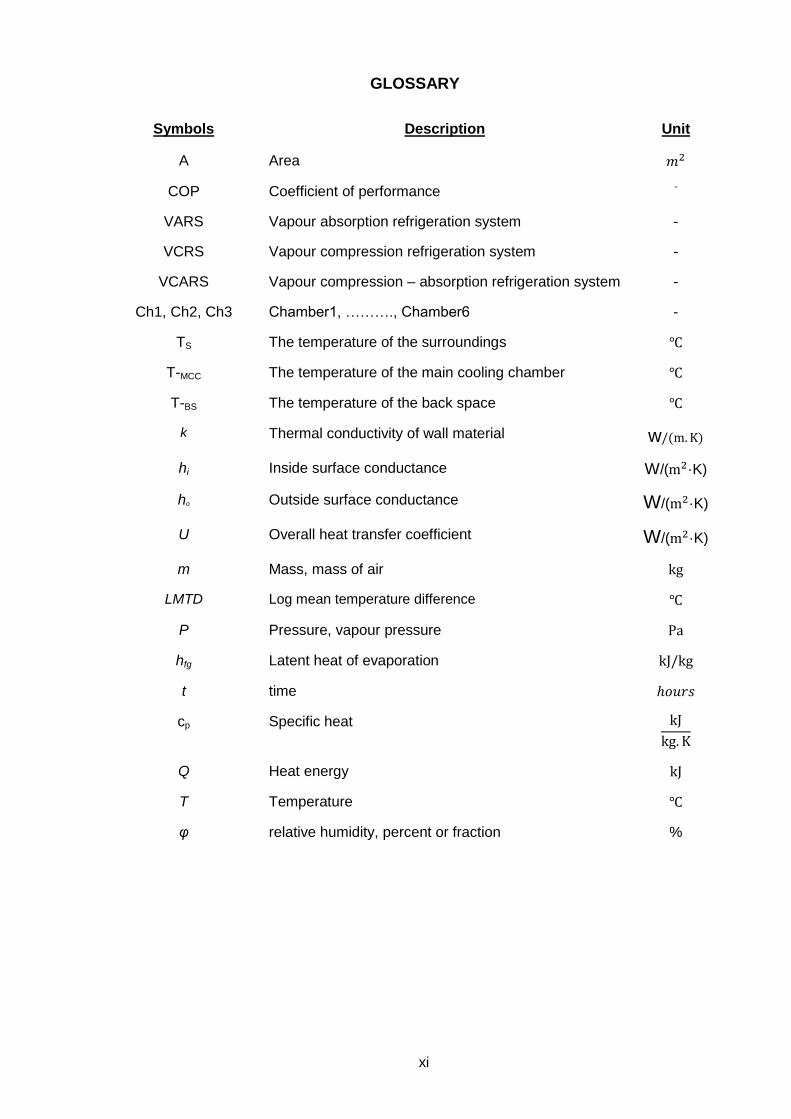
GLOSSARY
Symbols Description Unit
A Area
COP Coefficient of performance -
VARS Vapour absorption refrigeration system -
VCRS Vapour compression refrigeration system -
VCARS Vapour compression – absorption refrigeration system -
Ch1, Ch2, Ch3 Chamber1, ………., Chamber6 -
TS The temperature of the surroundings
T-MCC The temperature of the main cooling chamber
T-BS The temperature of the back space
k Thermal conductivity of wall material w
hi Inside surface conductance W/( ·K)
ho Outside surface conductance W/( ·K)
U Overall heat transfer coefficient W/( ·K)
m Mass, mass of air
LMTD Log mean temperature difference
P Pressure, vapour pressure
hfg Latent heat of evaporation
t time
cp Specific heat
Q Heat energy
T Temperature
φ relative humidity, percent or fraction %

1
CHAPTER ONE INTRODUCTION TO THE FOOD STORAGE CONCEPT
1.1 BACKGROUND
Before the invention of the mechanical refrigeration system, various methods of preserving
food were used by people of different cultures. Some preferred to use snow or ice that was
available in and around the areas where they lived, brought down from the mountains and
stored in cellars in the cold seasons to be used in the warmer or the hotter ones. The first
cellars were holes dug into the ground, lined with wood or straw and then filled with ice
and snow (PEAK Mechanical Partnership, nd). This refrigeration principle goes back to the
year 1000 BC when ice was cut into pieces in
winter and stored for the summer by the
Chinese as well as the ancient Hebrews,
Romans and the Greeks. This seasonal
harvesting of ice or snow was very common
throughout the ancient cultures. Pickling,
salting, spicing, drying and smoking were
other methods used for preservation. These
techniques were used mainly for cheese,
salted meats and bread. Rapid spoilage of
food could not be prevented by the use of
window boxes or cellar storage for products
such as milk and cheeses. These products were considered to be the most difficult to keep
fresh. Pasteurisation was not understood at the time, therefore, infestation of bacteria was
widespread and in the colonial days, during the warm weather. The death was common in
summer, because of spoiled food. Therefore, a form of improved and a better food
preservation method was needed (PEAK Mechanical Partnership, nd).
The recognition of this need was observed by the creative thinkers in India, who created
and used the first evaporative cooling systems. These worked on the principle that when a
liquid vaporises quickly, it rapidly expands and the kinetic energy increases due to the
rising of the vapour molecules. This increases the energy drawn from the surrounding
vapour immediately and causes it to cool (PEAK Mechanical Partnership, nd)..
Later on, reducing temperature with the addition of chemicals such as potassium nitrate or
sodium nitrate was discovered. In 1550, the first cooling of wine using this technique was
recorded and the term ‘refrigeration’ came into being. In 1600, cooled drinks became very
popular in Europe, specifically in Spain, France and Italy. Long-necked bottles were
Figure 1.1: The ancient culture of ice storage
0111 BC) Ice house).

2
rotated in water containing dissolved saltpetre. This was a new technique for cooling
instead of cooling the water at night and using it during the day. This method was also
used to create low temperatures in addition to the usage of ice. Frozen juice, liquors and
iced drinks were popular in France by the end of the 17th century (PEAK Mechanical
Partnership, nd).
A strong demand for ice was prompted at the end of the 17th century. In 1799, the first
commercial shipment of ice was shipped out from Canal Street in New York to
Charlestown. However, this attempt was a
failure as there very little ice remained in
the shipment when it arrived. The potential
for the existence of ice as a business was
seen by Frederick Tudor and Nathaniel
Wyeth of New England. In the first half of
the 1800s, the industry was revolutionised
by their efforts. Shipping ice to the tropical
climates was the concern of the Frederick
Tudor ‘Ice King’, an American
businessman. His project and experiments
led to a decrease in the losses of ice shipments from 66% to 8% caused by ice melting
(PEAK Mechanical Partnership, nd)..
He experimented and tested different insulation materials, with the result that icehouses
were built to decrease the loss caused by melting, thus ensuring the shipment’s safety. A
cheap and quick method for cutting ice into uniform blocks that the industry required was
developed by Wyeth (PEAK Mechanical Partnership, nd). The handling technique of ice in
storage improved and became easy, as well as the possibility of transporting and
distributing ice with less waste. Therefore, more and more companies became involved in
the ice business. Prices of ice fell and ice refrigeration became more realistic and
available. In America, there were 35 commercial plants for ice production in 1879. A
decade later, there were 200 and by 1909, this number had increased to 2000. In 1907,
the consumption of ice was triple that of 1880 and it reached a peak of 15 million tons.
Ponds were scraped everywhere for ice production. In 1847, approximately 1000 tons of
ice was extracted on a daily basis from Thoreau’s Walden Pond (PEAK Mechanical
Partnership, nd).
Health problems occurred due to the fact that the ice scraped was not clean. (PEAK
Mechanical Partnership, nd). Eventually, this problem became evident and finding clean
natural ice sources became a difficult task. By the 1890s, sewage dumping and pollution
Figure 1.2: Ice Harvesting in Massachusetts
1850s (Refrigeration).
3
had made it even more impossible. In the brewing industry, the first signs of health
problems were noticed, followed by the dairy and meat-packing industry, which were
severely affected. There was a desperate need for a new preservation method of food
(PEAK Mechanical Partnership, nd).
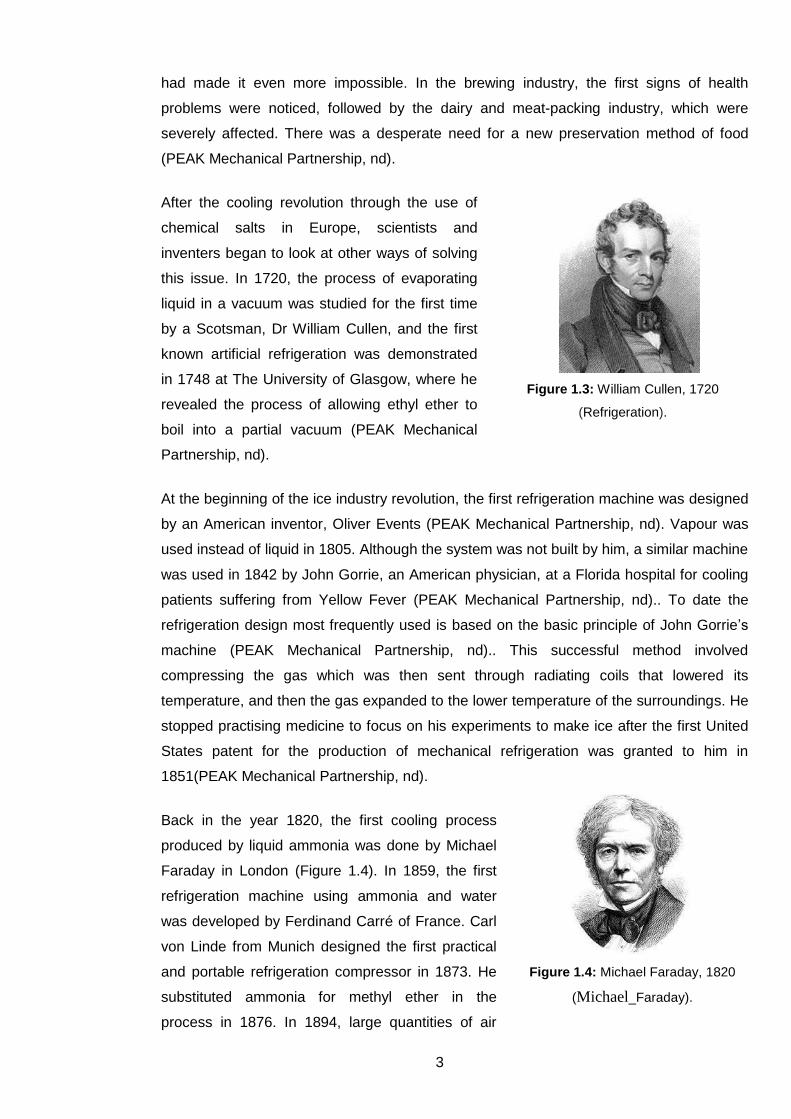
After the cooling revolution through the use of
chemical salts in Europe, scientists and
inventers began to look at other ways of solving
this issue. In 1720, the process of evaporating
liquid in a vacuum was studied for the first time
by a Scotsman, Dr William Cullen, and the first
known artificial refrigeration was demonstrated
in 1748 at The University of Glasgow, where he
revealed the process of allowing ethyl ether to
boil into a partial vacuum (PEAK Mechanical
Partnership, nd).
At the beginning of the ice industry revolution, the first refrigeration machine was designed
by an American inventor, Oliver Events (PEAK Mechanical Partnership, nd). Vapour was
used instead of liquid in 1805. Although the system was not built by him, a similar machine
was used in 1842 by John Gorrie, an American physician, at a Florida hospital for cooling
patients suffering from Yellow Fever (PEAK Mechanical Partnership, nd).. To date the
refrigeration design most frequently used is based on the basic principle of John Gorrie’s
machine (PEAK Mechanical Partnership, nd).. This successful method involved
compressing the gas which was then sent through radiating coils that lowered its
temperature, and then the gas expanded to the lower temperature of the surroundings. He
stopped practising medicine to focus on his experiments to make ice after the first United
States patent for the production of mechanical refrigeration was granted to him in
1851(PEAK Mechanical Partnership, nd).
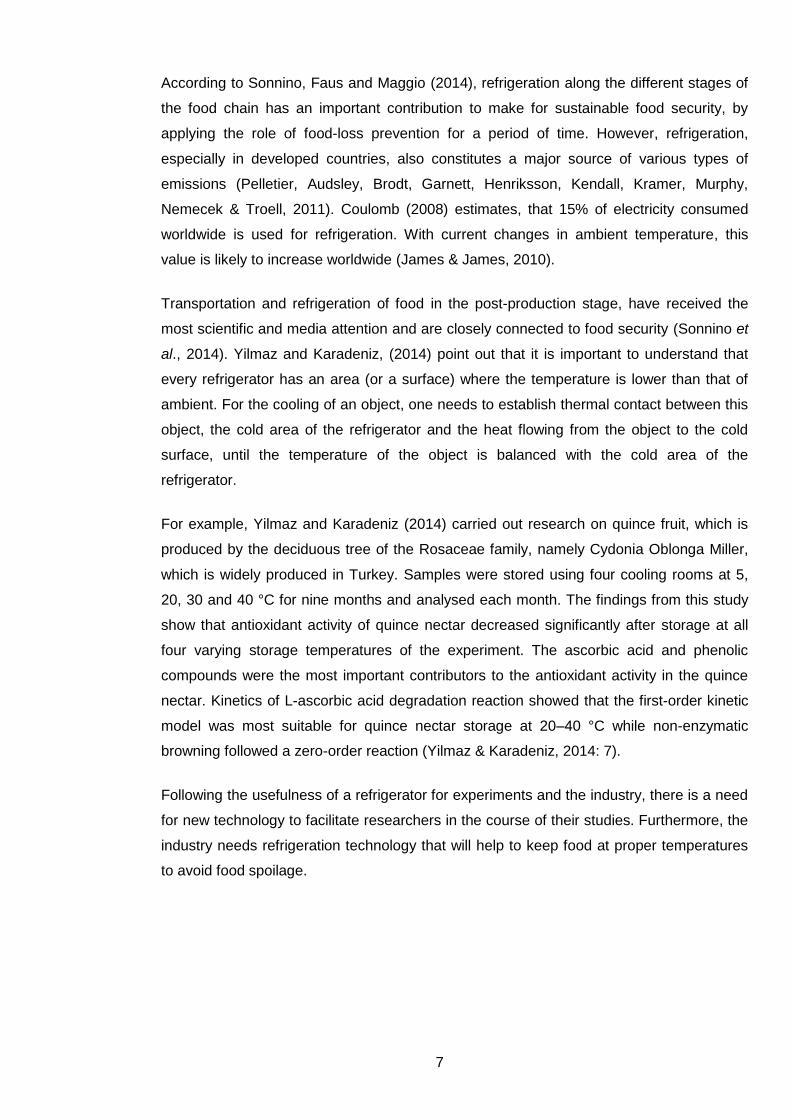
Back in the year 1820, the first cooling process
produced by liquid ammonia was done by Michael
Faraday in London (Figure 1.4). In 1859, the first
refrigeration machine using ammonia and water
was developed by Ferdinand Carré of France. Carl
von Linde from Munich designed the first practical
and portable refrigeration compressor in 1873. He
substituted ammonia for methyl ether in the
process in 1876. In 1894, large quantities of air
Figure 1.3: William Cullen, 1720
(Refrigeration).
Figure 1.4: Michael Faraday, 1820
(Michael_Faraday).

4
were liquefied and this method was named the ‘Linde technique’ (PEAK Mechanical
Partnership, nd).
The first recognition of the major benefits of using the refrigeration process system was in
the brewing industry. In the 1840s, with the arrival of the German immigrants, a German
lager beer was introduced in America. The beer proved to be superior to the American ale.
Throughout the entire year, the breweries were able to make uniform products. In 1870, S.
Liebmann’s Sons Brewing Company in Brooklyn, New York was the first to adopt the use
of an absorption refrigeration system and by 1891, most of the breweries were using
refrigerating machines (PEAK Mechanical Partnership, nd).
Approximately a decade later, the mechanical refrigeration system was adopted in
Chicago for use by the meat-packing industry. The compression refrigeration system using
ammonia had a capacity of over 90,000 tons per day in use by most of the meat-packing
industry in America by 1914. Cars, cold storage and brunch house facilities such as
restaurants, hotels, offices used this refrigeration system technology. The refrigeration
system greatly improved the industry and meat could be transported to markets
throughout the year (PEAK Mechanical Partnership, nd). Figure 1.5 demonstrates the
timeline of refrigerant history.
Figure 1.5: Timeline of refrigerant history
(Refrigerant-safety).

5
1.2 THE PHENOMENON
Heat is transferred in the direction of decreasing
temperature, that is, from the higher temperatures
to lower temperatures. Reversing this phenomenon
is possible and is not in violation of the
thermodynamic second law if additional work has
been done on the system (James & James, 2010).
A system called ‘refrigerator’ is required as an
intermediate device to transfer heat from low
temperature regions to high ones. The dividing line
at -70 °C or 100 °F marks the temperatures within
the refrigeration system where physical
philosophies and methods are applied to achieve
low temperatures. Below this, cryogenic devices
take over.
In industrial technology and science, experimentation is an important issue, where
constant monitoring and observation of systems are done. When the desired result is not
achieved, further research has to be conducted until a final and successful result is
achieved. Such experiments may run for years to achieve the desired outcome if only one
or two items are monitored at a time. Most refrigeration systems have one or two
chambers and precise temperature control in these chambers is limited.
1.3 PROBLEM STATEMENT
Due to the growth of the world’s population and the necessity to ensure adequate food
supply, high-level experiments have skilfully been performed globally. To date, the issue of
malnutrition remains a major challenge globally (Rolle, 2006). Sciences and technology
have pushed the agricultural output to maximum beyond the market demand or supply in
the most developed countries; this has led to degradation of the ecosystem of the
agricultural environment in some countries. The industrial revolution in the 20th century in
the most developed counties, and its effect on the ozone layer and the pollution has made
the world live under the neutral crises umbrella. Climate change is the direct result of the
behaviour of the developed countries. Flooding, dryness, wars due to the political conflict
and bad management of the agricultural resources, are the major undernourishment
factors in the less developed countries. Therefore, from my point view there is no shortage
of food worldwide, at least in the agricultural product, but what is there is food waste in
worldwide production especially the fruits and vegetables which is the most favourable to
Figure 1.6:1927 witnesses the first
widespread refrigerator being used
(Flik).

6
human and more favourable when they are fresh. The focus now shouldn’t be on
increasing the production, as it should be on reducing the percentage losses of the post-
harvest as much as possible, but how can this be possible? The answer is refrigeration. It
can be an attractive option for the reduction of post-harvest losses in fruits and vegetable,
and in foodstuffs in general. This is because it preserves most of the initial food quality,
and maintains the initial chemical, physical and nutritional properties with extent shelf life.
Hence, consumers can be provided with wholesome and safe foodstuffs (Peck, 1997). The
lack of a refrigeration infrastructure in many countries, and specifically in less developed
ones where undernourishment along with the population growth is greatest, means it is still
neither sufficiently nor equally used to ensure safety and security of food (Peck, 1997).
Contributing to the reduction of post-harvest losses by quickly establishing suitable
storage conditions under laboratory conditions is the broader aim of this study.
Other methods which can be used for reducing post-harvest losses of foodstuffs include
high-pressure processing, salting, electrically pulsed food processing and canning (Peck,
1997). But none of those methods named above at the level of quality for food
preservation as the refrigeration system for extending the life shelf and maintaining the
initial sensory, chemical, physics, and nutritional properties for the extent of the consumer
desired. It is reported that refrigeration technology would allow less-developed countries to
increase their food supply of perishable foodstuffs extensively and reliably by about 15%.
This would allow them to approach food security in a similar way to that in the more
industrialised countries (Gustavsson, Cederberg & Sonesson, 2011). To cool and store
food at the site of production is vital to ensure the effectiveness of the cold chain.
Accordingly, adequate training of local engineers and technicians is essential for the cold
chain plants.
According to Gustavsson et al., (2011), there is a growing demand for mainly processed
food that are of a high quality, nutritious and easy to prepare. These demands have been
met where the refrigerated foods were developed with an extant shelf life (Peck, 1997).
Such types of food have been precooked or slightly processed where their shelf-life is
limited and refrigeration is their preservation. They include cured meats, luncheon meats
and the new generations of processed, refrigerated foods, like seafood, vegetable salads,
pasta sauce, soups, complete meals and so on (Leistner, 2000). They require less heat to
prepare than the heat required for commercial sterility.
One of the major causes of food loss in low-income countries is the poor environmental
conditions while it is on display. According to Gustavsson et al. (2011), poor temperature
management on shelves where food is displayed causes various problems like chilling or
heat sensitivity.
7
According to Sonnino, Faus and Maggio (2014), refrigeration along the different stages of
the food chain has an important contribution to make for sustainable food security, by
applying the role of food-loss prevention for a period of time. However, refrigeration,
especially in developed countries, also constitutes a major source of various types of
emissions (Pelletier, Audsley, Brodt, Garnett, Henriksson, Kendall, Kramer, Murphy,
Nemecek & Troell, 2011). Coulomb (2008) estimates, that 15% of electricity consumed
worldwide is used for refrigeration. With current changes in ambient temperature, this
value is likely to increase worldwide (James & James, 2010).
Transportation and refrigeration of food in the post-production stage, have received the
most scientific and media attention and are closely connected to food security (Sonnino et
al., 2014). Yilmaz and Karadeniz, (2014) point out that it is important to understand that
every refrigerator has an area (or a surface) where the temperature is lower than that of
ambient. For the cooling of an object, one needs to establish thermal contact between this
object, the cold area of the refrigerator and the heat flowing from the object to the cold
surface, until the temperature of the object is balanced with the cold area of the
refrigerator.
For example, Yilmaz and Karadeniz (2014) carried out research on quince fruit, which is
produced by the deciduous tree of the Rosaceae family, namely Cydonia Oblonga Miller,
which is widely produced in Turkey. Samples were stored using four cooling rooms at 5,
20, 30 and 40 °C for nine months and analysed each month. The findings from this study
show that antioxidant activity of quince nectar decreased significantly after storage at all
four varying storage temperatures of the experiment. The ascorbic acid and phenolic
compounds were the most important contributors to the antioxidant activity in the quince
nectar. Kinetics of L-ascorbic acid degradation reaction showed that the first-order kinetic
model was most suitable for quince nectar storage at 20–40 °C while non-enzymatic
browning followed a zero-order reaction (Yilmaz & Karadeniz, 2014: 7).
Following the usefulness of a refrigerator for experiments and the industry, there is a need
for new technology to facilitate researchers in the course of their studies. Furthermore, the
industry needs refrigeration technology that will help to keep food at proper temperatures
to avoid food spoilage.
8
40
23
90
0
20
40
60
80
100
Agricultural
production
Post-harvest
handling and
storage
Processing
and packaging
Distribution Consumption Total
Mill
ion
to
n
Volume of waste in developing countries
Europe
North America and Oceania
Industrialised Asia
17
26
90
20
0
20
40
60
80
100
Agricultural
production
Post-harvest
handling and
storage
Processing
and packaging
Distribution Consumption Total
Mill
ion
to
n
Volume of waste in less developing countries
Sub-Saharan Africa
North Africa western and central Asia
South and Southeast Asia
Latin America
1.4 FINDINGS
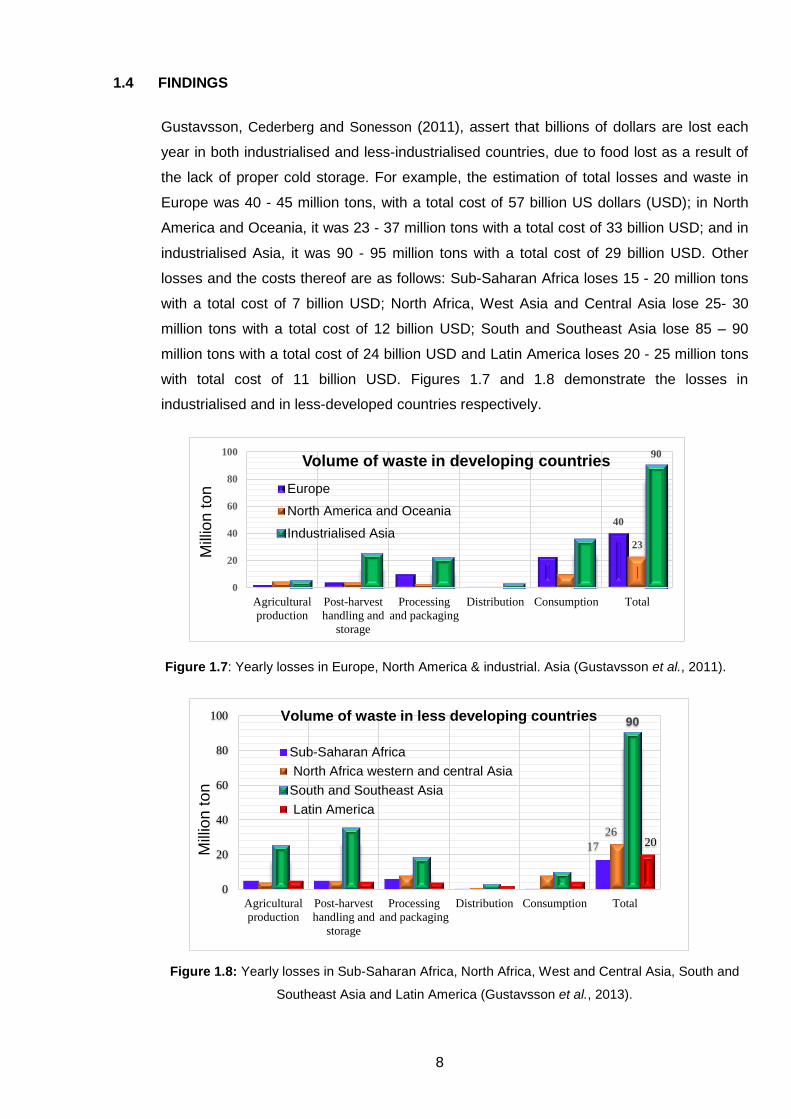
Gustavsson, Cederberg and Sonesson (2011), assert that billions of dollars are lost each
year in both industrialised and less-industrialised countries, due to food lost as a result of
the lack of proper cold storage. For example, the estimation of total losses and waste in
Europe was 40 - 45 million tons, with a total cost of 57 billion US dollars (USD); in North
America and Oceania, it was 23 - 37 million tons with a total cost of 33 billion USD; and in
industrialised Asia, it was 90 - 95 million tons with a total cost of 29 billion USD. Other
losses and the costs thereof are as follows: Sub-Saharan Africa loses 15 - 20 million tons
with a total cost of 7 billion USD; North Africa, West Asia and Central Asia lose 25- 30
million tons with a total cost of 12 billion USD; South and Southeast Asia lose 85 – 90
million tons with a total cost of 24 billion USD and Latin America loses 20 - 25 million tons
with total cost of 11 billion USD. Figures 1.7 and 1.8 demonstrate the losses in
industrialised and in less-developed countries respectively.
Figure 1.7: Yearly losses in Europe, North America & industrial. Asia (Gustavsson et al., 2011).
Figure 1.8: Yearly losses in Sub-Saharan Africa, North Africa, West and Central Asia, South and
Southeast Asia and Latin America (Gustavsson et al., 2013).

9
According to Sonnino, et al. (2014), refrigeration is the solution to food loss throughout the
different stages of the food chain. Refrigeration makes an important contribution towards
sustainable food security by fulfilling its role in preventing food loss. The aim of this project
is to provide six temperature-controllable, thermally isolated chambers so that semi-
processed food storage temperatures can be determined. The study was done in three
phases, namely, the design, construction and testing phases. To ensure the quality of the
output, each phase was tested before the researcher proceeded to the next phase.
1.5 JUSTIFICATION OF THE RESEARCH
Most refrigeration systems have one or two chambers and it is time-consuming for
scientists who want to do experiments on storage temperatures. Therefore, there is a need
for multiple, temperature-controllable, thermally-isolated chambers so that research times
can be reduced.
1.6 RESEARCH OBJECTIVES
The objective of this study was to provide six chambers for a medium to high refrigeration
system that can be used by scientists to do experiments on food products.
1.7 METHODOLOGY
This study was conducted in three phases:
The design phase: a controllable-temperature, six chambers refrigerator for laboratory
purposes was designed.
The construction phase: a prototype was constructed in line with the design.
The testing phase: four tests were done on the prototype, namely without load at fans
speed 0, without load at fans speed maximum, without load at the chambers desired
temperature, and testing with a load of 200 grams of apples in each chamber. Data was
collected every half hour.
1.8 ASSUMPTIONS
The main cooling chamber below the experimental chambers runs at - C, which is
usually the lowest temperature of the deep freezer. The assumption is that the main
cooling chamber would be capable of bringing down the temperature of the experimental
chambers down to C, where the desired temperature for agriculture products lies
between C and 1 C.
10
CHAPTER TWO LITERATURE REVIEW
2.1 OUTLINE
This chapter discusses the effects of food spoilage as well as the factors responsible for
the spoilage of food. Food spoilage factors include temperature, desiccation,
incompatibility and deterioration. The preservation of food to reduce losses will be
demonstrated as well as the methods used, with the emphasis on refrigeration.
2.2 FOOD SPOILAGE FACTORS
Food spoilage is considered to have occurred when food undergoes undesired changes of
state or contains objectionable material.
2.2.1 TEMPERATURE
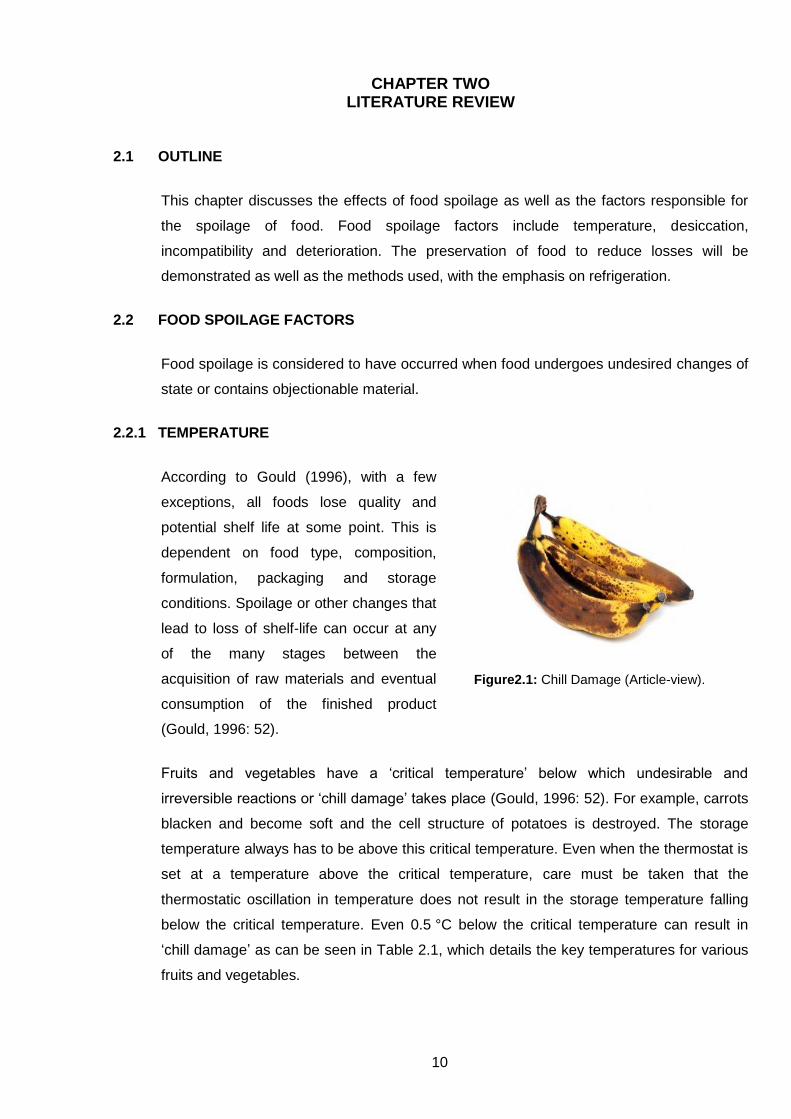
According to Gould (1996), with a few
exceptions, all foods lose quality and
potential shelf life at some point. This is
dependent on food type, composition,
formulation, packaging and storage
conditions. Spoilage or other changes that
lead to loss of shelf-life can occur at any
of the many stages between the
acquisition of raw materials and eventual
consumption of the finished product
(Gould, 1996: 52).
Fruits and vegetables have a ‘critical temperature’ below which undesirable and
irreversible reactions or ‘chill damage’ takes place (Gould, 1996: 52). For example, carrots
blacken and become soft and the cell structure of potatoes is destroyed. The storage
temperature always has to be above this critical temperature. Even when the thermostat is
set at a temperature above the critical temperature, care must be taken that the
thermostatic oscillation in temperature does not result in the storage temperature falling
below the critical temperature. Even 0.5 °C below the critical temperature can result in
‘chill damage’ as can be seen in Table 2.1, which details the key temperatures for various
fruits and vegetables.
Figure2.1: Chill Damage (Article-view).

11
Table 2.1: Storage conditions for fruits and vegetable (NPCS, 2016 )
Item Temperature ºC
Relative
Humidity
%
Maximum
storage time
recommended
Storage time in cold
stores for vegetables
in tropical countries
Apple 0-4 90-95 2-6 m*
Beetroot 0 95-99
Cabbage 0 95-99 5-6 m 2 m
Carrots 0 98-99 5-9 m 2 m
Cauliflower 0 95 2-4 w 1+ w
Cucumber 10-13 90-95
Eggplant 8-10 90-95
Lettuce 1 95-99
Leeks 0 95 1-3 m 1 m
Oranges 0-4 85-90 3-4 m
Pears 0 90-95 2-5 m
Pumpkin 10-13 70-75
Spinach 0 95 1-2 m 1 w
Tomatoes 13-21 85-90
*m = months; +w = weeks
2.2.2 DESICCATION
Desiccation is a process in which the spoilage of unpacked fresh foods, such as meat,
fish, fruits and vegetables, occurs due to the loss of moisture from the surface of the
product by evaporation into the surrounding air (ASHRAE, 2002). In other words,
desiccation is the state or the process of extreme dryness. In fruits and vegetables, for
example, desiccation is accompanied by a considerable loss of weight and vitamin
content. Water loss also causes a product to shrivel. This is the only physical factor related
to the evaporative potential of air and can be expressed as illustrated in the formula below
(ASHRAE, 2002:10.1):
(1.1)

12
Where:
= vapour pressure deficit, indicating combined influence of temperature and relative
humidity on evaporative potential of air
p = vapour pressure of water at given temperature
φ = relative humidity, percentage
The comparison of the air potential
evaporating in two different storage rooms,
one at 0 ºC and the other at 10 ºC dry bulb
temperature (DBT), and for each storage
room with 90% relative humidity (RH), the
deficit of the air vapour pressure at 0 ºC is
60 Pa, whereas at 10 ºC, it is 120 Pa.
Assuming all the other factors are equal,
there is a tendency to lose water at 0 ºC
and the DBT is lower than 10 ºC. (ASHRAE,
2002).
2.2.3 INCOMPATIBILITY
According to Dinçer and Kanoĝlu (2011), if different products are stored in the same room
there is a risk of the transfer of odours. Table 2.2 below shows the incompatibilities of
different products.
Table 2.2: Incompatibilities between products: Source:(NPCS, 2016)
Item Apple Banana Cabbage Grapes Oranges Potatoes Vegetable
Apples - N SR Y Y SR Y
Bananas N - N Y N N Y2
Cabbage SR Y - SR N SR SR
Grapes Y Y SR - Y Y Y
Oranges Y N N Y - Y Y
Potatoes SR N SR Y Y - Y
Vegetables Y Y SR Y Y Y -
Y= No cross action SR =Slight danger BR=Danger N=Cross-action will take place
Figure 2.2: Desiccated peppers (Products-12).

13
2.2.4 DETERIORATION
The environment in which harvested produce is placed may greatly influence not only the
respiration rate but also other changes and products formed in related chemical reactions.
Changes in fruit are called ripening. Fruits such as pears and bananas require the ripening
process to make them edible. The continuation of the ripening process leads to
deterioration which softens the fruit, causing it to lose flavour and the tissues undergo a
breakdown (NPCS, 2016).
The rate of deterioration is directly proportional to the temperature. The specific
relationships between temperature and deterioration rate vary considerably among
commodities. A generalisation, assuming that there is a deterioration rate of 1 for a fruit at
−1 °C, is shown in Table 2.3 (NPCS, 2016).
Table 2.3: Approximate deterioration rate of fresh product. Source:(NPCS, 2016)
For example, a commodity that is marketable for 12
days at -1 ºC, might lose only four days (12/3=4) at 5
ºC. The proper temperature for slowing down the
deterioration is where the fruit can be safely
maintained without freezing or preserving the
commodity, which is about 0.5 - 1 K above the
freezing point of the commodity (NPCS, 2016).
2.3 PRESERVATION
In order to extend the life span or storage time of food to reduce the food loss, different
methods have been proposed and these include, among others, hurdle technology,
dehydration and refrigeration.
Temperature, ºC Deterioration factor rate
20 8 to 10
10 4 to 5
5 3
3 2
0 1.25
-1 1
Figure 2.3: Deterioration of peppers
(Docrep)

14
2.3.1 HURDLE TECHNOLOGY
Hurdle technology is a crucial concept for the mild preservation of food, as the hurdles in a
stable product concertedly control microbial spoilage and food poisoning, leaving the
designed fermentation processes unaffected (Leistner & Gorris, 1995: 41). Hurdle
technology aims to apply an intelligent mix of hurdles to deterioration so that the total
quality of foods is improved. This technology was motivated by the current consumer
demand for more natural and fresh foods, which places pressure on food manufacturers to
use only mild preservation techniques, for example, refrigeration, modified-atmosphere
packaging and bio conservation (Leistner & Gorris, 1995: 41). The concept of food
preservation is to use a hostile environment in which to put the microorganisms to shorten
their survival and, therefore, lead to their death or inhibit their growth. Their feasible
response to the hostile environment would determine, whether they grow or die. Recent
advances have been made by considering the homeostasis, metabolic exhaustion and
stress reactions of microorganisms in relation to hurdle technology, as well as by
introducing the novel concept of multi-target preservation for a gentle but most effective
preservation of hurdle-technology foods to avoid dehydration (Leistner, 1995a, 1995b).
2.3.2 DEHYDRATION
Dehydration is a common technique for the preservation of agricultural and other products,
including fruits and vegetables. In developing countries, for example, the traditional
method of dehydration is by open air drying, which often results in food contamination and
nutritional deterioration (Ratti & Mujumdar, 1997). Pineapples, for instance, are an
important crop in tropical countries and are eaten fresh or mostly canned, as juice or other
products (Tanaka, Hilary & Ishzaki, 1999). However, technologies for canning or storing
fresh fruits are very limited in developing countries. In addition, farmers face problems in
shipping fresh fruits from rural areas to potential markets in urban areas of these countries,
resulting in the spoilage of the fresh produce and economic loss because of limited or a
complete lack of refrigeration facilities or systems (Madhlopa & Ngwalo, 2007: 455).
2.3.3 REFRIGERATION
The principle of refrigeration is the transferral of heat from a space to be cooled by an
electrical motor. Boiling fluids with low temperatures are called refrigerants, where the
thermal energy is absorbed and vaporised in the evaporator in the region where it is being
cooled (Neuburger, 2003). Moving heat from one location to another is the process of
refrigeration (Madhlopa & Ngwalo, 2007). Mechanical work is the traditional way of
transferring heat, but there are other methods such as, among others, the use of laser,
electricity and magnetism. Refrigeration applications are unlimited and can include air-
15
conditioning, cryogenics, industrial freezers and household refrigerators (Neuburger,
2003). Neuburger (2003) points out that the heat pumps are similar to refrigeration units,
where the heat pumps use the heat output of the refrigeration process and could be
designed to be reversible. The literature review on refrigeration classifies refrigeration
systems under the following themes: vapour-absorption refrigeration systems, vapour-
compression refrigeration systems and vapour compression-absorption refrigeration
systems.
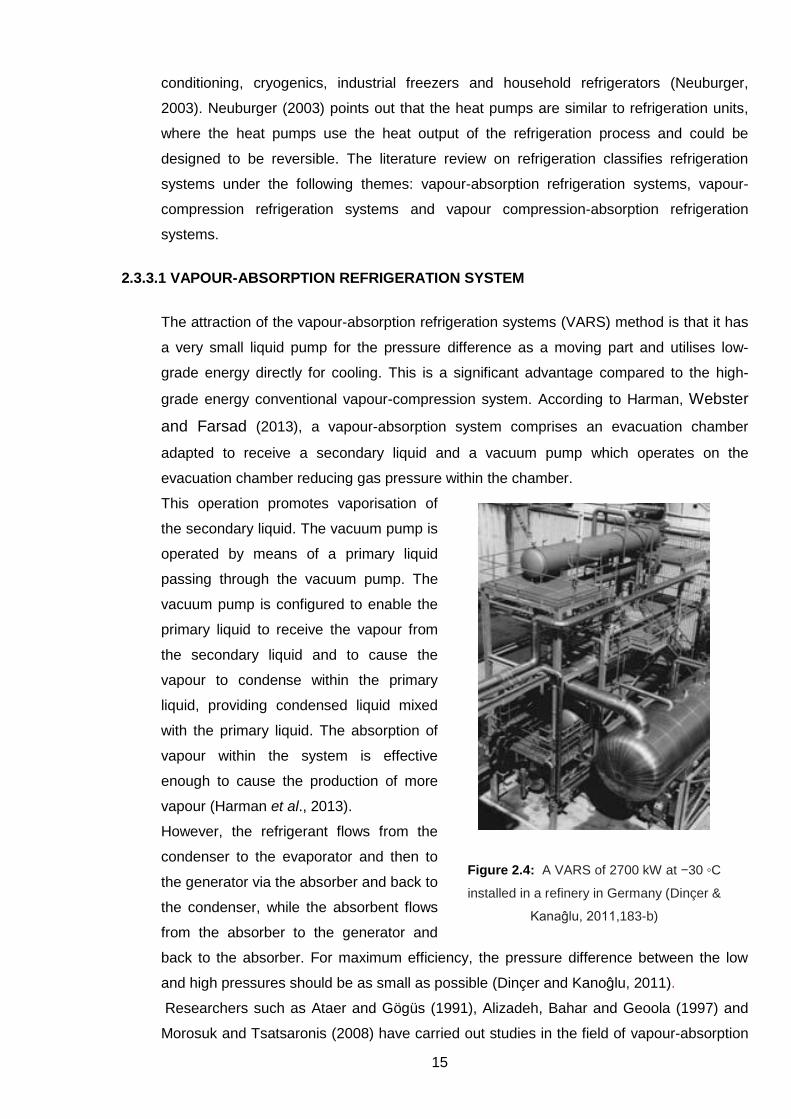
2.3.3.1 VAPOUR-ABSORPTION REFRIGERATION SYSTEM
The attraction of the vapour-absorption refrigeration systems (VARS) method is that it has
a very small liquid pump for the pressure difference as a moving part and utilises low-
grade energy directly for cooling. This is a significant advantage compared to the high-
grade energy conventional vapour-compression system. According to Harman, Webster
and Farsad (2013), a vapour-absorption system comprises an evacuation chamber
adapted to receive a secondary liquid and a vacuum pump which operates on the
evacuation chamber reducing gas pressure within the chamber.
This operation promotes vaporisation of
the secondary liquid. The vacuum pump is
operated by means of a primary liquid
passing through the vacuum pump. The
vacuum pump is configured to enable the
primary liquid to receive the vapour from
the secondary liquid and to cause the
vapour to condense within the primary
liquid, providing condensed liquid mixed
with the primary liquid. The absorption of
vapour within the system is effective
enough to cause the production of more
vapour (Harman et al., 2013).
However, the refrigerant flows from the
condenser to the evaporator and then to
the generator via the absorber and back to
the condenser, while the absorbent flows
from the absorber to the generator and
back to the absorber. For maximum efficiency, the pressure difference between the low
and high pressures should be as small as possible (Dinçer and Kanoĝlu, 2011).
Researchers such as Ataer and Gögüs (1991), Alizadeh, Bahar and Geoola (1997) and
Morosuk and Tsatsaronis (2008) have carried out studies in the field of vapour-absorption
Figure 2.4: A VARS of 2700 kW at −30 ◦C
installed in a refinery in Germany (Dinçer &
Kanaĝlu, 2011,183-b)

16
refrigeration, using different working pairs with the most common being LiBr-H2O and
NH3-H2O.
The water-lithium bromide refrigeration cycle was an optimisation and theoretical study by
Alizadeh et al. (1997). The conclusion was that a high cooling ratio is directly proportional
to the high generator temperature, with a small surface for heat exchange and low cost
(Alizadeh et al., 1997).
Tyagi (1988) carried out a detailed study on the aqua-ammonia vapour-absorption
refrigeration system (VARS) and plotted the coefficient of performance and mass flow
rates as a function of operating parameters (for example, the temperatures of the
generator, evaporator and absorber). Tyagi established that the temperature of the
evaporator, absorber, condenser and generator are the base functions of the coefficient of
performance (COP) and the work carried out added to their properties of binary solution.
Ataer and Gögüs (1991) indicate that the second law of thermodynamic analysis is the
basis of irreversibility in components of the aqua-ammonia absorption refrigeration system.
Hence, they calculate the dimensionless exergy loss for each element, energetic
coefficients of performance and circulation ratios for different generators, absorber
evaporators and condenser temperature. A high ammonia concentration needs a rectifier
for the aqua-ammonia system in cases where it would lead to extra losses of exergy in the
system. Their observation is that absorber loss is the direct result of the highest exergy
loss in the evaporator (Ataer & Gögüs, 1991).
Bell, Al-Daini, Al-Ali, Habib, Abdel-Gayed and Duckers (1996) experimented with a solar
energy-driven absorption cooling-system called a LiBr-H20. To observe all the processes,
evacuated glass cylinders housed the components of the system to determine the
thermodynamic performance by applying mass and energy balance for all the elements.
However, their work was based on the assumption that working fluids are in equilibrium
and the temperature of the working fluid leaving the generator and absorber is equal to the
temperature of the generator and absorber respectively. The conclusion was that the
system COP depends on the temperature of the generator and the optimum value of the
generator temperature is where COP is maximised. Additionally, COP is obtained at the
low temperature of 68 ºC, when the condenser and the absorber of the system operate at
the same temperature.
Morosuk and Tsatsaronis (2008) used an absorption refrigeration machine to represent
splitting the exergy destruction into endogenous/exogenous and unavoidable/avoidable
parts. This was a new development in the exergy analysis of energy conversion systems.
Their conclusion was that additional useful information would be supplied by an absorption

17
refrigeration machine of advanced energetic evaluation, where exergy analysis cannot be
undertaken or is not possible.
2.3.3.2 VAPOUR-COMPRESSION REFRIGERATION SYSTEM
Wightman (2002) points out that, in a closed-loop vapour-compression cycle, the heat
transfer fluid changes state from a vapour to a liquid in the condenser, giving off heat and
then changes state from a liquid to a vapour in the evaporator, absorbing the heat during
vaporisation. A typical vapour-compression refrigeration system (VCRS) includes a
compressor for pumping the heat transfer fluid, such as Freon, to a condenser, where heat
is produced as the vapour condenses into a liquid. The liquid flows through a line to a
thermostatic expansion valve, while the heat transfer fluid undergoes a volumetric
expansion. The heat transfer fluid, which then exits from the thermostatic expansion valve,
is a low-quality liquid-vapour mixture (Wightman, 2002).
The CFC12 refrigerant in a two-stage vapour-compression refrigeration system’s (VCRS)
optimum inter-stage pressure was determined by Keshwani and Rastogi (1968). Their
research concentrated on the minimisation of the work done by the compressor between
the stages, with or without intercooling. The principle was discussed by Katz (1962) and
was used by Arora and Dhar (1971) for solving R-12 compression systems for the multi-
stages of an optimum inter-stage pressure problem. They concluded that the optimum
inter-stage pressure approximately equals the geometric means of the condensation and
evaporation pressure but when the flash intercooler was incorporated, they found a
considerable difference between the geometric means and the optimal pressure values.
Figure 2.5: A (VCRS) with the control devices (Dinçer & Kanaĝlu, 2011, 142).
18
R-11 and R-12, used as a working fluid for a system of vapour-compression refrigeration
and its method of carrying out exergy analysis, was demonstrated by Kumar, Prevost and
Bugarel (1989). The exergy-enthalpy diagram was presented to facilitate the analysis.
They found that the system demonstrated that different components showed various
losses during the calculation procedure.
Zubair and Khan (1995) indicated that the optimum inter-stage pressure for a two-stage
refrigeration system can be approximated by the saturation pressure corresponding to the
arithmetic mean of the condensation and evaporation temperatures.
R-502 is the proper and a suitable refrigerant for a refrigeration system of vapour-
compression where widely used for supermarket and other cold storage. The Zeotropic
mixture of R-22 and R-115 makes up the components for R-502.
2.3.3.3 VAPOUR COMPRESSION-ABSORPTION REFRIGERATION SYSTEM
The principle of heat pump or vapour compression-absorption refrigeration (VCARS) is the
mechanical compression of the vapour. This vapour is then desorbed after being
absorbed, where a cycle of liquid solution is used. The compression and the absorption of
vapour by those systems would be considered as being hybrid systems. These two types
of systems combine the concepts of a heat pump, the compression and the absorption.
The refrigerants mixture is the working fluid serving as absorbent and desorbent for both
of them. The mixture availability of the range extent of the temperature is the advantage of
the hybrid heat pump over the pure refrigerant. Another advantage is the irreversibility
factor reduced during the process of heat exchanges between the working fluids, leading
to the improvement of the performance of the system due to temperature gliding in both
the absorber and desorber.
Pourreza-Djourshari and Radermacher (1996) obtained the performance characteristics
for two vapour-compression heat pump cycles with a single-stage and two-stage circuit. R-
22-DEGDME was the working fluid, significantly increasing the COP compared to R-22.
The results indicate that there is a potential to control the capacity by a ratio of 7:1, energy
saving of up to 50% and significant reduction in pressure ratio compared to a conventional
R-22 cycle. Radermacher (1987) examined the performance of a vapour-compression
heat pump cycle with desorber/absorber heat exchange working on an R-22-R-113
mixture, using the successive-substitution method. The results showed an improvement in
the cooling COP by 57% with a 69% pressure ratio reduction in comparison to a
conventional R-22 cycle.

19
The process of overall heat-transfer resistance was included in the first simulation model
presented by Stokar and Trepp (1987). The calculation of heat-transfer resistance was
introduced as a function of the mass-flow rate for the working pair NH3-H2O from the
experimental data. The achievement of 23% of energy saving was the result from testing
the plant by heating water from 40 - 70 ºC and from 40 ºC - 15 ºC as the water cools.
A study on a compression-absorption heat bump with R-22-Dimethy1 form during
performance was undertaken by George, Marx and Srinivasa Murthy (1989) using a
thermodynamic analysis. The heating COP, concentration difference and the circulation
ratio were calculated by varying the compression ratio and operating temperatures during
absorption and desorbtion. The assumptions were that the absorbent does not evaporate
sufficiently in the considered temperature range to necessitate rectification.
At the desorber/absorber exit point, the condition of equilibrium exists, which means there
is 100% heat exchanger effectiveness in the compressor. There is isotropic compression
in the pressure-reducing valve as well as isenthalpic expansion and less heat loss,
causing a drop in pressure in the various components. George, J.M., Marx, W. & Srinivasa
Murthy’s (1989) conclusion was that a temperature of 60 ºC with a high CPU of six
conditions was achieved.
An optimisation study was done by Ăhlby, Hodgett and Rademacher (1993) on the cycle of
compression-absorption, with NH3-H2O as a working fluid mixture. The performance of the
cycle was improved by the optimisation of the absorber temperature gradient where
consideration was given to small external temperature gradient situations in particular. The
analysis of the assumptions was that at the outlets of both the absorber and the desorber;
adiabatic absorption and desorption takes place respectively until reaching the state of
equilibrium. For the heat exchange UA (overall heat transfer coefficient (W/(m²·K)* heat
transfer surface area (m2)) value constant, they found that there were neither pressure
drops nor heat losses. Therefore, the operation’s optimum point was found by studying the
changes in the compressor, the pump and observing the heat losses in the solution heat
exchanger with the changes taking place when operational. Their conclusion was that an
optimum point could be found for the working conditions of each external situation.
A working fluid, NH3-H2O-LiBr, was used to study the compression-absorption heat pump
performance. The 10% cycle performance performed better than the binary fluid NH3-H2O,
as shown by the ternary mixture with 60% of mass salt concentration. The estimation from
NH3-H2O-60% LiBr and NH3-H2O properties have not been validated by experimentation,
therefore, the calculation cannot be considered reliable. A salty solution of 40- 50% by
mass would be reliable and the best mixture, as indicated by the results.

20
Solutions of two different versions of working fluid were compared in performance. They
were circuited in the two-stage vapour compression heat pump. This experiment was
carried out by Rane, Amrane and Radermacher (1993). A cascade system was presented.
The mass and heat balance for each component were the basis for the computer
simulation of the model developed. The input parameters were UA values for the
calculations of heat exchange. The cycle performance was compared and it was
established that the cycle of the bleed line and super heater provided 40-50% COP, higher
than the cycle with the rectifier. Various weak parameters of solution-concentration were
studied for the parameters of cooling COP, effectiveness of heat-exchange solution, ratio
of pressure, glides of temperature in absorber and desorber and low-temperature desorber
load. The results indicate the system above could operate at 100 ºC and more than 100K
lift in temperature was achieved.
Itard and Machielsen (1994) investigated the problems encountered when modelling
compression/resorption heat pumps. For large temperature glides, the Log Mean
Temperature Difference (LMTD) method was used less for heat-exchange modelling and
the calculations of COP. Their conclusion was that pure refrigerant was less advantageous
than a mixture, and, for certain external conditions, an optimum overall concentration
existed that was the determinant factor for the COP of the system.
A nitrate absorption/compression refrigeration cycle of ammonia/lithium study was carried
out by Ayala, Heard and Holland (1997). With a range from 0 to 100, the mechanical
vapour compressions were modelled and different generations of power and efficiencies of
distribution were applied to drive the primary ratio of energy. The heat loss of zero was the
main consideration for the hybrid model assumption, except that, in the generator, the
work of the pump was excluded. It was found that an achievement of 10% in overall
efficiency increase is possible by using the absorption/compression refrigeration system.
Kairouani and Nahdi (2006) developed a novel combined refrigeration system with the
purpose of discussing the thermodynamic analysis of the cycle. A study of the possibility of
the use of geothermal energy for the hybrid system, was carried out, where R-22, and R-
134 and R-717 were selected as working fluids for the conventional ammonia-water pair
absorption system. A range of 343 - 349K was the geothermal temperature source and the
result was that the COP for the combined system was significantly high compared to the
COP of a single-stage refrigeration system. This would lead to a reduction of the
consumption of electrical energy.
A thermodynamic investigation comparison was carried out by Satapathy, Gopal and
Arora (2007) on R-22-E181 and R-134a-E181 as working pairs for the vapour

21
compression-absorption system for cooling and heating applications. With the low-
concentration solution and low-system capacity, the R-134a-181 provides a better
performance, while with the high-solution concentration and high-system capacity, R-2-
E181 is better than R-134a-E181. Concluded that for higher volumetric capacities, R-22
was considered to be the proper refrigerant to be used because it could be used for many
years, but, due to the use of non-optimisational components, the actual performance
would be poor.
2.4 REFRIGERATION SUMMARY
A refrigeration system is a combination of components and equipment connected in a
sequential order to produce the desired refrigeration effect for cooling or heating (Klein,
1992).
The refrigeration systems could be classified into three themes:
Vapour absorption refrigeration systems (VARS)
Vapours compression refrigeration system (VCRS)
Vapour compression-absorption refrigeration system (VCARS)
As literature has indicated, refrigerators are designed in stages or chambers.
Refrigeration applications touch our daily lives in deferent forms such as: household
refrigerator, commercial refrigerator as in the supermarket display, restaurants, and
cafeterias, food processing like refrigerated warehouse, industrial tools for liquefaction of
gases, chemical process cooling, crystallization and transport refrigeration for transporting
the product from place to another.
22
CHAPTER THREE DESIGN CONCEPT
3.1 PROLOGUE
In this study, six-chamber refrigeration has been selected with the understanding that if
each chamber has its own temperature, cold air supplies, thermostat and its own door, this
would reduce the testing time to reach the proper temperature for storage of the products
six times less than that in the experiments.
3.2 DESIGN CONSIDERATIONS
Refrigeration can be described as the process of cooling materials where the heat is
transferred from a lower to a higher temperature by a process such as mechanical work.
The temperature may span the range of -157 ºC to +4 ºC. The study of the production of
ultra-low temperature cooling from absolute zero, -273 ºC to -157 ºC, is commonly referred
to as cryogenics. This study will focus on how to extract the heat from the products in each
cooling chamber and keep them at the required temperature, where each thermostat of
each chamber is set.
Having the main cooling chamber below the experimental chambers will lead to a violation
of the air properties. Therefore the cooled air has to be forced to flow into the experimental
chambers. Fans are the key, but there is also the issue of the heat that is produced by
them. The calculation of the heat loss is another issue to be taken into account. If the
chambers are arranged so that they are separated, this will allow each to be surrounded
with the same air temperature on all sides and the calculation of one of the four sides of
the chamber will cover the other three sides. Chapter Four will describe this in detail.
The ejected air from the experimental chambers has to be directed to the bottom of the
deep freezer for larger amount of heat exchange between cold and hot air.
3.3 THE PROTOTYPE COMPONENTS
The prototype is made up of six similar chambers, base and back cover.
3.3.1 THE TESTING CHAMBER
The testing chamber is made up as follows: -

23
1. The outer container: This is a box measuring
300×300 mm with a depth of 350 mm and is made
of 6 mm-thick wood material which serves to
contain the rest of the components of each
chamber. There is a hole 100 mm in diameter in the
top corner of the back of the chamber and another
hole 50 mm in diameter in the opposite bottom
corner of the back (Figure 3.1).
2. The plastic box: This is a box measuring 200×200×300 mm in width, height and depth
respectively. The sides were cut with a laser-cutting machine at the CPUT Project Lab as
in Figure 3.2(a), and assembled with the use of super glue to join the sides together.
3. The air tray: Two plastic strips with a height of 25 mm and a rectangular piece
measures 200×330 mm. The two strips will be lifting the rectangular piece from the bottom
by 25 mm to allow the ejected air to pass out of the experimental chamber. All the
components are glued together with super glue. This is illustrated in Figure 3.2(b).
Figure 3.2(a): The construction of the chamber’s plastic box
4. The sheet metal rim: A piece of square sheet metal with dimensions of 256×256 mm,
and square cut at the medal with dimensions of 206×206 mm with left-over of 150 mm in
length and 20 mm in width for fitting the rim to the body of the chamber . The inner and
Figure 3.1 The outer container
Figure 3.2(b): The chamber’s plastic box after assemblage
24
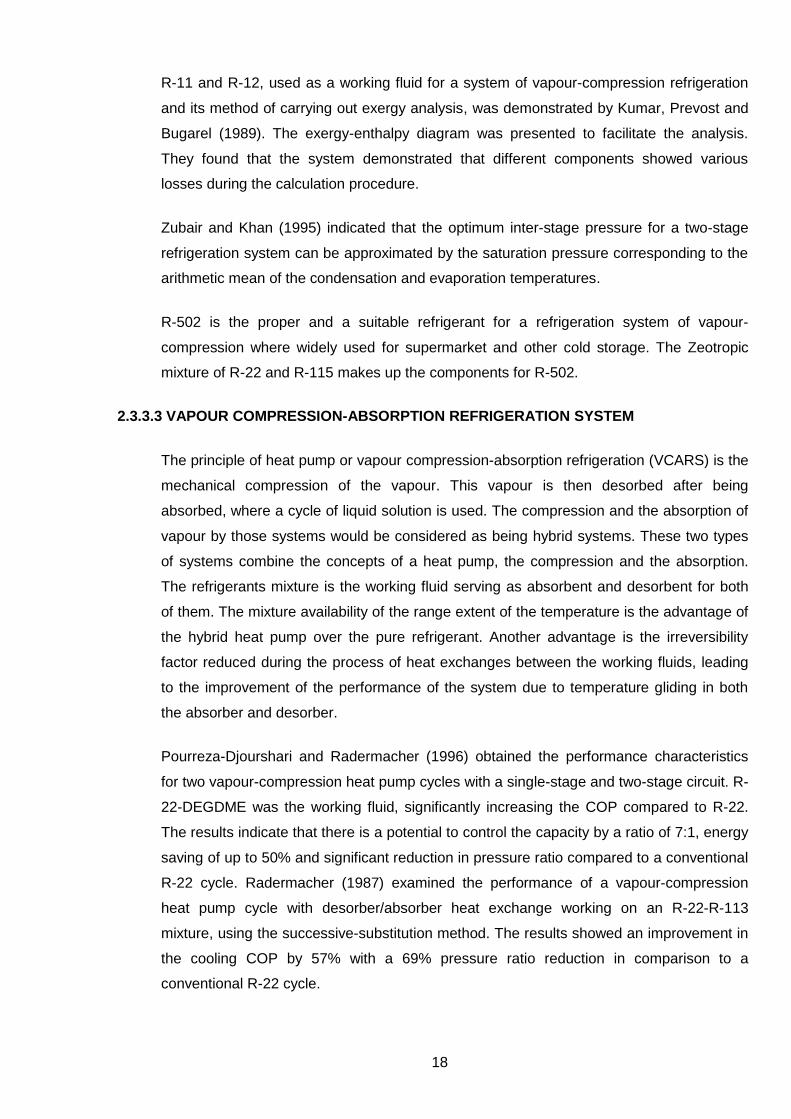
outer edges are bent in the same direction. Figure 3.3 illustrates the layout of the design. It
needs to be taken into consideration that the material of the rim is magnetic ‘ferrite’.
Figure 3.3: The layout of the cut and bend of the sheet metal plate.
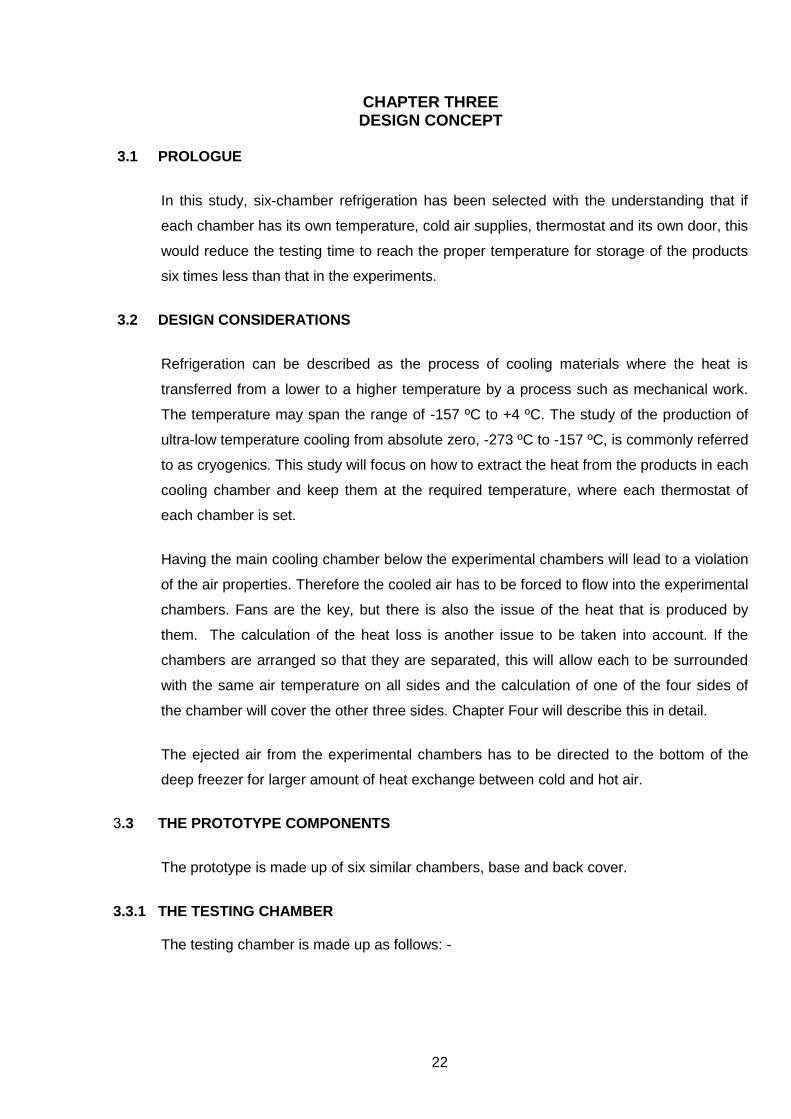
6. The digital thermometer-holder: The digital thermometer holder is made up of two
pieces of plastic with the dimensions of 80×50 mm cut with the laser-cutter machine. The
inner piece is 5 mm thick from which 60×30 windows are cut out. The second piece is 3
mm in thickness with 44×24 mm windows cut out. These pieces are stuck together with
super glue as demonstrated in figure 3.4 below.
Figure 3.4: The digital thermometer-holder components.
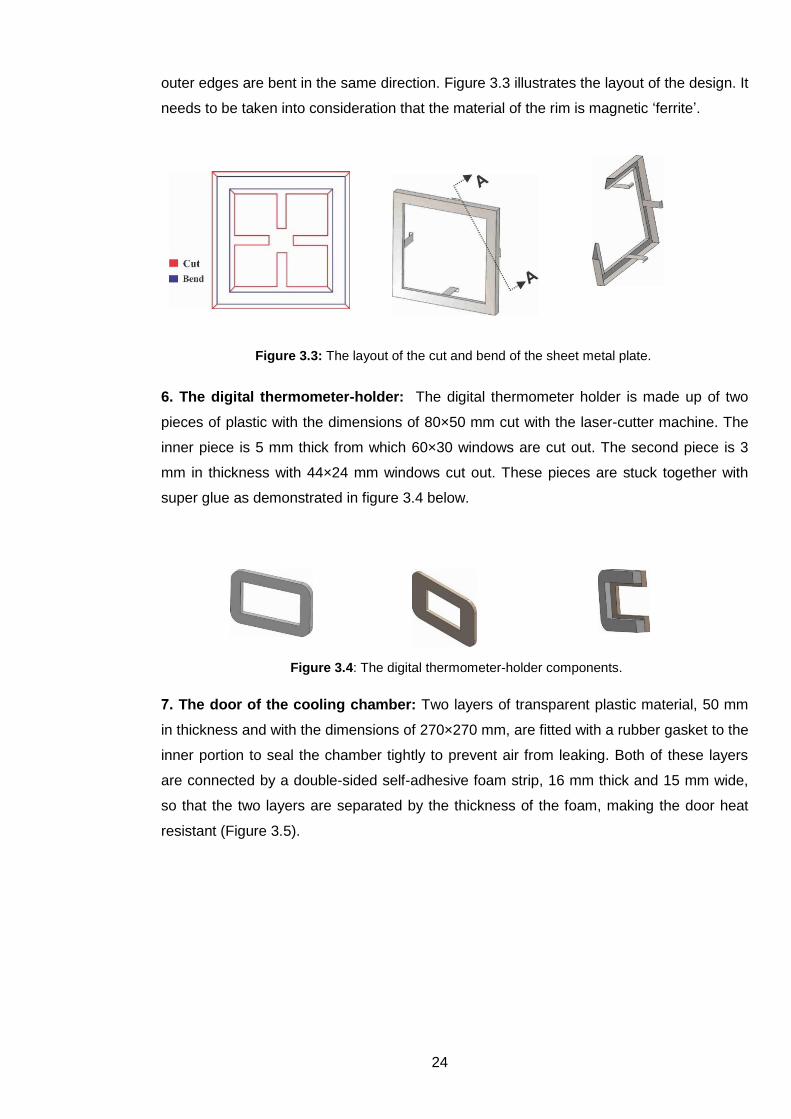
7. The door of the cooling chamber: Two layers of transparent plastic material, 50 mm
in thickness and with the dimensions of 270×270 mm, are fitted with a rubber gasket to the
inner portion to seal the chamber tightly to prevent air from leaking. Both of these layers
are connected by a double-sided self-adhesive foam strip, 16 mm thick and 15 mm wide,
so that the two layers are separated by the thickness of the foam, making the door heat
resistant (Figure 3.5).

25
Figure 3.5: The door of the cooling chamber
8. Inlet and outlet: the outlet is a 100 mm plastic tube, 150 mm in length, and is connected
to the edge of the plastic box through the wood shield. The inlet is 50 mm in diameter with a
90º elbow connected to the outer container at the inlet hole and the 50 mm diameter flexible
tube is linked to the other end of the elbow and left hanging inside the main cooling chamber,
which is referred to as the deep freezer.
9. The electrical unit: A small fan measuring 100 mm×100 mm is connected at the end of
the inlet tube inside the plastic box. The fan speed is controlled by a sensitive thermostat.
There is a Nibble digital ear thermometer installed in the thermometer holder at the chamber
door. Figure 3.6 illustrates the testing chamber after it has been assembled.
Figure 3.6: The testing chamber body
26
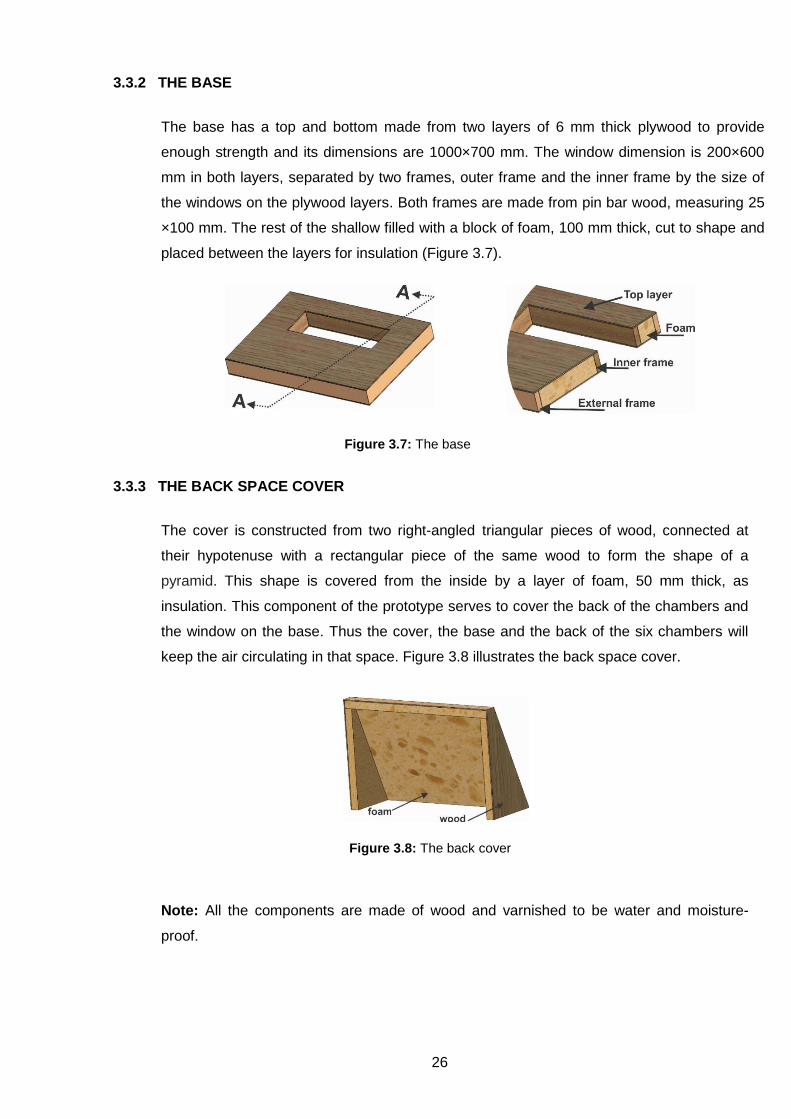
3.3.2 THE BASE
The base has a top and bottom made from two layers of 6 mm thick plywood to provide
enough strength and its dimensions are 1000×700 mm. The window dimension is 200×600
mm in both layers, separated by two frames, outer frame and the inner frame by the size of
the windows on the plywood layers. Both frames are made from pin bar wood, measuring 25
×100 mm. The rest of the shallow filled with a block of foam, 100 mm thick, cut to shape and
placed between the layers for insulation (Figure 3.7).
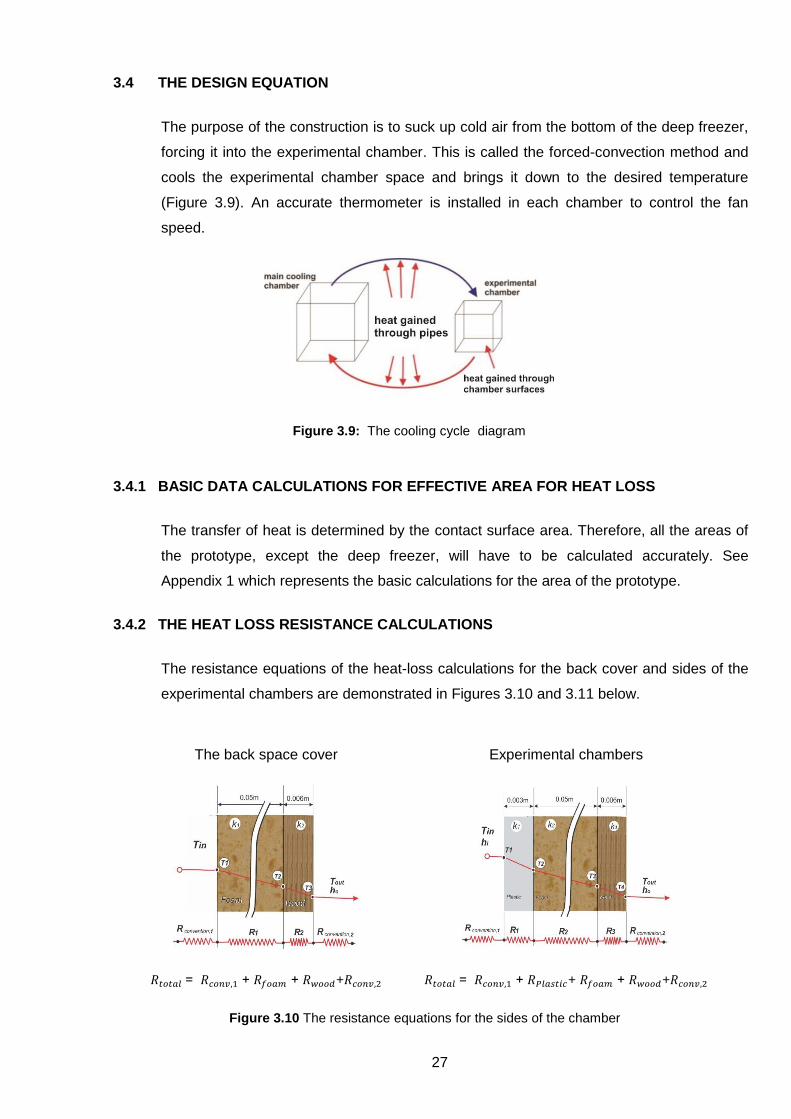
3.3.3 THE BACK SPACE COVER
The cover is constructed from two right-angled triangular pieces of wood, connected at
their hypotenuse with a rectangular piece of the same wood to form the shape of a
pyramid. This shape is covered from the inside by a layer of foam, 50 mm thick, as
insulation. This component of the prototype serves to cover the back of the chambers and
the window on the base. Thus the cover, the base and the back of the six chambers will
keep the air circulating in that space. Figure 3.8 illustrates the back space cover.
Note: All the components are made of wood and varnished to be water and moisture-
proof.
Figure 3.7: The base
Figure 3.8: The back cover
27
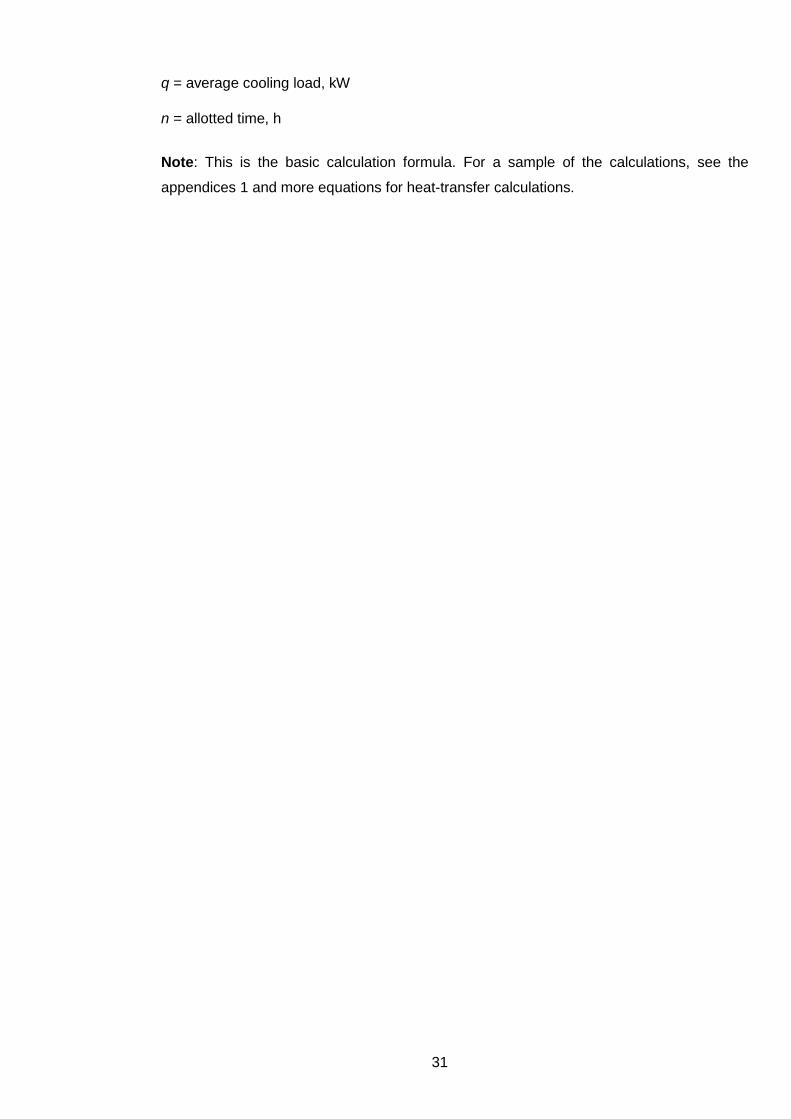
3.4 THE DESIGN EQUATION
The purpose of the construction is to suck up cold air from the bottom of the deep freezer,
forcing it into the experimental chamber. This is called the forced-convection method and
cools the experimental chamber space and brings it down to the desired temperature
(Figure 3.9). An accurate thermometer is installed in each chamber to control the fan
speed.
Figure 3.9: The cooling cycle diagram
3.4.1 BASIC DATA CALCULATIONS FOR EFFECTIVE AREA FOR HEAT LOSS
The transfer of heat is determined by the contact surface area. Therefore, all the areas of
the prototype, except the deep freezer, will have to be calculated accurately. See
Appendix 1 which represents the basic calculations for the area of the prototype.
3.4.2 THE HEAT LOSS RESISTANCE CALCULATIONS
The resistance equations of the heat-loss calculations for the back cover and sides of the
experimental chambers are demonstrated in Figures 3.10 and 3.11 below.
The back space cover Experimental chambers
= + + + = + + + +
Figure 3.10 The resistance equations for the sides of the chamber

28
= + + + +
Figure 3.11: The resistance equations for the chamber door
3.4.3 DEFINITIONS OF HEAT LOSS AND LOAD DETERMINANTS
According to ASHRAE (2002), there are five stages in the refrigeration of the total load as
listed below:
Heat transferred into the refrigeration space through its surface is called the transmission
load.
Heat removed from the product or produced by the product is called the product load.
Heat produced by internal sources such a fan, lights, etc. is called the internal load.
Heat gained by transferring air to the refrigeration space is called the infiltration air load.
Equipment-related load such as fan motors, defrost heater, humidity control.
3.4.4.1 THE TRANSMISSION LOAD
According to the ASHRAE (2002) handbook, the calculation of transmission load
equations is:
(3.1)
Where:
= heat gain W

29
A = Average surface area for heat transfer, where the outer and inner surface area divided
by 2. The unit is .
= Difference between outside air temperature and air temperature of refrigeration
space .
U = overall thermal coefficient of heat transfer of wall, W/ ( .K)
U
⁄
⁄
⁄
(3.2)
Where:
𝑋 = the layer thickness of the wall .
= thermal conductivity of material layers of the wall, W (m.k)
= inside surface conductivity of the wall, W ( .K)
= outside surface conductance, W ( .K)
= outside surface area of the wall,
= inside surface area of the wall,
Note: The effective area is determined by the average of the outside area and the inside
area
The average area =
(3.3)
The inlet area where the fan is located is a circle, 100 mm in diameter, cut out of
the back wall of the chamber, therefore.
The area of the circle= (3.4)
3.4.4.2 THE INTERNAL LOAD
There is generally no other internal load beside the fan’s load, therefore,
Q=n P t (3.5)
Q= heat produced by the fan J (P [W] * t [s])
= number of fans
= time of operation in seconds
P = the fan power (watts)

30
3.4.4.3 THE PRODUCT LOAD
Certain foodstuffs in storage are living organisms and give off heat as their starch or sugar
reserves are slowly being consumed. Oxygen is consumed for the process. This is called
heat of respiration.
According to ASHRAE (2002), for the product load calculation, there are four phases of
heat-removal during the cooling process of the products:
1- Cooling to some lower temperature from the initial temperature above freezing:
= m ( – ) (3.6)
2- Cooling to the freezing point of the product from the initial temperature:
= m ( – ) (3.7)
3- Cooling to freeze the product:
= m (3.8)
4- Cooling to the final temperature below the freezing point from the freezing point:
= m ( – ) (3.9)
Where:
, = heat removed, kJ
m = mass of product, kg
= specific heat of product above freezing, kJ/ (kg·K)
= initial temperature of product above freezing, °C
= lower temperature of product above freezing, °C
= freezing temperature of product, °C
= latent heat of fusion of product, kJ/kg
= specific heat of product below freezing, kJ/ (kg·K)
= final temperature of product below freezing, °C
Thus, the equation for the refrigeration load required for the product is:
q = ∑
(3.10)
31
q = average cooling load, kW
n = allotted time, h
Note: This is the basic calculation formula. For a sample of the calculations, see the
appendices 1 and more equations for heat-transfer calculations.
32
CHAPTER FOUR READINESS, TESTING AND OBSERVATIONS
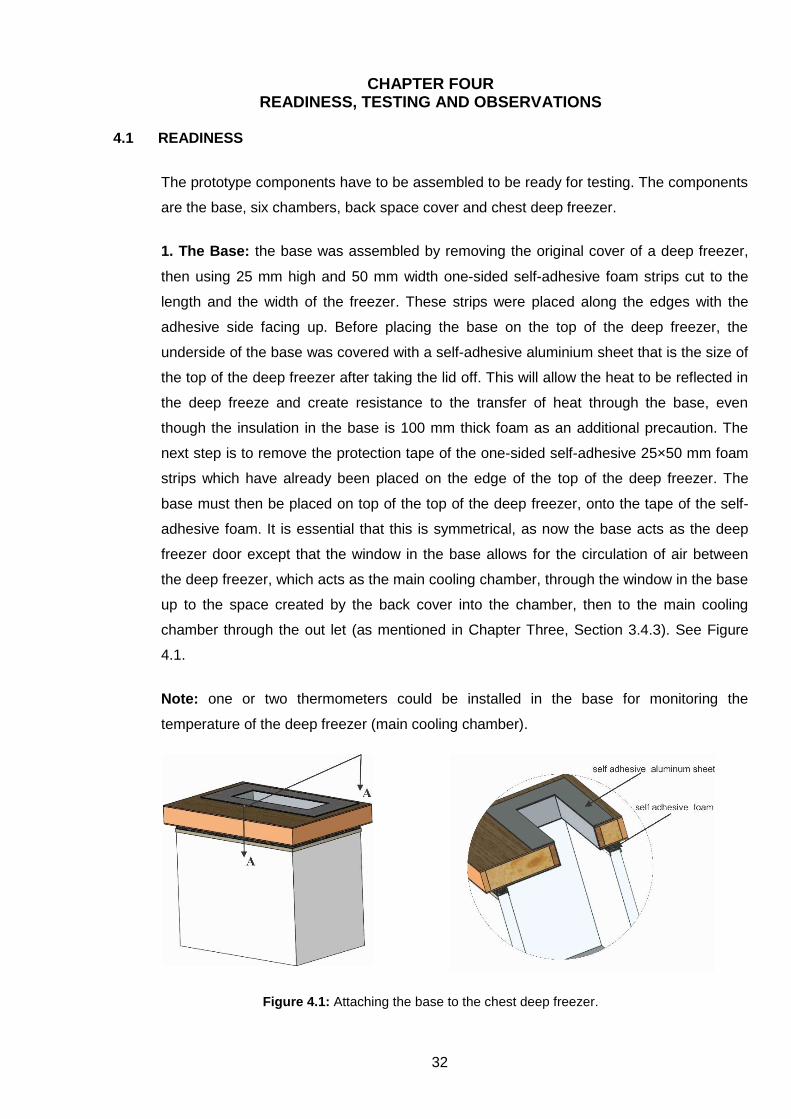
4.1 READINESS
The prototype components have to be assembled to be ready for testing. The components
are the base, six chambers, back space cover and chest deep freezer.
1. The Base: the base was assembled by removing the original cover of a deep freezer,
then using 25 mm high and 50 mm width one-sided self-adhesive foam strips cut to the
length and the width of the freezer. These strips were placed along the edges with the
adhesive side facing up. Before placing the base on the top of the deep freezer, the
underside of the base was covered with a self-adhesive aluminium sheet that is the size of
the top of the deep freezer after taking the lid off. This will allow the heat to be reflected in
the deep freeze and create resistance to the transfer of heat through the base, even
though the insulation in the base is 100 mm thick foam as an additional precaution. The
next step is to remove the protection tape of the one-sided self-adhesive 25×50 mm foam
strips which have already been placed on the edge of the top of the deep freezer. The
base must then be placed on top of the top of the deep freezer, onto the tape of the self-
adhesive foam. It is essential that this is symmetrical, as now the base acts as the deep
freezer door except that the window in the base allows for the circulation of air between
the deep freezer, which acts as the main cooling chamber, through the window in the base
up to the space created by the back cover into the chamber, then to the main cooling
chamber through the out let (as mentioned in Chapter Three, Section 3.4.3). See Figure
4.1.
Note: one or two thermometers could be installed in the base for monitoring the
temperature of the deep freezer (main cooling chamber).
Figure 4.1: Attaching the base to the chest deep freezer.
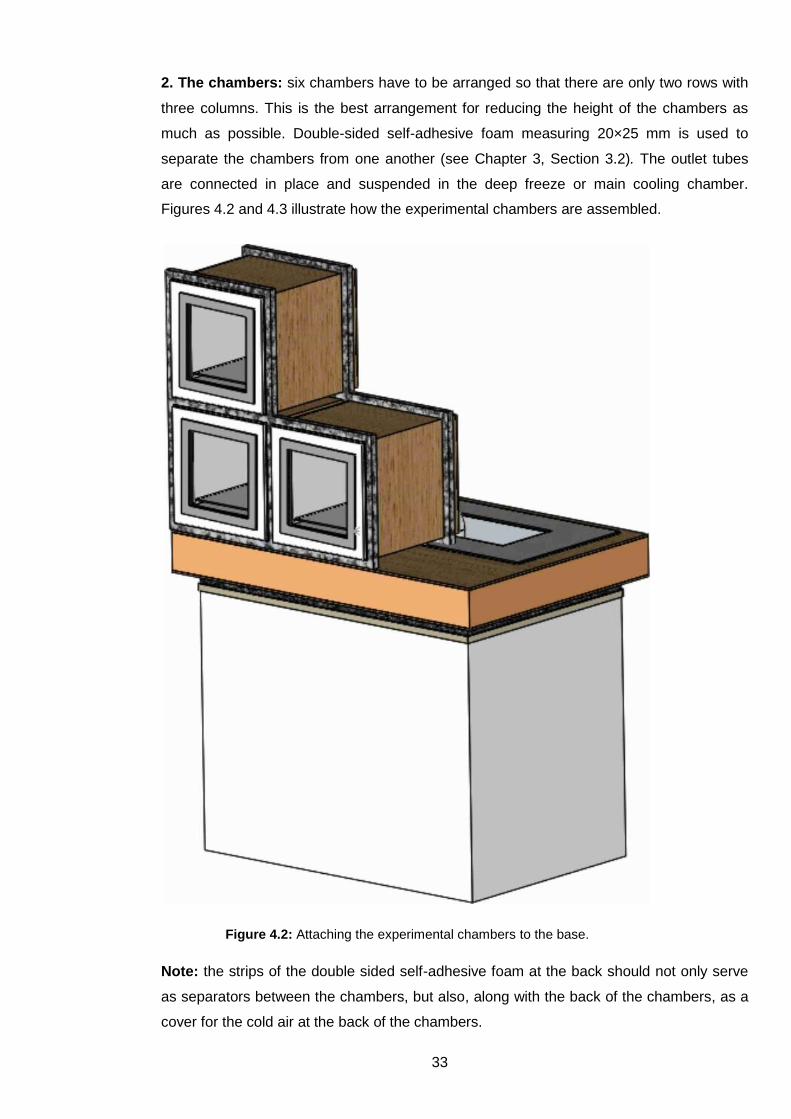
33
2. The chambers: six chambers have to be arranged so that there are only two rows with
three columns. This is the best arrangement for reducing the height of the chambers as
much as possible. Double-sided self-adhesive foam measuring 20×25 mm is used to
separate the chambers from one another (see Chapter 3, Section 3.2). The outlet tubes
are connected in place and suspended in the deep freeze or main cooling chamber.
Figures 4.2 and 4.3 illustrate how the experimental chambers are assembled.
Figure 4.2: Attaching the experimental chambers to the base.
Note: the strips of the double sided self-adhesive foam at the back should not only serve
as separators between the chambers, but also, along with the back of the chambers, as a
cover for the cold air at the back of the chambers.
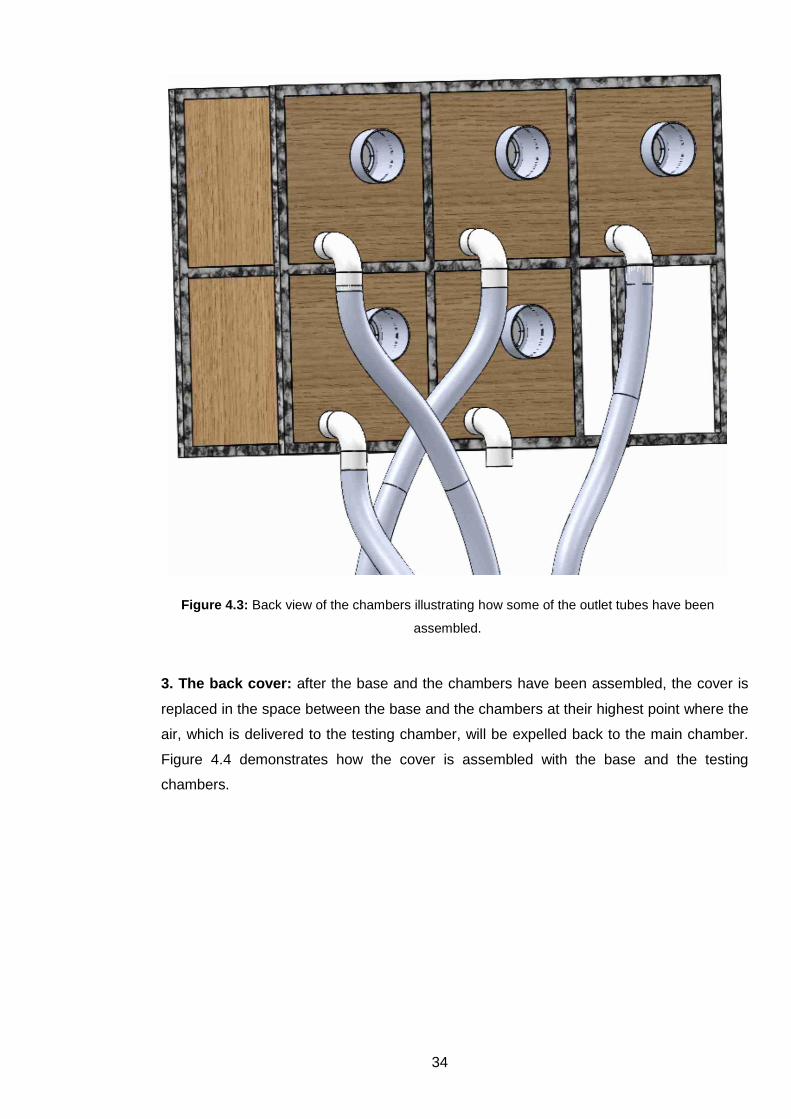
34
Figure 4.3: Back view of the chambers illustrating how some of the outlet tubes have been
assembled.
3. The back cover: after the base and the chambers have been assembled, the cover is
replaced in the space between the base and the chambers at their highest point where the
air, which is delivered to the testing chamber, will be expelled back to the main chamber.
Figure 4.4 demonstrates how the cover is assembled with the base and the testing
chambers.
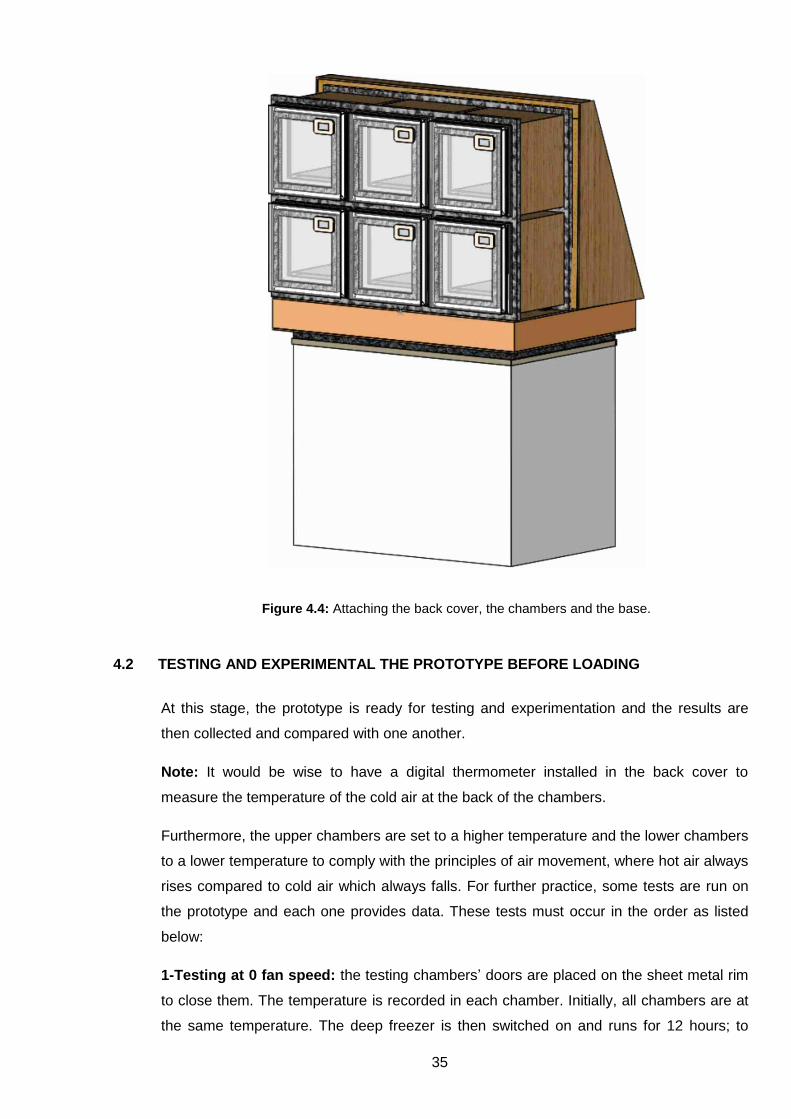
35
Figure 4.4: Attaching the back cover, the chambers and the base.
4.2 TESTING AND EXPERIMENTAL THE PROTOTYPE BEFORE LOADING
At this stage, the prototype is ready for testing and experimentation and the results are
then collected and compared with one another.
Note: It would be wise to have a digital thermometer installed in the back cover to
measure the temperature of the cold air at the back of the chambers.
Furthermore, the upper chambers are set to a higher temperature and the lower chambers
to a lower temperature to comply with the principles of air movement, where hot air always
rises compared to cold air which always falls. For further practice, some tests are run on
the prototype and each one provides data. These tests must occur in the order as listed
below:
1-Testing at 0 fan speed: the testing chambers’ doors are placed on the sheet metal rim
to close them. The temperature is recorded in each chamber. Initially, all chambers are at
the same temperature. The deep freezer is then switched on and runs for 12 hours; to

36
reach the lowest temperature and -30 ºC is recorded. This test demonstrates how much
heat will be transferred to the chambers by comparing the first and last readings from the
digital thermometers on the doors of the chambers, recording the temperatures of the
deep freezer and that at the back cover space. If the temperature in the testing chamber
standing still or has negligible change or slightly has dropped, this will be acceptable as, at
this stage, the design of the prototype will be considered satisfactory. If there is a greater
degree of change, the design for the control inlet will have to be modified.
2- Testing at maximum fan speed: this second test is done after the prototype has
passed the previous test. The thermostat of each testing chamber is set to the same
temperature for all the chambers and the fans switched on when the deep freezer
temperature has reached its maximum. The minimum time for monitoring the drop in
temperature for each of the testing chambers was 45 minutes to an hour. The test
provided information about the cooling speeds for the testing chambers and whether the
testing chambers would all cool down to the same temperature at the same time or not.
3- Testing at chamber temperature: this test follows if the previous test has been
successful. The thermostat of each testing chamber is set to the desired temperature. The
drop in temperature for the testing chambers is monitored every 30 minutes for four hours
or longer, as this provides information regarding the question of how higher temperature
chamber fan stoppages would affect the performance of lower ones.
These tests provide information for future research into the analysis of the design while the
results of these experiments with this prototype and the design are regarded as the
outputs of the current project. Figure 4.5 demonstrates the final prototype design.
Figure 4.5: The original built prototype.
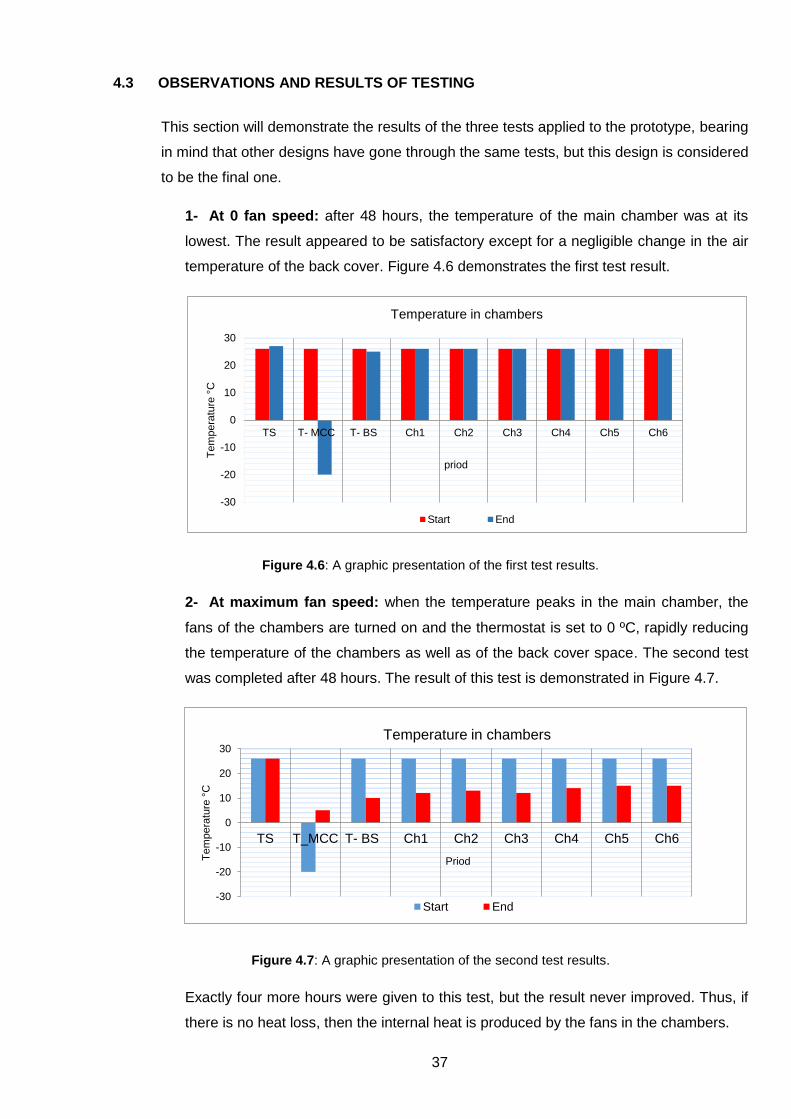
37
4.3 OBSERVATIONS AND RESULTS OF TESTING
This section will demonstrate the results of the three tests applied to the prototype, bearing
in mind that other designs have gone through the same tests, but this design is considered
to be the final one.
1- At 0 fan speed: after 48 hours, the temperature of the main chamber was at its
lowest. The result appeared to be satisfactory except for a negligible change in the air
temperature of the back cover. Figure 4.6 demonstrates the first test result.
Figure 4.6: A graphic presentation of the first test results.
2- At maximum fan speed: when the temperature peaks in the main chamber, the
fans of the chambers are turned on and the thermostat is set to 0 ºC, rapidly reducing
the temperature of the chambers as well as of the back cover space. The second test
was completed after 48 hours. The result of this test is demonstrated in Figure 4.7.
Figure 4.7: A graphic presentation of the second test results.
Exactly four more hours were given to this test, but the result never improved. Thus, if
there is no heat loss, then the internal heat is produced by the fans in the chambers.
-30
-20
-10
0
10
20
30
TS T- MCC T- BS Ch1 Ch2 Ch3 Ch4 Ch5 Ch6
Te
mpera
ture
°C
priod
Temperature in chambers
Start End
-30
-20
-10
0
10
20
30
TS T_MCC T- BS Ch1 Ch2 Ch3 Ch4 Ch5 Ch6
Te
mpera
ture
°C
Priod
Temperature in chambers
Start End
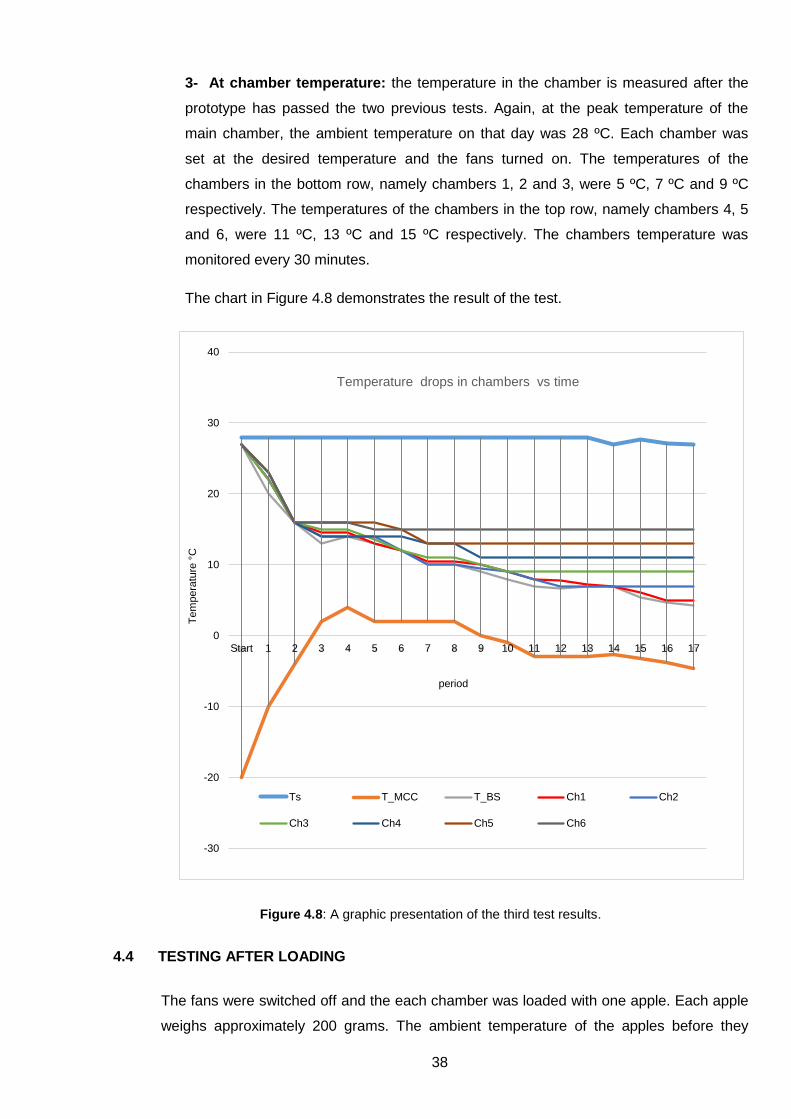
38
3- At chamber temperature: the temperature in the chamber is measured after the
prototype has passed the two previous tests. Again, at the peak temperature of the
main chamber, the ambient temperature on that day was 28 ºC. Each chamber was
set at the desired temperature and the fans turned on. The temperatures of the
chambers in the bottom row, namely chambers 1, 2 and 3, were 5 ºC, 7 ºC and 9 ºC
respectively. The temperatures of the chambers in the top row, namely chambers 4, 5
and 6, were 11 ºC, 13 ºC and 15 ºC respectively. The chambers temperature was
monitored every 30 minutes.
The chart in Figure 4.8 demonstrates the result of the test.
Figure 4.8: A graphic presentation of the third test results.
4.4 TESTING AFTER LOADING
The fans were switched off and the each chamber was loaded with one apple. Each apple
weighs approximately 200 grams. The ambient temperature of the apples before they
-30
-20
-10
0
10
20
30
40
Start 1 2 3 4 5 6 7 8 9 10 11 12 13 14 15 16 17
Te
mpera
ture
°C
period
Temperature drops in chambers vs time
Ts T_MCC T_BS Ch1 Ch2
Ch3 Ch4 Ch5 Ch6
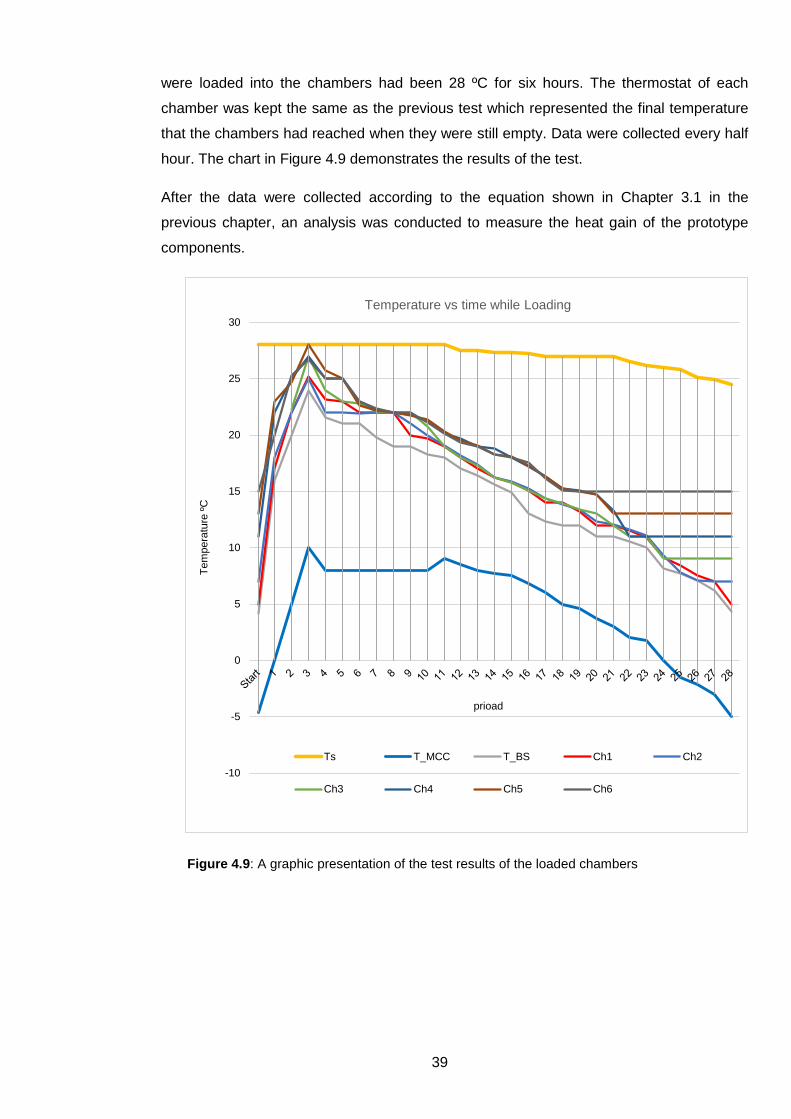
39
were loaded into the chambers had been 28 ºC for six hours. The thermostat of each
chamber was kept the same as the previous test which represented the final temperature
that the chambers had reached when they were still empty. Data were collected every half
hour. The chart in Figure 4.9 demonstrates the results of the test.
After the data were collected according to the equation shown in Chapter 3.1 in the
previous chapter, an analysis was conducted to measure the heat gain of the prototype
components.
Figure 4.9: A graphic presentation of the test results of the loaded chambers
-10
-5
0
5
10
15
20
25
30
Te
mpera
ture
ºC
prioad
Temperature vs time while Loading
Ts T_MCC T_BS Ch1 Ch2
Ch3 Ch4 Ch5 Ch6
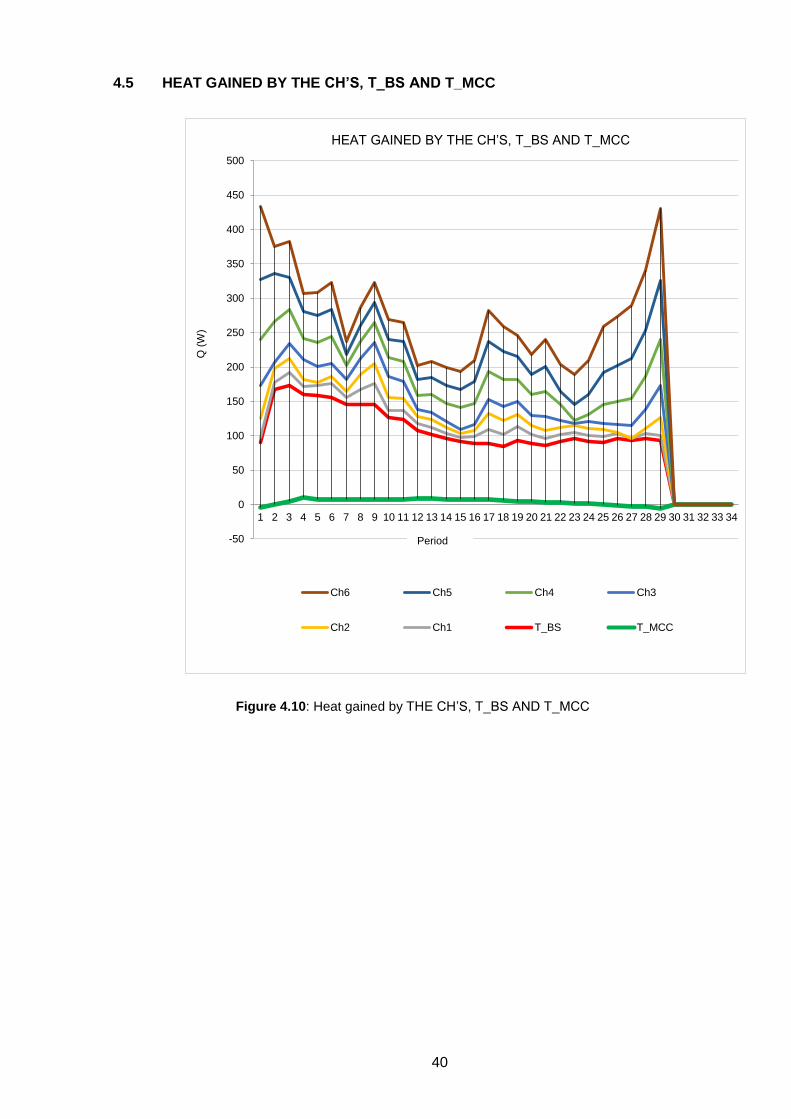
40
4.5 HEAT GAINED BY THE CH’S, T_BS AND T_MCC
Figure 4.10: Heat gained by THE CH’S, T_BS AND T_MCC
-50
0
50
100
150
200
250
300
350
400
450
500
1 2 3 4 5 6 7 8 9 10 11 12 13 14 15 16 17 18 19 20 21 22 23 24 25 26 27 28 29 30 31 32 33 34
Q (
W)
HEAT GAINED BY THE CH’S, T_BS AND T_MCC
Ch6 Ch5 Ch4 Ch3
Ch2 Ch1 T_BS T_MCC
Period
41
CHAPTER FIVE CONCLUSION AND RECOMMENDATIONS
5.1 CONCLUSION
On the basis of the results obtained in this study, the following conclusions can be
drawn:
The first test proved that the air is very poor at self-cooling by convection if the desired
space to be cooled is directly above the source of the cold (evaporator). The temperature
in the back space decreased by only one degree from 26º C to 25º C after 48 hours. The
temperatures of the chambers did not change, which provides self-regulation of the air
flowing to the chambers.
The second test shows that after 48 hours, the temperature of the main cooling chamber
rose. The temperatures in the lower chambers were lower than those in the upper
chambers.
The third test ran without a load in the chambers. The result shows that the different
desired temperatures in the chambers had been reached periodically after seven and a
half hours. They remained constant in each chamber at the levels at which they had been
set. The phenomenon is that when the thermostat of the sixth chamber sets the fan speed
to zero, the heat generated by this fan is eliminated. This is evident in the temperature
decreasing in the temperature of the main cooling chamber and when the thermostat set
the fan speed to zero in the different chambers, the temperature in the main cooling
chamber decreased every time.
The fourth test ran with a load in the testing chambers after the third test. The result shows
that the temperature of the chambers increased rapidly, especially the upper chambers
where the temperatures were higher. The temperature of the main cooling chamber
increased too. The temperature of the main cooling chamber dropped slightly within half
an hour and then stabilised for three hours, after which, for some unknown reason, it rose
up for half an hour, before it started to decline again. The temperatures of chambers one,
two and three were constant at first. Later, they dropped at different rates, with chamber 2
showing the slowest rate. A constant temperature in the lowest chamber was achieved at
5°C. Hence, the objective of having different chambers at different set temperatures
between 5 and 15 °C was achieved. The system can therefore be used to test food
storage at these ‘high’ refrigeration temperatures.
5.2 RECOMMENDATIONS
For this project, it was ascertained that the design would be better off with an evaporator
above the area needing to be cooled because the results of the experiments show that the

42
time to reach constant temperatures is too long. This could be because of the deficit
caused by dragging or pushing the cold air from the main cooling chamber up to the
experimental chambers, which is in violation of the principles governing the movement of
cold air. Another device, such as a fan, is needed. This will make it possible for more loads
to be added. Finding another way for controlling the air flow in the experimental chambers
(for example, such as using a hydraulic thermostat) would also help.

43
REFERENCES
Ăhlby, L., Hodgett, D. & Radermacher, R.1993. NH3/H2O-LiBr as working fluid for the
compression/absorption cycle. International Journal of Refrigeration, 16(4):265-273.
Alizadeh, S., Bahar, F. & Geoola, F. 1979. Design and optimisation of an absorption
refrigeration system operated by solar energy. Solar Energy, 22(2):149–154.
Arora, C.P. and Dhar, P.L., Optimization of multistage refrigerant compressor, Progress in
Refrigeration Science and Technology, XIII International Congress of Refrigeration (IIR),
(1973), pp. 693-700
ASHRAE, 2002. Refrigeration Handbook , American Society of Heating, Refrigerating and
Air-Conditioning Engineers, Inc. 1791 Tullie Circle, N.E., Atlanta, GA 30329.
Ataer, O. E. & Gögüs, Y. 1991. Comparative study of irreversibilities in an aqua-ammonia
absorption refrigeration system. International Journal of Refrigeration, 14(2):86–92.
Ayala, R., Heard, C.L. & Holland, F.A. 1997. Ammonia/lithium nitrate
absorption/compression refrigeration cycle. Part-I. Simulation. Applied Thermal
Engineering, 17(3):223–233.
Bell, I.A., Al-Daini, A.J., Al-Ali, H., Abdel-Gayed, R.G. & Duckers, L. 1996. The design of
an evaporator/absorber and thermodynamic analysis of a vapour absorption chiller driven
by solar energy. Renewable Energy, 9(1–4):657–660.
Chopra, K., Sahni, V., Mishra, R.S., 2015. Energy, Exergy and Sustainability Analysis of
Two-stage Vapour Compression Refrigeration System. Journal of Thermal Engineering,
1(4): 440–445.Coulomb, D. 2008. Refrigeration and cold chain serving the global food
industry and creating a better future: two key IIR challenges for improved health and
environment. Trends in Food Science and Technology, 19(8):413–417.
Dinçer, I. and Kanoĝlu, M. (2011). Refrigeration System and Applications. (2nd ed.).
Chichester, United Kingdom: John Wiley and Sons Ltd.
Docrep http://www.fao.org/docrep/008/y4893- e/y4893e06.htm/ April 18, 2016, 9:27:07
PM
44
Flik https://www.flickr.com/photos/17016116@N08/3243161746/sizes/o/April 10, 2016,
10:56:06 PM.
George, J.M., Marx, W. & Srinivasa Murthy, S. 1989. Thermodynamic analysis of R22-
DMF compression-absorption heat pump. Heat Recovery Systems & CHP, 9(5):433–446.
Gould, G.W. 1995. New Methods of Food Preparation. Dordrecht: Springer.
Gould, G.W.1996. Methods for preservation and extension of shelf life. International
Journal of Food Microbiology, 33(1):51–64.
Gustavsson, J., Cederberg, C. & Sonesson, U. 2011. Global Food Losses and Food
Waste. PowerPoint presentation at the Save Food Congress, Düsseldorf, 16 May 2011.
The Swedish Institute for Food and Biotechnology (SIK), Gothenburg, Sweden.
Harman, J.D., Webster, B. & Farsad, K., 2013. US Patent Application for Vapor
Absorption System Patent Application (Application #20140326591 issued November 6,
2014) - Justia Patents Search.
Satapathy, P.K., Gopal, M.R., Arora R.C. 2004. Studies on a Compression-Absorption
Heat Pump for simultaneous cooling and heating. International Journal of Energy
Research, 28(7):567-580.
http://www.guardian.co.uk/environment/2012/feb/10/sainsbury-food-freezing-advice-waste.
April 18, 2016, 9:27:07 PM
Ice house http://www.newforestexplorersguide. co.uk/heritage/history- in-the-landscape/ice-
houses.html/ April 16, 2016, 9:27:07 PM
Itard, L.C.M. & Machielsen, C.H.M. 1994. Considerations when modelling
compression/resorption heat pumps. International Journal of Refrigeration, 17(7):453–
460.
James, S.G. & James, C. 2010. The food cold-chain and climate change. Food Research
International, 43(7):1944–1956.
Kairouani, L. & Nehdi, E. 2006. Cooling performance and energy saving of a
compression-absorption refrigeration system assisted by geothermal energy. Applied
Thermal Engineering, 26(2–3):288-294.
45
Katz, S. 1962. Best Operating points for Staged System, Industrial Engineering Chemistry
Fundamentals, 1(4):226-40.
Keshwani, H.B. & Rastogi, K.V. 1968. Optimum inter-cooler pressure in multistage
compression of refrigerants. All India Symposium on Refrigeration, Air-Conditioning and
Environmental Control in Cold Storage Industry, E6.1–13.
Klein, S. A. (1992). Design Considerations for Refrigeration Cycles. International Journal of
Refrigeration, 15(3):181-186.
Kumar, S., Prevost, M. & Bugarel, R. 1989. Exergy analysis of a compression
refrigeration system. Heat Recovery Systems and CHP, 9(2):151-157.
Leistner, L & Gorris, LGM. 1995. Food preservation by hurdle technology. Trends in Food
Science and Technology, 6(2): 41-46.
Leistner, L. 2000. Basic aspects of food preservation by hurdle technology. International
Journal of Food Microbiology, 55(1-3):181-186.
Leistner, L., 1995a. Principles and applications of hurdle technology. In: Gould, G.W.
(Ed.). New Methods for Food Preservation. Dordrecht: Springer,:1–21.Leistner, L., 1995b.
Emerging concepts for food safety. In: 41st International Congress of Meat Science and
Technology, 20– 25 August 1995, San Antonio, Texas:321–322.Madhlopa. A & Ngwalo,
G. 2006. Solar dryer with thermal storage and biomass-backup heater. Solar Energy,
81(4):449–462.
Michael_Faraday https://simple.wikipedia.org /wiki/Michael_Faraday/April 10, 2016,
10:56:06 PM
Morosuk, T. & Tsatsaronis, G. 2008. A new approach to the exergy analysis of absorption
refrigeration machines. Energy, 33(6):890-907.
Neuburger, A. (2003). The technical arts and sciences of the ancients. London: Kegan
Paul.
NPCS Board of Consultants and Engineers. 2016. The Complete Book on Cold Storage,
Cold Chain & Warehouse (with Controlled Atmosphere Storage & Rural Godowns). 2nd
Ed. New Delhi, India: Niir Project Consultancy Services.
46
PEAK Mechanical Partnership, nd. History of Refrigeration [WWW Document]. URL
http://www.peakmechanical.ca/history-of-refrigeration.html (accessed 4.27.16).
Peck, M.W. 1997. Clostridium botulinum and the safety of refrigerated processed foods of
extended durability. Trends in Food Science and Technology, 8(6): 186-192.
Pelletier, N., Audsley, E., Brodt, S., Garnett, T., Henriksson, P., Kendall, A., Kramer, K.J.,
Murphy, D., Nemecek, T. and Troell, M. 2011. Energy intensity of agriculture and food
systems, Annual Review of Environment and Resources, 36(1): 223–246.
Pourreza-Djourshari, S. and radermacher, R., Calculation of the performance of vapour
compression heat pumps with solution circuits using the mixture R-22-DEGDME,
International Journal of Refrigeration, Vol.9, (1996), pp. 245-250
Products_12 http://www.ponika-invest.com /products-12-en.html/ April 18, 2016, 9:27:07
PM
Radermacher, R.,vapour compression heat pumps with desorber/absorber heat
exchange, Proc. Of XVIIth, International Congress of Refrigeration, (1987), Vienna,
Austria, pp. 1061-1066
Rane, M.V., Amrane, K. & Radermacher, R. 1993. Performance enhancement of a two
stage vapour compression heat pump with solution circuits by eliminating the rectifier.
International Journal of Refrigeration, 16(4):247-257.
Ratti, C. & Mujumdar, A.S. 1997. Solar drying of foods: Modeling and numerical
simulation. Solar Energy, 60(3-4): 151–157.
Refrigerant-safety https://www.epa.gov/snap/refrigerant-safety/ Jun 18,2016 -8:32:33 PM
Refrigeration https://en.wikipedia.org/wiki/Refrigeration/ April 18, 2016, 9:27:07 PM
Rolle, Rosa S. (Ed.) (2006). Improving Postharvest Management and Marketing in the
Asia-Pacific Region: Issues and Challenges. In Rolle, Rosa S. Post-harvest Management
of Fruit and Vegetables in the Asia-Pacific Region. Tokyo, Japan: 23 – 31.
Satapathy, P.K., Gopal, M.R. & Arora, R.C. 2004. Studies on compression absorption
Sonnino, R., Faus, A.M. & Maggio, A. 2014. Sustainable food security: an emerging
47
research and policy agenda. International Journal of Sociology of Agriculture and Food,
21(1):173–188.
Stokar, M. & Trepp, C. 1987. Compression heat pump with solution circuit part-1: design
and experimental results. International Journal of Refrigeration, 10(2):87-96.
Tanaka, K., Hilary, Z.D. & Ishizaki, A., 1999. Investigation of the utility of pineapple juice
and pineapple waste material as low-cost substrate for ethanol fermentation by
Zymomonas mobilis. Bioscience and Bioengineering, 87(5), 642-646.
Tyagi, K.P. 1988. Design parameters of an aqua-ammonia vapour absorption refrigeration
system. Heat Recovery Systems & CHP, 8(4):375-377.
Wightman, D. 2002. Vapour compression system and method.
http://www.google.ch/patents/US20020053218. Accessed on 24 April 2016.
Yilmaz, E. & Karadeniz, F. 2014. Effect of storage on the bioactive compounds and
antioxidant activity of quince nectar. International Journal of Food Science and
Technology, 49(3): 718–725.
Zubair, S.M. & Khan, S.H. 1995. On optimum interstage pressure for two-stage and
mechanical-subcooling vapour compression refrigeration cycles. Journal of Solar Energy
Engineering, 117(1):64-66.

48
APPENDICES
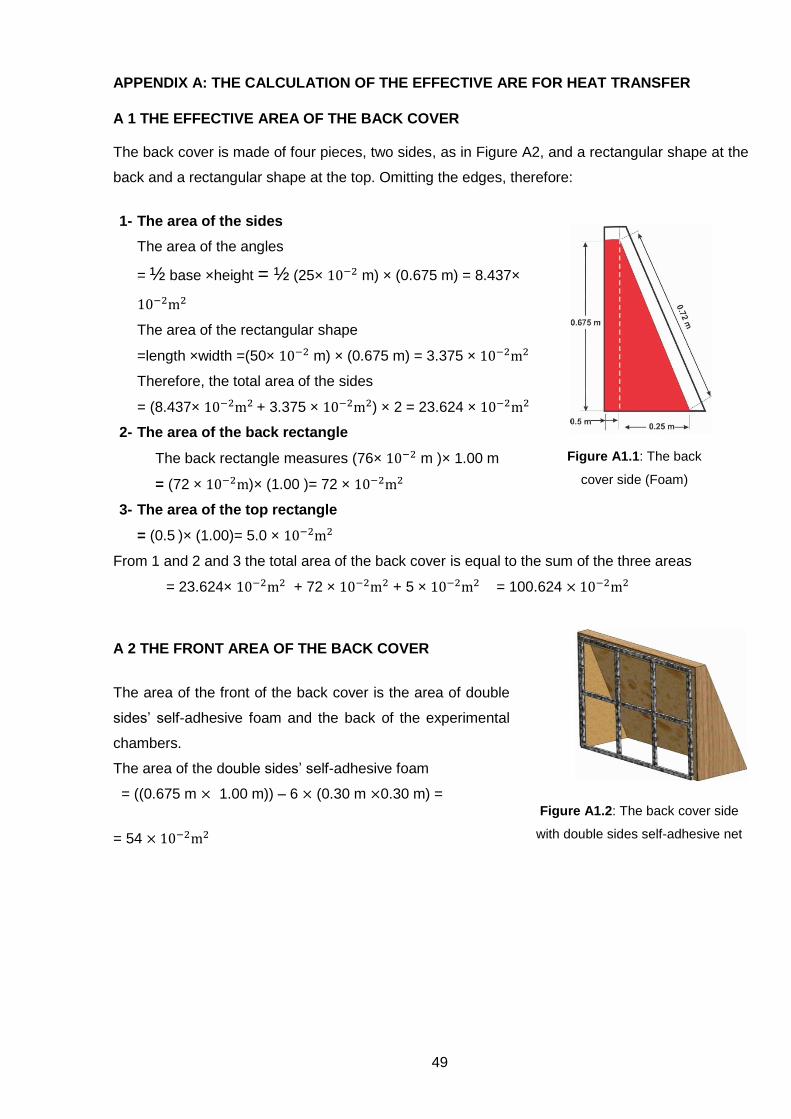
49
APPENDIX A: THE CALCULATION OF THE EFFECTIVE ARE FOR HEAT TRANSFER
A 1 THE EFFECTIVE AREA OF THE BACK COVER
The back cover is made of four pieces, two sides, as in Figure A2, and a rectangular shape at the
back and a rectangular shape at the top. Omitting the edges, therefore:
1- The area of the sides
The area of the angles
= ½ base ×height = ½ (25× m) × (0.675 m) = 8.437×
The area of the rectangular shape
=length ×width =(50× m) × (0.675 m) = 3.375 ×
Therefore, the total area of the sides
= (8.437× + 3.375 × ) × 2 = 23.624 ×
2- The area of the back rectangle
The back rectangle measures (76× m )× 1.00 m
= (72 × )× (1.00 )= 72 ×
3- The area of the top rectangle
= (0.5 )× (1.00)= 5.0 ×
From 1 and 2 and 3 the total area of the back cover is equal to the sum of the three areas
= 23.624× + 72 × + 5 × = 100.624
A 2 THE FRONT AREA OF THE BACK COVER
The area of the front of the back cover is the area of double
sides’ self-adhesive foam and the back of the experimental
chambers.
The area of the double sides’ self-adhesive foam
= ((0.675 m 1.00 m)) – 6 (0.30 m 0.30 m) =
= 54
Figure A1.2: The back cover side
with double sides self-adhesive net
Figure A1.1: The back
cover side (Foam)

50
A 3 THE EFFECTIVE HEAT TRANSFER AREA OF THE CHAMBER
Figure A1.3: The chamber dimensions for the effective area
Thus: the chamber door has two plastic layers separated by layer of air and foam at the edges,
therefore,
The area of the foam separator = (0.25 m× 0.25m) - (0.20 m×0.20 m) = 1.06
By using the Microsoft Excel software for calculations, the results are shown in Table A1.
Table A1: Calculations of the chamber effective area for heat transfer
Figure A1.4: The chamber door dimensions diagram for the effective area
No; Part name The inner area The external
area
# Average Area ×#
1 The chamber sides 0.200 m×0.250 m 0.318 m×0.309 m 4 29.16
2 The chamber back side 0.200 m×0.175 m 0.318 m×0.259 m 1 6.31
3 The plastic doors (air separator)
0.20 m×0.20 m 0.20 m×0.20 m 1 4.0
4 The plastic doors (foam separator)
(0.25 m× 0.25m) -(0.20 m×0.20 m) 1 1.06
5 Convection area of the chamber door
0.2250 m×0.2250 m 1 5.06
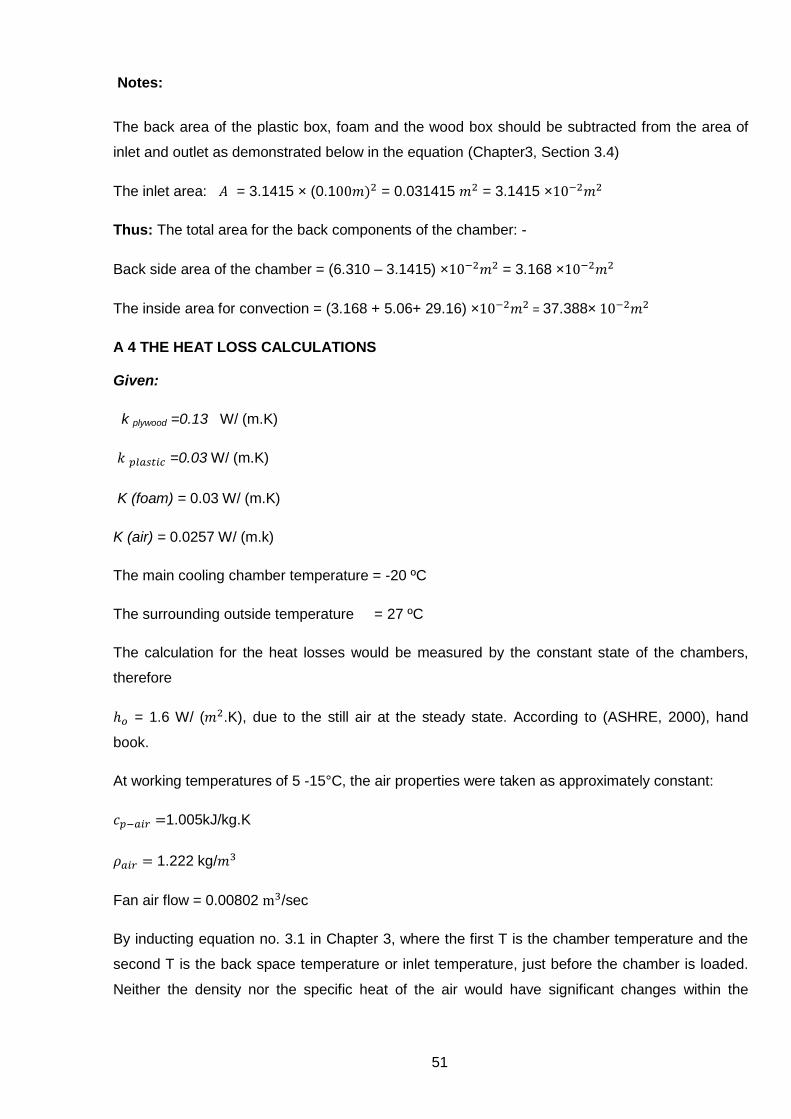
51
Notes:
The back area of the plastic box, foam and the wood box should be subtracted from the area of
inlet and outlet as demonstrated below in the equation (Chapter3, Section 3.4)
The inlet area: = 3.1415 × (0.1 = 0.031415 = 3.1415 ×
Thus: The total area for the back components of the chamber: -
Back side area of the chamber = (6.310 – 3.1415) × = 3.168 ×
The inside area for convection = (3.168 + 5.06+ 29.16) × = 37.388×
A 4 THE HEAT LOSS CALCULATIONS
Given:
k plywood =0.13 W/ (m.K)
=0.03 W/ (m.K)
K (foam) = 0.03 W/ (m.K)
K (air) = 0.0257 W/ (m.k)
The main cooling chamber temperature = -20 ºC
The surrounding outside temperature = 27 ºC
The calculation for the heat losses would be measured by the constant state of the chambers,
therefore
= 1.6 W/ ( .K), due to the still air at the steady state. According to (ASHRE, 2000), hand
book.
At working temperatures of 5 -15°C, the air properties were taken as approximately constant:
1.005kJ/kg.K
1.222 kg/
Fan air flow = 0.00802 /sec
By inducting equation no. 3.1 in Chapter 3, where the first T is the chamber temperature and the
second T is the back space temperature or inlet temperature, just before the chamber is loaded.
Neither the density nor the specific heat of the air would have significant changes within the

52
temperature range reserved, therefore, from appendices B, table B4 and the first row of data for
the chamber 1, the calculation of the heat gained:
= (1.222 kg/ × 0.00802 /sec) × 1.005 kJ/kg. ºC × (5- 4.2) ºC
= 0.007879 kW
When the chamber is loaded with an apple weights 200 grams, the temperature of the chamber
rises due to the ambient air which flowed in while loading the chamber with the apple, and the
heat produced by the apple. The thermostat switches the fan on.
Note:
: surrounding temperature
: main cooling chamber temperature
: back space cover temperature
Ch1… Ch6: chamber1 …, chamber6
All the temperatures were measured in degrees Celsius.
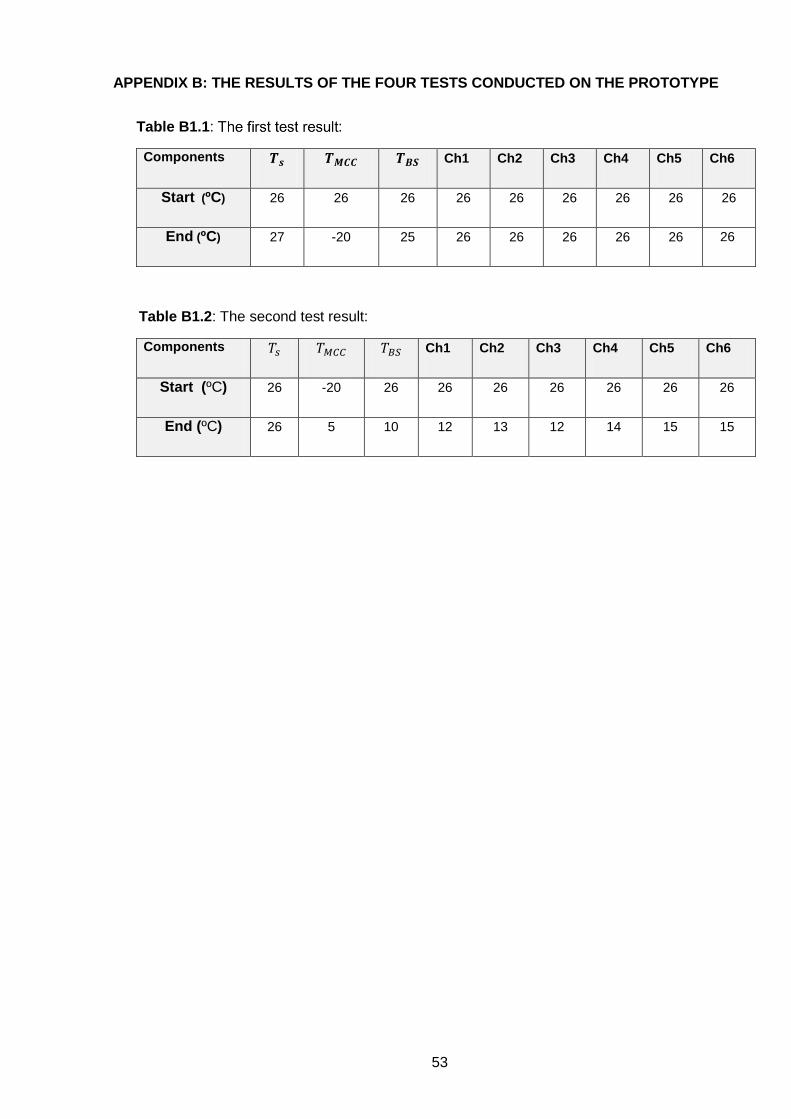
53
APPENDIX B: THE RESULTS OF THE FOUR TESTS CONDUCTED ON THE PROTOTYPE
Table B1.1: :
Components Ch1 Ch2 Ch3 Ch4 Ch5 Ch6
Start (ºC) 26 26 26 26 26 26 26 26 26
End (ºC) 27 -20 25 26 26 26 26 26 26
Table B1.2: The second test result:
Components Ch1 Ch2 Ch3 Ch4 Ch5 Ch6
Start (ºC) 26 -20 26 26 26 26 26 26 26
End (ºC) 26 5 10 12 13 12 14 15 15

54
Table B1.3: The third test result before loading the chambers.
Compone
nts
Ch1 Ch2 Ch3 Ch4 Ch5 Ch6
Start (ºC) 28 -20 27 27 27 27 27 27 27
1 28 -10 20 22 22 22 23 23 23
2 28 -4 16 16 16 16 16 16 16
3 28 2 13 14.5 14 15 14 16 16
4 28 4 14 14.5 14 15 14 16 16
5 28 2 13 13 14 13.5 14 16 15
6 28 2 12 12 12 12 14 15 15
7 28 2 10 10.5 10 11 13 13 15
8 28 2 10 10.5 10 11 13 13 15
9 28 0 9 10 9.5 10 11 13 15
10 28 -1 8 9 9 9 11 13 15
11 28 -3 7 8 8 9 11 13 15
12 28 -3 6.7 7.8 7 9 11 13 15
13 28 -3 7 7.2 7 9 11 13 15
14 27 -2.6 7 6.9 7 9 11 13 15
15 27.6 -3.2 5.4 6.1 7 9 11 13 15
16 27.1 -3.8 4.7 5 7 9 11 13 15
17 26.9 -4.6 4.2 5 7 9 11 13 15

55
Table B1.4: The test result after loading the chambers
Components Ch1 Ch2 Ch3 Ch4 Ch5 Ch6
Start (ºC) 28 -4.6 4.2 5 7 9 11 13 15
1 28 0 16 17 18 22 23 20
2 28 5 20 22 22 22.3 25 24.7 25.3
3 28 10 24 25.2 25 27 27 28 26.7
4 28 8 21.6 23.2 22 24 25 25.7 25
5 28 8 21 23 22 23 25 25 25
6 28 8 21 22 21.9 22.8 23 22.6 23
7 28 8 19.8 22 22 22.1 22.3 22.2 22.4
8 28 8 19 22 22 22 22 22 22
9 28 8 19 20 21 22 21.8 21.7 22
10 28 8 18.3 19.7 20 20.8 21.2 21.4 21.1
11 28 9 18 19 19.1 19 20.1 20.3 20.1
12 27.5 8.5 17 18 18.2 18 19.7 19.5 19.3
13 27.5 8 16.4 17. 17.4 17.3 19 19.1 19
14 27.3 7.7 15.6 16.2 16.2 16.2 18.8 18.3 18.3
15 27.3 7.5 14.9 15.8 15.9 15.8 18 18.1 18
16 27.2 6.8 13 15.1 15.3 15.1 17.2 17.3 17.6
17 27 6 12.3 14 14.4 14.4 16.3 16.3 16.1
18 27 5 12 14 13.8 13.9 15.3 15.3 15.1
19 27 4.6 12 13.2 13.4 13.4 15.1 15 15
20 27 3.7 11 12 12.3 13 14.7 14.7 15
21 27 3 11 12 12.1 12 13.3 13 15
22 26.5 2 10.6 11.5 11.6 11 11 13 15
23 26.2 1.8 10 10,9 11.1 11 11 13 15
24 26 0 8.2 9.1 9.3 9 11 13 15
25 25.8 -1.5 7.7 8.4 7.8 9 11 13 15
26 25.1 -2.1 7.1 7.5 7.1 9 11 13 15
27 24.9 -3 6.2 7 7 9 11 13 15
28 24.5 -5 4.3 5 7 9 11 13 15

56
APPENDIX C: THE AIR PROPERTIES TABLE
Table C1.1: Air properties
Temperature - t - (ºC)
Density - ρ -
(kg/m3)
Specific Heat - cp -
(kJ/(kg K))
Thermal Conductivity
- k - (W/(m K))
Kinematic Viscosity
- ν - x 10-6 (m2/s)
Expansion Coefficient
- b - x 10-3 (1/K)
Prandtl's Number
- Pr -
-150 2.793 1.026 0.0116 3.08 8.21 0.76
-100 1.980 1.009 0.0160 5.95 5.82 0.74
-50 1.534 1.005 0.0204 9.55 4.51 0.725
0 1.293 1.005 0.0243 13.30 3.67 0.715
20 1.205 1.005 0.0257 15.11 3.43 0.713
40 1.127 1.005 0.0271 16.97 3.20 0.711
60 1.067 1.009 0.0285 18.90 3.00 0.709
80 1.000 1.009 0.0299 20.94 2.83 0.708
100 0.946 1.009 0.0314 23.06 2.68 0.703
120 0.898 1.013 0.0328 25.23 2.55 0.70
140 0.854 1.013 0.0343 27.55 2.43 0.695
160 0.815 1.017 0.0358 29.85 2.32 0.69
180 0.779 1.022 0.0372 32.29 2.21 0.69
200 0.746 1.026 0.0386 34.63 2.11 0.685
250 0.675 1.034 0.0421 41.17 1.91 0.68
300 0.616 1.047 0.0454 47.85 1.75 0.68
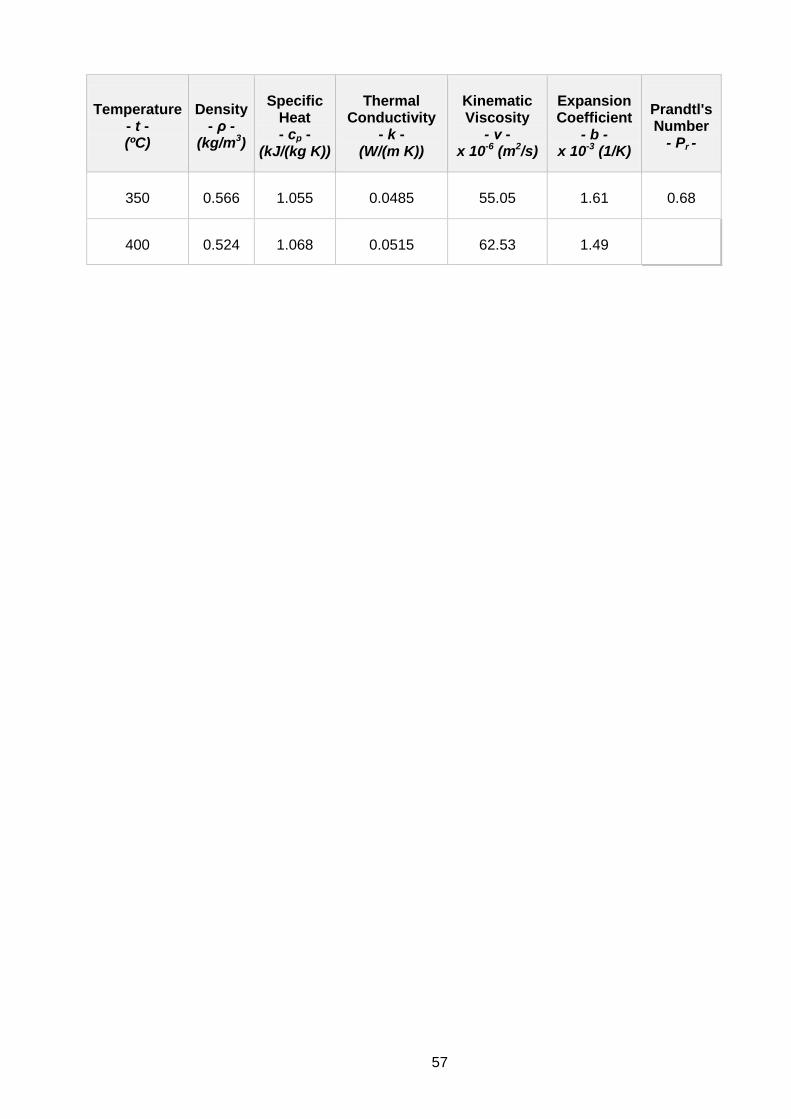
57
Temperature - t - (ºC)
Density - ρ -
(kg/m3)
Specific Heat - cp -
(kJ/(kg K))
Thermal Conductivity
- k - (W/(m K))
Kinematic Viscosity
- ν - x 10-6 (m2/s)
Expansion Coefficient
- b - x 10-3 (1/K)
Prandtl's Number
- Pr -
350 0.566 1.055 0.0485 55.05 1.61 0.68
400 0.524 1.068 0.0515 62.53 1.49

61
APPENDIX F: THE MATERIAL COST FOR CONSTRUCTION
No Item Quantity
Price Labour
Total
1 SCI Impulse P/B 10 mm Round 6 R25 - R150
2 Ambiant T/Stat -35/+35 DEG C RAMB 6 R75 - R450
3 Digital Thermometer white RT-LTD10 6 R45 - R270
4 Fan Motor 80×80×25 mm 6 R80 - R480
5 3/8×3/4 wall Insulation Gulf o FL RFINS -11838
6 R25 - R150
6 Special Gasket Screw-On Grey: 601152/017- Grey
6 R75 - R450
7 GALVF-White Sheet metal 0.50×2450×1225 mm
1 R250 R500 R750
8 PLYWOOD COMM EXT 9×2440×1220 mm 3 R386.40 R150 R1309.30
9 ALCOLIN Cold Glue, Wood Glue 1 R120 - R120
10 Spray fume cans 6 R120 - R720
11 50 mm in diameter plastic Tubes 10 m R10/m - R100
12 Other - - - R600
13 Chest deep freezer 1 R 1900 - R1900
total R7449.30