(XI) SANTOS, Maria Emília Madeira - No mar também há conchas
Upload
ndejjeuniversityCategory
view
1download
0
ORIGINAL ARTICLE
Patterns of genic diversity and structure in aspecies undergoing rapid chromosomal radiation:an allozyme analysis of house mice from theMadeira archipelago
J Britton-Davidian1, J Catalan1, J Lopez1, G Ganem1, AC Nunes2, MG Ramalhinho3, JC Auffray1,
JB Searle4 and ML Mathias2
1Institut des Sciences de l’Evolution (UM2, CNRS), Laboratoire Genetique et Environnement, CC65, Universite Montpellier II,Montpellier, France; 2Centro de Biologia Ambiental, Departamento de Biologia Animal, Faculdade de Ciencias, Universidade de Lisboa,Bloco C2, Campo Grande, Lisboa, Portugal; 3Centro de Biologia Ambiental, Departamento Zoologico e Anthropologico do MNHN,Universidade de Lisboa, Rua da Escola Politecnica, Lisboa, Portugal and 4Department of Biology, University of York, York, UK
The chromosomal radiation of the house mouse in the islandof Madeira most likely involved a human-mediated coloniza-tion event followed by within-island geographical isolationand recurrent episodes of genetic drift. The genetic signatureof such processes was assessed by an allozyme analysis ofthe chromosomal races from Madeira. No trace of adecrease in diversity was observed suggesting the possibilityof large founder or bottleneck sizes, multiple introductionsand/or a high post-colonization expansion rate. The Madeirapopulations were more closely related to those of Portugalthan to other continental regions, in agreement with thedocumented human colonization of the island. Such aPortuguese origin contrasts with a study indicating a northEuropean source of the mitochondrial haplotypes present inthe Madeira mice. This apparent discrepancy may be
resolved if not one but two colonization events took place,an initial north European introduction followed by a later onefrom Portugal. Asymmetrical reproduction between thesemice would have resulted in a maternal north Europeansignature with a nuclear Portuguese genome. The extensivechromosomal divergence of the races in Madeira is expectedto contribute to their genic divergence. However, there wasno significant correlation between chromosomal and allo-zyme distances. This low apparent chromosomal impact ongenic differentiation may be related to the short time sincethe onset of karyotypic divergence, as the strength of thechromosomal barrier will become significant only at laterstages.Heredity advance online publication, 4 July 2007;doi:10.1038/sj.hdy.6801021
Keywords: house mouse; Madeira; radiation; island; allozymes; Robertsonian fusions
Introduction
Oceanic islands have long attracted the attention ofbiologists in their endeavour to document the evolu-tionary processes involved in adaptive radiations. Arenewed interest has recently focused on Atlanticarchipelagos where several discrete groups of smallislands may harbour a large diversity of habitats. Such asituation provides an ideal framework for unravellingthe interaction between landscape features and micro-evolutionary processes leading to species diversification(Emerson and Kolm, 2005; Gavrilets and Vose, 2005).However, ascertaining the origin and evolution of islandspecies requires that the number of colonization eventsbe determined, the time of the radiation estimatedand the continental source of founder populations
identified. Recent improvements in phylogeneticreconstruction and meta-analyses have providedpowerful tools to tease apart the factors promotingadaptive radiations and endemism (Emerson, 2002;Manel et al., 2003). The proportion of endemic speciesin particular has been shown to be strongly related toisland size and topographical complexity due to theincreased opportunity for intra-island allopatric specia-tion (Emerson and Kolm, 2005). Recently, such ap-proaches have been successfully applied to variousplant and animal species diversifications in the Macar-onesian islands (Jordal and Hewitt, 2004; Salgueiro et al.,2004; Silvertown, 2004).
More recent within-species radiations can also bedetected. A case in point is the impressive chromosomalradiation discovered in the house mouse in Madeira(Britton-Davidian et al., 2000). This island is part of anAtlantic volcanic archipelago consisting of Madeira,Porto Santo and Desertas, all of which are Portuguesedependencies. They are relatively small and flat islandswith the exception of Madeira in which sharp changes inaltitude are present. The karyotypic analysis of micefrom the Madeiran archipelago uncovered the presence
Received 23 October 2006; revised 19 May 2007; accepted 29 May2007
Correspondence: Dr J Britton-Davidian, Institut des Sciences del’Evolution, UMR 5554, Laboratoire Genetique et Environnement,CC65, Universite Montpellier II, 34095 Montpellier Cedex 5, France.E-mail: [email protected]
Heredity (2007), 1–11& 2007 Nature Publishing Group All rights reserved 0018-067X/07 $30.00
www.nature.com/hdy
of six highly differentiated chromosomal races carryingdifferent combinations of Robertsonian (Rb) centricfusions between acrocentric chromosomes (Britton-Davidian et al., 2000). Although such rearrangementsare widespread in mouse populations from continentalEurope and North Africa (Pialek et al., 2005), 10 ofthe 20 Rb fusions discovered are unique to thisarchipelago. The chromosomal differentiation was ob-served in Madeira, whereas the other islands were foundto have mice carrying the standard 2n¼ 40 all acrocentrickaryotype (Mathias et al., 2004). A previous studypostulated that this radiation was related to the extremetopography of Madeira, which isolated mouse popula-tions, providing the necessary conditions for therecurrent fixation of Rb fusions through genetic drift(Britton-Davidian et al., 2000). Not only is the extent ofthe chromosomal radiation in Madeira house miceextraordinary, but also its rate. Historical documentsdate the first human occupation of Madeira at the endof the fifteenth century AD by Portuguese settlers,suggesting that mice could have been introduced atthat time (Britton-Davidian et al., 2000). Alternatively, ithas been suggested that Madeira was colonized in theninth century AD by Danish Vikings; this suggestionfollows from a similarity in mouse mitochondrial DNAsequence between individuals in northern Europe andthe Madeiran archipelago (Gunduz et al., 2001). What-ever the origin, such dates provide very high rates of Rbfusion fixation (9 in 500–1000 years; Britton-Davidianet al., 2005).
The stochastic factors that apparently promotedchromosomal race formation in Madeiran mice mightbe expected to leave a genetic signature (Frankham,1997), such as a within-race loss of diversity and a highbetween-race genic divergence. This study presents anallozyme analysis of house mouse populations fromMadeira and the second largest island in the archipelago,Porto Santo to (1) trace the effects of genetic drift byestimating genic diversity within populations, (2) deter-mine the effects of geographic isolation and chromoso-mal differentiation on the genic divergence betweenpopulations and races and (3) identify the origin of thefounder populations by comparing the island popula-tions to samples from Portugal and Denmark as well as alarge published geographical survey of other Europeanand North African house mice. These analyses provide apreliminary assessment of the evolutionary processesthat may be involved in the chromosomal radiation ofhouse mice in Madeira.
Materials and methods
Population samplesMice belonging to Mus musculus domesticus were cap-tured in commensal habitats (houses, gardens, farms andcultivated fields) using Sherman live traps baited withsardine paste. One hundred and fifty-eight mice from 37localities in Madeira (1998 and 1999 field trips) wereanalyzed together with 24 mice from seven localities inPorto Santo. The specimens from Madeira derived fromthe different chromosome races (see Table 1) and thechromosomal hybrid zone between the Santana race andstandard mice in Funchal, the main port of entry ontothe island (see Britton-Davidian et al., 2000, 2005). In
addition, nine mice were trapped in two localities fromcentral Portugal (Caixas 38140N 9120W and Santarem39123N 8168W). Most of these localities were pooledaccording to geographical and/or chromosomal proxi-mity into 22 population samples (17 in Madeira, 4 inPorto Santo and 1 in continental Portugal; see Figure 1).For comparative purposes, specimens of M. m. domesticuswere trapped along the eastern coast of southernDenmark in May 2000 (see details in Smadja et al.,2004). Several farmhouses were sampled aroundtwo main towns yielding 17 mice in Sommersted(Kastvra A, Ringtved, Sillerupgaard, Kastvra) and 21mice in Sonder Bjert (Skartved, Binderup, SoenderStenderup, Lauritzminde). The names of the island Rb
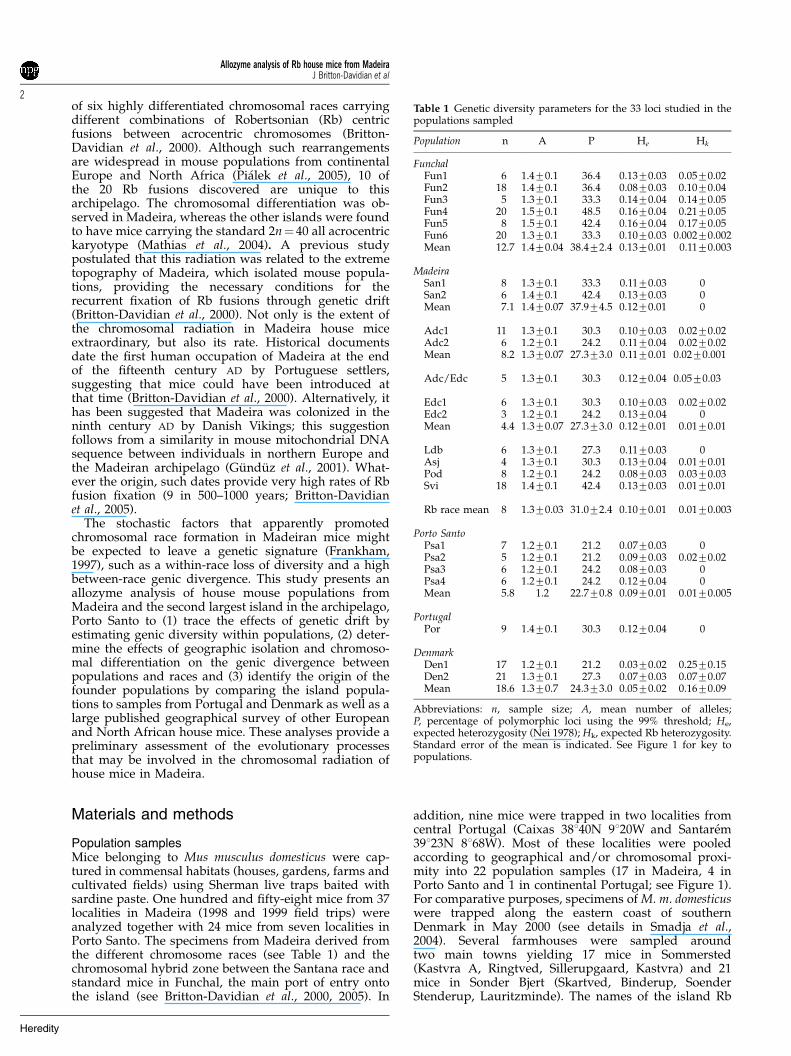
Table 1 Genetic diversity parameters for the 33 loci studied in thepopulations sampled
Population n A P He Hk
FunchalFun1 6 1.470.1 36.4 0.1370.03 0.0570.02Fun2 18 1.470.1 36.4 0.0870.03 0.1070.04Fun3 5 1.370.1 33.3 0.1470.04 0.1470.05Fun4 20 1.570.1 48.5 0.1670.04 0.2170.05Fun5 8 1.570.1 42.4 0.1670.04 0.1770.05Fun6 20 1.370.1 33.3 0.1070.03 0.00270.002Mean 12.7 1.470.04 38.472.4 0.1370.01 0.1170.003
MadeiraSan1 8 1.370.1 33.3 0.1170.03 0San2 6 1.470.1 42.4 0.1370.03 0Mean 7.1 1.470.07 37.974.5 0.1270.01 0
Adc1 11 1.370.1 30.3 0.1070.03 0.0270.02Adc2 6 1.270.1 24.2 0.1170.04 0.0270.02Mean 8.2 1.370.07 27.373.0 0.1170.01 0.0270.001
Adc/Edc 5 1.370.1 30.3 0.1270.04 0.0570.03
Edc1 6 1.370.1 30.3 0.1070.03 0.0270.02Edc2 3 1.270.1 24.2 0.1370.04 0Mean 4.4 1.370.07 27.373.0 0.1270.01 0.0170.01
Ldb 6 1.370.1 27.3 0.1170.03 0Asj 4 1.370.1 30.3 0.1370.04 0.0170.01Pod 8 1.270.1 24.2 0.0870.03 0.0370.03Svi 18 1.470.1 42.4 0.1370.03 0.0170.01
Rb race mean 8 1.370.03 31.072.4 0.1070.01 0.0170.003
Porto SantoPsa1 7 1.270.1 21.2 0.0770.03 0Psa2 5 1.270.1 21.2 0.0970.03 0.0270.02Psa3 6 1.270.1 24.2 0.0870.03 0Psa4 6 1.270.1 24.2 0.1270.04 0Mean 5.8 1.2 22.770.8 0.0970.01 0.0170.005
PortugalPor 9 1.470.1 30.3 0.1270.04 0
DenmarkDen1 17 1.270.1 21.2 0.0370.02 0.2570.15Den2 21 1.370.1 27.3 0.0770.03 0.0770.07Mean 18.6 1.370.7 24.373.0 0.0570.02 0.1670.09
Abbreviations: n, sample size; A, mean number of alleles;P, percentage of polymorphic loci using the 99% threshold; He,expected heterozygosity (Nei 1978); Hk, expected Rb heterozygosity.Standard error of the mean is indicated. See Figure 1 for key topopulations.
Allozyme analysis of Rb house mice from MadeiraJ Britton-Davidian et al
2
Heredity

races follow the nomenclature proposed by Pialek et al.(2005) except that the prefix P (for Portugal) was omittedfor brevity.
The karyotypes of the mice from Madeira, PortoSanto, mainland Portugal and Denmark have all beenpreviously described (Gazave et al., 2003; Mathias et al.,2004; Smadja et al., 2004; Britton-Davidian et al., 2000,2005; Nunes et al., 2005).
Allozyme analysisThe allozyme analysis was performed on 229 mice. Atotal of 33 loci were scored from liver, kidney, heart,plasma and hemolysate samples by starch gel electro-
phoresis (see Britton-Davidian, 1990 for references onmethods): alcohol dehydrogenase ADH (1.1.1.1, Adh-1),albumin ALB (Alb-1), amylase AMY (3.2.1.1, Amy-1),carbonic anhydrase CAR (4.2.1.1, Car-2), creatine kinaseCK (2.7.3.2, Ck-1), esterases ES (3.1.1.1, Es-1, Es-2, Es-3,Es-10, Es-15), guanine deaminase GDA (3.5.4.3, Gda-1),a-glycerophosphate dehydrogenase aGPD (1.1.1.8, Gdc-1),glyoxalase GLO (4.4.1.5, Glo-1), amino-aspartate transa-minases GOT (2.6.1.1, Got-1, Got-2), glycerophosphateisomerase GPI (5.3.1.9, Gpi-1), hydroxyacid oxidase HAO(1.1.3.15, Hao-1), haemoglobin HBB (Hbb), isocitratedehydrogenase IDH (1.1.1.42, Idh-1, Idh-2), lactatedehydrogenase LDH (1.1.1.27, Ldh-1, Ldh-2), NADP-dependent malate dehydrogenases MOD (1.1.1.40, Mod-
Figure 1 Maps of Madeira and Porto Santo. Numbers refer to the sampled localities and the dashed line indicates those pooled perpopulation and per race. San¼ Santana, Asj¼Arco di San Jorge, Pod¼Ponta Delgada, Svi¼ Sao Vicente, Edc¼Estreito de Calheta,Adc¼Achadas da Cruz, Adc/Edc¼hybrid population between the Adc and Edc races, Ldb¼Lugar di Baixo, Psa¼Porto Santo,Fun¼hybrid zone of Funchal. The insert shows the distribution of localities in Funchal. Distribution of Rb fusions among the races: San(including Asj)¼ 2.19, 3.8, 4.16, 5.14, 6.7, 9.10, 11.12, 13.17, 15.18; Pod¼ 3.8, 4.5, 9.18, 10.16, 11.12, 14.17; Svi¼ 2.4, 3.8, 5.18, 6.7, 9.12, 10.16, 11.19,13.17; Edc¼ 2.4, 3.14, 5.18, 6.7, 8.11, 9.12, 10.16, 13.17; Adc¼ 2.4, 3.14, 5.18, 7.15, 8.11, 9.12, 10.16, 13.17; Ldb¼ 2.4, 3.14, 6.7, 8.11, 9.12, 10.16,13.17, 15.18.
Allozyme analysis of Rb house mice from MadeiraJ Britton-Davidian et al
3
Heredity

1, Mod-2), NAD-dependent malate dehydrogenase MOR(1.1.1.37, Mor-1, Mor-2), mannose phosphate isomeraseMPI (5.3.1.8, Mpi-1), nucleoside phosphorylase NP(2.4.2.1, Np-1), phosphoglucomutase PGM (5.4.2.2,Pgm-1, Pgm-2), pyruvate kinase PK (2.7.1.40, Pk-1, Pk-3)and superoxide dismutase SOD (1.15.1.1, Sod-1). Theidentity and nomenclature of alleles were assessed bycomparison with the migration profiles of the allelespresent in two laboratory strains of mice (C57Bl/6J andBalb/c; see Britton-Davidian et al. (1989) for details of theprocedure).
Statistical analysesAllele frequencies were estimated as well as the follow-ing measures of intrapopulation variation: mean numberof alleles (A), percentage of polymorphic loci per sample(P%) and mean expected heterozygosity (He) calculatedfor small samples using the BIOSYS-1 program (Swof-ford and Selander, 1981). All other population para-meters were computed and tested as implemented inGENEPOP v3.2a (Raymond and Rousset, 1995) unlessotherwise indicated. In all cases, the default options wereused. Exact tests with their associated P-values wereperformed in each population to test for departure fromHardy–Weinberg expectations and for pairwise linkagedisequilibrium between loci. Genic differentiation be-tween pairs of populations was estimated by Fisher’sexact test. In addition, pairwise FST values using theestimator y were calculated, and their level of signifi-cance evaluated by permutation tests (1000) usingGENETIX v4.03 (Belkhir et al., 1996–2004). Relationshipsbetween populations were investigated by constructing amaximum likelihood (ML) tree from the gene frequencydata, and a distance tree using the neighbour-joiningmethod (NJ). The genetic distance used was the FST-based Reynolds’ index available in GENETIX v4.03.Both trees were built with the PHYLIP v3.5c package(Felsenstein, 1985). Branch support was established by500 bootstrap resamplings among loci. The graphicaldisplay of the tree topologies was drawn with theTreeView v1.6.6 software distributed by Page (1996).The same procedures were applied to the chromosomaldata by considering each Rb fusion as a locus, with theacrocentric and metacentric states treated as alternativealleles. In this case, two additional tests were performed:linkage disequilibrium between Rb fusions and allozymeloci and a test of the correlation between geneticdistances (Nei, 1978) for Rb fusions vs those forallozymes using the Mantel procedure as implementedin GENETIX v4.03 (1000 permutations). P-values for themultiple tests were subjected to sequential Bonferronicorrection.
To investigate the genetic relationship of the islandpopulations to Portugal and Denmark, a Bayesiananalysis of population structure was performed asimplemented in BAPSv.4.14 (option: Trained MixtureAnalysis using these two European samples as thereference file; Corander et al., 2006). To compare genicdiversity and relatedness of the populations from theMadeira archipelago over a larger European sample,allozyme data from an additional 27 European andNorth African house mouse populations (Britton-Davi-dian et al., 1989; Britton-Davidian, 1990) were included inthe analyses. He estimates, genetic distances and phe-
netic trees were assessed over the 31 loci common to allsamples (Haox and Gda were omitted). Differences in He
between geographical groupings of populations weretested by the non-parametric Kruskal–Wallis test. Popu-lation genetic structure was investigated by analysesof molecular variance (AMOVA, SAMOVA), whichestimate the proportion of genic variation at differenthierarchical levels using information from the geographi-cal distribution of allozyme frequencies and the pairwisedistance between them. Two approaches were performed.The first one involved an AMOVA (Excoffier et al., 1992) ofuser-established hierarchical geographical arrangementsof populations following the clusters present in the NJtree. The procedure consisted of a step-by-step increase inthe size of the geographical groups to uncover those withthe maximum among-group divergence. The secondseries of tests was implemented with the variant spatialanalysis of molecular variance (SAMOVA) approach(Dupanloup et al., 2002) which detects the groups ofpopulations that are maximally differentiated from eachother. As in the AMOVA procedure, the proportion oftotal genic variation due to differences between groups ofpopulations is maximized within a sequentially decreas-ing number of groups.
Results
Chromosomal diversityDetails of the chromosomal composition of mice from theislands of Madeira and Porto Santo are published inBritton-Davidian et al. (2005) and Nunes et al. (2005), ofthe Portuguese sample in Mathias et al. (2004) and of theDanish populations in Smadja et al. (2004). In summary,six chromosomal races harbouring a different combina-tion of 20 Rb fusions are present on Madeira (Figure 1;Asj is considered as belonging to the Santana Rb race, seebelow). No hybrid karyotypes between Rb races wereobserved except in one locality where two mice weretrapped each carrying Rb fusions that discriminate thewesternmost races (Achadas da Cruz race/Estreito daCalheta race (Adc/Edc)). Within-race polymorphisminvolving Rb fusions and their homologous acrocentricswas found in four of the six races as well as in the hybridzone localities in Funchal. The mice from mainlandPortugal and Porto Santo had the 2n¼ 40 standardkaryotype with the exception of two individuals in thelatter island, each heterozygous for a different Rb fusionalso present in Madeira. The house mice from Denmarkshowed a diploid number varying from 2n¼ 34 to 37 dueto the presence of three Rb fusions: Rb(3.8), Rb(2.5)and Rb(6.9). The latter two were segregating in Den1whereas only Rb(2.5) was polymorphic in Den2. Thelevels of chromosomal heterozygosity (Hk) in thesepopulations are reported in Table 1. All Hk values werelow, except for most of the samples in the hybrid zone ofFunchal (maximum of 0.21 in Fun4) and Den1 (0.25).Heterozygosity for multiple Rb fusions (2–8) followedthe same trend, as it was almost exclusively limited tosamples from Funchal, particularly Fun4 in which oneindividual was heterozygous for 8 Rb fusions. Nosignificant departures from Hardy–Weinberg expecta-tions or linkage disequilibrium between Rb fusions wereobserved.
Allozyme analysis of Rb house mice from MadeiraJ Britton-Davidian et al
4
Heredity

Genic diversityThe allozyme analysis of house mice from Madeira,Porto Santo, Portugal and Denmark showed that eight ofthe 33 loci scored were monomorphic for the same allelein all populations (Appendix A). The remaining 25 lociwere polymorphic in at least one population. Significantdeviations from Hardy–Weinberg expectations weredetected in only three localities: Fun2 (1 locus; Po0.01),Fun4 (2 loci; Po0.05) and Adc1 (1 locus; Po0.01). In allthree cases, deviations were due to a deficit of hetero-zygotes involving three loci (Car, Es-15, Gda). Linkagedisequilibrium between pairs of loci was tested within allpopulations. Differences were found between one toseven pairs of loci in seven of the 22 populations.However, given the large number of tests involved, weapplied the Bonferonni correction and none remainedstatistically significant.
Measures of genic diversity are provided in Table 1.Estimates of expected heterozygosity varied betweenlocalities; however, the highest values were present inMadeira where they ranged from 0.16 in the hybridzone (Funchal) to 0.08 in Pod. The lowest values wererecorded in the Danish samples (mean He¼ 0.05). Theseestimates were compared to previously published valuesfor 27 populations from Europe and North Africa(Britton-Davidian et al., 1989; Britton-Davidian, 1990),
recalculated over the 31 loci common to both studies. Toaccount for variation between northern and southernEuropean populations and between Madeira and PortoSanto, He values were subdivided into four geographicgroups. Mean values between these regions showed thatHe was highest in the Rb races from Madeira (even whenFunchal was excluded) and southern European popula-tions compared to Porto Santo and northern Europeanpopulations (Table 2). These differences were marginallysignificant (Kruskal–Wallis test; P¼ 0.048). Post hoc testsbetween regions indicated that the differences weresignificant only between the Madeiran races and thenorth European populations. Twelve unique alleles wereobserved in the populations studied (see Appendix A).None were present in Porto Santo and only three in theMadeiran Rb races, two in Svi and one in Ldb. Elsewhereunique alleles were evenly distributed between thePortuguese (3), Danish (3) and Funchal (3) samples.
Genic differentiation within the Madeiran archipelagoPopulation differentiation was investigated within andbetween races and between islands in the Madeiranarchipelago. The exact tests of genic differentiationinvolving the Rb races detected no significant divergencebetween samples within races except for the Santana race(San1 vs San2: Table 3). Also the Achadas da Cruz race(Adc) and the Estreito da Calheta race (Edc) sampleswere not significantly differentiated from the hybridinterracial sample (Adc/Edc; P40.16). Pialek et al. (2005)recognized Asj (Arco di San Jorge) as a seventh racedistinct from the Santana race, since it lacked one of theRb fusions present in the latter. However, as several micecarrying this fusion were subsequently trapped in the Asjlocalities, this distinction is no longer warranted (Britton-Davidian et al., 2005). The relatedness between mice fromAsj and San is now further supported by the absence of asignificant genic differentiation between these samples(P40.60). In Porto Santo, the four localities sampledwere slightly differentiated (Po0.05). Pairwise testswithin the hybrid zone in Funchal yielded varyingresults with Fun1 showing the lowest level of differ-entiation (P40.19) from all the other samples exceptFun6, which was highly divergent (Po0.001). The levelof differentiation between races in Madeira was recalcu-lated after pooling samples within races, as well as inPorto Santo and Denmark (Table 3). Results indicatedthat most Rb Madeiran races were genically differen-
Table 2 Mean He values and standard error for different geo-graphical groups of populations
Region n He
Madeira 10 0.11270.005Porto Santo 4 0.08870.012
ContinentAll 30 0.09370.005North 8 0.07670.012South 22 0.09970.005Rb 9 0.08570.011
See Figure 1 for key to island populations and Figure 2 for details ofcontinental samples.Southern continental populations are from Greece, Israel, Italy,Spain, France (except for Fr4), Portugal, Algeria and Tunisia;northern continental populations are from Germany, Denmark,Netherlands, Scotland and Fr4 from France. Continental Rbpopulations are from Italy, Denmark, Germany and Spain.
Table 3 Genic differentiation
Population Fun San Pod Svi Adc Edc Ldb Psa Por Den
Fun 0.168* 0.089 0.273 0.172 0.097 0.182 0.160 0.375 0.182 0.305San *** 0.163* 0.210 0.055 0.075 0.163 0.099 0.401 0.175 0.304Pod *** *** — 0.146 0.295 0.346 0.363 0.476 0.292 0.187Svi *** NS ** — 0.109 0.131 0.161 0.386 0.168 0.264Adc ** ** *** *** 0.017ns 0.025 0.120 0.367 0.087 0.331Edc *** ** *** ** NS 0.027ns 0.157 0.279 0.090 0.392Ldb ** NS *** NS * * — 0.408 0.270 0.345Psa *** *** *** *** *** *** *** 0.063* 0.291 0.487Por *** *** *** *** *** * *** *** — 0.351Den *** *** *** *** *** *** *** *** *** 0.179***
Abbreviation: NS, nonsignificant.Interpopulation FST values are provided above the diagonal and intragroup ones in italics along the diagonal.Significant values (Po0.05) are presented in bold. Along and below, the diagonal level of significance of the P-value of the exact test ofpopulation differentiation is indicated. ***0.001, **0.01, *0.05. See Figure 1 for key to populations.
Allozyme analysis of Rb house mice from MadeiraJ Britton-Davidian et al
5
Heredity

tiated from each other, with the exception of San vs Sviand Ldb, Ldb vs Svi and Adc vs Edc. Levels ofdifferentiation were then tested between the MadeiranRb races, Funchal and the Porto Santo mice, as well asbetween these and the mainland populations (Portugaland Denmark) and were found to be highly significant inall cases (0.001oPo0.01).
To investigate the contribution of chromosomal diver-gence to genic differentiation, a correlation betweengenic and chromosomal distance using Nei’s geneticdistances was performed for the Madeira Rb races andfound to be marginally non-significant (Mantel testz¼ 0.7570.01, P¼ 0.08). In fact, the most chromosomallydivergent races (San and Adc) were not among the mostgenically differentiated (Po0.01).
Island–mainland genic divergenceInterpopulation divergence estimated by the FST indexshowed three levels of differentiation (Table 3). First, FST
values were the lowest among the Madeira Rb racesranging from 0.025 to 0.363 (P40.05 in 6 cases out of 15),with Pod showing the highest overall levels (0.146–0.363;all Po0.05). Second, the Madeira Rb races were lessdifferentiated from the Portuguese population (0.087–0.292; 0.054P40.05), than they were from the PortoSanto (0.279–0.476; all Po0.05) or Danish populations(0.187–0.392; all Po0.05). Third, the divergence betweenthe latter two yielded the highest value observed (0.487;Po0.05). The hybrid samples of Funchal diverged lessfrom the various Madeiran Rb races and the Portugalpopulation, than from the mice of Porto Santo andDenmark. To further evaluate the significance of thesegenic affinities, an analysis of population structure usinga Bayesian approach (BAPS) was performed over allsamples except the hybrid population from Funchal. Theanalysis provided an optimal partition of the data intothree clusters using the Portugal and Denmark samplesas the reference populations (log (marginal like-lihood)¼�1265.3143). These groups are shown inTable 4, which includes the log(ml) values associatedwith changes in cluster assignment of samples. Theisland populations were distributed into the followingthree clusters: (1) one including all the Madeira racesexcept Pod (Mad5; Table 4), which formed a separategroup, although the low log(ml) value of �1.1 indicatedthat Pod could also be reasonably allocated to theMadeira Rb group (see BAPSv4.14) and (2) one showingthe divergent position of the Porto Santo populationswhich were always separate from the Madeira ones. Inaddition, the data showed that a reassignment of the Rbpopulations to the Portuguese group yielded a less worsepartition than when included in the Denmark cluster,except again for Pod which had low and similar values ineach case.
The distinctiveness of the Porto Santo mice promptedus to determine the origin and genetic relatedness of thepopulations studied over a larger geographical sample ofhouse mice. Reynold’s distances between these and anadditional 27 populations were computed and used toconstruct an ML tree (Figure 2). The topology high-lighted several features. First, the Madeira Rb racesclustered together as well as with Portugal. All of thesein turn were included in a larger group with thepopulations from Israel, Egypt and Denmark and one
Figure 2 Maximum likelihood tree showing the phylogeneticrelatedness of the island and European samples based on the 31loci common to this and previous studies (Britton-Davidian et al.,1989; Britton-Davidian, 1990). Boostrap values above 50% areindicated in italics. Circled numbers refer to the groups tested inthe AMOVA analysis (see text). Key to populations (includingsample sizes in the case of the 27 new populations): Algeria(Al1¼Bouzadjar 12, Al2¼Oran 8), Egypt (Eg1¼GZA 18, Eg2¼CRO 20), France (Fr1¼ENSAM 7, Fr2¼Pratx 24, Fr3¼Pages 6,Fr4¼Haute Savoie 9, Fr5¼Toulouse 10, Fr6¼Dordogne 24),Germany (Ge1¼Ravensburg 10, Ge2¼Tubingen2 12, Ge3¼Tubin-gen3 9), Great Britain (Gb1¼CTC 26), Greece (Gr1¼Prosotsani 27,Gr2¼Orestias 9, Gr3¼Marasia 15, Gr4¼Doirani 15), Israel(Is1¼Geshum 5, Is2¼Elrom 10), Italy (It1¼ Santa Caterina 27,It2¼Ovada 22, It3¼Bergamo 30), the Netherlands(Ne1¼Amsterdam 9), Spain (Sp1¼RPT, AVY, VDX 10, Sp2¼LRA,MOY 13), Tunisia (Tu1¼ Sfax 10). Bold: Denmark (Den1¼ Sommer-sted, Den2¼ Sonder Bjert), Madeira (San¼ Santana, Pod¼Ponta Delgada, Svi¼ Sao Vicente, Edc¼Estreito de Calheta,Adc¼Achadas da Cruz, Ldb¼Lugar di Baixo), Porto Santo(Psa1 Psa2, Psa3/4) and Portugal (Por¼Caixas). For furtherdetails of the European and Mediterranean samples, see Britton-Davidian et al. (1989) and Britton-Davidian (1990). log-like-lihood¼ 2754.07.
Table 4 Results of the Bayesian analysis of population structureusing the Trained Mixture Analysis in BAPSv4.14
Islandpopulation
Reference 1 2 3
Portugal Denmark Mad5 Pod Porto Santo
San �31.3 �98.8 0 �22.0 �115.6Pod �9.2 �8.8 �1.1 0 �70.2Svi �22.7 �89.0 0 �2.6 �111.6Adc �25.4 �106.9 0 �36.8 �105.3Edc �7.9 �74.7 0 �25.7 �40.6Ldb �24.2 �48.4 0 �21.8 �59.0Psa �30.6 �157.4 �163.2 �70.2 0
The composition of the three island clusters is indicated as wellas the log(ml) values associated with the inclusion of a samplein a group; the lower the absolute value, the better the assignment.The Portugal and Denmark samples were used as referencepopulations to which the island populations were compared.Mad5 consists of San, Svi, Adc, Edc and Ldb. See Figure 1 for keyto populations.
Allozyme analysis of Rb house mice from MadeiraJ Britton-Davidian et al
6
Heredity

from Tunisia (Tu1). Second, the mice from Porto Santoclustered with the samples from Scotland (Gb1) andFrance (Fr6) in a composite group including mostlywestern Mediterranean samples. Third, house miceshowed a very low overall macrogeographical geneticstructure except at a regional local scale. This weakstructure is confirmed by the very low bootstrap values(only three were above 50%) providing little support forthe different nodes. The NJ tree topology (not shown)roughly matched what was observed with the ML tree,the only notable difference concerning the position of theMadeiran Pod race, which clustered with the popula-tions from Denmark.
To test the significance of the genetic units uncoveredby the tree, the partitioning of variation between andwithin the five groups was assessed by the AMOVAtest (see node indication in Figure 2). Results of theanalysis did not provide statistical support for theseunits since the among-group differentiation was lowerthan that within groups (FCT¼ 0.205 and FSC¼ 0.267,respectively). The SAMOVA method that maximizesFCT by constraining the number of groups but not theircomposition was then performed. The program wasinstructed to identify from 10 to 3 partitions of the data(see Table 5 for group compositions). Several geo-graphic clusters were stable throughout the analyses:Portugal with the Madeiran samples, Scotland withDordogne (Fr6) and one to all populations from PortoSanto, a western Mediterranean group (Italy, Spain withall but one of the French populations), an easternMediterranean group (Israel with Egypt) and finally aGerman group. Thus, this analysis provided statisticalsupport for several of the branching arrangementsuncovered in the ML tree. In all analyses using lessthan seven partitions, among-group differentiationfell below that of within groups. Additional tests wererun by removing the North African (Al2, Tu1) and Ne1
(Amsterdam) outlier samples, the group assignment ofwhich fluctuated considerably between tests. The low-est number of significantly differentiated groups de-creased to four yielding approximately the same geneticclusters as in the previous seven-group test except forthe Danish populations which were now includedtogether with the eastern Mediterranean ones in theMadeira/Portugal group (FSC¼ 0.236 and FCT¼ 0.249;Table 5). In no instance did the Madeira Rb racescluster with the Danish samples alone, nor with anyother European/Mediterranean population. The ana-lyses of genetic variance thus provided added supportfor a different geographic make-up of the mice fromPorto Santo and Madeira, as well as the Portugueseaffinity of the latter.
Discussion
Genic diversity and colonization historyPopulation genetic models predict that accidental colo-nization of islands often involves a small number ofindividuals leading to a loss of genic variation and aninstantaneous increase in genic divergence from ances-tral populations (Frankham, 1997; Berry and Scriven,2005). Two other specific features may be expected toenhance these effects in Madeira house mice: the smallsize of the island with its highly dissected topography,and the subdivision of the mouse population intochromosome races. However, the results we obtainedwere quite the contrary. The allozyme analysis showsthat the Rb races exhibit no decrease in genic diversitycompared to European populations; indeed they are infact among the highest levels recorded in the housemouse (Britton-Davidian et al., 1989; Britton-Davidian,1990). A further indication lies in the lack of a reductionin the mean number of alleles which is more sensitive
Table 5 Results of the SAMOVA tests for several hierarchical group-partitioning schemes
No. of groups Composition FSC FCT
10 a Por, San, Pod, Svi, Adc, Edc, Ldb 0.155 0.301b Sc1, Fr6, Psa1c Sp1, Sp2, Fr1, Fr2, Fr3, Fr4, Fr5, It1, It2, It3, Gr4d Eg1, Eg2, Is1, Is2e Ge1, Ge2, Ge3f Den1, Den2, Ne1g Gr1, Gr2, Gr3h Al2, Psa2, Psa3/4i Tu1j Al1
7 a Por, San, Pod, Svi, Adc, Edc, Ldb, Tu1 0.216 0.263b Sc1, Fr6, Psa1, Psa2, Psa3/4c Sp1, Sp2, Fr1, Fr2, Fr3, Fr4, Fr5, It1, It2, It3, Gr1, Gr2, Gr3, Gr4, Al2, Ne1d Eg1, Eg2, Is1, Is2e Ge1, Ge2, Ge3f Den1, Den2g Al1
4 a Por, San, Pod, Svi, Adc, Edc, Ldb, Den1, Den2, Gr1, Eg1, Eg2, Is1, Is2 0.236 0.249b Sc1, Fr6, Psa1, Psa2, Psa3/4c Sp1, Sp2, Fr1, Fr2, Fr3, Fr4, Fr5, It1, It2, It3, Gr2, Gr3, Gr4d Ge1, Ge2, Ge3
The composition of the groups (letters a to j) is indicated as well as the levels of within-group (FSC) and between-group (FCT) differentiationvalues. See Figures 1, 2 for key to populations. The populations are those from Madeira, Porto Santo, Portugal and Denmark to which wereadded 27 (in the 7- and 10-group schemes) or 23 (in the 4-group scheme) European and Mediterranean samples analyzed at 31 loci. AllF-values were highly significant (Po10�5).
Allozyme analysis of Rb house mice from MadeiraJ Britton-Davidian et al
7
Heredity

than He to bottlenecks (Frankham, 1997). On theother hand, very few unique alleles are present inthese races. Theoretical models predict that recovery ingenic heterozygosity following a bottleneck is caused bynew mutations which slowly increase in frequency bygenetic drift (Nei, 2005). If unique alleles are indicative ofthe occurrence of novel mutations, their low number inthe Madeiran Rb races compared to the mainlandpopulations may reflect the short time since thecolonization event which can be roughly estimated at2000 generations for a colonization from Portugal (500years and four generations/year; see Nachman andSearle, 1995) and 4000 generations for the earliersuggested colonization from northern Europe. Conver-sely, a slight reduction in all diversity parameters isfound in the mice of Porto Santo in which nochromosomal differentiation has taken place. A reducedlevel of variability is also present in the mice fromDenmark, and is in agreement with a gradual loss ofdiversity due to founder events during the South toNorth expansion of the house mouse in Europe (Britton-Davidian, 1990; Nachman et al., 1994).
Several non-mutually exclusive reasons may explainthe pattern found in the Madeira mice: (1) a large andgeographically varied introduction source, (2) a highpost-colonization expansion rate (Zenger et al., 2003) and(3) sufficiently large founding populations to preventpost-introduction losses in diversity. Previous data fromhouse mouse populations indicate that diversity levels inisland populations are sometimes higher than in themainland (Navajas y Navarro and Britton-Davidian,1989). This finding can be attributed to the extraordinarylevel of passive dispersal of house mice as a commensalof humans. Such a trait will facilitate multiple introduc-tions onto islands from different sources, therebyincreasing local variation (for example, Mediterraneanisland populations; Navajas y Navarro and Britton-Davidian, 1989). The large distance of the Madeiraarchipelago to a continental source supports a human-mediated introduction of the house mice. Historicaldocuments date the arrival of Portuguese settlers in the1490 s pinpointing Portugal as a likely origin of themouse colonists. This scenario is in agreement with theallozyme data since the mice from Madeira and Portugalshow the highest levels of genic similarity. In addition, aPortuguese origin fits well with the observed level ofdiversity owing to the documented mode of coloniza-tion. After the discovery of Madeira, the island wasrapidly settled to develop commercially lucrative cropssuch as sugar cane. Two main centres were established(Machico and Funchal; Albuquerque and Vieira, 1988)from which the colonization spread rapidly north, butmostly along the southern coast (Nunes et al., 2005).Thus, the colonization of Madeira was characterized by alarge number of settlers and the rapid expansion of farmcommunities along the southern and eastern coastalareas. These features suggest that the initial mousecolonists were most likely not reduced in number, andthat the developing human agricultural activities wouldhave favoured their rapid post-founding expansion anddispersal. Such a colonization pattern not only wouldhave considerably limited any loss in genetic variability(Zenger et al., 2003; Nei, 2005), but may even havecontributed to its enhancement since the human im-migrants originated from several regions in Portugal
(Albuquerque and Vieira, 1988). Similarly, the lowergenic diversity measured in the Porto Santo micecompared to those in Madeira is in agreement withrecords of a less intensive settlement both in populationnumber and through time, suggesting fewer migrationevents and subsequent expansion. In Madeira, however,one would expect the initial genic diversity to have beensubsequently eroded during the chromosomal radiationthat took place in this island. Indeed, the extensive andrapid karyotypic divergence argues in favour of thesuccessive fixation of Rb fusions through recurrentbottlenecks. Once again, the results show no traces of areduction in genic diversity within the races related toprocesses of chromosomal differentiation. A previousstudy of mainland European Rb races investigated thevalues of bottleneck sizes, mutation rates and selectivedisadvantage coefficients compatible with a genic andchromosomal architecture similar to that found in theMadeira mice (Britton-Davidian et al., 1989). The com-putations yielded a realistic range of values sufficient toensure a fixation rate in large-sized bottlenecks (435founding individuals) comparable to that observed.However, fixation rates in Madeira are higher thanprevious estimates by a factor of 10 (4.5� 10�3 pergeneration vs 4� 10�4 per generation), leading to thesuggestion that additional genomic factors may beinvolved in the Rb process in this island. Two possibi-lities have been proposed, one of which consisted inelevated mutation rates such as those observed inlaboratory strains (10�4 per generation), particularlythose that have already fixed one Rb fusion (10�2 to10�3 per generation; see Britton-Davidian et al., 2005).The other resides in a selective transmission advantageof Rb fusions in heterozygous females; such distortionshave been documented in humans, but have yet to bedemonstrated in house mice with a predominantly Rbkaryotype (Pardo-Manuel de Villena and Sapienza,2001).
A Portuguese origin of mice from Madeira contrastswith two main results of a previous mtDNA analysis. Ineffect, the study by Gunduz et al. (2001) clearly shows thepresence in the Madeira mice of mtDNA haplotypes,which are characteristic of northwestern continentalEurope. Similarly, the haplotypes present in the micefrom Porto Santo are unique to this island and veryclosely related to the most frequent one in Madeira,pointing to a single and similar northern origin of themice from these two islands. These results led theauthors to postulate an earlier introduction by DanishViking seafarers involving an accidental shipwreck onMadeira, as no trace of a prolonged presence is recorded.The allozyme data on the other hand favour a Portu-guese origin for the Madeira mice and a separate one forthe Porto Santo ones that are tentatively ascribed toScotland. Thus, the analysis of allozyme and mtDNAmarkers indicate not only that the nuclear and mitochon-drial genomes of the island mice have differentfounder origins, but that the geographic source popula-tions of the nuclear component is not the same inMadeira (Portugal) and Porto Santo (Scotland).One possible explanation is compatible with an initialViking introduction of mice as suggested by Gunduzet al. (2001), followed by a second one from Portugaland Scotland. Subsequent asymmetrical reproductionbetween these distinct sets of mice would have resulted
Allozyme analysis of Rb house mice from MadeiraJ Britton-Davidian et al
8
Heredity

in a maternal Viking signature with a nuclear Portu-guese/Scottish genome. A trace of such a mixedbackground may explain the position of the Pod race,which clusters with the populations from Denmark insome of the analyses. Such asymmetric introgression isknown to occur in several species and is related todifferences in sex dispersal and/or social characteristics(Jones et al., 1995; Waits et al., 2000; Shaw, 2002). Thefact that in both islands the original mitochondrialgenome prevailed over those of the subsequent invaderssuggests that selective processes may also be involvedsuch as sexual or natural selection (Ryan and Wagner,1987; Melo-Ferreira et al., 2005). The analysis ofadditional mitochondrial and nuclear markers on alarger sample of mice from different European localitieswould help clarify the historical and biological processesleading to the composite genome of the Madeirahouse mice.
Genic signature of chromosomal divergenceThe role of chromosomal divergence in generatingreproductive isolation can be measured by estimatinglevels of genic differentiation. In Madeira, however, it isdifficult to tease apart the contribution of the chromoso-mal vs geographic barriers in limiting gene flow betweenraces, as they are often coincident. This is the situationbetween the eastern races (San, Pod, Svi) and betweenthese and the western ones (Edc, Adc, Ldb), which arethe most chromosomally and genically differentiated andare isolated by geographic barriers. Several indicationssuggest in fact that geographic isolation may have been adeterminant factor in shaping the differentiation in genicarchitecture. This is supported by the absence of acorrelation between chromosomal and allozyme dis-tances, although the karyotypic index used does notreflect precise chromosomal differences important indetermining levels of underdominance and thus thestrength of the barrier to gene flow. A case in point is Podin which four of the six Rb fusions are unique to this raceand which is also the most genically divergent of theMadeira races. Both of these characteristics suggest thatthe ancestral population was likely geographicallyisolated in this valley early in the divergence process,allowing this race to acquire a genic and chromosomaldistinctiveness. The genic differences between the threewestern races also support the role of geographicbarriers. These three parapatric races carry one Rb fusioneach differing by a one-arm homology from the others:Rb(6.7) in Edc vs Rb(7.15) in Adc and Rb(5.18) in thelatter vs Rb(15.18) in Ldb (see Figure 1); thus the samelevel of underdominance can be assumed in hybridsbetween them. The Edc and Adc races interact along acontact zone within which two chromosomal hybridswere subsequently recorded. These races are not geni-cally differentiated, suggesting that the chromosomaldifferences are insufficient to impede gene flow. Theseresults contrast with the significant genic differentiationbetween Edc and Ldb, which are separated by a shortdistance (Nunes et al., 2005). Thus, the general pattern ofgenic divergence seems to follow more closely that ofgeographic barriers than of chromosomal differentiation.However, this no longer holds true at the within-racescale, since some populations are clearly geographicallydistant (for example, Edc1 and Edc2) and show no
significant genic differentiation. In these cases, theabsence of a chromosomal barrier coupled with a largeenough migration rate may have led to the geniccohesiveness of these populations. Such results will needto be reassessed with more variable markers, as the genicsimilarity may be due to a lack of resolution associatedwith the small sample size of the populations and theresilience of allozymes. The apparently low chromoso-mal impact on the genic architecture may be related tothe time since the onset of the karyotypic divergence,and the rapid build-up in strength of the chromosomalbarrier to gene flow as incompatible Rb fusions accumu-late. So, a significant limitation in genic exchangesbetween races is only expected to occur at the laterstages of chromosomal differentiation, and to affect morestrongly genes located on incompatible fusions due tochanges in recombination patterns (Dumas and Britton-Davidian, 2002). The specific signature ascribed tochromosomal rearrangements will need to be assessedby measuring the differential in gene flow of geneslocated on similar and different Rb fusions (Ayala andColuzzi, 2005; Gavrilets and Vose, 2005). The Madeiraraces are ideally suited for such a study as they arederived from the same original gene pool, and havediverged parapatrically only very recently.
Acknowledgements
We are extremely grateful to Claude Berger whoperformed part of the allozyme analysis and to AnaIsabel Galvao, Carla Cristina Marques and Ruben Capelafor their help in the field. We also thank Manuel Biscoitoand Jorge Prudencio. This study was financially sup-ported by an ICCTI–French Embassy scientific collabora-tion, a grant from Fundacao para a Ciencia e a Tecnologia(PRAXIS/PCNA/C/BIA/135/96) and funding by aSAPIENS project (POCTI/BSE/47019/02). This is pub-lication N1ISEM2007-062.
References
Albuquerque L, Vieira A (1988). The Archipelago of Madeira in theXV-Century Coleccao Atlantica. Secretaria Regional doTurismo e Cultura & Centro de Estudos de Historia doAtlantico (eds). Regiao Autonoma da Madeira, Madeira, 69 pp.
Ayala FJ, Coluzzi M (2005). Chromosome speciation:humans, Drosophila and mosquitoes. Proc Natl Acad Sci 102:6535–6542.
Belkhir K, Borsa P, Chikhi L, Raufaste N, Bonhomme F (1996–2004). GENETIX 4.05, logiciel sous Windows TM pour lagenetique des populations. Laboratoire Genome, Populations,Interactions, CNRS UMR. 5171, Universite de Montpellier II:Montpellier, France.
Berry RL, Scriven PN (2005). The house mouse: a model andmotor for evolutionary understanding. Biol J Linn Soc 84:335–347.
Britton-Davidian J (1990). Genic differentiation in M. m.domesticus populations from Europe, the Middle East andNorth Africa: geographic patterns and colonization events.Biol J Linn Soc 41: 27–45.
Britton-Davidian J, Catalan J, Ramalhinho MG, Auffray J-C,Nunes AC, Gazave E, et al. (2005). Chromosomal phylogenyof Robertsonian races of the house mouse on the island ofMadeira: testing between alternative mutational processes.Genet Res 86: 171–183.
Allozyme analysis of Rb house mice from MadeiraJ Britton-Davidian et al
9
Heredity

Britton-Davidian J, Catalan J, Ramalhinho MG, Ganem G,Auffray J-C, Capela R et al. (2000). Rapid chromosomalevolution in island mice. Nature 403: 158.
Britton-Davidian J, Nadeau JH, Croset H, Thaler L (1989). Genicdifferentiation and origin of Robertsonian populations of thehouse mouse (Mus musculus domesticus Rutty). Genet Res 53:29–44.
Corander J, Marttinen P, Mantyniemi S (2006). Bayesianmodification of stock mixtures from molecular data. FishBull 104: 550–558.
Dumas D, Britton-Davidian J (2002). Chromosomal rearrange-ments and evolution of recombination: comparison ofchiasma distribution patterns in standard and Robertsonianpopulations of the house mouse. Genetics 162: 1355–1366.
Dupanloup I, Schneider S, Excoffier L (2002). A simulatedannealing approach to define the genetic structure ofpopulations. Mol Ecol 11: 2571–2581.
Emerson BC (2002). Evolution on oceanic islands: molecularphylogenetic approaches to understanding pattern andprocess. Mol Ecol 11: 951–966.
Emerson BC, Kolm N (2005). Species diversity can drivespeciation. Nature 434: 1015–1017.
Excoffier L, Smouse PE, Quattro JM (1992). Analysis ofmolecular variance inferred from metric distances amonghaplotypes: application to human mitochondrial DNArestriction data. Genetics 31: 479–491.
Felsenstein J (1985). Phylogenies and the comparative method.Am Nat 125: 1–15.
Frankham R (1997). Do island populations have lessgenetic variation than mainland populations? Heredity 78:311–327.
Gazave E, Catalan J, Ramalhinho MG, Mathias ML, Nunes AC,Dumas D et al. (2003). The non-random occurrence ofRobertsonian fusion in the house mouse. Genet Res 81: 33–42.
Gavrilets S, Vose A (2005). Dynamic patterns of adaptativeradiation. Proc Natl Acad Sci 102: 18040–18045.
Gunduz I, Auffray J-C, Britton-Davidian J, Catalan J, Ganem G,Ramalhinho MG et al. (2001). Molecular studies on thecolonization of the Madeiran archipelago by house mice. MolEcol 10: 2023–2029.
Jones CS, Noble LR, Jones JS, Tegelstrom H, Triggs GS, Berry RJ(1995). Differential male genetic success determines geneflow in an experimentally manipulated mouse population.Proc R Soc Lond B 260: 251–256.
Jordal BH, Hewitt GM (2004). The origin and radiation ofMacaronesian beetles breeding in Euphorbia: the relativeimportance of multiple data partitions and populationsampling. Syst Biol 53: 711–734.
Manel S, Schwartz MK, Luikart G, Taberlet P (2003). Landscapegenetics: combining landscape ecology and populationgenetics. Trends Ecol Evol 18: 189–197.
Mathias ML, Nunes AC, Marques CC, Sousa I, RamalhinhoMG, Auffray JC et al. (2004). Adaptive energetics in housemice, Mus musculus L. from the island of Porto Santo(Madeira archipelago, North Atlantic). Comp Biochem PhysiolA 137: 703–709.
Melo-Ferreira J, Boursot P, Suchentrunk F, Ferrand N, Alves PC(2005). Invasion form the cold past: extensive introgressionof mountain hare (Lepus timidus) mitochondrial DNAinto three other hare species in northern Iberia. Mol Ecol 14:2459–2464.
Nachman MW, Boyer SN, Searle JB, Aquadro CF (1994).Mitochondrial DNA variation and the evolution of Robert-
sonian chromosomal races of house mice Mus domesticus.Genetics 136: 1105–1120.
Nachman MW, Searle JB (1995). Why is the house mousekaryotype so variable? Trends Ecol Evol 10: 397–402.
Navajas y Navarro M, Britton-Davidian J (1989). Geneticstructure of insular Mediterranean populations of the housemouse. Biol J Linn Soc 36: 377–390.
Nei M (1978). Estimation of average heterozygosity and geneticdistance from a small number of individuals. Genetics 89:583–590.
Nei M (2005). Bottlenecks, genetic polymorphism, and specia-tion. Genetics 170: 1–4.
Nunes AC, Britton-Davidian J, Catalan J, Ramalhinho MG,Capela R, Mathias ML et al. (2005). Influence of physicalenvironmental characteristics and anthropogenic factors onthe position and structure of a contact zone betweenchromosomal races of the house mouse on the island ofMadeira (North Atlantic, Portugal). J Biogeogr 32: 2123–2134.
Page RDM (1996). TREEVIEW: an application to displayphylogenetic trees on personal computers. Comput ApplBiosci 12: 357–358.
Pardo-Manuel de Villena F, Sapienza C (2001). Female meiosisdrives karyotypic evolution in mammals. Genetics 159:1179–1189.
Pialek J, Hauffe HC, Searle JB (2005). Chromosomal variation inthe house mouse: a review. Biol J Linn Soc 84: 535–563.
Raymond M, Rousset F (1995). Genepop (Version 1.2): popula-tion genetics software for exact tests and ecumenism. J Hered86: 248–249.
Ryan MJ, Wagner Jr WE (1987). Asymmetries in matingpreferences between species: female swordtails prefer het-erospecific males. Science 236: 595–596.
Salgueiro P, Coelho MM, Palmeirim JM, Ruedi M (2004).Mitochondrial DNA variation and population structure ofthe island endemic Azorean bat (Nyctalus azoreum). Mol Ecol13: 3357–3366.
Shaw KL (2002). Conflict between nuclear and mitochondrialDNA phylogenies of a recent species radiation: what mtDNAreveals and conceals about modes of speciation in Hawaiiancrickets. Proc Natl Acad Sci 99: 16122–16127.
Silvertown J (2004). The ghost of competition past in thephylogeny of island endemic plants. J Ecol 92: 168–173.
Smadja C, Catalan J, Ganem G (2004). Strong prematingdivergence in a unimodal hybrid zone between twosubspecies of the house mouse. J Evol Biol 17: 165–176.
Swofford DL, Selander RB (1981). BIOSYS-1. A ComputerProgram for the Analysis of Allelic Variation in PopulationGenetics and Biochemical Systematics Release 1.7. University ofIllinois: Urbana, IL.
Waits L, Taberlet P, Swenson JE, Sandegren F, Franzen R (2000).Nuclear DNA microsatellite analysis of genetic diversity andgene flow in the Scandinavian brown bear (Ursus arctos). MolEcol 9: 421–431.
Zenger KR, Richardson BJ, Vachot-Griffin AM (2003). A rapidpopulation expansion retains genetic diversity within Eur-opean rabbits in Australia. Mol Ecol 12: 789–794.
Appendix A
The distribution of allelic frequencies at the 25 poly-morphic loci in the samples studied is given in AppendixTable A1.
Allozyme analysis of Rb house mice from MadeiraJ Britton-Davidian et al
10
Heredity

Table A1 Distribution of allelic frequencies at the 25 polymorphic loci in the samples studied
Locus Chr Allele Fun1 Fun2 Fun3 Fun4 Fun5 Fun6 San1 San2 Arc Pod Svi Adc1 Adc2 Adc/Edc Edc1 Edc2 Ldb Psa1 Psa2 Psa3 Psa4 Por Den1 Den2
Adh 3 100 1 1 1 1 1 0.95 1 0.9 1 1 0.93 1 1 1 1 1 1 1 1 1 1 1 1 135 0.07
140 0.05 0.1Amy 3 100 0.9 0.83 0.8 0.45 0.94 0.24 0.08 0.4 0.1 0.08 0.33 0.06 0.03 0.02
80 0.1 0.17 0.2 0.55 0.06 0.76 1 0.92 1 1 1 1 1 0.6 1 1 1 1 0.9 0.92 0.67 0.94 0.97 0.98Car-2 3 100 0.88 0.82 0.5 0.68 1 0.97 1 1 1 1 0.93 1 1 1 1 1 1 1 1 1 1 1 1 1
120 0.12 0.18 0.5 0.32 0.03 0.07Es-1 8 94 1 1 1 1 1 1 1 1 1 1 1 1 1 1 1 1 1 1 1 1 1 0.83 1 1
100 0.17Es-2 8 100 0.92 0.97 0.9 0.7 1 1 0.72 0.92 0.75 0.56 0.68 0.96 1 1 0.83 1 0.67 1 1 1 1 1 1 0.48
99 0.08 0.03 0.1 0.3 0.28 0.08 0.25 0.44 0.32 0.04 0.17 0.3398 0.52
Es-10 14 100 1 1 1 1 1 1 1 1 1 1 0.82 1 1 1 1 1 1 1 1 1 1 1 1 160 0.18
Es-15 ni 100 0.58 0.93 0.8 0.55 0.5 0.3 0.5 0.92 0.75 1 0.53 0.36 0.5 0.3 0.08 0.33 0.67 0.28 1 190 0.42 0.07 0.2 0.4 0.5 0.7 0.5 0.08 0.25 0 0.47 0.64 0.5 0.7 0.92 0.67 0.33 1 1 1 1 0.4450 0.05 0.28
Gda 19 100 0.17 0.44 0.4 0.55 0.5 0.95 0.75 0.5 0.5 1 0.87 0.57 0.8 1 0.7 0.5 0.43 0.6 0.17 0.5 1 0.62 0.68120 0.83 0.56 0.6 0.45 0.5 0.05 0.25 0.5 0.5 0.13 0.43 0.2 0.3 0.5 1 0.57 0.4 0.83 0.5 0.38 0.32
Got-1 19 100 1 1 1 0.98 1 1 1 1 1 1 1 1 1 1 1 1 1 1 1 1 1 1 0.91 1120 0.02 0.09
Got-2 8 100 0.83 0.92 1 1 0.81 1 0.94 0.92 1 1 0.97 1 1 0.7 0.83 0.67 1 1 0.17 0.33 0.56 0.97 0.9150 0.17 0.08 0.19 0.06 0.08 0.03 0.3 0.17 0.33 1 0.83 0.67 0.44 0.03 0.09
aGpd 15 100 1 1 1 1 1 1 1 1 1 1 1 1 1 1 1 1 1 1 1 1 1 1 1 0.7980 0.21
Gpi-1 7 100 1 0.97 0.6 1 0.93 1 0.94 0.92 0.75 0.88 1 0.91 0.83 0.6 0.5 1 1 1 1 1 1 1 1 1125 0.03 0.4 0.07 0.06 0.08 0.25 0.12 0.09 0.17 0.4 0.5
Haox 2 100 1 1 1 0.98 0.75 1 1 1 1 1 1 1 1 1 1 1 1 1 1 1 1 1 1 1120 0.0280 0.1940 0.06
Hbb-1 7 s 0.83 0.94 1 0.75 0.71 0.44 0.64 0.92 0.88 0.63 0.67 0.96 0.4 0.8 1 0.67 0.9 1 1 1 1 1 1 1d 0.17 0.06 0 0.25 0.29 0.56 0.36 0.08 0.12 0.37 0.33 0.04 0.6 0.2 0.33 0.1
Idh-1 1 100 1 1 0.9 0.9 0.88 0.83 0.89 0.67 0.5 0.44 0.85 1 0.9 0.92 0.67 0.92 0.67 0.43 0.4 0.17 0.3 0.83 0.97 0.64125 0.1 0.1 0.12 0.17 0.11 0.33 0.5 0.56 0.15 0.1 0.08 0.33 0.08 0.33 0.57 0.6 0.83 0.7 0.17 0.03 0.36
Ldh-1 7 100 1 1 1 1 1 1 1 1 1 1 1 1 1 1 1 1 0.75 1 1 1 1 1 1 190 0.25
Mod-1 9 m 0.5 0.53 0.6 0.67 0.63 0.52 0.5 0.42 0.63 0.94 0.88 0.73 0.67 1 1 1 0.92 0.86 1 1 0.9 0.67 1 0.98f 0.5 0.47 0.4 0.33 0.37 0.48 0.5 0.58 0.37 0.06 0.12 0.27 0.33 0.08 0.14 0.1 0.22 0.02s 0.11
Mod-2 7 100 0.33 0.22 0.8 0.78 0.81 0.33 0.83 0.67 0.88 1 0.82 0.32 0.25 0.37 0.25 0.33 0.5 0.93 0.5 0.67 0.4 0.33 0.91 1110 0.67 0.78 0.2 0.22 0.19 0.67 0.17 0.33 0.12 0.18 0.68 0.75 0.63 0.75 0.67 0.5 0.07 0.5 0.33 0.6 0.67 0.09
Mpi-1 9 100 0.92 1 1 0.73 0.88 1 1 1 1 1 0.94 1 1 0.9 1 1 1 0.93 0.6 0.83 0.6 1 1 1120 0.1 0.0680 0.08 0.17 0.12 0.1 0.07 0.4 0.17 0.4
Np-1 14 100 1 1 1 1 1 1 1 1 1 1 1 1 1 1 1 1 1 0.86 0.3 0.58 0.42 1 1 0.98120 0.14 0.7 0.42 0.5890 0.02
Pgm-1 5 100 0.33 0.09 0.2 0.22 0.5 0.27 0.17 0.58 0.12 0.88 0.68 0.56 0.58 0.83 0.8 0.67 0.58 1 1 1 1 0.78 1 180 0.67 0.91 0.8 0.78 0.5 0.73 0.83 0.42 0.88 0.12 0.32 0.44 0.42 0.17 0.2 0.33 0.42 0.22
Pgm-2 4 100 1 1 1 0.98 1 1 1 0.92 1 0.88 1 1 1 1 0.92 1 1 1 1 1 1 0.78 1 180 0.02 0.08 0.12 0.08 0.22
Pk-1 3 100 1 1 1 0.98 0.88 1 1 1 1 1 1 1 1 1 1 1 1 1 1 1 1 1 1 150 0.02 0.12
Pk-3 3 100 1 1 1 1 1 1 1 1 1 1 1 1 1 1 1 1 1 1 1 1 1 1 0.92 0.86120 0.08 0.14
Sdh-1 2 100 0.83 0.97 0.7 0.62 0.44 0.98 0.17 0.92 0.63 0.94 0.41 0.77 0.67 0.3 0.58 0.67 0.58 0.86 1 0.83 1 0.78 1 1110 0.17 0.03 0.3 0.38 0.56 0.02 0.83 0.08 0.38 0.06 0.59 0.23 0.33 0.7 0.42 0.33 0.42 0.14 0.17 0.1190 0.11
The chromosomal localization of the loci is indicated (ni¼not identified). See Figure 1 for key to populations.
Allozyme analysis of Rb house mice from MadeiraJ Britton-Davidian et al
11
Heredity
Copyright © 2022 FDOKUMEN